Embed Size (px)
Citation preview

Nuclear Instruments and Methods in Physics Research B 358 (2015) 6–15
Contents lists available at ScienceDirect
Nuclear Instruments and Methods in Physics Research B
journal homepage: www.elsevier .com/locate /n imb
Study of thermoluminescence response of purple to violetamethyst quartz from Balikesir, Turkey
http://dx.doi.org/10.1016/j.nimb.2015.05.0110168-583X/� 2015 Elsevier B.V. All rights reserved.
⇑ Corresponding author. Tel.: +90 416 223 38 00.E-mail address: [email protected] (N. Nur).
N. Nur a,⇑, Z. Yegingil b, M. Topaksu b, K. Kurt c, T. Dogan d, N. Sarıgül e, M. Yüksel b, V. Altunal b,A. Özdemir b, V. Güçkan b, I. Günay f
a Adiyaman University, Engineering Faculty, Department of Electrical and Electronic Engineering, 02040 Adiyaman, Turkeyb Cukurova University, Art and Sciences Faculty, Physics Department, 01330 Adana, Turkeyc University of Mersin, Science and Art Faculty, Physics Department, 33343 Mersin, Turkeyd Cukurova University, Vocational School of Imamoglu, Department of Technical Programs, 01700 Adana, Turkeye Institute of Nuclear Science, Hacettepe University, 06532 Ankara, Turkeyf Cukurova University, Medicine Faculty, Biophysics Department, Adana, Turkey
a r t i c l e i n f o a b s t r a c t
Article history:Received 25 December 2014Received in revised form 26 April 2015Accepted 1 May 2015
Keywords:AmethystThermoluminescenceDose responseTLDosimeters
In thermoluminescence (TL) dosimetry, the phosphor amethyst quartz as a thermoluminescent, appearsto be one of the materials arousing the highest interest. In this study the dosimetric characteristics of nat-ural amethyst quartz crystals collected from Balikesir–Dursunbey (Turkey) were investigated for the pur-pose of determination of the general properties that phosphors should have in order to be useful forthermoluminescence dosimetry. The natural thermoluminescence was drained by annealing the powdersamples at 450 �C for 1.5 h. The effects of high temperature annealing, dose response curves, glow curvesafter a postirradiation annealing, reusability of the samples and storage of trapped electrons in dark atroom temperature were clarified through irradiating the samples with the desired exposures by90Sr/90Y beta particles.
Isothermal annealing before and after irradiation was found to have a definite effect upon the TL glowcurve of amethyst crystal powder. The same sample varied in sensitivity depending upon its previousthermal and radiation history. The peak heights of the glow peaks were examined with respect to doseresponse at dose levels between 1 Gy and 5 kGy. The intermediate temperature (IT) and high temperature(HT) peaks of 230 �C and 300 �C, respectively, exhibit dose–response curves as superlinear when dose ison the logarithmic scale except the dose response of 300 �C peak for the dose values of 1 < D < 20 Gy inwhich linear dose response was acquired. At the end of the storage time between exposure and readoutwhich was about one month at room temperature, the emitted light reduction was 14% comparing to theinitial state. Repeating the measurements of the same sample, exposed with 0.1, 0.5, 0.8 and 1 kGy betaexposures, resulted in between 4% and 11% increase in the TL sensitivity of the material.
� 2015 Elsevier B.V. All rights reserved.
1. Introduction mineral is potentially useful for a wide spectrum of investigations
Quartz is the second most abundant mineral found in rocks andsoils at and near the earth’s surface. It is an important constituentof many rocks of sedimentary, igneous and metamorphic originand demonstrates excellent luminescence properties. Due tochemical differences of mineral forming fluids and physical condi-tions prevalent during the formation of quartz, all the types of themineral behave differently regarding their thermoluminescenceproperties [42,30]. All types of quartz contain mainly traces of iron,aluminum, lithium and slight amount of water. This natural
which depend on crystal lattice defect characteristics and concen-trations, and as such it has been extensively studied [6]. Naturalamethyst samples are purple varieties of a-quartz (SiO2) [41].Colorless samples of quartz that has become amethyst after irradi-ation have infrared spectra at room temperature with a broad bandat 3441 cm�1 and a sharp band at 3595 cm�1. The color ofamethyst is assigned to F centers formed by the exposure to ioniz-ing radiation and to the influence of lattice distortions due to thecontent of iron as a substitute for silicon and a high content of traceelements of large ionic radius like potassium [10,15].
Heat treatment of amethyst converts it to yellow, yellowishbrown, green, or even makes it colorless. After heating the amethystsamples in the air at 300–560 �C for several hours the followinggeneral sequence of colors was noted: violet–colorless–green–

N. Nur et al. / Nuclear Instruments and Methods in Physics Research B 358 (2015) 6–15 7
yellow–brown, although not all samples displayed the entiresequence of changes [33]. Optical absorption spectroscopy of irradi-ation and thermal effects on samples of amethyst from Brazil hasbeen reported by Dotto and Osotani [13]. The isothermal decayand irradiation growth of the studied three bands, 10,500 cm�1
(j), 18,300 cm�1 (h) and 28,000 cm�1 (n), were considered to reveala complex kinetics. Correlated Thermally Stimulated DepolarisationCurrents (TSDC) and Electron Paramagnetic Resonance (EPR) studieswere performed on natural samples of Brazilian amethyst [11].
Over the past few decades, many papers have been publishedthat describe the thermoluminescence analysis as well assuitability of quartz and amethyst quartz for dosimeters[29,30,18,43,40,9,5,44]. Attempts were made to examine amethystfor thermoluminescence characteristics and it was determined thatboth natural and artificial pressure and thermal effects may be ofconsiderable importance in modifying the thermoluminescenceof amethyst [36]. In the same study, it was introduced that staticloading of the order of 1 kilobar may cause increased thermolumi-nescence in one peak and impact loading of the order of 100 kilo-bars may decrease the height of the peak and increase the height ofanother. The response of thermoluminescence to subsequent X-rayirradiation in natural amethyst samples subjected to shock pres-sures between 10 GPa and 50 GPa has been observed. This workdetermined the activation energies from the glow peaks of theglow curves and investigated them being not reliable because ofthe wide distribution of trap depths.
The ongoing discussions in the literature concerning thermolu-minescence spectra of natural and synthetic amethyst and quartzsamples show that conflicting identifications are characteristicfor host lattice and impurity generated recombination sites.Zhang et al. [47] in his work indicates that quartz was dominatedby emission bands at 250–800 nm. Emission bands for amethystquartz were at the level of 740–750 nm. The possible explanationof the difference pointed out by Zhang was Fe ion impurity.
In the study of Rocha et al. [40] the main dosimetric character-istics of Brazilian amethyst were investigated in order to verify thepossibility of its utilization for gamma-radiation detection usingthe thermoluminescence (TL) technique. The samples were testedin x- and gamma radiation beams and their TL glow curves, depen-dence of the dose response and energy response on the absorbeddose and reproducibility were examined. The study hints the feasi-bility of utilizing the luminescence properties of amethyst quartzfor dosimetry purposes in the range 50 mGy to high doses.
This paper summarizes the dosimetric properties of naturalamethyst samples collected from Balıkesir–Dursunbey (Turkey),determined with the use of thermoluminescence technique. Thethermoluminescence characteristics of amethyst specimens wereanalyzed to confirm that consideration should be given toamethyst quartz to be utilized as a dosimeter. The characteristicsof the natural amethyst quartz glow curve as a function of anneal-ing time and temperature, both before and after irradiation, werestudied. The effects of high-temperature annealing and high betadose were clarified. The TL signal as a function of the absorbed dosewas determined for both �230 �C peak at intermediate tempera-ture (IT) region and �300 �C peaks at high temperature (HT) regionof glow curve. The enhancement in sensitivity under high betadose was examined by the dependence on both prior and subse-quent (to beta irradiation) heat treatments. In order to have a bet-ter understanding of the luminescence characteristics, thereusability and fading of the material were also investigated.
2. Material and methods
The natural amethyst crystals collected from Dursunbey(Balikesir–Turkey) were small cleaved crystals between 1 cm2
and 3 cm2 and a few mm thick. Their external form reflected theirordered internal structure with variety of pink to violet colorsdepending on a sample. Amethysts used in this study were in loosepowder form in order to avoid disparities arising from variations incolors. It was found that the thermoluminescence varied from onepart of a crystal to another and that it was necessary to grain thecrystals to powder and mix it to obtain a uniform average sensitiv-ity. The crystal pieces in this work were grained using an agatemortar and sieved to obtain grain sizes of 90–140 l.
To test the thermal behavior of the TL properties of amethyst,powdered phosphor was divided into several 30 mg portions inbordered disks. The samples were then isothermally annealed atone of the preirradiation annealing temperatures (between250 �C and 550 �C, in 50 �C steps) for various lengths of time, rang-ing from 0.5 h to 24 h. The samples were placed in the oven,removed after the intended time and cooled down to room tem-perature. This process, beginning with fresh powder, was followedat each of the preirradiation annealing temperatures. After beingremoved from the oven, the bordered disks containing the powderwere placed on an aluminum block and allowed to cool to roomtemperature in a nonlinear, although reproducible manner.
All the readouts have been performed with a Riso TL/OSL readermodel DA-20 using the heating rate of 2 �C/s and the temperaturerange was from room temperature up to 700 �C. The irradiatorbuilt in the Riso TL/OSL system is a 90Sr/90Y beta source 1.48 GBq(40 mCi), which emits beta particles with a maximum energy of2.27 MeV. The dose rate of the source is about 6.689 Gy/min whichgives an amount of dose of 0.11 Gy/s to quartz at the sample loca-tion. All irradiations and readings were carried out at room tem-peratures. For quantitative dosimetry the amount of powder usedin readout, usually 5–60 mg, must be reproducible with precision.Usually, about 30 mg of amethyst quartz powder samples werespread out on thin bordered disks and heated to 700 �C. The emit-ted light was viewed with a PM tube and resulting anode currentwas integrated to provide a quantity that is related to dose. Theglow curve, a plot of light intensity vs. time or temperature, isdependent upon: the heating rate, the dose to which the powderhas been exposed, the type of radiation used and the electronicenergy states of the thermoluminescent material.
X-ray fluorescence (XRF) spectroscopy uses an X-ray source toeject core–shell electrons from an atom to create an excited state.In consequence a cascade of electrons filling the holes evokesemission of x-radiation from the atom (fluorescence) that has acharacteristic wavelength/energy specific to each element. The flu-orescence can be quantified to enable elemental analysis from ppmto percent. The first step in this study was to perform the X-rayfluorescence (XRF) spectrometer analysis in a group of amethystsamples in powder form using a PANalytical AXIOS-AdvancedWDXRF spectrometer.
3. Results and discussion
3.1. TL glow curves of natural amethyst before and after annealing
In order to determine the characteristic TL glow curves of thevirgin natural amethyst, three samples in powder form, each about30 mg were used. The samples were next exposed to the tempera-ture ranging from room temperature to 700 �C. The temperaturewas rising at a constant heating rate of 2 �C per second to ascertainwhether or not the amethyst possessed any natural thermolumi-nescence. Fig. 1 presents thermoluminescence glow curvesobtained on these samples. Two large symmetrical glow peakswere found in unirradiated amethyst at about 300 and 500 �C.The elementary peaks were always located at the same tempera-tures with ±5 �C differences in the locations of the peak

Fig. 1. TL glow curves of virgin natural amethyst sample without any thermaltreatment.
Fig. 2. TL glow curve of annealed amethyst samples after irradiation. (a) Irradiatedby 2 kGy of beta dose (b) Irradiated by 200 Gy of beta dose.
8 N. Nur et al. / Nuclear Instruments and Methods in Physics Research B 358 (2015) 6–15
temperatures (Tm) for all those samples and relative peak ampli-tudes exhibited no large variations (see Fig. 1). The differences inTm locations can be explained by the thermal lag between the heat-ing disk and the sample. In the previous studies, it has been shownthat the thickness of the sample and the quality of the thermal con-tact between the sample and the heating unit can strongly effectthe position of the peaks [2,3,24].
The glow curves of the amethyst samples after the annealingprocedure (450 �C for 1.5 h) were also investigated. The ability todrain completely any natural luminescence by treating the sampleswith this annealing procedure is discussed below. As it is seen inFig. 1 the unannealed amethyst samples contain two main peaksoccurring at approximately 300 �C and 500 �C. The appearance ofanother peak, which will be called 450 �C peak, is observed on thelow temperature side of the 500 �C peak. To obtain the TL glowcurves of annealed amethyst samples after irradiation, two sampleswere irradiated respectively by 200 Gy and 2 kGy of 90Sr/90Y betaparticles. The TL glow curves are shown in Fig. 2a and b. These glowcurves were measured by heating the sample from room tempera-ture to 700 �C at a heating rate of 2 �C/s. As shown by the figure, afterthe exposures, two new TL glow peaks appeared at around 120 �Cand 170 �C, in the low temperature side of 300 �C peak of the virginsample. The 120 �C peak of amethyst showed the greatest peak
height 6238 and 52,424 a.u. for 200 Gy and 2 kGy, respectively.The peak heights at 170 �C peak were 4965 and 44,928 a.u. for200 Gy and 2 kGy beta exposure, respectively. These lower temper-ature peaks could be bleached out more easily upon storage at sur-rounding temperatures. It can be explained by the very high fadingrates of these low temperature peaks and it is reasonable that theyare completely removed after the natural amethyst crystals beingstored at ambient temperatures for an adequate time for sponta-neous escape of a charge carrier from a trap [31]. The peak at450 �C of amethyst was however, quite stable at the ambient tem-perature and appeared to be having a little value of light emission,621 and 3665 a.u. at 200 Gy and 2 kGy, respectively. Besides this,its dose response was very poor and this peak appears only whenthe samples were irradiated with high dose levels. On the otherhand, the 270 �C peak of glow curve was also quite sensitive to radi-ation, showing a sixteen fold increase in intensity (4689–86,230 a.u.) in going from 200 Gy to 2 kGy (see Fig. 2) and appearedto have considerable promise for dosimetry purposes. Hence, thepeak around 270 �C could be considered as one of the main dosimet-ric peaks of the amethyst phosphor.
In the similar to present investigations, published in numerousliterature positions, the nature of glow peaks for quartz samplesvaried from sample to sample and appeared at different tempera-tures than the determined dosimetric peaks in this study. Toktamiset al. [45] reported that after the quartz samples exposed to�55 Gy the LT (Low Temperature) peak (�90 �C), IT(Intermediate Temperature) peak (�210 �C),) and HT (HighTemperature) peak (�360 �C) were determined. Franklin et al.mentioned about emission spectra of 100, 180, 220, 260, 305,350 and 450 �C glow peaks in sedimentary quartz [16]. Other stud-ies on thermoluminescence mechanism of quartz confirmed thoseobservations [37,19,34].
In the present study, the peaks occurring at 230 �C and 325 �C(see Fig. 2) are highly overlapped with other peaks and it was hardto define their peak temperatures and maximum peak intensitieswithout using computer deconvolution programs. An influence ofincreasing irradiation on glow curve complexity was observed.Small but distinct peaks at 230 �C and 325 �C were noted whichwere barely detectable after 200 Gy (see Fig. 2). After increasingthe exposure to 2 kGy, 230 �C and 325 �C peaks were no longerapparent. It would be inferred that both the 230 �C and 325 �C glowpeaks may involve hole type centers [30].
Exposure of amethyst powder to high temperature results inchanges of its properties. These changes are important since thenormal processing of the powder during preparation and readingrequire high temperatures. In order to investigate the effect uponthe chemical compositions of amethyst samples with the isother-mal annealing, three groups of amethyst samples were used. Firstgroup was virgin natural amethyst samples and no thermal treat-ment was implemented. The second group was annealed by thestandard pre-irradiation annealing procedure as given above(450 �C for 1.5 h) and the third group of samples were alsoannealed by the standard pre-irradiation annealing procedurebut after this annealing they were heated up to 700 �C for 4 minfor the purpose of whether high temperature used to measurepeaks permanently damages the phosphor. After that all of thesegroups of samples were analyzed by X-ray fluorescence (XRF) spec-trometer. The data relating percentage element content to anneal-ing processes suggests a positive correlation between SiO2
concentration and high temperature annealing (see Table 1).Table 1 shows the change in the percentage of the impurity ionsdue to the heat exposure. As it is seen from the table the annealingprocess causes permanent changes in the chemical compositions ofthe amethyst samples for the determined three groups. Thesechanges depend on the evaporation of some ions which containoxygen and their removal from the crystal lattice by diffusion at
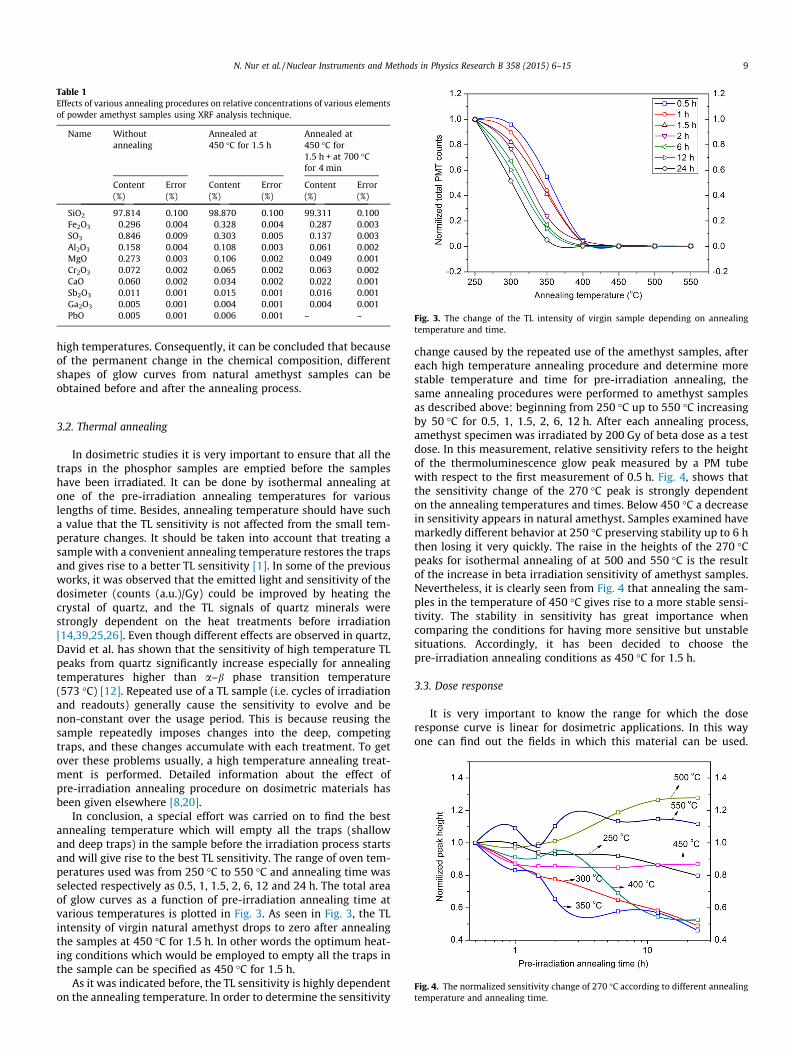
Table 1Effects of various annealing procedures on relative concentrations of various elementsof powder amethyst samples using XRF analysis technique.
Name Withoutannealing
Annealed at450 �C for 1.5 h
Annealed at450 �C for1.5 h + at 700 �Cfor 4 min
Content(%)
Error(%)
Content(%)
Error(%)
Content(%)
Error(%)
SiO2 97.814 0.100 98.870 0.100 99.311 0.100Fe2O3 0.296 0.004 0.328 0.004 0.287 0.003SO3 0.846 0.009 0.303 0.005 0.137 0.003Al2O3 0.158 0.004 0.108 0.003 0.061 0.002MgO 0.273 0.003 0.106 0.002 0.049 0.001Cr2O3 0.072 0.002 0.065 0.002 0.063 0.002CaO 0.060 0.002 0.034 0.002 0.022 0.001Sb2O3 0.011 0.001 0.015 0.001 0.016 0.001Ga2O3 0.005 0.001 0.004 0.001 0.004 0.001PbO 0.005 0.001 0.006 0.001 – – Fig. 3. The change of the TL intensity of virgin sample depending on annealing
temperature and time.
N. Nur et al. / Nuclear Instruments and Methods in Physics Research B 358 (2015) 6–15 9
high temperatures. Consequently, it can be concluded that becauseof the permanent change in the chemical composition, differentshapes of glow curves from natural amethyst samples can beobtained before and after the annealing process.
Fig. 4. The normalized sensitivity change of 270 �C according to different annealingtemperature and annealing time.
3.2. Thermal annealing
In dosimetric studies it is very important to ensure that all thetraps in the phosphor samples are emptied before the sampleshave been irradiated. It can be done by isothermal annealing atone of the pre-irradiation annealing temperatures for variouslengths of time. Besides, annealing temperature should have sucha value that the TL sensitivity is not affected from the small tem-perature changes. It should be taken into account that treating asample with a convenient annealing temperature restores the trapsand gives rise to a better TL sensitivity [1]. In some of the previousworks, it was observed that the emitted light and sensitivity of thedosimeter (counts (a.u.)/Gy) could be improved by heating thecrystal of quartz, and the TL signals of quartz minerals werestrongly dependent on the heat treatments before irradiation[14,39,25,26]. Even though different effects are observed in quartz,David et al. has shown that the sensitivity of high temperature TLpeaks from quartz significantly increase especially for annealingtemperatures higher than a–b phase transition temperature(573 �C) [12]. Repeated use of a TL sample (i.e. cycles of irradiationand readouts) generally cause the sensitivity to evolve and benon-constant over the usage period. This is because reusing thesample repeatedly imposes changes into the deep, competingtraps, and these changes accumulate with each treatment. To getover these problems usually, a high temperature annealing treat-ment is performed. Detailed information about the effect ofpre-irradiation annealing procedure on dosimetric materials hasbeen given elsewhere [8,20].
In conclusion, a special effort was carried on to find the bestannealing temperature which will empty all the traps (shallowand deep traps) in the sample before the irradiation process startsand will give rise to the best TL sensitivity. The range of oven tem-peratures used was from 250 �C to 550 �C and annealing time wasselected respectively as 0.5, 1, 1.5, 2, 6, 12 and 24 h. The total areaof glow curves as a function of pre-irradiation annealing time atvarious temperatures is plotted in Fig. 3. As seen in Fig. 3, the TLintensity of virgin natural amethyst drops to zero after annealingthe samples at 450 �C for 1.5 h. In other words the optimum heat-ing conditions which would be employed to empty all the traps inthe sample can be specified as 450 �C for 1.5 h.
As it was indicated before, the TL sensitivity is highly dependenton the annealing temperature. In order to determine the sensitivity
change caused by the repeated use of the amethyst samples, aftereach high temperature annealing procedure and determine morestable temperature and time for pre-irradiation annealing, thesame annealing procedures were performed to amethyst samplesas described above: beginning from 250 �C up to 550 �C increasingby 50 �C for 0.5, 1, 1.5, 2, 6, 12 h. After each annealing process,amethyst specimen was irradiated by 200 Gy of beta dose as a testdose. In this measurement, relative sensitivity refers to the heightof the thermoluminescence glow peak measured by a PM tubewith respect to the first measurement of 0.5 h. Fig. 4, shows thatthe sensitivity change of the 270 �C peak is strongly dependenton the annealing temperatures and times. Below 450 �C a decreasein sensitivity appears in natural amethyst. Samples examined havemarkedly different behavior at 250 �C preserving stability up to 6 hthen losing it very quickly. The raise in the heights of the 270 �Cpeaks for isothermal annealing of at 500 and 550 �C is the resultof the increase in beta irradiation sensitivity of amethyst samples.Nevertheless, it is clearly seen from Fig. 4 that annealing the sam-ples in the temperature of 450 �C gives rise to a more stable sensi-tivity. The stability in sensitivity has great importance whencomparing the conditions for having more sensitive but unstablesituations. Accordingly, it has been decided to choose thepre-irradiation annealing conditions as 450 �C for 1.5 h.
3.3. Dose response
It is very important to know the range for which the doseresponse curve is linear for dosimetric applications. In this wayone can find out the fields in which this material can be used.

Fig. 6. TL dose response curves of amethyst sample determined by the peak heightof glow peaks (a) IT peak (�230 �C) and (b) HT peak (�300 �C). Samples wereexposed to beta irradiation with dose amounts changing from 1 Gy up to 5 kGy.
10 N. Nur et al. / Nuclear Instruments and Methods in Physics Research B 358 (2015) 6–15
Ideal dosimetric materials are expected to have a linear doseresponse over a wide dose range. However, most materials usedin dosimetric applications show different non-linear effects. It isgenerally observed that the response of the material shows threedifferent kinds of behavior called respectively as linear, superlinearand sublinear. The superlinearity index g(D) gives the change in theslope of the dose response in all regions. This index is defined asg(D) = DS00(D)/S0(D) + 1 where S(D) is the dose response at dose D.S0(D) and S00(D) is the first and second derivatives of functionS(D). Thus, linearity defined as g(D) = 1, is generally observed onlyfor a narrow dose range and superlinearity (g(D) > 1) is commonlyobserved [7].
To drive out the dose response curve for natural amethyst, thestudied samples were measured at a heating rate of 2 �C/s afterthe application of heat treatment at 600 �C for 1.5 h before theexposure of 1 Gy through 5 kGy by 90Sr/90Y beta source. Sampleswere evaluated for 24 h after both annealing and irradiation. TheTL readouts were performed up to 600 �C and started by preheatingthe samples from room temperature to 150 �C to delete low tem-perature peaks of the glow curves. Accomplished glow peaks wereused to obtain the dose response curves of the natural amethystsamples. Two of the obtained TL glow curves each exposed to100 Gy and 2 kGy, respectively are presented in Fig. 5.
There is a strong possibility that the glow curve structures ofthe amethyst phosphor samples could be well described by a linearcombination of at least four glow peaks between RT and 600 �C(Fig. 5). When the exposed dose levels were 1, 2, 5, 10, 20, 50,100, 200, 400, 600, 800, 1000, 2000 and 5000 Gy, in the doseresponse measurements, the glow curves were distributed intotwo main regions showing the nature of the traps responsible forenergy storage and the resultant thermoluminescence. As a conse-quence of this appearance, the first region was the intermediatetemperature (IT) region that was manifested as a peak at�230 �C. The second region was the higher temperature (HT)region and represented by the glow peak at �300 �C.
All recorded glow curves were analyzed to obtain the doseresponse curves of all glow peaks. The resulting dose responsecurves are plotted on log–log scales and shown in Fig. 6a and b.In the given figures, all reported values are averages of at leastthree measurements. The growth of TL dose response curves inamethyst quartz was also examined in this study. The growth
Fig. 5. Amethyst samples are annealed at 600 �C for 1.5 h and preheated up to150 �C before TL readout. Glow curves of those samples after b-particle exposures.Curve a: Sample receives 2 kGy absorbed dose Curve b: Sample receives 200 Gyabsorbed dose. Intermediate temperature peak (IT) around 230 �C and hightemperature peak (HT) around 300 �C are assigned for those dose levels asindicated.
was the subject of observation at low (1 < D < 20 Gy) and high dose(20 < D < 5 kGy) levels both for IT peak �230 �C and HT peak�300 �C. At the dose values (1 Gy < D < 5 kGy) superlinear dosedependence of thermoluminescence (TL) with the superlinearityindex g(D) > 1 was obtained for IT peak �230 �C (see Fig. 6a). TheHT peaks �300 �C of amethyst quartz samples show linear behav-ior at low dose levels (1 < D < 20 Gy) with the superlinearity indexg(D) = 1, as shown in Fig. 6b whereas superlinear dose responsewith the superlinearity index g(D) > 1 at relatively high dose ratesbetween 20 Gy < D < 2 k Gy was calculated (see Fig. 6b). After thesuperlinear growth in the 300 �C peak, its peak height was tendedtowards saturation value at 5 kGy dose exposure.
3.4. Reusability
Repeated use of dosimetric materials might place charge intodeep, competing traps and this charge, accumulating with eachtreatment, has an adverse effect on the sensitivity of the material.Therefore, repeated use of dosimetric samples would cause perma-nent changes in TL sensitivity and make it non-constant over theusage period [8]. To confirm that the amethyst samples have thesame properties during repeated cycles of thermal annealing fol-lowed by irradiation exposure and TL readouts, ten repeatedusages of the samples were performed. TL readouts (up to 700 �C,heating rate 2 �C s�1) were made each time a sample was annealed,with the application of the standard pre-irradiation annealing pro-cedure (discussed above), and irradiated by 0.1, 0.5, 0.8 and1.0 kGy of beta doses. As a consequence, it was observed thatreproducibility of the previous-radiation sensitivity was acquiredeach time with the deviations changing between r = 4–11% over

Fig. 8. TL glow curves obtained from annealed amethyst samples irradiated by200 Gy of beta dose. The TL readouts were performed for five different heating rates.
N. Nur et al. / Nuclear Instruments and Methods in Physics Research B 358 (2015) 6–15 11
10 readings (see Fig. 7). The possibility of nonlinearity in the recy-cling measurement was due to activation of different traps andrecombination centers with increasing dose. Mandowski [27]claimed that traps and recombination centers may be consideredas a system of interacting clusters. With increasing dose the sizeof the clusters grows and creates detrapping mechanism due tosimultaneous occurrence of localized and delocalized transitions.
3.5. Heating rate
Five different heating rates of 1, 2, 4, 6 and 10 �C s�1 were usedto check the heating rate effect at the peak temperature (Tm) andpeak amplitude of glow curves. Five amethyst samples wereannealed with standard pre-irradiation annealing temperatureand then irradiated with 200 Gy of beta dose. Fig. 8 shows someof the obtained TL glow curves by using different heating rates. Itcan be seen from Fig. 9a and b that while the peak temperatures(i.e. maximum peak positions) are shifting to the high temperatureside with greater heating rates, at the same time, the height of thepeaks decrease (see Fig. 10). In TL theory, when the dose exposureremains constant, the peak temperature shifts to the high temper-ature side when heating rate is increased for the first order kinetics[17]. Furthermore, a study on first order kinetics in thermolumi-nescence materials and the interactive multiple trap system(IMTS) was conducted by Pagonis and Kitis [35]. The results showthat as the number of competitor traps increases, the averagebehavior of the TL glow curves tends toward first-order kinetics,and this in turn results in systematically smaller average variationsin the shape of the TL glow peak, in the apparent kinetic order b,and in the value of Tmax. In this study, during the dose responsestudies it was clarified that the temperature of glow peak – maxi-mum of individual IT and HT – glow peaks remained practicallyconstant over the examined dose range. This made the authors tosuggest the first order kinetics for the TL glow peaks of theamethyst samples.
Many TL materials suffer from the problem of thermal quench-ing in which the luminescence efficiency decreases as the temper-ature is increased. In previous studies it has been shown that somehigh temperature peaks in quartz and feldspars are subject to ther-mal quenching processes, i.e. the increased probability ofnon-radiative recombination at higher temperatures [8,46]. Inorder to test the thermal quenching, the integrated signal mustremain stable and not dependent upon the heating temperatures.This was the reason behind the examination of how the area underthe glow curves changes with increased heating rates. The result-ing curve is given in Fig. 11. The occasion of the acquired curve
Fig. 7. The change of TL sensitivity after various exposures (0.1, 0.5, 0.8, 1.0 kGy);each time with ten repeated cycles.
Fig. 9. The changes of peak temperatures of TL peaks around (a) 120 �C and 170 �C(b) 270 �C and 450 �C obtained for different heating rates after 200 Gy of betairradiation.
decrease with increased heating rate shows that thermal quench-ing occurs.
The shifting of the maximum peak temperatures can be alsoexplained by the thermal lag between heating planchet and sampleand by thermal gradient inside the material [2,3,24]. During TLreadout with readers using contact heating, the temperature ofthe sample differs from the temperature of the heating element.This difference is called temperature lag. At very low heating ratesthe temperature lag is assumed to be zero [23]. In practice,

Fig. 10. The changes in TL intensities for clearly distinguishable peaks around120 �C, 170 �C, 270 �C and 450 �C obtained for different heating rates after 200 Gy ofbeta irradiation.
Fig. 11. The change of total areas under the TL glow curves of amethyst samplesobtained for different heating rates resulted from a 200 Gy beta exposure. Theordinate of the curve is the ratio of each area obtained by successive heating rates toinitial heating rate of 1 �C s�1.
Fig. 12. The sensitivity change after the high dose application. The test dose appliedwas 20 Gy and the high dose was 5 kGy beta exposure.
12 N. Nur et al. / Nuclear Instruments and Methods in Physics Research B 358 (2015) 6–15
however, a sample consisting 30 mg of powder used in this studycorresponded with relatively high thickness and as such the tem-perature lag effect at various heating rates could not be avoidedeven at low temperatures.
3.6. The pre-dose sensitization of amethyst
In the previous studies, in literature, it has been observed thatthe TL sensitivity of crystals like quartz changes when they areirradiated with high dose levels followed by annealing. Theincrease of TL sensitivity comes from an increased probability ofphoton emission per thermally released charge. In other words,the increase of TL sensitivity is the aftermath of increase in thenumber of activated luminescence centers participating in the TLemission. These centers being activated by charge capture [8].Detailed information on pre-dose sensitization of quartz has beengiven elsewhere [38]. A group of amethyst samples were irradiatedby a test dose of 20 Gy and then TL glow curves recorded (firstreadout). After that the samples were annealed with the use ofthe standard pre-irradiation annealing procedure. In the next step,they were irradiated with 5 kGy (high dose exposure) andannealed again basing on the same procedure. The second test doseof 20 Gy was applied and TL readouts were recorded (second read-out). The results of pre-dose sensitization using a thermal
activation temperature of 700 �C are given in Fig. 12. As it is clearlyseen from the figure, the glow curve from the second readouts(after high dose exposure followed by annealing) has greater glowcurve total area than the first readout (before high dose exposure).For the 270 �C peak the sensitivity enhancement is around 30%.Consequently, it may be concluded that the pre-dose effect canbe used to improve the sensitivity of the amethyst samples andthis TL characterization must be considered while using theamethyst samples in dosimetric applications.
3.7. Fading
Another important subject in dosimetric studies is the stabilityof the stored signal at room temperature. Any noticeable decay inthe stored TL signal at ambient room temperature in a storage per-iod will cause an incompatibility between the light emitted resul-tant and the dose exposed. In this study, fading rates (a measure ofthe rate of change of the number of trapped electrons) of theamethyst samples were also investigated. For this reason groupsof virgin amethyst samples were annealed with standardpre-irradiation annealing procedure (450 �C for 1.5 h) and thenirradiated to 100 Gy with beta particles. These samples were storedin room temperature (around 25 �C) in a drawer providing a dryand dark environment. Storage measurements were made over aperiod of around a month at most. The TL readout of the first groupof samples was performed immediately after the exposure. Theother readouts were carried out respectively after 1, 6, 24, 48,168 and 624 h. Fig. 13 shows appearance of glow curves ofamethyst samples after various storage times at room tempera-ture. Three features are of special interest: (1) during the first1 h, the decrease in the maximum peak height at about 90 �Cwas that of 78 %. It is clear that most of the decrease in the totalglow curve area in this time comes from the decay of 90 �C peak.(2) As 120 �C peak decays over the total range of the fading pro-gressively another peak, denoted earlier as 170 �C peak, decayedsubstantially in the first 48 h. (3) For longer fading times up to26 days 270 �C peak was found to be stable in the glow curveswithin experimental error.
As it is seen in Fig. 13, the light output (light emitted) of the120 �C peak decays rapidly after being stored for 26 days. In addi-tion, the 170 �C peak also loses nearly half of its light output after26 days of storage period. Nevertheless, the TL decay related to thefading rate in one of the main peaks – 270 �C peak – of theamethyst samples is at the level of 14% after 7 days of storage.Beyond the 7 days TL intensity of the peak remains constant forlonger storage times. There has been good agreement within fading

Fig. 13. The TL glow curves of annealed amethyst samples irradiated by 100 Gy ofbeta dose obtained after different storage periods at ambient room temperature of25 �C. While the first readout was performed immediately after the exposure theother readouts were carried out respectively after 1, 6 h and 1, 2, 7 and 26 days.
N. Nur et al. / Nuclear Instruments and Methods in Physics Research B 358 (2015) 6–15 13
measurements of 270 �C peak, for its being determined as one ofthe main peaks for amethyst quartz crystal and risen at a temper-ature high enough to provide stability upon storage followingexposure.
4. Discussion and conclusion
There are many suitable thermoluminescence (TL) materialsavailable and a prospective user must demonstrate understandingof the characteristics of the materials in order to select the appro-priate one for the particular application of detection and measure-ment of ionizing radiation. In this study, clarification of importantTL properties of natural amethyst has been made and it has clearlyproved that potential exists for the use of amethyst quartz crystalfor TL dosimetry. The pre-irradiation annealing drained the energystored in irradiated amethyst crystal over the geologic time. It wasrevealed that isothermal annealing after irradiation has a definiteeffect upon the thermoluminescence glow curve of amethyst.Basing on measurements it was decided that the best annealingprocedure is the one utilizing 450 �C for 1.5 h as it ensures highefficiency and stability. It is known from the literature that thelow-temperature traps are thermally unstable and are graduallyannealed out of existence at room temperature. Annealing at hightemperatures, followed by rapid cooling empties all the deep traps,reduces residual TL in subsequent measurements to a negligiblelevel and maximizes the concentration of the defects responsiblefor dosimetric peak [20].
The results of this study indicate that the natural amethyst crys-tals are very sensitive to the annealing temperatures and times. Itis observed that the chemical compositions of the amethyst sam-ples change appreciably depending on the thermal treatment ofthe samples. As the exposure temperature increases, a big percent-age of the impurity ions which contain oxygen evaporates andmoves away from the crystal lattice by diffusion. This occurstogether with a decrease in the sensitivity of the amethystsamples.
The use of powder form of a phosphor instead of its crystal formprovides an advantage for a uniform average sensitivity. In thisstudy, it was found that the thermoluminescence varied fromone part of a crystal to another and that it was necessary to grindthe crystals to powder and mix it to obtain the same thermolumi-nescence exhibited by the crystal used. Six peaks occurring atapproximately 120, 170, 230, 270, 325 and 450 �C appeared inthe glow curve of annealed (at 450 �C for 1.5 h) and irradiated
(200 Gy) loose powder amethyst samples. However the peakaround 450 �C was not seen for low doses, whereas this peak didshow convenient dose response. Meanwhile, the low temperaturepeaks (120 �C and 170 �C peaks) of the amethyst samples tendedto lose their light emission for short storage periods at room tem-perature, i.e. they showed high fading properties. Therefore it wasdecided to use the 270 �C peak of the glow curve to obtain moreaccurate solutions. Indeed it was observed that while the low tem-perature peaks lose a big amount of TL intensity through storage indark only 14% reduction was recorded in the TL intensity of the270 �C peak after about one month.
It must also be noted that natural amethyst shows an enhance-ment of sensitivity after being exposed to high dose irradiation.The normal phosphor response to beta exposure had been deter-mined beforehand by giving the samples a 20 Gy exposure andreading out the glow curve. The effect of the 5 kGy exposure andannealing on the beta particle response was measured afterwardby repeating 20 Gy exposure and readout. It was found that theTL sensitivity increased by an amount of about 30% for the sametest dose.
The amethyst has the advantage that it can be reused over andover again without any substantial loss in sensitivity. It was foundthat repeated use of the amethyst samples after annealing at450 �C for 1.5 h and exposing the dose of approximately 100 Gyshowed an increase in sensitivity for an amount of less than 4%after ten repetitions. Nevertheless, due to its possible use forhigher dose measurements, reusability for 0.5, 0.8 and 1 kGy dosewas also investigated. Further studies showed 6–11% increase insensitivity of amethyst after 10 readout cycles for every individualdose exposure.
This study has pointed out that the examined natural amethystsamples have a superlinear dose response region (g(D) > 1)between 1 Gy and about 5 kGy for the IT peaks �230 �C. The HTpeaks �300 �C of amethyst samples show linear behavior at lowdose levels (1 < D < 20 Gy) with the superlinearity index g(D) = 1.In contrast, it shows superlinearity (g(D) > 1) between20 Gy < D < 2 kGy and tends towards saturation beyond about5 kGy.
On one hand, there are various commercial TLDs like LiF:Mg,Ti(TLD100) with the measurement ranges from 10 pGy to 10 Gywhich have been used for medical health physics purposes in theclinics (www.thermoscientific.com). It has been mostly used toimplement calibration, radiation evaluation and management, inclinics. LiF:Mg,Cu,P (TLD100H) is starting to replace LiF:Mg,Ti in avariety of personnel dosimetry applications. Lithium Flouride(Lithium natural) (LiF:Mg,Cu,P) has superior characteristics ascompared to LiF:Mg,Ti including, higher sensitivity, improvedenergy response for photons, lack of supralinearity and insignifi-cant fading [28] . Measurements range for the absorbed dosechanges from 1 pGy to 10 Gy. TLD-100H suits environmental, per-sonnel, and extremity dosimetry applications (www.thermoscien-tific.com/en/product/high-sensitivity-lif-mg-cu-p-thermolumines-cent-dosimetry-materials-1.html). Lithium Fluoride (Li6 isotope)LiF:Mg,Cu,P (TLD 600) and Lithium Fluoride (Li7 isotope)LiF:Mg,Cu,P (TLD700) both have minimum detectable dose value(MDD) of 1 pGy and suit for neutron dosimetry and gamma, betaapplications, respectively. TLD 200 (CaF:Dy) has the MDD of0.1 pGy; it ranges up to 1 Gy. It can be used for environmental dosemeasurements (http://www.thermoscientific.com/en/product/tld-200-thermoluminescent-dosimetry-material.html). On the otherhand, the use of synthetic materials for OSL has greatly improvedthe sensitivity of the luminescence method; it has now been usedfor about 15 years as a method for monitoring occupational radia-tion dose. The Optically Stimulated Luminescence (OSL)carbon-doped Aluminum Oxide (Al2O3:C) dosimeters were origi-nally proposed for radiation protection application in the late

14 N. Nur et al. / Nuclear Instruments and Methods in Physics Research B 358 (2015) 6–15
1990s by Akselrod’s group and were later characterized for radio-therapy applications by the same and other investigators[32,21,22]. Al2O3:C OSLDs commercially known as nanoDots(Landauers, Inc., Glenwood, IL) are designed for use in single pointradiation assessments and measure minimum occupational radia-tion dose of 0.1 mGy (www.landauer.com/Industry/Products/Dosimeters/nanoDot_OSLD.aspx). Recently, it has been widelyused for medical dosimetry applications. In this study, the deter-mined linear dose range for amethyst phosphor samples between1 Gy and 20 Gy and to some extent, the superlinear dose responsesbeyond 20 Gy make the HT peak �300 �C well suited for a widerange of applications in both medical dosimetry and in some prob-able applications of high dose dosimetry (from 102 Gy up to106 Gy; [31] like sterilization, polymer cross-linking, agriculturalapplications and the irradiation of certain food items for sanitation.
At various publications on thermoluminescence of amethystquartz, some aspects of its usage in high radiation dosimetry werediscussed in detail [47,4,40]. These studies suggested the feasibilityof utilizing the luminescence properties of amethyst quartz fordosimetry purposes in the range 50 mGy to high doses [40].
All these results provide information useful in the investigationof the intrinsic characteristics of the amethyst quartz crystals inthe research fields relevant to dosimetry. In addition, the resultsindicate that thanks to their luminescence properties the amethystquartz crystals deserve more recognition as possible dosimetermaterials. It is expected that the cost of manufactured amethystwould be low enough to allow its routine use.
The spatial arrangement of the defect centers in amethystquartz, TL mechanism of interaction and TL trap parameters fromthe experimental TL glow curves remain to be determined.
Acknowledgments
This study was carried out at Çukurova University (CU),Department of Physics. We are grateful to TUBITAK (TurkishScientific and Technology Research Council) for its financial sup-port under the Contract No. 105Y349 to purchase RISO TL/OSLDA-20 equipment. We would like to acknowledge the ÇukurovaUniversity Rectorate, Scientific Research Unit for its providing thefinancial support for this research as a PhD study under theContract No. FEF2006D11.
References
[1] M.J. Aitken, Thermoluminescence Dating, Academic Press, Orlando, Florida,1985.
[2] D.S. Betts, L. Couturier, A.H. Khayrat, B.J. Luff, P.D. Townsend, Temperaturedistribution in thermoluminescence experiments. I. Experimental results, J.Phys. D Appl. Phys. 26 (1993) 843–848, http://dx.doi.org/10.1088/0022-3727/26/5/019.
[3] D.S. Betts, P.D. Townsend, Temperature distribution in thermoluminescenceexperiments. II: Some calculational models, J. Phys. D Appl. Phys. 26 (1993)849–857, http://dx.doi.org/10.1088/0022-3727/26/5/020.
[4] V.S. Balitsky, I.B. Machina, A.A. Mar’in, J.E. Shigley, G.R. Rossman, T. Lu,Industrial growth, morphology and some properties of Bi-colored amethyst-citrine quartz (ametrine), J. Cryst. Growth 212 (2000) 255–260, http://dx.doi.org/10.1016/S0022-0248(99)00866-0.
[5] Y. Cao, S. Li, M. Yao, H. Zhang, Thermoluminescence of quartz from Shihu golddeposit, western Hebei province, China: some implications for goldexploration, Cent. Eur. J. Geosci. 2 (2010) 433–440, http://dx.doi.org/10.2478/v10085-010-0010-y.
[6] J.M. Charlet, Thermoluminescence of detrital rocks used in paleogeographicproblems, Mod. Geol. 2 (1971) 265–274.
[7] R. Chen, S.W.S. McKeever, Characterization of nonlinearities in the dosedependence of thermoluminescence, Radiat. Meas. 23 (1994) 667–673, http://dx.doi.org/10.1016/1350-4487(94) 90002-7.
[8] R. Chen, S.W.S. McKeever, Theory of thermoluminescence and relatedphenomena, World Scientific Publication, Singapore, 1997, ISBN 9810222955.
[9] R. Chen, V. Pagonis, Modelling thermal activation characteristics of thesensitization of thermoluminescence in quartz, J. Phys. D Appl. Phys. 37(2004) 159, http://dx.doi.org/10.1088/ 0022-3727/37/2/003.
[10] A.J. Cohen, F. Hassan, Ferrous and ferric ions in synthetic a-quartz and naturalamethyst, Am. Mineral. 59 (1974) 719–728.
[11] S.U. Cortezao, W.M. Pontuschka, M.S.F. Da Rocha, A.R. Blak, Depolarisationcurrents (TSDC) and paramagnetic resonance (EPR) of iron in amethyst, J. Phys.Chem. Solids 64 (2003) 1151–1155, http://dx.doi.org/10.1016/S0022-3697(03)00043-X.
[12] M. David, C.M. Sunta, A.K. Ganguly, Thermoluminescence of quartz: part II.Sensitization by thermal treatment, Indian J. Pure Ap. Phys. 15 (1977) 277–280.
[13] C.T. Dotto, S. Osotani, Irradiation and heating effects in amethyst crystals fromBrazil, Radiat. Eff. Defects Solids 117 (4) (1991) 355–361, http://dx.doi.org/10.1080/10420159108220755.
[14] A.M. Eid, M.I. El-Gohary, S.M. Kamal, Effect of heat treatments onthermoluminescence of naturally occurring materials, Radiat. Phys. Chem. 26(1985) 663–667, http://dx.doi.org/10.1016/0146-5724(85)90104-9.
[15] S.L. Fernando, H.M.N. Eduardo, Wander, V. Luiz, Infrared and chemicalcharacterization of natural amethysts and prasiolites colored by irradiation,Mater. Res. 12 (3) (2009) 315–320, http://dx.doi.org/10.1590/S1516-14392009000300011.
[16] A.D. Franklin, J.R. Prescott, R.B. Scholefield, The mechanism ofthermoluminescence in an Australian sedimentary quartz, J. Lumin. 63(1995) 317–326, http://dx.doi.org/10.1016/0022-2313(94)00068-N.
[17] C. Furetta, P.S. Weng, Operational Thermoluminescence Dosimetry, WorldScientific Publishing, Singapore, 1998, ISBN 9810234686.
[18] T. Hashimoto, K. Yokosaka, H. Habuki, Emission properties ofthermoluminescence from natural quartz-blue and red TL response toabsorbed dose, Int. J. Radiat. Appl. Instrum. Part D 13 (1987) 57–66, http://dx.doi.org/10.1016/1359-0189(87)90008-2.
[19] W.F. Hornyak, R. Chen, A. Franklin, Thermoluminescence characteristics of the375 �C electron trap in quartz, Phys. Rev. B. 46 (13) (1992) 8036–8049, http://dx.doi.org/10.1103/PhysRevB.46. 8036.
[20] Y.S. Horowitz, Thermoluminescence and TL Dosimetry, CRC Press, Boca Raton,FL, 1984.
[21] P.A. Jursinic, Characterization of optically stimulated luminescent dosimeters,OSLDs, for clinical dosimetric measurements, Med. Phys. 34 (12) (2007) 4594–4604, http://dx.doi.org/10.1118/ 1.2804555.
[22] J.R. Kerns, S.F. Kry, N. Sahoo, D.S. Followill, G.S. Ibbott, Angular dependence ofthe nano Dot OSL dosimeter, Med. Phys. 38 (7) (2011) 3955–3962, http://dx.doi.org/10.1118/1.3596533.
[23] G. Kitis, V. Pagonis, Peak shape methods for general orderthermoluminescence glow-peaks: a reappraisal, Nucl. Instr. Meth. Phys. Res.B 262 (2007) 313–322, http://dx.doi.org/10.1016/j.nimb.2007.05.027.
[24] N.G. Kiyak, E. Bulus, Effect of annealing temperature on determining trapdepths of quartz by various heating rates method, Radiat. Meas. 33 (2001)879–882, http://dx.doi.org/10.1016/S1350-4487(01)00248-7.
[25] S.H. Li, Luminescence sensitivity changes of quartz by bleaching, annealingand UV exposure, Radiat. Eff. Defects Solids 157 (2002) 357–364, http://dx.doi.org/10.1080/1042015021000005225.
[26] J.F. de Lima, M.S. Navarro, M.E.G. Valerio, Effects of thermal treatment on theTL emission of natural quartz, Radiat. Meas. 35 (2002) 155–159, http://dx.doi.org/10.1016/S1350-4487(01)00283-9.
[27] A. Mandowski, How to detect trap cluster systems?, Radiat Meas. 43 (2) (2008)167–170, http://dx.doi.org/10.1016/j.radmeas.2007.09.018.
[28] M. Mascoyitch, T.J. St John, J.R. Cassata, P.K. Blake, J.E. Rotunda, M. Ramlo, K.J.Velbeck, L.Z. Luo, The application of LiF:Mg, Cu, P to large scale personneldosimetry: current status and future directions, Radiat. Prot. Dosim. 119 (1–4)(2006) 248–254, http://dx.doi.org/10.1093/rpd/ nci692.
[29] W.L. Medlin, Thermoluminescence in quartz, J. Chem. Phys. 38 (5) (1963)1132–1143, http://dx.doi.org/10.1063/1.1733814.
[30] S.W.S. McKeever, Thermoluminescence of Solids, Cambridge University Press,London, 1985.
[31] S.W.S. McKeever, M. Moscovitch, P.D. Townsend, Dosimetry Materials:Properties and Uses, Nuclear Technology Publishing, England, 1995 (ISBN: 18709650 19 1).
[32] S.W.S. McKeever, M.S. Akselrod, Radiation dosimetry using pulsed opticallystimulated luminescence of Al2O3:C, Radiat. Prot. Dosim. 84 (1–4) (1999)317–320, http://dx.doi.org/10.1093/oxfordjournals.rpd.a032746.
[33] Neumann, E., Schmetzer, K., 1984, Mechanism of thermal conversion of colorand color centers by heat treatment of amethyst. Neues Jahrbuch fuerMineralogie, Monatshefte. 272–282.
[34] V. Pagonis, E. Tatsis, G. Kitis, C. Drupieski, Search for common characteristics inthe glow-curves of quartz of various origins, Radiat. Prot. Dosim. 100 (2002)373–376, http://dx.doi.org/10.1093/oxfordjournals.rpd.a005892.
[35] V. Pagonis, G. Kitis, Prevalence of first-order kinetics in thermoluminescencematerials: an explanation based on multiple competition processes, Phys.Status Solidi B 8 (2012) 1590–1601, http://dx.doi.org/10.1002/pssb.201248082.
[36] I. Plath, G. Lehmann, Thermoluminescence of shock-loaded amethyst quartz,Phys. Chem. Miner. 14 (4) (1987) 383–386, http://dx.doi.org/10.1007/BF00309815.
[37] S.A. Petrov, I.K. Bailiff, The ‘110 C’ peak in synthetic quartz, Radiat. Meas. 24(1995) 519–523, http://dx.doi.org/10.1016/1350-4487(95)00002-V.
[38] G.S. Polymeris, E.O. Oniya, N.N. Jibiri, N.C. Tsirliganis, G. Kitis, In-homogeneityin the pre-dosesensitization of the 110 �C TL peak in various quartz samples:ihe influence of annealing, Nucl. Instr. Meth. Phys. Res. Sec. B 274 (2012) 105–110, http://dx.doi.org/10.1016/j.nimb.2011.12.001.

N. Nur et al. / Nuclear Instruments and Methods in Physics Research B 358 (2015) 6–15 15
[39] H.M. Rendell, R.A. Wood, Quartz sample pretreatment for TL/OSL dating:studies of TL emission spectra, Radiat. Meas. 23 (2/3) (1994) 575–580.
[40] F.D.G. Rocha, M.L. Oliveira, S.G.P. Cecatti, L.V.E. Caldas, Properties of sinteredamethyst pellets as thermoluminescent dosimeters, Appl. Radiat. Isot. 58(2003) 85–88.
[41] Rossman, G., 1994. The colored varieties of the silica minerals. In: P.J. Haney,ed., Reviews in Mineralogy 29, 433–468.
[42] Sankaran, A.V., Nambi, K.S.V., Sunta, C.M., 1983. In: Progress ofthermoluminescence research in geological materials, Proceedings of theIndian National Science Academy: Physical sciences, Part A. 49, 18–112. ISSN0370–0046.
[43] A.J.J. Santos, J.F. de Lima, M.E.G. Valerio, Phototransferred thermoluminescenceof quartz, Radiat. Meas. 33 (4) (2001) 427–430, http://dx.doi.org/10.1016/S1350-4487(00)00135-9.
[44] K.W. Song, K.B. Kim, D.G. Hong, Determination of trap parameters forthermoluminescence glow peaks of red thermoluminescence of quartz fromJapan, Radiat. Eff. Defect Solids 165 (4) (2010) 305–312, http://dx.doi.org/10.1080/10420151003631910.
[45] H. Toktamis, A.N. Yazici, M. Topaksu, Investigation of the stability of theradiation sensitivity of TL peaks of quartz extracted from tiles, Nucl. Instr.
Meth. Phys. Res. B 262 (2007) 69–74, http://dx.doi.org/10.1016/j.nimb.2007.05.003.
[46] A.G. Wintle, Thermal quenching of thermoluminescence in quartz, Geophys. J.Roy. Astron. Soc. 41 (1975) 107–113.
[47] Q. Zhang, B. Yang, R.A. Wood, D.R.R. White, P.D. Townsend, B.J. Luff,Thermoluminescence spectra of amethyst, Radiat. Meas. 23 (2–3) (1994)423–431.
Web references
[48] http://www.thermoscientific.com/en/product/tld-100-thermoluminescent-dosimetry-material.html.
[49] http://www.thermoscientific.com/en/product/high-sensitivity-lif-mg-cu-p-thermoluminescent-dosimetry-materials-1.html.
[50] http://www.thermoscientific.com/en/product/tld-200-thermoluminescent-dosimetry-material.html.
[51] http://www.landauer.com/Industry/Products/Dosimeters/nanoDot_OSLD.aspx.


