Embed Size (px)
Citation preview
Desalination 174 (2005) 221–230
0011-9164/05/$– See front matter © 2005 Elsevier B.V. All rights reserved
*Corresponding author.
Sub-critical flux fouling in membrane bioreactors — a review ofrecent literature
Alfieri Pollicea*, Adam Brookesb, Bruce Jeffersonb, Simon Juddb
aCNR – Istituto di Ricerca Sulle Acque, Viale F. De Blasio 5, 70123 Bari, ItalyTel. +39 (080) 5820531; Fax +39 (080) 5313365; email: [email protected]
bSchool of Water Sciences, Cranfield University, Cranfield, Bedfordshire, MK43 0AL, UK
Received 11 June 2004; accepted 24 September 2004
Abstract
Membrane fouling is one of the main factors affecting the diffusion of membrane bioreactors to wastewatertreatments. Fouling is generally held to persist above a so-called “critical flux”, below which a steady-state membranepermeability is assumed to be attainable. However, a number of recent studies have demonstrated that low-levelfouling can take place at very low fluxes which are substantially below the critical value. This short survey isfocused on reported evidences of membrane fouling under sub-critical conditions and examines possible linksbetween operational paramenters, mixed liquor characteristics and fouling propensity. The reported experimentalevidences suggest no unequivocal connection between parameters such as permeability decline (dK/dt) and foulingrate (dP/dt) and sustainable long term sub-critical operation. In this respect, test size and plant configuration alsoplay a relevant role. Step-flux experiments may provide information on fouling propensity under sub-critical flux,but the fouling rates determined with this method are generally not applicable to long term operation. Mixed liquorquality determinants such as EPS and SMP and their relative protein/carbohydrate ratios are likely to contribute tosub-critical fouling in MBRs. Possible relationships between these parameters and plant operation (sludge age,biomass concentration, hydraulic retention time, etc.) are briefly discussed.
Keywords: Fouling; Membrane bioreactors; Sub-critical flux; Permeability
1. Introduction
Critical flux (Jc) was originally defined formicrofiltration as a flux below which a decline ofpermeability with time does not occur and abovewhich fouling is observed [1,2]. However, sub-
critical flux fouling in membrane filtration hasrecently been reported and membrane bioreactors(MBRs) operated at sub-critical fluxes appear tobe affected by a similar phenomenon over the longterm. In some studies, a noticable change in therate of transmembrane pressure (TMP) increasewas observed after some critical time period,
222 A. Pollice et al. / Desalination 174 (2005) 221–230
eventually necessitating membrane cleaning [3–5]. It has subsequently been suggested that thecritical flux actually represents the boundarybetween fouling by the dissolved/colloidal com-ponents and suspended matter of the biomass [4].In other words, the critical flux in an MBR can bethought of as marking the transition betweenconstant and non-constant permeability, and hencereversible and irreversible fouling [6]. The inter-pretation of the mechanisms leading to the initialrapid phase and the long gradual TMP rise iscrucial for the assessment and quantification ofmembrane fouling behaviour under sub-criticalflux conditions.
The present work provides some criteria forevaluating the sub-critical fouling behaviour ofMBRs based on a survey of existing data. Experi-mental evidence of fouling under sub-critical con-ditions are scattered in a number of research pub-lications, which this review aims to collate anddiscuss. The main operational parameters are con-sidered for the identification of pseudo-constantflux operation, along with levels of key biomasscomponents.
2. Some experimental evidences of foulingunder sub-critical operation
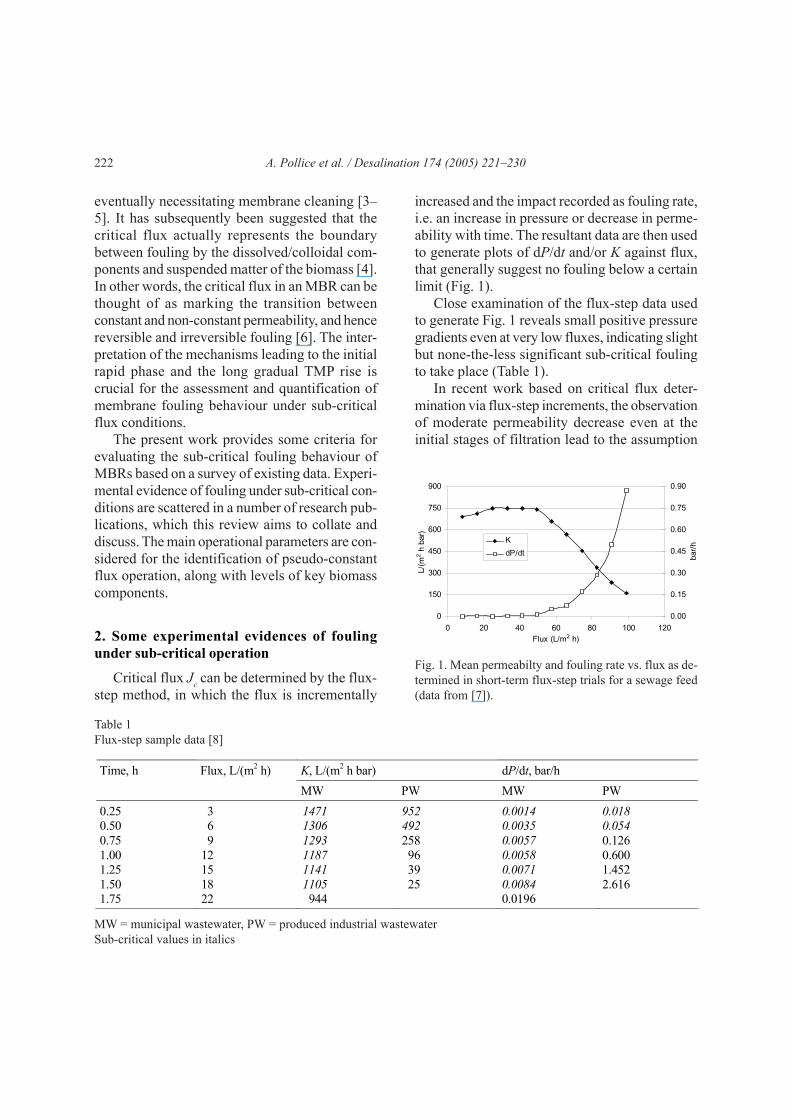
Critical flux Jc can be determined by the flux-step method, in which the flux is incrementally
Fig. 1. Mean permeabilty and fouling rate vs. flux as de-termined in short-term flux-step trials for a sewage feed(data from [7]).
increased and the impact recorded as fouling rate,i.e. an increase in pressure or decrease in perme-ability with time. The resultant data are then usedto generate plots of dP/dt and/or K against flux,that generally suggest no fouling below a certainlimit (Fig. 1).
Close examination of the flux-step data usedto generate Fig. 1 reveals small positive pressuregradients even at very low fluxes, indicating slightbut none-the-less significant sub-critical foulingto take place (Table 1).
In recent work based on critical flux deter-mination via flux-step increments, the observationof moderate permeability decrease even at theinitial stages of filtration lead to the assumption
Table 1Flux-step sample data [8]
MW = municipal wastewater, PW = produced industrial wastewaterSub-critical values in italics
K, L/(m2 h bar) dP/dt, bar/h Time, h Flux, L/(m2 h) MW PW MW PW
0.25 3 1471 952 0.0014 0.018 0.50 6 1306 492 0.0035 0.054 0.75 9 1293 258 0.0057 0.126 1.00 12 1187 96 0.0058 0.600 1.25 15 1141 39 0.0071 1.452 1.50 18 1105 25 0.0084 2.616 1.75 22 944 0.0196
0
150
300
450
600
750
900
0 20 40 60 80 100 120Flux (L/m2 h)
L/(m
2 h b
ar)
0.00
0.15
0.30
0.45
0.60
0.75
0.90
bar/
hK
dP/dt
A. Pollice et al. / Desalination 174 (2005) 221–230 223
of a permeability threshold below which thecritical flux is reached (e.g. 90% of the perme-ability measured at the first filtration step, [7]).However, many factors were reported to affectthe timeframe over which sub-critical operationcan be sustained, including membrane characteris-tics, feedwater and mixed liquor characteristics,and system operation [9].
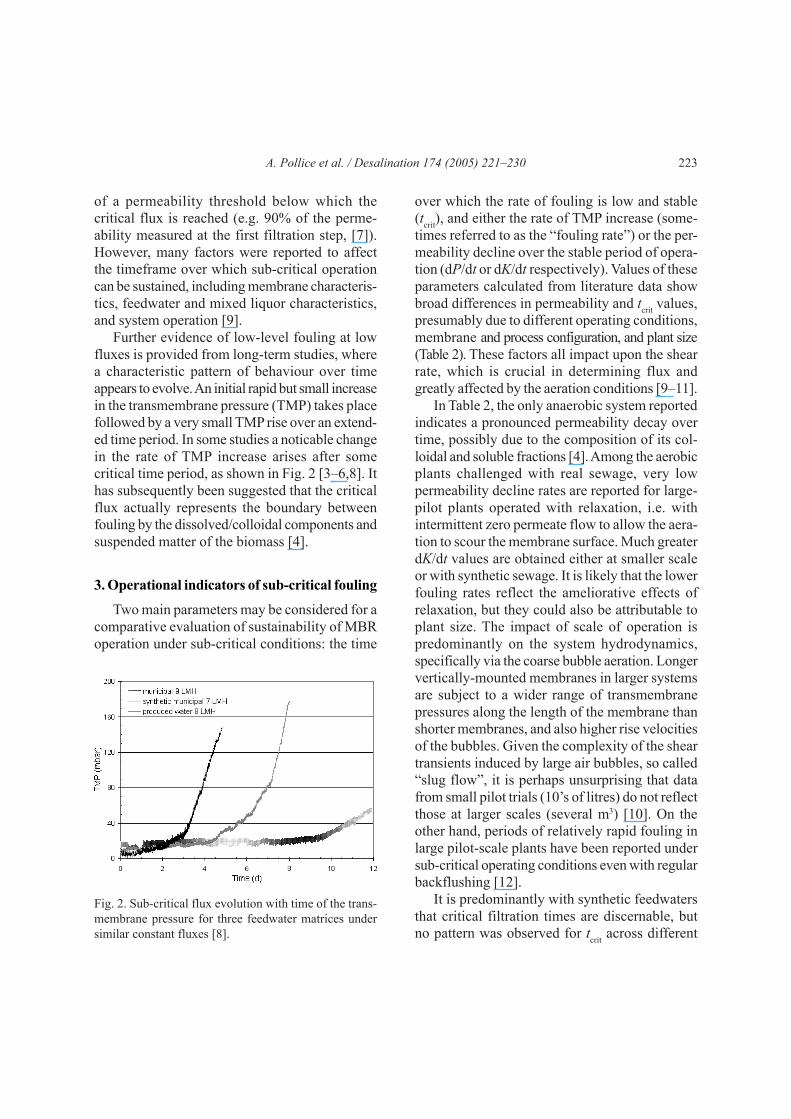
Further evidence of low-level fouling at lowfluxes is provided from long-term studies, wherea characteristic pattern of behaviour over timeappears to evolve. An initial rapid but small increasein the transmembrane pressure (TMP) takes placefollowed by a very small TMP rise over an extend-ed time period. In some studies a noticable changein the rate of TMP increase arises after somecritical time period, as shown in Fig. 2 [3–6,8]. Ithas subsequently been suggested that the criticalflux actually represents the boundary betweenfouling by the dissolved/colloidal components andsuspended matter of the biomass [4].
3. Operational indicators of sub-critical fouling
Two main parameters may be considered for acomparative evaluation of sustainability of MBRoperation under sub-critical conditions: the time
Fig. 2. Sub-critical flux evolution with time of the trans-membrane pressure for three feedwater matrices undersimilar constant fluxes [8].
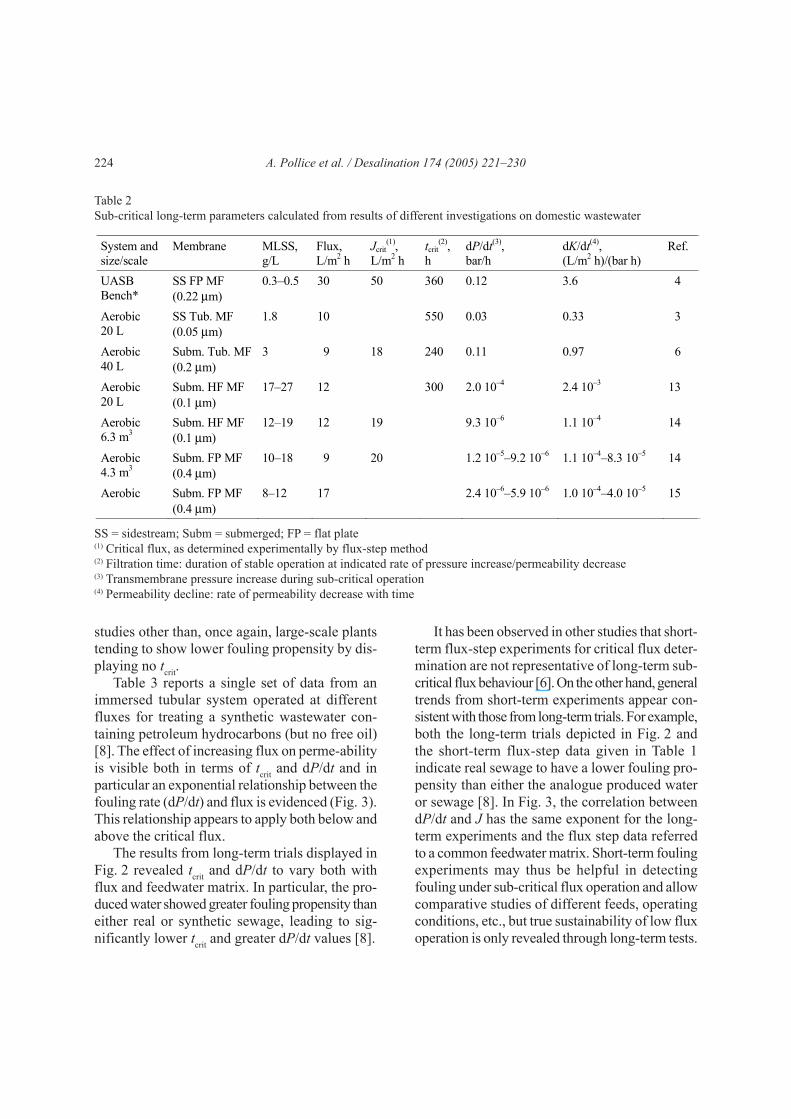
over which the rate of fouling is low and stable(tcrit), and either the rate of TMP increase (some-times referred to as the “fouling rate”) or the per-meability decline over the stable period of opera-tion (dP/dt or dK/dt respectively). Values of theseparameters calculated from literature data showbroad differences in permeability and tcrit values,presumably due to different operating conditions,membrane and process configuration, and plant size(Table 2). These factors all impact upon the shearrate, which is crucial in determining flux andgreatly affected by the aeration conditions [9–11].
In Table 2, the only anaerobic system reportedindicates a pronounced permeability decay overtime, possibly due to the composition of its col-loidal and soluble fractions [4]. Among the aerobicplants challenged with real sewage, very lowpermeability decline rates are reported for large-pilot plants operated with relaxation, i.e. withintermittent zero permeate flow to allow the aera-tion to scour the membrane surface. Much greaterdK/dt values are obtained either at smaller scaleor with synthetic sewage. It is likely that the lowerfouling rates reflect the ameliorative effects ofrelaxation, but they could also be attributable toplant size. The impact of scale of operation ispredominantly on the system hydrodynamics,specifically via the coarse bubble aeration. Longervertically-mounted membranes in larger systemsare subject to a wider range of transmembranepressures along the length of the membrane thanshorter membranes, and also higher rise velocitiesof the bubbles. Given the complexity of the sheartransients induced by large air bubbles, so called“slug flow”, it is perhaps unsurprising that datafrom small pilot trials (10’s of litres) do not reflectthose at larger scales (several m3) [10]. On theother hand, periods of relatively rapid fouling inlarge pilot-scale plants have been reported undersub-critical operating conditions even with regularbackflushing [12].
It is predominantly with synthetic feedwatersthat critical filtration times are discernable, butno pattern was observed for tcrit across different
224 A. Pollice et al. / Desalination 174 (2005) 221–230
studies other than, once again, large-scale plantstending to show lower fouling propensity by dis-playing no tcrit.
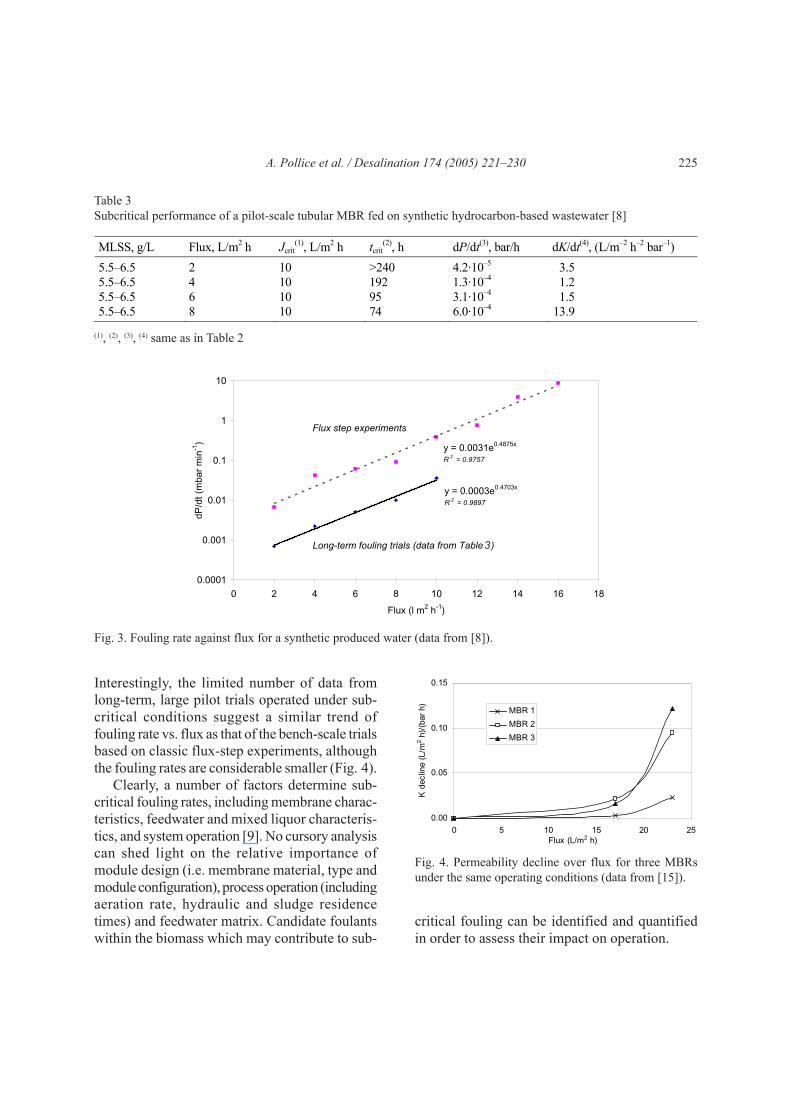
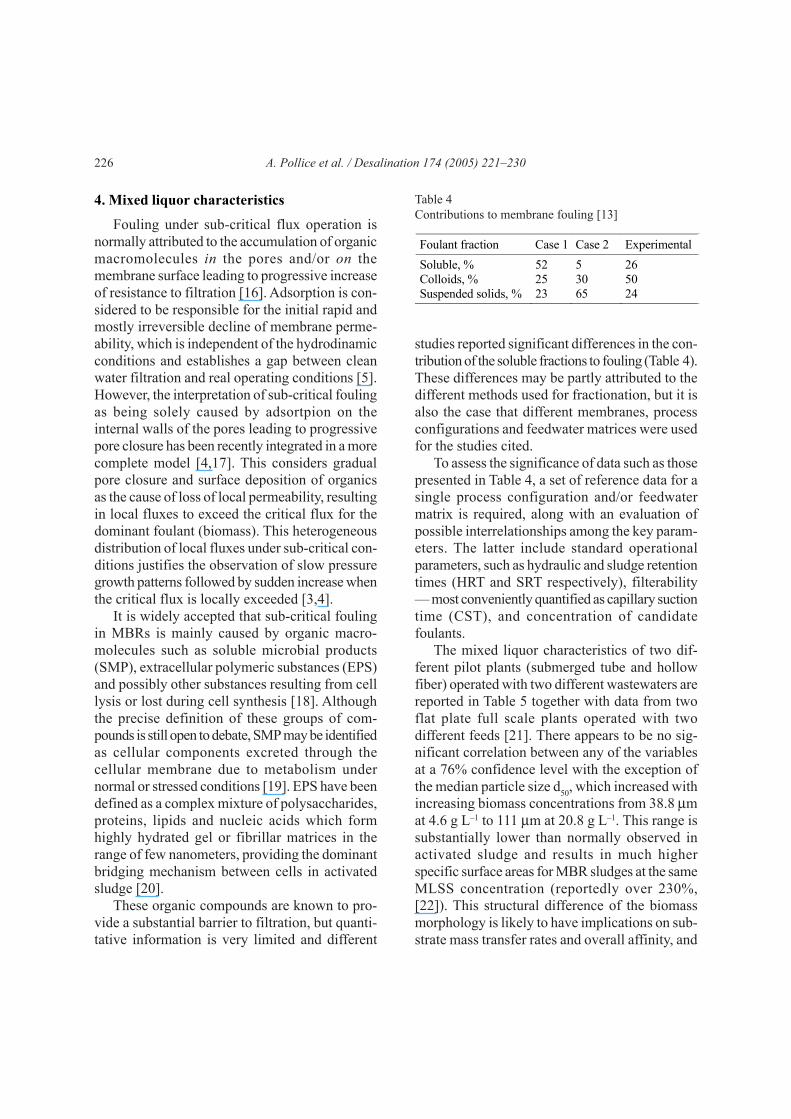
Table 3 reports a single set of data from animmersed tubular system operated at differentfluxes for treating a synthetic wastewater con-taining petroleum hydrocarbons (but no free oil)[8]. The effect of increasing flux on perme-abilityis visible both in terms of tcrit and dP/dt and inparticular an exponential relationship between thefouling rate (dP/dt) and flux is evidenced (Fig. 3).This relationship appears to apply both below andabove the critical flux.
The results from long-term trials displayed inFig. 2 revealed tcrit and dP/dt to vary both withflux and feedwater matrix. In particular, the pro-duced water showed greater fouling propensity thaneither real or synthetic sewage, leading to sig-nificantly lower tcrit and greater dP/dt values [8].
Table 2Sub-critical long-term parameters calculated from results of different investigations on domestic wastewater
SS = sidestream; Subm = submerged; FP = flat plate(1) Critical flux, as determined experimentally by flux-step method(2) Filtration time: duration of stable operation at indicated rate of pressure increase/permeability decrease(3) Transmembrane pressure increase during sub-critical operation(4) Permeability decline: rate of permeability decrease with time
System and size/scale
Membrane MLSS, g/L
Flux, L/m2 h
Jcrit(1),
L/m2 h tcrit
(2), h
dP/dt(3), bar/h
dK/dt(4), (L/m2 h)/(bar h)
Ref.
UASB Bench*
SS FP MF (0.22 µm)
0.3–0.5 30 50 360 0.12 3.6 4
Aerobic 20 L
SS Tub. MF (0.05 µm)
1.8 10 550 0.03 0.33 3
Aerobic 40 L
Subm. Tub. MF (0.2 µm)
3 9 18 240 0.11 0.97 6
Aerobic 20 L
Subm. HF MF (0.1 µm)
17–27 12 300 2.0 10–4 2.4 10–3 13
Aerobic 6.3 m3
Subm. HF MF (0.1 µm)
12–19 12 19 9.3 10–6 1.1 10–4 14
Aerobic 4.3 m3
Subm. FP MF (0.4 µm)
10–18 9 20 1.2 10–5–9.2 10–6 1.1 10–4–8.3 10–5 14
Aerobic Subm. FP MF (0.4 µm)
8–12 17 2.4 10–6–5.9 10–6 1.0 10–4–4.0 10–5 15
It has been observed in other studies that short-term flux-step experiments for critical flux deter-mination are not representative of long-term sub-critical flux behaviour [6]. On the other hand, generaltrends from short-term experiments appear con-sistent with those from long-term trials. For example,both the long-term trials depicted in Fig. 2 andthe short-term flux-step data given in Table 1indicate real sewage to have a lower fouling pro-pensity than either the analogue produced wateror sewage [8]. In Fig. 3, the correlation betweendP/dt and J has the same exponent for the long-term experiments and the flux step data referredto a common feedwater matrix. Short-term foulingexperiments may thus be helpful in detectingfouling under sub-critical flux operation and allowcomparative studies of different feeds, operatingconditions, etc., but true sustainability of low fluxoperation is only revealed through long-term tests.
A. Pollice et al. / Desalination 174 (2005) 221–230 225
Table 3Subcritical performance of a pilot-scale tubular MBR fed on synthetic hydrocarbon-based wastewater [8]
(1), (2), (3), (4) same as in Table 2
MLSS, g/L Flux, L/m2 h Jcrit(1), L/m2 h tcrit
(2), h dP/dt(3), bar/h dK/dt(4), (L/m–2 h–2 bar–1) 5.5–6.5 2 10 >240 4.2·10–5 3.5 5.5–6.5 4 10 192 1.3·10–4 1.2 5.5–6.5 6 10 95 3.1·10–4 1.5 5.5–6.5 8 10 74 6.0·10–4 13.9
Fig. 3. Fouling rate against flux for a synthetic produced water (data from [8]).
y = 0.0003e0.4703x
R 2 = 0.9897
y = 0.0031e0.4875x
R 2 = 0.9757
0.0001
0.001
0.01
0.1
1
10
0 2 4 6 8 10 12 14 16 18
Flux (l m2 h-1)
dP/d
t (m
bar
min
-1)
Flux step experiments
Long-term fouling trials (data from Table 2)
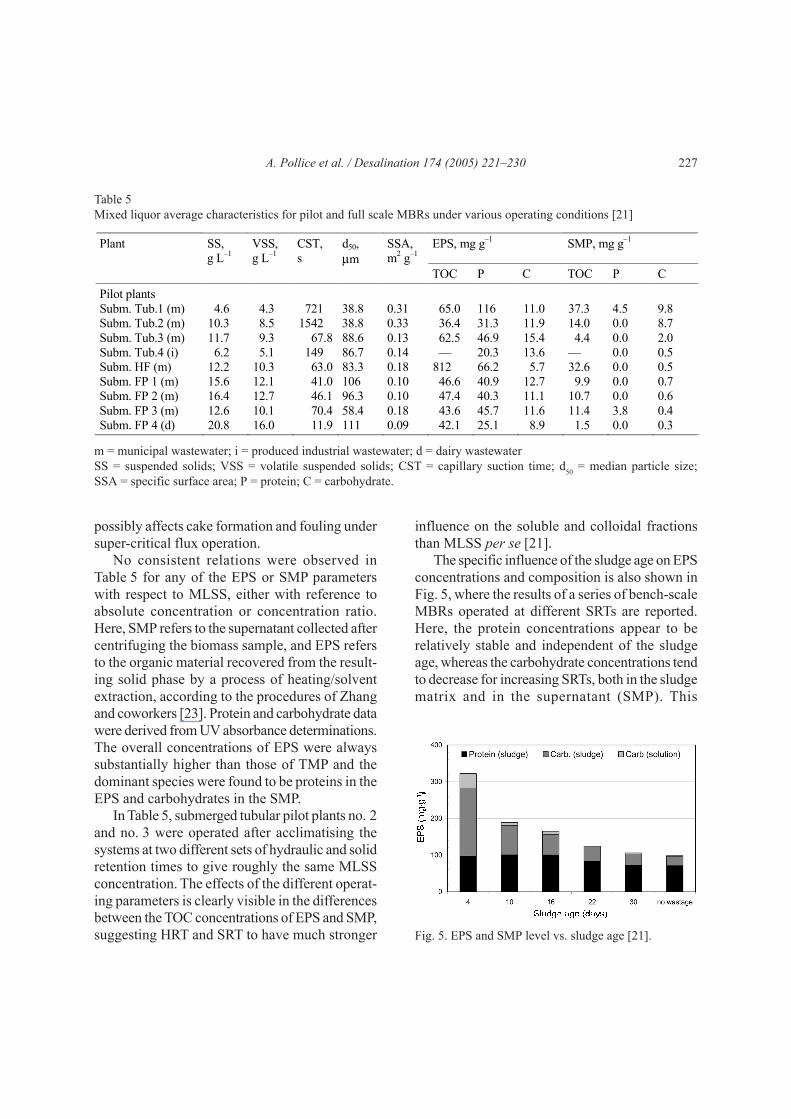
Interestingly, the limited number of data fromlong-term, large pilot trials operated under sub-critical conditions suggest a similar trend offouling rate vs. flux as that of the bench-scale trialsbased on classic flux-step experiments, althoughthe fouling rates are considerable smaller (Fig. 4).
Clearly, a number of factors determine sub-critical fouling rates, including membrane charac-teristics, feedwater and mixed liquor characteris-tics, and system operation [9]. No cursory analysiscan shed light on the relative importance ofmodule design (i.e. membrane material, type andmodule configuration), process operation (includingaeration rate, hydraulic and sludge residencetimes) and feedwater matrix. Candidate foulantswithin the biomass which may contribute to sub-
Fig. 4. Permeability decline over flux for three MBRsunder the same operating conditions (data from [15]).
0.00
0.05
0.10
0.15
0 5 10 15 20 25Flux (L/m2 h)
K d
eclin
e (L
/m2 h
)/(b
ar h
)
MBR 1
MBR 2
MBR 3
critical fouling can be identified and quantifiedin order to assess their impact on operation.
3
226 A. Pollice et al. / Desalination 174 (2005) 221–230
4. Mixed liquor characteristics
Fouling under sub-critical flux operation isnormally attributed to the accumulation of organicmacromolecules in the pores and/or on themembrane surface leading to progressive increaseof resistance to filtration [16]. Adsorption is con-sidered to be responsible for the initial rapid andmostly irreversible decline of membrane perme-ability, which is independent of the hydrodinamicconditions and establishes a gap between cleanwater filtration and real operating conditions [5].However, the interpretation of sub-critical foulingas being solely caused by adsortpion on theinternal walls of the pores leading to progressivepore closure has been recently integrated in a morecomplete model [4,17]. This considers gradualpore closure and surface deposition of organicsas the cause of loss of local permeability, resultingin local fluxes to exceed the critical flux for thedominant foulant (biomass). This heterogeneousdistribution of local fluxes under sub-critical con-ditions justifies the observation of slow pressuregrowth patterns followed by sudden increase whenthe critical flux is locally exceeded [3,4].
It is widely accepted that sub-critical foulingin MBRs is mainly caused by organic macro-molecules such as soluble microbial products(SMP), extracellular polymeric substances (EPS)and possibly other substances resulting from celllysis or lost during cell synthesis [18]. Althoughthe precise definition of these groups of com-pounds is still open to debate, SMP may be identifiedas cellular components excreted through thecellular membrane due to metabolism undernormal or stressed conditions [19]. EPS have beendefined as a complex mixture of polysaccharides,proteins, lipids and nucleic acids which formhighly hydrated gel or fibrillar matrices in therange of few nanometers, providing the dominantbridging mechanism between cells in activatedsludge [20].
These organic compounds are known to pro-vide a substantial barrier to filtration, but quanti-tative information is very limited and different
studies reported significant differences in the con-tribution of the soluble fractions to fouling (Table 4).These differences may be partly attributed to thedifferent methods used for fractionation, but it isalso the case that different membranes, processconfigurations and feedwater matrices were usedfor the studies cited.
To assess the significance of data such as thosepresented in Table 4, a set of reference data for asingle process configuration and/or feedwatermatrix is required, along with an evaluation ofpossible interrelationships among the key param-eters. The latter include standard operationalparameters, such as hydraulic and sludge retentiontimes (HRT and SRT respectively), filterability— most conveniently quantified as capillary suctiontime (CST), and concentration of candidatefoulants.
The mixed liquor characteristics of two dif-ferent pilot plants (submerged tube and hollowfiber) operated with two different wastewaters arereported in Table 5 together with data from twoflat plate full scale plants operated with twodifferent feeds [21]. There appears to be no sig-nificant correlation between any of the variablesat a 76% confidence level with the exception ofthe median particle size d50, which increased withincreasing biomass concentrations from 38.8 µmat 4.6 g L–1 to 111 µm at 20.8 g L–1. This range issubstantially lower than normally observed inactivated sludge and results in much higherspecific surface areas for MBR sludges at the sameMLSS concentration (reportedly over 230%,[22]). This structural difference of the biomassmorphology is likely to have implications on sub-strate mass transfer rates and overall affinity, and
Table 4Contributions to membrane fouling [13]
Foulant fraction Case 1 Case 2 Experimental Soluble, % 52 5 26 Colloids, % 25 30 50 Suspended solids, % 23 65 24
A. Pollice et al. / Desalination 174 (2005) 221–230 227
possibly affects cake formation and fouling undersuper-critical flux operation.
No consistent relations were observed inTable 5 for any of the EPS or SMP parameterswith respect to MLSS, either with reference toabsolute concentration or concentration ratio.Here, SMP refers to the supernatant collected aftercentrifuging the biomass sample, and EPS refersto the organic material recovered from the result-ing solid phase by a process of heating/solventextraction, according to the procedures of Zhangand coworkers [23]. Protein and carbohydrate datawere derived from UV absorbance determinations.The overall concentrations of EPS were alwayssubstantially higher than those of TMP and thedominant species were found to be proteins in theEPS and carbohydrates in the SMP.
In Table 5, submerged tubular pilot plants no. 2and no. 3 were operated after acclimatising thesystems at two different sets of hydraulic and solidretention times to give roughly the same MLSSconcentration. The effects of the different operat-ing parameters is clearly visible in the differencesbetween the TOC concentrations of EPS and SMP,suggesting HRT and SRT to have much stronger
Table 5Mixed liquor average characteristics for pilot and full scale MBRs under various operating conditions [21]
m = municipal wastewater; i = produced industrial wastewater; d = dairy wastewaterSS = suspended solids; VSS = volatile suspended solids; CST = capillary suction time; d50 = median particle size;SSA = specific surface area; P = protein; C = carbohydrate.
EPS, mg g–1 SMP, mg g–1 Plant SS, g L–1
VSS, g L–1
CST, s
d50, µm
SSA, m2 g–1
TOC P C TOC P C Pilot plants Subm. Tub.1 (m) 4.6 4.3 721 38.8 0.31 65.0 116 11.0 37.3 4.5 9.8 Subm. Tub.2 (m) 10.3 8.5 1542 38.8 0.33 36.4 31.3 11.9 14.0 0.0 8.7 Subm. Tub.3 (m) 11.7 9.3 67.8 88.6 0.13 62.5 46.9 15.4 4.4 0.0 2.0 Subm. Tub.4 (i) 6.2 5.1 149 86.7 0.14 — 20.3 13.6 — 0.0 0.5 Subm. HF (m) 12.2 10.3 63.0 83.3 0.18 812 66.2 5.7 32.6 0.0 0.5 Subm. FP 1 (m) 15.6 12.1 41.0 106 0.10 46.6 40.9 12.7 9.9 0.0 0.7 Subm. FP 2 (m) 16.4 12.7 46.1 96.3 0.10 47.4 40.3 11.1 10.7 0.0 0.6 Subm. FP 3 (m) 12.6 10.1 70.4 58.4 0.18 43.6 45.7 11.6 11.4 3.8 0.4 Subm. FP 4 (d) 20.8 16.0 11.9 111 0.09 42.1 25.1 8.9 1.5 0.0 0.3
influence on the soluble and colloidal fractionsthan MLSS per se [21].
The specific influence of the sludge age on EPSconcentrations and composition is also shown inFig. 5, where the results of a series of bench-scaleMBRs operated at different SRTs are reported.Here, the protein concentrations appear to berelatively stable and independent of the sludgeage, whereas the carbohydrate concentrations tendto decrease for increasing SRTs, both in the sludgematrix and in the supernatant (SMP). This
Fig. 5. EPS and SMP level vs. sludge age [21].
228 A. Pollice et al. / Desalination 174 (2005) 221–230
suggests that a higher fouling potential may beobserved during MBR start-up when the biomassis building-up in the reactor, the MLSS concen-tration is lower than at steady state, and the SRTis progressively increasing. Under these conditionsthe two effects of proportionally higher levels ofundegraded feed fractions and higher EPSconcentrations from the growing biomass maycombine to produce larger loading of potentialfoulants on the membrane [24]. In other words,the stability of the sludge concentration at a givenorganic loading rate may be more relevant indefining the mixed liquor fouling potential thanthe MLSS concentration. This is partially con-firmed by previous observations, where SRT andorganic load were identified among the keyparameters for minimizing SMP production inactivated sludge [19]. However, the same authorsalso reported proportionality between biomassconcentration and SMP production due to in-creased release of organic material from cell lysis.This could increase fouling propensity for higherMLSS concentrations also under sub-criticalconditions.
The effects of MLSS concentration on thefiltation resistance are mostly related to cakepermeability, and thus would be expected to affectsuper-critical rather than sub-critical operation.
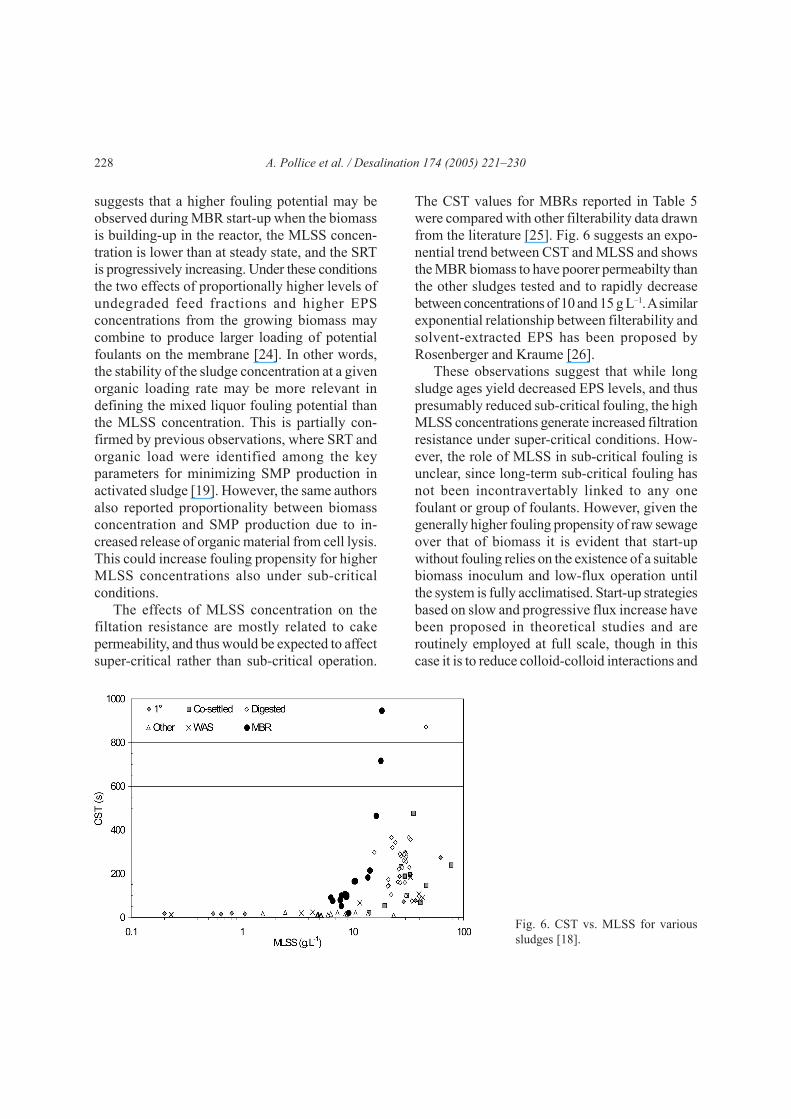
Fig. 6. CST vs. MLSS for varioussludges [18].
The CST values for MBRs reported in Table 5were compared with other filterability data drawnfrom the literature [25]. Fig. 6 suggests an expo-nential trend between CST and MLSS and showsthe MBR biomass to have poorer permeabilty thanthe other sludges tested and to rapidly decreasebetween concentrations of 10 and 15 g L–1. A similarexponential relationship between filterability andsolvent-extracted EPS has been proposed byRosenberger and Kraume [26].
These observations suggest that while longsludge ages yield decreased EPS levels, and thuspresumably reduced sub-critical fouling, the highMLSS concentrations generate increased filtrationresistance under super-critical conditions. How-ever, the role of MLSS in sub-critical fouling isunclear, since long-term sub-critical fouling hasnot been incontravertably linked to any onefoulant or group of foulants. However, given thegenerally higher fouling propensity of raw sewageover that of biomass it is evident that start-upwithout fouling relies on the existence of a suitablebiomass inoculum and low-flux operation untilthe system is fully acclimatised. Start-up strategiesbased on slow and progressive flux increase havebeen proposed in theoretical studies and areroutinely employed at full scale, though in thiscase it is to reduce colloid-colloid interactions and
A. Pollice et al. / Desalination 174 (2005) 221–230 229
ultimately produce less consolidated depositlayers [27,28].
5. Conclusions
Recently available data from different experi-ences on sub-critical flux operation of MBRsallow an assessment of relevant parametersaffecting the sustainability of long-term operationunder these conditions. In terms of operationalparameters, the following observations can bemade:• Information on sub-critical behaviour obtained
at the laboratory or pilot scale is difficult totransfer to full-scale plants, since the plant sizeprobably impacts upon the hydrodynamics ina submerged system.
• Values of permeability decline (dK/dt) andfouling rate (dP/dt) vary widely betweenstudies, with no observable trend other thanthe tendency towards increased fouling atsmaller scales of operation and for analogues.
• Critical filtration time (tcrit) has been observedonly in small-scale experiments, with thelimited data available suggesting that it is afunction of flux.
• Short-term fouling experiments (step-flux)may be helpful in detecting the occurrence offouling even at sub-critical fluxes and quantifyrelative fouling propensity of factors such asfeedwater characteristics, but the absolutemeasured fouling rates do not appear to be ap-plicable to long-term operation.
In terms of mixed liquor characteristics, themain conclusions are the following:• Sludge concentration is more significant in
super-critical than sub-critical operation.• HRT and SRT impact upon the soluble and
colloidal fractions in the MLSS.• Extractable EPS are the dominant microbial
product in the MBR mixed liquor independentof the feed and operating conditions, and aremainly composed of proteins and lower con-centrations of carbohydrates.
• Carbohydrate concentrations in SMP and EPStend to decrease with increasing sludge reten-tion time, whereas proteins appear less affectedby the sludge age.
• While long sludge ages may be beneficial inminimizing the EPS carbohydrate levels, thuslimiting sub-critical fouling, high MLSS con-centrations cause increased filtration resist-ances under super-critical conditions.
• Higher fouling potential are more likely to ariseduring start-up of MBRs due to the combinedeffects of higher undegraded feed fractions andhigher EPS levels from the growing biomass.
Despite the observed importance of EPS infouling in general, no unequivocal link betweenEPS levels and sub-critical fouling has beenreported. Further elucidation requires the correla-tion of sub-critical fouling rates and EPS levels.Moreover, such correlations would be made morevaluable if the critical flux is defined, sincereported studies suggest that fouling rate increasesexponentially with flux in both the sub- and super-critical regions.
Acknowledgements
During the preparation of this review AP wasguest at the School of Water Sciences as partialfulfilment of a CNR-NATO fellowship.
References[1] R.W. Field, D. Wu, J.A. Howell and B.B. Gupta, Criti-
cal flux concept for microfiltration fouling. J. Membr.Sci., 100 (1995) 259–272.
[2] J.A. Howell, Sub-critical flux operation of micro-filtration. J. Membr. Sci., 107 (1995) 165–171.
[3] S. Ognier, C. Wisniewski and A. Grasmick, Biofoulingin MBRs: phenomenon analysis and modeling. Proc.3rd Internat. Meeting on Membrane Bioreactors,Cranfield University, May 2001, pp. 1–13.
[4] B.D. Cho and A.G. Fane, Fouling transients in nomi-nally sub-critical flux operation of a membranebioreactor. J. Membr. Sci., 209 (2002) 391–403.
[5] S. Ognier, C. Wisniewski and A. Grasmick, Influence
230 A. Pollice et al. / Desalination 174 (2005) 221–230
of macromolecule adsorption during filtration of amembrane bioreactor mixed liquor suspension. J.Membr. Sci., 209 (2002) 27–37.
[6] P. Le Clech, B. Jefferson, I.S. Chang and S.Judd, Criti-cal flux determination by the flux-step method in asubmerged membrane bioreactor. J. Membr. Sci., 227(2003) 81–93.
[7] P. Le Clech, B. Jefferson and S.J. Judd, Impact of aera-tion, solids concentration and membrane charac-teristics on the hydraulic performance of a membranebioreactor. J. Membr. Sci., 218 (2003) 117–129.
[8] A. Brookes, B. Jefferson, P. Le Clech and S.J. Judd,The fate of organics during treatment of produced waterby MBRs. Proc. 5th IMSTEC Internat. MembraneScience and Technology Conference, UNSW, Sydney,Australia, 10–14 November 2003.
[9] I.S. Chang, P. Le Clech, B. Jefferson and S. Judd,Membrane fouling in membrane bioreactors for waste-water treatment. J. Environ. Eng. ASCE, 128(11) (2002)1018–1029.
[10] R. Ghosh and Z.F. Cui, Mass transfer in gas-spargedultrafiltration: upward slug flow in tubular membranes.J. Membr. Sci., 162 (1999) 91–102.
[11] S. Judd and B. Jefferson, The impact of sludge qualityon MBR operation. Proc. Internat. Conference “Ap-plications and perspectives of MBR in wastewater treat-ment and reuse”, Politecnico di Milano, Cremona, Italy,28–29 April 2003.
[12] S. Rosenberger, U. Krüger, R. Witzig, W. Manz, U.Szewzyk and M. Kraume, Performance of a bioreactorwith submerged membranes for aerobic treatment ofmunicipal wastewater. Wat. Res., 36 (2002) 413–429.
[13] E.H. Bouhabila, R. Ben Aïm and H. Buisson, Foulingcharacterisation in membrane bioreactors. Separ. Purif.Tech., 22–23 (2001) 123–132.
[14] G. Guglielmi, Membrane bioreactors for municipalwastewater treatment. Ph.D. thesis, Universita’ diTrento, Italy, 2002.
[15] S. Churchouse, Membrane bioreactors going from labto large scale applications. First Internat. Meeting onCritical Flux, Oxford University, July 2002.
[16] L. Defrance and M.Y. Jaffrin, Comparison betweenfiltration at fixed transmembrane pressure and fixedpermeate flux: application to a membrane bioreactorused for wastewater treatment. J. Membr. Sci., 152(1999) 203–210.
[17] B.D. Cho, A.G. Fane, S.B. Ghayeni, K.J. Kim and K.Parameshwaran, Biological wastewater treatments and
membranes. Proc. Conf. Membrane Technology inEnvironmental Management, IAWQ, Tokyo, 1999.
[18] I.S. Chang, J.S. Kim and C.H. Lee, The effects of EPSon membrane fouling in a MBR process. Proc. 3rdInternat. Meeting on Membrane Bioreactors, CranfieldUniversity, May 2001, pp. 19–28.
[19] D.J. Barker and D.C. Stuckey, A review of solublemicrobial products (SMP) in wastewater treatmentsystems. Wat. Res., 33 (1999) 3063–3082.
[20] R. Bura, M. Cheung, B. Liao, J. Finlayson, B.C. Lee,I.G. Droppo, G.G. Leppard and S.N. Liss, Composi-tion of extracellular polymeric substances in the acti-vated sludge floc matrix. Wat. Sci. Tech., 37(4–5)(1998) 325–333.
[21] A. Brookes, S. Judd, E. Reid, E. Germain, S. Smith,H. Alvarez, P. Le Clech, T. Stephenson, E. Turra andB. Jefferson, Charcterization and impact of biomassfoulants in membrane bioreactors. Proc. 5th IMSTECInternational Membrane Science and Technology Con-ference, UNSW, Sydney, Australia, 10–14 November2003.
[22] S. Smith, S. Judd, T. Stephenson and B. Jefferson,Membrane bioreactors — Hybrid activated sludge ora new process? Proc. 5th IMSTEC International Mem-brane Science and Technology Conference, UNSW,Sydney, Australia, 10–14 November 2003.
[23] X. Zhang, P. Bishop and P. Kinkle, Comparison of ex-traction methods for quantifying extracellular polymersin biofilms. Wat. Sci. Tech., 39(7) (1999) 211–218.
[24] T. Mukai, K. Takimoto, T. Kohno and M. Okada, Ul-trafiltration behaviour of extracellular and metabolicproducts in activated sludge system with UF separa-tion process. Wat. Res., 34 (2000) 902–908.
[25] J. Houghton, T. Stephenson and J. Quarmby, The im-pact of digester retention time on microbial extracel-lular polymer production and sludge dewaterability.Environ. Technol., 21 (2002) 1157–1165.
[26] S. Rosenberger and M. Kraume, Filterability of acti-vated sludge in membrane bioreactors. Desalination,146 (2002) 373–379.
[27] V. Chen, A.G. Fane, S. Madaeni and I.G. Wenten, Par-ticle deposition during membrane filtration of colloids:transition between concentration polarization and cakeformation. J. Membr. Sci., 125 (1997) 109–122.
[28] V. Chen, Performance of partially permeable micro-filtration membranes under low fouling conditions. J.Membr. Sci., 147 (1998) 265–278.


