Embed Size (px)
Citation preview
Subclinical delusional thinking predicts lateral temporalcortex responses during social reflectionBenjamin K. Brent ,1 Garth Coombs ,2 ,3 Matcheri S. Keshavan ,1 Larry J. Seidman ,1 ,3 Joseph M. Moran ,4 andDaphne J. Holt2 ,3
1The Department of Psychiatry, Beth Israel Deaconess Medical Center, Harvard Medical School, Boston, MA 02115, 2The Athinoula A. Martinos
Center for Biomedical Imaging, Charlestown, MA 02114, 3The Department of Psychiatry, Massachusetts General Hospital, Harvard Medical
School, Boston, MA 02114, and 4The Department of Psychology, Harvard University, Cambridge, MA 02138, USA
Neuroimaging studies have demonstrated associations between delusions in psychotic disorders and abnormalities of brain areas involved in socialcognition, including medial prefrontal cortex (MPFC), posterior cingulate cortex, and lateral temporal cortex (LTC). General population studies havelinked subclinical delusional thinking to impaired social cognition, raising the question of whether a specific pattern of brain activity during socialperception is associated with delusional beliefs. Here, we tested the hypothesis that subclinical delusional thinking is associated with changes in neuralfunction, while subjects made judgments about themselves or others [�social reflection� (SR)]. Neural responses during SR and non-social tasks, as wellas resting-state activity, were measured using functional magnetic resonance imaging in 22 healthy subjects. Delusional thinking was measured usingthe Peters et al. Delusions Inventory. Delusional thinking was negatively correlated with responses of the left LTC during SR (r¼�0.61, P¼0.02,Bonferroni corrected), and connectivity between the left LTC and left ventral MPFC, and was positively correlated with connectivity between the left LTCand the right middle frontal and inferior temporal cortices. Thus, delusional thinking in the general population may be associated with reduced activityand aberrant functional connectivity of cortical areas involved in SR.
Keywords: delusions; psychosis; fMRI; lateral temporal cortex; default mode network
INTRODUCTION
Delusions represent a defining symptom of psychotic disorders (Breier
and Berg, 1999; McKay et al., 2007). Nevertheless, it has become in-
creasingly clear that within the general population, �5–6% of individ-
uals without psychiatric disorders endorse beliefs similar to the
delusions experienced by patients with psychotic illnesses (Freeman,
2006; van Os et al., 2009). Although the majority of people with sub-
clinical psychotic symptoms are unlikely to develop full-blown psych-
osis (Dominguez et al., 2011), recent epidemiological studies suggest
that delusion-like beliefs may be on an etiological continuum with
delusions in psychotic disorders. For example, subclinical delusions
share common risk factors with clinical delusions, such as urban
living, social isolation, and depression (van Os et al., 2000). Also, a
recent longitudinal study showed that childhood internalizing and
externalizing problems are associated with a higher incidence in early
adulthood of both (i) subclinical delusions and (ii) non-affective
psychosis (Scott et al., 2009). In addition, one study found that delu-
sion severity in patients with schizophrenia and bipolar disorder pre-
dicted greater levels of delusional thinking in the patients’ non-ill,
first-degree relatives (Schurhoff et al., 2003), suggesting that genetic
vulnerability to delusions and clinical psychosis is expressed as aber-
rant beliefs in otherwise healthy individuals. These results support the
possibility that some of the delusional thinking observed in
non-clinical samples arises from the same pathophysiological mechan-
isms associated with delusions in psychotic disorders.
Because delusions frequently involve misunderstandings of social
situations (e.g. persecutory delusions) or of the person’s position in
the world relative to others (e.g. grandiose or religious delusions), it
has been proposed that basic neurocognitive processes supporting the
perception of the self and others [i.e. ‘social reflection’ (SR)] may be
disrupted during the formation and maintenance of delusions (Bentall
et al., 2001; Blackwood et al., 2001). Consistent with this theory, several
studies have demonstrated associations between delusions in schizo-
phrenia and impairments of the capacity for understanding the mental
states of others (‘theory of mind’) (Frith and Corcoran, 1996; Langdon
et al., 1997). Moreover, delusional thinking in the general population
has been linked to a reduced ability to take an external perspective on
one’s own thinking (Warman and Martin, 2006) and a heightened
self-focus when reasoning about social situations (Galbraith et al.,
2008). However, the neural basis of these abnormalities is not yet
understood.
Recently, investigating the neural correlates of deficits of SR in psy-
chopathology has become more feasible because the neural systems
mediating social perception have been characterized to some extent
in healthy populations. Functional magnetic resonance imaging
(fMRI) studies in healthy subjects have consistently shown that think-
ing about the self (Jenkins and Mitchell, 2011; Kelley et al., 2002;
Schmitz et al., 2004) and other people (Gallagher et al., 2000; Frith
and Frith, 2003; Saxe and Kanwisher, 2003) engages midline cortical
structures [medial prefrontal cortex (MPFC) and posterior cingulate
cortex (PCC)], and the lateral temporal cortex (LTC). The involve-
ment of these areas in SR is typically manifested by increased activity of
these brain regions during the performance of tasks involving the re-
trieval of information about the self and/or others, compared with
tasks focusing on general semantic or physical features of the stimuli
(Amodio and Frith, 2006). Also, interestingly, these same midline and
lateral cortical regions show elevated activity (Gusnard et al., 2001;
Gusnard and Raichle, 2001; Raichle et al., 2001) and increased func-
tional coupling (Greicius et al., 2003; Greicius and Menon, 2004)
during ‘resting states’ (i.e. when no task is performed). In studies of
Received 22 June 2012; Accepted 4 November 2012
Portions of this study were presented at the 2010 International Congress of Schizophrenia Research meeting in
Colorado Springs, CO, and at the 2012 Biological Psychiatry meeting in Philadelphia, PA.
We thank the Harvard Catalyst and Dr Heidi Thermenos for valuable statistical support throughout the study. This
study was supported by Harvard Medical School’s Stuart T. Hauser Clinical Research Training Program (B.K.B.) and
Peter B. Livingston Fellowship (B.K.B.), the National Institute of Mental Health K23MH076054 (D.J.H.), the National
Alliance for Research on Depression and Schizophrenia with the Sidney R. Baer, Jr Foundation (D.J.H.), and the
Commonwealth Research Center of Massachusetts SCDMH82101008006 (L.J.S.).
Correspondence should be addressed to Daphne J. Holt, 149 13th St. Charlestown, MA 02129, USA.
E-mail: [email protected]
doi:10.1093/scan/nss129 SCAN (2012) 1of10
� The Author (2012). Publishedby Oxford University Press. For Permissions, please email: [email protected]
Social Cognitive and Affective Neuroscience Advance Access published December 19, 2012 at H
arvard University on D
ecember 20, 2012
http://scan.oxfordjournals.org/D
ownloaded from
schizophrenia, abnormalities in the magnitude or pattern of functional
coupling among the regions of this ‘default mode’ network, including
those showing aberrant activity during SR (Holt et al., 2011a; Murphy
et al., 2010), have been reported (Bluhm et al., 2007; Garrity et al.,
2007; Pomarol-Clotet et al., 2008; Whitfield-Gabrieli et al., 2009).
Consistent with the idea that abnormal neural function during SR
may be associated with psychosis, dysfunction of default network
regions, including the LTC (Brune et al., 2008; Murphy et al., 2010;
Wang et al., 2011) and midline cortical structures (MPFC and PCC)
(Brunet et al., 2003; Holt et al., 2011a; Russell et al., 2000; Blackwood
et al., 2004), have been observed during reflection on the self and
others in schizophrenia. Links between functional and structural
abnormalities of regions of this network and the presence or severity
of delusions have also been reported (Blackwood et al., 2004;
Takahashi et al., 2009; Rotarsk-Jagiela et al., 2010; Menon et al.,
2011). Specifically, previous investigations of the neural correlates of
delusions or psychotic symptoms have found evidence for both (i)
state-related overactivity of limbic and default mode circuitry
(Honey et al., 2008; Rotarska-Jagiela et al., 2010; Menon et al.,
2011), for example, delusional thoughts and associated neural activity
may be elicited by ambiguous (Surguladze et al., 2006; Holt et al.,
2011b) or threatening (Taylor et al., 2007) information, as well as
(ii) impaired recruitment of medial frontal (Blackwood et al., 2004;
Brune et al., 2008; Holt et al., 2012) and temporal (Han et al., 2007)
cortex during social, emotional, or language processing. These pre-
vious studies suggest that in delusional states, disinhibition of circuits
involved in socioemotional perception may interfere with their
task-dependent functioning, perhaps particularly during emotional
and social perception.
Given these findings and the associations previously found between
delusions and SR deficits, one remaining question is whether delu-
sional thinking is associated with a specific pattern of neural activity
during social reflective processing. To examine this question, in this
study, we measured the relationship between the severity of delusional
thinking in healthy subjects and default network responses during SR.
Taking a dimensional approach to studying neural correlates of delu-
sional thinking in a non-clinical population allowed us to avoid the
potential confounds of illness chronicity, medication effects, and insti-
tutionalization that commonly influence the study of delusions in pa-
tients with psychotic disorders (Claridge, 1987). In addition, we
conducted a secondary analysis to determine whether region(s) show-
ing associations between SR-related responses and delusions also ex-
hibit changes in resting-state functional connectivity. Resting-state
fluctuations in the blood oxygen level–dependent (BOLD) signal are
thought to provide a measure of the default network’s intrinsic (i.e.
state and task independent) functional organization (Whitfield-
Gabrieli and Ford, 2012). Because the degree of resting-state functional
coupling among default network structures may reflect, at least in part,
the strength of the anatomical connections between them (Buckner
et al., 2008; Greicius et al., 2008; Andrews-Hanna et al., 2010),
abnormalities in resting-state coupling strength within the default net-
work in delusional people would provide evidence for persistent alter-
ations of those pathways in delusions.
We employed a well-validated fMRI paradigm used in a previous
study of schizophrenia (Holt et al., 2011a), in which subjects evaluate
the degree to which trait adjectives describe themselves or a close other
(Kelley et al., 2002; Schmitz et al., 2004; van der Meer et al., 2010).
Subclinical delusional thinking was measured using the Peters et al.
Delusions Inventory (PDI) (Peters et al., 1999). The PDI is a validated
measure of delusional ideation in non-clinical subjects that shows
strong correlations with standard measures of schizotypy (Peters
et al., 1999) and other subthreshold psychotic symptoms (e.g. hallu-
cinatory experiences) (Larøi and van der Linden, 2005) and
differentiates patients with psychotic disorders from healthy subjects
(Schurhoff et al., 2003; Scott et al, 2009). On the basis of the evidence
for abnormal function and connectivity of default network regions in
schizophrenia (Whitfield-Gabrieli et al., 2009; Murphy et al., 2010;
Holt et al., 2011a) and clinical delusions (Blackwood et al., 2004;
Brune et al., 2008), we hypothesized that delusional thinking in
non-clinical subjects would be associated with similar abnormalities
of this network.
MATERIALS AND METHODS
Participants
Twenty-two right-handed, native English-speaking subjects (14 men
and 8 women) without psychiatric disorders, as determined by the
structured clinical interview for DSM-IV (Frist et al., 2002), were
recruited via advertisement and enrolled in the study. Subjects with
neurological disorders, serious medical illnesses, substance abuse or
dependence, and subjects with contraindications for MRI scanning
(e.g. claustrophobia, metal implants) were excluded. Written informed
consent was obtained from all subjects before enrollment in accord-
ance with the guidelines of the Partners HealthCare Institutional
Review Board and/or the Beth Israel Deaconess Medical Center’s
Committee on Clinical Investigations. Participants had a mean age
of 37.4 (s.d.¼ 13.4) and a mean IQ measured with the North
American Adult Reading Test (Uttl, 2002) of 111.8 (s.d.¼ 7.3). One
subject did not have a full resting BOLD scan due to early scan ter-
mination and was excluded from the resting functional connectivity
analysis. Behavioral response times were not recorded for one subject
due to equipment failure. A different analysis of a portion of this
dataset (16 of the 22 subjects) was included in a previous publication
(Holt et al., 2011a).
Clinical measures
The PDI is a 40-item measure of common delusional beliefs (e.g. Do
you ever feel as if other people are talking about you behind your
back?), rated on a 0 (‘no’) to 1 (‘yes’) point scale. Levels of anxiety
and depression were measured using the Spielberger State-Trait
Anxiety Inventory [STAI (Spielberger et al., 1970)] and the Beck
Depression Inventory [BDI (Beck and Steer, 1987)].
Stimulus presentation and task
The stimuli set of 144 words (trait adjectives, e.g. aimless, unenthusi-
astic, studious, mature) was divided into 4 lists of 36 words. The lists
consisted of an equal number of positively and negatively valenced
adjectives (Anderson, 1968), half of which were printed in upper
case and half in lower case letters. The word lists were matched for
mean word length, word frequency, and valence. During the functional
runs, subjects were asked to make yes/no judgments about the words,
presented one at a time, in four conditions: (i) ‘does this word describe
you?’ [Self (S)]; (ii) ‘does this word describe your mother?’ [Other
(O)]; (iii) ‘is this a desirable trait?’ [affect labeling (AL)], which in-
volves judging and then labeling the affective valence (positive vs nega-
tive) of the word; and (iv) ‘is this word printed in upper or lower case
letters?’ [Perceptual (P)]. For each subject, all 144 words were viewed
during the experiment, and 1 of the 4 word lists was assigned to each of
the 4 conditions. The pattern of assignment of word lists to particular
conditions was counterbalanced across subjects. Each word was viewed
for 3 s in 18-s blocks (six words per block; two blocks per condition)
over three functional runs. Each block was preceded by an instruction
screen viewed for 3 s, and each block was followed by a 21-s fixation
period. Subjects registered their ‘yes’ or ‘no’ responses by pressing a
button with the index finger of their right or left hand. The run order
2 of10 SCAN (2012) B.K.Brent et al.
at Harvard U
niversity on Decem
ber 20, 2012http://scan.oxfordjournals.org/
Dow
nloaded from
and the use of the right or left hand for particular responses were
counterbalanced across subjects.
MRI data acquisition
MRI data were acquired using a 3-Tesla Siemens TIM Trio magnetic
resonance scanner (Siemens Medical Systems, Iselin, New Jersey).
Functional imaging was preceded by the collection of a
high-resolution, three-dimensional structural T1 magnetization pre-
pared rapid acquisition gradient-echo scan [8 min 7 s, 129 sagittal
slices, 1.33-mm thickness, repetition time (TR)¼ 2530 ms, echo time
(TE)¼ 3.39 ms, flip angle¼ 78, resolution¼ 1.3� 1� 1.3 mm). Then
T2*-weighted echo-planar images were acquired (33� 3-mm thick
slices, 3� 3 mm in-plane resolution) during three 6-min and 9-s func-
tional runs, using a gradient-echo sequence (TR¼ 3000 m; TE¼ 30 m;
flip angle¼ 908). A 6-min and 20-s resting BOLD scan (TR¼ 5000 ms;
TE¼ 30 ms; flip angle¼ 908; 55� 2-mm thick slices, 2� 2 mm
in-plane resolution) was also acquired. During the resting scan, sub-
jects viewed a cross in the center of a gray screen and were instructed to
fixate on the cross and to think about whatever they liked.
MRI data analysis
Preprocessing
Functional data were preprocessed and analyzed using the
FreeSurfer Functional Analysis Stream (http://surfer.nmr.mgh.har-
vard.edu). Functional volumes were motion corrected using the
Analysis of Functional NeuroImages algorithm, corrected for temporal
drift, normalized for signal intensity, and then global intensity vari-
ations were removed. Normalized data were spatially smoothed
(full width at half maximum¼ 6 mm) using a three-dimensional spa-
tial filter. The individual cortical surface of each subject was morphed
onto an average spherical surface representation to facilitate intersub-
ject averaging of the functional data, which was carried out in a
common spherical surface coordinate system using the General
Linear Model with random effects.
Task-based fMRI analyses
For the primary contrast of interest, activation during SR [0.5(S)
þ 0.5(O)] was compared with activation during AL. Activation for
the SR > AL contrast is considered to index neural activity during
social processing because the SR task requires a greater level of detail
and depth of explicit representation of social information (i.e. of the
self or a close other), compared with the AL task. Moreover, similar to
previous studies (Schmitz et al., 2004; Moran et al., 2006), we used AL
as a baseline condition to control for the affective processing that
occurs during the S and O tasks. In addition, to determine whether
findings for the SR > AL contrast were driven primarily by activation
during the S or O conditions, exploratory analyses were conducted
using the contrasts S > AL and O > AL. Because the P task involved
responding to questions with objectively correct answers, it served as
an indicator of subjects’ task engagement.
Because of previous findings of abnormal neural function in midline
cortical structures during self-reflection (Holt et al., 2011a) and aber-
rant LTC activation during other reflection (Murphy et al., 2010) in
schizophrenia, we planned to measure average percent signal change,
compared with a baseline average signal intensity, in three a priori
regions of interest (ROIs) within the default network: MPFC, PCC,
and LTC (Figure 1A). These ROIs were defined using an automated
parcellation method [FreeSurfer (Fischl et al., 1999)], which deter-
mines boundaries between cortical regions on the basis of known
sulcal and gyral landmarks in each subject’s anatomical scan
(Desikan et al., 2006). Percent signal change within these ROIs [SR
or AL vs a low-level baseline (i.e. the mean BOLD signal intensity
across all functional runs)] was measured and compared between con-
ditions using a 2 (task: SR, AL)� 3 (region: MPFC, PCC, LTC) � 2
(hemisphere: left, right) analysis of variance (ANOVA). Significant
effects were followed up by planned paired t-tests.
In addition, a secondary cortical surface–based analysis (Fischl et al.,
1999) was carried out to localize significant effects found in the ROI
analysis. A Monte Carlo simulation (10 000 iterations, height threshold
of P < 0.005) was used to identify significant clusters of activated voxels
(corrected cluster-wise P < 0.05). The locations of peaks of activation
were identified using FreeSurfer and confirmed with the Talairach atlas
(Talairach and Tournoux, 1988).
Task-based fMRI activation and symptom analyses
Means and s.d. for symptom data (total scores for the PDI, STAI, and
BDI questionnaires) were calculated. Kolmogorov–Smirnov testing
showed a normal distribution for PDI and STAI and percent signal
change during SR, but not for BDI. Thus, correlations between fMRI
data, PDI, and STAI were tested with Pearson’s correlation coefficient
(r), whereas correlations involving BDI scores were calculated with
Spearman’s rank correlation coefficient (rs). To constrain the examin-
ation of our primary hypothesis to brain areas showing the most
robust response during SR, we limited this analysis to regions showing
significant effects in the ROI analysis and significant cortical surface
activation for the SR > AL contrast. For these correlations, � was set at
0.05, after a Bonferroni correction was applied for the number of re-
gions examined. Because all other correlations conducted were ex-
ploratory in nature, uncorrected P values are reported for those
analyses.
Resting-state functional connectivity analysis
Conventional preprocessing techniques (Buckner et al., 2009) involved
realignment and normalization to Montreal Neurological Institute co-
ordinates and temporal filtering to isolate low frequency (< 0.08 Hz)
BOLD signal fluctuations. Images were corrected for spatial drift, tem-
poral variance, and other potential causes of non-specific variance
using nuisance regressors that included: the six parameters computed
from the rigid-body motion correction, the averaged signal within a
ventricular ROI, a region within the deep white matter, and the signal
averaged over the whole brain. A seed-based analysis was performed by
constructing a 4-mm radius sphere around the voxel showing the
strongest relationship between SR-related activity and delusional
thinking (see Results). Group averaging was performed on Fisher z
transforms (Zar, 1996) using SPM5 (http://www.fil.ion.ucl.ac.uk/
spm). Loci exhibiting positive or negative correlations with the seed
were considered significant if they met a voxel-level height threshold of
P < 0.005 and a whole brain cluster–corrected threshold of P < 0.05. In
addition, exploratory whole brain analyses using PDI total score or
percent signal change during SR as a regressor were conducted.
These regression analyses were limited to regions showing significant
(P < 0.05) positive functional connectivity with the seed (negative cor-
relations were excluded). Correlations meeting a height threshold of
P < 0.01 with an extent threshold of 25 voxels are reported.
RESULTS
Symptoms
Mean levels of delusional thinking (3.2� 3.4; range: 0–10), state anx-
iety (29.2� 6.6; range: 20–26), trait anxiety (31.1� 7.4; range: 22–26),
and depression (1.9� 3.7; range: 0–14) (measured using the PDI,
STAI, and BDI, respectively) were typical of those previously reported
for healthy samples (Knight et al., 1983; Beck et al., 1988; Peters et al.,
1999). Consistent with prior evidence linking delusional thinking and
Delusions and social reflection SCAN (2012) 3 of10
at Harvard U
niversity on Decem
ber 20, 2012http://scan.oxfordjournals.org/
Dow
nloaded from
anxiety (Freeman, 2006), a significant correlation between levels of
delusional thinking and trait anxiety was found (r¼ 0.51, P¼ 0.02).
Behavior
On average, 49.1% of the words seen during the S task were endorsed
as ‘like self’; 47.6% of the words seen during the O task were endorsed
as ‘like other’; and 48.1% of the words seen during the AL task were
endorsed as ‘desirable.’ Subjects showed high levels of accuracy during
the P task (98.5� 2%), indicating good attentional engagement. A
repeated measures ANOVA revealed a main effect of condition for
subjects’ speed of responses F(2,40)¼ 9.015, P¼ 0.001. Post hoc
paired t-tests with Bonferroni correction showed that response times
during O (1.51� 0.23 s) were significantly greater than during S
(1.42� 0.21 s; t¼�2.73; df¼ 20; P¼ 0.04) and AL (1.37� 0.20 s;
t¼ 3.9; df¼ 20; P¼ 0.002). There were no significant differences be-
tween response times during S and AL (t¼ 1.6; df¼ 20; P¼ 0.39).
Task-related BOLD responses
In the ROI analysis (Table 1), a significant Region by Task interaction
(F ¼ 5.13; df¼ 2, 42; P¼ 0.01) was found, but no Region by Task by
Hemisphere interaction (F¼ 1.27; df¼ 2, 42; P¼ 0.29). Follow-up,
planned comparisons showed a greater response during SR compared
with AL in the MPFC (t¼ 4.02, df¼ 21, P¼ 0.001), PCC (t¼ 4.11,
df¼ 21, P¼ 0.001), and LTC (t¼ 4.6, df¼ 21, p¼ 0.0005). Consistent
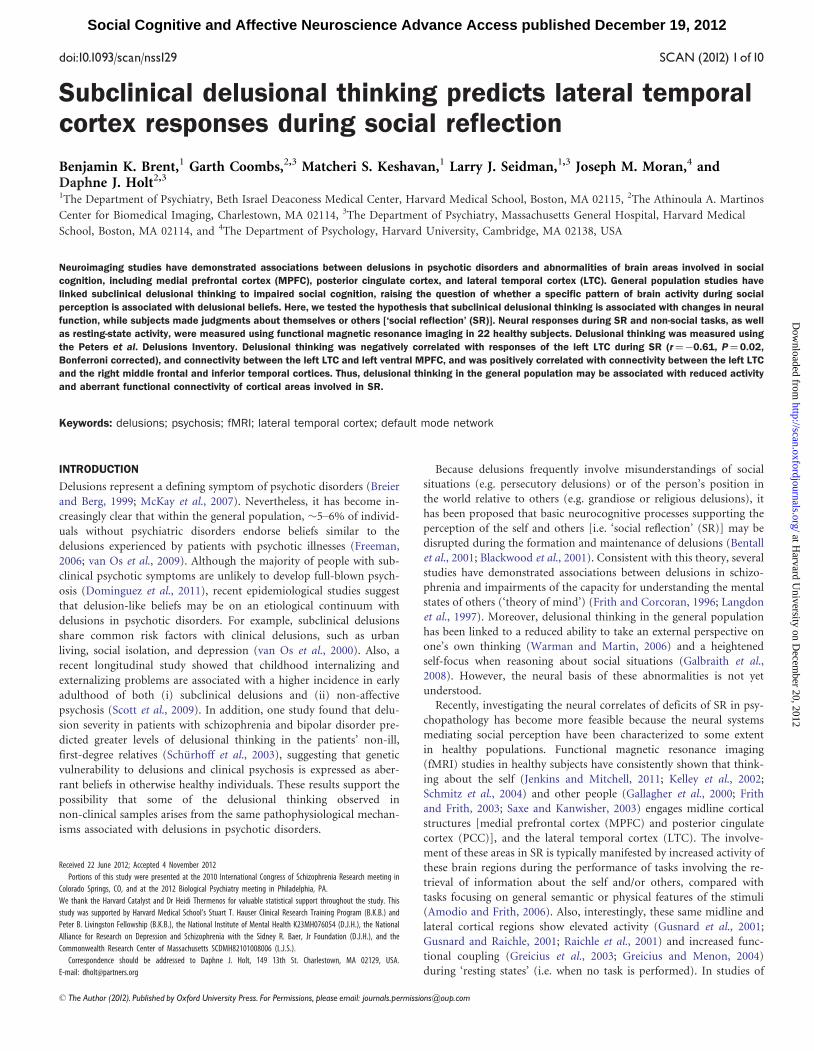
with these results, the follow-up cortical surface-based analysis revealed
clusters with greater responses during SR compared with AL in the
MPFC and PCC bilaterally, and the left LTC (Figure 1B and Table 2A).
Correlational analyses
SR-related activation of the left LTC was negatively correlated with
levels of delusional thinking (r¼�0.61, P¼ 0.02, Bonferroni cor-
rected: P¼ 0.003/5 regions) (Figure 1C). This association remained
unchanged after controlling for trait anxiety. In contrast, there were
no significant associations between left LTC responses during SR and
state anxiety, trait anxiety, depression, or speed of responses during
self-reflection or other reflection (all rs < 0.28, ps > 0.30). Although the
responses of the right LTC during SR compared with AL did not reach
cluster-wise significance, an exploratory analysis revealed that the right
LTC SR response was also negatively correlated with delusional think-
ing (r¼�0.47, P¼ 0.03, uncorrected). In contrast, there were no
significant correlations between levels of delusional thinking and the
magnitude of SR-related responses of the MPFC or PCC bilaterally, or
significant associations between AL-related responses of any of the a
priori ROIs and levels of delusional thinking.
Exploratory analyses of additional contrasts
For both the S > AL and O > AL contrasts, there was significantly
greater activation of the MPFC and PCC bilaterally, and the left
Fig. 1 The results of the cortical surface-based fMRI analyses. (A) The three anatomically defined ROIs [medial prefrontal cortex (MPFC), posterior cingulate cortex (PCC), and lateral temporal cortex (LTC)] areshown in these right medial and lateral views of a representative cortical surface. These ROIs were defined in each subject’s anatomical magnetic resonance imaging scan, using an automated parcellationsystem (FreeSurfer; see Materials and Methods). (B) Cortical surface maps show activation patterns for the SR > AL contrast, P < 0.005. Vertices with significantly greater activation during SR compared with ALare labeled with warm (yellow–red) colors. (C) A scatter plot displays the negative correlation between levels of delusional thinking [measured as Peters et al. Delusions Inventory (PDI) total score] andresponses of the left lateral temporal cortex (LTC) during social reflection (SR) measured as percentage signal change.
4 of10 SCAN (2012) B.K.Brent et al.
at Harvard U
niversity on Decem
ber 20, 2012http://scan.oxfordjournals.org/
Dow
nloaded from

LTC, similar to the pattern seen for the SR > AL contrast (Table 2A–C).
Left LTC responses were also negatively correlated with delusional
thinking for both the S (r¼�0.55, P¼ 0.008) and O (r¼�0.62,
P¼ 0.002) conditions. There were no significant associations between
MPFC or PCC responses during the S or O conditions and delusional
thinking.
Resting-state BOLD activity correlations
We followed up our main finding�a negative correlation between
SR-related responses of the left LTC and delusional thinking�by test-
ing whether this LTC region also showed aberrant functional coupling
within the default network in association with delusional thinking. To
examine this, a seed-based functional connectivity analysis was con-
ducted, using a spherical seed centered on the coordinates of the ac-
tivation peak for the SR > AL contrast within the left LTC (BA 21; [x, y,
z]: �58, �14, �16). This seed (Figure 2A) demonstrated significant
positive functional connectivity with several default network regions,
including bilateral MPFC, PCC, and LTC (Figure 2B and C and
Table 3A).
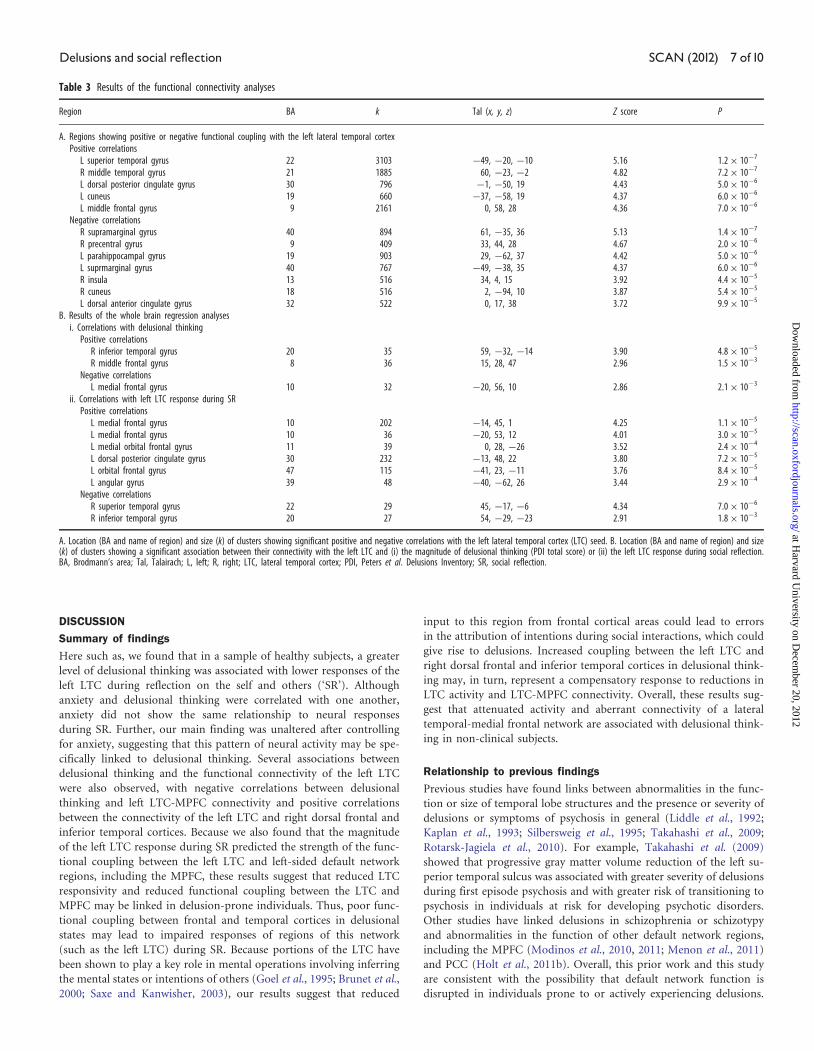
A whole brain analysis using PDI total score as a regressor revealed
that delusional thinking was negatively correlated with the strength of
functional connectivity between the left LTC and left MPFC (z¼ 2.86;
P¼ 0.002) (Figure 3A and B and Table 3Bi) and also showed positive
correlations with the connectivity between the left LTC and the right
dorsal middle frontal gyrus (z¼ 2.96; P¼ 0.001) and right inferior
temporal gyrus (z¼ 3.90; P¼ 5� 10�5) (Table 3Bi).
A second whole brain analysis, using left LTC response during SR as
a regressor, revealed that the magnitude of left LTC responses during
SR was positively correlated with the strength of the connectivity be-
tween the left LTC and default network regions, including the left
MPFC [z¼ 4.01; P¼ 3.0� 10�5 (Figure 3C and D)], PCC, and inferior
parietal cortex (Table 3Bii). Finally, there were negative correlations
between left LTC responses during SR and the connectivity between
the left LTC and right temporal cortices.
Table 2 Results of the cortical surface–based analyses
Region BA Area (mm2) Tal (x, y, z) Z score P
A. Clusters of significant activation for the SR vs AL contrastL medial frontal gyrus 11 2920 �8, 47, �10 4.89 5.0� 10�7
L middle frontal gyrus 9 304 �20, 35, 29 4.10 2.1� 10�5
L middle frontal gyrus 9 337 �25, 36, 27 3.72 1.0� 10�4
R medial and middle frontal gyri 9/10 1991 8, 50, 15 4.41 5.0� 10�6
L posterior cingulate gyrus 23/31 2688 �5, �58, 26 5.42 3.0� 10�8
R posterior cingulate gyrus 23/31 1088 8, �48, 25 4.61 2.0� 10�6
L angular and middle temporal gyri 21/39 5003 �40, �53, 24/�58, �14, �16 5.24 8.0� 10�8
R angular gyrus 39 617 45, �54, 25 4.61 2.0� 10�6
L inferior frontal gyrus 47 1371 �28, 17, �17 3.72 1.0� 10�4
B. Clusters of significant activation for the S vs AL contrastL medial and middle frontal gyri 9/10 2058 �9, 43, 20 4.75 1.0� 10�6
L middle frontal gyrus 9 365 �25, 37, 28 3.94 4.1� 10�5
R medial frontal gyrus 10 525 8, 52, 15 3.94 4.1� 10�5
L posterior cingulate gyrus 23/31 2108 �5, �59, 26 4.12 1.9� 10�5
R posterior cingulate gyrus 23/31 567 7, �57, 20 3.54 2.0� 10�4
L superior temporal gyrus 22 3218 �57, �49, 4 4.26 1.0� 10�5
C. Clusters of significant activation for the O vs AL contrastL medial and middle frontal gyri 11 2808 �9, 47, �12 4.75 1.0� 10�6
R medial frontal gyrus 10 2101 9, 61, �3 4.34 7.0� 10�6
L superior frontal gyrus 6 323 �19, 29, 35 4.11 2.0� 10�5
L posterior cingulate gyrus 23/31 1935 �6, �58, 30 5.27 6.8� 10�8
R posterior cingulate gyrus 23/31 1435 7, �54, 28 5.07 2.0� 10�7
L middle temporal gyrus 21 5417 �60, �17, �14 5.61 1.0� 10�8
R middle temporal gyrus 21 323 53, �19, �13 3.24 6.0� 10�4
R angular gyrus 39 1016 45, �54, 26 4.75 1.0� 10�6
L inferior frontal gyrus 47 2105 �29, 18, �17 4.11 2.0� 10�5
R inferior frontal gyrus 47 607 25, 15, �16 3.54 2.0� 10�4
L lingual gyrus 18 484 �14, �69, �2 3.78 7.8� 10�5
Location and size of clusters of vertices which showed significant SR > AL (A), S > AL (B), and O > AL (C) activation with Talairach (Tal) coordinates, z value, and P value for the local p minimum for each cluster.Clusters of activated vertices with a corrected cluster-wise P value < 0.05 were identified using a Monte Carlo simulation (see Materials and Methods). There were no loci that showed significantly greateractivation for the AL condition, relative to SR, S, or O.BA, Brodmann area; L, left; SR, social reflection; R, right; S, self reflection; O, other reflection. AL, affect labeling
Table 1 Results of the regions of interest analysis
R MPFC L MPFC R PCC L PCC R LTC L LTC
Social reflection (% signal change) �0.02 (0.12) �0.01 (0.11) �0.05 (0.10) �0.03 (0.08) �0.01 (0.08) 0.06 (0.08)Affect labeling (% signal change) �0.09 (0.13) �0.10 (0.11) �0.10 (0.13) �0.10 (0.11) �0.02 (0.07) 0.01 (0.06)
Data are represented as means with standard deviations (s.d). Average percentage signal change during the social reflection (SR) and affect labeling (AL) tasks, relative to a mean blood oxygen level–dependentsignal intensity baseline, was extracted from the three anatomical ROIs the medial prefrontal cortex (MPFC), posterior cingulate cortex (PCC), and lateral temporal cortex (LTC). An analysis of variance showed asignificant region by task interaction (see Results). Significantly greater responses during SR compared to AL were found in all three anatomical ROIs (n¼ 22), P < 0.05).L, left; R, right.
Delusions and social reflection SCAN (2012) 5 of10
at Harvard U
niversity on Decem
ber 20, 2012http://scan.oxfordjournals.org/
Dow
nloaded from
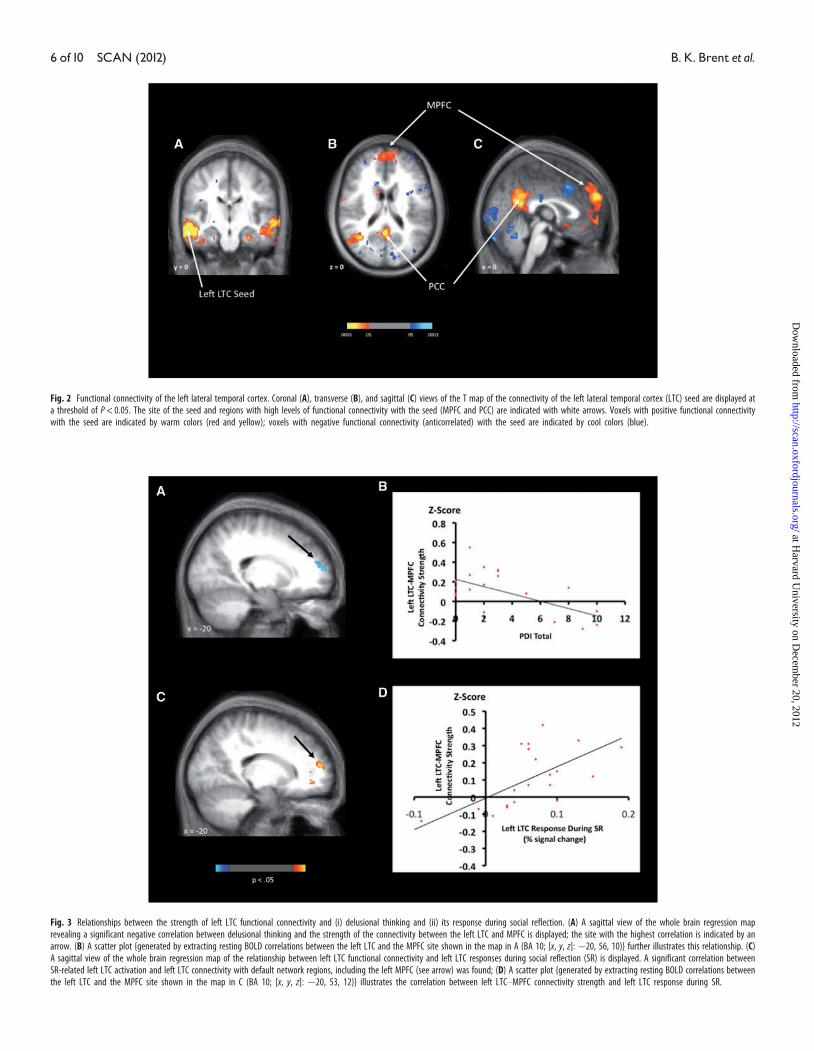
Fig. 3 Relationships between the strength of left LTC functional connectivity and (i) delusional thinking and (ii) its response during social reflection. (A) A sagittal view of the whole brain regression maprevealing a significant negative correlation between delusional thinking and the strength of the connectivity between the left LTC and MPFC is displayed; the site with the highest correlation is indicated by anarrow. (B) A scatter plot {generated by extracting resting BOLD correlations between the left LTC and the MPFC site shown in the map in A (BA 10; [x, y, z]: �20, 56, 10)} further illustrates this relationship. (C)A sagittal view of the whole brain regression map of the relationship between left LTC functional connectivity and left LTC responses during social reflection (SR) is displayed. A significant correlation betweenSR-related left LTC activation and left LTC connectivity with default network regions, including the left MPFC (see arrow) was found; (D) A scatter plot {generated by extracting resting BOLD correlations betweenthe left LTC and the MPFC site shown in the map in C (BA 10; [x, y, z]: �20, 53, 12)} illustrates the correlation between left LTC–MPFC connectivity strength and left LTC response during SR.
Fig. 2 Functional connectivity of the left lateral temporal cortex. Coronal (A), transverse (B), and sagittal (C) views of the T map of the connectivity of the left lateral temporal cortex (LTC) seed are displayed ata threshold of P < 0.05. The site of the seed and regions with high levels of functional connectivity with the seed (MPFC and PCC) are indicated with white arrows. Voxels with positive functional connectivitywith the seed are indicated by warm colors (red and yellow); voxels with negative functional connectivity (anticorrelated) with the seed are indicated by cool colors (blue).
6 of10 SCAN (2012) B.K.Brent et al.
at Harvard U
niversity on Decem
ber 20, 2012http://scan.oxfordjournals.org/
Dow
nloaded from
DISCUSSION
Summary of findings
Here such as, we found that in a sample of healthy subjects, a greater
level of delusional thinking was associated with lower responses of the
left LTC during reflection on the self and others (‘SR’). Although
anxiety and delusional thinking were correlated with one another,
anxiety did not show the same relationship to neural responses
during SR. Further, our main finding was unaltered after controlling
for anxiety, suggesting that this pattern of neural activity may be spe-
cifically linked to delusional thinking. Several associations between
delusional thinking and the functional connectivity of the left LTC
were also observed, with negative correlations between delusional
thinking and left LTC-MPFC connectivity and positive correlations
between the connectivity of the left LTC and right dorsal frontal and
inferior temporal cortices. Because we also found that the magnitude
of the left LTC response during SR predicted the strength of the func-
tional coupling between the left LTC and left-sided default network
regions, including the MPFC, these results suggest that reduced LTC
responsivity and reduced functional coupling between the LTC and
MPFC may be linked in delusion-prone individuals. Thus, poor func-
tional coupling between frontal and temporal cortices in delusional
states may lead to impaired responses of regions of this network
(such as the left LTC) during SR. Because portions of the LTC have
been shown to play a key role in mental operations involving inferring
the mental states or intentions of others (Goel et al., 1995; Brunet et al.,
2000; Saxe and Kanwisher, 2003), our results suggest that reduced
input to this region from frontal cortical areas could lead to errors
in the attribution of intentions during social interactions, which could
give rise to delusions. Increased coupling between the left LTC and
right dorsal frontal and inferior temporal cortices in delusional think-
ing may, in turn, represent a compensatory response to reductions in
LTC activity and LTC-MPFC connectivity. Overall, these results sug-
gest that attenuated activity and aberrant connectivity of a lateral
temporal-medial frontal network are associated with delusional think-
ing in non-clinical subjects.
Relationship to previous findings
Previous studies have found links between abnormalities in the func-
tion or size of temporal lobe structures and the presence or severity of
delusions or symptoms of psychosis in general (Liddle et al., 1992;
Kaplan et al., 1993; Silbersweig et al., 1995; Takahashi et al., 2009;
Rotarsk-Jagiela et al., 2010). For example, Takahashi et al. (2009)
showed that progressive gray matter volume reduction of the left su-
perior temporal sulcus was associated with greater severity of delusions
during first episode psychosis and with greater risk of transitioning to
psychosis in individuals at risk for developing psychotic disorders.
Other studies have linked delusions in schizophrenia or schizotypy
and abnormalities in the function of other default network regions,
including the MPFC (Modinos et al., 2010, 2011; Menon et al., 2011)
and PCC (Holt et al., 2011b). Overall, this prior work and this study
are consistent with the possibility that default network function is
disrupted in individuals prone to or actively experiencing delusions.
Table 3 Results of the functional connectivity analyses
Region BA k Tal (x, y, z) Z score P
A. Regions showing positive or negative functional coupling with the left lateral temporal cortexPositive correlations
L superior temporal gyrus 22 3103 �49, �20, �10 5.16 1.2� 10�7
R middle temporal gyrus 21 1885 60, �23, �2 4.82 7.2� 10�7
L dorsal posterior cingulate gyrus 30 796 �1, �50, 19 4.43 5.0� 10�6
L cuneus 19 660 �37, �58, 19 4.37 6.0� 10�6
L middle frontal gyrus 9 2161 0, 58, 28 4.36 7.0� 10�6
Negative correlationsR supramarginal gyrus 40 894 61, �35, 36 5.13 1.4� 10�7
R precentral gyrus 9 409 33, 44, 28 4.67 2.0� 10�6
L parahippocampal gyrus 19 903 29, �62, 37 4.42 5.0� 10�6
L suprmarginal gyrus 40 767 �49, �38, 35 4.37 6.0� 10�6
R insula 13 516 34, 4, 15 3.92 4.4� 10�5
R cuneus 18 516 2, �94, 10 3.87 5.4� 10�5
L dorsal anterior cingulate gyrus 32 522 0, 17, 38 3.72 9.9� 10�5
B. Results of the whole brain regression analysesi. Correlations with delusional thinking
Positive correlationsR inferior temporal gyrus 20 35 59, �32, �14 3.90 4.8� 10�5
R middle frontal gyrus 8 36 15, 28, 47 2.96 1.5� 10�3
Negative correlationsL medial frontal gyrus 10 32 �20, 56, 10 2.86 2.1� 10�3
ii. Correlations with left LTC response during SRPositive correlations
L medial frontal gyrus 10 202 �14, 45, 1 4.25 1.1� 10�5
L medial frontal gyrus 10 36 �20, 53, 12 4.01 3.0� 10�5
L medial orbital frontal gyrus 11 39 0, 28, �26 3.52 2.4� 10�4
L dorsal posterior cingulate gyrus 30 232 �13, 48, 22 3.80 7.2� 10�5
L orbital frontal gyrus 47 115 �41, 23, �11 3.76 8.4� 10�5
L angular gyrus 39 48 �40, �62, 26 3.44 2.9� 10�4
Negative correlationsR superior temporal gyrus 22 29 45, �17, �6 4.34 7.0� 10�6
R inferior temporal gyrus 20 27 54, �29, �23 2.91 1.8� 10�3
A. Location (BA and name of region) and size (k) of clusters showing significant positive and negative correlations with the left lateral temporal cortex (LTC) seed. B. Location (BA and name of region) and size(k) of clusters showing a significant association between their connectivity with the left LTC and (i) the magnitude of delusional thinking (PDI total score) or (ii) the left LTC response during social reflection.BA, Brodmann’s area; Tal, Talairach; L, left; R, right; LTC, lateral temporal cortex; PDI, Peters et al. Delusions Inventory; SR, social reflection.
Delusions and social reflection SCAN (2012) 7 of10
at Harvard U
niversity on Decem
ber 20, 2012http://scan.oxfordjournals.org/
Dow
nloaded from
Moreover, the evidence linking aberrant default network responses
with delusions in schizophrenia, and our findings of reduced activity
in the same network in association with delusional beliefs in healthy
subjects, support the hypothesis that delusional thinking in the general
population is on a neurobiological continuum with clinical delusions.
However, the interpretation of our findings is limited by the fact
that we measured delusions via self-report. Thus, it is possible that
delusional thinking was underreported among our participants.
Although conducting semistructured interviews may have enhanced
our assessment of delusional thinking, the PDI has reliably distin-
guished patients with psychotic disorders from healthy subjects
(Schurhoff et al., 2003; Scott et al., 2009), suggesting that it is a valid
measure of delusion-like beliefs. Future studies measuring delusional
thinking using several different methods, including interviews, are
needed to confirm these initial findings.
The role of the lateral temporal cortex in social cognition
In healthy subjects, neuroimaging studies have shown that the LTC is
reliably recruited during a wide range of social cognitive processes,
such as theory of mind (Goel et al., 1995; Russel et al., 2000; Calder
et al., 2002; Perner et al., 2006; Brune et al., 2008), empathy (Vollm
et al., 2006), face recognition (Kircher et al., 2001; Platek et al., 2006),
and self and other processing (Saxe et al., 2006; Svoboda et al., 2006).
Although previous studies frequently report MPFC activity during
tasks requiring self-awareness and self-referential processing
(Northoff and Bermpohl, 2004; Heatherton, 2011; Frith and Frith,
2012), activity within the LTC has been most commonly seen during
tasks requiring subjects to judge mental states and attributes of others
(Lou et al., 2004; Hein and Knight, 2008). However, the existence of
networks specific to self or other processing is a subject of ongoing
debate (Happe, 2003; Lou et al., 2004; Denny et al., 2012). According
to simulation models of social perception, self-reflection may serve as
the basis for inferring attributes and intentions of others. Thus, the
networks mediating these seemingly distinct mental processes may be
overlapping (Tamir and Mitchell, 2010). We found that LTC responses
during self and other-reflection were both negatively correlated with
levels of delusional thinking. Follow-up studies employing an
event-related design (with behavioral measurements indicating the
degree of self or other relevance of stimuli) will be needed to test
whether delusional thinking is more closely related to disrupted pro-
cessing of self or other-relevant information or whether both are
affected.
Other models of delusions
Studies of the cognitive basis of delusions have found abnormalities in
associative learning and memory processes in delusional patients
(Corlett et al., 2007; Romaniuk et al., 2010; Holt et al., 2012). These
abnormalities may give rise to delusions via inappropriate ‘prediction
error’ signaling (i.e. signaling that there is an environmental stimulus
that violates one’s expectations) (Corlett et al., 2006, 2007) or an
inability to retrieve a ‘safety signal’ (a fear extinction memory) in a
context-appropriate manner (Holt et al., 2012). These data suggest that
people with deficits in associative memory processes supporting emo-
tional/salience processing may be more vulnerable to delusions.
However, these data do not account for a key phenomenological fea-
ture of many delusional beliefs – that they tend to involve social
themes, rather than random events. One possibility is that associative
memory abnormalities in delusions may be particularly disruptive of
social cognitive processes. Future studies examining associative
memory processes and social perception in the same subjects will
shed further light on this issue.
Clinical implications and future directions
These findings have several clinical implications. First, if abnormalities
of the neural circuitry supporting SR contribute to delusional beliefs,
psychosocial interventions fostering improved self and other under-
standing may provide a valuable adjunct to antipsychotic medications
in the treatment of strongly held delusions and could promote recov-
ery of social functioning (Lysaker et al., 2011). Second, the patterns of
brain activity associated with delusional thinking could serve as quan-
titative biomarkers to facilitate the early detection and treatment of
psychosis. To establish the predictive validity of such a biomarker,
follow-up studies must confirm that the delusion-associated patterns
of LTC activity and connectivity reported here are also found in the
prodromal stages of clinical psychosis. Future longitudinal studies can
ultimately determine the degree of overlap between the pattern of
neural responses during SR seen in people with attenuated delusional
beliefs and those who develop clinically impairing delusions.
Conflict of InterestNone declared.
REFERENCES
Amodio, D.M., Frith, C.D. (2006). Meeting of minds: the medial frontal cortex and social
cognition. Nature Reviews: Neuroscience, 7, 268–77.
Anderson, N.H. (1968). Likableness ratings of 555 personality-trait words. Journal of
Personality and Social Psychology, 9, 272–9.
Andrews-Hanna, J.R., Reidler, J.S., Sepulcre, J., Poulin, R., Buckner, R.L. (2010).
Functional-anatomic fractionation of the brain’s default network. Neuron, 25, 550–62.
Beck, A.T., Steer, R.A. (1987). Beck Depression Inventory: Manual. San Antonio, TX: The
Psychiatric Corporation.
Beck, A.T., Steer, R.A., Garbin, M.G. (1988). Psychometric properties of the beck depres-
sion inventory: twenty-five years of evaluation. Clinical Psychology Review, 8, 77–100.
Bentall, R.P., Corcoran, R., Howard, R., Blackwood, N., Kinderman, P. (2001). Persecutory
delusions: a review and theoretical integration. Clinical Psychology Review, 21, 1143–92.
Blackwood, N.J., Bentall, R.P., Ffytche, D.H., Simmons, A., Murray, R.M., Howard, R.J.
(2004). Persecutory delusions and the determination of self-relevance: an fMRI investi-
gation. Psychological Medicine, 34, 591–6.
Blackwood, N.J., Howard, R.J., Bentall, R.P., Murray, R.M. (2001). Cognitive neuropsychi-
atric models of persecutory delusions. American Journal of Psychiatry, 158, 527–39.
Bluhm, R.L., Miller, J., Lanius, R.A., et al. (2007). Spontaneous low-frequency fluctuations
in the BOLD signal in schizophrenia patients: abnormalities in the default mode net-
work. Schizophrenia Bulletin, 33, 1004–12.
Breier, A., Berg, P.H. (1999). The psychosis of schizophrenia: prevalence, response to
atypical antipsychotics, and prediction of outcome. Biological Psychiatry, 46, 361–4.
Brune, M., Lissek, S., Fuchs, N., et al. (2008). An fmri study of theory of mind in schizo-
phrenia patients with “passivity” symptoms. Neuropsychologia, 46, 1992–2001.
Brunet, E., Sarfati, Y., Hardy-Bayle, M.C., Decety, J. (2000). A PET investigation of the
attribution of intentions with a nonverbal task. NeuroImage, 11, 157–66.
Brunet, E., Sarfati, Y., Hardy-Bayle, M.C., Decety, J. (2003). Abnormalities of brain func-
tion during a nonverbal theory of mind task in schizophrenia. Neuropsychologia, 41,
1574–82.
Buckner, R.L., Andrews-Hanna, J.R., Schacter, D.L. (2008). The brain’s default mode net-
work: anatomy, function, and relevance to disease. Annals of the New York Academy of
Science, 1124, 1–38.
Buckner, R.L., Sepulcre, J., Tulukdar, T., et al. (2009). Cortical hubs revealed by intrinsic
functional connectivity: mapping, assessment of stability, and relation to Alzheimer’s
disease. Journal of Neuroscience, 29, 1860–73.
Calder, A.J., Lawrence, A.D., Keane, J., et al. (2002). Reading the mind from eye gaze.
Neuropsychologia, 40, 1129–38.
Claridge, G. (1987). “The schizophrenia as nervous types” revisited. British Journal of
Psychiatry, 151, 735–43.
Corlett, P.R., Honey, G.D., Aitken, M.R.F., et al. (2006). Frontal responses during learning
predict vulnerability to the psychotogenic effects of ketamine. Archives of General
Psychiatry, 63, 611–21.
Corlett, P.R., Murray, G.K., Honey, G.D., et al. (2007). Disrupted prediction-error signal in
psychosis: evidence for an associative account of delusions. Brain, 130, 2387–400.
Denny, B.T., Kober, H., Wager, T.D., Ochsner, K.N. (2012). A meta-analysis of functional
neuroimaging studies of self- and other judgments reveals a spatial gradient for menta-
lizing in medial prefrontal cortex. Journal of Cognitive Neuroscience, 24(8), 1742–52.
Desikan, R.S., Segonne, F., Fischl, B., et al. (2006). An automated parcellation labeling
system for subdividing the human cerebral cortex on MRI scans into gyral based regions
of interest. Neuroimage, 31, 968–80.
8 of10 SCAN (2012) B.K.Brent et al.
at Harvard U
niversity on Decem
ber 20, 2012http://scan.oxfordjournals.org/
Dow
nloaded from
Dominguez, M., Wichers, M., Lieb, R., Wittchen, H., van Os, J. (2011). Evidence that onset
of clinical psychosis is an outcome of progressively more persistent subclinical psychotic
experiences: an 8-year cohort study. Schizophrenia Bulletin, 37, 84–93.
Fischl, B., Sereno, M.I., Tootell, R.B., Dale, A.M. (1999). High-resolution intersubject
averaging and a coordinate system for the cortical surface. Human Brain Mapping, 8,
272–84.
Freeman, D. (2006). Delusions in the non-clinical population. Current Psychiatry Reports, 8,
191–204.
Frist, M.B., Spitzer, R.L., Gibbon, M., Williams, J.B.W. (2002). Structured Clinical Interview
for DSM-IV TR Axis I Disorders, Research Version, Patient Edition. New York: Biometrics
Research, New York State Psychiatric Institute.
Frith, C.D., Corcoran, R. (1996). Exploring “theory of mind” in people with schizophrenia.
Psychological Medicine, 26, 521–30.
Frith, C.D., Frith, U. (2012). Mechanisms of social cognition. Annual Review of Psychology,
63, 8.1–8.27.
Frith, U., Frith, C.D. (2003). Development and neurophysiology of mentalizing.
Philosophical Transactions of the Royal Society of London, 358, 459–73.
Galbraith, N., Manktelow, K., Morris, N. (2008). Subclinical delusional ideation and a
self-reference bias in everyday reasoning. British Journal of Psychology, 99, 29–44.
Gallagher, H.L., Happe, F., Brunswick, N., Fletcher, P.C., Frith, U., Frith, C.D. (2000).
Reading the mind in cartoons and stories: an fMRI study of “theory of mind” in verbal
and nonverbal tasks. Neuropsychologia, 38, 11–21.
Garrity, A.G., Pearlson, G.D., McKiernan, K., Lloyd, D., Kiehl, K.A., Calhoun, V.D. (2007).
Aberrant “default mode” functional connectivity in schizophrenia. American Journal of
Psychiatry, 164, 450–7.
Goel, V., Grafman, J., Sadato, N., Hallett, M. (1995). Modeling other minds. Neuroreport, 6,
1741–6.
Greicius, M.D., Kiviniemi, V., Tervonen, O., et al. (2008). Persistent default-mode network
connectivity during light sedation. Human Brain Mapping, 29, 839–47.
Greicius, M.D., Krasnow, B., Reiss, A.L., Menon, V. (2003). Functional connectivity in the
resting brain: a network analysis of the default mode hypothesis. Proceedings of the
National Academy of Science USA, 100, 253–8.
Greicius, M.D., Menon, V. (2004). Default-mode activity during a passive sensory task:
uncoupled from deactivation but impacting activation. Journal of Cognitive Neuroscience,
16, 1484–92.
Gusnard, D.A., Akbudak, E., Shulman, G.L., Raichle, M.E. (2001). Medial prefrontal cortex
and self-referential mental activity: relation to a default mode of brain function.
Proceedings of the National Academy of Science USA, 98, 4259–64.
Gusnard, D.A., Raichle, M.E. (2001). Searching for a baseline: functional imaging and the
resting human brain. Nature Reviews and Neuroscience, 2, 685–94.
Han, S.D., Nestor, P.G., Hale-Spencer, M., et al. (2007). Functional neuroimaging of word
priming in males with chronic schizophrenia. Neuroimage, 35, 273–282.
Happe, F. (2003). Theory of mind and the self. Annals of the New York Academy of Sciences,
1001, 134–44.
Heatherton, T.F. (2011). Neuroscience of self and self-regulation. Annual Review of
Psychology, 62, 363–90.
Hein, G., Knight, R.T. (2008). Superior temporal sulcus�it’s my area: or is it? Journal of
Cognitive Neuroscience, 20, 2125–36.
Holt, D.J., Cassidy, B.S., Andrews-Hanna, J.R., et al. (2011a). An anterior-to-posterior shift
in midline cortical activity in schizophrenia during self-reflection. Biological Psychiatry,
69, 415–23.
Holt, D.J., Coombs, G., Zeidan, M.A., Goff, D.C., Milad, M.R. (2012). Failure of
neural responses to safety cues in schizophrenia. Archives of General Psychiatry, 69,
893–903.
Holt, D.J., Lakshmanan, B., Freudenreich, O., Goff, D.C., Rauch, S.L., Kuperberg, G.R.
(2011b). Dysfunction of a cortical midline network during emotional appraisals in
schizophrenia. Schizophrenia Bulletin, 37, 164–176.
Honey, G.D., Corlett, P.R., Absalom, A.R., et al. (2008). Individual differences in psychotic
effects of ketamine are predicted by brain function measured under placebo. Journal of
Neuroscience, 28, 6295–303.
Jenkins, A.C., Mitchell, J.P. (2011). Medial prefrontal cortex subserves diverse forms of
self-reflection. Social Neuroscience, 6, 211–8.
Kaplan, R.D., Szechtam, H., Franco, S., et al. (1993). Three clinical syndromes of schizo-
phrenia in untreated subjects: relation to brain glucose activity measured by PET.
Schizophrenia Research, 11, 47–54.
Kelley, W.M., Macrae, C.N., Wyland, C.L., Caglar, S., Inati, S., Heatherton, T.F. (2002).
Finding the self? An event-related fMRI study. Journal of Cognitive Neuroscience, 14,
785–94.
Kircher, T.T.J., Senior, C., Phillips, M.L., et al. (2001). Towards a functional neuroanatomy
of self processing: effects of faces and words. Cognitive Brain Research, 10, 133–44.
Knight, R.G., Waal-Manning, H.J., Spears, G.R. (1983). Some norms and reliability data for
the State-Trait Anxiety Inventory and the Zung Self-Rating Depression Scale. British
Journal of Clinical Psychology, 22, 245–9.
Langdon, R., Michie, P.T., Ward, P.B., McConaghy, N., Catts, S.V., Coltheart, M. (1997).
Defective self and/or other mentalizing in schizophrenia: a cognitive neuropsychological
approach. Cognitive Neuropsychiatry, 2, 167–93.
Larøi, F., van der Linden, M. (2005). Metacognitions in proneness towards hallucinations
and delusions. Behavior Research and Therapy, 43, 1425–41.
Liddle, P.F., Friston, K.J., Frith, C.D., Hirsch, S.R., Jones, T., Fracknowiak, S.J. (1992).
Patterns of cerebral blood flow in schizophrenia. British Journal of Psychiatry, 160,
179–186.
Lou, H.C., Luber, B., Crupain, M., et al. (2004). Parietal cortex and representation of the
mental self. Proceedings of the National Academic of Science USA, 101, 6827–32.
Lysaker, P.H., Buck, K.D., Carcione, A., et al. (2011). Addressing metacognitive capacity for
self reflection in the psychotherapy for schizophrenia: a conceptual model of the key
tasks and processes. Psychology and Psychotherapy, 84, 58–69.
McKay, R., Langdon, R., Coltheart, M. (2007). Models of misbelief: integrating motiv-
ational and deficit theories of delusions. Consciousness and Cognition, 16, 932–41.
Menon, M., Schmitz, T.W., Anderson, A.K., et al. (2011). Exploring the neural correlates of
delusions of reference. Biological Psychiatry, 70, 1127–33.
Modinos, G., Renken, R., Ormel, J., Aleman, A. (2011). Self-reflection and the
psychosis-prone brain: an fmri study. Neuropsychology, 25, 295–305.
Modinos, G., Renken, R., Shamay-Tsoory, S.G., Ormel, J., Aleman, A. (2010).
Neurobiological correlates of theory of mind in psychosis proneness.
Neuropsychologia, 48, 3715–24.
Moran, J.M., Macrae, C.N., Heatherton, T.F., Wyland, C.L., Kelley, W.M. (2006).
Neuroanatomical evidence for distinct cognitive and affective components of self.
Journal of Cognitive Neuroscience, 18, 1586–94.
Murphy, E.R., Brent, B.K., Benton, M., et al. (2010). Differential processing of metacog-
nitive evaluation and the neural circuitry of the self and others in schizophrenia: a pilot
study. Schizophrenia Research, 116, 252–8.
Northoff, G., Bermpohl, F. (2004). Cortical midline structures and the self. Trends in
Cognitive Neuroscience, 8, 102–7.
Perner, J., Aichorn, M., Kronbichler, M., Staffen, W., Ladurner, G. (2006). Thinking of
mental and other representation: the roles of the left and right temporo-parietal junc-
tion. Social Neuroscience, 1, 245–58.
Peters, E., Joseph, S., Day, S., Garety, P. (1999). Measurement of delusional ideation in the
normal population: introducing the PDI (Peters et al. Delusions Inventory).
Schizophrenia Bulletin, 25, 553–76.
Platek, S.M., Loughead, J.W., Gur, R.C., et al. (2006). Neural substrates for functionally
discriminating self-face from personally familiar faces. Human Brain Mapping, 27, 91–8.
Pomarol-Clotet, E., Salvador, R., Sarro, S., et al. (2008). Failure to deactivate in the pre-
frontal cortex in schizophrenia: dysfunction of the default mode network? Psychological
Medicine, 38, 1185–93.
Raichle, M.E., MacLeod, A.M., Snyder, A.Z., Powers, W.J., Gusnard, D.A., Shulman, G.L.
(2001). A default mode of brain function. Proceedings of the National Academy of Science
USA, 98, 676–82.
Romaniuk, L., Honey, G.D., King, J.R.L., et al. (2010). Midbrain activation during
Pavlovian conditioning and delusional symptoms in schizophrenia. Archives of
General Psychiatry, 67, 1246–54.
Rotarsk-Jagiela, A., van de Ven, V., Oertel-Knochel, V., Uhlhaas, P.J., Vogeley, K.,
Linden, D.E.J. (2010). Resting-state functional network correlates of psychotic symp-
toms in schizophrenia. Schizophrenia Research, 117, 21–30.
Russell, T.A., Rubia, K., Bullmore, E.T., et al. (2000). Exploring the social brain in schizo-
phrenia: left prefrontal underactivation during mental state attribution. American
Journal of Psychiatry, 157, 2040–2.
Saxe, R., Kanwisher, N. (2003). People thinking about people. The role of the
temporo-parietal junction in “theory of mind”. NeuroImage, 19, 1835–42.
Saxe, R., Moran, J.M., Scholz, J., Gabrieli, J. (2006). Overlapping and non-overlapping
brain regions for theory of mind and self-reflection in individual subjects. Social
Cognition and Affective Neuroscience, 1, 229–34.
Schmitz, T.W., Kawahara-Baccus, T.N., Johnson, S.C. (2004). Metacognitive evaluation,
self-relevance, and the right prefrontal cortex. NeuroImage, 22, 941–7.
Schurhoff, F., Szoke, A., Meary, A., et al. (2003). Familial aggregation of delusional prone-
ness in schizophrenia and bipolar pedigrees. American Journal of Psychiatry, 160, 1313–9.
Scott, J.S., Martin, G., Welham, J., et al. (2009). Psychopathology during childhood and
adolescence predicts delusion-like experiences in adults: a 21-year birth cohort study.
American Journal of Psychiatry, 166, 567–74.
Silbersweig, D.A., Stern, E., Frith, C., et al. (1995). A functional neuroanatomy of hallu-
cinations in schizophrenia. Nature, 378, 176–9.
Spielberger, C.D., Gorsuch, R.C., Lushene, R.E. (1970). Manual for the Stat-Trait Anxiety
Inventory. Palo Alto, CA: Consulting Psychologists Press.
Surguladze, S., Russell, T., Kucharska-Pietura, K., et al. (2006). A reversal of the normal
pattern of parahippocampal response to neutral and fearful faces is associated with
reality distortion in schizophrenia. Biological Psychiatry, 60, 423–31.
Svoboda, E., McKinnon, M.C., Levine, B. (2006). The functional neuroanatomy of auto-
biographical memory: a meta-analysis. Neuropsychologia, 44, 2189–208.
Takahashi, T., Wood, S.H., Yung, A.R., et al. (2009). Progressive gray matter reduction of
the superior temporal gyrus during transition to psychosis. Archives of General
Psychiatry, 66, 266–376.
Talairach, J., Tournoux, P. (1988). Co-Planar Sterotaxic Atlas of the Human Brain. New
York: Thieme Medical Publishers.
Delusions and social reflection SCAN (2012) 9 of10
at Harvard U
niversity on Decem
ber 20, 2012http://scan.oxfordjournals.org/
Dow
nloaded from

Tamir, D.I., Mitchell, J.P. (2010). Neural correlates of anchoring-and-adjustment during
mentalizing. Proceedings of the National Academy of Science USA, 107, 10827–32.
Taylor, S.F., Welsh, R.C., Chen, A.C., Velander, A.J., Liberzon, I. (2007). Medial frontal
hyperactivity in reality distortion. Biological Psychiatry, 61, 1171–8.
Uttl, B. (2002). North American Adult Reading Test: age norms, reliability, and validity.
Journal of Clinical and Experimental Neuropsychology, 24, 1123–37.
van der Meer, L., Costafreda, S., Aleman, A., David, A.S. (2010). Self-reflection and the
brain: a theoretical review and meta-analysis of neuroimaging studies with implications
for schizophrenia. Neuroscience and Biobehavioral Reviews, 34, 935–46.
van Os, J., Hanssen, M., Bijl, R.V., Ravelii, A. (2000). Strauss (1969) revisited: a psychosis
continuum in the general population. Schizophrenia Research, 45, 11–20.
van Os, J., Linscott, R.J., Myin-Germeys, I., Delespaul, P., Krabbendam, L. (2009). A sys-
tematic review and meta-analysis of the psychosis continuum: evidence for a psychosis
proneness-persistence-impairment model of psychotic disorder. Psychological Medicine,
39, 179–95.
Vollm, B.A., Taylor, A.N.W., Richardson, P., et al. (2006). Neuronal correlates of theory of
mind and empathy: a functional magnetic resonance imaging study in a nonverbal task.
Neuroimage, 29, 90–8.
Wang, L., Metzak, P.D., Woodward, T.S. (2011). Aberrant connectivity during self-other
source monitoring in schizophrenia. Schizophrenia Research, 125, 136–42.
Warman, D.M., Martin, J.M. (2006). Cognitive insight and delusion proneness: an
investigation using the Beck Cognitive Insight Scale. Schizophrenia Research, 84,
297–304.
Whitfield-Gabrieli, S., Ford, J.M. (2012). Default mode network activity and connectivity
in psychopathology. Annual Review of Clinical Psychology, 8, 49–76.
Whitfield-Gabrieli, S., Thermenos, H.W., Milanovic, S., et al. (2009). Hyperactivity and
hyperconnectivity of the default network in schizophrenia and in first-degree relatives of
persons with schizophrenia. Proceedings of the National Academy of Science USA, 106
1279–84.
Zar, J.H. (1996). Biostatistical Analysis. Upper Saddle River, NJ: Prentice Hall.
10 of10 SCAN (2012) B.K.Brent et al.
at Harvard U
niversity on Decem
ber 20, 2012http://scan.oxfordjournals.org/
Dow
nloaded from


