Embed Size (px)
Citation preview

Subjective Experience of Image Quality: Attributes, Definitions and Decision Making of Subjective Image Quality
Tuomas Leisti1*, Jenni Radun1, Toni Virtanen1, Raisa Halonen2, Göte Nyman1
1 Department of Psychology, University of Helsinki, P.O. Box 9, 00014 Helsinki, Finland
2 Laboratory of Media Technology, Helsinki University of Technology, P.O Box 500 02015 TKK, Finland
ABSTRACT
Subjective quality rating does not reflect the properties of the image directly, but it is the outcome of a quality decision making process, which includes quantification of subjective quality experience. Such a rich subjective content is often ignored. We conducted two experiments (with 28 and 20 observers), in order to study the effect of paper grade on image quality experience of the ink-jet prints. Image quality experience was studied using a grouping task and a quality rating task. Both tasks included an interview, but in the latter task we examined the relations of different subjective attributes in this experience. We found out that the observers use an attribute hierarchy, where the high-level attributes are more experiential, general and abstract, while low-level attributes are more detailed and concrete. This may reflect the hierarchy of the human visual system. We also noticed that while the observers show variable subjective criteria for IQ, the reliability of average subjective estimates is high: when two different observer groups estimated the same images in the two experiments, correlations between the mean ratings were between .986 and .994, depending on the image content. Keywords: Ink-jet printing, printing paper, subjective image quality, experience, decision making
1. INTRODUCTION Image quality (IQ) measures can be objective and subjective. Objective (instrumental) measurements offer fast and reliable results but, unfortunately, at present, the only valid no-reference estimate for overall IQ is the average quality rating, obtained from the users of the image. Although objective image quality metrics rely on the knowledge of contrast sensitivity and masking phenomena of the human visual system1, contemporary knowledge of human high-level visual perception does not give possibility of predicting overall quality from low level perceptual information. This situation will not change fast, since the visual quality perception of the humans is not still well understood. Subjective measurements will not become obsolete in the near future although interesting models are being developed for this purpose2. It is tempting to assume that both objective measures and subjective quality ratings reflect the properties of the image directly, but this is true only for the former. For example, technologically naïve end user of an image does not spontaneously look for sharpness information in the image, like some computational measure would do, but rather reacts to the image sharpness and makes a subjective interpretation of its meaning. In other words, subjective estimation of quality is done on the basis of the experienced of quality of the image, not on the basis of the image features as such (see Figure 1). So, understanding the overall quality requires understanding of the quality experiences of the image users. Similarly, evaluation of the subjective image quality attributes is a subjective description of this experience. In addition to workload and cost, one factor that has made the subjective measurement of quality somewhat unappealing is the fact that basically it is a measurement of psychological nature. But because this experience underlies all evaluations of image quality, it should be well understood. *[email protected]
Image Quality and System Performance VI, edited by Susan P. Farnand, Frans Gaykema,Proc. of SPIE-IS&T Electronic Imaging, SPIE Vol. 7242, 72420D · © 2009 SPIE-IS&T
CCC code: 0277-786X/09/$18 · doi: 10.1117/12.807142
SPIE-IS&T/ Vol. 7242 72420D-1
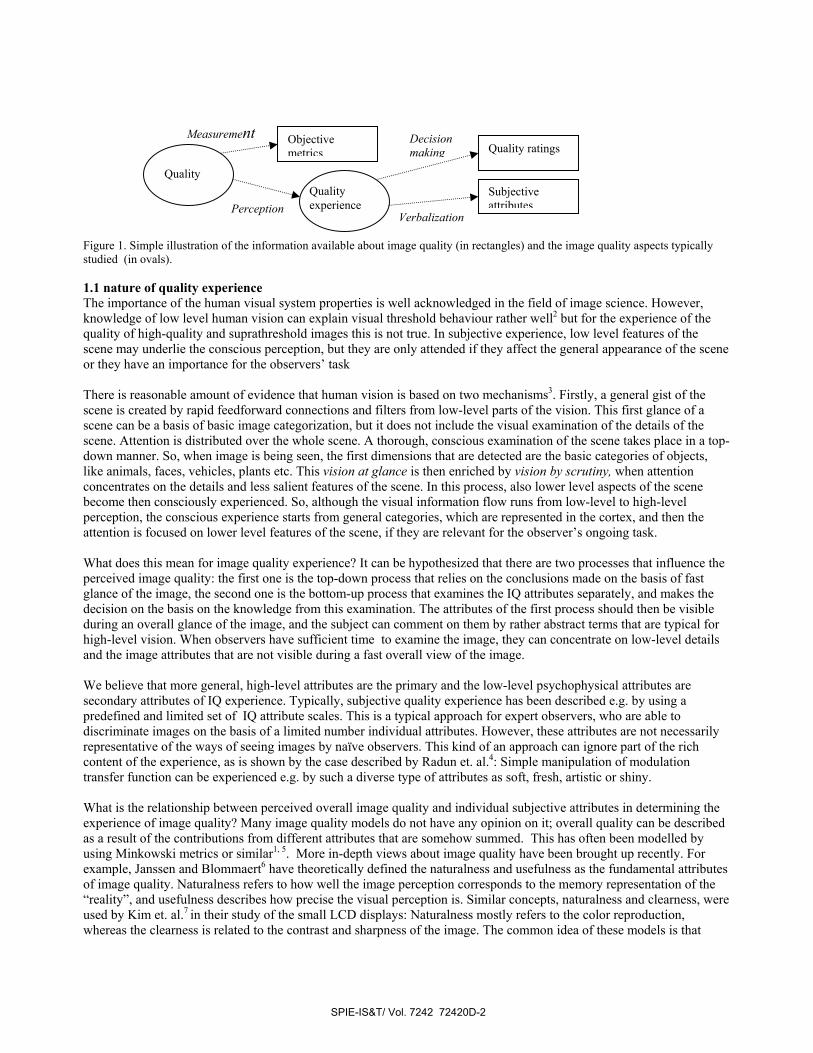
Figure 1. Simple illustration of the information available about image quality (in rectangles) and the image quality aspects typically studied (in ovals). 1.1 nature of quality experience The importance of the human visual system properties is well acknowledged in the field of image science. However, knowledge of low level human vision can explain visual threshold behaviour rather well2 but for the experience of the quality of high-quality and suprathreshold images this is not true. In subjective experience, low level features of the scene may underlie the conscious perception, but they are only attended if they affect the general appearance of the scene or they have an importance for the observers’ task There is reasonable amount of evidence that human vision is based on two mechanisms3. Firstly, a general gist of the scene is created by rapid feedforward connections and filters from low-level parts of the vision. This first glance of a scene can be a basis of basic image categorization, but it does not include the visual examination of the details of the scene. Attention is distributed over the whole scene. A thorough, conscious examination of the scene takes place in a top-down manner. So, when image is being seen, the first dimensions that are detected are the basic categories of objects, like animals, faces, vehicles, plants etc. This vision at glance is then enriched by vision by scrutiny, when attention concentrates on the details and less salient features of the scene. In this process, also lower level aspects of the scene become then consciously experienced. So, although the visual information flow runs from low-level to high-level perception, the conscious experience starts from general categories, which are represented in the cortex, and then the attention is focused on lower level features of the scene, if they are relevant for the observer’s ongoing task. What does this mean for image quality experience? It can be hypothesized that there are two processes that influence the perceived image quality: the first one is the top-down process that relies on the conclusions made on the basis of fast glance of the image, the second one is the bottom-up process that examines the IQ attributes separately, and makes the decision on the basis on the knowledge from this examination. The attributes of the first process should then be visible during an overall glance of the image, and the subject can comment on them by rather abstract terms that are typical for high-level vision. When observers have sufficient time to examine the image, they can concentrate on low-level details and the image attributes that are not visible during a fast overall view of the image. We believe that more general, high-level attributes are the primary and the low-level psychophysical attributes are secondary attributes of IQ experience. Typically, subjective quality experience has been described e.g. by using a predefined and limited set of IQ attribute scales. This is a typical approach for expert observers, who are able to discriminate images on the basis of a limited number individual attributes. However, these attributes are not necessarily representative of the ways of seeing images by naïve observers. This kind of an approach can ignore part of the rich content of the experience, as is shown by the case described by Radun et. al.4: Simple manipulation of modulation transfer function can be experienced e.g. by such a diverse type of attributes as soft, fresh, artistic or shiny. What is the relationship between perceived overall image quality and individual subjective attributes in determining the experience of image quality? Many image quality models do not have any opinion on it; overall quality can be described as a result of the contributions from different attributes that are somehow summed. This has often been modelled by using Minkowski metrics or similar1, 5. More in-depth views about image quality have been brought up recently. For example, Janssen and Blommaert6 have theoretically defined the naturalness and usefulness as the fundamental attributes of image quality. Naturalness refers to how well the image perception corresponds to the memory representation of the “reality”, and usefulness describes how precise the visual perception is. Similar concepts, naturalness and clearness, were used by Kim et. al.7 in their study of the small LCD displays: Naturalness mostly refers to the color reproduction, whereas the clearness is related to the contrast and sharpness of the image. The common idea of these models is that
Quality
Objective metrics Quality ratings
Subjective attributes
Quality experience Perception
Decision making
Measurement
Verbalization
SPIE-IS&T/ Vol. 7242 72420D-2

there are some more fundamental attributes of image quality, which, on the other hand, are dependent of more concrete attributes. We have studied image quality in different contexts, like digital printing, camera benchmarking, image processing pipes and video quality by using a qualitative methodology. To our understanding, the best known way to probe the subjective quality experience and to find the dimensions that actually influence the subjective decision making behind the IQ evaluation is to give the observer a real possibility to express his/her experiences freely and spontaneously, with a systematic methodology8. This is done in top-down manner: First the observer is asked how much he or she prefers the image, and then the quality experience is more thoroughly examined by asking specific grounds for the rating. We have concluded that the attribute space used in such evaluations is more riche and content-dependent than is usually thought. In these studies, we have encountered two kinds of attributes: a) concrete attributes, which are later called low-level attributes, for which there are physical counterpart, and b) abstract attributes, that are related to observers’ experience and/or interpretation of the image content The only difference between high level and low-level attributes is not only abstractness. It seems that the importance of high level attributes lies in their ability to inform the observer of the meaning of low-level attributes for the general quality. For example, let us take two low level attributes, sharpness and contrast, and two high level attributes, clarity and naturalness. If an observer is asked why the sharper image is better, the answer could be that it is more clear or informative. Answer could be the same for image with more contrast, but too much contrast may also cause unnaturalness, which is detrimental for image quality. 1.2 Quality decision making Subjective quality ratings are the outcomes of a quality decision making process, which includes quantification of observers' own quality experience. Decision making is based on the observer’s own individual taste and understanding of quality. This is not just a complex problem but it is simply the logic behind all normal visual behavior. Quality ratings are often treated like a result of low-level perceptual processing, but evaluating the quality of an image may also require quite demanding mental processing. The complexity of this decision making is caused by the multi-dimensionality of IQ, which requires the observers to pool different attributes and perform inter-attribute evaluations between e.g. noisy and unsharp images. Even if only one technical parameter is changing, it may influence several subjective attributes5. How this pooling is done, is not known. Literature on decision making and preferential choice is completely separate tradition of image quality research. In this tradition, several strategies are presented on how people combine information about the alternatives on a choice situation9. Rules are usually simple and less important aspects are ignored, so only few attributes are used. Preferences are often constructed in the choice situation. When an observer makes a decision about the quality, he or she selects the relevant attribute dimensions that eventually comprise the quality decision making space. This happens automatically and it is not experienced as a decision as such, but simply as perception of certain quality. While objective metrics form dimensionality that represents the physical features of the image, the most ambitious aim is to integrate these objective and subjective spaces in order to arrive at a valid computational IQ space. However, the scope of this paper is not to present this kind of solution, but to present a preliminary description of the naïve observers’ quality experience. 1.3 Purpose of the experiments The purpose of this study was to create a description of subjective image quality experience in one case – influence of paper on the ink-jet printed images. Two experiments were made and the following aspects were emphasized:
1. Gathering all the subjective attributes that describe differences in samples with different quality in the present material context (experiment 1)
2. Creating a description of image quality experience and the relations of the different attributes in this experience (experiment 2)
SPIE-IS&T/ Vol. 7242 72420D-3

2. METHODS 2.1 materials We used 4 image contents that were printed on 15 different paper grades. Papers differed in several characteristics, such as whiteness, roughness and gloss. The sample papers, test contents and the printing process are described elsewhere in detail10. The contents are later called studio, man, landscape and cactus. 2.2 Observers Observers were recruited from e-mail lists of university of Helsinki. They were mostly students of education and psychology. There were 28 participants in the experiment 1 and 20 participants in the experiment 2. They reported having no deficiencies in their vision. 2.3 Experiment 1: procedure Experiment 1 included two tasks, grouping task with an interview and a quality rating task. In the grouping task, observers were asked to create groups of the samples based on similarities and dissimilarities. All the samples of the same content were placed on the table in random order. Observers were first asked to create two groups of images in a way that the images within each group should be as similar as possible and the images in the different groups as dissimilar as possible. After the grouping, the observers were asked, which attributes differentiate the groups from each other. After grouping the images into two groups, the observer was asked to create three groups from the same images with the same instruction. Then the observers were asked to create four, five and six groups from the same images. The minimum number of groups was four, and if the observer could not see any differences after four or five groups, the test proceeded to the next content. The maximum number of groups was six. This task was done to all contents, and the contents were presented randomly. In the quality evaluation task, a mean opinion score for each sample was obtained. In this test, we defined the lowest quality sample to be value 1 and the highest quality sample to be value 5. The quality evaluation was done as follows: All the samples of one content were placed on the table in a random order. In addition, five patches of paper were placed on table, numbered 1 to 5. The observer was asked to select the sample representing the worst quality of the set and place it on number 1. Then the observer was asked to select the best sample and place it on number 5. After that, the observer was asked to place the remaining samples on numbers 1 to 5 so that the quality grows regularly from 1 to 5. 2.4 Experiment 2: procedure Experiment 2 consisted of a quality evaluation task and an interview. The quality evaluation was the same as in experiment 1, except the observer was interviewed about the reasons for his/her quality rating after evaluating each content. The experimenter spread out the samples of each quality group 1 to 5 and asked, what in the samples makes them better from the samples in the lower quality group and why. In order to gain a better understanding of how the quality differences between samples were experienced, the following approach was used in the semi-structured interview: For each low-level attribute, the experimenter tried to get the corresponding high level attribute that would tell why the lower level attribute makes the images better. For example, if the subject used the attribute ”sharp” to explain his evaluation of quality, he or she was then asked, what in the sharpness makes this image better, or why it is good that the image is sharp. In similar manner, if an observer used a high level attribute to explain the rating of quality, he or she is asked what concrete attribute is the cause of the high level attribute. For example, if the subject use the attribute natural when evaluating the quality, she is then asked, what in the image makes it more natural 2.5 Analyses The interview material was analyzed qualitatively. This was done by collecting the attributes that the observers used for describing the samples. In the analysis of experiment 2 data, the attributes were also divided into low level and high level attributes. The qualitative data about the subjective attributes of different levels was then further analyzed by crosstabulating them and performing a correspondence analysis on them.
SPIE-IS&T/ Vol. 7242 72420D-4

3. RESULTS 3.1 Quality evaluations The results of the quality evaluations of the experiment 1 and 2 can be seen on Figure 2. The correlation between the mean ratings of the experiments in varied between .983 and .994 for different contents. The ratings seem very stable despite the different experimental settings.
Experiment 15,004,003,002,001,00
Expe
rimen
t 2
5,00
4,00
3,00
2,00
1,00
ManLandscapeCactusStudio
Content
Fig. 2: Scatter plot of the mean ratings for the different samples in experiments 1 and 2. Correlation between the experiments was .986. Correlation within contents was .994 for man and cactus contents and .992 for landscape content. For the studio content the correlation was little lower, .983. Different observers did the quality rating in different experiments, so the reliability of the subjective ratings can be considered very high. 3.2 Qualitative differences between samples Subjective attributes used in the grouping of the samples (experiment 1) are presented on the Table 1. As it was noticed earlier, attributes used for describing differences between samples represented different abstractness. The more abstract attributes are typed in italics in the table. Usage of some subjective attributes, like clarity and naturalness, was very content dependent 3.3 High level attributes of image quality Table 2 shows the high level attributes that were found on the qualitative analysis of the experiment 2. In this context (ink-jet print quality) we found out five major higher level attributes. The most abstract and demanding attribute was realism, which refers to the observers’ feeling of being in the scene depicted by the image or the feeling of missing the mediating device between the scene being seen. This phenomenon of unmediated perception is much discussed in the virtual reality literature. Naturalness is a familiar attribute for image scientists, and it is related to the perception of the objects or the scene ‘as they are in real life', or their perception without any distortions. Clarity refers to how easy the objects of the images can be discriminated: Clear image is easy to watch. Finally, there are some attributes that are just associated with good quality, like gloss. It is also interesting that good image quality made the images look more three-dimensional.
SPIE-IS&T/ Vol. 7242 72420D-5

Table 1: The subjective attributes used for describing the differences between the samples, their counts and percentage in different content. Statistically significant differences between percentages are marked with asterisks (* p < .05, ** p < .01, *** p < .001)
Subjective attribute Total counts
Studio (%)
Cactus (%)
Landscape(%)
Man (%) Total (%)
Brightness (bright vs. faded) 308 23.7 25.6 23.4 27.3 100.0 Sharpness (sharp vs. fuzzy) 201 28.4 29.9 16.4 25.4 100.0 Lightness (light vs. dark) 142 20.4 24.6 35.9 19.0 100.0 Brightness of colors (bright colors vs faded colors) 111 25.2 27.0 27.9 19.8 100.0 Gloss 66 31.8 21.2 19.7 27.3 100.0 Clarity*** 61 23.0 41.0 9.8 26.2 100.0 Preference (better vs. worse) 57 24.6 28.1 19.3 28.1 100.0 Graininess*** 54 31.5 13.0 11.1 44.4 100.0 Photograph likeness (like photograph vs. like print) 41 17.1 26.8 26.8 29.3 100.0 Yellowishness*** 33 42.4 18.2 15.2 24.2 100.0 Naturalness*** 27 22.2 11.1 40.7 25.9 100.0 White spots*** 27 29.6 3.7 7.4 59.3 100.0 Greenness*** 24 29.2 16.7 50.0 4.2 100.0 Brightness of yellow*** 21 9.5 90.5 0.0 0.0 100.0 Blueness 20 45.0 5.0 20.0 30.0 100.0 Darkness of colors*** 17 11.8 17.6 41.2 29,4 100,0 Contrast* 16 18,8 37,5 18,8 25,0 100,0 Lighting (well lighted vs. lightless)*** 14 21,4 0,0 21,4 57,1 100,0 Vividness** 11 36,4 27,3 27,3 9,1 100,0 Quality of the colors*** 11 36,4 27,3 0,0 36,4 100,0
Table 3: High level attributes used to reason meaning of the low level attributes for the quality rating
Attribute Frequency Description Related concepts Realism, genuineness etc
73 The feeling of being absorbed into image, the feeling of being in the image The feeling the there is no medium between the world of the image and the real world
Presence11
Naturalness 69 The objects being reproduced as they are Naturalness6,7 Clarity
66 The image being informative The objects are easy to discriminate
Usefulness6, clearness7
Depth
35 feeling of 3-dimensionality, objects coming forward from the image
Quality associations
34 Image can resemble e.g. image of the high class magazine or photograph People associate certain low-level attributes with good quality
3.4 Relation between low and high level attributes After the interview and the qualitative analysis was done, a corresponding high level attribute was known for each low level attribute. Table 4 represents the most important low level attributes and their corresponding high level attributes. Correspondence analysis was also performed on this crosstabulation in order to make further conclusions easier. The perceptual map yielded by the analysis is presented in the Figure 3.
SPIE-IS&T/ Vol. 7242 72420D-6

003 C 0
equu
UO! SUeWIO
501500550 & 00 0 0 00 q4UIg±0d.lU0s o 0 0105.10 ON
0.5010150
lOINS 0505J Soloono
S!o5.
0
Fodnd depthUtshopp 0°Wltts Net pool
0 Nod pdtps opspp0 0
0
cstttpdopd0 0
OONNtdlPI sos PLI&NnNNtos
Dimension 3
Allil lute0 AbstIopt00
Table 4: Relation between subjective high level attributes and low level attributes. Realism Naturalness Clarity Quality Depth Real Not
real Natural Unnatural Clear Unclear Good
quality Bad quality
More depth
Less depth
Bright 18 0 12 4 12 0 6 0 6 0 Brightness of colors Faded 0 3 1 2 0 3 0 3 0 0
Sharp 13 0 9 0 11 0 3 0 1 0 Sharpness Unsharp 0 7 0 7 0 8 0 6 0 1 Grainy 0 8 0 10 0 2 0 7 0 0 Graininess Not grainy 1 0 4 0 0 0 1 0 1 0
White dots 0 4 0 9 0 2 0 8 0 3 Bright 7 0 1 0 12 0 1 0 1 0 Brightness Faded 0 0 0 0 0 5 0 5 0 2 Good colors 6 0 11 0 1 0 2 0 0 0 Color
quality Bad colors 0 5 0 6 0 4 0 2 0 0 Gloss Glossy 6 0 0 0 0 0 8 0 0 0 Contrast Large
contrast 5 0 1 0 3 0 0 0 2 0
Lightness Light 0 0 1 0 0 4 0 0 0 0 Figure 3: Correspondence analysis performed on the crosstabulated attribute data. Blue circles denote the high level (abstract) attributes and the green circles denote low level (concrete) attributes. ). The dimension 1 separates attributes of high and low quality from each other; dimension 2 separates attributes of high quality and dimension 3 attributes of low quality from each other. Examination of the perceptual maps shows that brightness, sharpness and larger contrast made the image seem clearer. Having no graininess, good and bright colors added realism and naturalness to the image. If the low quality attributes are examined, the low level attributes have different associations to the high level attributes. For example, bright colors are associated to realism and naturalness in high quality, but faded colors are associated with unclarity. Also graininess seems to be the main reason for the appearance of the image being not real, unnatural and flat. 3.5 Other abstract attributes There is also a third class of attributes that do not fit abovementioned categories. These attributes may have a minor importance for image quality evaluation, but they still illustrate the experiential manner of quality evaluation. Table 4 shows the frequencies of this kind of attributes, which do not share the concrete nature of the low-level attributes, but are not general in the way the high-level attributes are. The experiential nature of image quality is represented in these attributes that are highly dependent on the interpretation of quality differences in certain contexts.
SPIE-IS&T/ Vol. 7242 72420D-7

Table 4: Other abstract attributes used in quality evaluation.
Attribute Frequency Fresh vs. smudgy 13 Vividness 11 Soft vs. hard 10 Summer vs. autumn 9 Fogginess 8 Happiness 7 Warm vs. cold 7 Inviting 3
4. DISCUSSION This study aimed at understanding the role of different attributes in the experience of image quality. The first experiment probed the subjective attribute dimensions that separated images with varying quality from each other. The second experiment examined the relation of attributes to each other. The purpose was to create a description of quality experience in one case - the effect of paper grade on image quality of the ink-jet prints. Naïve observers, that is, typical users of the images, mix different kinds of attributes while describing their quality experience. Some have quite straight association of the physics of the images, like sharpness, contrast or graininess. Some, on the other hand, can be quite abstract, like naturalness, realism or clarity. We found out that usually observers relate low-level, concrete and more detailed attributes to more high-level, abstract and more general attributes, and vice versa. In observers’ description of their experience of image quality, there seems to be a hierarchical relation between these concrete and abstract attributes. This may be related to the hierarchical nature of human visual system. The high-level part of the hierarchy is used in evaluation of more experiential, general and abstract attributes, where as low-level part is responsible of more detailed analysis of the more concrete attributes. This study was only descriptive in nature, and reviewed the naïve observers’ subjective conceptions of quality, but the hierarchical approach to image quality may be beneficial to the understanding e.g. content dependency issues. The subjective experience also seems to reflect the interaction between the high-level and the low-level vision, and the real image quality evaluation process. Some of the subjective attributes used by the naïve observers transcend the typical IQ attributes. For example, the IQ experience was described by words such as grainy, sharp or colorful, but also soft, smudgy or summery. The latter attributes emphasize experiential nature of IQ, in which the subjective process of interpreting the image quality is closely intertwined with the interpretation of image content. Landscape image can be seen as summery or sunny, but simple indoor composition of objects can not be. The visual experience of naïve observers also reflects a subjective interplay between positive and negative attributes. For example in a landscape content, good quality images can be seen as having more depth and being more immersive, while graininess, for example, makes the image look flat. So, low-level attributes do not necessarily have same effect on high level attributes on different quality levels. In future, new quality attributes may emerge, when new technology is introduced. For example, presence or realism can be such attributes that may become important in high definition and high dynamic range systems. While the observers show variable subjective criteria and definitions for IQ, the reliability of subjective estimates can be high: The correlation of the average ratings between different experiment 1 and 2, was .992 to .994 depending on the content. This is promising, since it has been often claimed that reasoning the evaluation may bias the results12. Results presented here prove the fact that asking the reasons for quality ratings does not distract the evaluation process and the subjective evaluation can be very reliable, if the experiment set-up is well controlled.
SPIE-IS&T/ Vol. 7242 72420D-8

5. REFERENCES
[1] Eckert, M. P. and Bradley, A. P., "Perceptual quality metrics applied to still image compression", Signal Process., 70, 177-200 (1998). [2] To, M., Lovell, P. G. , Troscianko, T. and Tolhurst, D. J. , “Summation of perceptual cues in natural visual scenes”, Proc. R. Soc. B, 275, 2299-308 (2008). [3] Hochstein, S. and Ahissari, M., "View from the top: Hierarchies and reverse hierarchies in the visual system," Neuron, 36, 791-804 (2002). [4] Radun, J., Leisti T., Nyman, G., Häkkinen J., ,Ojanen, H., Olives, J.-L. and Vuori, T., "Content and quality: Interpretation-based estimation of image quality," ACM Trans. Appl. Percept., 4, 21:1-21:15 (2008). [5] Keelan, B. W. , [Handbook of Image Quality], Marcel Dekker, New York (2002) [6] Janssen, T. J. W. M. and Blommaert, F. J. J., "Image quality semantics," J. Imaging Sci. Techn., 41, 555-560 (1997). [7] Kim, Y. J. , Luo, M. R. , Choe, W. , Kim, H. S., Park, S. O., Baek, Y. , Rhodes, P. , Lee S. and Kim C. Y., "Factors affecting the psychophysical image quality evaluation of mobile phone displays: the case of transmissive liquid-crystal displays," J. Opt. Soc. Am. A, 25, 2215-2222 (2008). [8] Nyman, G., Radun, J., Leisti, T. and Vuori, T., "From image fidelity to subjective quality: A hybrid qualitative/quantitative methodology for measuring subjective image quality for different image contents," in Proc. 12th International Display Workshops (IDW '05), pp. 1825-1828 (2005) [9] Bettman, J. R., Luce, M. F. and Payne, J. W., "Constructive consumer choice processes", J. Consum. Res., 25, 187-217 (1998) [10] Oittinen, P., Halonen, R., Kokkonen A., Leisti T., ,Nyman G., Eerola, T., Lensu L., Kälviäinen H.,Ritala, R., Pulla, J. and Mettänen, M., "Framework for modeling visual printed image quality from the paper perspective." in Proc. IS&T/SPIE International Symposium on Electronic Imaging 2008: Imaging Quality and System Performance V (2008). [11] Bracken, C., "Presence and image quality: The case of high-definition television", Media Psychol., 7, 191-205 (2005). [12] McGlone, M., Kobrynowics, D. and Alexander, R., "A certain je ne sais quoi: Verbalization bias in evaluation," Hum. Commun. Res., 31, 241-267 (2005).
SPIE-IS&T/ Vol. 7242 72420D-9


