Embed Size (px)
Citation preview

Subtle hemispheric asymmetry of motor cortical inhibitory tone
Tihomir V. Ilic, Patrick Jung, Ulf Ziemann*
Clinic of Neurology, J.W. Goethe-University Frankfurt, Theodor-Stern-Kai 7, D-60590 Frankfurt am Main, Germany
Accepted 25 September 2003
Abstract
Objective: To test whether a novel paired transcranial magnetic stimulation (TMS) protocol (J Physiol 545.1 (2002) 153) detects
hemispheric differences in motor cortical inhibition.
Methods: Nine right-handers and 8 left-handers participated. Focal paired TMS was applied to the hand area of the dominant (M1-D) or
non-dominant motor cortex (M1-ND). Motor evoked potentials (MEP) were recorded from the relaxed contralateral abductor digiti minimi.
The first (S1) and second pulse (S2) were separated by 1.5 or 2.1 ms. Nine stimulus intensities of S1 and S2 (i.e. 9 £ 9 intensity conditions)
ranging from 60 to 140% of resting motor threshold (RMT) were tested. The interaction between S1 and S2 was expressed by
MEPS1þS2/(MEPS1 þ MEPS2) p 100%. Values below and above 100% indicate short-interval intracortical inhibition (SICI) and facilitation
(SICF), respectively.
Results: In right-handers, RMT was lower, SICI was present with fewer intensity conditions and the magnitude of SICI was less in M1-D
than M1-ND. No hemispheric asymmetry was found for SICF. Left-handers showed no hemispheric difference for any of these measures.
Conclusions: Findings suggest that, in right-handers, M1-D is controlled by less inhibitory tone than M1-ND. This may put the M1-D to an
advantage for processes that are associated with a reduction of SICI, such as voluntary activation and use-dependent plasticity.
q 2003 International Federation of Clinical Neurophysiology. Published by Elsevier Ireland Ltd. All rights reserved.
Keywords: Short-interval intracortical inhibition; Motor evoked potential; Transcranial magnetic stimulation; Motor cortex; Hemispheric asymmetry
1. Introduction
Many cerebral functions are associated with hemispheric
specialisation. These include speech, sensory cognition, and
motor function. Anatomical and electrophysiological
studies demonstrated a larger volume of the dominant
(M1-D) than non-dominant motor cortex (M1-ND) (Amunts
et al., 1996; Volkmann et al., 1998). The hand represen-
tation is greater in the M1-D than M1-ND. More extensive
neuronal connectivity in M1-D might constitute a neural
substrate which favours the formation of experience-
dependent excitatory and inhibitory interactions between
elementary movement representations in M1-D over M1-
ND (Hammond, 2002).
It is now possible to assess some of these excitatory and
inhibitory interactions in motor cortex non-invasively by
transcranial magnetic stimulation (TMS). For instance,
long-lasting inhibition influenced by activity through
the GABAB receptor can be tested by the duration of the
cortical silent period (Fuhr et al., 1991; Cantello et al., 1992;
Inghilleri et al., 1993; Wilson et al., 1993; Hallett, 1995;
Werhahn et al., 1999). One study found that the duration of
the cortical silent period is shorter in M1-D compared to
M1-ND (Priori et al., 1999) but this asymmetry was not
confirmed by another study (Cicinelli et al., 1997). Short-
lasting inhibition is influenced by activity through the
GABAA receptor and can be assessed by the short-interval
intracortical inhibition (SICI) as measured by paired TMS
protocols (Kujirai et al., 1993; Ziemann et al., 1996a,c; Di
Lazzaro et al., 1998, 2000). In contrast to the findings on the
cortical silent period, no hemispheric asymmetry was found
for the SICI (Cicinelli et al., 2000; Civardi et al., 2000;
Maeda et al., 2002). However, SICI testing in the classical
protocols (Kujirai et al., 1993; Ziemann et al., 1996c) is
limited by the possible occurrence of ‘floor effects’ because
these classical protocols use a conditioning first pulse that is
already optimal for producing maximum SICI (Ziemann
et al., 1996b). One novel paired TMS protocol uses a
systematic variation of the intensities of the first and second
pulse to prevent ‘floor effects’ (Ilic et al., 2002). That
Clinical Neurophysiology 115 (2004) 330–340
www.elsevier.com/locate/clinph
1388-2457/$30.00 q 2003 International Federation of Clinical Neurophysiology. Published by Elsevier Ireland Ltd. All rights reserved.
doi:10.1016/j.clinph.2003.09.017
* Corresponding author. Tel.: þ49-69-6301-5739; fax: þ49-69-6301-
6842.
E-mail address: [email protected] (U. Ziemann).

protocol revealed an increase of SICI by a single oral dose
of the GABAA receptor agonist diazepam which was not
apparent in the classical protocols (Ilic et al., 2002).
A reduction of SICI occurs prior to or during voluntary
activation of a motor representation (Ridding et al., 1995b;
Reynolds and Ashby, 1999; Zoghi et al., 2003). A reduction
of SICI enhances use-dependent plasticity (Ziemann et al.,
2001) while an increase in SICI by a GABAA receptor
agonist suppresses use-dependent plasticity in human motor
cortex (Tegenthoff et al., 1999; Butefisch et al., 2000). The
aim of the present study was to revisit the question of
possible hemispheric differences in SICI by taking the
advantages of the novel paired TMS protocol (Ilic et al.,
2002). We will demonstrate that, in right-handers, SICI is
less in the M1-D compared to the M1-ND. This hemispheric
asymmetry supports the idea that M1-D may have an
advantage over M1-ND with processes that are associated
with a reduction of SICI, such as voluntary activation of
movement representations or use-dependent plasticity.
2. Methods and subjects
2.1. Subjects
Seventeen healthy volunteers (mean age, 29.7 ^ 1.1
years; range, 22–36 years; 6 females, 11 males) participated
in the main experiments. Nine subjects were right-handed
(RH, mean laterality index, 92.5 ^ 2.4) and 8 left-handed
(LH, mean laterality index, 268.7 ^ 3.9) when tested with
the Edinburgh Inventory (Oldfield, 1971). Another 8 RH
subjects (mean age, 31.4 ^ 1.6 years; 5 males; mean
laterality index, 97.1 ^ 1.9) took part in a control
experiment (see below, Section 2.3) Written informed
consent was obtained from all subjects. The study was
approved by the Ethics Committee of the J.W. Goethe
University of Frankfurt, Germany, and conformed to the
Declaration of Helsinki.
2.2. Recording and stimulation procedures
Subjects were seated comfortably in a reclining chair.
Surface EMG was recorded from the abductor digiti minimi
(ADM) muscle, using surface Ag-AgCl cup electrodes in a
belly-tendon montage. The raw EMG was amplified and
filtered (10 Hz–2 kHz, Counterpoint Electromyograph,
Dantec Electronics, Skovlunde, Denmark), passed through a
CED micro 1401 laboratory interface (Cambridge Elec-
tronic Design, Cambridge, UK) for digitisation (sampling
rate, 4 kHz) and then fed into a personal computer for online
display and offline analysis, using customised data collec-
tion and conditional averaging software (Spike 2 for
Windows, Version 3.05, Cambridge Electronic Design,
Cambridge, UK).
Focal TMS was applied over the hand area of the motor
cortex through a figure-of-8 coil (outer diameter of each
wing, 9 cm; peak magnetic field, ,1.5 T) using two
MAGSTIM 200 magnetic stimulators (Magstim, Whitland,
UK) connected to the BiStim module (Magstim) throughout
all measurements. The stimulating coil was placed flat on
the skull with the handle pointing backwards and rotated 458
away from the midline. Thus, the current induced in the
brain was directed from lateral-posterior to medial-anterior,
approximately perpendicular towards the assumed line of
the central sulcus. This is the optimal orientation for a
predominantly trans-synaptic activation of the corticospinal
neurones (Kaneko et al., 1996). The optimal coil position for
activating the contralateral ADM was determined as the site
where stimulation produced consistently the largest motor
evoked potential (MEP) at a slightly supra-threshold
stimulus intensity. This site was marked on the scalp with
a pen in order to assure a constant placement of the coil
throughout the experiment. Resting motor threshold (RMT)
was determined in the resting ADM to the nearest 1% of
maximum stimulator output using single-pulse TMS. RMT
was defined as the lowest stimulus intensity which elicited
MEP .50 mV in at least 5 of 10 consecutive trials (Rossini
et al., 1994). Throughout this paper, RMT will be reported
in percent of the maximum stimulator output. All exper-
iments were performed in the relaxed ADM. The raw EMG
was displayed continuously at a high gain (50 mV/D) of the
recording device on the computer screen and played through
a loudspeaker for acoustic feedback. Trials contaminated by
EMG activity were discarded from analysis.
For the paired pulse experiments, two different inter-
stimulus intervals (ISI) of 1.5 and 2.1 ms were tested twice
in each subject in pseudo-randomised order and in separate
sessions (i.e. 4 sessions per subject). Each session consisted
of successive testing of M1-D and M1-ND at a given ISI.
The order of testing M1-D and M1-ND in a given session
was reversed in the second session of the same ISI to
exclude possible order effects. Whether M1-D or M1-ND
was tested first in the first session at a given ISI was set
pseudo-randomly, with a balanced order across subjects.
Since statistical analysis did not reveal any order effects,
results from the two sessions at a given ISI were pooled in
the final statistical analysis (see below).
The ISI of 1.5 and 2.1 ms were selected because they
showed different interactions between the first (S1) and
second pulse (S2) in previous paired-pulse TMS exper-
iments when the target muscle was studied at rest. Marked
short-latency intracortical facilitation (SICF) occurred at the
ISI of 1.5 ms, if a supra-threshold S1 and a sub-threshold S2
were used (Ziemann et al., 1998; Ilic et al., 2002), or if both
stimuli were approximately equal to RMT (Tokimura et al.,
1996), while relatively little or no SICI occurred when S1
was sub-threshold and S2 supra-threshold (Fisher et al.,
2002; Ilic et al., 2002). In contrast, at ISI of around 2 ms,
SICF was relatively weak (Tokimura et al., 1996; Ziemann
et al., 1998; Ilic et al., 2002) while SICI was prominent (Di
Lazzaro et al., 1998; Fisher et al., 2002; Ilic et al., 2002).
Therefore, it may be expected that these intervals are
T.V. Ilic et al. / Clinical Neurophysiology 115 (2004) 330–340 331
particularly suitable for testing hemispheric differences in
SICF and SICI, respectively.
It is currently thought that SICI reflects the summation of
strong GABAergic inhibitory post-synaptic potentials at the
cortico-spinal neurone elicited by the sub-threshold S1, and
excitatory post-synaptic potentials elicited by the supra-
threshold S2 (Kujirai et al., 1993; Ilic et al., 2002). SICF, on
the other hand, most likely originates non-synaptically
through direct excitation of the axon initial segment of
excitatory interneurones by the sub-threshold S2 which
were made hyper-excitable through excitatory post-synaptic
potentials by a supra-threshold S1 (Hanajima et al., 2002;
Ilic et al., 2002).
In all experiments, S1 and S2 varied in steps of 10%
of RMT between 60 and 140% RMT (i.e. 9 intensity
steps). The paired-pulse conditions consisted of all
possible combinations of S1 and S2 intensities (i.e.
9 £ 9 ¼ 81 conditions). In addition, single-pulse con-
ditions were applied at each of the 9 different intensities.
Five trials were performed for each condition (i.e. 5
repeats £ 90 conditions ¼ 450 trials per hemisphere; two
hemispheres £ 450 conditions ¼ 900 trials per session).
The different intensity conditions were applied in pseudo-
randomised order. The intensities of the two magnetic
stimulators were set automatically by customised soft-
ware (Spike 2) at a minimum step width of 1% of
maximum stimulator output via the CED 1401 laboratory
interface and the remote port of the MAGSTIM
stimulators. The inter-trial interval varied randomly in a
range of 6 ^ 2 s. One session lasted on average
approximately 2 h.
2.3. Control experiment
The principal finding of this study was slightly less SICI
in the M1-D than M1-ND of right-handed subjects at the ISI
of 2.1 ms (see Section 3). Concomitantly, the RMT was
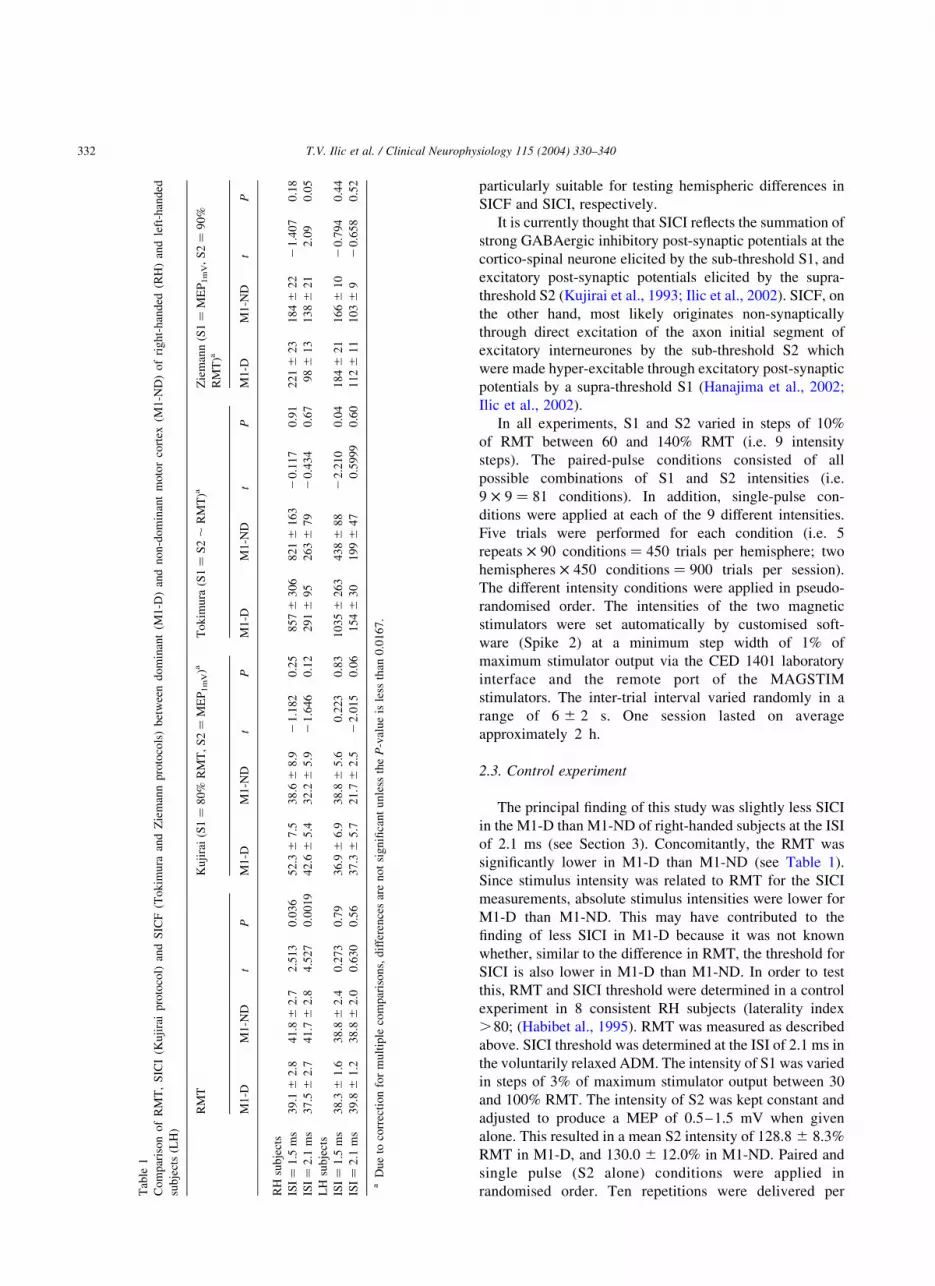
significantly lower in M1-D than M1-ND (see Table 1).
Since stimulus intensity was related to RMT for the SICI
measurements, absolute stimulus intensities were lower for
M1-D than M1-ND. This may have contributed to the
finding of less SICI in M1-D because it was not known
whether, similar to the difference in RMT, the threshold for
SICI is also lower in M1-D than M1-ND. In order to test
this, RMT and SICI threshold were determined in a control
experiment in 8 consistent RH subjects (laterality index
.80; (Habibet al., 1995). RMT was measured as described
above. SICI threshold was determined at the ISI of 2.1 ms in
the voluntarily relaxed ADM. The intensity of S1 was varied
in steps of 3% of maximum stimulator output between 30
and 100% RMT. The intensity of S2 was kept constant and
adjusted to produce a MEP of 0.5–1.5 mV when given
alone. This resulted in a mean S2 intensity of 128.8 ^ 8.3%
RMT in M1-D, and 130.0 ^ 12.0% in M1-ND. Paired and
single pulse (S2 alone) conditions were applied in
randomised order. Ten repetitions were delivered perTab
le1
Com
par
iso
no
fR
MT
,S
ICI
(Ku
jira
ip
roto
col)
and
SIC
F(T
ok
imu
raan
dZ
iem
ann
pro
toco
ls)
bet
wee
nd
om
inan
t(M
1-D
)an
dn
on
-do
min
ant
moto
rco
rtex
(M1
-ND
)o
fri
gh
t-h
anded
(RH
)an
dle
ft-h
and
ed
sub
ject
s(L
H)
RM
TK
uji
rai
(S1¼
80
%R
MT
,S
2¼
ME
P1m
V)a
To
kim
ura
(S1¼
S2,
RM
T)a
Zie
man
n(S
1¼
ME
P1m
V,
S2¼
90
%
RM
T)a
M1
-DM
1-N
Dt
PM
1-D
M1
-ND
tP
M1
-DM
1-N
Dt
PM
1-D
M1
-ND
tP
RH
sub
ject
s
ISI¼
1.5
ms
39
.1^
2.8
41
.8^
2.7
2.5
13
0.0
36
52
.3^
7.5
38
.6^
8.9
21
.182
0.2
58
57^
30
68
21^
16
32
0.1
17
0.9
12
21^
23
18
4^
22
21
.407
0.1
8
ISI¼
2.1
ms
37
.5^
2.7
41
.7^
2.8
4.5
27
0.0
01
94
2.6
^5
.43
2.2
^5
.92
1.6
46
0.1
22
91^
95
26
3^
79
20
.43
40
.67
98^
13
13
8^
21
2.0
90
.05
LH
sub
ject
s
ISI¼
1.5
ms
38
.3^
1.6
38
.8^
2.4
0.2
73
0.7
93
6.9
^6
.93
8.8
^5
.60
.223
0.8
31
03
5^
26
34
38^
88
22
.21
00
.04
18
4^
21
16
6^
10
20
.794
0.4
4
ISI¼
2.1
ms
39
.8^
1.2
38
.8^
2.0
0.6
30
0.5
63
7.3
^5
.72
1.7
^2
.52
2.0
15
0.0
61
54^
30
19
9^
47
0.5
99
90
.60
11
2^
11
10
3^
92
0.6
58
0.5
2
aD
ue
toco
rrec
tio
nfo
rm
ult
iple
com
par
iso
ns,
dif
fere
nce
sar
en
ot
sig
nifi
can
tu
nle
ssth
eP
-val
ue
isle
ssth
an0
.01
67
.
T.V. Ilic et al. / Clinical Neurophysiology 115 (2004) 330–340332

condition. The inter-trial interval was 6 ^ 2 s. M1-D and
M1-ND were tested consecutively in the same session in
randomised order which was balanced across the subjects.
The effect of S1 on the MEP elicited by S2 alone was
expressed as 100% 2 MEPS1þS2/MEPS2 p 100%. For each
subject and hemisphere, this effect was plotted as a
dependent variable against the stimulus intensity of S1
(given in % of maximum stimulator output). A 3rd
order sigmoid polynomial regression function was fitted,
and SICI threshold was defined as the stimulus intensity of
S1 which resulted in a 25% diminution of MEPS1þS2
compared to MEPS2.
2.4. Data analysis
RH and LH subjects were analysed separately. A paired
two-tailed t test was used to assess hemispheric differences
in RMT. MEP intensity curves were constructed from the
single pulse data of the paired-pulse experiments. For each
subject and ISI, MEP amplitude was normalised to the
largest MEP of M1-D, which was assigned a value of 1
(Fig. 1). MEP intensity curves were analysed by a two-way
ANOVA with the within-subject factors of hemisphere
(M1-D vs. M1-ND) and stimulus intensity (9 levels, 60%
RMT – 140% RMT).
For analysis of the paired-pulse data, conditional
averages of the single trial peak-to-peak MEP amplitudes
were calculated, and the interaction between S1 and S2 was
expressed as the ratio of the MEP amplitude elicited by
paired TMS (MEPS1þS2) over the arithmetic sum of the
MEP amplitudes produced by the single pulses (MEPS1 þ
MEPS2) (Ilic et al., 2002):
Interaction ¼ MEPS1þS2=ðMEPS1 þ MEPS2Þ p 100%:
Fig. 1. MEP intensity curves in RH and LH subjects in M1-D and M1-ND. MEP amplitude was normalised for each subject and inter-stimulus interval to the
maximum MEP in the M1-D which was assigned a value of 1. Normalised MEP amplitudes are plotted against stimulus intensity (expressed in % of resting
motor threshold, RMT). The 4 plots refer to right-handed (A, B); and left-handed subjects (C, D) and to the sessions where, for the paired-pulse experiments,
inter-stimulus intervals of 1.5 ms (A, C); and 2.1 ms (B, D) were tested. M1-D and M1-ND are indicated by black and white circles, respectively. All data are
means ^ SEM.
T.V. Ilic et al. / Clinical Neurophysiology 115 (2004) 330–340 333

Those conditions where S1 and S2 were ,RMT (16/81
conditions) were discarded from analysis because both
single pulse conditions resulted in no MEP, and therefore,
no meaningful interaction could be calculated. Interactions
were plotted as contour lines separately for M1-D and M1-
ND, and separately for the ISI of 1.5 and 2.1 ms (RH
subjects: Fig. 2; LH subjects: Fig. 3). In order to run a
statistical analysis on the ‘extent’ of SICI and SICF,
conditions with non-overlapping interactions ,25, 25–50,
50–75 and 75–100% (SICI), or 100–125, 125–150,
150–300, 300–600% and .600% (SICF) were counted
(Fig. 4). Furthermore, in order to evaluate the ‘magnitude’
of SICI and SICF, an average of the 10 lowest SICI values
(SICI-10) and the 10 highest SICF values (SICF-10) was
calculated from each subject (Fig. 5). Finally, from each
experiment those 3 intensity conditions were selected which
Fig. 2. Short-interval paired-pulse inhibition and facilitation in M1-D and M1-ND as a function of stimulus intensity and inter-stimulus interval in the resting
ADM of RH subjects. (A–D) Refer to inter-stimulus intervals (ISI) of 1.5 ms (A, B); and 2.1 ms (C, D). Stimulus intensity of the first stimulus (S1, x-axis), and
the second stimulus (S2, y-axis) are plotted relative to the ADM RMT. As there were 9 different stimulus intensities for S1 and S2, each diagram consists of 81
conditions. Those 16/81 conditions with S1 and S2 ,RMT were discarded from analysis because both single pulses did not elicit a MEP, and therefore no
meaningful interaction between S1 and S2 could be calculated. For each of the other conditions, the interaction between S1 and S2 is expressed as
MEPS1þS2/(MEPS1 þ MEPS2) p 100%. Data are grand averages from 9 RH subjects and shown as contour plots. The thick line in each diagram indicates no
interaction (100%), dashed lines show inhibitory (,100%) and thin solid lines facilitatory (.100%) interactions. The numbers on the contour lines provide the
interaction values (in %). Note that, at the ISI of 2.1 ms, the area of inhibition (inhibitory interaction ,50% coloured in red) was less extensive in M1-D than
M1-ND.
T.V. Ilic et al. / Clinical Neurophysiology 115 (2004) 330–340334

best approximated the conditions in the classical paired-
pulse TMS protocols (Kujirai et al., 1993; Tokimura et al.,
1996; Ziemann et al., 1998) (cf. Table 1). This was done
to appreciate the superior sensitivity of the novel paired-
pulse protocol (Ilic et al., 2002) in detecting subtle
hemispheric differences in paired-pulse excitability. Paired
t tests corrected for multiple comparisons were applied to
test for hemispheric differences (M1-D vs. M1-ND) of SICI
and SICF extent and magnitude, and for SICI and SICF
according to the classical paired-pulse TMS protocols.
For all comparisons, a significance level of P , 0:05 was
adopted. Descriptive statistics will always be reported as
mean ^ 1 standard error of the mean (SEM).
3. Results
3.1. Main experiment (hemispheric asymmetry of SICI and
SICF)
In RH subjects, RMT was lower in M1-D than M1-ND
(P , 0:05). This difference was consistent for both ISI
(Table 1). No hemispheric difference in RMT was observed
in LH subjects (Table 1).
In RH and LH subjects, MEP intensity curves were not
different between hemispheres (Fig. 1; RH subjects, ISI 1.5
ms: Fð1; 8Þ ¼ 0:87, P ¼ 0:78; RH subjects, ISI 2.1 ms:
Fð1; 8Þ ¼ 0:74, P ¼ 0:41; LH subjects, ISI 1.5 ms:
Fig. 3. Short-interval paired-pulse inhibition and facilitation in M1-D and M1-ND as a function of stimulus intensity and inter-stimulus interval in the resting
ADM of LH subjects. Data are grand averages from 8 LH subjects. Otherwise, same arrangement and conventions as in Fig. 2.
T.V. Ilic et al. / Clinical Neurophysiology 115 (2004) 330–340 335

Fig. 4. ‘Extent’ of SICI and SICF. Data are means ^ SEM from 9 RH subjects (A, B); and 8 LH subjects (C, D) at ISI of 1.5 ms (A, C); and 2.1 ms (B, D).
Frequency plots (given as percentage of the analysed 65/81 conditions, y-axis) show conditions at discrete, non-overlapping interaction levels of
MEPS1þS2/(MEPS1 þ MEPS2) £ 100% as indicated on the x-axis. Filled and open columns refer to M1-D and M1-ND, respectively. Note that, in RH subjects
and the ISI of 2.1 ms, SICI conditions ,25% were less frequent in M1-D than M1-ND (*P ¼ 0:0019).
Fig. 5. ‘Magnitude’ of SICI and SICF. Data are means ^ SEM from the 10 lowest values of inhibitory interactions (A, SICI-10) and the 10 highest values of
facilitatory interactions (B, SICF-10) in the resting ADM from 9 RH subjects and 8 LH subjects. Filled and open columns refer to M1-D and M1-ND,
respectively. Significant differences between hemispheres are indicated (paired t tests). Note that, in RH subjects at the ISI of 2.1 ms, the magnitude of
inhibition was less (i.e. higher SICI-10 values) in M1-D than M1-ND.
T.V. Ilic et al. / Clinical Neurophysiology 115 (2004) 330–340336

Fð1; 6Þ ¼ 1:89, P ¼ 0:22; LH subjects, ISI 2.1 ms:
Fð1; 5Þ ¼ 5:62, P ¼ 0:06). In addition, none of the inter-
actions of hemisphere with stimulus intensity was signifi-
cant. These are important negative results because
single-pulse MEP amplitude may affect the interaction
between S1 and S2 (Kujirai et al., 1993; Ziemann et al.,
1996c; Ilic et al., 2002).
The main results are displayed in Figs. 2–5. The
interaction plots between S1 and S2 (Figs. 2 and 3) suggest
that, in RH subjects and at the ISI of 2.1 ms, the number of
conditions with inhibitory interactions is lower in M1-D
than M1-ND (Figs. 2C,D). No such difference was observed
at the ISI of 1.5 ms (Figs. 2A,B). LH subjects showed no
conspicuous difference at either ISI (Fig. 3). Statistical
analysis confirmed that, in RH subjects and at the ISI of 2.1
ms, the extent of SICI was less in M1-D than M1-ND for
SICI ,25% (Fig. 4). No significant differences occurred in
RH subjects at the ISI of 1.5 ms, or in LH subjects at either
interval (Fig. 4).
The magnitude of inhibitory interaction (SICI-10) in RH
subjects was significantly less in M1-D than M1-ND for the
ISI of 2.1 ms but not at the ISI of 1.5 ms (Fig. 5A) while
there was no such hemispheric difference in LH subjects at
either interval (Fig. 5A). SICF-10 showed a trend towards
higher values in the M1-D of LH subjects at the ISI of 1.5 ms
but this difference was not statistically significant (Fig. 5B,
P ¼ 0:06).
Finally, SICI according to the classical paired-pulse
protocol (Kujirai et al., 1993) in RH and LH subjects
showed a trend towards less inhibition in M1-D than
M1-ND, but this did not reach statistical significance
(Table 1). SICF (Tokimura et al., 1996; Ziemann et al.,
1998) in RH and LH subjects was also not significantly
different between hemispheres (Table 1).
3.2. Control experiment (hemispheric asymmetry of SICI
threshold)
The control experiment replicated the finding of the main
experiment that, in RH subjects, RMT was significantly
lower in M1-D (39.1 ^ 1.5%) compared to M1-ND
(43.1 ^ 2.7%, P ¼ 0:042) (Fig. 6). In addition, SICI
threshold was also significantly lower in M1-D
(22.3 ^ 1.5%) than M1-ND (25.6 ^ 1.4%, P ¼ 0:0045)
(Fig. 6). MEP size elicited by S2 alone did not differ
between hemispheres (M1-D: 1.19 ^ 0.16 mV; M1-ND:
1.00 ^ 0.22 mV). Finally, the ratio of SICI threshold over
RMT was also not different between hemispheres (M1-D:
0.57 ^ 0.03; M1-ND: 0.60 ^ 0.04, P ¼ 0:26).
These findings indicate that the lower stimulus intensities
used for M1-D when testing the paired-pulse measures in
the main experiment cannot account for the observed
hemispheric difference in SICI extent and magnitude (see
above, Figs. 2C,D, 4B and 5A) because of similar
hemispheric differences in RMT and SICI threshold.
4. Discussion
The main novel finding is significantly less SICI in the
M1-D compared to the M1-ND of RH subjects. In addition,
this study confirms that, in RH subjects, RMT is lower in
M1-D compared to M1-ND (Macdonell et al., 1991; Triggs
et al., 1994, 1997) although this hemispheric differences
was not unanimously found in previous reports (Cicinelli
et al., 1997; Mills and Nithi, 1997; Semmler and Nordstrom,
1998; Cicinelli et al., 2000; Civardi et al., 2000; Ziemann
and Hallett, 2001).
4.1. Physiological interpretation
The cortical origin of SICI was proven by epidural
recordings of the descending cortico-spinal discharge at the
level of the cervical spinal cord which showed a reduction in
the size and number of I-waves when a sub-threshold
conditioning pulse preceded the supra-threshold test pulse by
1–5 ms (Nakamura et al., 1997; Di Lazzaro et al., 1998).
Application of agonists at the GABAA receptor, such as
benzodiazepines, leads to an increase of SICI (Ziemann et al.,
1996a; Di Lazzaro et al., 2000; Ilic et al., 2002). Therefore,
convergent evidence points to the idea that SICI measures
inhibition at the level of the human motor cortex which is
influenced by activation through the GABAA receptor.
To the best of our knowledge, only 3 previous studies
tested for hemispheric differences in SICI (Cicinelli et al.,
2000; Civardi et al., 2000; Maeda et al., 2002). Contrasting
with the present report, none of those studies found
Fig. 6. Relationship between resting motor threshold (RMT) and short-
interval intracortical inhibition threshold (SICI threshold). RMT (y-axis)
and SICI threshold (inter-stimulus interval of 2.1 ms, x-axis) of M1-D and
M1-ND of 8 RH subjects are expressed as percentage of the maximum
stimulator output (% MSO). Grey circles with error bars indicate
means ^ SEM in M1-D (dark grey) and M1-ND (pale grey). SICI
threshold was positively correlated with RMT (Pearson’s r ¼ 0:581,
P , 0:02). RMT was significantly lower in M1-D than M1-ND (P , 0:05).
SICI threshold was also significantly lower in M1-D than M1-ND
(P , 0:01). Thus, the lower inhibitory tone in M1-D than M1-ND observed
in the main experiment (cf. Figs. 2C,D, 4B and 5A) was not an artefact due
to lower stimulus intensities used for testing of M1-D.
T.V. Ilic et al. / Clinical Neurophysiology 115 (2004) 330–340 337

a significant hemispheric asymmetry. Several reasons may
account for this disagreement. Most importantly, all previous
studies measured SICI according to the classical Kujirai
protocol which uses a conditioning pulse of 80% RMT
intensity. This is in the optimal range of intensities for
producing maximum SICI (Kujirai et al., 1993; Ziemann
et al., 1996c). Therefore, small SICI differences may escape
detection with this method due to saturation or ‘floor’ effects.
In contrast, a range of non-optimal intensities of the
conditioning pulse was used in the present protocol. This
revealed, in RH subjects, significantly less SICI in the M1-D
than M1-ND, while testing of SICI according to the Kujirai
protocol did not show a significant difference (Table 1).
Another point is that the degree of handedness of the subjects
was less well defined in two of the previous studies (Cicinelli
et al., 2000; Maeda et al., 2002). In fact, RH and LH subjects
were mixed in one study (Maeda et al., 2002). Finally, it is
now clear that both inhibitory and excitatory interactions can
be obtained at short ISI of 1–5 ms. The net effect depends on
the exact ISI and the intensities of the first and second pulse
(Kujirai et al., 1993; Tokimura et al., 1996; Ziemann et al.,
1996c, 1998; Awiszus et al., 1999; Fisher et al., 2002; Ilic
et al., 2002). The present study showed that the hemispheric
difference in SICI in RH subjects occurred at the ISI of 2.1 ms
but not at 1.5 ms. An ISI of around 2 ms was not tested in two
of the previous studies (Cicinelli et al., 2000; Maeda et al.,
2002) which may be another reason why those authors did not
find a significant hemispheric difference in SICI. Why the
hemispheric asymmetry of SICI in the present study was
observed only at the ISI of 2.1 ms is not entirely clear but one
may argue that relatively pure SICI is being tested at that
interval without much contamination by SICF (Tokimura
et al., 1996; Ziemann et al., 1998; Fisher et al., 2002; Ilic et al.,
2002).
SICI differences may be explained by differences in the
amplitude of the MEP elicited by S2 (Stefan et al., 2002),
and by stimulus intensity (Ilic et al., 2002). These effects
were carefully controlled for in the present experiments.
First, the MEP intensity curves were not different (cf.
Fig. 1B). Second, slightly lower absolute stimulus inten-
sities were used for testing of M1-D compared to M1-ND
because stimulus intensity was related to the slightly
asymmetric RMT. However, this did not contribute to the
observed hemispheric difference in SICI because the SICI
threshold was, similarly to RMT, significantly lower in
M1-D than M1-ND (see Section 2.3, Fig. 6). Therefore, it is
very likely that the observed hemispheric difference in SICI
of RH subjects is a true biological finding.
Our failure to detect a significant hemispheric difference
in any measure of motor excitability in LH subjects is most
likely explained by the fact that left-handedness is on
average associated with a less pronounced and more
variable cortical asymmetry of both structure and function
compared to right-handedness (for review, LeMay, 1992).
In the motor system, further evidence was provided that
right-hemispheric motor dominance in LH subjects is less
consistent than left-hemispheric motor dominance in RH
subjects (Netz et al., 1995). In addition, the lower mean
laterality index in our LH compared to the RH subjects
possibly impeded a detection of significant side differences
in intracortical motor inhibition. It was shown previously
that a lower degree of asymmetry of hand preference was no
longer associated with a hemispheric difference in motor
excitability (Triggs et al., 1994, 1997).
4.2. Functional significance
GABA is the major inhibitory neurotransmitter in the
human cerebral cortex (McCormick, 1989). GABAergic
neurons constitute approximately 25–30% of the neuronal
population (Jones, 1993). The role of GABA in motor control
was assessed by iontophoretic injection of the GABAA
receptor agonist muscimol or the GABAA receptor antago-
nist bicuculline into monkey M1. Muscimol resulted in a
severe disturbance of manual dexterity such as the ability to
pick up small objects (Matsumura et al., 1991; Brochier et al.,
1999), individuated finger movements (Schieber and Polia-
kov, 1998), prolonged reaction and movement times
(Matsumura et al., 1991; Kubota, 1996) and even a paretic
hand (Kubota, 1996). These deficits were associated with a
decrease in movement-related activity of neurones in M1
(Matsumura et al., 1992). Low cortical GABA may also lead
to uncontrolled motor activity in the form of seizures (for
review, (Olsen and Avoli, 1997). Application of bicuculline
also produced a severe disruption of manual dexterity in a
small object pick-up task, and in addition resulted in co-
contraction of muscles which are normally not activated
during a particular movement (Matsumura et al., 1991).
These abnormalities were associated with an increase in
movement-related activity of neurones in M1, a decrease of
direction selectivity of movement-related activity and the
movement-related recruitment of neurones which were not
activated prior to bicuculline injection (Matsumura et al.,
1992). The muscular co-contractions under bicuculline are
reminiscent of those in dystonia, a neurological disorder
associated with gross deficits in SICI (Ridding et al., 1995a;
Siebner et al., 1999; Sommer et al., 2002) and a reduced
content of GABA in the sensori-motor cortex (Levy and
Hallett, 2002). These findings demonstrate that the amount of
GABA related inhibition in motor cortex is extremely
important for the fine tuning of movement-related neuronal
activity which in turn is essential for the level of dexterity of
complex or individuated finger movements (Keller, 1993).
Therefore, it appears that there exists an optimal level of
GABAergic inhibitory tone to permit optimal motor
performance. Too much inhibitory tone blocks required
neuronal activity while too low inhibitory tone may result in
dystonic or seizure activity. We showed here for the first time
that, in RH subjects, the M1-D displays less inhibitory tone
than the M1-ND. However, this difference was rather subtle
so that it is likely that the inhibitory tone in both M1 operates
closely to the proposed optimum for motor performance.
T.V. Ilic et al. / Clinical Neurophysiology 115 (2004) 330–340338
Slightly less SICI in M1-D than M1-ND may provide some
advantage for the readiness and ease to carry out movements
with the dominant compared to the non-dominant hand
because a reduction of SICI occurs before and during
voluntary contraction of hand and forearm muscles (Ridding
et al., 1995b; Reynolds and Ashby, 1999; Zoghi et al., 2003).
Another important role of GABA related inhibition in
motor cortex is its regulatory function on plasticity (Jones,
1993; Keller, 1993). Synaptic plasticity such as long-term
potentiation can be induced clearly less reliably in motor
cortex than in other areas of the cerebral neocortex
(Castro-Alamancos et al., 1995). Therefore, in animal
preparations, it was often necessary to reduce the GABA
related cortical inhibition in order to permit induction of
long-term potentiation (Hess and Donoghue, 1994; Hess
et al., 1996). GABA related inhibition is reduced in the area
surrounding a photothrombotic lesion of sensori-motor
cortex in rats (Domann et al., 1993) and long-term
potentiation can be induced more readily in this disinhibited
area compared to control cortex (Hagemann et al., 1998).
Recovery of sensori-motor function after cortical lesion in
rats is significantly delayed or even permanently disrupted
by administration of the GABAA receptor agonist diazepam
(Schallert et al., 1986; Hernandez and Schallert, 1990).
Similarly, there exists anecdotal knowledge that the intake
of GABAergic drugs in patients after stroke is detrimental
for functional outcome (Goldstein, 1998). Finally, use-
dependent plasticity in healthy subjects can be blocked by
the GABAA receptor agonist lorazepam (Tegenthoff et al.,
1999; Butefisch et al., 2000) but enhanced by disinhibition
(Ziemann et al., 2001). These data strongly suggest that an
increase in GABA related inhibition has a disruptive effect
on plasticity in motor cortex. In this context, the subtle
hemispheric asymmetry in inhibitory tone demonstrated in
this study may put a small advantage to the M1-D in terms
of its readiness to undergo functionally relevant plasticity.
This contention can be tested in future experiments. It
should be kept in mind, however, that use-dependent
plasticity may rely on a more complex multitude of
excitatory and inhibitory cortical processes that goes
beyond of what is being tested by SICI.
Acknowledgements
Dr Ilic was a research fellow of the Alexander von
Humboldt Foundation.
References
Amunts K, Schlaug G, Schleicher A, Steinmetz H, Dabringhaus A, Roland
PE, Zilles K. Asymmetry in the human motor cortex and handedness.
Neuroimage 1996;4:216–22.
Awiszus F, Feistner H, Urbach D, Bostock H. Characterisation of paired-
pulse transcranial magnetic stimulation conditions yielding inhibition
or I-wave facilitation using a threshold-hunting paradigm. Exp Brain
Res 1999;129:317–24.
Brochier T, Boudreau MJ, Pare M, Smith AM. The effects of muscimol
inactivation of small regions of motor and somatosensory cortex on
independent finger movements and force control in the precision grip.
Exp Brain Res 1999;128:31–40.
Butefisch CM, Davis BC, Wise SP, Sawaki L, Kopylev L, Classen J, Cohen
LG. Mechanisms of use-dependent plasticity in the human motor
cortex. Proc Natl Acad Sci USA 2000;97:3661–5.
Cantello R, Gianelli M, Civardi C, Mutani R. Magnetic brain stimulation:
the silent period after the motor evoked potential. Neurology 1992;42:
1951–9.
Castro-Alamancos MA, Donoghue JP, Connors BW. Different forms of
synaptic plasticity in somatosensory and motor areas of the neocortex.
J Neurosci 1995;15:5324–33.
Cicinelli P, Traversa R, Bassi A, Scivoletto G, Rossini PM. Interhemi-
spheric differences of hand muscle representation in human motor
cortex. Muscle Nerve 1997;20:535–42.
Cicinelli P, Traversa R, Oliveri M, Palmieri MG, Filippi MM, Pasqualetti P,
Rossini PM. Intracortical excitatory and inhibitory phenomena to paired
transcranial magnetic stimulation in healthy human subjects: differences
between the right and left hemisphere. Neurosci Lett 2000;288:171–4.
Civardi C, Cavalli A, Naldi P, Varrasi C, Cantello R. Hemispheric
asymmetries of cortico-cortical connections in human hand motor
areas. Clin Neurophysiol 2000;111:624–9.
Di Lazzaro V, Restuccia D, Oliviero A, Profice P, Ferrara L, Insola A,
Mazzone P, Tonali P, Rothwell JC. Magnetic transcranial stimulation at
intensities below active motor threshold activates intracortical inhibi-
tory circuits. Exp Brain Res 1998;119:265–8.
Di Lazzaro V, Oliviero A, Meglio M, Cioni B, Tamburrini G, Tonali P,
Rothwell JC. Direct demonstration of the effect of lorazepam on the
excitability of the human motor cortex. Clin Neurophysiol 2000;111:
794–9.
Domann R, Hagemann G, Kraemer M, Freund H-J, Witte OW.
Electrophysiological changes in the surrounding brain tissue of
photochemically induced cortical infarcts in the rat. Neurosci Lett
1993;155:69–72.
Fisher RJ, Nakamura Y, Bestmann S, Rothwell JC, Bostock H. Two phases
of intracortical inhibition revealed by transcranial magnetic threshold
tracking. Exp Brain Res 2002;143:240–8.
Fuhr P, Agostino R, Hallett M. Spinal motor neuron excitability during the
silent period after cortical stimulation. Electroenceph clin Neurophysiol
1991;81:257–62.
Goldstein LB. Potential effects of common drugs on stroke recovery. Arch
Neurol 1998;55:454–6.
Habib M, Robichon F, Levrier O, Khalil R, Salamon G. Diverging
asymmetries of temporo-parietal cortical areas: a reappraisal of
Geschwind/Galaburda theory. Brain Lang 1995;48:238–58.
Hagemann G, Redecker C, Neumann-Haefelin T, Freund H-J, Witte O.
Increased long-term potentiation in the surround of experimentally
induced focal cortical infarction. Ann Neurol 1998;44:255–8.
Hallett M. Transcranial magnetic stimulation. Negative effects. Adv Neurol
1995;67:107–13.
Hammond G. Correlates of human handedness in primary motor
cortex: a review and hypothesis. Neurosci Biobehav Rev 2002;26:
285–92.
Hanajima R, Ugawa Y, Terao Y, Enomoto H, Shiio Y, Mochizuki H,
Furubayashi T, Uesugi H, Iwata NK, Kanazawa I. Mechanisms of
intracortical I-wave facilitation elicited with paired-pulse magnetic
stimulation in humans. J Physiol 2002;538:253–61.
Hernandez TD, Schallert T. Long-term impairment of behavioral
recovery from cortical damage can be produced by short-term
GABA-agonist infusion into adjacent cortex. Restor Neurol Neurosci
1990;1:323–30.
Hess G, Donoghue JP. Long-term potentiation of horizontal connections
provides a mechanism to reorganize cortical motor maps.
J Neurophysiol 1994;71:2543–7.
T.V. Ilic et al. / Clinical Neurophysiology 115 (2004) 330–340 339

Hess G, Aizenman CD, Donoghue JP. Conditions for the induction of long-
term potentiation in layer II/III horizontal connections of the rat motor
cortex. J Neurophysiol 1996;75:1765–78.
Ilic TV, Meintzschel F, Cleff U, Ruge D, Kessler KR, Ziemann U. Short-
interval paired-pulse inhibition and facilitation of human motor cortex:
the dimension of stimulus intensity. J Physiol 2002;545.1:153–67.
Inghilleri M, Berardelli A, Cruccu G, Manfredi M. Silent period evoked by
transcranial stimulation of the human cortex and cervicomedullary
junction. J Physiol (Lond) 1993;466:521–34.
Jones EG. GABAergic neurons and their role in cortical plasticity in
primates. Cereb Cortex 1993;3:361–72.
Kaneko K, Kawai S, Fuchigami Y, Morita H, Ofuji A. The effect of current
direction induced by transcranial magnetic stimulation on the
corticospinal excitability in human brain. Electroenceph clin Neuro-
physiol 1996;101:478–82.
Keller A. Intrinsic synaptic organization of the motor cortex. Cereb Cortex
1993;3:430–41.
Kubota K. Motor cortical muscimol injection disrupts forelimb movement
in freely moving monkeys. NeuroReport 1996;7:2379–84.
Kujirai T, Caramia MD, Rothwell JC, Day BL, Thompson PD, Ferbert A,
Wroe S, Asselman P, Marsden CD. Corticocortical inhibition in human
motor cortex. J Physiol (Lond) 1993;471:501–19.
LeMay M. Left-right dissymmetry, handedness. Am J Neuroradiol 1992;
13:493–504.
Levy LM, Hallett M. Impaired brain GABA in focal dystonia. Ann Neurol
2002;51:93–101.
Macdonell RA, Shapiro BE, Chiappa KH, Helmers SL, Cros D, Day BJ,
Shahani BT. Hemispheric threshold differences for motor evoked
potentials produced by magnetic coil stimulation. Neurology 1991;41:
1441–4.
Maeda F, Gangitano M, Thall M, Pascual-Leone A. Inter- and intra-
individual variability of paired-pulse curves with transcranial magnetic
stimulation (TMS). Clin Neurophysiol 2002;113:376–82.
Matsumura M, Sawaguchi T, Oishi T, Ueki K, Kubota K. Behavioral
deficits induced by local injection of bicuculline and muscimol into the
primate motor and premotor cortex. J Neurophysiol 1991;65:1542–53.
Matsumura M, Sawaguchi T, Kubota K. GABAergic inhibition of neuronal
activity in the primate motor and premotor cortex during voluntary
movement. J Neurophysiol 1992;68:692–702.
McCormick DA. GABA as an inhibitory neurotransmitter in human
cerebral cortex. J Neurophysiol 1989;62:1018–27.
Mills KR, Nithi KA. Corticomotor threshold to magnetic stimulation:
normal values and repeatability. Muscle Nerve 1997;20:570–6.
Nakamura H, Kitagawa H, Kawaguchi Y, Tsuji H. Intracortical facilitation
and inhibition after transcranial magnetic stimulation in conscious
humans. J Physiol (Lond) 1997;498:817–23.
Netz J, Ziemann U, Homberg V. Hemispheric asymmetry of transcallosal
inhibition in man. Exp Brain Res 1995;104:527–33.
Oldfield RC. The assessment and analysis of handedness: the Edinburgh
inventory. Neuropsychologia 1971;9:97–113.
Olsen RW, Avoli M. GABA and epileptogenesis. Epilepsia 1997;38:
399–407.
Priori A, Oliviero A, Donati E, Callea L, Bertolasi L, Rothwell JC. Human
handedness and asymmetry of the motor cortical silent period. Exp
Brain Res 1999;128:390–6.
Reynolds C, Ashby P. Inhibition in the human motor cortex is reduced just
before a voluntary contraction. Neurology 1999;53:730–5.
Ridding MC, Sheean G, Rothwell JC, Inzelberg R, Kujirai T. Changes in
the balance between motor cortical excitation and inhibition in focal,
task specific dystonia. J Neurol Neurosurg Psychiatry 1995a;59:493–8.
Ridding MC, Taylor JL, Rothwell JC. The effect of voluntary contraction
on cortico-cortical inhibition in human motor cortex. J Physiol (Lond)
1995b;487:541–8.
Rossini PM, Barker AT, Berardelli A, Caramia MD, Caruso G, Cracco RQ,
Dimitrijevic MR, Hallett M, Katayama Y, Lucking CH, Maertens de
Noordhout AL, Marsden CD, Murray NMF, Rothwell JC, Swash M,
Tomberg C. Non-invasive electrical and magnetic stimulation of the
brain, spinal cord and roots: basic principles and procedures for routine
clinical application. Report of an IFCN committee. Electroenceph clin
Neurophysiol 1994;91:79–92.
Schallert T, Hernandez TD, Barth TM. Recovery of function after brain
damage: severe and chronic disruption by diazepam. Brain Res 1986;
379:104–11.
Schieber MH, Poliakov AV. Partial inactivation of the primary motor
cortex hand area: effects on individuated finger movements. J Neurosci
1998;18:9038–54.
Semmler JG, Nordstrom MA. Hemispheric differences in motor cortex
excitability during a simple index finger abduction task in humans.
J Neurophysiol 1998;79:1246–54.
Siebner HR, Tormos JM, Ceballos-Baumann AO, Auer C, Catala MD,
Conrad B, Pascual-Leone A. Low-frequency repetitive transcranial
magnetic stimulation of the motor cortex in writer’s cramp. Neurology
1999;52:529–37.
Sommer M, Ruge D, Tergau F, Beuche W, Altenmuller E, Paulus W.
Intracortical excitability in the hand motor representation in hand
dystonia and blepharospasm. Mov Disord 2002;17:1017–25.
Stefan K, Kunesch E, Benecke R, Cohen LG, Classen J. Mechanisms of
enhancement of human motor cortex excitability induced by interven-
tional paired associative stimulation. J Physiol 2002;543:699–708.
Tegenthoff M, Witscher K, Schwenkreis P, Liepert J. Pharmacological
modulation of training-induced plastic changes in human motor cortex.
Electroenceph clin Neurophysiol Suppl 1999;51:188–96.
Tokimura H, Ridding MC, Tokimura Y, Amassian VE, Rothwell JC. Short
latency facilitation between pairs of threshold magnetic stimuli applied
to human motor cortex. Electroenceph clin Neurophysiol 1996;101:
263–72.
Triggs WJ, Calvanio R, Macdonell RA, Cros D, Chiappa KH. Physiological
motor asymmetry in human handedness: evidence from transcranial
magnetic stimulation. Brain Res 1994;636:270–6.
Triggs WJ, Calvanio R, Levine M. Transcranial magnetic stimulation
reveals a hemispheric asymmetry correlate of intermanual differences
in motor performance. Neuropsychologia 1997;35:1355–63.
Volkmann J, Schnitzler A, Witte OW, Freund H. Handedness and
asymmetry of hand representation in human motor cortex.
J Neurophysiol 1998;79:2149–54.
Werhahn KJ, Kunesch E, Noachtar S, Benecke R, Classen J. Differential
effects on motorcortical inhibition induced by blockade of GABA
uptake in humans. J Physiol (Lond) 1999;517:591–7.
Wilson SA, Lockwood RJ, Thickbroom GW, Mastaglia FL. The muscle
silent period following transcranial magnetic cortical stimulation.
J Neurol Sci 1993;114:216–22.
Ziemann U, Hallett M. Hemispheric asymmetry of ipsilateral motor cortex
activation during unimanual motor tasks: further evidence for motor
dominance. Clin Neurophysiol 2001;112:107–13.
Ziemann U, Lonnecker S, Steinhoff BJ, Paulus W. The effect of lorazepam
on the motor cortical excitability in man. Exp Brain Res 1996a;109:
127–35.
Ziemann U, Lonnecker S, Steinhoff BJ, Paulus W. Effects of antiepileptic
drugs on motor cortex excitability in humans: a transcranial magnetic
stimulation study. Ann Neurol 1996b;40:367–78.
Ziemann U, Rothwell JC, Ridding MC. Interaction between intracortical
inhibition and facilitation in human motor cortex. J Physiol (Lond)
1996c;496:873–81.
Ziemann U, Tergau F, Wassermann EM, Wischer S, Hildebrandt J, Paulus
W. Demonstration of facilitatory I-wave interaction in the human motor
cortex by paired transcranial magnetic stimulation. J Physiol (Lond)
1998;511:181–90.
Ziemann U, Muellbacher W, Hallett M, Cohen LG. Modulation of practice-
dependent plasticity in human motor cortex. Brain 2001;124:1171–81.
Zoghi M, Pearce SL, Nordstrom MA. Differential modulation of
intracortical inhibition in human motor cortex during selective
activation of an intrinsic hand muscle. J Physiol 2003;550:933–46.
T.V. Ilic et al. / Clinical Neurophysiology 115 (2004) 330–340340


