Embed Size (px)
Citation preview
This summary aims to give you an overview of the information contained in this prospectus.
As this is a summary, it does not contain all the information that may be important to you. You
should read the whole document before you decide to invest in the Offer Shares.
There are risks associated with any investment. Some of the particular risks in investing in the
Offer Shares are set out in “Risk Factors” in this prospectus. You should read that section carefully
before you decide to invest in the Offer Shares.
OVERVIEW
We are the world’s largest telecommunications tower infrastructure service provider. As of
March 31, 2018, we operated and managed 1,886,454 sites and served 2,733,500 tenants. According
to the F&S Report, in and as of December 31, 2017, we ranked first among the global
telecommunications tower infrastructure service providers in terms of the number of sites, the number
of tenants, and revenue. According to the F&S Report, our market share in the PRC
telecommunications tower infrastructure industry was 96.3% in terms of the number of sites and
97.3% in terms of revenue in and as of December 31, 2017. We are an indispensable driving force in
the implementation of China’s strategy of building strength in cyberspace (the “Cyber Power”
strategy).
Our nationwide site resources allow us to have the most competitive position in the PRC market.
As of March 31, 2018, our sites were spread across 31 provinces, municipalities and autonomous
regions in the PRC, covering all cities and extensive rural areas. According to the F&S Report, we
have an extensive geographic distribution of our sites, which are strategically located in the PRC. Our
site density is relatively greater in the areas with more developed economy and higher density of
wireless communications users.
BUSINESS MODEL
We are primarily engaged in the following businesses:
• Tower business: Using our sites, we carry out macro cell and small cell businesses with
telecommunications service providers (“TSPs”).
— Macro cell business: We provide site space, including towers and shelters or cabinets,
to TSPs and to host their antennas and other macro cell equipment. Through macro
cell business, we support TSPs to achieve the extensive coverage of their wireless
communications networks in the PRC.
— Small cell business: We provide site space, including towers, poles, other
infrastructure resources and cabinets, to TSPs and to host their small cell equipment.
Through small cell business, we support TSPs to densify the coverage and increase the
capacity of the wireless communications networks built up by their macro cell
equipment, particularly in urban areas with high density of population and buildings
and certain non-urban areas.
SUMMARY
— 1 —
• DAS business: We provide indoor distributed antenna systems to TSPs and to attach their
telecommunications equipment. Through our DAS business, we support TSPs to achieve the
in-depth coverage of wireless communications networks in buildings and tunnels.
• Trans-sector site application and information business (“TSSAI” business): Using our sites
dispersed nationwide, we provide site resource services, including our infrastructure,
maintenance services and power services, to host different types of devices for our
customers from different industries and support them to build up different types of
nationwide or regional networks. Furthermore, by integrating data collection devices,
transmission networks, data platforms and other resources, we provide site-based
information services, including data collection, transmission, analysis and application.
We primarily conduct tower and DAS businesses with TSPs using our extensive site resources.
In addition to offering site space to TSPs, we provide them ancillary equipment, maintenance services
and power services at our sites. Given the vast territory with complex geographical features and
various wireless communications coverage requirements, we use different solutions for providing our
infrastructure and services under different scenarios to address coverage needs of TSPs. While
maintaining stable and predictable sources of operating revenue and cash flows from these two
businesses, we are also engaged in TSSAI business with customers from different industries to meet
their needs and to enhance our profitability.
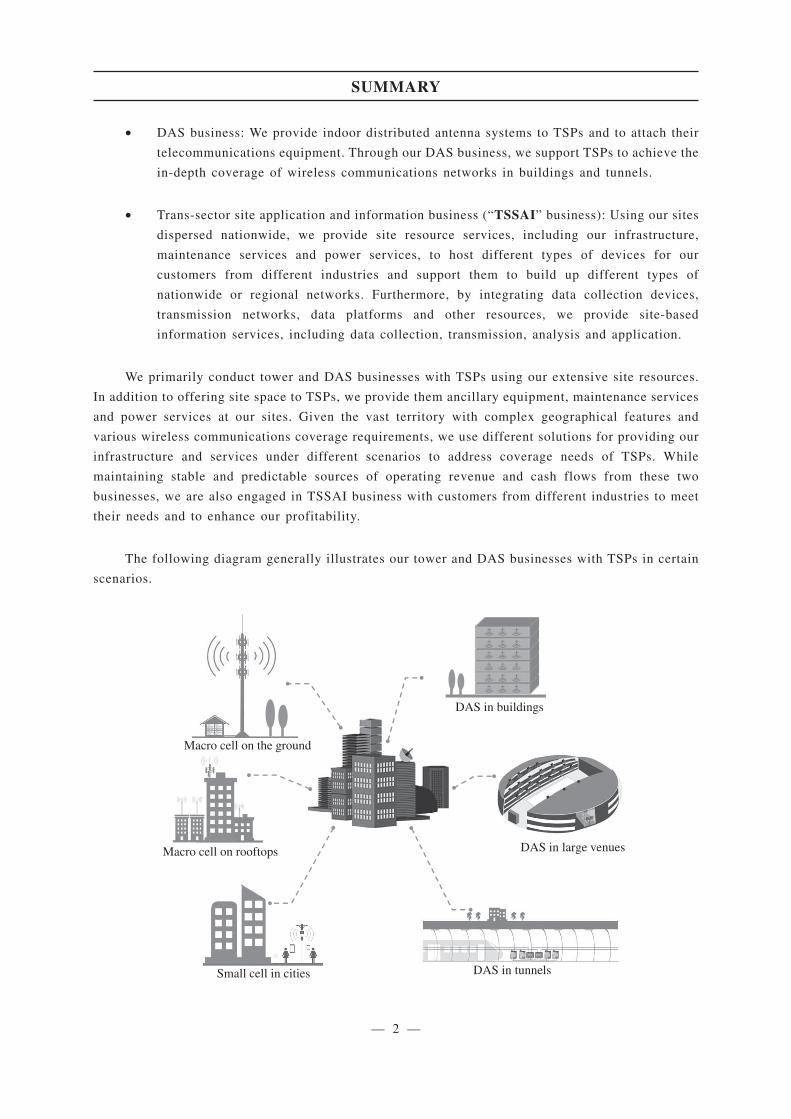
The following diagram generally illustrates our tower and DAS businesses with TSPs in certain
scenarios.
Macro cell on the ground
Macro cell on rooftops
Small cell in cities
DAS in large venues
DAS in tunnels
DAS in buildings
SUMMARY
— 2 —
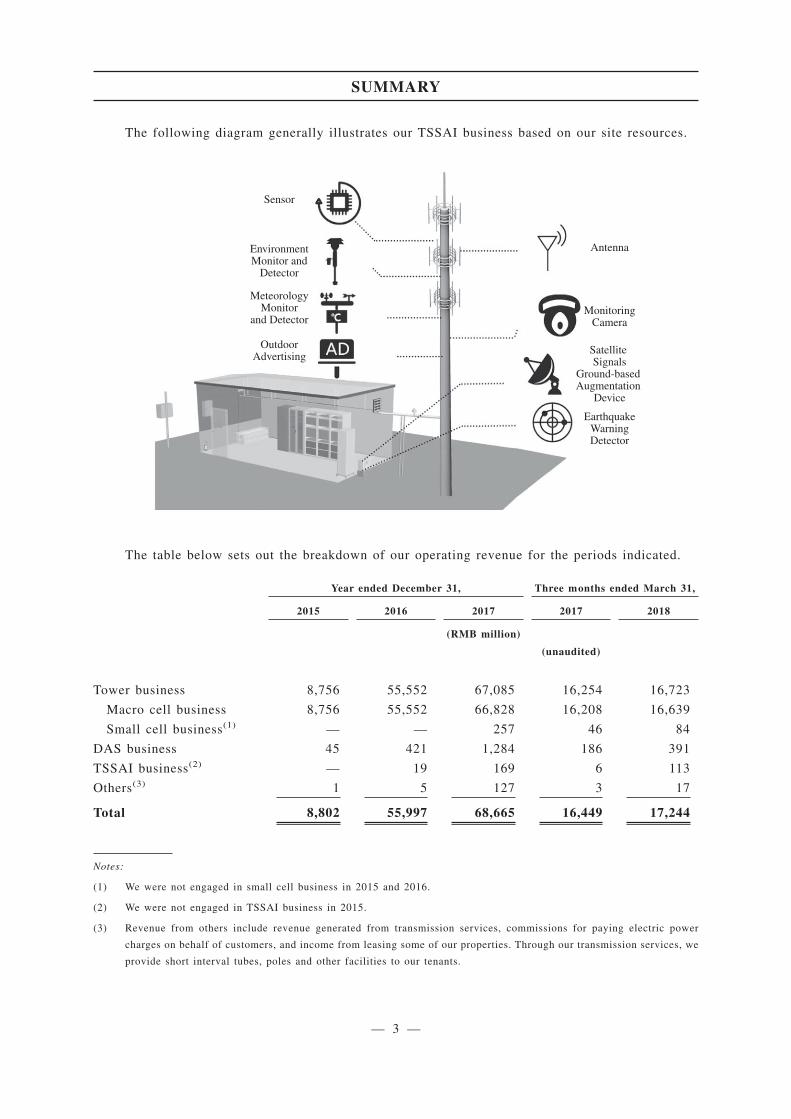
The following diagram generally illustrates our TSSAI business based on our site resources.
Sensor
EnvironmentMonitor and
Detector
MeteorologyMonitor
and Detector
OutdoorAdvertising
Antenna
MonitoringCamera
Satellite Signals
Ground-based Augmentation
Device
EarthquakeWarningDetector
The table below sets out the breakdown of our operating revenue for the periods indicated.
Year ended December 31, Three months ended March 31,
2015 2016 2017 2017 2018
(RMB million)
(unaudited)
Tower business 8,756 55,552 67,085 16,254 16,723
Macro cell business 8,756 55,552 66,828 16,208 16,639
Small cell business(1) — — 257 46 84
DAS business 45 421 1,284 186 391
TSSAI business(2) — 19 169 6 113
Others(3) 1 5 127 3 17
Total 8,802 55,997 68,665 16,449 17,244
Notes:
(1) We were not engaged in small cell business in 2015 and 2016.
(2) We were not engaged in TSSAI business in 2015.
(3) Revenue from others include revenue generated from transmission services, commissions for paying electric power
charges on behalf of customers, and income from leasing some of our properties. Through our transmission services, we
provide short interval tubes, poles and other facilities to our tenants.
SUMMARY
— 3 —
OUR BUSINESS RELATIONSHIPS WITH TSPS AND INCREASING RELEVANCE TO
NON-TELECOM INDUSTRIES
TSPs primarily provide wireless communications, fixed communications and Internet access
services to telecommunications users in the PRC. TSPs provide their wireless communications
networks for users to access and use wireless communications services. To do this, TSPs require sites
for hosting telecommunications equipment and building out their wireless communications networks.
TSPs have historically acquired, constructed and maintained the sites by themselves. To alleviate the
burden of capital expenditures and with a view to systematically improving their cost position, TSPs
are increasingly opting to use sites and services provided by telecommunications tower infrastructure
service providers, who allow TSPs to share sites and achieve network coverage and expansion through
consolidated site resources. We, as a key supplier of TSPs in the PRC, provide them with site resources
and related services. See “Industry Overview — Overview of the Telecommunications Tower
Infrastructure Industry.”
We are the world’s largest telecommunications tower infrastructure service provider with a
commanding market position in the PRC. As the coordinator of the co-location of telecommunications
tower infrastructure in the PRC, our site resources and services are essential and fundamental to the
nationwide enhancement of 4G network and the future build-out of 5G network by China Mobile,
China Unicom and China Telecom (the “Big Three TSPs”) in the PRC telecommunications market. All
of the Big Three TSPs are global leading TSPs. According to the F&S Report, as of December 31,
2017, their total market share in the PRC wireless communications market was approximately 100%.
The PRC wireless communications market has seen sustainable and rapid development in recent years.
According to the F&S Report, the PRC has the world’s largest wireless communications user base,
which continues to grow, and is expected to reach 1.56 billion in 2022. The wireless communications
data traffic per capita in the PRC increased at a high growth rate from 0.8 GB per year in 2012 to 17.4
GB per year in 2017, representing a CAGR of 85.5%, and is expected to maintain a relatively high
growth from 2017 to 80.5 GB per year in 2022, representing a CAGR of 35.9%. Driven by factors
including the growth in the number of users and data traffic of wireless communications in the PRC
market, from 2017 to 2022, the size of the PRC telecommunications tower infrastructure market is
expected to increase steadily from RMB70.6 billion to RMB109.1 billion, representing a CAGR of
9.1% according to the F&S Report.
Our long-term relationships with the Big Three TSPs are mutually beneficial and complementary.
We consolidate demands from TSPs for their wireless communications coverages and match such
demands with our site resources. Based on the matching result, we can satisfy such demands either by
augmenting our existing sites or by identifying and building new sites. We also offer TSPs integrated
solutions for wireless communications coverage. As we combine and coordinate our macro cell, small
cell and DAS businesses in a specific area, we can support TSPs to broaden their wireless
communications coverages and increase their wireless communications network quality, with
relatively lower costs. We support the Big Three TSPs in the PRC to operate the world’s largest
wireless communications network in terms of the number of base stations, and also benefit from the
rapid development of the wireless communications industry.
SUMMARY
— 4 —
We have entered into long-term agreements with the Big Three TSPs, including the Commercial
Pricing Agreements, the Supplemental Agreements to the Commercial Pricing Agreements and the
Service Agreements. Under these agreements, they agreed to pay us total fee according to payment
schedules and compensations as a result of early termination of the services for their own reasons. For
information on the principal terms of such agreements, see “Connected Transactions — Principal
Services Provided to the Telecom Shareholders — Agreements related to the Principal Services
Provided to the Telecom Shareholders.”
According to the Circular [2014] No. 586, Circular [2016] No. 142, Circular [2017] No. 92 and
Circular [2018] No. 82, the TSPs are in principle required not to build ancillary facilities for base
stations such as towers, and indoor distributed antenna systems at key venues such as subways,
high-speed railways, expressways and transportation hubs, and we shall coordinate the co-location of
telecommunications towers. According to the F&S Report, our preeminent position in the PRC market
allows us to minimize the contract renewal risk, and since replacing a telecommunications tower
infrastructure service provider is costly and it may impact the network coverage, TSPs generally have
a stable business relationship with their existing telecommunications tower infrastructure service
providers. We believe that our quality customers provide solid assurance for predictable and stable
sources of our revenue, and allow us to achieve sustainable growth in our revenue and cash flows,
which will enhance our enterprise value.
In addition, technologies such as IoT, big data and artificial intelligence have been developing
rapidly in the PRC and are driving rapid growth in the demand for informatization in all industries.
In response to this trend and by expanding the scope of our services, improving the value proposition
of our services and addressing needs of customers from different industries, we conduct our TSSAI
business to increase our marginal profit and develop our diverse businesses. During the Track Record
Period, the number of our customers in, and the revenue from, our TSSAI business continued to grow.
The accumulated number of our customers increased from 281 as of December 31, 2016 to 1,758 as
of March 31, 2018, while the number of our tenants increased from 2,169 as of December 31, 2016
to 45,674 as of March 31, 2018. We believe the expansion of our TSSAI business will help us create
new business opportunities and growth areas.
We endeavor to achieve sustainable growth in our business by (i) reinforcing our backbone
business of telecommunications tower infrastructure services, and (ii) further growing our business
through vigorous development of our TSSAI business. Please see “Business — Business Strategies.”
Given the growth prospects of telecommunications tower infrastructure service industry, our
commanding market position, the increasing demands by TSPs in line with the further enhancement
of 4G network and the future build-out of 5G network in the PRC, our long-term and stable
relationships with TSPs, the supports from favorable government policies and the new business
opportunities and growth areas in our TSSAI business, we believe we will continue to grow in, and
benefit from, such sustainable and favorable environment.
SUMMARY
— 5 —
SITE SHARING AND CO-LOCATION
We consistently apply the “sharing” philosophy to guide our business operations and create
growth opportunities. We consolidate demands from TSPs for their wireless communications
coverages and encourage them to share our sites through co-location. To facilitate our site co-location,
we offer attractive co-location discounts to the Big Three TSPs and encourage them to co-locate at our
existing sites or new sites to be built. Co-location by TSPs also allows us to enhance our profitability.
Increasing one additional tenant at a site normally requires lower capital expenditures for
augmentation than those for building a new site. As compared to serving a single tenant, serving
multiple tenants at a site increases our marginal profit, even after the co-location discounts. To further
site sharing, we also provide site resources services and site-based information services to
accommodate diverse needs of customers from different industries. This also helps to expand the
functionality of our sites from serving as telecommunications towers to serving as multi-use towers
with a greater base for sharing. Being proactive to government policy which supports our access to
infrastructure resources, we will be able to further diversify site sources by sharing, and expanding
the functionality of, public utility towers and poles.
PRICING
The prices for our services are determined with reference to our costs, the pricing mechanism as
agreed between us and our major customers and market prices. The detailed pricing mechanism for our
services provided in our tower business and DAS business, including site space, indoor distributed
antenna systems, maintenance services and power services, are prescribed under the Commercial
Pricing Agreements and supplemental agreements thereto entered into between the Company and each
of the Big Three TSPs. Such pricing mechanism was determined after arm’s length negotiations by the
relevant parties during the ordinary and usual course of business of the Company with reference to the
construction cost, maintenance cost, site fee, management cost, operating cost, labor cost and
appropriate profit margin, as applicable, of each service we provide. For more details of the pricing
mechanism for tower and DAS business, see “Connected Transactions — Principal Services Provided
to the Telecom Shareholders — Agreements related to Principal Services Provided to the Telecom
Shareholders.” For services in TSSAI business, the prices are determined by negotiating with
customers with reference to market prices. For more details, see “Business — Pricing.”
OUR CUSTOMERS
Our customers are all based in the PRC, among which the Big Three TSPs are our most important
customers. In conducting our TSSAI business, we have customers from different industries such as
environmental protection, broadcasting and digital television, satellite positioning, energy, marine and
agriculture. With respect to our TSSAI business, the accumulated number of our customers increased
from 281 as of December 31, 2016 to 1,758 as of March 31, 2018.
SUMMARY
— 6 —
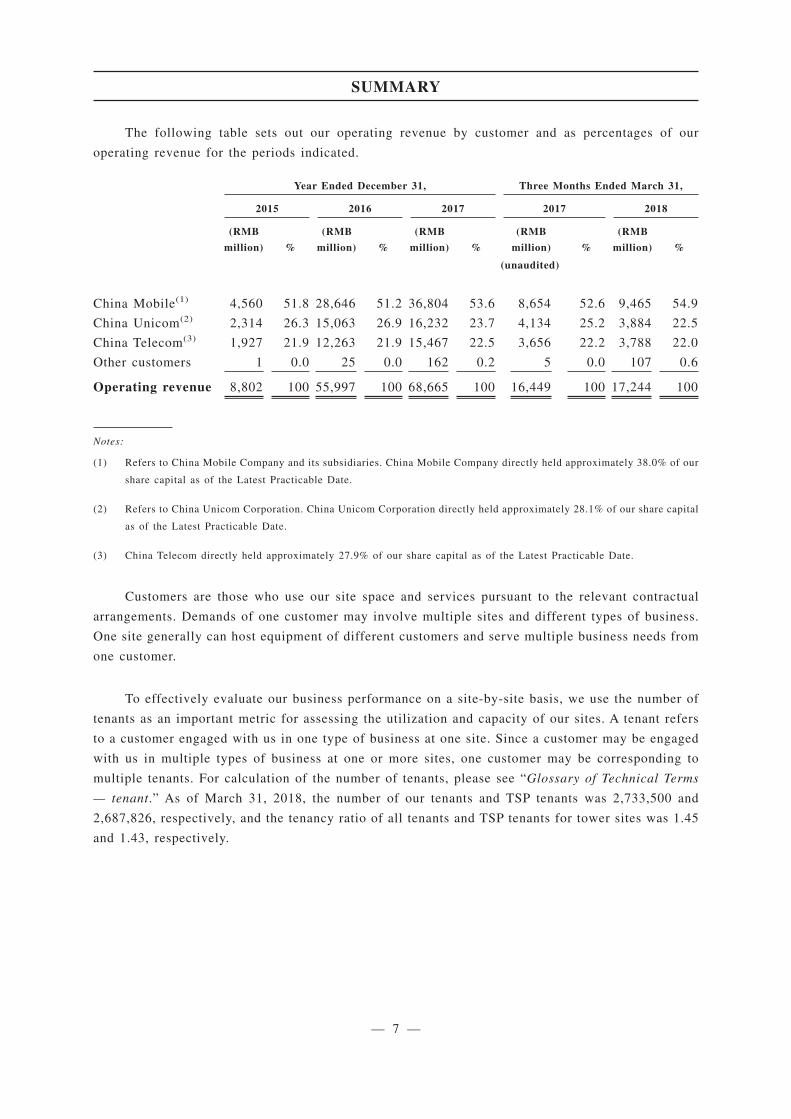
The following table sets out our operating revenue by customer and as percentages of our
operating revenue for the periods indicated.
Year Ended December 31, Three Months Ended March 31,
2015 2016 2017 2017 2018
(RMB
million) %
(RMB
million) %
(RMB
million) %
(RMB
million) %
(RMB
million) %
(unaudited)
China Mobile(1) 4,560 51.8 28,646 51.2 36,804 53.6 8,654 52.6 9,465 54.9
China Unicom(2) 2,314 26.3 15,063 26.9 16,232 23.7 4,134 25.2 3,884 22.5
China Telecom(3) 1,927 21.9 12,263 21.9 15,467 22.5 3,656 22.2 3,788 22.0
Other customers 1 0.0 25 0.0 162 0.2 5 0.0 107 0.6
Operating revenue 8,802 100 55,997 100 68,665 100 16,449 100 17,244 100
Notes:
(1) Refers to China Mobile Company and its subsidiaries. China Mobile Company directly held approximately 38.0% of our
share capital as of the Latest Practicable Date.
(2) Refers to China Unicom Corporation. China Unicom Corporation directly held approximately 28.1% of our share capital
as of the Latest Practicable Date.
(3) China Telecom directly held approximately 27.9% of our share capital as of the Latest Practicable Date.
Customers are those who use our site space and services pursuant to the relevant contractual
arrangements. Demands of one customer may involve multiple sites and different types of business.
One site generally can host equipment of different customers and serve multiple business needs from
one customer.
To effectively evaluate our business performance on a site-by-site basis, we use the number of
tenants as an important metric for assessing the utilization and capacity of our sites. A tenant refers
to a customer engaged with us in one type of business at one site. Since a customer may be engaged
with us in multiple types of business at one or more sites, one customer may be corresponding to
multiple tenants. For calculation of the number of tenants, please see “Glossary of Technical Terms
— tenant.” As of March 31, 2018, the number of our tenants and TSP tenants was 2,733,500 and
2,687,826, respectively, and the tenancy ratio of all tenants and TSP tenants for tower sites was 1.45
and 1.43, respectively.
SUMMARY
— 7 —
As far as our Directors are aware of, during the Track Record Period, save for the three Telecom
Shareholders, neither the Directors, their respective associates, nor any Shareholders who own more
than 5% of our issued shares to the best knowledge of the Directors, had any interest in any of our
five largest customers.
PROCUREMENT AND SUPPLIERS
We established an online procurement platform that features e-commerce and a “one click to
serve nationwide” function (the “E-procurement platform”). Our E-procurement platform covers
materials and services required in our construction, operation and management. The materials we
procure mainly include construction materials for towers and shelters, ancillary equipment, power
supply equipment, air conditioners and distributed antenna systems. In addition, we primarily procure
construction design and field services, including site inspection, survey, supervision, construction and
maintenance on sites. For materials and services that are not suitable for purchasing through our
E-procurement platform and large-scale construction projects for which the procurement procedures
are stipulated under PRC laws and regulations, we conduct procurement through a conventional
bidding and quoting process and manage the whole process of such procurement through our IT
system.
Procurements from our five largest suppliers accounted for approximately 12.9%, 14.5%, 18.2%
and 21.4% of our total procurement expenditures and expenses in 2015, 2016 and 2017 and the three
months ended March 31, 2018, respectively, while purchases from the largest supplier accounted for
approximately 9.4%, 8.3%, 12.4% and 13.7% of our total procurement expenditures and expenses in
2015, 2016 and 2017 and the three months ended March 31, 2018, respectively. Procurement
expenditures and expenses represent (i) the addition of property, plant and equipment, land use right
and software in our statements of balance sheet on accrual basis, and (ii) site operating lease charges,
repairs and maintenance and other operating expenses, which are expensed as incurred and recorded
in our statements of comprehensive income on accrual basis. As our suppliers, Telecom Group
Companies and their respective associates provide materials, property leasing, telecommunications
services as well as design, supervision, construction, maintenance services and power generation
services to us and were among the five largest suppliers respectively in 2015, 2016 and 2017 and the
three months ended March 31, 2018. In addition, we purchased batteries and telecommunications
equipment from other suppliers during the Track Record Period.
COMPETITION
According to the F&S Report, as of December 31, 2017, there were over 200 companies
providing telecommunications tower infrastructure services and competing in the PRC
telecommunications tower infrastructure industry, of which less than ten companies each owned more
SUMMARY
— 8 —
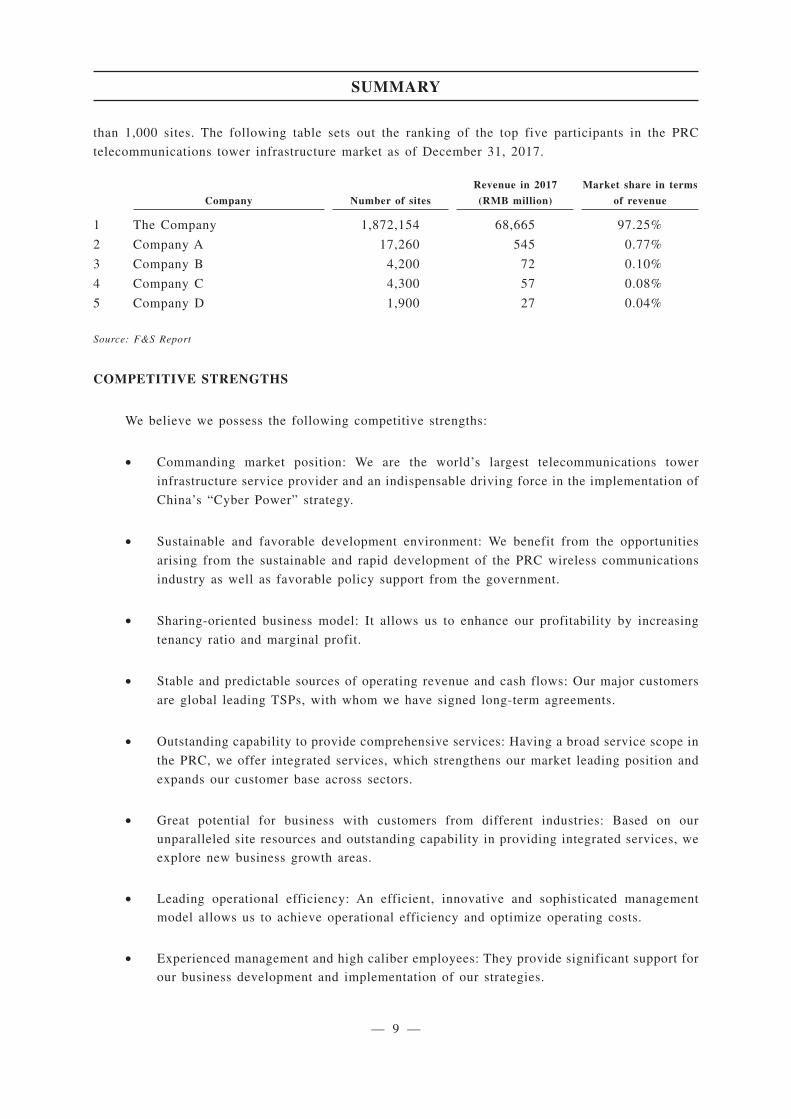
than 1,000 sites. The following table sets out the ranking of the top five participants in the PRC
telecommunications tower infrastructure market as of December 31, 2017.
Company Number of sites
Revenue in 2017
(RMB million)
Market share in terms
of revenue
1 The Company 1,872,154 68,665 97.25%
2 Company A 17,260 545 0.77%
3 Company B 4,200 72 0.10%
4 Company C 4,300 57 0.08%
5 Company D 1,900 27 0.04%
Source: F&S Report
COMPETITIVE STRENGTHS
We believe we possess the following competitive strengths:
• Commanding market position: We are the world’s largest telecommunications tower
infrastructure service provider and an indispensable driving force in the implementation of
China’s “Cyber Power” strategy.
• Sustainable and favorable development environment: We benefit from the opportunities
arising from the sustainable and rapid development of the PRC wireless communications
industry as well as favorable policy support from the government.
• Sharing-oriented business model: It allows us to enhance our profitability by increasing
tenancy ratio and marginal profit.
• Stable and predictable sources of operating revenue and cash flows: Our major customers
are global leading TSPs, with whom we have signed long-term agreements.
• Outstanding capability to provide comprehensive services: Having a broad service scope in
the PRC, we offer integrated services, which strengthens our market leading position and
expands our customer base across sectors.
• Great potential for business with customers from different industries: Based on our
unparalleled site resources and outstanding capability in providing integrated services, we
explore new business growth areas.
• Leading operational efficiency: An efficient, innovative and sophisticated management
model allows us to achieve operational efficiency and optimize operating costs.
• Experienced management and high caliber employees: They provide significant support for
our business development and implementation of our strategies.
SUMMARY
— 9 —
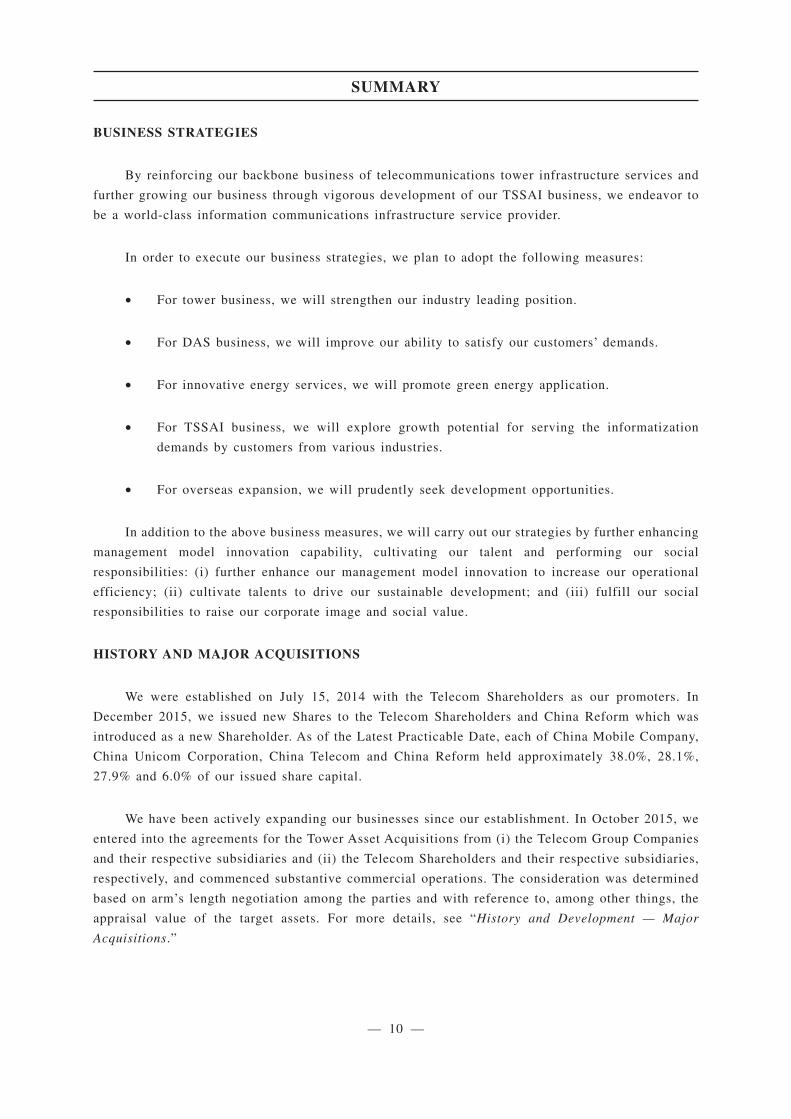
BUSINESS STRATEGIES
By reinforcing our backbone business of telecommunications tower infrastructure services and
further growing our business through vigorous development of our TSSAI business, we endeavor to
be a world-class information communications infrastructure service provider.
In order to execute our business strategies, we plan to adopt the following measures:
• For tower business, we will strengthen our industry leading position.
• For DAS business, we will improve our ability to satisfy our customers’ demands.
• For innovative energy services, we will promote green energy application.
• For TSSAI business, we will explore growth potential for serving the informatization
demands by customers from various industries.
• For overseas expansion, we will prudently seek development opportunities.
In addition to the above business measures, we will carry out our strategies by further enhancing
management model innovation capability, cultivating our talent and performing our social
responsibilities: (i) further enhance our management model innovation to increase our operational
efficiency; (ii) cultivate talents to drive our sustainable development; and (iii) fulfill our social
responsibilities to raise our corporate image and social value.
HISTORY AND MAJOR ACQUISITIONS
We were established on July 15, 2014 with the Telecom Shareholders as our promoters. In
December 2015, we issued new Shares to the Telecom Shareholders and China Reform which was
introduced as a new Shareholder. As of the Latest Practicable Date, each of China Mobile Company,
China Unicom Corporation, China Telecom and China Reform held approximately 38.0%, 28.1%,
27.9% and 6.0% of our issued share capital.
We have been actively expanding our businesses since our establishment. In October 2015, we
entered into the agreements for the Tower Asset Acquisitions from (i) the Telecom Group Companies
and their respective subsidiaries and (ii) the Telecom Shareholders and their respective subsidiaries,
respectively, and commenced substantive commercial operations. The consideration was determined
based on arm’s length negotiation among the parties and with reference to, among other things, the
appraisal value of the target assets. For more details, see “History and Development — Major
Acquisitions.”
SUMMARY
— 10 —
OUR SINGLE LARGEST SHAREHOLDER
As of the Latest Practicable Date, China Mobile Company, directly held 38.0% of our share
capital. Immediately following the completion of the Global Offering, China Mobile Company will
directly hold 28.5% of our share capital (assuming the Over-allotment Option is not exercised) and
remain as our single largest Shareholder, and CMCC will remain as our ultimate single largest
Shareholder.
To the best knowledge of the Company, CMCC does not directly or indirectly hold 10% or more
equity interest in any other company which is principally engaged in a business similar to the principal
business of the Company.
KEY OPERATIONAL AND FINANCIAL DATA
The following tables sets out our summary consolidated financial information for the year ended
December 31, 2015, 2016 and 2017. We have derived this summary from our financial information set
forth in “Appendix I — Accountant’s Report” and “Financial Information.” You should read this
summary in conjunction with our financial information set out in “Appendix I — Accountant’s Report,”
including the accompanying notes, and the information set out in “Financial Information.”
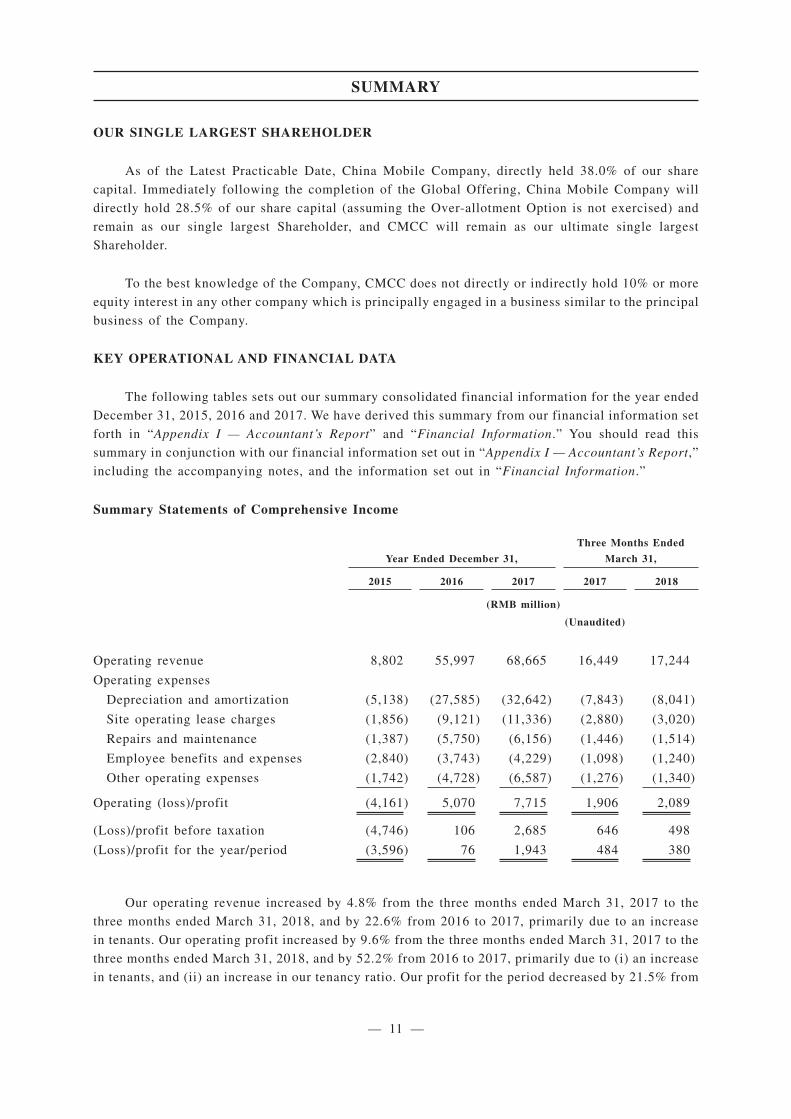
Summary Statements of Comprehensive Income
Year Ended December 31,
Three Months Ended
March 31,
2015 2016 2017 2017 2018
(RMB million)
(Unaudited)
Operating revenue 8,802 55,997 68,665 16,449 17,244
Operating expenses
Depreciation and amortization (5,138) (27,585) (32,642) (7,843) (8,041)
Site operating lease charges (1,856) (9,121) (11,336) (2,880) (3,020)
Repairs and maintenance (1,387) (5,750) (6,156) (1,446) (1,514)
Employee benefits and expenses (2,840) (3,743) (4,229) (1,098) (1,240)
Other operating expenses (1,742) (4,728) (6,587) (1,276) (1,340)
Operating (loss)/profit (4,161) 5,070 7,715 1,906 2,089
(Loss)/profit before taxation (4,746) 106 2,685 646 498
(Loss)/profit for the year/period (3,596) 76 1,943 484 380
Our operating revenue increased by 4.8% from the three months ended March 31, 2017 to the
three months ended March 31, 2018, and by 22.6% from 2016 to 2017, primarily due to an increase
in tenants. Our operating profit increased by 9.6% from the three months ended March 31, 2017 to the
three months ended March 31, 2018, and by 52.2% from 2016 to 2017, primarily due to (i) an increase
in tenants, and (ii) an increase in our tenancy ratio. Our profit for the period decreased by 21.5% from
SUMMARY
— 11 —
the three months ended March 31, 2017 to the three months ended March 31, 2018, primarily due to
increased finance costs. Our profit for the year increased significantly from 2016 to 2017, primarily
due to increased operating profit and the lower portion of finance costs as percentage of our operating
profit in 2017.
From 2015 to 2016, our operating revenue increased significantly, and both operating profit and
profit for the year turned positive. The results of operations in 2015 are not directly comparable to
those of 2016 and 2017, because our revenue for the year ended December 31, 2015 was primarily
generated from the operations carried out in November and December, and the costs and expenses
associated therewith were also primarily incurred in such two-month period. For more detailed
discussion of our results of operations and other financial information, see “Financial Information.”
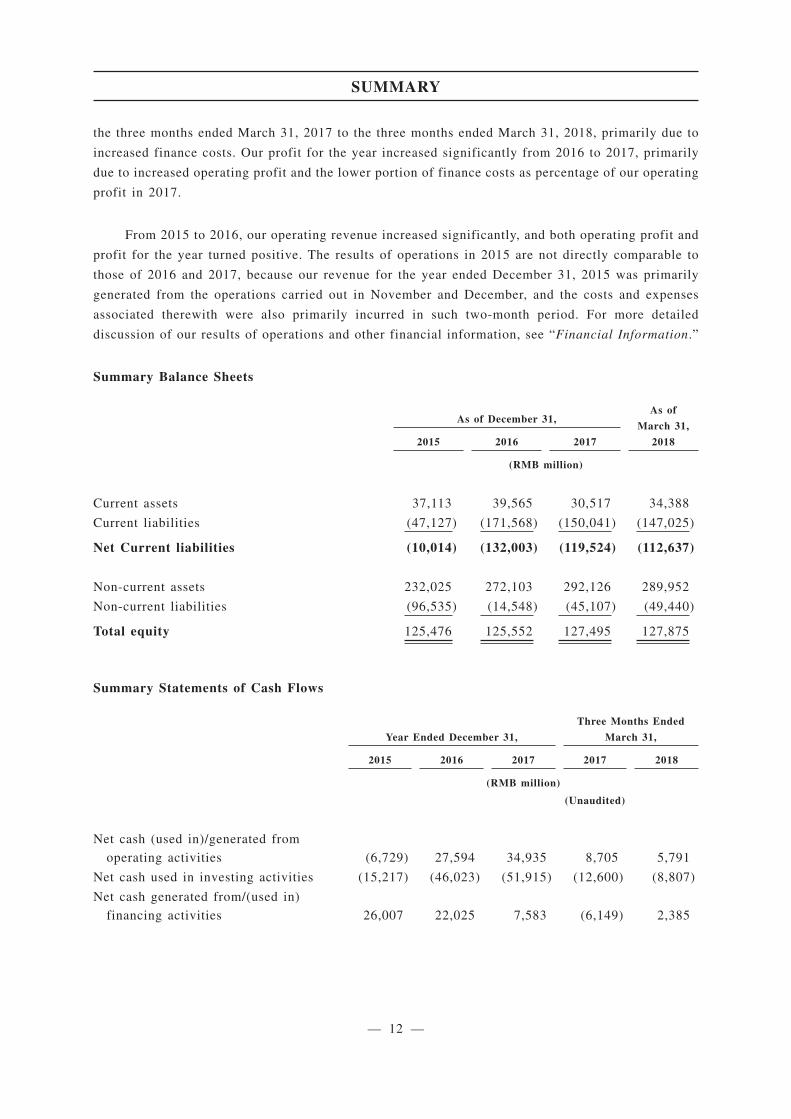
Summary Balance Sheets
As of December 31,As of
March 31,
20182015 2016 2017
(RMB million)
Current assets 37,113 39,565 30,517 34,388
Current liabilities (47,127) (171,568) (150,041) (147,025)
Net Current liabilities (10,014) (132,003) (119,524) (112,637)
Non-current assets 232,025 272,103 292,126 289,952
Non-current liabilities (96,535) (14,548) (45,107) (49,440)
Total equity 125,476 125,552 127,495 127,875
Summary Statements of Cash Flows
Year Ended December 31,
Three Months Ended
March 31,
2015 2016 2017 2017 2018
(RMB million)
(Unaudited)
Net cash (used in)/generated from
operating activities (6,729) 27,594 34,935 8,705 5,791
Net cash used in investing activities (15,217) (46,023) (51,915) (12,600) (8,807)
Net cash generated from/(used in)
financing activities 26,007 22,025 7,583 (6,149) 2,385
SUMMARY
— 12 —
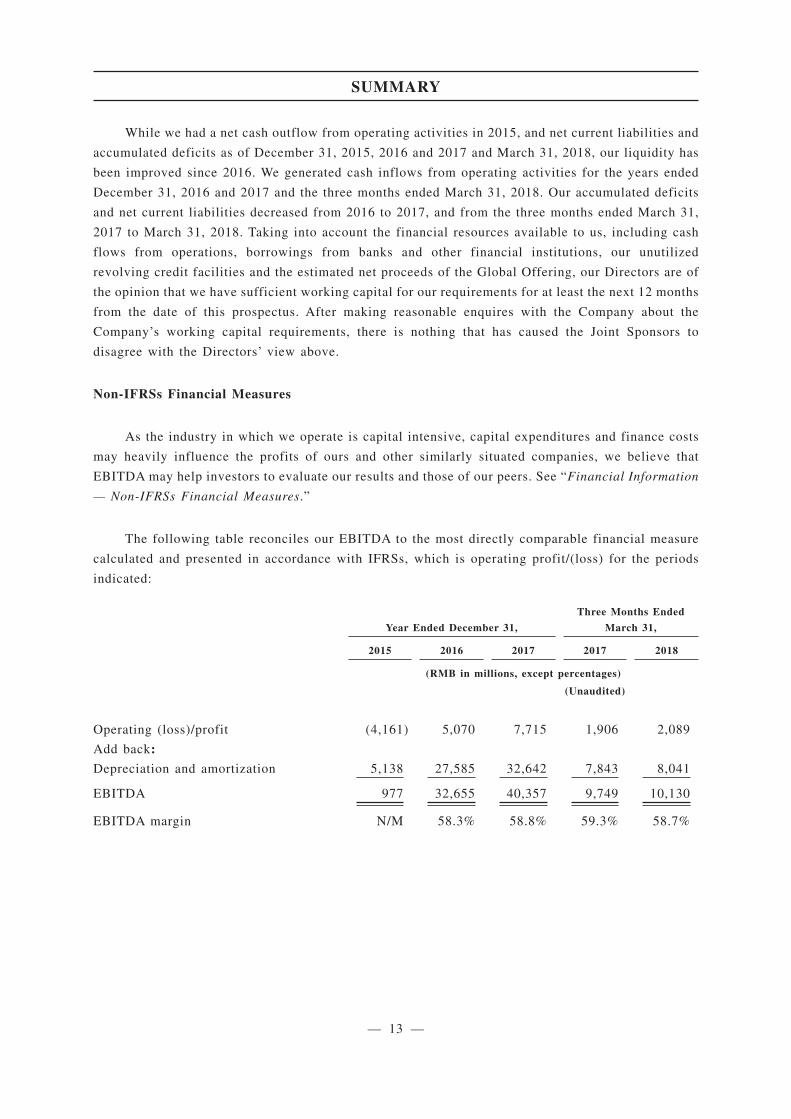
While we had a net cash outflow from operating activities in 2015, and net current liabilities and
accumulated deficits as of December 31, 2015, 2016 and 2017 and March 31, 2018, our liquidity has
been improved since 2016. We generated cash inflows from operating activities for the years ended
December 31, 2016 and 2017 and the three months ended March 31, 2018. Our accumulated deficits
and net current liabilities decreased from 2016 to 2017, and from the three months ended March 31,
2017 to March 31, 2018. Taking into account the financial resources available to us, including cash
flows from operations, borrowings from banks and other financial institutions, our unutilized
revolving credit facilities and the estimated net proceeds of the Global Offering, our Directors are of
the opinion that we have sufficient working capital for our requirements for at least the next 12 months
from the date of this prospectus. After making reasonable enquires with the Company about the
Company’s working capital requirements, there is nothing that has caused the Joint Sponsors to
disagree with the Directors’ view above.
Non-IFRSs Financial Measures
As the industry in which we operate is capital intensive, capital expenditures and finance costs
may heavily influence the profits of ours and other similarly situated companies, we believe that
EBITDA may help investors to evaluate our results and those of our peers. See “Financial Information
— Non-IFRSs Financial Measures.”
The following table reconciles our EBITDA to the most directly comparable financial measure
calculated and presented in accordance with IFRSs, which is operating profit/(loss) for the periods
indicated:
Year Ended December 31,
Three Months Ended
March 31,
2015 2016 2017 2017 2018
(RMB in millions, except percentages)
(Unaudited)
Operating (loss)/profit (4,161) 5,070 7,715 1,906 2,089
Add back:
Depreciation and amortization 5,138 27,585 32,642 7,843 8,041
EBITDA 977 32,655 40,357 9,749 10,130
EBITDA margin N/M 58.3% 58.8% 59.3% 58.7%
SUMMARY
— 13 —
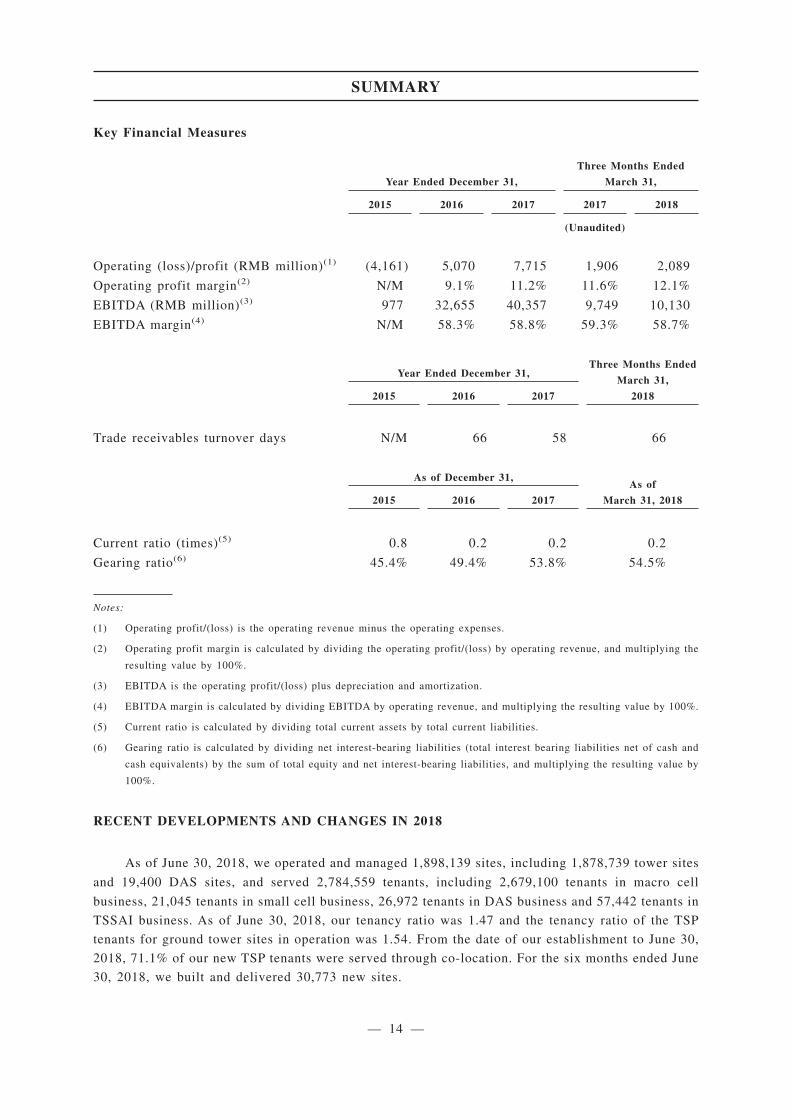
Key Financial Measures
Year Ended December 31,
Three Months Ended
March 31,
2015 2016 2017 2017 2018
(Unaudited)
Operating (loss)/profit (RMB million)(1) (4,161) 5,070 7,715 1,906 2,089
Operating profit margin(2) N/M 9.1% 11.2% 11.6% 12.1%
EBITDA (RMB million)(3) 977 32,655 40,357 9,749 10,130
EBITDA margin(4) N/M 58.3% 58.8% 59.3% 58.7%
Year Ended December 31,Three Months Ended
March 31,
20182015 2016 2017
Trade receivables turnover days N/M 66 58 66
As of December 31,As of
March 31, 20182015 2016 2017
Current ratio (times)(5) 0.8 0.2 0.2 0.2
Gearing ratio(6) 45.4% 49.4% 53.8% 54.5%
Notes:
(1) Operating profit/(loss) is the operating revenue minus the operating expenses.
(2) Operating profit margin is calculated by dividing the operating profit/(loss) by operating revenue, and multiplying the
resulting value by 100%.
(3) EBITDA is the operating profit/(loss) plus depreciation and amortization.
(4) EBITDA margin is calculated by dividing EBITDA by operating revenue, and multiplying the resulting value by 100%.
(5) Current ratio is calculated by dividing total current assets by total current liabilities.
(6) Gearing ratio is calculated by dividing net interest-bearing liabilities (total interest bearing liabilities net of cash and
cash equivalents) by the sum of total equity and net interest-bearing liabilities, and multiplying the resulting value by
100%.
RECENT DEVELOPMENTS AND CHANGES IN 2018
As of June 30, 2018, we operated and managed 1,898,139 sites, including 1,878,739 tower sites
and 19,400 DAS sites, and served 2,784,559 tenants, including 2,679,100 tenants in macro cell
business, 21,045 tenants in small cell business, 26,972 tenants in DAS business and 57,442 tenants in
TSSAI business. As of June 30, 2018, our tenancy ratio was 1.47 and the tenancy ratio of the TSP
tenants for ground tower sites in operation was 1.54. From the date of our establishment to June 30,
2018, 71.1% of our new TSP tenants were served through co-location. For the six months ended June
30, 2018, we built and delivered 30,773 new sites.
SUMMARY
— 14 —
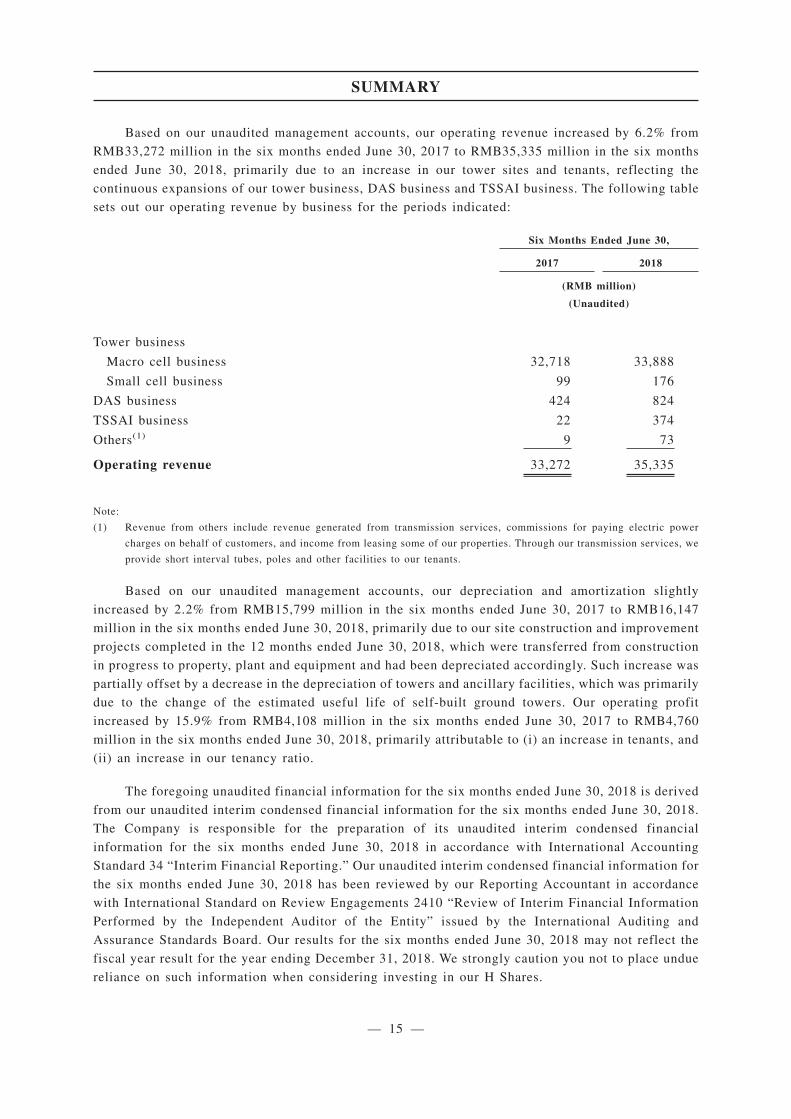
Based on our unaudited management accounts, our operating revenue increased by 6.2% from
RMB33,272 million in the six months ended June 30, 2017 to RMB35,335 million in the six months
ended June 30, 2018, primarily due to an increase in our tower sites and tenants, reflecting the
continuous expansions of our tower business, DAS business and TSSAI business. The following table
sets out our operating revenue by business for the periods indicated:
Six Months Ended June 30,
2017 2018
(RMB million)
(Unaudited)
Tower business
Macro cell business 32,718 33,888
Small cell business 99 176
DAS business 424 824
TSSAI business 22 374
Others(1) 9 73
Operating revenue 33,272 35,335
Note:
(1) Revenue from others include revenue generated from transmission services, commissions for paying electric power
charges on behalf of customers, and income from leasing some of our properties. Through our transmission services, we
provide short interval tubes, poles and other facilities to our tenants.
Based on our unaudited management accounts, our depreciation and amortization slightly
increased by 2.2% from RMB15,799 million in the six months ended June 30, 2017 to RMB16,147
million in the six months ended June 30, 2018, primarily due to our site construction and improvement
projects completed in the 12 months ended June 30, 2018, which were transferred from construction
in progress to property, plant and equipment and had been depreciated accordingly. Such increase was
partially offset by a decrease in the depreciation of towers and ancillary facilities, which was primarily
due to the change of the estimated useful life of self-built ground towers. Our operating profit
increased by 15.9% from RMB4,108 million in the six months ended June 30, 2017 to RMB4,760
million in the six months ended June 30, 2018, primarily attributable to (i) an increase in tenants, and
(ii) an increase in our tenancy ratio.
The foregoing unaudited financial information for the six months ended June 30, 2018 is derived
from our unaudited interim condensed financial information for the six months ended June 30, 2018.
The Company is responsible for the preparation of its unaudited interim condensed financial
information for the six months ended June 30, 2018 in accordance with International Accounting
Standard 34 “Interim Financial Reporting.” Our unaudited interim condensed financial information for
the six months ended June 30, 2018 has been reviewed by our Reporting Accountant in accordance
with International Standard on Review Engagements 2410 “Review of Interim Financial Information
Performed by the Independent Auditor of the Entity” issued by the International Auditing and
Assurance Standards Board. Our results for the six months ended June 30, 2018 may not reflect the
fiscal year result for the year ending December 31, 2018. We strongly caution you not to place undue
reliance on such information when considering investing in our H Shares.
SUMMARY
— 15 —
Pricing Adjustment
In early 2018, after negotiations on arm’s length basis, we entered into a Supplemental
Agreement to the Commercial Pricing Agreement with each of the China Mobile Company, China
Unicom Corporation and China Telecom to amend certain pricing terms of the previous Commercial
Pricing Agreements. The key amendments are the reduction of cost margin and increase of co-location
discount rates for tower business. The Supplemental Agreements to the Commercial Pricing
Agreements have a term of five years and expire on December 31, 2022. Should the above pricing term
changes were made for the whole year of 2017, with other terms remaining unchanged, the operating
revenue of our tower business would have decreased from RMB67,085 million to RMB62,986 million
for the year ended December 31, 2017.
Change of Estimated Useful Life of Self-built Ground Towers
Taking into account the technological improvement, such as the 5G standard implementation, the
favorable government policies related to site protection as well as quality and features of the towers,
the estimated useful life of self-built ground towers (excluding the towers acquired in the Tower Asset
Acquisitions) was adjusted from ten years to 20 years, starting from January 1, 2018. We accounted
for this change of accounting estimates prospectively. Should the above estimated useful life of
self-built ground towers were changed since January 1, 2017, the depreciation expenses of our
self-built ground towers would have decreased from RMB3,878 million to RMB1,865 million for the
year ended December 31, 2017.
Our depreciation and amortization increased from RMB7,843 million in the three months ended
March 31, 2017, to RMB8,041 million in the three months ended March 31, 2018, which was partially
offset by a decrease in the depreciation of towers and ancillary facilities. Specifically, our depreciation
expenses of self-built ground towers decreased by RMB594 million for the three months ended March
31, 2018 due to the change of the estimated useful life of self-built ground towers.
Illustrative Financial Information for 2017
Based on the adjusted pricing and changes of estimated useful lives of self-built ground towers,
assuming all other terms remaining unchanged, we calculated certain important illustrative financial
data for 2017 for illustration purposes. Such information is aimed to assist better evaluation of the
impact of pricing and depreciation on our financial performance. These measures are not prepared
under the IFRSs, and are based on several assumptions, thus you should not regard it as an independent
analysis or an alternative to analysis of the results of operations based on IFRSs. In any event, you
should consider carefully the importance placed on such information. For disclosures of adjusted
pricing and change of estimated useful life of self-built ground towers, see Note 6 and Note 2.1.3 of
“Appendix I — Accountant’s Report.”
SUMMARY
— 16 —
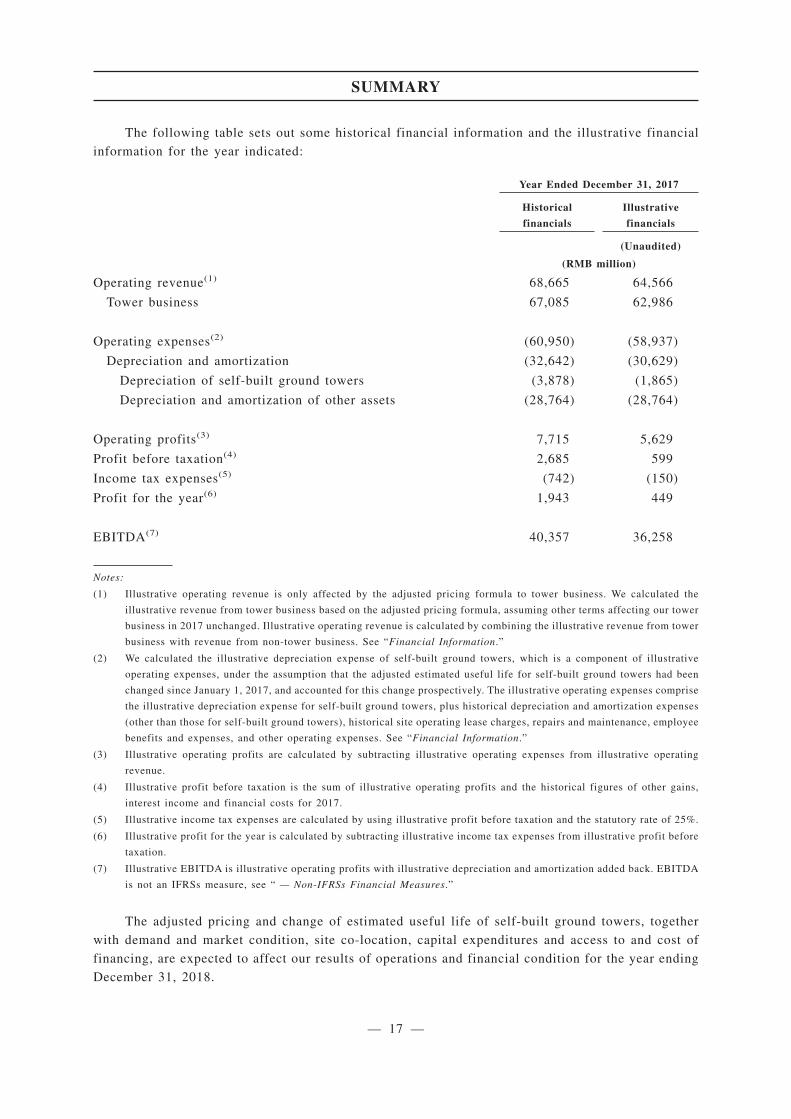
The following table sets out some historical financial information and the illustrative financial
information for the year indicated:
Year Ended December 31, 2017
Historical
financials
Illustrative
financials
(Unaudited)
(RMB million)
Operating revenue(1) 68,665 64,566
Tower business 67,085 62,986
Operating expenses(2) (60,950) (58,937)
Depreciation and amortization (32,642) (30,629)
Depreciation of self-built ground towers (3,878) (1,865)
Depreciation and amortization of other assets (28,764) (28,764)
Operating profits(3) 7,715 5,629
Profit before taxation(4) 2,685 599
Income tax expenses(5) (742) (150)
Profit for the year(6) 1,943 449
EBITDA(7) 40,357 36,258
Notes:
(1) Illustrative operating revenue is only affected by the adjusted pricing formula to tower business. We calculated the
illustrative revenue from tower business based on the adjusted pricing formula, assuming other terms affecting our tower
business in 2017 unchanged. Illustrative operating revenue is calculated by combining the illustrative revenue from tower
business with revenue from non-tower business. See “Financial Information.”
(2) We calculated the illustrative depreciation expense of self-built ground towers, which is a component of illustrative
operating expenses, under the assumption that the adjusted estimated useful life for self-built ground towers had been
changed since January 1, 2017, and accounted for this change prospectively. The illustrative operating expenses comprise
the illustrative depreciation expense for self-built ground towers, plus historical depreciation and amortization expenses
(other than those for self-built ground towers), historical site operating lease charges, repairs and maintenance, employee
benefits and expenses, and other operating expenses. See “Financial Information.”
(3) Illustrative operating profits are calculated by subtracting illustrative operating expenses from illustrative operating
revenue.
(4) Illustrative profit before taxation is the sum of illustrative operating profits and the historical figures of other gains,
interest income and financial costs for 2017.
(5) Illustrative income tax expenses are calculated by using illustrative profit before taxation and the statutory rate of 25%.
(6) Illustrative profit for the year is calculated by subtracting illustrative income tax expenses from illustrative profit before
taxation.
(7) Illustrative EBITDA is illustrative operating profits with illustrative depreciation and amortization added back. EBITDA
is not an IFRSs measure, see “ — Non-IFRSs Financial Measures.”
The adjusted pricing and change of estimated useful life of self-built ground towers, together
with demand and market condition, site co-location, capital expenditures and access to and cost of
financing, are expected to affect our results of operations and financial condition for the year ending
December 31, 2018.
SUMMARY
— 17 —
Save as disclosed above, the Directors have confirmed that, since March 31, 2018, being the date
of the latest audited financial statements of the Company, and up to the date of this prospectus, there
has been no material and adverse change in our financial or trading position, and there has been no
event which could materially affect the information set out in “Appendix I — Accountant’s Report.”
LISTING EXPENSES
Listing expenses represent professional fees, underwriting commission and other fees incurred
in connection with the Listing and the Global Offering. Listing expenses to be borne by us are
estimated to be approximately RMB858.5 million (assuming an Offer Price of HK$1.42 per H Share,
being the mid-point of the Offer Price range stated in this prospectus), of which approximately
RMB843.2 million is directly attributable to the issue of H Shares to the public and to be capitalized,
and the rest has been, or is expected to be reflected in our statements of comprehensive income for
2018. Our Directors do not expect such expenses to materially impact our results of operations for
2018.
USE OF PROCEEDS
We estimate that we will receive net proceeds from the Global Offering of approximately
HK$60,216.0 million (assuming an Offer Price of HK$1.42 per H share, being the mid-point of the
Offer Price range stated in this prospectus) (equivalent to approximately RMB51,336.5 million), after
deducting the underwriting commissions and estimated expenses payable by us in relation to the
Global Offering, and assuming no exercise of the Over-allotment Option.
Our Directors intend to apply the net proceeds from the Global Offering for the following
purposes:
• Approximately 60%, or HK$36,129.6 million, is expected to be used for funding the capital
expenditures on the following activities:
— approximately 51% to 54% is expected to be used on new site construction and
augmentation. In connection with the construction of new tower and DAS sites, such
net proceeds are intended to be primarily used on (i) procurement of towers, shelters
or cabinets and ancillary facilities and construction, design and supervision services
for the construction of new tower sites, and (ii) procurement of passive devices and
leaky cables and construction, design and supervision services for the construction of
new DAS sites. We also intend to use such net proceeds to fund augmentation projects
on our existing sites, primarily including height extension, foundation strengthening
and extension of ground space, to accommodate additional tenants and host more
equipment for the purpose of further enhancing the site co-location and utilization.
— approximately 6% to 9% is expected to be used on ancillary facilities replacement and
improvement. We intend to use such net proceeds to replace and improve the ancillary
facilities of our sites, such as installation or change of smart FSUs, batteries and air
conditioners.
SUMMARY
— 18 —
We incur capital expenditures primarily on (i) new site construction and augmentation,
which were conducted to meet our customers’ increasing demand; (ii) ancillary facilities
replacement and improvement, which primarily include the replacement and improvement
of obsolete ancillary facilities or addition of new facilities, such as installation or change
of smart FSUs, sensors, batteries and air conditioners; (iii) tower and shelter maintenance;
(iv) Tower Asset Acquisitions; and (v) other assets primarily including office buildings,
vehicles and software. The net proceeds from the Global Offering are intended to be used
for funding the new site construction and augmentation and ancillary facilities replacement
and improvement, and will not be used to fund capital expenditures on other activities. The
intended allocation of net proceeds from the Global Offering on capital expenditures is
based on our capital expenditure plan, which was prepared mainly by consolidating the
network build-out plans of TSPs and assessing their overall wireless communications
coverage demands through a communication mechanism with them. Due to our
demand-driven business model, the number and type of sites to be constructed or
augmented are subject to continuous adjustments. See “Industry Overview — Overview of
the PRC Telecommunications Tower Infrastructure Industry — Capital expenditure plans in
respect of the number and type of sites subject to demands from TSP Customers.”
The total amount of net proceeds from the Global Offering to be applied on capital
expenditures is expected to be fully utilized by the end of 2019. In addition to use of the
net proceeds from the Global Offering, we will continue to fund our capital expenditures
through cash flows from operating activities, borrowings from banks and other financial
institutions, and debt and equity financing;
• Approximately 30%, or HK$18,064.8 million, is expected to be used for repaying bank
loans that have been used to fund for capital expenditures and working capital, with the
annual interest rate of which ranges from 4.35% to 4.75%, maturing between 2018 and
2020; and
• Approximately 10%, or HK$6,021.6 million, is expected to be used for funding working
capital and other general corporate purposes.
See “Future Plans and Use of Proceeds.”
DIVIDEND
During the Track Record Period, we did not declare or distribute any dividend. We currently do
not have any pre-determined dividend payout ratio. In order to return capital to our Shareholders in
line with our growth when it is appropriate to do so, we intend to adopt a general dividend policy of
declaring and paying dividends with reference to dividends declared and paid by global
telecommunications tower infrastructure companies, our results of operations, cash flows, financial
condition, operating and capital expenditure requirements, distributable profits as determined under
PRC GAAP or IFRSs (whichever is lower) and other factors that our Directors may consider relevant.
We also intend to adopt in such general dividend policy a dividend payout ratio of no less than 50%
of our annual distributable net profit provided that the aforesaid factors are properly taken into
consideration. We may declare and pay dividends by way of cash or by other means that we consider
SUMMARY
— 19 —
appropriate in the future. Distribution of dividends will be decided by our Board at their discretion
and will be subject to Shareholders’ approval. In any event, we will pay dividends out of our profit
after tax only after having made allocations for, among other things, the recovery of accumulated
losses.
STATISTICS OF GLOBAL OFFERING
The numbers in the following table are based on the assumptions that (i) the Global Offering has
been completed and 43,114,800,000 H Shares are issued and sold in the Global Offering, (ii) the
Over-allotment Option is not exercised, and (iii) 172,459,415,024 Shares are issued following the
completion of the Global Offering.
Based on an Offer Price
of HK$1.26 per
H Share
Based on an Offer Price
of HK$1.58 per
H Share
Market capitalization of H Share after completion of
the Global Offering HK$54,324.6 million HK$68,121.4 million
Unaudited pro forma adjusted consolidated net
tangible assets of the Company attributable to the
owners of the Company per Share(1) HK$1.17 HK$1.26
Note:
(1) The unaudited pro forma adjusted consolidated net tangible assets of the Company attributable to the owners of the
Company per Share was calculated after adjustments as specified in “Appendix II — Unaudited Pro Forma Financial
Information.”
RISK FACTORS
There are certain risks relating to an investment in the Offer Shares. These risks can be
characterized as: (i) risks relating to our business and industry; (ii) risks relating to legal, compliance
and regulatory matters; (iii) risks relating to conducting business in the PRC; and (iv) risks relating
to the Global Offering.
The following are some of the major risks that we face: (i) if demand for telecommunications
tower infrastructure services does not achieve anticipated growth or even decrease, our business and
results of operations would be materially and adversely affected; (ii) our business relies on the Big
Three TSPs as customers; (iii) any difficulties in acquiring, constructing or maintaining sites may
materially and adversely affect our business, financial position and results of operations; (iv) our
ability to obtain and maintain suitable pricing for our services is essential; (v) any interference to our
right to use the land or premises on which our sites are situated may negatively impact our business
and results of operations; (vi) we face challenges in managing and consolidating our
telecommunications tower infrastructure assets; (vii) our business development may require relatively
high level of capital expenditures and we may not be able to obtain financing therefor; (viii) we may
face challenges in developing our small cell and DAS business; (ix) our limited operating history may
affect your ability to evaluate our business and prospects; and (x) natural disasters and other
unforeseen incidents could materially and adversely affect our business.
SUMMARY
— 20 —
PROPERTIES
We have site properties and general properties in the PRC. Our site properties include (i) owned
site properties and (ii) leased site properties/site properties otherwise used by us. Our general
properties, which are normally used as warehouses, staff dormitories and offices, include (i) owned
general properties and (ii) leased general properties.
Our properties consist of several types of site properties with certain title issues. However, we
believe such title issues would not individually and jointly have a material adverse impact on our
business and operations, due to the immateriality of a single site in terms of book value and revenue
contribution, protections from regulations and policies of the PRC and other factors. In addition, we
have also carried out a number of measures in preventing the materialization of the relevant risks,
including (i) setting out requirements and guidances; (ii) establishing IT systems to better manage and
monitor operation data, and setting up an information management committee; (iii) obtaining
government support and policies; (iv) collecting data on property title status and improving the
management and internal control; and (v) including the rectification work in our KPIs.
Our properties are spread across all regions in the PRC and most of them are used as sites. As
part of wireless communications network infrastructure, our sites not only serve general public’s
livelihood, but also are vital to implementing the “Cyber Power” strategy by the PRC government.
Therefore, our sites and their relevant properties are protected by regulations and policies of the PRC
government, including, among other things, the Measures for the Management of Telecommunication
Construction, the Telecommunications Regulations, the Circular [2017] No. 234 and certain normative
documents issued by provincial-level governments for the construction, protection and management of
public telecommunications infrastructure. In practice, the relevant regulations and policies have
facilitated the rectification of the property title issues and promoting settlement in our favour in an
event of dispute.
We believe that the possibility of a large scale of demolition and relocation of our relevant site
properties is relatively low due to (i) their wide distribution across the PRC; (ii) even if a few of our
relevant site properties are subject to the risks of demolition and relocation going forward, we will be
informed ahead of time by our maintenance staff or property providers and will be able to identify
alternatives promptly; and (iii) our general properties are small in number, low in economic value and
highly replaceable. Meanwhile, our PRC Legal Advisor is of the view that the possibility of general
or large-scale demolition and relocation of sites due to title issues is relatively low. For more details
of our properties, regulatory and policy protections and property compliance, see “Business —
Properties.”
SUMMARY
— 21 —
WAIVERS IN RESPECT OF CONTINUING CONNECTED TRANSACTIONS
The Company has conducted certain transactions with entities that will become our connected
persons upon the Listing in its ordinary course of business in the past, and these transactions will
continue after the Listing and will therefore constitute our continuing connected transactions under the
Hong Kong Listing Rules.
The Company provides relevant services of tower products, DAS products, transmission products
and service products to each of the Telecom Shareholders and their respective branches/subsidiaries
pursuant to the Service Framework Agreements, which are among the Company’s principal businesses.
We have applied to the Hong Kong Stock Exchange for, and the Hong Kong Stock Exchange has
granted to us, a waiver from strict compliance with the annual cap requirement under Rule 14A.53 of
the Listing Rules for the transactions above.
For details of the above and other continuing connected transactions of the Company and the
waivers applied for in connection therewith, please see “Connected Transactions” and “Waivers and
Consent under the Hong Kong Listing Rules.”
SUMMARY
— 22 —