Embed Size (px)
Citation preview
Super-Genotype: Global Monoclonality Defies the Oddsof NatureJohannes J. Le Roux1*, Ania M. Wieczorek1, Mark G. Wright2, Carol T. Tran1
1 Department of Tropical Plant and Soil Sciences, University of Hawaii at Manoa, Honolulu, Hawaii, United States of America, 2 Department of Plantand Environmental Sciences, University of Hawaii at Manoa, Honolulu, Hawaii, United States of America
The ability to respond to natural selection under novel conditions is critical for the establishment and persistence ofintroduced alien species and their ability to become invasive. Here we correlated neutral and quantitative genetic diversity ofthe weed Pennisetum setaceum Forsk. Chiov. (Poaceae) with differing global (North American and African) patterns ofinvasiveness and compared this diversity to native range populations. Numerous molecular markers indicate completemonoclonality within and among all of these areas (FST = 0.0) and is supported by extreme low quantitative trait variance(QST = 0.00065–0.00952). The results support the general-purpose-genotype hypothesis that can tolerate all environmentalvariation. However, a single global genotype and widespread invasiveness under numerous environmental conditionssuggests a super-genotype. The super-genotype described here likely evolved high levels of plasticity in response tofluctuating environmental conditions during the Early to Mid Holocene. During the Late Holocene, when environmentalconditions were predominantly constant but extremely inclement, strong selection resulted in only a few surviving genotypes.
Citation: Le Roux JJ, Wieczorek AM, Wright MG, Tran CT (2007) Super-Genotype: Global Monoclonality Defies the Odds of Nature. PLoS ONE 2(7):e590. doi:10.1371/journal.pone.0000590
INTRODUCTIONBiological invasions offer real-life situations of the roles of basic
evolutionary processes, such as the essentiality of genetic diversity,
the release from key limiting factors in native ranges and
phenotypic plasticity in self-sustained population growth [1–2].
While general trends and characteristics of successful invasions
remain for the most part elusive, many studies suggest that the
ability to respond to natural selection might contribute more to
invasion success than broad physiological tolerance or plasticity
[reviewed in 3]. Introduced ranges typically represent sub-adapted
environments akin to a ‘‘valley’’ on the adaptive topography;
species without pre-adapted histories will only persist if plasticity
allows genetic assimilation or if post drift allele frequencies allow
for the adaptation towards an alternative fitness peak.
Founding plant populations often have depauperate genetic
diversity and following range expansion, will generate low intra-
populational genetic variation. This situation is exacerbated in self-
pollinating and apomictic species with limited or no gene flow. As
isolated selection and mutations are the only mechanisms for
creating new alleles and variation, apomixes may represent an
evolutionary dead-end [4], leading to genotypic diversity decay
over time. Despite this, apomicts are frequently found as highly
tolerant and successful invaders [5] supporting two of Baker’s
hypotheses [6–7]. First, apomictic species have the opportunity for
a single propagule to colonize and spread into new environments,
satisfying Baker’s rule [7]. Secondly, many apomicts show
developmental and phenotypic plasticity with broad environmen-
tal tolerances, conforming to a ‘‘general-purpose-genotype’’ as
coined by Baker [6].
The allopolyploid apomictic grass weed, Pennisetum setaceum
Forsk. Chiov. (fountain grass) was used to study whether global
invasion gradients are shaped by genetic differentiation between
areas that are differentially impacted by this plant. This species’
native range spans parts of the Middle East and North Africa and
as a popular ornamental plant it has escaped cultivation and
invaded areas of Australia, Democratic Republic of Congo, Fiji,
Hawaii, continental USA, Namibia, South Africa, Swaziland,
Zambia and Zimbabwe [8]. We quantified neutral and quantita-
tive genetic diversity of globally invasive and native fountain grass
populations to determine the importance of such variation in
invasion success.
RESULTS AND DISCUSSION
Molecular genetic diversityDNA sequencing of the internal transcribed spacer (ITS) regions 1
and 2 showed that all populations from all geographical regions
share identical haplotypes for both genes. ITS2 was furthermore
heterozygous in all individuals with the two alleles differing by
1 bp transitions at positions number 38 (T and C) and 101 (A and
G), fixed for all populations. This initial lack of phylogeographical
differentiation within and among extremely invasive Pennisetum
setaceum populations characterized by nearly monotypic stands and
aggressive competitiveness (Hawaiian archipelago), moderately
invasive populations confined to disturbed habitats (South Africa),
introduced but non-invasive populations limited to roadsides
(Namibia) and native range populations (Egypt) (see Fig. 1) are
indicative of an apomictic breeding system. We therefore turned
our attention to molecular markers rendering higher intra-specific
resolution. In general, genetic polymorphism is anomalously high
for plant species with no known reproductive alternative(s) to
apomixes and could be the result of mutations and/or multiple
origins of clones [for e.g. see 9–11]. Despite this generalization, the
subsequent usage of ‘‘high resolution’’ markers (microsatellites and
Academic Editor: Shin-Han Shiu, Michigan State University, United States ofAmerica
Received November 10, 2006; Accepted June 6, 2007; Published July 4, 2007
Copyright: � 2007 Le Roux et al. This is an open-access article distributed underthe terms of the Creative Commons Attribution License, which permitsunrestricted use, distribution, and reproduction in any medium, provided theoriginal author and source are credited.
Funding: The research conducted in this study was financially supported bya USDATSTAR grant to Dr. Ania Wieczorek.
Competing Interests: The authors have declared that no competing interestsexist.
* To whom correspondence should be addressed. E-mail: [email protected]
PLoS ONE | www.plosone.org 1 July 2007 | Issue 7 | e590
inter simple sequence repeats [ISSR’s]) failed to resolve any
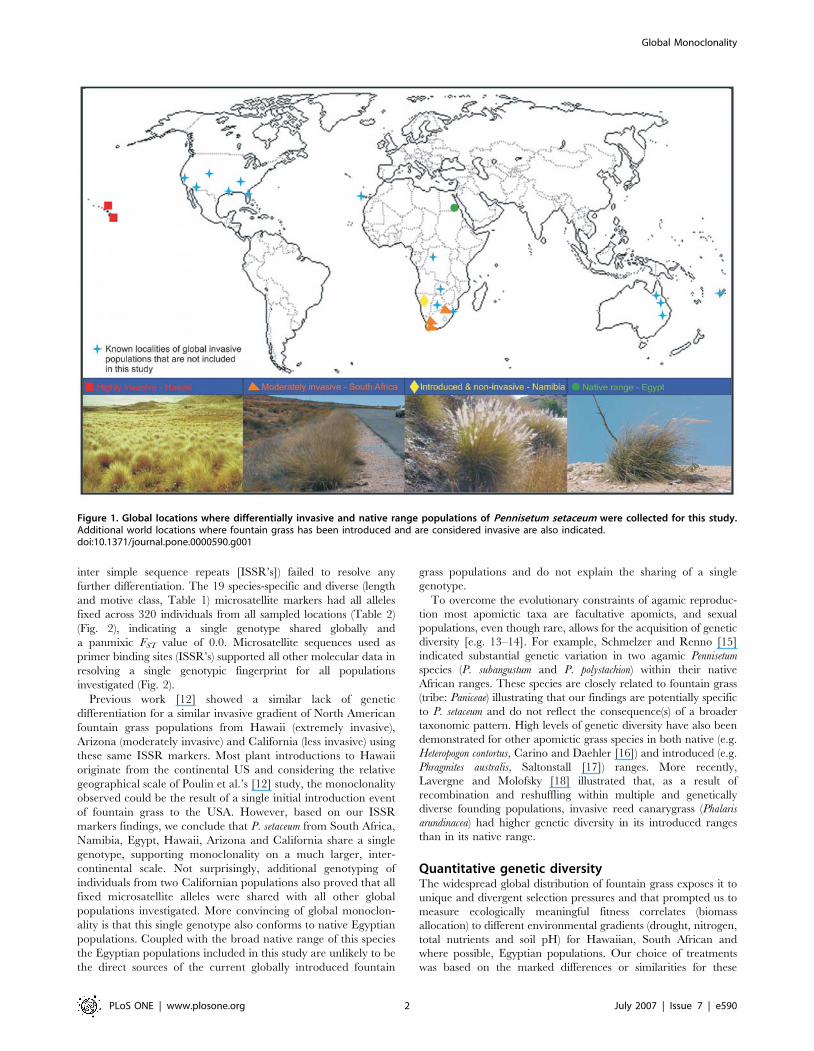
further differentiation. The 19 species-specific and diverse (length
and motive class, Table 1) microsatellite markers had all alleles
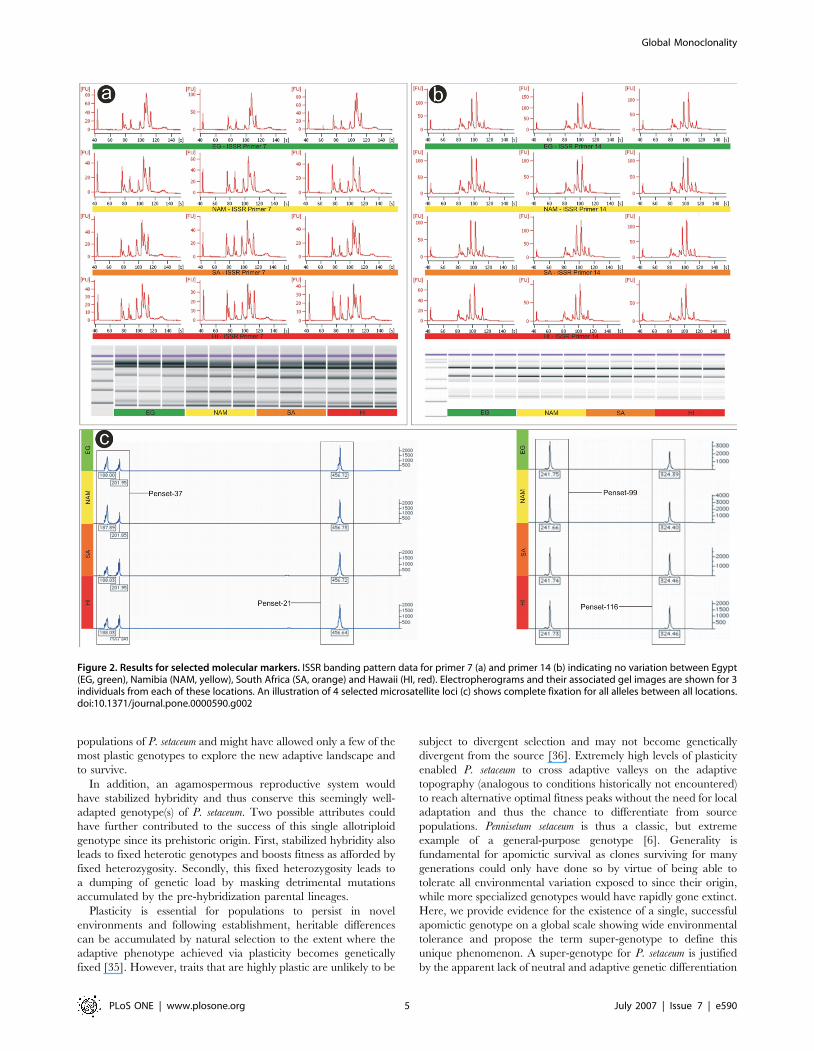
fixed across 320 individuals from all sampled locations (Table 2)
(Fig. 2), indicating a single genotype shared globally and
a panmixic FST value of 0.0. Microsatellite sequences used as
primer binding sites (ISSR’s) supported all other molecular data in
resolving a single genotypic fingerprint for all populations
investigated (Fig. 2).
Previous work [12] showed a similar lack of genetic
differentiation for a similar invasive gradient of North American
fountain grass populations from Hawaii (extremely invasive),
Arizona (moderately invasive) and California (less invasive) using
these same ISSR markers. Most plant introductions to Hawaii
originate from the continental US and considering the relative
geographical scale of Poulin et al.’s [12] study, the monoclonality
observed could be the result of a single initial introduction event
of fountain grass to the USA. However, based on our ISSR
markers findings, we conclude that P. setaceum from South Africa,
Namibia, Egypt, Hawaii, Arizona and California share a single
genotype, supporting monoclonality on a much larger, inter-
continental scale. Not surprisingly, additional genotyping of
individuals from two Californian populations also proved that all
fixed microsatellite alleles were shared with all other global
populations investigated. More convincing of global monoclon-
ality is that this single genotype also conforms to native Egyptian
populations. Coupled with the broad native range of this species
the Egyptian populations included in this study are unlikely to be
the direct sources of the current globally introduced fountain
grass populations and do not explain the sharing of a single
genotype.
To overcome the evolutionary constraints of agamic reproduc-
tion most apomictic taxa are facultative apomicts, and sexual
populations, even though rare, allows for the acquisition of genetic
diversity [e.g. 13–14]. For example, Schmelzer and Renno [15]
indicated substantial genetic variation in two agamic Pennisetum
species (P. subangustum and P. polystachion) within their native
African ranges. These species are closely related to fountain grass
(tribe: Paniceae) illustrating that our findings are potentially specific
to P. setaceum and do not reflect the consequence(s) of a broader
taxonomic pattern. High levels of genetic diversity have also been
demonstrated for other apomictic grass species in both native (e.g.
Heteropogon contortus, Carino and Daehler [16]) and introduced (e.g.
Phragmites australis, Saltonstall [17]) ranges. More recently,
Lavergne and Molofsky [18] illustrated that, as a result of
recombination and reshuffling within multiple and genetically
diverse founding populations, invasive reed canarygrass (Phalaris
arundinacea) had higher genetic diversity in its introduced ranges
than in its native range.
Quantitative genetic diversityThe widespread global distribution of fountain grass exposes it to
unique and divergent selection pressures and that prompted us to
measure ecologically meaningful fitness correlates (biomass
allocation) to different environmental gradients (drought, nitrogen,
total nutrients and soil pH) for Hawaiian, South African and
where possible, Egyptian populations. Our choice of treatments
was based on the marked differences or similarities for these
Figure 1. Global locations where differentially invasive and native range populations of Pennisetum setaceum were collected for this study.Additional world locations where fountain grass has been introduced and are considered invasive are also indicated.doi:10.1371/journal.pone.0000590.g001
Global Monoclonality
PLoS ONE | www.plosone.org 2 July 2007 | Issue 7 | e590
abiotic components between our study regions. For example, in
South Africa moderately invasive populations were found in both
summer (monsoonal) and winter (polar front) rainfall areas that
pose unique nitrogen fluxes, whilst highly aggressive Hawaiian
populations inhabit volcanic ash soils that are typically poor in
nitrogen. Furthermore, in South Africa, invading populations can
be found in different biomes including temperate coastal Fynbos,
sub-tropical Savannah, arid Succulent Karoo and Nama Karoo
regions [19], representing diverse and distinctive environmental
conditions. Measures of fitness correlates were useful in two ways:
1) given the lack of molecular genetic diversity we assessed the
degree of phenotypic plasticity and whether adaptive variation
exists for plasticity and 2) to partition quantitative genetic
differentiation among these regions, thereby allowing comparison
between neutral genetic variation (FST) to non-neutral adaptive
genetic variation (QST). Quantitative traits vary continuously owing
to their polygenic nature and environmental influences, and
coupled with selection strength, determine evolutionary potential.
A strong correlation exists between quantitative trait variation
(QST) and that observed for neutral markers (FST) with QST
typically exceeding FST in natural populations [20]. This is
consistent with the interpretation that polygenic traits are under
directional selection varying in magnitude and direction as
a function of differential selection pressures among different
populations in different environments.
Consistent with our molecular data, less than 1% of the
variation was explained among differentially invaded (South Africa
and Hawaii) and native range (Egypt) populations for fitness
correlate measurements in response to the nitrogen gradient
(QST = 0.00952). The same result was observed for differentially
invaded areas (South Africa and Hawaii) in response to the
nutrient and soil pH gradient (QST = 0.00065) and the water
gradient (QST = 0.00562) (see Fig. 3 for genotypic reaction norms).
Phenotypic plasticity was apparent for all populations investigated
and a lack of additive genetic variation in plasticity was reflected in
the similarity of the slopes and intercepts of the genotypic reaction
norms (Indicator Variable Analysis; nutrient and soil pH gradient
[F = 0.84; P = 0.362], water gradient [F = 0.16; P = 0.687] and
nitrogen gradient [F = 0.42; P = 0.661], Fig. 3). Egyptian popula-
tions were only included for one of the treatments measuring
ecological fitness correlates (nitrogen gradient) as all experimental
procedures were terminated prior to plants flowering (seeding
stage) and limited availability of seed stock. Despite the fact that
native Egyptian populations were only included in one experi-
mental treatment measuring quantitative genetic variation we feel
confident that the results support overall monoclonality. Nitrogen
sources (such as nitrate) have been shown to not only affect the
expression of genes involved in nitrogen metabolism but also those
involved in carbon metabolism [21]. Recently, a genome wide
microarray analysis showed that nitrate alone affected the
expression of 208 different genes in Arabidopsis thaliana [22]. Here,
only 0.95% of the variation in such gene expression (possibly
hundreds of genes involved in carbon and nitrogen metabolism)
that effects biomass accumulation was accounted for among
differentially invaded and native regions.
As with the adaptive evolution of any trait, polyphenism
requires genetic variation in, and selection on that variation.
Considering the geographical scale of our study, the lack of
variation in ecological meaningful fitness correlates and adaptive
plasticity is surprising. Most studies do reveal genetic variation in
plasticity, even over very small spatial scales [23] and coupled with
the known complexity of developmental plasticity, underscores the
uniqueness of our findings. Our data were furthermore predis-
posed to maternal effects as treatments were started from seed
directly collected in the field from all locations and were not
subjected to a common environment prior to experimental
manipulation making these results even more intriguing. Pennisetum
setaceum’s native range populations and those introduced globally
Table 1. Characteristics of the 19 microsatellite markers developed and used in this study.. . . . . . . . . . . . . . . . . . . . . . . . . . . . . . . . . . . . . . . . . . . . . . . . . . . . . . . . . . . . . . . . . . . . . . . . . . . . . . . . . . . . . . . . . . . . . . . . . . . . . . . . . . . . . . . . . . . . . . . . . . . . . . . . . . . . . . . . . . . . . . . . . .
Locus name Forward/reverse primer sequences (59R39) Repeat unitAnnealingtemperature
Genbank accessionnumber
Penset4 TATGGTTCGCCACTTGGTGC/ACCCTCTCACACCCTGGGAG (GA)18 48.0uC DQ899151
Penset6 CATATTTCAGACCGGGAACACC/AGGTCAGGGTCTCGGGTCG (TC)23 60.0uC DQ899152
Penset14 TGTCACCAATGGAGTTGCTC/GCGTATGTGGGTGTGTTGC (AAC)6 58.5uC DQ899153
Penset18 TCACTTTTGTGCCAGACTGC/TCAGCAGCTTGTGGCCCAC (CT)24 50.0uC DQ899154
Penset21 TTGGGATGGTGTGGACACC/ACCAAAGGATAAATCTCGCTGC (TA)7(AC)6 48.5uC DQ899155
Penset24 TCCTCACTCTTGCTCTCACG/CCCACATAGTTTGCGGTAGG (CT)15 49.0uC DQ899156
Penset28 GTGGTCTAACCGCCGATTAG/ACTAGCCAAACTTGGTTGATCG (GA)13 50.0uC DQ899157
Penset35 GCGAGCCTAACAGCGTTTC/CTCGTGTGGGCAGCAATGC (GA)33 56.2uC DQ899158
Penset37 TTGACGGGAAGAGCAAAGC/TGAATCGAGCCCAGGCTGC (CT)12 52.1uC DQ899159
Penset95 GGAGTGCTTGGAGACTTGC/CCAAATGGTACATACTAGCGGTTC (GTT)17 53.0uC DQ899160
Penset99 GCAATCAACGTGCCTGAACC/ATCCAGTGCCAGAGGCTCC (GTT)7 48.5uC DQ899163
Penset104 TGTTTCAGTCATGGGCTGAC/GCTTGCGATTGGGTCCTGAG (CAA)18 60.5uC DQ899165
Penset105 AGCAATTAGTGTGCCTGTAACC/TTTGCCACCAGCCGAGAGTC (GTT)7 45.5uC DQ899166
Penset110 CAATGTGTCTGAACCATGACCTC/AGCCTTTTGTCCCAAGCAAG (GT)8(GGGG)(GT)12 60.0uC DQ899168
Penset111 TGGGGTTGTCCTGGGGTGG/TGAGGAAGACAAAGCAATCACC (GTT)27 50.5uC DQ899169
Penset114 ACCCCAACTTGCTTGGGAC/TCTACGAGGACGCCTGTGG (GTT)6 48.0uC DQ899170
Penset117 CGCCATGCAACACAAGCAC/TCAAAGTGGTTGAGGGTTGC (AAC)21 60.0uC DQ899171
Penset119 TCACGTCGTAACAATGCACC/TGCTCAGGTGACTGCTCTG (CAA)8 60.0uC DQ899172
Penset120 ACAATCCCTGTGCCCAAAC/AGCTATCAACGTGCTTGAACC (AAC)6 49.0uC DQ899173
doi:10.1371/journal.pone.0000590.t001....
....
....
....
....
....
....
....
....
....
....
....
....
....
....
....
....
....
....
....
....
....
..
Global Monoclonality
PLoS ONE | www.plosone.org 3 July 2007 | Issue 7 | e590
(in most instances more than a century ago) seemingly have
undergone no local adaptation for developmental traits related to
water, nitrogen or nutrient stresses, as adequate levels of plasticity
guaranteed broad ecological range tolerance and fitness.
Evolution of phenotypic plasticity in P. setaceumSelective evolution of plasticity for any given population will in
part depend on whether the plastic response has high energetic,
functional and/or genetic costs [24]. Due to the lack of
phenotypically more or less plastic individuals estimates of such
costs were impossible to obtain during this study. Although
plasticity costs are likely to constrain the evolution of plasticity for
a given trait, the ubiquity of plasticity in many species suggests that
the benefits outweigh the costs under a wide variety of conditions.
Costs related to plasticity do, however, prevent the continued
evolution of plasticity to the point where a species could be
successful in most environments [25]. Opposing this general
perception, the single genotype described here supports the
hypothesis that plasticity is the sole mechanism driving this
genotype’s success in heterogeneous and novel environments.
Similarly, Williams and co-workers [26–27] found that high levels
of plasticity exist in ecophysiological traits in reciprocally
transplanted fountain grass populations conforming to an
altitudinal gradient spanning sea level to sub-alpine habitats in
Hawaii. Without sufficient plasticity, rapid changes in conditions
and environments such as these to which P. setaceum may never
have been exposed, will pose a particular risk of local extinction.
Costs associated with maintaining such high levels of polyphenism
are expected to trigger the evolution of reaction norms that
facilitates adaptation to more frequently encountered environ-
ments [28]. Therefore, we postulate that the single genotype
described here was historically extremely cost-effective even when
multiple plastic hybrid genotypes likely existed. For the evolution
of plastic genotypes such as the one reported here, single genotypes
or genotypes over a few generations must be subjected to
heterogeneous environmental condition exposures. However, this
situation still does not explain why apparently only one genotype
exists. To explain this, we furthermore speculate that at some
point native genotypes of P. setaceum were exposed to constant
environmental conditions that were extremely hostile and caused
hard purifying selection, depriving these populations of genetic
variation to very low or possibly non-existing levels, allowing only
for the most plastic genotypes to persist.
Numerous paleontological records attest that the Late Pleisto-
cene epoch was characterized by arid conditions accompanied by
aeolian activity in Egypt and Sudan. Aridity abated during the
Early to Middle Holocene as a transition towards episodic humid
and wetter conditions punctuated by intervening arid phases
occurred with primarily steppe vegetation covering aeolian sands
[29–31]. These fluctuations, corresponding to Indian Ocean
monsoon (IOM) intensity oscillations resulting from glacial
boundary forcing (e.g. sea surface temperatures), occurred on
timescales as short as decadal to multidecadal [32]. Pennisetum
setaceum’s agamospermous reproductive system likely assured single
genotypes’ preservation and thus exposure to such fluctuations
over the course of multiple generations. These variable conditions
in the ancestral environment would have favored the evolution of
high levels of phenotypic plasticity. Review of botanical evidence
from the Eastern Sahara furthermore suggests that the grasslands
in Egypt and Sudan were diminishing around 7000 BP when these
fluctuating climate conditions waned and constant aridity began to
set in, dramatically reducing the desert flora to a similar
composition to the present day flora [33]. Aridification led to
the establishment of arid-to-hyperarid conditions across the region
by , 4500 BP with the extant flora disappearing from most
habitats, and becoming restricted to only the hardiest desert-
adapted plants [34]. Such inclement environmental conditions
would have exerted extremely strong selection on ancestral
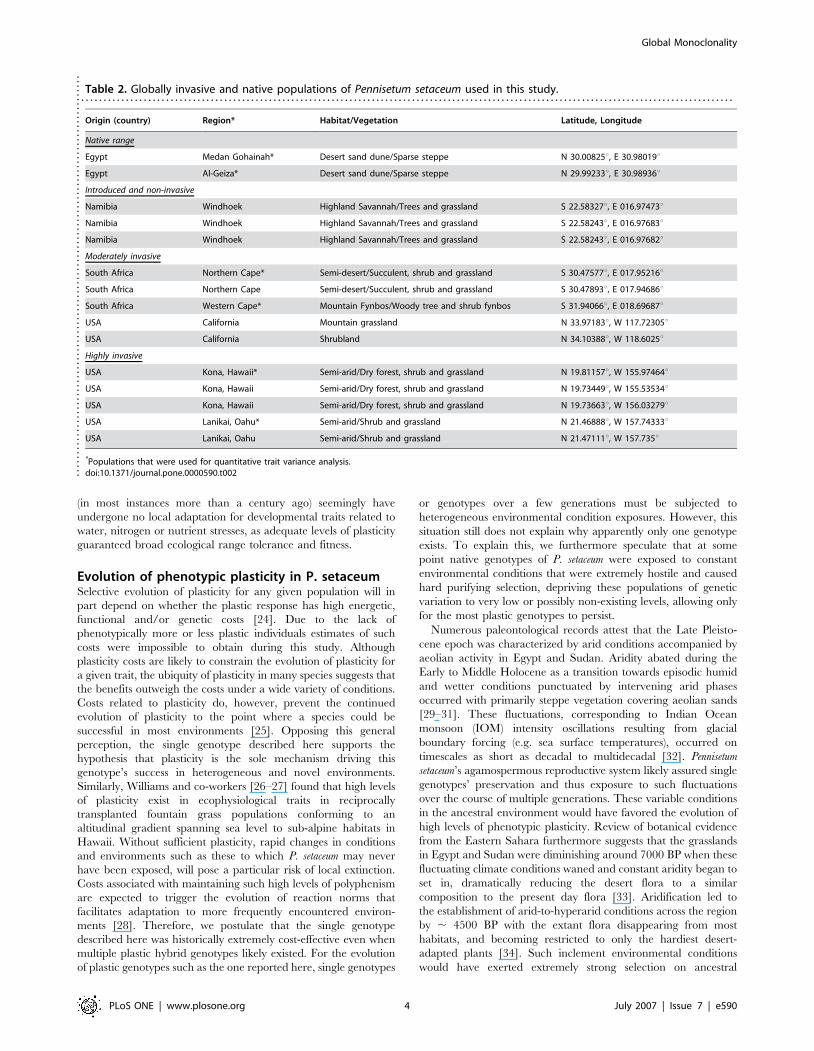
Table 2. Globally invasive and native populations of Pennisetum setaceum used in this study.. . . . . . . . . . . . . . . . . . . . . . . . . . . . . . . . . . . . . . . . . . . . . . . . . . . . . . . . . . . . . . . . . . . . . . . . . . . . . . . . . . . . . . . . . . . . . . . . . . . . . . . . . . . . . . . . . . . . . . . . . . . . . . . . . . . . . . . . . . . . . . . . . .
Origin (country) Region* Habitat/Vegetation Latitude, Longitude
Native range
Egypt Medan Gohainah* Desert sand dune/Sparse steppe N 30.00825u, E 30.98019u
Egypt Al-Geiza* Desert sand dune/Sparse steppe N 29.99233u, E 30.98936u
Introduced and non-invasive
Namibia Windhoek Highland Savannah/Trees and grassland S 22.58327u, E 016.97473u
Namibia Windhoek Highland Savannah/Trees and grassland S 22.58243u, E 016.97683u
Namibia Windhoek Highland Savannah/Trees and grassland S 22.58243u, E 016.97682u
Moderately invasive
South Africa Northern Cape* Semi-desert/Succulent, shrub and grassland S 30.47577u, E 017.95216u
South Africa Northern Cape Semi-desert/Succulent, shrub and grassland S 30.47893u, E 017.94686u
South Africa Western Cape* Mountain Fynbos/Woody tree and shrub fynbos S 31.94066u, E 018.69687u
USA California Mountain grassland N 33.97183u, W 117.72305u
USA California Shrubland N 34.10388u, W 118.6025u
Highly invasive
USA Kona, Hawaii* Semi-arid/Dry forest, shrub and grassland N 19.81157u, W 155.97464u
USA Kona, Hawaii Semi-arid/Dry forest, shrub and grassland N 19.73449u, W 155.53534u
USA Kona, Hawaii Semi-arid/Dry forest, shrub and grassland N 19.73663u, W 156.03279u
USA Lanikai, Oahu* Semi-arid/Shrub and grassland N 21.46888u, W 157.74333u
USA Lanikai, Oahu Semi-arid/Shrub and grassland N 21.47111u, W 157.735u
*Populations that were used for quantitative trait variance analysis.doi:10.1371/journal.pone.0000590.t002..
....
....
....
....
....
....
....
....
....
....
....
....
....
....
....
....
....
....
....
....
....
....
Global Monoclonality
PLoS ONE | www.plosone.org 4 July 2007 | Issue 7 | e590
populations of P. setaceum and might have allowed only a few of the
most plastic genotypes to explore the new adaptive landscape and
to survive.
In addition, an agamospermous reproductive system would
have stabilized hybridity and thus conserve this seemingly well-
adapted genotype(s) of P. setaceum. Two possible attributes could
have further contributed to the success of this single allotriploid
genotype since its prehistoric origin. First, stabilized hybridity also
leads to fixed heterotic genotypes and boosts fitness as afforded by
fixed heterozygosity. Secondly, this fixed heterozygosity leads to
a dumping of genetic load by masking detrimental mutations
accumulated by the pre-hybridization parental lineages.
Plasticity is essential for populations to persist in novel
environments and following establishment, heritable differences
can be accumulated by natural selection to the extent where the
adaptive phenotype achieved via plasticity becomes genetically
fixed [35]. However, traits that are highly plastic are unlikely to be
subject to divergent selection and may not become genetically
divergent from the source [36]. Extremely high levels of plasticity
enabled P. setaceum to cross adaptive valleys on the adaptive
topography (analogous to conditions historically not encountered)
to reach alternative optimal fitness peaks without the need for local
adaptation and thus the chance to differentiate from source
populations. Pennisetum setaceum is thus a classic, but extreme
example of a general-purpose genotype [6]. Generality is
fundamental for apomictic survival as clones surviving for many
generations could only have done so by virtue of being able to
tolerate all environmental variation exposed to since their origin,
while more specialized genotypes would have rapidly gone extinct.
Here, we provide evidence for the existence of a single, successful
apomictic genotype on a global scale showing wide environmental
tolerance and propose the term super-genotype to define this
unique phenomenon. A super-genotype for P. setaceum is justified
by the apparent lack of neutral and adaptive genetic differentiation
Figure 2. Results for selected molecular markers. ISSR banding pattern data for primer 7 (a) and primer 14 (b) indicating no variation between Egypt(EG, green), Namibia (NAM, yellow), South Africa (SA, orange) and Hawaii (HI, red). Electropherograms and their associated gel images are shown for 3individuals from each of these locations. An illustration of 4 selected microsatellite loci (c) shows complete fixation for all alleles between all locations.doi:10.1371/journal.pone.0000590.g002
Global Monoclonality
PLoS ONE | www.plosone.org 5 July 2007 | Issue 7 | e590
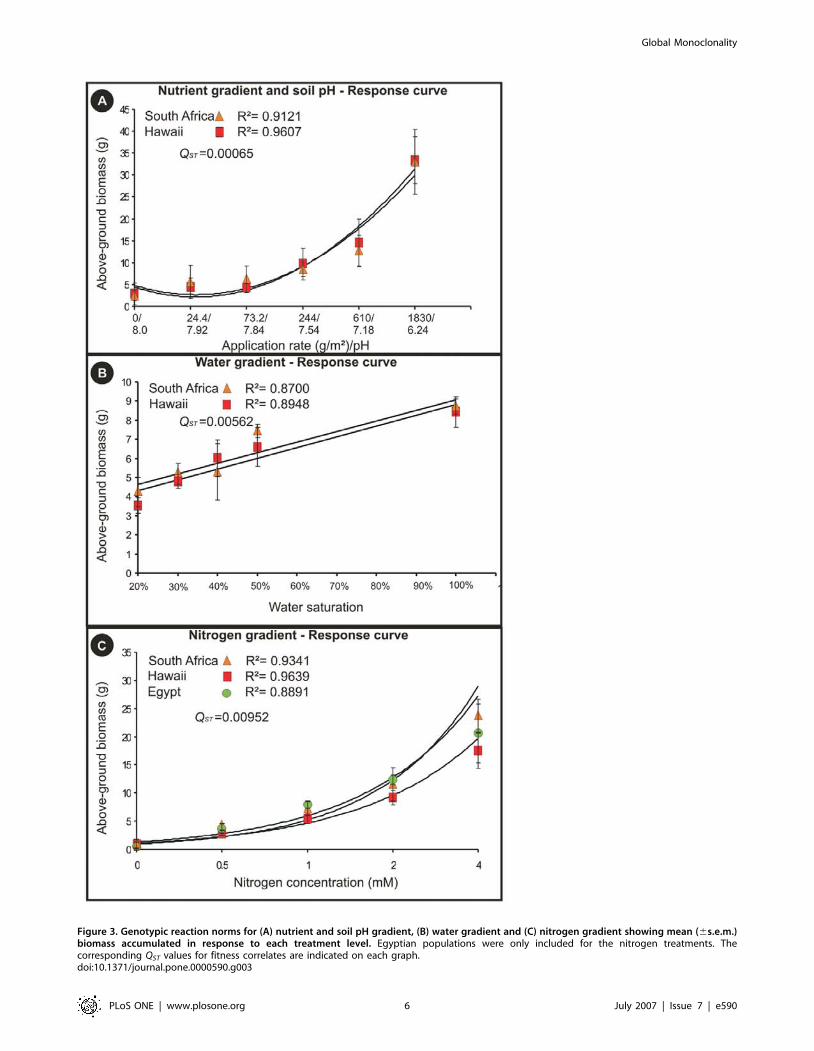
Figure 3. Genotypic reaction norms for (A) nutrient and soil pH gradient, (B) water gradient and (C) nitrogen gradient showing mean (6s.e.m.)biomass accumulated in response to each treatment level. Egyptian populations were only included for the nitrogen treatments. Thecorresponding QST values for fitness correlates are indicated on each graph.doi:10.1371/journal.pone.0000590.g003
Global Monoclonality
PLoS ONE | www.plosone.org 6 July 2007 | Issue 7 | e590
within the region of origin and among globally introduced
populations and the grass’ capability to survive under a wide
array of environmental conditions. High levels of phenotypic
plasticity ensure self-sustainability in disturbed habitats [37] but do
not seem to allow for fountain grass to overcome the biological
resistance-buffer posed by undisturbed habitats and intact
ecosystems. The gradient of invasiveness observed here is indeed
correlated to some degree to a similar disturbance-level gradient
between differentially invaded areas. Namibian fountain grass
populations are only found in human-derived disturbance areas
such as roadsides with no spread or establishment in undisturbed
native vegetation [8]. In South Africa, however, where limited
spread and persistence in native vegetation does occur [19],
ecosystems are characterized by intermediate disturbance levels.
In these Mediterranean-climate shrubland (Fynbos) areas fire
disturbance often yields spatial heterogeneity and intermediate
environmental disturbances [38]. The islands of the Hawaiian
archipelago’s, and in particular the island of Hawaii’s, geological
recentness (0–0.5 Ma) encompasses habitats that are overall in
a constant state of extreme disturbance [39]. Even though this
genotype is well-adapted to disturbed habitats, evolutionary
potential is essentially impossible and any fitness peak or slope
thereof that is out of reach to its plastic response will result in rapid
extinction.
ConclusionUnderstanding the underlying processes and variables that affect
a population’s ability to adapt and survive in changing and/or
novel environments are critical issues in evolutionary biology,
conservation biology, and ecology [2,40]. In contrast to typical
Darwinian evolution, the single super-genotype identified here
persists and survives exposure under most environmental condi-
tions. Further examination of other species may reveal further
super-genotypes, and it may be found that this is a more common,
significant but hitherto overlooked mechanism driving survival
and local fitness of plant populations.
MATERIALS AND METHODS
Population samplingLeaf material and where possible seeds were randomly collected
from 20–30 individuals per population of P. setaceum in South
Africa, Namibia, Hawaii, California and Egypt (Table 2).
DNA extraction and sequencing of Internal
Transcribed Spacer Regions (ITS1 and ITS2)Genomic DNA was extracted with the DNeasy Plant mini kit
(Qiagen, Germantown, USA). The entire ITS region was PCR
amplified using conditions and primers described by Martel et al.
[41]. Each reaction contained 5 ng of total genomic DNA, 0.4 (v/
v) HotMasterMix (HotMaster Taq DNA polymerase, 0.3 U; 2.56HotMaster Taq Buffer pH 8.5, 45 mM KCl and 2.5 mM MgCl2;
200 mM of each dNTP [Brinkman Instruments Inc., Westbury,
USA]) and 25 pmol of both primers. Purified PCR products were
sequenced in both directions and were run on an ABI377
automated sequencer (Applied Biosystems, Foster City, USA.)
using standard dye-terminator chemistry. DNA sequences were
manually aligned and submitted to GenBank (AY944426-
AY944463).
Microsatellite libraries and marker developmentWe developed microsatellite enriched-libraries as described by
Hamilton et al. [42] with slight modifications. Fifty micrograms of
extracted genomic DNA were digested with RsaI, HaeIII, AluI and
HincII and the resulting fragments simultaneously ligated onto
SNX oligonucleotide linkers. Following enrichment with biotin-
labeled microsatellite oligoprobes (AAC8 and GC12) and strepta-
vidin-coated magnetic beads, PCR amplification and purification,
putative microsatellite-containing fragments were digested with
NheI, and ligated into the XbaI site of pUC19 prior to
transformation.
Transformed bacterial colonies were transferred onto nylon
membranes and screened using digoxigenin labeled microsatellite
probes to identify microsatellite-containing clones. Following DNA
extraction from clones, vector insert fragments were PCR
amplified, purified and sequenced. DNA sequences were visually
inspected to identify perfect and compound microsatellite
sequences and PCR primers specific to each locus designed using
the program FASTPCR [43].
Screening for polymorphism and genotypingInitial screening for polymorphisms was done by analyzing alleles
for 6 different individuals from each global region (total of 24
individuals). PCR reactions were carried out in 15 mL total
reaction volumes. Each reaction contained 0.4 (v/v) HotMaster-
Mix (HotMaster Taq DNA polymerase, 0.3 U; 2.56 HotMaster
Taq Buffer pH 8.5, 45 mM KCl and 2.5 mM MgCl2; 200 mM of
each dNTP [Brinkman Instruments Inc., Westbury, USA]),
7.5 pmol of each primer and approximately 5 ng total genomic
DNA. A thermocycle of an initial denaturation of 94uC for 2 min
followed by 35 cycles of 1 min at 94uC, 1 min at the appropriate
annealing temperature (Table 1) and 1 min at 72uC, followed by
a final 12 min extension at 72uC. Purified PCR products were run
on an Agilent 2100 Bioanalyzer analysis LabChip (Quantum
Analytics, Inc., Foster City, CA) to detect fragment size differences
at each locus.
Loci were also genotyped by fluorescently labeling PCR
products using PCR cycle conditions described above and
fluorophore-labeled primers. Separation of specific alleles was
carried out on 5% polyacrylamide gels using an ABI377
sequencer. Analysis of the gels and the fragment lengths were
carried out using the software GeneMarker (Softgenetics LLCTM,
PA). Fragments of lengths 50–700 bp were manually scored.
Inter-simple sequence repeat marker (ISSR) diversityISSR diversity was assessed using primers described by Poulin et
al. [12]. Each PCR reaction contained approximately 2 ng of total
genomic DNA, 0.4 (v/v) HotMasterMix (HotMaster Taq DNA
polymerase, 0.3 U; 2.56HotMaster Taq Buffer pH 8.5, 45 mM
KCl and 2.5 mM MgCl2; 200 mM of each dNTP [Brinkman
Instruments Inc., Westbury, USA]) and 50 pmol of ISSR primer.
A thermocycle of an initial denaturation of 94uC for 2 min
followed by 35 cycles of 1 min at 94uC, 1 min at the appropriate
annealing temperature (Table 3) and 1 min at 72uC, followed by
a final extension of 12 min at 72uC. PCR products were run on an
Agilent 2100 Bioanalyzer analysis LabChip (Quantum Analytics,
Inc., Foster City, CA) to visualize and compare banding patterns
for each ISSR marker.
Developmental traitsTwenty families from South Africa, Hawaii and Egypt were
included for analysis of developmental variation under various
conditions. Each family consisted of seedlings produced from seeds
harvested from one of 20 randomly chosen individuals from each
geographic location. Prior to all treatments, seeds were allowed to
germinate and grow for two weeks in a 1:1 vermiculite and potting
Global Monoclonality
PLoS ONE | www.plosone.org 7 July 2007 | Issue 7 | e590
soil mixture before being transplanted into 800 mL plastic pots. A
total of 10 replicates from each geographical location, i.e. 10
randomly chosen families, were used in each treatment. Pots were
randomly repositioned weekly in the greenhouse for the duration
of all experiments. Responses to all different treatments were
measured as the amount of above-ground biomass produced after
a certain growth period. Egyptian populations were only included
for the nitrogen gradient due to limited seed stock available and as
all experimental procedures were terminated prior to plant
flowering (seeding stage).
Water StressSeedlings were maintained at five different levels of water
availability representing well-watered (obtained by watering the
potting soil and vermiculite mixture (1:1) and allowing percolation
to finish) to severe water stress (50, 40, 30, 20% of the maximum
water retention capacity i.e., well-watered) conditions. Plants were
watered with the appropriate amount of water each day. Above-
ground biomass was harvested and weighed after 43 days.
Nitrogen AvailabilityAfter transplanting seedlings in vermiculite a nitrogen gradient was
simulated by applying complete micronutrient solutions with
nitrate concentrations fixed at 0, 0.5, 1, 2 and 4 mM NO32, all
other elements applying to nitrogen-free nutrient solution
concentrations [44]. Fifty milliliters of the appropriate nutrient
solution was applied twice a week throughout the duration of the
experiment to each pot. Plants were watered daily to keep
vermiculate at saturated moisture content. Above-ground biomass
was harvested and weighed after 60 days.
Nutrient AvailabilityA nutrient gradient was created by applying slow-releasing
fertilizer (OsmocoteH [total nitrogen, 9.0%; available phosphate,
6.0%; soluble potassium, 6.0%; total sulphur, 18.7%; Iron, 2.0%])
at different rates (24.4 g/m2, 73.2 g/m2, 244 g/m2, 610 g/m2
and 1.83 kg/m2) to seedlings planted in a 1:1 vemiculite:potting
soil mixture. Plants were watered daily to simulate well-watered
conditions. Above-ground biomass was harvested and weighed
after 45 days. The slow-releasing fertilizer promoted acidic soil
conditions, simultaneously creating a pH gradient. Soil pH was
measured at the time of harvest after continuous stirring of 50 g of
soil in 300 mL distilled water for 20 min.
Analytical methodsA nested ANOVA [45] was used to partition and estimate
variance components of developmental responses, and to estimate
QST values as QST = Vo/(Vo+Vt), where Vo is variance among
families by geographical origin (country), and Vt is variance
among families by treatment (nested within origin) [46]. QST values
were calculated for the quantitative traits measured as accumu-
lated biomass in response to water, nutrients and nitrogen
availability.
Responses to treatments (water, nutrient and nitrogen avail-
ability) of plants from various origins were compared using linear
regression [47]. To compare the effect of the qualitative variable
‘‘origin’’, indicator variables were generated and full model
multiple regressions (including indicator variables as independent
variables) were compared to reduced models (with origins pooled)
to determine if origin had any significant effect on the slope and
intercept of the response curves. This analysis was conducted for
each of the treatments separately.
ACKNOWLEDGMENTSThe authors would like to thank Shin-Han Shiu, Naomi Ward and one
anonymous reviewer for their comments that greatly improved the quality
of this manuscript. We would also like to thank some of our colleagues,
Robert Paul, Monica Geber, Susana Vanzie-Canton, Stephanie Dunbar,
and Daniel Rubinoff, for helpful suggestions and comments on previous
drafts of this manuscript. The authors would like to credit J. Randall and
M. Ramadan for pictures used in Figure 1.
Author Contributions
Conceived and designed the experiments: JL AW. Performed the
experiments: JL CT. Analyzed the data: JL MW. Contributed reagents/
materials/analysis tools: JL AW. Wrote the paper: JL.
REFERENCES1. Cox GW (2004) Alien species and evolution. Washington DC: Island Press.
2. Sakai AK, Allendorf FW, Holt JS, Lodge DM, Molofsky J, et al. (2001) The
population biology of invasive species. Annu Rev Ecol Systemat 32: 305–332.
3. Lee CE (2002) Evolutionary genetics of invasive species. Trends Ecol Evol 17:386–391.
4. Asker SE, Jerling L (1992) Apomixis in Plants. Florida: CRC Press.
5. Rambuda TD, Johnson SD (2004) Breeding systems of invasive alien plants in
South Africa: does Baker’s rule apply? Divers Distrib 10: 409–416.6. Baker HG (1965) The Genetics of Colonizing Species. New York: New York
Academic Press. pp 147.
7. Baker HG (1967) Support for Baker’s law — As a rule. Evolution 21: 853–856.
8. Joubert DF, Cunningham PL (2002) The distribution and invasive potential offountain grass, Pennisetum setaceum, in Namibia. Dinteria 27: 37–47.
9. Reed DH, Lowe EH, Briscoe DA, Frankham R (2003) Fitness and adaptability
in a novel environment: effect of prior environment, inbreeding, and lineage.
Evolution 57: 1822–1828.10. Chaboudez P (1994) Patterns of clonal variation in skeleton weed (Chondrilla
juncea), an apomictic species. Aust J Bot 42: 283–295.
11. Ellstrand NC, Roose ML (1987) Patterns of genotypic diversity in clonal plant
species. Am J Bot 74: 123–131.
12. Poulin J, Weller S, Sakai A (2005) Genetic diversity does not affect the
invasiveness of fountain grass (Pennisetum setaceum) in Arizona, California andHawaii. Divers Distrib 11: 241–247.
13. Assienan B, Noirot M (1995) Isozyme polymorphism and organization of the
agamic complex of the Maximae (Panicum maximum Jacq., P. infestum Anders, and
P. trichocladum K. Schum.) in Tanzania. T A G 91: 672–680.
14. Barcaccia G, Arzenton F, Sharbel TF, Varotto S, Parrini P, et al. (2006) Geneticdiversity and reproductive biology in ecotypes of the facultative apomict
Hypericum perforatum L. Heredity 96: 322–334.
15. Schmelzer GH, Renno J-F (1997) Genetic variation in the agamic speciescomplex of Pennisetum section Brevivalvula (Poaceae) from West Africa: ploidy
levels and isozyme polymorphism. Euphytica 96: 23–29.
16. Carino DA, Daehler CC (1999) Genetic variation in an apomictic grass,
Heteropogon contortus, in the Hawaiian Islands. Mol Ecol 8: 2127–2132.
17. Saltonstall K (2003) Microsatellite variation within and among North Americanlineages of Phragmites australis. Mol Ecol 12: 1689–1702.
18. Lavergne S, Molofsky J () Increased genetic variation and evolutionary potential
drive the success of an invasive grass. Proc Natl Acad Sci U S A 104: 3883–3888.
19. Milton SJ, Hoffmann JH, Bowie RCK, et al. (1998) Invasive fountain grass on
the Cape Peninsula. S Afr J Sci 94: 57–58.
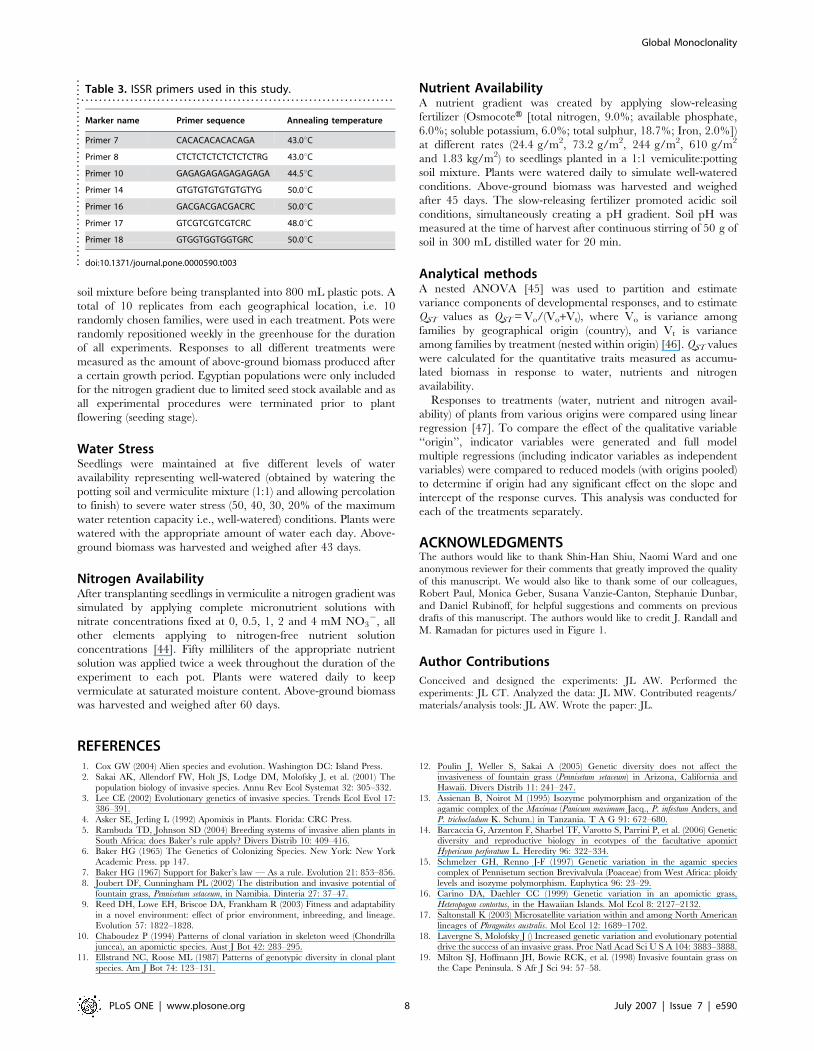
Table 3. ISSR primers used in this study.. . . . . . . . . . . . . . . . . . . . . . . . . . . . . . . . . . . . . . . . . . . . . . . . . . . . . . . . . . . . . . . . . . . . . .
Marker name Primer sequence Annealing temperature
Primer 7 CACACACACACAGA 43.0uC
Primer 8 CTCTCTCTCTCTCTCTRG 43.0uC
Primer 10 GAGAGAGAGAGAGAGA 44.5uC
Primer 14 GTGTGTGTGTGTGTYG 50.0uC
Primer 16 GACGACGACGACRC 50.0uC
Primer 17 GTCGTCGTCGTCRC 48.0uC
Primer 18 GTGGTGGTGGTGRC 50.0uC
doi:10.1371/journal.pone.0000590.t003....
....
....
....
....
....
....
....
....
....
..
Global Monoclonality
PLoS ONE | www.plosone.org 8 July 2007 | Issue 7 | e590
20. Merila J, Crnokrak P (2001) Comparison of marker gene and quantitative
genetic differentiation among populations. J Evolution Biol 14: 892–903.
21. Wang R, Okamoto M, Xing X, Crawford NM (2003) Microarray analysis of the
nitrate response in Arabidopsis roots and shoots reveals over 1,000 rapidly
responding genes and new linkages to glucose, trehalose-6-phosphate, iron, and
sulfate metabolism. Plant Physiol 132: 556–67.
22. Palenchar PM, Kouranov A, Lejay LV, Coruzzi GM (2004) Genome-wide
patterns of carbon and nitrogen regulation of gene expression validate the
combined carbon and nitrogen (CN)-signaling hypothesis in plants. Genome
Biol 5: R91.
23. van Kleunen M, Fischer M (2005) Constraints on the evolution of adaptive
phenotypic plasticity in plants. New Phytol 166: 49–60.
24. DeWitt TJ, Sih A, Wilson DS (1998) Costs and limits of phenotypic plasticity.
Trends Ecol Evol 13: 77–81.
25. Agrawal AA (2001) Phenotypic Plasticity in the Interactions and Evolution of
Species. Science 294: 321–326.
26. Williams DG, Black RA (1993) Phenotypic variation in contrasting temperature
environments: growth and photosynthesis in Pennisetum setaceum from different
altitudes on Hawaii. Funct Ecol 7: 623–633.
27. Williams DG, Mack RN, Black RA (1995) Ecophysiology of introduced
Pennisetum setaceum on Hawaii: the role of phenotypic plasticity. Ecology 76:
1569–1580.
28. Pigliucci M (2005) Evolution of phenotypic plasticity: where are we going now?
Trends Ecol Evol 20: 481–486.
29. Gasse F (2000) Hydrological changes in the African tropics since the Last Glacial
Maximum. Quat Sci Rev 19: 189–211.
30. Prentice IC, Jolly D, BIOME 6000 participants (2000) Mid-Holocene and
glacial-maximum vegetation geography of the northern continents and Africa.
J Biogeogr 27: 507–519.
31. Nicoll K (2004) Recent environmental change and prehistoric human activity in
Egypt and Northern Sudan. Quat Sci Rev 23: 561–580.
32. Fleitmann D, Burns SJ, Mudelsee M, Neff U, Kramers J, et al. (2003) Holocene
Forcing of the Indian Monsoon Recorded in a Stalagmite from Southern Oman.
Science 300: 1737–1739.
33. Neumann K (1989) Holocene vegetation of the eastern Sahara-charcoal from
Prehistoric sites. A A R R 7: 97–116.34. Bornkamm R, Kehl H (1989) Landscape ecology of the western desert of Egypt.
J Arid Environ 17: 271–277.
35. Pigliucci M, Murren CJ, Schlichting CD (2006) Phenotypic plasticity andevolution by genetic assimilation. J Exp Biol 209: 2362–2367.
36. Price T, Qvarnstrom A, Irwin DE (2003) The role of phenotypic plasticity indriving genetic evolution. Proc R Soc Lond B 270: 1433–1440.
37. Parker IM, Rodriguez J, Loik ME (2003) An evolutionary approach to
understanding the biology of invasions: local adaptation and general purposegenotype in the weed Verbascum thapsus. Cons Biol 17: 59–72.
38. Schwilk DW, Keeley JE, Bond WJ (1997) The intermediate disturbancehypothesis does not explain fire and diversity patterns in fynbos. Plant Ecol 132:
77–84.39. Price JP, Clague DA (2002) How old is the Hawaiian biota? Geology and
phylogeny suggest recent divergence Proc R Soc Lond B 269: 2429–2435.
40. Novak SJ, Mack RN (2000) Clonal diversity within and among introducedpopulations of the apomictic vine Bryonia alba (Cucurbitaceae). Can J Bot 78:
1469–1481.41. Martel E, Poncet V, Lamy F, Siljak-Yakovlev S, Lejeune B, et al. (2004)
Chromosome evolution of Pennisetum species (Poaceae): implications of ITS
phylogeny. Plant Syst Evol 249: 139–149.42. Hamilton MB, Pincus EL, Di Fiore A, Fleischer RC (1999) Universal linker and
ligation procedures for construction of genomic DNA libraries enriched formicrosatellites. BioTechniques 27: 500–507.
43. Kalendar R (2004) FASTPCR : PCR primer design, DNA and protein tools,repeats and own database searches program. (available at http:// www.bio-
center.helsinki.fi/bi/bare-1_html/fastpcr.htm).
44. Broughton WJ, Dilworth MJ (1971) Control of leghaemoglobin synthesis insnake beans. Biochem J 125: 1075–1080.
45. PROC NESTED, SAS Institute (2001).46. Stenøien HK, Fenster CB, Tonteri A, Savolainen O (2005) Genetic variability in
natural populations of Arabidopsis thaliana in northern Europe. Mol Ecol 14:
137–148.47. PROC REG, SAS Institute (2001).
Global Monoclonality
PLoS ONE | www.plosone.org 9 July 2007 | Issue 7 | e590