Embed Size (px)
Citation preview
Supplementary Information‘Biased hate crime perceptions may reveal supremacist sympathies’
ContentsSupplementary Information A: Annotated Analyses .................................................. 1Supplementary Information B: Full Survey of Study 1 ............................................. 145Supplementary Information C: Full Surveys of Studies 2a and 2b ............................ 201Supplementary Information D: Full Survey of Study 3 ............................................. 304Supplementary Information References ..................................................................... 361
www.pnas.org/cgi/doi/10.1073/pnas.1916883117
Supplementary Information AAnnotated Analyses of ‘Biased hate crime perceptions may reveal supremacist sympathies’
Jannis Kreienkamp, N. Pontus Leander, Maximilian Agostini
24-Feb-2020
ContentsData Import and Cleaning . . . . . . . . . . . . . . . . . . . . . . . . . . . . . . . . . . . . . . 1Study 1: Pittsburgh - Thousand Oaks . . . . . . . . . . . . . . . . . . . . . . . . . . . . . . . 3Study 2a: Christchurch . . . . . . . . . . . . . . . . . . . . . . . . . . . . . . . . . . . . . . . . 45Study 2b: Utrecht . . . . . . . . . . . . . . . . . . . . . . . . . . . . . . . . . . . . . . . . . . . . 74Meta Analysis . . . . . . . . . . . . . . . . . . . . . . . . . . . . . . . . . . . . . . . . . . . . . . 100Study 3: El Paso and Dayton . . . . . . . . . . . . . . . . . . . . . . . . . . . . . . . . . . . . 112Software Info . . . . . . . . . . . . . . . . . . . . . . . . . . . . . . . . . . . . . . . . . . . . . . . 140
The data sets are available at: https://osf.io/p9yca/
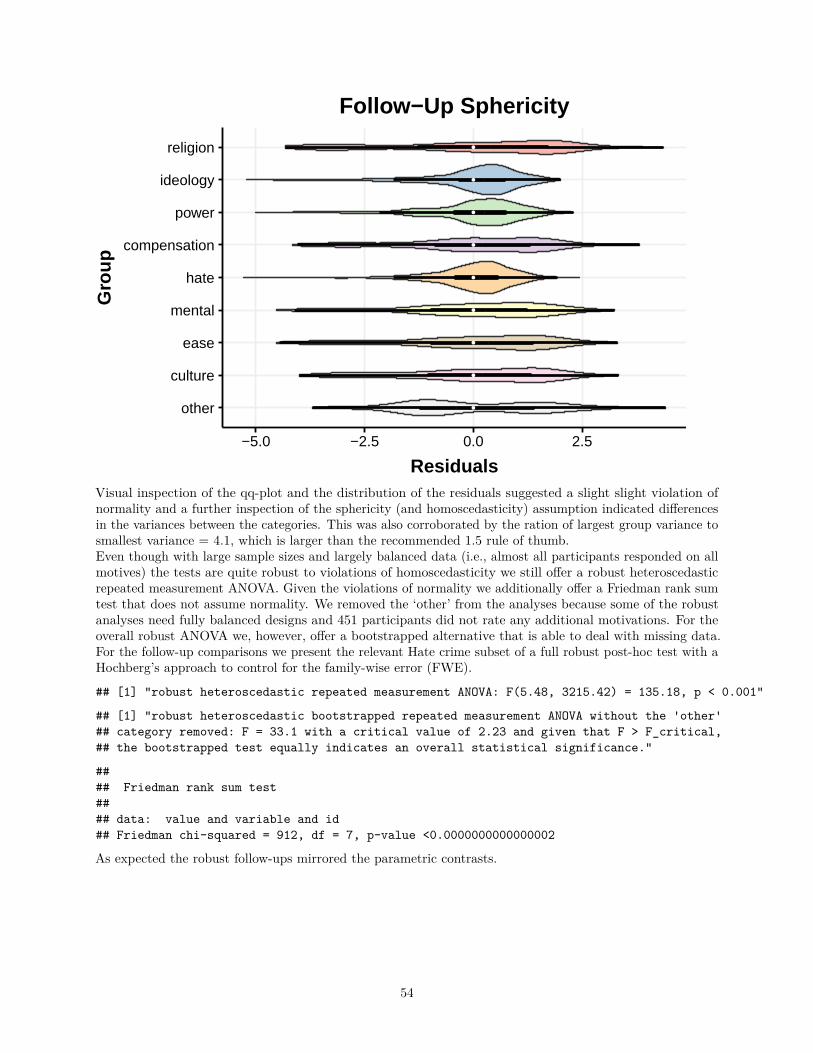
Note. Box-plots display the interquartile range (IQR, center box), and the whiskers extend 1.5*IQR from the lower and upper hinge. The white point indicates the mean and the white center line indicates the median.
Data Import and CleaningRaw Data
In a first step we import the raw Qualtrics data, which was downloaded as an SPSS file.
Data format and number of participants in the raw data:
## List of 5## $ PittTsdOaks :Classes 'tbl_df', 'tbl' and 'data.frame': 770 obs. of 404 variables:## $ PittTsdOaksCleaned:Classes 'tbl_df', 'tbl' and 'data.frame': 380 obs. of 513 variables:## $ Christchurch :Classes 'tbl_df', 'tbl' and 'data.frame': 828 obs. of 449 variables:## $ Utrecht :Classes 'tbl_df', 'tbl' and 'data.frame': 544 obs. of 376 variables:## $ ElPasoDayton :Classes 'tbl_df', 'tbl' and 'data.frame': 910 obs. of 425 variables:
1
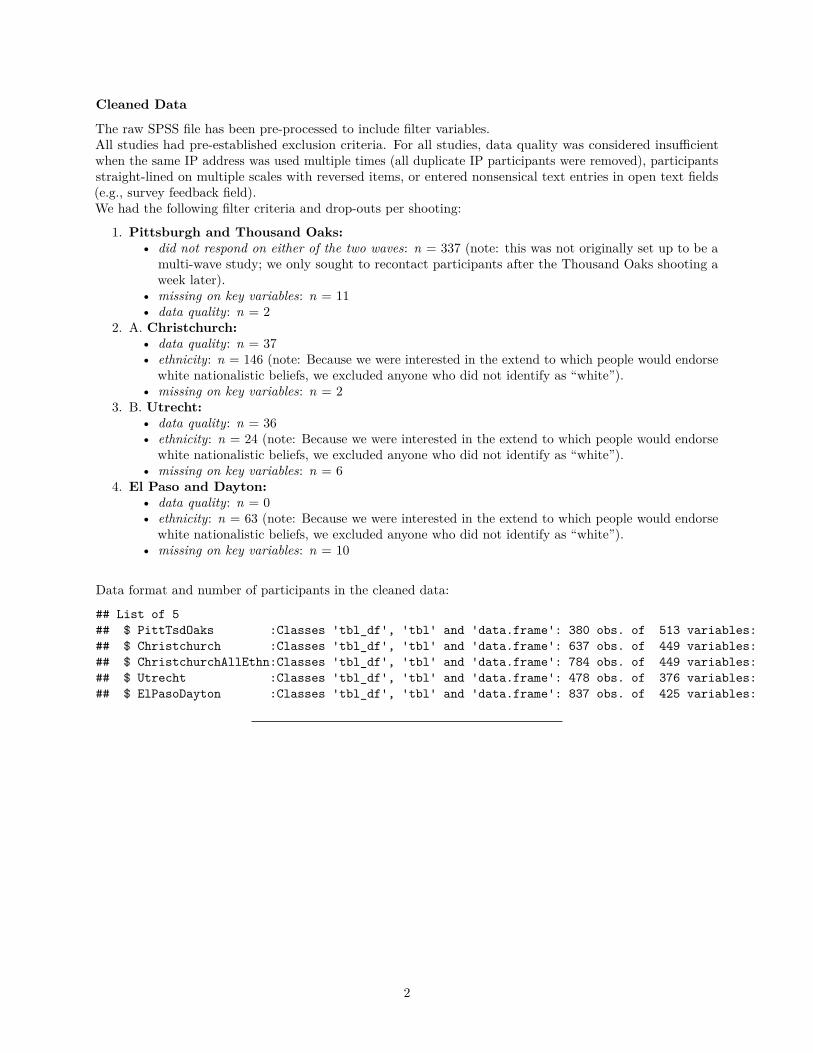
Cleaned Data
The raw SPSS file has been pre-processed to include filter variables.All studies had pre-established exclusion criteria. For all studies, data quality was considered insufficientwhen the same IP address was used multiple times (all duplicate IP participants were removed), participantsstraight-lined on multiple scales with reversed items, or entered nonsensical text entries in open text fields(e.g., survey feedback field).We had the following filter criteria and drop-outs per shooting:
1. Pittsburgh and Thousand Oaks:• did not respond on either of the two waves: n = 337 (note: this was not originally set up to be a
multi-wave study; we only sought to recontact participants after the Thousand Oaks shooting aweek later).
• missing on key variables: n = 11• data quality: n = 2
2. A. Christchurch:• data quality: n = 37• ethnicity: n = 146 (note: Because we were interested in the extend to which people would endorse
white nationalistic beliefs, we excluded anyone who did not identify as “white”).• missing on key variables: n = 2
3. B. Utrecht:• data quality: n = 36• ethnicity: n = 24 (note: Because we were interested in the extend to which people would endorse
white nationalistic beliefs, we excluded anyone who did not identify as “white”).• missing on key variables: n = 6
4. El Paso and Dayton:• data quality: n = 0• ethnicity: n = 63 (note: Because we were interested in the extend to which people would endorse
white nationalistic beliefs, we excluded anyone who did not identify as “white”).• missing on key variables: n = 10
Data format and number of participants in the cleaned data:
## List of 5## $ PittTsdOaks :Classes 'tbl_df', 'tbl' and 'data.frame': 380 obs. of 513 variables:## $ Christchurch :Classes 'tbl_df', 'tbl' and 'data.frame': 637 obs. of 449 variables:## $ ChristchurchAllEthn:Classes 'tbl_df', 'tbl' and 'data.frame': 784 obs. of 449 variables:## $ Utrecht :Classes 'tbl_df', 'tbl' and 'data.frame': 478 obs. of 376 variables:## $ ElPasoDayton :Classes 'tbl_df', 'tbl' and 'data.frame': 837 obs. of 425 variables:
2
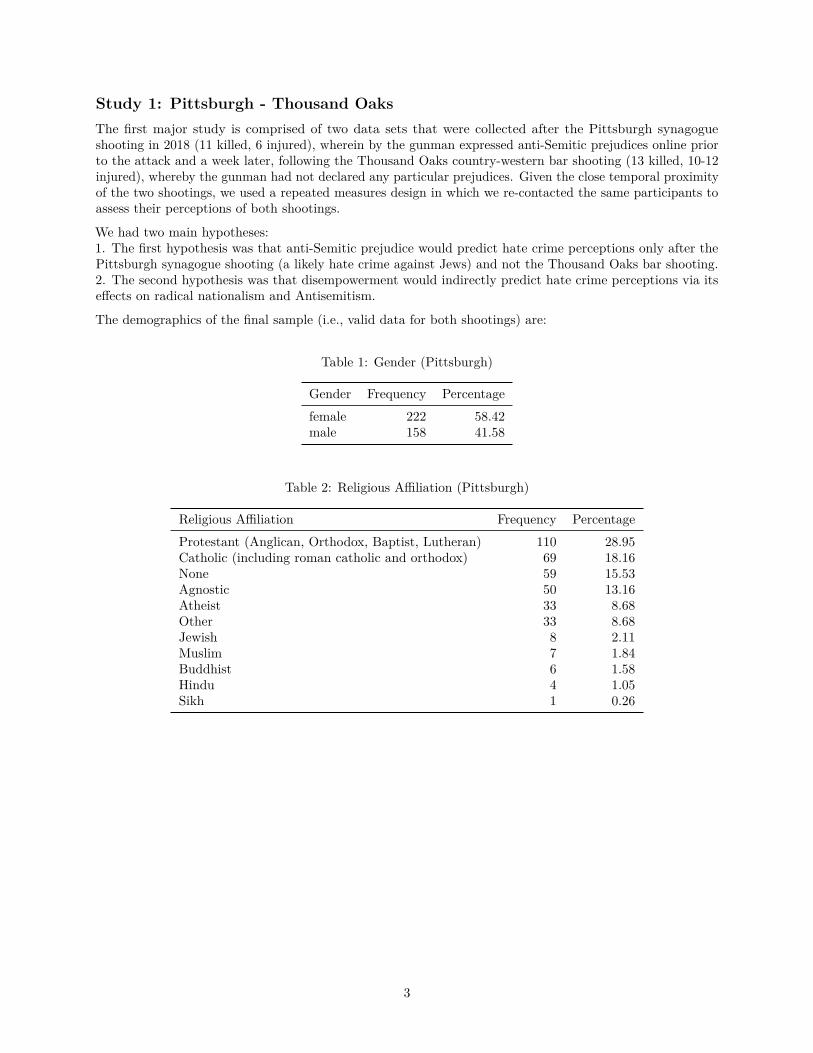
Study 1: Pittsburgh - Thousand OaksThe first major study is comprised of two data sets that were collected after the Pittsburgh synagogueshooting in 2018 (11 killed, 6 injured), wherein by the gunman expressed anti-Semitic prejudices online priorto the attack and a week later, following the Thousand Oaks country-western bar shooting (13 killed, 10-12injured), whereby the gunman had not declared any particular prejudices. Given the close temporal proximityof the two shootings, we used a repeated measures design in which we re-contacted the same participants toassess their perceptions of both shootings.
We had two main hypotheses:1. The first hypothesis was that anti-Semitic prejudice would predict hate crime perceptions only after thePittsburgh synagogue shooting (a likely hate crime against Jews) and not the Thousand Oaks bar shooting.2. The second hypothesis was that disempowerment would indirectly predict hate crime perceptions via itseffects on radical nationalism and Antisemitism.
The demographics of the final sample (i.e., valid data for both shootings) are:
Table 1: Gender (Pittsburgh)
Gender Frequency Percentagefemale 222 58.42male 158 41.58
Table 2: Religious Affiliation (Pittsburgh)
Religious Affiliation Frequency PercentageProtestant (Anglican, Orthodox, Baptist, Lutheran) 110 28.95Catholic (including roman catholic and orthodox) 69 18.16None 59 15.53Agnostic 50 13.16Atheist 33 8.68Other 33 8.68Jewish 8 2.11Muslim 7 1.84Buddhist 6 1.58Hindu 4 1.05Sikh 1 0.26
3
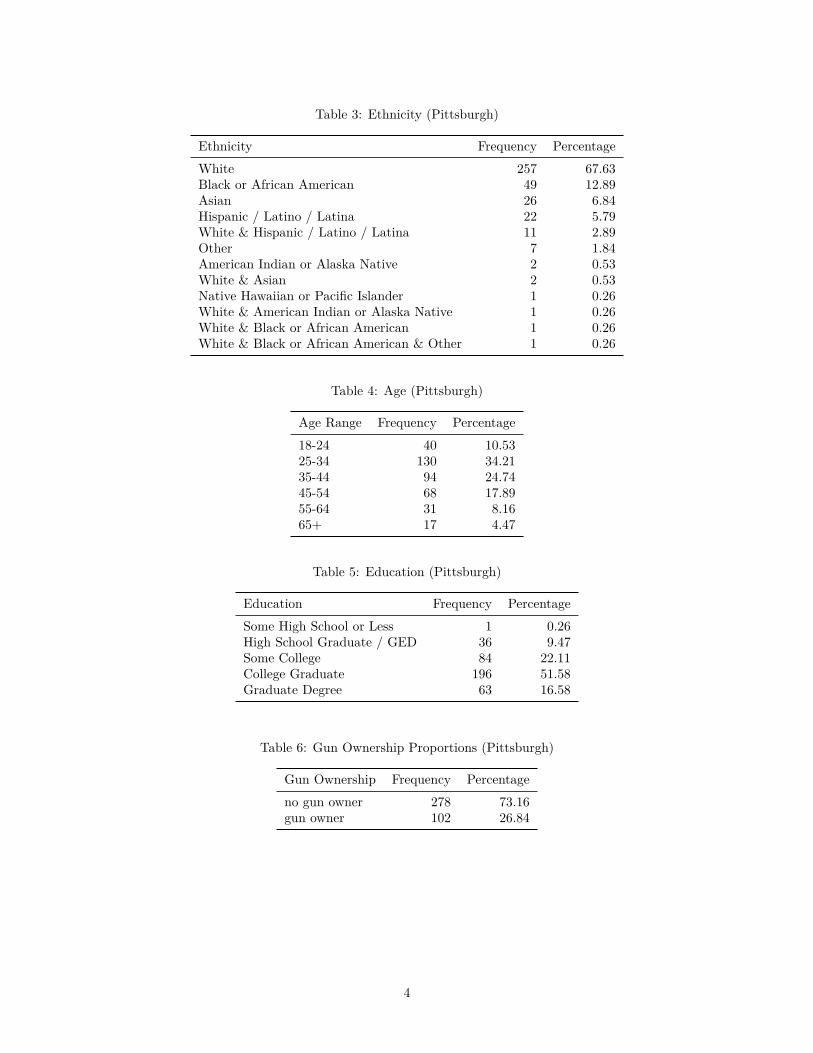
Table 3: Ethnicity (Pittsburgh)
Ethnicity Frequency PercentageWhite 257 67.63Black or African American 49 12.89Asian 26 6.84Hispanic / Latino / Latina 22 5.79White & Hispanic / Latino / Latina 11 2.89Other 7 1.84American Indian or Alaska Native 2 0.53White & Asian 2 0.53Native Hawaiian or Pacific Islander 1 0.26White & American Indian or Alaska Native 1 0.26White & Black or African American 1 0.26White & Black or African American & Other 1 0.26
Table 4: Age (Pittsburgh)
Age Range Frequency Percentage18-24 40 10.5325-34 130 34.2135-44 94 24.7445-54 68 17.8955-64 31 8.1665+ 17 4.47
Table 5: Education (Pittsburgh)
Education Frequency PercentageSome High School or Less 1 0.26High School Graduate / GED 36 9.47Some College 84 22.11College Graduate 196 51.58Graduate Degree 63 16.58
Table 6: Gun Ownership Proportions (Pittsburgh)
Gun Ownership Frequency Percentageno gun owner 278 73.16gun owner 102 26.84
4
Scale Construction
In order to test our two hypotheses we first assess all variables and create appropriate scale variables.
Hate Crime Attribution Pittsburgh
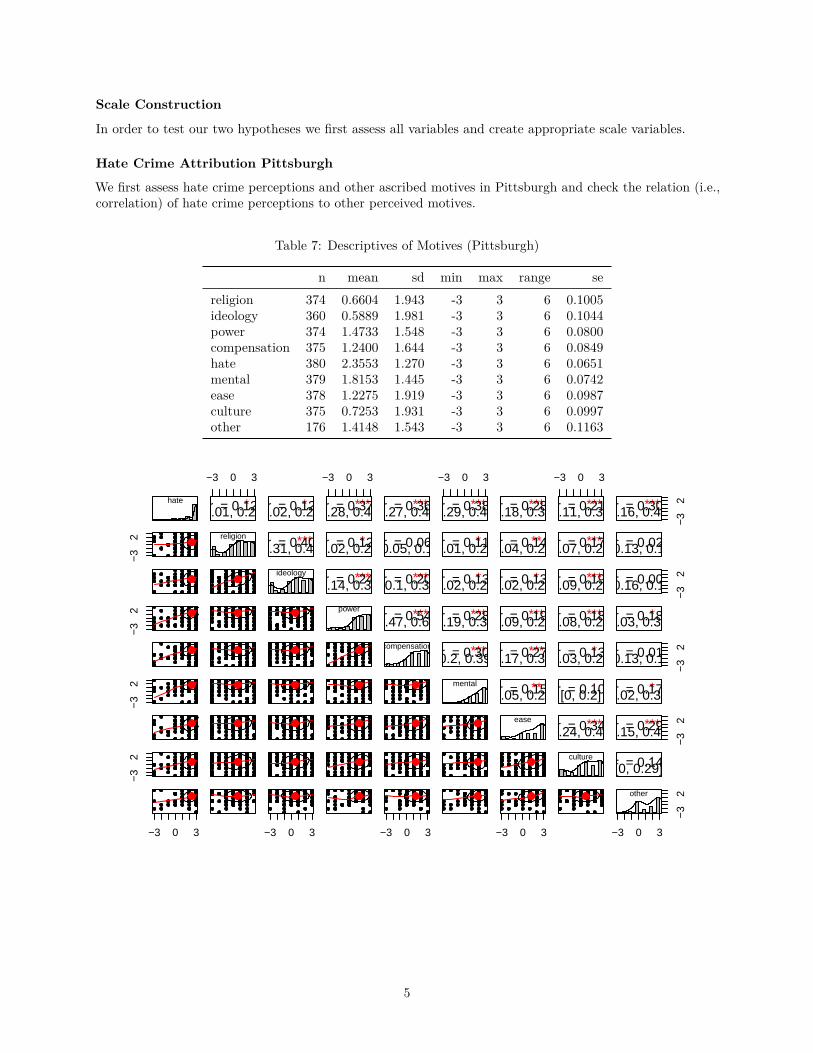
We first assess hate crime perceptions and other ascribed motives in Pittsburgh and check the relation (i.e.,correlation) of hate crime perceptions to other perceived motives.
Table 7: Descriptives of Motives (Pittsburgh)
n mean sd min max range sereligion 374 0.6604 1.943 -3 3 6 0.1005ideology 360 0.5889 1.981 -3 3 6 0.1044power 374 1.4733 1.548 -3 3 6 0.0800compensation 375 1.2400 1.644 -3 3 6 0.0849hate 380 2.3553 1.270 -3 3 6 0.0651mental 379 1.8153 1.445 -3 3 6 0.0742ease 378 1.2275 1.919 -3 3 6 0.0987culture 375 0.7253 1.931 -3 3 6 0.0997other 176 1.4148 1.543 -3 3 6 0.1163
hate
−3
2−
32
−3
2−
32
−3 0 3
−3 0 3
*r = 0.12[0.01, 0.21]
religion
*r = 0.12[0.02, 0.22]
***r = 0.40[0.31, 0.48]
ideology
−3 0 3
−3 0 3
***r = 0.37[0.28, 0.46]
*r = 0.12[0.02, 0.22]
***r = 0.24[0.14, 0.33]
power
***r = 0.36[0.27, 0.44]
r = 0.06[−0.05, 0.16]
***r = 0.20[0.1, 0.3]
***r = 0.54[0.47, 0.61]
compensation
−3 0 3
−3 0 3
***r = 0.38[0.29, 0.47]
*r = 0.11[0.01, 0.21]
*r = 0.13[0.02, 0.23]
***r = 0.28[0.19, 0.37]
***r = 0.30[0.2, 0.39]
mental
***r = 0.28[0.18, 0.37]
**r = 0.14[0.04, 0.24]
*r = 0.13[0.02, 0.23]
***r = 0.19[0.09, 0.29]
***r = 0.27[0.17, 0.36]
**r = 0.15[0.05, 0.25]
ease
−3 0 3
−3 0 3
***r = 0.21[0.11, 0.31]
***r = 0.17[0.07, 0.27]
***r = 0.19[0.09, 0.29]
***r = 0.18[0.08, 0.28]
*r = 0.13[0.03, 0.23]
.r = 0.10[0, 0.2]
***r = 0.34[0.24, 0.42]
culture
−3
2***r = 0.30[0.16, 0.43]
r = 0.02[−0.13, 0.17]
−3
2 r = 0.00[−0.16, 0.15]
*r = 0.18[0.03, 0.32]
−3
2 r = 0.01[−0.13, 0.16]
*r = 0.17[0.02, 0.31]−
32***r = 0.29[0.15, 0.42]
.r = 0.14[0, 0.29]
−3 0 3
−3
2other
5
0
100
200
−2 0 2Hate Crime Attribution Pittsburgh
coun
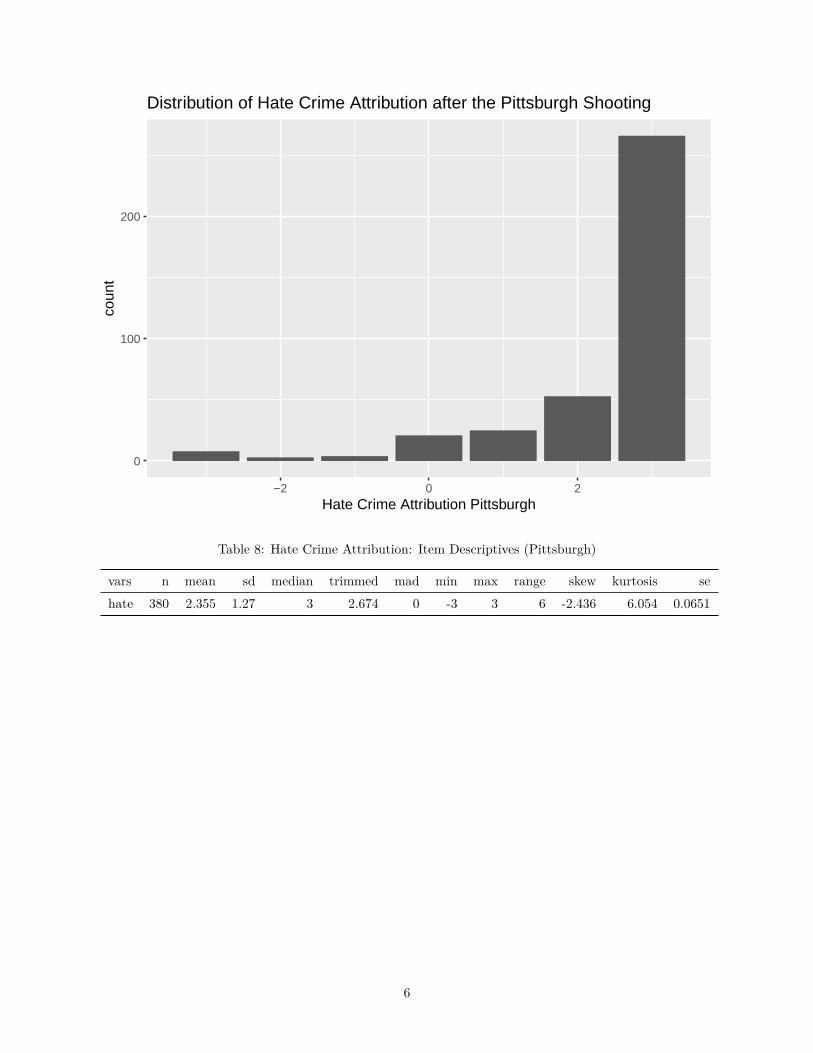
tDistribution of Hate Crime Attribution after the Pittsburgh Shooting
Table 8: Hate Crime Attribution: Item Descriptives (Pittsburgh)
vars n mean sd median trimmed mad min max range skew kurtosis sehate 380 2.355 1.27 3 2.674 0 -3 3 6 -2.436 6.054 0.0651
6
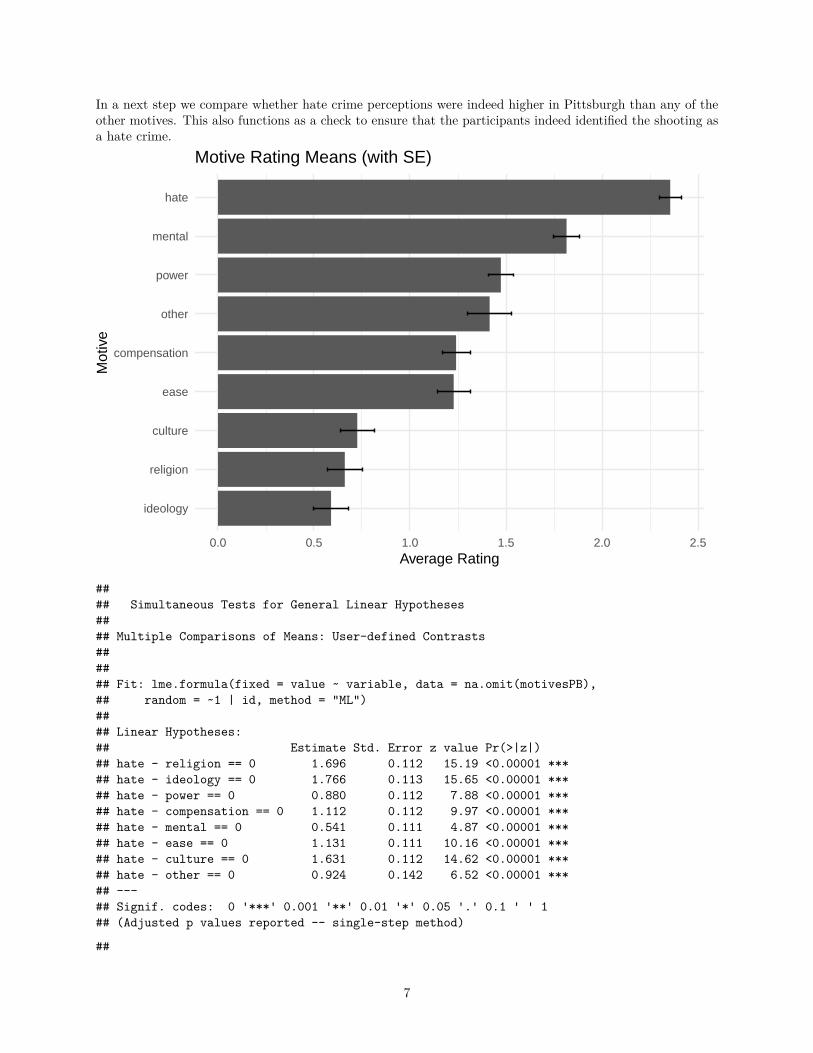
In a next step we compare whether hate crime perceptions were indeed higher in Pittsburgh than any of theother motives. This also functions as a check to ensure that the participants indeed identified the shooting asa hate crime.
ideology
religion
culture
ease
compensation
other
power
mental
hate
0.0 0.5 1.0 1.5 2.0 2.5Average Rating
Mot
ive
Motive Rating Means (with SE)
#### Simultaneous Tests for General Linear Hypotheses#### Multiple Comparisons of Means: User-defined Contrasts###### Fit: lme.formula(fixed = value ~ variable, data = na.omit(motivesPB),## random = ~1 | id, method = "ML")#### Linear Hypotheses:## Estimate Std. Error z value Pr(>|z|)## hate - religion == 0 1.696 0.112 15.19 <0.00001 ***## hate - ideology == 0 1.766 0.113 15.65 <0.00001 ***## hate - power == 0 0.880 0.112 7.88 <0.00001 ***## hate - compensation == 0 1.112 0.112 9.97 <0.00001 ***## hate - mental == 0 0.541 0.111 4.87 <0.00001 ***## hate - ease == 0 1.131 0.111 10.16 <0.00001 ***## hate - culture == 0 1.631 0.112 14.62 <0.00001 ***## hate - other == 0 0.924 0.142 6.52 <0.00001 ***## ---## Signif. codes: 0 '***' 0.001 '**' 0.01 '*' 0.05 '.' 0.1 ' ' 1## (Adjusted p values reported -- single-step method)
##
7
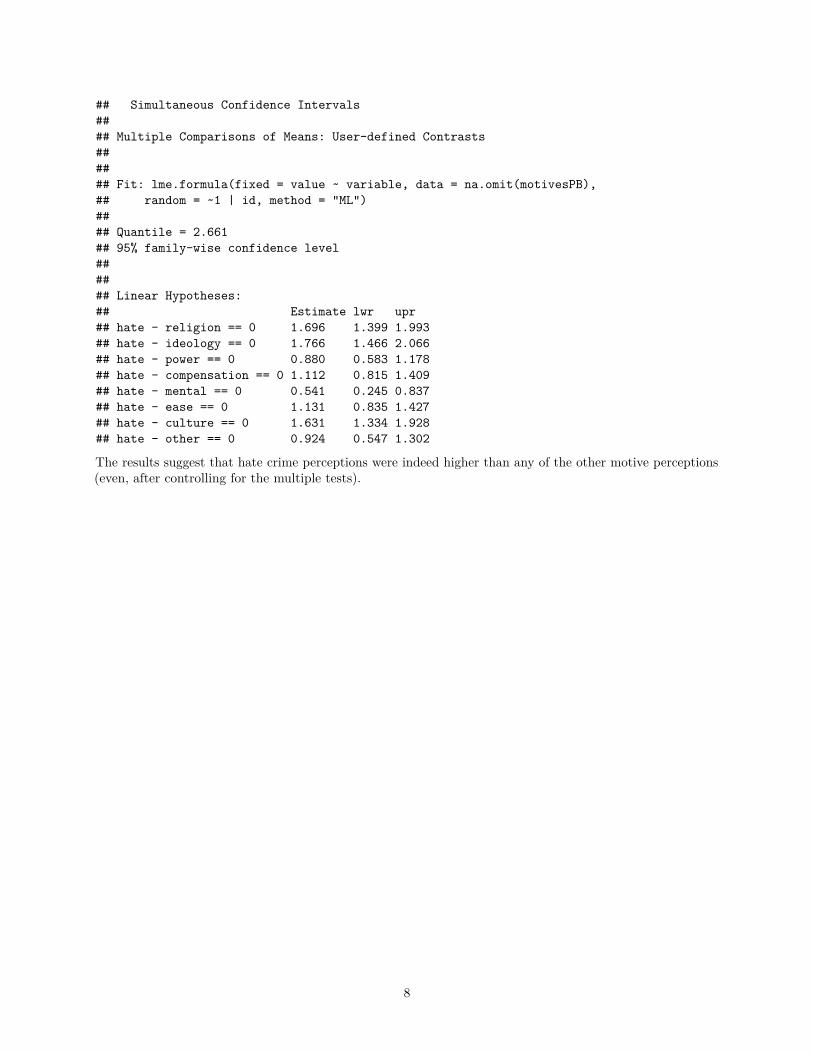
## Simultaneous Confidence Intervals#### Multiple Comparisons of Means: User-defined Contrasts###### Fit: lme.formula(fixed = value ~ variable, data = na.omit(motivesPB),## random = ~1 | id, method = "ML")#### Quantile = 2.661## 95% family-wise confidence level###### Linear Hypotheses:## Estimate lwr upr## hate - religion == 0 1.696 1.399 1.993## hate - ideology == 0 1.766 1.466 2.066## hate - power == 0 0.880 0.583 1.178## hate - compensation == 0 1.112 0.815 1.409## hate - mental == 0 0.541 0.245 0.837## hate - ease == 0 1.131 0.835 1.427## hate - culture == 0 1.631 1.334 1.928## hate - other == 0 0.924 0.547 1.302
The results suggest that hate crime perceptions were indeed higher than any of the other motive perceptions(even, after controlling for the multiple tests).
8
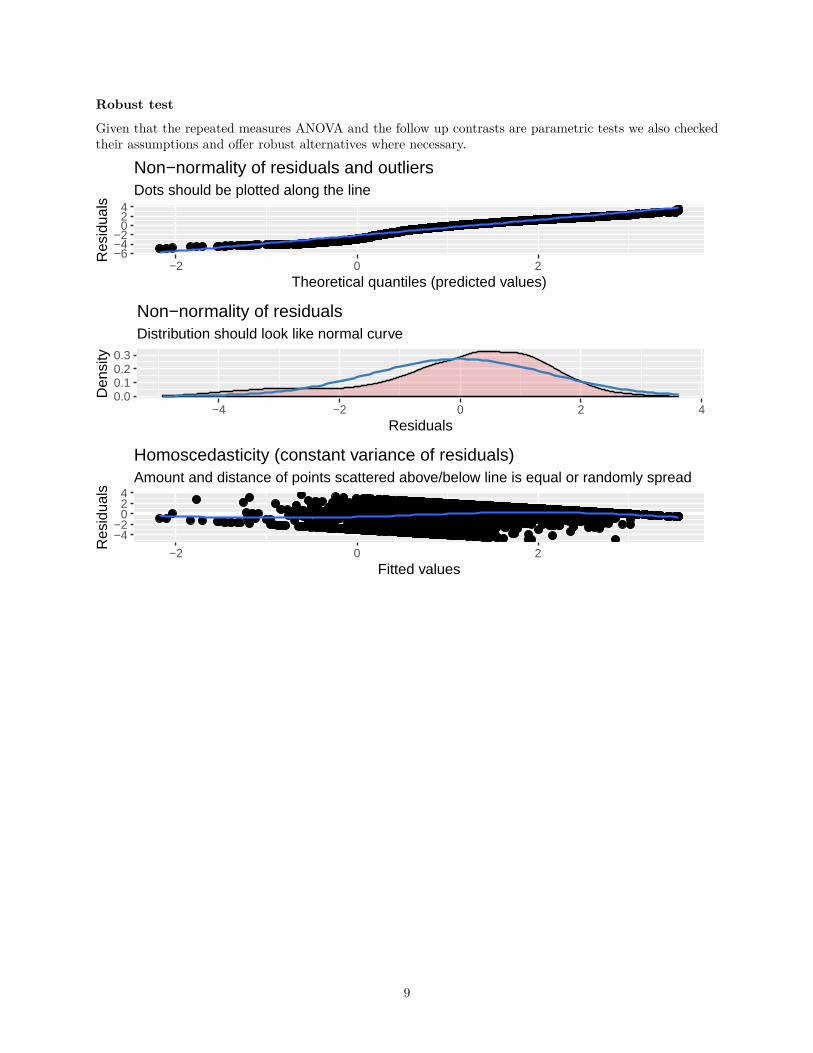
Robust test
Given that the repeated measures ANOVA and the follow up contrasts are parametric tests we also checkedtheir assumptions and offer robust alternatives where necessary.
−6−4−2
024
−2 0 2Theoretical quantiles (predicted values)
Res
idua
ls
Dots should be plotted along the line
Non−normality of residuals and outliers
0.00.10.20.3
−4 −2 0 2 4Residuals
Den
sity
Distribution should look like normal curve
Non−normality of residuals
−4−2
024
−2 0 2Fitted values
Res
idua
ls
Amount and distance of points scattered above/below line is equal or randomly spread
Homoscedasticity (constant variance of residuals)
9
other
culture
ease
mental
hate
compensation
power
ideology
religion
−4 −2 0 2 4
Residuals
Gro
upFollow−Up Sphericity
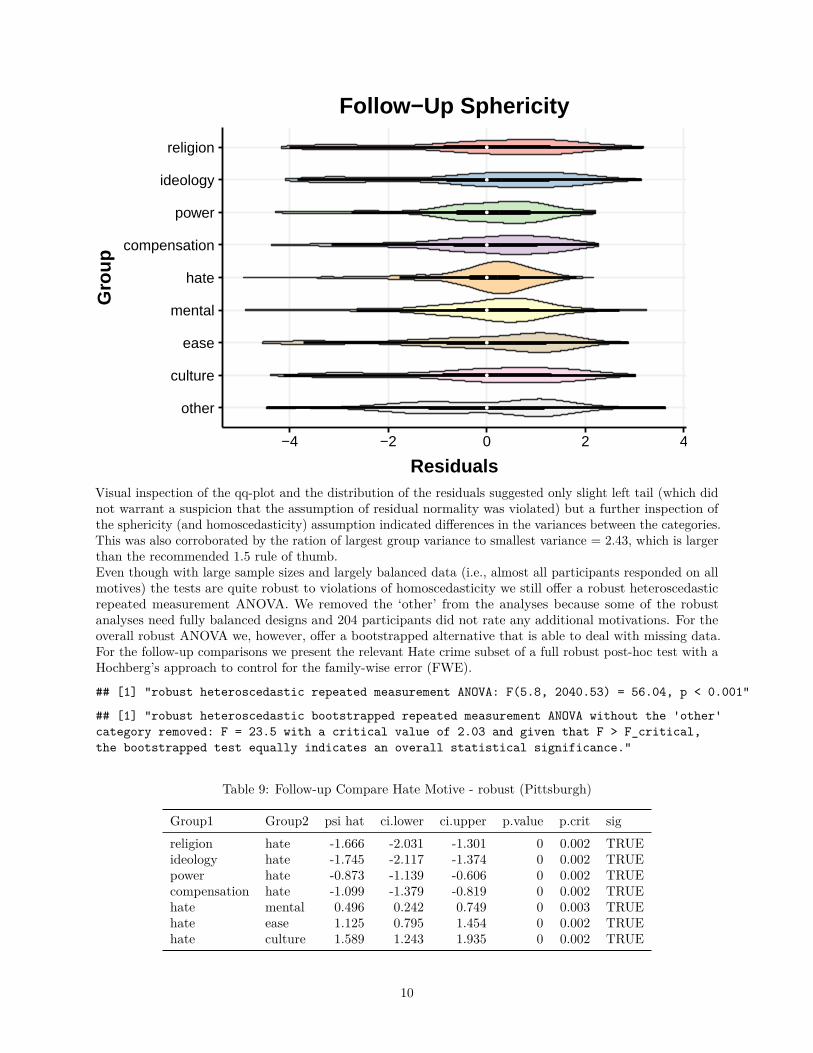
Visual inspection of the qq-plot and the distribution of the residuals suggested only slight left tail (which didnot warrant a suspicion that the assumption of residual normality was violated) but a further inspection ofthe sphericity (and homoscedasticity) assumption indicated differences in the variances between the categories.This was also corroborated by the ration of largest group variance to smallest variance = 2.43, which is largerthan the recommended 1.5 rule of thumb.Even though with large sample sizes and largely balanced data (i.e., almost all participants responded on allmotives) the tests are quite robust to violations of homoscedasticity we still offer a robust heteroscedasticrepeated measurement ANOVA. We removed the ‘other’ from the analyses because some of the robustanalyses need fully balanced designs and 204 participants did not rate any additional motivations. For theoverall robust ANOVA we, however, offer a bootstrapped alternative that is able to deal with missing data.For the follow-up comparisons we present the relevant Hate crime subset of a full robust post-hoc test with aHochberg’s approach to control for the family-wise error (FWE).
## [1] "robust heteroscedastic repeated measurement ANOVA: F(5.8, 2040.53) = 56.04, p < 0.001"
## [1] "robust heteroscedastic bootstrapped repeated measurement ANOVA without the 'other'category removed: F = 23.5 with a critical value of 2.03 and given that F > F_critical,the bootstrapped test equally indicates an overall statistical significance."
Table 9: Follow-up Compare Hate Motive - robust (Pittsburgh)
Group1 Group2 psi hat ci.lower ci.upper p.value p.crit sigreligion hate -1.666 -2.031 -1.301 0 0.002 TRUEideology hate -1.745 -2.117 -1.374 0 0.002 TRUEpower hate -0.873 -1.139 -0.606 0 0.002 TRUEcompensation hate -1.099 -1.379 -0.819 0 0.002 TRUEhate mental 0.496 0.242 0.749 0 0.003 TRUEhate ease 1.125 0.795 1.454 0 0.002 TRUEhate culture 1.589 1.243 1.935 0 0.002 TRUE
10

As expected the robust follow-ups mirrored the parametric contrasts.
11
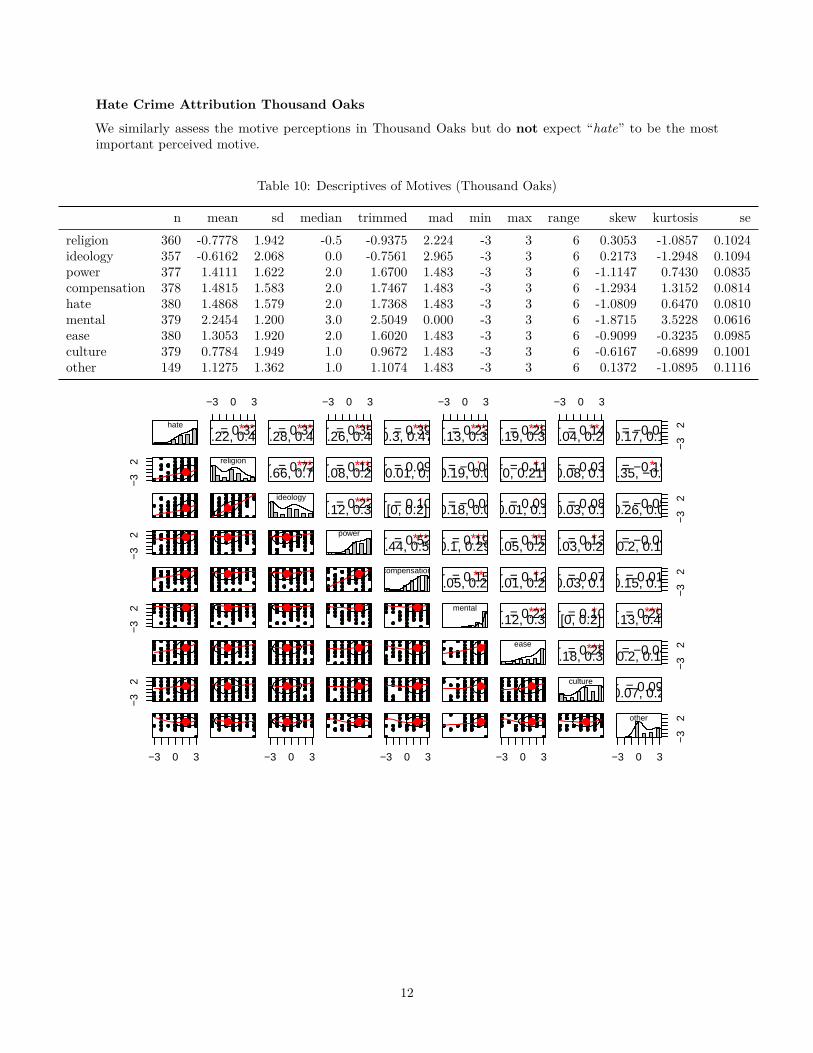
Hate Crime Attribution Thousand Oaks
We similarly assess the motive perceptions in Thousand Oaks but do not expect “hate” to be the mostimportant perceived motive.
Table 10: Descriptives of Motives (Thousand Oaks)
n mean sd median trimmed mad min max range skew kurtosis sereligion 360 -0.7778 1.942 -0.5 -0.9375 2.224 -3 3 6 0.3053 -1.0857 0.1024ideology 357 -0.6162 2.068 0.0 -0.7561 2.965 -3 3 6 0.2173 -1.2948 0.1094power 377 1.4111 1.622 2.0 1.6700 1.483 -3 3 6 -1.1147 0.7430 0.0835compensation 378 1.4815 1.583 2.0 1.7467 1.483 -3 3 6 -1.2934 1.3152 0.0814hate 380 1.4868 1.579 2.0 1.7368 1.483 -3 3 6 -1.0809 0.6470 0.0810mental 379 2.2454 1.200 3.0 2.5049 0.000 -3 3 6 -1.8715 3.5228 0.0616ease 380 1.3053 1.920 2.0 1.6020 1.483 -3 3 6 -0.9099 -0.3235 0.0985culture 379 0.7784 1.949 1.0 0.9672 1.483 -3 3 6 -0.6167 -0.6899 0.1001other 149 1.1275 1.362 1.0 1.1074 1.483 -3 3 6 0.1372 -1.0895 0.1116
hate
−3
2−
32
−3
2−
32
−3 0 3
−3 0 3
***r = 0.32[0.22, 0.41]
religion
***r = 0.37[0.28, 0.46]
***r = 0.72[0.66, 0.76]
ideology
−3 0 3
−3 0 3
***r = 0.35[0.26, 0.43]
***r = 0.18[0.08, 0.28]
***r = 0.22[0.12, 0.32]
power
***r = 0.39[0.3, 0.47]
.r = 0.09[−0.01, 0.2]
.r = 0.10[0, 0.2]
***r = 0.52[0.44, 0.59]
compensation
−3 0 3
−3 0 3
***r = 0.23[0.13, 0.32]
.r = −0.09[−0.19, 0.01]
r = −0.08[−0.18, 0.02]
***r = 0.19[0.1, 0.29]
**r = 0.15[0.05, 0.24]
mental
***r = 0.28[0.19, 0.37]
*r = 0.11[0, 0.21]
.r = 0.09[−0.01, 0.19]
**r = 0.15[0.05, 0.25]
*r = 0.12[0.01, 0.21]
***r = 0.22[0.12, 0.31]
ease
−3 0 3
−3 0 3
**r = 0.14[0.04, 0.24]
r = 0.03[−0.08, 0.13]
r = 0.08[−0.03, 0.18]
*r = 0.13[0.03, 0.23]
r = 0.07[−0.03, 0.17]
*r = 0.10[0, 0.2]
***r = 0.28[0.18, 0.37]
culture−
32
r = −0.01[−0.17, 0.15]
*r = −0.19[−0.35, −0.03]
−3
2 r = −0.09[−0.26, 0.08]
r = −0.04[−0.2, 0.12]
−3
2 r = 0.01[−0.15, 0.17]
***r = 0.29[0.13, 0.43]
−3
2 r = −0.04[−0.2, 0.12]
r = 0.09[−0.07, 0.25]
−3 0 3
−3
2other
12
0
30
60
90
120
−2 0 2Hate Crime Attribution Thousand Oaks
coun
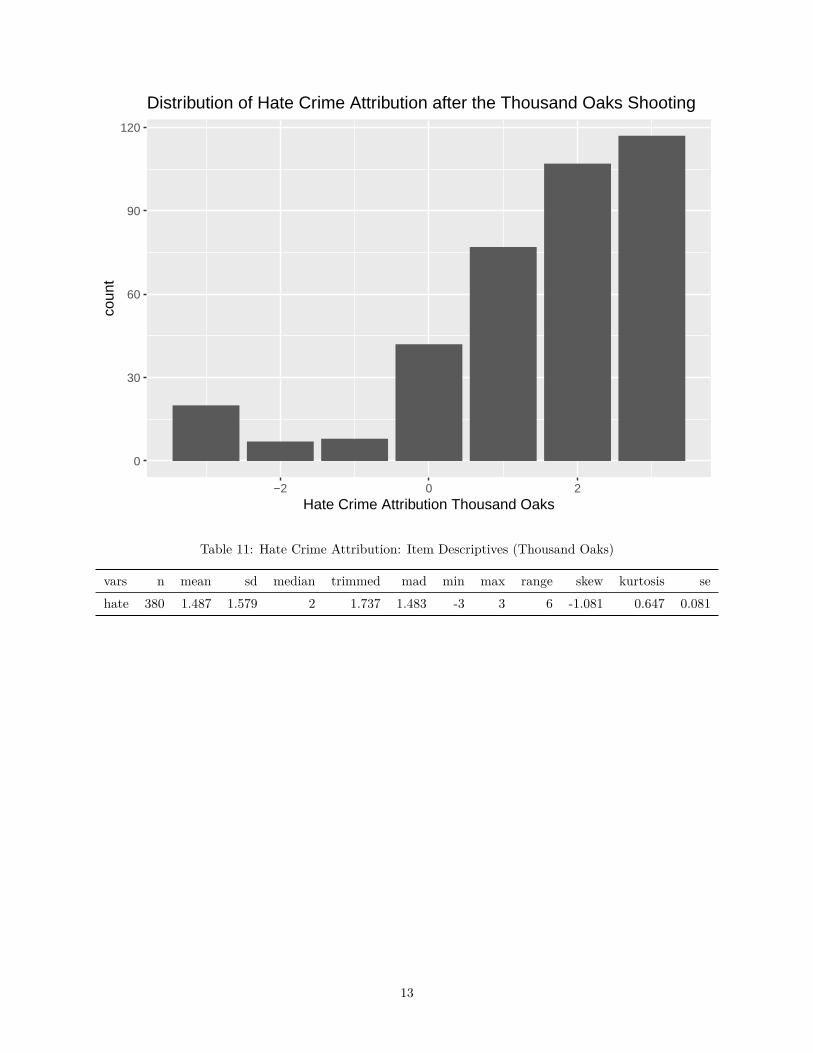
tDistribution of Hate Crime Attribution after the Thousand Oaks Shooting
Table 11: Hate Crime Attribution: Item Descriptives (Thousand Oaks)
vars n mean sd median trimmed mad min max range skew kurtosis sehate 380 1.487 1.579 2 1.737 1.483 -3 3 6 -1.081 0.647 0.081
13

We again formally contrast hate crime perceptions from the other motives.
religion
ideology
culture
other
ease
power
compensation
hate
mental
−1 0 1 2Average Rating
Mot
ive
Motive Rating Means (with SE)
#### Simultaneous Tests for General Linear Hypotheses#### Multiple Comparisons of Means: User-defined Contrasts###### Fit: lme.formula(fixed = value ~ variable, data = na.omit(motivesTO),## random = ~1 | id, method = "ML")#### Linear Hypotheses:## Estimate Std. Error z value Pr(>|z|)## hate - religion == 0 2.27029 0.11568 19.63 <0.001 ***## hate - ideology == 0 2.09787 0.11595 18.09 <0.001 ***## hate - power == 0 0.07833 0.11422 0.69 0.99## hate - compensation == 0 0.00373 0.11413 0.03 1.00## hate - mental == 0 -0.75599 0.11405 -6.63 <0.001 ***## hate - ease == 0 0.18158 0.11397 1.59 0.49## hate - culture == 0 0.71154 0.11405 6.24 <0.001 ***## hate - other == 0 0.32676 0.15447 2.12 0.19## ---## Signif. codes: 0 '***' 0.001 '**' 0.01 '*' 0.05 '.' 0.1 ' ' 1## (Adjusted p values reported -- single-step method)
#### Simultaneous Confidence Intervals##
14
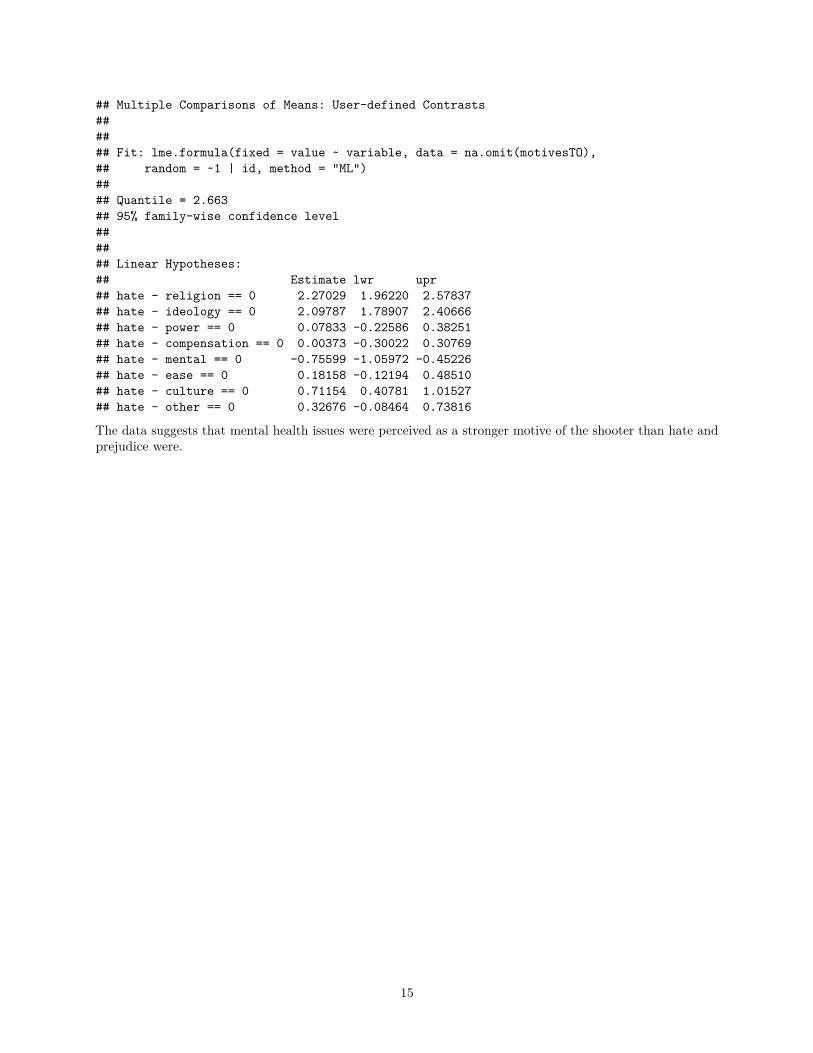
## Multiple Comparisons of Means: User-defined Contrasts###### Fit: lme.formula(fixed = value ~ variable, data = na.omit(motivesTO),## random = ~1 | id, method = "ML")#### Quantile = 2.663## 95% family-wise confidence level###### Linear Hypotheses:## Estimate lwr upr## hate - religion == 0 2.27029 1.96220 2.57837## hate - ideology == 0 2.09787 1.78907 2.40666## hate - power == 0 0.07833 -0.22586 0.38251## hate - compensation == 0 0.00373 -0.30022 0.30769## hate - mental == 0 -0.75599 -1.05972 -0.45226## hate - ease == 0 0.18158 -0.12194 0.48510## hate - culture == 0 0.71154 0.40781 1.01527## hate - other == 0 0.32676 -0.08464 0.73816
The data suggests that mental health issues were perceived as a stronger motive of the shooter than hate andprejudice were.
15
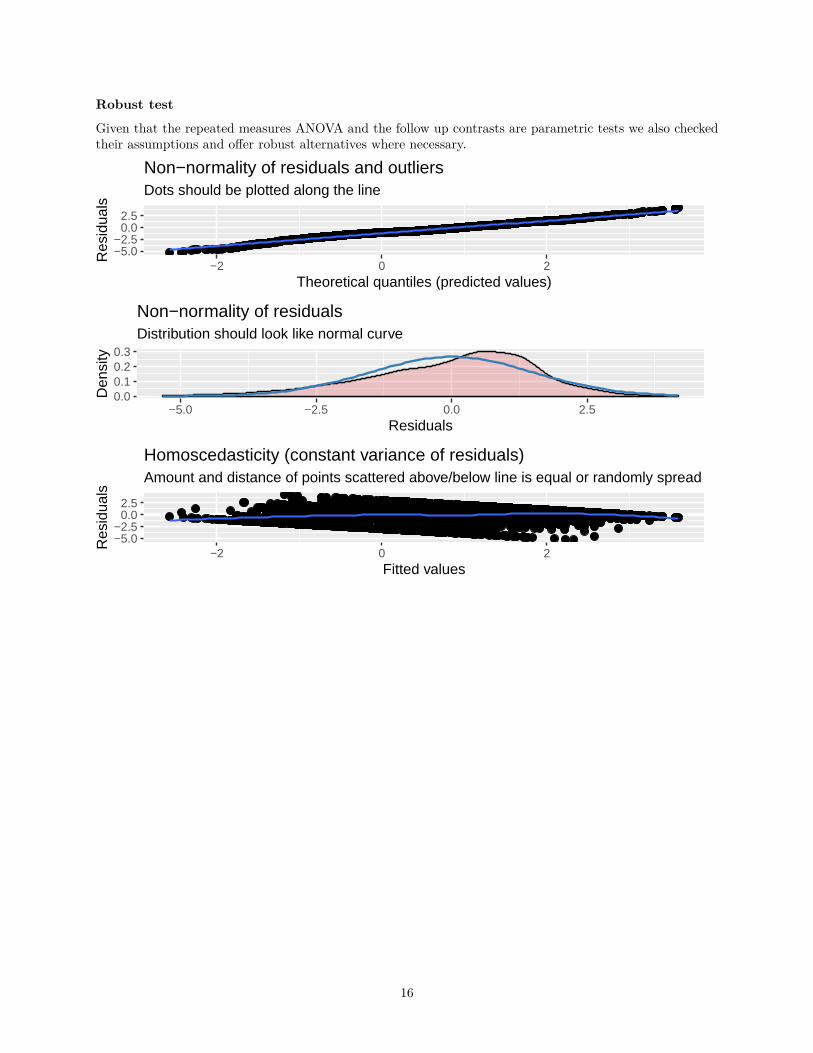
Robust test
Given that the repeated measures ANOVA and the follow up contrasts are parametric tests we also checkedtheir assumptions and offer robust alternatives where necessary.
−5.0−2.5
0.02.5
−2 0 2Theoretical quantiles (predicted values)
Res
idua
ls
Dots should be plotted along the line
Non−normality of residuals and outliers
0.00.10.20.3
−5.0 −2.5 0.0 2.5Residuals
Den
sity
Distribution should look like normal curve
Non−normality of residuals
−5.0−2.5
0.02.5
−2 0 2Fitted values
Res
idua
ls
Amount and distance of points scattered above/below line is equal or randomly spread
Homoscedasticity (constant variance of residuals)
16
other
culture
ease
mental
hate
compensation
power
ideology
religion
−5.0 −2.5 0.0 2.5
Residuals
Gro
upFollow−Up Sphericity
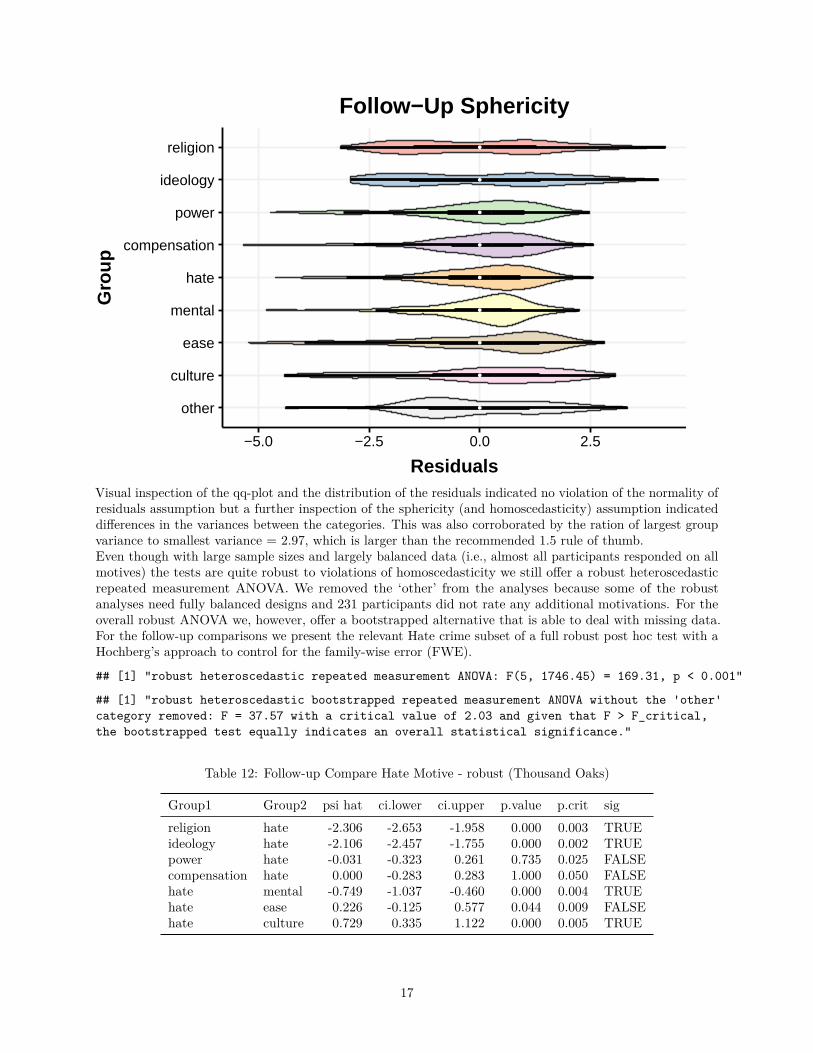
Visual inspection of the qq-plot and the distribution of the residuals indicated no violation of the normality ofresiduals assumption but a further inspection of the sphericity (and homoscedasticity) assumption indicateddifferences in the variances between the categories. This was also corroborated by the ration of largest groupvariance to smallest variance = 2.97, which is larger than the recommended 1.5 rule of thumb.Even though with large sample sizes and largely balanced data (i.e., almost all participants responded on allmotives) the tests are quite robust to violations of homoscedasticity we still offer a robust heteroscedasticrepeated measurement ANOVA. We removed the ‘other’ from the analyses because some of the robustanalyses need fully balanced designs and 231 participants did not rate any additional motivations. For theoverall robust ANOVA we, however, offer a bootstrapped alternative that is able to deal with missing data.For the follow-up comparisons we present the relevant Hate crime subset of a full robust post hoc test with aHochberg’s approach to control for the family-wise error (FWE).
## [1] "robust heteroscedastic repeated measurement ANOVA: F(5, 1746.45) = 169.31, p < 0.001"
## [1] "robust heteroscedastic bootstrapped repeated measurement ANOVA without the 'other'category removed: F = 37.57 with a critical value of 2.03 and given that F > F_critical,the bootstrapped test equally indicates an overall statistical significance."
Table 12: Follow-up Compare Hate Motive - robust (Thousand Oaks)
Group1 Group2 psi hat ci.lower ci.upper p.value p.crit sigreligion hate -2.306 -2.653 -1.958 0.000 0.003 TRUEideology hate -2.106 -2.457 -1.755 0.000 0.002 TRUEpower hate -0.031 -0.323 0.261 0.735 0.025 FALSEcompensation hate 0.000 -0.283 0.283 1.000 0.050 FALSEhate mental -0.749 -1.037 -0.460 0.000 0.004 TRUEhate ease 0.226 -0.125 0.577 0.044 0.009 FALSEhate culture 0.729 0.335 1.122 0.000 0.005 TRUE
17
As expected the robust follow-ups mirrored the parametric contrasts.
Change in Hate Crime Attributions:
In a final step, we then check for differences in “Motivated by Hate” between the two within subject samples.Here we would expect that hate crime perceptions were significantly higher for the Pittsburgh synagogueshooting than after the Thousand Oaks Bar shooting. This paired samples t-test also offers a sort of“manipulation check” to ensure that Pittsburgh was indeed, on average, more strongly perceived as a hatecrime than Thousand Oaks was (within participants).Given the differences in distribution between the re-contacts we also offer a rank based robust alternative.
#### Paired t-test#### data: hatePBTO$PB_Mot_PB_5 and hatePBTO$TO_Mot_PB_5## t = 9.1, df = 379, p-value <0.0000000000000002## alternative hypothesis: true difference in means is not equal to 0## 95 percent confidence interval:## 0.6812 1.0556## sample estimates:## mean of the differences## 0.8684
#### Wilcoxon signed rank test with continuity correction#### data: hatePBTO$PB_Mot_PB_5 and hatePBTO$TO_Mot_PB_5## V = 24988, p-value <0.0000000000000002## alternative hypothesis: true location shift is not equal to 0
The test results (both parametric and non-parametric) indicate that Pittsburgh was indeed, on average, morestrongly perceived as a hate crime than Thousand Oaks was (within participants).
Disempowerment Pittsburgh
For our antecedent Disempowerment measure after the Pittsburgh shooting we assess scale-ability andcombine the individual items into a single scale score.
Reliability Analysis of Disempowerment:
A spearman correlation matrix of 3 items was calculated and submitted to Reliability analysis.
The overall Cronbach’s Alpha was 0.79. Furthermore, deleting item(s) 3 may improve reliability. A gls factoranalysis was conducted. Items were regressed to a single factor. Their loadings are the following:
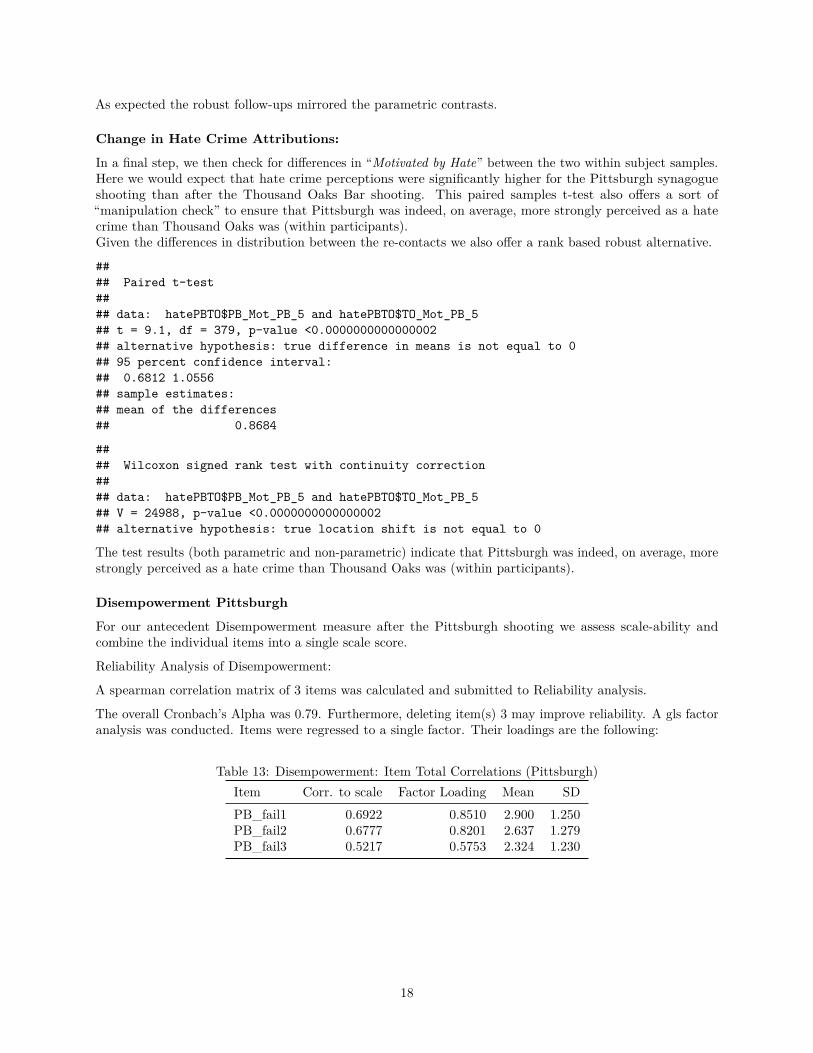
Table 13: Disempowerment: Item Total Correlations (Pittsburgh)Item Corr. to scale Factor Loading Mean SDPB_fail1 0.6922 0.8510 2.900 1.250PB_fail2 0.6777 0.8201 2.637 1.279PB_fail3 0.5217 0.5753 2.324 1.230
18
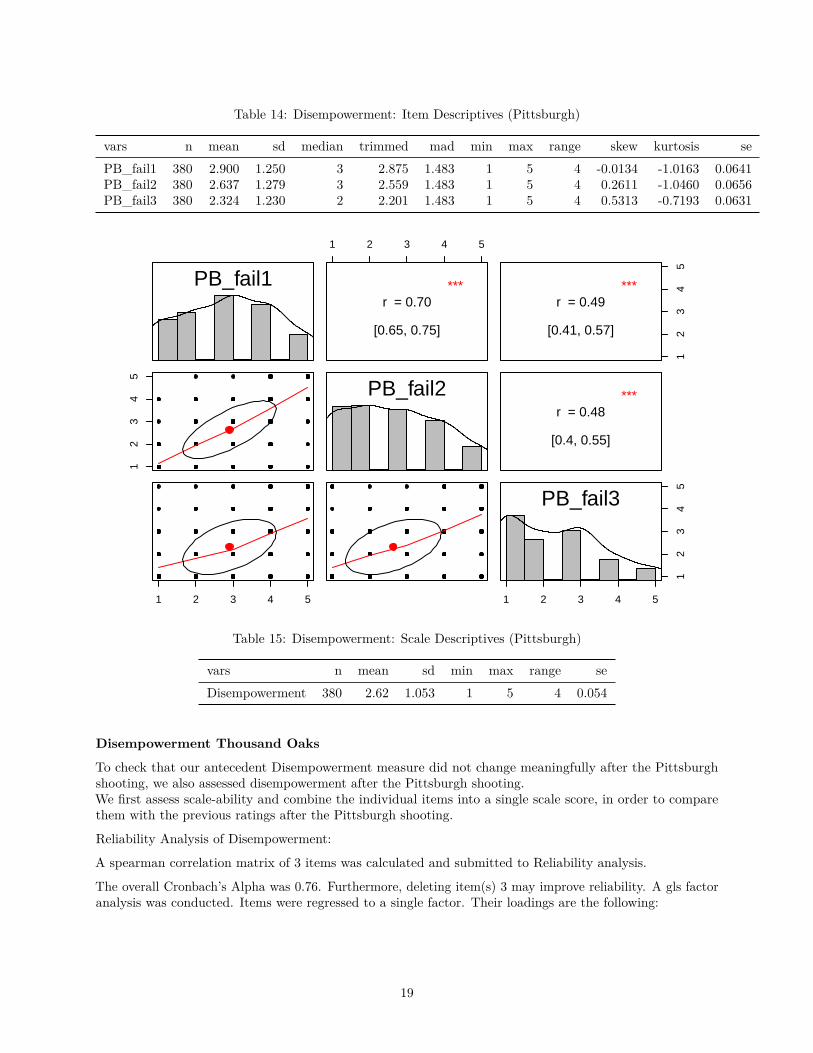
Table 14: Disempowerment: Item Descriptives (Pittsburgh)
vars n mean sd median trimmed mad min max range skew kurtosis sePB_fail1 380 2.900 1.250 3 2.875 1.483 1 5 4 -0.0134 -1.0163 0.0641PB_fail2 380 2.637 1.279 3 2.559 1.483 1 5 4 0.2611 -1.0460 0.0656PB_fail3 380 2.324 1.230 2 2.201 1.483 1 5 4 0.5313 -0.7193 0.0631
PB_fail1
12
34
5
1 2 3 4 5
1 2 3 4 5
***r = 0.70
[0.65, 0.75]
PB_fail2
12
34
5
***r = 0.49
[0.41, 0.57]
***r = 0.48
[0.4, 0.55]
1 2 3 4 5
12
34
5
PB_fail3
Table 15: Disempowerment: Scale Descriptives (Pittsburgh)
vars n mean sd min max range seDisempowerment 380 2.62 1.053 1 5 4 0.054
Disempowerment Thousand Oaks
To check that our antecedent Disempowerment measure did not change meaningfully after the Pittsburghshooting, we also assessed disempowerment after the Pittsburgh shooting.We first assess scale-ability and combine the individual items into a single scale score, in order to comparethem with the previous ratings after the Pittsburgh shooting.
Reliability Analysis of Disempowerment:
A spearman correlation matrix of 3 items was calculated and submitted to Reliability analysis.
The overall Cronbach’s Alpha was 0.76. Furthermore, deleting item(s) 3 may improve reliability. A gls factoranalysis was conducted. Items were regressed to a single factor. Their loadings are the following:
19
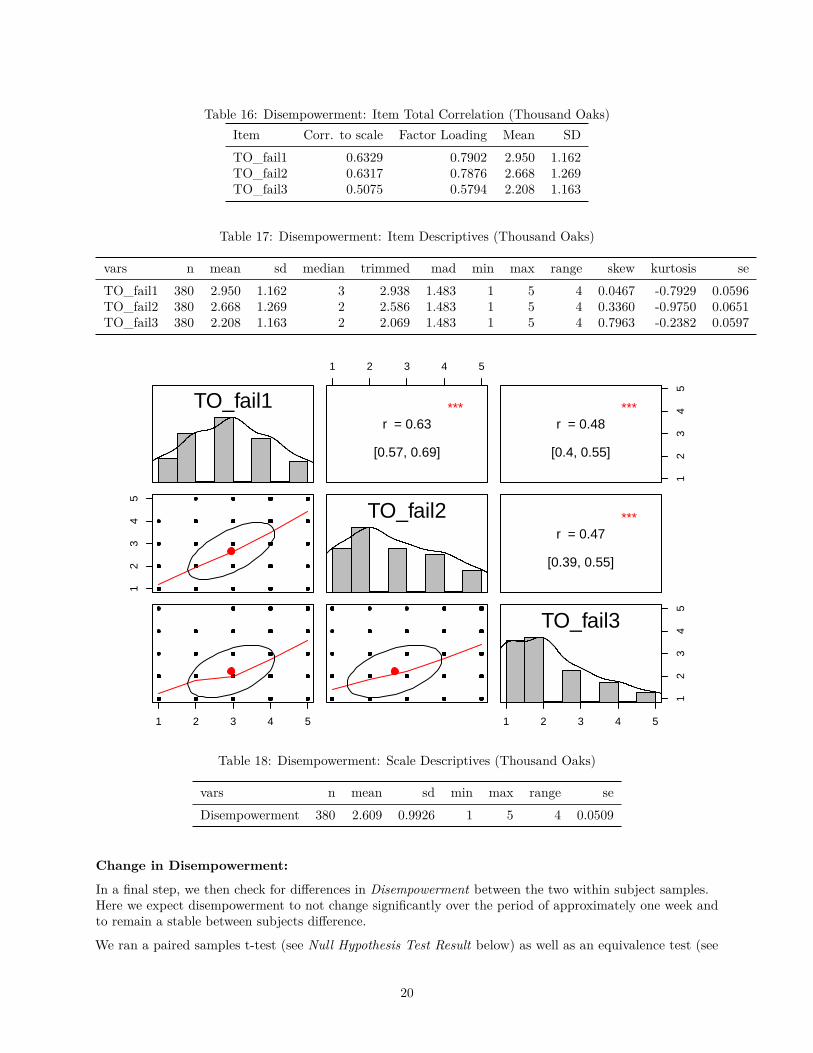
Table 16: Disempowerment: Item Total Correlation (Thousand Oaks)Item Corr. to scale Factor Loading Mean SDTO_fail1 0.6329 0.7902 2.950 1.162TO_fail2 0.6317 0.7876 2.668 1.269TO_fail3 0.5075 0.5794 2.208 1.163
Table 17: Disempowerment: Item Descriptives (Thousand Oaks)
vars n mean sd median trimmed mad min max range skew kurtosis seTO_fail1 380 2.950 1.162 3 2.938 1.483 1 5 4 0.0467 -0.7929 0.0596TO_fail2 380 2.668 1.269 2 2.586 1.483 1 5 4 0.3360 -0.9750 0.0651TO_fail3 380 2.208 1.163 2 2.069 1.483 1 5 4 0.7963 -0.2382 0.0597
TO_fail1
12
34
5
1 2 3 4 5
1 2 3 4 5
***r = 0.63
[0.57, 0.69]
TO_fail2
12
34
5
***r = 0.48
[0.4, 0.55]
***r = 0.47
[0.39, 0.55]
1 2 3 4 5
12
34
5
TO_fail3
Table 18: Disempowerment: Scale Descriptives (Thousand Oaks)
vars n mean sd min max range seDisempowerment 380 2.609 0.9926 1 5 4 0.0509
Change in Disempowerment:
In a final step, we then check for differences in Disempowerment between the two within subject samples.Here we expect disempowerment to not change significantly over the period of approximately one week andto remain a stable between subjects difference.
We ran a paired samples t-test (see Null Hypothesis Test Result below) as well as an equivalence test (see
20
Equivalence Test Result below) to ensure that the difference was not larger than a minimal effect size ofinterest (in our case a Cohen’s D of 0.3; also see Lakens, Scheel, & Isager, 2018. Equivalence Testing forPsychological Research: A Tutorial. https://doi.org/10.1177/2515245918770963 ).
−0.3 −0.2 −0.1 0.0 0.1 0.2 0.3
Mean Difference
Equivalence bounds −0.237 and 0.237Mean difference = 0.011
TOST: 90% CI [−0.055;0.078] significant NHST: 95% CI [−0.068;0.091] non−significant
## TOST results:## t-value lower bound: 6.13 p-value lower bound: 0.000000001## t-value upper bound: -5.57 p-value upper bound: 0.00000002## degrees of freedom : 379#### Equivalence bounds (Cohen's d):## low eqbound: -0.3## high eqbound: 0.3#### Equivalence bounds (raw scores):## low eqbound: -0.237## high eqbound: 0.237#### TOST confidence interval:## lower bound 90% CI: -0.055## upper bound 90% CI: 0.078#### NHST confidence interval:## lower bound 95% CI: -0.068## upper bound 95% CI: 0.091##
21
## Equivalence Test Result:## The equivalence test was significant, t(379) = -5.567, p = 0.0000000246, given equivalence bounds## of -0.237 and 0.237 (on a raw scale) and an alpha of 0.05.## Null Hypothesis Test Result:## The null hypothesis test was non-significant, t(379) = 0.281, p = 0.779, given an alpha of 0.05.## Based on the equivalence test and the null-hypothesis test combined, we can conclude that## the observed effect is statistically not different from zero and statistically equivalent to zero.
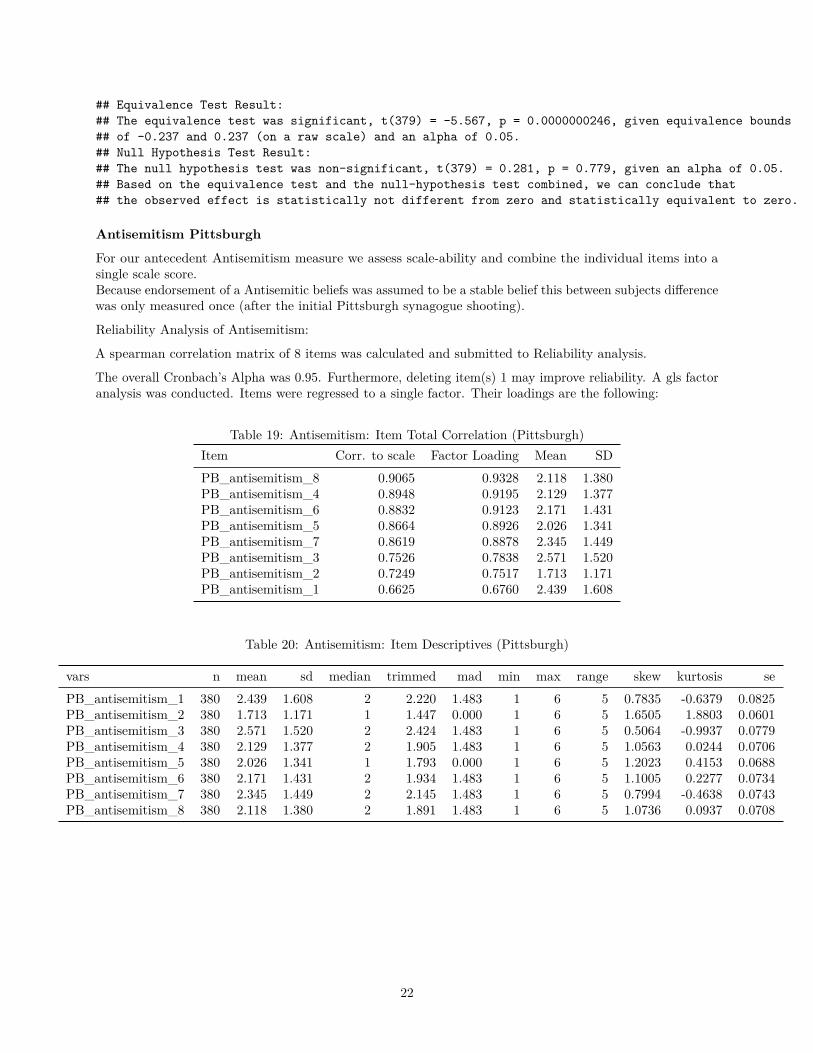
Antisemitism Pittsburgh
For our antecedent Antisemitism measure we assess scale-ability and combine the individual items into asingle scale score.Because endorsement of a Antisemitic beliefs was assumed to be a stable belief this between subjects differencewas only measured once (after the initial Pittsburgh synagogue shooting).
Reliability Analysis of Antisemitism:
A spearman correlation matrix of 8 items was calculated and submitted to Reliability analysis.
The overall Cronbach’s Alpha was 0.95. Furthermore, deleting item(s) 1 may improve reliability. A gls factoranalysis was conducted. Items were regressed to a single factor. Their loadings are the following:
Table 19: Antisemitism: Item Total Correlation (Pittsburgh)Item Corr. to scale Factor Loading Mean SDPB_antisemitism_8 0.9065 0.9328 2.118 1.380PB_antisemitism_4 0.8948 0.9195 2.129 1.377PB_antisemitism_6 0.8832 0.9123 2.171 1.431PB_antisemitism_5 0.8664 0.8926 2.026 1.341PB_antisemitism_7 0.8619 0.8878 2.345 1.449PB_antisemitism_3 0.7526 0.7838 2.571 1.520PB_antisemitism_2 0.7249 0.7517 1.713 1.171PB_antisemitism_1 0.6625 0.6760 2.439 1.608
Table 20: Antisemitism: Item Descriptives (Pittsburgh)
vars n mean sd median trimmed mad min max range skew kurtosis sePB_antisemitism_1 380 2.439 1.608 2 2.220 1.483 1 6 5 0.7835 -0.6379 0.0825PB_antisemitism_2 380 1.713 1.171 1 1.447 0.000 1 6 5 1.6505 1.8803 0.0601PB_antisemitism_3 380 2.571 1.520 2 2.424 1.483 1 6 5 0.5064 -0.9937 0.0779PB_antisemitism_4 380 2.129 1.377 2 1.905 1.483 1 6 5 1.0563 0.0244 0.0706PB_antisemitism_5 380 2.026 1.341 1 1.793 0.000 1 6 5 1.2023 0.4153 0.0688PB_antisemitism_6 380 2.171 1.431 2 1.934 1.483 1 6 5 1.1005 0.2277 0.0734PB_antisemitism_7 380 2.345 1.449 2 2.145 1.483 1 6 5 0.7994 -0.4638 0.0743PB_antisemitism_8 380 2.118 1.380 2 1.891 1.483 1 6 5 1.0736 0.0937 0.0708
22
PB_antisemitism_11
41
41
4
1 3 5
14
1 3 5
***r = 0.50[0.43, 0.58]
PB_antisemitism_2
***r = 0.46[0.37, 0.53]
***r = 0.53[0.46, 0.6]
PB_antisemitism_3
1 3 5
1 3 5
***r = 0.57[0.49, 0.63]
***r = 0.70[0.65, 0.75]
***r = 0.69[0.63, 0.74]
PB_antisemitism_4
***r = 0.54[0.47, 0.61]
***r = 0.70[0.64, 0.74]
***r = 0.65[0.59, 0.7]
***r = 0.90[0.88, 0.92]
PB_antisemitism_5
1 3 5
1 3 5
***r = 0.57[0.49, 0.63]
***r = 0.66[0.6, 0.71]
***r = 0.71[0.66, 0.76]
***r = 0.80[0.77, 0.84]
***r = 0.77[0.72, 0.81]
PB_antisemitism_6
***r = 0.60[0.53, 0.66]
***r = 0.61[0.54, 0.67]
***r = 0.77[0.72, 0.81]
***r = 0.77[0.73, 0.81]
***r = 0.74[0.69, 0.78]
***r = 0.83[0.79, 0.85]
PB_antisemitism_7
1 3 5
1 3 5
14***r = 0.56[0.49, 0.63]
***r = 0.70[0.64, 0.74]
14***r = 0.71[0.66, 0.76]
***r = 0.88[0.86, 0.9]
14***r = 0.86[0.83, 0.88]
***r = 0.83[0.79, 0.86]
14***r = 0.80[0.76, 0.83]
PB_antisemitism_8
Table 21: Antisemitism: Scale Descriptives (Pittsburgh)
vars n mean sd min max range seantisemitism 380 2.189 1.203 1 6 5 0.0617
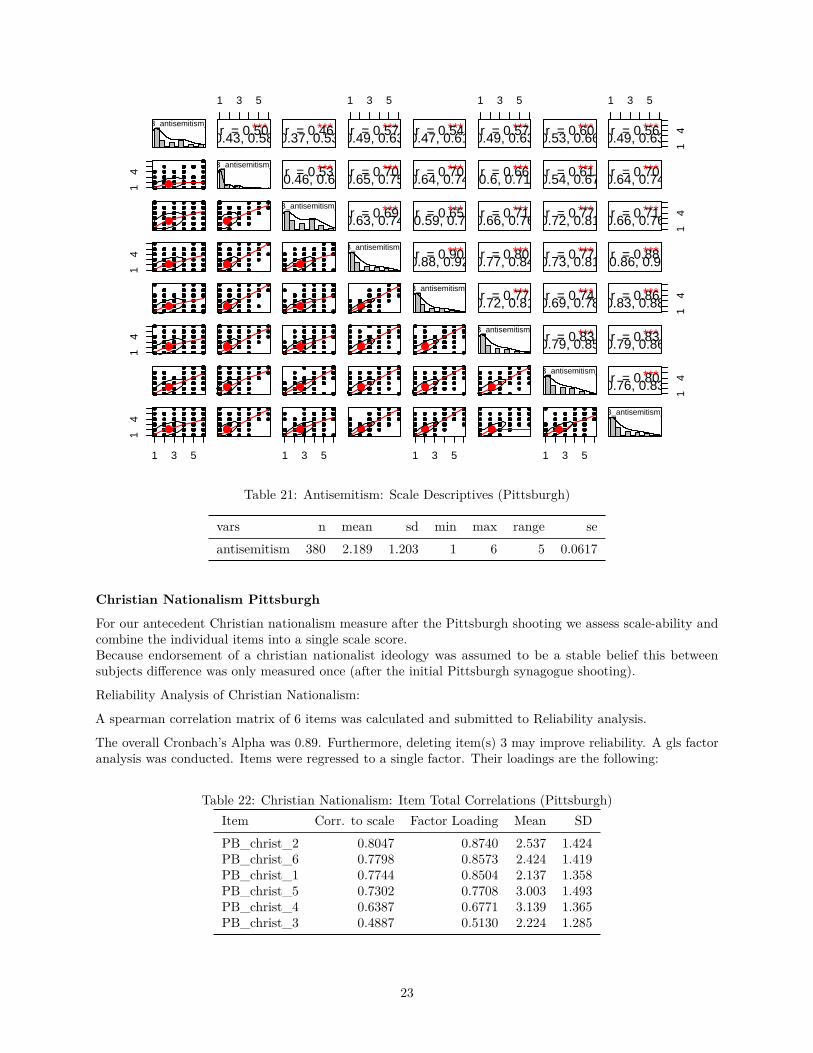
Christian Nationalism Pittsburgh
For our antecedent Christian nationalism measure after the Pittsburgh shooting we assess scale-ability andcombine the individual items into a single scale score.Because endorsement of a christian nationalist ideology was assumed to be a stable belief this betweensubjects difference was only measured once (after the initial Pittsburgh synagogue shooting).
Reliability Analysis of Christian Nationalism:
A spearman correlation matrix of 6 items was calculated and submitted to Reliability analysis.
The overall Cronbach’s Alpha was 0.89. Furthermore, deleting item(s) 3 may improve reliability. A gls factoranalysis was conducted. Items were regressed to a single factor. Their loadings are the following:
Table 22: Christian Nationalism: Item Total Correlations (Pittsburgh)Item Corr. to scale Factor Loading Mean SDPB_christ_2 0.8047 0.8740 2.537 1.424PB_christ_6 0.7798 0.8573 2.424 1.419PB_christ_1 0.7744 0.8504 2.137 1.358PB_christ_5 0.7302 0.7708 3.003 1.493PB_christ_4 0.6387 0.6771 3.139 1.365PB_christ_3 0.4887 0.5130 2.224 1.285
23
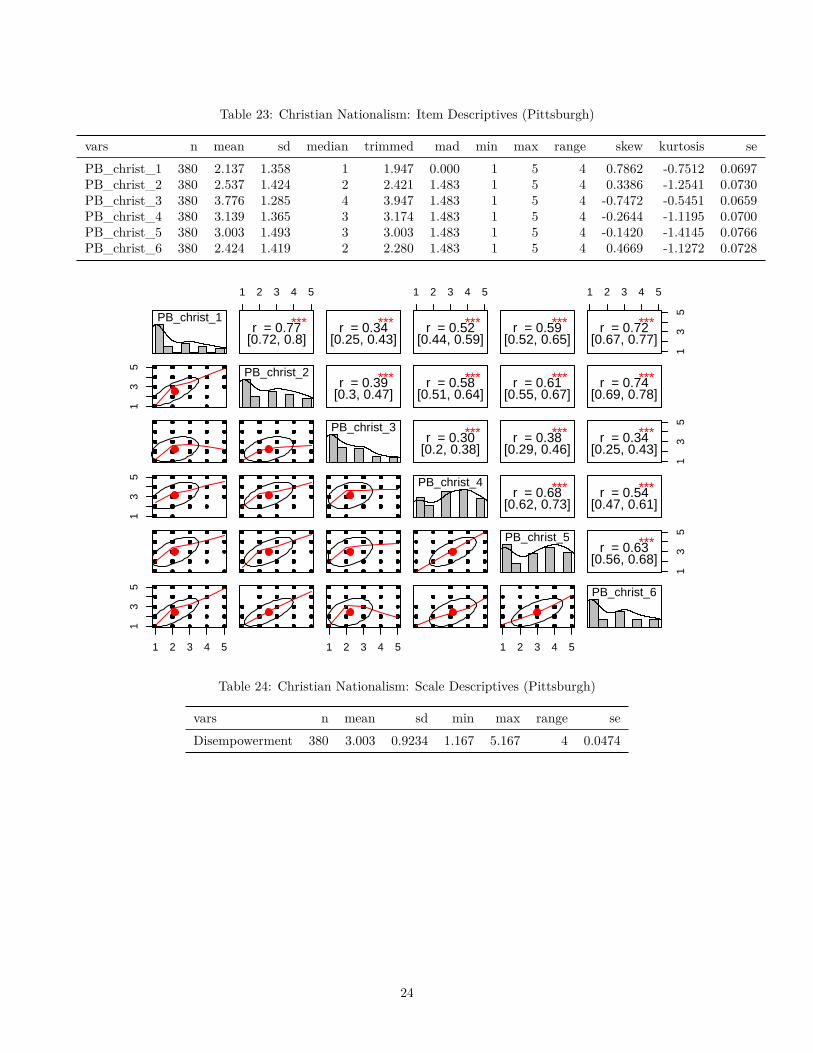
Table 23: Christian Nationalism: Item Descriptives (Pittsburgh)
vars n mean sd median trimmed mad min max range skew kurtosis sePB_christ_1 380 2.137 1.358 1 1.947 0.000 1 5 4 0.7862 -0.7512 0.0697PB_christ_2 380 2.537 1.424 2 2.421 1.483 1 5 4 0.3386 -1.2541 0.0730PB_christ_3 380 3.776 1.285 4 3.947 1.483 1 5 4 -0.7472 -0.5451 0.0659PB_christ_4 380 3.139 1.365 3 3.174 1.483 1 5 4 -0.2644 -1.1195 0.0700PB_christ_5 380 3.003 1.493 3 3.003 1.483 1 5 4 -0.1420 -1.4145 0.0766PB_christ_6 380 2.424 1.419 2 2.280 1.483 1 5 4 0.4669 -1.1272 0.0728
PB_christ_1
13
51
35
1 2 3 4 5
13
5
1 2 3 4 5
***r = 0.77[0.72, 0.8]
PB_christ_2
***r = 0.34[0.25, 0.43]
***r = 0.39[0.3, 0.47]
PB_christ_3
1 2 3 4 5
1 2 3 4 5
***r = 0.52[0.44, 0.59]
***r = 0.58[0.51, 0.64]
***r = 0.30[0.2, 0.38]
PB_christ_4
***r = 0.59[0.52, 0.65]
***r = 0.61[0.55, 0.67]
***r = 0.38[0.29, 0.46]
***r = 0.68[0.62, 0.73]
PB_christ_5
1 2 3 4 5
1 2 3 4 5
13
5
***r = 0.72[0.67, 0.77]
***r = 0.74[0.69, 0.78]
13
5
***r = 0.34[0.25, 0.43]
***r = 0.54[0.47, 0.61]
13
5
***r = 0.63[0.56, 0.68]
PB_christ_6
Table 24: Christian Nationalism: Scale Descriptives (Pittsburgh)
vars n mean sd min max range seDisempowerment 380 3.003 0.9234 1.167 5.167 4 0.0474
24
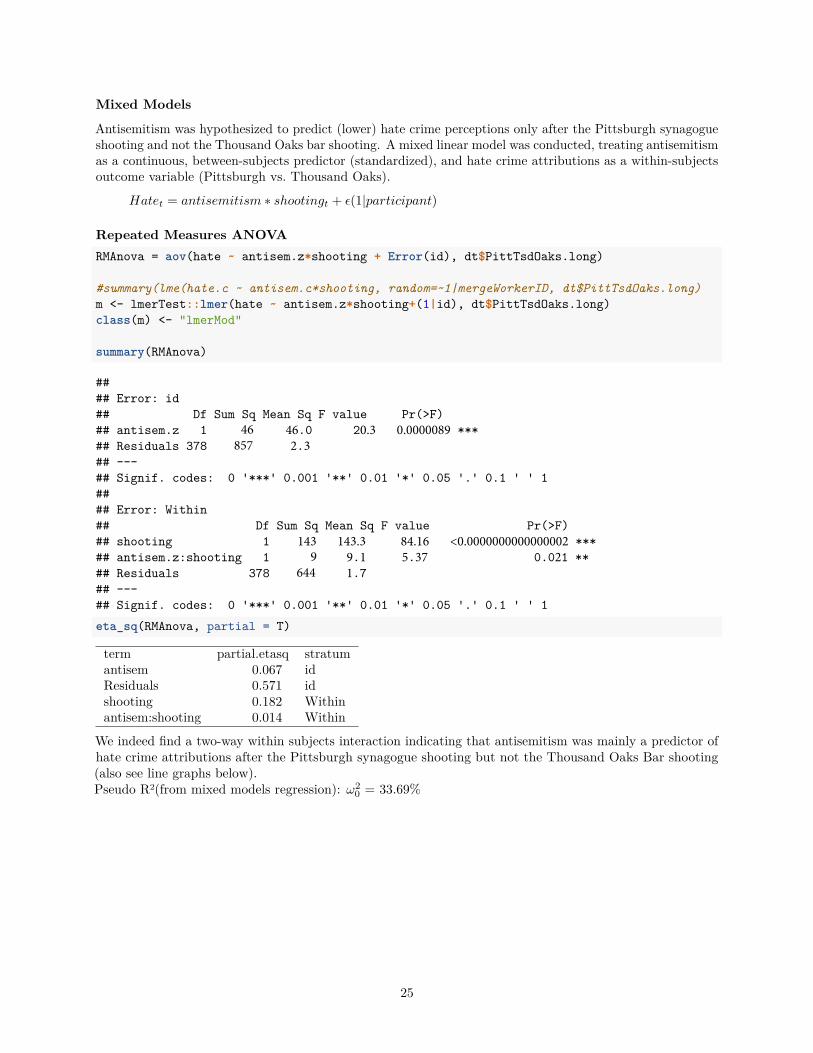
Mixed Models
Antisemitism was hypothesized to predict (lower) hate crime perceptions only after the Pittsburgh synagogueshooting and not the Thousand Oaks bar shooting. A mixed linear model was conducted, treating antisemitismas a continuous, between-subjects predictor (standardized), and hate crime attributions as a within-subjectsoutcome variable (Pittsburgh vs. Thousand Oaks).
Hatet = antisemitism ∗ shootingt + ε(1|participant)
Repeated Measures ANOVARMAnova = aov(hate ~ antisem.z*shooting + Error(id), dt$PittTsdOaks.long)
#summary(lme(hate.c ~ antisem.c*shooting, random=~1|mergeWorkerID, dt$PittTsdOaks.long)m <- lmerTest::lmer(hate ~ antisem.z*shooting+(1|id), dt$PittTsdOaks.long)class(m) <- "lmerMod"
summary(RMAnova)
#### Error: id## Df Sum Sq Mean Sq F value Pr(>F)## antisem.z 1 46 46.0 20.3 0.0000089 ***## Residuals 378 857 2.3## ---## Signif. codes: 0 '***' 0.001 '**' 0.01 '*' 0.05 '.' 0.1 ' ' 1#### Error: Within## Df Sum Sq Mean Sq F value Pr(>F)## shooting 1 143 143.3 84.16 <0.0000000000000002 ***## antisem.z:shooting 1 9 9.1 5.37 0.021 **## Residuals 378 644 1.7## ---## Signif. codes: 0 '***' 0.001 '**' 0.01 '*' 0.05 '.' 0.1 ' ' 1eta_sq(RMAnova, partial = T)
term partial.etasq stratumantisem 0.067 idResiduals 0.571 idshooting 0.182 Withinantisem:shooting 0.014 Within
We indeed find a two-way within subjects interaction indicating that antisemitism was mainly a predictor of hate crime attributions after the Pittsburgh synagogue shooting but not the Thousand Oaks Bar shooting (also see line graphs below).Pseudo R2(from mixed models regression): ω0
2 = 33.69%
25
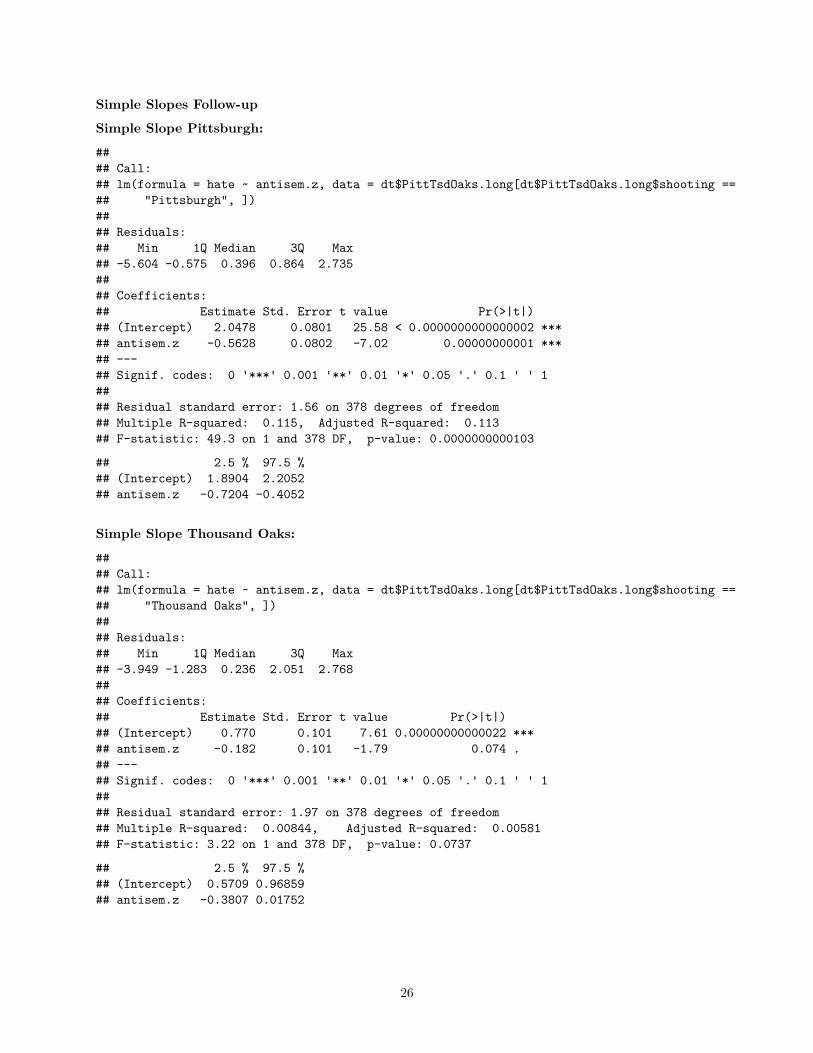
Simple Slopes Follow-up
Simple Slope Pittsburgh:
#### Call:## lm(formula = hate ~ antisem.z, data = dt$PittTsdOaks.long[dt$PittTsdOaks.long$shooting ==## "Pittsburgh", ])#### Residuals:## Min 1Q Median 3Q Max## -5.604 -0.575 0.396 0.864 2.735#### Coefficients:## Estimate Std. Error t value Pr(>|t|)## (Intercept) 2.0478 0.0801 25.58 < 0.0000000000000002 ***## antisem.z -0.5628 0.0802 -7.02 0.00000000001 ***## ---## Signif. codes: 0 '***' 0.001 '**' 0.01 '*' 0.05 '.' 0.1 ' ' 1#### Residual standard error: 1.56 on 378 degrees of freedom## Multiple R-squared: 0.115, Adjusted R-squared: 0.113## F-statistic: 49.3 on 1 and 378 DF, p-value: 0.0000000000103
## 2.5 % 97.5 %## (Intercept) 1.8904 2.2052## antisem.z -0.7204 -0.4052
Simple Slope Thousand Oaks:
#### Call:## lm(formula = hate ~ antisem.z, data = dt$PittTsdOaks.long[dt$PittTsdOaks.long$shooting ==## "Thousand Oaks", ])#### Residuals:## Min 1Q Median 3Q Max## -3.949 -1.283 0.236 2.051 2.768#### Coefficients:## Estimate Std. Error t value Pr(>|t|)## (Intercept) 0.770 0.101 7.61 0.00000000000022 ***## antisem.z -0.182 0.101 -1.79 0.074 .## ---## Signif. codes: 0 '***' 0.001 '**' 0.01 '*' 0.05 '.' 0.1 ' ' 1#### Residual standard error: 1.97 on 378 degrees of freedom## Multiple R-squared: 0.00844, Adjusted R-squared: 0.00581## F-statistic: 3.22 on 1 and 378 DF, p-value: 0.0737
## 2.5 % 97.5 %## (Intercept) 0.5709 0.96859## antisem.z -0.3807 0.01752
26
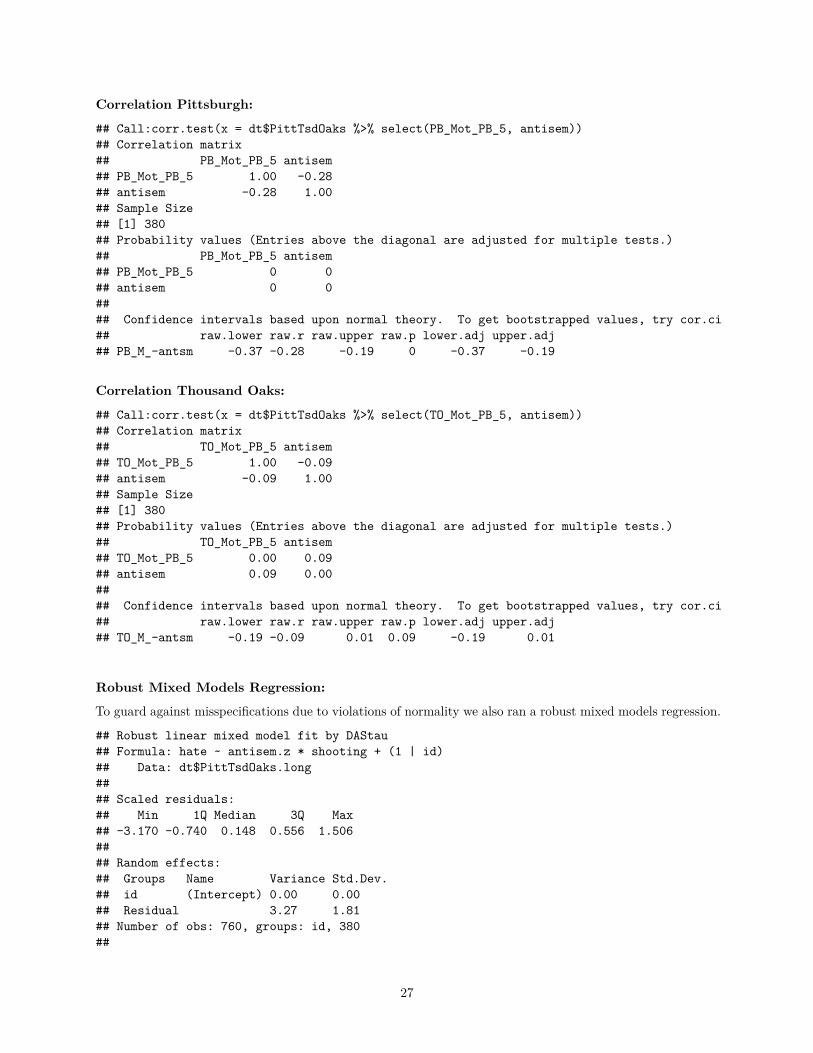
Correlation Pittsburgh:
## Call:corr.test(x = dt$PittTsdOaks %>% select(PB_Mot_PB_5, antisem))## Correlation matrix## PB_Mot_PB_5 antisem## PB_Mot_PB_5 1.00 -0.28## antisem -0.28 1.00## Sample Size## [1] 380## Probability values (Entries above the diagonal are adjusted for multiple tests.)## PB_Mot_PB_5 antisem## PB_Mot_PB_5 0 0## antisem 0 0#### Confidence intervals based upon normal theory. To get bootstrapped values, try cor.ci## raw.lower raw.r raw.upper raw.p lower.adj upper.adj## PB_M_-antsm -0.37 -0.28 -0.19 0 -0.37 -0.19
Correlation Thousand Oaks:
## Call:corr.test(x = dt$PittTsdOaks %>% select(TO_Mot_PB_5, antisem))## Correlation matrix## TO_Mot_PB_5 antisem## TO_Mot_PB_5 1.00 -0.09## antisem -0.09 1.00## Sample Size## [1] 380## Probability values (Entries above the diagonal are adjusted for multiple tests.)## TO_Mot_PB_5 antisem## TO_Mot_PB_5 0.00 0.09## antisem 0.09 0.00#### Confidence intervals based upon normal theory. To get bootstrapped values, try cor.ci## raw.lower raw.r raw.upper raw.p lower.adj upper.adj## TO_M_-antsm -0.19 -0.09 0.01 0.09 -0.19 0.01
Robust Mixed Models Regression:
To guard against misspecifications due to violations of normality we also ran a robust mixed models regression.
## Robust linear mixed model fit by DAStau## Formula: hate ~ antisem.z * shooting + (1 | id)## Data: dt$PittTsdOaks.long#### Scaled residuals:## Min 1Q Median 3Q Max## -3.170 -0.740 0.148 0.556 1.506#### Random effects:## Groups Name Variance Std.Dev.## id (Intercept) 0.00 0.00## Residual 3.27 1.81## Number of obs: 760, groups: id, 380##
27
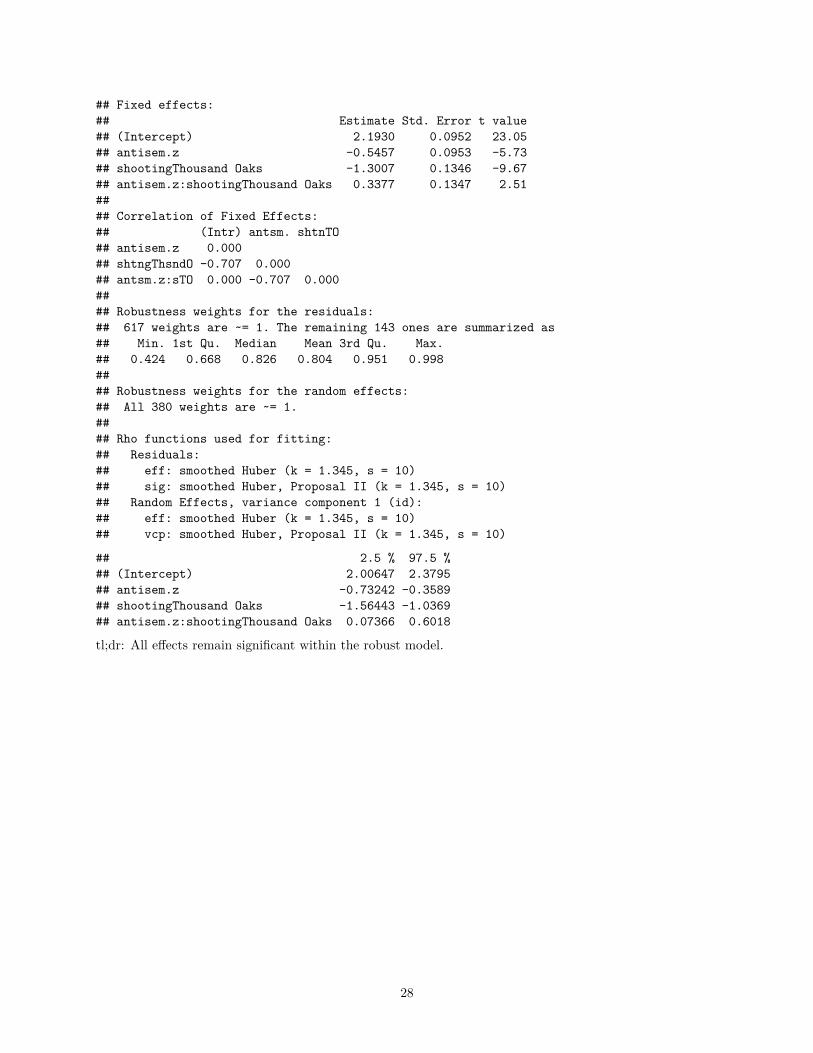
## Fixed effects:## Estimate Std. Error t value## (Intercept) 2.1930 0.0952 23.05## antisem.z -0.5457 0.0953 -5.73## shootingThousand Oaks -1.3007 0.1346 -9.67## antisem.z:shootingThousand Oaks 0.3377 0.1347 2.51#### Correlation of Fixed Effects:## (Intr) antsm. shtnTO## antisem.z 0.000## shtngThsndO -0.707 0.000## antsm.z:sTO 0.000 -0.707 0.000#### Robustness weights for the residuals:## 617 weights are ~= 1. The remaining 143 ones are summarized as## Min. 1st Qu. Median Mean 3rd Qu. Max.## 0.424 0.668 0.826 0.804 0.951 0.998#### Robustness weights for the random effects:## All 380 weights are ~= 1.#### Rho functions used for fitting:## Residuals:## eff: smoothed Huber (k = 1.345, s = 10)## sig: smoothed Huber, Proposal II (k = 1.345, s = 10)## Random Effects, variance component 1 (id):## eff: smoothed Huber (k = 1.345, s = 10)## vcp: smoothed Huber, Proposal II (k = 1.345, s = 10)
## 2.5 % 97.5 %## (Intercept) 2.00647 2.3795## antisem.z -0.73242 -0.3589## shootingThousand Oaks -1.56443 -1.0369## antisem.z:shootingThousand Oaks 0.07366 0.6018
tl;dr: All effects remain significant within the robust model.
28
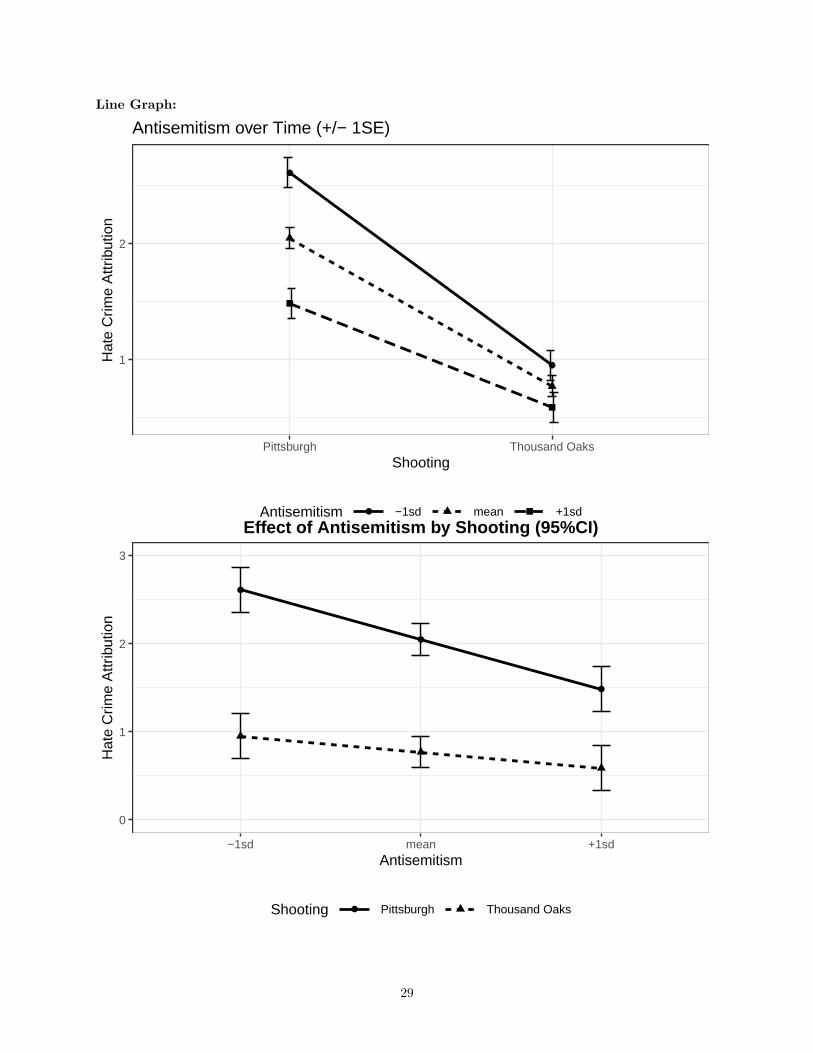
Line Graph:
1
2
Pittsburgh Thousand OaksShooting
Hat
e C
rime
Attr
ibut
ion
Antisemitism −1sd mean +1sd
Antisemitism over Time (+/− 1SE)
0
1
2
3
−1sd mean +1sdAntisemitism
Hat
e C
rime
Attr
ibut
ion
Shooting Pittsburgh Thousand Oaks
Effect of Antisemitism by Shooting (95%CI)
29
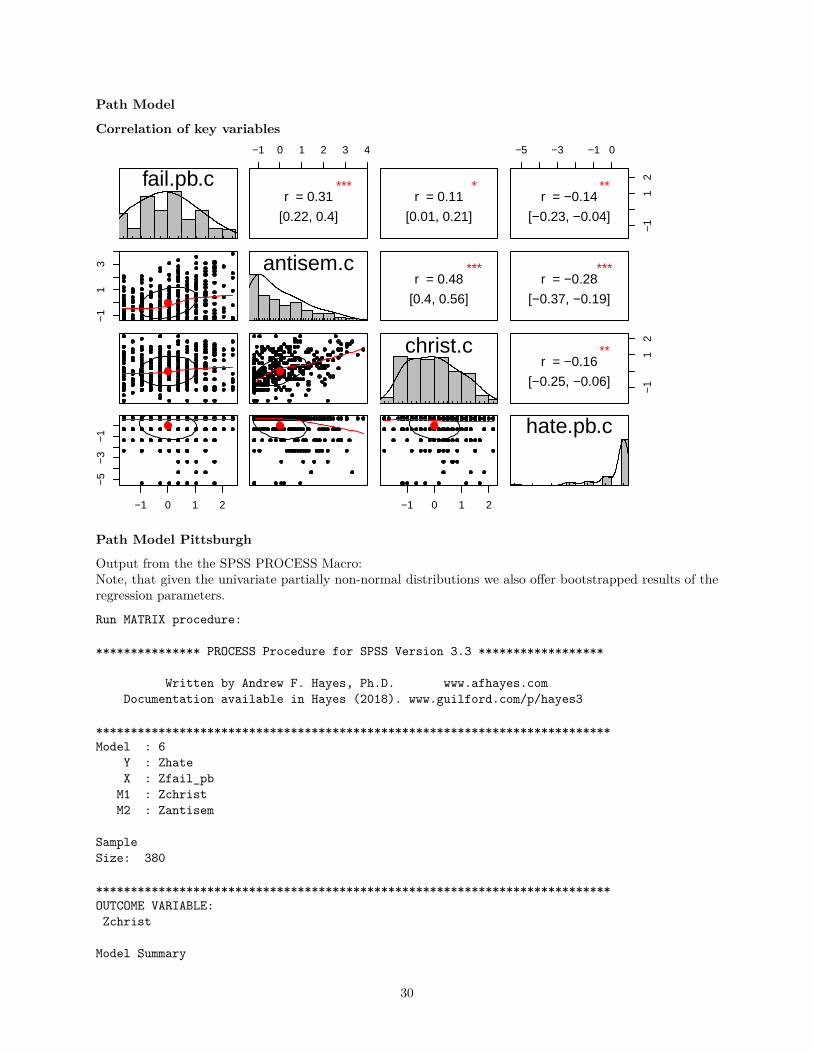
Path Model
Correlation of key variables
fail.pb.c
−1
13
−1 0 1 2
−5
−3
−1
−1 0 1 2 3 4
***r = 0.31
[0.22, 0.4]
antisem.c
*r = 0.11
[0.01, 0.21]
***r = 0.48
[0.4, 0.56]
christ.c
−1 0 1 2
−5 −3 −1 0
−1
12
**r = −0.14
[−0.23, −0.04]
***r = −0.28
[−0.37, −0.19]
−1
12
**r = −0.16
[−0.25, −0.06]
hate.pb.c
Path Model Pittsburgh
Output from the the SPSS PROCESS Macro:Note, that given the univariate partially non-normal distributions we also offer bootstrapped results of theregression parameters.
Run MATRIX procedure:
*************** PROCESS Procedure for SPSS Version 3.3 ******************
Written by Andrew F. Hayes, Ph.D. www.afhayes.comDocumentation available in Hayes (2018). www.guilford.com/p/hayes3
**************************************************************************Model : 6
Y : ZhateX : Zfail_pb
M1 : ZchristM2 : Zantisem
SampleSize: 380
**************************************************************************OUTCOME VARIABLE:Zchrist
Model Summary
30
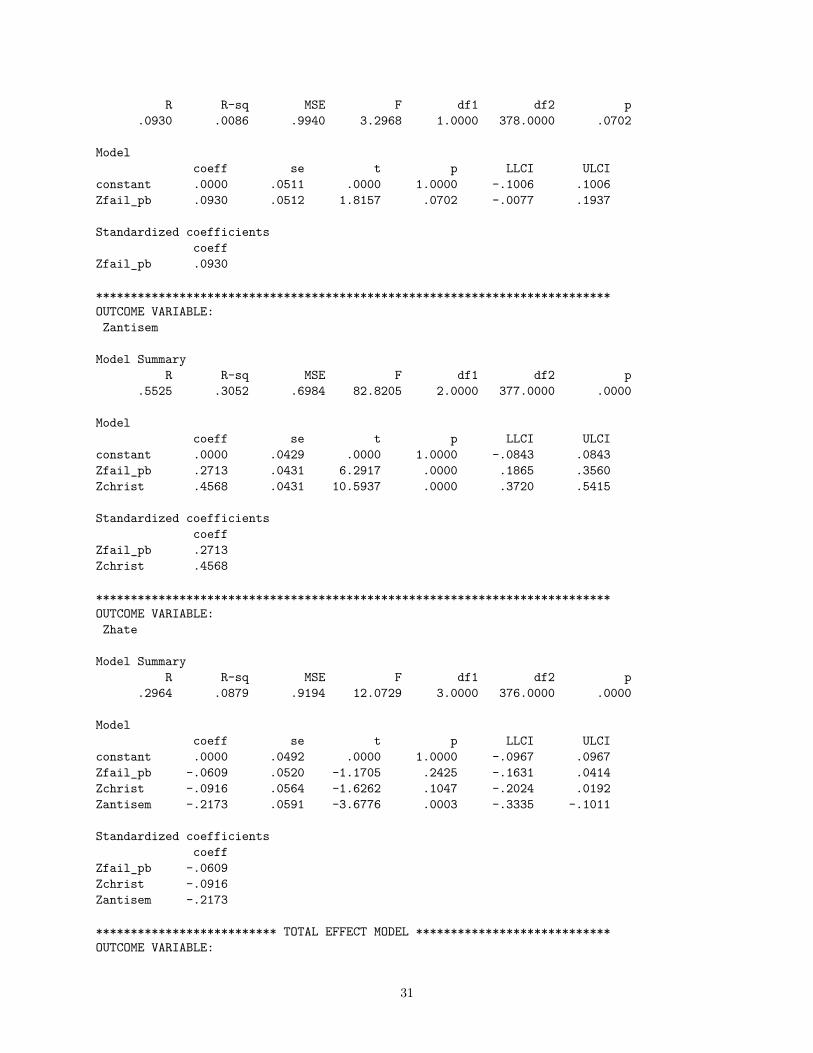
R R-sq MSE F df1 df2 p.0930 .0086 .9940 3.2968 1.0000 378.0000 .0702
Modelcoeff se t p LLCI ULCI
constant .0000 .0511 .0000 1.0000 -.1006 .1006Zfail_pb .0930 .0512 1.8157 .0702 -.0077 .1937
Standardized coefficientscoeff
Zfail_pb .0930
**************************************************************************OUTCOME VARIABLE:Zantisem
Model SummaryR R-sq MSE F df1 df2 p
.5525 .3052 .6984 82.8205 2.0000 377.0000 .0000
Modelcoeff se t p LLCI ULCI
constant .0000 .0429 .0000 1.0000 -.0843 .0843Zfail_pb .2713 .0431 6.2917 .0000 .1865 .3560Zchrist .4568 .0431 10.5937 .0000 .3720 .5415
Standardized coefficientscoeff
Zfail_pb .2713Zchrist .4568
**************************************************************************OUTCOME VARIABLE:Zhate
Model SummaryR R-sq MSE F df1 df2 p
.2964 .0879 .9194 12.0729 3.0000 376.0000 .0000
Modelcoeff se t p LLCI ULCI
constant .0000 .0492 .0000 1.0000 -.0967 .0967Zfail_pb -.0609 .0520 -1.1705 .2425 -.1631 .0414Zchrist -.0916 .0564 -1.6262 .1047 -.2024 .0192Zantisem -.2173 .0591 -3.6776 .0003 -.3335 -.1011
Standardized coefficientscoeff
Zfail_pb -.0609Zchrist -.0916Zantisem -.2173
************************** TOTAL EFFECT MODEL ****************************OUTCOME VARIABLE:
31
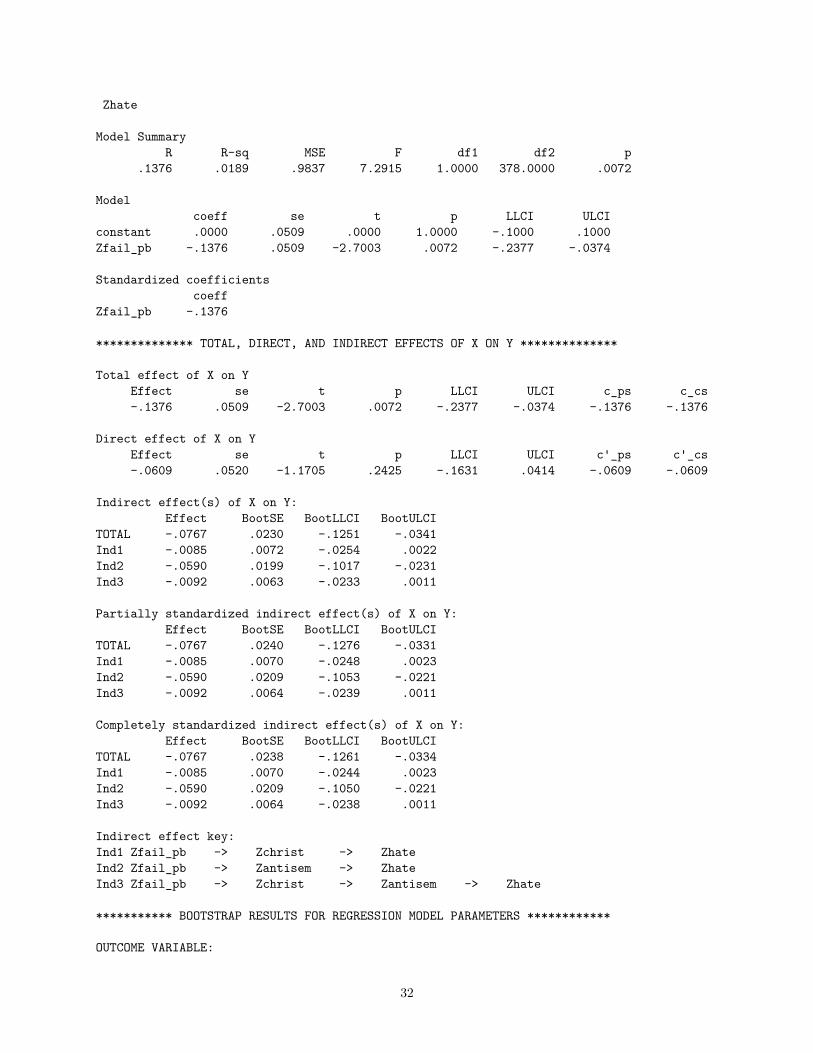
Zhate
Model SummaryR R-sq MSE F df1 df2 p
.1376 .0189 .9837 7.2915 1.0000 378.0000 .0072
Modelcoeff se t p LLCI ULCI
constant .0000 .0509 .0000 1.0000 -.1000 .1000Zfail_pb -.1376 .0509 -2.7003 .0072 -.2377 -.0374
Standardized coefficientscoeff
Zfail_pb -.1376
************** TOTAL, DIRECT, AND INDIRECT EFFECTS OF X ON Y **************
Total effect of X on YEffect se t p LLCI ULCI c_ps c_cs-.1376 .0509 -2.7003 .0072 -.2377 -.0374 -.1376 -.1376
Direct effect of X on YEffect se t p LLCI ULCI c'_ps c'_cs-.0609 .0520 -1.1705 .2425 -.1631 .0414 -.0609 -.0609
Indirect effect(s) of X on Y:Effect BootSE BootLLCI BootULCI
TOTAL -.0767 .0230 -.1251 -.0341Ind1 -.0085 .0072 -.0254 .0022Ind2 -.0590 .0199 -.1017 -.0231Ind3 -.0092 .0063 -.0233 .0011
Partially standardized indirect effect(s) of X on Y:Effect BootSE BootLLCI BootULCI
TOTAL -.0767 .0240 -.1276 -.0331Ind1 -.0085 .0070 -.0248 .0023Ind2 -.0590 .0209 -.1053 -.0221Ind3 -.0092 .0064 -.0239 .0011
Completely standardized indirect effect(s) of X on Y:Effect BootSE BootLLCI BootULCI
TOTAL -.0767 .0238 -.1261 -.0334Ind1 -.0085 .0070 -.0244 .0023Ind2 -.0590 .0209 -.1050 -.0221Ind3 -.0092 .0064 -.0238 .0011
Indirect effect key:Ind1 Zfail_pb -> Zchrist -> ZhateInd2 Zfail_pb -> Zantisem -> ZhateInd3 Zfail_pb -> Zchrist -> Zantisem -> Zhate
*********** BOOTSTRAP RESULTS FOR REGRESSION MODEL PARAMETERS ************
OUTCOME VARIABLE:
32
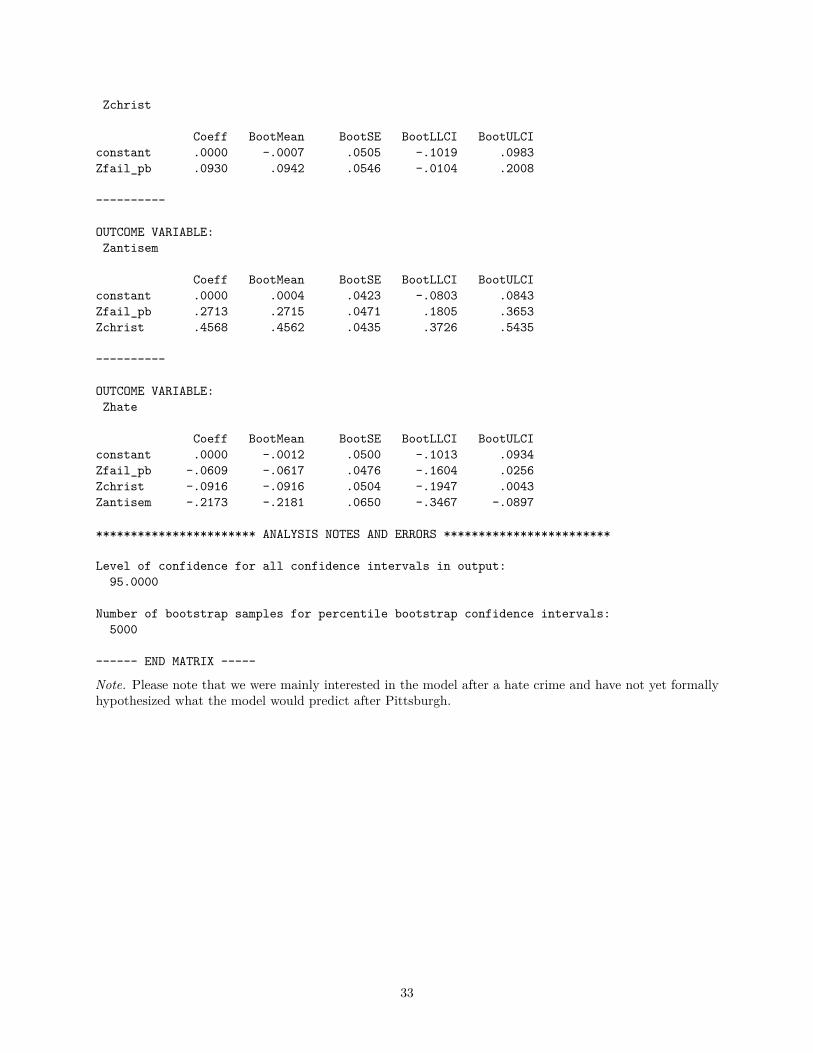
Zchrist
Coeff BootMean BootSE BootLLCI BootULCIconstant .0000 -.0007 .0505 -.1019 .0983Zfail_pb .0930 .0942 .0546 -.0104 .2008
----------
OUTCOME VARIABLE:Zantisem
Coeff BootMean BootSE BootLLCI BootULCIconstant .0000 .0004 .0423 -.0803 .0843Zfail_pb .2713 .2715 .0471 .1805 .3653Zchrist .4568 .4562 .0435 .3726 .5435
----------
OUTCOME VARIABLE:Zhate
Coeff BootMean BootSE BootLLCI BootULCIconstant .0000 -.0012 .0500 -.1013 .0934Zfail_pb -.0609 -.0617 .0476 -.1604 .0256Zchrist -.0916 -.0916 .0504 -.1947 .0043Zantisem -.2173 -.2181 .0650 -.3467 -.0897
*********************** ANALYSIS NOTES AND ERRORS ************************
Level of confidence for all confidence intervals in output:95.0000
Number of bootstrap samples for percentile bootstrap confidence intervals:5000
------ END MATRIX -----
Note. Please note that we were mainly interested in the model after a hate crime and have not yet formallyhypothesized what the model would predict after Pittsburgh.
33
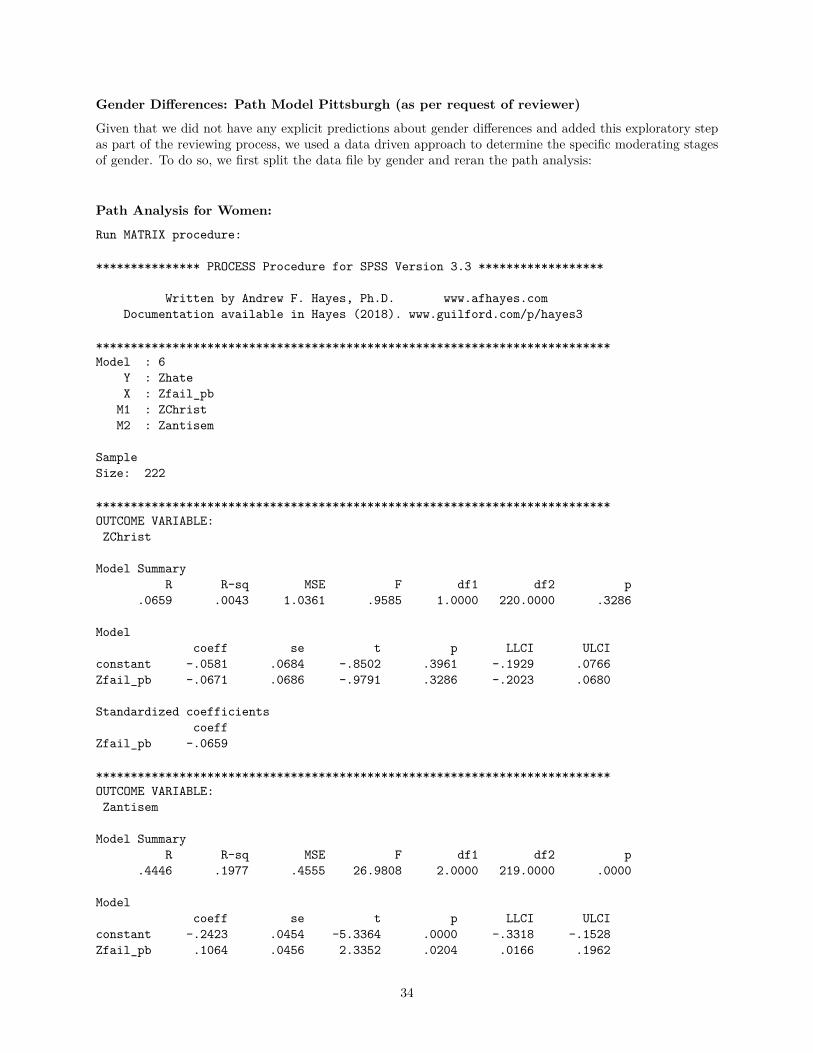
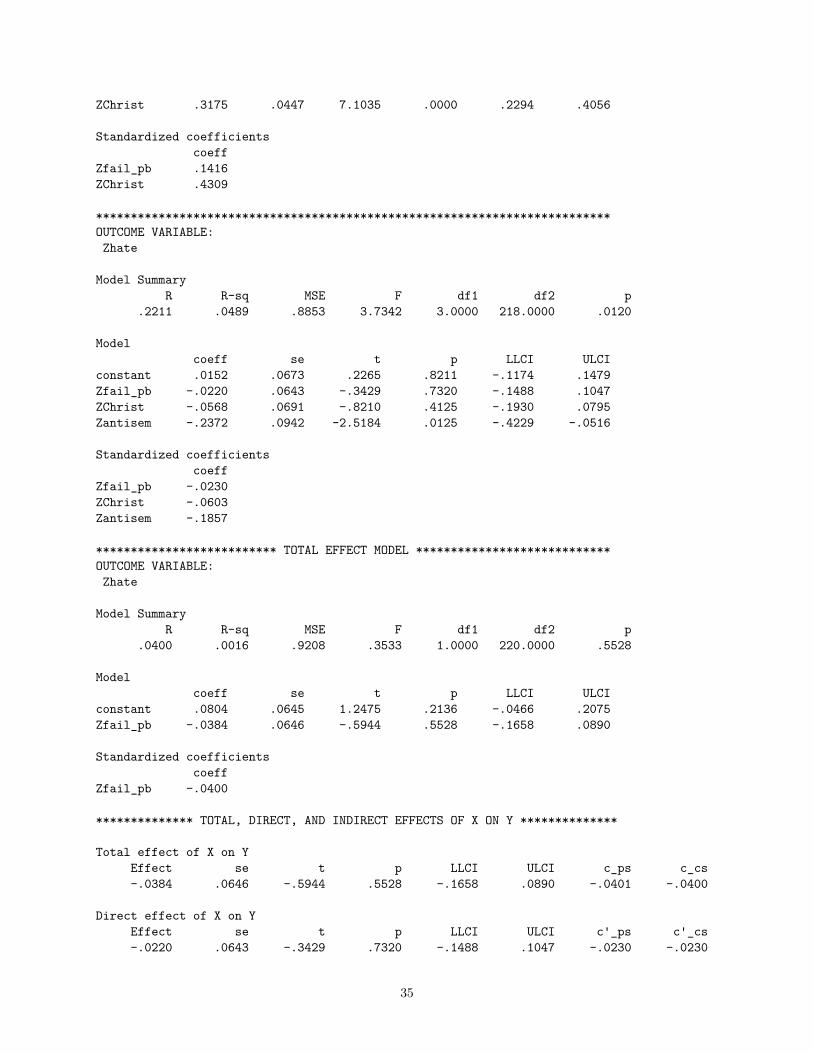
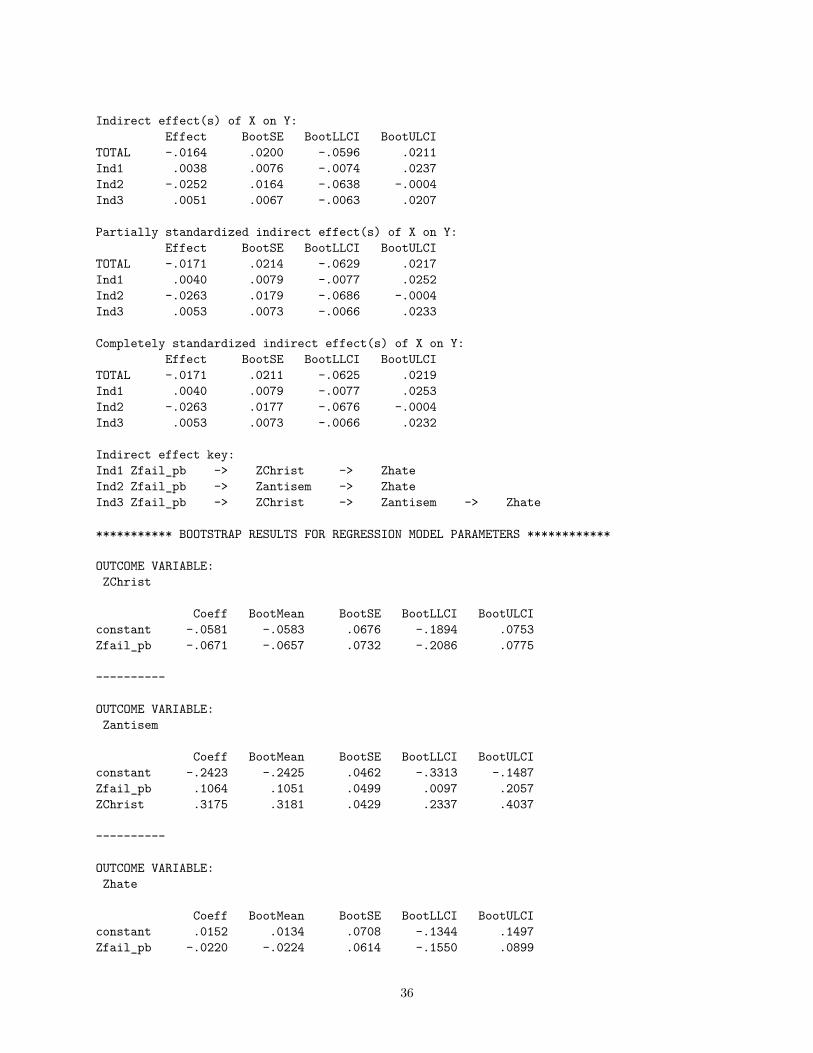
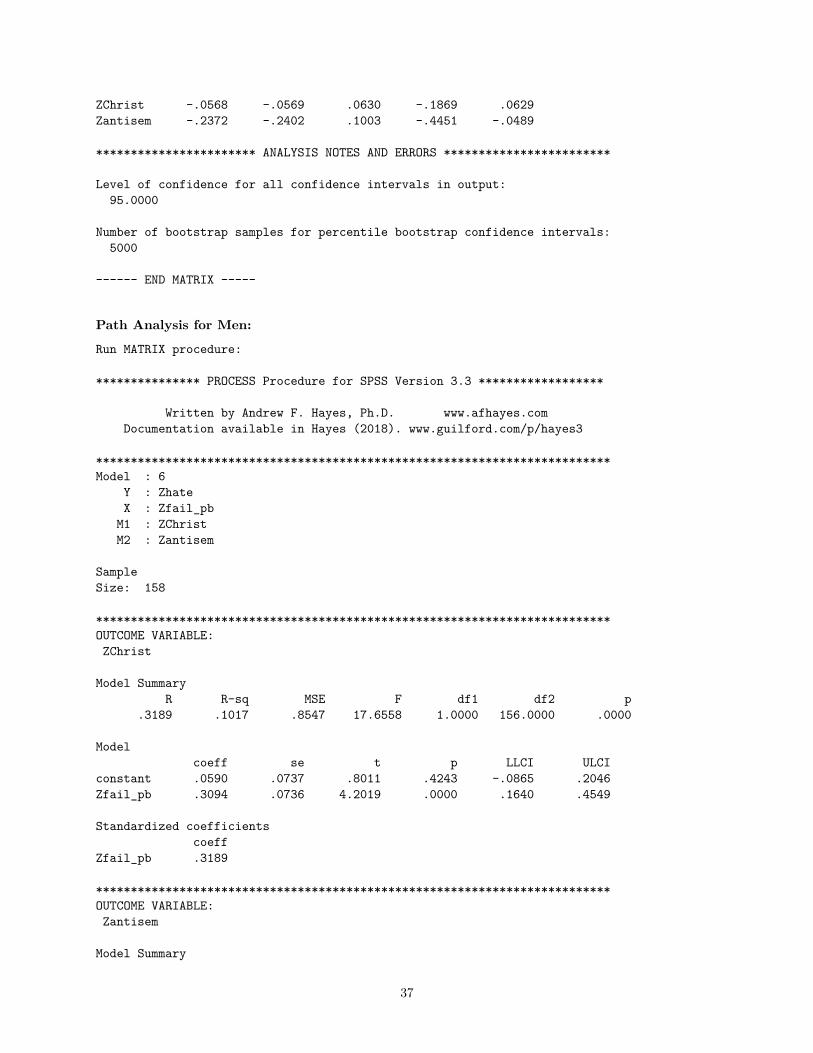
Gender Differences: Path Model Pittsburgh (as per request of reviewer)
Given that we did not have any explicit predictions about gender differences and added this exploratory stepas part of the reviewing process, we used a data driven approach to determine the specific moderating stagesof gender. To do so, we first split the data file by gender and reran the path analysis:
Path Analysis for Women:
Run MATRIX procedure:
*************** PROCESS Procedure for SPSS Version 3.3 ******************
Written by Andrew F. Hayes, Ph.D. www.afhayes.comDocumentation available in Hayes (2018). www.guilford.com/p/hayes3
**************************************************************************Model : 6
Y : ZhateX : Zfail_pb
M1 : ZChristM2 : Zantisem
SampleSize: 222
**************************************************************************OUTCOME VARIABLE:ZChrist
Model SummaryR R-sq MSE F df1 df2 p
.0659 .0043 1.0361 .9585 1.0000 220.0000 .3286
Modelcoeff se t p LLCI ULCI
constant -.0581 .0684 -.8502 .3961 -.1929 .0766Zfail_pb -.0671 .0686 -.9791 .3286 -.2023 .0680
Standardized coefficientscoeff
Zfail_pb -.0659
**************************************************************************OUTCOME VARIABLE:Zantisem
Model SummaryR R-sq MSE F df1 df2 p
.4446 .1977 .4555 26.9808 2.0000 219.0000 .0000
Modelcoeff se t p LLCI ULCI
constant -.2423 .0454 -5.3364 .0000 -.3318 -.1528Zfail_pb .1064 .0456 2.3352 .0204 .0166 .1962
34
ZChrist .3175 .0447 7.1035 .0000 .2294 .4056
Standardized coefficientscoeff
Zfail_pb .1416ZChrist .4309
**************************************************************************OUTCOME VARIABLE:Zhate
Model SummaryR R-sq MSE F df1 df2 p
.2211 .0489 .8853 3.7342 3.0000 218.0000 .0120
Modelcoeff se t p LLCI ULCI
constant .0152 .0673 .2265 .8211 -.1174 .1479Zfail_pb -.0220 .0643 -.3429 .7320 -.1488 .1047ZChrist -.0568 .0691 -.8210 .4125 -.1930 .0795Zantisem -.2372 .0942 -2.5184 .0125 -.4229 -.0516
Standardized coefficientscoeff
Zfail_pb -.0230ZChrist -.0603Zantisem -.1857
************************** TOTAL EFFECT MODEL ****************************OUTCOME VARIABLE:Zhate
Model SummaryR R-sq MSE F df1 df2 p
.0400 .0016 .9208 .3533 1.0000 220.0000 .5528
Modelcoeff se t p LLCI ULCI
constant .0804 .0645 1.2475 .2136 -.0466 .2075Zfail_pb -.0384 .0646 -.5944 .5528 -.1658 .0890
Standardized coefficientscoeff
Zfail_pb -.0400
************** TOTAL, DIRECT, AND INDIRECT EFFECTS OF X ON Y **************
Total effect of X on YEffect se t p LLCI ULCI c_ps c_cs-.0384 .0646 -.5944 .5528 -.1658 .0890 -.0401 -.0400
Direct effect of X on YEffect se t p LLCI ULCI c'_ps c'_cs-.0220 .0643 -.3429 .7320 -.1488 .1047 -.0230 -.0230
35
Indirect effect(s) of X on Y:Effect BootSE BootLLCI BootULCI
TOTAL -.0164 .0200 -.0596 .0211Ind1 .0038 .0076 -.0074 .0237Ind2 -.0252 .0164 -.0638 -.0004Ind3 .0051 .0067 -.0063 .0207
Partially standardized indirect effect(s) of X on Y:Effect BootSE BootLLCI BootULCI
TOTAL -.0171 .0214 -.0629 .0217Ind1 .0040 .0079 -.0077 .0252Ind2 -.0263 .0179 -.0686 -.0004Ind3 .0053 .0073 -.0066 .0233
Completely standardized indirect effect(s) of X on Y:Effect BootSE BootLLCI BootULCI
TOTAL -.0171 .0211 -.0625 .0219Ind1 .0040 .0079 -.0077 .0253Ind2 -.0263 .0177 -.0676 -.0004Ind3 .0053 .0073 -.0066 .0232
Indirect effect key:Ind1 Zfail_pb -> ZChrist -> ZhateInd2 Zfail_pb -> Zantisem -> ZhateInd3 Zfail_pb -> ZChrist -> Zantisem -> Zhate
*********** BOOTSTRAP RESULTS FOR REGRESSION MODEL PARAMETERS ************
OUTCOME VARIABLE:ZChrist
Coeff BootMean BootSE BootLLCI BootULCIconstant -.0581 -.0583 .0676 -.1894 .0753Zfail_pb -.0671 -.0657 .0732 -.2086 .0775
----------
OUTCOME VARIABLE:Zantisem
Coeff BootMean BootSE BootLLCI BootULCIconstant -.2423 -.2425 .0462 -.3313 -.1487Zfail_pb .1064 .1051 .0499 .0097 .2057ZChrist .3175 .3181 .0429 .2337 .4037
----------
OUTCOME VARIABLE:Zhate
Coeff BootMean BootSE BootLLCI BootULCIconstant .0152 .0134 .0708 -.1344 .1497Zfail_pb -.0220 -.0224 .0614 -.1550 .0899
36
ZChrist -.0568 -.0569 .0630 -.1869 .0629Zantisem -.2372 -.2402 .1003 -.4451 -.0489
*********************** ANALYSIS NOTES AND ERRORS ************************
Level of confidence for all confidence intervals in output:95.0000
Number of bootstrap samples for percentile bootstrap confidence intervals:5000
------ END MATRIX -----
Path Analysis for Men:
Run MATRIX procedure:
*************** PROCESS Procedure for SPSS Version 3.3 ******************
Written by Andrew F. Hayes, Ph.D. www.afhayes.comDocumentation available in Hayes (2018). www.guilford.com/p/hayes3
**************************************************************************Model : 6
Y : ZhateX : Zfail_pb
M1 : ZChristM2 : Zantisem
SampleSize: 158
**************************************************************************OUTCOME VARIABLE:ZChrist
Model SummaryR R-sq MSE F df1 df2 p
.3189 .1017 .8547 17.6558 1.0000 156.0000 .0000
Modelcoeff se t p LLCI ULCI
constant .0590 .0737 .8011 .4243 -.0865 .2046Zfail_pb .3094 .0736 4.2019 .0000 .1640 .4549
Standardized coefficientscoeff
Zfail_pb .3189
**************************************************************************OUTCOME VARIABLE:Zantisem
Model Summary
37
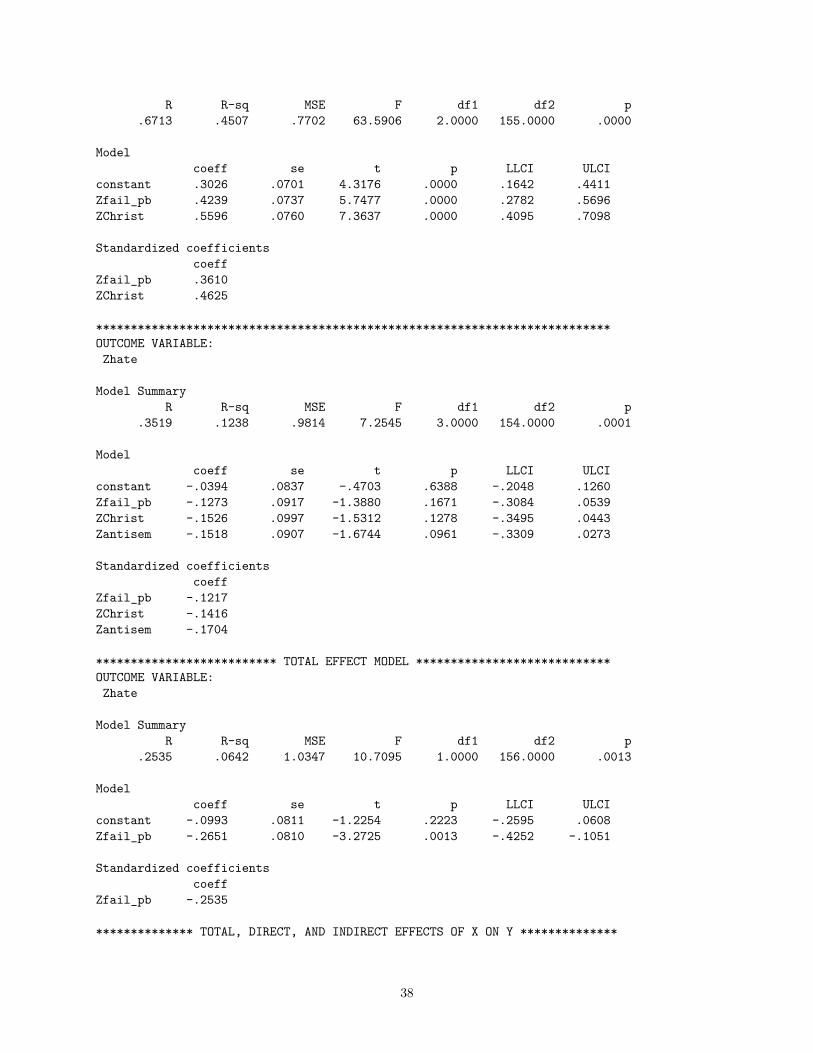
R R-sq MSE F df1 df2 p.6713 .4507 .7702 63.5906 2.0000 155.0000 .0000
Modelcoeff se t p LLCI ULCI
constant .3026 .0701 4.3176 .0000 .1642 .4411Zfail_pb .4239 .0737 5.7477 .0000 .2782 .5696ZChrist .5596 .0760 7.3637 .0000 .4095 .7098
Standardized coefficientscoeff
Zfail_pb .3610ZChrist .4625
**************************************************************************OUTCOME VARIABLE:Zhate
Model SummaryR R-sq MSE F df1 df2 p
.3519 .1238 .9814 7.2545 3.0000 154.0000 .0001
Modelcoeff se t p LLCI ULCI
constant -.0394 .0837 -.4703 .6388 -.2048 .1260Zfail_pb -.1273 .0917 -1.3880 .1671 -.3084 .0539ZChrist -.1526 .0997 -1.5312 .1278 -.3495 .0443Zantisem -.1518 .0907 -1.6744 .0961 -.3309 .0273
Standardized coefficientscoeff
Zfail_pb -.1217ZChrist -.1416Zantisem -.1704
************************** TOTAL EFFECT MODEL ****************************OUTCOME VARIABLE:Zhate
Model SummaryR R-sq MSE F df1 df2 p
.2535 .0642 1.0347 10.7095 1.0000 156.0000 .0013
Modelcoeff se t p LLCI ULCI
constant -.0993 .0811 -1.2254 .2223 -.2595 .0608Zfail_pb -.2651 .0810 -3.2725 .0013 -.4252 -.1051
Standardized coefficientscoeff
Zfail_pb -.2535
************** TOTAL, DIRECT, AND INDIRECT EFFECTS OF X ON Y **************
38
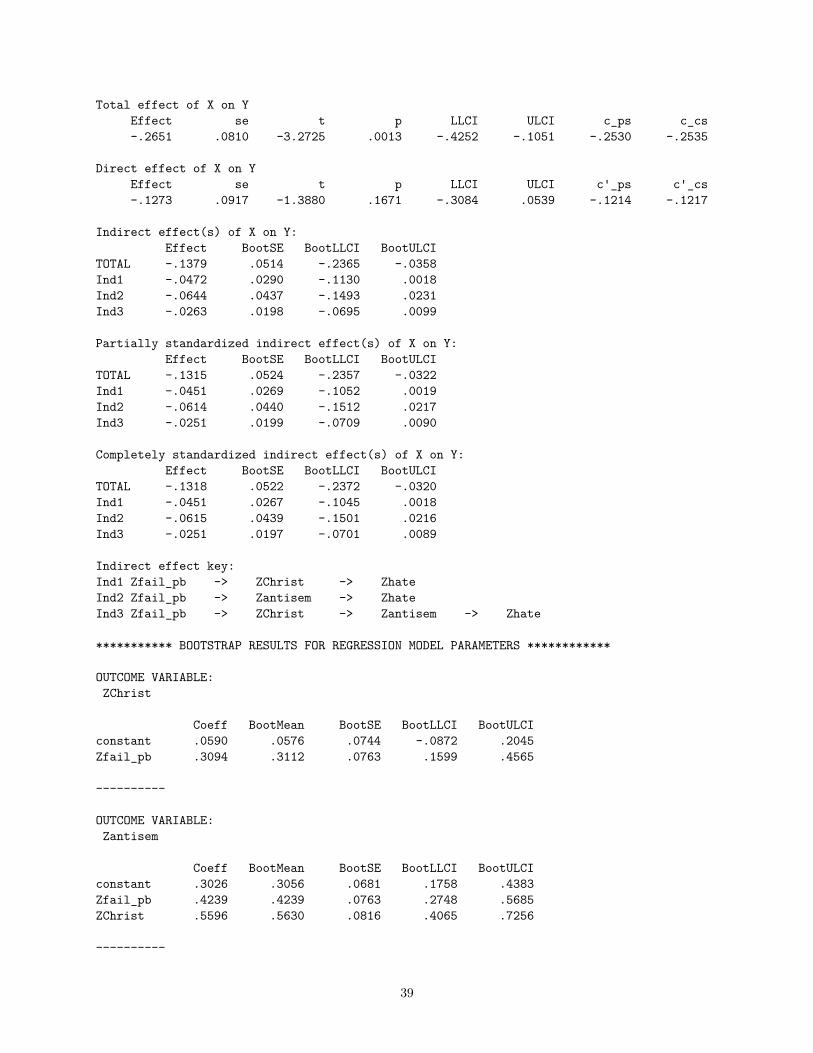
Total effect of X on YEffect se t p LLCI ULCI c_ps c_cs-.2651 .0810 -3.2725 .0013 -.4252 -.1051 -.2530 -.2535
Direct effect of X on YEffect se t p LLCI ULCI c'_ps c'_cs-.1273 .0917 -1.3880 .1671 -.3084 .0539 -.1214 -.1217
Indirect effect(s) of X on Y:Effect BootSE BootLLCI BootULCI
TOTAL -.1379 .0514 -.2365 -.0358Ind1 -.0472 .0290 -.1130 .0018Ind2 -.0644 .0437 -.1493 .0231Ind3 -.0263 .0198 -.0695 .0099
Partially standardized indirect effect(s) of X on Y:Effect BootSE BootLLCI BootULCI
TOTAL -.1315 .0524 -.2357 -.0322Ind1 -.0451 .0269 -.1052 .0019Ind2 -.0614 .0440 -.1512 .0217Ind3 -.0251 .0199 -.0709 .0090
Completely standardized indirect effect(s) of X on Y:Effect BootSE BootLLCI BootULCI
TOTAL -.1318 .0522 -.2372 -.0320Ind1 -.0451 .0267 -.1045 .0018Ind2 -.0615 .0439 -.1501 .0216Ind3 -.0251 .0197 -.0701 .0089
Indirect effect key:Ind1 Zfail_pb -> ZChrist -> ZhateInd2 Zfail_pb -> Zantisem -> ZhateInd3 Zfail_pb -> ZChrist -> Zantisem -> Zhate
*********** BOOTSTRAP RESULTS FOR REGRESSION MODEL PARAMETERS ************
OUTCOME VARIABLE:ZChrist
Coeff BootMean BootSE BootLLCI BootULCIconstant .0590 .0576 .0744 -.0872 .2045Zfail_pb .3094 .3112 .0763 .1599 .4565
----------
OUTCOME VARIABLE:Zantisem
Coeff BootMean BootSE BootLLCI BootULCIconstant .3026 .3056 .0681 .1758 .4383Zfail_pb .4239 .4239 .0763 .2748 .5685ZChrist .5596 .5630 .0816 .4065 .7256
----------
39
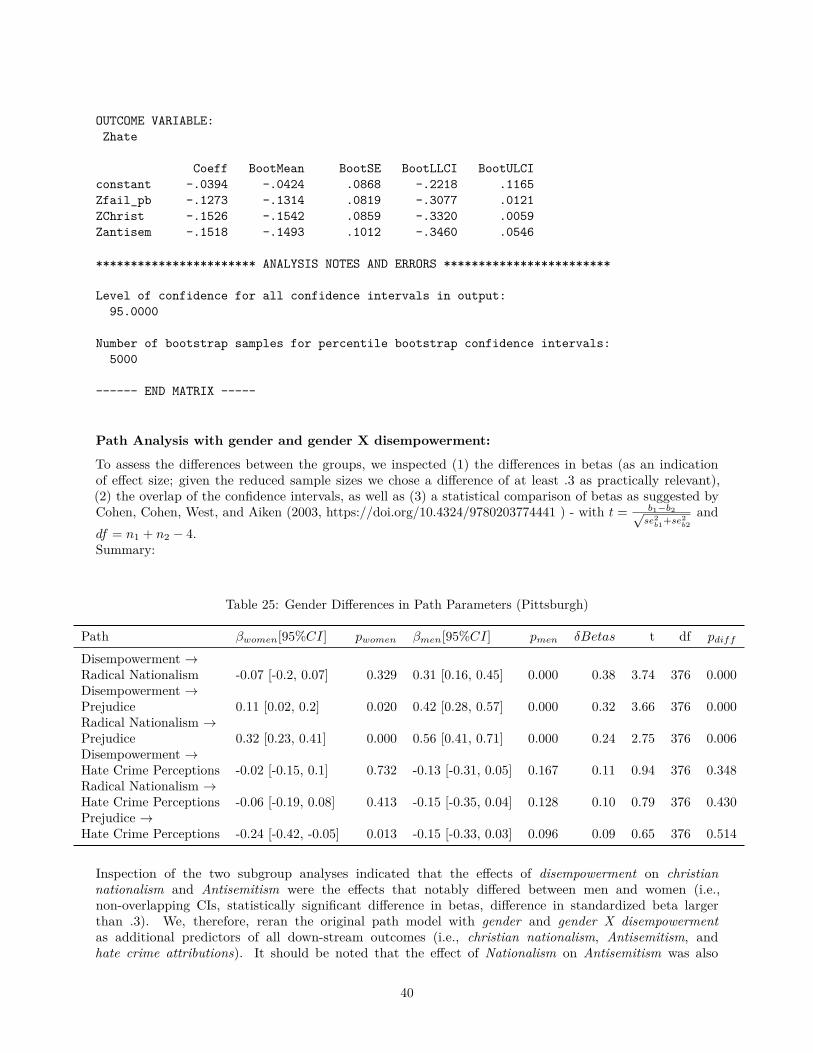
OUTCOME VARIABLE:Zhate
Coeff BootMean BootSE BootLLCI BootULCIconstant -.0394 -.0424 .0868 -.2218 .1165Zfail_pb -.1273 -.1314 .0819 -.3077 .0121ZChrist -.1526 -.1542 .0859 -.3320 .0059Zantisem -.1518 -.1493 .1012 -.3460 .0546
*********************** ANALYSIS NOTES AND ERRORS ************************
Level of confidence for all confidence intervals in output:95.0000
Number of bootstrap samples for percentile bootstrap confidence intervals:5000
------ END MATRIX -----
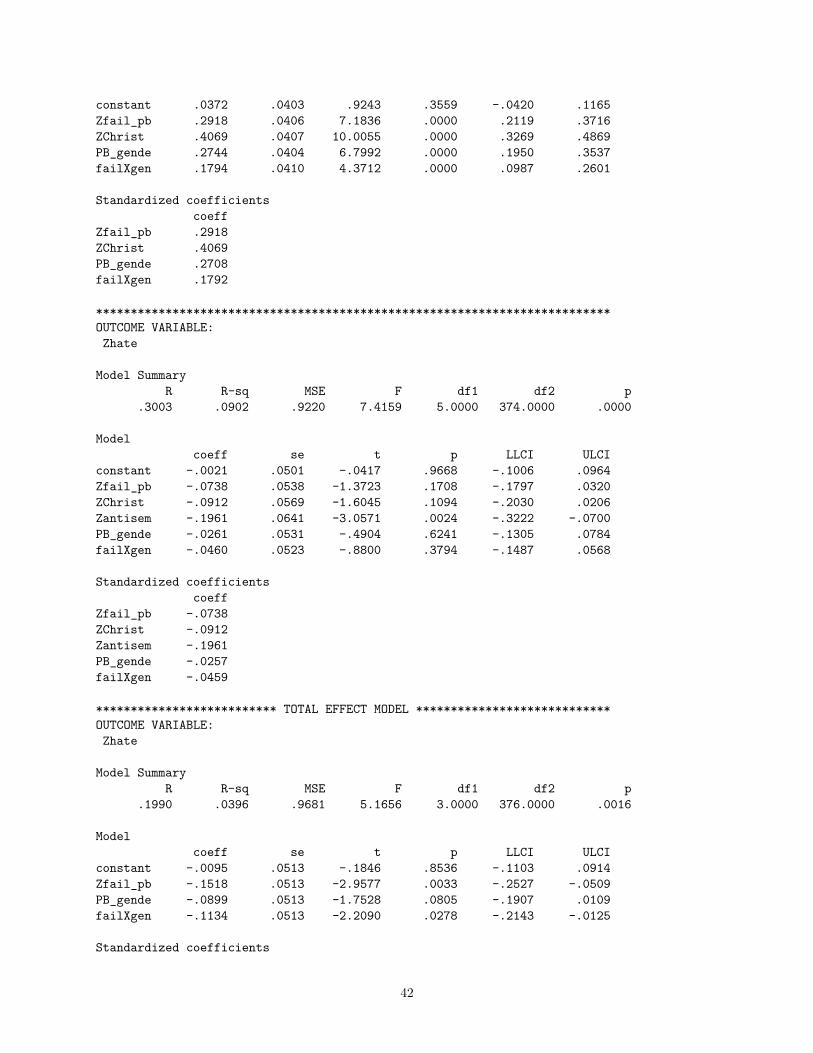
Path Analysis with gender and gender X disempowerment:
To assess the differences between the groups, we inspected (1) the differences in betas (as an indicationof effect size; given the reduced sample sizes we chose a difference of at least .3 as practically relevant),(2) the overlap of the confidence intervals, as well as (3) a statistical comparison of betas as suggested byCohen, Cohen, West, and Aiken (2003, https://doi.org/10.4324/9780203774441 ) - with t = b1−b2√
se2b1+se2
b2and
df = n1 + n2 − 4.Summary:
Table 25: Gender Differences in Path Parameters (Pittsburgh)
Path βwomen[95%CI] pwomen βmen[95%CI] pmen δBetas t df pdiff
Disempowerment →Radical Nationalism -0.07 [-0.2, 0.07] 0.329 0.31 [0.16, 0.45] 0.000 0.38 3.74 376 0.000Disempowerment →Prejudice 0.11 [0.02, 0.2] 0.020 0.42 [0.28, 0.57] 0.000 0.32 3.66 376 0.000Radical Nationalism →Prejudice 0.32 [0.23, 0.41] 0.000 0.56 [0.41, 0.71] 0.000 0.24 2.75 376 0.006Disempowerment →Hate Crime Perceptions -0.02 [-0.15, 0.1] 0.732 -0.13 [-0.31, 0.05] 0.167 0.11 0.94 376 0.348Radical Nationalism →Hate Crime Perceptions -0.06 [-0.19, 0.08] 0.413 -0.15 [-0.35, 0.04] 0.128 0.10 0.79 376 0.430Prejudice →Hate Crime Perceptions -0.24 [-0.42, -0.05] 0.013 -0.15 [-0.33, 0.03] 0.096 0.09 0.65 376 0.514
Inspection of the two subgroup analyses indicated that the effects of disempowerment on christiannationalism and Antisemitism were the effects that notably differed between men and women (i.e.,non-overlapping CIs, statistically significant difference in betas, difference in standardized beta largerthan .3). We, therefore, reran the original path model with gender and gender X disempowermentas additional predictors of all down-stream outcomes (i.e., christian nationalism, Antisemitism, andhate crime attributions). It should be noted that the effect of Nationalism on Antisemitism was also
40
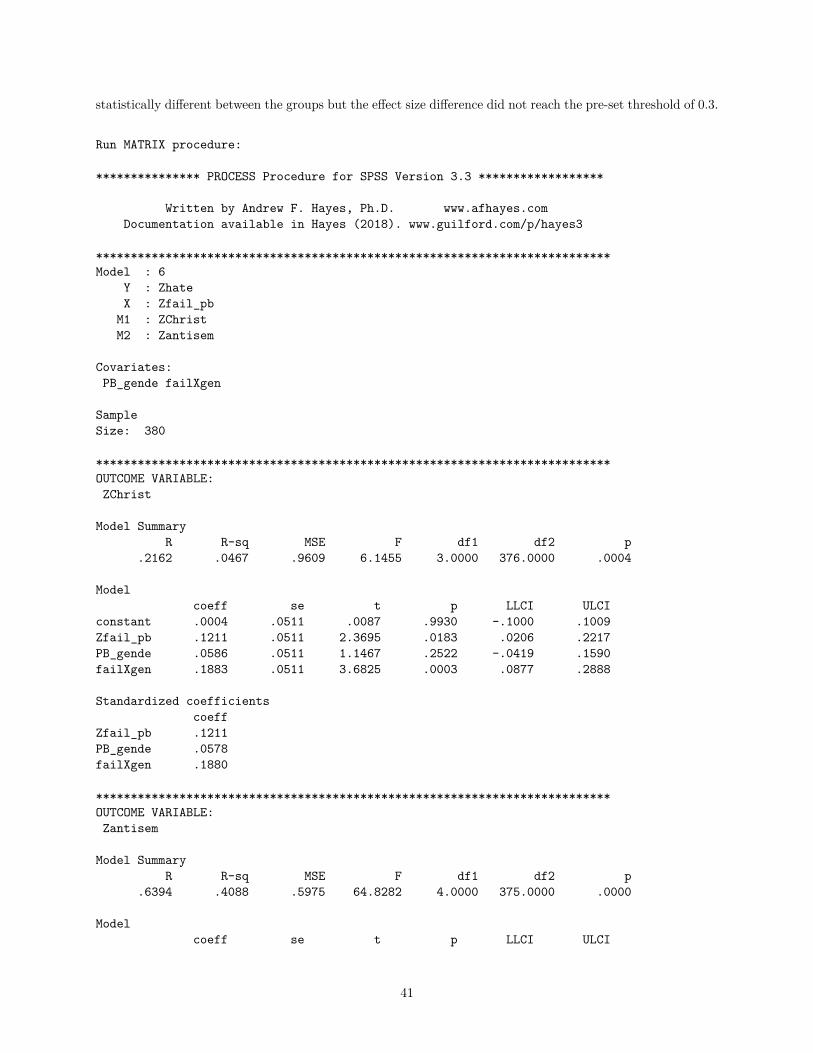
statistically different between the groups but the effect size difference did not reach the pre-set threshold of 0.3.
Run MATRIX procedure:
*************** PROCESS Procedure for SPSS Version 3.3 ******************
Written by Andrew F. Hayes, Ph.D. www.afhayes.comDocumentation available in Hayes (2018). www.guilford.com/p/hayes3
**************************************************************************Model : 6
Y : ZhateX : Zfail_pb
M1 : ZChristM2 : Zantisem
Covariates:PB_gende failXgen
SampleSize: 380
**************************************************************************OUTCOME VARIABLE:ZChrist
Model SummaryR R-sq MSE F df1 df2 p
.2162 .0467 .9609 6.1455 3.0000 376.0000 .0004
Modelcoeff se t p LLCI ULCI
constant .0004 .0511 .0087 .9930 -.1000 .1009Zfail_pb .1211 .0511 2.3695 .0183 .0206 .2217PB_gende .0586 .0511 1.1467 .2522 -.0419 .1590failXgen .1883 .0511 3.6825 .0003 .0877 .2888
Standardized coefficientscoeff
Zfail_pb .1211PB_gende .0578failXgen .1880
**************************************************************************OUTCOME VARIABLE:Zantisem
Model SummaryR R-sq MSE F df1 df2 p
.6394 .4088 .5975 64.8282 4.0000 375.0000 .0000
Modelcoeff se t p LLCI ULCI
41
constant .0372 .0403 .9243 .3559 -.0420 .1165Zfail_pb .2918 .0406 7.1836 .0000 .2119 .3716ZChrist .4069 .0407 10.0055 .0000 .3269 .4869PB_gende .2744 .0404 6.7992 .0000 .1950 .3537failXgen .1794 .0410 4.3712 .0000 .0987 .2601
Standardized coefficientscoeff
Zfail_pb .2918ZChrist .4069PB_gende .2708failXgen .1792
**************************************************************************OUTCOME VARIABLE:Zhate
Model SummaryR R-sq MSE F df1 df2 p
.3003 .0902 .9220 7.4159 5.0000 374.0000 .0000
Modelcoeff se t p LLCI ULCI
constant -.0021 .0501 -.0417 .9668 -.1006 .0964Zfail_pb -.0738 .0538 -1.3723 .1708 -.1797 .0320ZChrist -.0912 .0569 -1.6045 .1094 -.2030 .0206Zantisem -.1961 .0641 -3.0571 .0024 -.3222 -.0700PB_gende -.0261 .0531 -.4904 .6241 -.1305 .0784failXgen -.0460 .0523 -.8800 .3794 -.1487 .0568
Standardized coefficientscoeff
Zfail_pb -.0738ZChrist -.0912Zantisem -.1961PB_gende -.0257failXgen -.0459
************************** TOTAL EFFECT MODEL ****************************OUTCOME VARIABLE:Zhate
Model SummaryR R-sq MSE F df1 df2 p
.1990 .0396 .9681 5.1656 3.0000 376.0000 .0016
Modelcoeff se t p LLCI ULCI
constant -.0095 .0513 -.1846 .8536 -.1103 .0914Zfail_pb -.1518 .0513 -2.9577 .0033 -.2527 -.0509PB_gende -.0899 .0513 -1.7528 .0805 -.1907 .0109failXgen -.1134 .0513 -2.2090 .0278 -.2143 -.0125
Standardized coefficients
42
coeffZfail_pb -.1518PB_gende -.0887failXgen -.1132
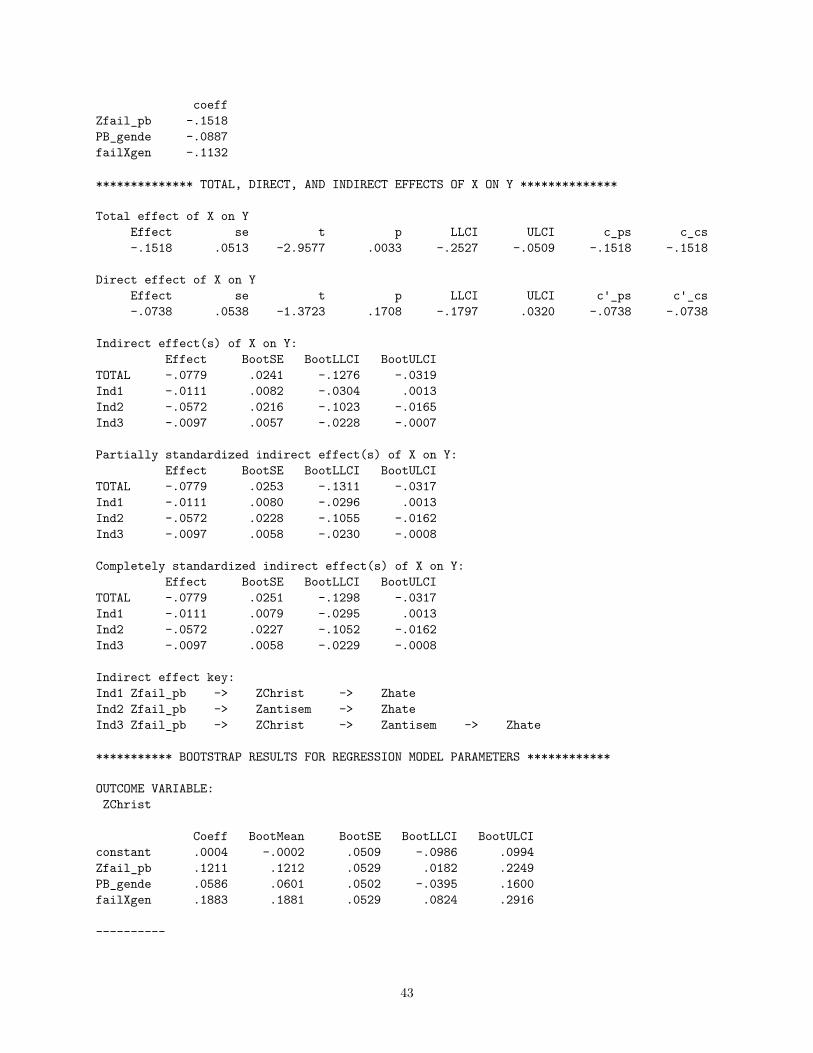
************** TOTAL, DIRECT, AND INDIRECT EFFECTS OF X ON Y **************
Total effect of X on YEffect se t p LLCI ULCI c_ps c_cs-.1518 .0513 -2.9577 .0033 -.2527 -.0509 -.1518 -.1518
Direct effect of X on YEffect se t p LLCI ULCI c'_ps c'_cs-.0738 .0538 -1.3723 .1708 -.1797 .0320 -.0738 -.0738
Indirect effect(s) of X on Y:Effect BootSE BootLLCI BootULCI
TOTAL -.0779 .0241 -.1276 -.0319Ind1 -.0111 .0082 -.0304 .0013Ind2 -.0572 .0216 -.1023 -.0165Ind3 -.0097 .0057 -.0228 -.0007
Partially standardized indirect effect(s) of X on Y:Effect BootSE BootLLCI BootULCI
TOTAL -.0779 .0253 -.1311 -.0317Ind1 -.0111 .0080 -.0296 .0013Ind2 -.0572 .0228 -.1055 -.0162Ind3 -.0097 .0058 -.0230 -.0008
Completely standardized indirect effect(s) of X on Y:Effect BootSE BootLLCI BootULCI
TOTAL -.0779 .0251 -.1298 -.0317Ind1 -.0111 .0079 -.0295 .0013Ind2 -.0572 .0227 -.1052 -.0162Ind3 -.0097 .0058 -.0229 -.0008
Indirect effect key:Ind1 Zfail_pb -> ZChrist -> ZhateInd2 Zfail_pb -> Zantisem -> ZhateInd3 Zfail_pb -> ZChrist -> Zantisem -> Zhate
*********** BOOTSTRAP RESULTS FOR REGRESSION MODEL PARAMETERS ************
OUTCOME VARIABLE:ZChrist
Coeff BootMean BootSE BootLLCI BootULCIconstant .0004 -.0002 .0509 -.0986 .0994Zfail_pb .1211 .1212 .0529 .0182 .2249PB_gende .0586 .0601 .0502 -.0395 .1600failXgen .1883 .1881 .0529 .0824 .2916
----------
43
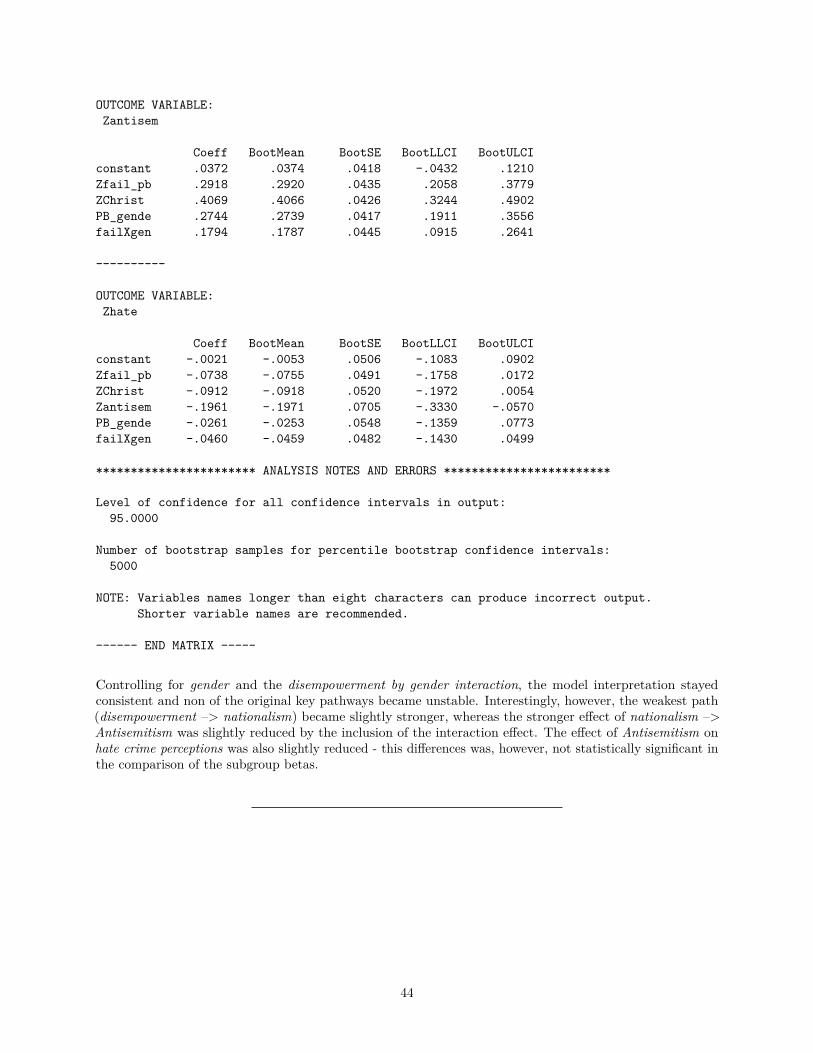
OUTCOME VARIABLE:Zantisem
Coeff BootMean BootSE BootLLCI BootULCIconstant .0372 .0374 .0418 -.0432 .1210Zfail_pb .2918 .2920 .0435 .2058 .3779ZChrist .4069 .4066 .0426 .3244 .4902PB_gende .2744 .2739 .0417 .1911 .3556failXgen .1794 .1787 .0445 .0915 .2641
----------
OUTCOME VARIABLE:Zhate
Coeff BootMean BootSE BootLLCI BootULCIconstant -.0021 -.0053 .0506 -.1083 .0902Zfail_pb -.0738 -.0755 .0491 -.1758 .0172ZChrist -.0912 -.0918 .0520 -.1972 .0054Zantisem -.1961 -.1971 .0705 -.3330 -.0570PB_gende -.0261 -.0253 .0548 -.1359 .0773failXgen -.0460 -.0459 .0482 -.1430 .0499
*********************** ANALYSIS NOTES AND ERRORS ************************
Level of confidence for all confidence intervals in output:95.0000
Number of bootstrap samples for percentile bootstrap confidence intervals:5000
NOTE: Variables names longer than eight characters can produce incorrect output.Shorter variable names are recommended.
------ END MATRIX -----
Controlling for gender and the disempowerment by gender interaction, the model interpretation stayedconsistent and non of the original key pathways became unstable. Interestingly, however, the weakest path(disempowerment –> nationalism) became slightly stronger, whereas the stronger effect of nationalism –>Antisemitism was slightly reduced by the inclusion of the interaction effect. The effect of Antisemitism onhate crime perceptions was also slightly reduced - this differences was, however, not statistically significant inthe comparison of the subgroup betas.
44
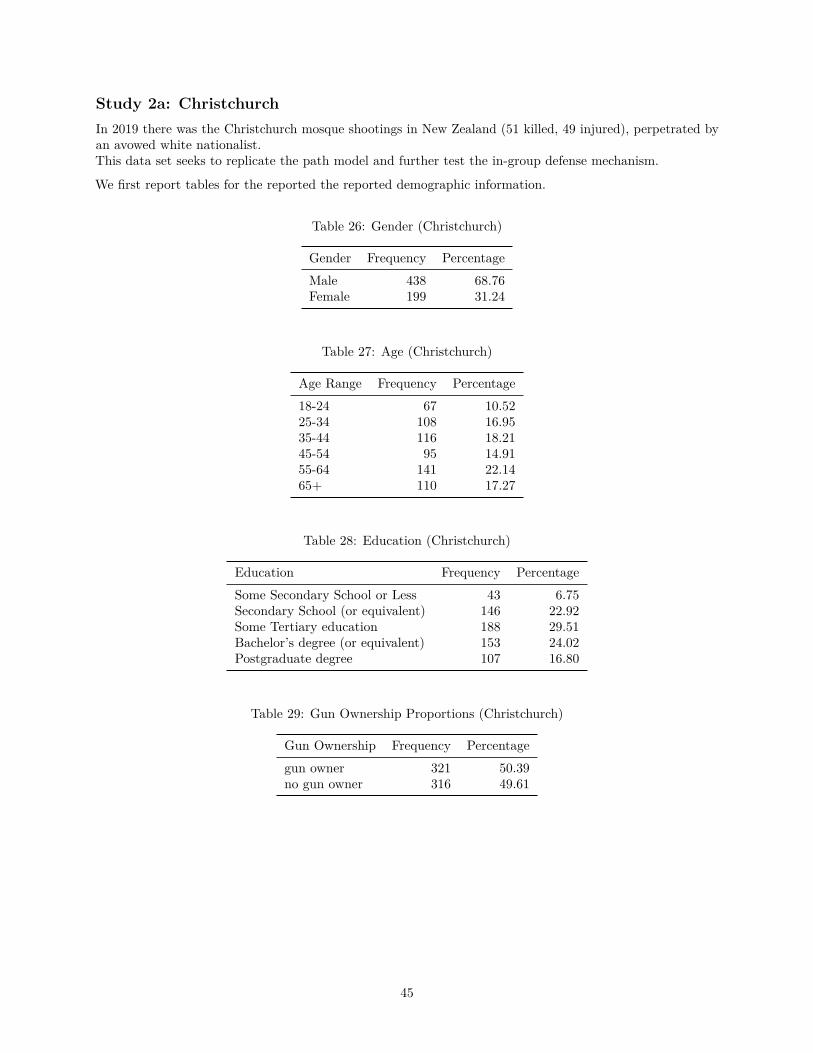
Study 2a: ChristchurchIn 2019 there was the Christchurch mosque shootings in New Zealand (51 killed, 49 injured), perpetrated byan avowed white nationalist.This data set seeks to replicate the path model and further test the in-group defense mechanism.
We first report tables for the reported the reported demographic information.
Table 26: Gender (Christchurch)
Gender Frequency PercentageMale 438 68.76Female 199 31.24
Table 27: Age (Christchurch)
Age Range Frequency Percentage18-24 67 10.5225-34 108 16.9535-44 116 18.2145-54 95 14.9155-64 141 22.1465+ 110 17.27
Table 28: Education (Christchurch)
Education Frequency PercentageSome Secondary School or Less 43 6.75Secondary School (or equivalent) 146 22.92Some Tertiary education 188 29.51Bachelor’s degree (or equivalent) 153 24.02Postgraduate degree 107 16.80
Table 29: Gun Ownership Proportions (Christchurch)
Gun Ownership Frequency Percentagegun owner 321 50.39no gun owner 316 49.61
45
Scale Construction
Hate Crime Attributions
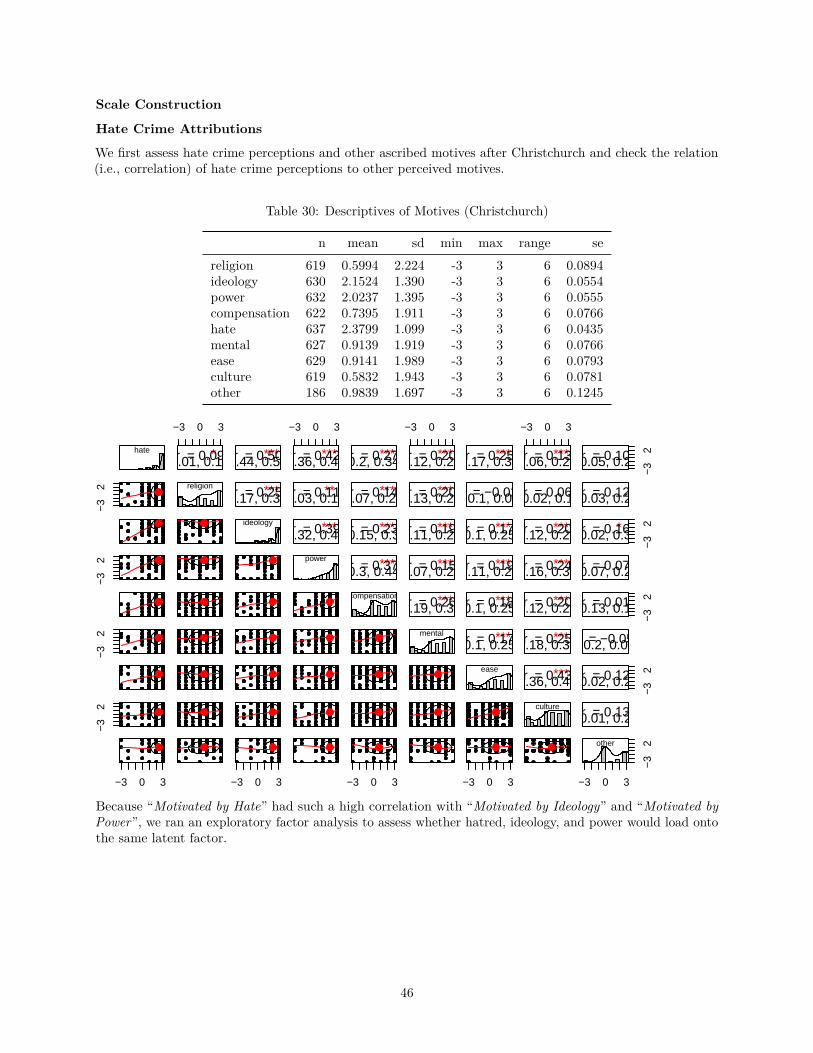
We first assess hate crime perceptions and other ascribed motives after Christchurch and check the relation(i.e., correlation) of hate crime perceptions to other perceived motives.
Table 30: Descriptives of Motives (Christchurch)
n mean sd min max range sereligion 619 0.5994 2.224 -3 3 6 0.0894ideology 630 2.1524 1.390 -3 3 6 0.0554power 632 2.0237 1.395 -3 3 6 0.0555compensation 622 0.7395 1.911 -3 3 6 0.0766hate 637 2.3799 1.099 -3 3 6 0.0435mental 627 0.9139 1.919 -3 3 6 0.0766ease 629 0.9141 1.989 -3 3 6 0.0793culture 619 0.5832 1.943 -3 3 6 0.0781other 186 0.9839 1.697 -3 3 6 0.1245
hate
−3
2−
32
−3
2−
32
−3 0 3
−3 0 3
*r = 0.09[0.01, 0.17]
religion
***r = 0.50[0.44, 0.56]
***r = 0.25[0.17, 0.32]
ideology
−3 0 3
−3 0 3
***r = 0.42[0.36, 0.48]
**r = 0.11[0.03, 0.19]
***r = 0.39[0.32, 0.45]
power
***r = 0.27[0.2, 0.34]
***r = 0.14[0.07, 0.22]
***r = 0.23[0.15, 0.3]
***r = 0.37[0.3, 0.44]
compensation
−3 0 3
−3 0 3
***r = 0.20[0.12, 0.27]
***r = 0.20[0.13, 0.28]
***r = 0.19[0.11, 0.26]
***r = 0.15[0.07, 0.23]
***r = 0.26[0.19, 0.33]
mental
***r = 0.25[0.17, 0.32]
r = −0.02[−0.1, 0.06]
***r = 0.17[0.1, 0.25]
***r = 0.19[0.11, 0.26]
***r = 0.18[0.1, 0.25]
***r = 0.17[0.1, 0.25]
ease
−3 0 3
−3 0 3
***r = 0.13[0.06, 0.21]
r = 0.06[−0.02, 0.14]
***r = 0.20[0.12, 0.27]
***r = 0.24[0.16, 0.31]
***r = 0.20[0.12, 0.28]
***r = 0.25[0.18, 0.33]
***r = 0.43[0.36, 0.49]
culture
−3
2 r = 0.10[−0.05, 0.24]
r = 0.12[−0.03, 0.26]
−3
2*r = 0.16[0.02, 0.3]
r = 0.07[−0.07, 0.21]
−3
2 r = 0.01[−0.13, 0.15]
r = −0.05[−0.2, 0.09]
−3
2.r = 0.12[−0.02, 0.26]
.r = 0.13[−0.01, 0.27]
−3 0 3
−3
2other
Because “Motivated by Hate” had such a high correlation with “Motivated by Ideology” and “Motivated byPower”, we ran an exploratory factor analysis to assess whether hatred, ideology, and power would load ontothe same latent factor.
46
2 4 6 8
0.0
0.5
1.0
1.5
2.0
2.5
Parallel Analysis Scree Plots for Shooter Motives
Factor Number
eige
n va
lues
of p
rinci
pal f
acto
rs FA Actual Data FA Simulated Data FA Resampled Data
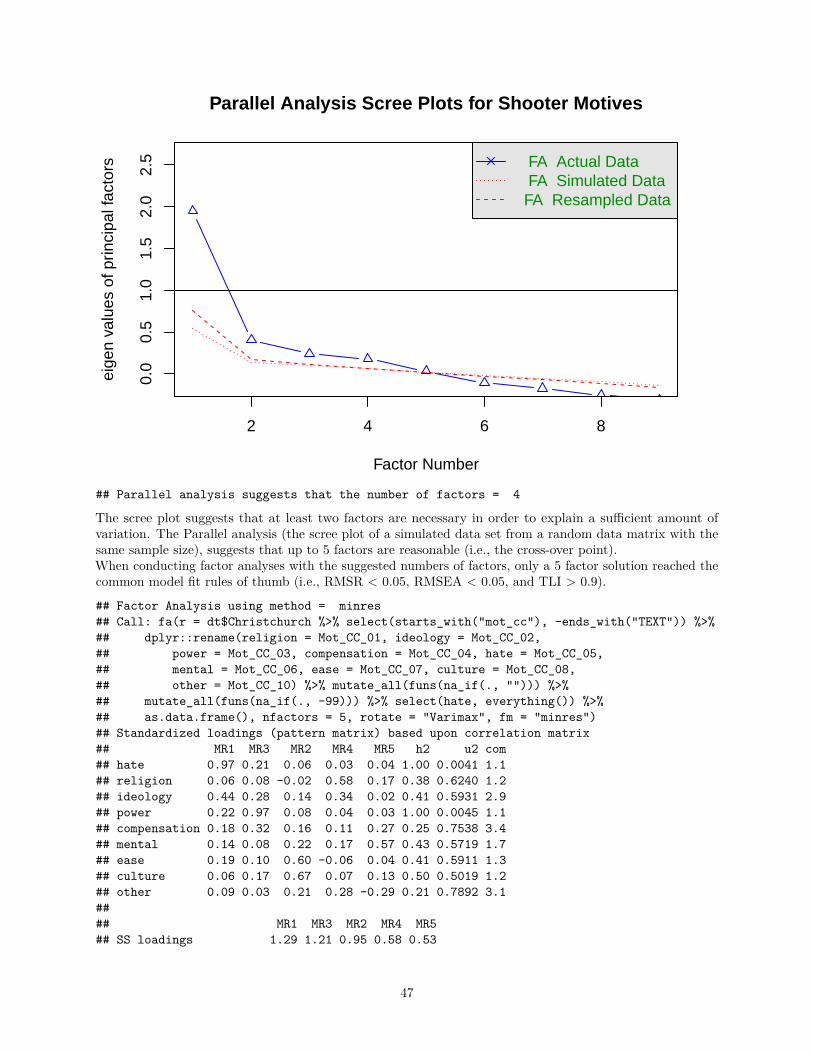
## Parallel analysis suggests that the number of factors = 4
The scree plot suggests that at least two factors are necessary in order to explain a sufficient amount ofvariation. The Parallel analysis (the scree plot of a simulated data set from a random data matrix with thesame sample size), suggests that up to 5 factors are reasonable (i.e., the cross-over point).When conducting factor analyses with the suggested numbers of factors, only a 5 factor solution reached thecommon model fit rules of thumb (i.e., RMSR < 0.05, RMSEA < 0.05, and TLI > 0.9).
## Factor Analysis using method = minres## Call: fa(r = dt$Christchurch %>% select(starts_with("mot_cc"), -ends_with("TEXT")) %>%## dplyr::rename(religion = Mot_CC_01, ideology = Mot_CC_02,## power = Mot_CC_03, compensation = Mot_CC_04, hate = Mot_CC_05,## mental = Mot_CC_06, ease = Mot_CC_07, culture = Mot_CC_08,## other = Mot_CC_10) %>% mutate_all(funs(na_if(., ""))) %>%## mutate_all(funs(na_if(., -99))) %>% select(hate, everything()) %>%## as.data.frame(), nfactors = 5, rotate = "Varimax", fm = "minres")## Standardized loadings (pattern matrix) based upon correlation matrix## MR1 MR3 MR2 MR4 MR5 h2 u2 com## hate 0.97 0.21 0.06 0.03 0.04 1.00 0.0041 1.1## religion 0.06 0.08 -0.02 0.58 0.17 0.38 0.6240 1.2## ideology 0.44 0.28 0.14 0.34 0.02 0.41 0.5931 2.9## power 0.22 0.97 0.08 0.04 0.03 1.00 0.0045 1.1## compensation 0.18 0.32 0.16 0.11 0.27 0.25 0.7538 3.4## mental 0.14 0.08 0.22 0.17 0.57 0.43 0.5719 1.7## ease 0.19 0.10 0.60 -0.06 0.04 0.41 0.5911 1.3## culture 0.06 0.17 0.67 0.07 0.13 0.50 0.5019 1.2## other 0.09 0.03 0.21 0.28 -0.29 0.21 0.7892 3.1#### MR1 MR3 MR2 MR4 MR5## SS loadings 1.29 1.21 0.95 0.58 0.53
47
## Proportion Var 0.14 0.13 0.11 0.06 0.06## Cumulative Var 0.14 0.28 0.38 0.45 0.51## Proportion Explained 0.28 0.27 0.21 0.13 0.12## Cumulative Proportion 0.28 0.55 0.76 0.88 1.00#### Mean item complexity = 1.9## Test of the hypothesis that 5 factors are sufficient.#### The degrees of freedom for the null model are 36 and the objective function was## 1.36 with Chi Square of 860## The degrees of freedom for the model are 1 and the objective function was 0#### The root mean square of the residuals (RMSR) is 0## The df corrected root mean square of the residuals is 0.02#### The harmonic number of observations is 414 with the empirical chi square 0.49 with## prob < 0.49. The total number of observations was 637 with Likelihood## Chi Square = 0.71 with prob < 0.4#### Tucker Lewis Index of factoring reliability = 1.013## RMSEA index = 0 and the 90 % confidence intervals are 0 0.099## BIC = -5.74## Fit based upon off diagonal values = 1## Measures of factor score adequacy## MR1 MR3 MR2 MR4 MR5## Correlation of (regression) scores with factors 1.00 1.00 0.78 0.68 0.65## Multiple R square of scores with factors 0.99 0.99 0.60 0.46 0.43## Minimum correlation of possible factor scores 0.99 0.98 0.21 -0.09 -0.14
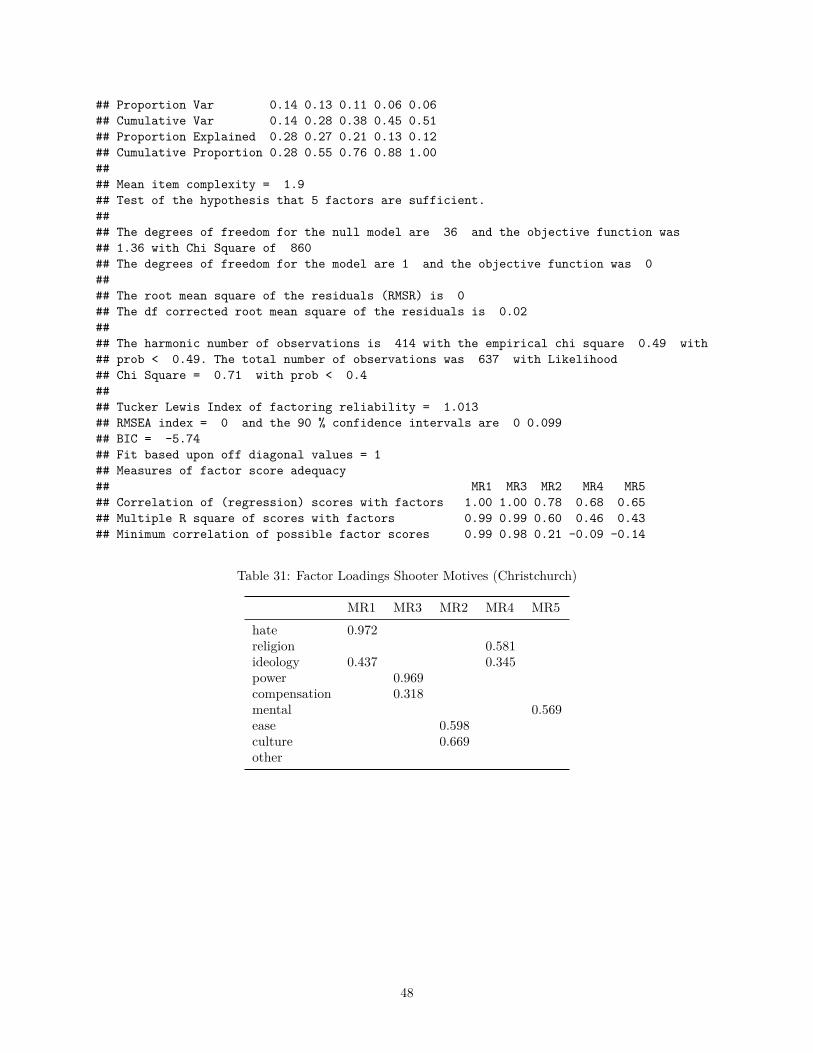
Table 31: Factor Loadings Shooter Motives (Christchurch)
MR1 MR3 MR2 MR4 MR5hate 0.972religion 0.581ideology 0.437 0.345power 0.969compensation 0.318mental 0.569ease 0.598culture 0.669other
48
Factor Analysis
hate
ideology
power
compensation
culture
ease
religion
mental
other
MR11
0.4
MR31
0.3
MR20.7
0.6
MR40.6
MR50.6
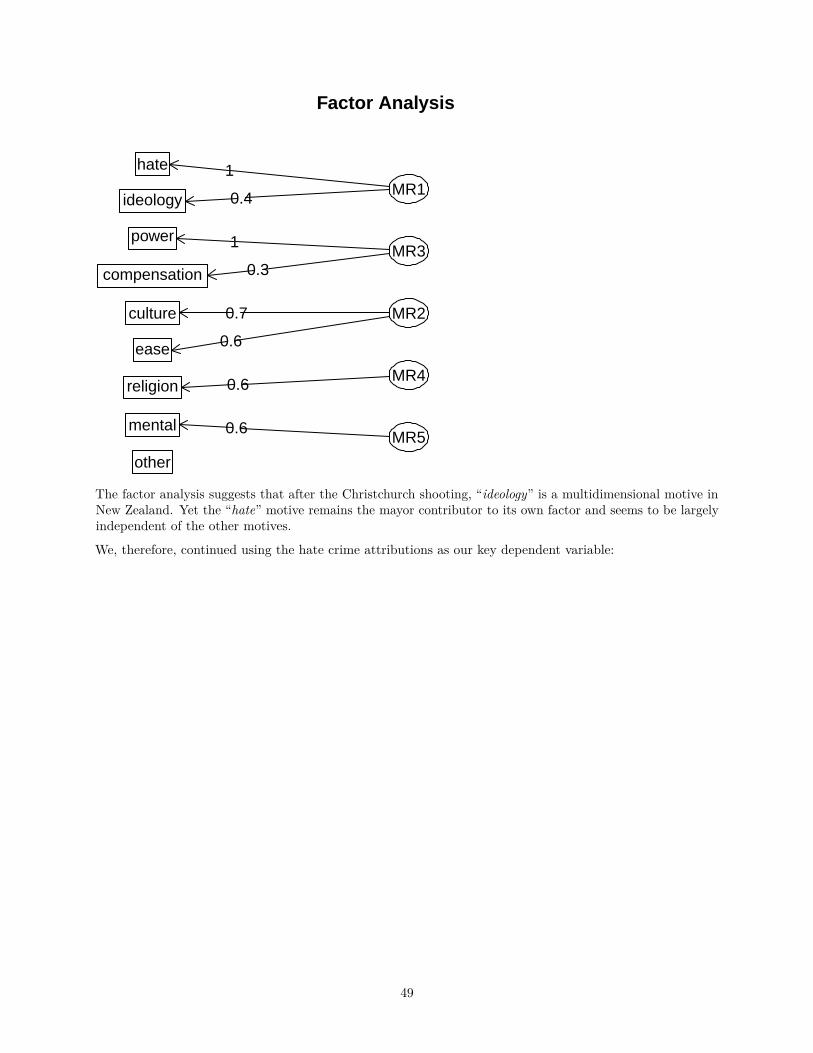
The factor analysis suggests that after the Christchurch shooting, “ideology” is a multidimensional motive inNew Zealand. Yet the “hate” motive remains the mayor contributor to its own factor and seems to be largelyindependent of the other motives.
We, therefore, continued using the hate crime attributions as our key dependent variable:
49
0
100
200
300
400
−2 0 2Hate Crime Attribution Thousand Oaks
coun
tDistribution of Hate Crime Attribution after the Thousand Oaks Shooting
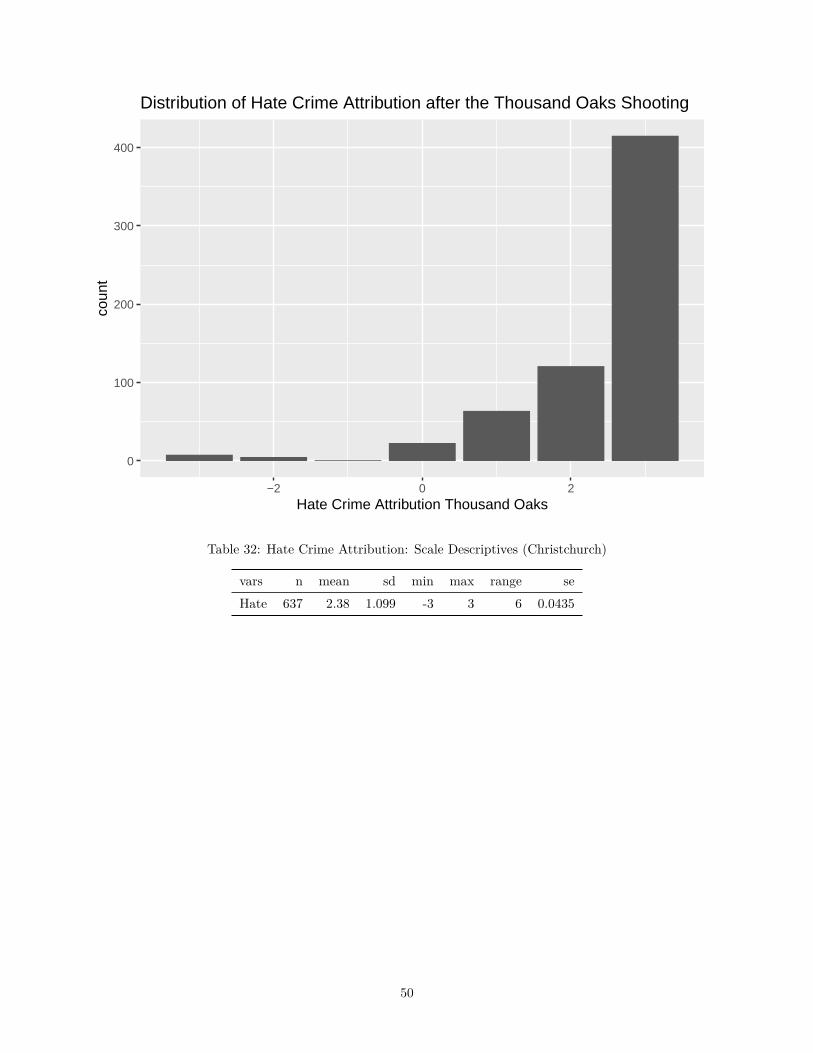
Table 32: Hate Crime Attribution: Scale Descriptives (Christchurch)
vars n mean sd min max range seHate 637 2.38 1.099 -3 3 6 0.0435
50
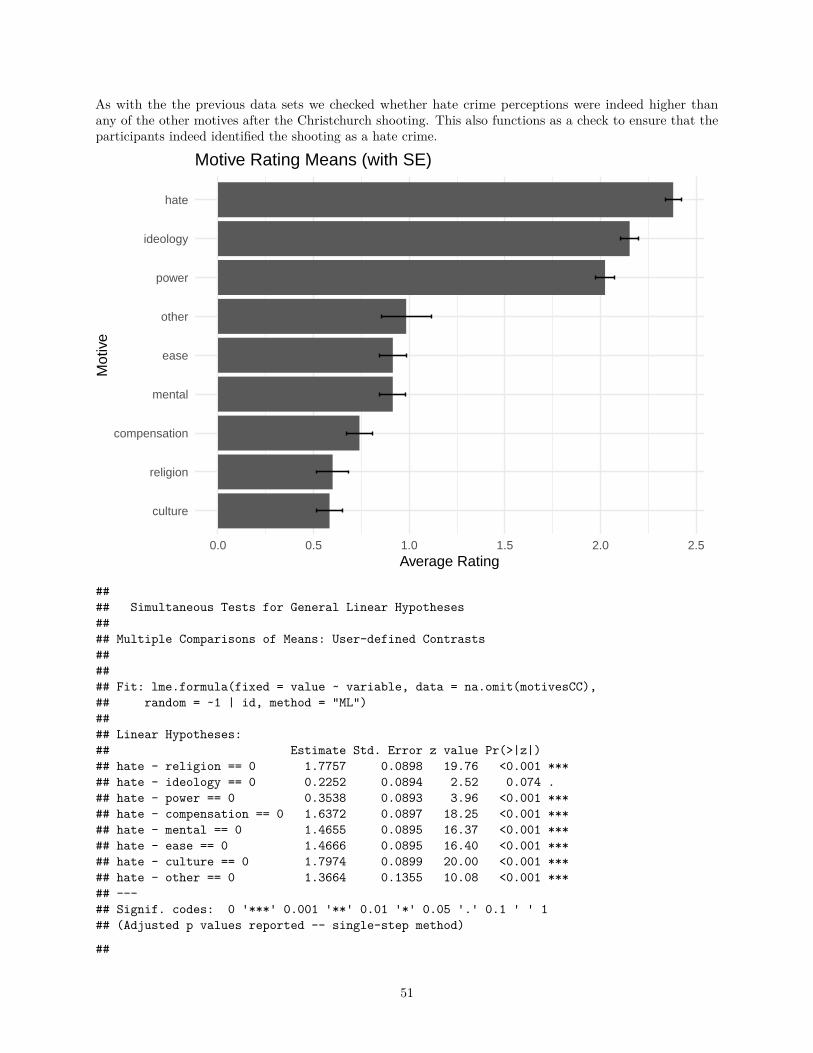
As with the the previous data sets we checked whether hate crime perceptions were indeed higher thanany of the other motives after the Christchurch shooting. This also functions as a check to ensure that theparticipants indeed identified the shooting as a hate crime.
culture
religion
compensation
mental
ease
other
power
ideology
hate
0.0 0.5 1.0 1.5 2.0 2.5Average Rating
Mot
ive
Motive Rating Means (with SE)
#### Simultaneous Tests for General Linear Hypotheses#### Multiple Comparisons of Means: User-defined Contrasts###### Fit: lme.formula(fixed = value ~ variable, data = na.omit(motivesCC),## random = ~1 | id, method = "ML")#### Linear Hypotheses:## Estimate Std. Error z value Pr(>|z|)## hate - religion == 0 1.7757 0.0898 19.76 <0.001 ***## hate - ideology == 0 0.2252 0.0894 2.52 0.074 .## hate - power == 0 0.3538 0.0893 3.96 <0.001 ***## hate - compensation == 0 1.6372 0.0897 18.25 <0.001 ***## hate - mental == 0 1.4655 0.0895 16.37 <0.001 ***## hate - ease == 0 1.4666 0.0895 16.40 <0.001 ***## hate - culture == 0 1.7974 0.0899 20.00 <0.001 ***## hate - other == 0 1.3664 0.1355 10.08 <0.001 ***## ---## Signif. codes: 0 '***' 0.001 '**' 0.01 '*' 0.05 '.' 0.1 ' ' 1## (Adjusted p values reported -- single-step method)
##
51
## Simultaneous Confidence Intervals#### Multiple Comparisons of Means: User-defined Contrasts###### Fit: lme.formula(fixed = value ~ variable, data = na.omit(motivesCC),## random = ~1 | id, method = "ML")#### Quantile = 2.667## 95% family-wise confidence level###### Linear Hypotheses:## Estimate lwr upr## hate - religion == 0 1.7757 1.5361 2.0153## hate - ideology == 0 0.2252 -0.0133 0.4636## hate - power == 0 0.3538 0.1156 0.5921## hate - compensation == 0 1.6372 1.3979 1.8765## hate - mental == 0 1.4655 1.2267 1.7043## hate - ease == 0 1.4666 1.2281 1.7052## hate - culture == 0 1.7974 1.5578 2.0371## hate - other == 0 1.3664 1.0050 1.7278
The results suggest that hate crime perceptions were indeed higher than any of the other motive perceptions(except for ideology, which became non-significant after multi-test alpha correction).
52
Robust test
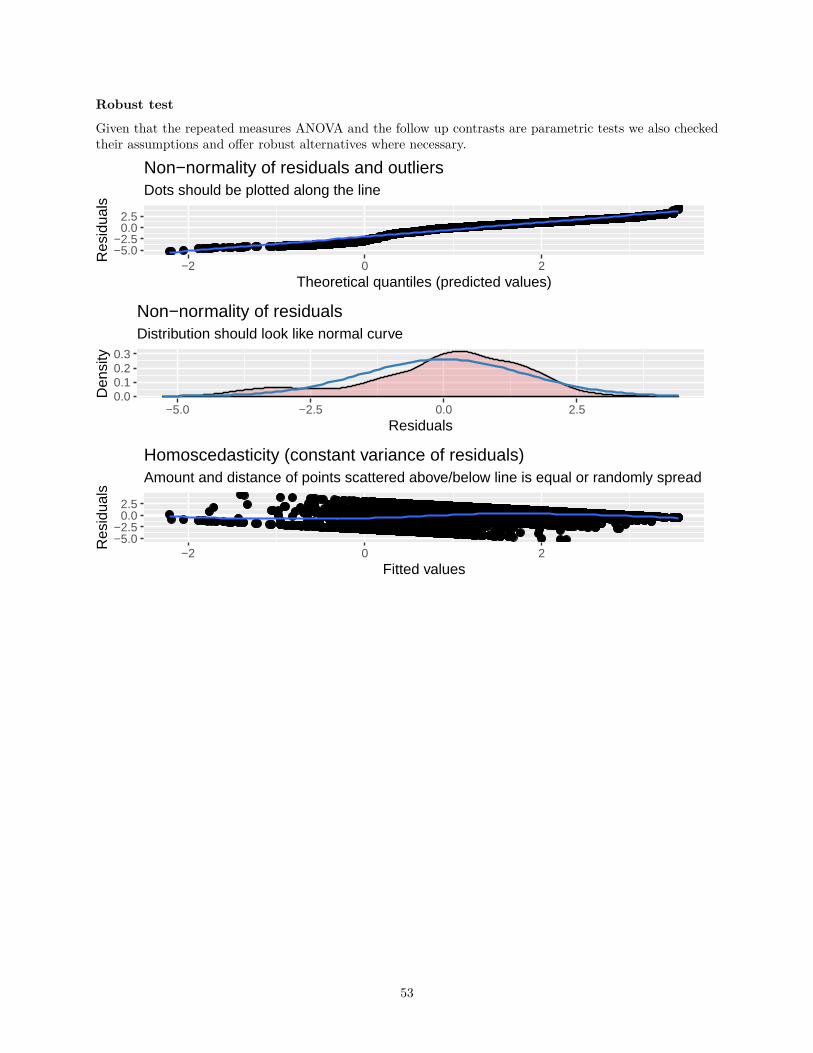
Given that the repeated measures ANOVA and the follow up contrasts are parametric tests we also checkedtheir assumptions and offer robust alternatives where necessary.
−5.0−2.5
0.02.5
−2 0 2Theoretical quantiles (predicted values)
Res
idua
ls
Dots should be plotted along the line
Non−normality of residuals and outliers
0.00.10.20.3
−5.0 −2.5 0.0 2.5Residuals
Den
sity
Distribution should look like normal curve
Non−normality of residuals
−5.0−2.5
0.02.5
−2 0 2Fitted values
Res
idua
ls
Amount and distance of points scattered above/below line is equal or randomly spread
Homoscedasticity (constant variance of residuals)
53
other
culture
ease
mental
hate
compensation
power
ideology
religion
−5.0 −2.5 0.0 2.5
Residuals
Gro
upFollow−Up Sphericity
Visual inspection of the qq-plot and the distribution of the residuals suggested a slight slight violation ofnormality and a further inspection of the sphericity (and homoscedasticity) assumption indicated differencesin the variances between the categories. This was also corroborated by the ration of largest group variance tosmallest variance = 4.1, which is larger than the recommended 1.5 rule of thumb.Even though with large sample sizes and largely balanced data (i.e., almost all participants responded on allmotives) the tests are quite robust to violations of homoscedasticity we still offer a robust heteroscedasticrepeated measurement ANOVA. Given the violations of normality we additionally offer a Friedman rank sumtest that does not assume normality. We removed the ‘other’ from the analyses because some of the robustanalyses need fully balanced designs and 451 participants did not rate any additional motivations. For theoverall robust ANOVA we, however, offer a bootstrapped alternative that is able to deal with missing data.For the follow-up comparisons we present the relevant Hate crime subset of a full robust post-hoc test with aHochberg’s approach to control for the family-wise error (FWE).
## [1] "robust heteroscedastic repeated measurement ANOVA: F(5.48, 3215.42) = 135.18, p < 0.001"
## [1] "robust heteroscedastic bootstrapped repeated measurement ANOVA without the 'other'## category removed: F = 33.1 with a critical value of 2.23 and given that F > F_critical,## the bootstrapped test equally indicates an overall statistical significance."
#### Friedman rank sum test#### data: value and variable and id## Friedman chi-squared = 912, df = 7, p-value <0.0000000000000002
As expected the robust follow-ups mirrored the parametric contrasts.
54
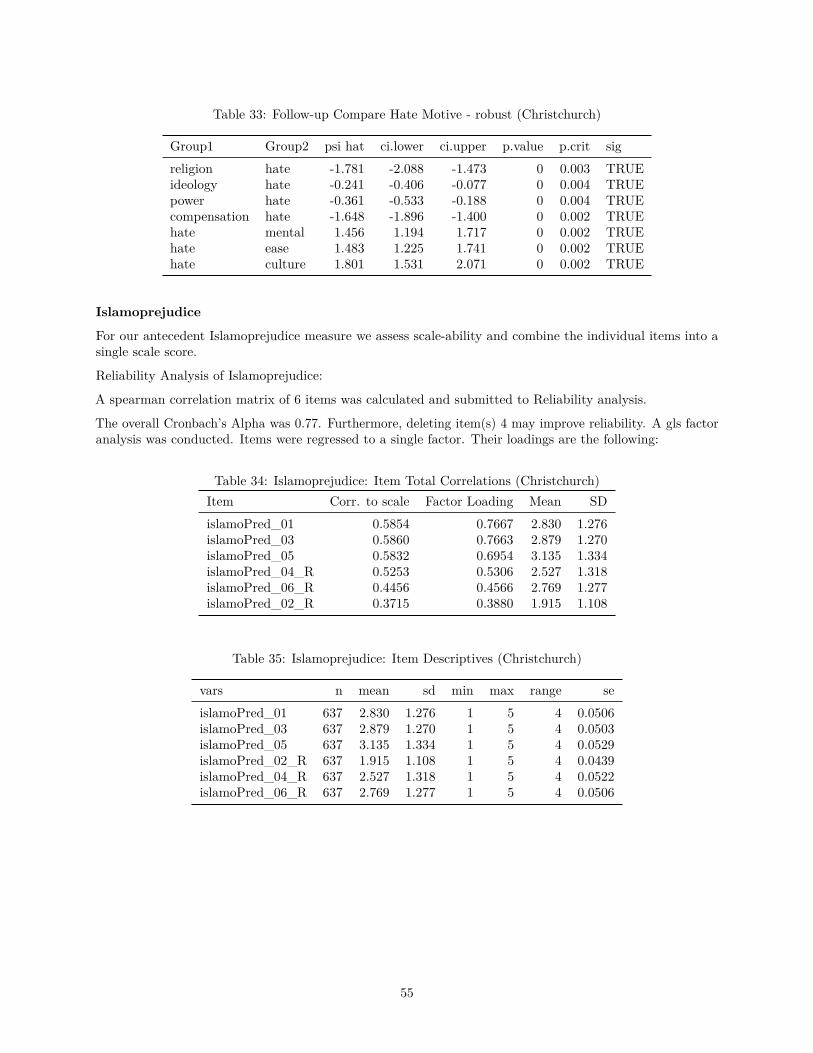
Table 33: Follow-up Compare Hate Motive - robust (Christchurch)
Group1 Group2 psi hat ci.lower ci.upper p.value p.crit sigreligion hate -1.781 -2.088 -1.473 0 0.003 TRUEideology hate -0.241 -0.406 -0.077 0 0.004 TRUEpower hate -0.361 -0.533 -0.188 0 0.004 TRUEcompensation hate -1.648 -1.896 -1.400 0 0.002 TRUEhate mental 1.456 1.194 1.717 0 0.002 TRUEhate ease 1.483 1.225 1.741 0 0.002 TRUEhate culture 1.801 1.531 2.071 0 0.002 TRUE
Islamoprejudice
For our antecedent Islamoprejudice measure we assess scale-ability and combine the individual items into asingle scale score.
Reliability Analysis of Islamoprejudice:
A spearman correlation matrix of 6 items was calculated and submitted to Reliability analysis.
The overall Cronbach’s Alpha was 0.77. Furthermore, deleting item(s) 4 may improve reliability. A gls factoranalysis was conducted. Items were regressed to a single factor. Their loadings are the following:
Table 34: Islamoprejudice: Item Total Correlations (Christchurch)Item Corr. to scale Factor Loading Mean SDislamoPred_01 0.5854 0.7667 2.830 1.276islamoPred_03 0.5860 0.7663 2.879 1.270islamoPred_05 0.5832 0.6954 3.135 1.334islamoPred_04_R 0.5253 0.5306 2.527 1.318islamoPred_06_R 0.4456 0.4566 2.769 1.277islamoPred_02_R 0.3715 0.3880 1.915 1.108
Table 35: Islamoprejudice: Item Descriptives (Christchurch)
vars n mean sd min max range seislamoPred_01 637 2.830 1.276 1 5 4 0.0506islamoPred_03 637 2.879 1.270 1 5 4 0.0503islamoPred_05 637 3.135 1.334 1 5 4 0.0529islamoPred_02_R 637 1.915 1.108 1 5 4 0.0439islamoPred_04_R 637 2.527 1.318 1 5 4 0.0522islamoPred_06_R 637 2.769 1.277 1 5 4 0.0506
55
islamoPred_011
35
13
5
1 2 3 4 5
13
5
1 2 3 4 5
***r = 0.69[0.65, 0.73]
islamoPred_03
***r = 0.54[0.49, 0.6]
***r = 0.54[0.48, 0.59]
islamoPred_05
1 2 3 4 5
1 2 3 4 5
***r = 0.21[0.14, 0.29]
***r = 0.22[0.14, 0.29]
***r = 0.20[0.12, 0.27]
islamoPred_02_R
***r = 0.31[0.24, 0.38]
***r = 0.32[0.25, 0.39]
***r = 0.41[0.34, 0.47]
***r = 0.33[0.26, 0.4]
islamoPred_04_R
1 2 3 4 5
1 2 3 4 5
13
5
***r = 0.26[0.19, 0.33]
***r = 0.26[0.19, 0.33]
13
5
***r = 0.34[0.27, 0.4]
***r = 0.27[0.19, 0.34]
13
5
***r = 0.47[0.41, 0.53]
islamoPred_06_R
Table 36: Islamoprejudice: Scale Descriptives (Christchurch)
vars n mean sd min max range seIslamoprejudice 637 2.676 0.8674 1 5 4 0.0344
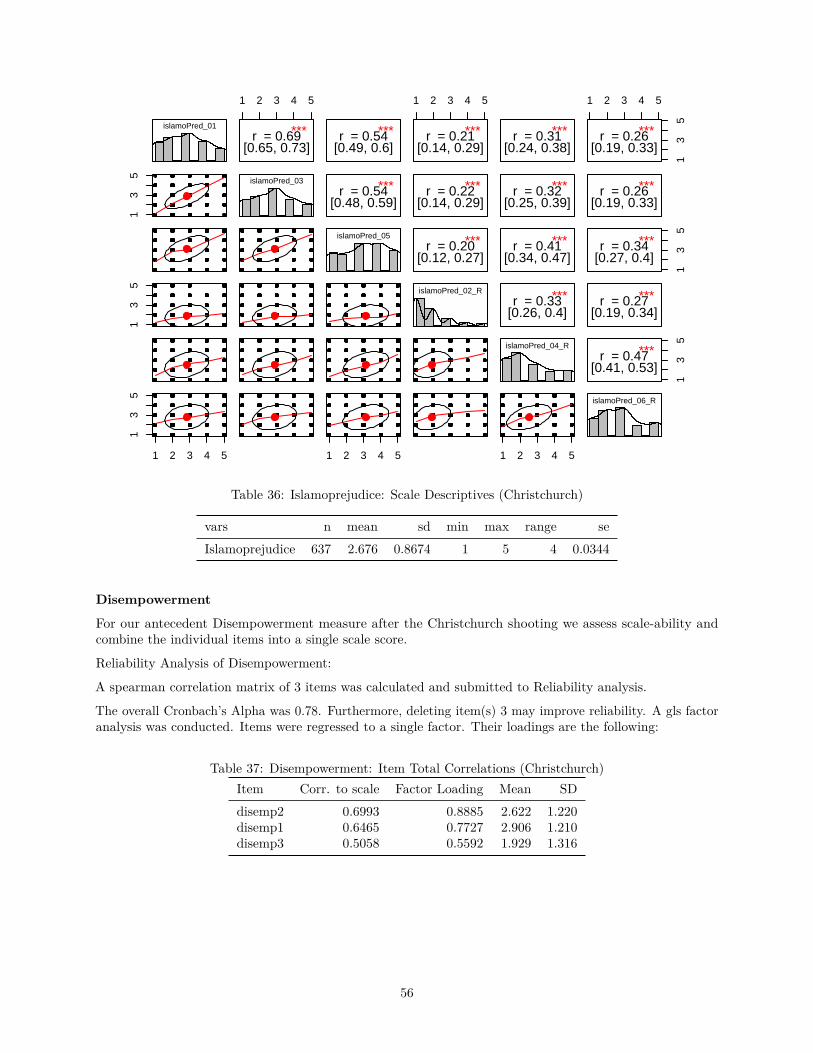
Disempowerment
For our antecedent Disempowerment measure after the Christchurch shooting we assess scale-ability andcombine the individual items into a single scale score.
Reliability Analysis of Disempowerment:
A spearman correlation matrix of 3 items was calculated and submitted to Reliability analysis.
The overall Cronbach’s Alpha was 0.78. Furthermore, deleting item(s) 3 may improve reliability. A gls factoranalysis was conducted. Items were regressed to a single factor. Their loadings are the following:
Table 37: Disempowerment: Item Total Correlations (Christchurch)Item Corr. to scale Factor Loading Mean SDdisemp2 0.6993 0.8885 2.622 1.220disemp1 0.6465 0.7727 2.906 1.210disemp3 0.5058 0.5592 1.929 1.316
56
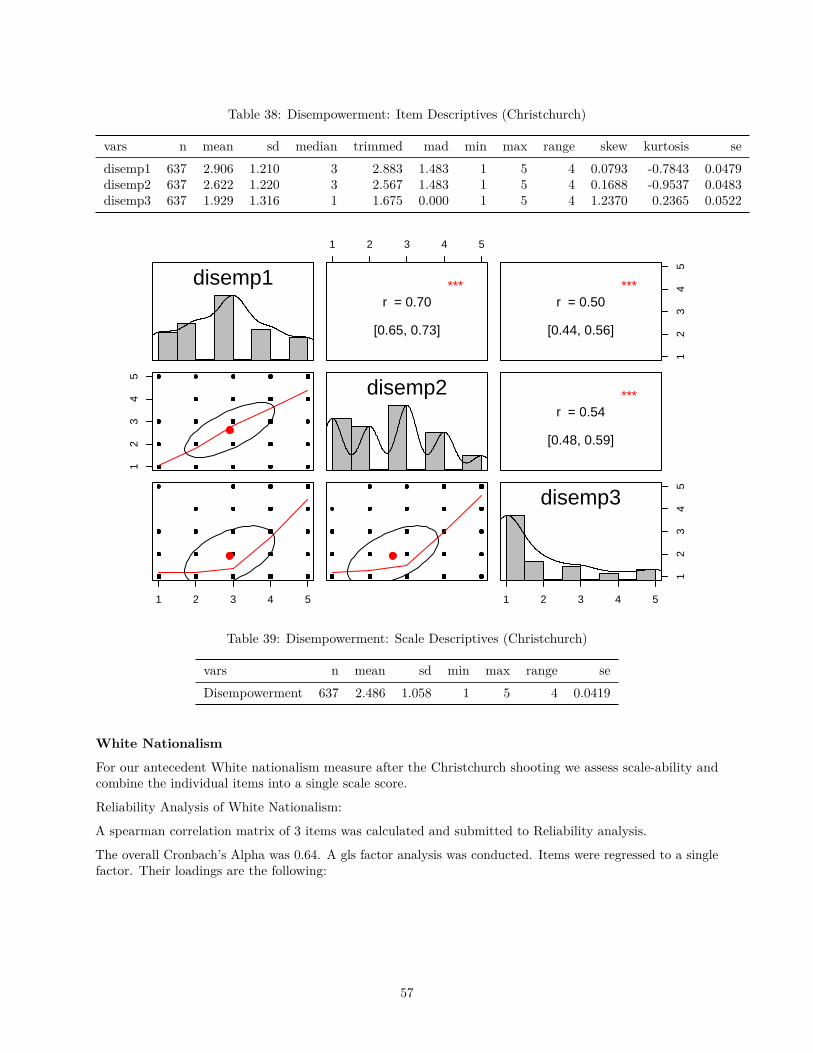
Table 38: Disempowerment: Item Descriptives (Christchurch)
vars n mean sd median trimmed mad min max range skew kurtosis sedisemp1 637 2.906 1.210 3 2.883 1.483 1 5 4 0.0793 -0.7843 0.0479disemp2 637 2.622 1.220 3 2.567 1.483 1 5 4 0.1688 -0.9537 0.0483disemp3 637 1.929 1.316 1 1.675 0.000 1 5 4 1.2370 0.2365 0.0522
disemp1
12
34
5
1 2 3 4 5
1 2 3 4 5
***r = 0.70
[0.65, 0.73]
disemp2
12
34
5
***r = 0.50
[0.44, 0.56]
***r = 0.54
[0.48, 0.59]
1 2 3 4 5
12
34
5
disemp3
Table 39: Disempowerment: Scale Descriptives (Christchurch)
vars n mean sd min max range seDisempowerment 637 2.486 1.058 1 5 4 0.0419
White Nationalism
For our antecedent White nationalism measure after the Christchurch shooting we assess scale-ability andcombine the individual items into a single scale score.
Reliability Analysis of White Nationalism:
A spearman correlation matrix of 3 items was calculated and submitted to Reliability analysis.
The overall Cronbach’s Alpha was 0.64. A gls factor analysis was conducted. Items were regressed to a singlefactor. Their loadings are the following:
57
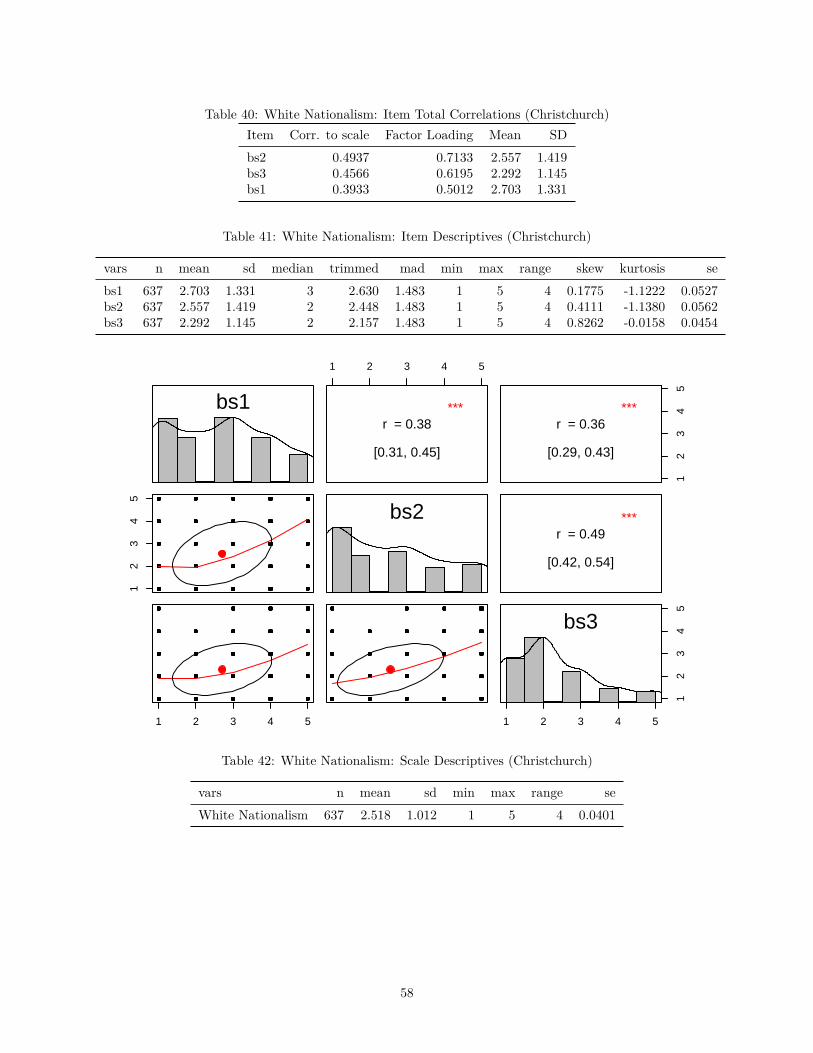
Table 40: White Nationalism: Item Total Correlations (Christchurch)Item Corr. to scale Factor Loading Mean SDbs2 0.4937 0.7133 2.557 1.419bs3 0.4566 0.6195 2.292 1.145bs1 0.3933 0.5012 2.703 1.331
Table 41: White Nationalism: Item Descriptives (Christchurch)
vars n mean sd median trimmed mad min max range skew kurtosis sebs1 637 2.703 1.331 3 2.630 1.483 1 5 4 0.1775 -1.1222 0.0527bs2 637 2.557 1.419 2 2.448 1.483 1 5 4 0.4111 -1.1380 0.0562bs3 637 2.292 1.145 2 2.157 1.483 1 5 4 0.8262 -0.0158 0.0454
bs1
12
34
5
1 2 3 4 5
1 2 3 4 5
***r = 0.38
[0.31, 0.45]
bs2
12
34
5
***r = 0.36
[0.29, 0.43]
***r = 0.49
[0.42, 0.54]
1 2 3 4 5
12
34
5
bs3
Table 42: White Nationalism: Scale Descriptives (Christchurch)
vars n mean sd min max range seWhite Nationalism 637 2.518 1.012 1 5 4 0.0401
58
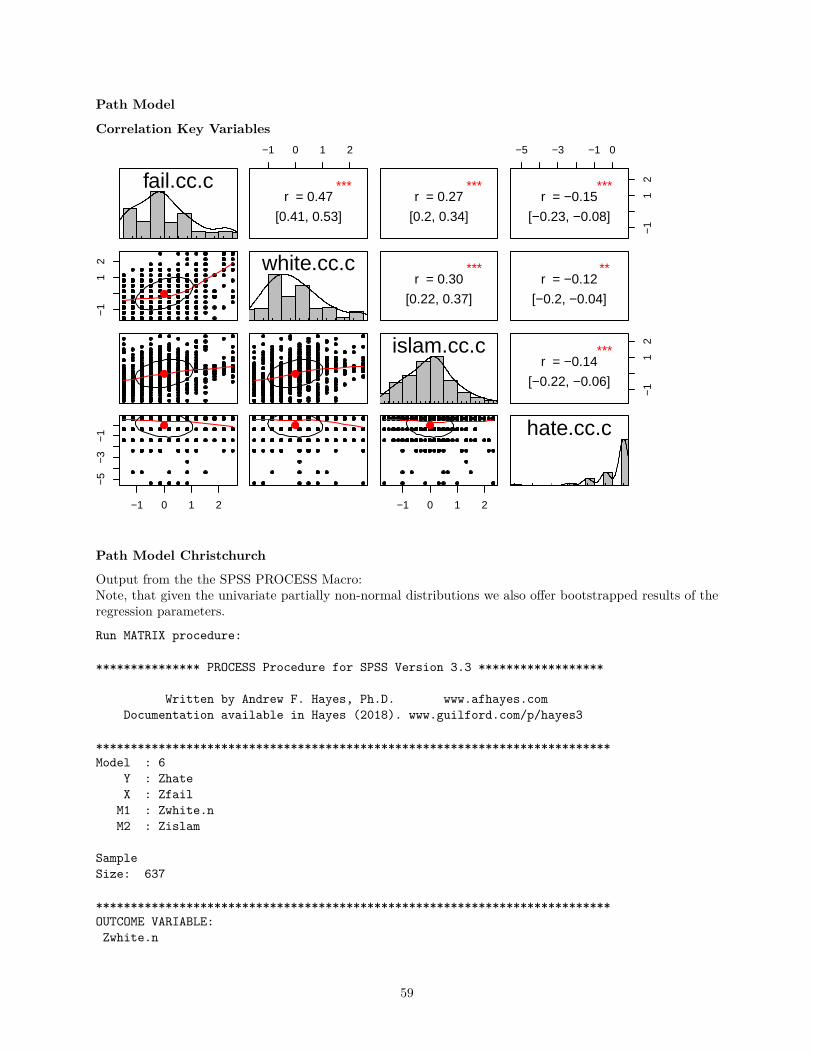
Path Model
Correlation Key Variables
fail.cc.c
−1
12
−1 0 1 2
−5
−3
−1
−1 0 1 2
***r = 0.47
[0.41, 0.53]
white.cc.c
***r = 0.27
[0.2, 0.34]
***r = 0.30
[0.22, 0.37]
islam.cc.c
−1 0 1 2
−5 −3 −1 0
−1
12
***r = −0.15
[−0.23, −0.08]
**r = −0.12
[−0.2, −0.04]
−1
12
***r = −0.14
[−0.22, −0.06]
hate.cc.c
Path Model Christchurch
Output from the the SPSS PROCESS Macro:Note, that given the univariate partially non-normal distributions we also offer bootstrapped results of theregression parameters.
Run MATRIX procedure:
*************** PROCESS Procedure for SPSS Version 3.3 ******************
Written by Andrew F. Hayes, Ph.D. www.afhayes.comDocumentation available in Hayes (2018). www.guilford.com/p/hayes3
**************************************************************************Model : 6
Y : ZhateX : Zfail
M1 : Zwhite.nM2 : Zislam
SampleSize: 637
**************************************************************************OUTCOME VARIABLE:Zwhite.n
59
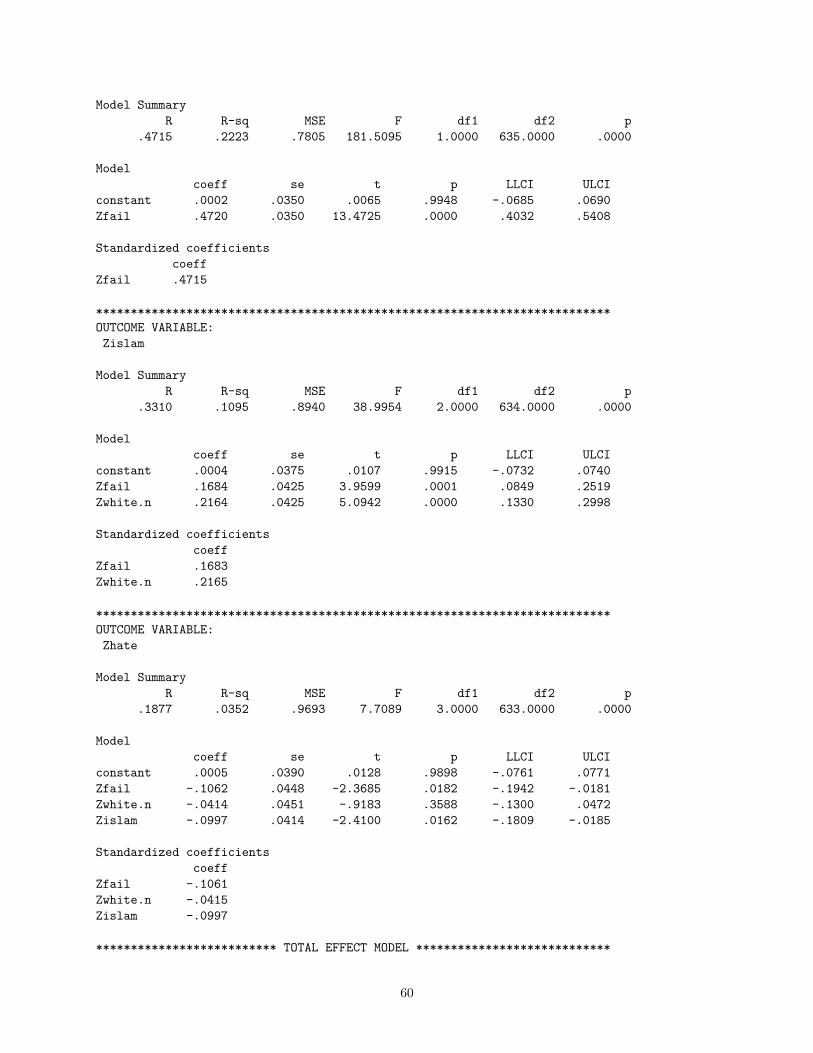
Model SummaryR R-sq MSE F df1 df2 p
.4715 .2223 .7805 181.5095 1.0000 635.0000 .0000
Modelcoeff se t p LLCI ULCI
constant .0002 .0350 .0065 .9948 -.0685 .0690Zfail .4720 .0350 13.4725 .0000 .4032 .5408
Standardized coefficientscoeff
Zfail .4715
**************************************************************************OUTCOME VARIABLE:Zislam
Model SummaryR R-sq MSE F df1 df2 p
.3310 .1095 .8940 38.9954 2.0000 634.0000 .0000
Modelcoeff se t p LLCI ULCI
constant .0004 .0375 .0107 .9915 -.0732 .0740Zfail .1684 .0425 3.9599 .0001 .0849 .2519Zwhite.n .2164 .0425 5.0942 .0000 .1330 .2998
Standardized coefficientscoeff
Zfail .1683Zwhite.n .2165
**************************************************************************OUTCOME VARIABLE:Zhate
Model SummaryR R-sq MSE F df1 df2 p
.1877 .0352 .9693 7.7089 3.0000 633.0000 .0000
Modelcoeff se t p LLCI ULCI
constant .0005 .0390 .0128 .9898 -.0761 .0771Zfail -.1062 .0448 -2.3685 .0182 -.1942 -.0181Zwhite.n -.0414 .0451 -.9183 .3588 -.1300 .0472Zislam -.0997 .0414 -2.4100 .0162 -.1809 -.0185
Standardized coefficientscoeff
Zfail -.1061Zwhite.n -.0415Zislam -.0997
************************** TOTAL EFFECT MODEL ****************************
60
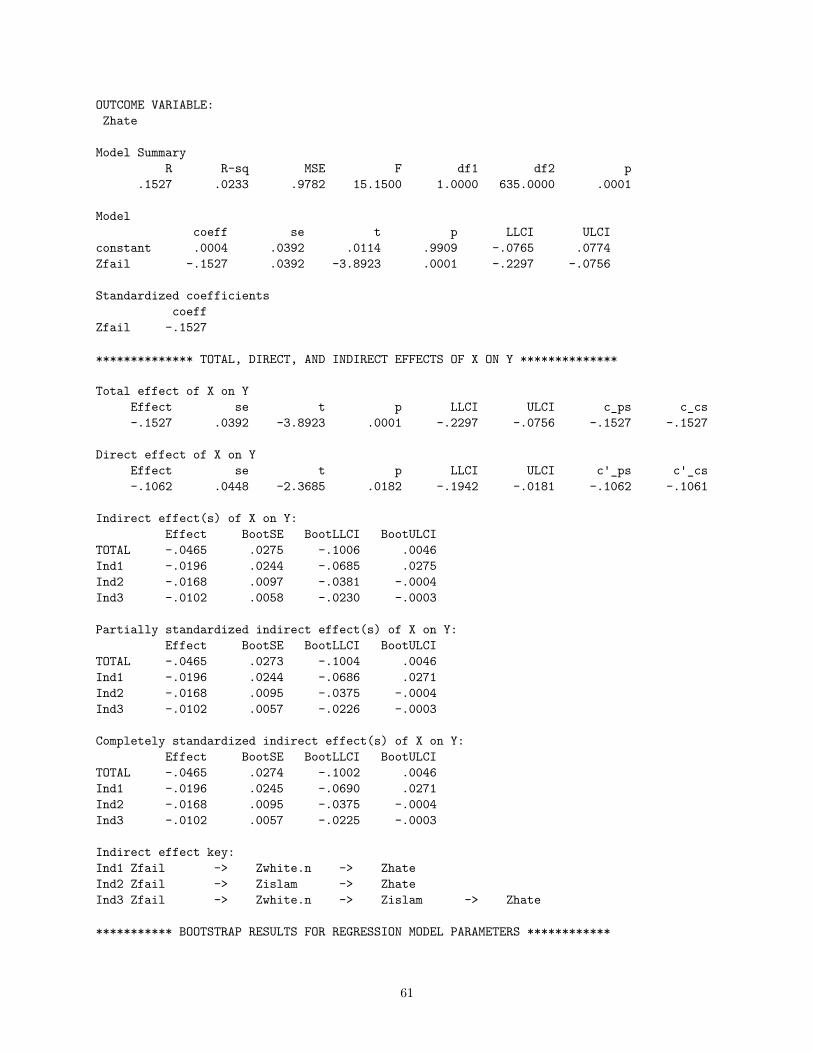
OUTCOME VARIABLE:Zhate
Model SummaryR R-sq MSE F df1 df2 p
.1527 .0233 .9782 15.1500 1.0000 635.0000 .0001
Modelcoeff se t p LLCI ULCI
constant .0004 .0392 .0114 .9909 -.0765 .0774Zfail -.1527 .0392 -3.8923 .0001 -.2297 -.0756
Standardized coefficientscoeff
Zfail -.1527
************** TOTAL, DIRECT, AND INDIRECT EFFECTS OF X ON Y **************
Total effect of X on YEffect se t p LLCI ULCI c_ps c_cs-.1527 .0392 -3.8923 .0001 -.2297 -.0756 -.1527 -.1527
Direct effect of X on YEffect se t p LLCI ULCI c'_ps c'_cs-.1062 .0448 -2.3685 .0182 -.1942 -.0181 -.1062 -.1061
Indirect effect(s) of X on Y:Effect BootSE BootLLCI BootULCI
TOTAL -.0465 .0275 -.1006 .0046Ind1 -.0196 .0244 -.0685 .0275Ind2 -.0168 .0097 -.0381 -.0004Ind3 -.0102 .0058 -.0230 -.0003
Partially standardized indirect effect(s) of X on Y:Effect BootSE BootLLCI BootULCI
TOTAL -.0465 .0273 -.1004 .0046Ind1 -.0196 .0244 -.0686 .0271Ind2 -.0168 .0095 -.0375 -.0004Ind3 -.0102 .0057 -.0226 -.0003
Completely standardized indirect effect(s) of X on Y:Effect BootSE BootLLCI BootULCI
TOTAL -.0465 .0274 -.1002 .0046Ind1 -.0196 .0245 -.0690 .0271Ind2 -.0168 .0095 -.0375 -.0004Ind3 -.0102 .0057 -.0225 -.0003
Indirect effect key:Ind1 Zfail -> Zwhite.n -> ZhateInd2 Zfail -> Zislam -> ZhateInd3 Zfail -> Zwhite.n -> Zislam -> Zhate
*********** BOOTSTRAP RESULTS FOR REGRESSION MODEL PARAMETERS ************
61
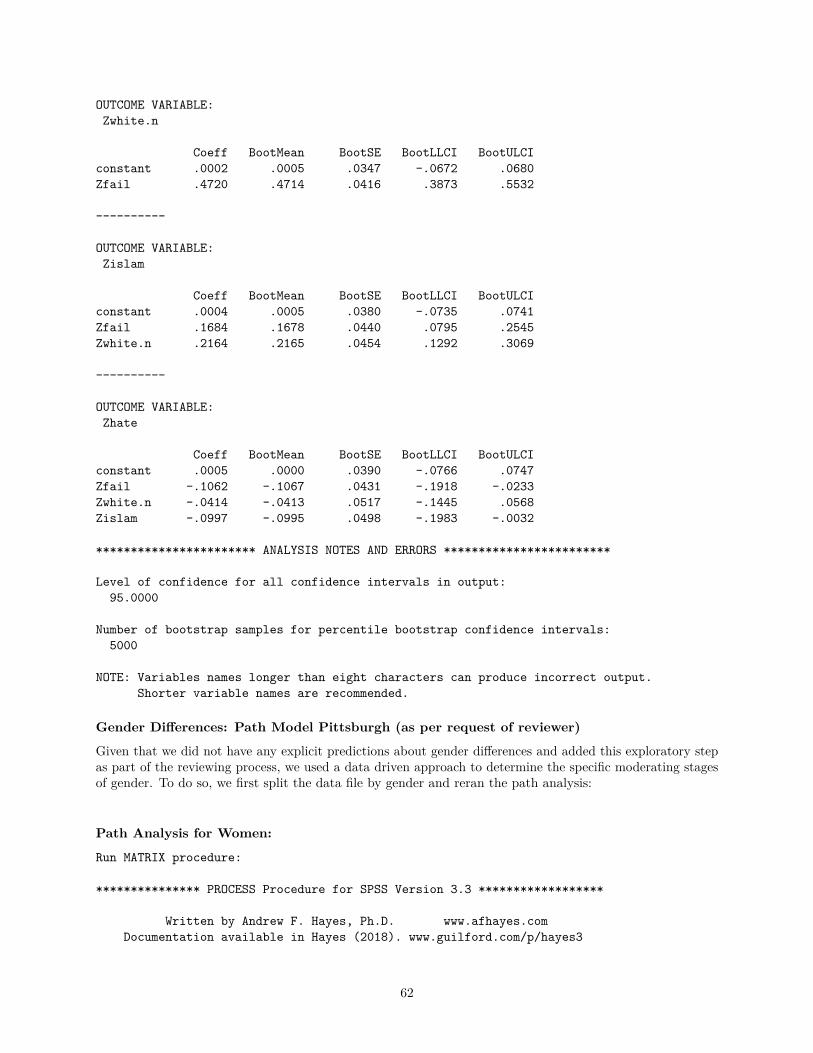
OUTCOME VARIABLE:Zwhite.n
Coeff BootMean BootSE BootLLCI BootULCIconstant .0002 .0005 .0347 -.0672 .0680Zfail .4720 .4714 .0416 .3873 .5532
----------
OUTCOME VARIABLE:Zislam
Coeff BootMean BootSE BootLLCI BootULCIconstant .0004 .0005 .0380 -.0735 .0741Zfail .1684 .1678 .0440 .0795 .2545Zwhite.n .2164 .2165 .0454 .1292 .3069
----------
OUTCOME VARIABLE:Zhate
Coeff BootMean BootSE BootLLCI BootULCIconstant .0005 .0000 .0390 -.0766 .0747Zfail -.1062 -.1067 .0431 -.1918 -.0233Zwhite.n -.0414 -.0413 .0517 -.1445 .0568Zislam -.0997 -.0995 .0498 -.1983 -.0032
*********************** ANALYSIS NOTES AND ERRORS ************************
Level of confidence for all confidence intervals in output:95.0000
Number of bootstrap samples for percentile bootstrap confidence intervals:5000
NOTE: Variables names longer than eight characters can produce incorrect output.Shorter variable names are recommended.
Gender Differences: Path Model Pittsburgh (as per request of reviewer)
Given that we did not have any explicit predictions about gender differences and added this exploratory stepas part of the reviewing process, we used a data driven approach to determine the specific moderating stagesof gender. To do so, we first split the data file by gender and reran the path analysis:
Path Analysis for Women:
Run MATRIX procedure:
*************** PROCESS Procedure for SPSS Version 3.3 ******************
Written by Andrew F. Hayes, Ph.D. www.afhayes.comDocumentation available in Hayes (2018). www.guilford.com/p/hayes3
62
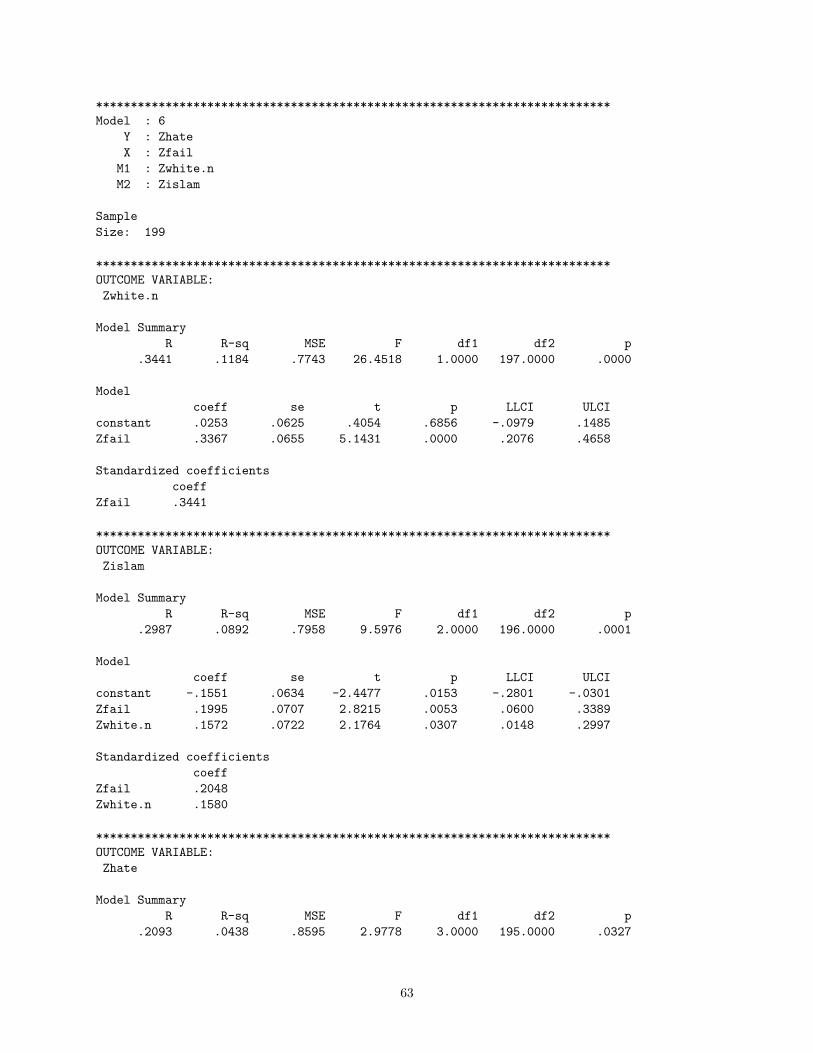
**************************************************************************Model : 6
Y : ZhateX : Zfail
M1 : Zwhite.nM2 : Zislam
SampleSize: 199
**************************************************************************OUTCOME VARIABLE:Zwhite.n
Model SummaryR R-sq MSE F df1 df2 p
.3441 .1184 .7743 26.4518 1.0000 197.0000 .0000
Modelcoeff se t p LLCI ULCI
constant .0253 .0625 .4054 .6856 -.0979 .1485Zfail .3367 .0655 5.1431 .0000 .2076 .4658
Standardized coefficientscoeff
Zfail .3441
**************************************************************************OUTCOME VARIABLE:Zislam
Model SummaryR R-sq MSE F df1 df2 p
.2987 .0892 .7958 9.5976 2.0000 196.0000 .0001
Modelcoeff se t p LLCI ULCI
constant -.1551 .0634 -2.4477 .0153 -.2801 -.0301Zfail .1995 .0707 2.8215 .0053 .0600 .3389Zwhite.n .1572 .0722 2.1764 .0307 .0148 .2997
Standardized coefficientscoeff
Zfail .2048Zwhite.n .1580
**************************************************************************OUTCOME VARIABLE:Zhate
Model SummaryR R-sq MSE F df1 df2 p
.2093 .0438 .8595 2.9778 3.0000 195.0000 .0327
63
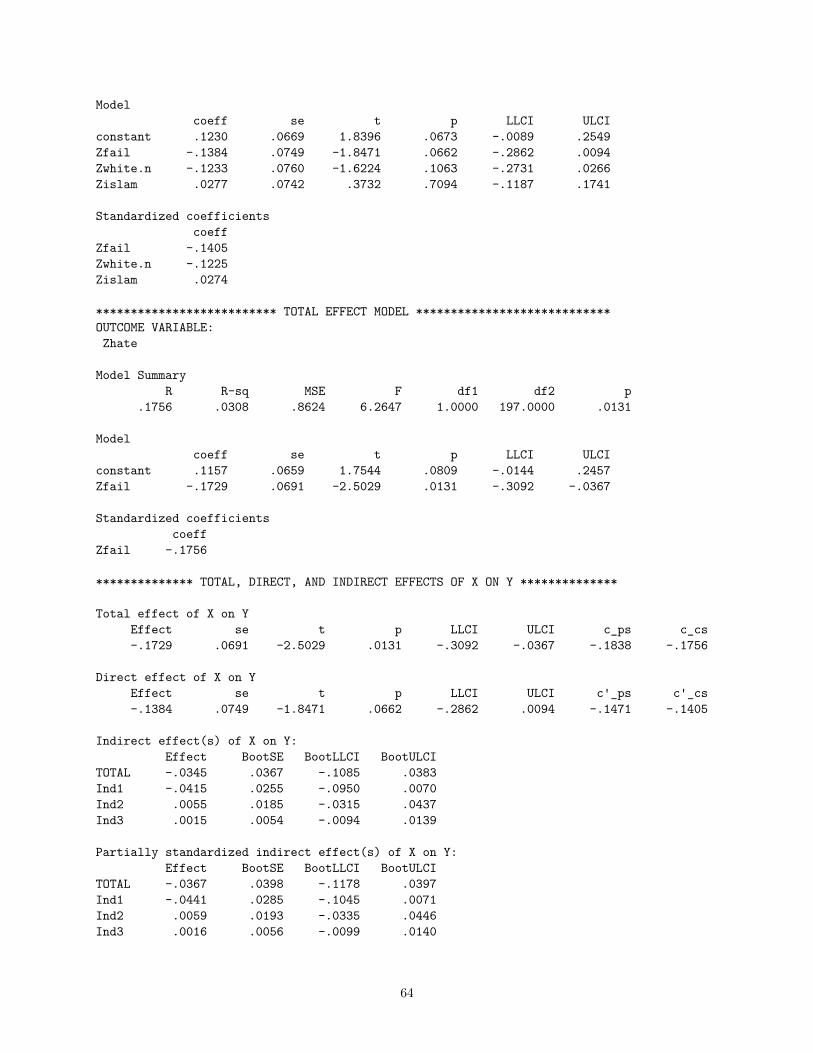
Modelcoeff se t p LLCI ULCI
constant .1230 .0669 1.8396 .0673 -.0089 .2549Zfail -.1384 .0749 -1.8471 .0662 -.2862 .0094Zwhite.n -.1233 .0760 -1.6224 .1063 -.2731 .0266Zislam .0277 .0742 .3732 .7094 -.1187 .1741
Standardized coefficientscoeff
Zfail -.1405Zwhite.n -.1225Zislam .0274
************************** TOTAL EFFECT MODEL ****************************OUTCOME VARIABLE:Zhate
Model SummaryR R-sq MSE F df1 df2 p
.1756 .0308 .8624 6.2647 1.0000 197.0000 .0131
Modelcoeff se t p LLCI ULCI
constant .1157 .0659 1.7544 .0809 -.0144 .2457Zfail -.1729 .0691 -2.5029 .0131 -.3092 -.0367
Standardized coefficientscoeff
Zfail -.1756
************** TOTAL, DIRECT, AND INDIRECT EFFECTS OF X ON Y **************
Total effect of X on YEffect se t p LLCI ULCI c_ps c_cs-.1729 .0691 -2.5029 .0131 -.3092 -.0367 -.1838 -.1756
Direct effect of X on YEffect se t p LLCI ULCI c'_ps c'_cs-.1384 .0749 -1.8471 .0662 -.2862 .0094 -.1471 -.1405
Indirect effect(s) of X on Y:Effect BootSE BootLLCI BootULCI
TOTAL -.0345 .0367 -.1085 .0383Ind1 -.0415 .0255 -.0950 .0070Ind2 .0055 .0185 -.0315 .0437Ind3 .0015 .0054 -.0094 .0139
Partially standardized indirect effect(s) of X on Y:Effect BootSE BootLLCI BootULCI
TOTAL -.0367 .0398 -.1178 .0397Ind1 -.0441 .0285 -.1045 .0071Ind2 .0059 .0193 -.0335 .0446Ind3 .0016 .0056 -.0099 .0140
64
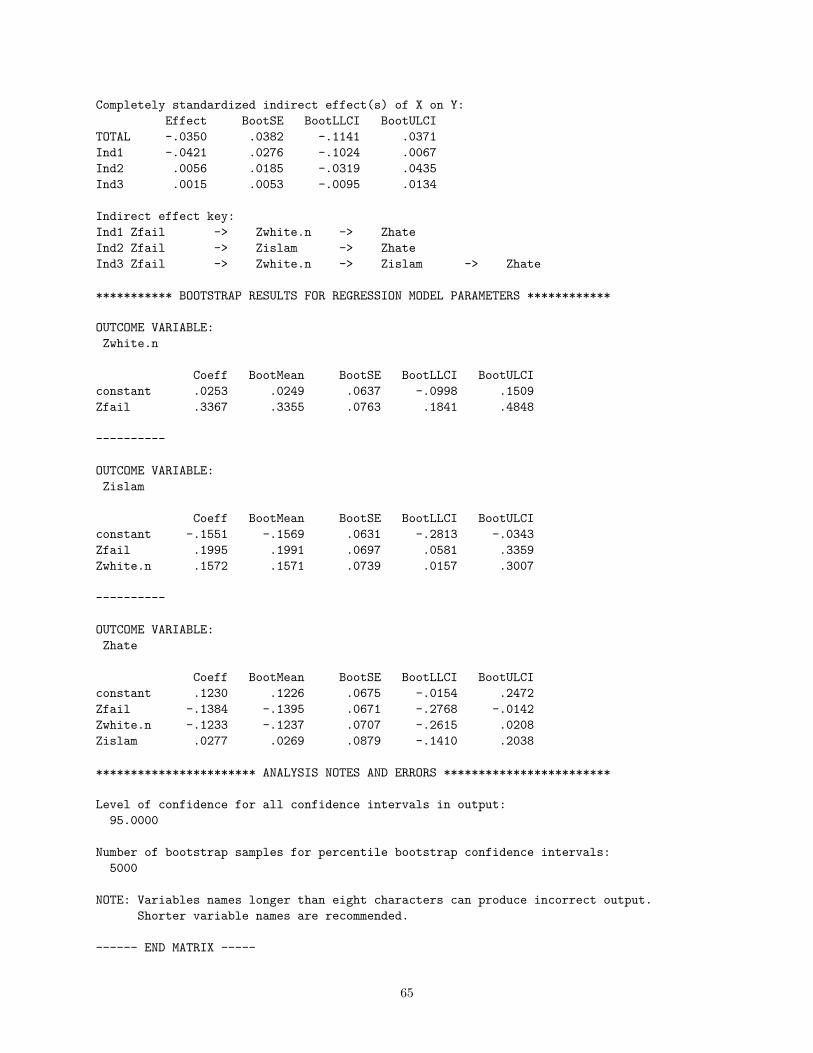
Completely standardized indirect effect(s) of X on Y:Effect BootSE BootLLCI BootULCI
TOTAL -.0350 .0382 -.1141 .0371Ind1 -.0421 .0276 -.1024 .0067Ind2 .0056 .0185 -.0319 .0435Ind3 .0015 .0053 -.0095 .0134
Indirect effect key:Ind1 Zfail -> Zwhite.n -> ZhateInd2 Zfail -> Zislam -> ZhateInd3 Zfail -> Zwhite.n -> Zislam -> Zhate
*********** BOOTSTRAP RESULTS FOR REGRESSION MODEL PARAMETERS ************
OUTCOME VARIABLE:Zwhite.n
Coeff BootMean BootSE BootLLCI BootULCIconstant .0253 .0249 .0637 -.0998 .1509Zfail .3367 .3355 .0763 .1841 .4848
----------
OUTCOME VARIABLE:Zislam
Coeff BootMean BootSE BootLLCI BootULCIconstant -.1551 -.1569 .0631 -.2813 -.0343Zfail .1995 .1991 .0697 .0581 .3359Zwhite.n .1572 .1571 .0739 .0157 .3007
----------
OUTCOME VARIABLE:Zhate
Coeff BootMean BootSE BootLLCI BootULCIconstant .1230 .1226 .0675 -.0154 .2472Zfail -.1384 -.1395 .0671 -.2768 -.0142Zwhite.n -.1233 -.1237 .0707 -.2615 .0208Zislam .0277 .0269 .0879 -.1410 .2038
*********************** ANALYSIS NOTES AND ERRORS ************************
Level of confidence for all confidence intervals in output:95.0000
Number of bootstrap samples for percentile bootstrap confidence intervals:5000
NOTE: Variables names longer than eight characters can produce incorrect output.Shorter variable names are recommended.
------ END MATRIX -----
65
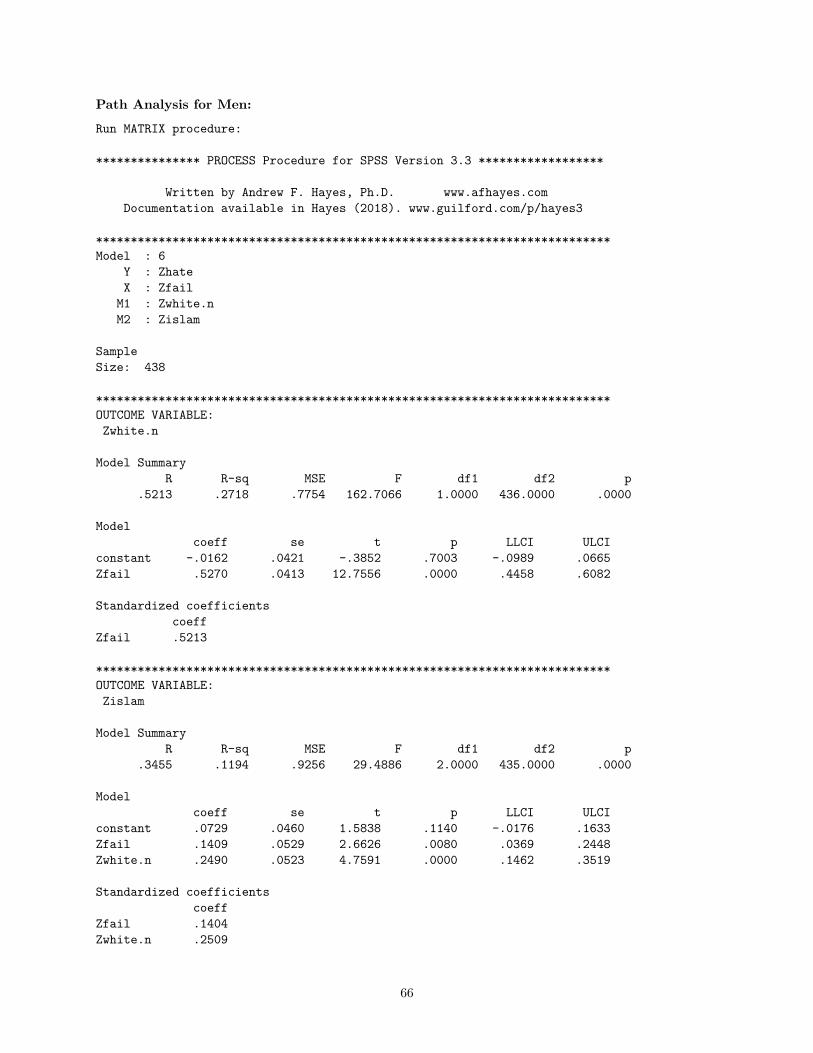
Path Analysis for Men:
Run MATRIX procedure:
*************** PROCESS Procedure for SPSS Version 3.3 ******************
Written by Andrew F. Hayes, Ph.D. www.afhayes.comDocumentation available in Hayes (2018). www.guilford.com/p/hayes3
**************************************************************************Model : 6
Y : ZhateX : Zfail
M1 : Zwhite.nM2 : Zislam
SampleSize: 438
**************************************************************************OUTCOME VARIABLE:Zwhite.n
Model SummaryR R-sq MSE F df1 df2 p
.5213 .2718 .7754 162.7066 1.0000 436.0000 .0000
Modelcoeff se t p LLCI ULCI
constant -.0162 .0421 -.3852 .7003 -.0989 .0665Zfail .5270 .0413 12.7556 .0000 .4458 .6082
Standardized coefficientscoeff
Zfail .5213
**************************************************************************OUTCOME VARIABLE:Zislam
Model SummaryR R-sq MSE F df1 df2 p
.3455 .1194 .9256 29.4886 2.0000 435.0000 .0000
Modelcoeff se t p LLCI ULCI
constant .0729 .0460 1.5838 .1140 -.0176 .1633Zfail .1409 .0529 2.6626 .0080 .0369 .2448Zwhite.n .2490 .0523 4.7591 .0000 .1462 .3519
Standardized coefficientscoeff
Zfail .1404Zwhite.n .2509
66
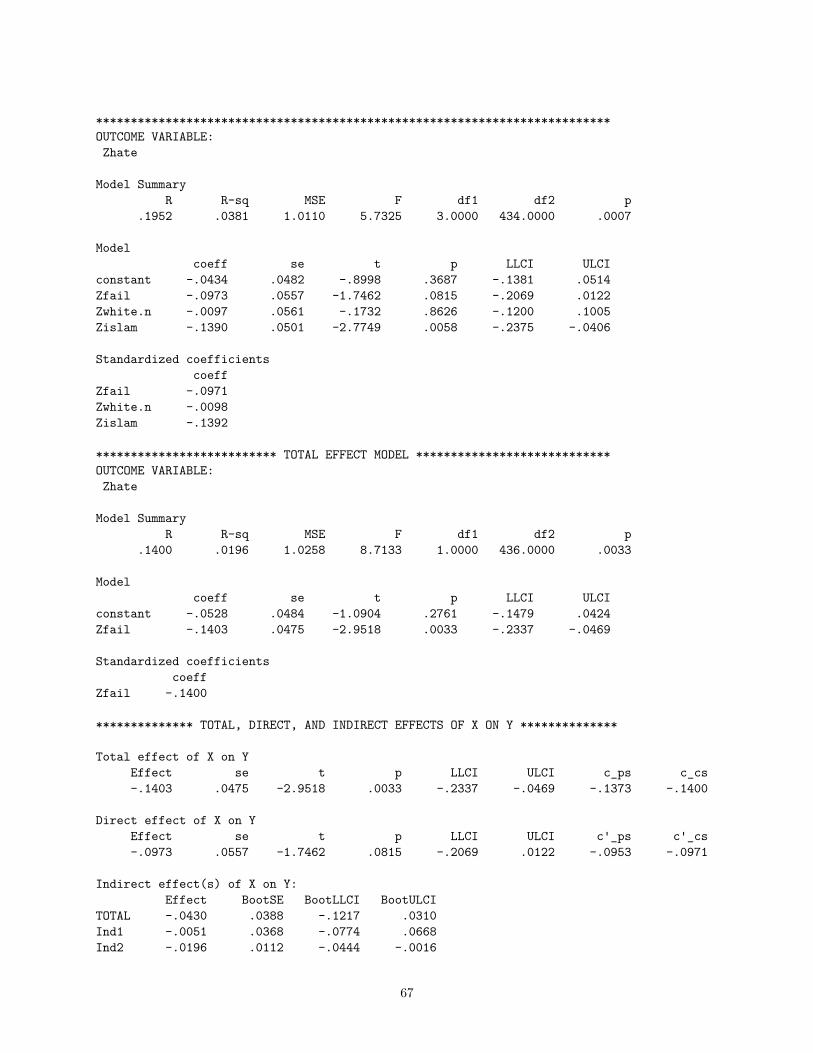
**************************************************************************OUTCOME VARIABLE:Zhate
Model SummaryR R-sq MSE F df1 df2 p
.1952 .0381 1.0110 5.7325 3.0000 434.0000 .0007
Modelcoeff se t p LLCI ULCI
constant -.0434 .0482 -.8998 .3687 -.1381 .0514Zfail -.0973 .0557 -1.7462 .0815 -.2069 .0122Zwhite.n -.0097 .0561 -.1732 .8626 -.1200 .1005Zislam -.1390 .0501 -2.7749 .0058 -.2375 -.0406
Standardized coefficientscoeff
Zfail -.0971Zwhite.n -.0098Zislam -.1392
************************** TOTAL EFFECT MODEL ****************************OUTCOME VARIABLE:Zhate
Model SummaryR R-sq MSE F df1 df2 p
.1400 .0196 1.0258 8.7133 1.0000 436.0000 .0033
Modelcoeff se t p LLCI ULCI
constant -.0528 .0484 -1.0904 .2761 -.1479 .0424Zfail -.1403 .0475 -2.9518 .0033 -.2337 -.0469
Standardized coefficientscoeff
Zfail -.1400
************** TOTAL, DIRECT, AND INDIRECT EFFECTS OF X ON Y **************
Total effect of X on YEffect se t p LLCI ULCI c_ps c_cs-.1403 .0475 -2.9518 .0033 -.2337 -.0469 -.1373 -.1400
Direct effect of X on YEffect se t p LLCI ULCI c'_ps c'_cs-.0973 .0557 -1.7462 .0815 -.2069 .0122 -.0953 -.0971
Indirect effect(s) of X on Y:Effect BootSE BootLLCI BootULCI
TOTAL -.0430 .0388 -.1217 .0310Ind1 -.0051 .0368 -.0774 .0668Ind2 -.0196 .0112 -.0444 -.0016
67

Ind3 -.0182 .0093 -.0392 -.0028
Partially standardized indirect effect(s) of X on Y:Effect BootSE BootLLCI BootULCI
TOTAL -.0420 .0374 -.1151 .0312Ind1 -.0050 .0359 -.0745 .0650Ind2 -.0192 .0107 -.0423 -.0016Ind3 -.0179 .0088 -.0372 -.0028
Completely standardized indirect effect(s) of X on Y:Effect BootSE BootLLCI BootULCI
TOTAL -.0429 .0381 -.1182 .0318Ind1 -.0051 .0366 -.0764 .0667Ind2 -.0195 .0108 -.0432 -.0017Ind3 -.0182 .0089 -.0378 -.0029
Indirect effect key:Ind1 Zfail -> Zwhite.n -> ZhateInd2 Zfail -> Zislam -> ZhateInd3 Zfail -> Zwhite.n -> Zislam -> Zhate
*********** BOOTSTRAP RESULTS FOR REGRESSION MODEL PARAMETERS ************
OUTCOME VARIABLE:Zwhite.n
Coeff BootMean BootSE BootLLCI BootULCIconstant -.0162 -.0172 .0413 -.0987 .0610Zfail .5270 .5257 .0459 .4355 .6137
----------
OUTCOME VARIABLE:Zislam
Coeff BootMean BootSE BootLLCI BootULCIconstant .0729 .0735 .0455 -.0153 .1630Zfail .1409 .1410 .0543 .0345 .2489Zwhite.n .2490 .2499 .0573 .1375 .3634
----------
OUTCOME VARIABLE:Zhate
Coeff BootMean BootSE BootLLCI BootULCIconstant -.0434 -.0431 .0467 -.1379 .0437Zfail -.0973 -.0980 .0569 -.2074 .0176Zwhite.n -.0097 -.0089 .0695 -.1482 .1257Zislam -.1390 -.1387 .0585 -.2563 -.0249
*********************** ANALYSIS NOTES AND ERRORS ************************
Level of confidence for all confidence intervals in output:
68
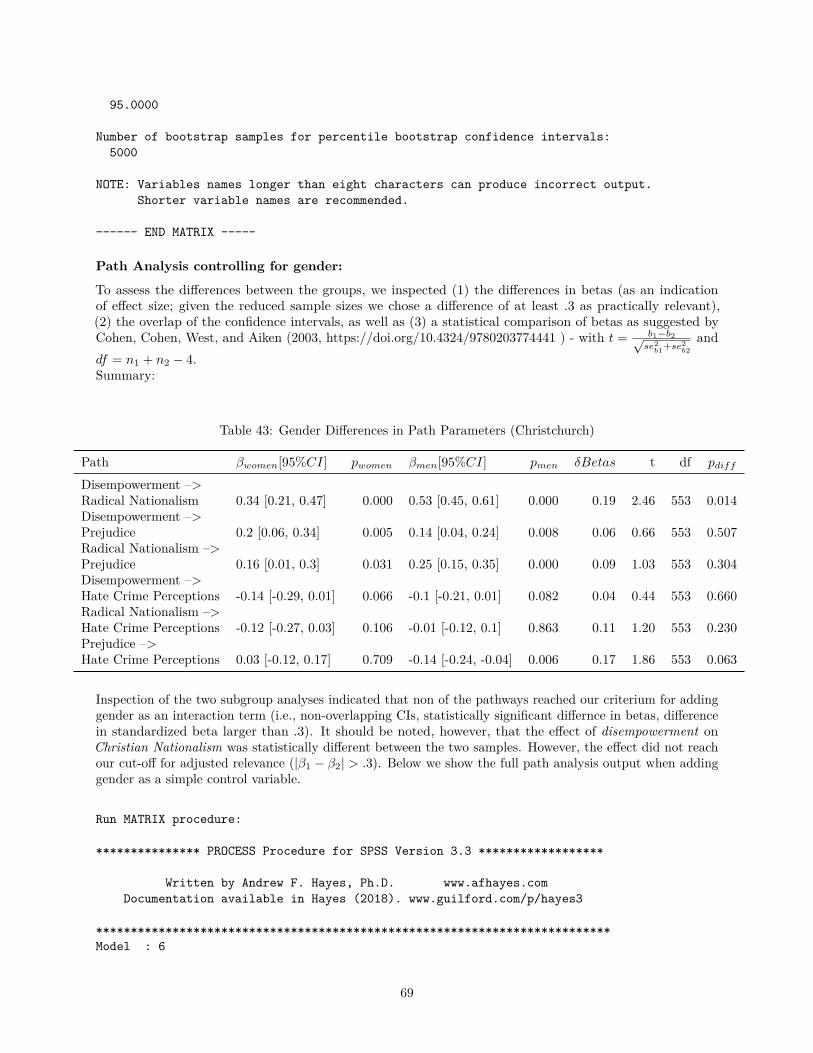
95.0000
Number of bootstrap samples for percentile bootstrap confidence intervals:5000
NOTE: Variables names longer than eight characters can produce incorrect output.Shorter variable names are recommended.
------ END MATRIX -----
Path Analysis controlling for gender:
To assess the differences between the groups, we inspected (1) the differences in betas (as an indicationof effect size; given the reduced sample sizes we chose a difference of at least .3 as practically relevant),(2) the overlap of the confidence intervals, as well as (3) a statistical comparison of betas as suggested byCohen, Cohen, West, and Aiken (2003, https://doi.org/10.4324/9780203774441 ) - with t = b1−b2√
se2b1+se2
b2and
df = n1 + n2 − 4.Summary:
Table 43: Gender Differences in Path Parameters (Christchurch)
Path βwomen[95%CI] pwomen βmen[95%CI] pmen δBetas t df pdiff
Disempowerment –>Radical Nationalism 0.34 [0.21, 0.47] 0.000 0.53 [0.45, 0.61] 0.000 0.19 2.46 553 0.014Disempowerment –>Prejudice 0.2 [0.06, 0.34] 0.005 0.14 [0.04, 0.24] 0.008 0.06 0.66 553 0.507Radical Nationalism –>Prejudice 0.16 [0.01, 0.3] 0.031 0.25 [0.15, 0.35] 0.000 0.09 1.03 553 0.304Disempowerment –>Hate Crime Perceptions -0.14 [-0.29, 0.01] 0.066 -0.1 [-0.21, 0.01] 0.082 0.04 0.44 553 0.660Radical Nationalism –>Hate Crime Perceptions -0.12 [-0.27, 0.03] 0.106 -0.01 [-0.12, 0.1] 0.863 0.11 1.20 553 0.230Prejudice –>Hate Crime Perceptions 0.03 [-0.12, 0.17] 0.709 -0.14 [-0.24, -0.04] 0.006 0.17 1.86 553 0.063
Inspection of the two subgroup analyses indicated that non of the pathways reached our criterium for addinggender as an interaction term (i.e., non-overlapping CIs, statistically significant differnce in betas, differencein standardized beta larger than .3). It should be noted, however, that the effect of disempowerment onChristian Nationalism was statistically different between the two samples. However, the effect did not reachour cut-off for adjusted relevance (|β1 − β2| > .3). Below we show the full path analysis output when addinggender as a simple control variable.
Run MATRIX procedure:
*************** PROCESS Procedure for SPSS Version 3.3 ******************
Written by Andrew F. Hayes, Ph.D. www.afhayes.comDocumentation available in Hayes (2018). www.guilford.com/p/hayes3
**************************************************************************Model : 6
69
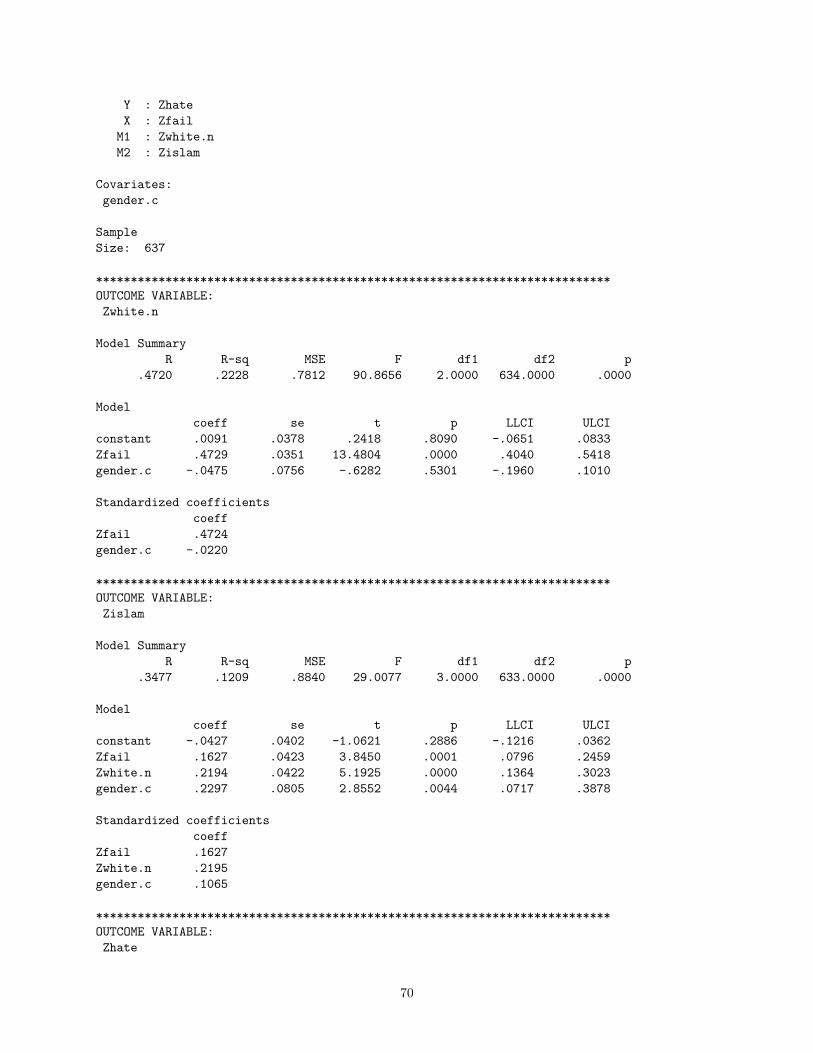
Y : ZhateX : Zfail
M1 : Zwhite.nM2 : Zislam
Covariates:gender.c
SampleSize: 637
**************************************************************************OUTCOME VARIABLE:Zwhite.n
Model SummaryR R-sq MSE F df1 df2 p
.4720 .2228 .7812 90.8656 2.0000 634.0000 .0000
Modelcoeff se t p LLCI ULCI
constant .0091 .0378 .2418 .8090 -.0651 .0833Zfail .4729 .0351 13.4804 .0000 .4040 .5418gender.c -.0475 .0756 -.6282 .5301 -.1960 .1010
Standardized coefficientscoeff
Zfail .4724gender.c -.0220
**************************************************************************OUTCOME VARIABLE:Zislam
Model SummaryR R-sq MSE F df1 df2 p
.3477 .1209 .8840 29.0077 3.0000 633.0000 .0000
Modelcoeff se t p LLCI ULCI
constant -.0427 .0402 -1.0621 .2886 -.1216 .0362Zfail .1627 .0423 3.8450 .0001 .0796 .2459Zwhite.n .2194 .0422 5.1925 .0000 .1364 .3023gender.c .2297 .0805 2.8552 .0044 .0717 .3878
Standardized coefficientscoeff
Zfail .1627Zwhite.n .2195gender.c .1065
**************************************************************************OUTCOME VARIABLE:Zhate
70
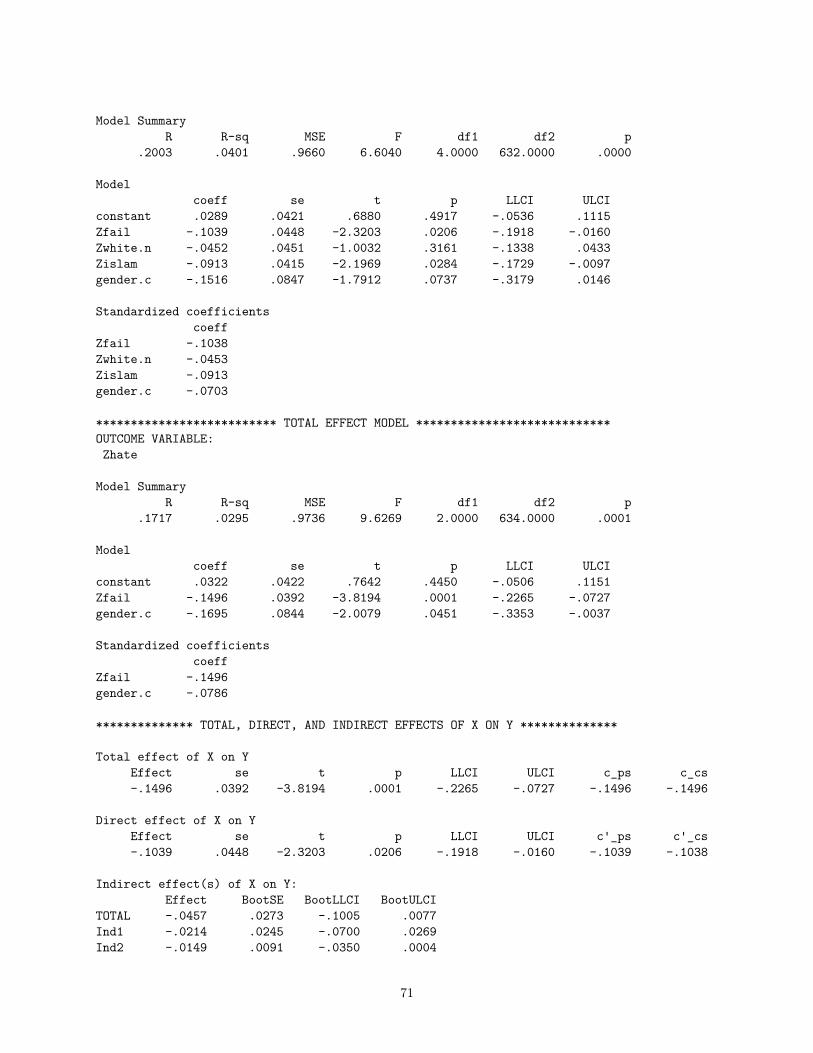
Model SummaryR R-sq MSE F df1 df2 p
.2003 .0401 .9660 6.6040 4.0000 632.0000 .0000
Modelcoeff se t p LLCI ULCI
constant .0289 .0421 .6880 .4917 -.0536 .1115Zfail -.1039 .0448 -2.3203 .0206 -.1918 -.0160Zwhite.n -.0452 .0451 -1.0032 .3161 -.1338 .0433Zislam -.0913 .0415 -2.1969 .0284 -.1729 -.0097gender.c -.1516 .0847 -1.7912 .0737 -.3179 .0146
Standardized coefficientscoeff
Zfail -.1038Zwhite.n -.0453Zislam -.0913gender.c -.0703
************************** TOTAL EFFECT MODEL ****************************OUTCOME VARIABLE:Zhate
Model SummaryR R-sq MSE F df1 df2 p
.1717 .0295 .9736 9.6269 2.0000 634.0000 .0001
Modelcoeff se t p LLCI ULCI
constant .0322 .0422 .7642 .4450 -.0506 .1151Zfail -.1496 .0392 -3.8194 .0001 -.2265 -.0727gender.c -.1695 .0844 -2.0079 .0451 -.3353 -.0037
Standardized coefficientscoeff
Zfail -.1496gender.c -.0786
************** TOTAL, DIRECT, AND INDIRECT EFFECTS OF X ON Y **************
Total effect of X on YEffect se t p LLCI ULCI c_ps c_cs-.1496 .0392 -3.8194 .0001 -.2265 -.0727 -.1496 -.1496
Direct effect of X on YEffect se t p LLCI ULCI c'_ps c'_cs-.1039 .0448 -2.3203 .0206 -.1918 -.0160 -.1039 -.1038
Indirect effect(s) of X on Y:Effect BootSE BootLLCI BootULCI
TOTAL -.0457 .0273 -.1005 .0077Ind1 -.0214 .0245 -.0700 .0269Ind2 -.0149 .0091 -.0350 .0004
71
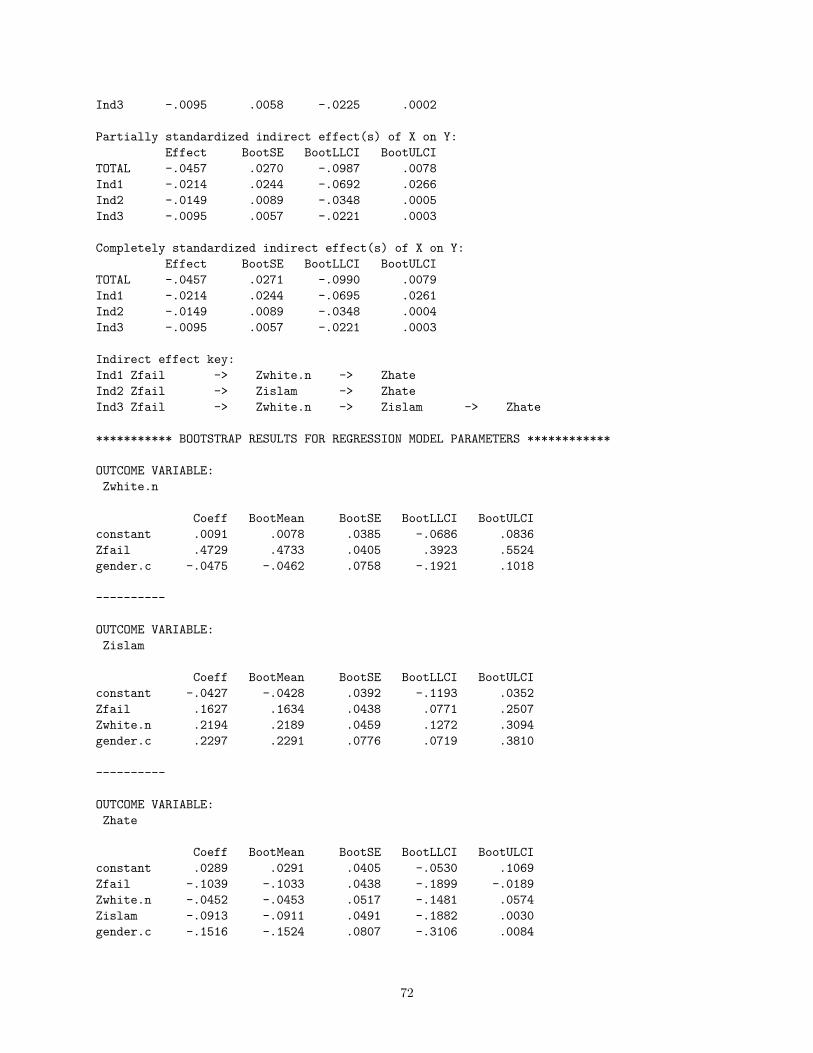
Ind3 -.0095 .0058 -.0225 .0002
Partially standardized indirect effect(s) of X on Y:Effect BootSE BootLLCI BootULCI
TOTAL -.0457 .0270 -.0987 .0078Ind1 -.0214 .0244 -.0692 .0266Ind2 -.0149 .0089 -.0348 .0005Ind3 -.0095 .0057 -.0221 .0003
Completely standardized indirect effect(s) of X on Y:Effect BootSE BootLLCI BootULCI
TOTAL -.0457 .0271 -.0990 .0079Ind1 -.0214 .0244 -.0695 .0261Ind2 -.0149 .0089 -.0348 .0004Ind3 -.0095 .0057 -.0221 .0003
Indirect effect key:Ind1 Zfail -> Zwhite.n -> ZhateInd2 Zfail -> Zislam -> ZhateInd3 Zfail -> Zwhite.n -> Zislam -> Zhate
*********** BOOTSTRAP RESULTS FOR REGRESSION MODEL PARAMETERS ************
OUTCOME VARIABLE:Zwhite.n
Coeff BootMean BootSE BootLLCI BootULCIconstant .0091 .0078 .0385 -.0686 .0836Zfail .4729 .4733 .0405 .3923 .5524gender.c -.0475 -.0462 .0758 -.1921 .1018
----------
OUTCOME VARIABLE:Zislam
Coeff BootMean BootSE BootLLCI BootULCIconstant -.0427 -.0428 .0392 -.1193 .0352Zfail .1627 .1634 .0438 .0771 .2507Zwhite.n .2194 .2189 .0459 .1272 .3094gender.c .2297 .2291 .0776 .0719 .3810
----------
OUTCOME VARIABLE:Zhate
Coeff BootMean BootSE BootLLCI BootULCIconstant .0289 .0291 .0405 -.0530 .1069Zfail -.1039 -.1033 .0438 -.1899 -.0189Zwhite.n -.0452 -.0453 .0517 -.1481 .0574Zislam -.0913 -.0911 .0491 -.1882 .0030gender.c -.1516 -.1524 .0807 -.3106 .0084
72
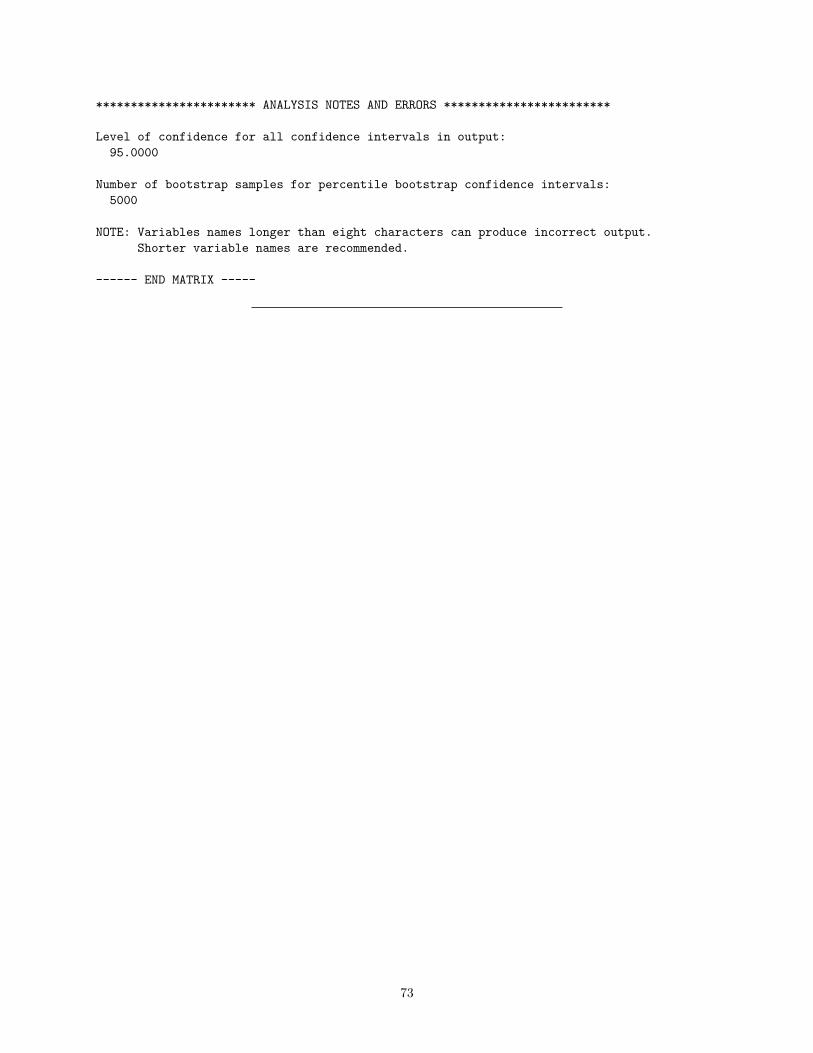
*********************** ANALYSIS NOTES AND ERRORS ************************
Level of confidence for all confidence intervals in output:95.0000
Number of bootstrap samples for percentile bootstrap confidence intervals:5000
NOTE: Variables names longer than eight characters can produce incorrect output.Shorter variable names are recommended.
------ END MATRIX -----
73
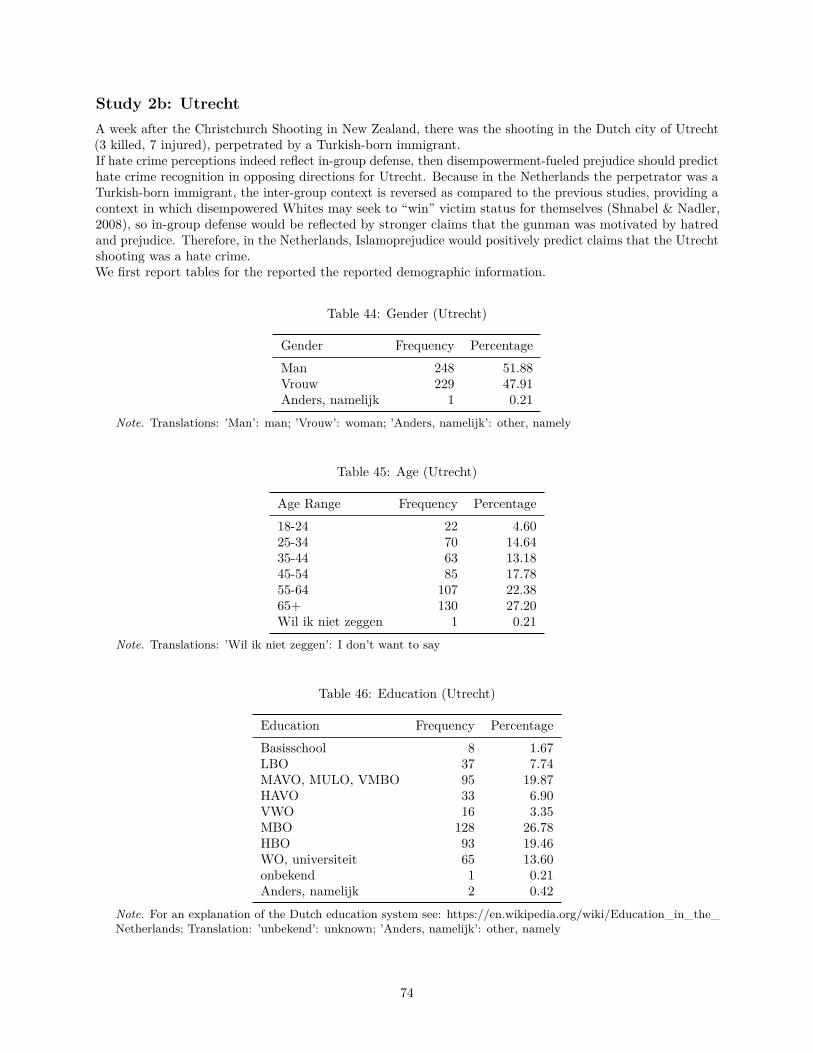
Study 2b: UtrechtA week after the Christchurch Shooting in New Zealand, there was the shooting in the Dutch city of Utrecht(3 killed, 7 injured), perpetrated by a Turkish-born immigrant.If hate crime perceptions indeed reflect in-group defense, then disempowerment-fueled prejudice should predicthate crime recognition in opposing directions for Utrecht. Because in the Netherlands the perpetrator was aTurkish-born immigrant, the inter-group context is reversed as compared to the previous studies, providing acontext in which disempowered Whites may seek to “win” victim status for themselves (Shnabel & Nadler,2008), so in-group defense would be reflected by stronger claims that the gunman was motivated by hatredand prejudice. Therefore, in the Netherlands, Islamoprejudice would positively predict claims that the Utrechtshooting was a hate crime.We first report tables for the reported the reported demographic information.
Table 44: Gender (Utrecht)
Gender Frequency PercentageMan 248 51.88Vrouw 229 47.91Anders, namelijk 1 0.21
Note. Translations: ’Man’: man; ’Vrouw’: woman; ’Anders, namelijk’: other, namely
Table 45: Age (Utrecht)
Age Range Frequency Percentage18-24 22 4.6025-34 70 14.6435-44 63 13.1845-54 85 17.7855-64 107 22.3865+ 130 27.20Wil ik niet zeggen 1 0.21
Note. Translations: ’Wil ik niet zeggen’: I don’t want to say
Table 46: Education (Utrecht)
Education Frequency PercentageBasisschool 8 1.67LBO 37 7.74MAVO, MULO, VMBO 95 19.87HAVO 33 6.90VWO 16 3.35MBO 128 26.78HBO 93 19.46WO, universiteit 65 13.60onbekend 1 0.21Anders, namelijk 2 0.42
Note. For an explanation of the Dutch education system see: https://en.wikipedia.org/wiki/Education_in_the_Netherlands; Translation: ’unbekend’: unknown; ’Anders, namelijk’: other, namely
74
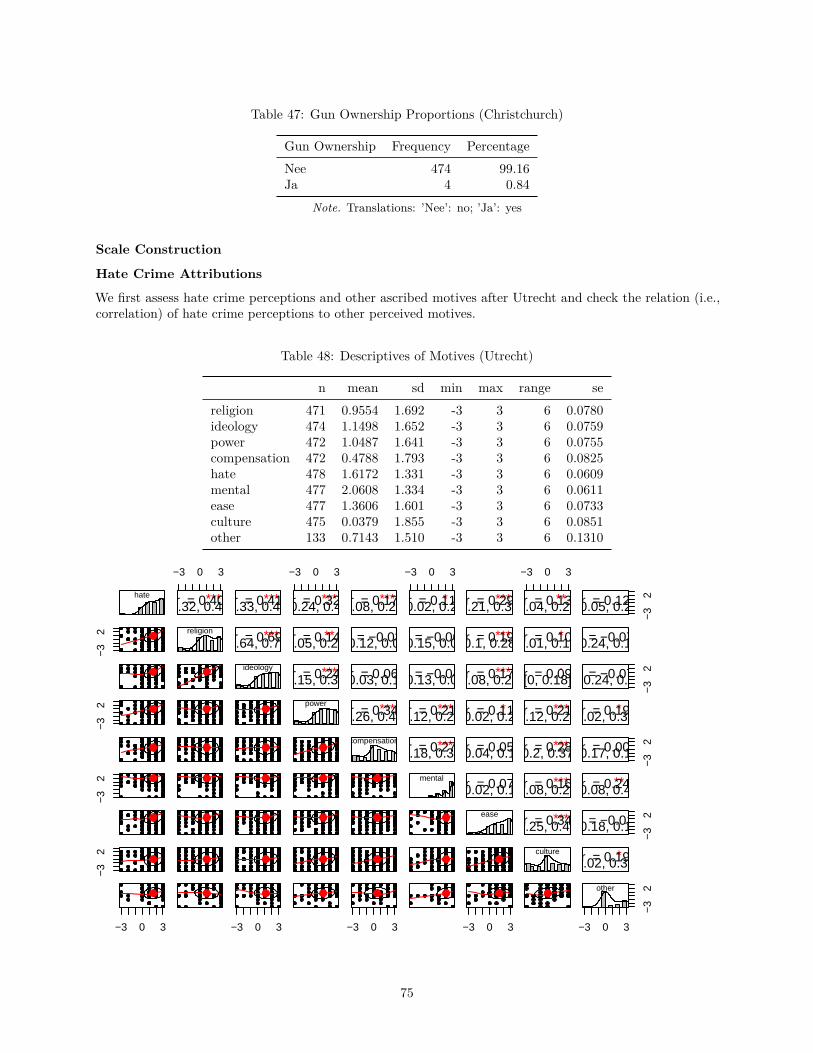
Table 47: Gun Ownership Proportions (Christchurch)
Gun Ownership Frequency PercentageNee 474 99.16Ja 4 0.84
Note. Translations: ’Nee’: no; ’Ja’: yes
Scale Construction
Hate Crime Attributions
We first assess hate crime perceptions and other ascribed motives after Utrecht and check the relation (i.e.,correlation) of hate crime perceptions to other perceived motives.
Table 48: Descriptives of Motives (Utrecht)
n mean sd min max range sereligion 471 0.9554 1.692 -3 3 6 0.0780ideology 474 1.1498 1.652 -3 3 6 0.0759power 472 1.0487 1.641 -3 3 6 0.0755compensation 472 0.4788 1.793 -3 3 6 0.0825hate 478 1.6172 1.331 -3 3 6 0.0609mental 477 2.0608 1.334 -3 3 6 0.0611ease 477 1.3606 1.601 -3 3 6 0.0733culture 475 0.0379 1.855 -3 3 6 0.0851other 133 0.7143 1.510 -3 3 6 0.1310
hate
−3
2−
32
−3
2−
32
−3 0 3
−3 0 3
***r = 0.40[0.32, 0.47]
religion
***r = 0.41[0.33, 0.48]
***r = 0.69[0.64, 0.73]
ideology
−3 0 3
−3 0 3
***r = 0.32[0.24, 0.4]
**r = 0.14[0.05, 0.22]
***r = 0.24[0.15, 0.32]
power
***r = 0.17[0.08, 0.25]
r = −0.03[−0.12, 0.06]
r = 0.06[−0.03, 0.15]
***r = 0.34[0.26, 0.42]
compensation
−3 0 3
−3 0 3
*r = 0.11[0.02, 0.2]
r = −0.06[−0.15, 0.03]
r = −0.04[−0.13, 0.05]
***r = 0.21[0.12, 0.29]
***r = 0.27[0.18, 0.35]
mental
***r = 0.29[0.21, 0.37]
***r = 0.19[0.1, 0.28]
***r = 0.17[0.08, 0.26]
*r = 0.11[0.02, 0.2]
r = 0.05[−0.04, 0.14]
r = 0.07[−0.02, 0.16]
ease
−3 0 3
−3 0 3
**r = 0.13[0.04, 0.22]
*r = 0.10[0.01, 0.19]
.r = 0.09[0, 0.18]
***r = 0.21[0.12, 0.29]
***r = 0.28[0.2, 0.37]
***r = 0.16[0.08, 0.25]
***r = 0.34[0.25, 0.41]
culture
−3
2 r = 0.12[−0.05, 0.29]
r = −0.07[−0.24, 0.11]
−3
2 r = −0.07[−0.24, 0.1]
*r = 0.19[0.02, 0.35]
−3
2 r = 0.00[−0.17, 0.17]
**r = 0.24[0.08, 0.4]
−3
2 r = −0.01[−0.18, 0.16]
*r = 0.19[0.02, 0.35]
−3 0 3
−3
2other
75
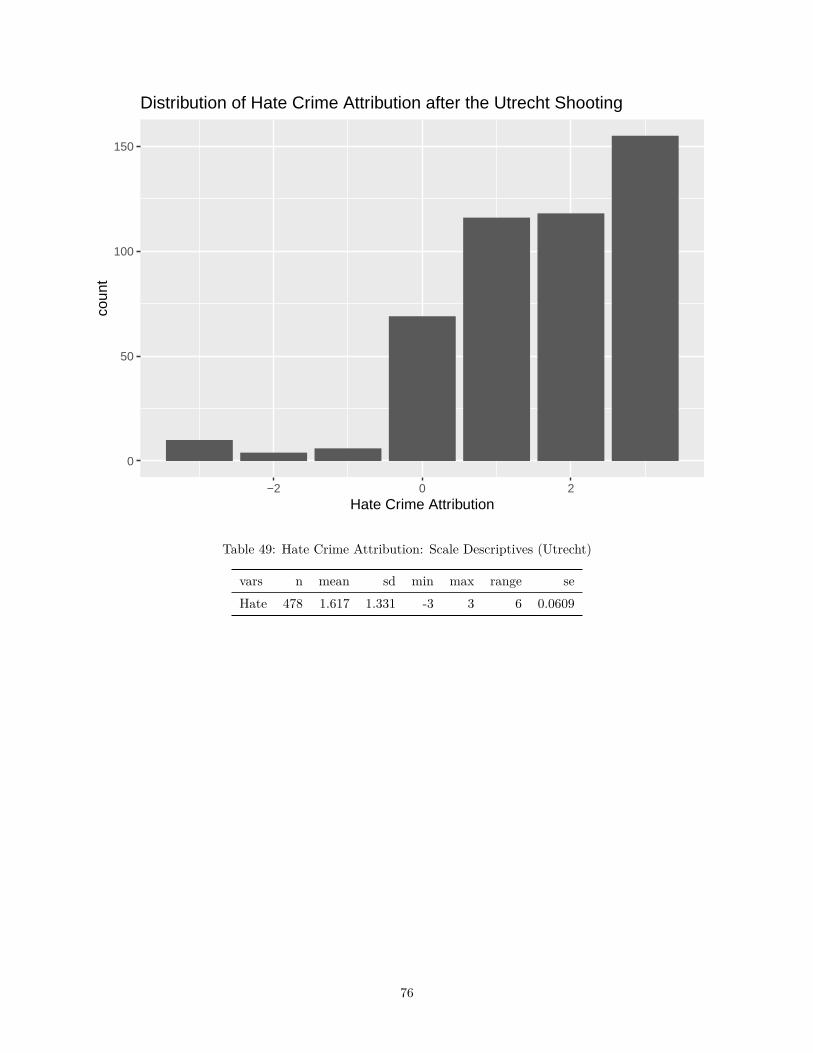
0
50
100
150
−2 0 2Hate Crime Attribution
coun
tDistribution of Hate Crime Attribution after the Utrecht Shooting
Table 49: Hate Crime Attribution: Scale Descriptives (Utrecht)
vars n mean sd min max range seHate 478 1.617 1.331 -3 3 6 0.0609
76
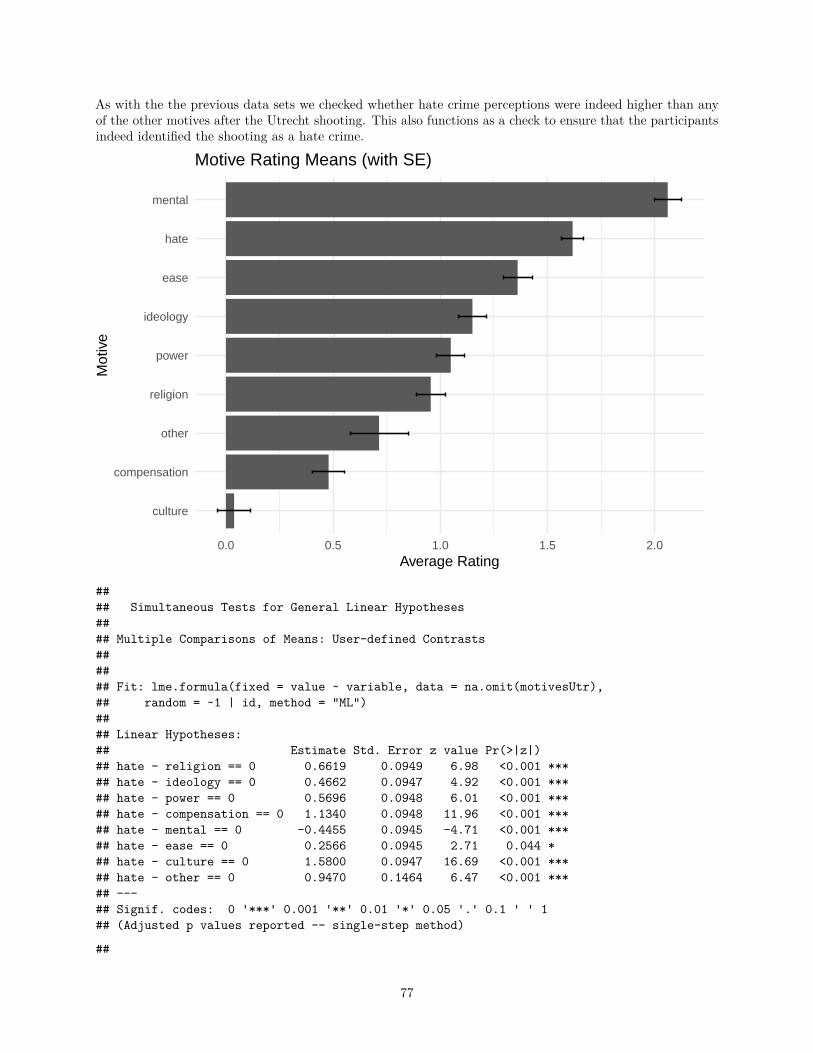
As with the the previous data sets we checked whether hate crime perceptions were indeed higher than anyof the other motives after the Utrecht shooting. This also functions as a check to ensure that the participantsindeed identified the shooting as a hate crime.
culture
compensation
other
religion
power
ideology
ease
hate
mental
0.0 0.5 1.0 1.5 2.0Average Rating
Mot
ive
Motive Rating Means (with SE)
#### Simultaneous Tests for General Linear Hypotheses#### Multiple Comparisons of Means: User-defined Contrasts###### Fit: lme.formula(fixed = value ~ variable, data = na.omit(motivesUtr),## random = ~1 | id, method = "ML")#### Linear Hypotheses:## Estimate Std. Error z value Pr(>|z|)## hate - religion == 0 0.6619 0.0949 6.98 <0.001 ***## hate - ideology == 0 0.4662 0.0947 4.92 <0.001 ***## hate - power == 0 0.5696 0.0948 6.01 <0.001 ***## hate - compensation == 0 1.1340 0.0948 11.96 <0.001 ***## hate - mental == 0 -0.4455 0.0945 -4.71 <0.001 ***## hate - ease == 0 0.2566 0.0945 2.71 0.044 *## hate - culture == 0 1.5800 0.0947 16.69 <0.001 ***## hate - other == 0 0.9470 0.1464 6.47 <0.001 ***## ---## Signif. codes: 0 '***' 0.001 '**' 0.01 '*' 0.05 '.' 0.1 ' ' 1## (Adjusted p values reported -- single-step method)
##
77
## Simultaneous Confidence Intervals#### Multiple Comparisons of Means: User-defined Contrasts###### Fit: lme.formula(fixed = value ~ variable, data = na.omit(motivesUtr),## random = ~1 | id, method = "ML")#### Quantile = 2.664## 95% family-wise confidence level###### Linear Hypotheses:## Estimate lwr upr## hate - religion == 0 0.6619 0.4091 0.9147## hate - ideology == 0 0.4662 0.2138 0.7185## hate - power == 0 0.5696 0.3169 0.8222## hate - compensation == 0 1.1340 0.8814 1.3867## hate - mental == 0 -0.4455 -0.6974 -0.1936## hate - ease == 0 0.2566 0.0047 0.5085## hate - culture == 0 1.5800 1.3278 1.8322## hate - other == 0 0.9470 0.5568 1.3372
Mean scores on the dependent variable “. . . Hatred of others; prejudice” were lower than in the Orlando,Pittsburgh, or Christchurch studies. Scores on the item were still higher than most of the other possiblemotivations. Only, scores on “Mental illness” were higher, presumably due to the fact that the Dutch nationalmedia emphasized the gunman’s history of mental illness in its coverage of the shooting.
78
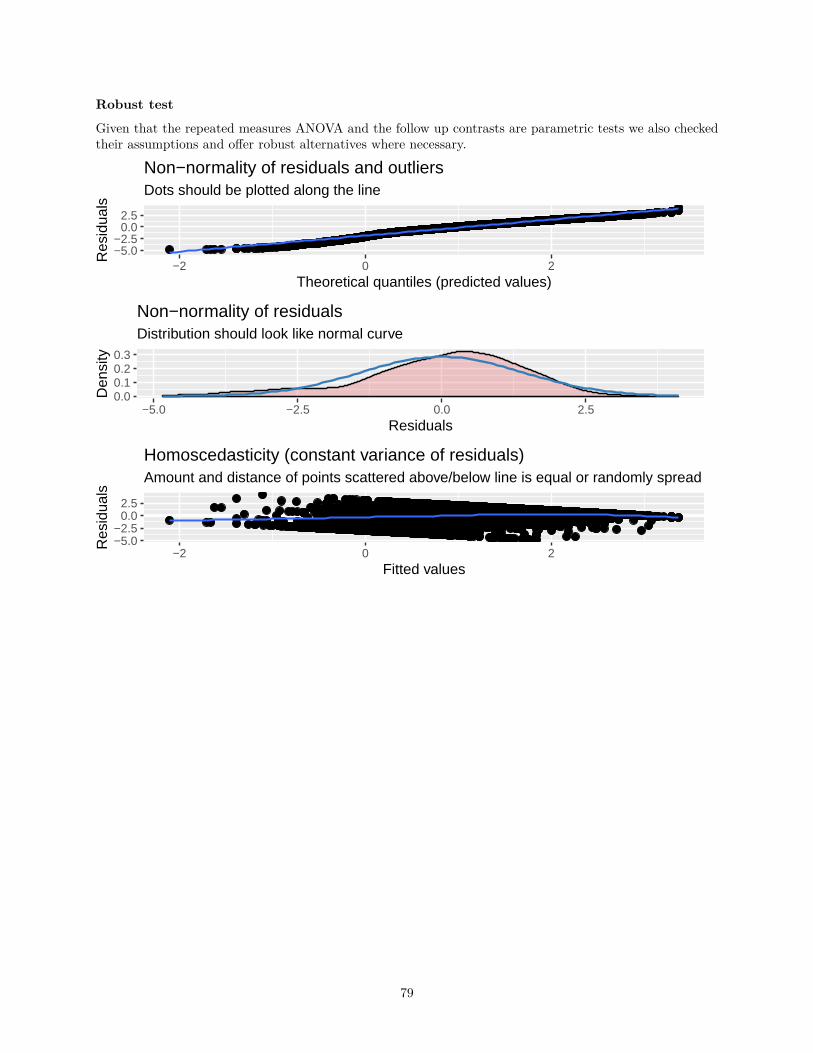
Robust test
Given that the repeated measures ANOVA and the follow up contrasts are parametric tests we also checkedtheir assumptions and offer robust alternatives where necessary.
−5.0−2.5
0.02.5
−2 0 2Theoretical quantiles (predicted values)
Res
idua
ls
Dots should be plotted along the line
Non−normality of residuals and outliers
0.00.10.20.3
−5.0 −2.5 0.0 2.5Residuals
Den
sity
Distribution should look like normal curve
Non−normality of residuals
−5.0−2.5
0.02.5
−2 0 2Fitted values
Res
idua
ls
Amount and distance of points scattered above/below line is equal or randomly spread
Homoscedasticity (constant variance of residuals)
79
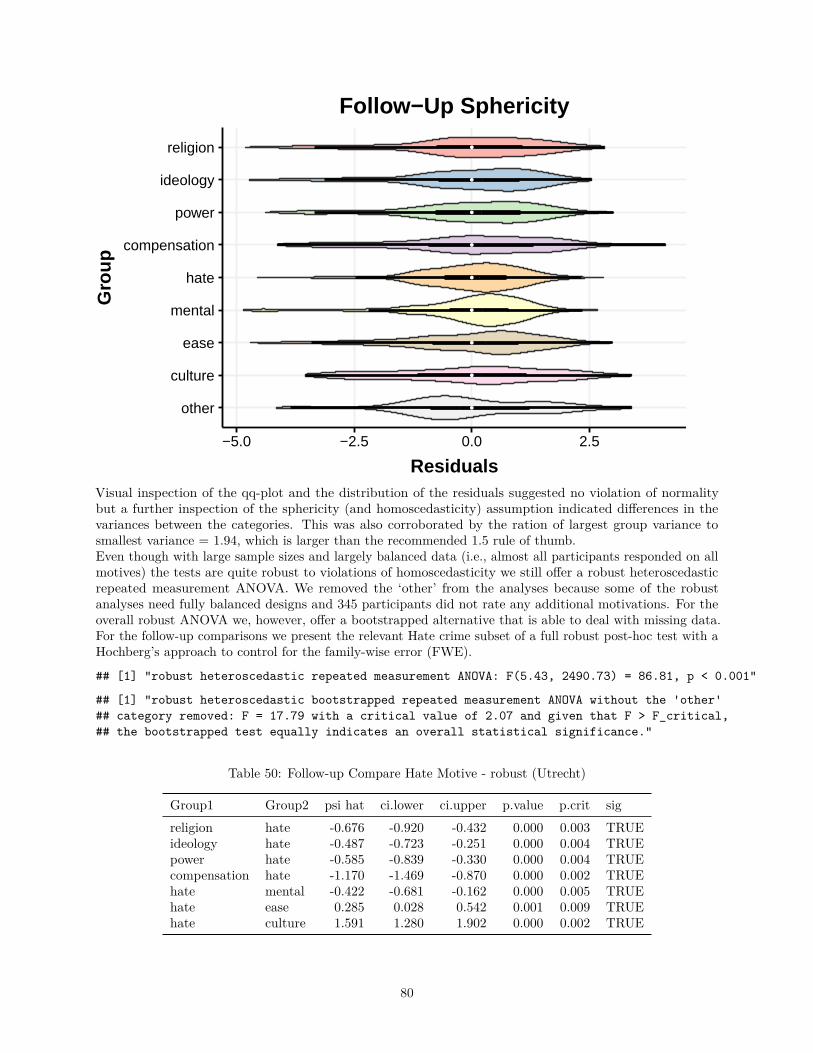
other
culture
ease
mental
hate
compensation
power
ideology
religion
−5.0 −2.5 0.0 2.5
Residuals
Gro
upFollow−Up Sphericity
Visual inspection of the qq-plot and the distribution of the residuals suggested no violation of normalitybut a further inspection of the sphericity (and homoscedasticity) assumption indicated differences in thevariances between the categories. This was also corroborated by the ration of largest group variance tosmallest variance = 1.94, which is larger than the recommended 1.5 rule of thumb.Even though with large sample sizes and largely balanced data (i.e., almost all participants responded on allmotives) the tests are quite robust to violations of homoscedasticity we still offer a robust heteroscedasticrepeated measurement ANOVA. We removed the ‘other’ from the analyses because some of the robustanalyses need fully balanced designs and 345 participants did not rate any additional motivations. For theoverall robust ANOVA we, however, offer a bootstrapped alternative that is able to deal with missing data.For the follow-up comparisons we present the relevant Hate crime subset of a full robust post-hoc test with aHochberg’s approach to control for the family-wise error (FWE).
## [1] "robust heteroscedastic repeated measurement ANOVA: F(5.43, 2490.73) = 86.81, p < 0.001"
## [1] "robust heteroscedastic bootstrapped repeated measurement ANOVA without the 'other'## category removed: F = 17.79 with a critical value of 2.07 and given that F > F_critical,## the bootstrapped test equally indicates an overall statistical significance."
Table 50: Follow-up Compare Hate Motive - robust (Utrecht)
Group1 Group2 psi hat ci.lower ci.upper p.value p.crit sigreligion hate -0.676 -0.920 -0.432 0.000 0.003 TRUEideology hate -0.487 -0.723 -0.251 0.000 0.004 TRUEpower hate -0.585 -0.839 -0.330 0.000 0.004 TRUEcompensation hate -1.170 -1.469 -0.870 0.000 0.002 TRUEhate mental -0.422 -0.681 -0.162 0.000 0.005 TRUEhate ease 0.285 0.028 0.542 0.001 0.009 TRUEhate culture 1.591 1.280 1.902 0.000 0.002 TRUE
80
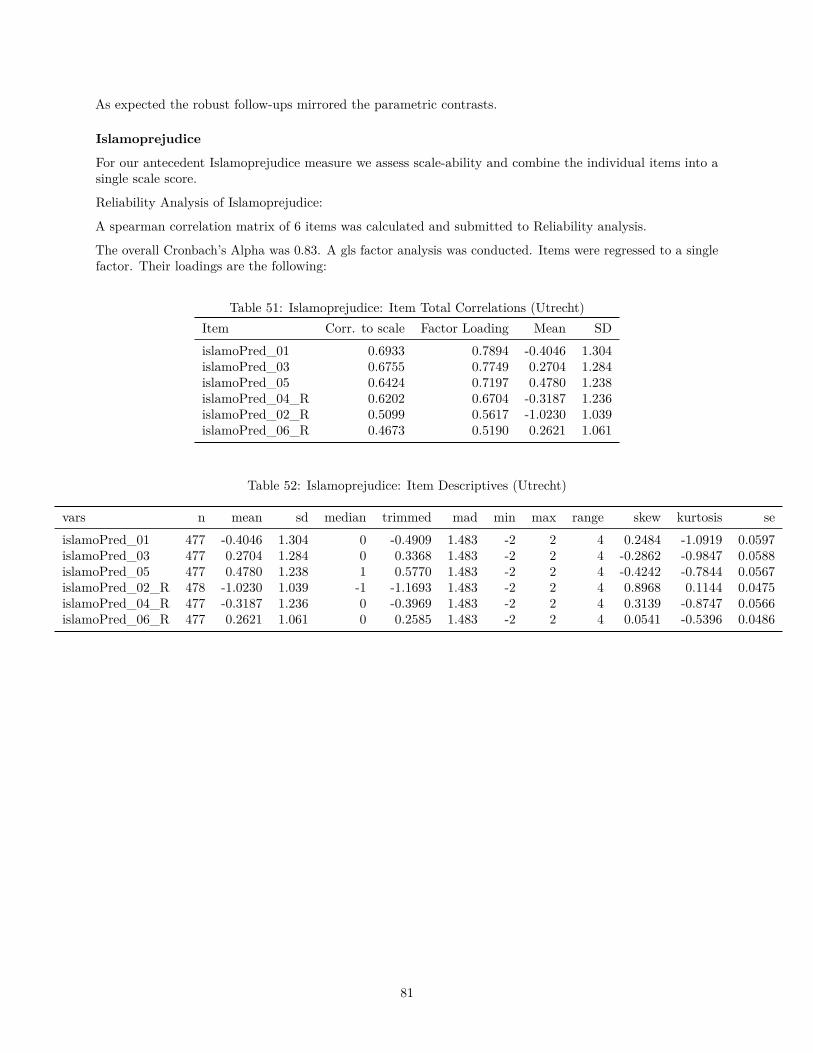
As expected the robust follow-ups mirrored the parametric contrasts.
Islamoprejudice
For our antecedent Islamoprejudice measure we assess scale-ability and combine the individual items into asingle scale score.
Reliability Analysis of Islamoprejudice:
A spearman correlation matrix of 6 items was calculated and submitted to Reliability analysis.
The overall Cronbach’s Alpha was 0.83. A gls factor analysis was conducted. Items were regressed to a singlefactor. Their loadings are the following:
Table 51: Islamoprejudice: Item Total Correlations (Utrecht)Item Corr. to scale Factor Loading Mean SDislamoPred_01 0.6933 0.7894 -0.4046 1.304islamoPred_03 0.6755 0.7749 0.2704 1.284islamoPred_05 0.6424 0.7197 0.4780 1.238islamoPred_04_R 0.6202 0.6704 -0.3187 1.236islamoPred_02_R 0.5099 0.5617 -1.0230 1.039islamoPred_06_R 0.4673 0.5190 0.2621 1.061
Table 52: Islamoprejudice: Item Descriptives (Utrecht)
vars n mean sd median trimmed mad min max range skew kurtosis seislamoPred_01 477 -0.4046 1.304 0 -0.4909 1.483 -2 2 4 0.2484 -1.0919 0.0597islamoPred_03 477 0.2704 1.284 0 0.3368 1.483 -2 2 4 -0.2862 -0.9847 0.0588islamoPred_05 477 0.4780 1.238 1 0.5770 1.483 -2 2 4 -0.4242 -0.7844 0.0567islamoPred_02_R 478 -1.0230 1.039 -1 -1.1693 1.483 -2 2 4 0.8968 0.1144 0.0475islamoPred_04_R 477 -0.3187 1.236 0 -0.3969 1.483 -2 2 4 0.3139 -0.8747 0.0566islamoPred_06_R 477 0.2621 1.061 0 0.2585 1.483 -2 2 4 0.0541 -0.5396 0.0486
81
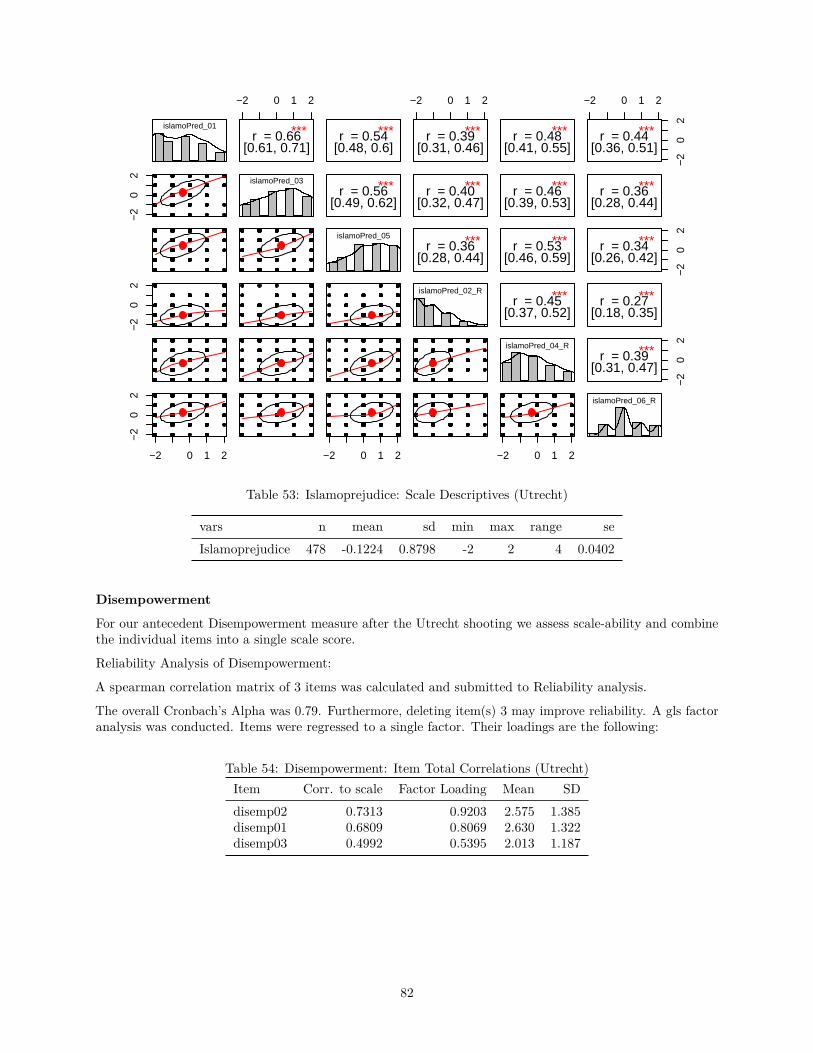
islamoPred_01−
20
2−
20
2
−2 0 1 2
−2
02
−2 0 1 2
***r = 0.66[0.61, 0.71]
islamoPred_03
***r = 0.54[0.48, 0.6]
***r = 0.56[0.49, 0.62]
islamoPred_05
−2 0 1 2
−2 0 1 2
***r = 0.39[0.31, 0.46]
***r = 0.40[0.32, 0.47]
***r = 0.36[0.28, 0.44]
islamoPred_02_R
***r = 0.48[0.41, 0.55]
***r = 0.46[0.39, 0.53]
***r = 0.53[0.46, 0.59]
***r = 0.45[0.37, 0.52]
islamoPred_04_R
−2 0 1 2
−2 0 1 2
−2
02
***r = 0.44[0.36, 0.51]
***r = 0.36[0.28, 0.44]
−2
02
***r = 0.34[0.26, 0.42]
***r = 0.27[0.18, 0.35]
−2
02
***r = 0.39[0.31, 0.47]
islamoPred_06_R
Table 53: Islamoprejudice: Scale Descriptives (Utrecht)
vars n mean sd min max range seIslamoprejudice 478 -0.1224 0.8798 -2 2 4 0.0402
Disempowerment
For our antecedent Disempowerment measure after the Utrecht shooting we assess scale-ability and combinethe individual items into a single scale score.
Reliability Analysis of Disempowerment:
A spearman correlation matrix of 3 items was calculated and submitted to Reliability analysis.
The overall Cronbach’s Alpha was 0.79. Furthermore, deleting item(s) 3 may improve reliability. A gls factoranalysis was conducted. Items were regressed to a single factor. Their loadings are the following:
Table 54: Disempowerment: Item Total Correlations (Utrecht)Item Corr. to scale Factor Loading Mean SDdisemp02 0.7313 0.9203 2.575 1.385disemp01 0.6809 0.8069 2.630 1.322disemp03 0.4992 0.5395 2.013 1.187
82
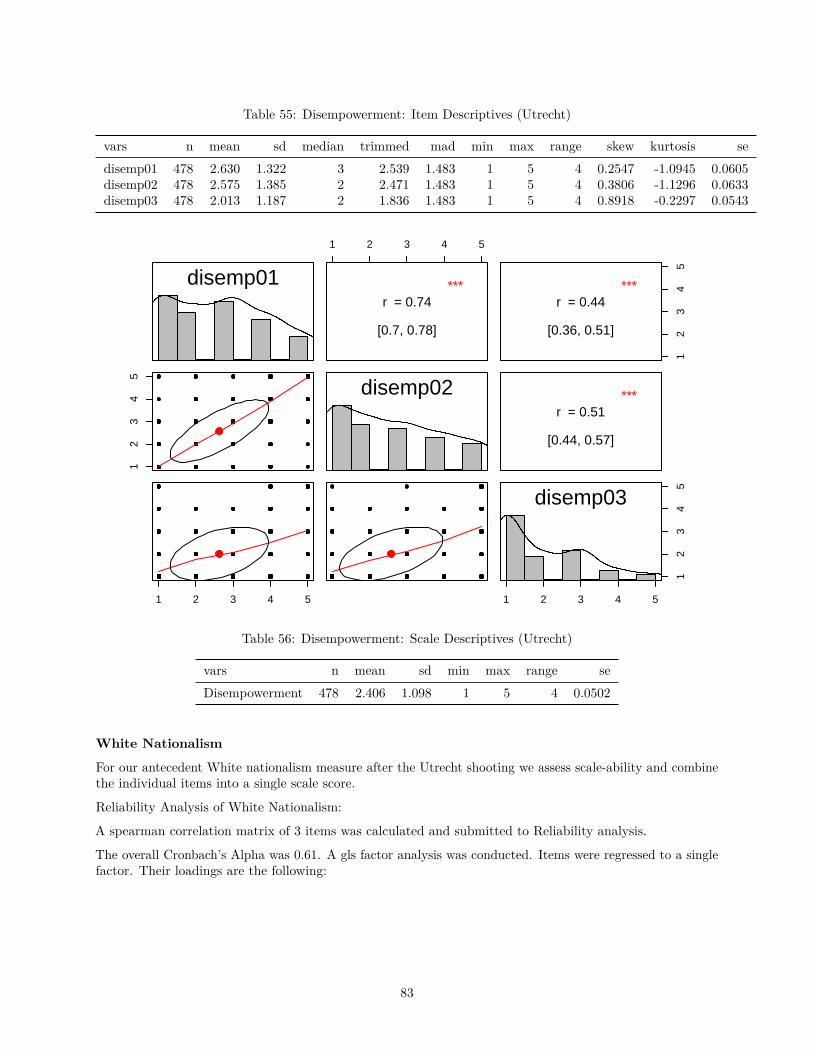
Table 55: Disempowerment: Item Descriptives (Utrecht)
vars n mean sd median trimmed mad min max range skew kurtosis sedisemp01 478 2.630 1.322 3 2.539 1.483 1 5 4 0.2547 -1.0945 0.0605disemp02 478 2.575 1.385 2 2.471 1.483 1 5 4 0.3806 -1.1296 0.0633disemp03 478 2.013 1.187 2 1.836 1.483 1 5 4 0.8918 -0.2297 0.0543
disemp01
12
34
5
1 2 3 4 5
1 2 3 4 5
***r = 0.74
[0.7, 0.78]
disemp02
12
34
5
***r = 0.44
[0.36, 0.51]
***r = 0.51
[0.44, 0.57]
1 2 3 4 5
12
34
5
disemp03
Table 56: Disempowerment: Scale Descriptives (Utrecht)
vars n mean sd min max range seDisempowerment 478 2.406 1.098 1 5 4 0.0502
White Nationalism
For our antecedent White nationalism measure after the Utrecht shooting we assess scale-ability and combinethe individual items into a single scale score.
Reliability Analysis of White Nationalism:
A spearman correlation matrix of 3 items was calculated and submitted to Reliability analysis.
The overall Cronbach’s Alpha was 0.61. A gls factor analysis was conducted. Items were regressed to a singlefactor. Their loadings are the following:
83
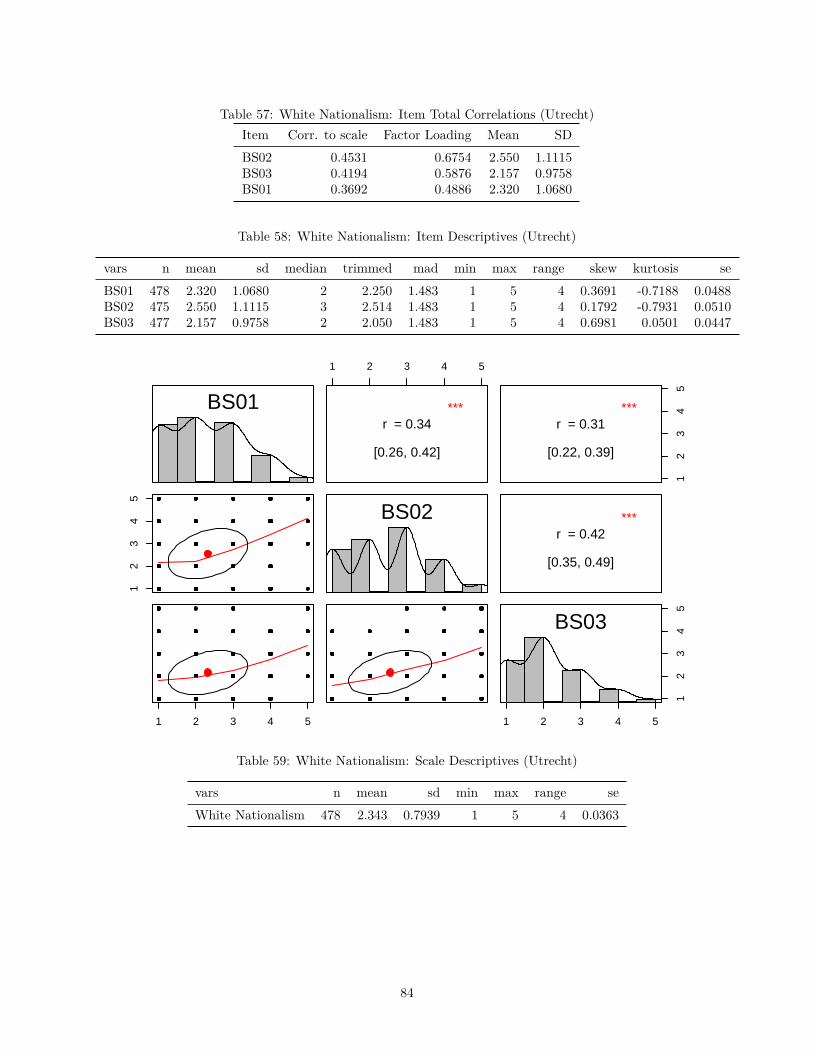
Table 57: White Nationalism: Item Total Correlations (Utrecht)Item Corr. to scale Factor Loading Mean SDBS02 0.4531 0.6754 2.550 1.1115BS03 0.4194 0.5876 2.157 0.9758BS01 0.3692 0.4886 2.320 1.0680
Table 58: White Nationalism: Item Descriptives (Utrecht)
vars n mean sd median trimmed mad min max range skew kurtosis seBS01 478 2.320 1.0680 2 2.250 1.483 1 5 4 0.3691 -0.7188 0.0488BS02 475 2.550 1.1115 3 2.514 1.483 1 5 4 0.1792 -0.7931 0.0510BS03 477 2.157 0.9758 2 2.050 1.483 1 5 4 0.6981 0.0501 0.0447
BS01
12
34
5
1 2 3 4 5
1 2 3 4 5
***r = 0.34
[0.26, 0.42]
BS02
12
34
5
***r = 0.31
[0.22, 0.39]
***r = 0.42
[0.35, 0.49]
1 2 3 4 5
12
34
5
BS03
Table 59: White Nationalism: Scale Descriptives (Utrecht)
vars n mean sd min max range seWhite Nationalism 478 2.343 0.7939 1 5 4 0.0363
84
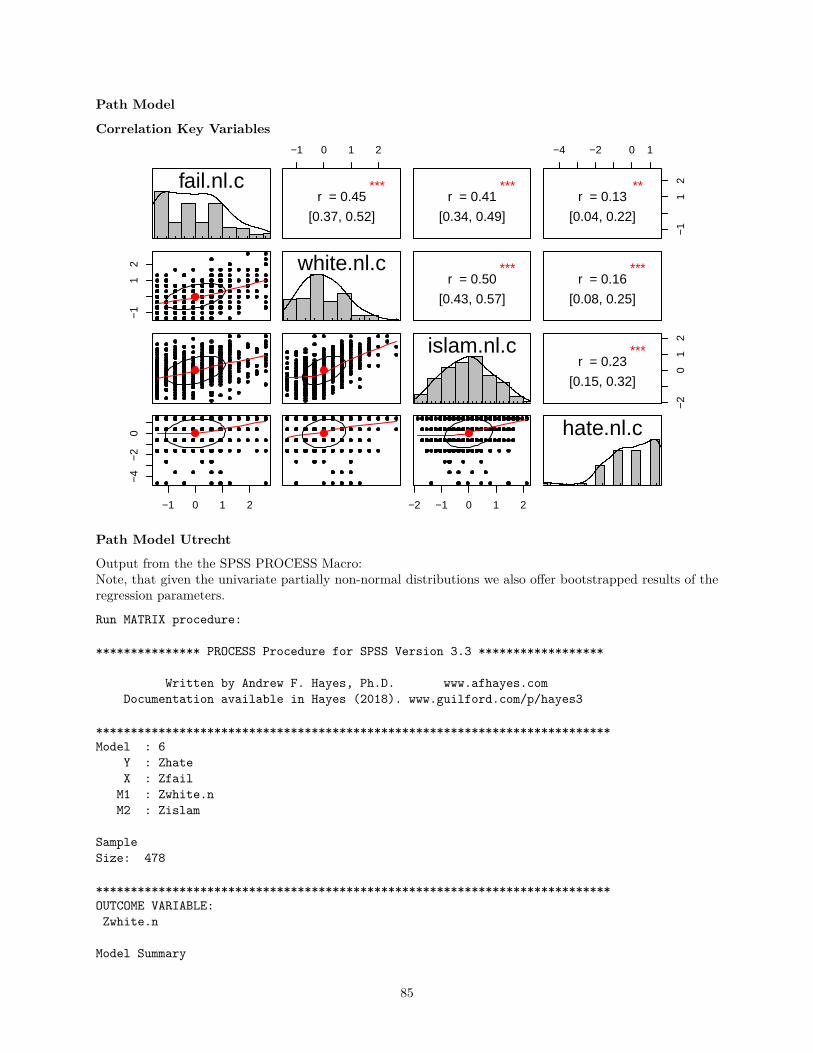
Path Model
Correlation Key Variables
fail.nl.c
−1
12
−1 0 1 2
−4
−2
0
−1 0 1 2
***r = 0.45
[0.37, 0.52]
white.nl.c
***r = 0.41
[0.34, 0.49]
***r = 0.50
[0.43, 0.57]
islam.nl.c
−2 −1 0 1 2
−4 −2 0 1
−1
12**
r = 0.13
[0.04, 0.22]
***r = 0.16
[0.08, 0.25]
−2
01
2
***r = 0.23
[0.15, 0.32]
hate.nl.c
Path Model Utrecht
Output from the the SPSS PROCESS Macro:Note, that given the univariate partially non-normal distributions we also offer bootstrapped results of theregression parameters.
Run MATRIX procedure:
*************** PROCESS Procedure for SPSS Version 3.3 ******************
Written by Andrew F. Hayes, Ph.D. www.afhayes.comDocumentation available in Hayes (2018). www.guilford.com/p/hayes3
**************************************************************************Model : 6
Y : ZhateX : Zfail
M1 : Zwhite.nM2 : Zislam
SampleSize: 478
**************************************************************************OUTCOME VARIABLE:Zwhite.n
Model Summary
85
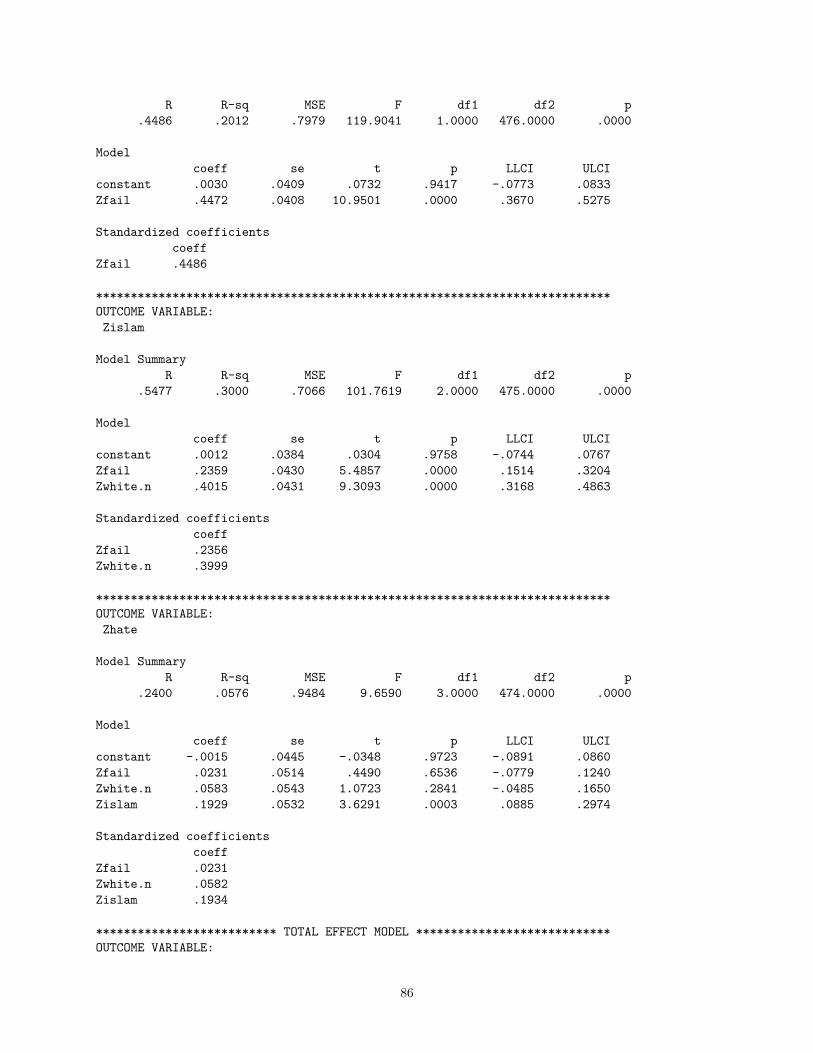
R R-sq MSE F df1 df2 p.4486 .2012 .7979 119.9041 1.0000 476.0000 .0000
Modelcoeff se t p LLCI ULCI
constant .0030 .0409 .0732 .9417 -.0773 .0833Zfail .4472 .0408 10.9501 .0000 .3670 .5275
Standardized coefficientscoeff
Zfail .4486
**************************************************************************OUTCOME VARIABLE:Zislam
Model SummaryR R-sq MSE F df1 df2 p
.5477 .3000 .7066 101.7619 2.0000 475.0000 .0000
Modelcoeff se t p LLCI ULCI
constant .0012 .0384 .0304 .9758 -.0744 .0767Zfail .2359 .0430 5.4857 .0000 .1514 .3204Zwhite.n .4015 .0431 9.3093 .0000 .3168 .4863
Standardized coefficientscoeff
Zfail .2356Zwhite.n .3999
**************************************************************************OUTCOME VARIABLE:Zhate
Model SummaryR R-sq MSE F df1 df2 p
.2400 .0576 .9484 9.6590 3.0000 474.0000 .0000
Modelcoeff se t p LLCI ULCI
constant -.0015 .0445 -.0348 .9723 -.0891 .0860Zfail .0231 .0514 .4490 .6536 -.0779 .1240Zwhite.n .0583 .0543 1.0723 .2841 -.0485 .1650Zislam .1929 .0532 3.6291 .0003 .0885 .2974
Standardized coefficientscoeff
Zfail .0231Zwhite.n .0582Zislam .1934
************************** TOTAL EFFECT MODEL ****************************OUTCOME VARIABLE:
86

Zhate
Model SummaryR R-sq MSE F df1 df2 p
.1295 .0168 .9853 8.1132 1.0000 476.0000 .0046
Modelcoeff se t p LLCI ULCI
constant -.0009 .0454 -.0202 .9839 -.0901 .0883Zfail .1293 .0454 2.8484 .0046 .0401 .2185
Standardized coefficientscoeff
Zfail .1295
************** TOTAL, DIRECT, AND INDIRECT EFFECTS OF X ON Y **************
Total effect of X on YEffect se t p LLCI ULCI c_ps c_cs.1293 .0454 2.8484 .0046 .0401 .2185 .1293 .1295
Direct effect of X on YEffect se t p LLCI ULCI c'_ps c'_cs.0231 .0514 .4490 .6536 -.0779 .1240 .0231 .0231
Indirect effect(s) of X on Y:Effect BootSE BootLLCI BootULCI
TOTAL .1062 .0268 .0545 .1608Ind1 .0261 .0253 -.0239 .0762Ind2 .0455 .0161 .0173 .0808Ind3 .0346 .0117 .0134 .0598
Partially standardized indirect effect(s) of X on Y:Effect BootSE BootLLCI BootULCI
TOTAL .1062 .0274 .0540 .1612Ind1 .0261 .0254 -.0238 .0776Ind2 .0455 .0161 .0173 .0812Ind3 .0346 .0118 .0135 .0597
Completely standardized indirect effect(s) of X on Y:Effect BootSE BootLLCI BootULCI
TOTAL .1064 .0275 .0542 .1615Ind1 .0261 .0255 -.0237 .0777Ind2 .0456 .0161 .0174 .0805Ind3 .0347 .0117 .0134 .0594
Indirect effect key:Ind1 Zfail -> Zwhite.n -> ZhateInd2 Zfail -> Zislam -> ZhateInd3 Zfail -> Zwhite.n -> Zislam -> Zhate
*********** BOOTSTRAP RESULTS FOR REGRESSION MODEL PARAMETERS ************
OUTCOME VARIABLE:
87
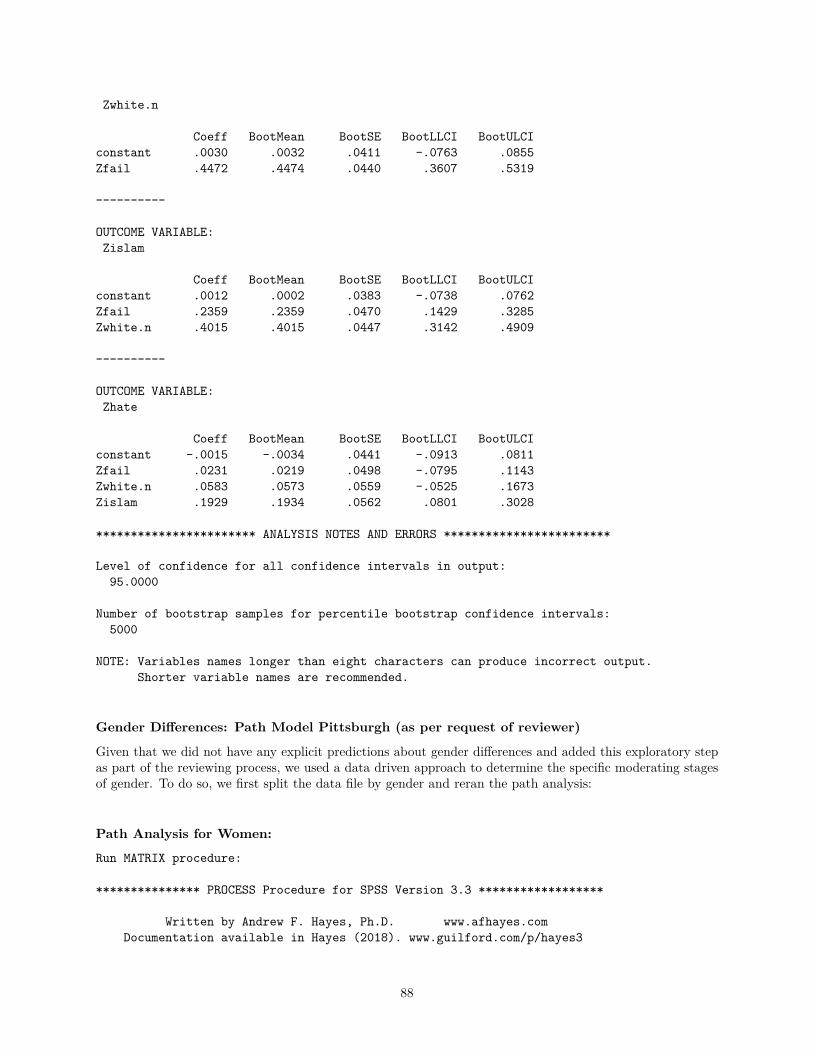
Zwhite.n
Coeff BootMean BootSE BootLLCI BootULCIconstant .0030 .0032 .0411 -.0763 .0855Zfail .4472 .4474 .0440 .3607 .5319
----------
OUTCOME VARIABLE:Zislam
Coeff BootMean BootSE BootLLCI BootULCIconstant .0012 .0002 .0383 -.0738 .0762Zfail .2359 .2359 .0470 .1429 .3285Zwhite.n .4015 .4015 .0447 .3142 .4909
----------
OUTCOME VARIABLE:Zhate
Coeff BootMean BootSE BootLLCI BootULCIconstant -.0015 -.0034 .0441 -.0913 .0811Zfail .0231 .0219 .0498 -.0795 .1143Zwhite.n .0583 .0573 .0559 -.0525 .1673Zislam .1929 .1934 .0562 .0801 .3028
*********************** ANALYSIS NOTES AND ERRORS ************************
Level of confidence for all confidence intervals in output:95.0000
Number of bootstrap samples for percentile bootstrap confidence intervals:5000
NOTE: Variables names longer than eight characters can produce incorrect output.Shorter variable names are recommended.
Gender Differences: Path Model Pittsburgh (as per request of reviewer)
Given that we did not have any explicit predictions about gender differences and added this exploratory stepas part of the reviewing process, we used a data driven approach to determine the specific moderating stagesof gender. To do so, we first split the data file by gender and reran the path analysis:
Path Analysis for Women:
Run MATRIX procedure:
*************** PROCESS Procedure for SPSS Version 3.3 ******************
Written by Andrew F. Hayes, Ph.D. www.afhayes.comDocumentation available in Hayes (2018). www.guilford.com/p/hayes3
88
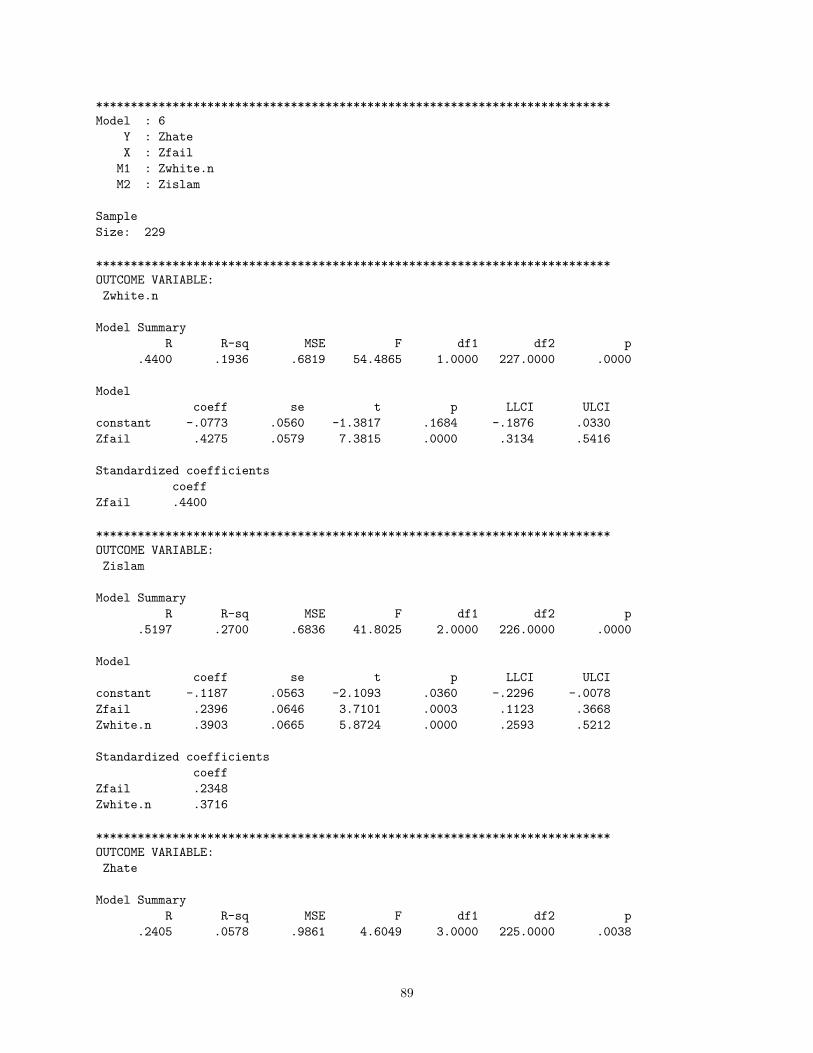
**************************************************************************Model : 6
Y : ZhateX : Zfail
M1 : Zwhite.nM2 : Zislam
SampleSize: 229
**************************************************************************OUTCOME VARIABLE:Zwhite.n
Model SummaryR R-sq MSE F df1 df2 p
.4400 .1936 .6819 54.4865 1.0000 227.0000 .0000
Modelcoeff se t p LLCI ULCI
constant -.0773 .0560 -1.3817 .1684 -.1876 .0330Zfail .4275 .0579 7.3815 .0000 .3134 .5416
Standardized coefficientscoeff
Zfail .4400
**************************************************************************OUTCOME VARIABLE:Zislam
Model SummaryR R-sq MSE F df1 df2 p
.5197 .2700 .6836 41.8025 2.0000 226.0000 .0000
Modelcoeff se t p LLCI ULCI
constant -.1187 .0563 -2.1093 .0360 -.2296 -.0078Zfail .2396 .0646 3.7101 .0003 .1123 .3668Zwhite.n .3903 .0665 5.8724 .0000 .2593 .5212
Standardized coefficientscoeff
Zfail .2348Zwhite.n .3716
**************************************************************************OUTCOME VARIABLE:Zhate
Model SummaryR R-sq MSE F df1 df2 p
.2405 .0578 .9861 4.6049 3.0000 225.0000 .0038
89
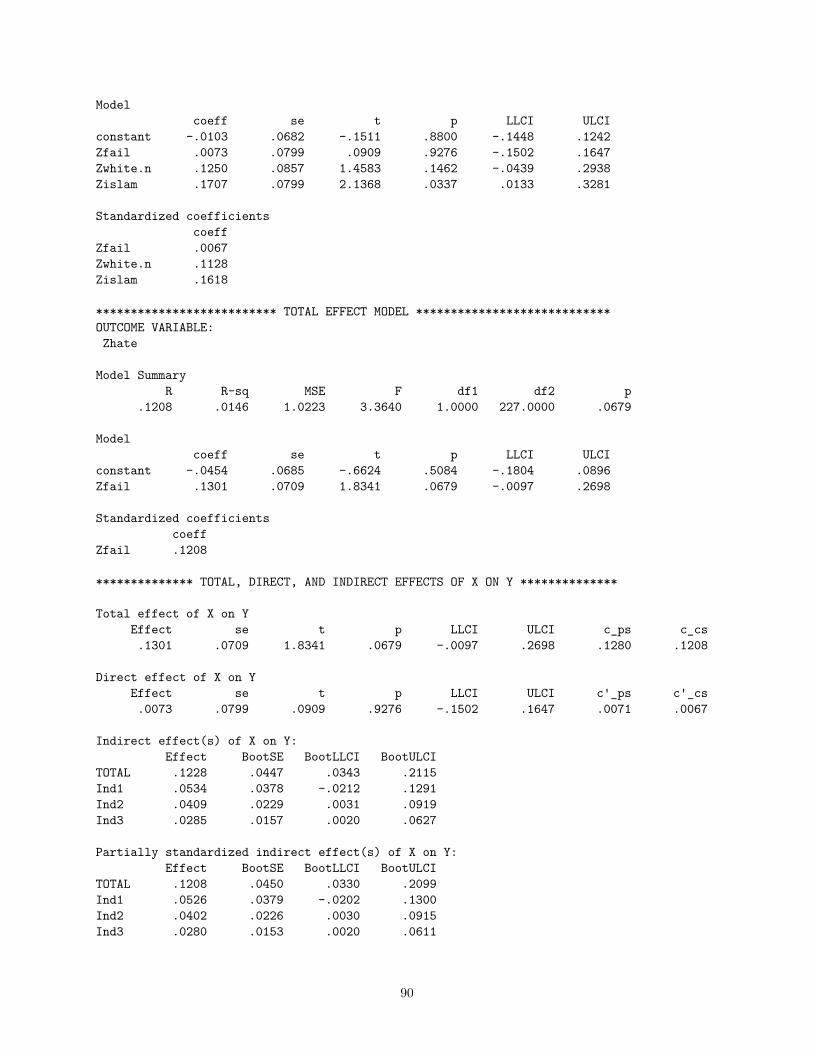
Modelcoeff se t p LLCI ULCI
constant -.0103 .0682 -.1511 .8800 -.1448 .1242Zfail .0073 .0799 .0909 .9276 -.1502 .1647Zwhite.n .1250 .0857 1.4583 .1462 -.0439 .2938Zislam .1707 .0799 2.1368 .0337 .0133 .3281
Standardized coefficientscoeff
Zfail .0067Zwhite.n .1128Zislam .1618
************************** TOTAL EFFECT MODEL ****************************OUTCOME VARIABLE:Zhate
Model SummaryR R-sq MSE F df1 df2 p
.1208 .0146 1.0223 3.3640 1.0000 227.0000 .0679
Modelcoeff se t p LLCI ULCI
constant -.0454 .0685 -.6624 .5084 -.1804 .0896Zfail .1301 .0709 1.8341 .0679 -.0097 .2698
Standardized coefficientscoeff
Zfail .1208
************** TOTAL, DIRECT, AND INDIRECT EFFECTS OF X ON Y **************
Total effect of X on YEffect se t p LLCI ULCI c_ps c_cs.1301 .0709 1.8341 .0679 -.0097 .2698 .1280 .1208
Direct effect of X on YEffect se t p LLCI ULCI c'_ps c'_cs.0073 .0799 .0909 .9276 -.1502 .1647 .0071 .0067
Indirect effect(s) of X on Y:Effect BootSE BootLLCI BootULCI
TOTAL .1228 .0447 .0343 .2115Ind1 .0534 .0378 -.0212 .1291Ind2 .0409 .0229 .0031 .0919Ind3 .0285 .0157 .0020 .0627
Partially standardized indirect effect(s) of X on Y:Effect BootSE BootLLCI BootULCI
TOTAL .1208 .0450 .0330 .2099Ind1 .0526 .0379 -.0202 .1300Ind2 .0402 .0226 .0030 .0915Ind3 .0280 .0153 .0020 .0611
90
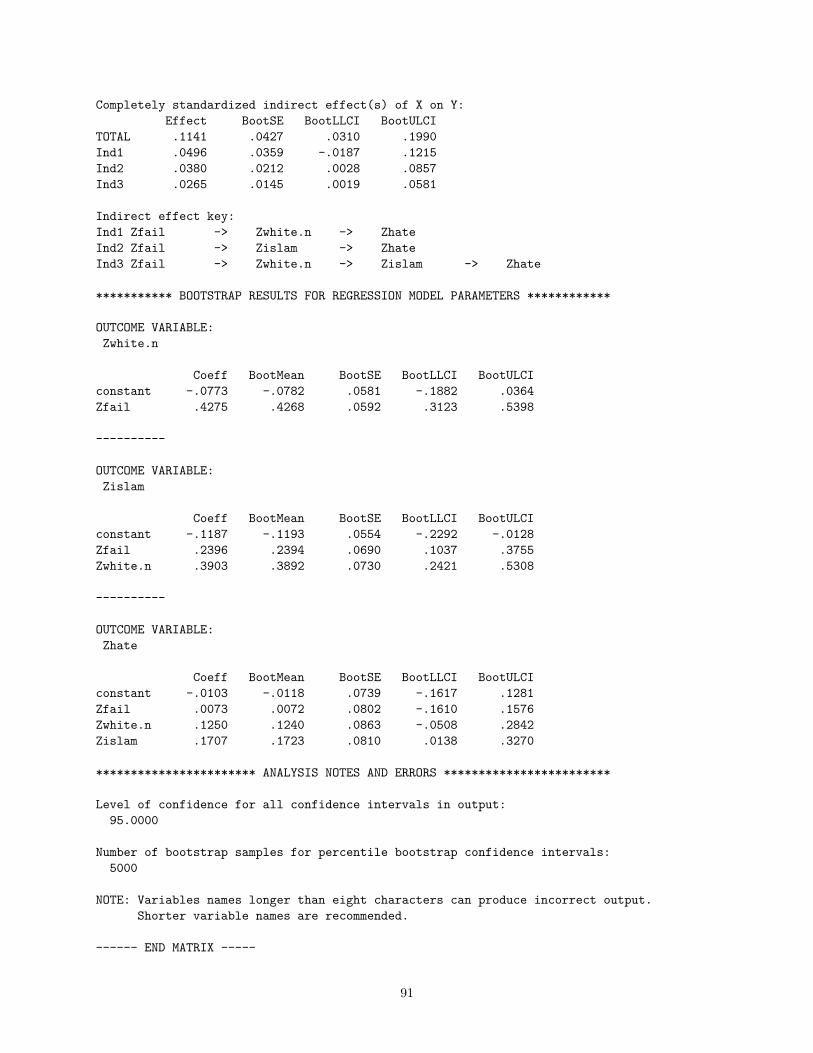
Completely standardized indirect effect(s) of X on Y:Effect BootSE BootLLCI BootULCI
TOTAL .1141 .0427 .0310 .1990Ind1 .0496 .0359 -.0187 .1215Ind2 .0380 .0212 .0028 .0857Ind3 .0265 .0145 .0019 .0581
Indirect effect key:Ind1 Zfail -> Zwhite.n -> ZhateInd2 Zfail -> Zislam -> ZhateInd3 Zfail -> Zwhite.n -> Zislam -> Zhate
*********** BOOTSTRAP RESULTS FOR REGRESSION MODEL PARAMETERS ************
OUTCOME VARIABLE:Zwhite.n
Coeff BootMean BootSE BootLLCI BootULCIconstant -.0773 -.0782 .0581 -.1882 .0364Zfail .4275 .4268 .0592 .3123 .5398
----------
OUTCOME VARIABLE:Zislam
Coeff BootMean BootSE BootLLCI BootULCIconstant -.1187 -.1193 .0554 -.2292 -.0128Zfail .2396 .2394 .0690 .1037 .3755Zwhite.n .3903 .3892 .0730 .2421 .5308
----------
OUTCOME VARIABLE:Zhate
Coeff BootMean BootSE BootLLCI BootULCIconstant -.0103 -.0118 .0739 -.1617 .1281Zfail .0073 .0072 .0802 -.1610 .1576Zwhite.n .1250 .1240 .0863 -.0508 .2842Zislam .1707 .1723 .0810 .0138 .3270
*********************** ANALYSIS NOTES AND ERRORS ************************
Level of confidence for all confidence intervals in output:95.0000
Number of bootstrap samples for percentile bootstrap confidence intervals:5000
NOTE: Variables names longer than eight characters can produce incorrect output.Shorter variable names are recommended.
------ END MATRIX -----
91

Path Analysis for Men:
Run MATRIX procedure:
*************** PROCESS Procedure for SPSS Version 3.3 ******************
Written by Andrew F. Hayes, Ph.D. www.afhayes.comDocumentation available in Hayes (2018). www.guilford.com/p/hayes3
**************************************************************************Model : 6
Y : ZhateX : Zfail
M1 : Zwhite.nM2 : Zislam
SampleSize: 248
**************************************************************************OUTCOME VARIABLE:Zwhite.n
Model SummaryR R-sq MSE F df1 df2 p
.4224 .1784 .9007 53.4192 1.0000 246.0000 .0000
Modelcoeff se t p LLCI ULCI
constant .0788 .0615 1.2811 .2014 -.0424 .2000Zfail .4360 .0597 7.3088 .0000 .3185 .5535
Standardized coefficientscoeff
Zfail .4224
**************************************************************************OUTCOME VARIABLE:Zislam
Model SummaryR R-sq MSE F df1 df2 p
.5291 .2800 .7106 47.6320 2.0000 245.0000 .0000
Modelcoeff se t p LLCI ULCI
constant .1227 .0548 2.2372 .0262 .0147 .2307Zfail .1982 .0585 3.3909 .0008 .0831 .3134Zwhite.n .3887 .0566 6.8636 .0000 .2771 .5002
Standardized coefficientscoeff
Zfail .2028Zwhite.n .4105
92
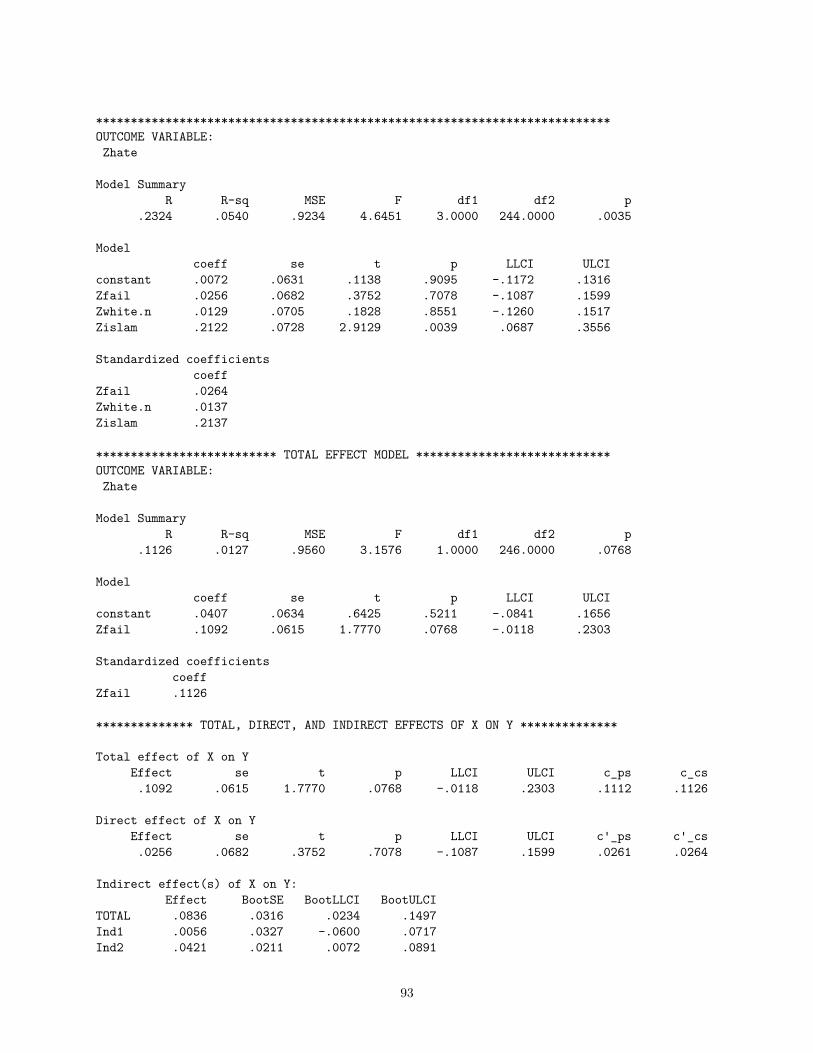
**************************************************************************OUTCOME VARIABLE:Zhate
Model SummaryR R-sq MSE F df1 df2 p
.2324 .0540 .9234 4.6451 3.0000 244.0000 .0035
Modelcoeff se t p LLCI ULCI
constant .0072 .0631 .1138 .9095 -.1172 .1316Zfail .0256 .0682 .3752 .7078 -.1087 .1599Zwhite.n .0129 .0705 .1828 .8551 -.1260 .1517Zislam .2122 .0728 2.9129 .0039 .0687 .3556
Standardized coefficientscoeff
Zfail .0264Zwhite.n .0137Zislam .2137
************************** TOTAL EFFECT MODEL ****************************OUTCOME VARIABLE:Zhate
Model SummaryR R-sq MSE F df1 df2 p
.1126 .0127 .9560 3.1576 1.0000 246.0000 .0768
Modelcoeff se t p LLCI ULCI
constant .0407 .0634 .6425 .5211 -.0841 .1656Zfail .1092 .0615 1.7770 .0768 -.0118 .2303
Standardized coefficientscoeff
Zfail .1126
************** TOTAL, DIRECT, AND INDIRECT EFFECTS OF X ON Y **************
Total effect of X on YEffect se t p LLCI ULCI c_ps c_cs.1092 .0615 1.7770 .0768 -.0118 .2303 .1112 .1126
Direct effect of X on YEffect se t p LLCI ULCI c'_ps c'_cs.0256 .0682 .3752 .7078 -.1087 .1599 .0261 .0264
Indirect effect(s) of X on Y:Effect BootSE BootLLCI BootULCI
TOTAL .0836 .0316 .0234 .1497Ind1 .0056 .0327 -.0600 .0717Ind2 .0421 .0211 .0072 .0891
93
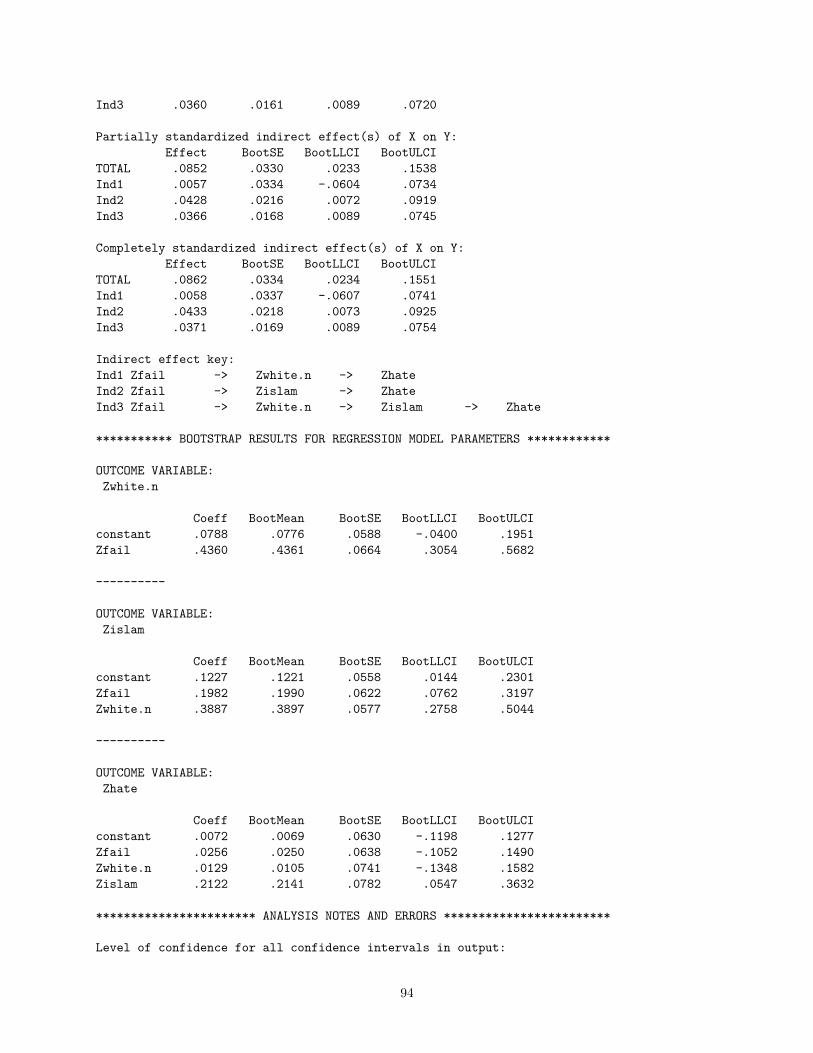
Ind3 .0360 .0161 .0089 .0720
Partially standardized indirect effect(s) of X on Y:Effect BootSE BootLLCI BootULCI
TOTAL .0852 .0330 .0233 .1538Ind1 .0057 .0334 -.0604 .0734Ind2 .0428 .0216 .0072 .0919Ind3 .0366 .0168 .0089 .0745
Completely standardized indirect effect(s) of X on Y:Effect BootSE BootLLCI BootULCI
TOTAL .0862 .0334 .0234 .1551Ind1 .0058 .0337 -.0607 .0741Ind2 .0433 .0218 .0073 .0925Ind3 .0371 .0169 .0089 .0754
Indirect effect key:Ind1 Zfail -> Zwhite.n -> ZhateInd2 Zfail -> Zislam -> ZhateInd3 Zfail -> Zwhite.n -> Zislam -> Zhate
*********** BOOTSTRAP RESULTS FOR REGRESSION MODEL PARAMETERS ************
OUTCOME VARIABLE:Zwhite.n
Coeff BootMean BootSE BootLLCI BootULCIconstant .0788 .0776 .0588 -.0400 .1951Zfail .4360 .4361 .0664 .3054 .5682
----------
OUTCOME VARIABLE:Zislam
Coeff BootMean BootSE BootLLCI BootULCIconstant .1227 .1221 .0558 .0144 .2301Zfail .1982 .1990 .0622 .0762 .3197Zwhite.n .3887 .3897 .0577 .2758 .5044
----------
OUTCOME VARIABLE:Zhate
Coeff BootMean BootSE BootLLCI BootULCIconstant .0072 .0069 .0630 -.1198 .1277Zfail .0256 .0250 .0638 -.1052 .1490Zwhite.n .0129 .0105 .0741 -.1348 .1582Zislam .2122 .2141 .0782 .0547 .3632
*********************** ANALYSIS NOTES AND ERRORS ************************
Level of confidence for all confidence intervals in output:
94

95.0000
Number of bootstrap samples for percentile bootstrap confidence intervals:5000
NOTE: Variables names longer than eight characters can produce incorrect output.Shorter variable names are recommended.
------ END MATRIX -----
Path Analysis controlling for gender:
To assess the differences between the groups, we inspected (1) the differences in betas (as an indicationof effect size; given the reduced sample sizes we chose a difference of at least .3 as practically relevant),(2) the overlap of the confidence intervals, as well as (3) a statistical comparison of betas as suggested byCohen, Cohen, West, and Aiken (2003, https://doi.org/10.4324/9780203774441 ) - with t = b1−b2√
se2b1+se2
b2and
df = n1 + n2 − 4.Summary:
Table 60: Gender Differences in Path Parameters (Utrecht)
Path βwomen[95%CI] pwomen βmen[95%CI] pmen δBetas t df pdiff
Disempowerment →Radical Nationalism 0.43 [0.31, 0.54] 0.000 0.44 [0.32, 0.55] 0.000 0.01 0.10 473 0.919Disempowerment →Prejudice 0.24 [0.11, 0.37] 0.000 0.2 [0.08, 0.31] 0.001 0.04 0.48 473 0.635Radical Nationalism →Prejudice 0.39 [0.26, 0.52] 0.000 0.39 [0.28, 0.5] 0.000 0.00 0.02 473 0.985Disempowerment →Hate Crime Perceptions 0.01 [-0.15, 0.16] 0.928 0.03 [-0.11, 0.16] 0.708 0.02 0.17 473 0.862Radical Nationalism –>Hate Crime Perceptions 0.13 [-0.04, 0.29] 0.146 0.01 [-0.13, 0.15] 0.855 0.11 1.01 473 0.313Prejudice →Hate Crime Perceptions 0.17 [0.01, 0.33] 0.034 0.21 [0.07, 0.36] 0.004 0.04 0.38 473 0.701
Inspection of the two subgroup analyses indicated that non of the pathways reached our criterion for addinggender as an interaction term (i.e., non-overlapping CIs, statistically significant difference in betas, differencein standardized beta larger than .3). Below we show the full path analysis output when adding gender as asimple control variable.
Run MATRIX procedure:
*************** PROCESS Procedure for SPSS Version 3.3 ******************
Written by Andrew F. Hayes, Ph.D. www.afhayes.comDocumentation available in Hayes (2018). www.guilford.com/p/hayes3
**************************************************************************Model : 6
Y : ZhateX : Zfail
95
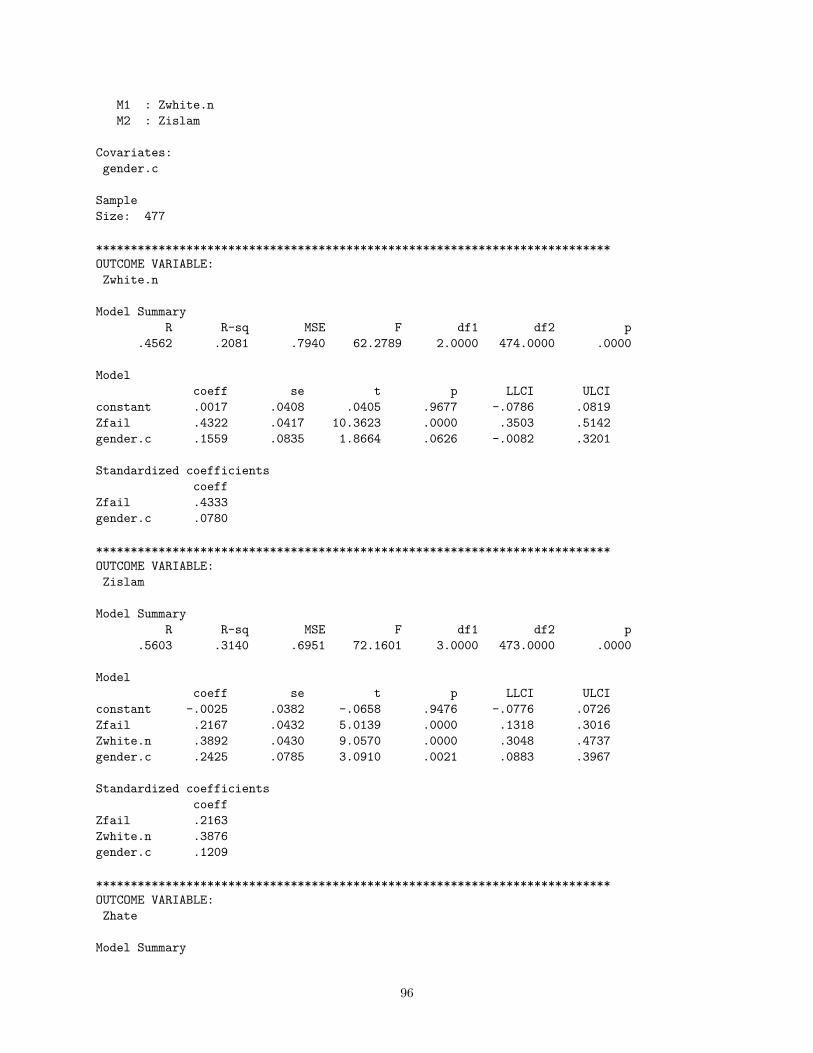
M1 : Zwhite.nM2 : Zislam
Covariates:gender.c
SampleSize: 477
**************************************************************************OUTCOME VARIABLE:Zwhite.n
Model SummaryR R-sq MSE F df1 df2 p
.4562 .2081 .7940 62.2789 2.0000 474.0000 .0000
Modelcoeff se t p LLCI ULCI
constant .0017 .0408 .0405 .9677 -.0786 .0819Zfail .4322 .0417 10.3623 .0000 .3503 .5142gender.c .1559 .0835 1.8664 .0626 -.0082 .3201
Standardized coefficientscoeff
Zfail .4333gender.c .0780
**************************************************************************OUTCOME VARIABLE:Zislam
Model SummaryR R-sq MSE F df1 df2 p
.5603 .3140 .6951 72.1601 3.0000 473.0000 .0000
Modelcoeff se t p LLCI ULCI
constant -.0025 .0382 -.0658 .9476 -.0776 .0726Zfail .2167 .0432 5.0139 .0000 .1318 .3016Zwhite.n .3892 .0430 9.0570 .0000 .3048 .4737gender.c .2425 .0785 3.0910 .0021 .0883 .3967
Standardized coefficientscoeff
Zfail .2163Zwhite.n .3876gender.c .1209
**************************************************************************OUTCOME VARIABLE:Zhate
Model Summary
96
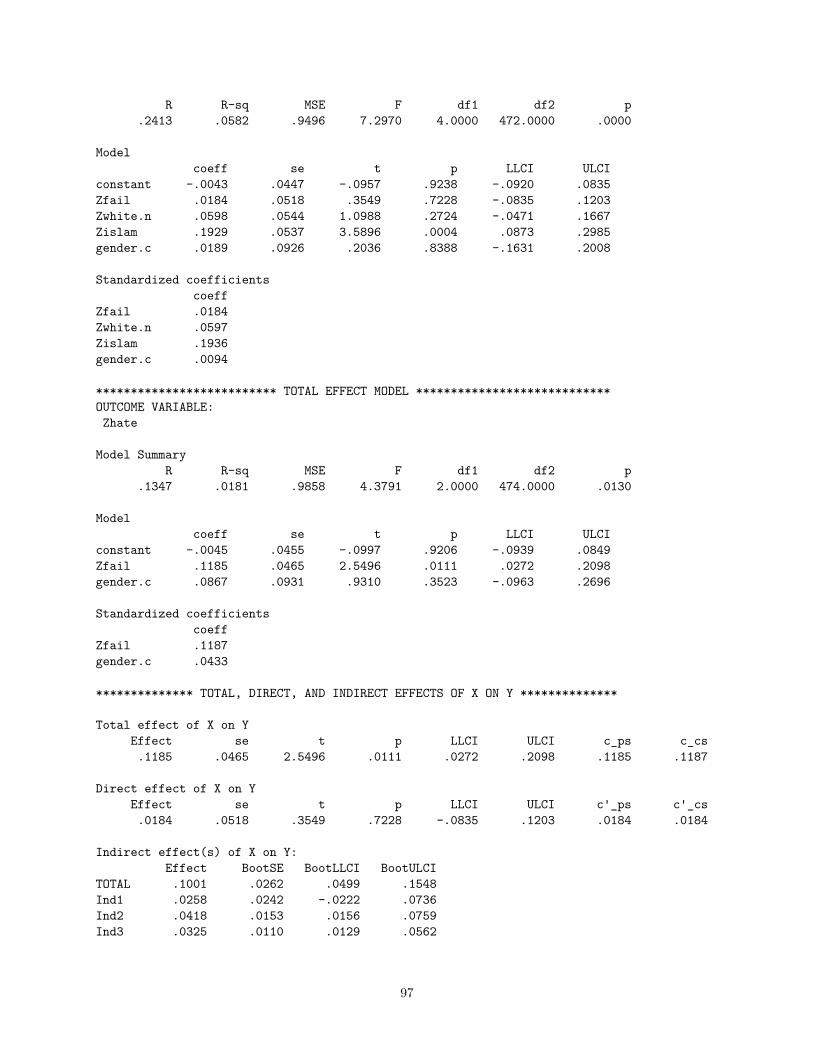
R R-sq MSE F df1 df2 p.2413 .0582 .9496 7.2970 4.0000 472.0000 .0000
Modelcoeff se t p LLCI ULCI
constant -.0043 .0447 -.0957 .9238 -.0920 .0835Zfail .0184 .0518 .3549 .7228 -.0835 .1203Zwhite.n .0598 .0544 1.0988 .2724 -.0471 .1667Zislam .1929 .0537 3.5896 .0004 .0873 .2985gender.c .0189 .0926 .2036 .8388 -.1631 .2008
Standardized coefficientscoeff
Zfail .0184Zwhite.n .0597Zislam .1936gender.c .0094
************************** TOTAL EFFECT MODEL ****************************OUTCOME VARIABLE:Zhate
Model SummaryR R-sq MSE F df1 df2 p
.1347 .0181 .9858 4.3791 2.0000 474.0000 .0130
Modelcoeff se t p LLCI ULCI
constant -.0045 .0455 -.0997 .9206 -.0939 .0849Zfail .1185 .0465 2.5496 .0111 .0272 .2098gender.c .0867 .0931 .9310 .3523 -.0963 .2696
Standardized coefficientscoeff
Zfail .1187gender.c .0433
************** TOTAL, DIRECT, AND INDIRECT EFFECTS OF X ON Y **************
Total effect of X on YEffect se t p LLCI ULCI c_ps c_cs.1185 .0465 2.5496 .0111 .0272 .2098 .1185 .1187
Direct effect of X on YEffect se t p LLCI ULCI c'_ps c'_cs.0184 .0518 .3549 .7228 -.0835 .1203 .0184 .0184
Indirect effect(s) of X on Y:Effect BootSE BootLLCI BootULCI
TOTAL .1001 .0262 .0499 .1548Ind1 .0258 .0242 -.0222 .0736Ind2 .0418 .0153 .0156 .0759Ind3 .0325 .0110 .0129 .0562
97
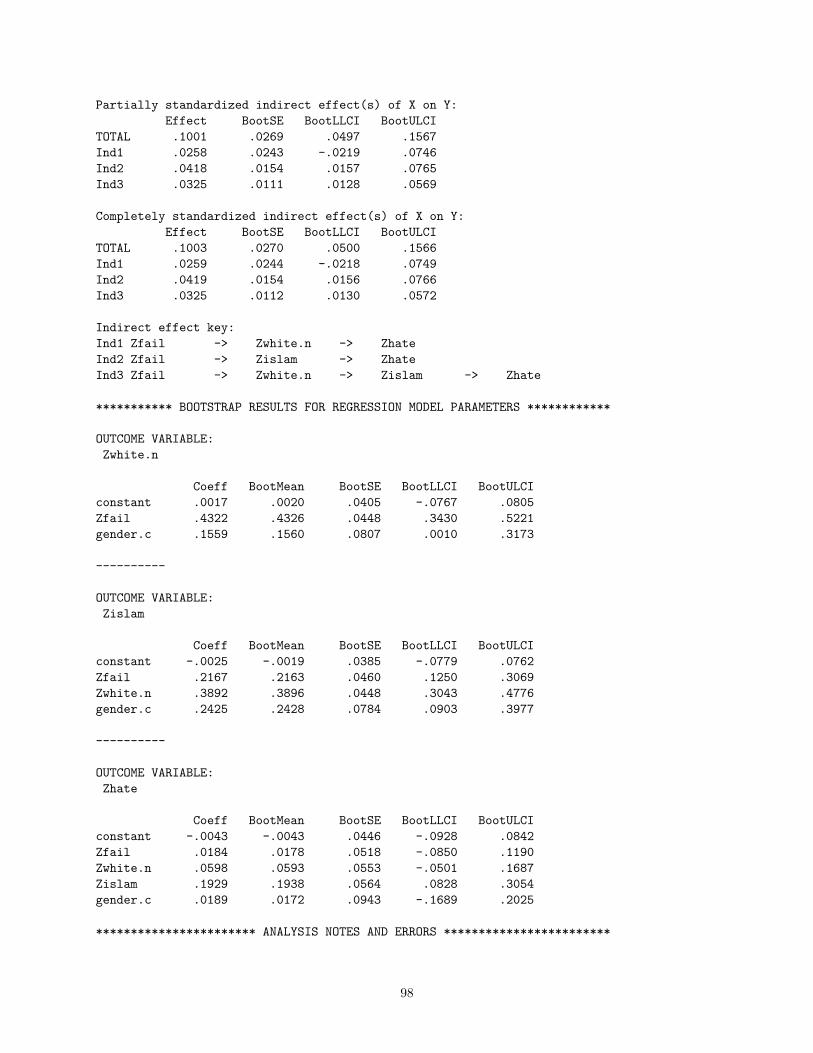
Partially standardized indirect effect(s) of X on Y:Effect BootSE BootLLCI BootULCI
TOTAL .1001 .0269 .0497 .1567Ind1 .0258 .0243 -.0219 .0746Ind2 .0418 .0154 .0157 .0765Ind3 .0325 .0111 .0128 .0569
Completely standardized indirect effect(s) of X on Y:Effect BootSE BootLLCI BootULCI
TOTAL .1003 .0270 .0500 .1566Ind1 .0259 .0244 -.0218 .0749Ind2 .0419 .0154 .0156 .0766Ind3 .0325 .0112 .0130 .0572
Indirect effect key:Ind1 Zfail -> Zwhite.n -> ZhateInd2 Zfail -> Zislam -> ZhateInd3 Zfail -> Zwhite.n -> Zislam -> Zhate
*********** BOOTSTRAP RESULTS FOR REGRESSION MODEL PARAMETERS ************
OUTCOME VARIABLE:Zwhite.n
Coeff BootMean BootSE BootLLCI BootULCIconstant .0017 .0020 .0405 -.0767 .0805Zfail .4322 .4326 .0448 .3430 .5221gender.c .1559 .1560 .0807 .0010 .3173
----------
OUTCOME VARIABLE:Zislam
Coeff BootMean BootSE BootLLCI BootULCIconstant -.0025 -.0019 .0385 -.0779 .0762Zfail .2167 .2163 .0460 .1250 .3069Zwhite.n .3892 .3896 .0448 .3043 .4776gender.c .2425 .2428 .0784 .0903 .3977
----------
OUTCOME VARIABLE:Zhate
Coeff BootMean BootSE BootLLCI BootULCIconstant -.0043 -.0043 .0446 -.0928 .0842Zfail .0184 .0178 .0518 -.0850 .1190Zwhite.n .0598 .0593 .0553 -.0501 .1687Zislam .1929 .1938 .0564 .0828 .3054gender.c .0189 .0172 .0943 -.1689 .2025
*********************** ANALYSIS NOTES AND ERRORS ************************
98
Level of confidence for all confidence intervals in output:95.0000
Number of bootstrap samples for percentile bootstrap confidence intervals:5000
NOTE: Variables names longer than eight characters can produce incorrect output.Shorter variable names are recommended.
------ END MATRIX -----
99
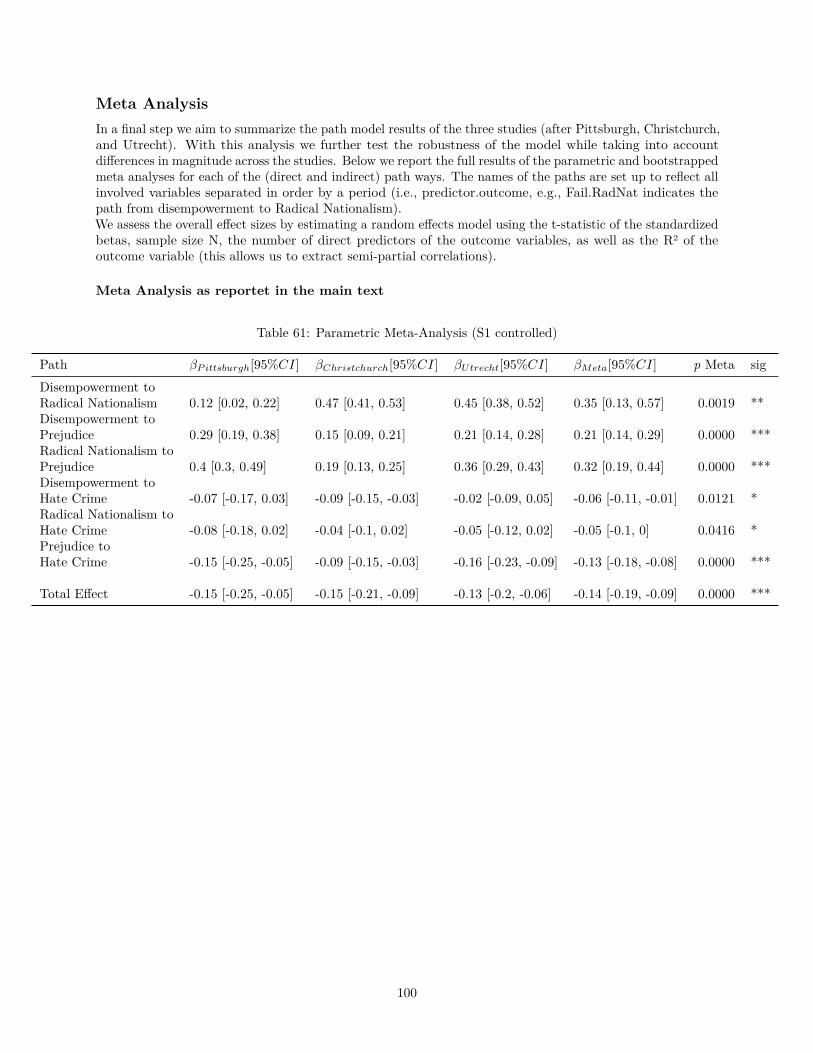
Meta AnalysisIn a final step we aim to summarize the path model results of the three studies (after Pittsburgh, Christchurch,and Utrecht). With this analysis we further test the robustness of the model while taking into accountdifferences in magnitude across the studies. Below we report the full results of the parametric and bootstrappedmeta analyses for each of the (direct and indirect) path ways. The names of the paths are set up to reflect allinvolved variables separated in order by a period (i.e., predictor.outcome, e.g., Fail.RadNat indicates thepath from disempowerment to Radical Nationalism).We assess the overall effect sizes by estimating a random effects model using the t-statistic of the standardizedbetas, sample size N, the number of direct predictors of the outcome variables, as well as the R2 of theoutcome variable (this allows us to extract semi-partial correlations).
Meta Analysis as reportet in the main text
Table 61: Parametric Meta-Analysis (S1 controlled)
Path βP ittsburgh[95%CI] βChristchurch[95%CI] βUtrecht[95%CI] βMeta[95%CI] p Meta sigDisempowerment toRadical Nationalism 0.12 [0.02, 0.22] 0.47 [0.41, 0.53] 0.45 [0.38, 0.52] 0.35 [0.13, 0.57] 0.0019 **Disempowerment toPrejudice 0.29 [0.19, 0.38] 0.15 [0.09, 0.21] 0.21 [0.14, 0.28] 0.21 [0.14, 0.29] 0.0000 ***Radical Nationalism toPrejudice 0.4 [0.3, 0.49] 0.19 [0.13, 0.25] 0.36 [0.29, 0.43] 0.32 [0.19, 0.44] 0.0000 ***Disempowerment toHate Crime -0.07 [-0.17, 0.03] -0.09 [-0.15, -0.03] -0.02 [-0.09, 0.05] -0.06 [-0.11, -0.01] 0.0121 *Radical Nationalism toHate Crime -0.08 [-0.18, 0.02] -0.04 [-0.1, 0.02] -0.05 [-0.12, 0.02] -0.05 [-0.1, 0] 0.0416 *Prejudice toHate Crime -0.15 [-0.25, -0.05] -0.09 [-0.15, -0.03] -0.16 [-0.23, -0.09] -0.13 [-0.18, -0.08] 0.0000 ***
Total Effect -0.15 [-0.25, -0.05] -0.15 [-0.21, -0.09] -0.13 [-0.2, -0.06] -0.14 [-0.19, -0.09] 0.0000 ***
100
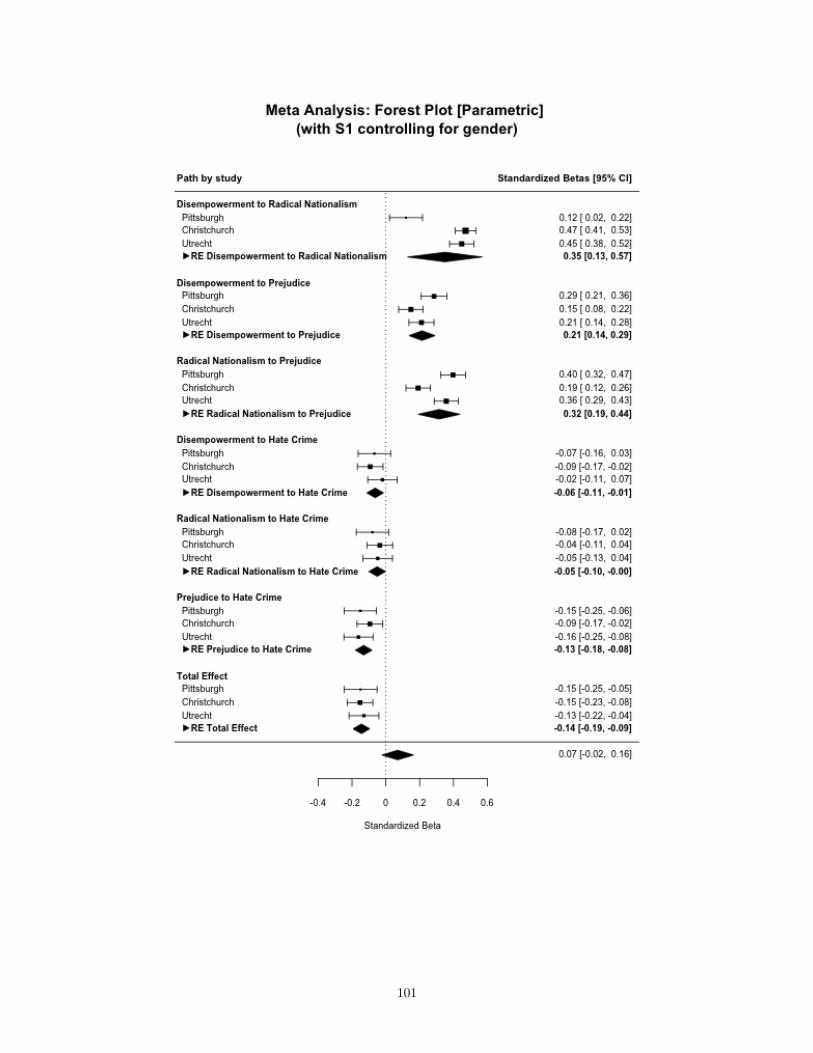
101

Table 62: Bootstrapped Meta-Analysis (S1 controlled)
Path βP ittsburgh[95%CI] βChristchurch[95%CI] βUtrecht[95%CI] βMeta[95%CI] p Meta sigDisempowerment toRadical Nationalism 0.12 [0.02, 0.22] 0.47 [0.39, 0.55] 0.45 [0.36, 0.53] 0.35 [0.13, 0.57] 0.0019 **Disempowerment toPrejudice 0.29 [0.19, 0.39] 0.17 [0.09, 0.25] 0.24 [0.15, 0.32] 0.23 [0.16, 0.3] 0.0000 ***Radical Nationalism toPrejudice 0.41 [0.30, 0.51] 0.22 [0.14, 0.30] 0.4 [0.32, 0.49] 0.34 [0.22, 0.46] 0.0000 ***Disempowerment toHate Crime -0.07 [-0.18, 0.03] -0.11 [-0.19, -0.03] -0.02 [-0.11, 0.06] -0.07 [-0.12, -0.02] 0.0095 **Radical Nationalism toHate Crime -0.09 [-0.19, 0.01] -0.04 [-0.12, 0.04] -0.06 [-0.14, 0.03] -0.06 [-0.12, 0.00] 0.0339 *Prejudice toHate Crime -0.2 [-0.30, -0.09] -0.1 [-0.18, -0.02] -0.19 [-0.28, -0.11] -0.15 [-0.22, -0.09] 0.0000 ***
Indirect 1 -0.01 [-0.11, 0.09] -0.02 [-0.1, 0.06] -0.03 [-0.11, 0.06] -0.01 [-0.03, 0.00] 0.0667
Indirect 2 -0.06 [-0.16, 0.05] -0.02 [-0.10, 0.06] -0.05 [-0.13, 0.04] -0.03 [-0.06, -0.01] 0.0067 **
SecondaryIndirect -0.01 [-0.11, 0.09] -0.01 [-0.09, 0.07] -0.03 [-0.12, 0.05] -0.01 [-0.03, 0.00] 0.0148 *Note.Indirect 1: Disempowerment to Radical Nationalism to Hate CrimeIndirect 2: Disempowerment to Prejudice to Hate CrimeSecondary Indirect: Disempowerment to Radical Nationalism to Prejudice to Hate Crime
102

103
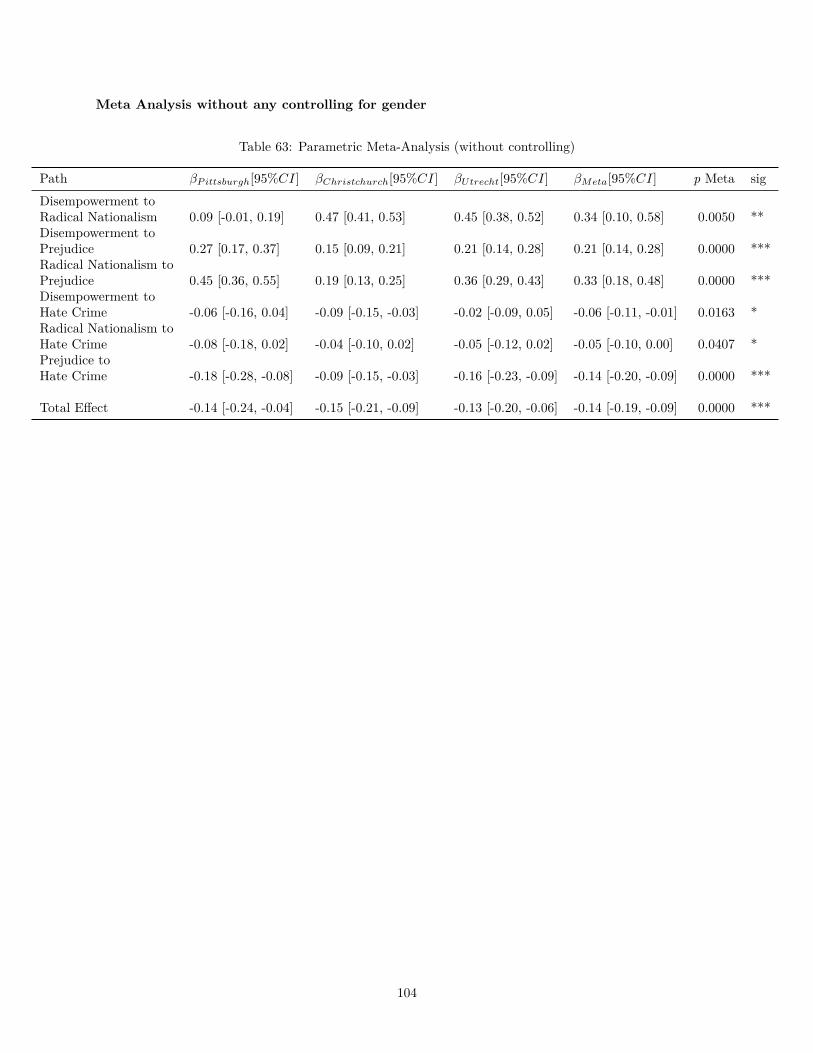
Meta Analysis without any controlling for gender
Table 63: Parametric Meta-Analysis (without controlling)
Path βP ittsburgh[95%CI] βChristchurch[95%CI] βUtrecht[95%CI] βMeta[95%CI] p Meta sigDisempowerment toRadical Nationalism 0.09 [-0.01, 0.19] 0.47 [0.41, 0.53] 0.45 [0.38, 0.52] 0.34 [0.10, 0.58] 0.0050 **Disempowerment toPrejudice 0.27 [0.17, 0.37] 0.15 [0.09, 0.21] 0.21 [0.14, 0.28] 0.21 [0.14, 0.28] 0.0000 ***Radical Nationalism toPrejudice 0.45 [0.36, 0.55] 0.19 [0.13, 0.25] 0.36 [0.29, 0.43] 0.33 [0.18, 0.48] 0.0000 ***Disempowerment toHate Crime -0.06 [-0.16, 0.04] -0.09 [-0.15, -0.03] -0.02 [-0.09, 0.05] -0.06 [-0.11, -0.01] 0.0163 *Radical Nationalism toHate Crime -0.08 [-0.18, 0.02] -0.04 [-0.10, 0.02] -0.05 [-0.12, 0.02] -0.05 [-0.10, 0.00] 0.0407 *Prejudice toHate Crime -0.18 [-0.28, -0.08] -0.09 [-0.15, -0.03] -0.16 [-0.23, -0.09] -0.14 [-0.20, -0.09] 0.0000 ***
Total Effect -0.14 [-0.24, -0.04] -0.15 [-0.21, -0.09] -0.13 [-0.20, -0.06] -0.14 [-0.19, -0.09] 0.0000 ***
104
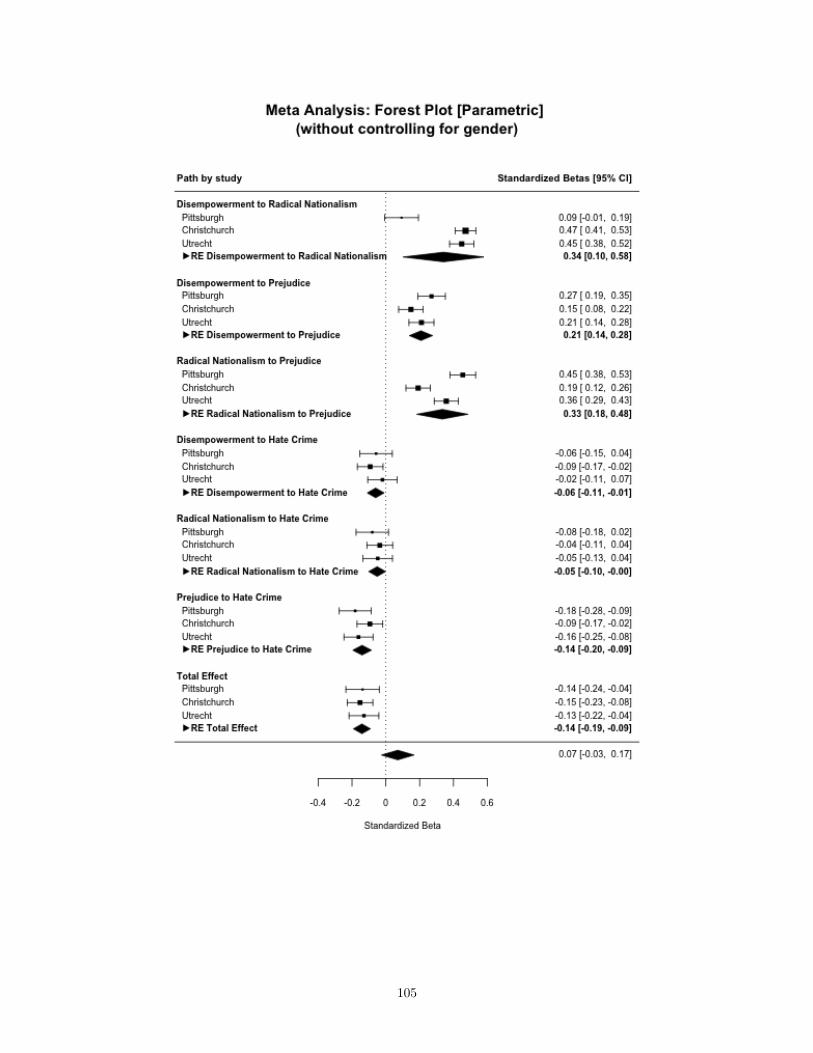
105
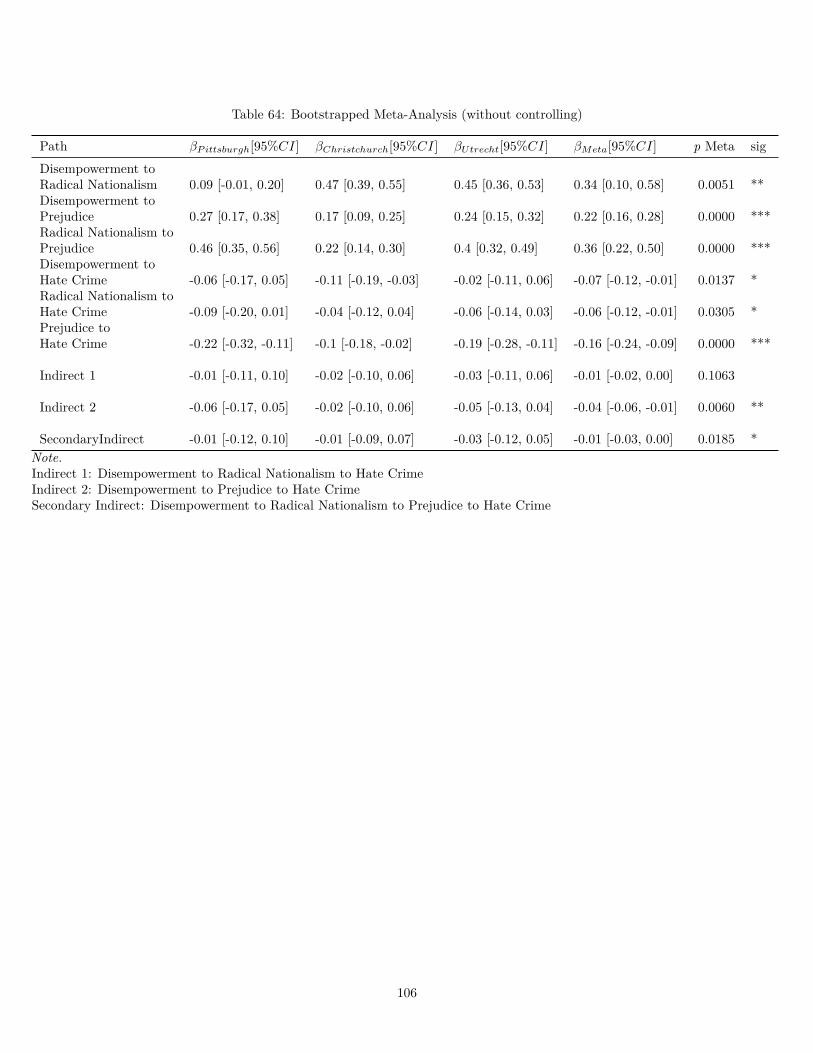
Table 64: Bootstrapped Meta-Analysis (without controlling)
Path βP ittsburgh[95%CI] βChristchurch[95%CI] βUtrecht[95%CI] βMeta[95%CI] p Meta sigDisempowerment toRadical Nationalism 0.09 [-0.01, 0.20] 0.47 [0.39, 0.55] 0.45 [0.36, 0.53] 0.34 [0.10, 0.58] 0.0051 **Disempowerment toPrejudice 0.27 [0.17, 0.38] 0.17 [0.09, 0.25] 0.24 [0.15, 0.32] 0.22 [0.16, 0.28] 0.0000 ***Radical Nationalism toPrejudice 0.46 [0.35, 0.56] 0.22 [0.14, 0.30] 0.4 [0.32, 0.49] 0.36 [0.22, 0.50] 0.0000 ***Disempowerment toHate Crime -0.06 [-0.17, 0.05] -0.11 [-0.19, -0.03] -0.02 [-0.11, 0.06] -0.07 [-0.12, -0.01] 0.0137 *Radical Nationalism toHate Crime -0.09 [-0.20, 0.01] -0.04 [-0.12, 0.04] -0.06 [-0.14, 0.03] -0.06 [-0.12, -0.01] 0.0305 *Prejudice toHate Crime -0.22 [-0.32, -0.11] -0.1 [-0.18, -0.02] -0.19 [-0.28, -0.11] -0.16 [-0.24, -0.09] 0.0000 ***
Indirect 1 -0.01 [-0.11, 0.10] -0.02 [-0.10, 0.06] -0.03 [-0.11, 0.06] -0.01 [-0.02, 0.00] 0.1063
Indirect 2 -0.06 [-0.17, 0.05] -0.02 [-0.10, 0.06] -0.05 [-0.13, 0.04] -0.04 [-0.06, -0.01] 0.0060 **
SecondaryIndirect -0.01 [-0.12, 0.10] -0.01 [-0.09, 0.07] -0.03 [-0.12, 0.05] -0.01 [-0.03, 0.00] 0.0185 *Note.Indirect 1: Disempowerment to Radical Nationalism to Hate CrimeIndirect 2: Disempowerment to Prejudice to Hate CrimeSecondary Indirect: Disempowerment to Radical Nationalism to Prejudice to Hate Crime
106
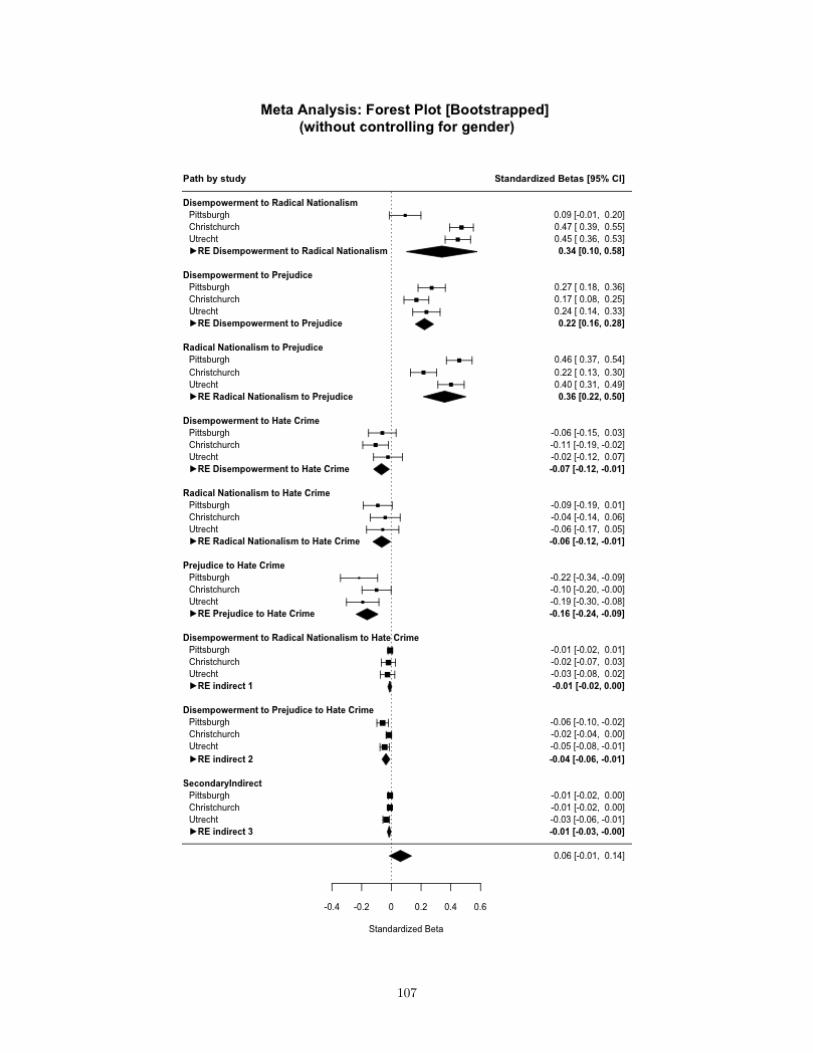
107
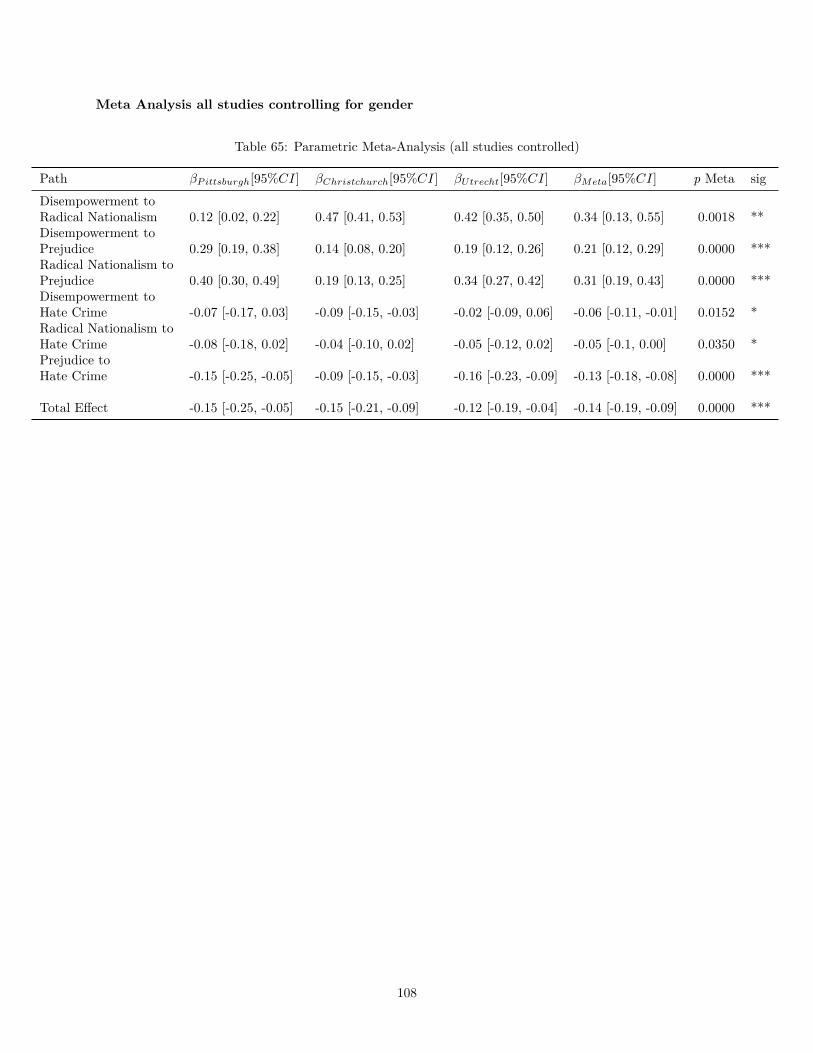
Meta Analysis all studies controlling for gender
Table 65: Parametric Meta-Analysis (all studies controlled)
Path βP ittsburgh[95%CI] βChristchurch[95%CI] βUtrecht[95%CI] βMeta[95%CI] p Meta sigDisempowerment toRadical Nationalism 0.12 [0.02, 0.22] 0.47 [0.41, 0.53] 0.42 [0.35, 0.50] 0.34 [0.13, 0.55] 0.0018 **Disempowerment toPrejudice 0.29 [0.19, 0.38] 0.14 [0.08, 0.20] 0.19 [0.12, 0.26] 0.21 [0.12, 0.29] 0.0000 ***Radical Nationalism toPrejudice 0.40 [0.30, 0.49] 0.19 [0.13, 0.25] 0.34 [0.27, 0.42] 0.31 [0.19, 0.43] 0.0000 ***Disempowerment toHate Crime -0.07 [-0.17, 0.03] -0.09 [-0.15, -0.03] -0.02 [-0.09, 0.06] -0.06 [-0.11, -0.01] 0.0152 *Radical Nationalism toHate Crime -0.08 [-0.18, 0.02] -0.04 [-0.10, 0.02] -0.05 [-0.12, 0.02] -0.05 [-0.1, 0.00] 0.0350 *Prejudice toHate Crime -0.15 [-0.25, -0.05] -0.09 [-0.15, -0.03] -0.16 [-0.23, -0.09] -0.13 [-0.18, -0.08] 0.0000 ***
Total Effect -0.15 [-0.25, -0.05] -0.15 [-0.21, -0.09] -0.12 [-0.19, -0.04] -0.14 [-0.19, -0.09] 0.0000 ***
108
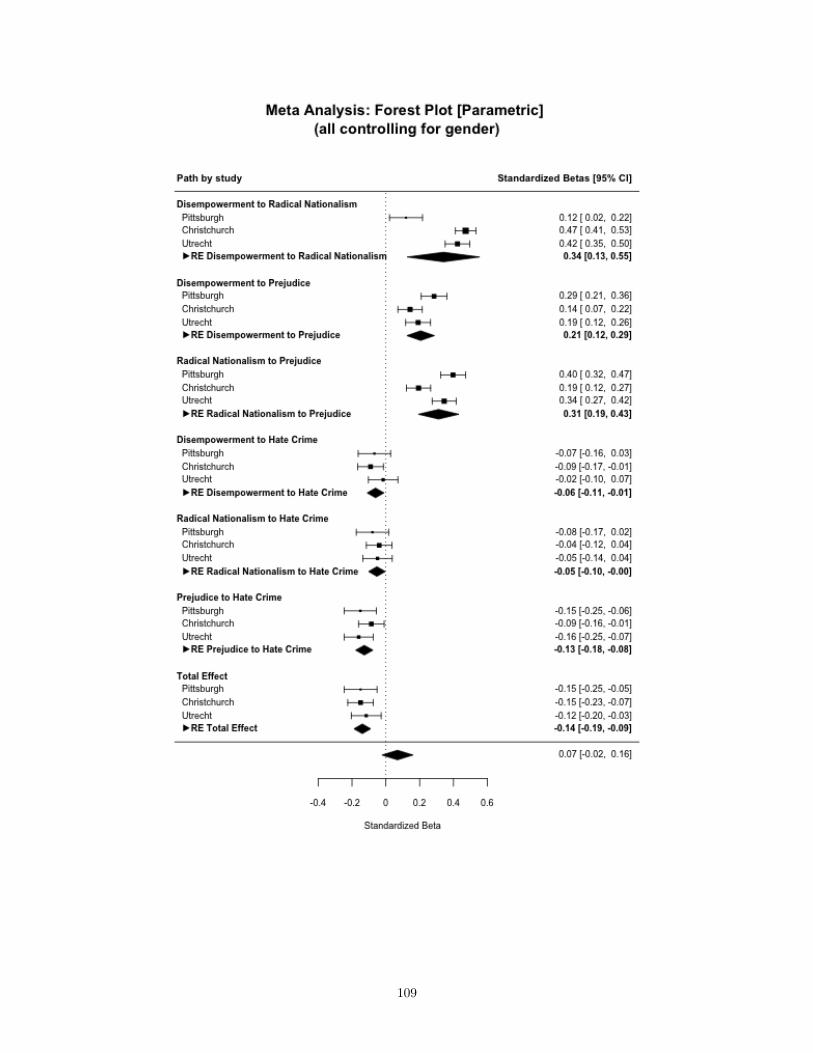
109

Table 66: Bootstrapped Meta-Analysis (all studies controlled)
Path βP ittsburgh[95%CI] βChristchurch[95%CI] βUtrecht[95%CI] βMeta[95%CI] p Meta sigDisempowerment toRadical Nationalism 0.12 [0.02, 0.22] 0.47 [0.39, 0.55] 0.43 [0.34, 0.52] 0.34 [0.13, 0.56] 0.0018 **Disempowerment toPrejudice 0.29 [0.19, 0.39] 0.16 [0.08, 0.24] 0.22 [0.13, 0.30] 0.22 [0.15, 0.30] 0.0000 ***Radical Nationalism toPrejudice 0.41 [0.3, 0.51] 0.22 [0.14, 0.3] 0.39 [0.30, 0.48] 0.34 [0.22, 0.46] 0.0000 ***Disempowerment toHate Crime -0.07 [-0.18, 0.03] -0.1 [-0.18, -0.02] -0.02 [-0.11, 0.07] -0.07 [-0.12, -0.02] 0.0111 *Radical Nationalism toHate Crime -0.09 [-0.19, 0.01] -0.05 [-0.12, 0.03] -0.06 [-0.15, 0.03] -0.07 [-0.13, -0.01] 0.0293 *Prejudice toHate Crime -0.20 [-0.30, -0.09] -0.09 [-0.17, -0.01] -0.19 [-0.28, -0.11] -0.15 [-0.23, -0.08] 0.0001 ***
Indirect 1 -0.01 [-0.11, 0.09] -0.02 [-0.10, 0.06] -0.03 [-0.11, 0.06] -0.01 [-0.03, 0.00] 0.0625
Indirect 2 -0.06 [-0.16, 0.05] -0.01 [-0.09, 0.06] -0.04 [-0.13, 0.05] -0.03 [-0.06, -0.01] 0.0104 *
Secondary Indirect -0.01 [-0.11, 0.09] -0.01 [-0.09, 0.07] -0.03 [-0.12, 0.06] -0.01 [-0.02, 0.00] 0.0116 *Note.Indirect 1: Disempowerment to Radical Nationalism to Hate CrimeIndirect 2: Disempowerment to Prejudice to Hate CrimeSecondary Indirect: Disempowerment to Radical Nationalism to Prejudice to Hate Crime
110
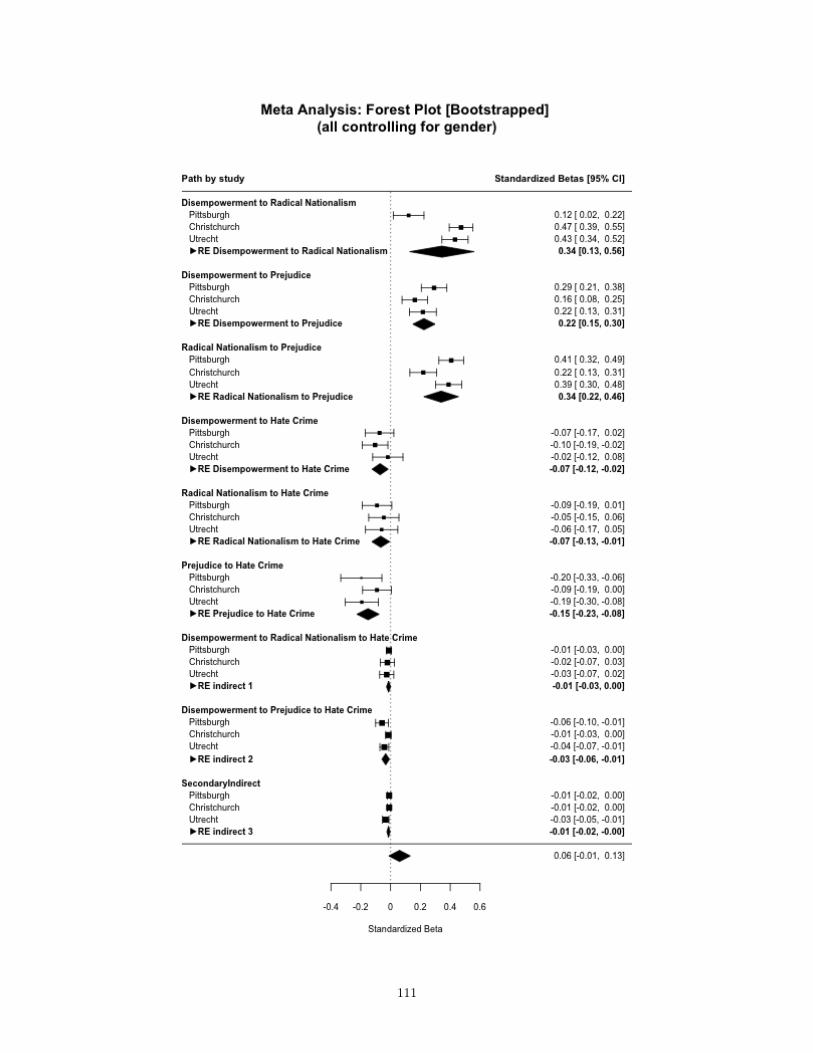
111
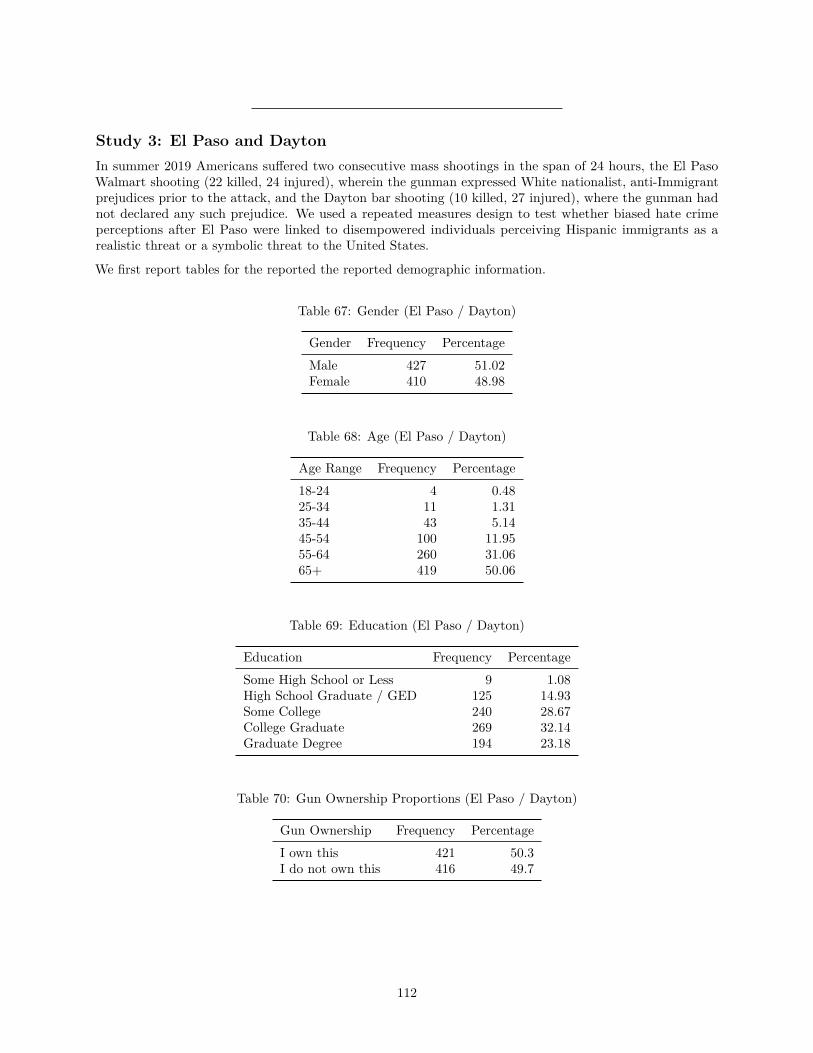
Study 3: El Paso and DaytonIn summer 2019 Americans suffered two consecutive mass shootings in the span of 24 hours, the El PasoWalmart shooting (22 killed, 24 injured), wherein the gunman expressed White nationalist, anti-Immigrantprejudices prior to the attack, and the Dayton bar shooting (10 killed, 27 injured), where the gunman hadnot declared any such prejudice. We used a repeated measures design to test whether biased hate crimeperceptions after El Paso were linked to disempowered individuals perceiving Hispanic immigrants as arealistic threat or a symbolic threat to the United States.
We first report tables for the reported the reported demographic information.
Table 67: Gender (El Paso / Dayton)
Gender Frequency PercentageMale 427 51.02Female 410 48.98
Table 68: Age (El Paso / Dayton)
Age Range Frequency Percentage18-24 4 0.4825-34 11 1.3135-44 43 5.1445-54 100 11.9555-64 260 31.0665+ 419 50.06
Table 69: Education (El Paso / Dayton)
Education Frequency PercentageSome High School or Less 9 1.08High School Graduate / GED 125 14.93Some College 240 28.67College Graduate 269 32.14Graduate Degree 194 23.18
Table 70: Gun Ownership Proportions (El Paso / Dayton)
Gun Ownership Frequency PercentageI own this 421 50.3I do not own this 416 49.7
112
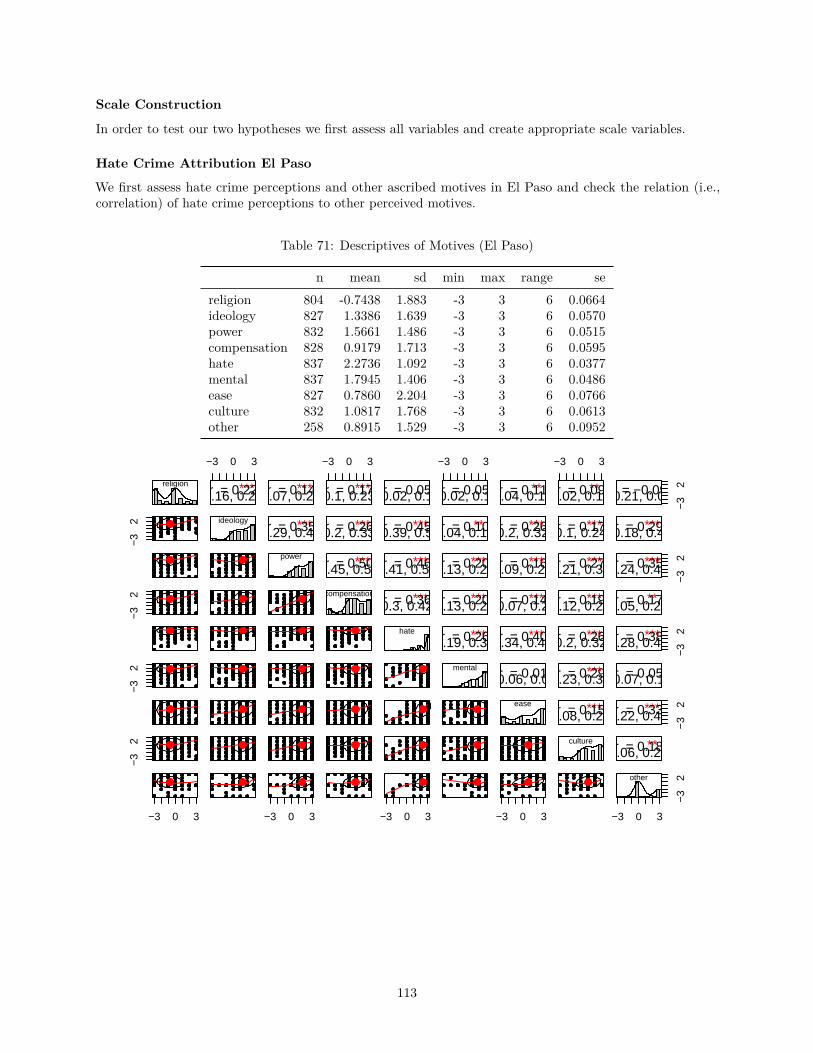
Scale Construction
In order to test our two hypotheses we first assess all variables and create appropriate scale variables.
Hate Crime Attribution El Paso
We first assess hate crime perceptions and other ascribed motives in El Paso and check the relation (i.e.,correlation) of hate crime perceptions to other perceived motives.
Table 71: Descriptives of Motives (El Paso)
n mean sd min max range sereligion 804 -0.7438 1.883 -3 3 6 0.0664ideology 827 1.3386 1.639 -3 3 6 0.0570power 832 1.5661 1.486 -3 3 6 0.0515compensation 828 0.9179 1.713 -3 3 6 0.0595hate 837 2.2736 1.092 -3 3 6 0.0377mental 837 1.7945 1.406 -3 3 6 0.0486ease 827 0.7860 2.204 -3 3 6 0.0766culture 832 1.0817 1.768 -3 3 6 0.0613other 258 0.8915 1.529 -3 3 6 0.0952
religion
−3
2−
32
−3
2−
32
−3 0 3
−3 0 3
***r = 0.22[0.16, 0.29]
ideology
***r = 0.14[0.07, 0.21]
***r = 0.35[0.29, 0.41]
power
−3 0 3
−3 0 3
***r = 0.17[0.1, 0.23]
***r = 0.26[0.2, 0.33]
***r = 0.50[0.45, 0.55]
compensation
r = 0.05[−0.02, 0.12]
***r = 0.45[0.39, 0.5]
***r = 0.46[0.41, 0.51]
***r = 0.36[0.3, 0.42]
hate
−3 0 3
−3 0 3
r = 0.05[−0.02, 0.12]
**r = 0.10[0.04, 0.17]
***r = 0.20[0.13, 0.27]
***r = 0.20[0.13, 0.26]
***r = 0.26[0.19, 0.32]
mental
**r = 0.11[0.04, 0.18]
***r = 0.26[0.2, 0.32]
***r = 0.16[0.09, 0.22]
***r = 0.14[0.07, 0.2]
***r = 0.40[0.34, 0.45]
r = 0.01[−0.06, 0.08]
ease
−3 0 3
−3 0 3
**r = 0.09[0.02, 0.16]
***r = 0.17[0.1, 0.24]
***r = 0.27[0.21, 0.33]
***r = 0.19[0.12, 0.25]
***r = 0.26[0.2, 0.32]
***r = 0.29[0.23, 0.35]
***r = 0.15[0.08, 0.21]
culture
−3
2 r = −0.09[−0.21, 0.03]
***r = 0.29[0.18, 0.4]
−3
2***r = 0.35[0.24, 0.45]
**r = 0.17[0.05, 0.28]
−3
2***r = 0.38[0.28, 0.48]
r = 0.05[−0.07, 0.17]
−3
2***r = 0.33[0.22, 0.44]
**r = 0.18[0.06, 0.29]
−3 0 3
−3
2other
113
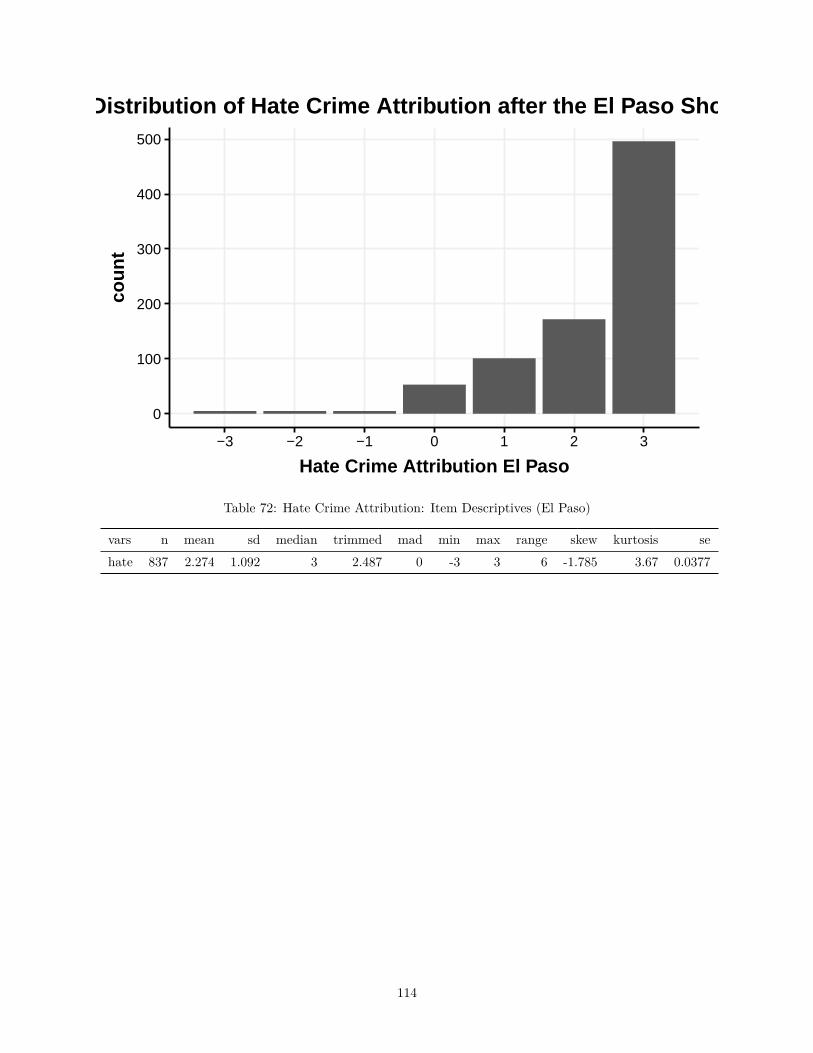
0
100
200
300
400
500
−3 −2 −1 0 1 2 3
Hate Crime Attribution El Paso
coun
tDistribution of Hate Crime Attribution after the El Paso Shooting
Table 72: Hate Crime Attribution: Item Descriptives (El Paso)
vars n mean sd median trimmed mad min max range skew kurtosis sehate 837 2.274 1.092 3 2.487 0 -3 3 6 -1.785 3.67 0.0377
114
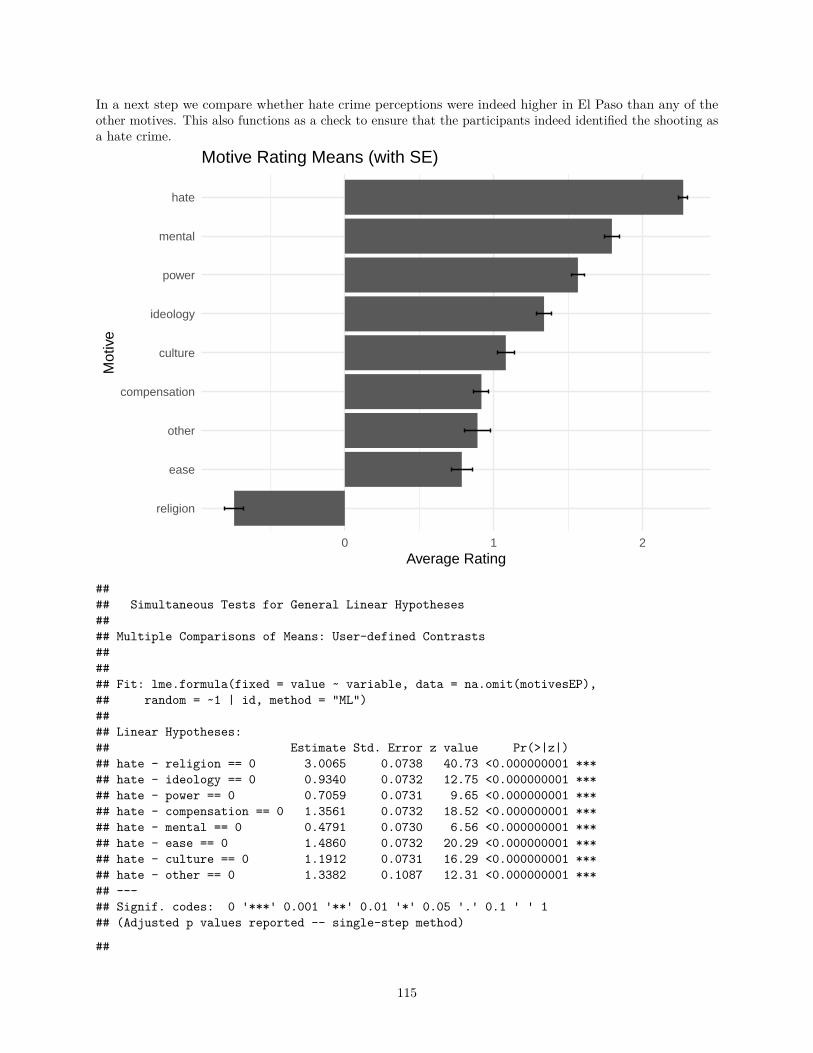
In a next step we compare whether hate crime perceptions were indeed higher in El Paso than any of theother motives. This also functions as a check to ensure that the participants indeed identified the shooting asa hate crime.
religion
ease
other
compensation
culture
ideology
power
mental
hate
0 1 2Average Rating
Mot
ive
Motive Rating Means (with SE)
#### Simultaneous Tests for General Linear Hypotheses#### Multiple Comparisons of Means: User-defined Contrasts###### Fit: lme.formula(fixed = value ~ variable, data = na.omit(motivesEP),## random = ~1 | id, method = "ML")#### Linear Hypotheses:## Estimate Std. Error z value Pr(>|z|)## hate - religion == 0 3.0065 0.0738 40.73 <0.000000001 ***## hate - ideology == 0 0.9340 0.0732 12.75 <0.000000001 ***## hate - power == 0 0.7059 0.0731 9.65 <0.000000001 ***## hate - compensation == 0 1.3561 0.0732 18.52 <0.000000001 ***## hate - mental == 0 0.4791 0.0730 6.56 <0.000000001 ***## hate - ease == 0 1.4860 0.0732 20.29 <0.000000001 ***## hate - culture == 0 1.1912 0.0731 16.29 <0.000000001 ***## hate - other == 0 1.3382 0.1087 12.31 <0.000000001 ***## ---## Signif. codes: 0 '***' 0.001 '**' 0.01 '*' 0.05 '.' 0.1 ' ' 1## (Adjusted p values reported -- single-step method)
##
115

## Simultaneous Confidence Intervals#### Multiple Comparisons of Means: User-defined Contrasts###### Fit: lme.formula(fixed = value ~ variable, data = na.omit(motivesEP),## random = ~1 | id, method = "ML")#### Quantile = 2.664## 95% family-wise confidence level###### Linear Hypotheses:## Estimate lwr upr## hate - religion == 0 3.006 2.810 3.203## hate - ideology == 0 0.934 0.739 1.129## hate - power == 0 0.706 0.511 0.901## hate - compensation == 0 1.356 1.161 1.551## hate - mental == 0 0.479 0.285 0.674## hate - ease == 0 1.486 1.291 1.681## hate - culture == 0 1.191 0.996 1.386## hate - other == 0 1.338 1.049 1.628
The results suggest that hate crime perceptions were indeed higher than any of the other motive perceptions(even, after controlling for the multiple tests).
116
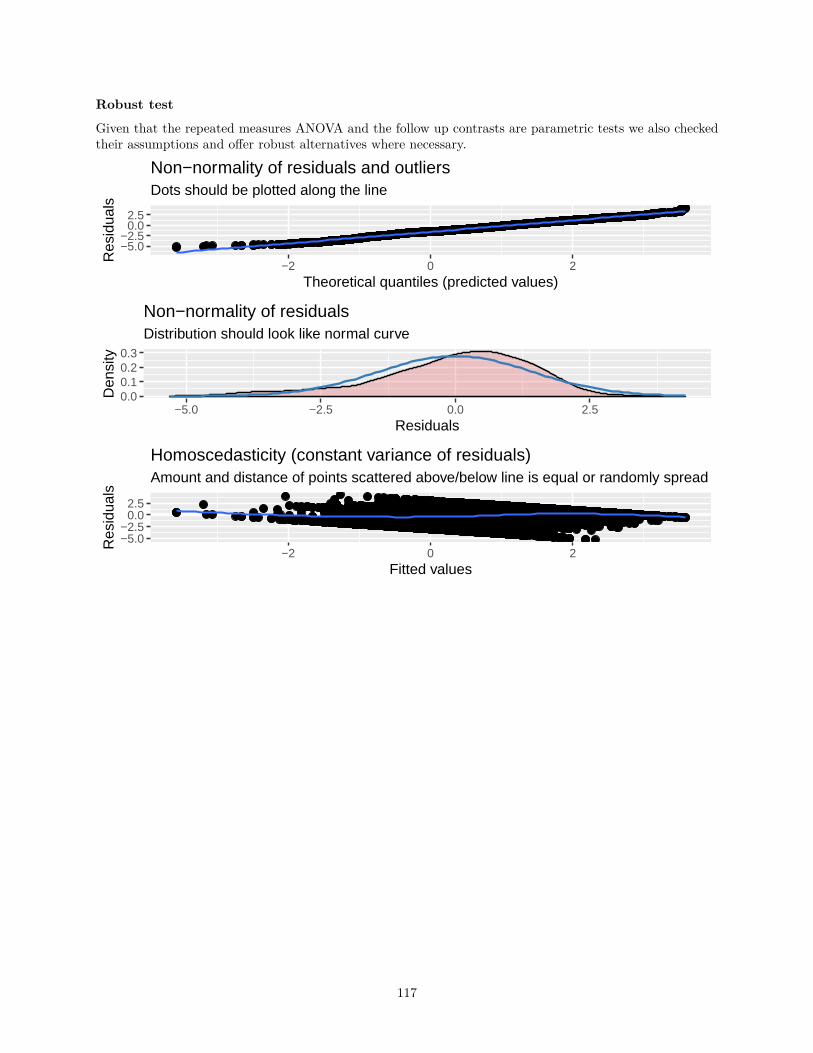
Robust test
Given that the repeated measures ANOVA and the follow up contrasts are parametric tests we also checkedtheir assumptions and offer robust alternatives where necessary.
−5.0−2.5
0.02.5
−2 0 2Theoretical quantiles (predicted values)
Res
idua
ls
Dots should be plotted along the line
Non−normality of residuals and outliers
0.00.10.20.3
−5.0 −2.5 0.0 2.5Residuals
Den
sity
Distribution should look like normal curve
Non−normality of residuals
−5.0−2.5
0.02.5
−2 0 2Fitted values
Res
idua
ls
Amount and distance of points scattered above/below line is equal or randomly spread
Homoscedasticity (constant variance of residuals)
117
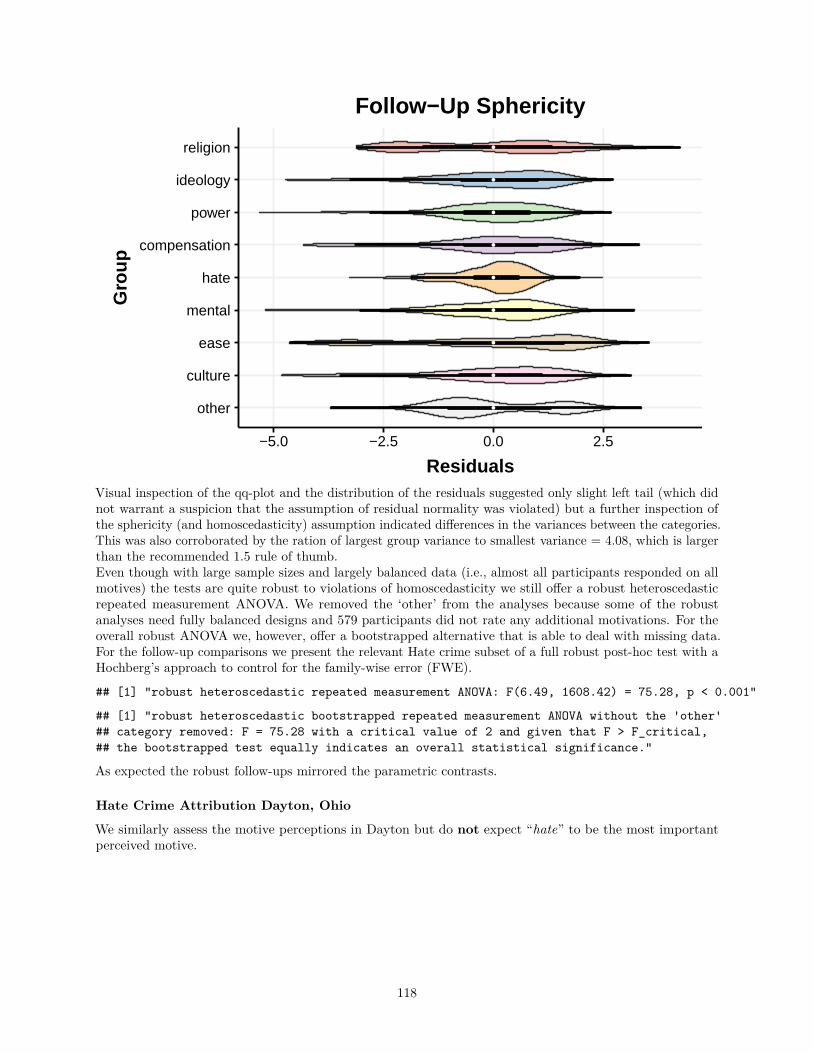
other
culture
ease
mental
hate
compensation
power
ideology
religion
−5.0 −2.5 0.0 2.5
Residuals
Gro
upFollow−Up Sphericity
Visual inspection of the qq-plot and the distribution of the residuals suggested only slight left tail (which didnot warrant a suspicion that the assumption of residual normality was violated) but a further inspection ofthe sphericity (and homoscedasticity) assumption indicated differences in the variances between the categories.This was also corroborated by the ration of largest group variance to smallest variance = 4.08, which is largerthan the recommended 1.5 rule of thumb.Even though with large sample sizes and largely balanced data (i.e., almost all participants responded on allmotives) the tests are quite robust to violations of homoscedasticity we still offer a robust heteroscedasticrepeated measurement ANOVA. We removed the ‘other’ from the analyses because some of the robustanalyses need fully balanced designs and 579 participants did not rate any additional motivations. For theoverall robust ANOVA we, however, offer a bootstrapped alternative that is able to deal with missing data.For the follow-up comparisons we present the relevant Hate crime subset of a full robust post-hoc test with aHochberg’s approach to control for the family-wise error (FWE).
## [1] "robust heteroscedastic repeated measurement ANOVA: F(6.49, 1608.42) = 75.28, p < 0.001"
## [1] "robust heteroscedastic bootstrapped repeated measurement ANOVA without the 'other'## category removed: F = 75.28 with a critical value of 2 and given that F > F_critical,## the bootstrapped test equally indicates an overall statistical significance."
As expected the robust follow-ups mirrored the parametric contrasts.
Hate Crime Attribution Dayton, Ohio
We similarly assess the motive perceptions in Dayton but do not expect “hate” to be the most importantperceived motive.
118
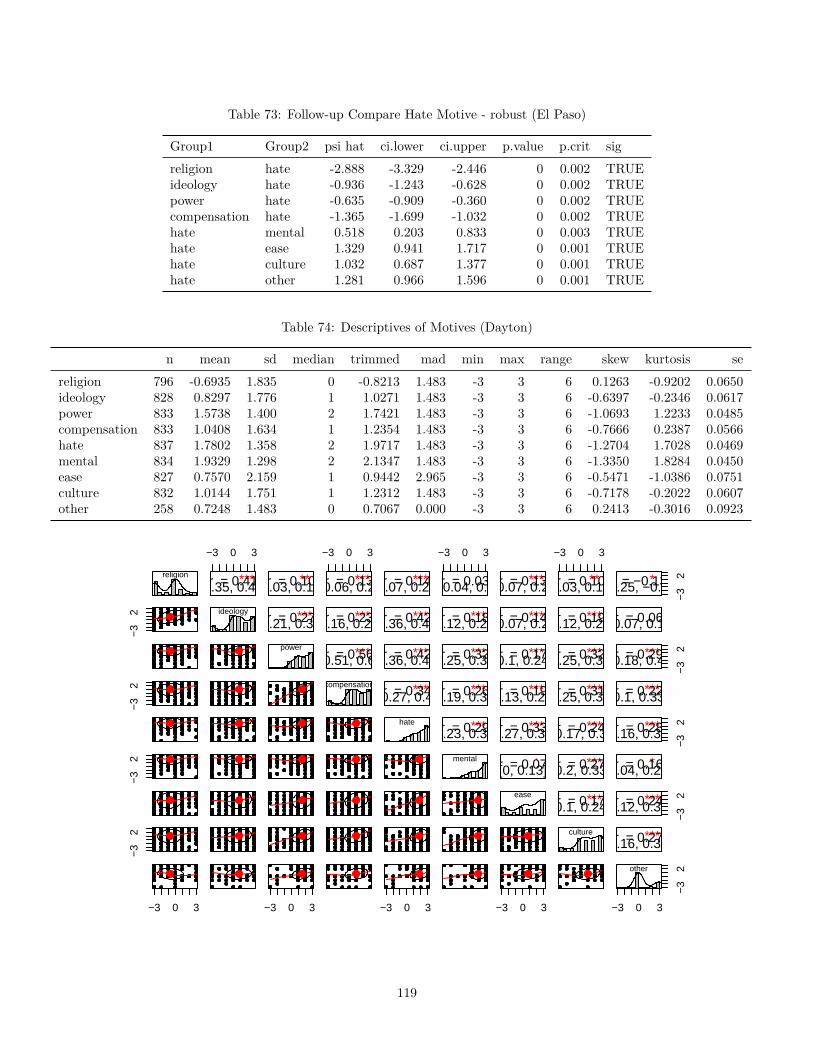
Table 73: Follow-up Compare Hate Motive - robust (El Paso)
Group1 Group2 psi hat ci.lower ci.upper p.value p.crit sigreligion hate -2.888 -3.329 -2.446 0 0.002 TRUEideology hate -0.936 -1.243 -0.628 0 0.002 TRUEpower hate -0.635 -0.909 -0.360 0 0.002 TRUEcompensation hate -1.365 -1.699 -1.032 0 0.002 TRUEhate mental 0.518 0.203 0.833 0 0.003 TRUEhate ease 1.329 0.941 1.717 0 0.001 TRUEhate culture 1.032 0.687 1.377 0 0.001 TRUEhate other 1.281 0.966 1.596 0 0.001 TRUE
Table 74: Descriptives of Motives (Dayton)
n mean sd median trimmed mad min max range skew kurtosis sereligion 796 -0.6935 1.835 0 -0.8213 1.483 -3 3 6 0.1263 -0.9202 0.0650ideology 828 0.8297 1.776 1 1.0271 1.483 -3 3 6 -0.6397 -0.2346 0.0617power 833 1.5738 1.400 2 1.7421 1.483 -3 3 6 -1.0693 1.2233 0.0485compensation 833 1.0408 1.634 1 1.2354 1.483 -3 3 6 -0.7666 0.2387 0.0566hate 837 1.7802 1.358 2 1.9717 1.483 -3 3 6 -1.2704 1.7028 0.0469mental 834 1.9329 1.298 2 2.1347 1.483 -3 3 6 -1.3350 1.8284 0.0450ease 827 0.7570 2.159 1 0.9442 2.965 -3 3 6 -0.5471 -1.0386 0.0751culture 832 1.0144 1.751 1 1.2312 1.483 -3 3 6 -0.7178 -0.2022 0.0607other 258 0.7248 1.483 0 0.7067 0.000 -3 3 6 0.2413 -0.3016 0.0923
religion
−3
2−
32
−3
2−
32
−3 0 3
−3 0 3
***r = 0.41[0.35, 0.47]
ideology
**r = 0.10[0.03, 0.17]
***r = 0.27[0.21, 0.34]
power
−3 0 3
−3 0 3
***r = 0.13[0.06, 0.2]
***r = 0.23[0.16, 0.29]
***r = 0.56[0.51, 0.6]
compensation
***r = 0.14[0.07, 0.21]
***r = 0.42[0.36, 0.47]
***r = 0.42[0.36, 0.47]
***r = 0.34[0.27, 0.4]
hate
−3 0 3
−3 0 3
r = 0.03[−0.04, 0.1]
***r = 0.18[0.12, 0.25]
***r = 0.32[0.25, 0.38]
***r = 0.26[0.19, 0.32]
***r = 0.29[0.23, 0.35]
mental
***r = 0.13[0.07, 0.2]
***r = 0.14[0.07, 0.2]
***r = 0.17[0.1, 0.24]
***r = 0.19[0.13, 0.26]
***r = 0.33[0.27, 0.39]
.r = 0.07[0, 0.13]
ease
−3 0 3
−3 0 3
**r = 0.10[0.03, 0.17]
***r = 0.19[0.12, 0.25]
***r = 0.32[0.25, 0.38]
***r = 0.31[0.25, 0.37]
***r = 0.24[0.17, 0.3]
***r = 0.27[0.2, 0.33]
***r = 0.17[0.1, 0.24]
culture
−3
2*r = −0.13[−0.25, −0.01]
r = 0.06[−0.07, 0.18]
−3
2***r = 0.29[0.18, 0.4]
***r = 0.22[0.1, 0.33]−
32***r = 0.28[0.16, 0.39]
*r = 0.16[0.04, 0.27]
−3
2***r = 0.24[0.12, 0.35]
***r = 0.27[0.16, 0.38]
−3 0 3
−3
2other
119
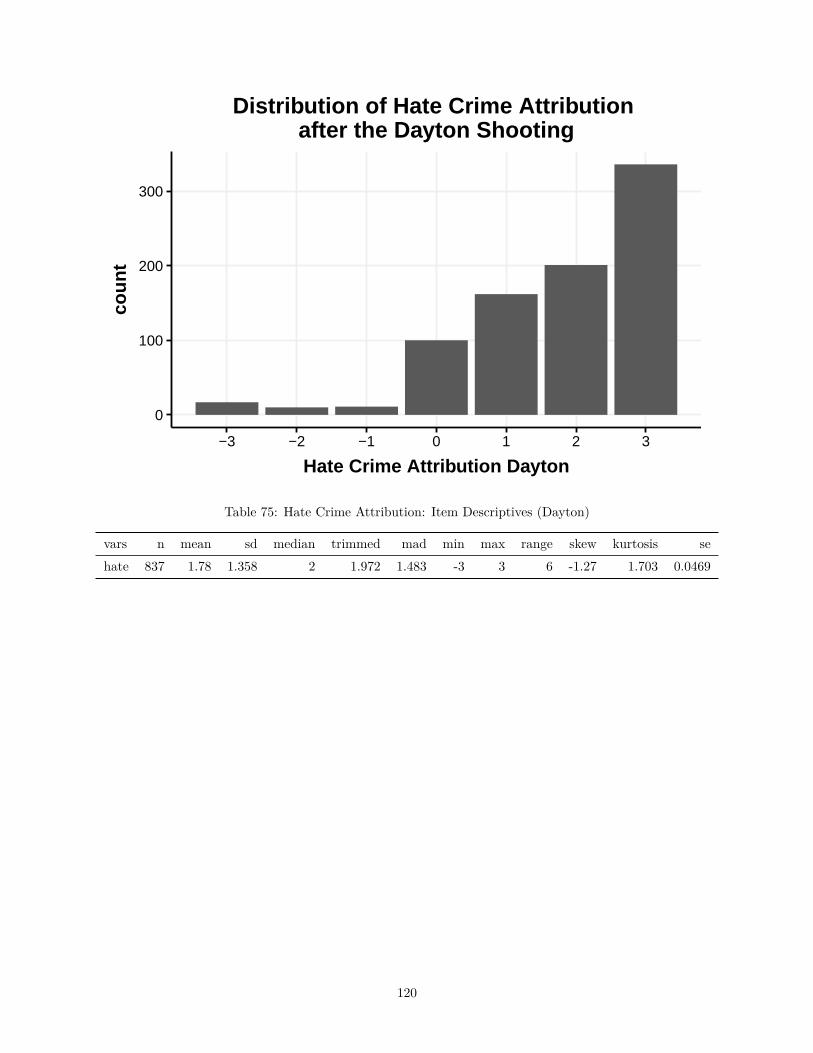
0
100
200
300
−3 −2 −1 0 1 2 3
Hate Crime Attribution Dayton
coun
tDistribution of Hate Crime Attribution
after the Dayton Shooting
Table 75: Hate Crime Attribution: Item Descriptives (Dayton)
vars n mean sd median trimmed mad min max range skew kurtosis sehate 837 1.78 1.358 2 1.972 1.483 -3 3 6 -1.27 1.703 0.0469
120
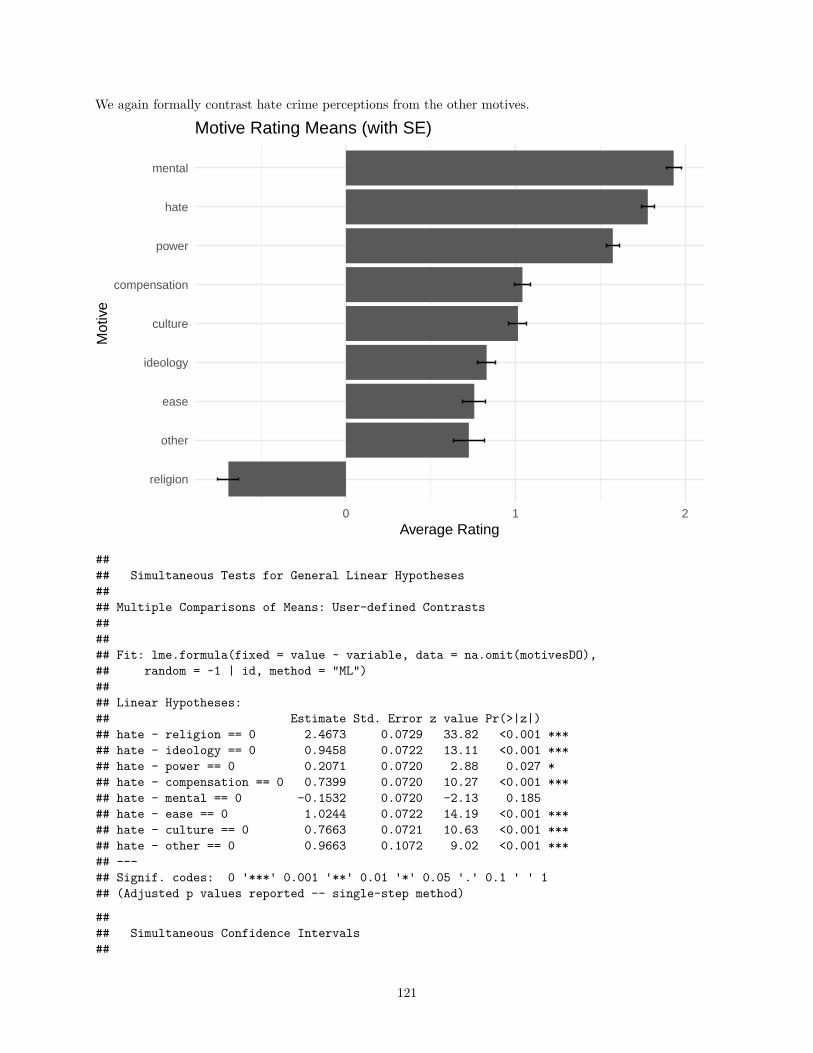
We again formally contrast hate crime perceptions from the other motives.
religion
other
ease
ideology
culture
compensation
power
hate
mental
0 1 2Average Rating
Mot
ive
Motive Rating Means (with SE)
#### Simultaneous Tests for General Linear Hypotheses#### Multiple Comparisons of Means: User-defined Contrasts###### Fit: lme.formula(fixed = value ~ variable, data = na.omit(motivesDO),## random = ~1 | id, method = "ML")#### Linear Hypotheses:## Estimate Std. Error z value Pr(>|z|)## hate - religion == 0 2.4673 0.0729 33.82 <0.001 ***## hate - ideology == 0 0.9458 0.0722 13.11 <0.001 ***## hate - power == 0 0.2071 0.0720 2.88 0.027 *## hate - compensation == 0 0.7399 0.0720 10.27 <0.001 ***## hate - mental == 0 -0.1532 0.0720 -2.13 0.185## hate - ease == 0 1.0244 0.0722 14.19 <0.001 ***## hate - culture == 0 0.7663 0.0721 10.63 <0.001 ***## hate - other == 0 0.9663 0.1072 9.02 <0.001 ***## ---## Signif. codes: 0 '***' 0.001 '**' 0.01 '*' 0.05 '.' 0.1 ' ' 1## (Adjusted p values reported -- single-step method)
#### Simultaneous Confidence Intervals##
121
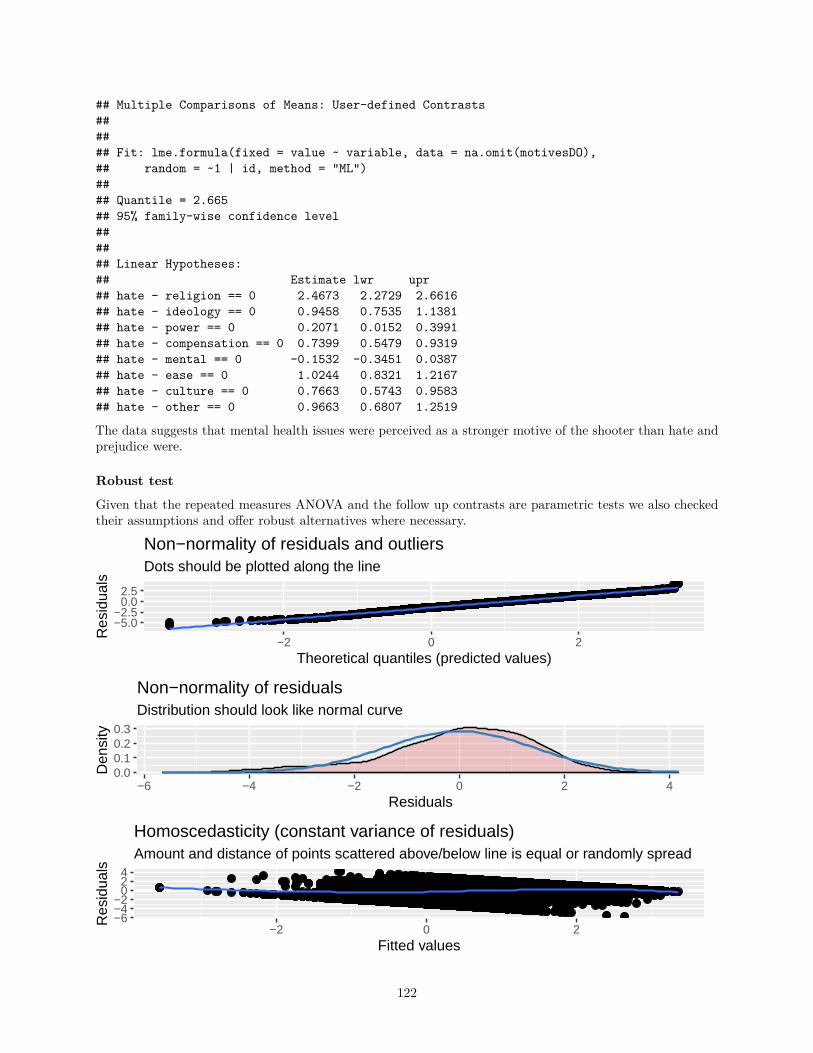
## Multiple Comparisons of Means: User-defined Contrasts###### Fit: lme.formula(fixed = value ~ variable, data = na.omit(motivesDO),## random = ~1 | id, method = "ML")#### Quantile = 2.665## 95% family-wise confidence level###### Linear Hypotheses:## Estimate lwr upr## hate - religion == 0 2.4673 2.2729 2.6616## hate - ideology == 0 0.9458 0.7535 1.1381## hate - power == 0 0.2071 0.0152 0.3991## hate - compensation == 0 0.7399 0.5479 0.9319## hate - mental == 0 -0.1532 -0.3451 0.0387## hate - ease == 0 1.0244 0.8321 1.2167## hate - culture == 0 0.7663 0.5743 0.9583## hate - other == 0 0.9663 0.6807 1.2519
The data suggests that mental health issues were perceived as a stronger motive of the shooter than hate andprejudice were.
Robust test
Given that the repeated measures ANOVA and the follow up contrasts are parametric tests we also checkedtheir assumptions and offer robust alternatives where necessary.
−5.0−2.5
0.02.5
−2 0 2Theoretical quantiles (predicted values)
Res
idua
ls
Dots should be plotted along the line
Non−normality of residuals and outliers
0.00.10.20.3
−6 −4 −2 0 2 4Residuals
Den
sity
Distribution should look like normal curve
Non−normality of residuals
−6−4−2
024
−2 0 2Fitted values
Res
idua
ls
Amount and distance of points scattered above/below line is equal or randomly spread
Homoscedasticity (constant variance of residuals)
122

other
culture
ease
mental
hate
compensation
power
ideology
religion
−6 −4 −2 0 2 4
Residuals
Gro
upFollow−Up Sphericity
Visual inspection of the qq-plot and the distribution of the residuals indicated no violation of the normality ofresiduals assumption but a further inspection of the sphericity (and homoscedasticity) assumption indicateddifferences in the variances between the categories. This was also corroborated by the ration of largest groupvariance to smallest variance = 2.77, which is larger than the recommended 1.5 rule of thumb.Even though with large sample sizes and largely balanced data (i.e., almost all participants responded on allmotives) the tests are quite robust to violations of homoscedasticity we still offer a robust heteroscedasticrepeated measurement ANOVA. We removed the ‘other’ from the analyses because some of the robustanalyses need fully balanced designs and 579 participants did not rate any additional motivations. For theoverall robust ANOVA we, however, offer a bootstrapped alternative that is able to deal with missing data.For the follow-up comparisons we present the relevant Hate crime subset of a full robust post-hoc test with aHochberg’s approach to control for the family-wise error (FWE).
## [1] "robust heteroscedastic repeated measurement ANOVA: F(6.42, 1565.82) = 60.39, p < 0.001"
## [1] "robust heteroscedastic bootstrapped repeated measurement ANOVA without the 'other'## category removed: F = 60.39 with a critical value of 2.11 and given that F > F_critical,## the bootstrapped test equally indicates an overall statistical significance."
Table 76: Follow-up Compare Hate Motive - robust (Thousand Oaks)
Group1 Group2 psi hat ci.lower ci.upper p.value p.crit sigreligion hate -2.216 -2.642 -1.791 0.000 0.002 TRUEideology hate -0.980 -1.324 -0.635 0.000 0.001 TRUEpower hate -0.192 -0.471 0.087 0.027 0.005 FALSEcompensation hate -0.731 -1.067 -0.394 0.000 0.002 TRUEhate mental -0.065 -0.371 0.241 0.491 0.013 FALSEhate ease 1.086 0.682 1.489 0.000 0.002 TRUEhate culture 0.739 0.385 1.093 0.000 0.003 TRUEhate other 0.967 0.621 1.314 0.000 0.001 TRUE
123
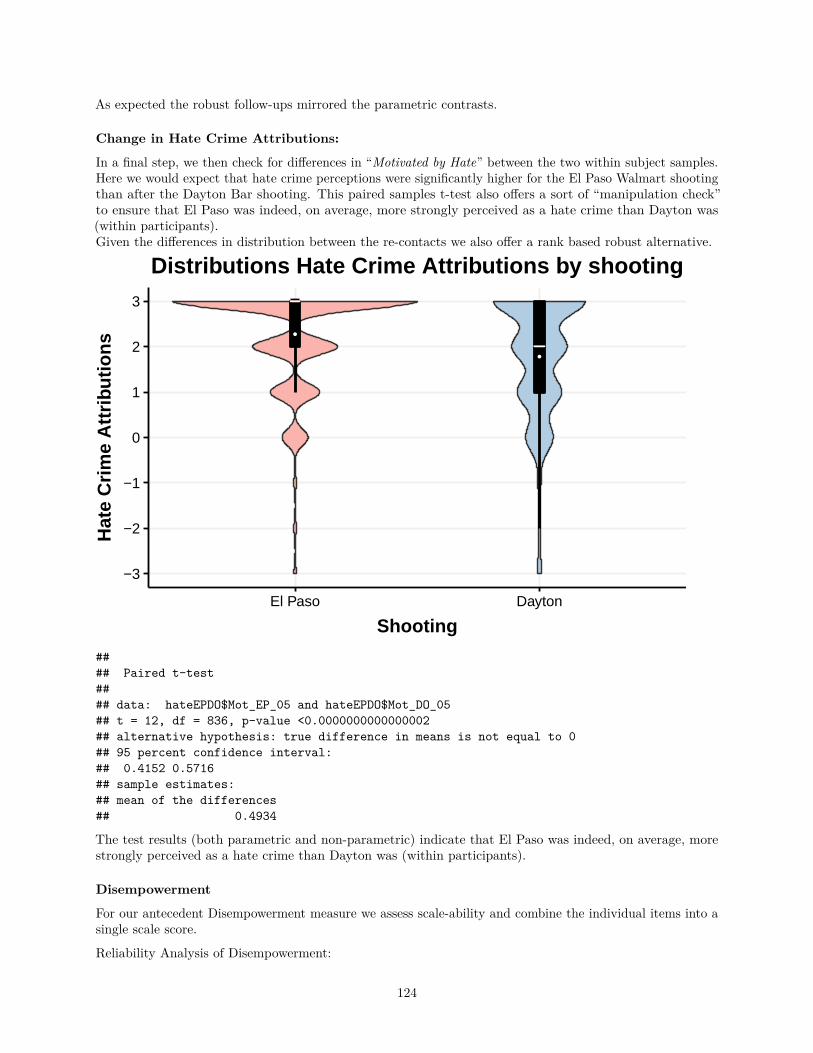
As expected the robust follow-ups mirrored the parametric contrasts.
Change in Hate Crime Attributions:
In a final step, we then check for differences in “Motivated by Hate” between the two within subject samples.Here we would expect that hate crime perceptions were significantly higher for the El Paso Walmart shootingthan after the Dayton Bar shooting. This paired samples t-test also offers a sort of “manipulation check”to ensure that El Paso was indeed, on average, more strongly perceived as a hate crime than Dayton was(within participants).Given the differences in distribution between the re-contacts we also offer a rank based robust alternative.
−3
−2
−1
0
1
2
3
El Paso Dayton
Shooting
Hat
e C
rime
Attr
ibut
ions
Distributions Hate Crime Attributions by shooting
#### Paired t-test#### data: hateEPDO$Mot_EP_05 and hateEPDO$Mot_DO_05## t = 12, df = 836, p-value <0.0000000000000002## alternative hypothesis: true difference in means is not equal to 0## 95 percent confidence interval:## 0.4152 0.5716## sample estimates:## mean of the differences## 0.4934
The test results (both parametric and non-parametric) indicate that El Paso was indeed, on average, morestrongly perceived as a hate crime than Dayton was (within participants).
Disempowerment
For our antecedent Disempowerment measure we assess scale-ability and combine the individual items into asingle scale score.
Reliability Analysis of Disempowerment:
124
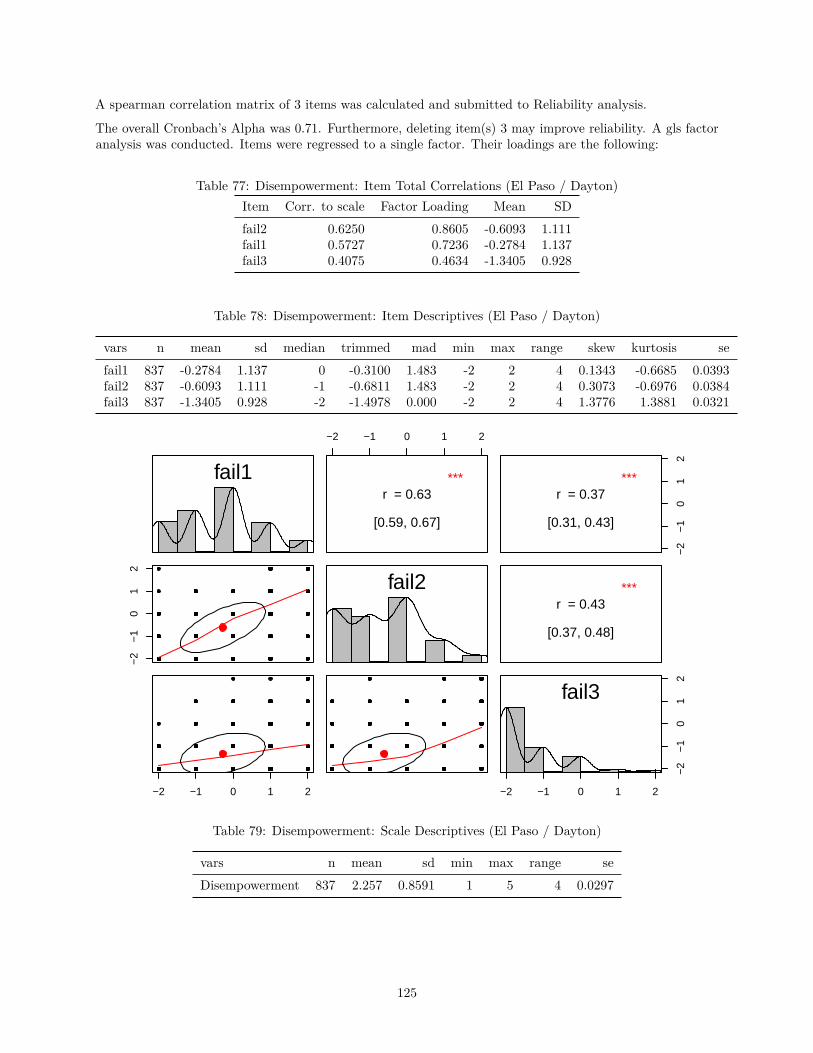
A spearman correlation matrix of 3 items was calculated and submitted to Reliability analysis.
The overall Cronbach’s Alpha was 0.71. Furthermore, deleting item(s) 3 may improve reliability. A gls factoranalysis was conducted. Items were regressed to a single factor. Their loadings are the following:
Table 77: Disempowerment: Item Total Correlations (El Paso / Dayton)Item Corr. to scale Factor Loading Mean SDfail2 0.6250 0.8605 -0.6093 1.111fail1 0.5727 0.7236 -0.2784 1.137fail3 0.4075 0.4634 -1.3405 0.928
Table 78: Disempowerment: Item Descriptives (El Paso / Dayton)
vars n mean sd median trimmed mad min max range skew kurtosis sefail1 837 -0.2784 1.137 0 -0.3100 1.483 -2 2 4 0.1343 -0.6685 0.0393fail2 837 -0.6093 1.111 -1 -0.6811 1.483 -2 2 4 0.3073 -0.6976 0.0384fail3 837 -1.3405 0.928 -2 -1.4978 0.000 -2 2 4 1.3776 1.3881 0.0321
fail1
−2
−1
01
2
−2 −1 0 1 2
−2 −1 0 1 2
***r = 0.63
[0.59, 0.67]
fail2
−2
−1
01
2
***r = 0.37
[0.31, 0.43]
***r = 0.43
[0.37, 0.48]
−2 −1 0 1 2
−2
−1
01
2fail3
Table 79: Disempowerment: Scale Descriptives (El Paso / Dayton)
vars n mean sd min max range seDisempowerment 837 2.257 0.8591 1 5 4 0.0297
125
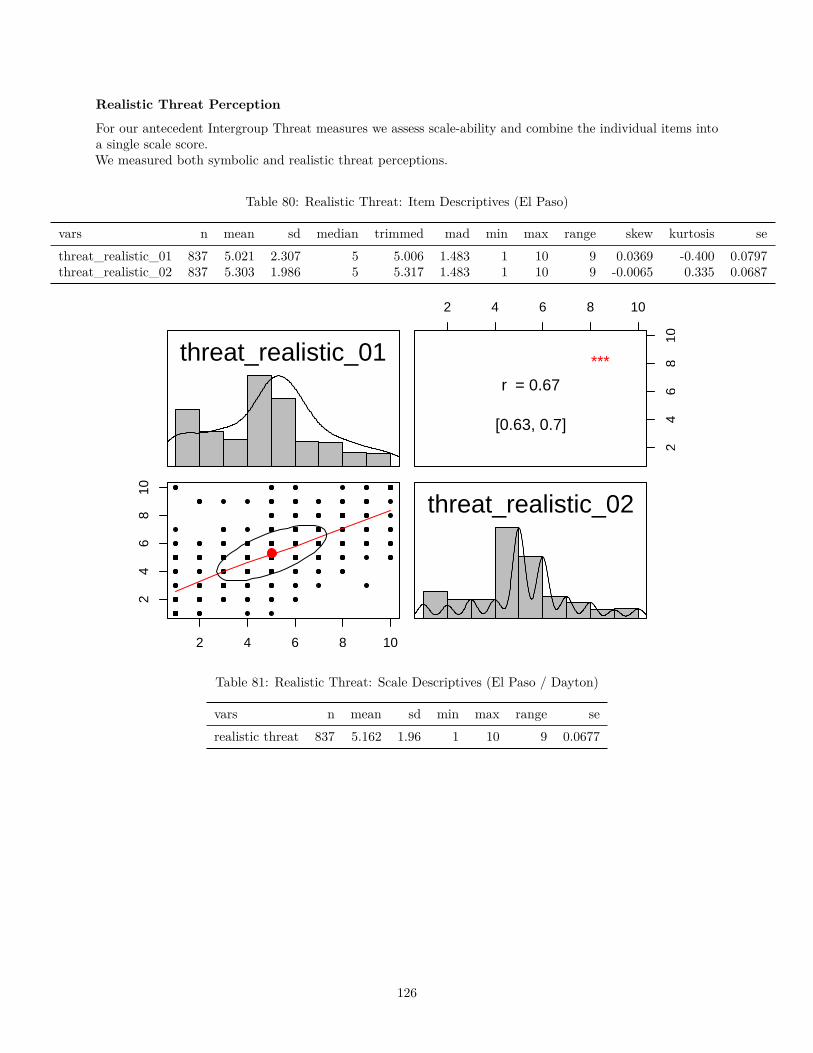
Realistic Threat Perception
For our antecedent Intergroup Threat measures we assess scale-ability and combine the individual items intoa single scale score.We measured both symbolic and realistic threat perceptions.
Table 80: Realistic Threat: Item Descriptives (El Paso)
vars n mean sd median trimmed mad min max range skew kurtosis sethreat_realistic_01 837 5.021 2.307 5 5.006 1.483 1 10 9 0.0369 -0.400 0.0797threat_realistic_02 837 5.303 1.986 5 5.317 1.483 1 10 9 -0.0065 0.335 0.0687
threat_realistic_01
2 4 6 8 10
24
68
10
2 4 6 8 10
24
68
10
***
r = 0.67
[0.63, 0.7]
threat_realistic_02
Table 81: Realistic Threat: Scale Descriptives (El Paso / Dayton)
vars n mean sd min max range serealistic threat 837 5.162 1.96 1 10 9 0.0677
126
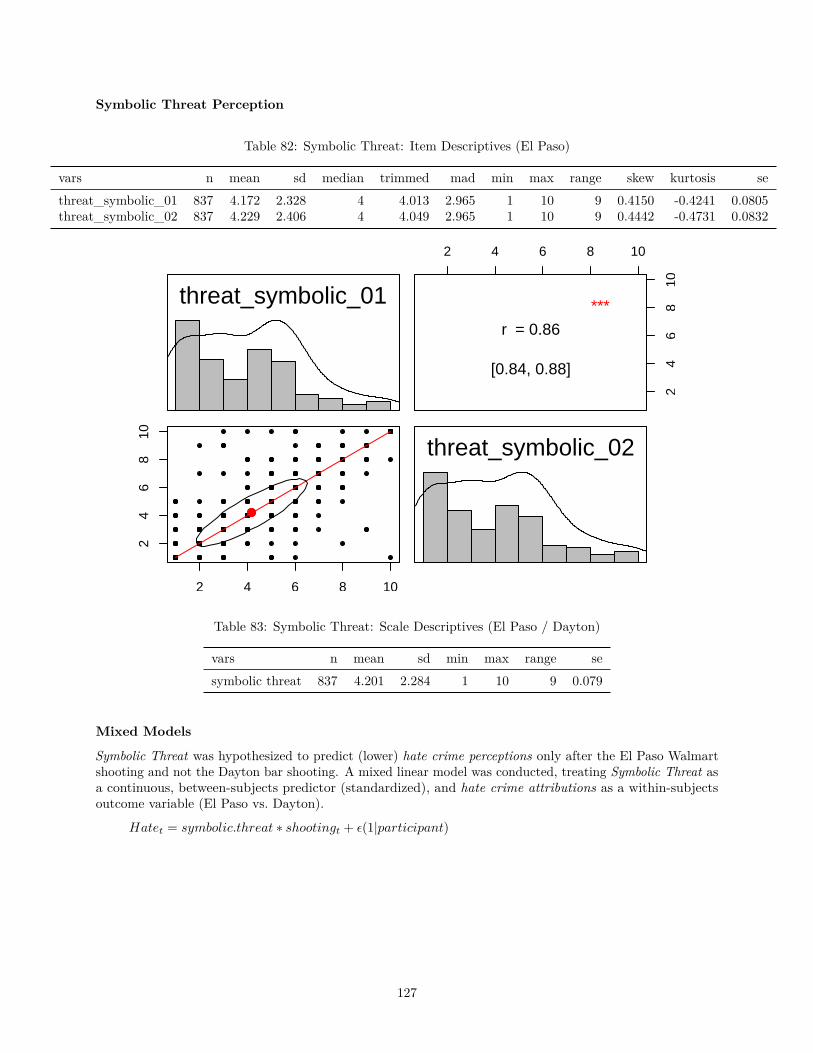
Symbolic Threat Perception
Table 82: Symbolic Threat: Item Descriptives (El Paso)
vars n mean sd median trimmed mad min max range skew kurtosis sethreat_symbolic_01 837 4.172 2.328 4 4.013 2.965 1 10 9 0.4150 -0.4241 0.0805threat_symbolic_02 837 4.229 2.406 4 4.049 2.965 1 10 9 0.4442 -0.4731 0.0832
threat_symbolic_01
2 4 6 8 10
24
68
10
2 4 6 8 10
24
68
10
***
r = 0.86
[0.84, 0.88]
threat_symbolic_02
Table 83: Symbolic Threat: Scale Descriptives (El Paso / Dayton)
vars n mean sd min max range sesymbolic threat 837 4.201 2.284 1 10 9 0.079
Mixed Models
Symbolic Threat was hypothesized to predict (lower) hate crime perceptions only after the El Paso Walmartshooting and not the Dayton bar shooting. A mixed linear model was conducted, treating Symbolic Threat asa continuous, between-subjects predictor (standardized), and hate crime attributions as a within-subjectsoutcome variable (El Paso vs. Dayton).
Hatet = symbolic.threat ∗ shootingt + ε(1|participant)
127
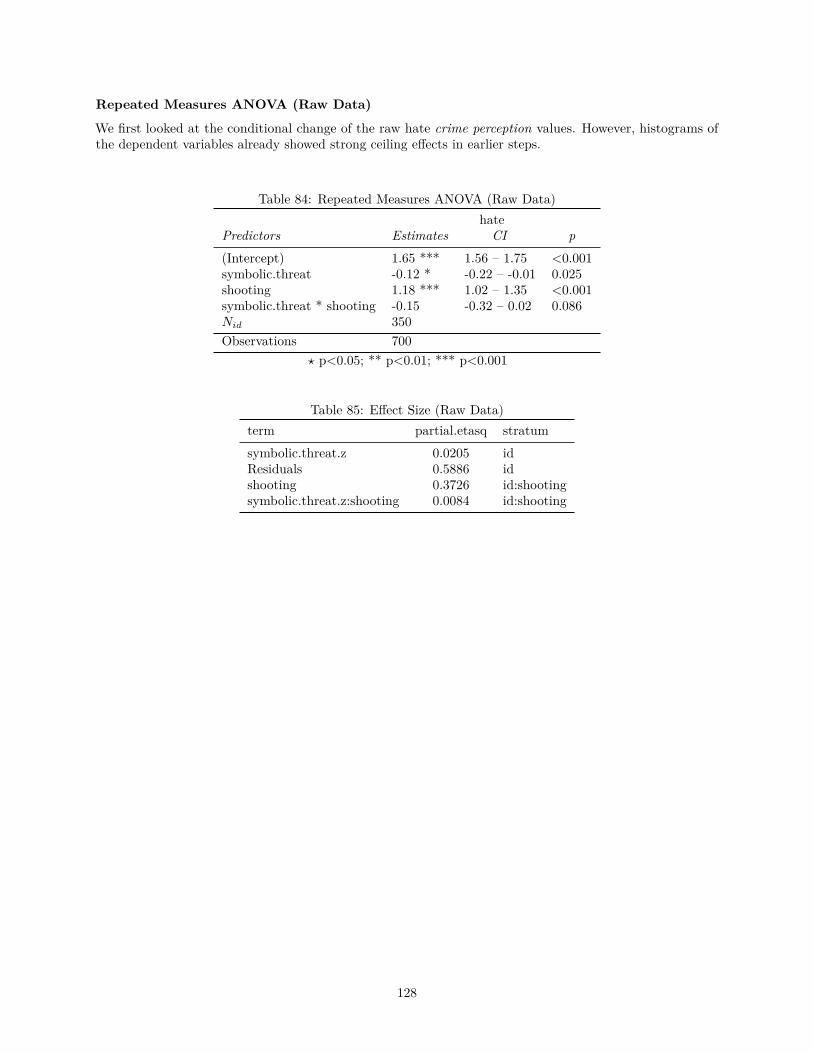
Repeated Measures ANOVA (Raw Data)
We first looked at the conditional change of the raw hate crime perception values. However, histograms ofthe dependent variables already showed strong ceiling effects in earlier steps.
Table 84: Repeated Measures ANOVA (Raw Data)hate
Predictors Estimates CI p(Intercept) 1.65 *** 1.56 – 1.75 <0.001symbolic.threat -0.12 * -0.22 – -0.01 0.025shooting 1.18 *** 1.02 – 1.35 <0.001symbolic.threat * shooting -0.15 -0.32 – 0.02 0.086Nid 350Observations 700
? p<0.05; ** p<0.01; *** p<0.001
Table 85: Effect Size (Raw Data)term partial.etasq stratumsymbolic.threat.z 0.0205 idResiduals 0.5886 idshooting 0.3726 id:shootingsymbolic.threat.z:shooting 0.0084 id:shooting
128
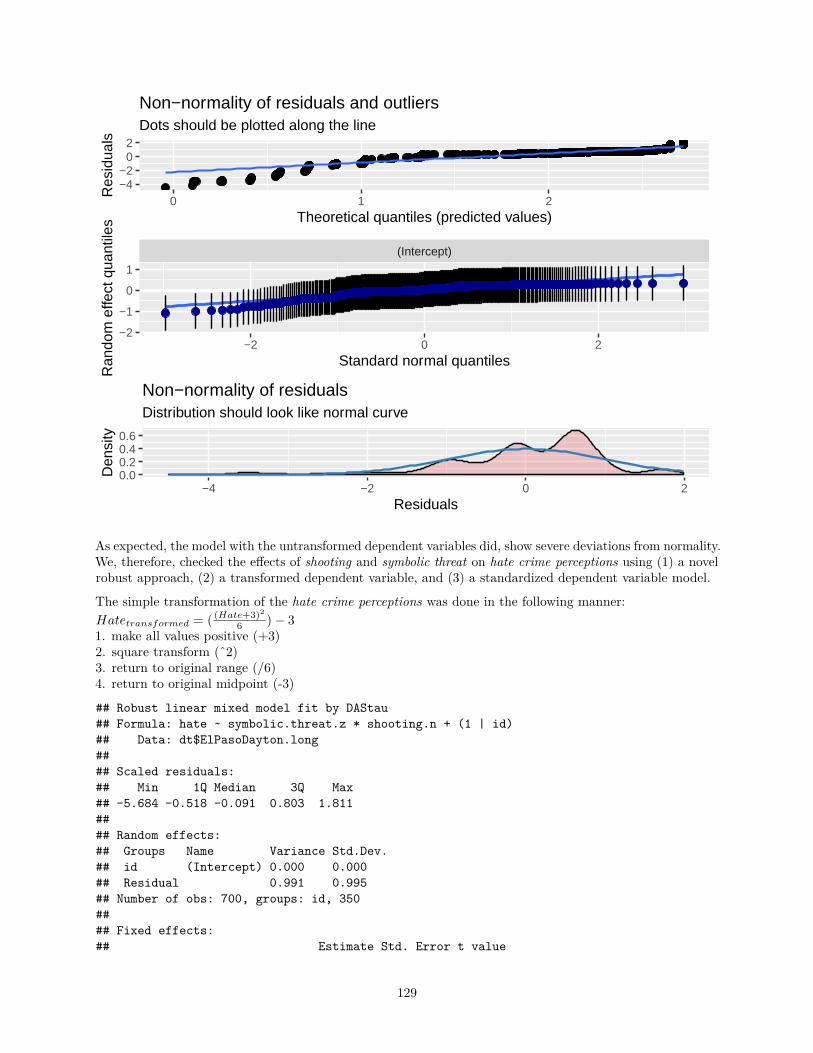
−4−2
02
0 1 2Theoretical quantiles (predicted values)
Res
idua
lsDots should be plotted along the line
Non−normality of residuals and outliers
(Intercept)
−2 0 2−2
−1
0
1
Standard normal quantiles
Ran
dom
effe
ct q
uant
iles
0.00.20.40.6
−4 −2 0 2Residuals
Den
sity
Distribution should look like normal curve
Non−normality of residuals
As expected, the model with the untransformed dependent variables did, show severe deviations from normality.We, therefore, checked the effects of shooting and symbolic threat on hate crime perceptions using (1) a novelrobust approach, (2) a transformed dependent variable, and (3) a standardized dependent variable model.
The simple transformation of the hate crime perceptions was done in the following manner:Hatetransformed = ( (Hate+3)2
6 )− 31. make all values positive (+3)2. square transform (ˆ2)3. return to original range (/6)4. return to original midpoint (-3)
## Robust linear mixed model fit by DAStau## Formula: hate ~ symbolic.threat.z * shooting.n + (1 | id)## Data: dt$ElPasoDayton.long#### Scaled residuals:## Min 1Q Median 3Q Max## -5.684 -0.518 -0.091 0.803 1.811#### Random effects:## Groups Name Variance Std.Dev.## id (Intercept) 0.000 0.000## Residual 0.991 0.995## Number of obs: 700, groups: id, 350#### Fixed effects:## Estimate Std. Error t value
129
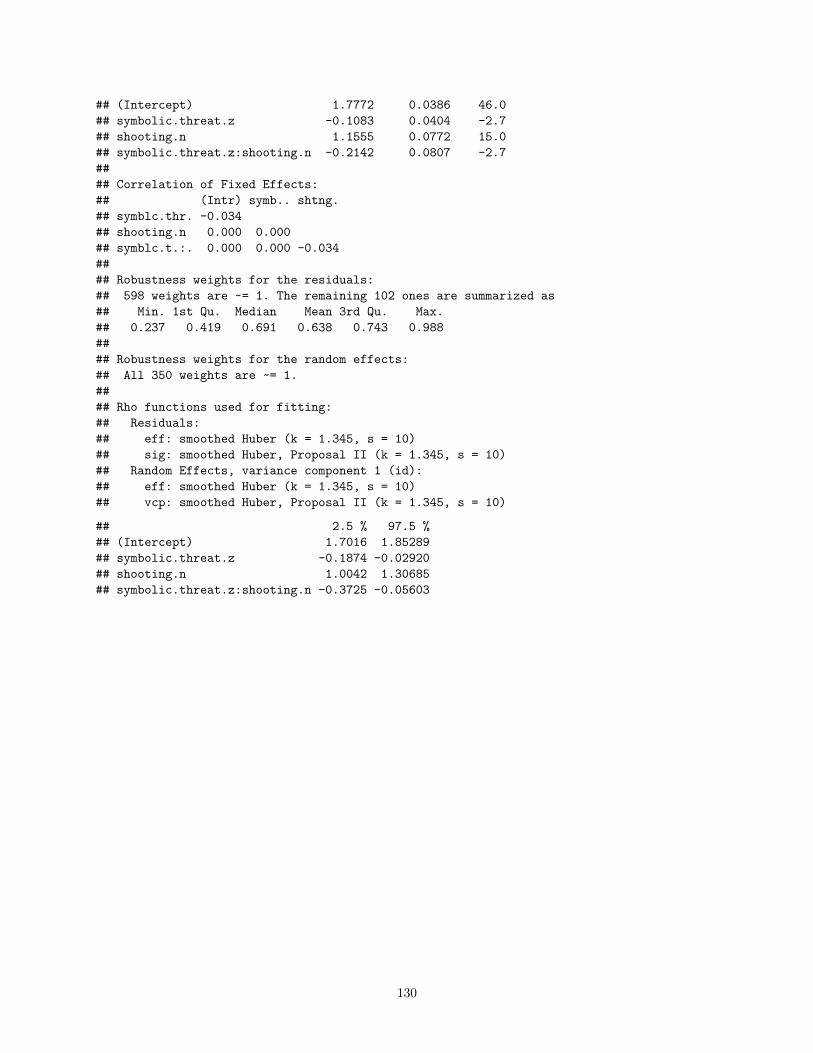
## (Intercept) 1.7772 0.0386 46.0## symbolic.threat.z -0.1083 0.0404 -2.7## shooting.n 1.1555 0.0772 15.0## symbolic.threat.z:shooting.n -0.2142 0.0807 -2.7#### Correlation of Fixed Effects:## (Intr) symb.. shtng.## symblc.thr. -0.034## shooting.n 0.000 0.000## symblc.t.:. 0.000 0.000 -0.034#### Robustness weights for the residuals:## 598 weights are ~= 1. The remaining 102 ones are summarized as## Min. 1st Qu. Median Mean 3rd Qu. Max.## 0.237 0.419 0.691 0.638 0.743 0.988#### Robustness weights for the random effects:## All 350 weights are ~= 1.#### Rho functions used for fitting:## Residuals:## eff: smoothed Huber (k = 1.345, s = 10)## sig: smoothed Huber, Proposal II (k = 1.345, s = 10)## Random Effects, variance component 1 (id):## eff: smoothed Huber (k = 1.345, s = 10)## vcp: smoothed Huber, Proposal II (k = 1.345, s = 10)
## 2.5 % 97.5 %## (Intercept) 1.7016 1.85289## symbolic.threat.z -0.1874 -0.02920## shooting.n 1.0042 1.30685## symbolic.threat.z:shooting.n -0.3725 -0.05603
130
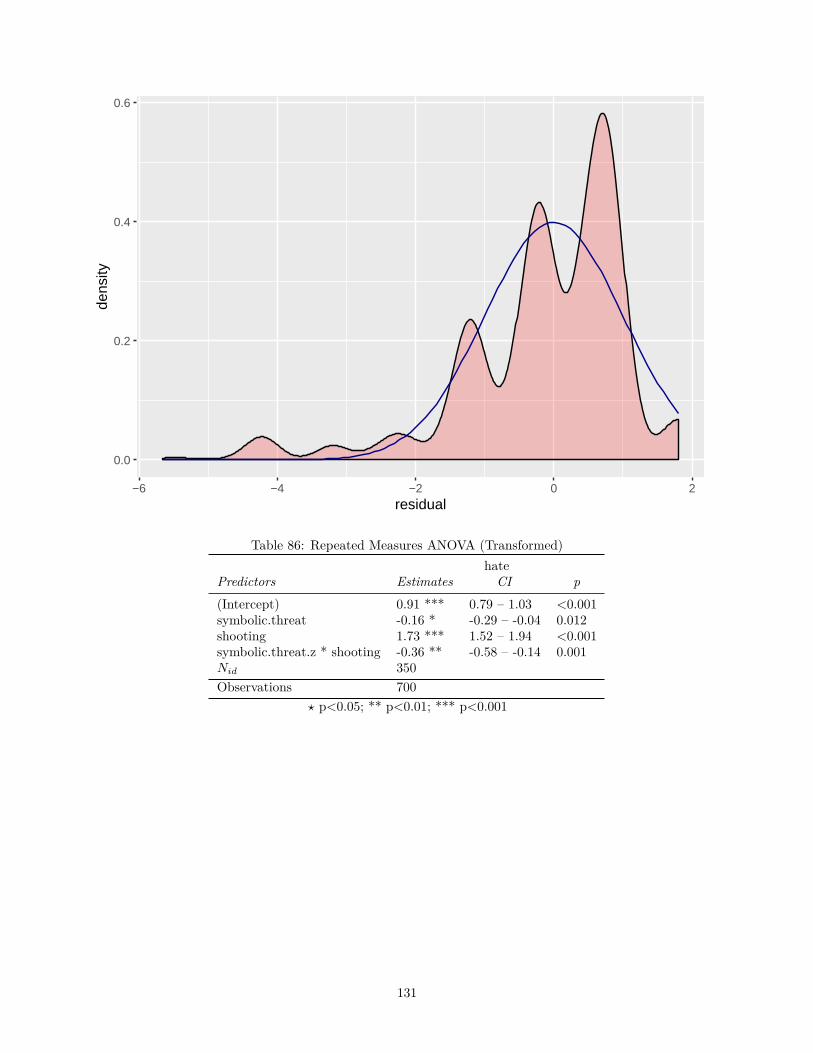
0.0
0.2
0.4
0.6
−6 −4 −2 0 2residual
dens
ity
Table 86: Repeated Measures ANOVA (Transformed)hate
Predictors Estimates CI p(Intercept) 0.91 *** 0.79 – 1.03 <0.001symbolic.threat -0.16 * -0.29 – -0.04 0.012shooting 1.73 *** 1.52 – 1.94 <0.001symbolic.threat.z * shooting -0.36 ** -0.58 – -0.14 0.001Nid 350Observations 700
? p<0.05; ** p<0.01; *** p<0.001
131
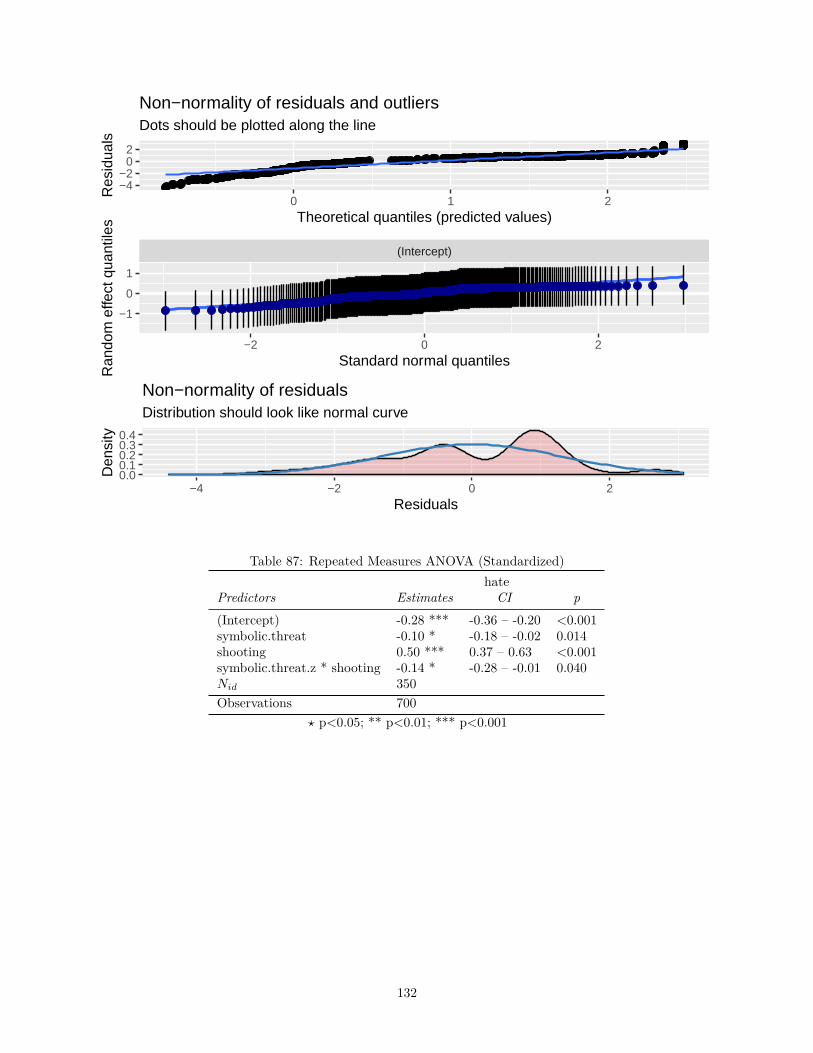
−4−2
02
0 1 2Theoretical quantiles (predicted values)
Res
idua
lsDots should be plotted along the line
Non−normality of residuals and outliers
(Intercept)
−2 0 2
−1
0
1
Standard normal quantiles
Ran
dom
effe
ct q
uant
iles
0.00.10.20.30.4
−4 −2 0 2Residuals
Den
sity
Distribution should look like normal curve
Non−normality of residuals
Table 87: Repeated Measures ANOVA (Standardized)hate
Predictors Estimates CI p(Intercept) -0.28 *** -0.36 – -0.20 <0.001symbolic.threat -0.10 * -0.18 – -0.02 0.014shooting 0.50 *** 0.37 – 0.63 <0.001symbolic.threat.z * shooting -0.14 * -0.28 – -0.01 0.040Nid 350Observations 700
? p<0.05; ** p<0.01; *** p<0.001
132
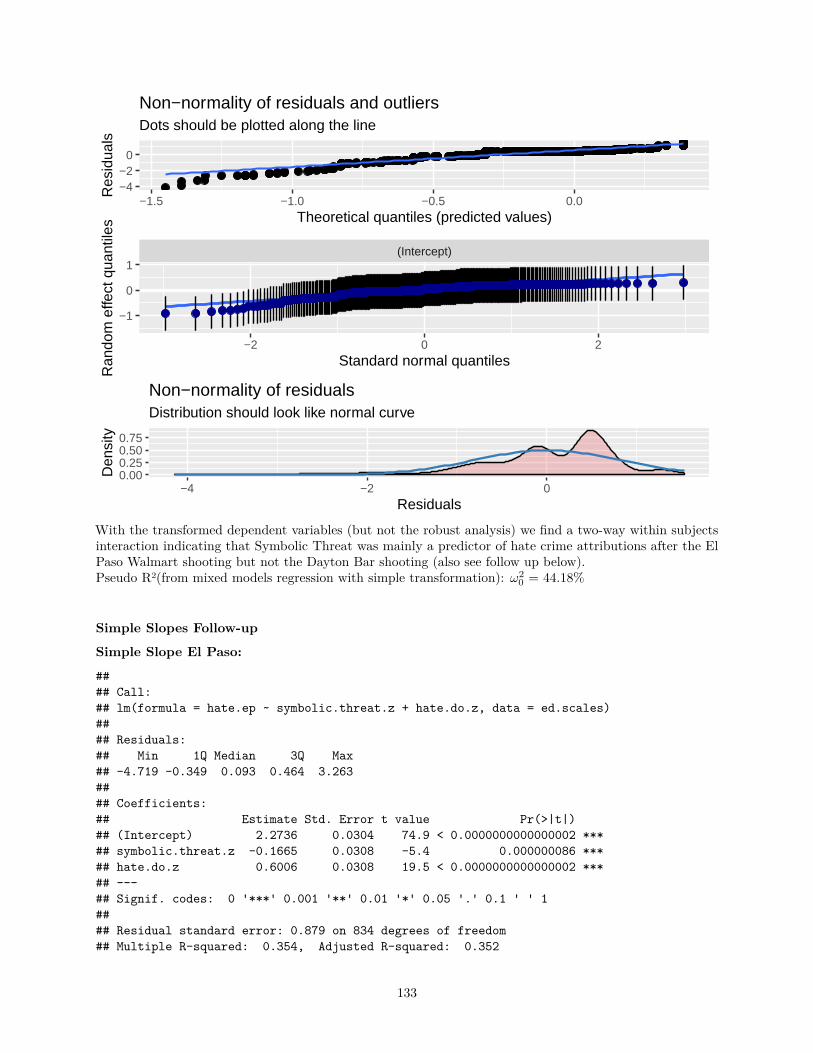
−4−2
0
−1.5 −1.0 −0.5 0.0Theoretical quantiles (predicted values)
Res
idua
lsDots should be plotted along the line
Non−normality of residuals and outliers
(Intercept)
−2 0 2
−1
0
1
Standard normal quantiles
Ran
dom
effe
ct q
uant
iles
0.000.250.500.75
−4 −2 0Residuals
Den
sity
Distribution should look like normal curve
Non−normality of residuals
With the transformed dependent variables (but not the robust analysis) we find a two-way within subjectsinteraction indicating that Symbolic Threat was mainly a predictor of hate crime attributions after the ElPaso Walmart shooting but not the Dayton Bar shooting (also see follow up below).Pseudo R2(from mixed models regression with simple transformation): ω2
0 = 44.18%
Simple Slopes Follow-up
Simple Slope El Paso:
#### Call:## lm(formula = hate.ep ~ symbolic.threat.z + hate.do.z, data = ed.scales)#### Residuals:## Min 1Q Median 3Q Max## -4.719 -0.349 0.093 0.464 3.263#### Coefficients:## Estimate Std. Error t value Pr(>|t|)## (Intercept) 2.2736 0.0304 74.9 < 0.0000000000000002 ***## symbolic.threat.z -0.1665 0.0308 -5.4 0.000000086 ***## hate.do.z 0.6006 0.0308 19.5 < 0.0000000000000002 ***## ---## Signif. codes: 0 '***' 0.001 '**' 0.01 '*' 0.05 '.' 0.1 ' ' 1#### Residual standard error: 0.879 on 834 degrees of freedom## Multiple R-squared: 0.354, Adjusted R-squared: 0.352
133
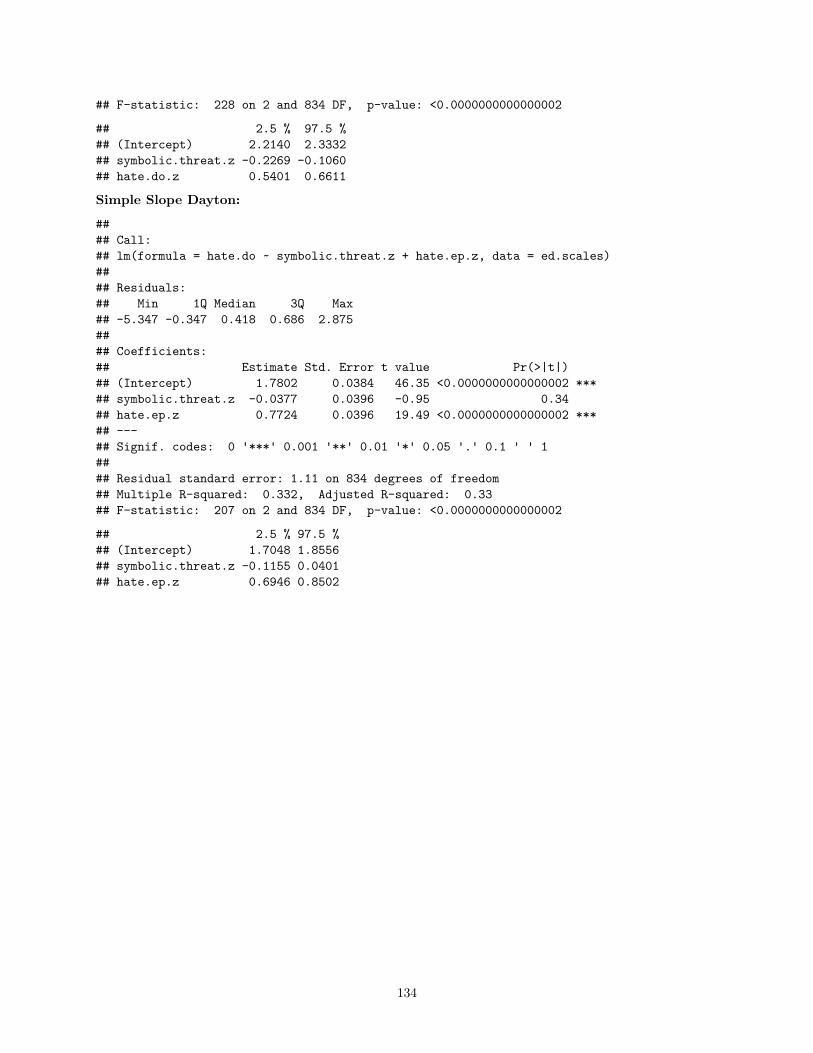
## F-statistic: 228 on 2 and 834 DF, p-value: <0.0000000000000002
## 2.5 % 97.5 %## (Intercept) 2.2140 2.3332## symbolic.threat.z -0.2269 -0.1060## hate.do.z 0.5401 0.6611
Simple Slope Dayton:
#### Call:## lm(formula = hate.do ~ symbolic.threat.z + hate.ep.z, data = ed.scales)#### Residuals:## Min 1Q Median 3Q Max## -5.347 -0.347 0.418 0.686 2.875#### Coefficients:## Estimate Std. Error t value Pr(>|t|)## (Intercept) 1.7802 0.0384 46.35 <0.0000000000000002 ***## symbolic.threat.z -0.0377 0.0396 -0.95 0.34## hate.ep.z 0.7724 0.0396 19.49 <0.0000000000000002 ***## ---## Signif. codes: 0 '***' 0.001 '**' 0.01 '*' 0.05 '.' 0.1 ' ' 1#### Residual standard error: 1.11 on 834 degrees of freedom## Multiple R-squared: 0.332, Adjusted R-squared: 0.33## F-statistic: 207 on 2 and 834 DF, p-value: <0.0000000000000002
## 2.5 % 97.5 %## (Intercept) 1.7048 1.8556## symbolic.threat.z -0.1155 0.0401## hate.ep.z 0.6946 0.8502
134
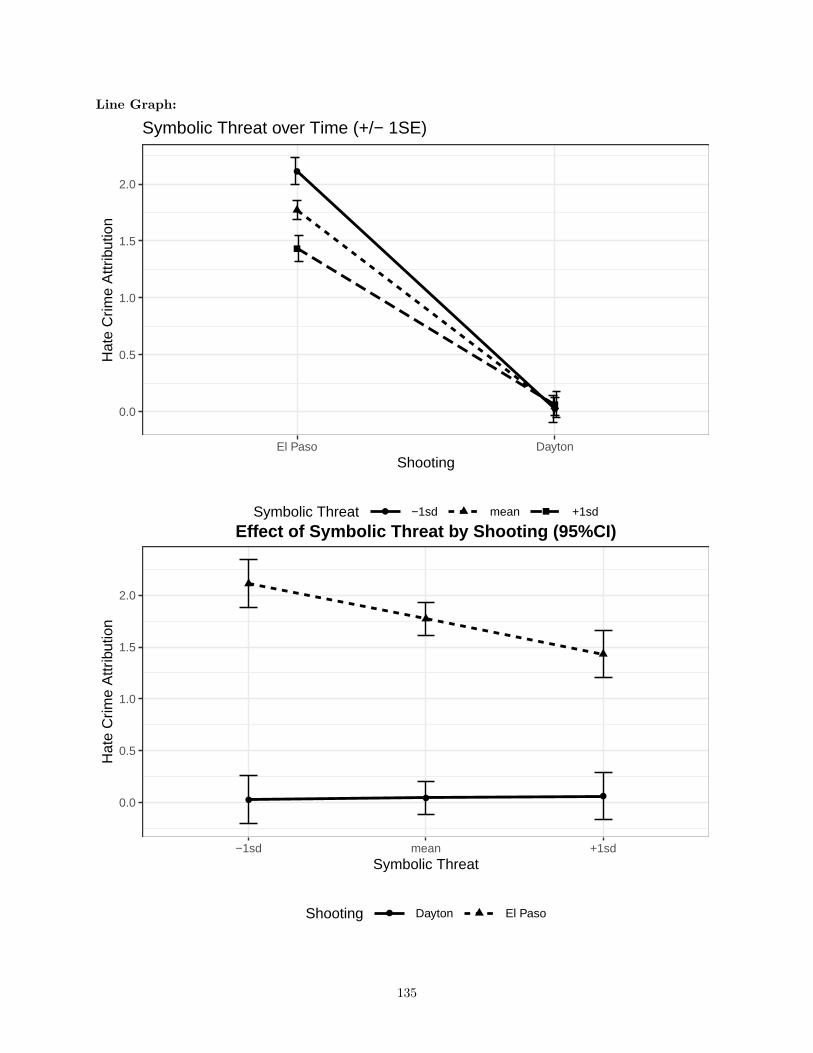
Line Graph:
0.0
0.5
1.0
1.5
2.0
El Paso DaytonShooting
Hat
e C
rime
Attr
ibut
ion
Symbolic Threat −1sd mean +1sd
Symbolic Threat over Time (+/− 1SE)
0.0
0.5
1.0
1.5
2.0
−1sd mean +1sdSymbolic Threat
Hat
e C
rime
Attr
ibut
ion
Shooting Dayton El Paso
Effect of Symbolic Threat by Shooting (95%CI)
135
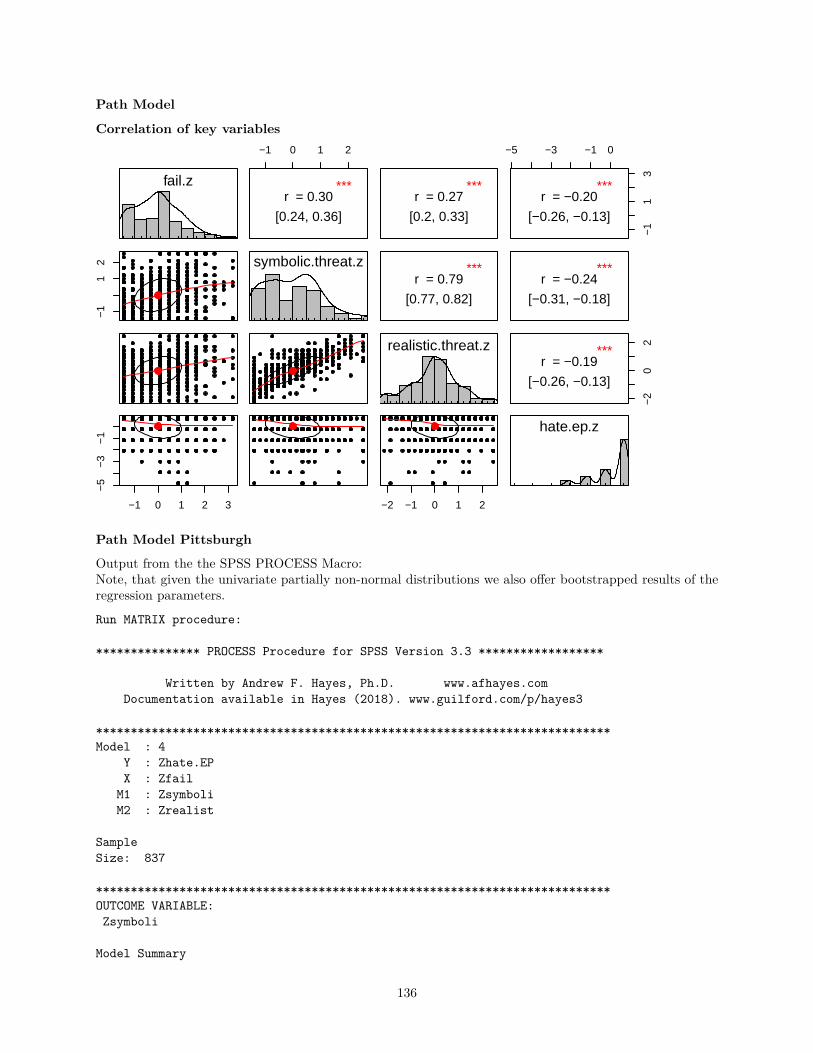
Path Model
Correlation of key variables
fail.z
−1
12
−1 0 1 2 3
−5
−3
−1
−1 0 1 2
***r = 0.30
[0.24, 0.36]
symbolic.threat.z
***r = 0.27
[0.2, 0.33]
***r = 0.79
[0.77, 0.82]
realistic.threat.z
−2 −1 0 1 2
−5 −3 −1 0
−1
13
***r = −0.20
[−0.26, −0.13]
***r = −0.24
[−0.31, −0.18]
−2
02
***r = −0.19
[−0.26, −0.13]
hate.ep.z
Path Model Pittsburgh
Output from the the SPSS PROCESS Macro:Note, that given the univariate partially non-normal distributions we also offer bootstrapped results of theregression parameters.
Run MATRIX procedure:
*************** PROCESS Procedure for SPSS Version 3.3 ******************
Written by Andrew F. Hayes, Ph.D. www.afhayes.comDocumentation available in Hayes (2018). www.guilford.com/p/hayes3
**************************************************************************Model : 4
Y : Zhate.EPX : Zfail
M1 : ZsymboliM2 : Zrealist
SampleSize: 837
**************************************************************************OUTCOME VARIABLE:Zsymboli
Model Summary
136
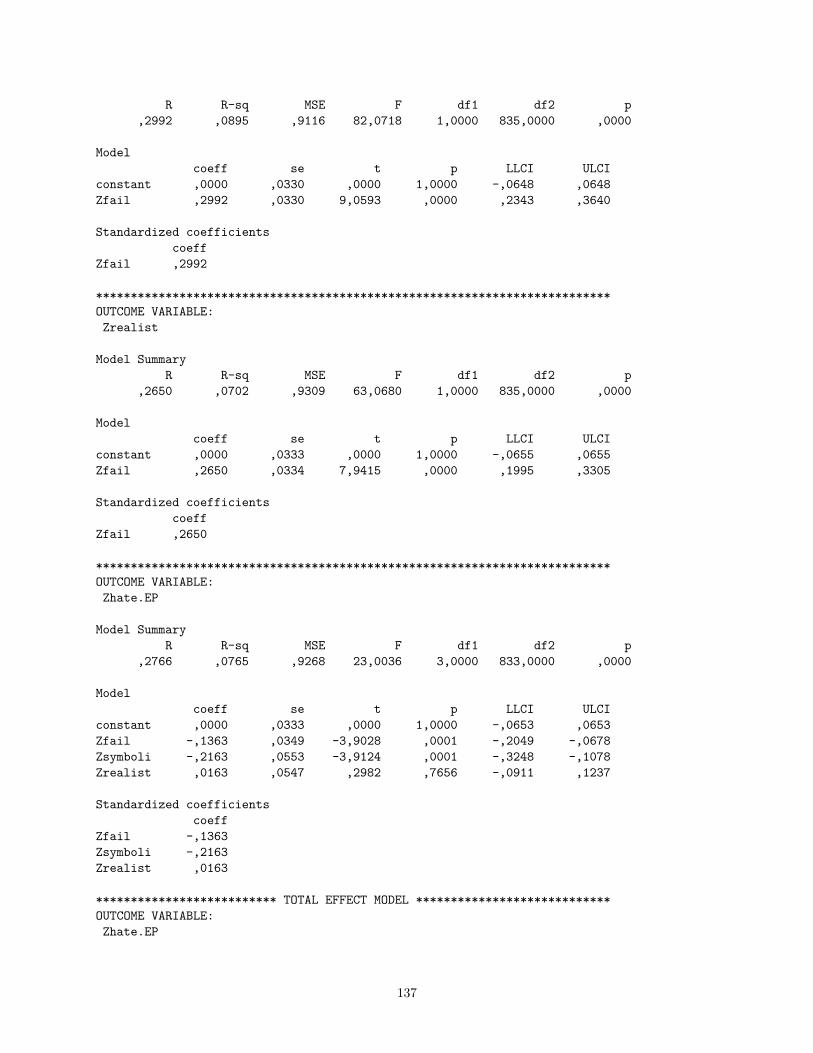
R R-sq MSE F df1 df2 p,2992 ,0895 ,9116 82,0718 1,0000 835,0000 ,0000
Modelcoeff se t p LLCI ULCI
constant ,0000 ,0330 ,0000 1,0000 -,0648 ,0648Zfail ,2992 ,0330 9,0593 ,0000 ,2343 ,3640
Standardized coefficientscoeff
Zfail ,2992
**************************************************************************OUTCOME VARIABLE:Zrealist
Model SummaryR R-sq MSE F df1 df2 p
,2650 ,0702 ,9309 63,0680 1,0000 835,0000 ,0000
Modelcoeff se t p LLCI ULCI
constant ,0000 ,0333 ,0000 1,0000 -,0655 ,0655Zfail ,2650 ,0334 7,9415 ,0000 ,1995 ,3305
Standardized coefficientscoeff
Zfail ,2650
**************************************************************************OUTCOME VARIABLE:Zhate.EP
Model SummaryR R-sq MSE F df1 df2 p
,2766 ,0765 ,9268 23,0036 3,0000 833,0000 ,0000
Modelcoeff se t p LLCI ULCI
constant ,0000 ,0333 ,0000 1,0000 -,0653 ,0653Zfail -,1363 ,0349 -3,9028 ,0001 -,2049 -,0678Zsymboli -,2163 ,0553 -3,9124 ,0001 -,3248 -,1078Zrealist ,0163 ,0547 ,2982 ,7656 -,0911 ,1237
Standardized coefficientscoeff
Zfail -,1363Zsymboli -,2163Zrealist ,0163
************************** TOTAL EFFECT MODEL ****************************OUTCOME VARIABLE:Zhate.EP
137
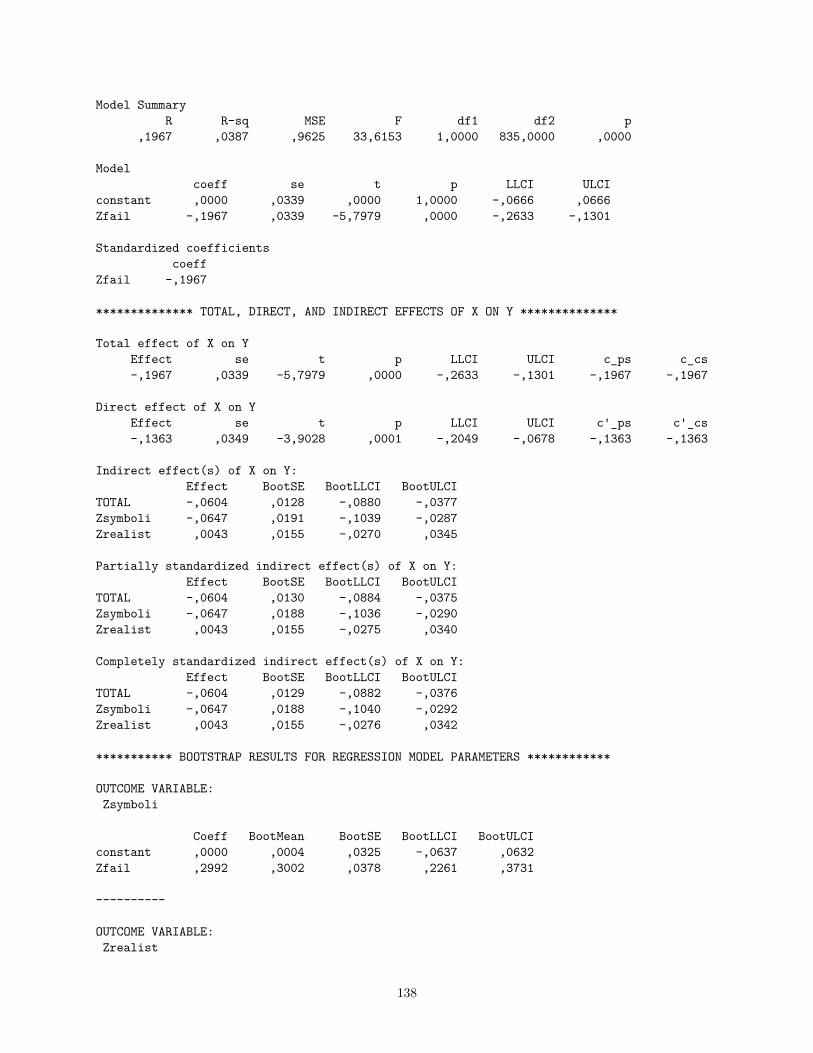
Model SummaryR R-sq MSE F df1 df2 p
,1967 ,0387 ,9625 33,6153 1,0000 835,0000 ,0000
Modelcoeff se t p LLCI ULCI
constant ,0000 ,0339 ,0000 1,0000 -,0666 ,0666Zfail -,1967 ,0339 -5,7979 ,0000 -,2633 -,1301
Standardized coefficientscoeff
Zfail -,1967
************** TOTAL, DIRECT, AND INDIRECT EFFECTS OF X ON Y **************
Total effect of X on YEffect se t p LLCI ULCI c_ps c_cs-,1967 ,0339 -5,7979 ,0000 -,2633 -,1301 -,1967 -,1967
Direct effect of X on YEffect se t p LLCI ULCI c'_ps c'_cs-,1363 ,0349 -3,9028 ,0001 -,2049 -,0678 -,1363 -,1363
Indirect effect(s) of X on Y:Effect BootSE BootLLCI BootULCI
TOTAL -,0604 ,0128 -,0880 -,0377Zsymboli -,0647 ,0191 -,1039 -,0287Zrealist ,0043 ,0155 -,0270 ,0345
Partially standardized indirect effect(s) of X on Y:Effect BootSE BootLLCI BootULCI
TOTAL -,0604 ,0130 -,0884 -,0375Zsymboli -,0647 ,0188 -,1036 -,0290Zrealist ,0043 ,0155 -,0275 ,0340
Completely standardized indirect effect(s) of X on Y:Effect BootSE BootLLCI BootULCI
TOTAL -,0604 ,0129 -,0882 -,0376Zsymboli -,0647 ,0188 -,1040 -,0292Zrealist ,0043 ,0155 -,0276 ,0342
*********** BOOTSTRAP RESULTS FOR REGRESSION MODEL PARAMETERS ************
OUTCOME VARIABLE:Zsymboli
Coeff BootMean BootSE BootLLCI BootULCIconstant ,0000 ,0004 ,0325 -,0637 ,0632Zfail ,2992 ,3002 ,0378 ,2261 ,3731
----------
OUTCOME VARIABLE:Zrealist
138
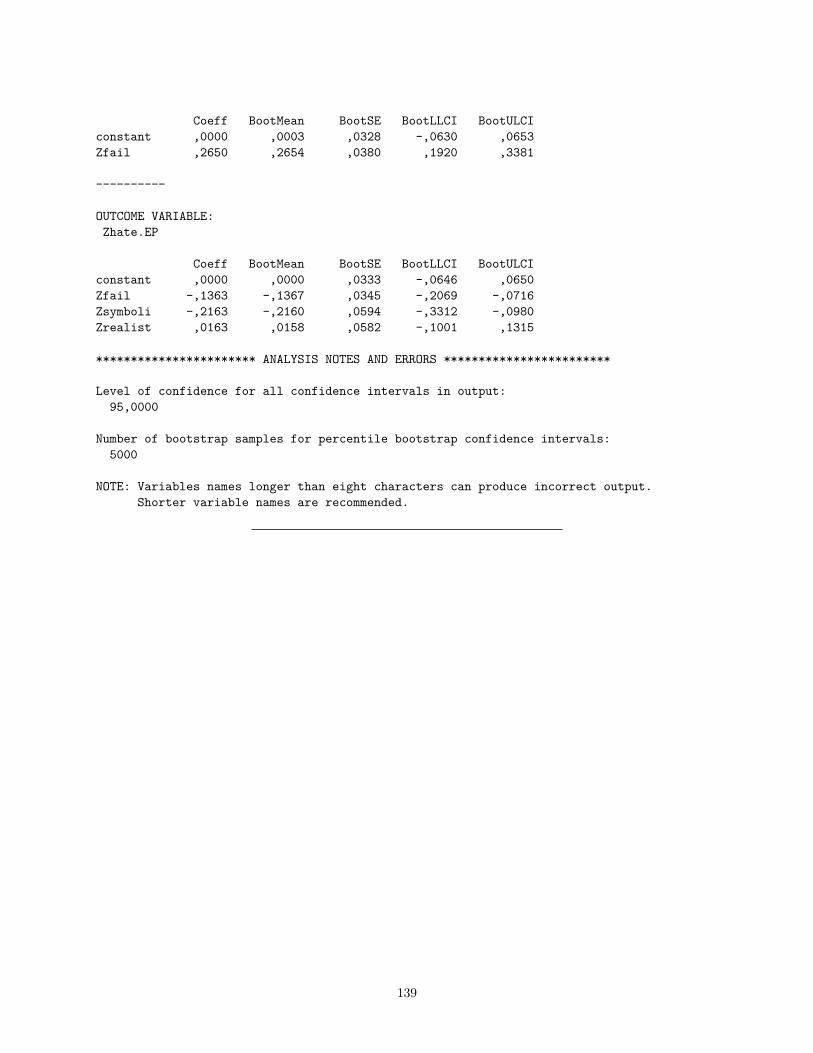
Coeff BootMean BootSE BootLLCI BootULCIconstant ,0000 ,0003 ,0328 -,0630 ,0653Zfail ,2650 ,2654 ,0380 ,1920 ,3381
----------
OUTCOME VARIABLE:Zhate.EP
Coeff BootMean BootSE BootLLCI BootULCIconstant ,0000 ,0000 ,0333 -,0646 ,0650Zfail -,1363 -,1367 ,0345 -,2069 -,0716Zsymboli -,2163 -,2160 ,0594 -,3312 -,0980Zrealist ,0163 ,0158 ,0582 -,1001 ,1315
*********************** ANALYSIS NOTES AND ERRORS ************************
Level of confidence for all confidence intervals in output:95,0000
Number of bootstrap samples for percentile bootstrap confidence intervals:5000
NOTE: Variables names longer than eight characters can produce incorrect output.Shorter variable names are recommended.
139

Software InfoWe used RStudio Version 1.2.1335 to analyse all data (except for the path models for with we used thePROCESS macro (v.3.3) in SPSS (v.25) in order to stay consistent with current standard in the field).Below you can find the full R session info:
R version 3.6.2 (2019-12-12)
Platform: x86_64-apple-darwin15.6.0 (64-bit)
locale: en_US.UTF-8||en_US.UTF-8||en_US.UTF-8||C||en_US.UTF-8||en_US.UTF-8
attached base packages:
• grid• parallel• stats• graphics• grDevices• utils• datasets• methods• base
other attached packages:
• dplyr(v.0.8.4)• plyr(v.1.8.5)• multcomp(v.1.4-12)• TH.data(v.1.0-10)• MASS(v.7.3-51.4)• prettydoc(v.0.3.1)• gdata(v.2.18.0)• scales(v.1.1.0)• ggbeeswarm(v.0.6.0)• tinytex(v.0.19)• pander(v.0.6.3)• rlme(v.0.5)• WRS2(v.1.0-0)• MANOVA.RM(v.0.3.4)• fBasics(v.3042.89)• timeSeries(v.3062.100)• timeDate(v.3043.102)• car(v.3.0-6)• ggthemes(v.4.2.0)• gridExtra(v.2.3)• TOSTER(v.0.3.4)• GPArotation(v.2014.11-1)• kableExtra(v.1.1.0)• jtools(v.2.0.2)• metafor(v.2.1-0)• meta(v.4.10-0)• DiagrammeR(v.1.0.5.9000)• igraph(v.1.2.4.2)• lavaanPlot(v.0.5.1)• semPlot(v.1.1.2)• sjPlot(v.2.8.2)• sjstats(v.0.17.8)
140
• effects(v.4.1-4)• carData(v.3.0-3)• robustlmm(v.2.3)• nlme(v.3.1-142)• lme4(v.1.1-21)• Matrix(v.1.2-18)• lavaan(v.0.6-5)• devtools(v.2.2.1)• usethis(v.1.5.1)• knitr(v.1.28)• mada(v.0.5.9)• mvmeta(v.1.0.3)• ellipse(v.0.4.1)• mvtnorm(v.1.0-12)• Hmisc(v.4.3-0)• Formula(v.1.2-3)• survival(v.3.1-8)• lattice(v.0.20-38)• stargazer(v.5.2.2)• forcats(v.0.4.0)• stringr(v.1.4.0)• purrr(v.0.3.3)• readr(v.1.3.1)• tibble(v.2.1.3)• tidyverse(v.1.3.0)• tidyr(v.1.0.2)• data.table(v.1.12.8)• haven(v.2.2.0)• ggplot2(v.3.2.1)• psych(v.1.9.12.31)• pacman(v.0.5.1)
loaded via a namespace (and not attached):
• reports(v.0.1.4)• estimability(v.1.3)• SparseM(v.1.78)• qdapTools(v.1.3.3)• coda(v.0.19-3)• acepack(v.1.4.1)• rpart(v.4.1-15)• RCurl(v.1.98-1.1)• generics(v.0.0.2)• qdapRegex(v.0.7.2)• callr(v.3.4.1)• openNLP(v.0.2-7)• openNLPdata(v.1.5.3-4)• chron(v.2.3-54)• webshot(v.0.5.2)• xml2(v.1.2.2)• lubridate(v.1.7.4)• assertthat(v.0.2.1)• d3Network(v.0.5.2.1)• xfun(v.0.12)• rJava(v.0.9-11)
141
• hms(v.0.5.3)• evaluate(v.0.14)• DEoptimR(v.1.0-8)• fansi(v.0.4.1)• dbplyr(v.1.4.2)• readxl(v.1.3.1)• DBI(v.1.1.0)• Rsolnp(v.1.16)• htmlwidgets(v.1.5.1)• reshape(v.0.8.8)• stats4(v.3.6.2)• ellipsis(v.0.3.0)• backports(v.1.1.5)• pbivnorm(v.0.6.0)• insight(v.0.8.0)• survey(v.3.37)• vctrs(v.0.2.2)• quantreg(v.5.54)• remotes(v.2.1.0)• sjlabelled(v.1.1.3)• abind(v.1.4-5)• withr(v.2.1.2)• robustbase(v.0.93-5)• checkmate(v.1.9.4)• emmeans(v.1.4.4)• fdrtool(v.1.2.15)• prettyunits(v.1.1.1)• fastGHQuad(v.1.0)• mnormt(v.1.5-5)• cluster(v.2.1.0)• mi(v.1.0)• lazyeval(v.0.2.2)• crayon(v.1.3.4)• slam(v.0.1-47)• labeling(v.0.3)• pkgconfig(v.2.0.3)• wordcloud(v.2.6)• vipor(v.0.4.5)• pkgload(v.1.0.2)• ggm(v.2.3)• nnet(v.7.3-12)• rlang(v.0.4.4)• spatial(v.7.3-11)• lifecycle(v.0.1.0)• MatrixModels(v.0.4-1)• sandwich(v.2.5-1)• kutils(v.1.69)• modelr(v.0.1.5)• cellranger(v.1.1.0)• rprojroot(v.1.3-2)• regsem(v.1.3.9)• mc2d(v.0.1-18)• boot(v.1.3-23)• zoo(v.1.8-7)
142
• beeswarm(v.0.2.3)• reprex(v.0.3.0)• base64enc(v.0.1-3)• whisker(v.0.4)• processx(v.3.4.1)• png(v.0.1-7)• viridisLite(v.0.3.0)• rjson(v.0.2.20)• bitops(v.1.0-6)• parameters(v.0.4.1)• diagram(v.1.6.4)• visNetwork(v.2.0.9)• shape(v.1.4.4)• arm(v.1.10-1)• jpeg(v.0.1-8.1)• rockchalk(v.1.8.144)• venneuler(v.1.1-0)• ggeffects(v.0.14.1)• memoise(v.1.1.0)• magrittr(v.1.5)• compiler(v.3.6.2)• RColorBrewer(v.1.1-2)• plotrix(v.3.7-7)• cli(v.2.0.1)• lmerTest(v.3.1-1)• TMB(v.1.7.16)• pbapply(v.1.4-2)• ps(v.1.3.0)• magic(v.1.5-9)• htmlTable(v.1.13.3)• mgcv(v.1.8-31)• tidyselect(v.1.0.0)• stringi(v.1.4.5)• lisrelToR(v.0.1.4)• mixmeta(v.1.0.7)• sem(v.3.1-9)• mitools(v.2.4)• yaml(v.2.2.1)• OpenMx(v.2.15.5)• latticeExtra(v.0.6-29)• tools(v.3.6.2)• rio(v.0.5.16)• matrixcalc(v.1.0-3)• rstudioapi(v.0.11)• foreign(v.0.8-72)• farver(v.2.0.3)• BDgraph(v.2.62)• digest(v.0.6.23)• Rcpp(v.1.0.3)• broom(v.0.5.4)• xlsx(v.0.6.1)• gender(v.0.5.3)• performance(v.0.4.3)• httr(v.1.4.1)
143
• effectsize(v.0.1.1)• colorspace(v.1.4-1)• rvest(v.0.3.5)• XML(v.3.99-0.3)• fs(v.1.3.1)• truncnorm(v.1.0-8)• splines(v.3.6.2)• Scale(v.1.0.4)• xlsxjars(v.0.6.1)• sessioninfo(v.1.1.1)• xtable(v.1.8-4)• jsonlite(v.1.6.1)• nloptr(v.1.2.1)• corpcor(v.1.6.9)• NLP(v.0.2-0)• glasso(v.1.11)• testthat(v.2.3.1)• R6(v.2.4.1)• tm(v.0.7-7)• qdap(v.2.3.6)• pillar(v.1.4.3)• htmltools(v.0.4.0)• glue(v.1.3.1)• minqa(v.1.2.4)• codetools(v.0.2-16)• pkgbuild(v.1.0.6)• numDeriv(v.2016.8-1.1)• huge(v.1.3.4)• curl(v.4.3)• gtools(v.3.8.1)• qdapDictionaries(v.1.0.7)• zip(v.2.0.4)• openxlsx(v.4.1.4)• glmmTMB(v.0.2.3)• CompQuadForm(v.1.4.3)• rmarkdown(v.2.1)• qgraph(v.1.6.4)• desc(v.1.2.0)• munsell(v.0.5.0)• sjmisc(v.2.8.3)• reshape2(v.1.4.3)• gtable(v.0.3.0)• bayestestR(v.0.5.1)
144
Supplementary Information B
Full Survey of Study 1: Pittsburgh Synagogue Shooting / Thousand Oaks Bar Shooting
The following supplementary appendix includes the full survey print-outs for Study 1. This
study uses two repeated measures survey data sets from 2018. Participants were recruited
after the Pittsburgh synagogue shooting (see below ‘MTurk – Pittsburgh – Oct. 2018’) and
re-contacted after the Thousand Oaks bar shooting (see below ‘MTurk - Thousand Oaks –
Nov. 2018’).
MTurk - Pittsburgh - Oct. 2018
Start of Block: Informed Consent Timing First Click Last Click Page Submit Click Count Informed Consent Primary investigator: Dr. N. P. Leander, PhDThis university-based psychological study will ask about your beliefs, attitudes, and experiences regarding potential gun ownership and the use of firearms. Also included are some short questions about the recent Pittsburgh synagogue shooting. The study typically takes 10-15 minutes. Your privacy is important: Your participation is completely anonymous. No identifying information will be collected from you. Only members of the research team will have access to the survey data, but even they cannot link the data to any single person. Your rights: You can decide whether or not to participate in the study. You can leave the study at any time.
145
You may click "Next" to begin when ready. Browser Meta Info Browser Version Operating System Screen Resolution Flash Version Java Support User Agent
End of Block: Informed Consent Start of Block: Demographics
Gender
o Male
o Female
Age
o 18-24
o 25-34
o 35-44
o 45-54
o 55-64
o 65+
146
Racial/ethnic background
▢ White
▢ Black or African American
▢ Hispanic / Latino / Latina
▢ American Indian or Alaska Native
▢ Asian
▢ Native Hawaiian or Pacific Islander
▢ Other ________________________________________________ Timing First Click Last Click Page Submit Click Count Page Break
147
Education
o Some High School or Less
o High School Graduate / GED
o Some College
o College Graduate
o Graduate Degree
What is your annual income?
o Under $15,000
o $15,000 - $25,000
o $25,000 - $35,000
o $35,000 - $50,000
o $50,000 - $75,000
o $75,000 - $100,000
o $100,000 - $150,000
o $150,000 - $200,000
o $200,000 +
148

Timing First Click Last Click Page Submit Click Count Page Break
149
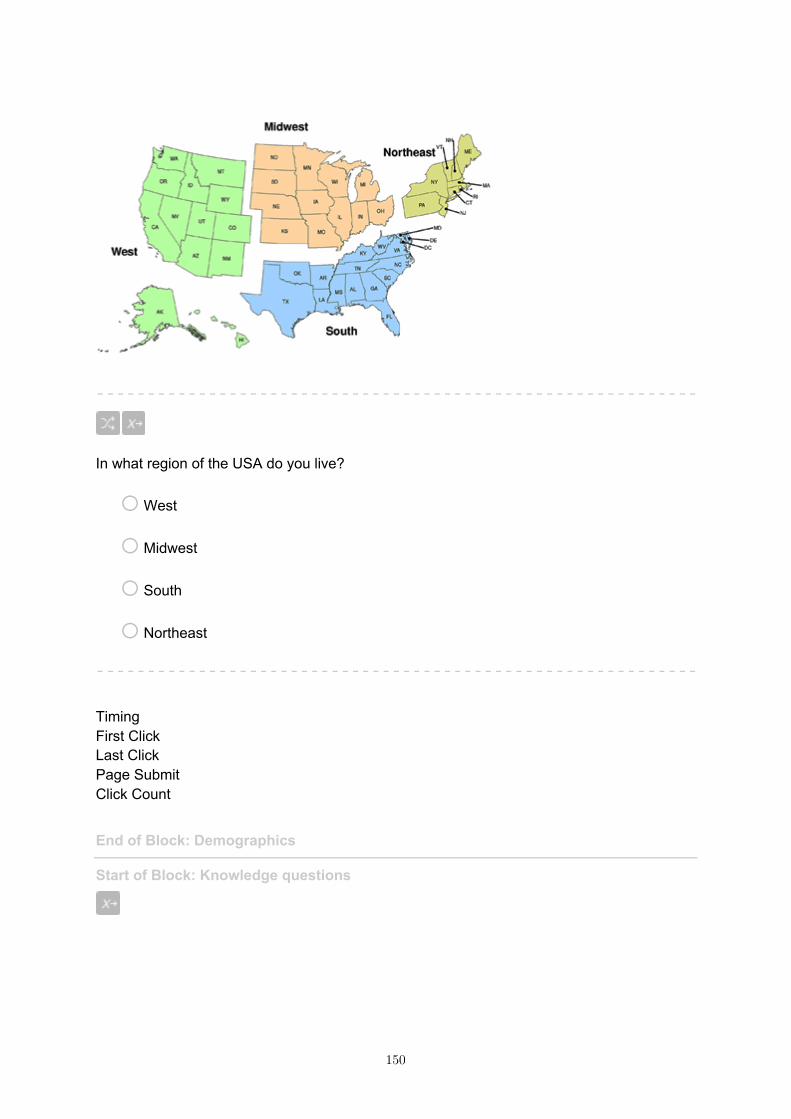
In what region of the USA do you live?
o West
o Midwest
o South
o Northeast Timing First Click Last Click Page Submit Click Count
End of Block: Demographics Start of Block: Knowledge questions
150
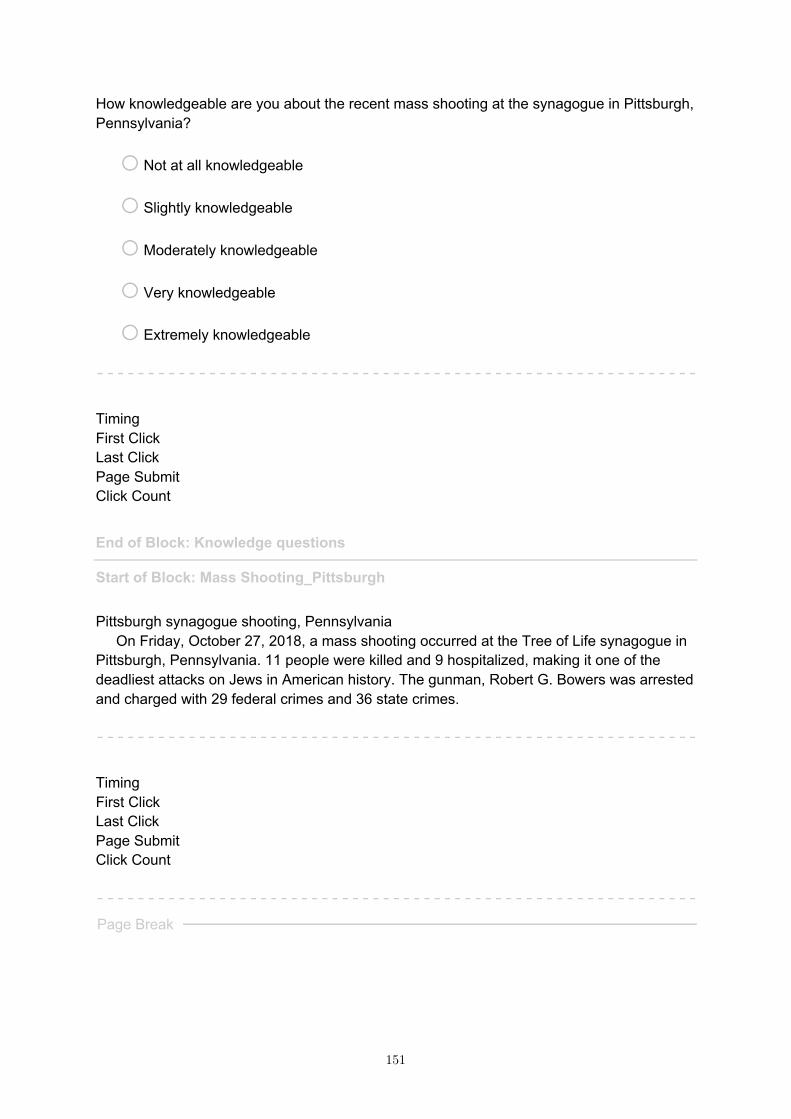
How knowledgeable are you about the recent mass shooting at the synagogue in Pittsburgh, Pennsylvania?
o Not at all knowledgeable
o Slightly knowledgeable
o Moderately knowledgeable
o Very knowledgeable
o Extremely knowledgeable Timing First Click Last Click Page Submit Click Count
End of Block: Knowledge questions Start of Block: Mass Shooting_Pittsburgh Pittsburgh synagogue shooting, Pennsylvania On Friday, October 27, 2018, a mass shooting occurred at the Tree of Life synagogue in Pittsburgh, Pennsylvania. 11 people were killed and 9 hospitalized, making it one of the deadliest attacks on Jews in American history. The gunman, Robert G. Bowers was arrested and charged with 29 federal crimes and 36 state crimes. Timing First Click Last Click Page Submit Click Count Page Break
151

On the next few screens are questions about your views on the mass shooting: (1) what might have prevented it; (2) what might have motivated the gunman. Timing First Click Last Click Page Submit Click Count Page Break
152
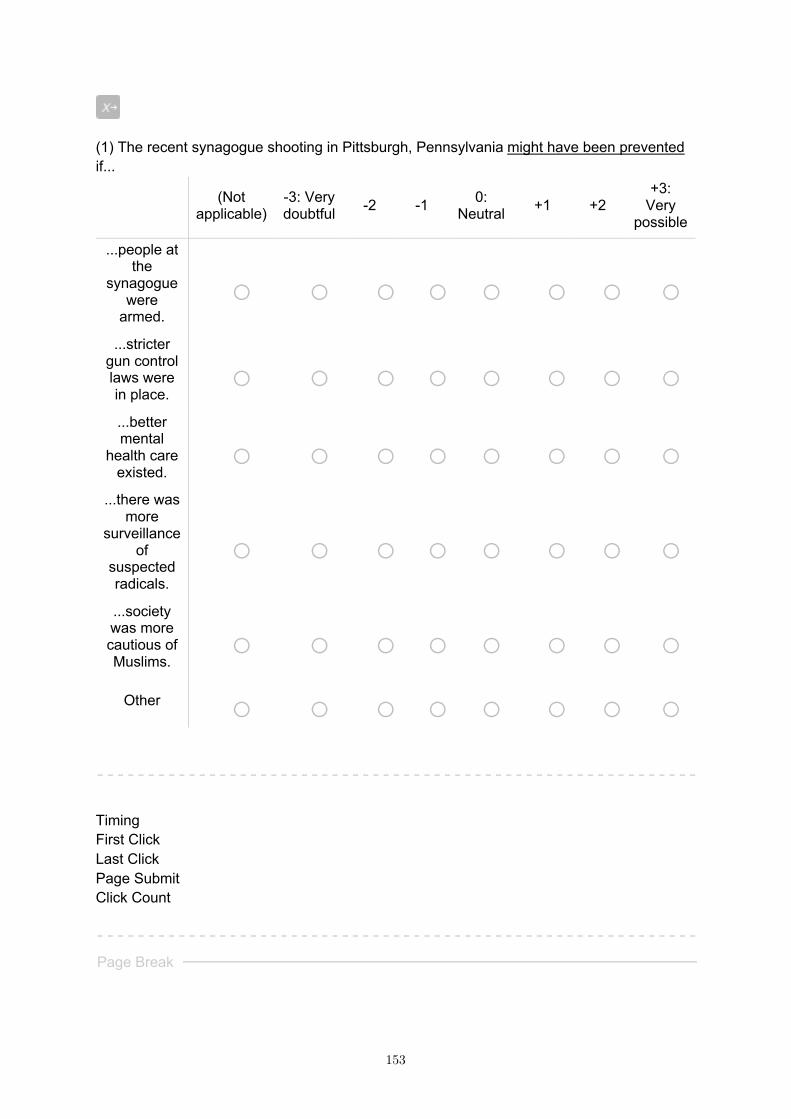
(1) The recent synagogue shooting in Pittsburgh, Pennsylvania might have been prevented if...
(Not applicable)
-3: Very doubtful -2 -1 0:
Neutral +1 +2 +3:
Very possible
...people at the
synagogue were
armed. o o o o o o o o
...stricter gun control laws were in place.
o o o o o o o o ...better mental
health care existed.
o o o o o o o o ...there was
more surveillance
of suspected radicals.
o o o o o o o o ...society was more cautious of Muslims.
o o o o o o o o Other o o o o o o o o
Timing First Click Last Click Page Submit Click Count Page Break
153
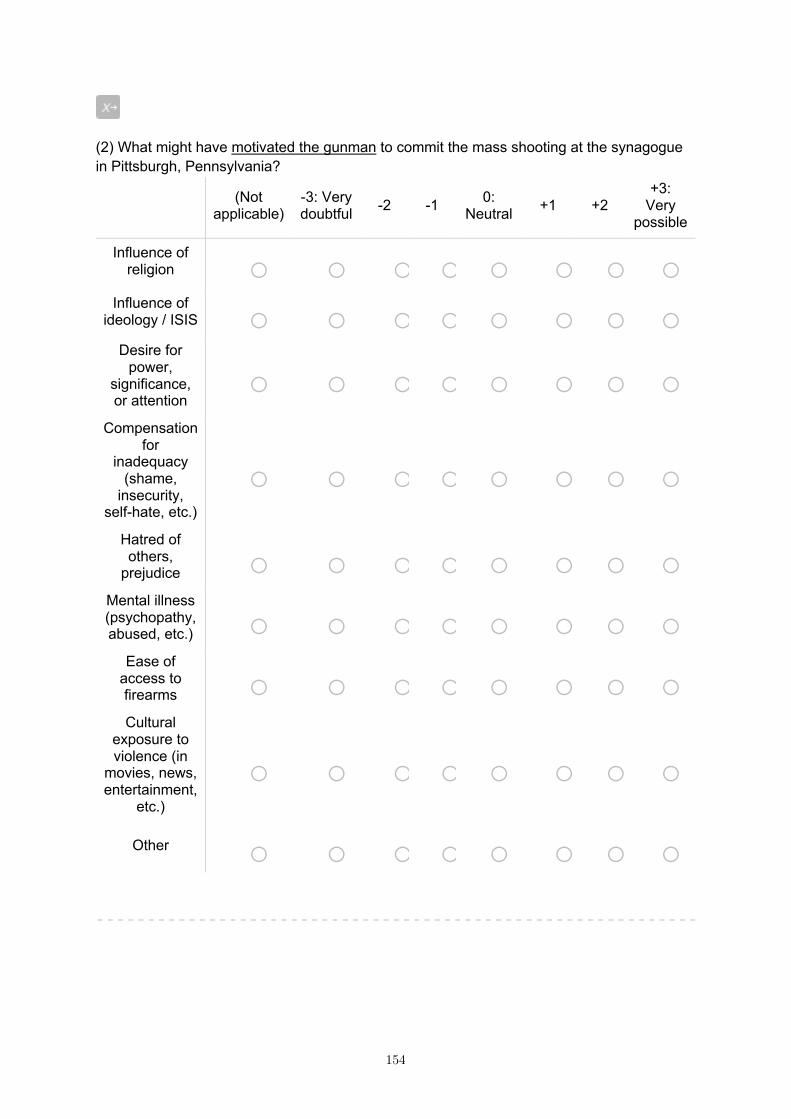
(2) What might have motivated the gunman to commit the mass shooting at the synagogue in Pittsburgh, Pennsylvania?
(Not applicable)
-3: Very doubtful -2 -1 0:
Neutral +1 +2 +3:
Very possible
Influence of religion o o o o o o o o
Influence of ideology / ISIS o o o o o o o o
Desire for power,
significance, or attention
o o o o o o o o Compensation
for inadequacy
(shame, insecurity,
self-hate, etc.)
o o o o o o o o Hatred of others,
prejudice o o o o o o o o Mental illness (psychopathy, abused, etc.) o o o o o o o o
Ease of access to firearms o o o o o o o o Cultural
exposure to violence (in
movies, news, entertainment,
etc.)
o o o o o o o o
Other o o o o o o o o
154

Timing First Click Last Click Page Submit Click Count Page Break
155
(3) Did the gunman have any of the following goals?
(Not applicable)
-3: Very doubtful -2 -1 0:
Neutral +1 +2 +3: Very possible
The gunman wanted respect
o o o o o o o o The
gunman wanted to be
important o o o o o o o o
The gunman wanted to be
famous o o o o o o o o
Timing First Click Last Click Page Submit Click Count
End of Block: Mass Shooting_Pittsburgh Start of Block: Owngun Next, we would like to ask you some gun-related questions. Page Break
156
Timing First Click Last Click Page Submit Click Count
Do you own a gun?
o Yes
o No
What type(s) of gun(s) do you personally own? (click all that apply)
▢ Handgun
▢ Precision rifle
▢ Modern sporting rifle (AR-15, AK-style)
▢ Shotgun
▢ Other (specify) ________________________________________________
▢ Not applicable / None of the above
157
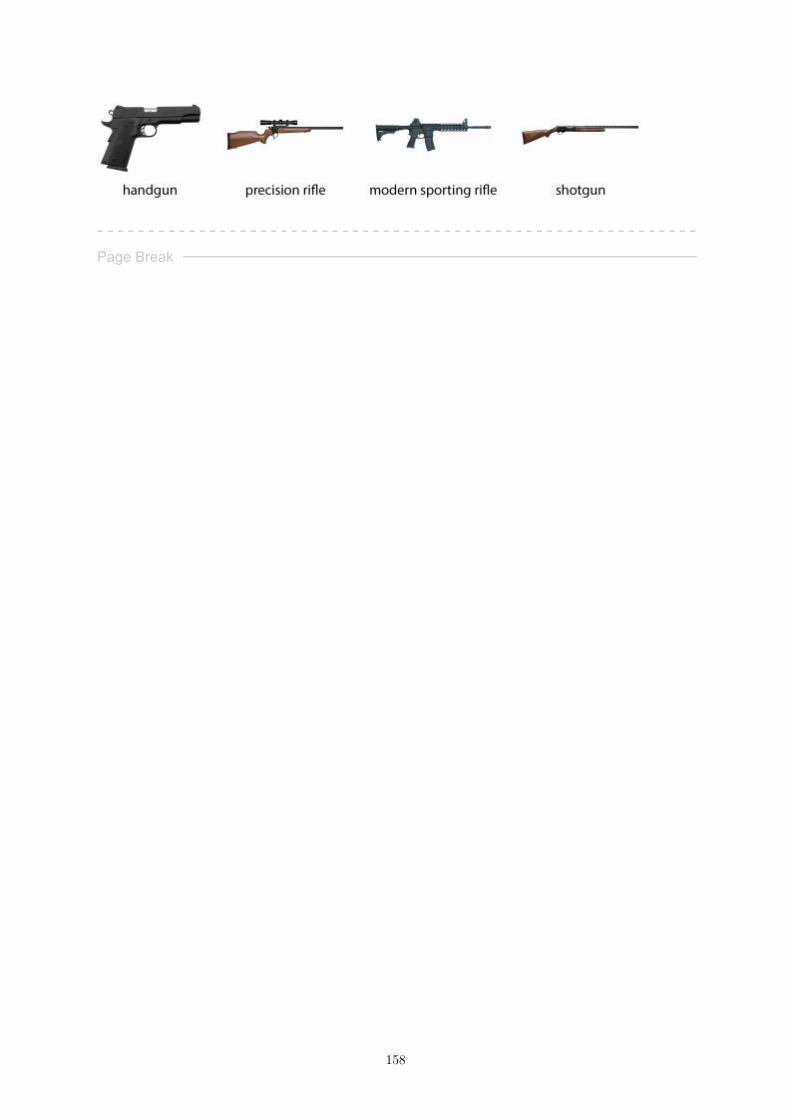
Page Break
158
To what extent do you see your gun as a central part of who you are? Please indicate the picture which best describes how much your gun represents you as a person.
o Image:1.png
o Image:2.png
o Image:3.png
o Image:4.png
o Image:5.png
o Image:6.png
o Image:7.png
o Image:8.png Timing First Click Last Click Page Submit Click Count
End of Block: Owngun Start of Block: Wolfgang_GunControl_Laws Timing First Click Last Click Page Submit Click Count
159
In general, do you think the laws covering the sale of firearms should be made more strict, less strict, or kept as they are now?
o 1: Much less strict
o 2
o 3
o 4: Neutral
o 5
o 6
o 7: Much more strict
Do you support or oppose some kind of registry of all guns, at least at the state-government level?
o 1: Strongly oppose a gun registry
o 2
o 3
o 4: Neutral
o 5
o 6
o 7: Strongly support a gun registry
160
Do you support or oppose laws that create "gun free zones" at schools and other public places?
o 1: Strongly oppose "gun free zones"
o 2
o 3
o 4: Neutral
o 5
o 6
o 7: Strongly support "gun free zones"
End of Block: Wolfgang_GunControl_Laws Start of Block: gunbuy Timing First Click Last Click Page Submit Click Count
161
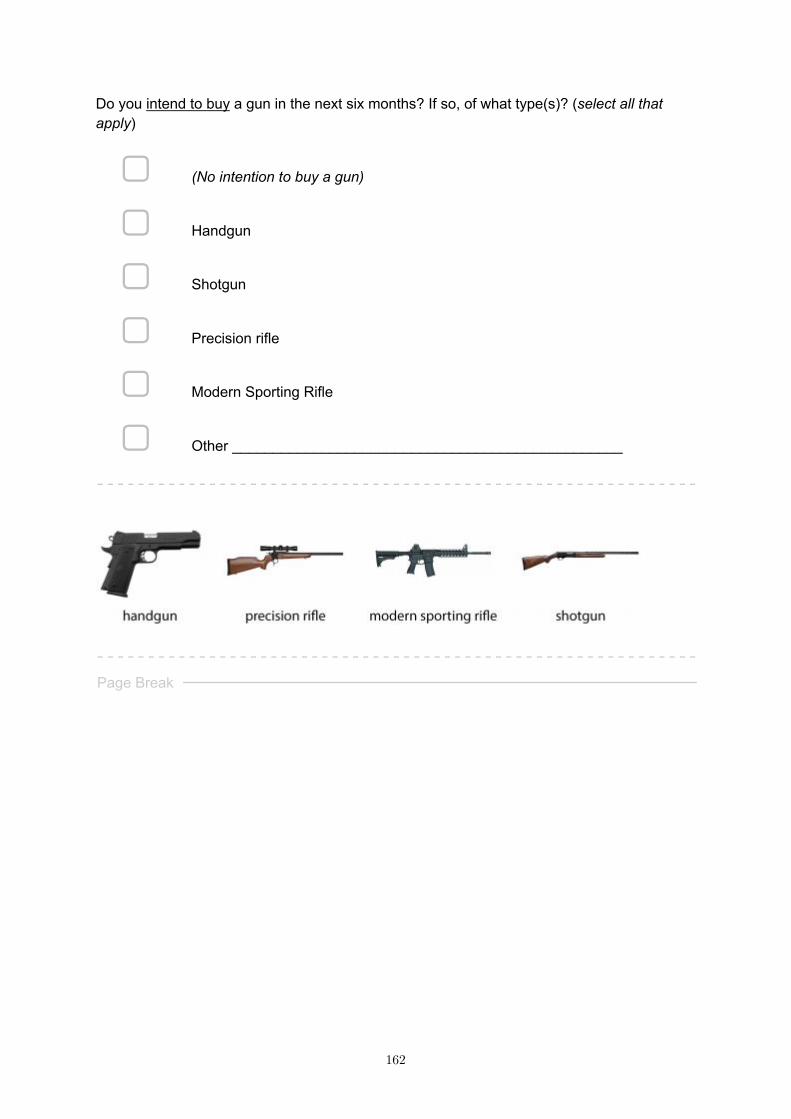
Do you intend to buy a gun in the next six months? If so, of what type(s)? (select all that apply)
▢ (No intention to buy a gun)
▢ Handgun
▢ Shotgun
▢ Precision rifle
▢ Modern Sporting Rifle
▢ Other ________________________________________________
Page Break
162
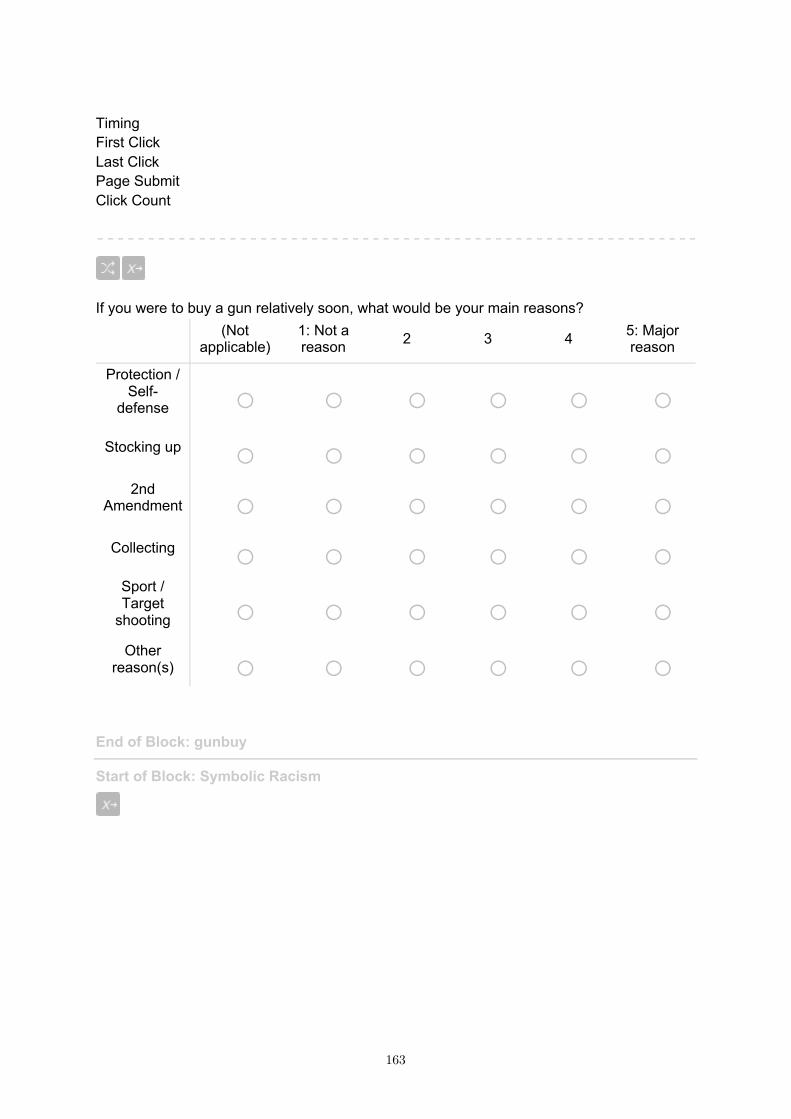
Timing First Click Last Click Page Submit Click Count
If you were to buy a gun relatively soon, what would be your main reasons?
(Not applicable)
1: Not a reason 2 3 4 5: Major
reason
Protection / Self-
defense o o o o o o Stocking up o o o o o o
2nd Amendment o o o o o o Collecting o o o o o o
Sport / Target
shooting o o o o o o Other
reason(s) o o o o o o
End of Block: gunbuy Start of Block: Symbolic Racism
163
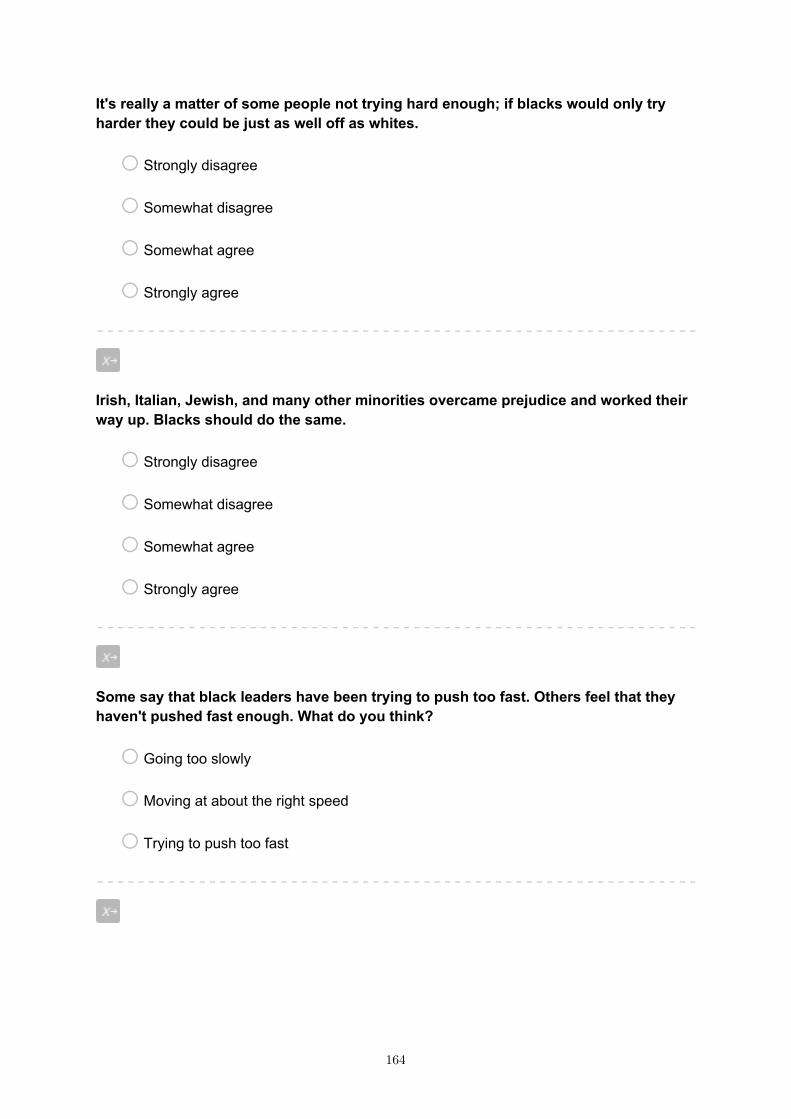
It's really a matter of some people not trying hard enough; if blacks would only try harder they could be just as well off as whites.
o Strongly disagree
o Somewhat disagree
o Somewhat agree
o Strongly agree
Irish, Italian, Jewish, and many other minorities overcame prejudice and worked their way up. Blacks should do the same.
o Strongly disagree
o Somewhat disagree
o Somewhat agree
o Strongly agree
Some say that black leaders have been trying to push too fast. Others feel that they haven't pushed fast enough. What do you think?
o Going too slowly
o Moving at about the right speed
o Trying to push too fast
164
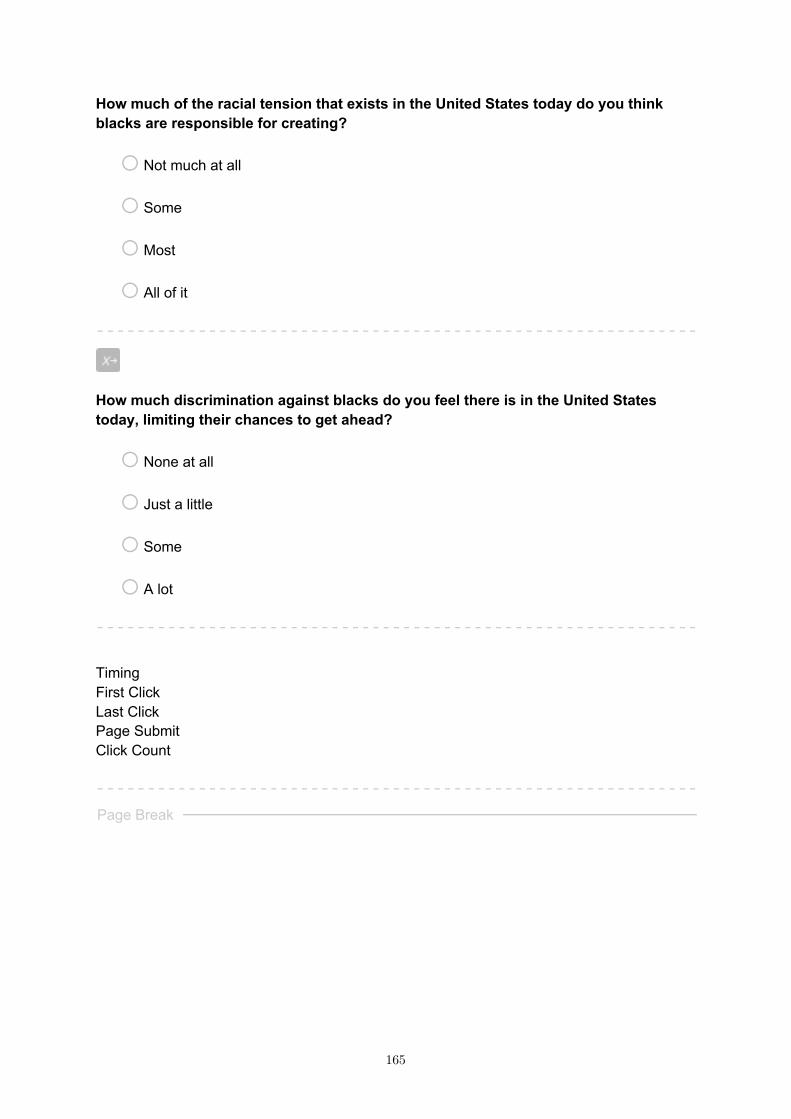
How much of the racial tension that exists in the United States today do you think blacks are responsible for creating?
o Not much at all
o Some
o Most
o All of it
How much discrimination against blacks do you feel there is in the United States today, limiting their chances to get ahead?
o None at all
o Just a little
o Some
o A lot Timing First Click Last Click Page Submit Click Count Page Break
165
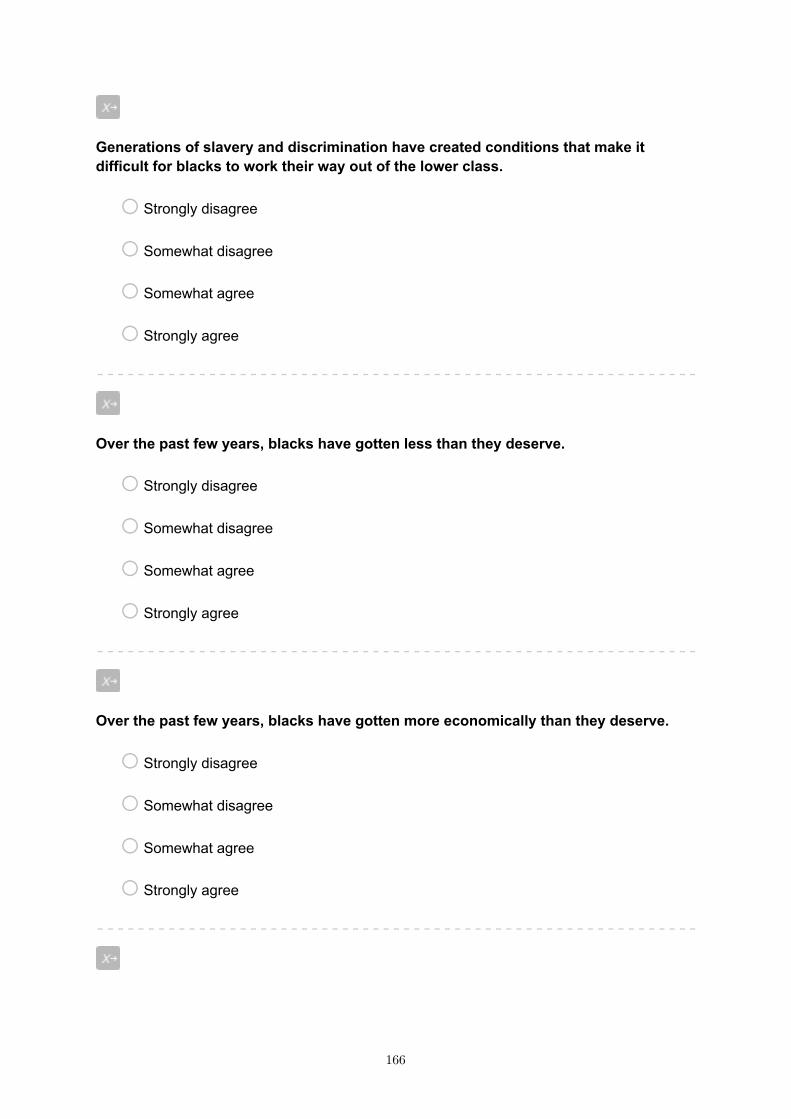
Generations of slavery and discrimination have created conditions that make it difficult for blacks to work their way out of the lower class.
o Strongly disagree
o Somewhat disagree
o Somewhat agree
o Strongly agree
Over the past few years, blacks have gotten less than they deserve.
o Strongly disagree
o Somewhat disagree
o Somewhat agree
o Strongly agree
Over the past few years, blacks have gotten more economically than they deserve.
o Strongly disagree
o Somewhat disagree
o Somewhat agree
o Strongly agree
166
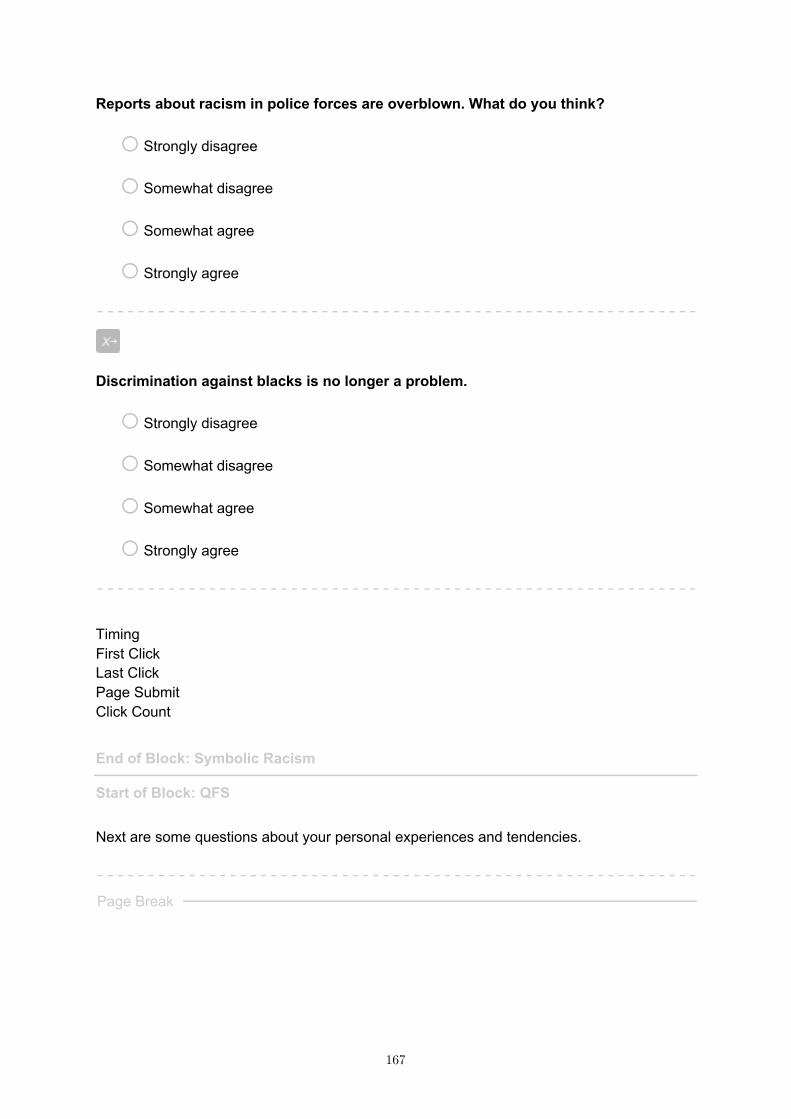
Reports about racism in police forces are overblown. What do you think?
o Strongly disagree
o Somewhat disagree
o Somewhat agree
o Strongly agree
Discrimination against blacks is no longer a problem.
o Strongly disagree
o Somewhat disagree
o Somewhat agree
o Strongly agree Timing First Click Last Click Page Submit Click Count
End of Block: Symbolic Racism Start of Block: QFS Next are some questions about your personal experiences and tendencies. Page Break
167

168

Think about your life right now and express your level of agreement with each of the following statements.
169
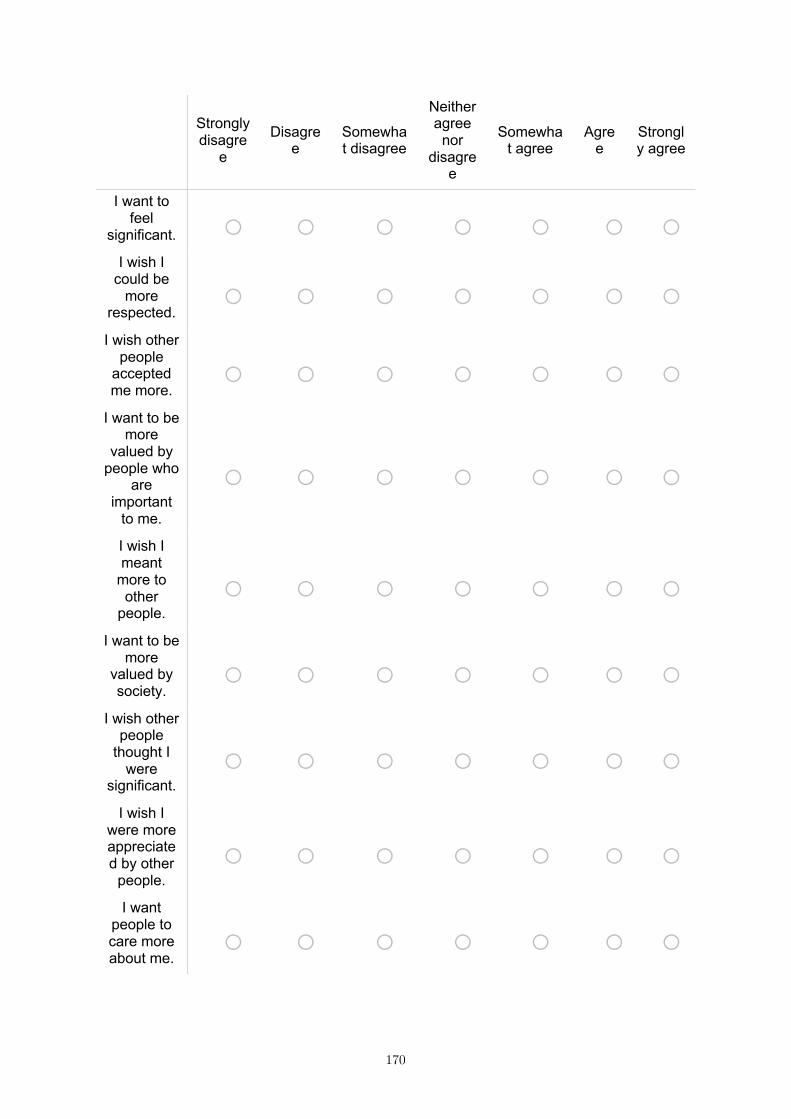
Strongly disagre
e
Disagree
Somewhat disagree
Neither agree nor
disagree
Somewhat agree
Agree
Strongly agree
I want to feel
significant. o o o o o o o I wish I
could be more
respected. o o o o o o o
I wish other people
accepted me more.
o o o o o o o I want to be
more valued by
people who are
important to me.
o o o o o o o
I wish I meant
more to other
people. o o o o o o o
I want to be more
valued by society.
o o o o o o o I wish other
people thought I
were significant.
o o o o o o o I wish I
were more appreciated by other
people. o o o o o o o
I want people to care more about me.
o o o o o o o
170
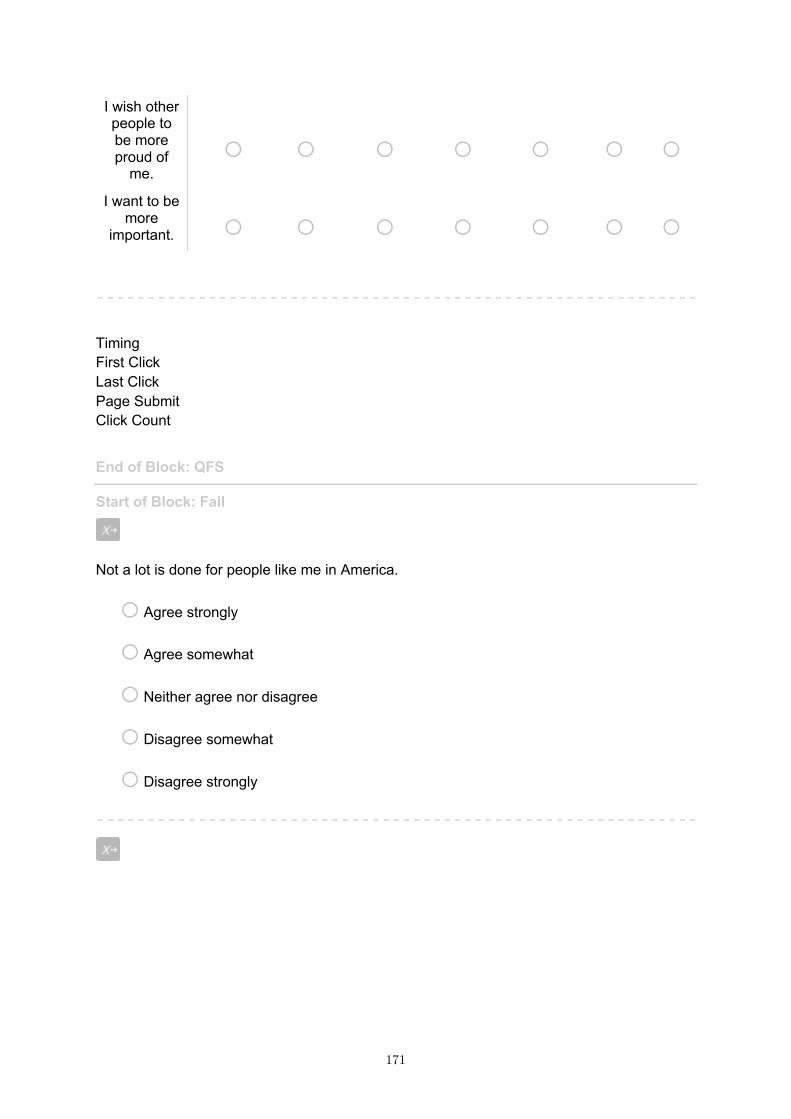
I wish other people to be more proud of
me. o o o o o o o
I want to be more
important. o o o o o o o Timing First Click Last Click Page Submit Click Count
End of Block: QFS Start of Block: Fail
Not a lot is done for people like me in America.
o Agree strongly
o Agree somewhat
o Neither agree nor disagree
o Disagree somewhat
o Disagree strongly
171
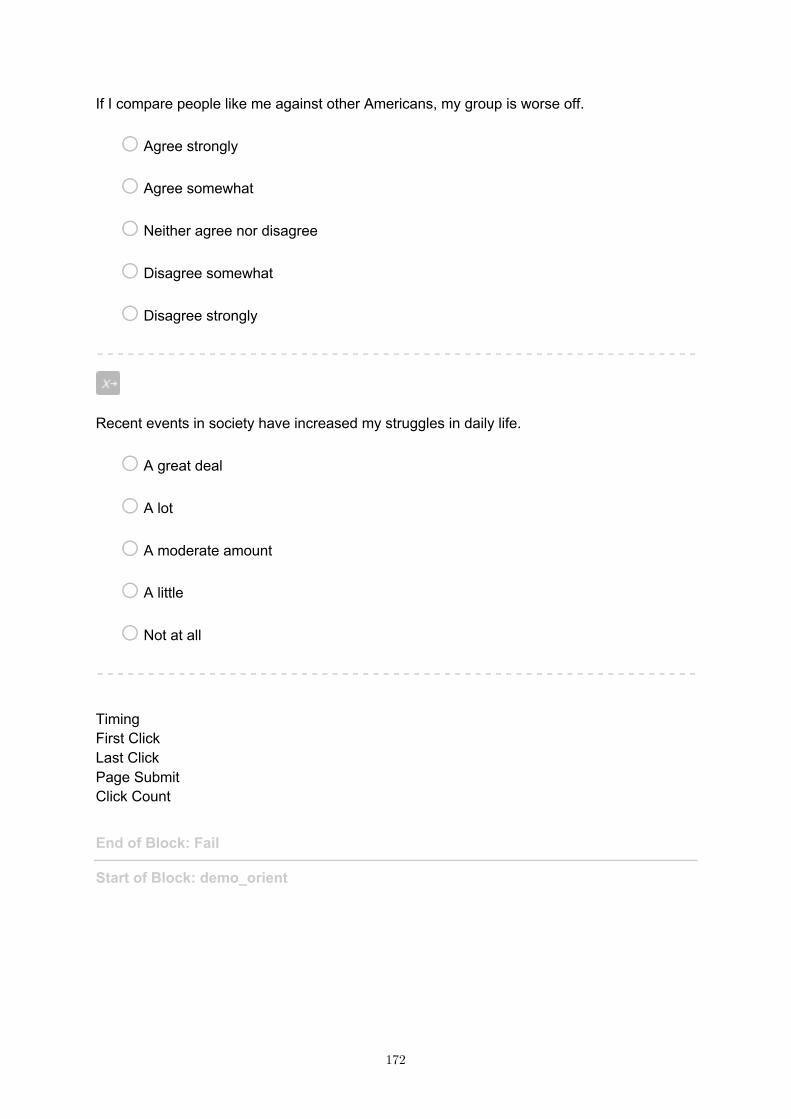
If I compare people like me against other Americans, my group is worse off.
o Agree strongly
o Agree somewhat
o Neither agree nor disagree
o Disagree somewhat
o Disagree strongly
Recent events in society have increased my struggles in daily life.
o A great deal
o A lot
o A moderate amount
o A little
o Not at all Timing First Click Last Click Page Submit Click Count
End of Block: Fail Start of Block: demo_orient
172
Timing First Click Last Click Page Submit Click Count
In which state do you currently reside?
▼ Alabama ... I do not reside in the United States
What is your political orientation?
o 1: Extremely conservative
o 2
o 3
o 4
o 5
o 6
o 7
o 8
o 9: Extremely liberal
173
Where do you stand with regards to the current U.S. President's policies?
o Oppose broadly
o More opposed than support
o Neutral / Mixed
o More support than oppose
o Support broadly
End of Block: demo_orient Start of Block: religaffil
What is your current religious affiliation, if any?
o Catholic (including roman catholic and orthodox)
o Protestant (Anglican, Orthodox, Baptist, Lutheran)
o Jewish
o Muslim
o Sikh
o Hindu
o Buddhist
o Atheist
o Agnostic
o None
o Other ________________________________________________ Page Break
174

175

About how often do you attend church (or other organized religious services)?
o Never
o Rarely / Almost never
o At least once a year
o At least once a month
o At least once a week
End of Block: religaffil Start of Block: Christianity
176
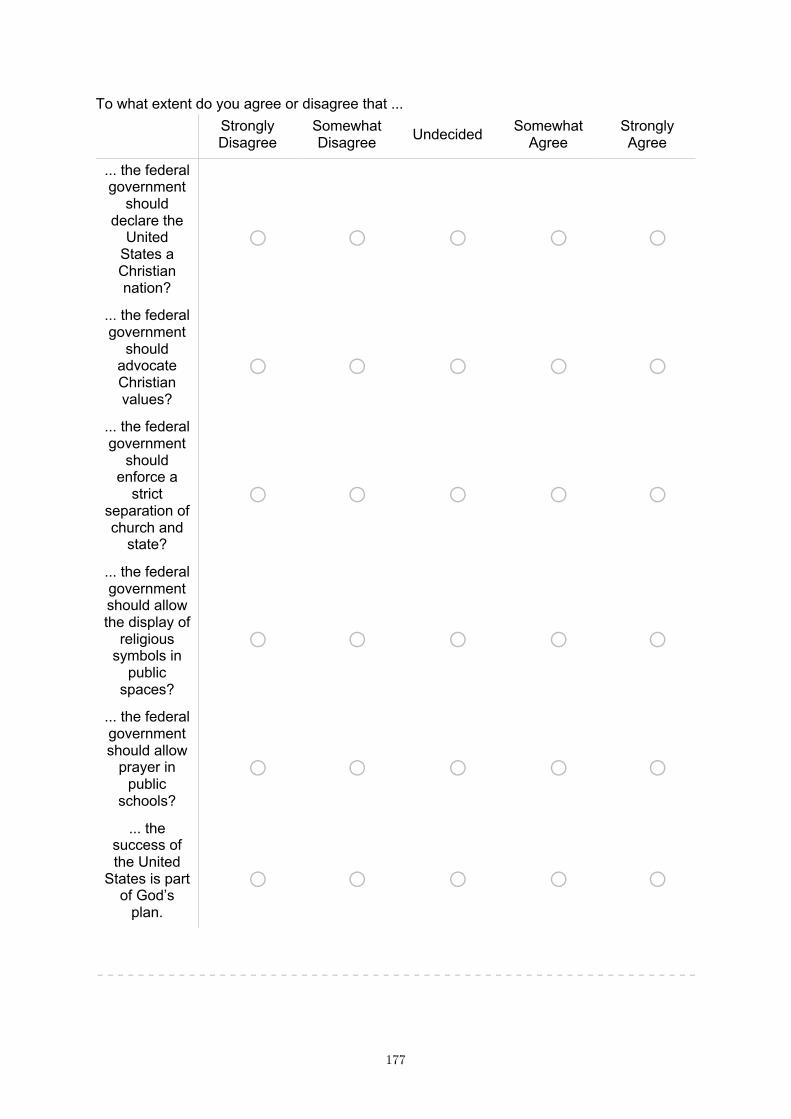
To what extent do you agree or disagree that ...
Strongly Disagree
Somewhat Disagree Undecided Somewhat
Agree Strongly Agree
... the federal government
should declare the
United States a Christian nation?
o o o o o
... the federal government
should advocate Christian values?
o o o o o ... the federal government
should enforce a
strict separation of church and
state?
o o o o o
... the federal government should allow the display of
religious symbols in
public spaces?
o o o o o
... the federal government should allow
prayer in public
schools?
o o o o o ... the
success of the United
States is part of God’s
plan.
o o o o o
177
Timing First Click Last Click Page Submit Click Count
End of Block: Christianity Start of Block: Jewish
Please select the picture that best describes your closeness to the Jewish people.
o Image:close1.png
o Image:close2.png
o Image:close3.png
o Image:close4.png
o Image:close5.png
o Image:close6.png
o Image:close7.png Page Break
178
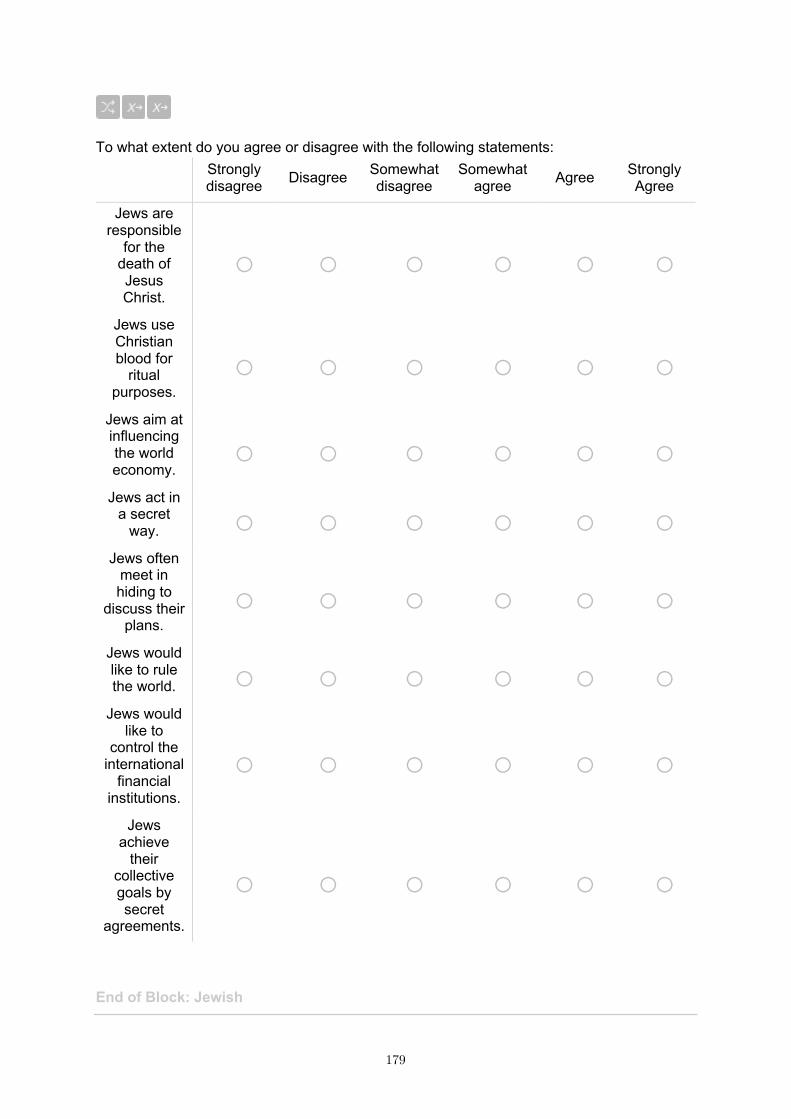
To what extent do you agree or disagree with the following statements:
Strongly disagree Disagree Somewhat
disagree Somewhat
agree Agree Strongly Agree
Jews are responsible
for the death of Jesus Christ.
o o o o o o Jews use Christian blood for
ritual purposes.
o o o o o o Jews aim at influencing the world economy.
o o o o o o Jews act in
a secret way. o o o o o o
Jews often meet in hiding to
discuss their plans.
o o o o o o Jews would like to rule the world. o o o o o o
Jews would like to
control the international
financial institutions.
o o o o o o Jews
achieve their
collective goals by secret
agreements.
o o o o o o
End of Block: Jewish
179
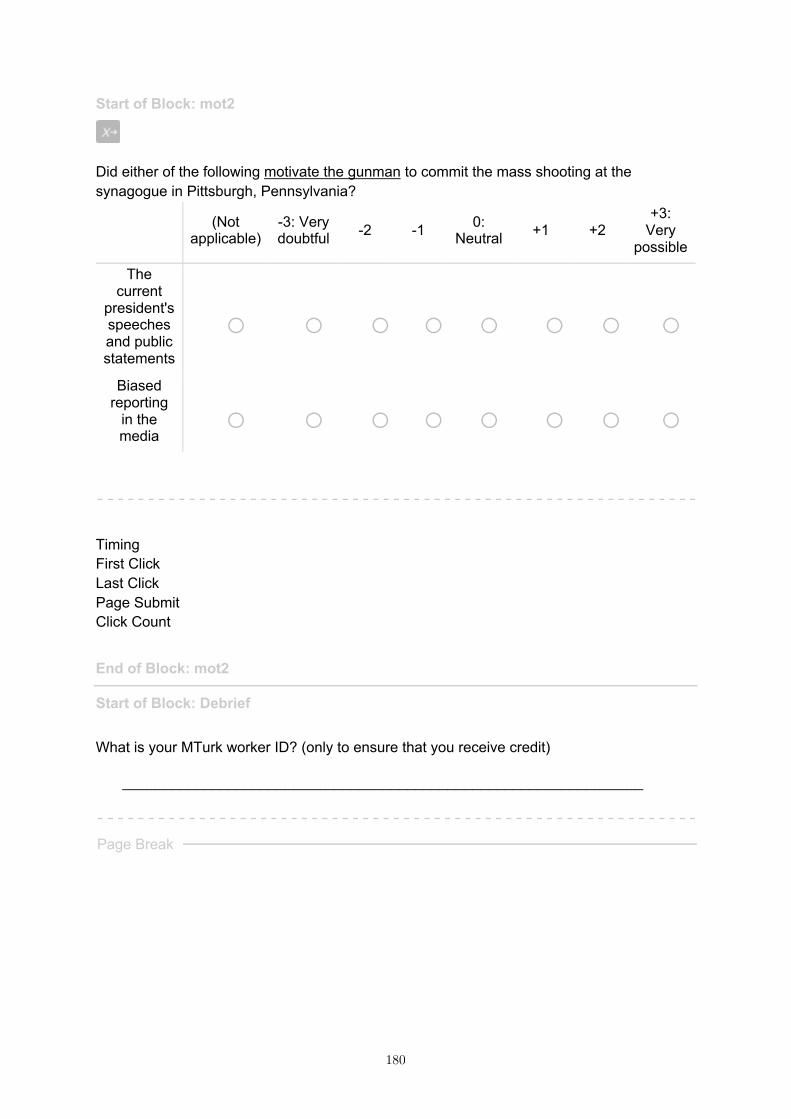
Start of Block: mot2
Did either of the following motivate the gunman to commit the mass shooting at the synagogue in Pittsburgh, Pennsylvania?
(Not applicable)
-3: Very doubtful -2 -1 0:
Neutral +1 +2 +3:
Very possible
The current
president's speeches and public statements
o o o o o o o o Biased
reporting in the media
o o o o o o o o Timing First Click Last Click Page Submit Click Count
End of Block: mot2 Start of Block: Debrief What is your MTurk worker ID? (only to ensure that you receive credit)
________________________________________________________________ Page Break
180
Thank you very much for helping with this study. Your completion code is 9001. Please enter the code "9001" into the MTurk window. Debriefing: The goal of this university-based psychological study is to examine how the public thinks about mass shootings. We collect this data regularly to assess changes in public opinions over time, especially as it relates to gun ownership, personality, beliefs, and daily habits. The results will be used for scientific research purposes only. If you have any questions or concerns about the study or your participation, you are welcome to contact the lead investigator, Dr. N. P. Leander ([email protected]). You are also welcome to contact our university ethics board at [email protected]. Now that you know the purpose of this study, do you have any advice or suggestions to improve the survey experience? We appreciate any feedback you can offer.
________________________________________________________________
________________________________________________________________
________________________________________________________________
________________________________________________________________
________________________________________________________________ Timing First Click Last Click Page Submit Click Count
End of Block: Debrief
181
MTurk - Thousand Oaks – Nov. 2018
Start of Block: Informed Consent Timing First Click Last Click Page Submit Click Count Informed Consent You were invited to this study as a follow-up to a previous study following a mass shooting. Primary investigator: Dr. N. P. Leander, PhD This university-based psychological study will ask about your beliefs, attitudes, and experiences regarding potential gun ownership and the use of firearms. Also included are some short questions about the recent Thousand Oaks bar shooting. The study typically takes 5 minutes. Your privacy is important: Your participation is completely anonymous. No identifying information will be collected from you. Only members of the research team will have access to the survey data, but even they cannot link the data to any single person. Your rights: You can decide whether or not to participate in the study. You can leave the study at any time. You may click "Next" to begin when ready. Browser Meta Info Browser Version Operating System Screen Resolution Flash Version Java Support User Agent
End of Block: Informed Consent
182
Start of Block: Knowledge questions
How knowledgeable are you about the recent mass shooting at the bar in Thousand Oaks, California?
o Not at all knowledgeable
o Slightly knowledgeable
o Moderately knowledgeable
o Very knowledgeable
o Extremely knowledgeable Timing First Click Last Click Page Submit Click Count
End of Block: Knowledge questions Start of Block: Mass Shooting_Thousand Oaks Thousand Oaks shooting, California On Wednesday, November 7, 2018, a mass shooting occurred at the Borderline Bar and Grill in Thousand Oaks, California. 12 people were killed and 24 hospitalized. The bar was hosting a College Country Night, which is attended by students from the area, including California Lutheran University, Pepperdine University, and California State University Channel Islands. The gunman, Ian David Long, died of a self-inflicted gunshot wound. Timing First Click Last Click Page Submit Click Count
183

Page Break
184

On the next few screens are questions about your views on the mass shooting: (1) what might have prevented it; (2) what might have motivated the gunman. Timing First Click Last Click Page Submit Click Count Page Break
185
(1) The recent bar shooting in Thousand Oaks, California might have been prevented if...
(Not applicable)
-3: Very doubtful -2 -1 0:
Neutral +1 +2 +3:
Very possible
...people at the bar were
armed. o o o o o o o o
...stricter gun control laws were in place.
o o o o o o o o ...better mental
health care existed.
o o o o o o o o ...there was
more surveillance
of suspected radicals.
o o o o o o o o ...society was more cautious of Muslims.
o o o o o o o o Other o o o o o o o o
Timing First Click Last Click Page Submit Click Count Page Break
186

(2) What might have motivated the gunman to commit the mass shooting at the bar in Thousand Oaks, California?
(Not applicable)
-3: Very doubtful -2 -1 0:
Neutral +1 +2 +3:
Very possible
Influence of religion o o o o o o o o
Influence of ideology / ISIS o o o o o o o o
Desire for power,
significance, or attention
o o o o o o o o Compensation
for inadequacy
(shame, insecurity,
self-hate, etc.)
o o o o o o o o Hatred of others,
prejudice o o o o o o o o Mental illness (psychopathy, abused, etc.) o o o o o o o o
Ease of access to firearms o o o o o o o o Cultural
exposure to violence (in
movies, news, entertainment,
etc.)
o o o o o o o o
Other o o o o o o o o
187

Timing First Click Last Click Page Submit Click Count Page Break
188

(3) Did the gunman have any of the following goals?
(Not applicable)
-3: Very doubtful -2 -1 0:
Neutral +1 +2 +3: Very possible
The gunman wanted respect
o o o o o o o o The
gunman wanted to be
important o o o o o o o o
The gunman wanted to be
famous o o o o o o o o
Timing First Click Last Click Page Submit Click Count
End of Block: Mass Shooting_Thousand Oaks Start of Block: Owngun Next, we would like to ask you some gun-related questions. Page Break
189
Timing First Click Last Click Page Submit Click Count
Do you own a gun?
o Yes
o No Page Break
190
To what extent do you see your gun as a central part of who you are? Please indicate the picture which best describes how much your gun represents you as a person.
o Image:1.png
o Image:2.png
o Image:3.png
o Image:4.png
o Image:5.png
o Image:6.png
o Image:7.png
o Image:8.png Timing First Click Last Click Page Submit Click Count
End of Block: Owngun Start of Block: gunbuy Timing First Click Last Click Page Submit Click Count
191
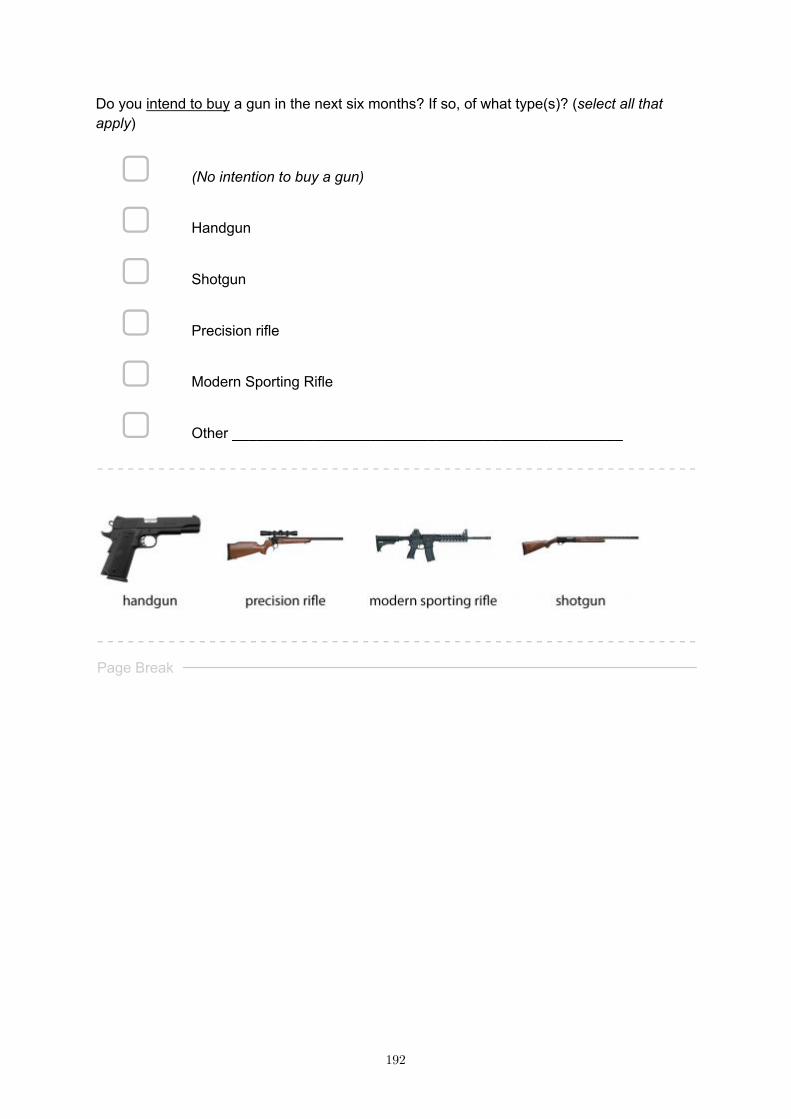
Do you intend to buy a gun in the next six months? If so, of what type(s)? (select all that apply)
▢ (No intention to buy a gun)
▢ Handgun
▢ Shotgun
▢ Precision rifle
▢ Modern Sporting Rifle
▢ Other ________________________________________________
Page Break
192
Timing First Click Last Click Page Submit Click Count
If you were to buy a gun relatively soon, what would be your main reasons?
(Not applicable)
1: Not a reason 2 3 4 5: Major
reason
Protection / Self-
defense o o o o o o Stocking up o o o o o o
2nd Amendment o o o o o o Collecting o o o o o o
Sport / Target
shooting o o o o o o Other
reason(s) o o o o o o
End of Block: gunbuy Start of Block: Fail Next are some questions about your personal experiences and tendencies. Page Break
193
Not a lot is done for people like me in America.
o Agree strongly
o Agree somewhat
o Neither agree nor disagree
o Disagree somewhat
o Disagree strongly
If I compare people like me against other Americans, my group is worse off.
o Agree strongly
o Agree somewhat
o Neither agree nor disagree
o Disagree somewhat
o Disagree strongly
Recent events in society have increased my struggles in daily life.
o A great deal
o A lot
o A moderate amount
o A little
o Not at all
194
Timing First Click Last Click Page Submit Click Count
End of Block: Fail Start of Block: Jewish
Please select the picture that best describes your closeness to the American people.
o Image:closeUS1.png
o Image:closeUS2.png
o Image:closeUS3.png
o Image:closeUS4.png
o Image:closeUS5.png
o Image:closeUS6.png
o Image:closeUS7.png Timing First Click Last Click Page Submit Click Count Page Break
195
Please select the picture that best describes your closeness to the Jewish people.
o Image:close1.png
o Image:close2.png
o Image:close3.png
o Image:close4.png
o Image:close5.png
o Image:close6.png
o Image:close7.png Timing First Click Last Click Page Submit Click Count
End of Block: Jewish Start of Block: Hero Pic Timing First Click Last Click Page Submit Click Count
196
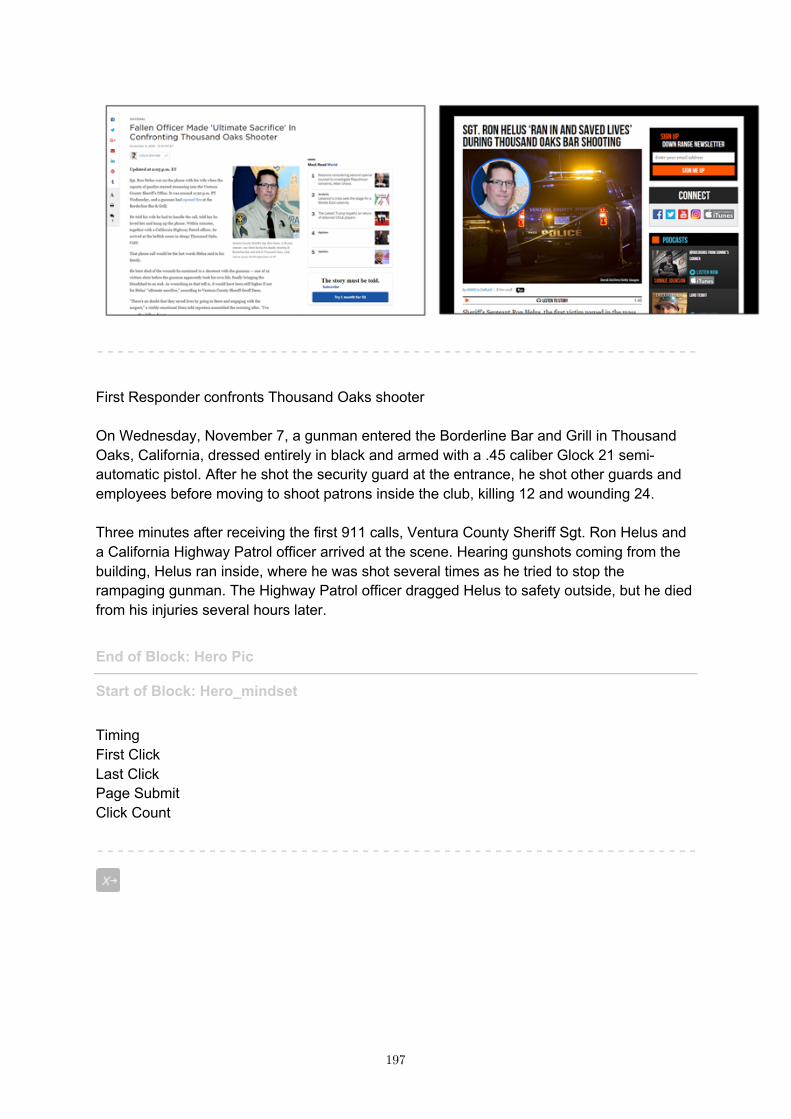
First Responder confronts Thousand Oaks shooter On Wednesday, November 7, a gunman entered the Borderline Bar and Grill in Thousand Oaks, California, dressed entirely in black and armed with a .45 caliber Glock 21 semi-automatic pistol. After he shot the security guard at the entrance, he shot other guards and employees before moving to shoot patrons inside the club, killing 12 and wounding 24. Three minutes after receiving the first 911 calls, Ventura County Sheriff Sgt. Ron Helus and a California Highway Patrol officer arrived at the scene. Hearing gunshots coming from the building, Helus ran inside, where he was shot several times as he tried to stop the rampaging gunman. The Highway Patrol officer dragged Helus to safety outside, but he died from his injuries several hours later.
End of Block: Hero Pic Start of Block: Hero_mindset Timing First Click Last Click Page Submit Click Count
197
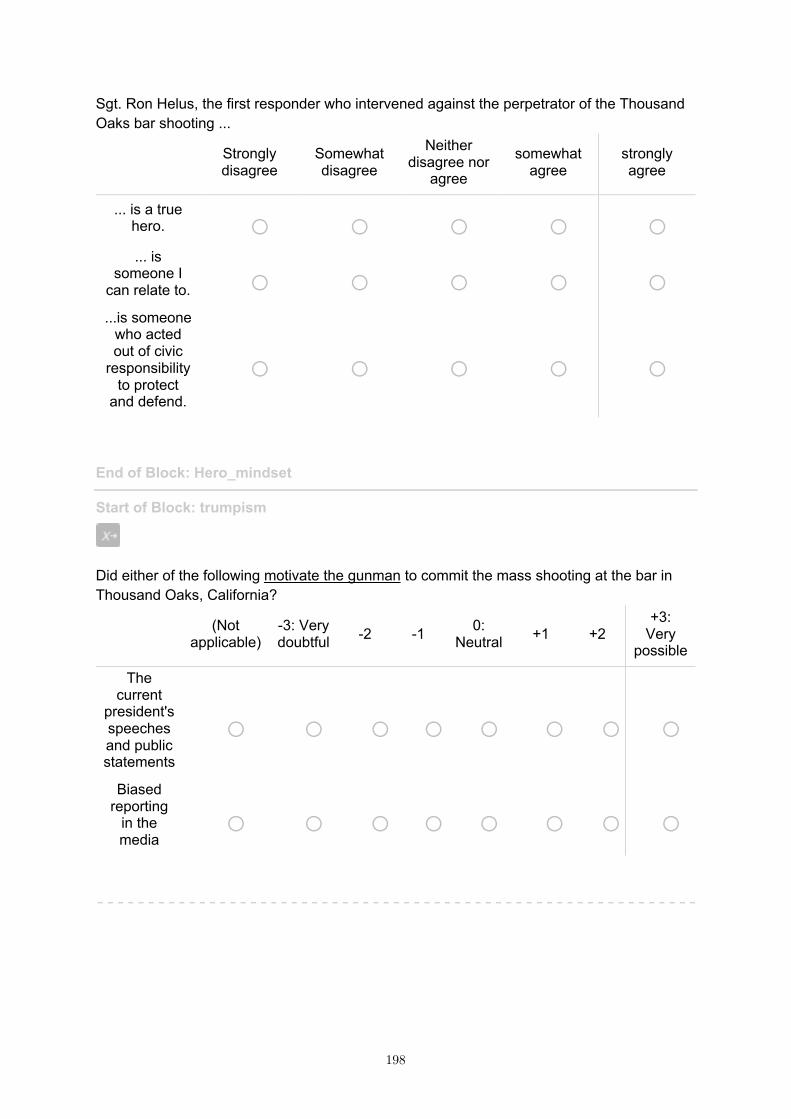
Sgt. Ron Helus, the first responder who intervened against the perpetrator of the Thousand Oaks bar shooting ...
Strongly disagree
Somewhat disagree
Neither disagree nor
agree
somewhat agree
strongly agree
... is a true hero. o o o o o ... is
someone I can relate to. o o o o o ...is someone
who acted out of civic
responsibility to protect
and defend.
o o o o o
End of Block: Hero_mindset Start of Block: trumpism
Did either of the following motivate the gunman to commit the mass shooting at the bar in Thousand Oaks, California?
(Not applicable)
-3: Very doubtful -2 -1 0:
Neutral +1 +2 +3:
Very possible
The current
president's speeches and public statements
o o o o o o o o Biased
reporting in the media
o o o o o o o o
198
Timing First Click Last Click Page Submit Click Count
End of Block: trumpism Start of Block: Debrief What is your MTurk worker ID? (only to ensure that you receive credit)
________________________________________________________________ Page Break
199

Thank you very much for helping with this study. Your completion code is 6552. Please enter the code "6552" into the MTurk window. Debriefing: The goal of this university-based psychological study is to examine how the public thinks about mass shootings. We collect this data regularly to assess changes in public opinions over time, especially as it relates to gun ownership, personality, beliefs, and daily habits. We are, therefore, especially thankful to you for taking the time to complete this study a second time. The results will be used for scientific research purposes only. If you have any questions or concerns about the study or your participation, you are welcome to contact the lead investigator, Dr. N. P. Leander ([email protected]). You are also welcome to contact our university ethics board at [email protected]. Now that you know the purpose of this study, do you have any advice or suggestions to improve the survey experience? We appreciate any feedback you can offer.
________________________________________________________________
________________________________________________________________
________________________________________________________________
________________________________________________________________
________________________________________________________________ Timing First Click Last Click Page Submit Click Count
End of Block: Debrief
200

Supplementary Information C
Full Surveys of Studies 2a and 2b: Christchurch Mosque Shootings and Utrecht Tram
Shooting
The following supplementary appendix includes the full survey print-outs for Study 3. This
study uses two independent survey datasets from 2019. Participants were recruited after the
Christchurch mosque shooting (see below ‘Qualtrics Panels – Christchurch (NZ) – Mar.
2019’) and after the Utrecht tram shooting (see below ‘Flycatcher – Utrecht (NL) – Mar.
2019’).
Qualtrics Panels – Christchurch (NZ) – Mar. 2019
Start of Block: Demographics
Gender
o Male
o Female
201
Age
o 18-24
o 25-34
o 35-44
o 45-54
o 55-64
o 65+
Racial/ethnic background
▢ White / Caucasian
▢ Māori
▢ Asian
▢ Pacific Islander
▢ Other ________________________________________________ Timing First Click Last Click Page Submit Click Count Page Break
202
Education
o Some Secondary School or Less
o Secondary School (or equivalent)
o Some Tertiary education
o Bachelor's degree (or equivalent)
o Postgraduate degree
What is your annual income?
o Under $15,000
o $15,000 - $25,000
o $25,000 - $35,000
o $35,000 - $50,000
o $50,000 - $75,000
o $75,000 - $100,000
o $100,000 - $150,000
o $150,000 - $200,000
o $200,000 +
203
Do you own a gun?
o Yes
o No Timing First Click Last Click Page Submit Click Count Page Break
204
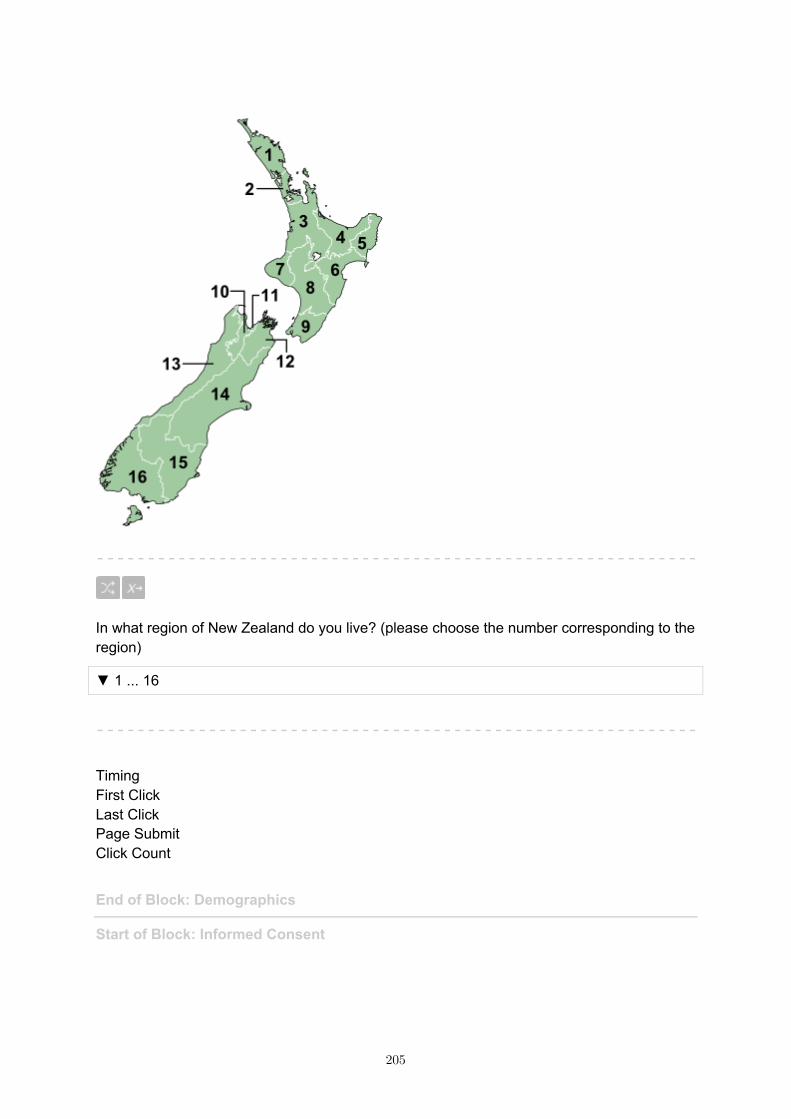
In what region of New Zealand do you live? (please choose the number corresponding to the region)
▼ 1 ... 16
Timing First Click Last Click Page Submit Click Count
End of Block: Demographics Start of Block: Informed Consent
205
Timing First Click Last Click Page Submit Click Count Informed Consent Primary investigator: Dr. N. P. Leander, PhDThis university-based psychological study will ask about your beliefs, attitudes, and experiences regarding guns and the use of firearms. Also included are some short questions about the recent mass shooting at the Christchurch mosques. The study typically takes 10-15 minutes. Your privacy is important: Your participation is completely anonymous. No identifying information will be collected from you. Only members of the research team will have access to the survey data, but even they cannot link the data to any single person. Your rights: You can decide whether or not to participate in the study. You can leave the study at any time. You may click "Next" to begin when ready. Browser Meta Info Browser Version Operating System Screen Resolution Flash Version Java Support User Agent
End of Block: Informed Consent Start of Block: BDW Next are a series of statements. Please indicate the extent to which you agree or disagree with each of them.
206
Although it may appear that things are constantly getting more dangerous and chaotic, it really isn’t so. Every era has its problems, and a person’s chances of living a safe, untroubled life are better today than ever before.
o Agree strongly
o Agree somewhat
o Neither agree nor disagree
o Disagree somewhat
o Disagree strongly
Any day now, chaos and lawlessness could erupt around us. All the signs are pointing to it.
o Agree strongly
o Agree somewhat
o Neither agree nor disagree
o Disagree somewhat
o Disagree strongly
207
There are many dangerous people in our society who will attack someone out of pure meanness, for no reason at all.
o Agree strongly
o Agree somewhat
o Neither agree nor disagree
o Disagree somewhat
o Disagree strongly
Despite what one hears about “crime in the street,” there probably isn’t any more now than there ever has been.
o Agree strongly
o Agree somewhat
o Neither agree nor disagree
o Disagree somewhat
o Disagree strongly
208
If a person takes a few sensible precautions, nothing bad is likely to happen to him or her; we do not live in a dangerous world.
o Agree strongly
o Agree somewhat
o Neither agree nor disagree
o Disagree somewhat
o Disagree strongly Timing First Click Last Click Page Submit Click Count Page Break
209
Every day, as society becomes more lawless and bestial, a person’s chances of being robbed, assaulted, and even murdered go up and up.
o Agree strongly
o Agree somewhat
o Neither agree nor disagree
o Disagree somewhat
o Disagree strongly
My knowledge and experience tells me that the social world we live in is basically a safe, stable and secure place, in which most people are fundamentally good.
o Agree strongly
o Agree somewhat
o Neither agree nor disagree
o Disagree somewhat
o Disagree strongly
210
It seems that every year there are fewer and fewer truly respectable people, and more and more persons with no morals at all, who threaten everyone else.
o Agree strongly
o Agree somewhat
o Neither agree nor disagree
o Disagree somewhat
o Disagree strongly
The “end” is not near. People who think that earthquakes, wars, and famines mean God might be about to destroy the world are being foolish.
o Agree strongly
o Agree somewhat
o Neither agree nor disagree
o Disagree somewhat
o Disagree strongly
211
My knowledge and experience tells me that the social world we live in is basically a dangerous and unpredictable place, in which good, decent and moral people’s values and way of life are threatened and disrupted by bad people.
o Agree strongly
o Agree somewhat
o Neither agree nor disagree
o Disagree somewhat
o Disagree strongly Timing First Click Last Click Page Submit Click Count
End of Block: BDW Start of Block: PLRA
212
What do you estimate is the likelihood the following will happen in your lifetime (in your future)?
1: Not at all 2 3 4 5: Extremely likely
1. Likelihood you will be mugged. o o o o o
2. Likelihood you will be violently attacked.
o o o o o 3. Likelihood your home
will be invaded by an armed burglar.
o o o o o 4. Likelihood you will be
present during a
mass shooting.
o o o o o Timing First Click Last Click Page Submit Click Count
End of Block: PLRA Start of Block: Owngun Timing First Click Last Click Page Submit Click Count
213
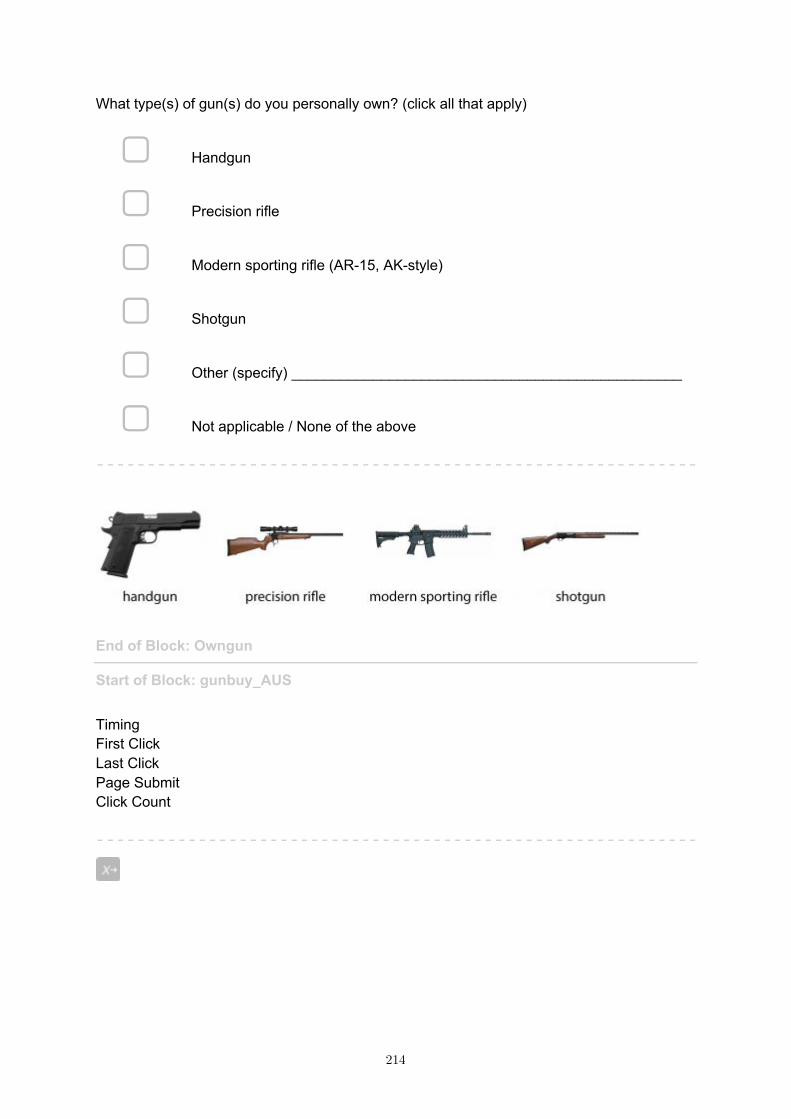
What type(s) of gun(s) do you personally own? (click all that apply)
▢ Handgun
▢ Precision rifle
▢ Modern sporting rifle (AR-15, AK-style)
▢ Shotgun
▢ Other (specify) ________________________________________________
▢ Not applicable / None of the above
End of Block: Owngun Start of Block: gunbuy_AUS Timing First Click Last Click Page Submit Click Count
214
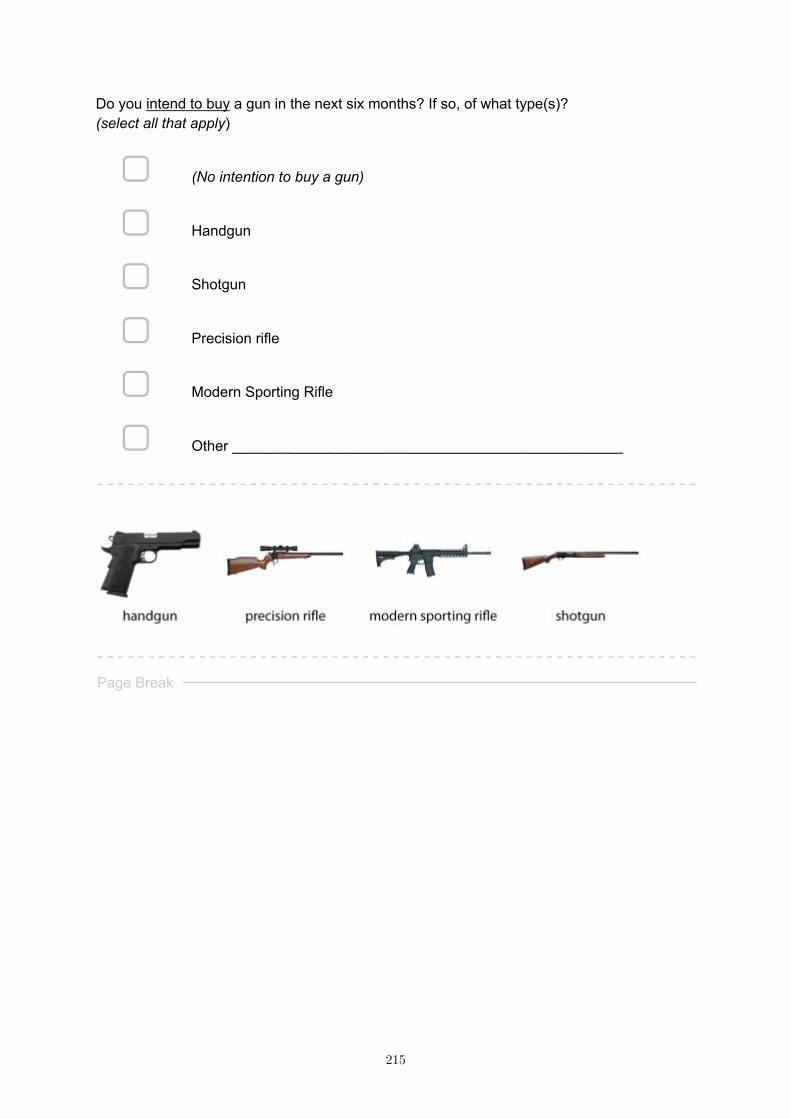
Do you intend to buy a gun in the next six months? If so, of what type(s)? (select all that apply)
▢ (No intention to buy a gun)
▢ Handgun
▢ Shotgun
▢ Precision rifle
▢ Modern Sporting Rifle
▢ Other ________________________________________________
Page Break
215
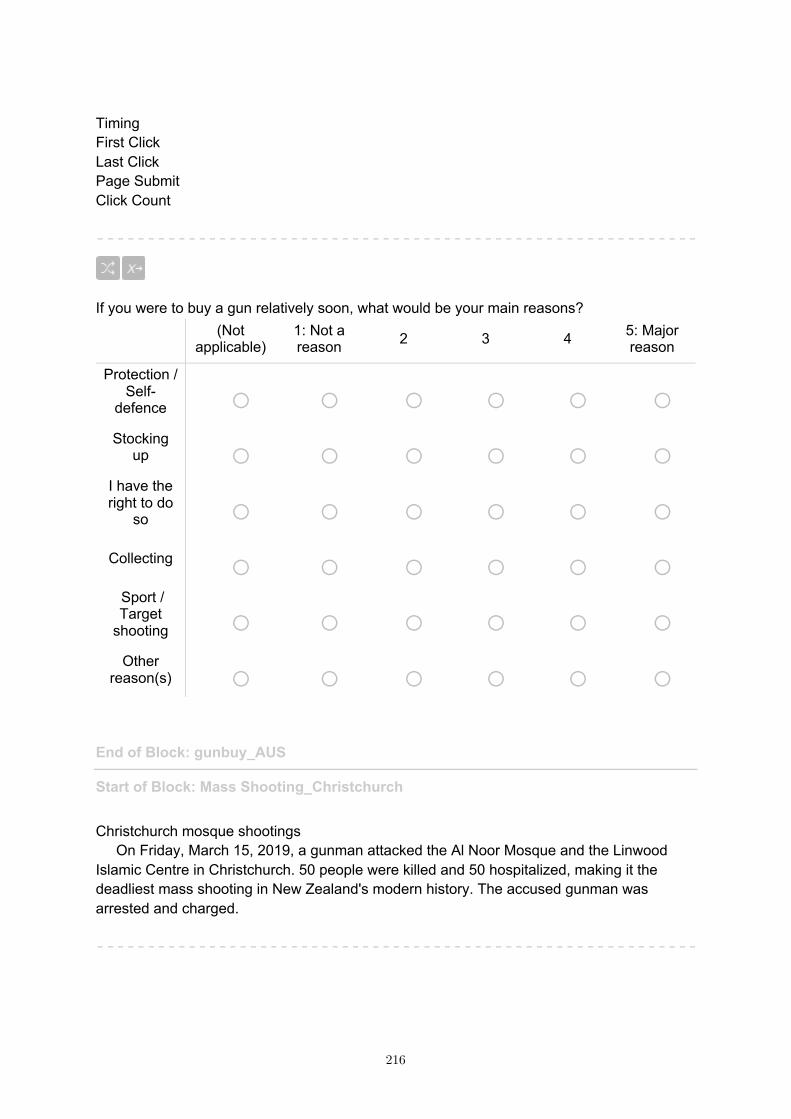
Timing First Click Last Click Page Submit Click Count
If you were to buy a gun relatively soon, what would be your main reasons?
(Not applicable)
1: Not a reason 2 3 4 5: Major
reason
Protection / Self-
defence o o o o o o Stocking
up o o o o o o I have the right to do
so o o o o o o Collecting o o o o o o
Sport / Target
shooting o o o o o o Other
reason(s) o o o o o o
End of Block: gunbuy_AUS Start of Block: Mass Shooting_Christchurch Christchurch mosque shootings On Friday, March 15, 2019, a gunman attacked the Al Noor Mosque and the Linwood Islamic Centre in Christchurch. 50 people were killed and 50 hospitalized, making it the deadliest mass shooting in New Zealand's modern history. The accused gunman was arrested and charged.
216

Timing First Click Last Click Page Submit Click Count Page Break
217

On the next few screens are questions about your views on the mass shooting: (1) what might have prevented it; (2) what might have motivated the gunman. Timing First Click Last Click Page Submit Click Count Page Break
218
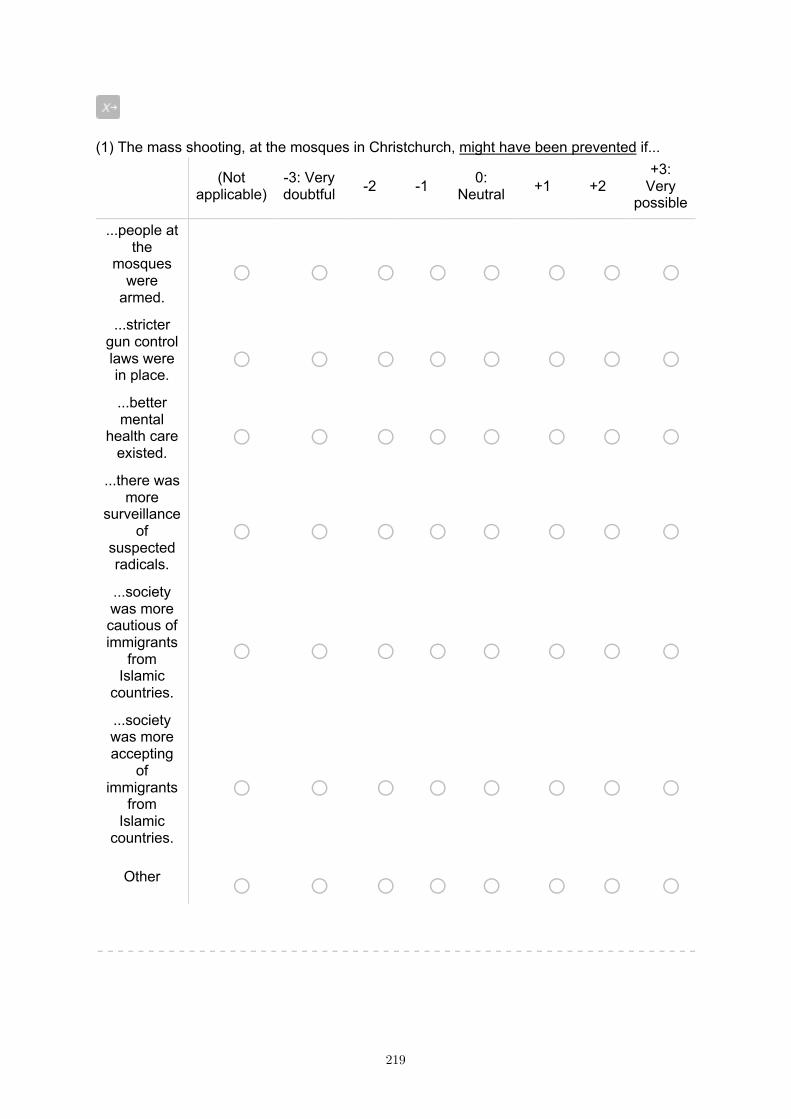
(1) The mass shooting, at the mosques in Christchurch, might have been prevented if...
(Not applicable)
-3: Very doubtful -2 -1 0:
Neutral +1 +2 +3:
Very possible
...people at the
mosques were
armed. o o o o o o o o
...stricter gun control laws were in place.
o o o o o o o o ...better mental
health care existed.
o o o o o o o o ...there was
more surveillance
of suspected radicals.
o o o o o o o o ...society was more cautious of immigrants
from Islamic
countries.
o o o o o o o o
...society was more accepting
of immigrants
from Islamic
countries.
o o o o o o o o
Other o o o o o o o o
219

Timing First Click Last Click Page Submit Click Count Page Break
220

(2) What might have motivated the gunman to commit the mass shooting at the mosques in Christchurch?
(Not applicable)
-3: Very doubtful -2 -1 0:
Neutral +1 +2 +3:
Very possible
Influence of religion o o o o o o o o
Influence of ideology o o o o o o o o
Desire for power,
significance, or attention
o o o o o o o o Compensation
for inadequacy
(shame, insecurity,
self-hate, etc.)
o o o o o o o o Hatred of others,
prejudice o o o o o o o o Mental illness o o o o o o o o
Ease of access to firearms o o o o o o o o Cultural
exposure to violence (in
movies, news, entertainment,
etc.)
o o o o o o o o
Other o o o o o o o o
221

Timing First Click Last Click Page Submit Click Count
End of Block: Mass Shooting_Christchurch Start of Block: Islamoprejudice
222
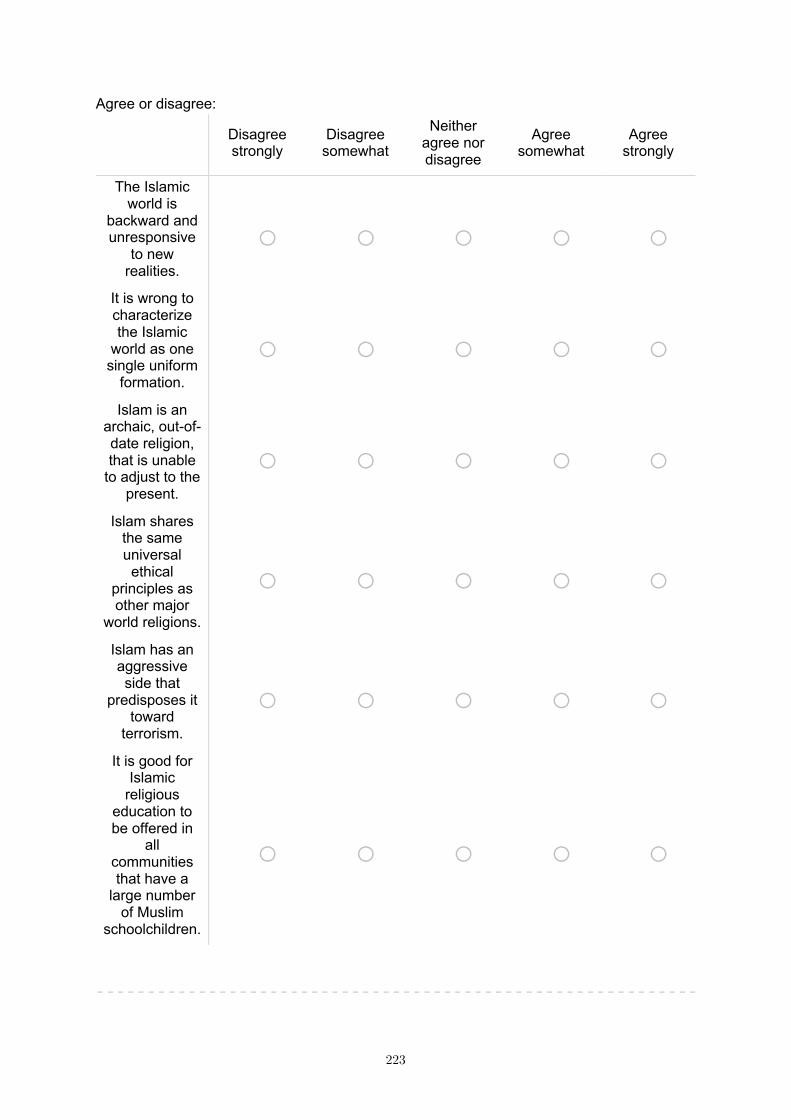
Agree or disagree:
Disagree strongly
Disagree somewhat
Neither agree nor disagree
Agree somewhat
Agree strongly
The Islamic world is
backward and unresponsive
to new realities.
o o o o o It is wrong to characterize the Islamic
world as one single uniform
formation.
o o o o o Islam is an
archaic, out-of-date religion, that is unable
to adjust to the present.
o o o o o Islam shares
the same universal ethical
principles as other major
world religions.
o o o o o
Islam has an aggressive side that
predisposes it toward
terrorism.
o o o o o It is good for
Islamic religious
education to be offered in
all communities that have a
large number of Muslim
schoolchildren.
o o o o o
223

Page Break
224
Please select the picture that best describes your closeness to the Muslim people.
o Image:Muslim01.png
o Image:Muslim02.png
o Image:Muslim03.png
o Image:Muslim04.png
o Image:Muslim04.png
o Image:Muslim06.png
o Image:Muslim07.png
End of Block: Islamoprejudice Start of Block: Behavioral towards Muslims
225
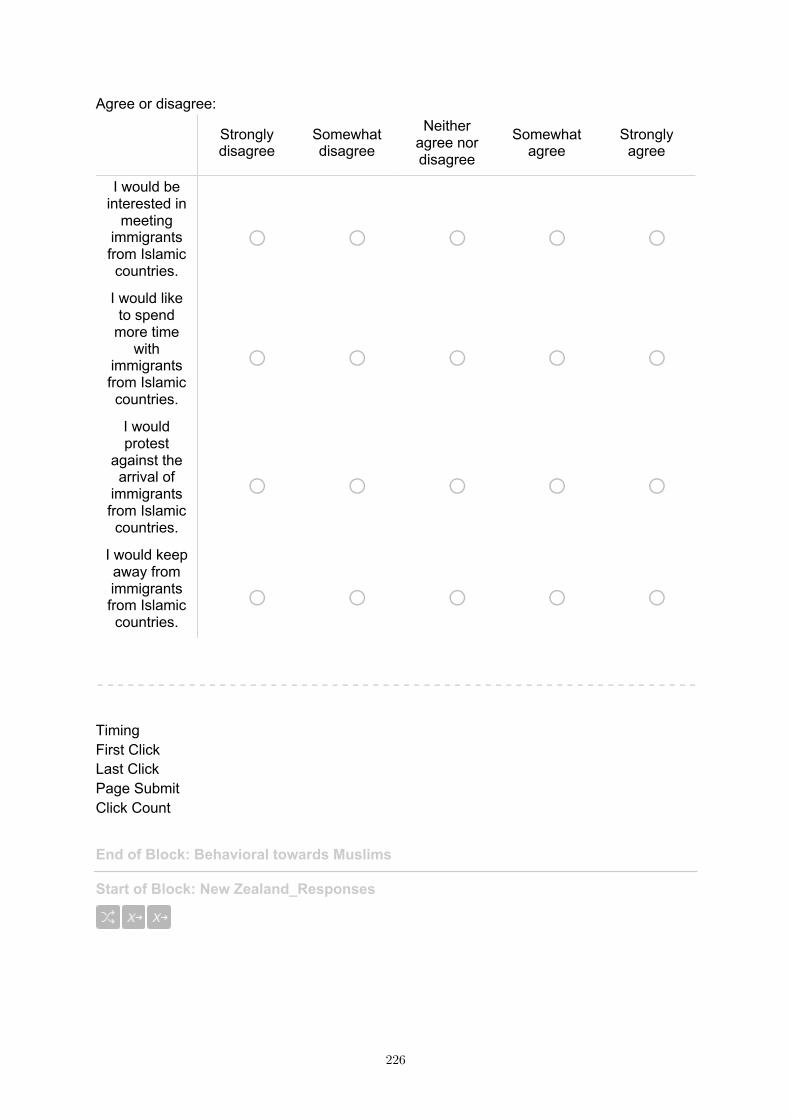
Agree or disagree:
Strongly disagree
Somewhat disagree
Neither agree nor disagree
Somewhat agree
Strongly agree
I would be interested in
meeting immigrants from Islamic countries.
o o o o o I would like to spend
more time with
immigrants from Islamic countries.
o o o o o
I would protest
against the arrival of
immigrants from Islamic countries.
o o o o o
I would keep away from immigrants from Islamic countries.
o o o o o Timing First Click Last Click Page Submit Click Count
End of Block: Behavioral towards Muslims Start of Block: New Zealand_Responses
226
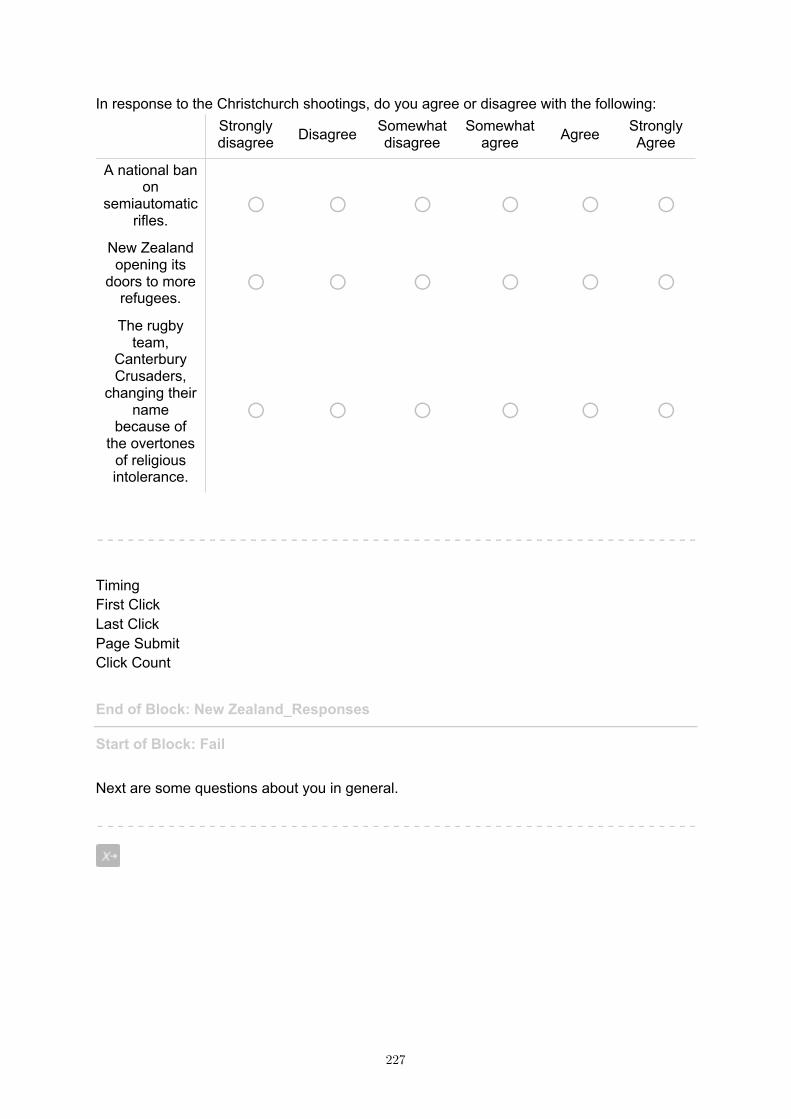
In response to the Christchurch shootings, do you agree or disagree with the following:
Strongly disagree Disagree Somewhat
disagree Somewhat
agree Agree Strongly Agree
A national ban on
semiautomatic rifles.
o o o o o o New Zealand opening its
doors to more refugees.
o o o o o o The rugby
team, Canterbury Crusaders,
changing their name
because of the overtones
of religious intolerance.
o o o o o o
Timing First Click Last Click Page Submit Click Count
End of Block: New Zealand_Responses Start of Block: Fail Next are some questions about you in general.
227
Not a lot is done for people like me in New Zealand.
o Agree strongly
o Agree somewhat
o Neither agree nor disagree
o Disagree somewhat
o Disagree strongly
If I compare people like me against other New Zealanders, my group is worse off.
o Agree strongly
o Agree somewhat
o Neither agree nor disagree
o Disagree somewhat
o Disagree strongly
Recent events in society have increased my struggles in daily life.
o A great deal
o A lot
o A moderate amount
o A little
o Not at all
228
Timing First Click Last Click Page Submit Click Count
End of Block: Fail Start of Block: Ernestine_Discontent
I fear things will go wrong in society.
o Agree strongly
o Agree somewhat
o Neither agree nor disagree
o Disagree somewhat
o Disagree strongly
I feel concerned when I think about the future of society.
o Agree strongly
o Agree somewhat
o Neither agree nor disagree
o Disagree somewhat
o Disagree strongly
229
I am satisfied with society.
o Agree strongly
o Agree somewhat
o Neither agree nor disagree
o Disagree somewhat
o Disagree strongly Timing First Click Last Click Page Submit Click Count
End of Block: Ernestine_Discontent Start of Block: hero Timing First Click Last Click Page Submit Click Count
230
Might you ever consider drawing or discharging a firearm to...
Definitely not Probably not Might or
might not Probably
yes Definitely
yes
Save a vulnerable stranger in
distress o o o o o
Stop an active shooter
situation o o o o o Deter
intimidation by
troublemakers o o o o o
End of Block: hero Start of Block: Right to Kill_AUS
I have a right to kill another person...
Strongly disagree
Somewhat disagree
Neither agree nor disagree
Somewhat agree
Strongly agree
...in self-defence. o o o o o
...to defend my family. o o o o o ...to defend my home. o o o o o
Timing First Click Last Click Page Submit Click Count
End of Block: Right to Kill_AUS Start of Block: Gun laws from las vegas
231
In general, do you think the laws covering the sale of firearms should be made more strict, less strict, or kept as they are now?
o 1: Much less strict
o 2
o 3
o 4: Neutral
o 5
o 6
o 7: Much more strict
Do you support or oppose some kind of government registry of all guns?
o 1: Strongly oppose a gun registry
o 2
o 3
o 4: Neutral
o 5
o 6
o 7: Strongly support a gun registry
232
"In general, if more people had guns, there would be less crime."
o Strongly disagree
o Somewhat disagree
o Neither agree nor disagree
o Somewhat agree
o Strongly agree Timing First Click Last Click Page Submit Click Count
End of Block: Gun laws from las vegas Start of Block: HP_OP_Guns_short
233
With regards to owning guns...
1: Do not agree at all 2 3 4
5: Completely
agree
Gun ownership is in harmony with other things that are part of
me.
o o o o o
I have almost an obsessive
feeling for gun
ownership. o o o o o
Gun ownership
allows me to live a variety
of experiences.
o o o o o I have the impression
that gun ownership
controls me. o o o o o
Gun ownership is in harmony with other things that are part of
me.
o o o o o
Gun ownership is so exciting
that I sometimes lose control
over it.
o o o o o
234

Timing First Click Last Click Page Submit Click Count Page Break
235
To what extent do you see your gun as a central part of who you are? Please indicate the picture which best describes how much your gun represents you as a person.
o Image:1.png
o Image:2.png
o Image:3.png
o Image:4.png
o Image:5.png
o Image:6.png
o Image:7.png
o Image:8.png Timing First Click Last Click Page Submit Click Count Page Break
236
Number of guns currently owned (Optional) (approximate if necessary)
▼ 1 ... More than 10
Timing First Click Last Click Page Submit Click Count
End of Block: HP_OP_Guns_short Start of Block: WAS_C
237
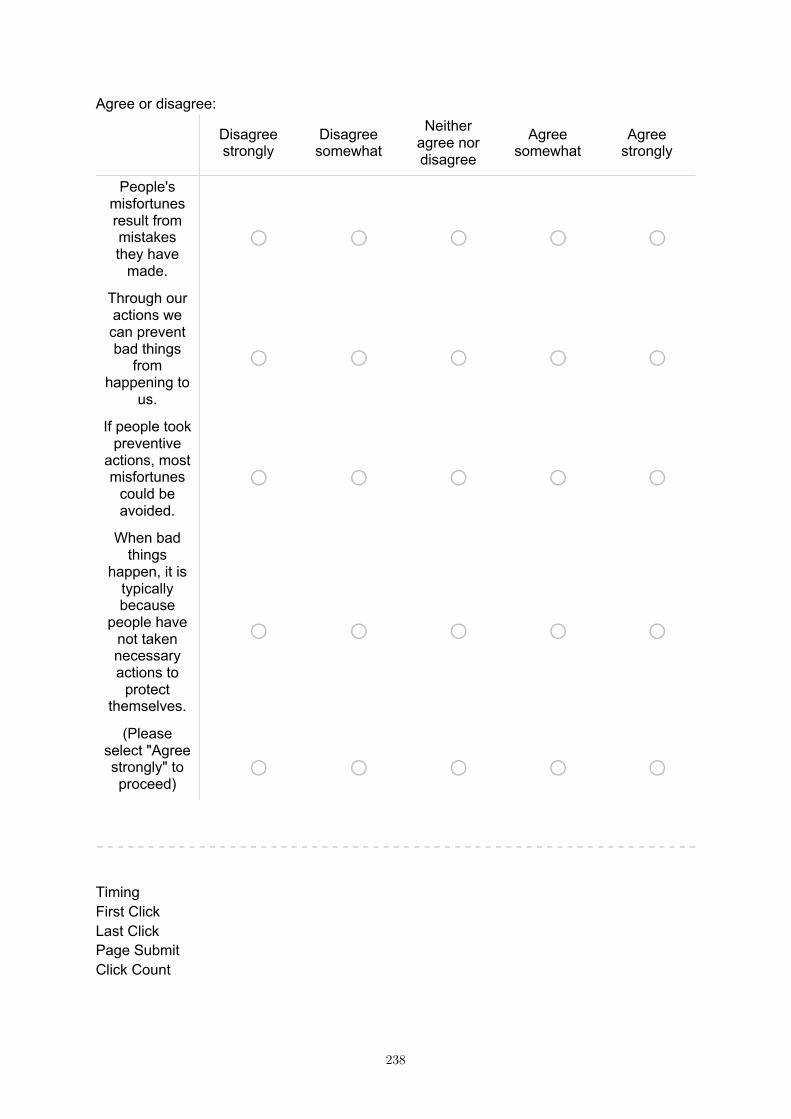
Agree or disagree:
Disagree strongly
Disagree somewhat
Neither agree nor disagree
Agree somewhat
Agree strongly
People's misfortunes result from mistakes they have
made.
o o o o o Through our actions we can prevent bad things
from happening to
us.
o o o o o
If people took preventive
actions, most misfortunes
could be avoided.
o o o o o When bad
things happen, it is
typically because
people have not taken necessary actions to
protect themselves.
o o o o o
(Please select "Agree strongly" to proceed)
o o o o o Timing First Click Last Click Page Submit Click Count
238
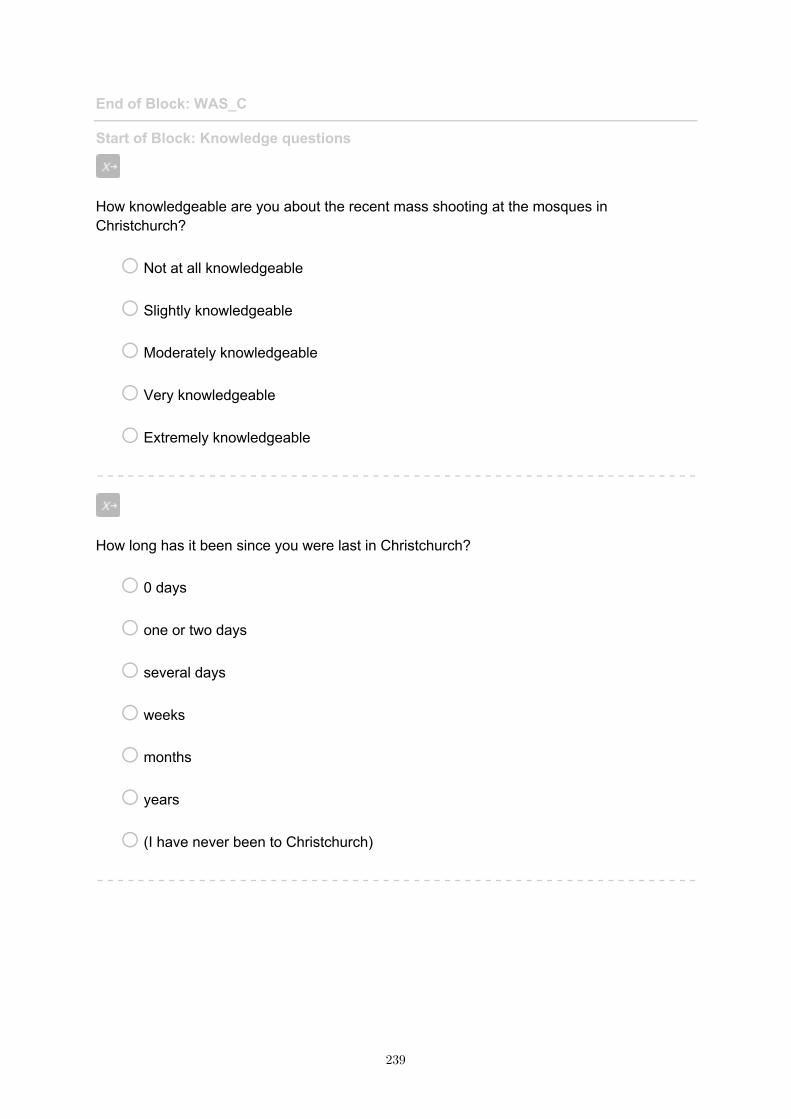
End of Block: WAS_C Start of Block: Knowledge questions
How knowledgeable are you about the recent mass shooting at the mosques in Christchurch?
o Not at all knowledgeable
o Slightly knowledgeable
o Moderately knowledgeable
o Very knowledgeable
o Extremely knowledgeable
How long has it been since you were last in Christchurch?
o 0 days
o one or two days
o several days
o weeks
o months
o years
o (I have never been to Christchurch)
239
Timing First Click Last Click Page Submit Click Count
End of Block: Knowledge questions Start of Block: Belief superiority
How important is your race/ethnic background to your identity?
o Not at all important
o Slightly important
o Moderately important
o Very important
o Extremely important Timing First Click Last Click Page Submit Click Count Page Break
240
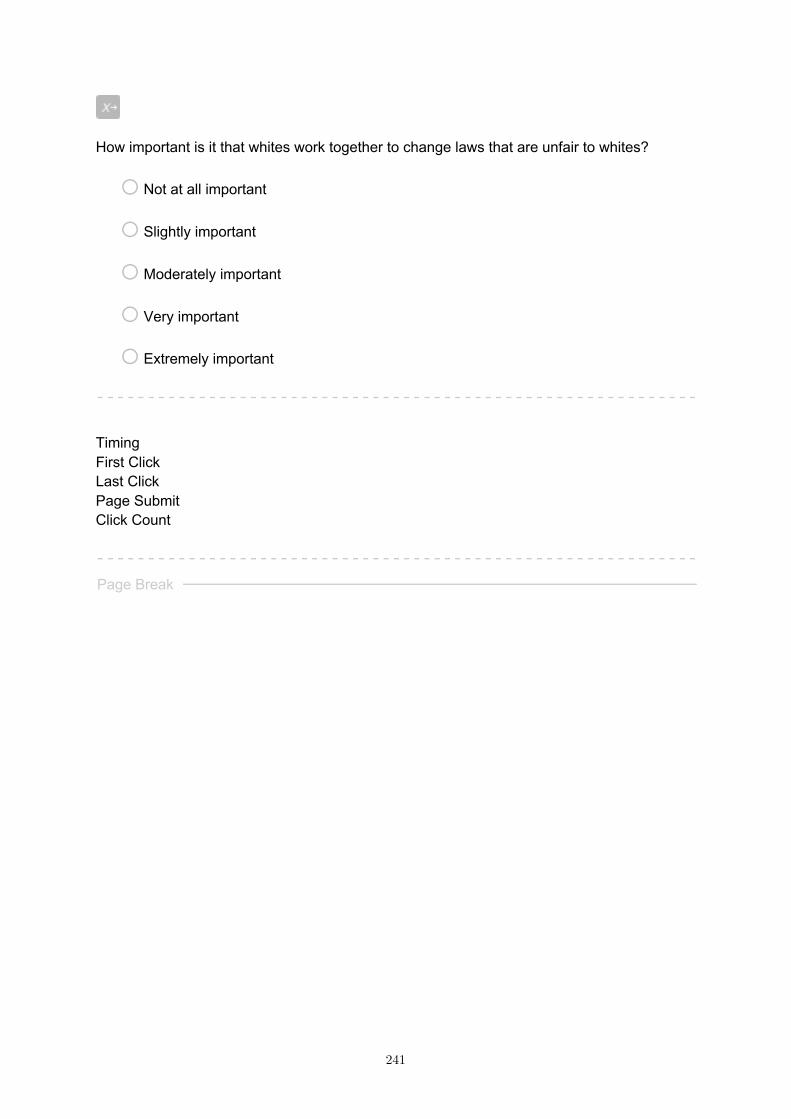
How important is it that whites work together to change laws that are unfair to whites?
o Not at all important
o Slightly important
o Moderately important
o Very important
o Extremely important Timing First Click Last Click Page Submit Click Count Page Break
241
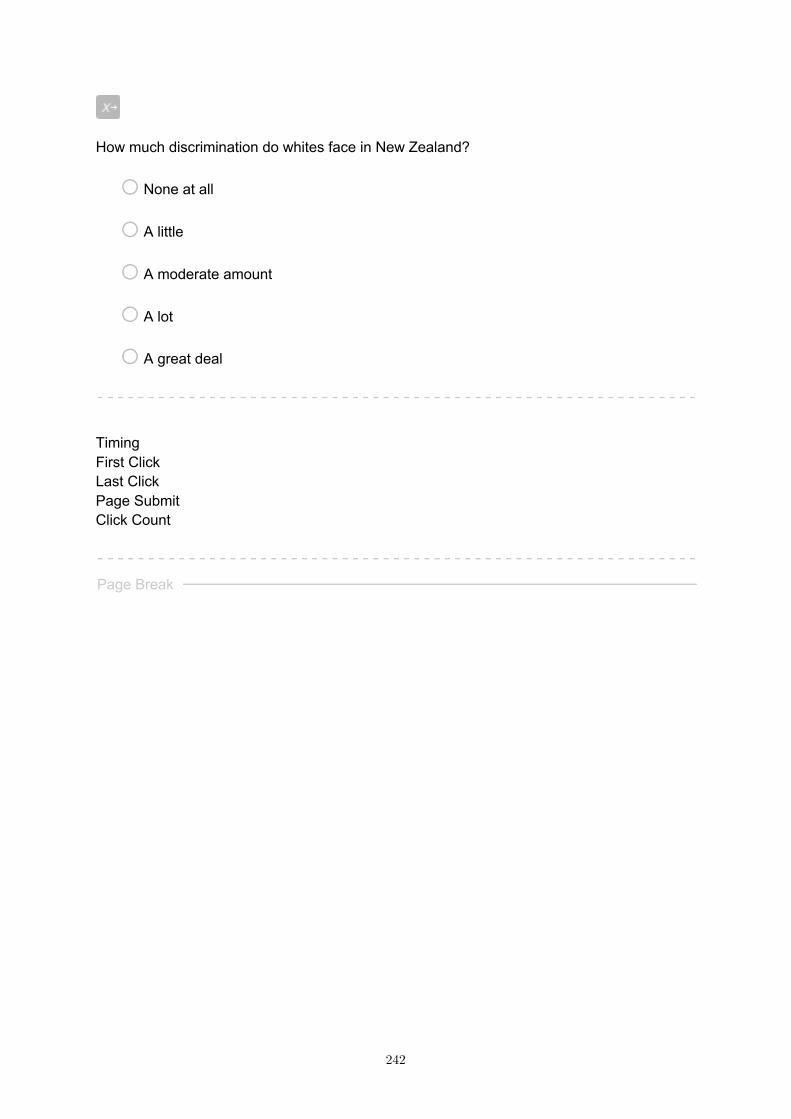
How much discrimination do whites face in New Zealand?
o None at all
o A little
o A moderate amount
o A lot
o A great deal Timing First Click Last Click Page Submit Click Count Page Break
242
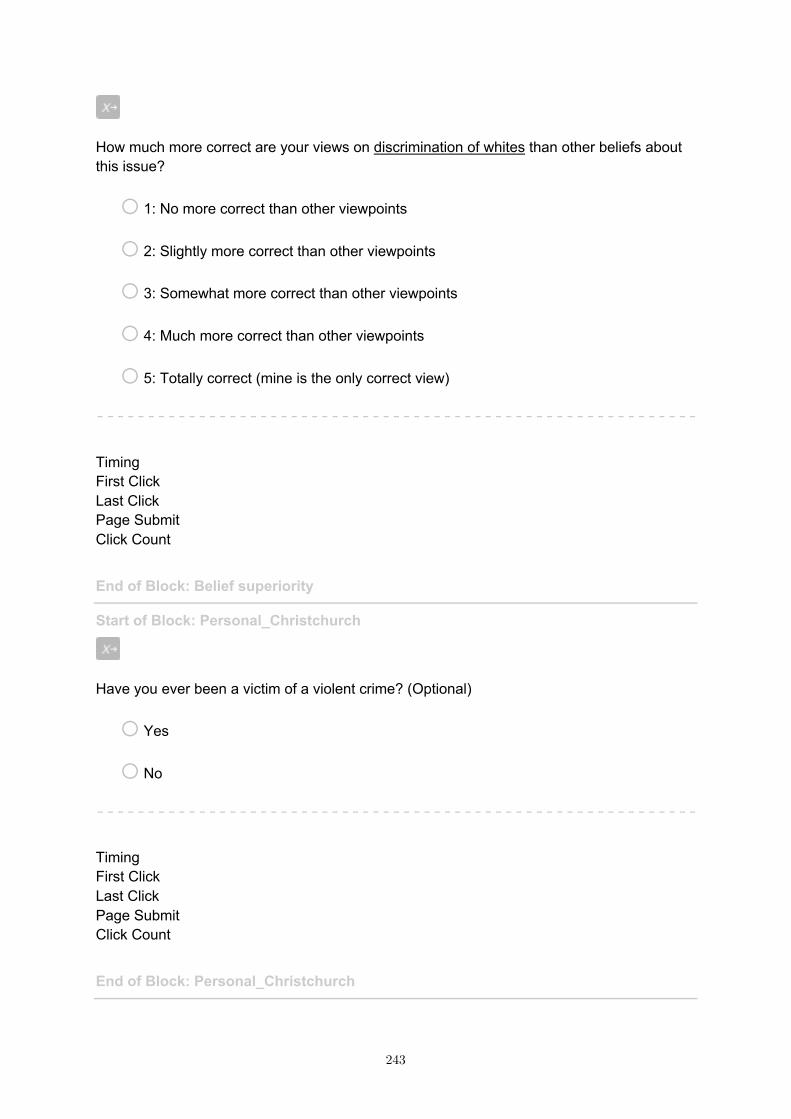
How much more correct are your views on discrimination of whites than other beliefs about this issue?
o 1: No more correct than other viewpoints
o 2: Slightly more correct than other viewpoints
o 3: Somewhat more correct than other viewpoints
o 4: Much more correct than other viewpoints
o 5: Totally correct (mine is the only correct view) Timing First Click Last Click Page Submit Click Count
End of Block: Belief superiority Start of Block: Personal_Christchurch
Have you ever been a victim of a violent crime? (Optional)
o Yes
o No Timing First Click Last Click Page Submit Click Count
End of Block: Personal_Christchurch
243
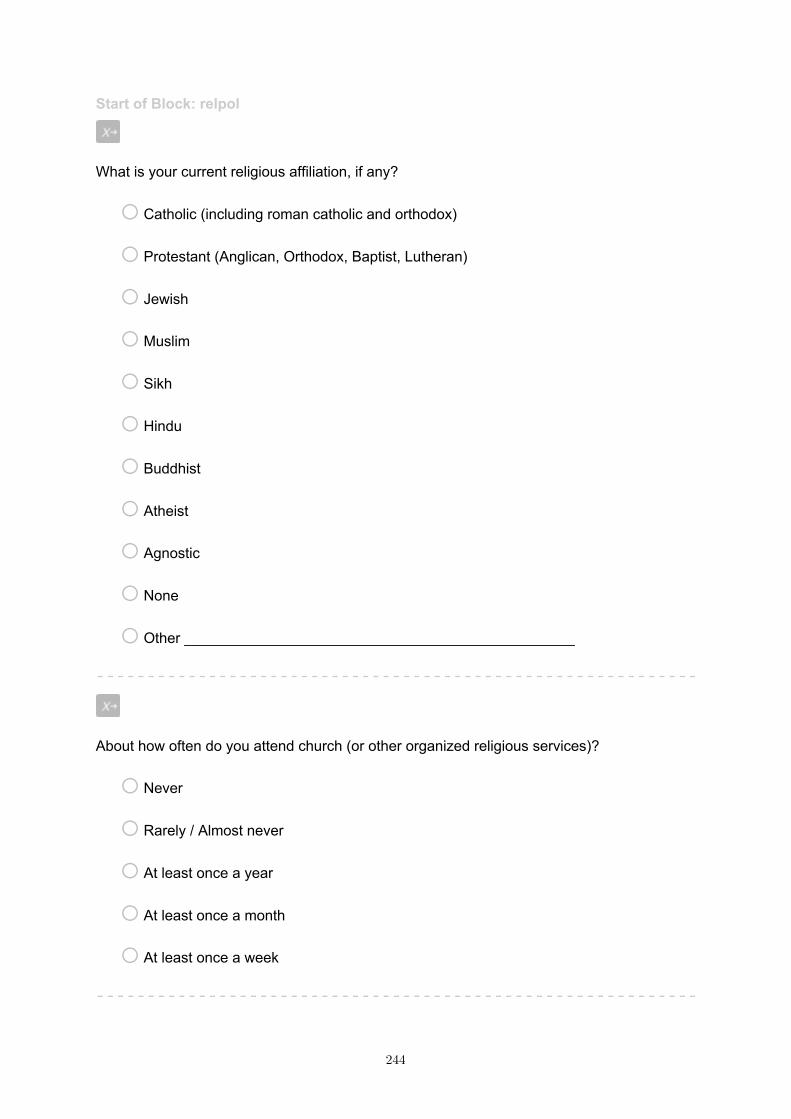
Start of Block: relpol
What is your current religious affiliation, if any?
o Catholic (including roman catholic and orthodox)
o Protestant (Anglican, Orthodox, Baptist, Lutheran)
o Jewish
o Muslim
o Sikh
o Hindu
o Buddhist
o Atheist
o Agnostic
o None
o Other ________________________________________________
About how often do you attend church (or other organized religious services)?
o Never
o Rarely / Almost never
o At least once a year
o At least once a month
o At least once a week
244
How religious are you?
o 1: Not religious at all
o 2
o 3
o 4
o 5: Highly religious Timing First Click Last Click Page Submit Click Count Page Break
245
What is your political orientation?
o 1: Left-wing
o 2
o 3
o 4
o 5
o 6
o 7
o 8
o 9: Right wing
Do you support any of the current political parties? (Select all that apply)
▢ National Party
▢ Labour Party
▢ NZ First
▢ Green Party
▢ ACT
▢ Other / none of the above
246
In general, do you think the laws covering immigration should be made more strict, less strict, or kept as they are now?
o 1: Much less strict
o 2
o 3
o 4: Neutral
o 5
o 6
o 7: Much more strict Timing First Click Last Click Page Submit Click Count Page Break
247
Do you know anyone who is an immigrant from an Islamic country? (Select all that apply)
▢ Family member(s)
▢ Friend(s)
▢ Immigrants from Islamic countries live in my neighbourhood / community
▢ Co-worker(s) / teammate(s)
▢ Some other connection to immigrants from Islamic countries ________________________________________________
▢ No
▢ (skip question)
Compared to myself, Muslims as a group have...
o -2: Much less power and influence
o -1
o 0: About the same amount of power and influence
o 1
o 2: Much more power and influence
248
How, based on your expectations, do people of an Islamic background feel about people who are not of an Islamic background?
o -2: Very negative
o -1
o 0: Neutral
o +1
o +2: Very positive
End of Block: relpol Start of Block: Ed_alone
Do you have any children? If so, how many?
▼ No ... Other
Are you married and/or cohabiting with a romantic partner?
▢ Yes
▢ No
249
How many days has it been since you had a meaningful conversation with another person?
o 0 days
o one or two days
o several days
o weeks
o months
o years Timing First Click Last Click Page Submit Click Count
End of Block: Ed_alone Start of Block: WAS_BW_Bruggen2018
250
Agree or disagree:
Disagree strongly
Disagree somewhat
Neither agree nor disagree
Agree somewhat
Agree strongly
The good things that happen in
this world far outnumber
the bad.
o o o o o There is
more good than evil in the world.
o o o o o If you look
closely enough, you will see that the world is
full of goodness
o o o o o
The world is a good place. o o o o o
Timing First Click Last Click Page Submit Click Count
End of Block: WAS_BW_Bruggen2018 Start of Block: Debrief Debriefing:The goal of this university-based psychological study is to examine how the public thinks about mass shootings. We collect this data regularly to assess changes in public opinions over time, especially as it relates to gun ownership, personality, beliefs, and preferences. Given that the Christchurch shootings targeted a minority group, we additionally assessed views on people from Islamic countries. The results will be used for scientific research purposes only. If you have any questions or concerns about the study or your participation, you are welcome to contact the lead investigator, Dr. N. P. Leander ([email protected]). You are also welcome to contact our
251
university ethics board at [email protected]. Now that you know the purpose of this study, do you have any advice or suggestions to improve the survey experience? We appreciate any feedback you can offer.
________________________________________________________________
________________________________________________________________
________________________________________________________________
________________________________________________________________
________________________________________________________________ Timing First Click Last Click Page Submit Click Count
End of Block: Debrief
252
Flycatcher – Utrecht (NL) – Mar. 2019
Start of Block: informedconsent_NL Doel van het onderzoek Dit onderzoek van de Rijksuniversiteit Groningen (Hoofdonderzoeker Dr. L.P. Leander) vraagt naar uw overtuigingen, meningen en ervaringen wat betreft het gebruik van wapens. Tevens stellen wij u vragen over het recente schietincident in Utrecht en aspecten die daar wellicht mee te maken hebben. Het duurt ongeveer 10 tot 15 minuten om de vragenlijst in te vullen. Instructie Lees telkens de instructies vooraf goed door en beantwoordt de vragen zo eerlijk mogelijk. Probeer niet te lang bij antwoorden na te denken. Vaak is uw eerste gedachte de beste. Er bestaan geen foute antwoorden en in dit onderzoek zal geen oordeel gegeven worden over uw mening. Met deelname aan dit onderzoek heeft u, de deelnemer, kennis genomen van het volgende: Mijn deelname is vrijwillig en ik mag mijn deelname aan deze studie op elk tijdstip stopzetten en de gegevens die verkregen zijn uit dit onderzoek terugkrijgen, laten verwijderen uit de database, of laten vernietigen. Ik mag weigeren te antwoorden op een vraag, of vragen overslaan die ik niet wil beantwoorden. Er kleven voor mij geen voordelen of nadelen aan deze keuze. Na deelname zal ik volledige informatie verkrijgen over mijn deelname en het doel van het onderzoek. Al mijn antwoorden zijn anoniem en geheel vertrouwelijk. Alle antwoorden zijn niet tot u herleidbaar en worden veilig opgeslagen. Uw antwoorden zijn enkel toegankelijk voor het onderzoeksteam en worden niet doorgegeven aan derden. Dit onderzoeksproject houdt zich aan de ethische standaarden voor onderzoek en beschermt te allen tijde de waardigheid, rechten, belangen, en veiligheid van deelnemers. Ik heb bovenstaande gelezen en stem in met deelname door op het "->" te klikken.
253
Browser Meta Info Browser Version Operating System Screen Resolution Flash Version Java Support User Agent
End of Block: informedconsent_NL Start of Block: Demographics_NL
Allereerst stellen wij u een aantal demografische vragen Wat is uw geslacht?
o Man
o Vrouw
o Anders, namelijk ________________________________________________
Wat is uw leeftijd?
o 18-24
o 25-34
o 35-44
o 45-54
o 55-64
o 65+
o Wil ik niet zeggen
254
Wat is uw etnische achtergrond (selecteer de categorie waar u zich het meest mee identificeert)?
▢ Europees
▢ Turks
▢ Marokkaans
▢ Indonesisch
▢ Surinaams
▢ Anders, namelijk ________________________________________________ Timing First Click Last Click Page Submit Click Count Page Break
255
Wat is uw huidige of hoogst behaalde opleiding?
o Basisschool
o LBO
o MAVO, MULO, VMBO
o HAVO
o VWO
o MBO
o HBO
o WO, universiteit
o onbekend
o Anders, namelijk ________________________________________________ Timing First Click Last Click Page Submit Click Count Page Break
256
In welke provincie woon je?
▼ Groningen ... Limburg
Timing First Click Last Click Page Submit Click Count
257
End of Block: Demographics_NL Start of Block: BDW_NL Hier volgen een aantal stellingen. Geef bij iedere stelling aan in hoeverre u het eens bent met de stelling.
Hoewel het kan lijken dat dingen steeds gevaarlijker en chaotischer worden, is het echt niet zo. Elk tijdperk heeft zijn problemen, en iemands kansen om een veilig, onbezorgd leven te leiden is beter dan ooit tevoren.
o Absoluut mee eens
o Beetje mee eens
o Niet mee eens of oneens
o Beetje mee oneens
o Absoluut mee oneens
Elke dag kan er chaos en wetteloosheid om ons heen losbarsten. Alle tekenen wijzen erop.
o Absoluut mee eens
o Beetje mee eens
o Niet mee eens of oneens
o Beetje mee oneens
o Absoluut mee oneens
258
Er zijn veel gevaarlijke mensen in onze samenleving die iemand zonder enige reden, maar uit pure slechtheid, kunnen aanvallen.
o Absoluut mee eens
o Beetje mee eens
o Niet mee eens of oneens
o Beetje mee oneens
o Absoluut mee oneens
Ondanks wat men hoort over 'misdaad op straat', is er niet meer misdaad dan ooit.
o Absoluut mee eens
o Beetje mee eens
o Niet mee eens of oneens
o Beetje mee oneens
o Absoluut mee oneens
Als een persoon een paar verstandige voorzorgsmaatregelen neemt, gebeurt er waarschijnlijk niets ergs met hem of haar; we leven niet in een gevaarlijke wereld.
o Absoluut mee eens
o Beetje mee eens
o Niet mee eens of oneens
o Beetje mee oneens
o Absoluut mee oneens
259
Timing First Click Last Click Page Submit Click Count Page Break
260
Aangezien de samenleving steeds wettelozer en beestachtiger wordt, gaan iemands kansen om bestolen, mishandeld en zelfs vermoord te worden omhoog.
o Absoluut mee eens
o Beetje mee eens
o Niet mee eens of oneens
o Beetje mee oneens
o Absoluut mee oneens
Mijn kennis en ervaring vertelt me dat de sociale wereld waarin we leven in feite een veilige, stabiele en veilige plaats is, waarin de meeste mensen fundamenteel goed zijn.
o Absoluut mee eens
o Beetje mee eens
o Niet mee eens of oneens
o Beetje mee oneens
o Absoluut mee oneens
261
Het lijkt erop dat er steeds minder echt respectabele mensen zijn en meer personen zonder moraal die de rest bedreigen.
o Absoluut mee eens
o Beetje mee eens
o Niet mee eens of oneens
o Beetje mee oneens
o Absoluut mee oneens
Het "einde" is niet nabij. Mensen die denken dat aardbevingen, oorlogen en hongersnood betekenen dat God op het punt staat de wereld te vernietigen zijn dwaas.
o Absoluut mee eens
o Beetje mee eens
o Niet mee eens of oneens
o Beetje mee oneens
o Absoluut mee oneens
Mijn kennis en ervaring vertelt me dat de sociale wereld waarin we leven in feite een gevaarlijke en onvoorspelbare plaats is, waarin de goede, fatsoenlijke en morele waarden en levensstijl van mensen worden bedreigd en verstoord door slechte mensen.
o Absoluut mee eens
o Beetje mee eens
o Niet mee eens of oneens
o Beetje mee oneens
o Absoluut mee oneens
262
Timing First Click Last Click Page Submit Click Count
End of Block: BDW_NL Start of Block: PLRA_NL
Hoe waarschijnlijk acht u dat het volgende gebeurt in uw leven (in uw toekomst)?
Absoluut
niet 1
2 3 4 Absoluut wel 5
1. Waarschijnlijkheid
dat u wordt overvallen.
o o o o o 2.
Waarschijnlijkheid dat u met geweld
wordt aangevallen.
o o o o o 3.
Waarschijnlijkheid dat uw huis zal
worden binnengevallen
door een gewapende
inbreker.
o o o o o
4. Waarschijnlijkheid
dat u aanwezig zult zijn bij een grootschalige
schietpartij met veel doden en
gewonden.
o o o o o
263
Timing First Click Last Click Page Submit Click Count
End of Block: PLRA_NL Start of Block: MassShooting_UtrechtNL_Fixed Schietincident in Utrecht Op maandag 18 maart 2019 schoot een schutter op meerdere mensen in een tram bij het 24 Oktoberplein in Utrecht. Drie mensen werden gedood en een aantal mensen werden in het ziekenhuis opgenomen, waardoor dit het dodelijkste schietincident in Nederland is sinds 2011. De schutter, een 37-jarige inwoner van Utrecht, werd na een klopjacht op de dag van de aanval gearresteerd. Timing First Click Last Click Page Submit Click Count Page Break
264
De volgende vragen hebben betrekking op uw kijk op het schietincident: (1) wat had het schietincident kunnen voorkomen; (2) wat zou de schutter hebben gemotiveerd? Timing First Click Last Click Page Submit Click Count Page Break
265

(1) Hoe waarschijnlijk vindt u de onderstaande opties?
266
Het schietincident in Utrecht had voorkomen kunnen worden als ...
(Niet van
toepassing)
Erg onwaarschijnlij
k -3
-2
-1
Neutraal 0
+1
+2
Erg waarschijnlij
k +3
...als mensen in de buurt
gewapend zouden zijn geweest.
o o o o o o o o ...als er
strengere wetten in Nederland
zouden zijn voor het legaal bezit
van vuurwapens.
o o o o o o o o ..als de
geestelijke gezondsheidszorg in Nederland
beter was geweest.
o o o o o o o o ...als er meer toezicht op
vermoedelijke radicalen zou zijn geweest.
o o o o o o o o ...als de
maatschappij waakzamer zou zijn geweest wat
betreft immigranten uit
islamitische landen.
o o o o o o o o
...als de samenleving toleranter zou zijn tegenover
immigranten uit islamitische
landen
o o o o o o o o
Andere reden, namelijk o o o o o o o o
267

Timing First Click Last Click Page Submit Click Count Page Break
268
(2) Hoe waarschijnlijk vind u de onderstaande opties? Wat zou de schutter hebben gemotiveerd om de schietpartij in Utrecht te plegen?
Niet van
toepassing
Erg onwaarschijnlij
k -3
-2
-1
Neutraal 0
+1
+2
Erg waarschijnlij
k +3
Invloed van religie o o o o o o o o
Invloed van ideologie o o o o o o o o
Verlangen naar macht,
betekenis of aandacht
o o o o o o o o Compensatie
voor eigen ontoereikendhei
d (schaamte, onveiligheid, zelfhaat, etc.)
o o o o o o o o Haat tegen anderen,
vooroordelen o o o o o o o o Psychische problemen o o o o o o o o
Gemakkelijke toegang tot vuurwapens o o o o o o o o
Culturele blootstelling aan geweld (in films,
nieuws, entertainment,
etc.)
o o o o o o o o Andere
motivatie, namelijk o o o o o o o o
269

Timing First Click Last Click Page Submit Click Count
End of Block: MassShooting_UtrechtNL_Fixed Start of Block: Islamoprejudice_FixedNL
270
De volgende vragen hebben betrekking op de islam. Geef bij iedere stelling aan in hoeverre u het er mee eens of oneens bent.
Absoluut oneens
Enigszins oneens
Niet mee eens of oneens
Enigszins eens
Absoluut mee eens
De islamitische wereld is
achterlijk en reageert niet op
nieuwe realiteiten.
o o o o o Het is verkeerd
om de islamitische wereld te
karakteriseren als één uniforme
wereld.
o o o o o
De islam is een archaïsche, verouderde
religie die zich niet aan het heden kan aanpassen.
o o o o o
De islam deelt dezelfde
universele ethische
principes als andere grote
wereldreligies.
o o o o o
De islam heeft een agressieve kant waardoor terrorisme er mogelijk door
wordt.
o o o o o Het is goed dat een islamitische
religieuze opvoeding wordt aangeboden in
alle gemeenschappen
met een groot aantal
islamitische kinderen.
o o o o o
271
Timing First Click Last Click Page Submit Click Count Page Break
272
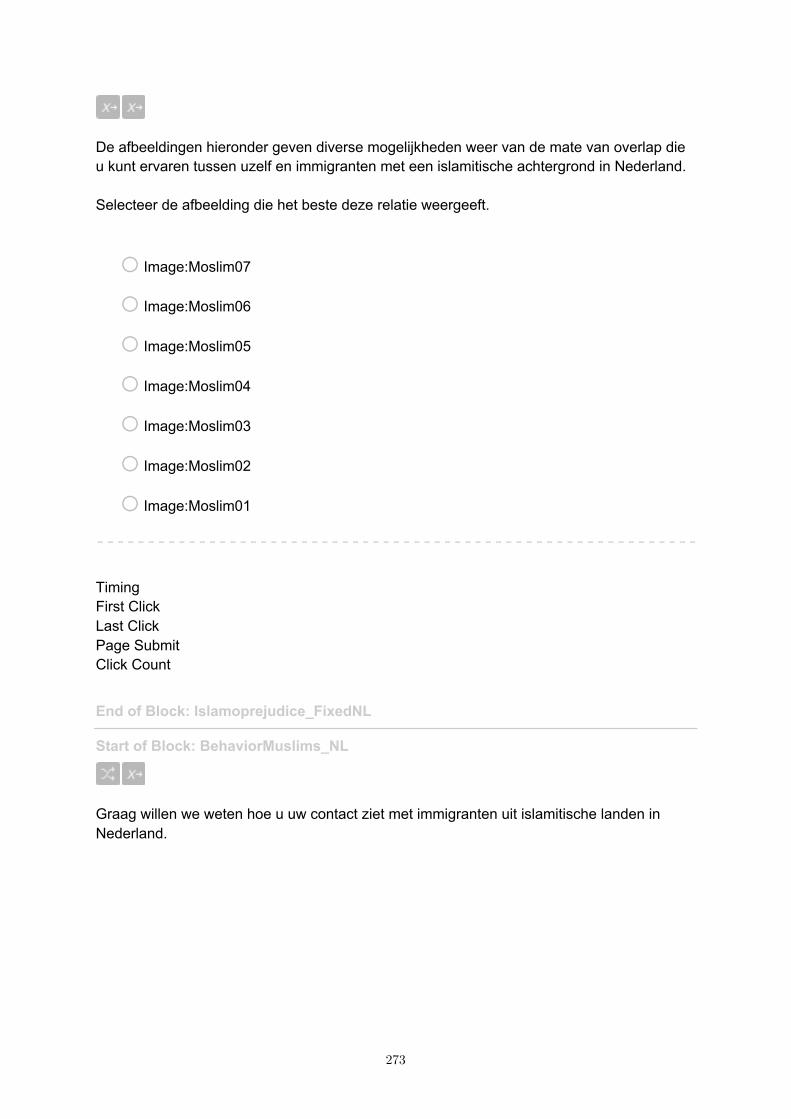
De afbeeldingen hieronder geven diverse mogelijkheden weer van de mate van overlap die u kunt ervaren tussen uzelf en immigranten met een islamitische achtergrond in Nederland. Selecteer de afbeelding die het beste deze relatie weergeeft.
o Image:Moslim07
o Image:Moslim06
o Image:Moslim05
o Image:Moslim04
o Image:Moslim03
o Image:Moslim02
o Image:Moslim01 Timing First Click Last Click Page Submit Click Count
End of Block: Islamoprejudice_FixedNL Start of Block: BehaviorMuslims_NL
Graag willen we weten hoe u uw contact ziet met immigranten uit islamitische landen in Nederland.
273
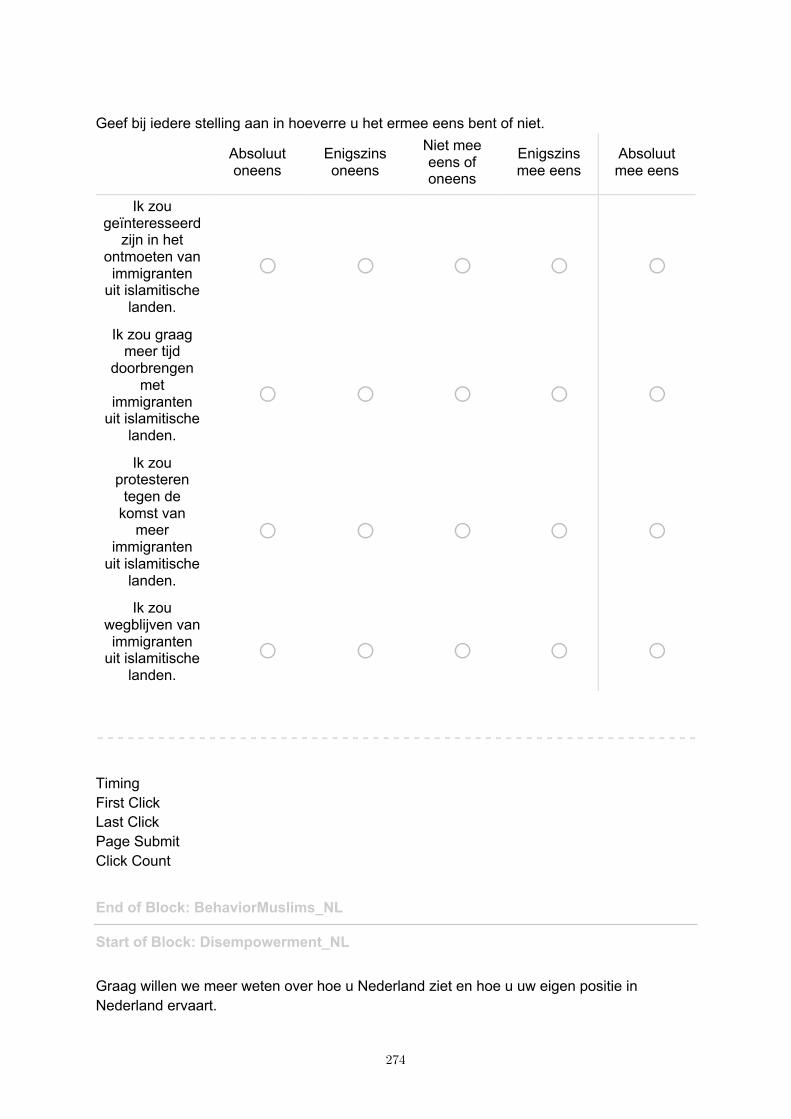
Geef bij iedere stelling aan in hoeverre u het ermee eens bent of niet.
Absoluut oneens
Enigszins oneens
Niet mee eens of oneens
Enigszins mee eens
Absoluut mee eens
Ik zou geïnteresseerd
zijn in het ontmoeten van immigranten
uit islamitische landen.
o o o o o
Ik zou graag meer tijd
doorbrengen met
immigranten uit islamitische
landen.
o o o o o
Ik zou protesteren
tegen de komst van
meer immigranten
uit islamitische landen.
o o o o o
Ik zou wegblijven van immigranten
uit islamitische landen.
o o o o o Timing First Click Last Click Page Submit Click Count
End of Block: BehaviorMuslims_NL Start of Block: Disempowerment_NL Graag willen we meer weten over hoe u Nederland ziet en hoe u uw eigen positie in Nederland ervaart.
274
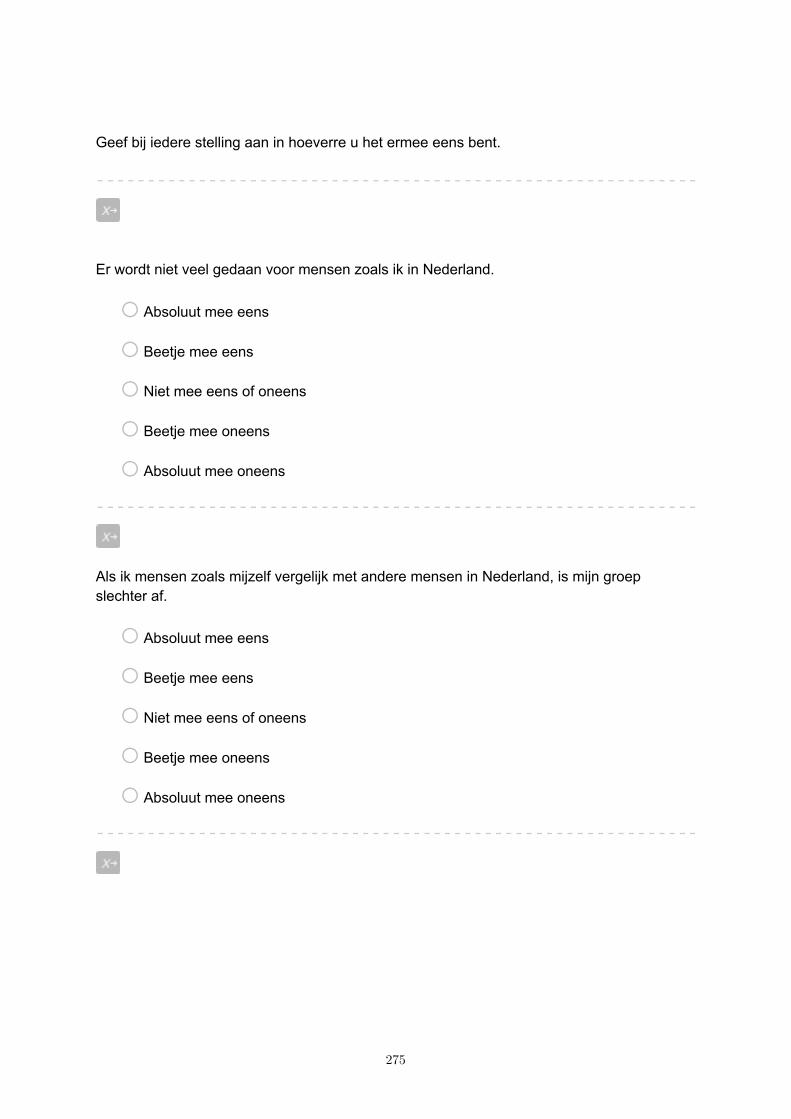
Geef bij iedere stelling aan in hoeverre u het ermee eens bent.
Er wordt niet veel gedaan voor mensen zoals ik in Nederland.
o Absoluut mee eens
o Beetje mee eens
o Niet mee eens of oneens
o Beetje mee oneens
o Absoluut mee oneens
Als ik mensen zoals mijzelf vergelijk met andere mensen in Nederland, is mijn groep slechter af.
o Absoluut mee eens
o Beetje mee eens
o Niet mee eens of oneens
o Beetje mee oneens
o Absoluut mee oneens
275
Recente gebeurtenissen in de samenleving hebben mijn problemen in het dagelijks leven vergroot.
o Absoluut mee eens
o Beetje mee eens
o Niet mee eens of oneens
o Beetje mee oneens
o Absoluut mee oneens Timing First Click Last Click Page Submit Click Count
End of Block: Disempowerment_NL Start of Block: Discontent_NL
Ik ben bang dat het fout zal gaan in de samenleving.
o Absoluut mee eens
o Beetje mee eens
o Niet mee eens of oneens
o Beetje mee oneens
o Absoluut mee oneens
276
Ik ben bezorgd wanneer ik denk aan de toekomst van de samenleving.
o Absoluut mee eens
o Beetje mee eens
o Niet mee eens of oneens
o Beetje mee oneens
o Absoluut mee oneens
Ik ben tevreden over de samenleving.
o Absoluut mee eens
o Beetje mee eens
o Niet mee eens of oneens
o Beetje mee oneens
o Absoluut mee oneens Timing First Click Last Click Page Submit Click Count
End of Block: Discontent_NL Start of Block: WAS_CNL
277
Geef bij onderstaande stellingen in hoeverre u het er mee eens bent.
Absoluut
mee oneens
Beetje mee
oneens
Niet mee eens of oneens
Beetje mee eens
Absoluut mee eens
De tegenslagen van mensen zijn het
gevolg van fouten die ze hebben gemaakt.
o o o o o Door ons gedrag
kunnen we voorkomen dat er
slechte dingen met ons gebeuren.
o o o o o Als mensen
voorzorgsmaatregelen nemen, kunnen de
meeste tegenslagen worden vermeden.
o o o o o Wanneer er slechte dingen gebeuren, komt dit meestal
doordat mensen niet de noodzakelijke
maatregelen hebben genomen om zichzelf
te beschermen.
o o o o o
Timing First Click Last Click Page Submit Click Count
End of Block: WAS_CNL Start of Block: RTK_NL
Graag willen wij nu weten hoe u denkt over het volgende onderwerp: geef bij iedere mogelijkheid aan in hoeverre u het er mee eens bent.
278
Ik heb het recht om iemand anders te vermoorden ...
Absoluut mee oneens
Beetje mee oneens
Niet mee eens of oneens
Beetje mee eens
Absoluut mee eens
...in geval van zelfverdediging o o o o o
...om mijn familie te
beschermen o o o o o ...om mijn huis te verdedigen o o o o o
Timing First Click Last Click Page Submit Click Count
End of Block: RTK_NL Start of Block: Knowledge
Hoe voelde u zich toen u hoorde over het schietincident in Utrecht?
Absoluut niet 1 2 3 4 Absoluut wel
5
Woedend o o o o o Verdrietig o o o o o Angstig o o o o o
Geschrokken o o o o o Verrast o o o o o
279
Wanneer was u voor het laatst in Utrecht?
o vandaag
o een paar dagen geleden
o een week geleden
o een aantal weken geleden
o een aantal maanden geleden
o jaren geleden
o Ik ben nooit in Utrecht geweest
Hoeveel weet u over het schietincident in Utrecht?
o Helemaal niets
o Een beetje
o Redelijk wat
o Best veel
o Heel erg veel Timing First Click Last Click Page Submit Click Count
End of Block: Knowledge Start of Block: Belief Superiority
280
Hoe belangrijk is uw ras of etnische achtergrond voor uw identiteit?
o Helemaal niet belangrijk
o Een beetje belangrijk
o Belangrijk
o Heel belangrijk
o Extreem belangrijk Timing First Click Last Click Page Submit Click Count Page Break
281

Hoe belangrijk is het volgens u dat blanke mensen samenwerken om maatregelen en initiatieven te veranderen die oneerlijk zijn tegenover blanken?
o Helemaal niet belangrijk
o Een beetje belangrijk
o Belangrijk
o Heel belangrijk
o Extreem belangrijk Timing First Click Last Click Page Submit Click Count Page Break
282
Hoeveel discriminatie ervaren blanke mensen in Nederland?
o Helemaal niet
o Een beetje
o Redelijk wat
o Veel
o Heel erg veel Timing First Click Last Click Page Submit Click Count Page Break
283
Zijn uw opvattingen wat betreft discriminatie van blanken beter dan opvattingen die andere mensen hebben over discriminatie van blanken?
o Niet beter dan andere opvattingen
o Een beetje beter dan andere opvattingen
o Beter dan andere opvattingen
o Veel beter dan andere opvattingen
o Alleen mijn opvattingen zijn juist Timing First Click Last Click Page Submit Click Count
End of Block: Belief Superiority Start of Block: Personal_NL
Bent u ooit het slachtoffer geweest van een gewelddadige misdaad?
o Ja
o Nee
Bent u in het bezit van een vuurwapen?
o Ja
o Nee
284

Timing First Click Last Click Page Submit Click Count Page Break
285
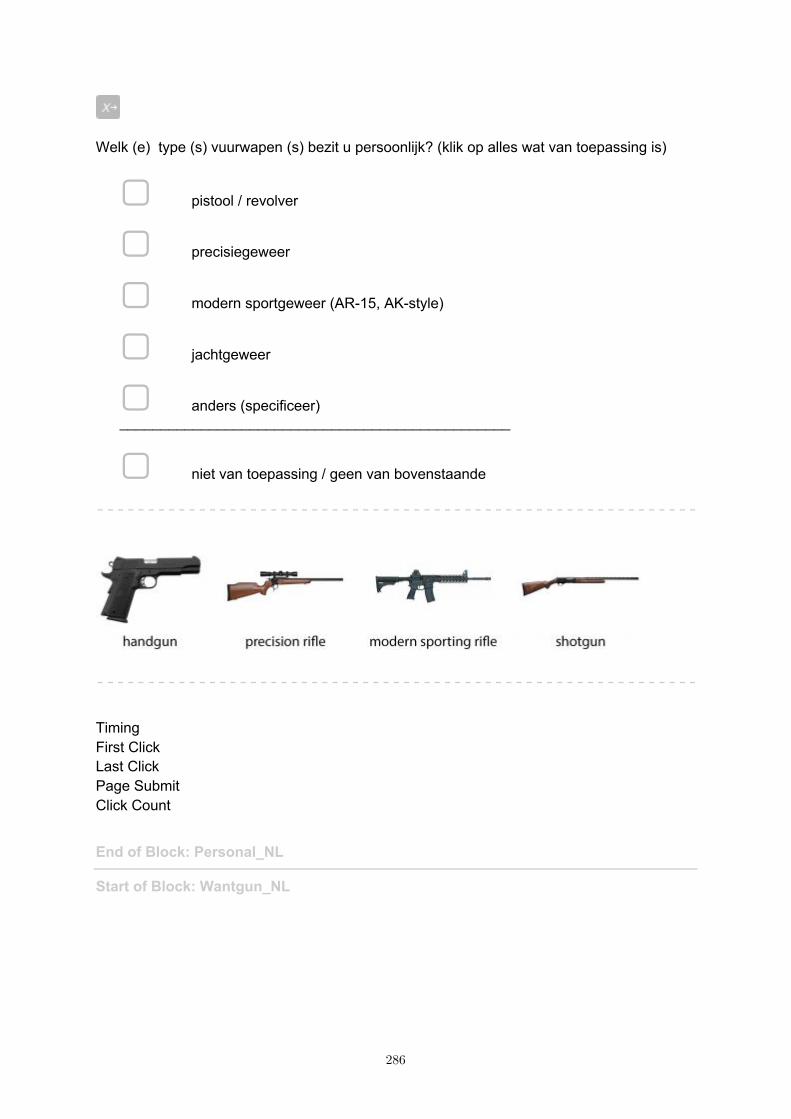
Welk (e) type (s) vuurwapen (s) bezit u persoonlijk? (klik op alles wat van toepassing is)
▢ pistool / revolver
▢ precisiegeweer
▢ modern sportgeweer (AR-15, AK-style)
▢ jachtgeweer
▢ anders (specificeer) ________________________________________________
▢ niet van toepassing / geen van bovenstaande
Timing First Click Last Click Page Submit Click Count
End of Block: Personal_NL Start of Block: Wantgun_NL
286
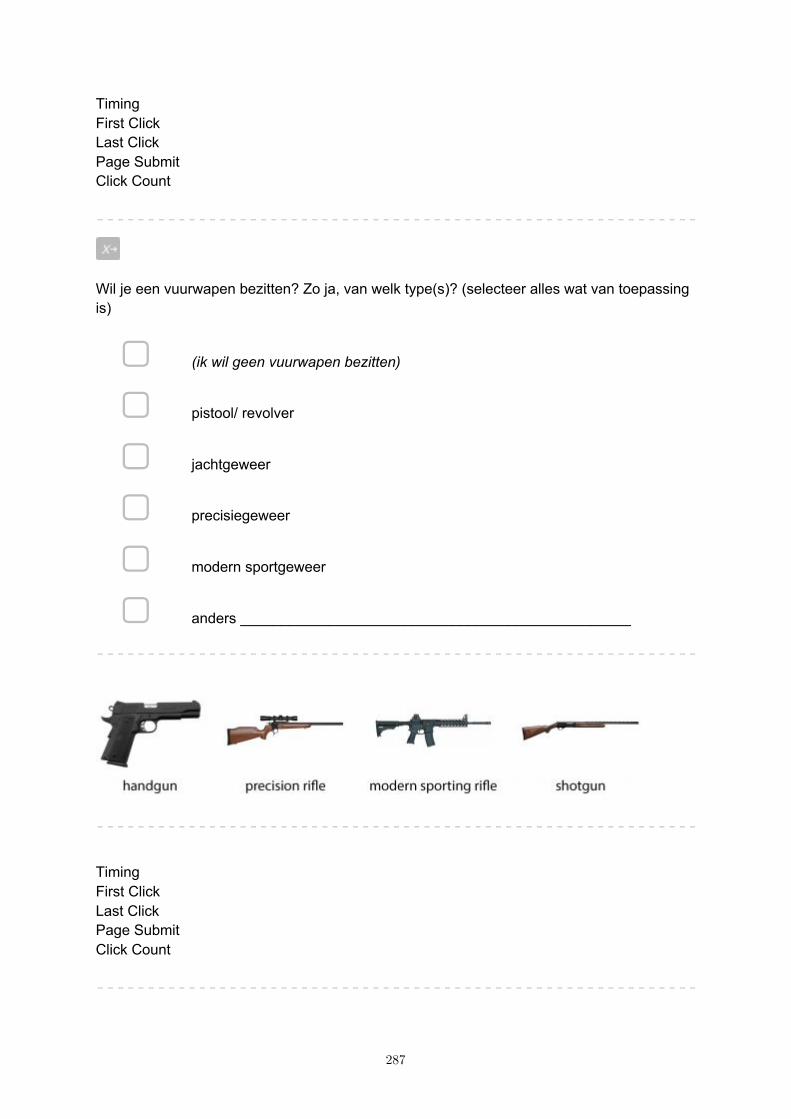
Timing First Click Last Click Page Submit Click Count
Wil je een vuurwapen bezitten? Zo ja, van welk type(s)? (selecteer alles wat van toepassing is)
▢ (ik wil geen vuurwapen bezitten)
▢ pistool/ revolver
▢ jachtgeweer
▢ precisiegeweer
▢ modern sportgeweer
▢ anders ________________________________________________
Timing First Click Last Click Page Submit Click Count
287

Page Break
288
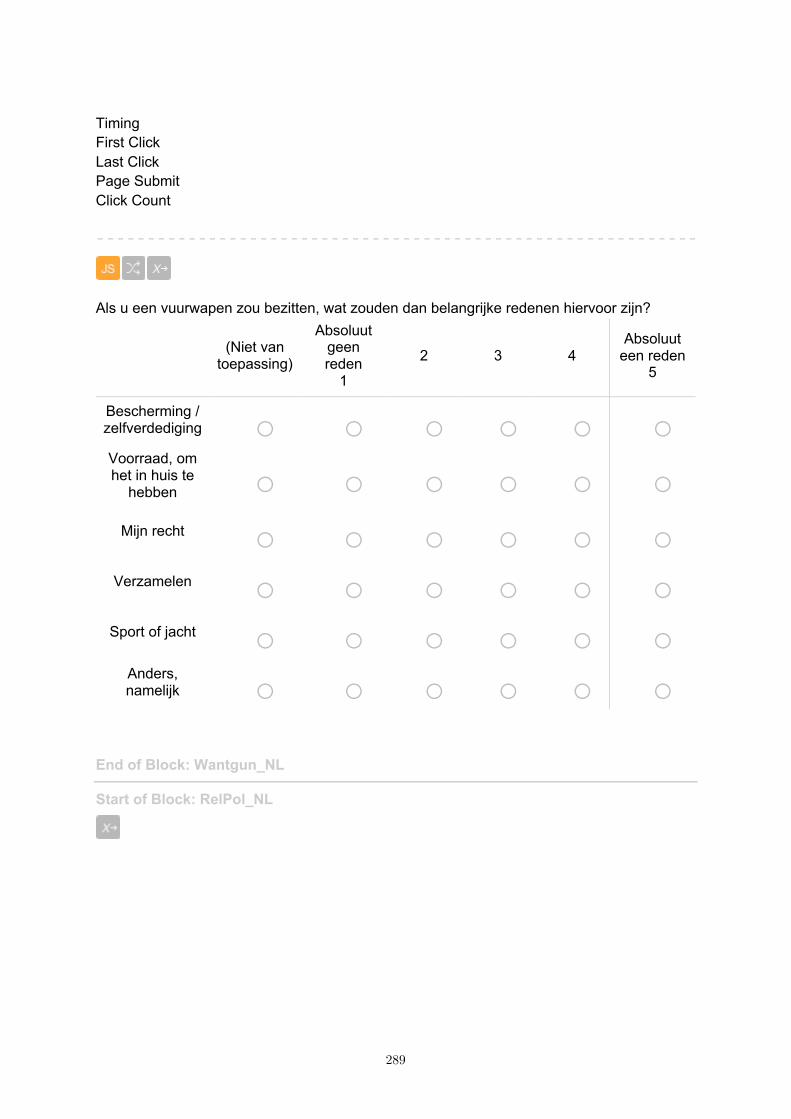
Timing First Click Last Click Page Submit Click Count
Als u een vuurwapen zou bezitten, wat zouden dan belangrijke redenen hiervoor zijn?
(Niet van toepassing)
Absoluut geen reden
1
2 3 4 Absoluut
een reden 5
Bescherming / zelfverdediging o o o o o o Voorraad, om het in huis te
hebben o o o o o o Mijn recht o o o o o o
Verzamelen o o o o o o Sport of jacht o o o o o o
Anders, namelijk o o o o o o
End of Block: Wantgun_NL Start of Block: RelPol_NL
289

Wat is uw huidige religieuze overtuiging, indien van toepassing?
o Katholiek
o Protestant
o Joods
o Moslim
o Sikh
o Hindoe
o Boeddhist
o Atheist
o Agnost
o Niets
o Anders, namelijk ________________________________________________
Hoe vaak gaat u naar de kerk (of andere georganiseerde religieuze diensten)?
o Nooit
o Zelden
o Minstens een keer per jaar
o Minstens een keer per maand
o Minstens een keer per week
290
Hoe religieus bent u?
o Absoluut niet religieus1
o 2
o 3
o 4
o Heel erg religieus5 Timing First Click Last Click Page Submit Click Count Page Break
291
Wat is uw politieke voorkeur?
o Heel erg links1
o 2
o 3
o 4
o 5
o 6
o 7
o 8
o Heel erg rechts9
292
Op welke partij heeft u bij de provinciale verkiezingen op 20 maart 2019 gestemd?
▢ VVD
▢ CDA
▢ D66
▢ Groenlinks
▢ PVDA
▢ PVV
▢ Forum voor Democratie
▢ Christenunie
▢ SGP
▢ Partij voor de Dieren
▢ 50Plus
▢ Denk
▢ SP
▢ Lokale/ provinciale partij
▢ Niet gestemd
▢ Wil niet zeggen
293

Op welke partij heeft u bij de tweede kamer verkiezingen in 2017 gestemd?
294
▢ VVD
▢ CDA
▢ D66
▢ Groenlinks
▢ PVDA
▢ PVV
▢ Forum voor Democratie
▢ Christenunie
▢ SGP
▢ Partij voor de Dieren
▢ 50Plus
▢ Denk
▢ SP
▢ Andere partij
▢ Niet gestemd
▢ Wil niet zeggen
295

Timing First Click Last Click Page Submit Click Count Page Break
296
Denkt u dat het immigratiebeleid veel strenger, veel minder streng of hetzelfde zou moeten zijn? zijn?
o Veel minder streng1
o 2
o 3
o Hetzelfde als nu4
o 5
o 6
o Veel strenger7
Hoeveel vertrouwen heeft u in de nationale regering?
o Geen vertrouwen1
o 2
o 3
o 4
o Veel vertrouwen5
297
De nationale regering behartigt de belangen van mij en anderen zoals ik.
o Helemaal mee eens
o Mee eens
o Noch mee oneens, noch mee eens
o Mee oneens
o Helemaal mee oneens
o (Weet ik niet) Timing First Click Last Click Page Submit Click Count Page Break
298

Kent u immigranten met een islamitische achtergrond? (Selecteer alles wat van toepassing is)
▢ ja, in mijn familie
▢ ja, in mijn vriendenkring
▢ Er wonen immigranten met een islamitische achtergrond bij mij in de buurt
▢ Ik werk samen en/of studeer met immigranten met een islamitische achtergrond
▢ een andere relatie met immigranten met een islamitische achtergrond, namelijk ________________________________________________
▢ Nee, ik ken geen immigranten met een islamitische achtergrond
▢ wil niet antwoorden
▢ Ik ben zelf een immigrant met een islamitische achtergrond
In vergelijking met mezelf hebben mensen met een islamitische achtergrond ...
o Veel minder macht en invloed-2
o -1
o Ongeveer evenveel macht en invloed0
o 1
o Veel meer macht en invloed2
299
Hoe denkt u dat mensen met een islamitische achtergrond zich voelen over mensen zonder islamitische achtergrond?
o Heel erg negatief-2
o -1
o Neutraal0
o 1
o Heel erg positief2 Timing First Click Last Click Page Submit Click Count
End of Block: RelPol_NL Start of Block: RelationsNL
Heeft u kinderen, en zo ja, hoeveeel?
o Nee
o Ja, 1 kind
o Ja, 2 kinderen
o Ja, 3 kinderen
o Ja, 4 kinderen
o Ja, 5 of meer kinderen
o Anders
o Anders, namelijk: ________________________________________________
300
Bent u getrouwd en / of woont u samen met een romantische partner?
o ja
o nee
Wanneer heeft u voor het laats een betekenisvol gesprek gehad met een ander persoon?
o Vandaag
o een of twee dagen geleden
o een aantal dagen geleden
o weken geleden
o maanden geleden
o jaren geleden Timing First Click Last Click Page Submit Click Count
End of Block: RelationsNL Start of Block: WAS_BIW_NL
301
In welke mate bent u het eens met de volgende stellingen?
Absoluut mee oneens
Beetje mee oneens
Niet mee eens of oneens
Beetje mee eens
Absolut mee eens
De goede dingen die in deze wereld
gebeuren overtreffen de slechte dingen die gebeuren
o o o o o
Er is meer goed dan
kwaad in de wereld.
o o o o o Als je goed
genoeg kijkt, zul je zien dat er veel
goeds gebeurt in de
wereld.
o o o o o
De wereld is een goede
plek. o o o o o Timing First Click Last Click Page Submit Click Count
End of Block: WAS_BIW_NL Start of Block: debrief_NL Dit is het einde van de vragenlijst. Hartelijk dank voor uw deelname! Het doel van deze studie is om te onderzoeken hoe het publiek denkt over massale schietpartijen. We verzamelen deze gegevens regelmatig in diverse landen om veranderingen in publieke
302

opinies in de loop van de tijd te beoordelen, vooral als het gaat om wapens, persoonlijkheid, overtuigingen en voorkeuren. Aangezien de schietpartij in Utrecht werd gepleegd door een migrant die geboren is in een land met een islamitische meerderheid, en dit feit in de media sterk naar voren kwam, hebben we bovendien overtuigingen over de islam gemeten. De resultaten zullen alleen worden gebruikt voor wetenschappelijke onderzoeksdoeleinden. Als u vragen of opmerkingen heeft over de studie of uw deelname, kunt u contact opnemen met de hoofdonderzoeker, Dr. N. P. Leander ([email protected]). Bij klachten over deze studie kunt u contact opnemen met onze ethische commssie ([email protected]). Nu u het doel van deze studie weet, heeft u advies of suggesties om de enquêtervaring te verbeteren? We stellen uw feedback op prijs. Klik op "-->" om de vragenlijst af te sluiten en terug te keren naar Flycatcher.
________________________________________________________________
________________________________________________________________
________________________________________________________________
________________________________________________________________
________________________________________________________________ Timing First Click Last Click Page Submit Click Count
End of Block: debrief_NL
303
Supplementary Information D
Full Survey of Study 3: El Paso Walmart Shooting / Dayton Bar Shooting
The following supplementary appendix includes the full survey print-out for Study 3. This
study uses a survey data set from 2019. Participants were recruited after the El Paso Walmart
shooting and the Dayton bar shooting had taken place (see below ‘Qualtrics – El Paso/Dayton
– Aug. 2019’).
Qualtrics – El Paso/Dayton – Aug. 2019
Start of Block: Demographics
Gender
o Male
o Female
Age
o 18-24
o 25-34
o 35-44
o 45-54
o 55-64
o 65+
304
Racial/ethnic background
▢ White
▢ Black or African American
▢ Hispanic / Latino / Latina
▢ American Indian or Alaska Native
▢ Asian
▢ Native Hawaiian or Pacific Islander
▢ Other ________________________________________________ Timing First Click Last Click Page Submit Click Count Page Break
305
Education
o Some High School or Less
o High School Graduate / GED
o Some College
o College Graduate
o Graduate Degree
What is your annual income?
o Under $15,000
o $15,000 - $25,000
o $25,000 - $35,000
o $35,000 - $50,000
o $50,000 - $75,000
o $75,000 - $100,000
o $100,000 - $150,000
o $150,000 - $200,000
o $200,000 +
306
Below is a list of items, please indicate the objects that you currently own. (select all that apply)
I own this I do not own this
a sport utility vehicle (SUV) o o a boat o o
a playstation o o a typewriter o o
a firearm o o a musical instrument o o
an easel o o a fishing rod o o
a dehumidifier o o a swimming pool o o
Timing First Click Last Click Page Submit Click Count Page Break
307
In what region of the USA do you live?
o West
o Midwest
o South
o Northeast Timing First Click Last Click Page Submit Click Count
End of Block: Demographics Start of Block: Informed Consent Timing First Click Last Click Page Submit Click Count
308
Informed Consent Primary investigator: Dr. N. P. Leander, PhDThis university-based psychological study will ask about your beliefs, attitudes, and experiences regarding guns and the use of firearms, including questions about the recent mass shootings. The study typically takes 15 minutes. Your privacy is important: Your participation is completely anonymous. No identifying information will be collected from you. Only members of the research team will have access to the survey data, but even they cannot link the data to any single person. Your rights: You can decide whether or not to participate in the study. You can leave the study at any time. You may click "Next" to begin when ready. Browser Meta Info Browser Version Operating System Screen Resolution Flash Version Java Support User Agent
End of Block: Informed Consent Start of Block: Knowledge questions_El Paso
309
How knowledgeable are you about the recent mass shooting at the Walmart store in El Paso, Texas?
o Not at all knowledgeable
o Slightly knowledgeable
o Moderately knowledgeable
o Very knowledgeable
o Extremely knowledgeable Timing First Click Last Click Page Submit Click Count
End of Block: Knowledge questions_El Paso Start of Block: Mass Shooting_El Paso El Paso Walmart shooting On August 3, 2019, a mass shooting occurred at a Walmart store in El Paso, Texas. Twenty-two people were killed and 24 were injured. Among the deceased were 13 Americans, 8 Mexican citizens, and 1 German citizen. The accused gunman, Patrick Crusius, was arrested and charged. Timing First Click Last Click Page Submit Click Count Page Break
310

On the next few screens are questions about your views on the mass shooting: (1) what might have prevented it; (2) what might have motivated the gunman. Timing First Click Last Click Page Submit Click Count Page Break
311
(1) The mass shooting, at the Walmart store in El Paso, might have been prevented if...
(Not applicable)
-3: Very doubtful -2 -1 0:
Neutral +1 +2 +3:
Very possible
...people at the
Walmart were
armed. o o o o o o o o
...stricter gun control laws were in place.
o o o o o o o o ...better mental
health care existed.
o o o o o o o o ...there was
more surveillance
of suspected radicals.
o o o o o o o o ...society was more cautious of Muslims.
o o o o o o o o ...society was more accepting
of Muslims. o o o o o o o o
Other o o o o o o o o Timing First Click Last Click Page Submit Click Count
312

Page Break
313

(2) What might have motivated the gunman to commit the mass shooting at the Walmart store in El Paso, Texas?
(Not applicable)
-3: Very doubtful -2 -1 0:
Neutral +1 +2 +3:
Very possible
Influence of religion o o o o o o o o
Influence of ideology o o o o o o o o
Desire for power,
significance, or attention
o o o o o o o o Compensation
for inadequacy
(shame, insecurity,
self-hate, etc.)
o o o o o o o o Hatred of others,
prejudice o o o o o o o o Mental illness o o o o o o o o
Ease of access to firearms o o o o o o o o Cultural
exposure to violence (in
movies, news, entertainment,
etc.)
o o o o o o o o
Other o o o o o o o o
314

Timing First Click Last Click Page Submit Click Count Page Break
315
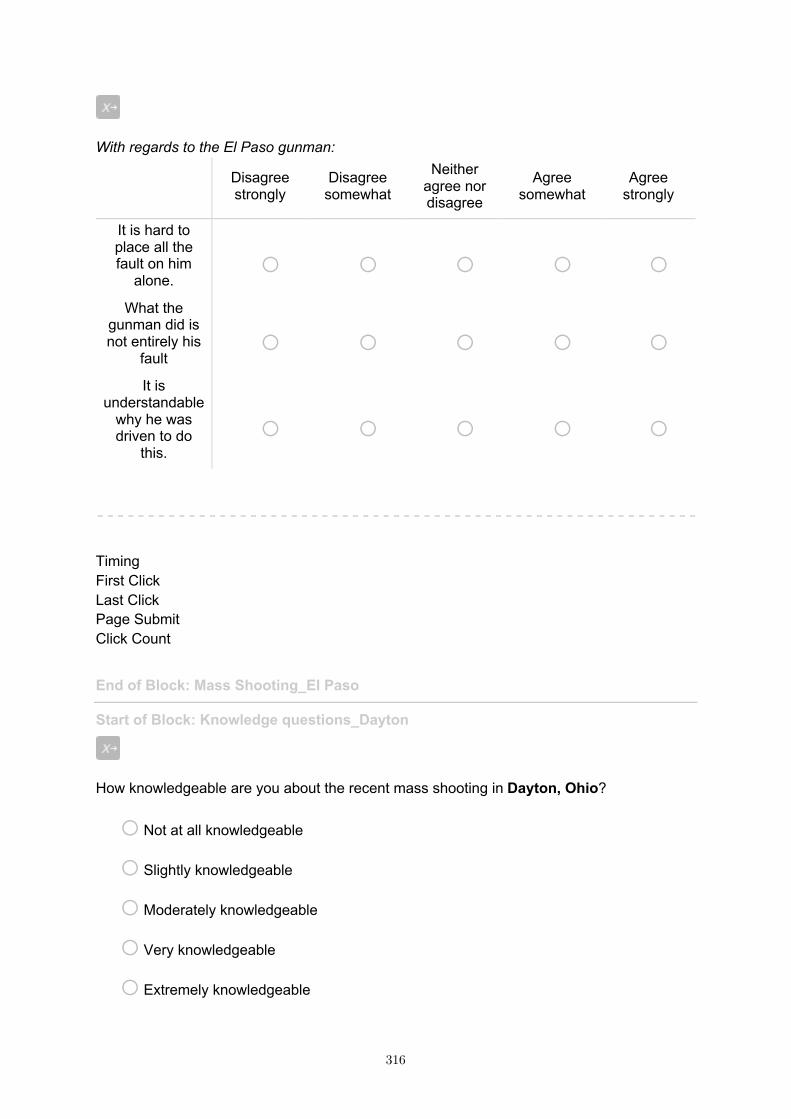
With regards to the El Paso gunman:
Disagree strongly
Disagree somewhat
Neither agree nor disagree
Agree somewhat
Agree strongly
It is hard to place all the fault on him
alone. o o o o o
What the gunman did is not entirely his
fault o o o o o
It is understandable
why he was driven to do
this. o o o o o
Timing First Click Last Click Page Submit Click Count
End of Block: Mass Shooting_El Paso Start of Block: Knowledge questions_Dayton
How knowledgeable are you about the recent mass shooting in Dayton, Ohio?
o Not at all knowledgeable
o Slightly knowledgeable
o Moderately knowledgeable
o Very knowledgeable
o Extremely knowledgeable
316
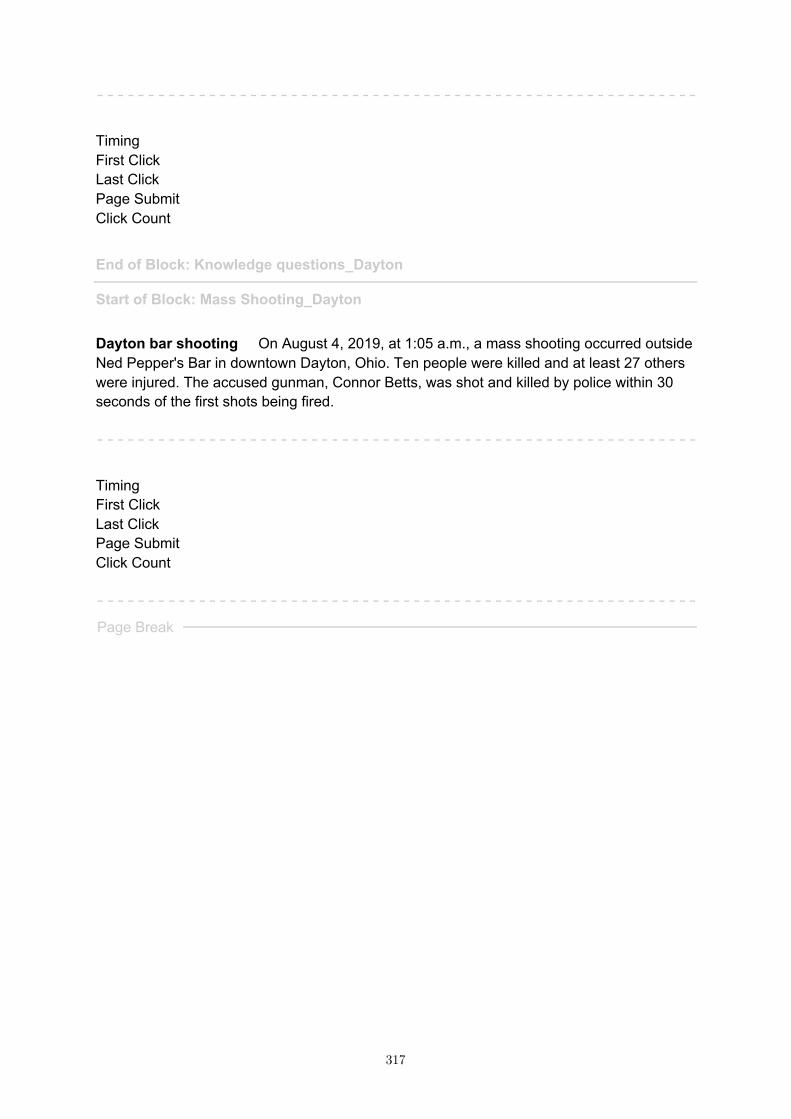
Timing First Click Last Click Page Submit Click Count
End of Block: Knowledge questions_Dayton Start of Block: Mass Shooting_Dayton Dayton bar shooting On August 4, 2019, at 1:05 a.m., a mass shooting occurred outside Ned Pepper's Bar in downtown Dayton, Ohio. Ten people were killed and at least 27 others were injured. The accused gunman, Connor Betts, was shot and killed by police within 30 seconds of the first shots being fired. Timing First Click Last Click Page Submit Click Count Page Break
317
On the next few screens are questions about your views on the mass shooting: (1) what might have prevented it; (2) what might have motivated the gunman. Timing First Click Last Click Page Submit Click Count Page Break
318
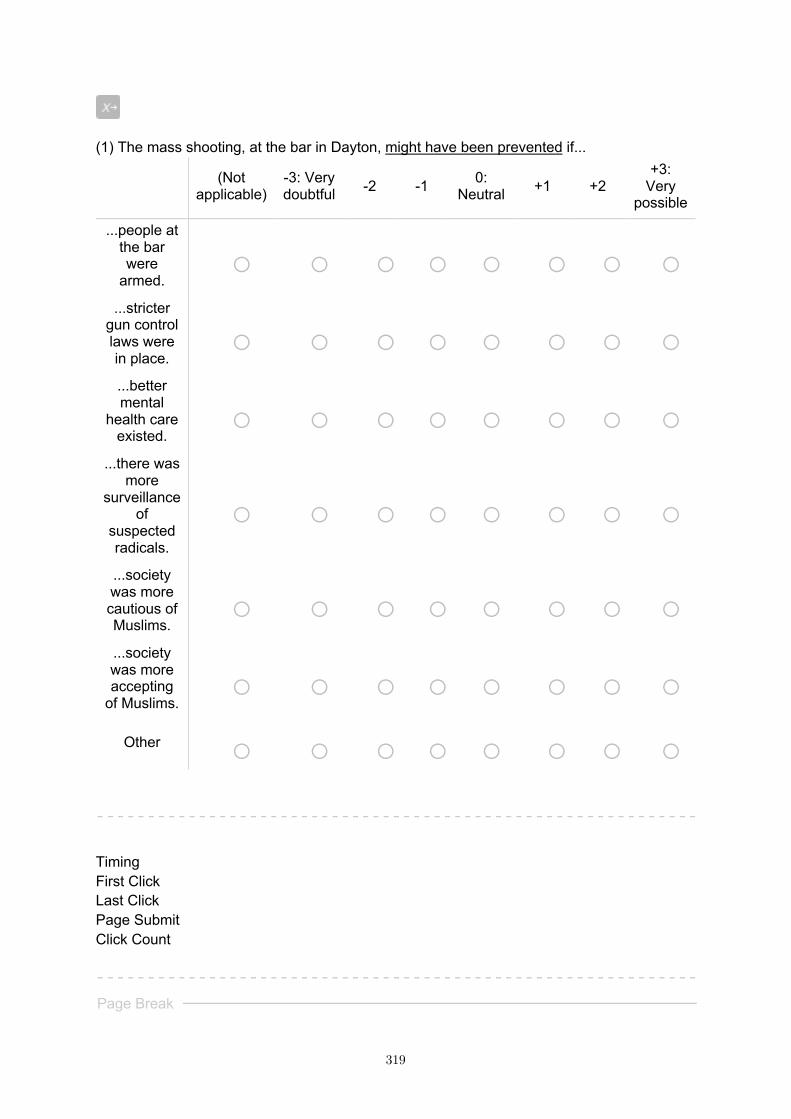
(1) The mass shooting, at the bar in Dayton, might have been prevented if...
(Not applicable)
-3: Very doubtful -2 -1 0:
Neutral +1 +2 +3:
Very possible
...people at the bar were
armed. o o o o o o o o
...stricter gun control laws were in place.
o o o o o o o o ...better mental
health care existed.
o o o o o o o o ...there was
more surveillance
of suspected radicals.
o o o o o o o o ...society was more cautious of Muslims.
o o o o o o o o ...society was more accepting
of Muslims. o o o o o o o o
Other o o o o o o o o Timing First Click Last Click Page Submit Click Count Page Break
319

320
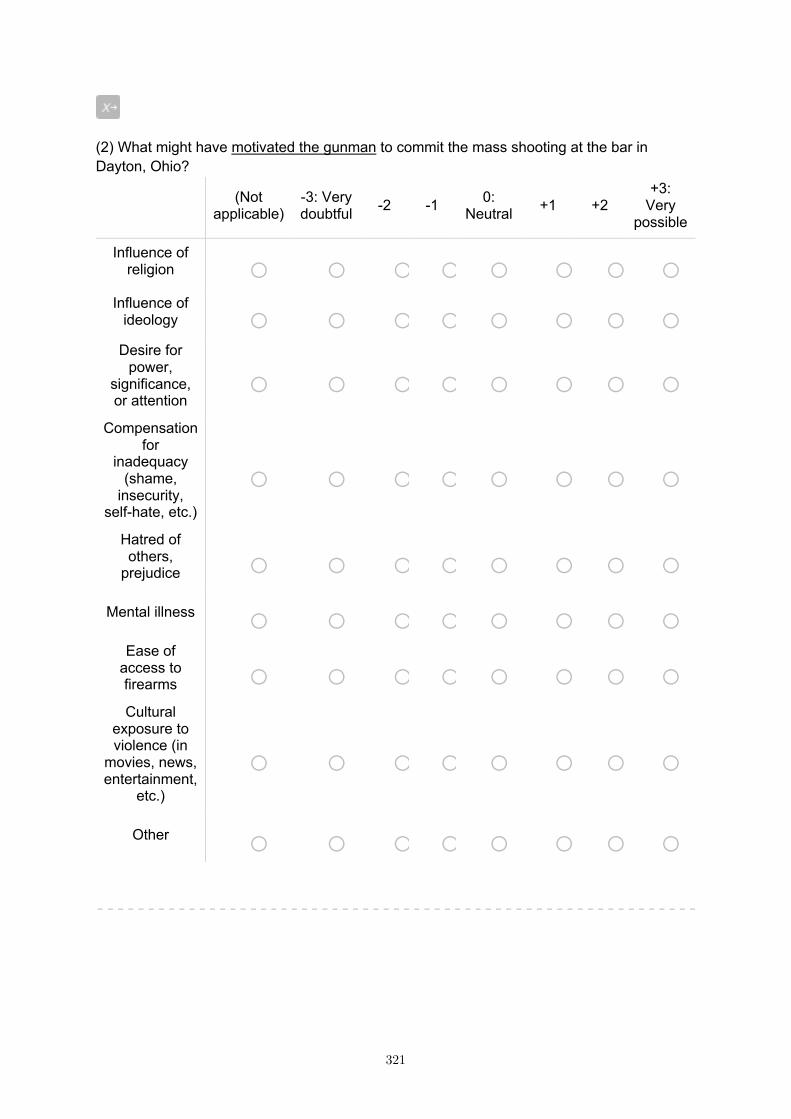
(2) What might have motivated the gunman to commit the mass shooting at the bar in Dayton, Ohio?
(Not applicable)
-3: Very doubtful -2 -1 0:
Neutral +1 +2 +3:
Very possible
Influence of religion o o o o o o o o
Influence of ideology o o o o o o o o
Desire for power,
significance, or attention
o o o o o o o o Compensation
for inadequacy
(shame, insecurity,
self-hate, etc.)
o o o o o o o o Hatred of others,
prejudice o o o o o o o o Mental illness o o o o o o o o
Ease of access to firearms o o o o o o o o Cultural
exposure to violence (in
movies, news, entertainment,
etc.)
o o o o o o o o
Other o o o o o o o o
321

Timing First Click Last Click Page Submit Click Count Page Break
322
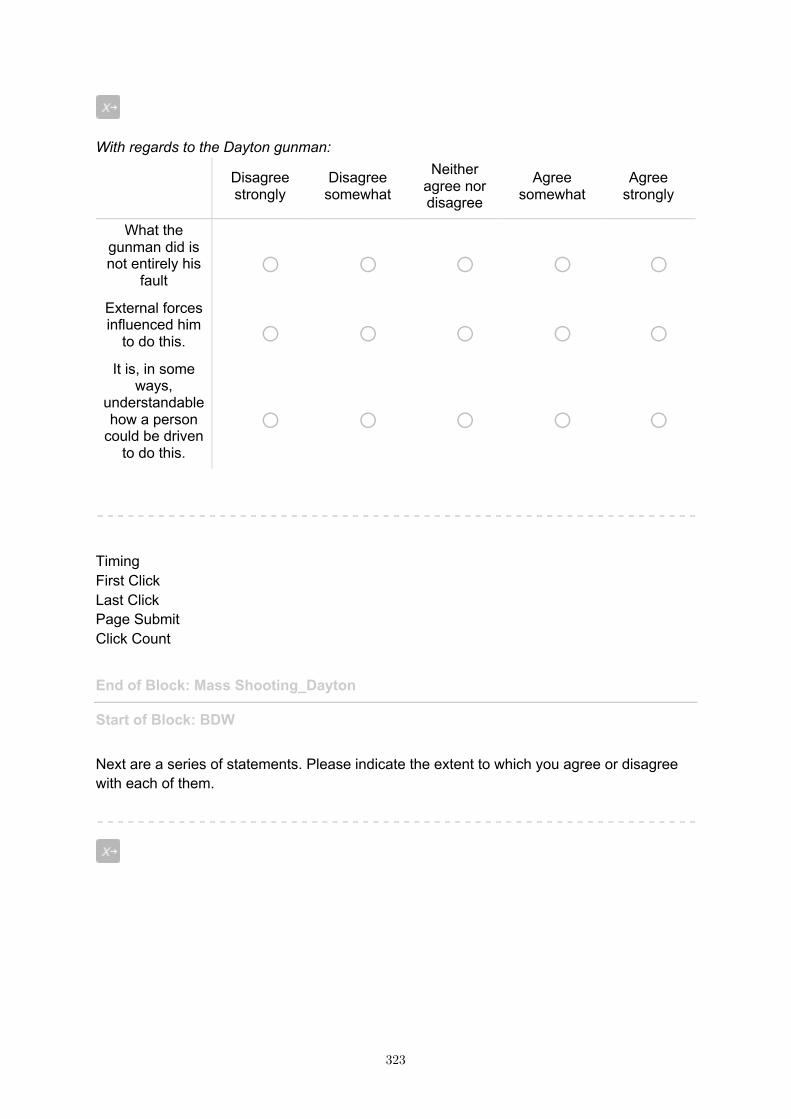
With regards to the Dayton gunman:
Disagree strongly
Disagree somewhat
Neither agree nor disagree
Agree somewhat
Agree strongly
What the gunman did is not entirely his
fault o o o o o
External forces influenced him
to do this. o o o o o It is, in some
ways, understandable how a person
could be driven to do this.
o o o o o Timing First Click Last Click Page Submit Click Count
End of Block: Mass Shooting_Dayton Start of Block: BDW Next are a series of statements. Please indicate the extent to which you agree or disagree with each of them.
323
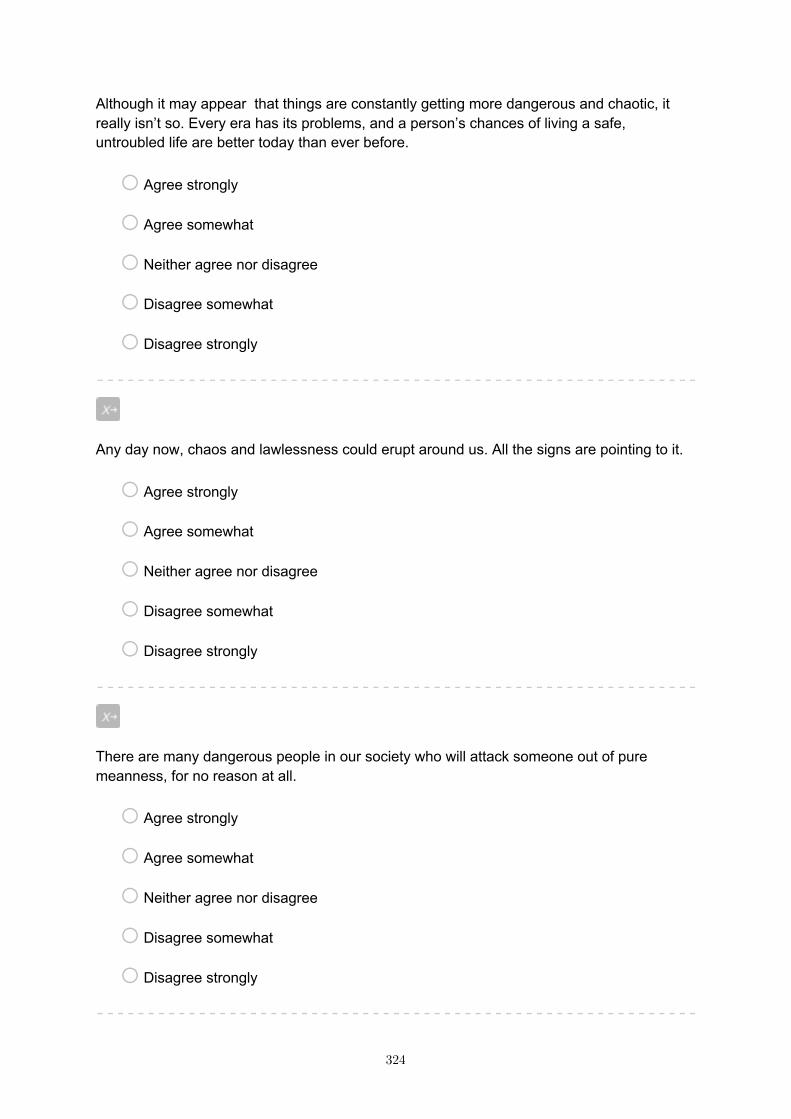
Although it may appear that things are constantly getting more dangerous and chaotic, it really isn’t so. Every era has its problems, and a person’s chances of living a safe, untroubled life are better today than ever before.
o Agree strongly
o Agree somewhat
o Neither agree nor disagree
o Disagree somewhat
o Disagree strongly
Any day now, chaos and lawlessness could erupt around us. All the signs are pointing to it.
o Agree strongly
o Agree somewhat
o Neither agree nor disagree
o Disagree somewhat
o Disagree strongly
There are many dangerous people in our society who will attack someone out of pure meanness, for no reason at all.
o Agree strongly
o Agree somewhat
o Neither agree nor disagree
o Disagree somewhat
o Disagree strongly
324
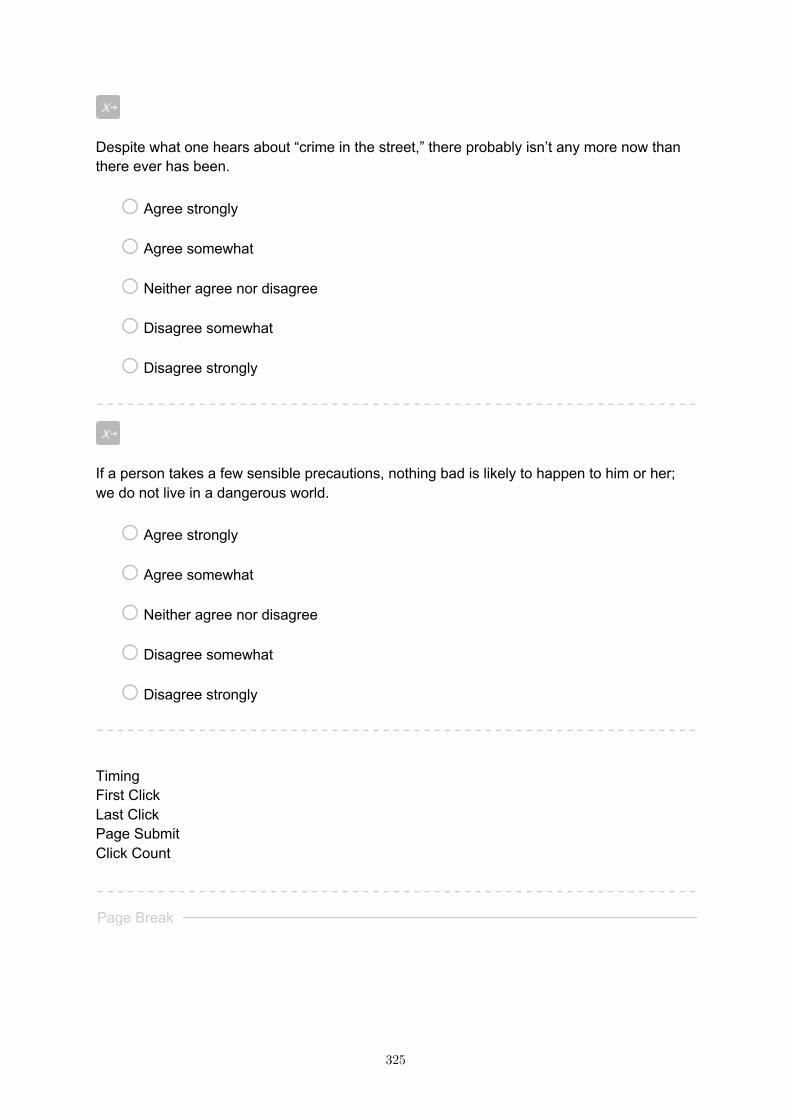
Despite what one hears about “crime in the street,” there probably isn’t any more now than there ever has been.
o Agree strongly
o Agree somewhat
o Neither agree nor disagree
o Disagree somewhat
o Disagree strongly
If a person takes a few sensible precautions, nothing bad is likely to happen to him or her; we do not live in a dangerous world.
o Agree strongly
o Agree somewhat
o Neither agree nor disagree
o Disagree somewhat
o Disagree strongly Timing First Click Last Click Page Submit Click Count Page Break
325
Every day, as society becomes more lawless and bestial, a person’s chances of being robbed, assaulted, and even murdered go up and up.
o Agree strongly
o Agree somewhat
o Neither agree nor disagree
o Disagree somewhat
o Disagree strongly
My knowledge and experience tells me that the social world we live in is basically a safe, stable and secure place, in which most people are fundamentally good.
o Agree strongly
o Agree somewhat
o Neither agree nor disagree
o Disagree somewhat
o Disagree strongly
326
It seems that every year there are fewer and fewer truly respectable people, and more and more persons with no morals at all, who threaten everyone else.
o Agree strongly
o Agree somewhat
o Neither agree nor disagree
o Disagree somewhat
o Disagree strongly
The “end” is not near. People who think that earthquakes, wars, and famines mean God might be about to destroy the world are being foolish.
o Agree strongly
o Agree somewhat
o Neither agree nor disagree
o Disagree somewhat
o Disagree strongly
My knowledge and experience tells me that the social world we live in is basically a dangerous and unpredictable place, in which good, decent and moral people’s values and way of life are threatened and disrupted by bad people.
o Agree strongly
o Agree somewhat
o Neither agree nor disagree
o Disagree somewhat
o Disagree strongly
327
Timing First Click Last Click Page Submit Click Count
End of Block: BDW Start of Block: Immigrant Prejudice
How often do you have any contact with Hispanic people when you are out and about? This could be on public transport, in the street, in shops or in the neighborhood.
o Never
o Less than once a month
o Once a month
o Several times a month
o Once a week
o Several times a week
o Every day
328
Thinking about contact with Hispanics, in general, is such contact hindering or facilitating the goals you have at that moment?
o 0 hindering my goals
o 1
o 2
o 3
o 4
o 5
o 6
o 7
o 8
o 9
o 10 facilitating my goals Timing First Click Last Click Page Submit Click Count Page Break
329
Please list the most important needs or goals you have when in contact with Hispanics. (try to list at least two)
________________________________________________________________
________________________________________________________________
________________________________________________________________
________________________________________________________________
________________________________________________________________ Timing First Click Last Click Page Submit Click Count Page Break
330
Thinking about contact with Hispanics, in general, how bad or good is it?
o 0 Extremely bad
o 1
o 2
o 3
o 4
o 5
o 6
o 7
o 8
o 9
o 10 Extremely good Timing First Click Last Click Page Submit Click Count Page Break
331
Hispanic people who come to live here, generally...
1 2 3 4 5 6 7 8 9 10
take jobs away o o o o o o o o o o create
new jobs
undermine the
cultural life
o o o o o o o o o o enrich
the cultural
life
make crime
problems worse
o o o o o o o o o o make crime
problems better
harm America's
culture o o o o o o o o o o benefit
America's culture
Timing First Click Last Click Page Submit Click Count Page Break
332
Below is a feeling thermometer. Ratings between 50 degrees and 100 degrees mean that you feel favorable and warm toward the group. Ratings between 0 degrees and 50 degrees mean that you don't feel favorable toward the group and that you don't care too much for that group. You would rate the group at the 50 degree mark if you don't feel particularly warm or cold toward the group.
How would you rate: Hispanics
o 100˚ Very warm or favorable feeling
o 85˚ Quite warm or favorable feeling
o 70˚ Fairly warm or favorable feeling
o 60˚ A bit more warm or favorable feeling than cold feeling
o 50˚ No feeling at all
o 40˚ A bit more cold or unfavorable feeling than warm feeling
o 30˚ Fairly cold or unfavorable feeling
o 15˚ Quite cold or unfavorable feeling
o 0˚ Very cold or unfavorable feeling Timing First Click Last Click Page Submit Click Count
End of Block: Immigrant Prejudice Start of Block: QFS Next are some questions about your personal experiences and tendencies.
333
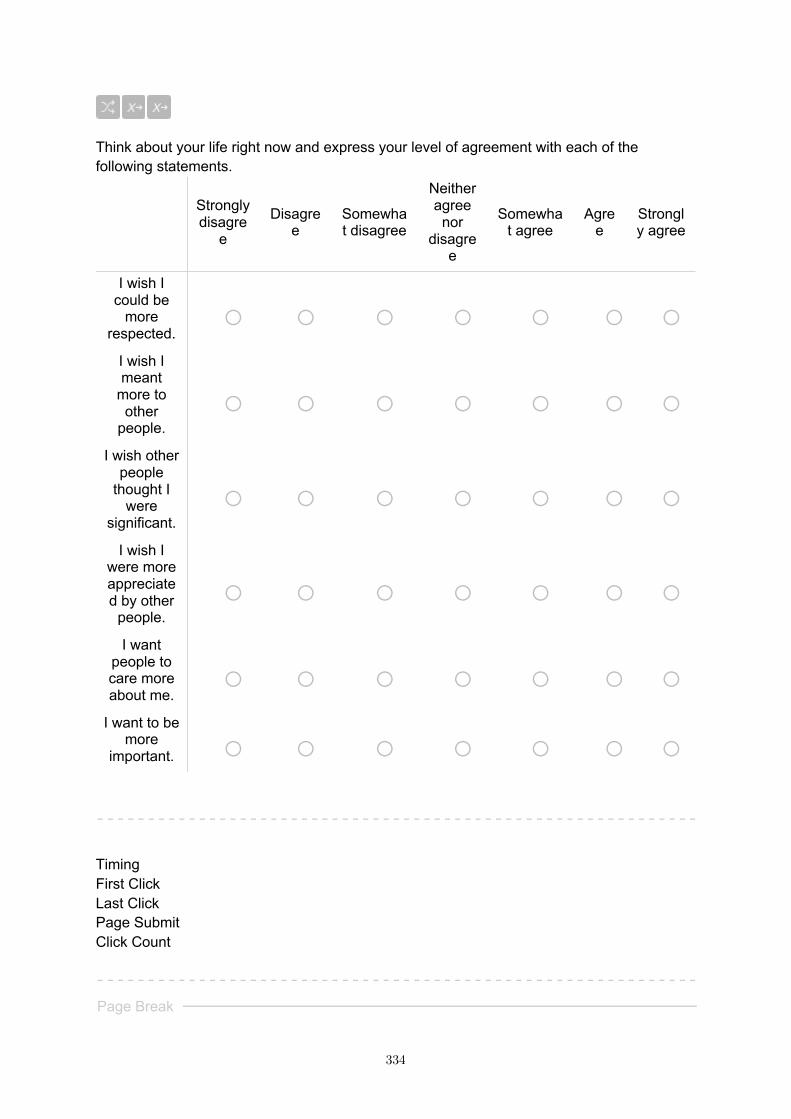
Think about your life right now and express your level of agreement with each of the following statements.
Strongly disagre
e
Disagree
Somewhat disagree
Neither agree nor
disagree
Somewhat agree
Agree
Strongly agree
I wish I could be
more respected.
o o o o o o o I wish I meant
more to other
people. o o o o o o o
I wish other people
thought I were
significant. o o o o o o o
I wish I were more appreciated by other
people. o o o o o o o
I want people to care more about me.
o o o o o o o I want to be
more important. o o o o o o o
Timing First Click Last Click Page Submit Click Count Page Break
334

335
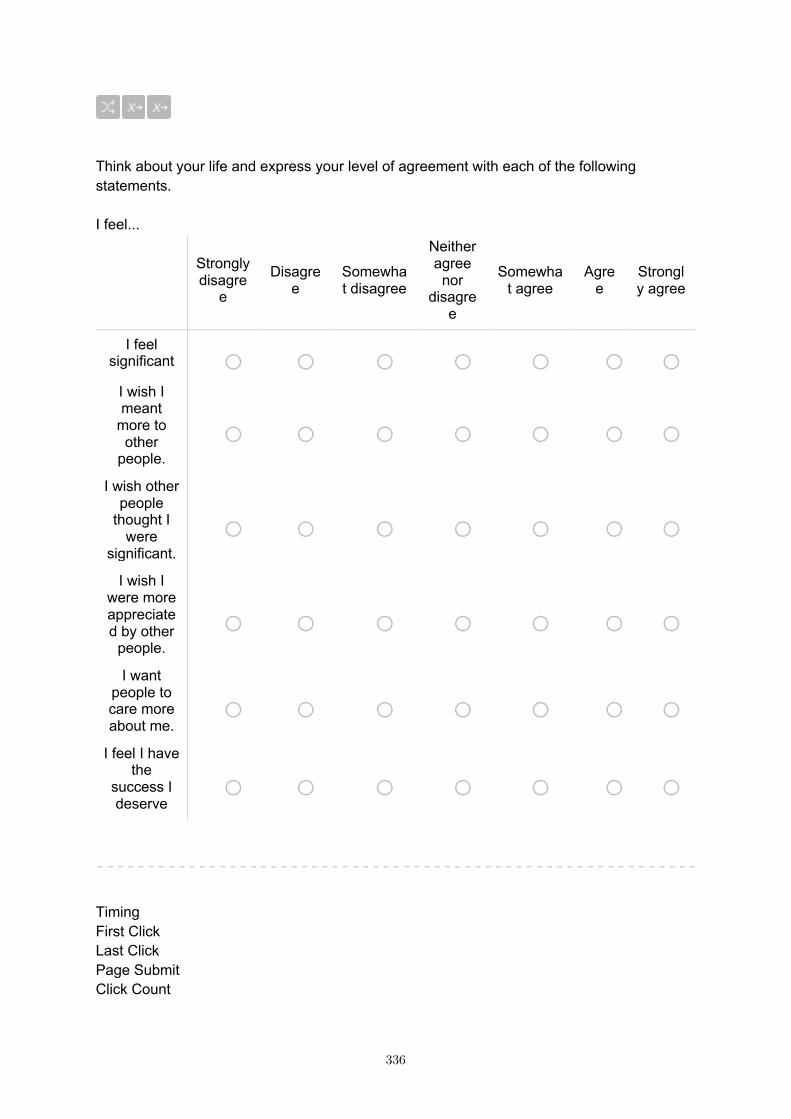
Think about your life and express your level of agreement with each of the following statements. I feel...
Strongly disagre
e
Disagree
Somewhat disagree
Neither agree nor
disagree
Somewhat agree
Agree
Strongly agree
I feel significant o o o o o o o
I wish I meant
more to other
people. o o o o o o o
I wish other people
thought I were
significant. o o o o o o o
I wish I were more appreciated by other
people. o o o o o o o
I want people to care more about me.
o o o o o o o I feel I have
the success I deserve
o o o o o o o Timing First Click Last Click Page Submit Click Count
336
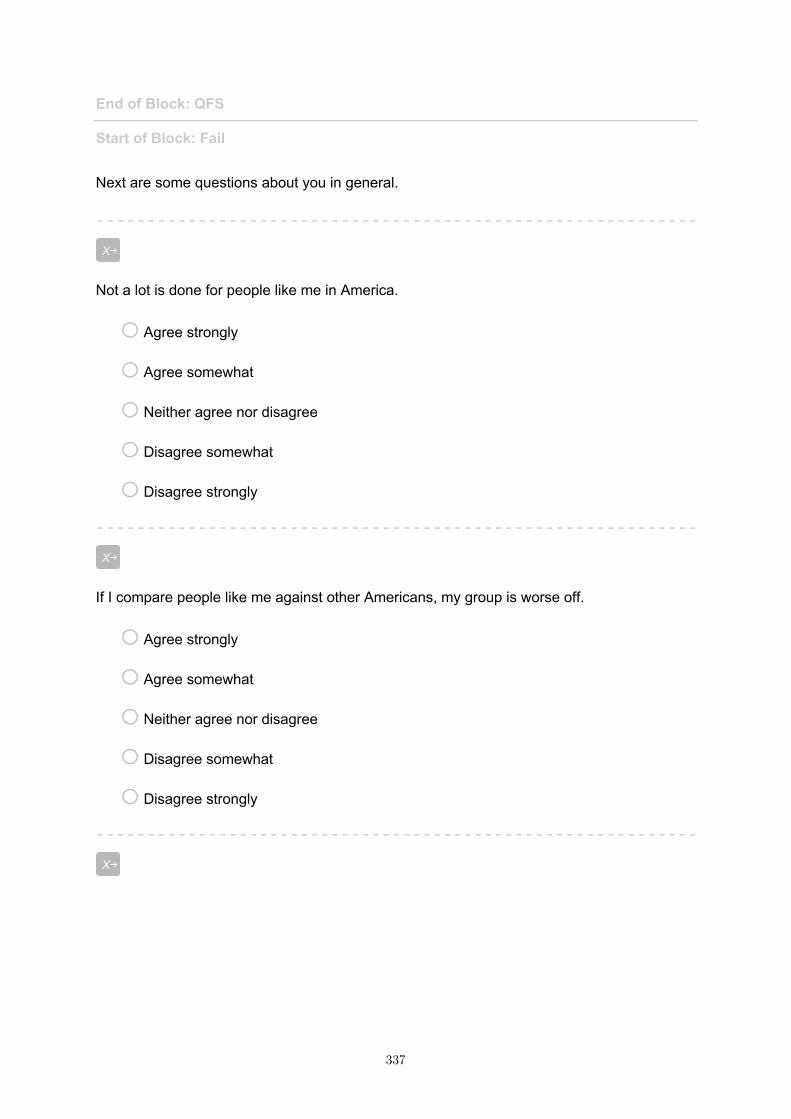
End of Block: QFS Start of Block: Fail Next are some questions about you in general.
Not a lot is done for people like me in America.
o Agree strongly
o Agree somewhat
o Neither agree nor disagree
o Disagree somewhat
o Disagree strongly
If I compare people like me against other Americans, my group is worse off.
o Agree strongly
o Agree somewhat
o Neither agree nor disagree
o Disagree somewhat
o Disagree strongly
337
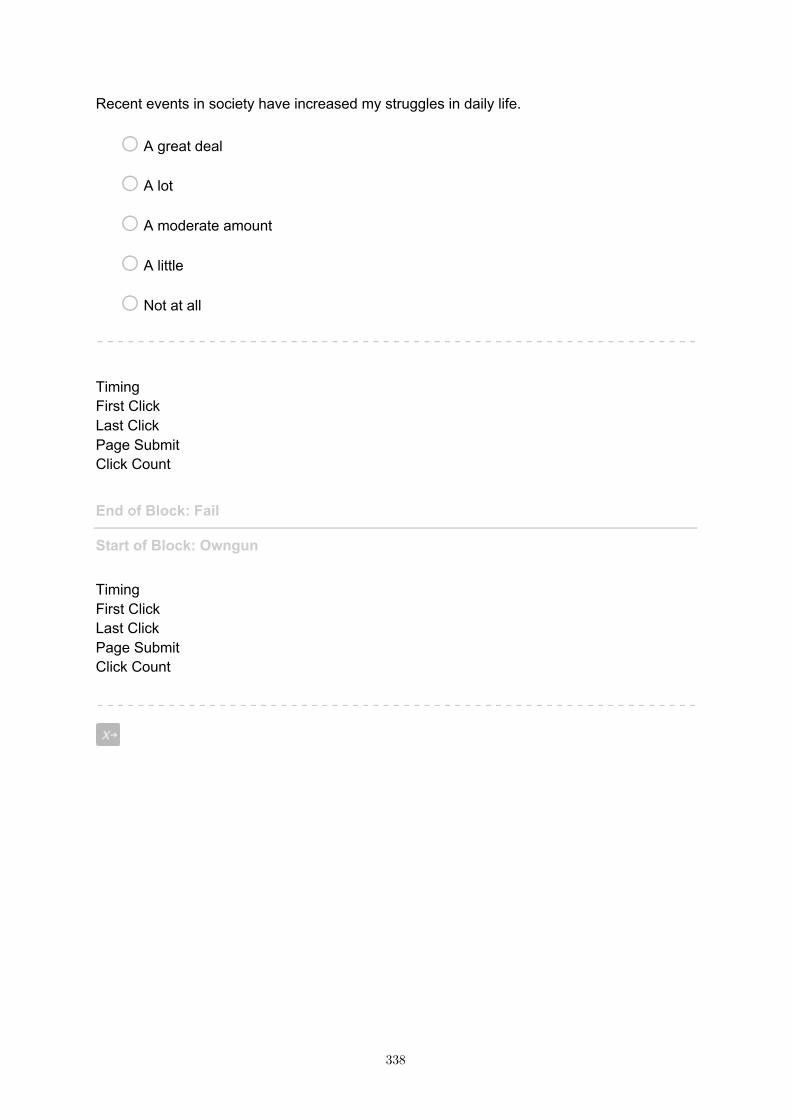
Recent events in society have increased my struggles in daily life.
o A great deal
o A lot
o A moderate amount
o A little
o Not at all Timing First Click Last Click Page Submit Click Count
End of Block: Fail Start of Block: Owngun Timing First Click Last Click Page Submit Click Count
338
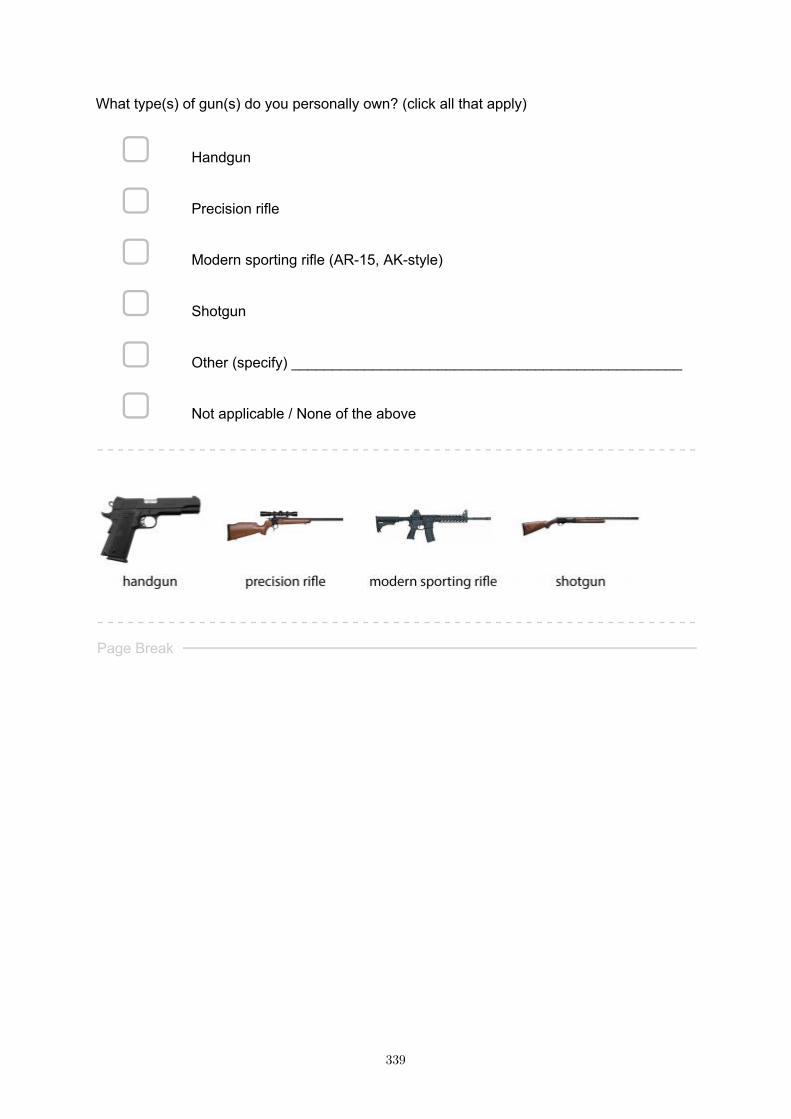
What type(s) of gun(s) do you personally own? (click all that apply)
▢ Handgun
▢ Precision rifle
▢ Modern sporting rifle (AR-15, AK-style)
▢ Shotgun
▢ Other (specify) ________________________________________________
▢ Not applicable / None of the above
Page Break
339
How important are guns for you as a means of protection?
o Not at all
o A little
o A moderate amount
o A lot
o A great deal
How important are guns for you as a means of recreation?
o Not at all
o A little
o A moderate amount
o A lot
o A great deal Timing First Click Last Click Page Submit Click Count
End of Block: Owngun Start of Block: HP-OP Guns (short)
340
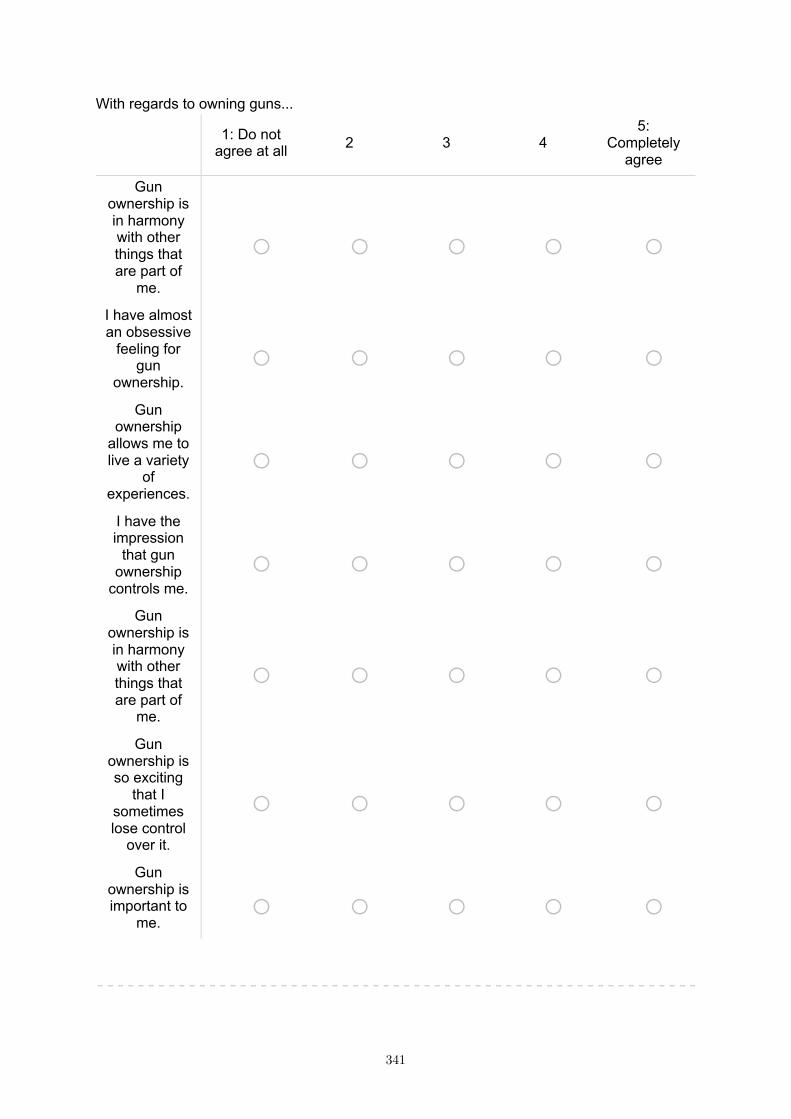
With regards to owning guns...
1: Do not agree at all 2 3 4
5: Completely
agree
Gun ownership is in harmony with other things that are part of
me.
o o o o o
I have almost an obsessive
feeling for gun
ownership. o o o o o
Gun ownership
allows me to live a variety
of experiences.
o o o o o I have the impression
that gun ownership
controls me. o o o o o
Gun ownership is in harmony with other things that are part of
me.
o o o o o
Gun ownership is so exciting
that I sometimes lose control
over it.
o o o o o
Gun ownership is important to
me. o o o o o
341
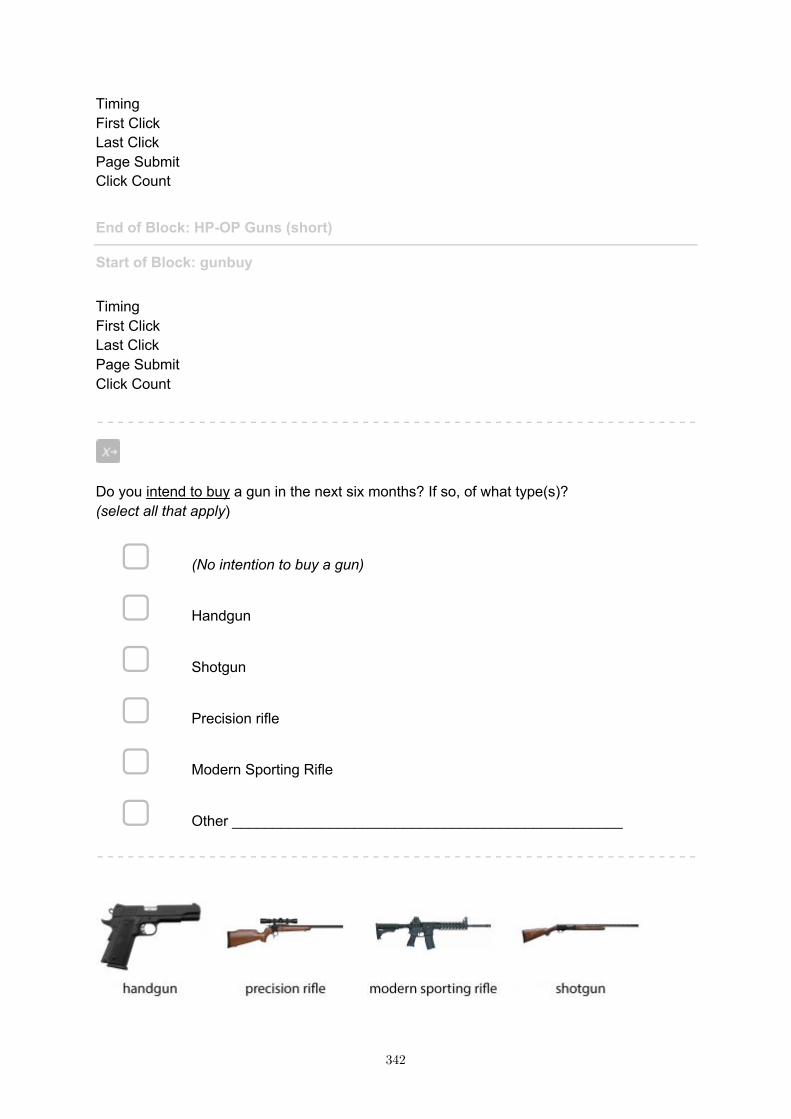
Timing First Click Last Click Page Submit Click Count
End of Block: HP-OP Guns (short) Start of Block: gunbuy Timing First Click Last Click Page Submit Click Count
Do you intend to buy a gun in the next six months? If so, of what type(s)? (select all that apply)
▢ (No intention to buy a gun)
▢ Handgun
▢ Shotgun
▢ Precision rifle
▢ Modern Sporting Rifle
▢ Other ________________________________________________
342
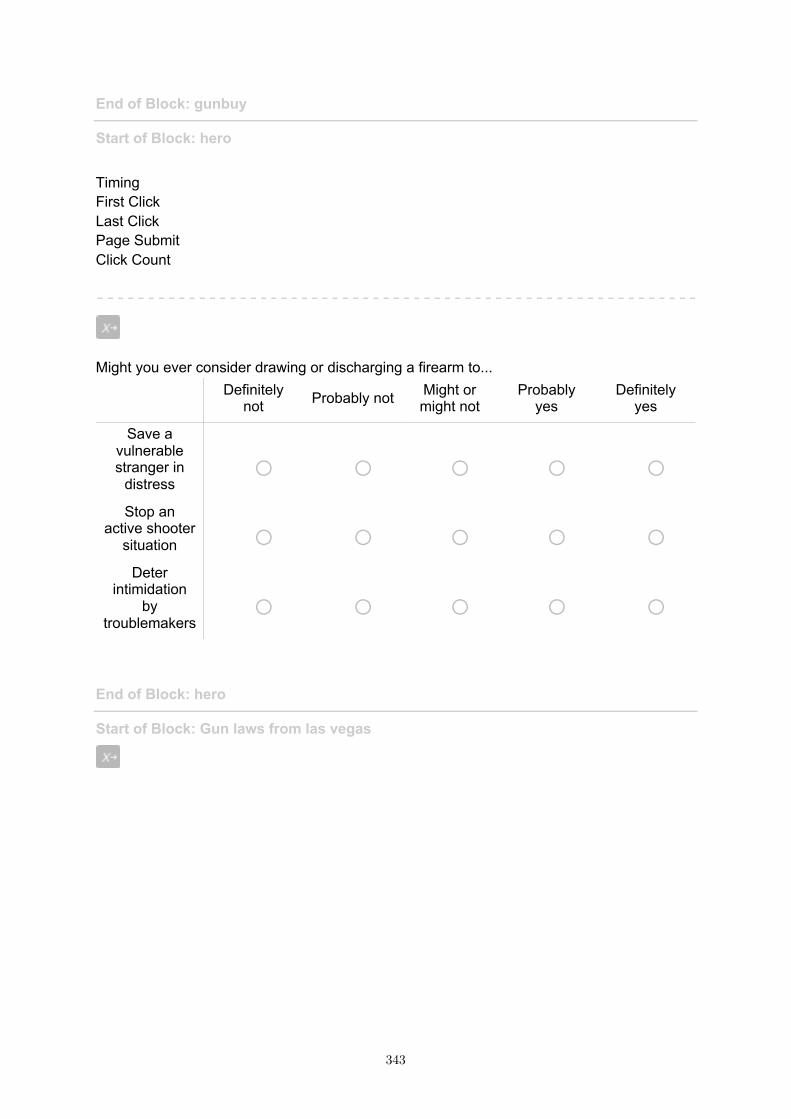
End of Block: gunbuy Start of Block: hero Timing First Click Last Click Page Submit Click Count
Might you ever consider drawing or discharging a firearm to...
Definitely not Probably not Might or
might not Probably
yes Definitely
yes
Save a vulnerable stranger in
distress o o o o o
Stop an active shooter
situation o o o o o Deter
intimidation by
troublemakers o o o o o
End of Block: hero Start of Block: Gun laws from las vegas
343
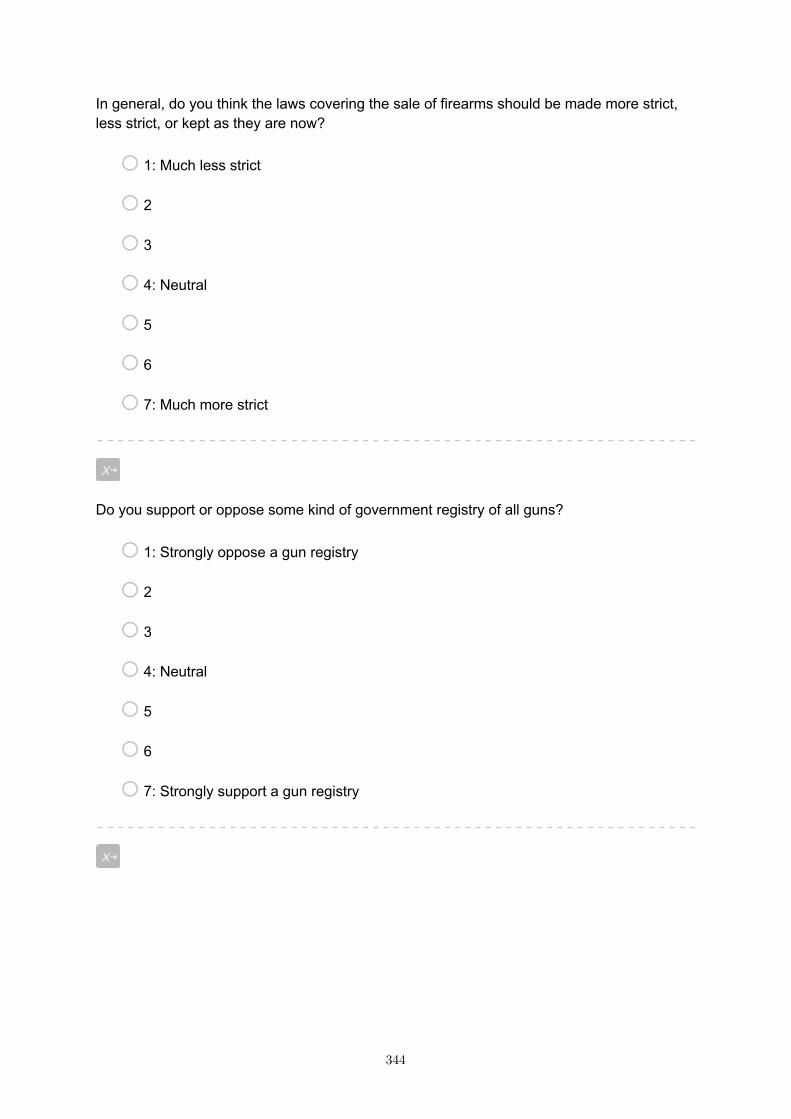
In general, do you think the laws covering the sale of firearms should be made more strict, less strict, or kept as they are now?
o 1: Much less strict
o 2
o 3
o 4: Neutral
o 5
o 6
o 7: Much more strict
Do you support or oppose some kind of government registry of all guns?
o 1: Strongly oppose a gun registry
o 2
o 3
o 4: Neutral
o 5
o 6
o 7: Strongly support a gun registry
344
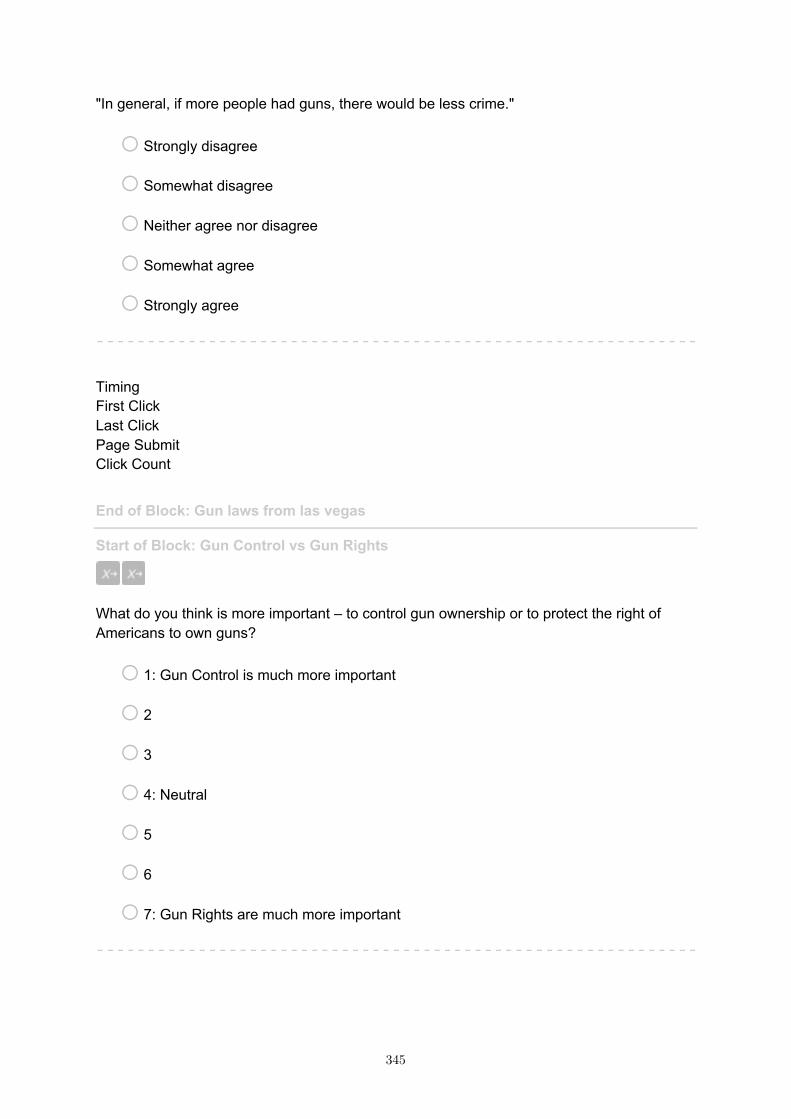
"In general, if more people had guns, there would be less crime."
o Strongly disagree
o Somewhat disagree
o Neither agree nor disagree
o Somewhat agree
o Strongly agree Timing First Click Last Click Page Submit Click Count
End of Block: Gun laws from las vegas Start of Block: Gun Control vs Gun Rights
What do you think is more important – to control gun ownership or to protect the right of Americans to own guns?
o 1: Gun Control is much more important
o 2
o 3
o 4: Neutral
o 5
o 6
o 7: Gun Rights are much more important
345
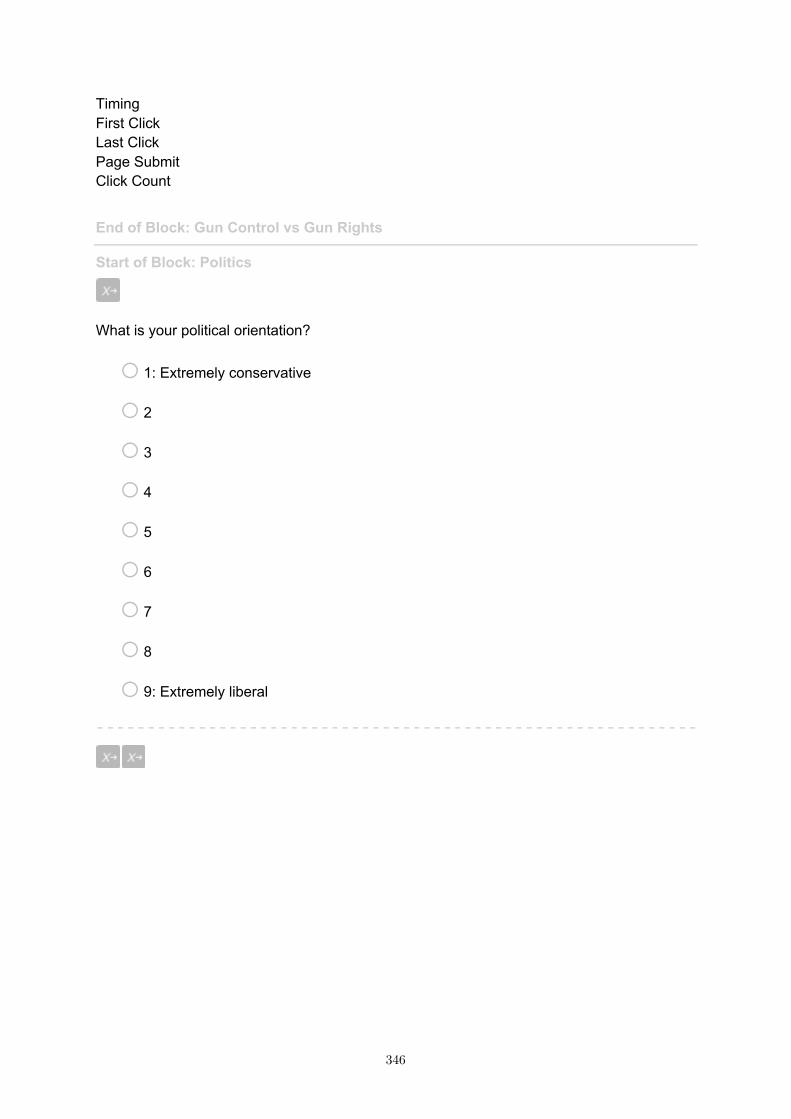
Timing First Click Last Click Page Submit Click Count
End of Block: Gun Control vs Gun Rights Start of Block: Politics
What is your political orientation?
o 1: Extremely conservative
o 2
o 3
o 4
o 5
o 6
o 7
o 8
o 9: Extremely liberal
346
Where do you stand with regards to the current U.S. President's policies?
o Oppose broadly
o More opposed than support
o Neutral / Mixed
o More support than oppose
o Support broadly
In general, do you think the laws covering immigration should be made more strict, less strict, or kept as they are now?
o 1: Much less strict
o 2
o 3
o 4: Neutral
o 5
o 6
o 7: Much more strict
Agree or disagree:
347
Illegal immigrants should be detained by ICE until they can be deported?
o Strongly disagree
o Somewhat disagree
o Neither agree nor disagree
o Somewhat agree
o Strongly agree
"The El Paso gunman may have been encouraged by public figures who describe immigrants as a threat to the United States."
o Strongly disagree
o Somewhat disagree
o Neither agree nor disagree
o Somewhat agree
o Strongly agree Timing First Click Last Click Page Submit Click Count
End of Block: Politics Start of Block: Extremism
348

Below, we will ask you about your thoughts, feelings, and behaviors related to goal pursuit. In each statement, please select an answer that describes you best.
349
Definitely disagree Disagree Slightly
disagree
Neither agree nor
disagree
Slightly agree Agree Definitely
agree
My life is usually
dominated by one main
pursuit/desire. o o o o o o o
I wish I meant more to other
people. o o o o o o o I wish other
people thought I
were significant.
o o o o o o o I wish I were
more appreciated
by other people.
o o o o o o o I want people to care more
about me. o o o o o o o I spend most of my time
thinking about the one goal that matters to me the
most.
o o o o o o o
When I decide on
something, I go for it like
my life depended on
it.
o o o o o o o
There is usually one
goal that looms large in
my mind. o o o o o o o
350
When I focus on my most important
goal, I easily forget other
things.
o o o o o o o Typically, my
happiness depends on the one thing that I value
most.
o o o o o o o There is only one thing that can make me happy in life.
o o o o o o o I react very
emotionally to anything that is related to
my most important
goal.
o o o o o o o
Timing First Click Last Click Page Submit Click Count
End of Block: Extremism Start of Block: Moral Foundations
351

When you decide whether something is right or wrong, to what extent are the following considerations relevant to your thinking? Please rate each statement using this scale:
352
not at all relevant
not very relevant
slightly relevant
somewhat relevant
very relevant
extremely relevant
Whether or not
someone suffered
emotionally o o o o o o
Whether or not
someone cared for someone weak or
vulnerable
o o o o o o
Whether or not some people were
treated differently
than others
o o o o o o
Whether or not
someone acted
unfairly o o o o o o
Whether or not
someone’s action
showed love for his
or her country
o o o o o o
Whether or not
someone did
something to betray his or her
group
o o o o o o
Whether or not
someone showed a
lack of respect for authority
o o o o o o
353
Whether or not
someone conformed
to the traditions of society
o o o o o o
Whether or not
someone violated
standards of purity
and decency
o o o o o o
Whether or not
someone did
something disgusting
o o o o o o Timing First Click Last Click Page Submit Click Count Page Break
354

355

Please read the following sentences and indicate your agreement or disagreement
356
strongly disagree
moderately disagree
slightly disagree
slightly agree
moderately agree
strongly agree
Compassion for those who are
suffering is the most crucial virtue.
o o o o o o
One of the worst things
a person could do is
hurt a defenseless
animal.
o o o o o o
When the government makes laws, the number
one principle
should be ensuring
that everyone is
treated fairly.
o o o o o o
Justice is the most important
requirement for a
society.
o o o o o o I am proud
of my country’s history.
o o o o o o People
should be loyal to their
family members, even when they have
done something
wrong.
o o o o o o
357
Respect for authority is something all children
need to learn.
o o o o o o Men and women
each have different
roles to play in society.
o o o o o o People
should not do things that are
disgusting, even if no
one is harmed.
o o o o o o
I would call some acts wrong on
the grounds that they are unnatural.
o o o o o o Timing First Click Last Click Page Submit Click Count
End of Block: Moral Foundations Start of Block: Debrief
In which state do you currently reside?
▼ Alabama ... I do not reside in the United States
358

Timing First Click Last Click Page Submit Click Count Page Break
359
Debriefing:The goal of this university-based psychological study is to examine how the public thinks about mass shootings. We collect this data regularly to assess changes in public opinions over time, especially as it relates to gun ownership, personality, beliefs, and preferences. Given that the El Paso shootings targeted a minority group, we additionally assessed views on people from Hispanic countries.
The results will be used for scientific research purposes only. If you have any questions or concerns about the study or your participation, you are welcome to contact the lead investigator, Dr. N. P. Leander ([email protected]). You are also welcome to contact our university ethics board at [email protected]. Now that you know the purpose of this study, do you have any advice or suggestions to improve the survey experience? We appreciate any feedback you can offer.
________________________________________________________________
________________________________________________________________
________________________________________________________________
________________________________________________________________
________________________________________________________________
Timing First Click Last Click Page Submit Click Count
End of Block: Debrief
360
SI References
1. D. Lakens, A. M. Scheel, P. M. Isager, Equivalence Testing for PsychologicalResearch: A Tutorial. Adv. Methods Pract. Psychol. Sci. 1, 259–269 (2018).
2. N. Shnabel, A. Nadler, A needs-based model of reconciliation: satisfying the differentialemotional needs of victim and perpetrator as a key to promoting reconciliation. J. Pers.Soc. Psychol. 94, 116–132 (2008).
3. J. Cohen, P. Cohen, S. G. West, L. S. Aiken, Applied Multiple Regression/CorrelationAnalysis for the Behavioral Sciences (Routledge, 2003)https:/doi.org/10.4324/9780203774441.
361


![[Electronic supplementary information] Contents - The Royal](https://img.pdfslide.net/doc/110x75/6315dea7aca2b42b580e0641/electronic-supplementary-information-contents-the-royal-.jpg)


