Embed Size (px)
Citation preview
- Supplementary Material -
4-(1-Ethyl-4-anisyl-imidazol-5-yl)- N-hydroxycinnamide –
A new pleiotropic HDAC inhibitor targeting cancer cell
signalling and cytoskeletal organisation
Experimental Cell Research
Katharina Mahala, Philip Kahlenb, Bernhard Biersacka, Rainer Schobert*,a
[a] Organic Chemistry Laboratory, University of Bayreuth, Universitätsstrasse 30,
95440 Bayreuth, Germany
Email: [email protected]; [email protected];
[b] Department of Genetics, University of Bayreuth, Universitätsstrasse 30, 95440
Bayreuth, Germany
Email: [email protected];
[*] Corresponding author:
Fax: +49 921 552671; Phone: +49 921 552670;
Email: [email protected];

TOC
Methods and experimental procedures S1
General remarks and instruments used S1
Cell proliferation assay (MTT assay) S1
Cell cycle analyses S2
TUNEL-based detection of apoptotic cells S2
Preparation of cell lysate fractions and determination of cell lysate fraction
purity
S3
FITC-labelling of gelatin S4
Animal studies S4
Additional and original data S6
Chemistry / compound synthesis S6
Determination of apoptosis by flow-cytometric TUNEL assays (Table 1,
Figure S1)
S9
Cell cycle analyses and Western blot analyses of p27/Kip1 (Figure S2-S3) S10
Western blot analyses of cell lysate fraction purity (Figure S4) S11
Western blot anaysis of recombinant HDAC1 (Figure S5) S12
Original Western blot images pertinent to Figure 2 (Figure S6-S8) S13
Original Western blot images pertinent to Figure 3 (Figure S9) S16
Original Western blot images pertinent to Figure 5 (Figure S10) S17
Original images of gelatin zymograms (Figure S11) S18
Preliminary results from animal studies (Figure S12 S19
References S20

- S1 -
Methods and experimental procedures
General remarks and instruments used
Column chromatography: silica gel 60 (230-400 mesh). Melting points (uncorrected),
Electrothermal 9100; IR spectra, Perkin-Elmer Spectrum One FT-IR
spectrophotometer with ATR sampling unit; NMR spectra, Bruker Avance 300
spectrometer; chemical shifts are given in parts per million (δ) downfield from
tetramethylsilane as internal standard; Mass spectra, Thermo Finnigan MAT 8500
(EI); Microanalyses, Perkin-Elmer 2400 CHN elemental analyzer. All tested
compounds are > 98% pure by elemental analysis. All starting compounds were
purchased from the usual retailers and used without further purification.
Cell proliferation assay (MTT assay) [1]
The tetrazolium salt MTT (3-(4,5-dimethylthiazol-2-yl)-2,5-diphenyl-tetrazolium
bromide, Carl Roth) was used to identify viable cells by reduction of MTT to a violet
formazan. 518A2 melanoma, HCT-1116 colon carcinoma, HT-29 colon
adenocarcinoma, MCF-7/Topo mammacarcinoma, KB-V1/Vbl cervix carcinoma, M-
MSV-Balb/3T3 mouse fibroblasts (5x10³ cells/well), Ea.hy926 and primary
endothelial cells (HUVEC) and non-malignant chicken fibroblasts (CHF, 1x10⁴
cells/well) were seeded on 96-well cell culture plates and cultured for 24 h (37 °C, 5%
CO2, 95% humidity). Incubation with the test compounds 1-3 (dilution series ranging
from 100 µM to 5 pM in ddH2O) was continued for 24 h or 72 h. Solvent controls
(DMSO) were treated identically. A stock solution of MTT (0.5% in PBS) was added
to a final MTT concentration of 0.05%. After 2 h incubation the microplates were
centrifuged (300 g, 4 °C, 5 min) and the supernatant medium was discarded prior to
cell lysis and dissolving of the precipitated formazan crystals in 30 µl of a SDS-
DMSO solution (10% SDS (w/v), 0.6% acetic acid in DMSO) per well. The
absorbance at wavelengths 570 and 630 nm (background) was measured using an

- S2 -
automatic microplate reader (Tecan). All experiments were carried out at least in
triplicates, the percentage of viable cells quoted was calculated as the mean ± S.D.
with respect to the controls set to 100%.
Cell cycle analyses
518A2 melanoma (1×10⁵ cells/well), HT-29 colon or MCF-7/Topo breast carcinoma
cells (2×10⁵ cells/well) grown on 6-well cell culture plates were treated with DMSO
(control), vorinostat or the new imidazoles 1-3 for 24 h. Cells were collected by
trypsination, fixed (ice-cold 70% EtOH, 1 h, 4 °C), and incubated with propidium
iodide (PI, Carl Roth) staining solution (50 µg/mL PI, 0.1% sodium citrate, 50 µg/mL
RNase A in PBS) for 30 min at 37 °C. The fluorescence intensity of 10,000 single
cells at an emission wavelength of 620 nm (excitation with a 488 nm laser source)
was recorded with a Beckman Coulter Cytomics FC500 flow cytometer and analysed
for the distribution of single cells (%) to G1, S and G2/M phase of the cell cycle as
well as for the content of sub-G1 events (apoptotic cells) by using the CXP software
(Beckman Coulter).
TUNEL-based detection of apoptotic cells
DNA fragmentation in apoptotic cells was additionally measured using the TUNEL
technique (Terminal desoxyribonucleotide Transferase-mediated dUTP Nick End
Labelling). Labelling of 3’OH ends was performed with the commercially available
FragEL™ DNA Fragmentation Detection Kit (QIA39, Calbiochem) and according to
manufacturer’s instructions. Briefly, HT-29 cells grown in 25 cm2-cell culture flasks
(5x10⁵ cells/well) and treated with vehicle (DMSO), 5 µM Vorinostat or the best
imidazoles 1-3 (5 µM Bimacroxam 1, 5 µM Animacroxam 2 or 2.5 µM Etacrox 3) for
24 h. Cells were then trypsinated, pelleted by centrifugation (300 g, 4 °C, 5 min) and
fixed in 4% formaldehyde in PBS at room temperature for 10 min followed by

- S3 -
washing of the cell pellets (300 g, 4 °C, 5 min) in 1 mL PBS and two times in 1 mL 1X
TBS (Tris-buffered saline, 50 mM Tris-HCl, 150 mM NaCl, pH 7.4). After proteinase K
digestion (20 µg/mL per specimen, 5 min, rt) and cell permeabilisation, about 1x10⁶
cells were resuspended in TdT-labelling reaction mixture containing TdT enzyme and
fluorescein-coupled dUTPs and incubated at 37 °C for 1 h in the dark. Labelled cells
were washed twice with 1 mL TBS before analysis of the green fluorescence intensity
on a Beckman Coulter Cytomics FC500 flow cytometer. Data analyses were done
with the CXP software (Beckman Coulter), gates defining the percentage of viable
and apoptotic cells were applied with respect to DMSO-treated control.
Preparation of cell lysate fractions and determinat ion of cell lysate fraction
purity
Cell lysate fractions from HeLa cells were obtained by a modified protocol [2] for
nuclei preparation by Dignam et al. [3]. Cell pellets from mass cultures were
resuspended in cell extraction buffer (20 mM HEPES-KOH, 10 mM KCl, 0.1 mM
EDTA, 0.1 mM EGTA, 1.5 mM MgCl2, 0.5 mM DTT, pH 7.4) and incubated on ice for
15 min before adding an equal volume of cell extraction buffer containing 0.2% Triton
X-100. After centrifugation (3,000 g, 2 min, 4 °C), the supernatant containing
cytosolic proteins was aspirated (cf. Figure S4). Lysis of the cells and purity of
extracted and intact nuclei was additionally monitored by light and fluorescence
microscopy after DAPI staining. The protein concentration of the cell lysate fraction
was determined by using a standard Bradford assay (Pierce/Thermo Scientific; HeLa
cytosolic extract: 2.3 mg/mL). Total cell lysates were prepared in cell lysis buffer (20
mM Tris-HCl, 1 mM MgCl2, 2 mM EGTA, 0.5% Triton X-100, pH 6.8) supplemented
with protease inhibitor (protease inhibitor cocktail set III, EDTA-free, Calbiochem) by
using a homogenizer (glass douncer) and according to standard procedures. For
subsequent evaluation of cell lysate fraction purity by Western blot analyses, equal

- S4 -
volumes of the whole cell lysate or the cytosolic fraction were mixed with 2X Laemmli
buffer and boiled at 95 °C for 10 min prior to SDS-PAGE and transfer to PVDF
membranes. Alpha-tubulin and nucleoporin-153 (NUP153) antibodies (anti-alpha-
tubulin mouse monoclonal antibody (mAb), invitrogen; anti-NUP153 [clone no. QE5]
mouse mAb, abcam) were used as marker for the purity of the cytosolic or nuclear
fraction, respectively [4,5]. The respective Western blot is shown in Figure S4.
FITC-labelling of gelatin
Gelatin for the fluorescent monitoring of gelatin degradation by matrix
metalloproteinases (MMPs) was labelled with fluorescein isothiocyanate (FITC,
Sigma Aldrich) according to manufacturer’s manual with some alterations. In brief,
2 mg/mL gelatin (Sigma Aldrich) were dissolved in 0.1 M sodium carbonate buffer
(pH 9.0) at 40 °C for 10 min under stirring. 50 µL of a 1 mg/mL FITC stock in DMSO
were added dropwise into 1 mL gelatin solution while stirring at 30 °C and the
labelling reaction was proceeded for 12 h at 30 °C in the dark. Then, NH4Cl was
added to a final concentration of 50 mM and the solution was stirred for a further 2 h
incubation at 30 °C to prevent gelling of the gelatin. The protein solution was then
dialysed against PBS (SnakeSkin dialyses tubing, 35 kDa cut-off, Pierce/Thermo
Scientific) at 30 °C in the dark for 1 d. The protein concentration was determined by
using a nanodrop UV/vis spectrometer (Thermo Scientific) and the solution was
diluted to a final concentration of 1 mg/mL. The coupling efficiency (FITC/protein
ratio) should range between 0.3 and 1.0 and was determined as 0.53.
Animal studies
The antiangiogenic activity of Etacrox 3 was studied on the established model of
highly vascularised 1411HP xenograft tumours previously described [6]. This study
was approved by the Laboratory Animal Care Committee of Sachsen-Anhalt,

- S5 -
Germany. Nude mice (Harlan and Winkelmann, Borchen, Germany) received 150
mg/kg body weight of compound 3 by intraperitoneal injection on day 1 and day 2
and effects on apical tumour blood vessels was documented after 24 h with a Canon
IXUS 50.
- S6 -
Additional and original data
Chemistry/compound synthesis. Compounds 1-2 prepared according to a previous
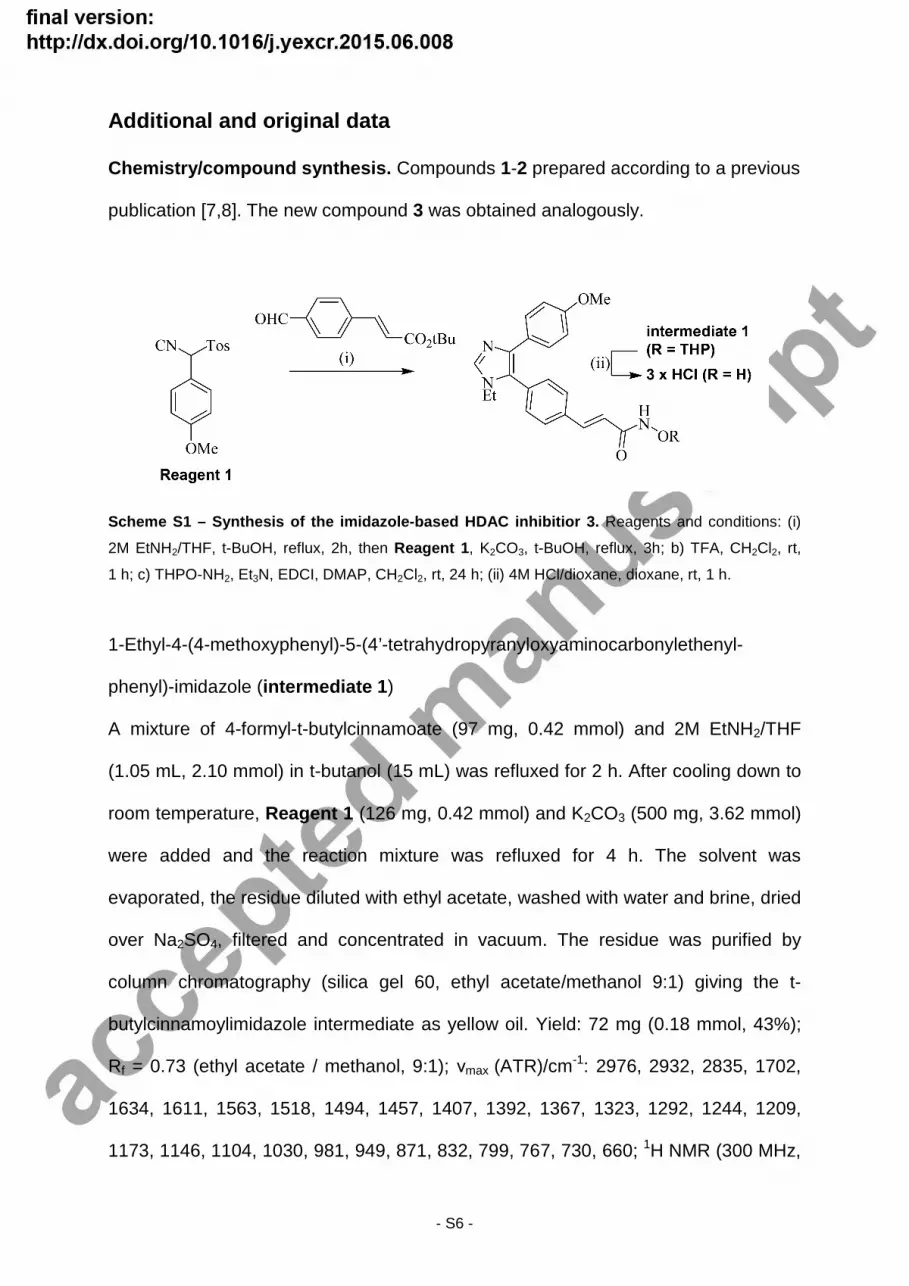
publication [7,8]. The new compound 3 was obtained analogously.
Scheme S1 – Synthesis of the imidazole-based HDAC inhibitior 3. Reagents and conditions: (i)
2M EtNH2/THF, t-BuOH, reflux, 2h, then Reagent 1 , K2CO3, t-BuOH, reflux, 3h; b) TFA, CH2Cl2, rt,
1 h; c) THPO-NH2, Et3N, EDCI, DMAP, CH2Cl2, rt, 24 h; (ii) 4M HCl/dioxane, dioxane, rt, 1 h.
1-Ethyl-4-(4-methoxyphenyl)-5-(4’-tetrahydropyranyloxyaminocarbonylethenyl-
phenyl)-imidazole (intermediate 1)
A mixture of 4-formyl-t-butylcinnamoate (97 mg, 0.42 mmol) and 2M EtNH2/THF
(1.05 mL, 2.10 mmol) in t-butanol (15 mL) was refluxed for 2 h. After cooling down to
room temperature, Reagent 1 (126 mg, 0.42 mmol) and K2CO3 (500 mg, 3.62 mmol)
were added and the reaction mixture was refluxed for 4 h. The solvent was
evaporated, the residue diluted with ethyl acetate, washed with water and brine, dried
over Na2SO4, filtered and concentrated in vacuum. The residue was purified by
column chromatography (silica gel 60, ethyl acetate/methanol 9:1) giving the t-
butylcinnamoylimidazole intermediate as yellow oil. Yield: 72 mg (0.18 mmol, 43%);
Rf = 0.73 (ethyl acetate / methanol, 9:1); νmax (ATR)/cm-1: 2976, 2932, 2835, 1702,
1634, 1611, 1563, 1518, 1494, 1457, 1407, 1392, 1367, 1323, 1292, 1244, 1209,
1173, 1146, 1104, 1030, 981, 949, 871, 832, 799, 767, 730, 660; 1H NMR (300 MHz,

- S7 -
CDCl3): δ 1.23 (3 H, t, J = 7.3 Hz), 1.51 (9 H, s), 3.71 (3 H, s), 3.7-3.9 (2 H, m), 6.39
(1 H, d, J = 16.0 Hz), 6.71 (2 H, d, J = 9.0 Hz), 7.3-7.4 (4 H, m), 7.5-7.6 (4 H, m); 13C
NMR (75.5 MHz, CDCl3): δ 16.3, 28.1, 40.1, 55.0, 80.6, 113.7, 114.4, 120.9, 126.5,
127.1, 127.5, 127.9, 128.4, 131.0, 132.0, 132.5, 134.6, 135.5, 136.2, 138.5, 142.5,
158.2, 166.0.
The intermediate (72 mg, 0.18 mmol) was dissolved in CH2Cl2 (3 mL), treated with
TFA (2 mL) and stirred at room temperature for 1 h. The solvent was evaporated, the
residue was dried in vacuum and used for the next step without further purification. It
was dissolved in dry DCM and EDCI (98 mg, 0.51 mmol), DMAP (19 mg, 0.14 mmol),
triethyl amine (117 µL, 0.55 mmol) and tetrahydropyranyl hydroxylamine (71 mg, 0.61
mmol) were added. After stirring at room temperature for 24 h, the solvent was
evaporated and the residue was purified by column chromatography (silica gel 60,
ethyl acetate / methanol, 9:1). Yield: 52 mg (0.12 mmol, 67%); Rf = 0.37 (ethyl
acetate / methanol, 95:5); νmax (ATR)/cm-1: 3158, 2941, 2869, 1662, 1626, 1613,
1518, 1494, 1462, 1442, 1336, 1294, 1245, 1203, 1174, 1129, 1112, 1030, 981, 948,
895, 872, 831, 816, 800, 727, 661; 1H NMR (300 MHz, CDCl3): δ 1.1-1.3 (3 H, m),
1.5-1.6 (3 H, m), 1.8-1.9 (3 H, m), 3.5-3.6 (1 H, m), 3.66 (3 H, s), 3.7-3.9 (2 H, m),
4.0-4.1 (1 H, m), 5.0-5.1 (1 H, m), 6.4-6.5 (1 H, m), 6.68 (2 H, d, J = 8.9 Hz), 7.2-7.3
(2 H, m), 7.31 (2 H, d, J = 8.9 Hz), 7.4-7.5 (1 H, m), 7.62 (1 H, s), 7.7-7.8 (1 H, m);
13C NMR (75.5 MHz, CDCl3): δ 16.3, 18.6, 25.0, 28.1, 40.2, 55.1, 62.5, 102.5, 113.6,
126.6, 126.8, 128.0, 131.0, 132.1, 134.9, 136.2, 138.3, 158.3.
1-Ethyl-4-(4-methoxyphenyl)-5-(4’-hydroxyaminocarbonylethenyl-phenyl)-imidazole
Ethyl-Animacroxam x HCl (3)
The THP-protected hydroxamate (intermediate 1 , 52 mg, 0.12 mmol) was dissolved
in CH2Cl2/MeOH (5 mL, 4:1) and 4M HCl/dioxane (3 mL) was added. The reaction
mixture was stirred at room temperature for 1 h. The solvent was evaporated and the

- S8 -
residue was crystallized from ethanol / n-hexane. Yield: 48 mg (0.12 mmol, 100%);
off-white solid of mp 194-196°C; νmax (ATR)/cm-1: 3126, 3000, 2970, 2833, 2765,
2626, 1653, 1603, 1571, 1540, 1510, 1462, 1427, 1412, 1349, 1299, 1258, 1181,
1113, 1085, 1053, 1027, 987, 828, 798, 766, 735, 692; 1H NMR (300 MHz, DMSO-
d6): δ 1.27 (3 H, t, J = 7.3 Hz), 3.74 (3 H, s), 4.02 (2 H, q, J = 7.3 Hz), 6.65 (1 H, d, J
= 15.9 Hz), 6.95 (2 H, d, J = 9.0 Hz), 7.33 (2 H, d, J = 9.0 Hz), 7.5-7.6 (3 H, m), 7.73
(2 H, d, J = 8.2 Hz), 9.41 (1 H, s), 11.0-11.1 (1 H, br s); 13C NMR (75.5 MHz, DMSO-
d6): δ 14.8, 42.3, 55.3, 114.4, 119.1, 121.2, 126.9, 127.8, 128.4, 128.8, 129.7, 131.5,
134.7, 136.6, 137.0, 159.8, 162.3; m/z (%) 363 (7) [M+], 347 (100), 317 (41), 280
(18), 45 (21).

- S9 -
Determination of apoptosis by flow cytometric TUNEL assays
Table S1 – Flow cytometric analyses of apoptosis (%) in 518A2 melanoma cells visualised by the TUNEL technique. Cells were treated with various concentrations of Vorinostat and the imidazoles 1-3 for 24 h and stained by using transferase-mediated fluorescein-dUTP nick end labeling of 3’-OH ends of fragmented DNA.
analysed
cells (%) control
5 µM
Bimacroxam 1
5 µM
Animacroxam 2
2.5 µM
Etacrox 3
5 µM
Vorinostat
vital 91,5 48,6 51,0 65,1 61,6 apoptotic 8,5 51,4 49,0 34,9 38,4
S.D. 1,2 1,7 1,8 2,8 1,3
Fig. S1 – Flow cytometric analyses of apoptosis (%) in HT-29 colon carcinoma cells
visualised by the TUNEL technique. Graphical representation of values represented in
Table S1.

- S10 -
Cell cycle analyses and Western blot analyses of p2 7/Kip1
Fig. S2 – Cell line-specific effects on the cell cy cle progression in cancer cell lines treated with SAHA or imidazole derivative 3 (Et-ani macroxam). Flow cytometric analysis of the propidium iodide (PI)-stained DNA content in 518A2 melanoma (upper row), HT-29 colon carcinoma (middle row) or MCF-7/Topo (lower row) breast cancer cells after treatment with DMSO (control) or the indicated concentrations of Vorinostat (SAHA) or Etacrox 3 for 24 h and distribution (%) into G1, S and G2-M phase of the cell cycle as well as the content of sub-diploid (sub-G1, apoptotic) events. Values shown in the histograms are representative for at least two independent experiments.
Fig. S3 – Immunoblot analyses of the effects of Eta crox 3 and Vorinostat on acetylated tubulin and p27/Kip1 level in cancer cells. Concentration-dependent (µM) increase in microtubule acetylation (acetyl-alpha-tubulin) with concomitant alterations in levels of cycle regulator p27/Kip1 (G1 marker, [9]) after treatment of cells with Etacrox 3 or Vorinostat (V) for 24h, alpha-tubulin was used as a loading control.
- S11 -
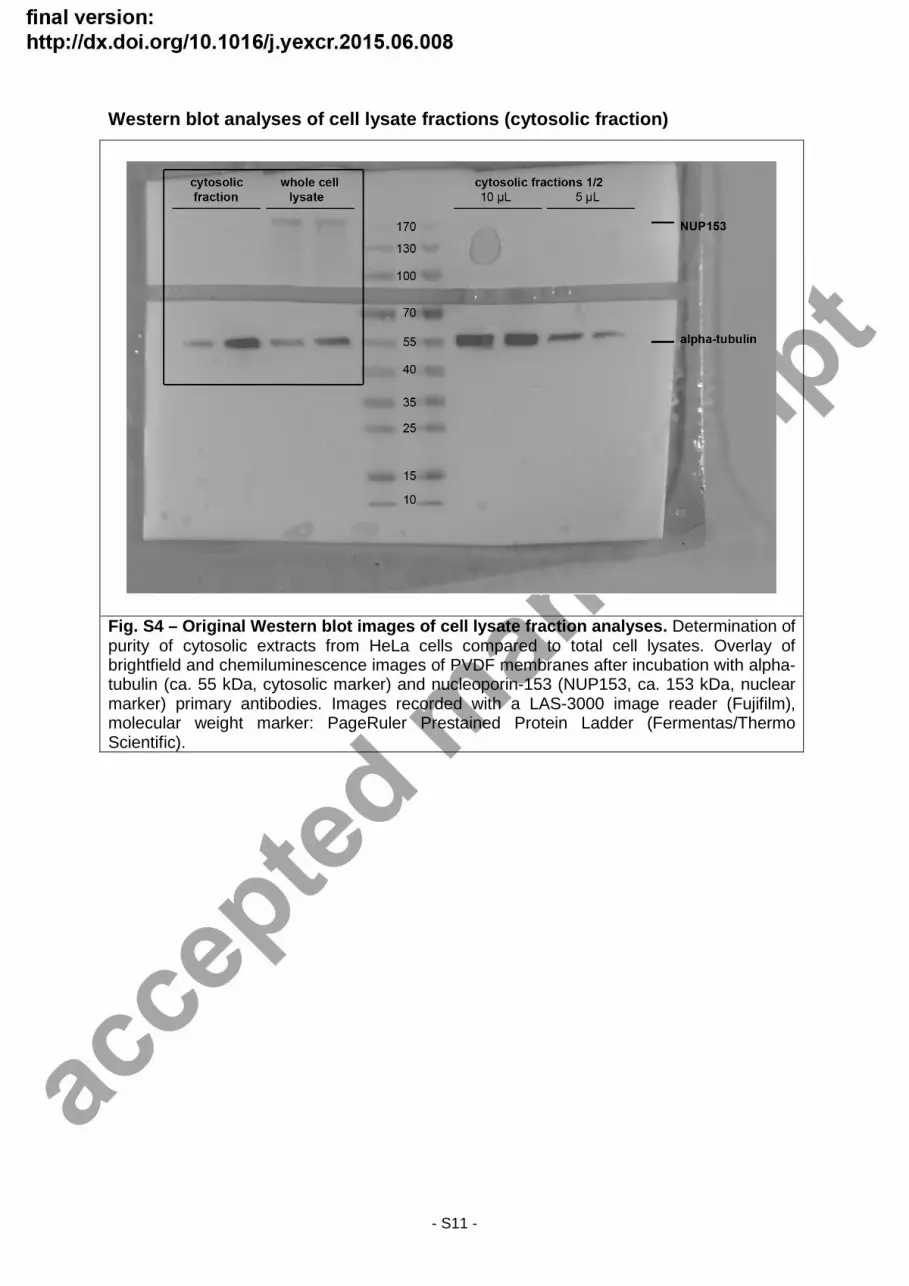
Western blot analyses of cell lysate fractions (cyt osolic fraction)
Fig. S4 – Original Western blot images of cell lysa te fraction analyses. Determination of purity of cytosolic extracts from HeLa cells compared to total cell lysates. Overlay of brightfield and chemiluminescence images of PVDF membranes after incubation with alpha-tubulin (ca. 55 kDa, cytosolic marker) and nucleoporin-153 (NUP153, ca. 153 kDa, nuclear marker) primary antibodies. Images recorded with a LAS-3000 image reader (Fujifilm), molecular weight marker: PageRuler Prestained Protein Ladder (Fermentas/Thermo Scientific).

- S12 -
Western blot analyses of recombinant HDAC1 from tra nsfected Hek-293
cultures
Fig. S5 – Original Western blot images of recombina nt HDAC1 analyses. Overlay of brightfield and chemiluminescence images of the PVDF membrane after incubation with an anti-GST (glutathione S-transferase) tag primary antibody. Determination of the concentration of the recombinant human GST-TEV3-HDAC1 fusion protein (85.7 kDa, iso-electric point 5.3) in cell lysates (lys) of transfected Hek-293 cells, in GSH (glutathione) elution buffer after GST-bead pulldown (elu) and in elution buffer concentrates (conc), 10 µL of each protein solution were loaded for SDS-PAGE. Images recorded with a LAS-3000 image reader (Fujifilm), molecular weight marker: PageRuler Prestained Protein Ladder (Fermentas/Thermo Scientific).

- S13 -
Original Western blot images pertinent to Figure 2A
A)
B)
Fig. S6 – Original Western blot images of bands pre sented in Fig. 2A. Overlay of brightfield and chemiluminescence images of Western blot membranes after incubation with an (A) acetyl-histone H2B (ca. 17 kDa) primary antibody or (B) an acetyl-alpha-tubulin (ca. 55 kDa) primary antibody. 518A2 cells were treated with DMSO (control), Etacrox or Vorinostat (V) or Panobinostat (P) for the indicated time points (3-24 h). Equal volumes of cell lysates were subjected to SDS-PAGE with subsequent transfer to PVDF membranes and a standard procedure antibody staining. Images recorded with a LAS-3000 image reader (Fujifilm), molecular weight (MW) marker: PageRuler Prestained Protein Ladder Plus (Fermentas/Thermo Scientific).

- S14 -
A)
B)
Fig. S7 – Original Western blot images of bands pre sented in Fig. 2A. Overlay of brightfield and chemiluminescence images of Western blot membranes after incubation with an (A) caspase-9 primary antibody [detection of full-length caspase-9 (ca. 45 kDa) and cleaved caspase fragments (> 35 kDa)] or (B) an alpha-tubulin (ca. 55 kDa) primary antibody (loading control). 518A2 cells were treated with DMSO (control), Etacrox or Vorinostat (V) or Panobinostat (P) for the indicated time points (3-24 h). Equal volumes of cell lysates were subjected to SDS-PAGE with subsequent transfer to PVDF membranes and a standard procedure antibody staining. Images recorded with a LAS-3000 image reader (Fujifilm), molecular weight (MW) marker: PageRuler Prestained Protein Ladder Plus (Fermentas/Thermo Scientific).

- S15 -
Original Western blot images pertinent to Figure 2B
A)
B)
Fig. S8 – Original Western blot images of bands pre sented in Fig. 2B. Overlay of brightfield and chemiluminescence images of Western blot membranes after incubation with an (A) acetyl-alpha-tubulin (ca. 55 kDa) primary antibody or (B) an alpha-tubulin (loading control) and acetyl-histone H2B (ca. 14 kDa) primary antibody. HT-29 cells were treated with DMSO (control), Etacrox or Vorinostat for the indicated time points (2-12 h). Equal volumes of cell lysates were subjected to SDS-PAGE with subsequent transfer to PVDF membranes and a standard procedure antibody staining. Images recorded with a LAS-3000 image reader (Fujifilm), molecular weight (MW) marker: PageRuler Prestained Protein Ladder Plus (Fermentas/Thermo Scientific).

- S16 -
Original Western blot images pertinent to Figure 3
A)
B)
Fig. S9 – Original Western blot images of bands pre sented in Fig. 3. Overlay of brightfield and chemiluminescence images of Western blot membranes after incubation with an (A) alpha-tubulin (ca. 55 kDa) primary antibody or (B) an antibody for acetylated lysines (anti-acetylated lysines polyclonal antibody, broad-range lysine residue recognition). 518A2 cells were treated with DMSO (control), Etacrox or Vorinostat (V) for 6 h or 24 h. Equal volumes of fractionated cell lysates (detergent-insoluble fraction containing polymeric tubulin) were subjected to SDS-PAGE with subsequent transfer to PVDF membranes and a standard procedure antibody staining. Images recorded with a LAS-3000 image reader (Fujifilm), molecular weight (MW) marker: PageRuler Prestained Protein Ladder Plus (Fermentas/Thermo Scientific).

- S17 -
Original Western blot images pertinent to Figure 5
A)
B)
Fig. S10 – Original Western blot images of bands pr esented in Fig. 5. Overlay of brightfield and chemiluminescence images of Western blot membranes after incubation with an (A) phospho-Akt (ca. 60 kDa) primary antibody or (B) a pan-Akt (total Akt level, loading control) primary antibody. 518A2 cells were treated with DMSO (control), Etacrox, Bimacroxam (Bimacrox) or Vorinostat (V) or the PI3K inhibitors Wortmannin (W) or LY294002 for 6 h after EGF pre-incubation (2 h, 200 ng/mL). Equal volumes of cell lysates were subjected to SDS-PAGE with subsequent transfer to PVDF membranes and a standard procedure antibody staining. Images recorded with a LAS-3000 image reader (Fujifilm), vanadate: cells were treated with 100 µM ortho-vanadate/H2O2 for 10 min prior to cell lysis; molecular weight (MW) marker: PageRuler Prestained Protein Ladder Plus (Fermentas/Thermo Scientific).

- S18 -
Original images of gelatin zymograms
(Determination of MMP-2 and MMP-9 inhibition by gelatine zymography)
Fig. S11 – Original images of gelatin zymography-ba sed detection of MMP inhibitors. A mixture of 2.5 µL non-reducing, denaturating 2X SDS-protein loading buffer and 2.5 µL conditioned DMEM (supernatant DMEM + 0.1% BSA + 200 KIU Aprotinin/mL from 518A2 melanoma cultures) was subjected to 10% SDS-Polyacrylamide gel electrophoresis with co-polymerised gelatin (0.1 mg/mL). Gels were cut into pieces containing to equal loaded lanes, washed (cf. Materials and Methods in the main manuscript for method description) and incubated with MMP activity-buffer containing Etacrox and Vorinostat at final concentrations as indicated. Gel slices were stained with coomassie brilliant blue and destained to detect concentrated MMP-9 and MMP-2 bands (white bands on dark background) and a high-molecular weight band that was used as an internal loading control (coomassie-stained protein band). Molecular weight standard: PageRuler Prestained Protein Ladder (Pierce/Thermo Scientific). Representative for three independent experiments.

- S19 -
Preliminary Animal Studies
Fig. S12 – Outlook: Dose-toleration experiments wit h xenograft bearing mice. (A) Two doses of 150 mg/kg body weight of Etacrox 3 were given to two mice at day 1 and 2 (indicated by arrows). (B) Effects on highly-vascularised 1411HP germ cell tumours after 24 h representative for two experiments.

- S20 -
References
[1] M.V. Berridge, A.S. Tan, K.D. McCoy, R. Wang, The biochemical and cellular basis of cell proliferation assays that use tetrazolium salts, Biochemica. 4 (1996) 15–19.
[2] U. Michelsen, J. von Hagen, Chapter 19 Isolation of Subcellular Organelles and Structures, in: Methods Enzymol., Elsevier, 2009: pp. 305–328. http://linkinghub.elsevier.com/retrieve/pii/S0076687909630196 (accessed December 16, 2014).
[3] J.D. Dignam, R.M. Lebovitz, R.G. Roeder, Accurate transcription initiation by RNA polymerase II in a soluble extract from isolated mammalian nuclei, Nucleic Acids Res. 11 (1983) 1475–1489.
[4] K.S. Ullman, S. Shah, M.A. Powers, D.J. Forbes, The nucleoporin nup153 plays a critical role in multiple types of nuclear export, Mol. Biol. Cell. 10 (1999) 649–664.
[5] T.E. Shaiken, A.R. Opekun, Dissecting the cell to nucleus, perinucleus and cytosol, Sci. Rep. 4 (2014). doi:10.1038/srep04923.
[6] R. Schobert, B. Biersack, A. Dietrich, K. Effenberger, S. Knauer, T. Mueller, 4-(3-Halo/amino-4,5-dimethoxyphenyl)-5-aryloxazoles and - N -methylimidazoles That Are Cytotoxic against Combretastatin A Resistant Tumor Cells and Vascular Disrupting in a Cisplatin Resistant Germ Cell Tumor Model, J. Med. Chem. 53 (2010) 6595–6602. doi:10.1021/jm100345r.
[7] P. Di Fazio, S. Lingelbach, R. Schobert, B. Biersack, 4,5-Diaryl imidazoles with hydroxamic acid appendages as anti-hepatoma agents, Invest. New Drugs. (2014). doi:10.1007/s10637-014-0188-0.
[8] K. Mahal, S. Schruefer, F. Rausch, G. Steinemann, R. Schobert, M. Höpfner, et al., 4,5-diaryl imidazoles with hydroxamic acid appendages as new dual mode anticancer agents, Cancer Chemother. Pharmacol. (2015) in press.
[9] Z. Lu, T. Hunter, Ubiquitylation and proteasomal degradation of the p21 (Cip1), p27 (Kip1) and p57 (Kip2) CDK inhibitors, Cell Cycle. 9 (2010) 2342–2352.


![Bis[2-(1 H -imidazol-2-yl-κ N 3 )-1 H -imidazol-3-ium]silver(I) trinitrate](https://img.pdfslide.net/doc/110x75/635921329e39cba4b6058502/bis2-1-h-imidazol-2-yl-k-n-3-1-h-imidazol-3-iumsilveri-trinitrate.jpg)


