Embed Size (px)
Citation preview

Methods
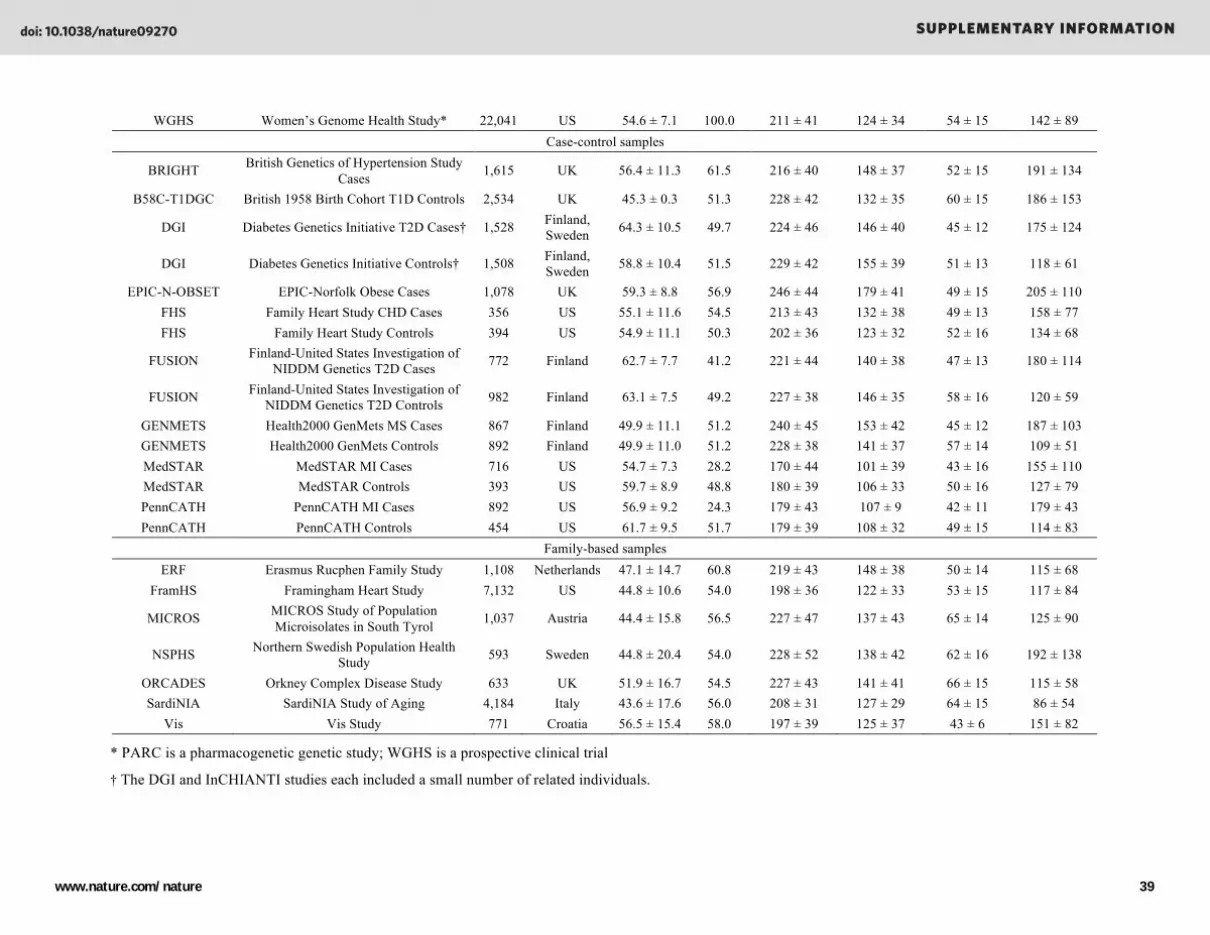
Study samples and phenotypes. Each of the 46 participating studies in the primary meta-
analysis is described in Supplementary Table 1 and in further detail below. In most studies,
total cholesterol, HDL-C, and triglycerides were measured at fasting in subjects. Direct
measurements of LDL-C were available for individuals in the Baltimore Longitudinal Study of
Aging and Women’s Genome Health Study and for a subset of individuals in the Health2000
GenMets Study; otherwise, LDL-C was calculated using the Friedewald formula, with missing
values assigned to individuals with triglycerides >400 mg/dL. Individuals known to be on lipid-
lowering therapy were excluded from analysis for all studies except the Fenland, EPIC Norfolk,
and EPIC Norfolk Obese cohorts; fewer than 2% of individuals in each of these studies were
known to be on lipid-lowering medication, and no exclusions or adjustments were made. All
individuals in each of these 46 studies were reported to be of European descent. All participants
provided informed consent, and local ethical committees at participating institutions approved
individual study protocols.
Study descriptions.
I. Primary Analysis: Community-based cohorts
a. Age, Gene/Environment Susceptibility (AGES) Study. The AGES study has
been described previously21. The study was initiated in 2002 to examine genetic
susceptibility and gene/environment interactions related to disease and disability
in old age. The AGES study is comprised of approximately 2,500 samples drawn
from the Reykjavik Study, a population-based cohort comprised of individuals
born between 1907 and 1935 and followed since 1967 by the Icelandic Heart
Association.
SUPPLEMENTARY INFORMATIONdoi: 10.1038/nature09270
www.nature.com/nature 1

b. Atherosclerosis Risk in Communities (ARIC) Study. The ARIC study has been
described in detail previously22. The ARIC Study is a multi-center prospective
investigation of atherosclerotic disease. White and African American men and
women aged 45-64 years at baseline were recruited from four communities:
Forsyth County, North Carolina; Jackson, Mississippi; suburban areas of
Minneapolis, Minnesota; and Washington County, Maryland. A total of 15,792
individuals participated in the baseline examination in 1987-1989, with three
triennial follow-up examinations. 7,841 white subjects were included in this
analysis. Individuals known to be taking lipid-lowering medications and/or to
have type 2 diabetes were excluded. Prevalent type 2 diabetes was defined as the
presence of any of the following: a fasting blood glucose level of 126 mg/dL (7.0
mmol/L); a nonfasting blood glucose level of 200 mg/dL (11.1 mmol/L); self-
reported physician diagnosis of type 2 diabetes; or pharmacologic treatment of
diabetes in the past two weeks.
c. Australian, Danish, Dutch, Finnish, Swedish Twin Cohorts and TwinsUK.
Twin samples were drawn from the GenomEUtwin project23, which is comprised
of the Danish, Dutch, Finnish, Italian, Norwegian, and Swedish national twin
cohorts, an Australian twin cohort, and the UK-based TwinsUK cohort. The
current study included monozygotic twin pairs from the Australian (MZGWA-
AUS; 449 pairs), Danish (MZGWA-DK; 142 pairs), Dutch (MZGWA-NLD; 289
pairs), Finnish (MZGWA-FIN; 137 pairs), Swedish (MZGWA-SWE; 297 pairs),
and UK (MZGWA-UK; 457 pairs) cohorts. In each of the six twin cohorts, female
monozygotic twin pairs were identified, lipid measurements were averaged for
each pair, and genotype data for one of the individuals was used in the analysis.
d. Baltimore Longitudinal Study of Aging (BLSA). This study has been described
in detail previously24. The BLSA is an on-going prospective study that began in
doi: 10.1038/nature09270 SUPPLEMENTARY INFORMATION
www.nature.com/nature 2

1958 to investigate changes that occur with normal aging. The study consists of
volunteers recruited primarily from the Washington, DC, and Baltimore, MD,
areas. Genome-wide data were available for 1,230 participants. The analysis was
restricted to 713 Caucasian individuals with lipid measurements.
e. British 1958 Birth Cohort – Wellcome Trust Case Control Consortium
(B58C-WTCCC). This study was part of the Wellcome Trust Case Control
Consortium (WTCCC) and has been described previously25, 26. The British 1958
Birth Cohort is a national population sample followed periodically from birth to
age 44-45 years. The current analysis included 1,459 individuals that passed
quality control criteria and had lipid measurements available.
f. Cardiovascular Health Study (CHS). The CHS has been described in detail
previously27. The CHS is a population-based cohort study of risk factors for
coronary heart disease and stroke in adults ≥65 years conducted across four field
centers. The original predominantly Caucasian cohort of 5,201 persons was
recruited in 1989-1990 from random samples of the Medicare eligibility lists, and
an additional 687 African-Americans were enrolled subsequently for a total
sample of 5,888. DNA was extracted from blood samples drawn on all
participants at their baseline examination in 1989-90. In 2007-2008, genotyping
was performed at the General Clinical Research Center’s
Phenotyping/Genotyping Laboratory at Cedars-Sinai on 3,980 CHS participants
who were free of cardiovascular disease at baseline, consented to genetic testing,
and had DNA available for genotyping. To limit the possibility of confounding
due to population structure, these analyses were limited to the 3,121 white
participants with genotype data and lipid measurements.
doi: 10.1038/nature09270 SUPPLEMENTARY INFORMATION
www.nature.com/nature 3

g. The Cohorte Lausannoise (CoLaus) Study. The CoLaus study has been
described in detail previously28. Participants were randomly selected from a list of
56,694 individuals aged 35 to 75 years who were permanent residents of the City
of Lausanne, Switzerland. Only individuals with four grandparents of European
origin were included in the study. The CoLaus study was sponsored in part by
GlaxoSmithKline, and all participants were duly informed about this sponsorship.
Principal components were computed to adjust for population stratification using
EIGENSOFT (http://genepath.med.harvard.edu/~reich/Software.htm). After using
the Akaike Information Criterion (AIC) based stepwise model selection, the 3
principal components significant at P < 0.05 were included as covariates in the
association analyses. A total of 5,253 participants with lipids measurements were
included in this analysis.
h. KORA - Cooperative Health Research in the Region of Augsburg (KORA).
The KORA surveys have been described in detail previously29, 30. The third
KORA survey (KORA S3, n=3,996) is a population-based sample from the
general population of the South-German city of Augsburg and surrounding
counties from 1994/1995. A subsample of 1,644 individuals from this survey with
10-year followup (KORA F3) information available was successfully genotyped
(the KORA S3/F3 500K Study). All participants had a German passport and were
of European origin. A total of 1,405 participants not on lipid-lowering therapy and
with lipid measurements were included in this analysis.
i. The European Prospective Investigation of Cancer-Norfolk Subcohort
(EPIC-N-SUBCOH). The EPIC-Norfolk studies have been described
previously31, 32. EPIC-Norfolk is an ongoing prospective cohort study of chronic
diseases comprising 25,663 Norfolk residents, an ethnically homogenous
European origin population aged 39-79 who were recruited from general practice
doi: 10.1038/nature09270 SUPPLEMENTARY INFORMATION
www.nature.com/nature 4

registers between 1993 and 1997 for a first health examination. A total of 2,346
non-obese subjects were included in this analysis.
j. Fenland Study. The Fenland Study is a community-based cohort of individuals
born between 1950 and 1975 and residing in East Cambridgeshire or Fenland,
UK. The goal of the Fenland Study is to study the interactions between diet,
lifestyle, and genetic factors and risk of diabetes and obesity. A total of 1,401
individuals with genotype data and lipid measurements were included in the
current analysis.
k. Invecchiare in Chianti (InCHIANTI) Study. InCHIANTI, described in detail
previously33, is an epidemiological study of risk factors contributing to the decline
in physical functioning in late life. Individuals were selected from the population
registries of two small towns in Tuscany, Italy. Participants, all of white European
origin, were invited to a clinic visit for evaluation of health status as described in
detail previously34. Genotype data and lipid measurements were available for
1,134 individuals.
l. London Life Sciences Prospective Population Study (LOLIPOP). LOLIPOP is
an ongoing community cohort of approximately 30,000 individuals aged 35-75
years, recruited in West London, UK35 to study the environmental and genetic
factors that contribute to cardiovascular disease among UK Indian Asians. The
study includes both European and Indian Asian subjects. Indian Asian participants
reported having all four grandparents born on the Indian subcontinent, while
European participants are self-classified whites born in Europe. For the current
study, genotypes and lipid measurements were available for 1,599 European white
individuals included in the primary meta-analysis.
doi: 10.1038/nature09270 SUPPLEMENTARY INFORMATION
www.nature.com/nature 5

m. National FINRISK Study. The FINRISK study is a population survey of risk
factors for chronic, non-communicable diseases carried out in Finland. Since
1972, the survey has been performed every five years using independent, random
and representative population samples from different parts of the country36.
Participants complete a questionnaire and undergo a physical examination,
including measurement of anthropometric traits and blood draw. The current
analysis included 910 healthy individuals from the Helsinki area, who participated
in a FINRISK survey and had genotype data and lipid measurements available.
n. Northern Finland Birth Cohort 1966 (NFBC1966). The NFBC1966 has been
described in detail previously37. The study was originally designed to study
factors affecting pre-term birth, low birth weight, and subsequent morbidity and
mortality. Mothers living in the two northern-most provinces of Finland were
invited to participate if they had expected delivery dates during 1966. A total of
12,058 live-births were included in the study. At age 31, 5,923 individuals still
living in the Helsinki area or Northern Finland were asked to participate in a
detailed biological and medical examination as well as a questionnaire. Genotypes
and lipid measurements were available for 5,138 individuals included in this
analysis.
o. Pharmacogenomics and Risk of Cardiovascular Disease Study (PARC).
There were two clinical populations in the PARC study, which has been described
in detail previously38. The first was derived from the Cholesterol Atherosclerosis
Pharmacogenetics (CAP) Study. CAP subjects were recruited from two clinical
sites located in Los Angeles and San Francisco, California. Participants were
Caucasians, aged 30 and above, who received open label 40 mg simvastatin daily
for 6 weeks. They were recruited on the basis of having plasma total cholesterol
levels of 4.14-10.36 mmol/L (160-400 mg/dL). The second population was
doi: 10.1038/nature09270 SUPPLEMENTARY INFORMATION
www.nature.com/nature 6

derived from the Pravastatin Inflammation CRP Evaluation (PRINCE). These
subjects were enrolled from 1,143 sites representing 49 states and the District of
Columbia, with no single site enrolling more than 4 patients. Participants were
Caucasians, aged 21 and older, who received 40 mg daily pravastatin for 12
weeks. They were recruited for having an LDL-cholesterol concentration ≥3.5
mmol/L (>135 mg/dL) or a history of myocardial infarction, stroke, or coronary
revascularization regardless of their baseline LDL-cholesterol. Subjects were
excluded for baseline use of statins or other lipid lowering agents, pregnancy,
lactation, alcohol or drug abuse, liver disease, known statin intolerance,
uncontrolled diabetes, uncontrolled thyroid disease or abnormal thyroid function,
or <90% compliance with the study medication during a two-week run-in period.
A total of 1,939 individuals were available for analysis.
p. Rotterdam Baseline Study and Rotterdam Extension of Baseline Study. The
Rotterdam Study is an ongoing prospective population-based cohort study,
focused on chronic disabling conditions of the elderly. The study comprises an
outbred ethnically homogenous population of Dutch Caucasian origin. The
rationale of the study has been described in detail elsewhere39, 40. In summary,
7,983 men and women aged 55 years or older, living in Ommoord, a suburb of
Rotterdam, the Netherlands, were invited to participate. A total of 5,701
individuals from the initial study were included in the current study. In 2000-
2001, a second cohort was established with approximately 3,000 individuals,
1,628 of whom were included in this study.
q. Supplementation en Vitamines et Mineraux Antioxydants (SUVIMAX)
Study. The SUVIMAX study has been described previously41, 42. SUVIMAX was
a controlled randomized primary prevention trial to study the effects of
supplemented vitamins and minerals on cardiovascular disease and cancers in
doi: 10.1038/nature09270 SUPPLEMENTARY INFORMATION
www.nature.com/nature 7

French men and women between 45-60 and 35-60 years of age, respectively. A
total of 1,813 individuals with lipid measurements were included in the current
analysis.
r. Women’s Genome Health Study (WGHS). The WGHS has been described
previously43. Participants were drawn from the Women’s Health Study, where
they had been followed over a 12-year period and monitored for serious health-
related events, including myocardial infarction, stroke, and diabetes. Genome-
wide genotyping was performed on individuals within the WGHS, and 22,041
participants with lipid measurements were included in the current analysis.
II. Primary Analysis: Case-control samples
a. British Genetics of Hypertension (BRIGHT) Study. The BRIGHT study has
been described previously44. Individuals diagnosed with hypertension before age
60 were recruited to study hypertension, an important risk factor for coronary
artery and cerebrovascular diseases. All individuals reported having four
grandparents of white British ancestry. A total of 1,615 hypertensive cases with
lipid measurements were included in the current analysis.
b. British 1958 Birth Cohort Type 1 Diabetes Genetics Consortium (B58C-
T1DGC). The B58C-T1DGC is a sample from the national population-based
1958 Birth Cohort collected in the UK and sampled periodically from birth to age
44-45 years26. Samples are distinct from those included in the B58C-WTCCC
cohort described above. A total of 2,534 individuals with lipids measurements
were included in the current analysis.
c. Diabetes Genetics Initiative (DGI). The DGI study has been described in detail
previously45, 46. The DGI study is a type 2 diabetes case-control study that
doi: 10.1038/nature09270 SUPPLEMENTARY INFORMATION
www.nature.com/nature 8

includes 1,588 T2D cases and 1,523 matched controls of European ancestry from
Sweden and Finland. A total of 1,528 cases and 1,508 controls with lipid
measurements were included in the current analysis.
d. The European Prospective Investigation of Cancer-Norfolk Obese Cohort
(EPIC-N-OBSET). The EPIC-Norfolk studies have been described previously31,
32. EPIC-Norfolk is an ongoing prospective cohort study of chronic diseases
comprising 25,663 Norfolk residents, an ethnically homogenous European origin
population aged 39-79 years who were recruited from general practice registers
between 1993 and 1997 for a first health examination. A subcohort of 1,078 obese
(BMI ≥ 30 kg·m-2) individuals with lipid measurements was included in the
current analysis.
e. The Family Heart Study (FHS). The FHS is a multicenter study of the genetic
and non-genetic risk factors for coronary heart disease and has been described in
detail previously47. A total of 356 individuals with coronary heart disease and 394
controls with lipid measurements were available for the current analysis.
f. Finland-United States Investigation of NIDDM Genetics (FUSION) Study.
The FUSION study has been described in detail previously48, 49. The FUSION
GWAS is a type 2 diabetes (T2D) case-control study that includes 1,161 Finnish
T2D cases and 1,174 normal glucose tolerant (NGT) controls. A total of 772 cases
and 982 controls with lipid measurements were included in the current analysis.
g. Health2000 GenMets Study. The GenMets sample has been described in detail
previously50. Individuals are metabolic syndrome cases and matched controls
drawn from the Finnish Health2000 study. A total of 867 metabolic syndrome
cases and 892 controls with genotype data and lipid measurements were included
in the current analysis.
doi: 10.1038/nature09270 SUPPLEMENTARY INFORMATION
www.nature.com/nature 9

h. MedSTAR Study. MedSTAR is a cross-sectional study of coronary
atherosclerosis that has been described in detail previously51. 1,500 subjects who
underwent cardiac catheterization at the Washington Hospital Center between
August 2004 and March 2007 were recruited to participate. The cohort is
comprised of 874 cases with history of coronary artery disease (CAD) and 447
controls without history of CAD. A total of 716 CAD cases and 393 controls with
genotype data and lipid measurements were included in the present study.
i. PennCATH Study. PennCATH is an angiographic study based at the University
of Pennsylvania Medical Center that has been described previously52. Individuals
who underwent cardiac catheterization at Penn between July 1998 and March
2003 were invited to participate. The cohort is comprised of 933 CAD cases and
468 controls with no history of CAD. The current analysis included 892 CAD
cases and 454 controls with genotype data and lipid measurements available.
III. Primary Analysis: Family-based samples
a. Erasmus Rucphen Family (ERF) Study. The ERF study has been described in
detail previously53. A total of approximately 3,000 participants descend from 22
couples who lived in the Rucphen region in The Netherlands in the 19th century.
A total of 1,108 individuals with genotype data and lipid measurements were
included in the current analysis.
b. Framingham Heart Study (FramHS). The FramHS is a three generational
prospective cohort that has been described in detail previously54. Individuals were
initially recruited in 1948 in Framingham, USA to evaluate cardiovascular disease
risk factors. The second generation cohort (5,124 offspring of the original cohort)
was recruited between 1971 and 1975, and multiple lipid measurements were
available and have been averaged. The third generation cohort (4,095 grand-
doi: 10.1038/nature09270 SUPPLEMENTARY INFORMATION
www.nature.com/nature 10

children of the original cohort) was collected between 2002 and 2005, and a
single lipid measurement was available. The current analysis includes 7,132
individuals for whom genotypes and lipid measurements were available.
c. MICROS Study of Population Microisolates in South Tyrol. The MICROS
study has been described in detail previously55. As part of the genomic healthcare
program “GenNova,” an extensive survey was carried out during 2001–2003 in
three villages of the Val Venosta (South Tyrol, Italy) on the populations of
Stelvio, Vallelunga, and Martello. The current analysis includes 1,037 individuals
for whom genotype data and lipid measurements were available.
d. Northern Swedish Population Health Study (NSPHS). The NSPHS is a family-
based prospective population study in Sweden. The parish of Karesuando, in the
subartic region of the County of Norrbotten, has about 1,500 inhabitants, 740 of
whom participated in the study. The region has experienced little immigration
during the last 200 years. The current analysis included 593 individuals for whom
genotypes and lipid measurements were available.
e. Orkney Complex Disease Study (ORCADES). ORCADES is an ongoing
family-based genetic epidemiology collection in the isolated Scottish archipelago
of Orkney. The current analysis included 633 individuals from a subgroup of the
Orkney islands who had genotype data and lipid measurements available for
study.
f. SardiNIA Study of Aging. The SardiNIA study has been described in detail
previously56. The study includes 4,301 related individuals from the Ogliastra
region of Sardinia, Italy who have been studied longitudinally for age-related
quantitative traits. The current study included 4,184 individuals with genotype
data and lipid measurements available.
doi: 10.1038/nature09270 SUPPLEMENTARY INFORMATION
www.nature.com/nature 11

g. Vis Study. The Vis study has been described in detail previously57. Croatians
aged 18-93 years were recruited from the villages of Vis and Komiza on the
Dalmation island of Vis between 2003 and 2004. The current analysis included
771 individuals for whom genotype data and lipid measurements were available.
IV. Replication (European and non-European) groups
a. East Asian cohorts
i. Cebu Longitudinal Health and Nutritional Survey (CLHNS). The
CLHNS is part of an ongoing study of a cohort of Filipino women who
gave birth between 1983 and 1984 and has been described previously58.
The four lipid traits were measured using blood plasma from the 2005
survey, and 1,789 women who were not taking lipid-lowering medication
were included in this study. Samples were genotyped with the Affymetrix
Genome-Wide Human SNP Array 5.059, and HapMap SNPs polymorphic
in both the 60 HapMap CEU founders and the 89 combined HapMap
CHB+JPT samples were imputed using MACH version 1.0. Residuals
were adjusted for age, age2, measures of socioeconomic status (total
assets, natural log-transformed income), number of previous pregnancies,
menopausal status, and seven principal components of variation
representing population substructure.
ii. Korea Association Resource (KARE) Project. The KARE project was
initiated in 2007 to perform large-scale genome-wide association analyses
of the Ansung and Ansan population-based cohorts in Korea60. The
cohorts were collected as part of the Korean Genome Epidemiology Study
and included 5,018 Ansung and 5,020 Ansan inhabitants between 40 and
69 years of age. Individuals were collected in the Gyeonggi Province,
doi: 10.1038/nature09270 SUPPLEMENTARY INFORMATION
www.nature.com/nature 12

close to Seoul, Republic of Korea. All participants have been examined
every two years since baseline, and more than 260 traits have been
examined. Genotypes were obtained using the Affymetrix Genome-Wide
Human SNP array 5.0, and a total of 352,228 markers were successfully
genotyped in 8,842 individuals. A total of 8,801 subjects with lipid
measurements and not taking lipid-lowering medications were included in
the current analysis.
iii. Singapore Malay Eye Study (SiMES). The Singapore Malay Eye Study
(SiMES) is a population-based cross-sectional epidemiological study of
3,280 individuals from one of the three major ethnic groups residing in
Singapore61, 62. All subjects were Malay and aged 40-80 years. In
summary, an age-stratified random sample comprised of 1,400 people
from each decade of 40-49, 50-59, 60-69 and 70-79 was drawn from a
computer-generated list of 15 residential districts provided by the
Singapore Ministry of Home Affairs. Of the 5,600 names generated, a
door to door household visit was made to confirm eligibility. Among the
4,168 eligible individuals, 3,280 participated in the study. In total, there
are 2,542 Malays with genotypes on 557,824 autosomal SNPs from the
Illumina610quad genotyping array. The 2,231 individuals not taking lipid-
lowering drugs were included in the current analysis.
iv. Singapore Prospective Study Program (SP2). The SP2 is a population-
based study of diabetes and cardiovascular disease in Singapore that has
been described previously63. The SP2 has recruited 10,633 Chinese,
Malay, and Indian subjects from four cross-sectional studies that were
conducted in Singapore between 1984 and 1998. Subjects were aged 18-
69 at baseline and represented a random sample of the Singapore
doi: 10.1038/nature09270 SUPPLEMENTARY INFORMATION
www.nature.com/nature 13

population, with over-sampling of the minority Malay and Indian ethnic
groups to achieve a ratio of 60:20:20 in the overall sample. From 2003 to
2007, 7,772 subjects were re-contacted and interviewed, 5,094 of whom
provided blood and other clinical data. In total, there are 2,434 Chinese
individuals with genotypes on 489,028 common SNPs combined from
three Illumina genotyping arrays, namely Illumina610quad,
Illumina1Mduo and Illumina550v3. The 2,225 individuals not taking
lipid-lowering drugs were included in the current analysis.
b. South Asian cohort
i. London Life Sciences Prospective Population Study (LOLIPOP).
LOLIPOP is an ongoing community cohort of approximately 30,000
individuals aged 35-75 years, recruited in West London, UK35 to study the
environmental and genetic factors that contribute to cardiovascular disease
among UK Indian Asians. The study includes both European and Indian
Asian subjects; Indian Asian participants reported having all four
grandparents born on the Indian subcontinent, while European participants
are self-classified whites born in Europe. For the current study, genotypes
and lipid measurements were available for 9,705 Indian Asian individuals
included in the cross-ethnic analysis.
c. African American cohorts
i. National Heart, Lung, and Blood Institute Candidate Gene
Association Resource (NHLBI CARe). These cohorts, including ARIC
study, the Coronary Artery Risk Development in Young Adults study, the
Cleveland Family Study, the Jackson Heart Study, and the Multi-Ethnic
Study of Atherosclerosis, have previously been described64. For the
doi: 10.1038/nature09270 SUPPLEMENTARY INFORMATION
www.nature.com/nature 14

current study, genotypes and lipid measurements were available for 8,061
African American individuals included in the cross-ethnic analysis.
d. European cohorts
i. deCODE. The deCODE lipid study includes lipid measurements from
Icelanders recruited through various genetic studies at deCODE, primarily
cardiovascular studies65. The measurements were done between the years
1987 and 2008. For the current analysis we included individuals born after
1935 and excluded those using lipid lowering drugs. Genotypes and lipid
measurements were thus available for 7,063 Icelanders included in the
cross-ethnic analysis. The study was approved by the Icelandic Data
Protection Commission and the National Bioethics Committee. All study
participants signed informed consent and donated blood samples. Personal
identities were encrypted by a third party system provided by the Icelandic
Data Protection Commission.
ii. Malmö Diet and Cancer Study – Cardiovascular Cohort (MDC-CC).
The Malmö Diet and Cancer Study, a community-based prospective
epidemiologic cohort of 28,449 persons recruited for a baseline
examination between 1991 and 199666. From this cohort, 6,103 persons
were randomly selected to participate in the cardiovascular cohort, which
sought to investigate risk factors for cardiovascular disease. All
participants underwent a medical history assessment and a physical
examination. Of the participants in the cardiovascular cohort, 4,991 had
DNA samples available for this analysis and data available for at least one
lipoprotein or lipid phenotype.
doi: 10.1038/nature09270 SUPPLEMENTARY INFORMATION
www.nature.com/nature 15

iii. National FINRISK 1997 Study (FINRISK97). FINRISK97 was a
population-based cross-sectional survey designed to study the prevalence
of cardiovascular risk factors in Finland67. Surveys are conducted every 5
years, and the 1997 survey included 8,389 Finnish men and women aged
25–74. Participants underwent a physical examination and completed a
questionnaire regarding cardiovascular risk factors. Of these FINRISK97
participants, 7,026 had DNA samples available for this analysis and data
available for at least one lipoprotein or lipid phenotype.
V. Coronary artery disease cohorts
a. Coronary ARtery DIsease Genome-wide Replication And Meta-analysis
(CARDIoGRAM) study. CARDIoGRAM combines data from all published and
several unpublished GWAS including individuals with European ancestry,
includes >22,000 cases with CAD and/or MI and >60,000 controls, and unifies
samples from Atherosclerotic Disease VAscular functioN and genetiC
Epidemiology study, CADomics, Cohorts for Heart and Aging Research in
Genomic Epidemiology, deCODE, the German Myocardial Infarction Family
Studies I, II, and III, Ludwigshafen Risk and Cardiovascular Heath
Study/AtheroRemo, MedStar, Myocardial Infarction Genetics Consortium,
Ottawa Heart Genomics Study, PennCath, and the Wellcome Trust Case Control
Consortium68. CAD was defined as: 1) coronary artery stenosis > 50% in at least
one major epicardial artery; 2) fatal MI; 3) non-fatal MI based on ECG and
cardiac biomarkers; 4) angina with positive stress testing; 5) percutaneous
transluminal angioplasty; or 6) coronary artery bypass surgery. The control
definition varied by study and ranged from population-based controls to self-
reported freedom from CAD to lack of obstructive lesions on coronary
angiography. Genotyping platforms and quality control criteria have been
described68.
doi: 10.1038/nature09270 SUPPLEMENTARY INFORMATION
www.nature.com/nature 16

b. COROGENE. The COROGENE study includes individuals who underwent
coronary angiography in Helsinki University Hospital, Finland and matched
controls. Cases (n = 2,172) were individuals admitted to the Helsinki University
Hospital for acute coronary syndrome (unstable angina pectoris or acute
myocardial infarction). Controls (n = 1,579) were age- and sex- and area of
residence matched individuals from the FINRISK 1997, 2002, or 2007 studies.
Genotype and quality control criteria have been described69.
VI. Extreme lipids case-control cohorts
a. High HDL-C. For the study of the cumulative effects of common variants in
individuals at the extremes of the HDL distribution, cases with high HDL (>90th
percentile for age, gender, and race) were selected from the University of
Pennsylvania High HDL Cholesterol Study (HHDL) and controls with low HDL
(<30th percentile for age, gender, and race) were selected from the University of
Pennsylvania Catheterization cohort (PennCATH). HHDL is a cross-sectional
study of genetic factors contributing to elevated HDL-C levels. Probands with
elevated HDL-C (>75th percentile for age and gender) were identified by
physician referrals or through the Hospital of the University of Pennsylvania
clinical laboratory70. Relatives of HHDL probands were also invited to participate
in the study. Subjects completed a lifestyle questionnaire and provided a blood
sample for the measurement of HDL and other lipid-related traits. Genotyping
was performed at the Center for Applied Genomics (Children’s Hospital of
Pennsylvania) following manufacturer specifications for amplification and
hybridization to the Affymetrix Genome-Wide Human SNP Array 6.0. Quality
control measures to exclude unreliable SNPs and eliminate SNPs with genotype
call rate < 95%, with minor allele frequency (MAF) < 1% or if there was
significant departure from Hardy-Weinberg equilibrium (P < 1 x 10⁻⁶ in combined
doi: 10.1038/nature09270 SUPPLEMENTARY INFORMATION
www.nature.com/nature 17

cases and controls) were performed. Imputation was conducted using a Hidden
Markov Model algorithm as implemented in MACH.
b. High LDL-C. Blood samples of unrelated hypercholesterolemic patients were
collected from 64 Dutch Lipid Clinics. Based on clinical criteria, all patients were
suspected for familial hypercholesterolemia by cardiologists and internists using a
uniform protocol and internationally accepted criteria71, 72. All patients were
routinely analysed for the presence of mutations by direct sequencing of the
complete LDLR and the LDL-receptor binding region of APOB (amino acids 3414
to 3588). For the identification of large rearrangements in the LDLR gene, a
multiplex ligation-dependent probe (MLPA) technique with the Salsa P062 LDLR
Exon Deletion Test Kit (MRC-Holland, Amsterdam, the Netherlands) was used,
according to the manufacturer’s instructions. For this analysis, we considered only
the 344 patients in whom a functional LDLR or APOB mutation was not
identified. After an overnight fast, blood was sampled, and plasma concentrations
of total cholesterol, HDL-C, and triglycerides were measured by commercially
available kits (Boehringer Mannheim, Mannheim, Germany). LDL-C
concentrations were calculated by the Friedewald formula only when the
triglyceride concentration was below 4.5 mmol/L. Genomic DNA was prepared
from 10 ml whole blood on an AutopureLS apparatus according to a protocol
provided by the manufacturer (Gentra Systems, Minneapolis, MI, USA).
c. High triglycerides. In total, 344 unrelated adult subjects of European ancestry
with hypertriglyceridemia, defined as having untreated 12 h fasting plasma
triglyceride concentrations >3 mmol/L on at least two occasions, were studied73.
Patients were ascertained through a single tertiary referral lipid clinic, and had
undergone complete medical history and examination, together with collection of
demographic, clinical, and biochemical variables. Low triglyceride control
doi: 10.1038/nature09270 SUPPLEMENTARY INFORMATION
www.nature.com/nature 18

subjects were comprised of 144 unrelated adult subjects of European ancestry
with fasting plasma triglyceride concentrations < 2.4 mmol/L, including both
healthy population-based controls from Ontario and subjects with molecularly
confirmed familial hypercholesterolemia. Study subjects were genotyped using
the Affymetrix Genome-Wide Human SNP Array 6.0 platform (Affymetrix, Santa
Clara, CA), according to protocols of the London Regional Genomics Centre
(www.lrgc.ca). Genotypes were called using Affymetrix Genotyping Console,
setting quality control thresholds for SNP call rate (95%), Hardy-Weinberg
equilibrium (P > 0.0001) and minor allele frequency (>1%). SNP imputation was
subsequently conducted using phased haplotypes from the European HapMap
cohort in MACH.
Genotyping and imputation. All cohorts were genotyped using commercially available
Affymetrix or Illumina genotyping arrays, or custom Perlegen arrays. Quality control was
performed independently for each study. To facilitate meta-analysis, each group performed
genotype imputation using BIMBAM, IMPUTE, or MACH, with reference to the Phase II CEU
HapMap74. Study-specific details are presented in Supplementary Table 3.
Genome-wide association analyses. Within each study, residual lipoprotein concentrations were
determined after regression adjustment. To calculate residuals, each study included as covariates
age, age2, and sex. Each group was given the option to include additional covariates (e.g.,
principal components, study site) to account for population structure; study-specific covariates
are detailed in Supplementary Table 3. Residuals were normalized to have mean 0 and standard
deviation 1, and normalized residuals were used as phenotypes to test for genotype-phenotype
association. In each of the six twin cohorts (Australian, Danish National, Dutch National, Finnish
National, TwinsUK, and Swedish National) monozygotic twin pairs were identified, lipid
measurements were averaged for each pair, and a single individual with this average value was
used to represent the pair.
doi: 10.1038/nature09270 SUPPLEMENTARY INFORMATION
www.nature.com/nature 19

In each study, each genotyped or imputed SNP was tested for association with each of the
lipid traits, assuming an additive genetic model. Linear regression was employed for studies of
unrelated individuals, and linear mixed effects models were used to account for family structure
in the family-based studies. For the six case-control studies of type 2 diabetes (Diabetes Genetic
Initiative, FUSION), myocardial infarction (MedSTAR, PennCATH), coronary heart disease
(Family Heart Study), and metabolic syndrome (Health2000 GenMets), cases and controls were
analysed separately to avoid confounding effects due to disease status. Each study excluded
SNPs with MAF < 0.01 and SNPs with poor imputation quality: Rsq < 0.3 (BIMBAM and
MACH) or proper info < 0.3 (IMPUTE/SNPTEST). Since BIMBAM does not output an
imputation quality score, Rsq was calculated manually as the ratio of observed to expected
variance: var/[2p(1-p)], where p is the minor allele frequency, and var is the sample variance of
the estimated dosages.
Meta-analysis of directly typed and imputed SNPs. To combine association results across the
46 studies, we performed a fixed-effects meta-analysis using METAL for each of the four lipid
traits. For each SNP, in each study, a Z-statistic was calculated that summarized the magnitude
and direction of effect relative to a randomly selected reference allele. The overall Z-statistic was
calculated from the weighted sum of the individual study statistics; weights were proportional to
the square root of the sample size of each study and scaled so that squared weights summed to
one. Each study was subjected to genomic control correction before inclusion in the meta-
analysis to account for P-value inflation due to residual population structure or other
confounding factors. For each of the six case-control studies, cases and controls were meta-
analysed together to create a single dataset and genomic control correction was applied to each
case-control dataset. Finally, the results of the overall meta-analysis were subjected to a second
round of genomic control correction. As a result, the final genomic control lambda for each of
the four sets of association results was exactly 1.0. Genomic control factors for the individual
contributing studies and for the overall meta-analysis prior to genomic control correction are
doi: 10.1038/nature09270 SUPPLEMENTARY INFORMATION
www.nature.com/nature 20

provided in Supplementary Table 4. The pre-specified statistical significance threshold for
heterogeneity (calculated in METAL) was P < 0.0005 to account for multiple testing (102 SNPs
in 95 loci tested).
To determine whether spurious associations arose as a result of imputation artifact, SNPs
with r2 ≥ 0.8 with the most highly associated SNP (“best SNP”) in the locus were identified, and
from these the SNP directly genotyped on the greatest number of Illumina genotyping arrays and
having the highest r2 with the best SNP was chosen as the “Proxy Illumina SNP.” The “Proxy
Affymetrix SNP” was chosen in the same manner. Supplementary Table 5 shows meta-analysis
P-values for the best Illumina and Affymetrix proxy SNPs.
To ensure that the results were robust to whether or not principal components analysis
(PCA) correction was used, we performed separate meta-analyses for cohorts in which principal
components analysis (PCA) had been used (n = 47,782) and cohorts in which PCA had not been
used (n = 52,408). We then calculated heterogeneity P-values between the groups for all SNPs
well represented in each group (typed in >10,000 individuals). We present the full results of this
analysis in Supplementary Table 19. Overall, there was minimal evidence of heterogeneity
between studies that used PCA to account for population structure and those that did not.
Estimation of effect sizes. To estimate regression coefficients in clinically interpretable units,
we repeated the variance-weighted meta-analysis (using METAL) on untransformed HDL-C,
LDL-C, TC, and log-transformed TG values (owing to skewness in the data) with exclusion
criteria and covariates as before.
Conditional analysis of top signals. To identify additional lipid-associated SNPs at each of the
reported loci and genome-wide, we repeated the primary association analysis for each trait,
including genotypes or imputed dosages for the lead SNPs of genome-wide significant
association signals as additional covariates. When data for a lead SNP were unavailable, high-
doi: 10.1038/nature09270 SUPPLEMENTARY INFORMATION
www.nature.com/nature 21

LD proxies were included instead. Association results for each study were again combined by
fixed-effects meta-analysis. Genomic control correction was performed before meta-analysis on
each study, and after meta-analysis on the meta-analysis results.
Sex-specific analysis. To detect loci that exhibit different effects in males and females, we
repeated the primary analysis for each trait, analyzing males and females separately. For each
trait, residuals were calculated separately for males and females, including covariates as
described for the primary analysis. For each sex, residuals were normalized to have mean 0 and
standard deviation 1, and normalized residuals were used as phenotypes to test for genotype-
phenotype association. For both males and females, association results for each study were
combined by fixed-effects meta-analysis. Genomic control correction was performed before
meta-analysis on each study, and after meta-analysis on the meta-analysis results. For each SNP,
heterogeneity of effect size between males and females was determined using the T statistic:
,
where and are the estimates of effect sizes for men and women, respectively, and
are the standard errors estimated for men and women, respectively, and is the Pearson’s
correlation between effect size estimates for males and females, across all SNPs. The pre-
specified statistical significance threshold for heterogeneity was P < 0.0005 to account for
multiple testing (102 SNPs in 95 loci tested).
Cis-expression quantitative trait locus analysis. To determine whether lipid-associated SNPs
might act as cis-regulators of nearby genes, we profiled expression levels of 39,280 transcripts in
960 human liver samples, 741 human omental fat samples, and 609 human subcutaneous fat
samples. Tissue samples were collected postmortem or during surgical resection from donors;
tissue collection, DNA and RNA isolation, expression profiling, and genotyping were performed
as described75. MACH was used to obtain imputed genotypes for ~2.5 million SNPs in the
doi: 10.1038/nature09270 SUPPLEMENTARY INFORMATION
www.nature.com/nature 22

HapMap release 22 for each of the samples. We examined the correlation between each SNP and
all transcripts within 500 kb of the SNP position, performing association analyses as previously
described75.
Analysis of lipid-associated SNPs in samples of European and non-European groups. To
investigate the relevance of our findings in non-European populations, lead SNPs reported in
Figure 1 were analysed in 9,705 South Asian, 15,046 East Asian, and 8,061 African American
samples, as well as 7,063 separate European samples as a control cohort. Association testing was
performed for each SNP-trait pair from Figure 1, using the same association testing strategy
applied to the primary European samples. The pre-specified statistical significance threshold for
heterogeneity between each of the non-European groups and the primary European samples was
P < 0.0005 to account for multiple testing (102 SNPs in 95 loci tested) (Supplementary Table
11).
To assess whether the observed concordance between effect directions in each replication
group and the primary meta-analysis cohort was due to chance, we tested the overall number of
concordant SNPs, regardless of P-value in the group, via a binomial draw with a null expectation
of P = 0.5. To investigate whether the observed number of nominally significant, concordant
associations in each group would be expected by chance, we performed the same test on SNPs
with P < 0.05 in the group, with a null expectation of P = 0.05.
For the additional European replication cohorts (MDC-CC and FINRISK97), with a total
of 12,017 samples, a subset of the lead SNPs were directly genotyped using either the iPLEX
Sequenom MassARRAY platform or allelic discrimination on an ABI 7900 instrument (Applied
Biosystems). All reported SNPs had a genotyping call rate >95% on the replication samples and
had a Hardy-Weinberg equilibrium P > 0.001. Association testing was performed using the same
strategy applied to the primary European samples.
doi: 10.1038/nature09270 SUPPLEMENTARY INFORMATION
www.nature.com/nature 23

Analyses of lipid-associated SNPs in individuals with and without coronary artery disease.
Lead SNPs associated with LDL-C, HDL-C, TG, and/or TC levels were queried in each of the
CARDIoGRAM and COROGENE consortium samples for association with coronary artery
disease (CAD), with a total of 24,607 individuals with CAD and 66,197 without CAD. The
pooled test of association was determined by a weighted fixed-effects meta-analysis of these
cohorts using METAL.
Analysis of associated SNPs in patients with extreme LDL-C, HDL-C and TG levels. Lead
SNPs associated with LDL-C, HDL-C, and/or TG levels were tested in case-control cohorts
ascertained based on extreme LDL-C, HDL-C, or TG concentrations, respectively. Logistic
regression was used to test for association between dichotomous extreme status and genotypes
for each SNP; age and sex were included as covariates in the model. In addition, for each
individual, we constructed a genetic risk score statistic, given by the sum of risk allele counts,
weighted by effect size, and adjusted for the number of SNPs genotyped. Weighted risk scores
were adjusted for age and sex, by multiplying each covariate by the parameter estimate obtained
by linear regression, and summed with the uncorrected, weighted risk score. Corrected/weighted
risk scores were subsequently ranked by increasing score and divided into quartiles. Quartile 1
was the reference quartile, originating from the lowest risk scores. The number of cases and
controls in each quartile were counted, and subsequently compared using chi-square analysis,
generating odds ratios and P-values that correspond to each quartile’s comparison to the
reference. The significance of increasing odds ratios between quartiles was assessed using the
Cochran-Armitage test for trend.
Simulation studies to assess overlap between GWAS signals and Mendelian disease loci. To
estimate the overlap between the 95 loci identified in our GWAS and loci previously implicated
in Mendelian dyslipidemias, we examined the proportion of lead SNPs falling within 0, 10, 20,
50 and 100 kb of a Mendelian dyslipidemia locus. To account for the fact that lead SNPs were
located near genes more often than expected by chance and for bias in allele frequency due to
doi: 10.1038/nature09270 SUPPLEMENTARY INFORMATION
www.nature.com/nature 24
SNP ascertainment, we first organized all SNPs examined in our GWAS into a series of bins,
each including SNPs with the same minor allele frequency (MAF) (rounded to the nearest 0.01)
and the same number of flanking RefSeq genes (not rounded). Next, we counted the number of
GWAS lead SNPs within each bin and sampled an appropriate number of SNPs from that bin. As
an example, suppose that there were 10,000 analysed SNPs with MAF = 0.10 examined and
which lie within 10 kb of at least one RefSeq gene; further, suppose two of these corresponded to
GWAS lead SNPs. Our resampling scheme would ensure that every permuted dataset would also
include exactly two SNPs from this bin. After generating 1,000,000 SNP sets, we tallied the
average number of Mendelian loci hit per simulation and the maximum number of Mendelian
loci hit in a single simulation. None of the simulations hit more Mendelian disease loci than that
observed in our original GWAS.
Mouse studies. We created adeno-associated virus 8 (AAV8) vectors encoding the mouse
orthologues of the Galnt2 and Ppp1r3b genes, driven by the liver-specific thyroxine-binding
globulin (TBG) promoter. We generated an AAV8 vector encoding an shRNA targeting the
endogenous mouse Galnt2 gene (sequence of hairpin:
GAACTTGGAGATCTCATTCTTCAAGAGAGAATGAGATCTCCAAGTTC) driven by the
U6 polymerase III promoter. We generated an adenoviral vector encoding an shRNA targeting
the endogenous mouse Ttc39b gene (sequence of hairpin:
GCACAGTTGTCGAGTCTTTCTCTTCCTGTCAAGAAAGACTCGACAACTGTGC) driven
by the U6 polymerase III promoter. Viral vectors encoding shRNAs with scrambled sequence
were used as controls.
Separate groups of wild-type C57BL/6J mice (six per group for Galnt2, seven per group
for Ppp1r3b) were injected via the peritoneal route with 1 x 10¹² vector genomes/mouse of the
relevant vectors. Plasma samples were taken immediately before vector administration, 14 days,
and 28 days following vector administration for analysis of lipids. Lipid measurements were
doi: 10.1038/nature09270 SUPPLEMENTARY INFORMATION
www.nature.com/nature 25

performed on a Cobas Fara II autoanalyzer (Roche Diagnostic Systems Inc, Nutley, NJ) using
Wako Chemicals (Richmond, VA) reagents. Upon sacrifice, livers were harvested and perfused
with cold phosphate-buffered saline (PBS). Liver RNA was isolated using the mirVana
microRNA isolation kit (Ambion, Inc., Austin, TX). Taqman Gene Expression Assays (Applied
Biosystems, Foster City, California) were used to perform quantitative real-time polymerase
chain reaction (qRT-PCR) measurements of transcript levels. Fast protein liquid chromatography
(FPLC) was used to fractionate mouse plasma samples, followed by measurement of the
cholesterol content. Cholesterol was measured enzymatically using the Cholesterol E kit from
Wako Chemicals (Richmond, VA).
Separate groups of wild-type C57Bl/6 mice (six per group for Ttc39b) were injected with
4 x 10⁹ pfu of adenovirus in 0.2 mL via tail vein. Mice were sacrificed after four days or seven
days, and blood samples were collected from the mice after six hours of fasting. Plasma HDL-C
levels were measured by precipitation and an enzymatic procedure (Wako Chemicals,
Richmond, VA).
URLs. Bayesian Imputation Based Association Mapping, BIMBAM,
http://quartus.uchicago.edu/~yguan/bimbam/index.html; genotype imputation program,
IMPUTE, http://www.stats.ox.ac.uk/~marchini/software/gwas/impute.html; Markov chain
haplotyping package, MACH, http://www.sph.umich.edu/csg/abecasis/MACH; MACH2QTL,
http://www.sph.umich.edu/csg/abecasis/MACH/download; pedigree analysis package, MERLIN,
http://www.sph.umich.edu/csg/abecasis/Merlin; meta-analysis tool for GWASs, METAL,
http://www.sph.umich.edu/csg/abecasis/Metal/index.html; whole-genome association analysis
package, PLINK, http://pngu.mgh.harvard.edu/~purcell/plink; whole-genome association
analysis of imputed data, ProbABEL, http://mga.bionet.nsc.ru/~yurii/ABEL; whole-genome
association analysis software, QUICKTEST, http://toby.freeshell.org/software/quicktest.shtml;
doi: 10.1038/nature09270 SUPPLEMENTARY INFORMATION
www.nature.com/nature 26

statistical computer software, R, http://www.r-project.org; whole-genome association analysis
package, SNPTEST, http://www.stats.ox.ac.uk/~marchini/software/gwas/snptest.html.
doi: 10.1038/nature09270 SUPPLEMENTARY INFORMATION
www.nature.com/nature 27

Supplementary References
21. Harris, T.B. et al. Age, Gene/Environment Susceptibility-Reykjavik Study: multidisciplinary
applied phenomics. Am J Epidemiol. 165, 1076-1087 (2007).
22. ARIC Investigators. Atherosclerosis Risk in Communities (ARIC) Study: design and
objectives. Am. J. Epidemiol. 129, 687-702 (1989).
23. Peltonen, L. GenomEUtwin: a strategy to identify genetic influences on health and disease.
Twin Res. 6, 354-360 (2003).
24. Shock, R.C., Greulich, R.C. & Andres, R.A. Normal Human Aging: The Baltimore
Longitudinal Study of Aging. NIH publication no. 84-2450, 45. Washington D.C., U.S.
Government Printing Office (1984).
25. The Wellcome Trust Case Control Consortium. Genome-wide association study of 14,000
cases of seven common diseases and 3,000 shared controls. Nature. 447, 661-678 (2007).
26. Barrett, J.C. & et al. Genome-wide association study and meta-analysis find that over 40 loci
affect risk of type 1 diabetes. Nat. Genet. 41, 703-707 (2009).
27. Fried, L.P. et al. The Cardiovascular Health Study: design and rationale. Ann. Epidemiol. 1,
263-276 (1991).
28. Firmann, M. et al. The CoLaus study: a population-based study to investigate the
epidemiology and genetic determinants of cardiovascular risk factors and metabolic syndrome.
BMC Cardiovasc. Disord. 8, 6 (2008).
29. Wichmann, H.E., Gieger, C. & Illig, T. KORA-gen—resource for population genetics,
controls and a broad spectrum of disease phenotypes. Gesundheitswesen. 67 Suppl 1, S26-S30
(2008).
30. Heid, I.M. et al. Association of the 103I MC4R allele with decreased body mass in 7937
participants of two population based surveys. J. Med. Genet. 42, e21 (2005).
doi: 10.1038/nature09270 SUPPLEMENTARY INFORMATION
www.nature.com/nature 28
31. Day, N. et al. EPIC-Norfolk: study design and characteristics of the cohort. European
Prospective Investigation of Cancer. Br. J. Cancer. 80, 95-103 (1999).
32. Harding, A.H. et al. Dietary fat and the risk of clinical type 2 diabetes: the European
Prospective Investigation of Cancer-Norfolk study. Am. J. Epidemiol. 159, 73-82 (2004).
33. Ferucci, L. et al. Subsystems contributing to the decline in ability to walk: bridging the gap
between epidemiology and geriatric practice in the InCHIANTI study. J. Am. Geriatr. Soc. 48,
1618-1625 (2000).
34. Bartali, B. et al. Changes in anthropometric measures in men and women across the life-
span: findings from the InCHIANTI study. Soz. Praventivmed. 47, 336-348 (2002).
35. Chambers, J.C. et al. Common genetic variation near MC4R is associated with waist
circumference and insulin resistance. Nat. Genet. 40, 716-718 (2008).
36. Vartiainen, E. et al. Thirty-five-year trends in cardiovascular risk factors in Finland. Int. J.
Epidemiol. 39, 504-518 (2010).
37. Rantakallio, P. Groups at risk in low birth weight infants and perinatal mortality. Acta Paed
Scand. 193 Suppl 193, 1-71 (1969).
38. Reiner, A.P. et al. Polymorphisms of the HNF1A gene encoding hepatocyte nuclear factor-1
alpha are associated with C-reactive protein. Am. J. Hum. Genet. 82, 1193-1201 (2008).
39. Hofman, A., Grobbee, D.E., de Jong, P.T., & van den Ouweland, F.A. Determinants of
disease and disability in the elderly: the Rotterdam Elderly Study. Eur. J. Epidemiol. 7, 403-22
(1991).
40. Hofman, A. et al. The Rotterdam Study: objectives and design update. Eur. J. Epidemiol. 22,
819-829 (2007).
41. Hercberg, S. et al. A primary prevention trial using nutritional doses of antioxidant vitamins
and minerals in cardiovascular diseases and cancers in a general population: the SU.VI.MAX
doi: 10.1038/nature09270 SUPPLEMENTARY INFORMATION
www.nature.com/nature 29

study--design, methods, and participant characteristics. SUpplementation en VItamines et
Minéraux AntioXydants. Control Clin. Trials. 19, 336-351 (1998).
42. Hercberg, S. et al. Background and rationale behind the SU.VI.MAX Study, a prevention
trial using nutritional doses of a combination of antioxidant vitamins and minerals to reduce
cardiovascular diseases and cancers. SUpplementation en VItamines et Minéraux AntioXydants
Study. Int. J. Vitam. Nutr. Res. 68, 3-20 (1998).
43. Ridker, P.M. et al. Rationale, design, and methodology of the Women’s Genome Health
Study: a genome-wide association study of more than 25,000 initially healthy American women.
Clin. Chem. 54, 249-55 (2008).
44. Caulfield, M. et al. Genome-wide mapping of human loci for essential hypertension. Lancet.
361, 2118-2123 (2003).
45. Diabetes Genetics Initiative of Broad Institute of Harvard and MIT, Lund University, and
Novartis Institutes of BioMedical Research et al. Genome-wide association analysis identifies
loci for type 2 diabetes and triglyceride levels. Science. 316, 1331-1336 (2007).
46. Groop, L. et al. Metabolic consequences of a family history of NIDDM (the Botnia study):
evidence for sex-specific parental effects. Diabetes. 45, 1585-93 (1996).
47. Arnett, D.K. et al. Angiotensinogen and angiotensin converting enzyme genotypes and
carotid atherosclerosis: the Atherosclerosis Risk in Communities and the NHLBI Family Heart
Studies. Atherosclerosis. 138, 111-116 (1998).
48. Valle, T. et al. Mapping genes for NIDDM. Design of the Finland-United States
Investigation of NIDDM Genetics (FUSION) Study. Diabetes Care. 21, 949-958 (1998).
49. Scott, L.J. et al. A genome-wide association study of type 2 diabetes in Finns detects
multiple susceptibility variants. Science. 316, 1341-1345 (2007).
50. Perttilä, J. et al. OSBPL10, a novel candidate gene for high triglyceride trait in dyslipidemic
Finnish subjects, regulates cellular lipid metabolism. J. Mol. Med. 87, 825-835 (2009).
doi: 10.1038/nature09270 SUPPLEMENTARY INFORMATION
www.nature.com/nature 30

51. Myocardial Infarction Genetics Consortium et al. Genome-wide association of early-onset
myocardial infarction with single nucleotide polymorphisms and copy number variants. Nat.
Genet. 41, 334-341 (2009).
52. Lehrke, M. et al. CXCL16 is a marker of inflammation, atherosclerosis, and acute coronary
syndromes in humans. J. Am. Coll. Cardiol. 49, 442-449 (2007).
53. Pardo, L.M., MacKay, I., Oostra, B., van Duijn, C.M. & Aulchenko, Y.S. The effect of
genetic drift in a young genetically isolated population. Ann. Hum. Genet. 69, 288-295 (2005).
54. Kannel, W.B. et al. III. Factors of risk in the development of coronary heart disease–six year
follow-up experience. The Framingham Study. Ann. Intern. Med. 55, 33-50 (1961).
55. Pattaro, C. et al. The genetic study of three population microisolates in South Tyrol
(MICROS): study design and epidemiological perspectives. BMC Med. Genet. 8, 29 (2007).
56. Pilia, G. et al. Heritability of cardiovascular and personality traits in 6,148 Sardinians. PLoS
Genet. 2, e132 (2006).
57. Rudan, I., Campbell, H. & Rudan, P. Genetic epidemiological studies of eastern Adriatic
Island isolates, Croatia: objective and strategies. Coll. Antropol. 23, 531-546 (1999).
58. Feranil, A., Gultiano, S. & Adair, L.S. The Cebu Longitudinal Health and Nutrition Survey:
two decades later. Asia Pac. Popul. J. 23, 39-54 (2008).
59. Lange, L.A. et al. Genome-wide association study of homocysteine levels in Filipinos
provides evidence for CPS1 in women and a stronger MTHFR effect in young adults. Submitted.
60. Cho, Y.S. et al. A large-scale genome-wide association study of Asian populations uncovers
genetic factors influencing eight quantitative traits. Nat. Genet. 41, 527-534 (2009).
61. Foong, A.W. et al. Rationale and methodology for a population-based study of eye diseases
in Malay people: the Singapore Malay Eye Study (SiMES). Ophthalmic Epidemiol. 14, 25-35
(2007).
doi: 10.1038/nature09270 SUPPLEMENTARY INFORMATION
www.nature.com/nature 31
62. Wong, T.Y. et al. Prevalence and causes of low vision and blindness in an urban Malay
population: the Singapore Malay Eye Study. Arch. Ophthalmol. 126, 1091-1099 (2008).
63. Nang, E.E. et al. Is there a clear threshold for fasting plasma glucose that differentiates
between those with and without neuropathy and chronic kidney disease?: the Singapore
Prospective Study Program. Am. J. Epidemiol. 169, 1454-1462 (2009).
64. Musunuru, K. et al. Candidate Gene Association Resource (CARe): design, methods, and
proof of concept. Circ. Cardiovasc. Genet., in the press.
65. Helgadottir, A. et al. A common variant on chromosome 9p21 affects the risk of myocardial
infarction. Science. 316, 1491-1493 (2007).
66. Berglund, G., Elmstahl, S., Janzon, L. & Larsson, S.A. The Malmo Diet and Cancer Study.
Design and feasibility. J. Intern. Med. 233, 45-51 (1993).
67. Vartiainen, E. et al. Cardiovascular risk factor changes in Finland, 1972–1997. Int. J.
Epidemiol. 29, 49-56 (2000).
68. Preuss, M. et al. Design of the Coronary ARtery DIsease Genome-wide Replication And
Meta-Analysis (CARDIoGRAM) Study—a genome-wide association meta-analysis involving
more than 22,000 cases and 60,000 controls. Submitted.
69. Soranzo, N. et al. A genome-wide meta-analysis identifies 22 loci associated with eight
hematological parameters in the HaemGen consortium. Nat. Genet. 41, 1182-1190 (2009).
70. Lehrke, M. et al. CXCL16 is a marker of inflammation, atherosclerosis, and acute coronary
syndromes in humans. J. Am. Coll. Cardiol. 49, 442-449 (2007).
71. Defesche, J.C. Familial hypercholesterolemia. In: Betteridge, D.J., ed. Lipids and Vascular
Disease: Current Issues. London: Martin Dunitz, 65-76 (2000).
doi: 10.1038/nature09270 SUPPLEMENTARY INFORMATION
www.nature.com/nature 32

72. Goldstein, J.L., Hobbs, H.H. & Brown, M.S. Familial hypercholesterolemia. In: Scriver,
C.R., Beaudet, A.L., Sly, W.S. & Valle, D., eds. The Metabolic and Molecular Basis of Inherited
Disease. New York: McGraw-Hill, 1981-2030 (1995).
73. Hegele, R.A. et al. A polygenic basis for four classical Fredrickson hyperlipoproteinemia
phenotypes that are characterized by hypertriglyceridemia. Hum. Mol. Genet. 18, 4189-4194
(2009).
74. Li, Y., Willer, C., Sanna, S. & Abecasis, G. Genotype imputation. Annu. Rev. Genomics
Hum. Genet. 10, 387-406 (2009).
75. Schadt, E. E. et al. Mapping the genetic architecture of gene expression in human liver. PLoS
Biol. 6, e107 (2008).
doi: 10.1038/nature09270 SUPPLEMENTARY INFORMATION
www.nature.com/nature 33

Supplementary Figure Legends
Supplementary Figure 1. Quantile-quantile plots for test statistics, with observed
association P-values plotted as a function of expected P-values. For each trait, the
same data is presented with two differing y-axis scales. Black line, all test statistics; blue
line, previously reported loci excluded; green line, genome-wide significant loci
confirmed or identified in this study excluded.
Supplementary Figure 2. Sex-specific effect of rs1562398 on plasma TG levels.
Regional plots of the KLF14 locus. Purple diamonds indicate rs1562398, which in
women has the strongest association evidence in the locus. Each circle indicates a SNP
with the color of the circle indicating the linkage disequilibrium (r2) between that SNP
and rs1562398. Blue lines indicate estimated recombination rates in HapMap. The
bottom panels show the relative position and the transcribed strand of each gene in the
locus.
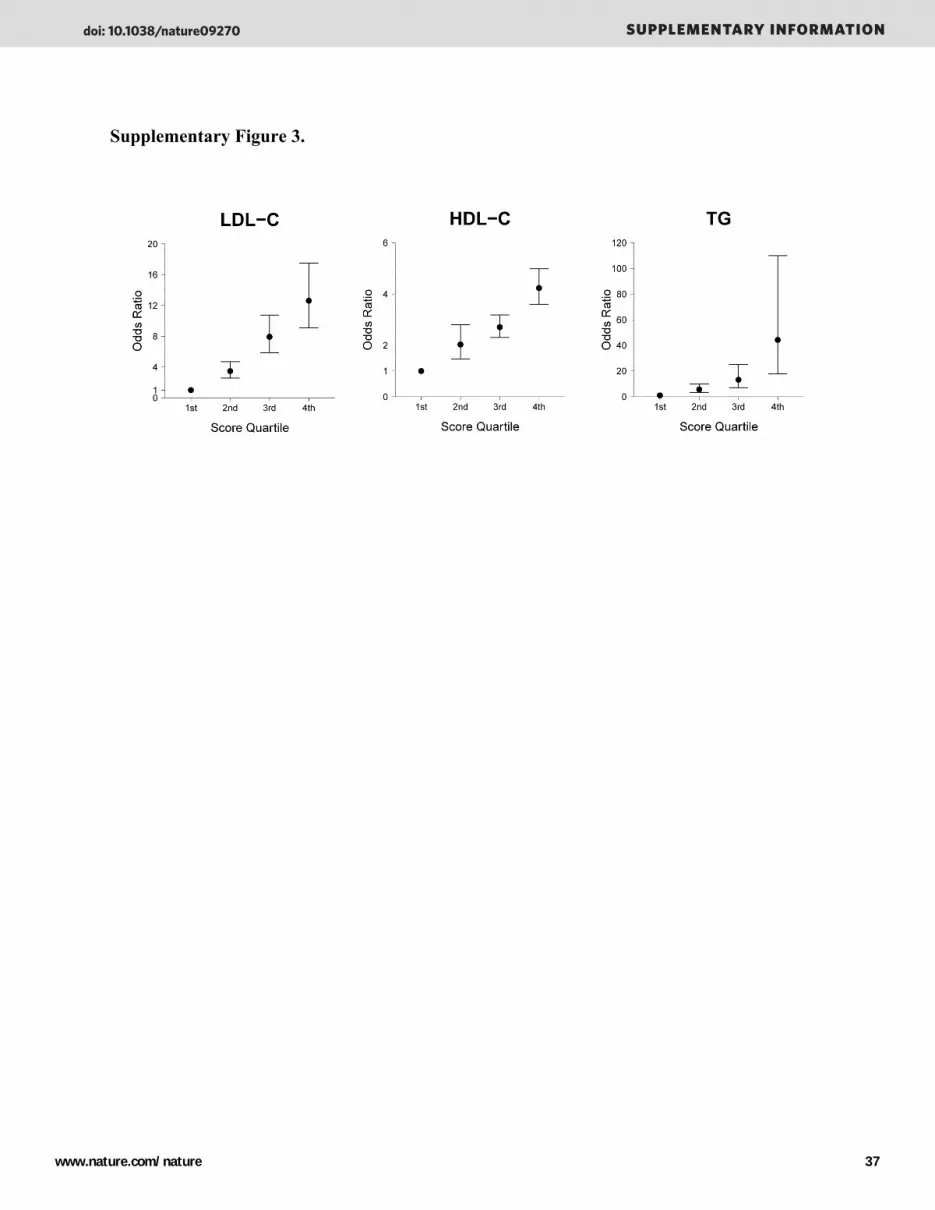
Supplementary Figure 3. Analysis of genotype scores in patients with extreme
lipid levels. Genotype scores were calculated for LDL-C, HDL-C, and TG in each case
(high lipid level) or control (low lipid level) individual. For each analysis, individuals were
stratified into quartiles of the genotype score. Quartile 1 (Q1) is the reference quartile,
originating from the lowest scores. Shown are odds ratios for case status for each
quartile in comparison to Q1. Bars indicate 95% confidence intervals.
doi: 10.1038/nature09270 SUPPLEMENTARY INFORMATION
www.nature.com/nature 34

Supplementary Figure 1.
doi: 10.1038/nature09270 SUPPLEMENTARY INFORMATION
www.nature.com/nature 35

Supplementary Figure 2.
doi: 10.1038/nature09270 SUPPLEMENTARY INFORMATION
www.nature.com/nature 36
Supplementary Figure 3.
doi: 10.1038/nature09270 SUPPLEMENTARY INFORMATION
www.nature.com/nature 37
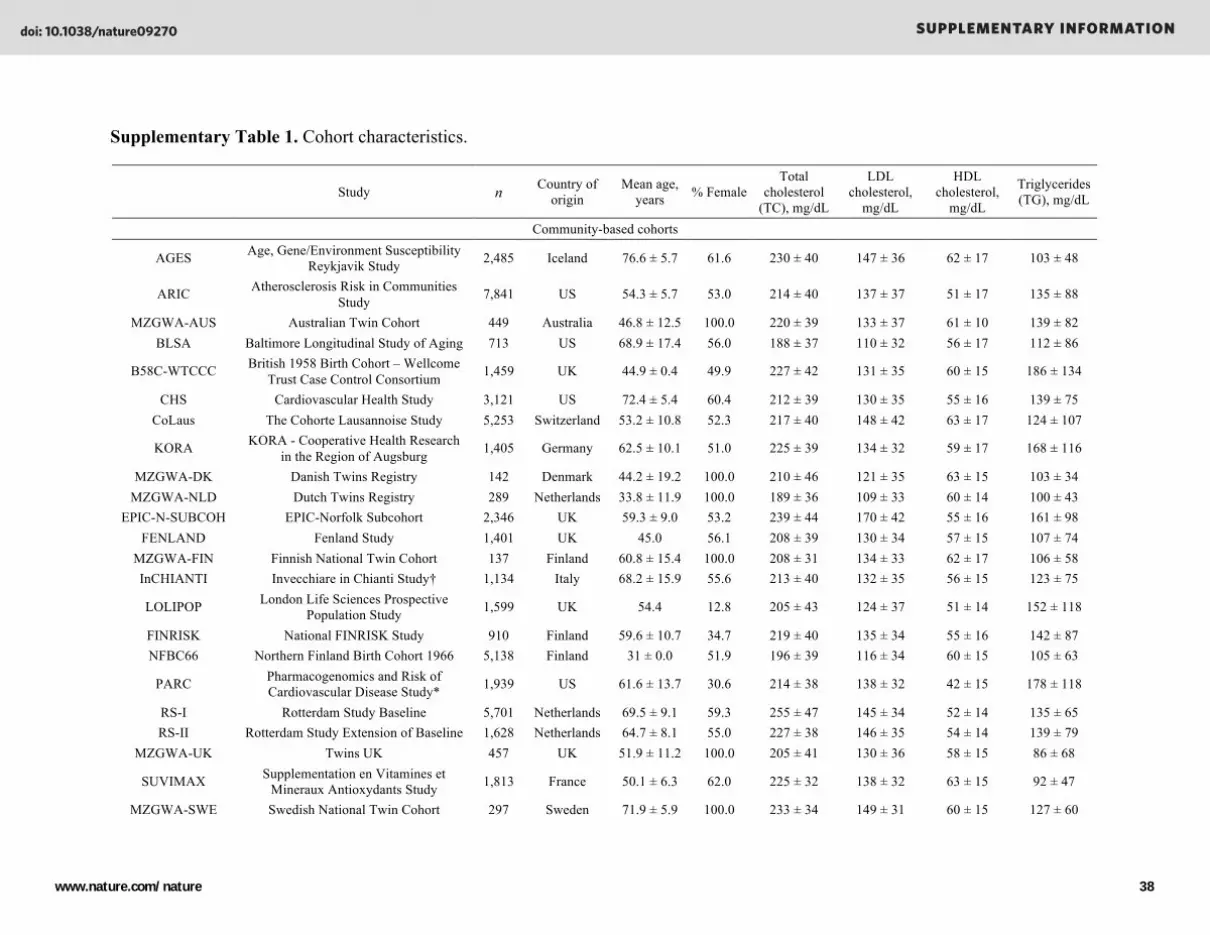
Supplementary Table 1. Cohort characteristics.
Study n Country of origin
Mean age, years % Female
Total cholesterol
(TC), mg/dL
LDL cholesterol,
mg/dL
HDL cholesterol,
mg/dL
Triglycerides (TG), mg/dL
Community-based cohorts
AGES Age, Gene/Environment Susceptibility Reykjavik Study 2,485 Iceland 76.6 ± 5.7 61.6 230 ± 40 147 ± 36 62 ± 17 103 ± 48
ARIC Atherosclerosis Risk in Communities Study 7,841 US 54.3 ± 5.7 53.0 214 ± 40 137 ± 37 51 ± 17 135 ± 88
MZGWA-AUS Australian Twin Cohort 449 Australia 46.8 ± 12.5 100.0 220 ± 39 133 ± 37 61 ± 10 139 ± 82 BLSA Baltimore Longitudinal Study of Aging 713 US 68.9 ± 17.4 56.0 188 ± 37 110 ± 32 56 ± 17 112 ± 86
B58C-WTCCC British 1958 Birth Cohort – Wellcome Trust Case Control Consortium 1,459 UK 44.9 ± 0.4 49.9 227 ± 42 131 ± 35 60 ± 15 186 ± 134
CHS Cardiovascular Health Study 3,121 US 72.4 ± 5.4 60.4 212 ± 39 130 ± 35 55 ± 16 139 ± 75 CoLaus The Cohorte Lausannoise Study 5,253 Switzerland 53.2 ± 10.8 52.3 217 ± 40 148 ± 42 63 ± 17 124 ± 107
KORA KORA - Cooperative Health Research in the Region of Augsburg 1,405 Germany 62.5 ± 10.1 51.0 225 ± 39 134 ± 32 59 ± 17 168 ± 116
MZGWA-DK Danish Twins Registry 142 Denmark 44.2 ± 19.2 100.0 210 ± 46 121 ± 35 63 ± 15 103 ± 34 MZGWA-NLD Dutch Twins Registry 289 Netherlands 33.8 ± 11.9 100.0 189 ± 36 109 ± 33 60 ± 14 100 ± 43
EPIC-N-SUBCOH EPIC-Norfolk Subcohort 2,346 UK 59.3 ± 9.0 53.2 239 ± 44 170 ± 42 55 ± 16 161 ± 98 FENLAND Fenland Study 1,401 UK 45.0 56.1 208 ± 39 130 ± 34 57 ± 15 107 ± 74
MZGWA-FIN Finnish National Twin Cohort 137 Finland 60.8 ± 15.4 100.0 208 ± 31 134 ± 33 62 ± 17 106 ± 58 InCHIANTI Invecchiare in Chianti Study† 1,134 Italy 68.2 ± 15.9 55.6 213 ± 40 132 ± 35 56 ± 15 123 ± 75
LOLIPOP London Life Sciences Prospective Population Study 1,599 UK 54.4 12.8 205 ± 43 124 ± 37 51 ± 14 152 ± 118
FINRISK National FINRISK Study 910 Finland 59.6 ± 10.7 34.7 219 ± 40 135 ± 34 55 ± 16 142 ± 87 NFBC66 Northern Finland Birth Cohort 1966 5,138 Finland 31 ± 0.0 51.9 196 ± 39 116 ± 34 60 ± 15 105 ± 63
PARC Pharmacogenomics and Risk of Cardiovascular Disease Study* 1,939 US 61.6 ± 13.7 30.6 214 ± 38 138 ± 32 42 ± 15 178 ± 118
RS-I Rotterdam Study Baseline 5,701 Netherlands 69.5 ± 9.1 59.3 255 ± 47 145 ± 34 52 ± 14 135 ± 65 RS-II Rotterdam Study Extension of Baseline 1,628 Netherlands 64.7 ± 8.1 55.0 227 ± 38 146 ± 35 54 ± 14 139 ± 79
MZGWA-UK Twins UK 457 UK 51.9 ± 11.2 100.0 205 ± 41 130 ± 36 58 ± 15 86 ± 68
SUVIMAX Supplementation en Vitamines et Mineraux Antioxydants Study 1,813 France 50.1 ± 6.3 62.0 225 ± 32 138 ± 32 63 ± 15 92 ± 47
MZGWA-SWE Swedish National Twin Cohort 297 Sweden 71.9 ± 5.9 100.0 233 ± 34 149 ± 31 60 ± 15 127 ± 60
doi: 10.1038/nature09270 SUPPLEMENTARY INFORMATION
www.nature.com/nature 38
WGHS Women’s Genome Health Study* 22,041 US 54.6 ± 7.1 100.0 211 ± 41 124 ± 34 54 ± 15 142 ± 89 Case-control samples
BRIGHT British Genetics of Hypertension Study Cases 1,615 UK 56.4 ± 11.3 61.5 216 ± 40 148 ± 37 52 ± 15 191 ± 134
B58C-T1DGC British 1958 Birth Cohort T1D Controls 2,534 UK 45.3 ± 0.3 51.3 228 ± 42 132 ± 35 60 ± 15 186 ± 153
DGI Diabetes Genetics Initiative T2D Cases† 1,528 Finland, Sweden 64.3 ± 10.5 49.7 224 ± 46 146 ± 40 45 ± 12 175 ± 124
DGI Diabetes Genetics Initiative Controls† 1,508 Finland, Sweden 58.8 ± 10.4 51.5 229 ± 42 155 ± 39 51 ± 13 118 ± 61
EPIC-N-OBSET EPIC-Norfolk Obese Cases 1,078 UK 59.3 ± 8.8 56.9 246 ± 44 179 ± 41 49 ± 15 205 ± 110 FHS Family Heart Study CHD Cases 356 US 55.1 ± 11.6 54.5 213 ± 43 132 ± 38 49 ± 13 158 ± 77 FHS Family Heart Study Controls 394 US 54.9 ± 11.1 50.3 202 ± 36 123 ± 32 52 ± 16 134 ± 68
FUSION Finland-United States Investigation of NIDDM Genetics T2D Cases 772 Finland 62.7 ± 7.7 41.2 221 ± 44 140 ± 38 47 ± 13 180 ± 114
FUSION Finland-United States Investigation of NIDDM Genetics T2D Controls 982 Finland 63.1 ± 7.5 49.2 227 ± 38 146 ± 35 58 ± 16 120 ± 59
GENMETS Health2000 GenMets MS Cases 867 Finland 49.9 ± 11.1 51.2 240 ± 45 153 ± 42 45 ± 12 187 ± 103 GENMETS Health2000 GenMets Controls 892 Finland 49.9 ± 11.0 51.2 228 ± 38 141 ± 37 57 ± 14 109 ± 51 MedSTAR MedSTAR MI Cases 716 US 54.7 ± 7.3 28.2 170 ± 44 101 ± 39 43 ± 16 155 ± 110 MedSTAR MedSTAR Controls 393 US 59.7 ± 8.9 48.8 180 ± 39 106 ± 33 50 ± 16 127 ± 79 PennCATH PennCATH MI Cases 892 US 56.9 ± 9.2 24.3 179 ± 43 107 ± 9 42 ± 11 179 ± 43 PennCATH PennCATH Controls 454 US 61.7 ± 9.5 51.7 179 ± 39 108 ± 32 49 ± 15 114 ± 83
Family-based samples ERF Erasmus Rucphen Family Study 1,108 Netherlands 47.1 ± 14.7 60.8 219 ± 43 148 ± 38 50 ± 14 115 ± 68
FramHS Framingham Heart Study 7,132 US 44.8 ± 10.6 54.0 198 ± 36 122 ± 33 53 ± 15 117 ± 84
MICROS MICROS Study of Population Microisolates in South Tyrol 1,037 Austria 44.4 ± 15.8 56.5 227 ± 47 137 ± 43 65 ± 14 125 ± 90
NSPHS Northern Swedish Population Health Study 593 Sweden 44.8 ± 20.4 54.0 228 ± 52 138 ± 42 62 ± 16 192 ± 138
ORCADES Orkney Complex Disease Study 633 UK 51.9 ± 16.7 54.5 227 ± 43 141 ± 41 66 ± 15 115 ± 58 SardiNIA SardiNIA Study of Aging 4,184 Italy 43.6 ± 17.6 56.0 208 ± 31 127 ± 29 64 ± 15 86 ± 54
Vis Vis Study 771 Croatia 56.5 ± 15.4 58.0 197 ± 39 125 ± 37 43 ± 6 151 ± 82
* PARC is a pharmacogenetic genetic study; WGHS is a prospective clinical trial
† The DGI and InCHIANTI studies each included a small number of related individuals.
doi: 10.1038/nature09270 SUPPLEMENTARY INFORMATION
www.nature.com/nature 39

Supplementary Table 2. Findings of the primary meta-analysis.
Nearby genes* Lead SNP Trait Best SNP Chr Position† n Major allele, minor allele
(MAF)‡
Effect size (SE) mg/dL§ P-value
Previous GWAS finding?
LDLRAP1 rs12027135 TC rs12027135 1 25,648,320 100,184 T, A (0.47) -1.22 (0.19) 4.12 × 10⁻¹¹ Y LDL rs12027135 1 25,648,320 95,454 T, A (0.47) -1.10 (0.18) 1.24 × 10⁻¹⁰ N
PABPC4 rs4660293 HDL rs4660293 1 39,800,767 99,855 A, G (0.23) -0.48 (0.09) 3.99 × 10⁻¹⁰ N PCSK9 rs2479409 TC rs2479409 1 55,277,238 100,164 A, G (0.30) 1.96 (0.24) 3.84 × 10⁻²⁴ N
LDL rs2479409 1 55,277,238 95,435 A, G (0.30) 2.01 (0.22) 1.93 × 10⁻²⁸ Y ANGPTL3 rs2131925 TC rs3850634 1 62,823,186 97,148 T, G (0.32) -2.60 (0.20) 4.90 × 10-41 Y
LDL rs3850634 1 62,823,186 92,503 T, G (0.32) -1.59 (0.19) 2.63 × 10⁻¹⁸ N TG rs2131925 1 62,798,530 96,598 T, G (0.32) -4.94 (0.40) 8.84 × 10-43 Y
EVI5 rs7515577 TC rs7515577 1 92,782,026 100,165 A, C (0.21) -1.18 (0.24) 2.78 × 10-08 N SORT1 rs629301 TC rs629301 1 109,619,829 100,184 T, G (0.22) -5.41 (0.24) 5.77 × 10-131 Y
LDL rs629301 1 109,619,829 95,454 T, G (0.22) -5.65 (0.21) 9.70 × 10-171 Y ZNF648 rs1689800 HDL rs1689800 1 180,435,508 99,900 A, G (0.35) -0.47 (0.08) 3.18 × 10⁻¹⁰ N MOSC1 rs2642442 TC rs2807834 1 219,037,216 100,098 G, T (0.32) -1.38 (0.22) 4.90 × 10⁻¹³ N
LDL rs2807834 1 219,037,216 95,372 G, T (0.32) -1.09 (0.20) 5.62 × 10⁻¹¹ N GALNT2 rs4846914 HDL rs4846914 1 228,362,314 99,881 A, G (0.40) -0.61 (0.07) 3.66 × 10⁻²¹ Y
TG rs1321257 1 228,371,935 92,418 A, G (0.39) 2.76 (0.38) 2.09 × 10⁻¹⁴ Y IRF2BP2 rs514230 TC rs514230 1 232,925,220 100,184 T, A (0.48) -1.36 (0.20) 5.37 × 10⁻¹⁴ N
LDL rs514230 1 232,925,220 95,454 T, A (0.48) -1.13 (0.18) 9.38 × 10⁻¹² N APOB rs1367117 TC rs1367117 2 21,117,405 100,176 G, A (0.30) 4.16 (0.22) 4.08 × 10-96 Y
LDL rs1367117 2 21,117,405 95,446 G, A (0.30) 4.05 (0.19) 4.48 × 10-114 Y rs1042034 HDL rs1042034 2 21,078,786 99,892 T, C (0.22) 0.90 (0.09) 1.22 × 10⁻³⁰ Y TG rs1042034 2 21,078,786 96,590 T, C (0.22) -5.99 (0.45) 1.36 × 10-45 Y
GCKR rs1260326 TC rs1260326 2 27,584,444 100,176 C, T (0.41) 1.91 (0.19) 7.31 × 10⁻²⁷ N TG rs1260326 2 27,584,444 96,590 C, T (0.41) 8.76 (0.40) 5.68 × 10-133 Y
ABCG5/8 rs4299376 TC rs4299376 2 43,926,080 95,992 T, G (0.30) 3.01 (0.22) 4.03 × 10-45 Y LDL rs4299376 2 43,926,080 91,285 T, G (0.30) 2.75 (0.20) 1.73 × 10-47 Y
RAB3GAP1 rs7570971 TC rs6759321 2 136,039,146 95,242 G, T (0.31) 1.18 (0.22) 1.39 × 10-08 N COBLL1 rs12328675 HDL rs12328675 2 165,249,046 99,892 T, C (0.13) 0.68 (0.12) 2.72 × 10⁻¹⁰ Y
rs10195252 TG rs10195252 2 165,221,337 96,590 T, C (0.40) -2.01 (0.38) 1.63 × 10⁻¹⁰ N IRS1 rs2972146 HDL rs1515100 2 226,837,161 96,875 A, C (0.37) 0.46 (0.08) 2.01 × 10-09 N
doi: 10.1038/nature09270 SUPPLEMENTARY INFORMATION
www.nature.com/nature 40

IRS1 TG rs2943645 2 226,807,424 93,554 T, C (0.37) -1.89 (0.38) 2.35 × 10-08 N RAF1 rs2290159 TC rs2290159 3 12,603,920 99,434 G, C (0.22) -1.42 (0.23) 4.21 × 10-09 N
MSL2L1 rs645040 TG rs645040 3 137,409,312 96,597 T, G (0.22) -2.22 (0.45) 2.52 × 10-08 N KLHL8 rs442177 TG rs442177 4 88,249,285 96,598 T, G (0.41) -2.25 (0.38) 8.65 × 10⁻¹² N
SLC39A8 rs13107325 HDL rs13107325 4 103,407,732 92,059 C, T (0.07) -0.84 (0.16) 7.20 × 10⁻¹¹ N ARL15 rs6450176 HDL rs6450176 5 53,333,782 99,900 G, A (0.26) -0.49 (0.09) 4.98 × 10-08 N
MAP3K1 rs9686661 TG rs9686661 5 55,897,543 95,848 C, T (0.20) 2.57 (0.49) 1.32 × 10⁻¹⁰ N HMGCR rs12916 TC rs12916 5 74,692,295 100,184 T, C (0.39) 2.84 (0.20) 8.79 × 10-47 Y
LDL rs12916 5 74,692,295 95,454 T, C (0.39) 2.45 (0.18) 5.12 × 10-45 Y TIMD4 rs6882076 TC rs6882076 5 156,322,875 100,184 C, T (0.35) -1.98 (0.20) 7.46 × 10⁻²⁸ N
LDL rs6882076 5 156,322,875 95,454 C, T (0.35) -1.67 (0.19) 1.89 × 10⁻²² Y TG rs1553318 5 156,411,901 96,598 C, G (0.36) -2.63 (0.39) 3.68 × 10⁻¹² N
MYLIP rs3757354 TC rs3757354 6 16,235,386 96,000 C, T (0.22) -1.46 (0.24) 2.78 × 10-09 N LDL rs3757354 6 16,235,386 91,293 C, T (0.22) -1.43 (0.21) 1.16 × 10⁻¹¹ N
HFE rs1800562 TC rs1800562 6 26,201,120 98,550 G, A (0.06) -2.16 (0.43) 2.49 × 10-08 N LDL rs1800562 6 26,201,120 93,821 G, A (0.06) -2.22 (0.39) 6.07 × 10⁻¹⁰ N
HLA rs3177928 TC rs3177928 6 32,520,413 100,151 G, A (0.16) 2.31 (0.27) 3.96 × 10⁻¹⁹ N LDL rs3177928 6 32,520,413 95,425 G, A (0.16) 1.83 (0.24) 2.40 × 10⁻¹⁵ N rs2247056 TG rs2247056 6 31,373,469 96,598 C, T (0.25) -2.99 (0.42) 1.60 × 10⁻¹⁵ Y
C6orf106 rs2814982 TC rs2814982 6 34,654,538 100,184 C, T (0.11) -1.86 (0.33) 4.68 × 10⁻¹¹ N rs2814944 HDL rs2814944 6 34,660,775 99,811 G, A (0.16) -0.49 (0.10) 3.81 × 10-09 N
FRK rs9488822 TC rs9488822 6 116,419,586 100,184 A, T (0.35) -1.18 (0.20) 1.69 × 10⁻¹⁰ N LDL rs11153594 6 116,461,284 95,367 C, T (0.41) -0.89 (0.18) 2.95 × 10⁻⁹ N
CITED2 rs605066 HDL rs605066 6 139,871,359 99,900 T, C (0.42) -0.39 (0.08) 2.55 × 10-08 N LPA rs1564348 TC rs1564348 6 160,498,850 100,168 T, C (0.17) 2.18 (0.27) 9.71 × 10⁻¹⁷ N
LDL rs1564348 6 160,498,850 95,439 T, C (0.17) 1.95 (0.24) 1.70 × 10⁻¹⁷ N rs1084651 HDL rs1084651 6 161,009,807 99,900 G, A (0.16) -0.56 (0.10) 2.97 × 10-08 N
DNAH11 rs12670798 TC rs2285942 7 21,549,442 100,184 C, T (0.15) 1.70 (0.28) 6.55 × 10⁻¹⁰ N LDL rs12670798 7 21,573,877 95,454 T, C (0.23) 1.26 (0.20) 6.88 × 10⁻¹⁰ Y
NPC1L1 rs2072183 TC rs2072183 7 44,545,705 97,063 G, C (0.25) 2.01 (0.29) 3.22 × 10⁻¹¹ N LDL rs217386 7 44,567,220 95,454 G, A (0.43) -1.17 (0.19) 4.25 × 10⁻¹¹ N
TYW1B rs13238203 TG rs13238203 7 71,767,603 78,797 C, T (0.04) -7.91 (1.34) 1.13 × 10-09 N MLXIPL rs17145738 HDL rs17145738 7 72,620,810 99,898 C, T (0.12) 0.57 (0.12) 1.19 × 10-09 N
TG rs7811265 7 72,572,446 96,598 A, G (0.19) -7.91 (0.50) 9.06 × 10-59 Y KLF14 rs4731702 HDL rs4731702 7 130,083,924 99,900 C, T (0.48) 0.59 (0.07) 1.21 × 10⁻¹⁵ N
PPP1R3B rs9987289 TC rs2126259 8 9,222,556 100,184 C, T (0.10) -3.14 (0.32) 8.98 × 10⁻²⁴ N
doi: 10.1038/nature09270 SUPPLEMENTARY INFORMATION
www.nature.com/nature 41
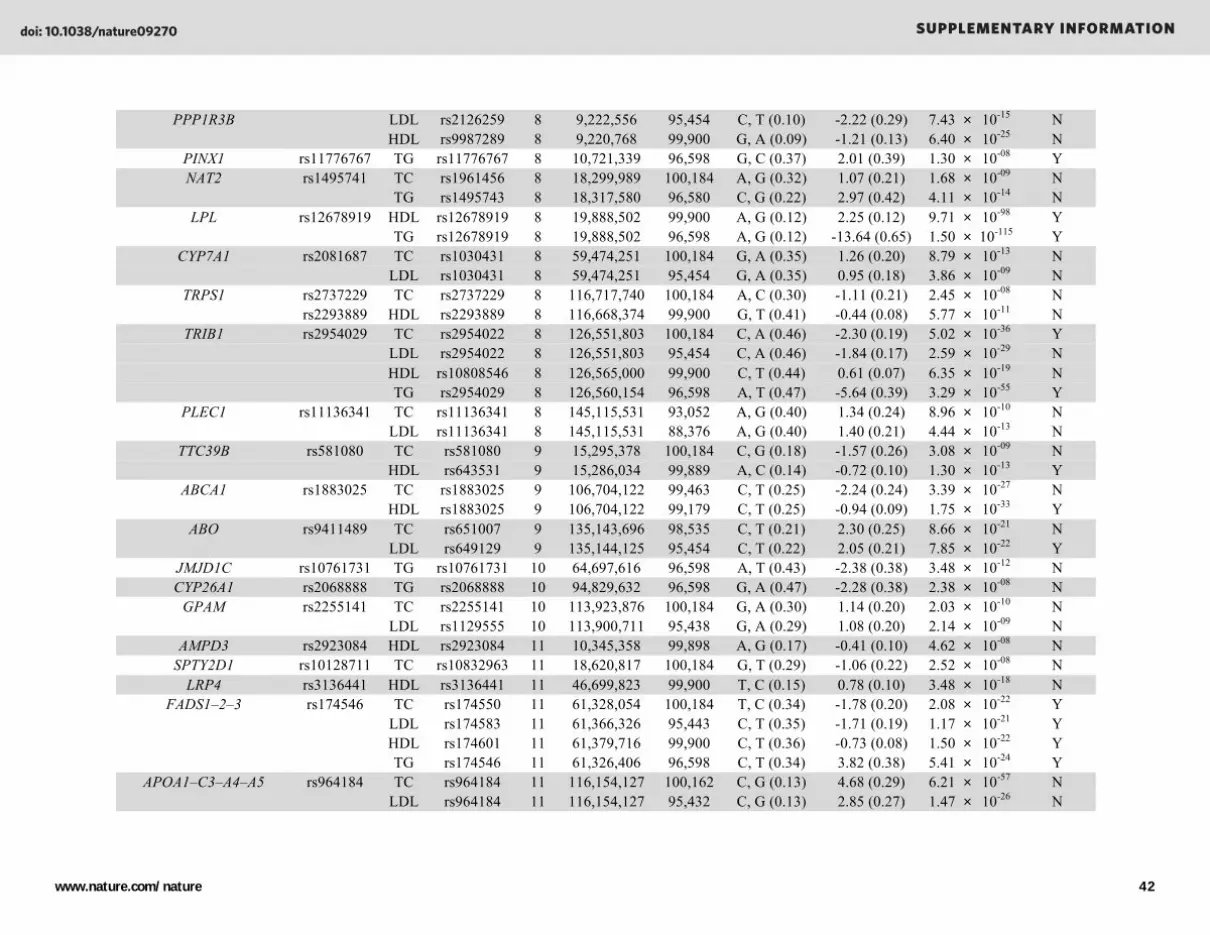
PPP1R3B LDL rs2126259 8 9,222,556 95,454 C, T (0.10) -2.22 (0.29) 7.43 × 10⁻¹⁵ N HDL rs9987289 8 9,220,768 99,900 G, A (0.09) -1.21 (0.13) 6.40 × 10⁻²⁵ N
PINX1 rs11776767 TG rs11776767 8 10,721,339 96,598 G, C (0.37) 2.01 (0.39) 1.30 × 10-08 Y NAT2 rs1495741 TC rs1961456 8 18,299,989 100,184 A, G (0.32) 1.07 (0.21) 1.68 × 10-09 N
TG rs1495743 8 18,317,580 96,580 C, G (0.22) 2.97 (0.42) 4.11 × 10⁻¹⁴ N LPL rs12678919 HDL rs12678919 8 19,888,502 99,900 A, G (0.12) 2.25 (0.12) 9.71 × 10-98 Y
TG rs12678919 8 19,888,502 96,598 A, G (0.12) -13.64 (0.65) 1.50 × 10-115 Y CYP7A1 rs2081687 TC rs1030431 8 59,474,251 100,184 G, A (0.35) 1.26 (0.20) 8.79 × 10⁻¹³ N
LDL rs1030431 8 59,474,251 95,454 G, A (0.35) 0.95 (0.18) 3.86 × 10-09 N TRPS1 rs2737229 TC rs2737229 8 116,717,740 100,184 A, C (0.30) -1.11 (0.21) 2.45 × 10-08 N
rs2293889 HDL rs2293889 8 116,668,374 99,900 G, T (0.41) -0.44 (0.08) 5.77 × 10⁻¹¹ N TRIB1 rs2954029 TC rs2954022 8 126,551,803 100,184 C, A (0.46) -2.30 (0.19) 5.02 × 10-36 Y
LDL rs2954022 8 126,551,803 95,454 C, A (0.46) -1.84 (0.17) 2.59 × 10⁻²⁹ N HDL rs10808546 8 126,565,000 99,900 C, T (0.44) 0.61 (0.07) 6.35 × 10⁻¹⁹ N TG rs2954029 8 126,560,154 96,598 A, T (0.47) -5.64 (0.39) 3.29 × 10-55 Y
PLEC1 rs11136341 TC rs11136341 8 145,115,531 93,052 A, G (0.40) 1.34 (0.24) 8.96 × 10⁻¹⁰ N LDL rs11136341 8 145,115,531 88,376 A, G (0.40) 1.40 (0.21) 4.44 × 10⁻¹³ N
TTC39B rs581080 TC rs581080 9 15,295,378 100,184 C, G (0.18) -1.57 (0.26) 3.08 × 10-09 N HDL rs643531 9 15,286,034 99,889 A, C (0.14) -0.72 (0.10) 1.30 × 10⁻¹³ Y
ABCA1 rs1883025 TC rs1883025 9 106,704,122 99,463 C, T (0.25) -2.24 (0.24) 3.39 × 10⁻²⁷ N HDL rs1883025 9 106,704,122 99,179 C, T (0.25) -0.94 (0.09) 1.75 × 10⁻³³ Y
ABO rs9411489 TC rs651007 9 135,143,696 98,535 C, T (0.21) 2.30 (0.25) 8.66 × 10⁻²¹ N LDL rs649129 9 135,144,125 95,454 C, T (0.22) 2.05 (0.21) 7.85 × 10⁻²² Y
JMJD1C rs10761731 TG rs10761731 10 64,697,616 96,598 A, T (0.43) -2.38 (0.38) 3.48 × 10⁻¹² N CYP26A1 rs2068888 TG rs2068888 10 94,829,632 96,598 G, A (0.47) -2.28 (0.38) 2.38 × 10-08 N
GPAM rs2255141 TC rs2255141 10 113,923,876 100,184 G, A (0.30) 1.14 (0.20) 2.03 × 10⁻¹⁰ N LDL rs1129555 10 113,900,711 95,438 G, A (0.29) 1.08 (0.20) 2.14 × 10-09 N
AMPD3 rs2923084 HDL rs2923084 11 10,345,358 99,898 A, G (0.17) -0.41 (0.10) 4.62 × 10-08 N SPTY2D1 rs10128711 TC rs10832963 11 18,620,817 100,184 G, T (0.29) -1.06 (0.22) 2.52 × 10-08 N
LRP4 rs3136441 HDL rs3136441 11 46,699,823 99,900 T, C (0.15) 0.78 (0.10) 3.48 × 10⁻¹⁸ N FADS1–2–3 rs174546 TC rs174550 11 61,328,054 100,184 T, C (0.34) -1.78 (0.20) 2.08 × 10⁻²² Y
LDL rs174583 11 61,366,326 95,443 C, T (0.35) -1.71 (0.19) 1.17 × 10⁻²¹ Y HDL rs174601 11 61,379,716 99,900 C, T (0.36) -0.73 (0.08) 1.50 × 10⁻²² Y TG rs174546 11 61,326,406 96,598 C, T (0.34) 3.82 (0.38) 5.41 × 10⁻²⁴ Y
APOA1–C3–A4–A5 rs964184 TC rs964184 11 116,154,127 100,162 C, G (0.13) 4.68 (0.29) 6.21 × 10-57 N LDL rs964184 11 116,154,127 95,432 C, G (0.13) 2.85 (0.27) 1.47 × 10⁻²⁶ N
doi: 10.1038/nature09270 SUPPLEMENTARY INFORMATION
www.nature.com/nature 42

APOA1–C3–A4–A5 HDL rs964184 11 116,154,127 99,878 C, G (0.13) -1.50 (0.11) 5.21 × 10-47 Y TG rs964184 11 116,154,127 96,576 C, G (0.13) 16.95 (0.48) 6.71 × 10-240 Y
UBASH3B rs7941030 TC rs7941030 11 122,027,585 100,184 T, C (0.38) 0.97 (0.19) 1.52 × 10⁻¹⁰ N HDL rs7115089 11 122,035,801 99,900 C, G (0.37) 0.31 (0.08) 2.66 × 10-08 N
ST3GAL4 rs11220462 TC rs11220463 11 125,753,421 100,184 A, T (0.11) 2.01 (0.33) 2.12 × 10⁻¹¹ N LDL rs11220462 11 125,749,162 95,454 G, A (0.14) 1.95 (0.26) 1.20 × 10⁻¹⁵ N
PDE3A rs7134375 HDL rs7134375 12 20,365,025 99,900 C, A (0.42) 0.40 (0.08) 3.84 × 10-08 N LRP1 rs11613352 HDL rs3741414 12 56,130,316 99,900 C, T (0.24) 0.46 (0.09) 1.64 × 10-08 N
TG rs11613352 12 56,078,847 96,598 C, T (0.23) -2.70 (0.43) 4.43 × 10⁻¹⁰ N MVK rs7134594 HDL rs7134594 12 108,484,576 99,900 T, C (0.47) -0.44 (0.07) 6.88 × 10⁻¹⁵ Y BRAP rs11065987 TC rs11065987 12 110,556,807 100,184 A, G (0.42) -0.96 (0.20) 6.77 × 10⁻¹² N
LDL rs11065987 12 110,556,807 95,454 A, G (0.42) -0.97 (0.18) 1.51 × 10-09 N HNF1A rs1169288 TC rs1169288 12 119,901,033 100,184 A, C (0.33) 1.45 (0.20) 1.48 × 10⁻¹⁴ N
LDL rs1169288 12 119,901,033 95,454 A, C (0.33) 1.42 (0.19) 1.13 × 10⁻¹⁵ Y SBNO1 rs4759375 HDL rs4759375 12 122,362,191 99,900 C, T (0.06) 0.86 (0.16) 7.50 × 10-09 N ZNF664 rs4765127 HDL rs4765127 12 123,026,120 99,787 G, T (0.34) 0.44 (0.08) 2.89 × 10⁻¹⁰ N
TG rs12310367 12 123,052,631 96,598 A, G (0.34) -2.42 (0.41) 1.21 × 10-08 Y SCARB1 rs838880 HDL rs838880 12 123,827,546 80,428 T, C (0.31) 0.61 (0.09) 2.58 × 10⁻¹⁴ N NYNRIN rs8017377 LDL rs2332328 14 23,952,898 95,454 C, T (0.48) 1.17 (0.19) 4.41 × 10⁻¹¹ N CAPN3 rs2412710 TG rs2412710 15 40,471,079 86,707 G, A (0.02) 7.00 (1.49) 1.87 × 10-08 N FRMD5 rs2929282 TG rs2929282 15 42,033,223 95,070 A, T (0.05) 5.13 (0.86) 1.63 × 10⁻¹¹ N
LIPC rs1532085 TC rs1532085 15 56,470,658 98,656 G, A (0.39) 1.54 (0.20) 8.83 × 10⁻²⁰ N HDL rs1532085 15 56,470,658 98,409 G, A (0.39) 1.45 (0.08) 2.92 × 10-96 Y TG rs261342 15 56,518,445 95,070 C, G (0.22) 2.99 (0.45) 2.42 × 10⁻¹³ N
LACTB rs2652834 HDL rs2652834 15 61,183,920 98,409 G, A (0.20) -0.39 (0.10) 8.75 × 10-09 N CTF1 rs11649653 TG rs11649653 16 30,825,988 95,034 C, G (0.40) -2.13 (0.39) 3.35 × 10-08 N CETP rs3764261 TC rs3764261 16 55,550,825 94,472 C, A (0.32) 1.67 (0.23) 6.67 × 10⁻¹⁴ N
LDL rs247616 16 55,547,091 89,838 C, T (0.32) -1.45 (0.20) 9.25 × 10⁻¹³ N HDL rs3764261 16 55,550,825 94,225 C, A (0.32) 3.39 (0.09) 7.10 × 10-380 Y TG rs7205804 16 55,562,390 95,070 G, A (0.45) -2.88 (0.38) 1.15 × 10⁻¹² Y
LCAT rs16942887 HDL rs16942887 16 66,485,543 98,409 G, A (0.12) 1.27 (0.11) 8.39 × 10⁻³³ Y HPR rs2000999 TC rs2000999 16 70,665,594 98,656 G, A (0.20) 2.34 (0.24) 3.22 × 10⁻²⁴ N
LDL rs2000999 16 70,665,594 93,999 G, A (0.20) 2.00 (0.22) 1.75 × 10⁻²² N CMIP rs2925979 HDL rs2925979 16 80,092,291 98,409 C, T (0.30) -0.45 (0.08) 2.09 × 10⁻¹¹ N
STARD3 rs11869286 HDL rs881844 17 35,063,744 98,409 G, C (0.34) -0.51 (0.08) 2.84 × 10⁻¹⁴ N OSBPL7 rs7206971 TC rs7206971 17 42,780,114 90,614 G, A (0.49) 1.01 (0.20) 1.05 × 10-08 N
doi: 10.1038/nature09270 SUPPLEMENTARY INFORMATION
www.nature.com/nature 43
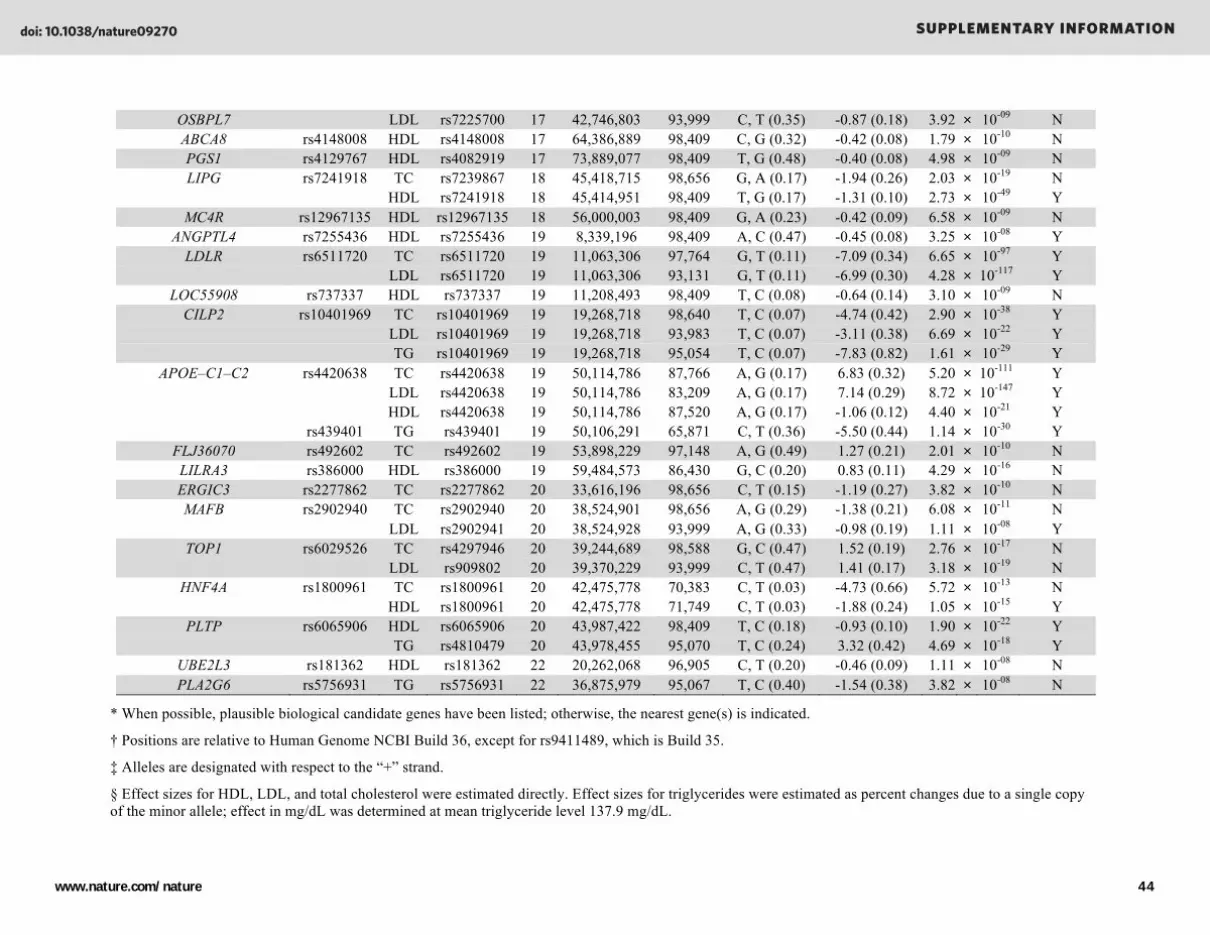
OSBPL7 LDL rs7225700 17 42,746,803 93,999 C, T (0.35) -0.87 (0.18) 3.92 × 10-09 N ABCA8 rs4148008 HDL rs4148008 17 64,386,889 98,409 C, G (0.32) -0.42 (0.08) 1.79 × 10⁻¹⁰ N PGS1 rs4129767 HDL rs4082919 17 73,889,077 98,409 T, G (0.48) -0.40 (0.08) 4.98 × 10-09 N LIPG rs7241918 TC rs7239867 18 45,418,715 98,656 G, A (0.17) -1.94 (0.26) 2.03 × 10⁻¹⁹ N
HDL rs7241918 18 45,414,951 98,409 T, G (0.17) -1.31 (0.10) 2.73 × 10-49 Y MC4R rs12967135 HDL rs12967135 18 56,000,003 98,409 G, A (0.23) -0.42 (0.09) 6.58 × 10-09 N
ANGPTL4 rs7255436 HDL rs7255436 19 8,339,196 98,409 A, C (0.47) -0.45 (0.08) 3.25 × 10-08 Y LDLR rs6511720 TC rs6511720 19 11,063,306 97,764 G, T (0.11) -7.09 (0.34) 6.65 × 10-97 Y
LDL rs6511720 19 11,063,306 93,131 G, T (0.11) -6.99 (0.30) 4.28 × 10-117 Y LOC55908 rs737337 HDL rs737337 19 11,208,493 98,409 T, C (0.08) -0.64 (0.14) 3.10 × 10-09 N
CILP2 rs10401969 TC rs10401969 19 19,268,718 98,640 T, C (0.07) -4.74 (0.42) 2.90 × 10-38 Y LDL rs10401969 19 19,268,718 93,983 T, C (0.07) -3.11 (0.38) 6.69 × 10⁻²² Y TG rs10401969 19 19,268,718 95,054 T, C (0.07) -7.83 (0.82) 1.61 × 10⁻²⁹ Y
APOE–C1–C2 rs4420638 TC rs4420638 19 50,114,786 87,766 A, G (0.17) 6.83 (0.32) 5.20 × 10-111 Y LDL rs4420638 19 50,114,786 83,209 A, G (0.17) 7.14 (0.29) 8.72 × 10-147 Y HDL rs4420638 19 50,114,786 87,520 A, G (0.17) -1.06 (0.12) 4.40 × 10⁻²¹ Y rs439401 TG rs439401 19 50,106,291 65,871 C, T (0.36) -5.50 (0.44) 1.14 × 10⁻³⁰ Y
FLJ36070 rs492602 TC rs492602 19 53,898,229 97,148 A, G (0.49) 1.27 (0.21) 2.01 × 10⁻¹⁰ N LILRA3 rs386000 HDL rs386000 19 59,484,573 86,430 G, C (0.20) 0.83 (0.11) 4.29 × 10⁻¹⁶ N ERGIC3 rs2277862 TC rs2277862 20 33,616,196 98,656 C, T (0.15) -1.19 (0.27) 3.82 × 10⁻¹⁰ N MAFB rs2902940 TC rs2902940 20 38,524,901 98,656 A, G (0.29) -1.38 (0.21) 6.08 × 10⁻¹¹ N
LDL rs2902941 20 38,524,928 93,999 A, G (0.33) -0.98 (0.19) 1.11 × 10-08 Y TOP1 rs6029526 TC rs4297946 20 39,244,689 98,588 G, C (0.47) 1.52 (0.19) 2.76 × 10⁻¹⁷ N
LDL rs909802 20 39,370,229 93,999 C, T (0.47) 1.41 (0.17) 3.18 × 10⁻¹⁹ N HNF4A rs1800961 TC rs1800961 20 42,475,778 70,383 C, T (0.03) -4.73 (0.66) 5.72 × 10⁻¹³ N
HDL rs1800961 20 42,475,778 71,749 C, T (0.03) -1.88 (0.24) 1.05 × 10⁻¹⁵ Y PLTP rs6065906 HDL rs6065906 20 43,987,422 98,409 T, C (0.18) -0.93 (0.10) 1.90 × 10⁻²² Y
TG rs4810479 20 43,978,455 95,070 T, C (0.24) 3.32 (0.42) 4.69 × 10⁻¹⁸ Y UBE2L3 rs181362 HDL rs181362 22 20,262,068 96,905 C, T (0.20) -0.46 (0.09) 1.11 × 10-08 N PLA2G6 rs5756931 TG rs5756931 22 36,875,979 95,067 T, C (0.40) -1.54 (0.38) 3.82 × 10-08 N
* When possible, plausible biological candidate genes have been listed; otherwise, the nearest gene(s) is indicated.
† Positions are relative to Human Genome NCBI Build 36, except for rs9411489, which is Build 35.
‡ Alleles are designated with respect to the “+” strand.
§ Effect sizes for HDL, LDL, and total cholesterol were estimated directly. Effect sizes for triglycerides were estimated as percent changes due to a single copy of the minor allele; effect in mg/dL was determined at mean triglyceride level 137.9 mg/dL.
doi: 10.1038/nature09270 SUPPLEMENTARY INFORMATION
www.nature.com/nature 44
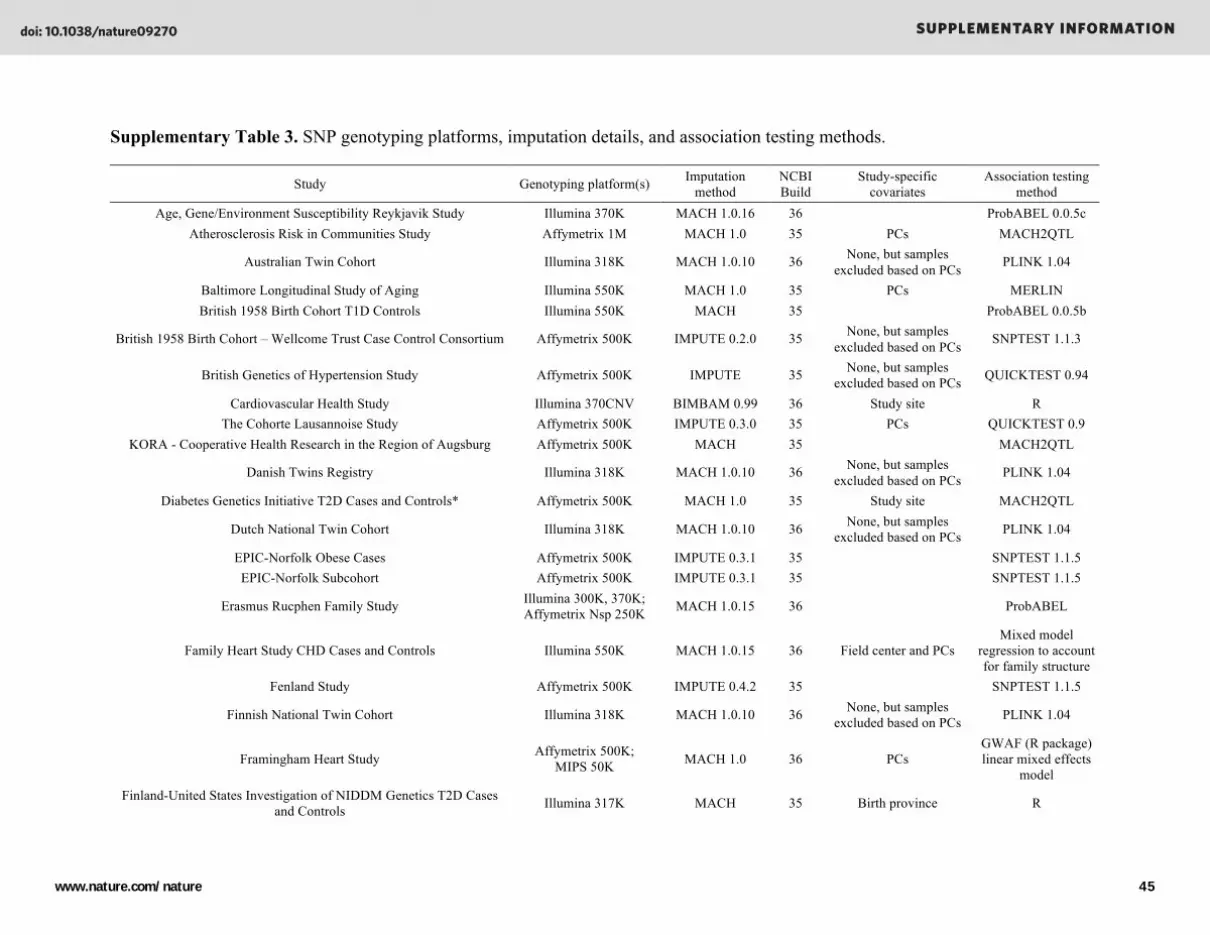
Supplementary Table 3. SNP genotyping platforms, imputation details, and association testing methods.
Study Genotyping platform(s) Imputation method
NCBI Build
Study-specific covariates
Association testing method
Age, Gene/Environment Susceptibility Reykjavik Study Illumina 370K MACH 1.0.16 36 ProbABEL 0.0.5c Atherosclerosis Risk in Communities Study Affymetrix 1M MACH 1.0 35 PCs MACH2QTL
Australian Twin Cohort Illumina 318K MACH 1.0.10 36 None, but samples excluded based on PCs PLINK 1.04
Baltimore Longitudinal Study of Aging Illumina 550K MACH 1.0 35 PCs MERLIN British 1958 Birth Cohort T1D Controls Illumina 550K MACH 35 ProbABEL 0.0.5b
British 1958 Birth Cohort – Wellcome Trust Case Control Consortium Affymetrix 500K IMPUTE 0.2.0 35 None, but samples excluded based on PCs SNPTEST 1.1.3
British Genetics of Hypertension Study Affymetrix 500K IMPUTE 35 None, but samples excluded based on PCs QUICKTEST 0.94
Cardiovascular Health Study Illumina 370CNV BIMBAM 0.99 36 Study site R The Cohorte Lausannoise Study Affymetrix 500K IMPUTE 0.3.0 35 PCs QUICKTEST 0.9
KORA - Cooperative Health Research in the Region of Augsburg Affymetrix 500K MACH 35 MACH2QTL
Danish Twins Registry Illumina 318K MACH 1.0.10 36 None, but samples excluded based on PCs PLINK 1.04
Diabetes Genetics Initiative T2D Cases and Controls* Affymetrix 500K MACH 1.0 35 Study site MACH2QTL
Dutch National Twin Cohort Illumina 318K MACH 1.0.10 36 None, but samples excluded based on PCs PLINK 1.04
EPIC-Norfolk Obese Cases Affymetrix 500K IMPUTE 0.3.1 35 SNPTEST 1.1.5 EPIC-Norfolk Subcohort Affymetrix 500K IMPUTE 0.3.1 35 SNPTEST 1.1.5
Erasmus Rucphen Family Study Illumina 300K, 370K; Affymetrix Nsp 250K MACH 1.0.15 36 ProbABEL
Family Heart Study CHD Cases and Controls Illumina 550K MACH 1.0.15 36 Field center and PCs Mixed model
regression to account for family structure
Fenland Study Affymetrix 500K IMPUTE 0.4.2 35 SNPTEST 1.1.5
Finnish National Twin Cohort Illumina 318K MACH 1.0.10 36 None, but samples excluded based on PCs PLINK 1.04
Framingham Heart Study Affymetrix 500K; MIPS 50K MACH 1.0 36 PCs
GWAF (R package) linear mixed effects
model Finland-United States Investigation of NIDDM Genetics T2D Cases
and Controls Illumina 317K MACH 35 Birth province R
doi: 10.1038/nature09270 SUPPLEMENTARY INFORMATION
www.nature.com/nature 45

Health2000 GenMets MS Cases and Controls Illumina 610K MACH 1.0.10 36 None, but samples excluded based on PCs ProbABEL
Invecchiare in Chianti Study* Illumina 550K MACH 1.0 35 MERLIN
London Life Sciences Population Study Affymetrix 500K; Perlegen custom array MACH 35 PCs MACH2QTL
MedSTAR MI Cases and Controls Affymetrix 1M MACH 1.0 36 PCs SNPTEST 1.1.5 MICROS Study of Population Microisolates in South Tyrol Illumina 300K MACH 1.0.15 36 ProbABEL
National FINRISK Study Illumina 610K MACH 1.0.10 36 None, but samples excluded based on PCs ProbABEL
Northern Finland Birth Cohort 1966 Illumina 370K MACH 1.0.10 36 None, but samples excluded based on PCs PLINK 1.04
Northern Swedish Population Health Study Illumina 300K MACH 1.0.15 36 ProbABEL Orkney Complex Disease Study Illumina 300K MACH 1.0.15 36 ProbABEL
PennCATH MI Cases and Controls Affymetrix 1M MACH 1.0 36 PCs SNPTEST 1.1.5
Pharmacogenomics and Risk of Cardiovascular Disease Study Illumina 317K; Illumina 610K BIMBAM 0.9.5 36 Study site SNPTEST 1.1.5
Rotterdam Study Baseline Illumina 550K MACH 1.0.15 36 ProbABEL Rotterdam Study Extension of Baseline Illumina 550K MACH 1.0.15 36 ProbABEL
SardiNIA Study of Aging Affymetrix 500K MACH 35
Twins UK Illumina 318K MACH 1.0.10 36 None, but samples excluded based on PCs PLINK 1.04
Supplementation en Vitamines et Mineraux Antioxydants Study Illumina 317K MACH 35
Swedish National Twin Cohort Illumina 318K MACH 1.0.10 36 None, but samples excluded based on PCs PLINK 1.04
Vis Study Illumina 300K MACH 1.0.15 36 ProbABEL
Women’s Genome Health Study Illumina 300K Duo "+" MACH 1.0.16 35 Eigenvectors (EIGENSTRAT) MACH2QTL
PCs = principal components.
* Contained a small number of related individuals.
doi: 10.1038/nature09270 SUPPLEMENTARY INFORMATION
www.nature.com/nature 46

Supplementary Table 4. Genomic control inflation factors.
Study HDL LDL TG TC
Age, Gene/Environment Susceptibility Reykjavik Study 1.077 1.045 1.049 1.052 Atherosclerosis Risk in Communities Study 1.013 1.025 1.042 1.026
Baltimore Longitudinal Study of Aging 1.013 1.016 1.057 1.044 British 1958 Birth Cohort – Wellcome Trust Case Control Consortium 1.004 1.004 1.006 1.004
British 1958 Birth Cohort T1D Controls 1.021 1.02 1.01 1.014 British Genetics of Hypertension Study 0.991 1.013 1.007 1
Cardiovascular Health Study 1.038 1.021 1.023 1.023 The Cohorte Lausannoise Study 1.016 0.996 1.038 0.999
KORA - Cooperative Health Research in the Region of Augsburg 1.01 1.007 1.004 1.012 Diabetes Genetics Initiative T2D Cases and Controls*† 1.477 1.266 1.077 1.134
ENGAGE‡ 1.046 1.043 1.031 0.989 EPIC-Norfolk Obese Cases 1.009 1.003 1.007 1.009 EPIC-Norfolk Subcohort 1.008 1.013 1.021 1.005
Family Heart Study CHD Cases and Controls 1.113 1.074 1.082 1.084 Fenland Study 1.024 1.016 1.015 1.034
Framingham Heart Study 1.022 1.02 1.03 1.031 Finland-United States Investigation of NIDDM Genetics T2D Cases and Controls* 1.006 1.016 1.007 1.016
Invecchiare in Chianti Study† 1 1.015 1.021 1.014 London Life Sciences Population Study 1.018 1.008 1.011 1.009
MedSTAR MI Cases and Controls* 1.037 1.024 1.015 1.015 PennCATH MI Cases and Controls* 1.004 1.007 1.024 1
Pharmacogenomics and Risk of Cardiovascular Disease Study 1.008 1.013 1.016 1.001 SardiNIA Study of Aging 1.119 1.133 1.129 1.147
Supplementation en Vitamines et Mineraux Antioxydants Study 1 1 1 1.047 Women’s Genome Health Study 1.064 1.034 1.084 1.040
Overall meta-analysis 1.14 1.097 1.121 1.105 * The cohort’s case and control sets were meta-analysed and genomic control correction was applied before the combined cohort was meta-analysed with the remaining studies. † The DGI and InCHIANTI studies each included a small number of related individuals. ‡ Meta-analysis of: Australian Twin Cohort, Danish Twins Registry, Dutch National Twin Cohort, Erasmus Rucphen Family Study, Finnish National Twin Cohort, Health2000 GenMets MS, MICROS Study of Population Microisolates in South Tyrol, National FINRISK Study, Northern Finland Birth Cohort 1966, Northern Swedish Population Health Study, Orkney Complex Disease Study, Rotterdam Study Baseline, Rotterdam Study Extension of Baseline, TwinsUK, Swedish National Twin Cohort, Vis Study.
doi: 10.1038/nature09270 SUPPLEMENTARY INFORMATION
www.nature.com/nature 47

Supplementary Table 5. Evidence of association for best proxies directly genotyped on Affymetrix and Illumina arrays.
Proxy Illumina SNP* Proxy Affymetrix SNP*
Lead SNP Trait Best SNP n P-value SNP r2 P-value A B C D Approx. typed n SNP r2 P-value E F Approx.
typed n
rs12027135 LDL rs12027135 95,454 1E-10 rs10903129 1.00 2E-10 Y Y Y Y 59,333 rs11802413 1.00 2E-10 Y Y 41,912 rs12027135 TC rs12027135 100,184 4E-11 rs10903129 1.00 7E-11 Y Y Y Y 59,333 rs11802413 1.00 5E-11 Y Y 41,912 rs4660293 HDL rs4660293 99,855 4E-10 rs4660293 1.00 4E-10 Y Y Y Y 59,333 rs4660293 1.00 4E-10 Y Y 41,912 rs2479409 LDL rs2479409 95,435 2E-28 rs2479409 1.00 2E-28 Y Y 41,912 rs2479409 TC rs2479409 100,164 4E-24 rs2479409 1.00 4E-24 Y Y 41,912 rs2131925 LDL rs3850634 92,503 3E-18 rs10889353 1.00 2E-17 Y Y Y Y 59,333 rs995000 1.00 5E-17 Y Y 41,912 rs2131925 TC rs3850634 97,148 5E-41 rs10889353 1.00 1E-40 Y Y Y Y 59,333 rs995000 1.00 1E-39 Y Y 41,912 rs2131925 TG rs2131925 96,598 9E-43 rs1167998 1.00 5E-41 Y Y Y Y 59,333 rs7539035 1.00 3E-42 Y Y 41,912 rs7515577 TC rs7515577 100,165 3E-8 rs2025607 0.90 4E-8 Y Y Y Y 59,333 rs4970712 0.95 3E-8 Y Y 41,912 rs629301 LDL rs629301 95,454 1E-172 rs646776 1.00 5E-169 Y Y Y Y 59,333 rs599839 0.89 3E-168 Y Y 41,912 rs629301 TC rs629301 100,184 6E-131 rs646776 1.00 7E-130 Y Y Y Y 59,333 rs599839 0.89 4E-130 Y Y 41,912
rs1689800 HDL rs1689800 99,900 3E-10 rs1689803 0.86 4E-9 Y Y Y Y 59,333 rs1689802 0.83 9E-10 Y Y 41,912 rs2642442 LDL rs2807834 95,372 6E-11 rs2807834 1.00 6E-11 Y Y 41,912 rs2642442 TC rs2807834 100,098 5E-13 rs2807834 1.00 5E-13 Y Y 41,912 rs4846914 HDL rs4846914 99,881 4E-21 rs10779835 0.97 6E-20 Y Y Y Y 59,333 rs2144300 1.00 5E-20 Y Y 41,912 rs4846914 TG rs1321257 92,418 2E-14 rs10779835 0.97 1E-13 Y Y Y Y 59,333 rs2281719 0.97 1E-13 Y Y 41,912 rs514230 LDL rs514230 95,454 9E-12 rs822928 0.84 2E-9 Y Y Y Y 59,333 rs553427 1.00 3E-10 Y Y 41,912 rs514230 TC rs514230 100,184 5E-14 rs822928 0.84 3E-10 Y Y Y Y 59,333 rs553427 1.00 5E-12 Y Y 41,912
rs1042034 HDL rs1042034 99,892 1E-30 rs673548 1.00 4E-30 Y Y Y Y 59,333 rs6544366 0.86 2E-27 Y Y 41,912 rs1367117 LDL rs1367117 95,446 4E-114 rs7575840 0.85 2E-98 Y Y 41,912 rs1367117 TC rs1367117 100,176 4E-96 rs7575840 0.85 3E-79 Y Y 41,912 rs1042034 TG rs1042034 96,590 1E-45 rs673548 1.00 3E-45 Y Y Y Y 59,333 rs6544366 0.86 5E-42 Y Y 41,912 rs1260326 TC rs1260326 100,176 7E-27 rs1260326 1.00 7E-27 Y Y Y Y 59,333 rs780094 0.93 1E-24 Y Y 41,912 rs1260326 TG rs1260326 96,590 6E-133 rs1260326 1.00 6E-133 Y Y Y Y 59,333 rs780094 0.93 7E-125 Y Y 41,912 rs4299376 LDL rs4299376 91,285 2E-47 rs4299376 1.00 2E-47 Y Y 17,068 rs4245791 1.00 3E-45 Y Y 41,912 rs4299376 TC rs4299376 95,992 4E-45 rs4299376 1.00 4E-45 Y Y 17,068 rs4245791 1.00 2E-43 Y Y 41,912 rs7570971 TC rs6759321 95,242 1E-8 rs1561277 0.95 3E-7 Y Y Y Y 59,333
rs12328675 HDL rs12328675 99,892 3E-10 rs10490694† 1.00 7E-3 Y Y Y Y 59,333 rs7607980 1.00 4E-10 Y 10,296 rs10195252 TG rs10195252 96,590 2E-10 rs10195252 1.00 2E-10 Y Y Y Y 59,333 rs6717858 0.94 3E-9 Y Y 41,912 rs2972146 HDL rs1515100 96,875 2E-9 rs2943645 0.93 5E-9 Y Y Y Y 59,333 rs2943658 1.00 5E-8 Y Y 41,912 rs2972146 TG rs2943645 93,554 2E-8 rs2943645 1.00 2E-8 Y Y Y Y 59,333 rs2972147 1.00 1E-7 Y Y 41,912
doi: 10.1038/nature09270 SUPPLEMENTARY INFORMATION
www.nature.com/nature 48

rs2290159 TC rs2290159 99,434 4E-9 rs11128607 0.86 1E-8 Y Y Y Y 59,333 rs7956 1.00 4E-8 Y Y 41,912 rs645040 TG rs645040 96,597 3E-8 rs684773 1.00 1E-7 Y Y Y Y 59,333 rs684773 1.00 1E-7 Y Y 41,912 rs442177 TG rs442177 96,598 9E-12 rs236996 0.96 2E-10 Y Y Y Y 59,333 rs3775214 0.96 4E-11 Y Y 41,912
rs13107325 HDL rs13107325 92,059 7E-11 rs13107325 1.00 7E-11 Y Y Y Y 59,333 rs13107325 1.00 7E-11 Y 10,296 rs6450176 HDL rs6450176 99,900 5E-8 rs4311394 0.91 1E-7 Y Y Y Y 59,333 rs6886510 0.91 2E-7 Y Y 41,912 rs9686661 TG rs9686661 95,848 1E-10 rs3843467 1.00 1E-9 Y Y Y Y 59,333 rs3843467 1.00 1E-9 Y Y 41,912
rs12916 LDL rs12916 95,454 5E-45 rs3846662 0.84 2E-35 Y Y Y Y 59,333 rs3846663 0.97 2E-42 Y Y 41,912 rs12916 TC rs12916 100,184 9E-47 rs3846662 0.84 1E-37 Y Y Y Y 59,333 rs3846663 0.97 3E-43 Y Y 41,912
rs6882076 LDL rs6882076 95,454 2E-22 rs1363232 0.96 4E-19 Y Y Y Y 59,333 rs1501908 1.00 6E-20 Y Y 41,912 rs6882076 TC rs6882076 100,184 7E-28 rs1363232 0.96 3E-24 Y Y Y Y 59,333 rs1501908 1.00 8.E-26 Y Y 41,912 rs6882076 TG rs1553318 96,598 4E-12 rs3757354 LDL rs3757354 91,293 1E-11 rs3757354 1.00 1E-11 Y Y Y Y 59,333 rs3757354 TC rs3757354 96,000 3E-9 rs3757354 1.00 3E-9 Y Y Y Y 59,333 rs1800562 LDL rs1800562 93,821 6E-10 rs1800562 1.00 6E-10 Y Y Y Y 59,333 rs1800562 1.00 6E-10 Y Y 41,912 rs1800562 TC rs1800562 98,550 2E-8 rs1800562 1.00 2E-8 Y Y Y Y 59,333 rs1800562 1.00 2E-8 Y Y 41,912 rs3177928 LDL rs3177928 95,425 2E-15 rs13209234 0.94 2E-14 Y Y Y Y 59,333 rs9391858 1.00 2E-13 Y Y 41,912 rs3177928 TC rs3177928 100,151 4E-19 rs13209234 0.94 3E-18 Y Y Y Y 59,333 rs9391858 1.00 2E-16 Y Y 41,912 rs2247056 TG rs2247056 96,598 2E-15 rs6457374 1.00 2E-15 Y Y Y Y 59,333 rs2814944 HDL rs2814944 99,811 4E-9 rs2814944 1.00 4E-9 Y Y Y Y 59,333 rs2814944 1.00 4E-9 Y Y 41,912 rs2814982 TC rs2814982 100,184 5E-11 rs2814982 1.00 5E-11 Y Y Y Y 59,333 rs9488822 LDL rs11153594 95,367 3E-9 rs6909746 1.00 3E-9 Y Y Y Y 59,333 rs10456902 1.00 3E-9 Y Y 41,912 rs9488822 TC rs9488822 100,184 2E-10 rs3798236 1.00 3E-10 Y Y Y Y 59,333 rs605066 HDL rs605066 99,900 3E-8 rs668459 1.00 1E-7 Y Y Y Y 59,333 rs634869 1.00 5E-8 Y Y 41,912
rs1084651 HDL rs1084651 99,900 3E-8 rs783149 1.00 1E-7 Y Y Y Y 59,333 rs1652507 0.93 5E-7 Y Y 41,912 rs1564348 LDL rs1564348 95,439 2E-17 rs1564348 1.00 2E-17 Y Y Y Y 59,333 rs1564348 1.00 2E-17 Y 10,296 rs1564348 TC rs1564348 100,168 1E-16 rs1564348 1.00 1E-16 Y Y Y Y 59,333 rs1564348 1.00 1E-16 Y 10,296
rs12670798 LDL rs12670798 95,454 7E-10 rs12670798 1.00 7E-10 Y Y Y Y 59,333 rs12670798 TC rs2285942 100,184 7E-10 rs2072183 LDL rs217386 95,454 4E-11 rs217369 0.84 7E-9 Y Y Y Y 59,333 rs217381 0.90 5E-11 Y Y 41,912 rs2072183 TC rs2072183 97,063 3E-11
rs13238203 TG rs13238203 78,797 1E-9 rs17145738 HDL rs17145738 99,898 1E-9 rs2240466 1.00 4E-9 Y Y Y Y 59,333 rs17145738 1.00 1E-9 Y Y 41,912 rs17145738 TG rs7811265 96,598 9E-59 rs11974409 1.00 1E-58 Y Y Y Y 59,333 rs1178977 1.00 3E-55 Y Y 41,912 rs4731702 HDL rs4731702 99,900 1E-15 rs4731702 1.00 1E-15 Y Y Y Y 59,333 rs13230111 1.00 4E-15 Y Y 41,912 rs9987289 HDL rs9987289 99,900 6E-25 rs2126259 0.80 1E-22 Y Y Y Y 59,333 rs1461729 0.80 9E-20 Y 10,296 rs9987289 LDL rs2126259 95,454 7E-15 rs2126259 1.00 7E-15 Y Y Y Y 59,333 rs1461729 1.00 1E-12 Y 10,296
doi: 10.1038/nature09270 SUPPLEMENTARY INFORMATION
www.nature.com/nature 49

rs9987289 TC rs2126259 100,184 9E-24 rs2126259 1.00 9E-24 Y Y Y Y 59,333 rs1461729 1.00 8E-20 Y 10,296 rs11776767 TG rs11776767 96,598 1E-8 rs6992366 0.87 1E-5 Y Y Y Y 59,333 rs2278335 0.80 2E-5 Y Y 41,912 rs1495741 TC rs1961456 100,184 2E-9 rs1495741 TG rs1495743 96,580 4E-14 rs1495741 1.00 5E-14 Y Y Y Y 59,333 rs1495743 1.00 4E-14 Y Y 41,912
rs12678919 HDL rs12678919 99,900 1E-97 rs10096633 0.86 1E-83 Y Y Y Y 59,333 rs10503669 0.93 5E-92 Y Y 41,912 rs12678919 TG rs12678919 96,598 2E-115 rs10096633 0.86 1E-97 Y Y Y Y 59,333 rs10503669 0.93 2E-108 Y Y 41,912 rs2081687 LDL rs1030431 95,454 4E-9 rs4738679 0.93 1E-8 Y Y Y Y 59,333 rs13277801 1.00 7E-9 Y Y 41,912 rs2081687 TC rs1030431 100,184 9E-13 rs4738679 0.93 3E-12 Y Y Y Y 59,333 rs13277801 1.00 2E-12 Y Y 41,912 rs2293889 HDL rs2293889 99,900 6E-11 rs3808439 0.93 4E-9 Y Y Y Y 59,333 rs3808461 0.96 1E-10 Y Y 41,912 rs2737229 TC rs2737229 100,184 2E-8 rs2737229 1.00 2E-8 Y Y Y Y 59,333 rs3808477 0.85 1E-7 Y Y 41,912 rs2954029 HDL rs10808546 99,900 6E-19 rs10808546 1.00 6E-19 Y Y Y Y 59,333 rs2980875 0.97 4E-17 Y Y 41,912 rs2954029 LDL rs2954022 95,454 3E-29 rs10808546 0.97 1E-26 Y Y Y Y 59,333 rs2980875 1.00 3E-29 Y Y 41,912 rs2954029 TC rs2954022 100,184 5E-36 rs10808546 0.97 2E-32 Y Y Y Y 59,333 rs2980875 1.00 6E-36 Y Y 41,912 rs2954029 TG rs2954029 96,598 3E-55 rs10808546 0.97 4E-54 Y Y Y Y 59,333 rs2980875 1.00 7E-54 Y Y 41,912
rs11136341 LDL rs11136341 88,376 4E-13 rs11136341 TC rs11136341 93,052 9E-10
rs581080 HDL rs643531 99,889 1E-13 rs686030 0.95 3E-13 Y Y Y Y 59,333 rs643531 1.00 1E-13 Y Y 41,912 rs581080 TC rs581080 100,184 3E-9
rs1883025 HDL rs1883025 99,179 2E-33 rs2575876† 0.90 6E-17 Y 4,608 rs1883025 TC rs1883025 99,463 3E-27 rs2575876† 0.90 1E-9 Y 4,608 rs9411489 LDL rs649129 95,454 8E-22 rs495828 1.00 2E-21 Y Y 17,068 rs651007 0.95 5E-21 Y Y 41,912 rs9411489 TC rs651007 98,535 9E-21 rs495828 0.95 4E-20 Y Y 17,068 rs651007 1.00 9E-21 Y Y 41,912
rs10761731 TG rs10761731 96,598 3E-12 rs10509186 0.88 3E-10 Y Y Y Y 59,333 rs10761739 1.00 9E-12 Y Y 41,912 rs2068888 TG rs2068888 96,598 2E-8 rs2068888 1.00 2E-8 Y Y Y Y 59,333 rs2255141 LDL rs1129555 95,438 2E-9 rs2419604 1.00 4E-9 Y Y Y Y 59,333 rs1129555 1.00 2E-9 Y Y 41,912 rs2255141 TC rs2255141 100,184 2E-10 rs2419604 1.00 5E-10 Y Y Y Y 59,333 rs1129555 1.00 3E-10 Y Y 41,912 rs2923084 HDL rs2923084 99,898 5E-8 rs2923084 1.00 5E-8 Y Y Y Y 59,333 rs1349326 0.81 2E-5 Y Y 41,912
rs10128711 TC rs10832963 100,184 3E-8 rs4757676 0.96 6E-8 Y Y Y Y 59,333 rs11024739 0.96 2E-7 Y Y 41,912 rs3136441 HDL rs3136441 99,900 3E-18 rs5896 1.00 7E-16 Y Y Y Y 59,333 rs2290883 1.00 4E-15 Y Y 41,912 rs174546 HDL rs174601 99,900 2E-22 rs102275 0.86 2E-22 Y Y Y Y 59,333 rs174547 0.86 1E-21 Y Y 41,912 rs174546 LDL rs174583 95,443 1E-21 rs102275 1.00 5E-21 Y Y Y Y 59,333 rs174547 1.00 1E-19 Y Y 41,912 rs174546 TC rs174550 100,184 2E-22 rs1535 1.00 4E-22 Y Y Y Y 59,333 rs174547 1.00 2E-20 Y Y 41,912 rs174546 TG rs174546 96,598 5E-24 rs1535 1.00 5E-23 Y Y Y Y 59,333 rs174547 1.00 6E-23 Y Y 41,912 rs964184 HDL rs964184 99,878 5E-47 rs964184 1.00 5E-47 Y 4,608 rs964184 1.00 5E-47 Y 10,296 rs964184 LDL rs964184 95,432 1E-26 rs964184 1.00 1E-26 Y 4,608 rs964184 1.00 1E-26 Y 10,296 rs964184 TC rs964184 100,162 6E-57 rs964184 1.00 6E-57 Y 4,608 rs964184 1.00 6E-57 Y 10,296
doi: 10.1038/nature09270 SUPPLEMENTARY INFORMATION
www.nature.com/nature 50

rs964184 TG rs964184 96,576 7E-240 rs964184 1.00 7E-240 Y 4,608 rs964184 1.00 7E-240 Y 10,296 rs7941030 HDL rs7115089 99,900 3E-8 rs7941030 0.87 3E-8 Y Y Y Y 59,333 rs10892873 1.00 4E-8 Y Y 41,912 rs7941030 TC rs7941030 100,184 2E-10 rs7941030 1.00 2E-10 Y Y Y Y 59,333 rs7123220 0.90 5E-10 Y Y 41,912
rs11220462 LDL rs11220462 95,454 1E-15 rs7940893 1.00 2E-14 Y Y Y Y 59,333 rs11220462 TC rs11220463 100,184 2E-11 rs7134375 HDL rs7134375 99,900 4E-8 rs7134375 1.00 4E-8 Y Y Y Y 59,333
rs11613352 HDL rs3741414 99,900 2E-8 rs3741414 1.00 2E-8 Y Y 17,068 rs11614506 0.84 1E-7 Y Y 41,912 rs11613352 TG rs11613352 96,598 4E-10 rs11172147 1.00 1E-9 Y Y 17,068 rs11614506 1.00 2E-9 Y Y 41,912 rs7134594 HDL rs7134594 99,900 7E-15 rs7134594 1.00 7E-15 Y Y Y Y 59,333 rs10161126 1.00 8E-13 Y Y 41,912
rs11065987 LDL rs11065987 95,454 2E-9 rs11065987 1.00 2E-9 Y Y 17,068 rs11065987 TC rs11065987 100,184 7E-12 rs11065987 1.00 7E-12 Y Y 17,068 rs1169288 LDL rs1169288 95,454 1E-15 rs2650000 0.92 3E-14 Y Y Y Y 59,333 rs2650000 0.92 3E-14 Y 10,296 rs1169288 TC rs1169288 100,184 1E-14 rs2650000 0.92 5E-14 Y Y Y Y 59,333 rs2650000 0.92 5E-14 Y 10,296 rs4759375 HDL rs4759375 99,900 8E-9 rs4765127 HDL rs4765127 99,787 3E-10 rs12298484 0.97 1E-9 Y Y Y Y 59,333 rs1187415 1.00 1E-9 Y Y 41,912 rs4765127 TG rs12310367 96,598 1E-8 rs12298484 0.97 8E-8 Y Y Y Y 59,333 rs1187415 1.00 2E-8 Y Y 41,912 rs838880 HDL rs838880 80,428 3E-14 rs838878 0.96 6E-14 Y Y Y Y 59,333 rs838880 1.00 3E-14 Y 10,296
rs8017377 LDL rs2332328 95,454 4E-11 rs8017377 1.00 5E-11 Y Y Y Y 59,333 rs2412710 TG rs2412710 86,707 2E-8 rs2929282 TG rs2929282 95,070 2E-11 rs2929275 1.00 3E-11 Y Y 17,068 rs2918952 1.00 9E-11 Y Y 41,912 rs1532085 HDL rs1532085 98,409 3E-96 rs1532085 1.00 3E-96 Y Y Y Y 59,333 rs1532085 TC rs1532085 98,656 9E-20 rs1532085 1.00 9E-20 Y Y Y Y 59,333 rs1532085 TG rs261342 95,070 2E-13 rs261341 0.85 4E-8 Y Y Y Y 59,333 rs261332 0.88 5E-12 Y Y 41,912 rs2652834 HDL rs2652834 98,409 9E-9
rs11649653 TG rs11649653 95,034 3E-8 rs11649653 1.00 3E-8 Y Y 41,912 rs3764261 HDL rs3764261 94,225 7E-380 rs3764261 1.00 7E-380 Y Y Y Y 59,333 rs3764261 LDL rs247616 89,838 9E-13 rs3764261 1.00 2E-12 Y Y Y Y 59,333 rs3764261 TC rs3764261 94,472 7E-14 rs3764261 1.00 7E-14 Y Y Y Y 59,333 rs3764261 TG rs7205804 95,070 1E-12 rs1532624 1.00 1E-12 Y Y Y Y 59,333
rs16942887 HDL rs16942887 98,409 8E-33 rs2271293 1.00 5E-32 Y Y Y Y 59,333 rs2292316 1.00 2E-32 Y Y 41,912 rs2000999 LDL rs2000999 93,999 2E-22 rs2000999 1.00 2E-22 Y Y Y Y 59,333 rs2000999 TC rs2000999 98,656 3E-24 rs2000999 1.00 3E-24 Y Y Y Y 59,333 rs2925979 HDL rs2925979 98,409 2E-11 rs2925979 1.00 2E-11 Y Y Y Y 59,333
rs11869286 HDL rs881844 98,409 3E-14 rs931992 1.00 9E-14 Y Y Y Y 59,333 rs11869286 1.00 1E-13 Y Y 41,912 rs7206971 LDL rs7225700 93,999 4E-9 rs6504833 1.00 6E-9 Y Y Y Y 59,333 rs11650072 1.00 1E-8 Y 10,296 rs7206971 TC rs7206971 90,614 1E-8 rs11079784 0.94 9E-7 Y Y Y Y 59,333 rs7206971 1.00 1E-8 Y Y 41,912
doi: 10.1038/nature09270 SUPPLEMENTARY INFORMATION
www.nature.com/nature 51
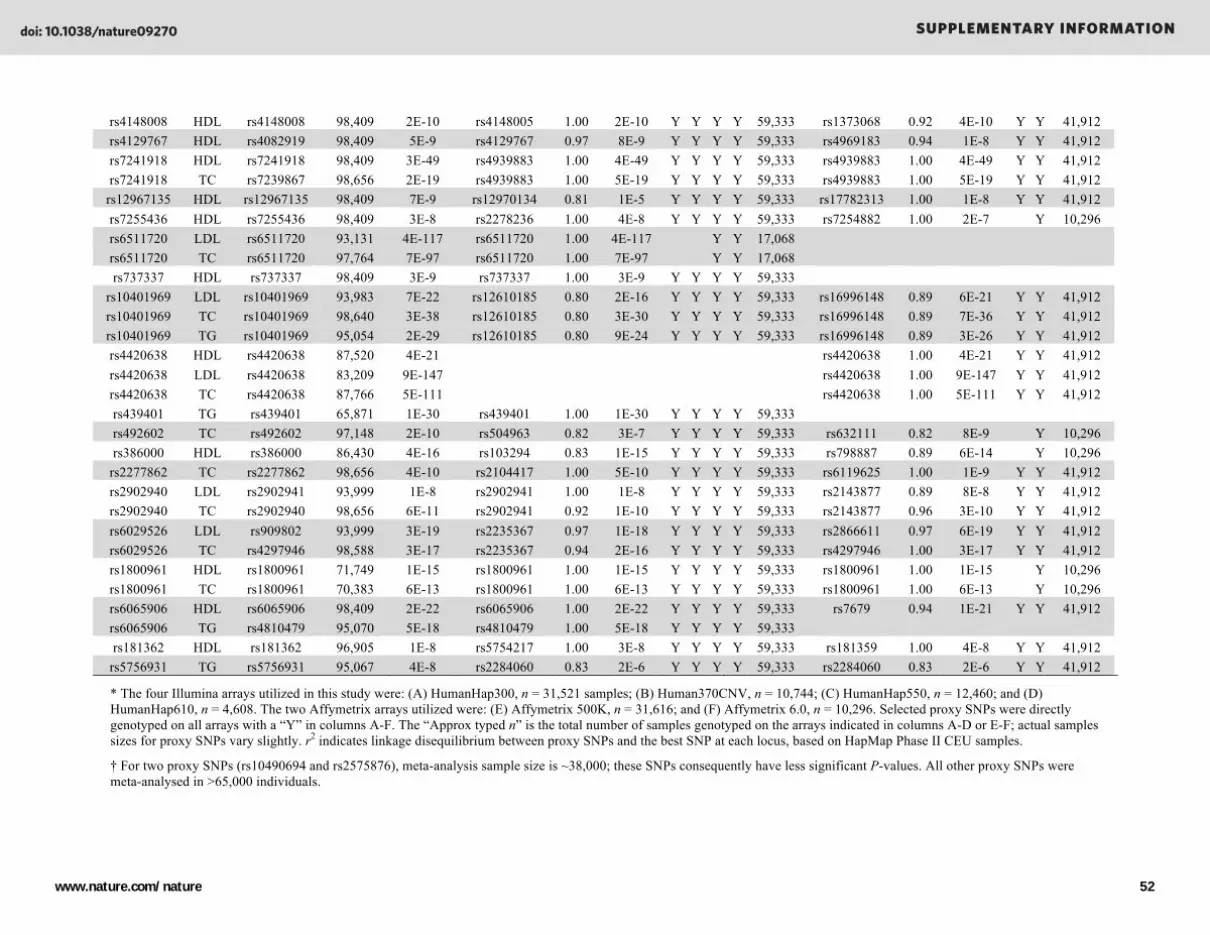
rs4148008 HDL rs4148008 98,409 2E-10 rs4148005 1.00 2E-10 Y Y Y Y 59,333 rs1373068 0.92 4E-10 Y Y 41,912 rs4129767 HDL rs4082919 98,409 5E-9 rs4129767 0.97 8E-9 Y Y Y Y 59,333 rs4969183 0.94 1E-8 Y Y 41,912 rs7241918 HDL rs7241918 98,409 3E-49 rs4939883 1.00 4E-49 Y Y Y Y 59,333 rs4939883 1.00 4E-49 Y Y 41,912 rs7241918 TC rs7239867 98,656 2E-19 rs4939883 1.00 5E-19 Y Y Y Y 59,333 rs4939883 1.00 5E-19 Y Y 41,912
rs12967135 HDL rs12967135 98,409 7E-9 rs12970134 0.81 1E-5 Y Y Y Y 59,333 rs17782313 1.00 1E-8 Y Y 41,912 rs7255436 HDL rs7255436 98,409 3E-8 rs2278236 1.00 4E-8 Y Y Y Y 59,333 rs7254882 1.00 2E-7 Y 10,296 rs6511720 LDL rs6511720 93,131 4E-117 rs6511720 1.00 4E-117 Y Y 17,068 rs6511720 TC rs6511720 97,764 7E-97 rs6511720 1.00 7E-97 Y Y 17,068 rs737337 HDL rs737337 98,409 3E-9 rs737337 1.00 3E-9 Y Y Y Y 59,333
rs10401969 LDL rs10401969 93,983 7E-22 rs12610185 0.80 2E-16 Y Y Y Y 59,333 rs16996148 0.89 6E-21 Y Y 41,912 rs10401969 TC rs10401969 98,640 3E-38 rs12610185 0.80 3E-30 Y Y Y Y 59,333 rs16996148 0.89 7E-36 Y Y 41,912 rs10401969 TG rs10401969 95,054 2E-29 rs12610185 0.80 9E-24 Y Y Y Y 59,333 rs16996148 0.89 3E-26 Y Y 41,912 rs4420638 HDL rs4420638 87,520 4E-21 rs4420638 1.00 4E-21 Y Y 41,912 rs4420638 LDL rs4420638 83,209 9E-147 rs4420638 1.00 9E-147 Y Y 41,912 rs4420638 TC rs4420638 87,766 5E-111 rs4420638 1.00 5E-111 Y Y 41,912 rs439401 TG rs439401 65,871 1E-30 rs439401 1.00 1E-30 Y Y Y Y 59,333 rs492602 TC rs492602 97,148 2E-10 rs504963 0.82 3E-7 Y Y Y Y 59,333 rs632111 0.82 8E-9 Y 10,296 rs386000 HDL rs386000 86,430 4E-16 rs103294 0.83 1E-15 Y Y Y Y 59,333 rs798887 0.89 6E-14 Y 10,296
rs2277862 TC rs2277862 98,656 4E-10 rs2104417 1.00 5E-10 Y Y Y Y 59,333 rs6119625 1.00 1E-9 Y Y 41,912 rs2902940 LDL rs2902941 93,999 1E-8 rs2902941 1.00 1E-8 Y Y Y Y 59,333 rs2143877 0.89 8E-8 Y Y 41,912 rs2902940 TC rs2902940 98,656 6E-11 rs2902941 0.92 1E-10 Y Y Y Y 59,333 rs2143877 0.96 3E-10 Y Y 41,912 rs6029526 LDL rs909802 93,999 3E-19 rs2235367 0.97 1E-18 Y Y Y Y 59,333 rs2866611 0.97 6E-19 Y Y 41,912 rs6029526 TC rs4297946 98,588 3E-17 rs2235367 0.94 2E-16 Y Y Y Y 59,333 rs4297946 1.00 3E-17 Y Y 41,912 rs1800961 HDL rs1800961 71,749 1E-15 rs1800961 1.00 1E-15 Y Y Y Y 59,333 rs1800961 1.00 1E-15 Y 10,296 rs1800961 TC rs1800961 70,383 6E-13 rs1800961 1.00 6E-13 Y Y Y Y 59,333 rs1800961 1.00 6E-13 Y 10,296 rs6065906 HDL rs6065906 98,409 2E-22 rs6065906 1.00 2E-22 Y Y Y Y 59,333 rs7679 0.94 1E-21 Y Y 41,912 rs6065906 TG rs4810479 95,070 5E-18 rs4810479 1.00 5E-18 Y Y Y Y 59,333 rs181362 HDL rs181362 96,905 1E-8 rs5754217 1.00 3E-8 Y Y Y Y 59,333 rs181359 1.00 4E-8 Y Y 41,912
rs5756931 TG rs5756931 95,067 4E-8 rs2284060 0.83 2E-6 Y Y Y Y 59,333 rs2284060 0.83 2E-6 Y Y 41,912
* The four Illumina arrays utilized in this study were: (A) HumanHap300, n = 31,521 samples; (B) Human370CNV, n = 10,744; (C) HumanHap550, n = 12,460; and (D) HumanHap610, n = 4,608. The two Affymetrix arrays utilized were: (E) Affymetrix 500K, n = 31,616; and (F) Affymetrix 6.0, n = 10,296. Selected proxy SNPs were directly genotyped on all arrays with a “Y” in columns A-F. The “Approx typed n” is the total number of samples genotyped on the arrays indicated in columns A-D or E-F; actual samples sizes for proxy SNPs vary slightly. r2 indicates linkage disequilibrium between proxy SNPs and the best SNP at each locus, based on HapMap Phase II CEU samples.
† For two proxy SNPs (rs10490694 and rs2575876), meta-analysis sample size is ~38,000; these SNPs consequently have less significant P-values. All other proxy SNPs were meta-analysed in >65,000 individuals.
doi: 10.1038/nature09270 SUPPLEMENTARY INFORMATION
www.nature.com/nature 52

Supplementary Table 6. Genome-wide significant SNPs after conditioning upon lead SNPs from primary GWAS analysis.
Locus SNP Trait Chr Position* n Allele 1, Allele 2† P-value Effect Conditioned
SNP in locus D' ‡ r2 ‡
PABPC4 rs4660808 TG 1 39,791,096 90,819 T, C 2.96 x 10-08 + PCSK9 rs1998013 TC 1 55,670,051 40,265 T, C 3.93 x 10⁻¹⁷ - rs2479409 1 0.004
LDL 1 55,730,618 36,329 T, C 1.97 x 10⁻²⁰ - rs2479409 1 0.004 EVI5 rs531514 HDL 1 93,412,233 97,559 T, C 7.46 x 10-09 + rs7515577 0.71 0.052
APOB rs515135 TC 2 21,197,709 97,140 T, C 6.38 x 10-52 - rs1367117 1 0.11 LDL 2 21,139,562 93,223 T, C 1.32 x 10-56 - rs1367117 1 0.11 rs668948 TG 2 21,145,034 91,483 A, G 4.31 x 10⁻¹⁰ + rs1042034 0.61 0.026
ABCG5/8 rs4953023 TC 2 43,985,651 90,564 A, G 1.18 x 10⁻¹⁹ - rs4299376 1 0.032 LDL 2 43,927,504 86,105 A, G 1.11 x 10⁻²³ - rs4299376 1 0.032
RAB3GAP1 rs10445686 LDL 2 135,609,842 93,223 A, G 3.82 x 10-08 - rs7570971 1 0.15 KLHL8 rs442177 HDL 4 88,387,440 97,559 T, G 1.84 x 10-08 -
HLA rs12660719 TG 6 32,683,961 83,173 A, G 1.13 x 10-08 - rs2247056 1 0.0056 C6orf106 rs3800406 LDL 6 35,241,052 86,867 A, G 1.69 x 10-08 + CITED2 rs636202 TG 6 139,885,276 93,855 T, C 2.56 x 10-08 +
LPA rs10455872 TC 6 160,980,529 90,193 A, G 2.67 x 10⁻²³ - rs1564348 0.04 0 LDL 6 160,930,108 86,418 A, G 3.55 x 10⁻²¹ - rs1564348 0.04 0 rs486359 TG 6 160,694,431 93,855 C, G 3.64 x 10-09 -
KLF14 rs1562398 TG 7 130,108,471 93,855 C, G 2.37 x 10-08 - LPL rs7016529 HDL 8 19,850,911 84,515 T, C 6.38 x 10-37 + rs12678919 1 0.004
TG 8 19,850,911 81,126 T, C 1.74 x 10⁻²⁹ - rs12678919 1 0.004 TRIB1 rs12677676 TC 8 126,571,708 68,665 A, G 2.04 x 10-09 - rs2954029 0.73 0.045 ABCA1 rs4149311 TC 9 104,668,332 92,064 T, C 2.30 x 10⁻¹⁰ + rs1883025 0.14 0.012
rs1800978 LDL 9 106,705,799 92,510 C, G 3.77 x 10-08 + rs11789603 HDL 9 104,726,574 94,899 T, C 4.49 x 10⁻¹⁴ + rs1883025 0.22 0.014
SPTY2D1 rs10128711 LDL 11 18,589,560 88,177 T, C 2.66 x 10-08 - APOA1-C3-A4-A5 rs9804646 TC 11 116,170,289 90,646 T, C 6.70 x 10⁻¹² - rs964184 0.065 0.002
rs12225230 HDL 11 116,233,840 97,559 C, G 6.77 x 10⁻³³ + rs964184 0.54 0.19 ZNF664 rs11057244 HDL 12 122,298,143 93,375 C, G 4.58 x 10-09 + rs4765127 0.34 0.0062
rs838880 HDL 12 123,786,473 80,113 T, C 8.54 x 10⁻¹⁵ - rs4765127 0.26 0.018 NYNRIN rs6573778 TC 14 23,942,049 97,148 T, C 1.99 x 10-08 +
LIPC rs261342 TC 15 56,518,445 97,148 C, G 1.27 x 10⁻²¹ - rs1532085 0.06 0.001 rs2070895 HDL 15 56,511,231 97,559 A, G 1.53 x 10-80 + rs1532085 0.15 0.005 rs261334 TG 15 56,514,036 93,855 C, G 1.56 x 10⁻¹³ - rs1532085 0.03 0
CETP rs9939224 HDL 16 55,560,233 92,366 T, G 3.98 x 10-120 - rs3764261 1 0.12
doi: 10.1038/nature09270 SUPPLEMENTARY INFORMATION
www.nature.com/nature 53
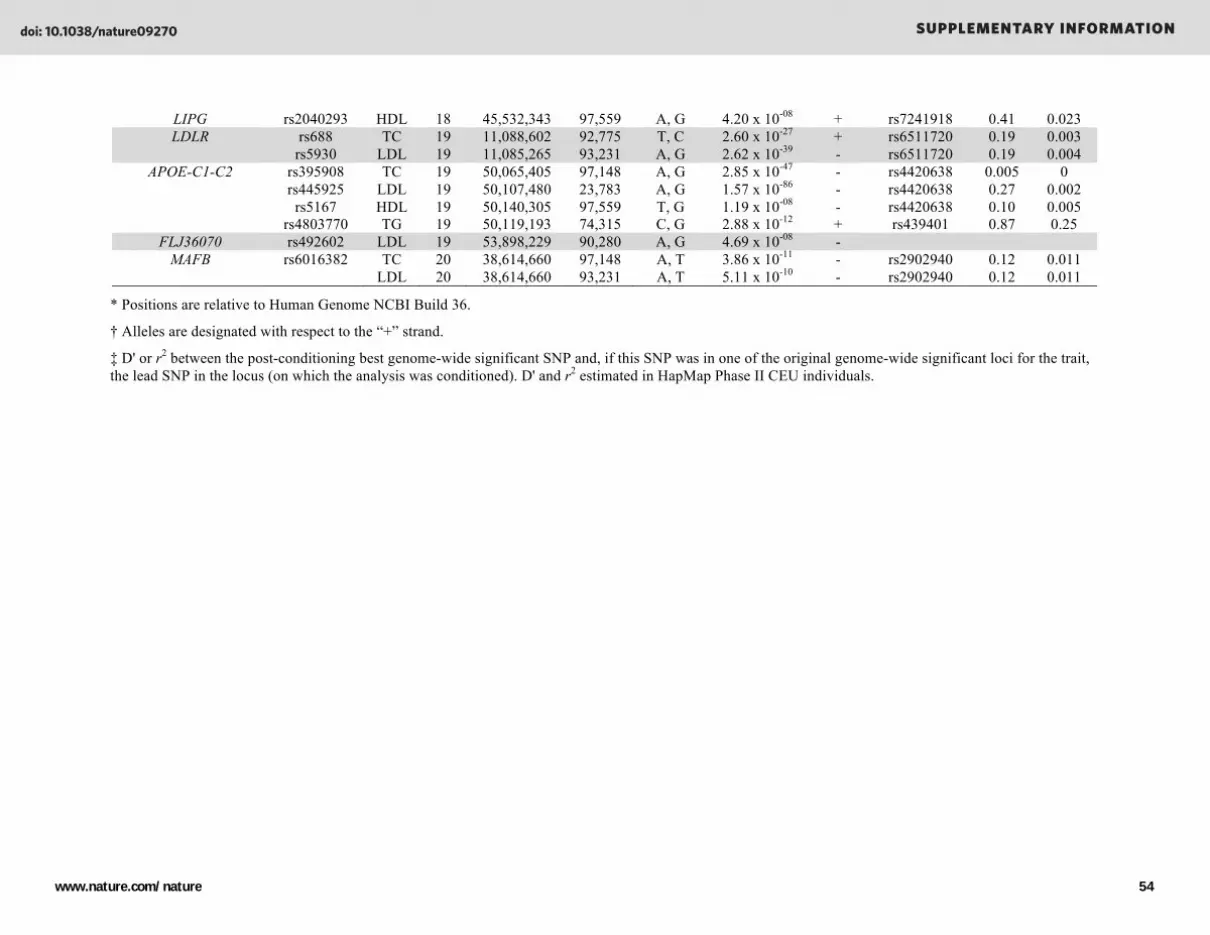
LIPG rs2040293 HDL 18 45,532,343 97,559 A, G 4.20 x 10-08 + rs7241918 0.41 0.023 LDLR rs688 TC 19 11,088,602 92,775 T, C 2.60 x 10⁻²⁷ + rs6511720 0.19 0.003
rs5930 LDL 19 11,085,265 93,231 A, G 2.62 x 10-39 - rs6511720 0.19 0.004 APOE-C1-C2 rs395908 TC 19 50,065,405 97,148 A, G 2.85 x 10-47 - rs4420638 0.005 0
rs445925 LDL 19 50,107,480 23,783 A, G 1.57 x 10-86 - rs4420638 0.27 0.002 rs5167 HDL 19 50,140,305 97,559 T, G 1.19 x 10-08 - rs4420638 0.10 0.005 rs4803770 TG 19 50,119,193 74,315 C, G 2.88 x 10⁻¹² + rs439401 0.87 0.25
FLJ36070 rs492602 LDL 19 53,898,229 90,280 A, G 4.69 x 10-08 - MAFB rs6016382 TC 20 38,614,660 97,148 A, T 3.86 x 10⁻¹¹ - rs2902940 0.12 0.011
LDL 20 38,614,660 93,231 A, T 5.11 x 10⁻¹⁰ - rs2902940 0.12 0.011
* Positions are relative to Human Genome NCBI Build 36.
† Alleles are designated with respect to the “+” strand.
‡ D' or r2 between the post-conditioning best genome-wide significant SNP and, if this SNP was in one of the original genome-wide significant loci for the trait, the lead SNP in the locus (on which the analysis was conditioned). D' and r2 estimated in HapMap Phase II CEU individuals.
doi: 10.1038/nature09270 SUPPLEMENTARY INFORMATION
www.nature.com/nature 54

Supplementary Table 7. Loci exhibiting sex heterogeneity.
Locus* SNP Chr Position† Trait Allele1, Allele2‡ Female n Female
P-value Female Effect
(SE)§ Male n Male P-value
Male Effect (SE)§
Heterogeneity P-value
Loci identified in primary analysis that also demonstrate heterogeneity of effect size in men and women||
LPL rs12678919 8 19,888,502 HDL A, G 62,816 4 x 10-37 -0.133 (0.01) 37,745 5 x 10-50 -0.196
(0.012) 3 x 10⁻⁵
ZNF664 rs12310367 12 123,052,631 TG A, G 59,473 4 x 10⁻¹⁰ 0.043 (0.007) 35,288 0.61 0.002
(0.008) 5 x 10⁻⁵
CILP2 rs10401969 19 19,268,718 TC T, C 62,932 5 x 10-11 0.095 (0.013) 37,873 2 x 10-21 0.177
(0.017) 3 x 10⁻⁵
CILP2 rs10401969 19 19,268,718 LDL T, C 60,529 0.03 0.030 (0.013) 35,734 9 x 10-15 0.149
(0.017) 4 x 10⁻⁹
APOE rs4420638 19 50,114,786 TC A, G 57,292 1 x 10-72 -0.188 (0.01) 32,624 6 x 10-20 -0.124
(0.012) 2 x 10⁻⁵
Loci with P < 5 x 10⁻⁸ in only one sex
LRPAP1 rs762861 4 3,411,809 TG C, G 53,412 4 x 10⁻⁸ 0.045 (0.009) 29,868 0.07 0.020
(0.011) 0. 07
DHX16 rs9262145 6 30,762,510 LDL C, G 61,803 0.80 -0.003 (0.007) 36,840 4 x 10⁻⁸ 0.048
(0.009) 1 x 10⁻⁶
VEGFA rs998584 6 43,865,874 TG A, C 55,289 0.007 0.020 (0.008) 31,104 1 x 10⁻⁸ 0.053
(0.009) 0.004
KLF14 rs1562398 7 13,010,8471 TG C, G 59,473 2 x 10-12 -0.046 (0.007) 35,288 0.05 -0.012
(0.008) 7 x 10-4
SOX17 rs10102164 8 55,584,167 TC A, G 64,235 0.01 0.019 (0.007) 39,104 4 x 10⁻¹⁰ 0.059
(0.009) 4 x 10⁻⁴
ABCA8 rs740516 17 64,594,557 LDL C, G 61,233 7 x 10⁻⁹ 0.062 (0.011) 35,156 0.24 0.027
(0.016) 0.05
C20orf152 rs7265718 20 34,098,855 TC T, G 64,235 0.02 0.022 (0.009) 39,104 2 x 10⁻⁸ 0.062
(0.011) 0.003 * Bold indicates locus already identified as genome-wide significant in primary analysis. † Positions are relative to Human Genome NCBI Build 36. ‡ Alleles are designated with respect to the “+” strand. § Effect sizes and standard errors are in s.d. units. || Pre-specified statistical threshold of P < 0.0005 to account for multiple testing of 102 lead SNPs in 95 loci.
doi: 10.1038/nature09270 SUPPLEMENTARY INFORMATION
www.nature.com/nature 55

Supplementary Table 8. Cis-acting associations of SNPs with transcript levels in human liver.
* Positions are relative to Human Genome NCBI Build 36. † Alleles are designated with respect to the “+” strand.
Mean expression Lead SNP Chr Position* Transcript
gene symbol # of
samples
Major, minor
alleles† Homo. major Hetero. Homo.
minor
Transcript P-value Trait
Lipid effect (modeled on minor allele)
rs12027135 1 25,648,320 RHCE 948 T, A -0.064 0.005 0.068 7E-54 LDL - TC - RHD 953 T, A -0.030 -0.008 0.027 4E-8 LDL - TC - TMEM50A 955 T, A -0.028 -0.010 0.024 4E-8 LDL - TC - TMEM57 954 T, A -0.088 0.004 0.081 2E-145 LDL - TC -
rs2131925 1 62,798,530 ANGPTL3 924 T, G 0.033 -0.031 -0.104 1E-13 TG - LDL - TC - DOCK7 952 T, G -0.018 0.018 0.068 1E-22 TG - LDL - TC -
rs629301 1 109,619,829 CELSR2 951 T, G -0.053 0.114 0.268 5E-94 TC - LDL - PSMA5 955 T, G -0.025 0.024 0.037 9E-17 LDL - TC - PSRC1 949 T, G -0.170 0.291 0.531 2E-271 LDL - TC - SORT1 951 T, G -0.182 0.286 0.537 2E-300 LDL - TC - SYPL2 955 T, G -0.039 0.041 0.129 1E-23 TC - LDL -
rs1260326 2 27,584,444 IFT172 944 C, T 0.037 0.002 -0.050 7E-32 TC + TG +
rs13107325 4 103,407,732 SLC39A8 952 C, T 0.009 -0.075 -0.167 3E-19 HDL - rs3177928 6 32,520,413 HLA-DQB1 955 G, A 0.026 -0.043 -0.110 2E-13 TC +
HLA-DRB1 918 G, A -0.052 0.171 0.257 7E-44 TC + rs9488822 6 116,419,586 FRK 953 A, T 0.030 -0.010 -0.068 4E-12 LDL -
TC - rs9987289 8 9,220,768 PPP1R3B 955 G, A -0.030 0.134 0.264 1E-14 LDL -
TC - HDL -
rs518080 9 15,295,378 TTC39B 953 C, G -0.025 0.036 0.076 2E-15 HDL - rs10128711 11 18,589,560 SPTY2D1 952 C, T -0.036 0.019 0.069 1E-16 TC -
rs174546 11 61,326,406 FADS1 944 C, T 0.085 -0.017 -0.197 5E-18 TG + HDL - LDL - TC -
rs11220462 11 125,749,162 ST3GAL4 951 G, A -0.019 0.062 0.098 2E-22 LDL + TC +
rs7134594 12 108,484,576 MMAB 955 T, C -0.106 0.019 0.111 2E-44 HDL - rs8017377 14 23,953,727 NYNRIN 954 G, A -0.098 0.023 0.088 3E-46 LDL + rs2929282 15 42,033,223 CKMT1A 954 T, A -0.003 0.072 0.132 8E-28 TG + rs1532085 15 56,470,658 ALDH1A2 949 G, A 0.020 0.001 -0.026 5E-8 HDL +
TC + TG + LIPC 953 G, A 0.067 -0.034 -0.129 7E-23 TG + HDL + TC +
rs11649653 16 30,825,988 VKORC1 950 C, G 0.076 -0.016 -0.150 7E-47 TG - rs16942887 16 66,485,543 NFATC3 954 G, A 0.009 -0.048 -0.090 3E-15 HDL + rs11869286 17 35,067,382 PERLD1 950 C, G -0.037 0.021 0.085 9E-24 HDL - rs7206971 17 42,780,114 TBKBP1 952 G, A 0.023 0.004 -0.025 6E-10 TC +
LDL - rs7241918 18 45,414,951 LIPG 938 T, G -0.031 0.040 0.132 4E-10 HDL -
TC - rs7255436 19 83,39,196 ANGPTL4 902 A, C 0.058 -0.037 -0.107 4E-8 HDL - rs439401 19 50,106,291 APOC4 920 C, T 0.037 -0.018 -0.054 4E-9 TG - rs386000 19 59,484,573 LILRA3 953 G, C 0.021 -0.014 -0.044 9E-12 HDL +
rs2277862 20 33,616,196 CEP250 949 C, T -0.009 0.058 0.072 3E-8 TC - CPNE1 954 C, T 0.018 -0.039 -0.080 7E-41 TC -
rs6065906 20 43,987,422 PLTP 913 T, C 0.041 -0.049 -0.142 3E-18 TG + HDL -
rs181362 22 20,262,068 UBE2L3 954 C, T -0.013 0.030 0.028 6E-13 HDL -
doi: 10.1038/nature09270 SUPPLEMENTARY INFORMATION
www.nature.com/nature 56

Supplementary Table 9. Cis-acting associations of SNPs with transcript levels in human omental fat.
Mean expression Lead SNP Chr Position* Transcript
gene symbol # of
samples
Major, minor
alleles† Homo. major Hetero. Homo.
minor
Transcript P-value Trait
Lipid effect (modeled on minor allele)
rs12027135 1 25648320 RHCE 730 T, A 0.025 0.002 -0.026 3E-55 LDL - TC - RHD 736 T, A -0.025 -0.003 0.032 5E-10 LDL - TC - TMEM50A 739 T, A 0.030 0.004 -0.035 2E-29 TC - LDL - TMEM57 740 T, A 0.056 0.004 -0.063 3E-115 TC - LDL -
rs4660293 1 39800767 OXCT2 740 A, G 0.074 0.041 -0.051 2E-37 HDL - rs2131925 1 62798530 DOCK7 738 T, G 0.126 0.032 -0.069 3E-91 LDL -
TC - TG -
rs1260326 2 27584444 IFT172 705 C, T -0.107 0.000 0.075 2E-65 TG + TC +
rs10195252 2 165221337 GRB14 734 T, C -0.079 -0.008 0.040 1E-13 TG - rs2972146 2 226808942 IRS1 714 T, G 0.047 0.009 -0.026 2E-8 TG -
HDL + rs3177928 6 32520413 HLA-DQA1 740 G, A 0.171 0.275 -0.051 2E-11 TC +
HLA-DQA2 737 G, A -0.048 -0.036 0.008 9E-13 TC + HLA-DRB1 728 G, A 0.264 0.274 -0.058 1E-15 TC + HLA-DRB5 728 G, A 0.516 0.271 -0.089 7E-12 TC +
rs2814944 6 34660775 UHRF1BP1 725 G, A 0.102 0.044 -0.023 3E-25 HDL - rs9488822 6 116419586 FRK 740 A, T -0.083 -0.014 0.058 6E-33 TC -
LDL - NT5DC1 735 A, T -0.013 -0.007 0.018 1E-8 LDL - TC -
rs3136441 11 46699823 ARHGAP1 739 T, C 0.015 -0.018 -0.003 1E-9 HDL + rs174546 11 61326406 FADS1 727 C, T -0.098 -0.027 0.045 2E-8 HDL -
LDL - TC - TG +
rs7134594 12 108484576 MMAB 738 T, C 0.093 0.022 -0.082 1E-72 HDL - rs2652834 15 61183920 LACTB 732 G, A 0.000 -0.031 0.017 2E-11 HDL -
rs16942887 16 66485543 ACD 721 G, A -0.011 -0.016 0.004 1E-8 HDL + NFATC3 741 G, A -0.068 -0.032 0.008 4E-10 HDL + PRMT7 729 G, A 0.034 0.025 -0.006 5E-9 HDL +
rs11869286 17 35067382 CRKRS 691 C, G 0.020 -0.012 -0.056 3E-18 HDL - PERLD1 737 C, G -0.014 0.007 0.038 1E-10 HDL -
rs2277862 20 33616196 CEP250 737 C, T -0.027 0.043 0.103 8E-37 TC - CPNE1 732 C, T 0.030 -0.051 -0.114 1E-73 TC - ERGIC3 731 C, T 0.014 -0.015 -0.062 2E-11 TC -
* Positions are relative to Human Genome NCBI Build 36. † Alleles are designated with respect to the “+” strand.
doi: 10.1038/nature09270 SUPPLEMENTARY INFORMATION
www.nature.com/nature 57

Supplementary Table 10. Cis-acting association of SNPs with transcript levels in human subcutaneous fat.
Mean expression Lead SNP Chr Position* Transcript
gene symbol # of
samples
Major, minor
alleles† Homo. major Hetero. Homo.
minor
Transcript P-value Trait
Lipid effect (modeled on minor allele)
rs12027135 1 25648320 RHCE 607 T, A 0.038 0.001 -0.038 1E-41 LDL - TC - TMEM50A 609 T, A 0.040 0.005 -0.041 2E-29 LDL - TC - TMEM57 609 T, A 0.080 0.004 -0.082 1E-99 LDL - TC -
rs4660293 1 39800767 OXCT2 609 A, G 0.037 0.038 -0.040 1E-17 HDL - rs2131925 1 62798530 DOCK7 608 T, G 0.188 0.054 -0.110 6E-80 TG -
LDL - TC -
rs1260326 2 27584444 IFT172 582 C, T -0.102 0.000 0.071 8E-54 TC + TG +
rs3177928 6 32520413 HLA-DQA1 609 G, A 0.229 0.287 -0.064 2E-10 TC + HLA-DQA2 605 G, A -0.067 -0.082 0.017 6E-13 TC + HLA-DRB1 605 G, A -0.138 -0.145 0.034 7E-13 TC + HLA-DRB5 604 G, A 0.517 0.315 -0.103 2E-9 TC +
rs2814944 6 34660775 UHRF1BP1 589 G, A 0.095 0.041 -0.024 2E-18 HDL - rs9488822 6 116419586 FRK 607 A, T -0.073 -0.007 0.052 3E-18 LDL -
TC - rs17145738 7 72620810 MLXIPL 539 C, T -0.020 0.018 -0.035 2E-8 HDL +
TG - rs7134594 12 108484576 MMAB 606 T, C 0.093 0.026 -0.079 4E-53 HDL -
rs11869286 17 35067382 CRKRS 588 C, G 0.024 -0.018 -0.042 3E-11 HDL - GSDM1 607 C, G 0.080 -0.016 -0.311 3E-8 HDL -
rs2277862 20 33616196 CEP250 609 C, T -0.029 0.047 0.138 6E-31 TC - CPNE1 607 C, T 0.031 -0.050 -0.138 1E-47 TC - ERGIC3 583 C, T 0.011 -0.022 -0.038 2E-8 TC -
* Positions are relative to Human Genome NCBI Build 36. † Alleles are designated with respect to the “+” strand.
doi: 10.1038/nature09270 SUPPLEMENTARY INFORMATION
www.nature.com/nature 58

Supplementary Table 11. Associations of lead SNPs in European and non-European groups.
Primary meta-analysis (n = 100,184)
European (n = 7,063)
East Asian (n =15,046)
South Asian (n = 9,705)
African American (n =8,061) Locus Lead SNP Trait Major
Allele* Minor Allele* Dir. P-value Het.† Dir. P-value Dir. P-value Het.‡ Dir. P-value Het.‡ Dir. P-value Het.‡
LDLRAP1 rs12027135 LDL T A - 1E-10 N - 1E-1 - 7E-5 Y - 3E-1 N - 4E-1 N TC T A - 4E-11 N - 2E-1 - 3E-3 N - 2E-1 N n.d. n.d.
PABPC4 rs4660293 HDL A G - 4E-10 N - 2E-3 - 6E-3 N - 3E-1 N - 8E-1 N PCSK9 rs2479409 LDL A G + 2E-28 N + 1E-1 + 4E-1 Y + 4E-2 N + 3E-3 N
TC A G + 4E-24 N + 5E-2 + 5E-1 Y + 1E-1 N n.d. n.d. ANGPTL3 rs2131925 TG T G - 9E-43 N - 3E-4 - 2E-7 N - 3E-7 N - 1E-3 N
LDL T G - 2E-17 N - 2E-3 + 7E-1 N - 9E-1 N - 1E-2 N TC T G - 3E-40 N - 9E-5 - 6E-3 N - 1E-2 N n.d. n.d.
EVI5 rs7515577 TC A C - 3E-8 N - 4E-3 - 2E-2 N - 9E-1 N n.d. n.d. SORT1 rs629301 LDL T G - 1E-170 Y - 2E-11 - 5E-13 N - 6E-18 N - 2E-14 N
TC T G - 6E-131 N - 8E-10 - 6E-11 N - 2E-11 N n.d. n.d. ZNF648 rs1689800 HDL A G - 3E-10 N - 2E-1 - 7E-4 N - 4E-1 N + 6E-1 N MOSC1 rs2642442 LDL T C - 1E-10 N + 9E-1 - 2E-2 N - 1E-1 N - 2E-1 N
TC T C - 6E-13 N - 3E-1 - 2E-1 N - 2E-1 N n.d. n.d. GALNT2 rs4846914 HDL A G - 4E-21 N - 4E-1 - 2E-1 N - 2E-5 N - 4E-3 N
TG A G + 8E-14 N + 3E-3 + 3E-1 N + 9E-1 N + 3E-1 N IRF2BP2 rs514230 LDL T A - 9E-12 N - 2E-1 - 5E-2 Y - 8E-3 N - 4E-1 N
TC T A - 5E-14 N - 2E-2 - 4E-3 N - 8E-3 N n.d. n.d. APOB rs1042034 HDL T C + 1E-30 N + 3E-3 + 4E-1 Y + 4E-4 N + 1E-2 N
TG T C - 1E-45 N - 4E-4 + 9E-1 Y - 2E-5 N - 5E-4 N rs1367117 LDL G A + 5E-114 N + 8E-6 + 2E-3 N + 2E-6 N + 2E-2 N TC G A + 4E-96 N + 5E-7 + 5E-4 N + 4E-8 N n.d. n.d.
GCKR rs1260326 TC C T + 7E-27 N + 4E-3 + 3E-8 N + 8E-7 N n.d. n.d. TG C T + 6E-133 Y + 5E-14 + 1E-17 N + 7E-16 N + 2E-5 N
ABCG5/8 rs4299376 LDL T G + 2E-47 Y + 3E-3 + 3E-2 Y + 2E-1 N + 4E-2 N TC T G + 4E-45 N + 3E-3 + 3E-1 N + 1E-1 N n.d. n.d.
RAB3GAP1 rs7570971 TC C A + 2E-8 N + 7E-1 - 6E-1 N n.d. n.d. n.d. n.d. COBLL1 rs10195252 TG T C - 2E-10 N - 3E-2 - 8E-1 N - 2E-2 N - 2E-2 N
rs12328675 HDL T C + 3E-10 N + 5E-3 + 7E-2 N n.d. n.d. + 4E-3 N IRS1 rs2972146 TG T G - 3E-8 N - 1E-1 - 2E-3 N - 1E-1 N + 1 N
HDL T G + 3E-9 N + 3E-1 + 5E-3 N + 2E-3 N + 8E-1 N RAF1 rs2290159 TC G C - 4E-9 N - 8E-2 - 4E-1 N - 8E-1 N n.d. n.d.
MSL2L1 rs645040 TG T G - 3E-8 N - 3E-1 - 5E-1 N + 8E-1 N - 4E-2 N KLHL8 rs442177 TG T G - 9E-12 N - 5E-1 - 5E-3 N - 5E-4 N - 5E-1 N
SLC39A8 rs13107325 HDL C T - 7E-11 N - 7E-1 + 8E-1 N n.d. n.d. + 5E-1 N ARL15 rs6450176 HDL G A - 5E-8 N + 6E-1 n.d. n.d n.d. n.d. - 8E-2 N
MAP3K1 rs9686661 TG C T + 1E-10 N + 7E-1 + 4E-2 N + 3E-1 N + 6E-1 N HMGCR rs12916 LDL T C + 5E-45 N + 1E-4 + 2E-15 N + 1E-4 N + 2E-1 N
TC T C + 9E-47 N + 2E-3 + 5E-12 N + 9E-4 N n.d. n.d.
doi: 10.1038/nature09270 SUPPLEMENTARY INFORMATION
www.nature.com/nature 59

TIMD4 rs6882076 LDL C T - 2E-22 N - 2E-2 - 3E-2 N - 1E-1 N - 2E-1 N TC C T - 8E-28 N - 1E-3 - 4E-3 N - 8E-3 N n.d. n.d. TG C T - 1E-10 N - 7E-2 - 4E-2 N - 6E-4 N - 3E-1 N
MYLIP rs3757354 LDL C T - 1E-11 N - 1E-2 + 5E-1 Y + 2E-1 Y - 4E-2 N TC C T - 3E-9 N - 3E-1 + 8E-1 N + 4E-1 N n.d. n.d.
HFE rs1800562 LDL G A - 6E-10 N - 1E-2 - 2E-1 N n.d. n.d. - 8E-1 N TC G A - 3E-8 N - 1E-2 - 3E-1 N n.d. n.d. n.d. n.d.
HLA rs2247056 TG C T - 2E-15 N - 2E-3 - 1E-1 Y - 8E-3 N + 9E-1 N rs3177928 LDL G A + 2E-15 N + 3E-2 + 6E-2 N + 1E-1 N + 2E-3 N TC G A + 4E-19 N + 6E-2 + 8E-3 N + 2E-1 N n.d. n.d.
C6orf106 rs2814982 TC C T - 5E-11 N + 2E-1 + 9E-1 N - 1E-1 N n.d. n.d. rs2814944 HDL G A - 4E-9 N - 5E-1 - 9E-1 N - 6E-1 N + 3E-1 N
FRK rs9488822 TC A T - 2E-10 N - 2E-1 - 6E-1 N - 3E-2 N n.d. n.d. LDL A T - 4E-8 N - 2E-1 - 6E-1 N - 1E-2 N - 9E-1 N
CITED2 rs605066 HDL T C - 3E-8 N - 1E-2 - 6E-2 N + 5E-1 N - 1 N LPA rs1564348 LDL T C + 2E-17 N + 2E-4 + 9E-1 N n.d. n.d. + 6E-2 N
TC T C + 1E-16 N + 2E-3 + 9E-1 N n.d. n.d. n.d. n.d. rs1084651 HDL G A - 3E-8 N - 1E-2 - 1E-1 N n.d. n.d. - 3E-1 N
DNAH11 rs12670798 TC T C + 9E-10 N + 1E-2 + 4E-1 Y + 5E-2 N n.d. n.d. LDL T C + 7E-10 N + 1E-2 + 1 Y + 1E-1 N - 6E-1 N
NPC1L1 rs2072183 TC G C + 3E-11 N + 3E-1 - 7E-1 Y + 5E-2 N n.d. n.d. LDL G C + 7E-11 N + 1 - 8E-1 Y + 2E-2 N + 4E-1 N
TYW1B rs13238203 TG C T - 1E-9 N - 6E-1 n.d. n.d. n.d. n.d. n.d. n.d. MLXIPL rs17145738 TG C T - 6E-58 N - 2E-5 - 2E-6 N - 3E-11 N - 2E-1 N
HDL C T + 1E-9 N + 1E-1 + 1 Y + 3E-1 N - 2E-2 Y KLF14 rs4731702 HDL C T + 1E-15 N + 2E-1 + 2E-1 N + 3E-3 N + 2E-1 N
PPP1R3B rs9987289 HDL G A - 6E-25 Y - 2E-2 - 4E-2 Y - 4E-6 N - 4E-5 N LDL G A - 2E-14 N - 9E-2 - 2E-1 N - 3E-3 N - 7E-2 N TC G A - 7E-23 N - 9E-2 - 1E-1 N - 8E-3 N n.d. n.d.
PINX1 rs11776767 TG G C + 1E-8 N - 8E-1 + 5E-1 N + 5E-3 N + 3E-1 N NAT2 rs1495741 TC A G + 3E-8 N - 1 + 6E-1 N + 8E-1 N n.d. n.d.
TG A G + 5E-14 N - 7E-1 + 8E-2 Y + 4E-2 N + 4E-1 N LPL rs12678919 HDL A G + 1E-97 N + 4E-7 + 7E-17 N + 2E-7 N + 1E-3 N
TG A G - 2E-115 Y - 1E-11 - 6E-18 N - 7E-15 N - 5E-3 N CYP7A1 rs2081687 LDL C T + 2E-8 N + 1E-1 + 1 N + 7E-1 N + 8E-1 N
TC C T + 2E-12 N + 2E-1 + 5E-1 Y + 4E-1 N n.d. n.d. TRPS1 rs2293889 HDL G T - 6E-11 N - 6E-2 - 2E-3 N - 9E-2 N - 3E-1 N
TC A C - 3E-8 N - 5E-2 - 2E-3 N + 9E-1 N n.d. n.d. TRIB1 rs2954029 LDL A T - 5E-29 N - 7E-2 - 2E-4 N - 2E-2 N - 6E-1 N
TC A T - 1E-35 N - 4E-4 - 4E-8 N - 3E-4 N n.d. n.d. TG A T - 3E-55 N - 8E-6 - 1E-9 N - 3E-6 N - 3E-1 N HDL A T + 5E-18 N + 3E-2 - 7E-1 Y + 2E-1 N + 2E-1 N
PLEC1 rs11136341 LDL A G + 4E-13 N + 7E-1 + 1E-2 N + 5E-1 N + 5E-2 N TC A G + 9E-10 N + 9E-1 + 5E-3 N + 8E-1 N n.d. n.d.
TTC39B rs581080 HDL C G - 3E-12 N - 1E-1 + 4E-1 N - 6E-2 N - 5E-1 N
doi: 10.1038/nature09270 SUPPLEMENTARY INFORMATION
www.nature.com/nature 60

TTC39B TC C G - 3E-9 N + 6E-1 - 7E-1 Y - 6E-1 N n.d. n.d. ABCA1 rs1883025 HDL C T - 2E-33 Y - 9E-2 - 2E-12 N - 2E-5 N - 3E-1 N
TC C T - 3E-27 N - 5E-5 - 5E-7 Y - 2E-2 N n.d. n.d. ABO rs9411489 TC C T + 5E-10 N n.d. n.d. n.d. n.d. n.d. n.d. n.d. n.d.
LDL C T + 6E-13 N n.d. n.d. n.d. n.d. n.d. n.d. n.d. n.d. JMJD1C rs10761731 TG A T - 4E-12 N - 4E-3 - 4E-4 N - 5E-1 N - 8E-1 N CYP26A1 rs2068888 TG G A - 2E-8 N - 5E-1 - 8E-2 N - 6E-1 N - 7E-1 N
GPAM rs2255141 LDL G A + 2E-9 N + 1E-1 + 8E-3 N + 2E-1 N + 5E-2 N TC G A + 2E-10 N + 3E-1 + 3E-3 N + 2E-1 N n.d. n.d.
AMPD3 rs2923084 HDL A G - 5E-8 N - 8E-1 - 4E-1 N + 5E-1 N - 4E-2 N SPTY2D1 rs10128711 TC C T - 3E-8 N - 6E-2 + 4E-1 Y - 5E-1 N n.d. n.d.
LRP4 rs3136441 HDL T C + 4E-18 N + 5E-4 + 2E-1 N + 3E-3 N n.d. n.d. FADS1–2–3 rs174546 TG C T + 5E-24 N + 2E-1 + 2E-3 N + 3E-5 N + 3E-5 N
TC C T - 3E-22 N - 2E-5 - 2E-2 N - 2E-2 N n.d. n.d. LDL C T - 2E-21 N - 1E-3 - 4E-3 N - 8E-3 N - 2E-1 N HDL C T - 3E-22 N - 3E-2 - 6E-2 N - 5E-5 N - 1E-1 N
APOC3 rs964184 HDL C G - 5E-47 N - 2E-2 - 1E-23 N - 3E-5 N - 3E-1 Y LDL C G + 2E-26 Y + 2E-3 - 2E-1 Y - 3E-1 Y + 9E-1 Y TC C G + 6E-57 Y + 2E-9 + 2E-2 Y + 1E-4 N n.d. n.d. TG C G + 7E-240 Y + 4E-28 + 2E-50 N + 9E-52 Y + 2E-1 Y
UBASH3B rs7941030 TC T C + 2E-10 N + 4E-1 + 3E-2 N + 5E-2 N n.d. n.d. HDL T C + 3E-8 N - 6E-1 - 9E-1 Y + 8E-2 N + 1E-2 N
ST3GAL4 rs11220462 LDL G A + 1E-15 N + 8E-2 + 4E-2 N + 2E-1 N + 4E-1 N TC G A + 6E-11 N + 4E-1 + 1E-1 N + 3E-1 N n.d. n.d.
PDE3A rs7134375 HDL C A + 4E-8 N + 8E-1 + 1E-1 N + 8E-1 N + 3E-1 N LRP1 rs11613352 TG C T - 4E-10 N - 6E-2 - 3E-1 N n.d. n.d. - 2E-2 N
HDL C T + 4E-8 N + 5E-3 + 2E-1 N n.d. n.d. + 1E-1 N MVK rs7134594 HDL T C - 7E-15 N - 7E-3 - 2E-1 N n.d. n.d. - 2E-1 N BRAP rs11065987 LDL A G - 2E-9 N - 9E-1 - 3E-1 N n.d. n.d. - 2E-1 N
TC A G - 7E-12 N - 6E-1 - 2E-1 N n.d. n.d. n.d. n.d. TCF1 rs1169288 LDL A C + 1E-15 N + 6E-3 + 9E-2 N + 2E-1 N + 4E-1 N
TC A C + 2E-14 N + 1E-3 + 2E-1 N + 2E-1 N n.d. n.d. SBNO1 rs4759375 HDL C T + 8E-9 N + 3E-1 n.d. n.d. n.d. n.d. + 3E-1 N ZNF664 rs4765127 HDL G T + 3E-10 N - 9E-1 + 4E-1 Y - 9E-1 N + 9E-3 N
TG G T - 2E-8 N + 9E-1 - 6E-1 N - 8E-1 N - 9E-1 N SCARB1 rs838880 HDL T C + 3E-14 N + 3E-2 + 9E-1 N - 7E-1 N n.d. n.d.
KIAA1305 rs8017377 LDL G A + 5E-11 N + 3E-1 - 1 N + 8E-2 N + 5E-2 N CAPN3 rs2412710 TG G A + 2E-8 N + 5E-1 n.d. n.d. n.d. n.d. - 5E-1 N FRMD5 rs2929282 TG A T + 2E-11 N + 7E-2 - 3E-1 N - 6E-1 N - 5E-1 Y
LIPC rs1532085 HDL G A + 3E-96 Y + 5E-12 + 4E-30 N + 9E-3 N + 5E-3 N TC G A + 9E-20 N + 1E-1 + 6E-8 N + 2E-1 N n.d. n.d. TG G A + 2E-11 N + 4E-1 + 1E-4 N + 2E-1 N + 2E-3 N
LACTB rs2652834 HDL G A - 9E-9 N - 7E-1 n.d. n.d. n.d. n.d. n.d. n.d. CTF1 rs11649653 TG C G - 3E-8 N - 2E-1 n.d. n.d. n.d. n.d. + 5E-1 N CETP rs3764261 LDL C A - 2E-12 N - 4E-5 + 4E-1 N - 8E-3 N - 2E-1 N
doi: 10.1038/nature09270 SUPPLEMENTARY INFORMATION
www.nature.com/nature 61

CETP HDL C A + 7e-380 Y + 6E-36 + 6E-19 N + 4E-38 N + 3E-18 N TC C A + 7E-14 N + 9E-1 + 5E-3 N + 2E-1 N n.d. n.d. TG C A - 6E-12 N - 3E-3 - 5E-3 N + 1 N - 7E-1 N
LCAT rs16942887 HDL G A + 8E-33 N + 6E-1 + 3E-3 N + 5E-7 N + 1E-10 N HPR rs2000999 LDL G A + 2E-22 N + 6E-2 + 3E-6 N + 1E-1 N - 1 N
TC G A + 3E-24 N + 1E-5 + 2E-4 N + 6E-2 N n.d. n.d. CMIP rs2925979 HDL C T - 2E-11 N - 1E-2 - 5E-2 N - 1E-3 N - 1E-1 N
STARD3 rs11869286 HDL C G - 1E-13 N - 5E-2 - 2E-2 N - 4E-1 N - 3E-2 N OSBPL7 rs7206971 LDL G A + 2E-8 N + 4E-1 + 6E-1 N - 7E-1 N + 1E-1 N
TC G A + 1E-8 N + 3E-1 + 2E-1 N - 6E-1 N n.d. n.d. ABCA8 rs4148008 HDL C G - 2E-10 N - 1 - 6E-2 N - 1E-1 N - 9E-1 N PGS1 rs4129767 HDL A G - 8E-9 N - 3E-1 - 8E-3 N - 1E-1 N - 7E-1 N LIPG rs7241918 HDL T G - 3E-49 N - 5E-4 - 3E-3 N - 3E-5 N - 8E-1 N
TC T G - 6E-19 N - 3E-3 + 8E-1 Y - 1E-2 N n.d. n.d. MC4R rs12967135 HDL G A - 7E-9 N - 8E-2 - 7E-1 N - 6E-4 N - 6E-1 N
ANGPTL4 rs7255436 HDL A C - 3E-8 N - 4E-2 - 4E-1 N - 6E-3 N - 3E-1 N LDLR rs6511720 LDL G T - 4E-117 Y - 1E-14 - 7E-3 N n.d. n.d. - 5E-8 N
TC G T - 7E-97 N - 4E-11 - 7E-2 N n.d. n.d. n.d. n.d. LOC55908 rs737337 HDL T C - 3E-9 N - 2E-1 - 5E-4 N - 6E-7 N - 6E-6 N
CILP2 rs10401969 LDL T C - 7E-22 Y - 1E-1 - 2E-1 N - 4E-1 N + 2E-1 Y TC T C - 3E-38 Y - 3E-2 - 2E-2 N - 8E-3 N n.d. n.d. TG T C - 2E-29 N - 3E-4 - 9E-5 N - 8E-10 N + 5E-1 Y
APOE rs439401 TG C T - 1E-30 Y - 5E-3 - 4E-5 N - 1E-7 N n.d. n.d. rs4420638 HDL A G - 4E-21 N - 2E-3 - 3E-10 N - 5E-5 N + 5E-2 Y LDL A G + 9E-147 Y + 5E-19 + 2E-5 Y + 5E-2 Y + 1 Y TC A G + 5E-111 Y + 5E-16 + 1E-5 Y + 2E-2 N n.d. n.d.
FLJ36070 rs492602 TC A G + 2E-10 N + 1E-1 - 9E-1 N + 3E-7 N n.d. n.d. LILRA3 rs386000 HDL G C + 4E-16 N + 4E-1 - 5E-1 N + 3E-4 N - 6E-1 N ERGIC3 rs2277862 TC C T - 4E-10 N - 6E-1 - 2E-1 N - 4E-2 N n.d. n.d. MAFB rs2902940 TC A G - 6E-11 N + 6E-1 + 2E-1 Y - 2E-1 N n.d. n.d.
LDL A G - 2E-8 N - 5E-1 + 7E-1 Y - 2E-1 N - 9E-1 N TOP1 rs6029526 TC T A + 9E-17 N + 4E-5 + 1E-3 N + 1E-1 N n.d. n.d.
LDL T A + 4E-19 N + 7E-4 + 2E-3 N + 1E-1 N + 4E-1 N HNF4A rs1800961 HDL C T - 1E-15 N - 1E-5 - 5E-1 N - 5E-3 N + 9E-1 N
TC C T - 6E-13 N + 2E-1 - 1E-1 N - 2E-1 N n.d. n.d. PLTP rs6065906 TG T C + 3E-17 N + 8E-4 + 9E-1 N + 1E-1 N + 4E-1 N
HDL T C - 2E-22 N - 1E-2 + 1 N - 4E-1 N - 3E-2 N UBE2L3 rs181362 HDL C T - 1E-8 N - 7E-2 - 1E-4 N - 7E-3 N - 7E-1 N PLA2G6 rs5756931 TG T C - 4E-8 N - 3E-1 n.d. n.d. n.d. n.d. - 5E-2 N
n.d. = not determined. * Alleles are designated with respect to the “+” strand. † “Y” if inter-cohort heterogeneity P < 0.0005 (to account for multiple testing of 102 lead SNPs in 95 loci), “N” otherwise. ‡ “Y” if the heterogeneity P-value between effect size in the non-European group and effect size in the primary meta-analysis < 0.0005 (to account for multiple testing of 102 lead SNPs in 95 loci), “N” otherwise.
doi: 10.1038/nature09270 SUPPLEMENTARY INFORMATION
www.nature.com/nature 62

Supplementary Table 12. Multi-ethnic replication summary.
Cohort Trait # of SNPs tested
# of SNPs in same
direction*
Binomial P-value
# of SNPs in same direction with P < 0.05†
Binomial P-value
HDL 47 44 1 × 10⁻¹⁰ 23 < 2 × 10-16 LDL 36 35 5 × 10⁻¹⁰ 18 7 × 10-15 TC 51 46 1 × 10⁻⁹ 25 < 2 × 10-16
European
TG 32 29 1 × 10⁻⁶ 15 4 × 10-12 HDL 44 38 5 × 10⁻⁷ 18 1 × 10-12 LDL 36 29 2 × 10⁻⁴ 16 4 × 10-12 TC 51 43 3 × 10⁻⁷ 24 4 × 10-18
East Asian
TG 28 26 2 × 10⁻⁶ 16 3 × 10-14 HDL 39 35 2 × 10⁻⁷ 22 < 2 × 10-16 LDL 32 29 1 × 10⁻⁶ 12 1 × 10⁻⁸ TC 46 43 2 × 10⁻¹⁰ 19 1 × 10-13
South Asian
TG 27 24 3 × 10⁻⁵ 16 6 × 10-15 HDL 44 37 3 × 10⁻⁶ 14 8 × 10⁻⁹ LDL 36 33 1 × 10⁻⁷ 10 4 × 10⁻⁶ TC n.d. n.d. n.d. n.d. n.d.
African American‡
TG 30 24 7 × 10⁻⁴ 10 6 × 10⁻⁷
* The “Number of SNPs in same direction” column indicates the number of SNPs for which the direction of effect is concordant between GLGC and the European or non-European cohort for each trait. The P-value reported is one-tailed, based on a binomial draw with null expectation P = 0.5.
† The “Number of SNPs in same direction with P < 0.05” column indicates the number of SNPs for which the direction of effect is concordant between GLGC and the European or non-European cohort, and the p-value for SNP-trait association in the European or non-European cohort is < 0.05. The P-value reported is one-tailed, based on a binomial draw with null expectation P = 0.05.
‡ Analyses for total cholesterol were unavailable for the African American cohorts; n.d. = not determined.
doi: 10.1038/nature09270 SUPPLEMENTARY INFORMATION
www.nature.com/nature 63

Supplementary Table 13. Additional replication in Europeans.
Locus Lead SNP Trait Major Allele*
Minor Allele*
Primary meta-analysis (n = 100,184)
MDC-CC & FINRISK97 meta-analysis (n =12,017)†
Dir. P-value Dir. P-value PABPC4 rs4660293 HDL A G - 4E-10 - 3E-1 ZNF648 rs1689800 HDL A G - 3E-10 - 3E-3 IRF2BP2 rs514230 LDL T A - 9E-12 + 8E-1 MSL2L1 rs645040 TG T G - 3E-8 - 4E-2 KLHL8 rs442177 TG T G - 9E-12 - 6E-2
SLC39A8 rs13107325 HDL C T - 7E-11 - 6E-3 MAP3K1 rs9686661 TG C T + 1E-10 + 4E-3 MYLIP rs3757354 LDL C T - 1E-11 - 2E-3 HFE rs1800562 LDL G A - 6E-10 + 9E-1 HLA rs3177928 LDL G A + 2E-15 + 9E-3
NPC1L1 rs2072183 LDL G C + 7E-11 + 1E-2 KLF14 rs4731702 HDL C T + 1E-15 + 1E-2
PPP1R3B rs9987289 HDL G A - 6E-25 - 7E-6 JMJD1C rs10761731 TG A T - 4E-12 - 6E-1
UBASH3B rs7941030 HDL T C + 3E-8 + 3E-2 PDE3A rs7134375 HDL C A + 4E-8 + 5E-2 SCARB1 rs838880 HDL T C + 3E-14 + 8E-5
KIAA1305 rs8017377 LDL G A + 5E-11 + 1E-1 CAPN3 rs2412710 TG G A + 2E-8 + 2E-2
HPR rs2000999 LDL G A + 2E-22 + 7E-1 CMIP rs2925979 HDL C T - 2E-11 - 1E-2
STARD3 rs11869286 HDL C G - 1E-13 - 1E-1 PGS1 rs4129767 HDL A G - 8E-9 - 9E-1
LOC55908 rs737337 HDL T C - 3E-9 - 6E-5 LILRA3 rs386000 HDL G C + 4E-16 + 1E-4 TOP1 rs6029526 LDL T A + 4E-19 + 4E-1
* Alleles are designated with respect to the “+” strand.
† Includes 7,026 individuals from the National FINRISK 1997 Study (FINRISK97) and 4,991 individuals from Malmö Diet and Cancer Study – Cardiovascular Cohort (MDC-CC).
doi: 10.1038/nature09270 SUPPLEMENTARY INFORMATION
www.nature.com/nature 64

Supplementary Table 14. HapMap SNPs in high linkage disequilibrium with lead SNPs.
Locus Trait(s) Lead SNP # SNPs with r2 ≥ 0.8 in CEU*
# SNPs with r2 ≥ 0.8 in CEU &
JPT+CHB*
# SNPs with r2 ≥ 0.8 in CEU & YRI*
SPTY2D1 TC rs10128711 7 7 (7) 5 (7) COBLL1 TG rs10195252 6 6 (6) 5 (6) CILP2 TC, TG, LDL rs10401969 5 0 (4) 0 (5) APOB TG, HDL rs1042034 10 9 (10) 4 (10)
JMJD1C TG rs10761731 56 37 (56) 48 (53) LPA HDL rs1084651 3 0 (3) 0 (3)
BRAP TC, LDL rs11065987 5 0 (5) 0 (5) PLEC1 LDL, TC rs11136341 0 0 (0) 0 (0)
ST3GAL4 LDL, TC rs11220462 8 8 (8) 1 (7) LRP1 TG, HDL rs11613352 9 0 (9) 0 (9) CTF1 TG rs11649653 0 0 (0) 0 (0)
HNF1A TC, LDL rs1169288 5 0 (5) 0 (5) PINX1 TG rs11776767 17 16 (17) 15 (17)
STARD3 HDL rs11869286 3 3 (3) 3 (3) LDLRAP1 TC, LDL rs12027135 10 9 (9) 0 (9) COBLL1 HDL rs12328675 2 0 (2) 2 (2) GCKR TG, TC rs1260326 4 4 (4) 0 (4)
DNAH11 TC, LDL rs12670798 9 4 (9) 3 (9) LPL TG, HDL rs12678919 34 18 (34) 0 (32)
HMGCR TC, LDL rs12916 17 15 (16) 2 (16) MC4R HDL rs12967135 14 10 (14) 3 (14)
SLC39A8 HDL rs13107325 1 0 (1) 0 (1) TYW1B TG rs13238203 0 0 (0) 0 (0) APOB LDL, TC rs1367117 6 0 (6) 0 (6) NAT2 TG, TC rs1495741 5 4 (5) 4 (5) LIPC HDL, TC, TG rs1532085 1 1 (1) 0 (1) LPA LDL, TC rs1564348 2 0 (2) 0 (2)
ZNF648 HDL rs1689800 11 11 (11) 2 (10) LCAT HDL rs16942887 8 5 (8) 6 (8)
MLXIPL TG, HDL rs17145738 9 8 (9) 1 (9) FADS1-2-3 TG, HDL, TC, LDL rs174546 22 21 (21) 10 (22)
HFE LDL, TC rs1800562 1 0 (1) 0 (1) HNF4A HDL, TC rs1800961 0 0 (0) 0 (0) UBE2L3 HDL rs181362 36 23 (35) 4 (35) ABCA1 HDL, TC rs1883025 1 1 (1) 0 (1)
HPR TC, LDL rs2000999 0 0 (0) 0 (0) CYP26A1 TG rs2068888 1 1 (1) 1 (1) NPC1L1 TC, LDL rs2072183 0 0 (0) 0 (0) CYP7A1 TC, LDL rs2081687 20 7 (18) 2 (17)
ANGPTL3 TG, TC, LDL rs2131925 103 66 (102) 61 (101) HLA TG rs2247056 20 18 (20) 1 (19)
GPAM TC, LDL rs2255141 18 15 (16) 0 (18) ERGIC3 TC rs2277862 8 5 (8) 3 (8)
RAF1 TC rs2290159 16 14 (14) 6 (15) TRPS1 HDL rs2293889 105 104 (105) 55 (105) CAPN3 TG rs2412710 0 0 (0) 0 (0) PCSK9 LDL, TC rs2479409 0 0 (0) 0 (0) MOSC1 TC, LDL rs2642442 4 3 (4) 0 (4) LACTB HDL rs2652834 2 0 (2) 0 (1) TRPS1 TC rs2737229 13 0 (13) 3 (13)
C6orf106 HDL rs2814944 23 17 (23) 0 (23)
doi: 10.1038/nature09270 SUPPLEMENTARY INFORMATION
www.nature.com/nature 65
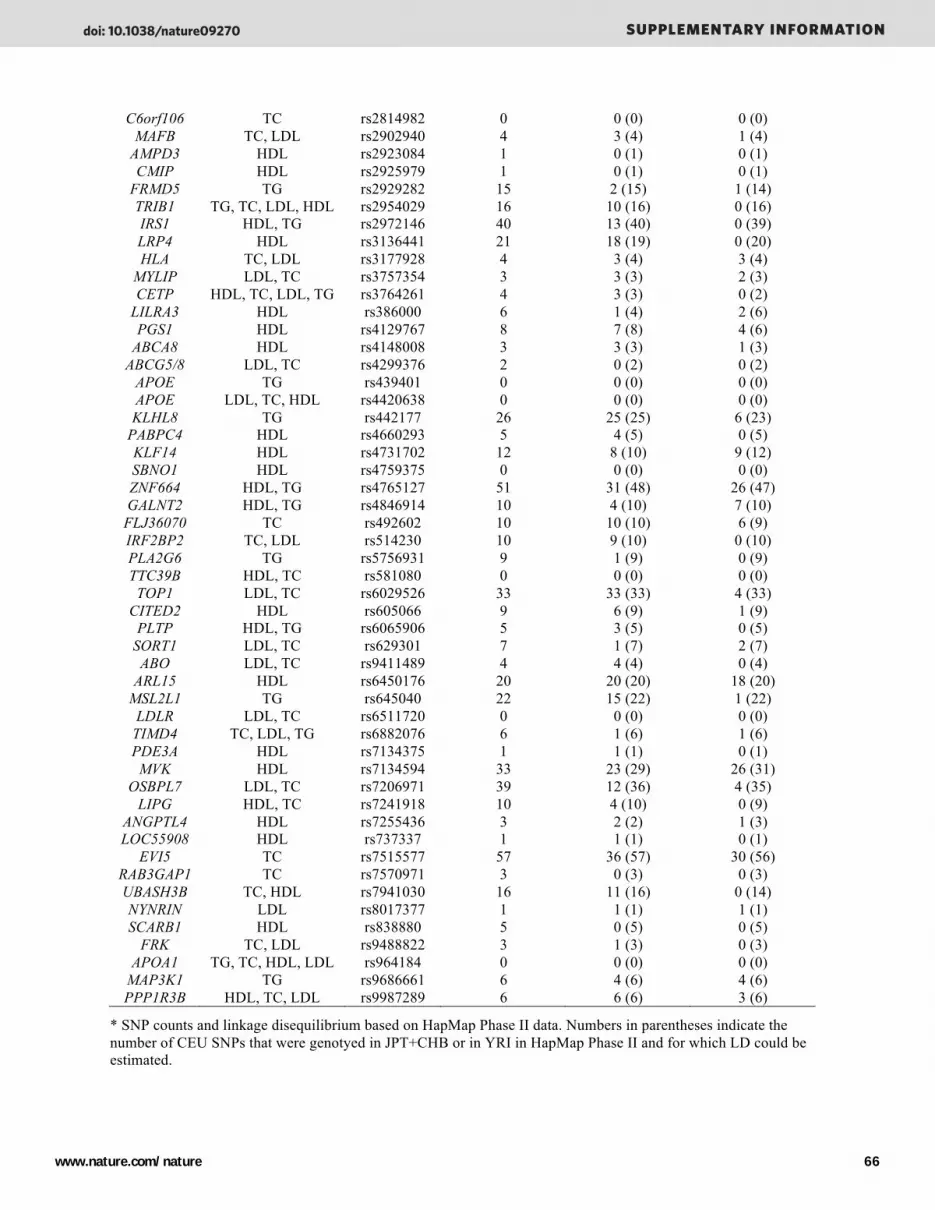
C6orf106 TC rs2814982 0 0 (0) 0 (0) MAFB TC, LDL rs2902940 4 3 (4) 1 (4)
AMPD3 HDL rs2923084 1 0 (1) 0 (1) CMIP HDL rs2925979 1 0 (1) 0 (1)
FRMD5 TG rs2929282 15 2 (15) 1 (14) TRIB1 TG, TC, LDL, HDL rs2954029 16 10 (16) 0 (16) IRS1 HDL, TG rs2972146 40 13 (40) 0 (39) LRP4 HDL rs3136441 21 18 (19) 0 (20) HLA TC, LDL rs3177928 4 3 (4) 3 (4)
MYLIP LDL, TC rs3757354 3 3 (3) 2 (3) CETP HDL, TC, LDL, TG rs3764261 4 3 (3) 0 (2)
LILRA3 HDL rs386000 6 1 (4) 2 (6) PGS1 HDL rs4129767 8 7 (8) 4 (6)
ABCA8 HDL rs4148008 3 3 (3) 1 (3) ABCG5/8 LDL, TC rs4299376 2 0 (2) 0 (2)
APOE TG rs439401 0 0 (0) 0 (0) APOE LDL, TC, HDL rs4420638 0 0 (0) 0 (0) KLHL8 TG rs442177 26 25 (25) 6 (23)
PABPC4 HDL rs4660293 5 4 (5) 0 (5) KLF14 HDL rs4731702 12 8 (10) 9 (12) SBNO1 HDL rs4759375 0 0 (0) 0 (0) ZNF664 HDL, TG rs4765127 51 31 (48) 26 (47) GALNT2 HDL, TG rs4846914 10 4 (10) 7 (10)
FLJ36070 TC rs492602 10 10 (10) 6 (9) IRF2BP2 TC, LDL rs514230 10 9 (10) 0 (10) PLA2G6 TG rs5756931 9 1 (9) 0 (9) TTC39B HDL, TC rs581080 0 0 (0) 0 (0)
TOP1 LDL, TC rs6029526 33 33 (33) 4 (33) CITED2 HDL rs605066 9 6 (9) 1 (9)
PLTP HDL, TG rs6065906 5 3 (5) 0 (5) SORT1 LDL, TC rs629301 7 1 (7) 2 (7) ABO LDL, TC rs9411489 4 4 (4) 0 (4)
ARL15 HDL rs6450176 20 20 (20) 18 (20) MSL2L1 TG rs645040 22 15 (22) 1 (22)
LDLR LDL, TC rs6511720 0 0 (0) 0 (0) TIMD4 TC, LDL, TG rs6882076 6 1 (6) 1 (6) PDE3A HDL rs7134375 1 1 (1) 0 (1) MVK HDL rs7134594 33 23 (29) 26 (31)
OSBPL7 LDL, TC rs7206971 39 12 (36) 4 (35) LIPG HDL, TC rs7241918 10 4 (10) 0 (9)
ANGPTL4 HDL rs7255436 3 2 (2) 1 (3) LOC55908 HDL rs737337 1 1 (1) 0 (1)
EVI5 TC rs7515577 57 36 (57) 30 (56) RAB3GAP1 TC rs7570971 3 0 (3) 0 (3) UBASH3B TC, HDL rs7941030 16 11 (16) 0 (14) NYNRIN LDL rs8017377 1 1 (1) 1 (1) SCARB1 HDL rs838880 5 0 (5) 0 (5)
FRK TC, LDL rs9488822 3 1 (3) 0 (3) APOA1 TG, TC, HDL, LDL rs964184 0 0 (0) 0 (0)
MAP3K1 TG rs9686661 6 4 (6) 4 (6) PPP1R3B HDL, TC, LDL rs9987289 6 6 (6) 3 (6)
* SNP counts and linkage disequilibrium based on HapMap Phase II data. Numbers in parentheses indicate the number of CEU SNPs that were genotyed in JPT+CHB or in YRI in HapMap Phase II and for which LD could be estimated.
doi: 10.1038/nature09270 SUPPLEMENTARY INFORMATION
www.nature.com/nature 66

Supplementary Table 15. Associations with coronary artery disease.
Locus Lead SNP* Chr Position† Lead trait Other traits Major allele, minor allele‡
Lipid effect§
CAD effect§
CAD P-value||
SORT1 rs629301 1 109,619,829 LDL TC T, G – – 4E-9 LDLR rs6511720 19 11,063,306 LDL TC G, T – – 5E-9
APOA1–C3–A4–A5 rs964184 11 116,154,127 TG TC, HDL, LDL C, G + + 2E-8 BRAP rs11065987 12 110,556,807 TC LDL A, G – + 1E-6 NAT2 rs1495741 8 18,317,161 TG TC A, G + + 2E-5 TCF1 rs1169288 12 119,901,033 LDL TC A, C + + 4E-5 TRIB1 rs2954029 8 126,560,154 TG TC, LDL, HDL A, T – – 5E-5
APOE–C1–C2 rs4420638 19 50,114,786 LDL TC, HDL A, G + + 7E-5 IRS1 rs2972146 2 226,808,942 HDL TG T, G + – 4E-4
CILP2 rs10401969 19 19,268,718 TC TG, LDL T, C – – 5E-4 C6orf106 rs2814982 6 34,654,538 TC C, T – + 5E-4
LPA rs1564348 6 160,498,850 LDL TC T, C + + 6E-4 LPL rs12678919 8 19,888,502 TG HDL A, G – – 7E-4
KLF14 rs4731702 7 130,083,924 HDL C, T + – 9E-4 CYP26A1 rs2068888 10 94,829,632 TG G, A – – 0.001 C6orf106 rs2814944 6 34,660,775 HDL G, A – + 0.002 ABCG5/8 rs4299376 2 43,926,080 LDL TC T, G + + 0.002 MAP3K1 rs9686661 5 55,897,543 TG C, T + + 0.003 ZNF664 rs4765127 12 123,026,120 HDL TG G, T + – 0.004 HMGCR rs12916 5 74,692,295 TC LDL T, C + + 0.004 ABCA8 rs4148008 17 64,386,889 HDL C, G – + 0.008
SPTY2D1 rs10128711 11 18,589,560 TC C, T – – 0.01 FRMD5 rs2929282 15 42,033,223 TG A, T + + 0.01 PINX1 rs11776767 8 10,721,339 TG G, C + – 0.02 PCSK9 rs2479409 1 55,277,238 LDL TC A, G + + 0.03 APOB rs1367117 2 21,117,405 LDL TC G, A + + 0.03
CAPN3 rs2412710 15 40,471,079 TG G, A + + 0.04 CETP rs3764261 16 55,550,825 HDL TC, LDL, TG C, A + – 0.05
CITED2 rs605066 6 139,871,359 HDL T, C – + 0.05 ST3GAL4 rs11220462 11 125,749,162 LDL TC G, A + + 0.06 GALNT2 rs4846914 1 228,362,314 HDL TG A, G – + 0.06
HPR rs2000999 16 70,665,594 TC LDL G, A + + 0.06 KLHL8 rs442177 4 88,249,285 TG T, G – – 0.06
MLXIPL rs17145738 7 72,620,810 TG HDL C, T – + 0.06 ARL15 rs6450176 5 53,333,782 HDL G, A – + 0.07
ANGPTL4 rs7255436 19 8,339,196 HDL A, C – + 0.07 PLA2G6 rs5756931 22 36,875,979 TG T, C – + 0.08 APOB rs1042034 2 21,078,786 TG HDL T, C – – 0.08
MOSC1 rs2642442 1 219,040,186 TC LDL T, C – – 0.09 CMIP rs2925979 16 80,092,291 HDL C, T – + 0.09 LPA rs1084651 6 161,009,807 HDL G, A + – 0.10 HLA rs2247056 6 31,373,469 TG C, T – – 0.11
ABCA1 rs1883025 9 106,704,122 HDL TC C, T – – 0.14 GCKR rs1260326 2 27,584,444 TG TC C, T + + 0.14
ANGPTL3 rs2131925 1 62,798,530 TG LDL, TC T, G – + 0.14 MAFB rs2902940 20 38,524,901 TC LDL A, G – – 0.15
MSL2L1 rs645040 3 137,409,312 TG T, G – – 0.15 PLTP rs6065906 20 43,987,422 HDL TG T, C – – 0.16
JMJD1C rs10761731 10 64,697,616 TG A, T – + 0.17 ERGIC3 rs2277862 20 33,616,196 TC C, T – + 0.19 TTC39B rs581080 9 15,295,378 HDL TC C, G – – 0.19
EVI5 rs7515577 1 92,782,026 TC A, C – – 0.20 MC4R rs12967135 18 56,000,003 HDL G, A – + 0.21 TYW1B rs13238203 7 71,767,603 TG C, T – + 0.22 LCAT rs16942887 16 66,485,543 HDL G, A + – 0.23
UBASH3B rs7941030 11 122,027,585 TC HDL T, C + + 0.25 RAB3GAP1 rs7570971 2 135,554,376 TC C, A + – 0.25
PLEC1 rs11136341 8 145,115,531 LDL TC A, G + – 0.25 FRK rs9488822 6 116,419,586 TC LDL A, T – – 0.27
ZNF648 rs1689800 1 180,435,508 HDL A, G – + 0.27 COBLL1 rs12328675 2 165,249,046 HDL T, C + – 0.34 CYP7A1 rs2081687 8 59,551,119 TC LDL C, T + – 0.35
TOP1 rs6029526 20 39,106,032 LDL TC T, A + + 0.36 HFE rs1800562 6 26,201,120 LDL TC G, A – – 0.37
TRPS1 rs2737229 8 116,717,740 TC A, C – + 0.39
doi: 10.1038/nature09270 SUPPLEMENTARY INFORMATION
www.nature.com/nature 67

LRP4 rs3136441 11 46,699,823 HDL T, C + – 0.39 NYNRIN rs8017377 14 23,953,727 LDL G, A + – 0.41
LDLRAP1 rs12027135 1 25,648,320 TC LDL T, A – – 0.41 MYLIP rs3757354 6 16,235,386 LDL TC C, T – – 0.45 LIPC rs1532085 15 56,470,658 HDL TC, TG G, A + + 0.46
PPP1R3B rs9987289 8 9,220,768 HDL TC, LDL G, A – – 0.46 CTF1 rs11649653 16 30,825,988 TG C, G – – 0.49
AMPD3 rs2923084 11 10,345,358 HDL A, G – – 0.51 LACTB rs2652834 15 61,183,920 HDL G, A – + 0.53
FADS1–2–3 rs174546 11 61,326,406 TG HDL, TC, LDL C, T + – 0.54 GPAM rs2255141 10 113,923,876 TC LDL G, A + – 0.55
PABPC4 rs4660293 1 39,800,767 HDL A, G – + 0.56 DNAH11 rs12670798 7 21,573,877 LDL TC T, C + – 0.58
HLA rs3177928 6 32,520,413 TC LDL G, A + + 0.58 TIMD4 rs6882076 5 156,322,875 TC LDL, TG C, T – – 0.58 PDE3A rs7134375 12 20,365,025 HDL C, A + – 0.58
APOE–C1–C2 rs439401 19 50,106,291 TG C, T – – 0.59 SBNO1 rs4759375 12 122,362,191 HDL C, T + – 0.60
NPC1L1 rs2072183 7 44,545,705 TC LDL G, C + + 0.61 LOC55908 rs737337 19 11,208,493 HDL T, C – + 0.65
TRPS1 rs2293889 8 116,668,374 HDL G, T – – 0.66 SLC39A8 rs13107325 4 103,407,732 HDL C, T – – 0.66 FLJ36070 rs492602 19 53,898,229 TC A, G + – 0.73 LILRA3 rs386000 19 59,484,573 HDL G, C + + 0.74 COBLL1 rs10195252 2 165,221,337 TG T, C – – 0.75 IRF2BP2 rs514230 1 232,925,220 TC LDL T, A – + 0.78 HNF4A rs1800961 20 42,475,778 HDL TC C, T – + 0.81
MVK rs7134594 12 108,484,576 HDL T, C – + 0.82 STARD3 rs11869286 17 35,067,382 HDL C, G – + 0.82
PGS1 rs4129767 17 73,915,579 HDL A, G – – 0.83 SCARB1 rs838880 12 123,827,546 HDL T, C + + 0.87 UBE2L3 rs181362 22 20,262,068 HDL C, T – – 0.88
LRP1 rs11613352 12 56,078,847 TG HDL C, T – + 0.91 OSBPL7 rs7206971 17 42,780,114 LDL TC G, A + – 0.96
LIPG rs7241918 18 45,414,951 HDL TC T, G – + 0.97 RAF1 rs2290159 3 12,603,920 TC G, C – – 1.0
* Except for the ABO locus, for which the lead SNP was unavailable in the CAD cohorts.
† Positions are relative to Human Genome NCBI Build 36.
‡ Alleles are designated with respect to the “+” strand.
§ The lipid effect and CAD effect are both modeled on the minor allele.
|| Shaded are loci having concordance between the direction of lipid effect and the change in CAD risk (increased TC = increased CAD risk; increased LDL-C = increased CAD risk; decreased HDL = increased CAD risk; increased TG = increased CAD risk). SNPs meeting the pre-specified statistical significance threshold of P < 0.001 for CAD are above the demarcated horizontal line.
doi: 10.1038/nature09270 SUPPLEMENTARY INFORMATION
www.nature.com/nature 68
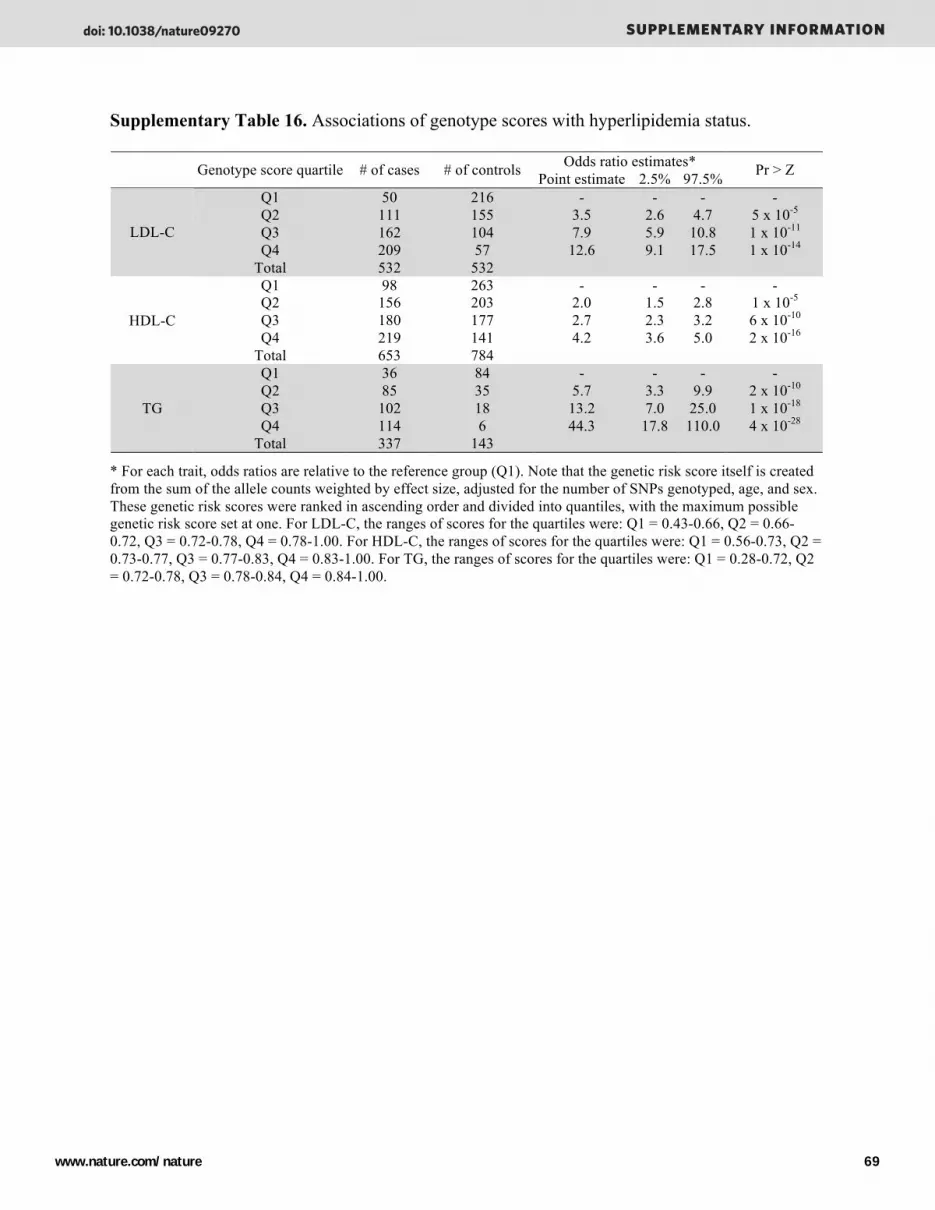
Supplementary Table 16. Associations of genotype scores with hyperlipidemia status.
Odds ratio estimates* Genotype score quartile # of cases # of controls Point estimate 2.5% 97.5% Pr > Z
Q1 50 216 - - - - Q2 111 155 3.5 2.6 4.7 5 x 10⁻⁵ Q3 162 104 7.9 5.9 10.8 1 x 10-11 Q4 209 57 12.6 9.1 17.5 1 x 10-14
LDL-C
Total 532 532 Q1 98 263 - - - - Q2 156 203 2.0 1.5 2.8 1 x 10⁻⁵ Q3 180 177 2.7 2.3 3.2 6 x 10⁻¹⁰ Q4 219 141 4.2 3.6 5.0 2 x 10-16
HDL-C
Total 653 784 Q1 36 84 - - - - Q2 85 35 5.7 3.3 9.9 2 x 10⁻¹⁰ Q3 102 18 13.2 7.0 25.0 1 x 10-18 Q4 114 6 44.3 17.8 110.0 4 x 10-28
TG
Total 337 143
* For each trait, odds ratios are relative to the reference group (Q1). Note that the genetic risk score itself is created from the sum of the allele counts weighted by effect size, adjusted for the number of SNPs genotyped, age, and sex. These genetic risk scores were ranked in ascending order and divided into quantiles, with the maximum possible genetic risk score set at one. For LDL-C, the ranges of scores for the quartiles were: Q1 = 0.43-0.66, Q2 = 0.66-0.72, Q3 = 0.72-0.78, Q4 = 0.78-1.00. For HDL-C, the ranges of scores for the quartiles were: Q1 = 0.56-0.73, Q2 = 0.73-0.77, Q3 = 0.77-0.83, Q4 = 0.83-1.00. For TG, the ranges of scores for the quartiles were: Q1 = 0.28-0.72, Q2 = 0.72-0.78, Q3 = 0.78-0.84, Q4 = 0.84-1.00.
doi: 10.1038/nature09270 SUPPLEMENTARY INFORMATION
www.nature.com/nature 69
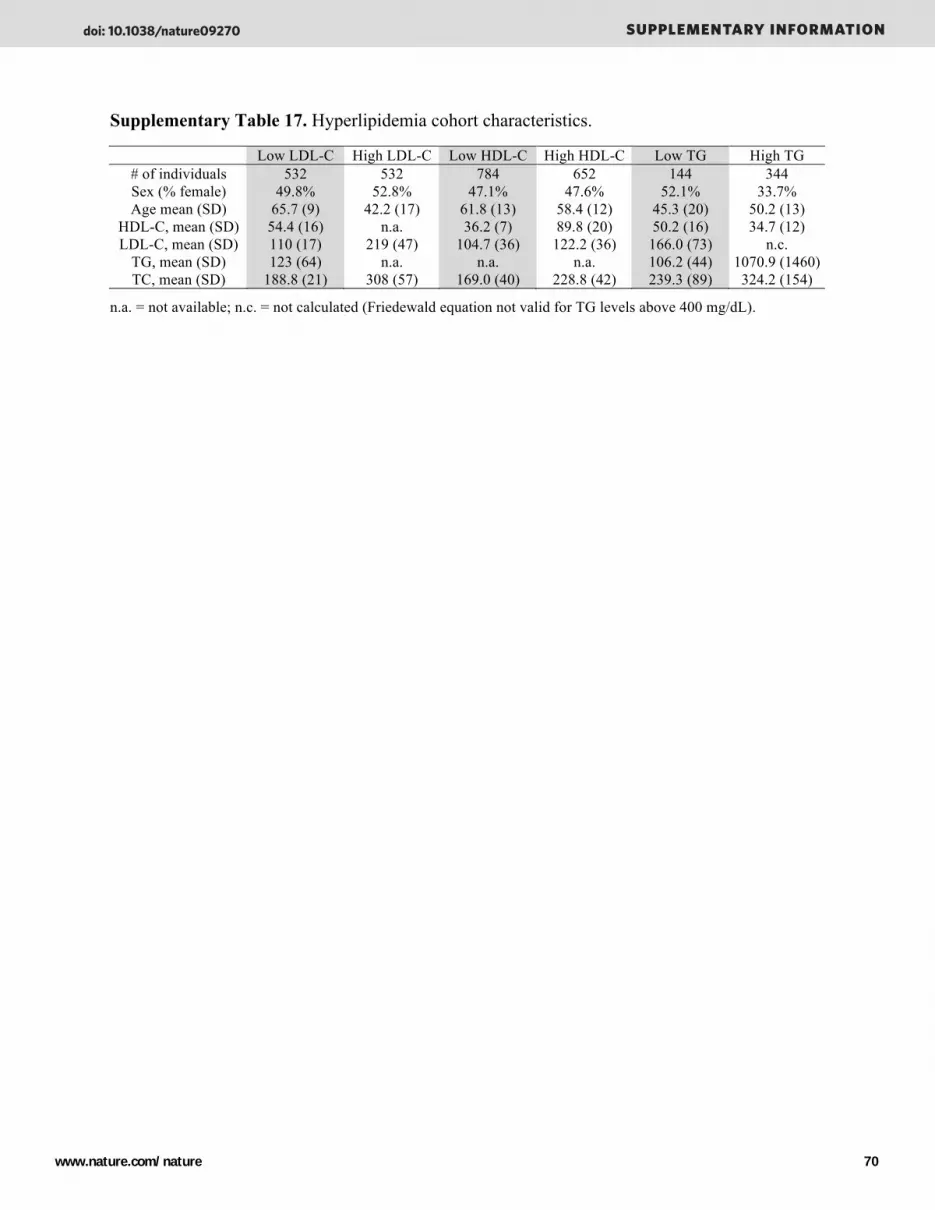
Supplementary Table 17. Hyperlipidemia cohort characteristics.
Low LDL-C High LDL-C Low HDL-C High HDL-C Low TG High TG # of individuals 532 532 784 652 144 344 Sex (% female) 49.8% 52.8% 47.1% 47.6% 52.1% 33.7% Age mean (SD) 65.7 (9) 42.2 (17) 61.8 (13) 58.4 (12) 45.3 (20) 50.2 (13)
HDL-C, mean (SD) 54.4 (16) n.a. 36.2 (7) 89.8 (20) 50.2 (16) 34.7 (12) LDL-C, mean (SD) 110 (17) 219 (47) 104.7 (36) 122.2 (36) 166.0 (73) n.c.
TG, mean (SD) 123 (64) n.a. n.a. n.a. 106.2 (44) 1070.9 (1460) TC, mean (SD) 188.8 (21) 308 (57) 169.0 (40) 228.8 (42) 239.3 (89) 324.2 (154)
n.a. = not available; n.c. = not calculated (Friedewald equation not valid for TG levels above 400 mg/dL).
doi: 10.1038/nature09270 SUPPLEMENTARY INFORMATION
www.nature.com/nature 70

Supplementary Table 18. Monogenic lipid disorders.
Gene Locus Lead SNP* Associated traits Lipid disorder ABCA1 9q31.1 rs1883025 Low HDL-C Tangier disease ABCG5 2p21 rs4299376 High LDL-C Sitosterolemia ABCG8 2p21 rs4299376 High LDL-C Sitosterolemia APOA1 11q23 rs964184 Low HDL-C ApoA-I deficiency
APOA5 11q23 rs964184 High VLDL, high chylomicrons ApoA-V deficiency
Low LDL-C Familial hypobetalipoproteinemia APOB 2p24 rs1367117 High LDL-C Familial defective ApoB-100 APOC2 19q13 rs4420638 High chylomicrons Familial ApoC-II deficiency
APOE 19q13 rs4420638 High VLDL, high chylomicrons Familial dysbetalipoproteinemia
CETP 16q13 rs3764261 High HDL-C Cholesteryl ester transfer protein deficiency
LCAT 16q22 rs16942887 Low HDL-C Lecithin-cholesterol acyltransferase deficiency (fish-eye disease)
LDLR 19p13 rs6511720 High LDL-C Familial hypercholesterolemia LDLRAP1 1p36 rs12027135 High LDL-C Autosomal recessive hypercholesterolemia LIPC 15q22 rs1532085 High VLDL remnants Familial hepatic lipase deficiency LMF1 16p13 – High triglycerides Combined lipase deficiency LPL 8p21 rs12678919 High chylomicrons Lipoprotein lipase deficiency MTTP 4q24 – Low LDL-C Abetalipoproteinemia
Low LDL-C PCSK9 deficiency PCSK9 1p32 rs2479409 High LDL-C Autosomal-dominant hypercholesterolemia SAR1B 5q31.1 – Low chylomicrons Chylomicron retention disease
*Where available, the lead SNP (from the primary meta-analysis) in the vicinity of the causal gene is listed.
doi: 10.1038/nature09270 SUPPLEMENTARY INFORMATION
www.nature.com/nature 71

Supplementary Table 19. Comparison of studies that used principal component analysis to adjust for population structure to those that did not.
All studies* Studies with PCA† Studies without PCA‡ Combined§ Heterogeneity||
Nearby genes Lead_SNP Best_SNP Trait N P-value N P-value N P-value P-value P-value LDLRAP1 rs12027135 rs12027135 LDL 86,707 1.2 x 10⁻¹⁰ 47,367 3.1 x 10⁻⁵ 38,925 3.1 x 10⁻⁷ 5.2 x 10⁻¹¹ 0.52 LDLRAP1 rs12027135 rs12027135 TC 95,070 4.1 x 10⁻¹¹ 47,776 1.3 x 10⁻⁴ 47,288 1.3 x 10⁻⁸ 1.4 x 10⁻¹¹ 0.25 PABPC4 rs4660293 rs4660293 HDL 98,409 4.0 x 10⁻¹⁰ 47,772 6.4 x 10⁻⁶ 50,637 3.6 x 10⁻⁶ 1.0 x 10⁻¹⁰ 0.96 PCSK9 rs2479409 rs2479409 LDL 98,656 1.9 x 10⁻²⁸ 47,366 8.7 x 10⁻¹³ 50,880 1.3 x 10⁻¹⁸ 1.6 x 10⁻²⁹ 0.26 PCSK9 rs2479409 rs2479409 TC 95,070 3.8 x 10⁻²⁴ 47,775 1.3 x 10⁻¹⁰ 47,288 2.2 x 10⁻¹⁶ 3.1 x 10⁻²⁵ 0.31
ANGPTL3 rs2131925 rs3850634 LDL 98,409 2.6 x 10⁻¹⁸ 47,367 7.8 x 10⁻¹¹ 50,637 1.2 x 10⁻⁹ 5.4 x 10⁻¹⁹ 0.85 ANGPTL3 rs2131925 rs3850634 TC 95,034 4.9 x 10-41 47,776 5.9 x 10⁻¹⁹ 47,264 7.0 x 10⁻²⁶ 6.1 x 10-43 0.30 ANGPTL3 rs2131925 rs2131925 TG 94,225 8.8 x 10-43 47,782 4.4 x 10⁻¹⁷ 46,453 1.8 x 10⁻³⁰ 6.2 x 10-45 0.036
EVI5 rs7515577 rs7515577 TC 89,838 2.8 x 10⁻⁸ 47,757 2.0 x 10⁻³ 42,471 8.9 x 10⁻⁷ 1.3 x 10⁻⁸ 0.25 SORT1 rs629301 rs629301 LDL 94,472 9.7 x 10-171 47,367 9.0 x 10-100 46,696 1.9 x 10-80 1.2 x 10-177 0.095 SORT1 rs629301 rs629301 TC 95,070 5.8 x 10-131 47,776 5.9 x 10-75 47,288 1.1 x 10-64 3.2 x 10-137 0.13 ZNF648 rs1689800 rs1689800 HDL 98,409 3.2 x 10⁻¹⁰ 47,772 5.8 x 10⁻⁴ 50,637 1.1 x 10⁻⁸ 7.5 x 10⁻¹¹ 0.14 MOSC1 rs2642442 rs2807834 LDL 93,999 5.6 x 10⁻¹¹ 47,355 5.3 x 10⁻⁶ 46,632 9.6 x 10⁻⁷ 2.3 x 10⁻¹¹ 0.83 MOSC1 rs2642442 rs2807834 TC 98,656 4.9 x 10⁻¹³ 47,764 1.9 x 10⁻⁶ 50,880 1.3 x 10⁻⁸ 1.4 x 10⁻¹³ 0.63 GALNT2 rs4846914 rs4846914 HDL 98,409 3.7 x 10⁻²¹ 47,772 2.0 x 10⁻¹⁰ 50,637 1.1 x 10⁻¹³ 1.6 x 10⁻²² 0.59 GALNT2 rs4846914 rs1321257 TG 98,409 2.1 x 10⁻¹⁴ 47,782 1.3 x 10⁻⁶ 50,637 3.5 x 10⁻¹⁰ 4.4 x 10⁻¹⁵ 0.25 IRF2BP2 rs514230 rs514230 LDL 93,999 9.4 x 10⁻¹² 47,367 5.6 x 10⁻⁷ 46,632 1.4 x 10⁻⁶ 3.6 x 10⁻¹² 0.88 IRF2BP2 rs514230 rs514230 TC 90,614 5.4 x 10⁻¹⁴ 47,776 1.6 x 10⁻⁶ 50,677 1.3 x 10⁻⁹ 1.3 x 10⁻¹⁴ 0.47
APOB rs1042034 rs1042034 HDL 98,409 1.2 x 10⁻³⁰ 47,772 6.8 x 10⁻¹⁵ 50,637 2.0 x 10⁻¹⁹ 1.2 x 10⁻³² 0.54 APOB rs1367117 rs1367117 LDL 98,409 4.5 x 10-114 47,367 2.8 x 10-62 50,637 2.6 x 10-58 1.2 x 10-118 0.63 APOB rs1367117 rs1367117 TC 98,409 4.1 x 10-96 47,776 1.5 x 10-49 50,637 5.6 x 10-53 1.1 x 10-100 0.90 APOB rs1042034 rs1042034 TG 98,656 1.4 x 10-45 47,782 3.5 x 10⁻²⁶ 50,880 2.1 x 10⁻²³ 7.9 x 10-48 0.61 GCKR rs1260326 rs1260326 TC 98,409 7.3 x 10⁻²⁷ 47,776 6.6 x 10⁻²⁴ 50,637 2.6 x 10⁻⁸ 4.4 x 10⁻²⁸ 0.00056 GCKR rs1260326 rs1260326 TG 98,409 5.7 x 10-133 47,782 1.6 x 10-77 50,637 2.1 x 10-64 1.3 x 10-139 0.18
ABCG5/8 rs4299376 rs4299376 LDL 93,131 1.7 x 10-47 47,367 8.1 x 10⁻²⁶ 46,632 3.0 x 10⁻²⁵ 2.3 x 10-49 0.85 ABCG5/8 rs4299376 rs4299376 TC 97,764 4.0 x 10-45 47,776 1.0 x 10⁻²³ 50,880 3.4 x 10⁻²⁵ 3.2 x 10-47 0.84
RAB3GAP1 rs7570971 rs6759321 TC 98,409 1.4 x 10⁻⁸ 47,026 1.0 x 10⁻³ 50,637 8.2 x 10⁻⁷ 6.2 x 10⁻⁹ 0.26 COBLL1 rs12328675 rs12328675 HDL 93,983 2.7 x 10⁻¹⁰ 47,772 3.8 x 10⁻⁸ 46,632 1.7 x 10⁻⁴ 7.0 x 10⁻¹¹ 0.17 COBLL1 rs10195252 rs10195252 TG 98,640 1.6 x 10⁻¹⁰ 47,782 1.9 x 10⁻⁸ 50,880 2.6 x 10⁻⁴ 5.8 x 10⁻¹¹ 0.15
IRS1 rs2972146 rs1515100 HDL 95,054 2.0 x 10⁻⁹ 47,747 4.4 x 10⁻⁴ 47,288 1.6 x 10⁻⁷ 5.5 x 10⁻¹⁰ 0.24 IRS1 rs2972146 rs2943645 TG 87,520 2.4 x 10⁻⁸ 47,782 4.2 x 10⁻⁶ 47,608 5.1 x 10⁻⁴ 1.1 x 10⁻⁸ 0.46 RAF1 rs2290159 rs2290159 TC 83,209 4.2 x 10⁻⁹ 47,026 5.3 x 10⁻⁶ 43,613 7.1 x 10⁻⁵ 1.8 x 10⁻⁹ 0.57
MSL2L1 rs645040 rs645040 TG 87,766 2.5 x 10⁻⁸ 47,781 4.4 x 10⁻⁵ 47,852 6.5 x 10⁻⁵ 1.1 x 10⁻⁸ 0.92 KLHL8 rs442177 rs442177 TG 65,871 8.7 x 10⁻¹² 47,782 2.9 x 10⁻⁵ 33,806 1.1 x 10⁻⁸ 2.5 x 10⁻¹² 0.30
SLC39A8 rs13107325 rs13107325 HDL 97,148 7.2 x 10⁻¹¹ 39,931 3.6 x 10⁻⁹ 49,372 1.6 x 10⁻⁴ 1.7 x 10⁻¹¹ 0.051
doi: 10.1038/nature09270 SUPPLEMENTARY INFORMATION
www.nature.com/nature 72

ARL15 rs6450176 rs6450176 HDL 86,430 5.0 x 10⁻⁸ 47,772 2.2 x 10⁻⁷ 38,658 4.7 x 10⁻³ 1.8 x 10⁻⁸ 0.074 MAP3K1 rs9686661 rs9686661 TG 98,656 1.3 x 10⁻¹⁰ 47,032 9.4 x 10⁻⁷ 50,880 1.0 x 10⁻⁵ 4.5 x 10⁻¹¹ 0.68 HMGCR rs12916 rs12916 LDL 93,999 5.1 x 10-45 47,367 2.2 x 10⁻²² 46,632 3.9 x 10⁻²⁶ 8.8 x 10-47 0.59 HMGCR rs12916 rs12916 TC 98,656 8.8 x 10-47 47,776 8.4 x 10⁻²⁰ 50,880 2.6 x 10⁻³¹ 5.8 x 10-49 0.15 TIMD4 rs6882076 rs6882076 LDL 93,999 1.9 x 10⁻²² 47,367 5.8 x 10⁻¹⁷ 46,632 1.2 x 10⁻⁸ 2.6 x 10⁻²³ 0.055 TIMD4 rs6882076 rs6882076 TC 98,588 7.5 x 10⁻²⁸ 47,776 1.1 x 10⁻¹⁸ 50,814 1.6 x 10⁻¹² 4.0 x 10⁻²⁹ 0.13 TIMD4 rs6882076 rs1553318 TG 71,749 3.7 x 10⁻¹² 47,782 3.5 x 10⁻⁵ 37,253 2.9 x 10⁻⁹ 1.0 x 10⁻¹² 0.22 MYLIP rs3757354 rs3757354 LDL 70,383 1.2 x 10⁻¹¹ 47,367 5.4 x 10⁻¹⁰ 35,885 4.1 x 10⁻⁴ 4.4 x 10⁻¹² 0.079 MYLIP rs3757354 rs3757354 TC 98,409 2.8 x 10⁻⁹ 47,776 2.9 x 10⁻⁷ 50,637 5.0 x 10⁻⁴ 1.2 x 10⁻⁹ 0.24 HFE rs1800562 rs1800562 LDL 95,070 6.1 x 10⁻¹⁰ 47,365 1.3 x 10⁻⁴ 47,288 3.2 x 10⁻⁷ 2.7 x 10⁻¹⁰ 0.35 HFE rs1800562 rs1800562 TC 96,905 2.5 x 10⁻⁸ 47,774 3.6 x 10⁻⁴ 49,133 7.0 x 10⁻⁶ 1.1 x 10⁻⁸ 0.57 HLA rs3177928 rs3177928 LDL 95,067 2.4 x 10⁻¹⁵ 47,338 3.1 x 10⁻¹¹ 47,285 1.7 x 10⁻⁶ 6.5 x 10⁻¹⁶ 0.18 HLA rs3177928 rs3177928 TC 86,707 4.0 x 10⁻¹⁹ 47,743 1.8 x 10⁻¹² 38,925 3.1 x 10⁻⁹ 5.6 x 10⁻²⁰ 0.31 HLA rs2247056 rs2247056 TG 95,070 1.6 x 10⁻¹⁵ 47,782 3.3 x 10⁻¹⁰ 47,288 1.3 x 10⁻⁷ 3.1 x 10⁻¹⁶ 0.45
C6orf106 rs2814944 rs2814944 HDL 98,409 3.8 x 10⁻⁹ 47,764 5.2 x 10⁻⁴ 50,637 3.1 x 10⁻⁷ 1.1 x 10⁻⁹ 0.30 C6orf106 rs2814982 rs2814982 TC 98,656 4.7 x 10⁻¹¹ 47,776 5.3 x 10⁻⁷ 50,880 6.0 x 10⁻⁶ 1.6 x 10⁻¹¹ 0.62
FRK rs9488822 rs11153594 LDL 95,070 3.0 x 10⁻⁹ 47,363 4.2 x 10⁻⁴ 47,288 4.9 x 10⁻⁷ 1.4 x 10⁻⁹ 0.30 FRK rs9488822 rs9488822 TC 98,409 1.7 x 10⁻¹⁰ 47,776 1.7 x 10⁻⁵ 50,637 8.2 x 10⁻⁷ 6.2 x 10⁻¹¹ 0.77
CITED2 rs605066 rs605066 HDL 95,034 2.6 x 10⁻⁸ 47,772 3.6 x 10⁻⁵ 47,264 6.0 x 10⁻⁵ 8.6 x 10⁻⁹ 0.83 LPA rs1084651 rs1084651 HDL 94,225 3.0 x 10⁻⁸ 47,772 3.1 x 10⁻⁶ 46,453 5.3 x 10⁻⁴ 1.0 x 10⁻⁸ 0.33 LPA rs1564348 rs1564348 LDL 89,838 1.7 x 10⁻¹⁷ 47,352 3.5 x 10⁻¹¹ 42,471 1.5 x 10⁻⁸ 3.8 x 10⁻¹⁸ 0.48 LPA rs1564348 rs1564348 TC 94,472 9.7 x 10⁻¹⁷ 47,760 3.5 x 10⁻⁹ 46,696 9.3 x 10⁻¹⁰ 1.8 x 10⁻¹⁷ 0.96
DNAH11 rs12670798 rs12670798 LDL 95,070 6.9 x 10⁻¹⁰ 47,367 5.0 x 10⁻⁴ 47,288 6.2 x 10⁻⁸ 3.1 x 10⁻¹⁰ 0.18 DNAH11 rs12670798 rs2285942 TC 98,409 6.6 x 10⁻¹⁰ 47,776 5.2 x 10⁻³ 50,637 1.3 x 10⁻⁹ 2.5 x 10⁻¹⁰ 0.03 NPC1L1 rs2072183 rs217386 LDL 93,999 4.3 x 10⁻¹¹ 47,367 9.9 x 10⁻⁶ 46,632 3.5 x 10⁻⁷ 1.7 x 10⁻¹¹ 0.65 NPC1L1 rs2072183 rs2072183 TC 98,656 3.2 x 10⁻¹¹ 47,776 1.2 x 10⁻⁵ 50,880 1.8 x 10⁻⁷ 1.1 x 10⁻¹¹ 0.59 TYW1B rs13238203 rs13238203 TG 98,409 1.1 x 10⁻⁹ 47,782 2.2 x 10⁻⁷ 50,637 4.5 x 10⁻⁴ 4.5 x 10⁻¹⁰ 0.60 MLXIPL rs17145738 rs17145738 HDL 98,409 1.2 x 10⁻⁹ 47,772 1.5 x 10⁻⁴ 50,637 3.8 x 10⁻⁷ 3.2 x 10⁻¹⁰ 0.44 MLXIPL rs17145738 rs7811265 TG 93,999 9.1 x 10-59 47,782 6.6 x 10-36 46,632 8.3 x 10⁻²⁸ 1.2 x 10-61 0.23 KLF14 rs4731702 rs4731702 HDL 90,614 1.2 x 10⁻¹⁵ 47,772 1.2 x 10⁻¹⁰ 50,677 1.3 x 10⁻⁷ 1.4 x 10⁻¹⁶ 0.32
PPP1R3B rs9987289 rs9987289 HDL 98,409 6.4 x 10⁻²⁵ 47,772 4.5 x 10⁻¹⁶ 50,637 3.2 x 10⁻¹² 1.7 x 10⁻²⁶ 0.29 PPP1R3B rs9987289 rs2126259 LDL 98,409 7.4 x 10⁻¹⁵ 47,367 8.0 x 10⁻⁷ 50,637 3.4 x 10⁻¹⁰ 2.1 x 10⁻¹⁵ 0.36 PPP1R3B rs9987289 rs2126259 TC 98,409 9.0 x 10⁻²⁴ 47,776 6.4 x 10⁻¹⁰ 50,637 8.1 x 10⁻¹⁷ 7.6 x 10⁻²⁵ 0.20
PINX1 rs11776767 rs11776767 TG 98,656 1.3 x 10⁻⁸ 47,782 5.0 x 10⁻⁵ 50,880 2.8 x 10⁻⁵ 5.5 x 10⁻⁹ 0.95 NAT2 rs1495741 rs1961456 TC 98,409 1.7 x 10⁻⁹ 47,776 1.0 x 10⁻⁴ 50,637 1.4 x 10⁻⁶ 6.8 x 10⁻¹⁰ 0.60 NAT2 rs1495741 rs1495743 TG 98,409 4.1 x 10⁻¹⁴ 47,778 5.9 x 10⁻⁸ 50,637 3.1 x 10⁻⁸ 9.3 x 10⁻¹⁵ 0.97 LPL rs12678919 rs12678919 HDL 93,131 9.7 x 10-98 47,772 2.4 x 10-49 46,632 7.4 x 10-57 2.5 x 10-104 0.75 LPL rs12678919 rs12678919 TG 97,764 1.5 x 10-115 47,782 3.1 x 10-59 50,880 4.5 x 10-64 2.2 x 10-121 0.73
CYP7A1 rs2081687 rs1030431 LDL 98,409 3.9 x 10⁻⁹ 47,367 4.0 x 10⁻⁵ 50,637 1.1 x 10⁻⁵ 1.9 x 10⁻⁹ 0.86
doi: 10.1038/nature09270 SUPPLEMENTARY INFORMATION
www.nature.com/nature 73

CYP7A1 rs2081687 rs1030431 TC 93,983 8.8 x 10⁻¹³ 47,776 2.3 x 10⁻⁸ 46,632 1.7 x 10⁻⁶ 2.5 x 10⁻¹³ 0.46 TRPS1 rs2293889 rs2293889 HDL 98,640 5.8 x 10⁻¹¹ 47,772 2.5 x 10⁻⁷ 50,880 9.5 x 10⁻⁶ 1.3 x 10⁻¹¹ 0.51 TRPS1 rs2737229 rs2737229 TC 95,054 2.5 x 10⁻⁸ 47,776 5.6 x 10⁻⁴ 47,288 4.2 x 10⁻⁶ 1.1 x 10⁻⁸ 0.49 TRIB1 rs2954029 rs10808546 HDL 87,520 6.4 x 10⁻¹⁹ 47,772 1.9 x 10⁻¹⁰ 47,608 3.6 x 10⁻¹¹ 4.1 x 10⁻²⁰ 0.98 TRIB1 rs2954029 rs2954022 LDL 83,209 2.6 x 10⁻²⁹ 47,367 3.0 x 10⁻¹³ 43,613 4.9 x 10⁻¹⁹ 1.9 x 10⁻³⁰ 0.27 TRIB1 rs2954029 rs2954022 TC 87,766 5.0 x 10-36 47,776 4.7 x 10⁻¹⁵ 47,852 1.1 x 10⁻²⁴ 1.1 x 10-37 0.16 TRIB1 rs2954029 rs2954029 TG 65,871 3.3 x 10-55 47,782 8.5 x 10⁻²³ 33,806 7.4 x 10-38 5.3 x 10-58 0.04 PLEC1 rs11136341 rs11136341 LDL 97,148 4.4 x 10⁻¹³ 40,289 5.2 x 10⁻⁶ 49,372 5.1 x 10⁻⁹ 1.5 x 10⁻¹³ 0.56 PLEC1 rs11136341 rs11136341 TC 86,430 9.0 x 10⁻¹⁰ 40,644 2.9 x 10⁻⁴ 38,658 2.4 x 10⁻⁷ 3.5 x 10⁻¹⁰ 0.49 TTC39B rs581080 rs643531 HDL 98,656 1.3 x 10⁻¹³ 47,767 3.8 x 10⁻⁹ 50,880 7.3 x 10⁻⁷ 2.0 x 10⁻¹⁴ 0.41 TTC39B rs581080 rs581080 TC 93,999 3.1 x 10⁻⁹ 47,776 7.9 x 10⁻⁹ 46,632 4.0 x 10⁻³ 1.3 x 10⁻⁹ 0.029 ABCA1 rs1883025 rs1883025 HDL 98,656 1.8 x 10⁻³³ 47,051 4.9 x 10⁻¹⁷ 50,880 2.8 x 10⁻²⁰ 1.1 x 10⁻³⁵ 0.78 ABCA1 rs1883025 rs1883025 TC 93,999 3.4 x 10⁻²⁷ 47,055 4.7 x 10⁻¹⁷ 46,632 3.3 x 10⁻¹³ 2.0 x 10⁻²⁸ 0.28
ABO rs9411489 rs649129 LDL 98,588 7.9 x 10⁻²² 47,367 1.4 x 10⁻¹⁵ 50,814 4.3 x 10⁻⁹ 1.2 x 10⁻²² 0.13 ABO rs9411489 rs651007 TC 71,749 8.7 x 10⁻²¹ 47,765 6.3 x 10⁻¹⁵ 37,253 7.6 x 10⁻⁹ 1.0 x 10⁻²¹ 0.12
JMJD1C rs10761731 rs10761731 TG 70,383 3.5 x 10⁻¹² 47,782 6.1 x 10⁻¹¹ 35,885 3.9 x 10⁻⁴ 1.0 x 10⁻¹² 0.031 CYP26A1 rs2068888 rs2068888 TG 98,409 2.4 x 10⁻⁸ 47,782 2.4 x 10⁻³ 50,637 4.4 x 10⁻⁷ 1.0 x 10⁻⁸ 0.16
GPAM rs2255141 rs1129555 LDL 95,070 2.1 x 10⁻⁹ 47,366 9.1 x 10⁻⁵ 47,288 2.3 x 10⁻⁶ 1.0 x 10⁻⁹ 0.58 GPAM rs2255141 rs2255141 TC 96,905 2.0 x 10⁻¹⁰ 47,776 6.9 x 10⁻⁵ 49,133 2.0 x 10⁻⁷ 7.5 x 10⁻¹¹ 0.48
AMPD3 rs2923084 rs2923084 HDL 95,067 4.6 x 10⁻⁸ 47,770 6.5 x 10⁻⁵ 47,285 6.4 x 10⁻⁵ 1.6 x 10⁻⁸ 0.90 SPTY2D1 rs10128711 rs10832963 TC 86,707 2.5 x 10⁻⁸ 47,776 1.7 x 10⁻² 38,925 2.1 x 10⁻⁸ 1.2 x 10⁻⁸ 0.032
LRP4 rs3136441 rs3136441 HDL 95,070 3.5 x 10⁻¹⁸ 47,772 4.8 x 10⁻⁶ 47,288 6.4 x 10⁻¹⁶ 2.3 x 10⁻¹⁹ 0.022 FADS1–2–3 rs174546 rs174601 HDL 98,409 1.5 x 10⁻²² 47,772 7.0 x 10⁻¹⁵ 50,637 6.9 x 10⁻¹¹ 5.8 x 10⁻²⁴ 0.27 FADS1–2–3 rs174546 rs174583 LDL 98,656 1.2 x 10⁻²¹ 47,356 4.9 x 10⁻¹⁰ 50,880 3.9 x 10⁻¹⁴ 1.8 x 10⁻²² 0.36 FADS1–2–3 rs174546 rs174550 TC 95,070 2.1 x 10⁻²² 47,776 1.4 x 10⁻¹¹ 47,288 2.2 x 10⁻¹³ 2.0 x 10⁻²³ 0.86 FADS1–2–3 rs174546 rs174546 TG 98,409 5.4 x 10⁻²⁴ 47,782 1.9 x 10⁻¹⁶ 50,637 1.4 x 10⁻¹⁰ 4.1 x 10⁻²⁵ 0.18
APOA1–C3–A4–A5 rs964184 rs964184 HDL 95,034 5.2 x 10-47 47,750 4.5 x 10-37 47,264 4.3 x 10⁻¹⁷ 5.3 x 10-50 0.00073 APOA1–C3–A4–A5 rs964184 rs964184 LDL 94,225 1.5 x 10⁻²⁶ 47,345 1.7 x 10⁻¹⁴ 46,453 1.2 x 10⁻¹⁴ 1.4 x 10⁻²⁷ 0.99 APOA1–C3–A4–A5 rs964184 rs964184 TC 89,838 6.2 x 10-57 47,754 9.1 x 10⁻²⁹ 42,471 1.4 x 10⁻³² 1.3 x 10-59 0.87 APOA1–C3–A4–A5 rs964184 rs964184 TG 94,472 6.7 x 10-240 47,760 3.8 x 10-158 46,696 1.7 x 10-99 7.6 x 10-252 3.2 x 10⁻⁵
UBASH3B rs7941030 rs7115089 HDL 95,070 2.7 x 10⁻⁸ 47,772 1.7 x 10⁻² 47,288 1.3 x 10⁻⁸ 8.4 x 10⁻⁹ 0.027 UBASH3B rs7941030 rs7941030 TC 98,409 1.5 x 10⁻¹⁰ 47,776 1.1 x 10⁻⁵ 50,637 1.1 x 10⁻⁶ 5.5 x 10⁻¹¹ 0.85 ST3GAL4 rs11220462 rs11220462 LDL 93,999 1.2 x 10⁻¹⁵ 47,367 5.9 x 10⁻⁸ 46,632 9.2 x 10⁻¹⁰ 3.2 x 10⁻¹⁶ 0.64 ST3GAL4 rs11220462 rs11220463 TC 98,656 2.1 x 10⁻¹¹ 47,776 3.1 x 10⁻⁶ 50,880 5.0 x 10⁻⁷ 7.0 x 10⁻¹² 0.92 PDE3A rs7134375 rs7134375 HDL 98,409 3.8 x 10⁻⁸ 47,772 7.7 x 10⁻⁸ 50,637 6.7 x 10⁻³ 1.4 x 10⁻⁸ 0.045 LRP1 rs11613352 rs3741414 HDL 98,409 1.6 x 10⁻⁸ 47,772 9.9 x 10⁻⁷ 50,637 7.0 x 10⁻⁴ 5.5 x 10⁻⁹ 0.23 LRP1 rs11613352 rs11613352 TG 93,999 4.4 x 10⁻¹⁰ 47,782 2.8 x 10⁻⁹ 46,632 1.9 x 10⁻³ 1.7 x 10⁻¹⁰ 0.041 MVK rs7134594 rs7134594 HDL 90,614 6.9 x 10⁻¹⁵ 47,772 1.8 x 10⁻⁷ 50,677 7.7 x 10⁻¹⁰ 8.2 x 10⁻¹⁶ 0.63 BRAP rs11065987 rs11065987 LDL 98,409 1.5 x 10⁻⁹ 47,367 1.5 x 10⁻⁴ 50,637 8.7 x 10⁻⁷ 7.0 x 10⁻¹⁰ 0.44
doi: 10.1038/nature09270 SUPPLEMENTARY INFORMATION
www.nature.com/nature 74

BRAP rs11065987 rs11065987 TC 98,409 6.8 x 10⁻¹² 47,776 2.2 x 10⁻⁵ 50,637 1.5 x 10⁻⁸ 2.1 x 10⁻¹² 0.40 HNF1A rs1169288 rs1169288 LDL 98,409 1.1 x 10⁻¹⁵ 47,367 2.9 x 10⁻¹⁰ 50,637 1.5 x 10⁻⁷ 3.0 x 10⁻¹⁶ 0.44 HNF1A rs1169288 rs1169288 TC 98,656 1.5 x 10⁻¹⁴ 47,776 5.7 x 10⁻⁹ 50,880 1.0 x 10⁻⁷ 3.5 x 10⁻¹⁵ 0.59 SBNO1 rs4759375 rs4759375 HDL 98,409 7.5 x 10⁻⁹ 47,772 1.1 x 10⁻⁷ 50,637 1.5 x 10⁻³ 2.4 x 10⁻⁹ 0.10 ZNF664 rs4765127 rs4765127 HDL 98,409 2.9 x 10⁻¹⁰ 47,754 2.4 x 10⁻⁷ 50,637 4.7 x 10⁻⁵ 7.4 x 10⁻¹¹ 0.36 ZNF664 rs4765127 rs12310367 TG 93,131 1.2 x 10⁻⁸ 47,782 2.0 x 10⁻⁷ 46,632 2.2 x 10⁻³ 5.4 x 10⁻⁹ 0.12 SCARB1 rs838880 rs838880 HDL 97,764 2.6 x 10⁻¹⁴ 41,639 5.2 x 10⁻⁷ 50,880 8.2 x 10⁻¹⁰ 3.4 x 10⁻¹⁵ 0.35 NYNRIN rs8017377 rs2332328 LDL 98,409 4.4 x 10⁻¹¹ 47,367 1.2 x 10⁻⁶ 50,637 3.3 x 10⁻⁶ 1.8 x 10⁻¹¹ 0.87 CAPN3 rs2412710 rs2412710 TG 93,983 1.9 x 10⁻⁸ 47,782 6.9 x 10⁻⁵ 46,632 2.7 x 10⁻⁵ 8.1 x 10⁻⁹ 0.65 FRMD5 rs2929282 rs2929282 TG 98,640 1.6 x 10⁻¹¹ 47,782 5.4 x 10⁻⁹ 50,880 8.8 x 10⁻⁵ 5.2 x 10⁻¹² 0.18
LIPC rs1532085 rs1532085 HDL 95,054 2.9 x 10-96 47,772 2.3 x 10-37 47,288 1.9 x 10-69 7.3 x 10-103 0.0019 LIPC rs1532085 rs1532085 TC 87,520 8.8 x 10⁻²⁰ 47,776 1.3 x 10⁻⁹ 47,608 1.3 x 10⁻¹² 1.2 x 10⁻²⁰ 0.56 LIPC rs1532085 rs261342 TG 83,209 2.4 x 10⁻¹³ 47,782 1.1 x 10⁻⁶ 43,613 8.7 x 10⁻⁹ 5.9 x 10⁻¹⁴ 0.52
LACTB rs2652834 rs2652834 HDL 87,766 8.8 x 10⁻⁹ 47,772 2.9 x 10⁻⁵ 47,852 2.3 x 10⁻⁵ 2.7 x 10⁻⁹ 0.96 CTF1 rs11649653 rs11649653 TG 65,871 3.4 x 10⁻⁸ 47,770 1.0 x 10⁻⁵ 33,806 3.3 x 10⁻⁴ 1.5 x 10⁻⁸ 0.58 CETP rs3764261 rs3764261 HDL 97,148 7.10 x 10-380 47,772 2.7 x 10-191 49,372 3.5 x 10-217 1.03 x 10-405 0.092 CETP rs3764261 rs247616 LDL 86,430 9.3 x 10⁻¹³ 47,367 6.7 x 10⁻⁷ 38,658 8.9 x 10⁻⁸ 3.2 x 10⁻¹³ 0.64 CETP rs3764261 rs3764261 TC 98,656 6.7 x 10⁻¹⁴ 47,776 7.7 x 10⁻⁹ 50,880 3.9 x 10⁻⁷ 1.7 x 10⁻¹⁴ 0.65 CETP rs3764261 rs7205804 TG 93,999 1.2 x 10⁻¹² 47,782 5.5 x 10⁻⁹ 46,632 7.8 x 10⁻⁶ 3.2 x 10⁻¹³ 0.35 LCAT rs16942887 rs16942887 HDL 98,656 8.4 x 10⁻³³ 47,772 3.4 x 10⁻¹³ 50,880 3.9 x 10⁻²⁴ 5.5 x 10⁻³⁵ 0.065 HPR rs2000999 rs2000999 LDL 93,999 1.8 x 10⁻²² 47,367 6.6 x 10⁻¹¹ 46,632 4.4 x 10⁻¹⁴ 2.5 x 10⁻²³ 0.45 HPR rs2000999 rs2000999 TC 98,588 3.2 x 10⁻²⁴ 47,776 4.9 x 10⁻¹² 50,814 7.2 x 10⁻¹⁵ 2.6 x 10⁻²⁵ 0.65
CMIP rs2925979 rs2925979 HDL 71,749 2.1 x 10⁻¹¹ 47,772 2.4 x 10⁻⁶ 37,253 3.9 x 10⁻⁷ 4.3 x 10⁻¹² 0.88 STARD3 rs11869286 rs881844 HDL 70,383 2.8 x 10⁻¹⁴ 47,772 1.9 x 10⁻⁶ 35,885 2.3 x 10⁻¹⁰ 3.7 x 10⁻¹⁵ 0.32 OSBPL7 rs7206971 rs7225700 LDL 98,409 3.9 x 10⁻⁹ 47,367 2.0 x 10⁻⁶ 50,637 1.9 x 10⁻⁴ 1.9 x 10⁻⁹ 0.49 OSBPL7 rs7206971 rs7206971 TC 95,070 1.1 x 10⁻⁸ 39,937 1.6 x 10⁻³ 47,288 4.8 x 10⁻⁷ 4.6 x 10⁻⁹ 0.33 ABCA8 rs4148008 rs4148008 HDL 96,905 1.8 x 10⁻¹⁰ 47,772 3.5 x 10⁻⁸ 49,133 1.3 x 10⁻⁴ 4.5 x 10⁻¹¹ 0.20 PGS1 rs4129767 rs4082919 HDL 95,067 5.0 x 10⁻⁹ 47,772 7.9 x 10⁻⁸ 47,285 1.4 x 10⁻³ 1.6 x 10⁻⁹ 0.10 LIPG rs7241918 rs7241918 HDL 86,707 2.7 x 10-49 47,772 8.6 x 10⁻²⁵ 38,925 1.6 x 10⁻²⁹ 1.5 x 10-52 0.63 LIPG rs7241918 rs7239867 TC 95,070 2.0 x 10⁻¹⁹ 47,776 1.3 x 10⁻⁹ 47,288 3.1 x 10⁻¹² 2.8 x 10⁻²⁰ 0.62 MC4R rs12967135 rs12967135 HDL 98,409 6.6 x 10⁻⁹ 47,772 1.3 x 10⁻⁵ 50,637 3.8 x 10⁻⁵ 2.0 x 10⁻⁹ 0.80
ANGPTL4 rs7255436 rs7255436 HDL 98,656 3.3 x 10⁻⁸ 47,772 6.7 x 10⁻⁵ 50,880 4.3 x 10⁻⁵ 1.1 x 10⁻⁸ 0.99 LDLR rs6511720 rs6511720 LDL 95,070 4.3 x 10-117 46,499 1.6 x 10-56 47,288 2.1 x 10-67 8.6 x 10-122 0.29 LDLR rs6511720 rs6511720 TC 98,409 6.7 x 10-97 46,884 2.4 x 10-42 50,637 1.4 x 10-61 1.7 x 10-101 0.10
LOC55908 rs737337 rs737337 HDL 95,034 3.1 x 10⁻⁹ 47,772 1.3 x 10⁻⁵ 47,264 1.7 x 10⁻⁵ 9.1 x 10⁻¹⁰ 0.89 CILP2 rs10401969 rs10401969 LDL 94,225 6.7 x 10⁻²² 47,351 2.0 x 10⁻⁹ 46,453 3.1 x 10⁻¹⁵ 1.0 x 10⁻²² 0.17 CILP2 rs10401969 rs10401969 TC 89,838 2.9 x 10-38 47,760 3.2 x 10⁻¹³ 42,471 5.2 x 10⁻³⁰ 4.9 x 10-40 0.0072 CILP2 rs10401969 rs10401969 TG 94,472 1.6 x 10⁻²⁹ 47,766 9.8 x 10⁻¹⁶ 46,696 8.0 x 10⁻¹⁷ 6.0 x 10⁻³¹ 0.81
APOE–C1–C2 rs4420638 rs4420638 HDL 95,070 4.4 x 10⁻²¹ 39,912 2.2 x 10⁻¹⁸ 47,288 2.2 x 10⁻⁷ 2.3 x 10⁻²² 0.0031
doi: 10.1038/nature09270 SUPPLEMENTARY INFORMATION
www.nature.com/nature 75

APOE–C1–C2 rs4420638 rs4420638 LDL 98,409 8.7 x 10-147 39,596 1.1 x 10-74 50,637 5.7 x 10-80 1.1 x 10-152 0.86 APOE–C1–C2 rs4420638 rs4420638 TC 93,999 5.2 x 10-111 39,914 1.1 x 10-47 46,632 7.8 x 10-71 2.7 x 10-116 0.20 APOE–C1–C2 rs439401 rs439401 TG 98,656 1.1 x 10⁻³⁰ 32,065 1.8 x 10⁻²¹ 50,880 5.9 x 10⁻¹³ 4.0 x 10⁻³² 0.073
FLJ36070 rs492602 rs492602 TC 98,409 2.0 x 10⁻¹⁰ 47,776 3.0 x 10⁻⁴ 50,637 2.4 x 10⁻⁸ 7.4 x 10⁻¹¹ 0.18 LILRA3 rs386000 rs386000 HDL 98,409 4.3 x 10⁻¹⁶ 47,772 1.5 x 10⁻⁶ 50,637 5.0 x 10⁻¹³ 4.1 x 10⁻¹⁷ 0.031 ERGIC3 rs2277862 rs2277862 TC 93,999 3.8 x 10⁻¹⁰ 47,776 1.5 x 10⁻³ 46,632 5.1 x 10⁻⁹ 1.4 x 10⁻¹⁰ 0.074 MAFB rs2902940 rs2902941 LDL 90,614 1.1 x 10⁻⁸ 47,367 5.7 x 10⁻⁵ 50,677 2.5 x 10⁻⁵ 5.6 x 10⁻⁹ 0.87 MAFB rs2902940 rs2902940 TC 98,409 6.1 x 10⁻¹¹ 47,776 1.9 x 10⁻⁶ 50,637 2.4 x 10⁻⁶ 2.1 x 10⁻¹¹ 0.89 TOP1 rs6029526 rs909802 LDL 98,409 3.2 x 10⁻¹⁹ 47,367 3.4 x 10⁻¹⁴ 50,637 9.2 x 10⁻⁸ 6.0 x 10⁻²⁰ 0.12 TOP1 rs6029526 rs4297946 TC 98,409 2.8 x 10⁻¹⁷ 47,774 7.1 x 10⁻¹⁴ 50,637 1.6 x 10⁻⁶ 4.8 x 10⁻¹⁸ 0.042
HNF4A rs1800961 rs1800961 HDL 98,656 1.1 x 10⁻¹⁵ 34,496 1.2 x 10⁻⁶ 50,880 8.2 x 10⁻¹² 1.1 x 10⁻¹⁶ 0.22 HNF4A rs1800961 rs1800961 TC 98,409 5.7 x 10⁻¹³ 34,498 2.6 x 10⁻⁸ 50,637 1.1 x 10⁻⁶ 1.6 x 10⁻¹³ 0.57 PLTP rs6065906 rs6065906 HDL 98,409 1.9 x 10⁻²² 47,772 5.4 x 10⁻¹⁴ 50,637 1.6 x 10⁻¹¹ 7.4 x 10⁻²⁴ 0.48 PLTP rs6065906 rs4810479 TG 93,131 4.7 x 10⁻¹⁸ 47,782 7.7 x 10⁻¹⁰ 46,632 1.5 x 10⁻¹⁰ 6.7 x 10⁻¹⁹ 0.84
UBE2L3 rs181362 rs181362 HDL 97,764 1.1 x 10⁻⁸ 47,772 4.0 x 10⁻⁴ 50,880 1.5 x 10⁻⁶ 3.5 x 10⁻⁹ 0.39 PLA2G6 rs5756931 rs5756931 TG 98,409 3.8 x 10⁻⁸ 47,782 1.3 x 10⁻⁴ 50,637 3.4 x 10⁻⁵ 1.7 x 10⁻⁸ 0.81
* Sample sizes and P-values for “All Studies” correspond to the primary meta-analysis and are identical to those shown in Supplementary Table 2.
† Meta-analysis of studies that used Principal Component Analysis (PCA) to account for population structure, as per Supplementary Table 3.
‡ Meta-analysis of studies that did not use PCA to account for population structure, as per Supplementary Table 3.
§ Meta-analysis of “Studies with PCA” and “Studies without PCA” P-values. Pearson’s correlation between “All Studies” P-values and “Combined” P-values = 0.98.
|| Heterogeneity P-values comparing Z-statistics for “Studies with PCA” and “Studies without PCA” calculated using METAL.
doi: 10.1038/nature09270 SUPPLEMENTARY INFORMATION
www.nature.com/nature 76

Acknowledgements
Massachusetts General Hospital (MGH). S.K. is funded by RC1 HL099793, RC1 HL099634,
and RC2 HL101864, all from the National Heart, Lung, and Blood Institute (NHLBI) of the US
National Institutes of Health (NIH), and the Donovan Family Foundation. D.A. is funded by NIH
R01 HL087676 from the NHLBI STAMPEED Genomics Research Program. Replication
genotyping was supported by The Broad Institute Center for Genotyping and Analysis through
grant U54 RR020278 from the National Center for Research Resources. K.M. is funded by T32
HL007208 and K99 HL098364 from the NHLBI. J.P.P. is a research fellow supported by Sarnoff
Cardiovascular Research Foundation. We thank Drs. Dennis A. Ausiello and Kenneth R. Chien
for support through the MGH Department of Medicine and Cardiovascular Research Center.
University of Michigan. T.M.T. is funded by T32 HG00040 from the National Human Genome
Research Institute (NHGRI) of the NIH. M.B. is funded by U01 DK062370 from the National
Institute of Diabetes and Digestive and Kidney Diseases (NIDDK) of the NIH.
Cardiovascular Health Study. The CHS research reported in this article was supported by
contract numbers N01-HC-85079 through N01-HC-85086, N01-HC-35129, N01 HC-15103,
N01 HC-55222, N01-HC-75150, N01-HC-45133, grant numbers U01 HL080295 and R01
HL087652 from the NHLBI, with additional contribution from the National Institute of
Neurological Disorders and Stroke (NINDS) of the NIH. A full list of principal CHS
investigators and institutions can be found at http://www.chs-nhlbi.org/pi.htm. DNA handling
and genotyping was supported in part by National Center for Research Resources grant M01-
RR00425 to the Cedars-Sinai General Clinical Research Center Genotyping core and NIDDK
grant DK063491 to the Southern California Diabetes Endocrinology Research Center.
Women’s Genome Health Study. The Women’s Genome Health Study Investigators are
indebted to the staff of the Women’s Health Study and to the nearly 20,000 dedicated and
conscientious women who are participating in this study. The WGHS is supported by funds from
doi: 10.1038/nature09270 SUPPLEMENTARY INFORMATION
www.nature.com/nature 77

the NHLBI (grants HL 04381 and HL 080467), the National Cancer Institute (CA 047988), the
Leducq Foundation, and the Donald W. Reynolds Foundation. Genotyping within the WGHS
was supported by Amgen, Inc.
PARC. PARC was supported by NIH grant U01 HL069757.
Family Heart Study. The Family Heart Study (FHS) work was supported in part by NIH grants
5R01HL08770003, 5R01HL08821502 (M.A.P.) from the NHLBI and 5R01DK07568102,
5R01DK06833603 from the NIDDK (I.B.B.). The authors thank the staff and participants of the
FHS for their important contributions.
National FINRISK Study. V.S. was supported by the Sigrid Juselius Foundation, Finnish
Foundation for Cardiovascular research, and the Finnish Academy (grant number 129494).
BLSA. This study was supported in part by the Intramural Research Program of the NIH,
National Institute on Aging (NIA). A portion of that support was through an R&D contract with
MedStar Research Institute.
InCHIANTI. The InCHIANTI study baseline (1998-2000) was supported as a "targeted project"
(ICS110.1/RF97.71) by the Italian Ministry of Health and in part by the NIA (Contracts: 263
MD 9164 and 263 MD 821336).
CLHNS. The investigators thank the Office of Population Studies Foundation research and data
collection teams. This work was supported by NIH grants DK078150, TW05596, HL085144,
RR20649, ES10126, DK56350, and T32 GM007092.
Age, Gene/Environment Susceptibility (AGES) – Reykjavik Study. The Age,
Gene/Environment Susceptibility – Reykjavik Study has been funded by NIH contract N01-AG-
12100, the NIA Intramural Research Program, Hjartavernd (the Icelandic Heart Association),
and the Althingi (the Icelandic Parliament).
doi: 10.1038/nature09270 SUPPLEMENTARY INFORMATION
www.nature.com/nature 78

ARIC. The Atherosclerosis Risk in Communities Study is carried out as a collaborative study
supported by NHLBI contracts N01-HC-55015, N01-HC-55016, N01-HC-55018, N01-HC-
55019, N01-HC-55020, N01-HC-55021, N01-HC-55022, R01HL087641, R01HL59367,
R01HL086694 and RC2 HL102419; NHGRI contract U01HG004402; and NIH contract
HHSN268200625226C. The authors thank the staff and participants of the ARIC study for their
important contributions. Infrastructure was partly supported by Grant Number UL1RR025005, a
component of the NIH Roadmap for Medical Research.
Framingham Heart Study. The investigators thank the participants and staff in the Framingham
Heart Study. This research was conducted in part using data and resources from the Framingham
Heart Study of the NHLBI and Boston University School of Medicine. The analyses reflect
intellectual input and resource development from the Framingham Heart Study investigators
participating in the SNP Health Association Resource (SHARe) project. This work was partially
supported by the NHLBI Framingham Heart Study (Contract No. N01-HC-25195) and its
contract with Affymetrix, Inc for genotyping services (Contract No. N02-HL-6-4278). DNA
isolation and biochemistry were partly supported by NHLBI HL-54776. A portion of this
research utilized the Linux Cluster for Genetic Analysis (LinGA-II) funded by the Robert
Dawson Evans Endowment of the Department of Medicine at Boston University School of
Medicine and Boston Medical Center.
BRIGHT Study. The contribution of M.J.C., T.J., and P.B.M. was facilitated by the Barts and
The London National Institute for Health Research Cardiovascular Biomedical Research Unit,
the Medical Research Council Programme grant number G9521010, data from the Wellcome
Trust Case Control Consortium and a Wellcome Trust Value In People Award. The BRIGHT
study is supported by the Medical Research Council of Great Britain (G9521010D) and the
British Heart Foundation (BHF) (PG/02/128). Genotyping was funded by the Wellcome Trust
(grant number; 076113/B/04/Z) as part of The Wellcome Trust Case Control Consortium. The
BRIGHT study is extremely grateful to all the patients who participated in the study and the
doi: 10.1038/nature09270 SUPPLEMENTARY INFORMATION
www.nature.com/nature 79

BRIGHT nursing team. BRIGHT investigators are also supported by BHF grants
(RG/07/005/23633 and SP/08/005/25115) and EU Ingenious HyperCare Consortium: Integrated
Genomics, Clinical Research and Care in Hypertension (LSHM-C7-2006-037093). This work
forms part of the research themes contributing to the translational research portfolio of Barts and
the London Cardiovascular Biomedical Research Unit that is supported and funded by the
National Institute of Health Research. N.J.S. holds a Chair supported by the British Heart
Foundation.
GEMS Consortium. We acknowledge the support of the UK Medical Research Council,
Wellcome Trust, British Heart Foundation (BHF), European Commission, and GlaxoSmithKline.
Specifically, we acknowledge use of genotype data from the 1958 British birth cohort DNA
collection, funded by the Medical Research Council grant G0000934 and the Wellcome Trust
grant 068545/Z/02. This research utilises resources provided by the Type 1 Diabetes Genetics
Consortium, a collaborative clinical study sponsored by the National Institute of Diabetes and
Digestive and Kidney Diseases (NIDDK), National Institute of Allergy and Infectious Diseases
(NIAID), National Human Genome Research Institute (NHGRI), National Institute of Child
Health and Human Development (NICHD), and Juvenile Diabetes Research Foundation
International (JDRF) and supported by U01 DK062418. The T1DGC GWAS project was funded
by the NIDDK and JDRF, and co-ordinated by the JDRF/WT Diabetes and Inflammation
Laboratory, Cambridge Institute for Medical Research, Cambridge, UK, which is funded by the
JDRF International, the Wellcome Trust, and the National Institute for Health Research
Cambridge Biomedical Research Center. The Cambridge Institute for Medical Research is in
receipt of a Wellcome Trust Strategic Award (079895). I.B. acknowledges support from EU FP6
funding (contract no LSHM-CT-2003-503041). M.S.S. and S.L.R. are funded by the BHF
(PG/08/094) and MRC (G0801566). I.B. (077016/Z/05/Z), L.P., M.I., and P.D. are funded by the
Wellcome Trust. The CoLaus study was supported by grants from GlaxoSmithKline, the Swiss
doi: 10.1038/nature09270 SUPPLEMENTARY INFORMATION
www.nature.com/nature 80

National Science Foundation (Grant 33CSCO-122661) and the Faculty of Biology and Medicine
of Lausanne.
FUSION. The FUSION investigators thank the Finnish citizens who generously participated in
these studies. Support for FUSION was provided by NIH grants DK062370 (M.B.), DK072193
(K.L.M.), T32 HG00040 (T.M.T.), and K99HL094535 (to C.J.W.), intramural project number
1Z01 HG000024 (to F.S.C.), and an American Diabetes Association (ADA) Mentor-Based
Postdoctoral Fellowship grant (M.B.). K.L.M. is a Pew Scholar for the Biomedical Sciences.
Genome-wide genotyping was conducted by the Johns Hopkins University Genetic Resources
Core Facility SNP Center at the Center for Inherited Disease Research (CIDR), with support
from CIDR NIH contract no. N01-HG-65403. The investigators also thank Anne Jackson for
assistance with statistical analyses.
Singapore Malay Eye Study and Singapore Prospective Study Program. These studies were
supported by the Agency for Science Technology and Research, Singapore.
deCODE CAD/MI Study. This study was sponsored by NIH grant R01 HL089650.
ENGAGE Consortium. The consortium has received funding from the European Community's
Seventh Framework Programme (FP7/2007-2013)/grant agreement HEALTH-F4-2007-201413
by the European Commission under the programme “Quality of Life and Management of the
Living Resources” of 5th Framework Programme (no. QLG2-CT-2002-01254). The Finnish
Heart Association (M.P., L.P.) is gratefully acknowledged for its financial support. L.P. and J.K.
have been supported by the Academy of Finland Centre of Excellence in Complex Disease
Genetics. NFBC genotyping was supported on NHLBI grant 5R01HL087679-02 through the
STAMPEED program. EUROSPAN (European Special Populations Research Network) was
supported by European Commission FP6 STRP grant number 018947 (LSHG-CT-2006-01947).
For the MICROS study in South Tyrol, we thank the primary care practitioners R. Stocker, S.
Waldner, T. Pizzecco, J. Plangger, U. Marcadent and the personnel of the Hospital of Silandro
(Department of Laboratory Medicine) for their participation and collaboration in the research
project. In South Tyrol, the study was supported by the Ministry of Health of the Autonomous
Province of Bolzano and the South Tyrolean Sparkasse Foundation. NTR/NESDA was supported
by “Genetic basis of anxiety and depression” program (NWO 904-61-090); Twin-family
doi: 10.1038/nature09270 SUPPLEMENTARY INFORMATION
www.nature.com/nature 81

database for behavior genomics studies (NWO 480-04-004); Center for Medical Systems
Biology (NWO Genomics); Spinozapremie (SPI 56-464-14192); Centre for Neurogenomics and
Cognitive Research (CNCR-VU); Genome-wide analyses of European twin and population
cohorts (EU/QLRT-2001-01254); Geestkracht program of ZonMW (10-000-1002); and matching
funds from universities and mental health care institutes involved in NESDA (GGZ
Buitenamstel-Geestgronden, Rivierduinen, University Medical Center Groningen, GGZ Lentis,
GGZ Friesland, GGZ Drenthe). Major funding for this project is from the Genetic Association
Information Network of the Foundation for the US National Institutes of Health, a public-private
partnership between the NIH and Pfizer, Affymetrix and Abbott Laboratories. The Vis study in
the Croatian island of Vis was supported through the grants from the Medical Research Council
UK to H.C., A.W. and I.R.; and Ministry of Science, Education and Sport of the Republic of
Croatia to I.R. (number 108-1080315-0302). The ERF study was supported by grants from The
Netherlands Organisation for Scientific Research, Erasmus MC and the Centre for Medical
Systems Biology (CMSB). We are grateful to all study participants and their relatives, general
practitioners and neurologists for their contributions and to P. Veraart for her help in genealogy,
J. Vergeer for the supervision of the laboratory work and P. Snijders for his help in data
collection. The Northern Swedish Population Health Study was funded by the Swedish Medical
Research Council and the European Commission through the EUROSPAN project. We are
greatly indebted to the participants in the study. The ORCADES study was supported by the
Scottish Executive Health Department, the Royal Society and the Wellcome Trust Clinical
Research Facility. We would like to acknowledge the data collection team in Orkney, the clerical
team in Edinburgh and the people of Orkney. We express our appreciation to all study
participants.
KORA. The KORA research platform was initiated and financed by the Helmholtz Center
Munich, German Research Center for Environmental Health, which is funded by the German
Federal Ministry of Education and Research (BMBF) and by the State of Bavaria. Part of this
work was financed by the German National Genome Research Network (NGFN-2 and
NGFNPlus: 01GS0823) and by the “Genomics of Lipid-associated Disorders – GOLD” of the
“Austrian Genome Research Programme GEN-AU.” The KORA research was supported within
the Munich Center of Health Sciences (MC Health) as part of LMUinnovativ. We gratefully
acknowledge the contribution of P. Lichtner, G. Eckstein and T. Strom and all other members of
doi: 10.1038/nature09270 SUPPLEMENTARY INFORMATION
www.nature.com/nature 82

the Helmholtz Zentrum München genotyping staff in generating and analyzing the SNP dataset.
We thank all members of field staffs who were involved in the planning and conduct of the
MONICA/KORA Augsburg studies. Finally, we express our appreciation to all study
participants.
Rotterdam Study. The Rotterdam Study (I and II) is funded by Erasmus Medical Center and
Erasmus University, Rotterdam, Netherlands Organization for the Health Research and
Development (ZonMw), the Research Institute for Diseases in the Elderly (RIDE), the Ministry
of Education, Culture and Science, the Ministry for Health, Welfare and Sports, the European
Commission (DG XII), the Netherlands Genomics Initiative (NGI)-sponsored Netherlands
Consortium for Healthy Aging (NCHA) and the Municipality of Rotterdam. Genome-wide
genotyping of the Rotterdam Study was supported by The Netherlands Organization for
Scientific Research (NOW 175.010.2005.011).
Erasmus Rucphen Family Study. Erasmus Rucphen Family (ERF) was supported by grants
from The Netherlands Organization for Scientific Research (NWO; Pionier Grant), Erasmus MC,
and the Netherlands Genomics Initiative (NGI)-sponsored Center of Medical Systems Biology
(CMSB).
doi: 10.1038/nature09270 SUPPLEMENTARY INFORMATION
www.nature.com/nature 83