Embed Size (px)
Citation preview
electrochem
Review
Surface Characterization of Carbonaceous MaterialsUsing Inverse Gas Chromatography: A Review
Fatemeh Gholami 1,* , Martin Tomas 1, Zahra Gholami 2 , Somayeh Mirzaei 3 andMohammadtaghi Vakili 4
1 New Technologies—Research Centre, University of West Bohemia, 30100 Plzen, Czech Republic;[email protected]
2 Unipetrol Centre of Research and Education, a.s, Areál Chempark 2838, Záluží 1,436 70 Litvínov, Czech Republic; [email protected]
3 Department of Chemical Engineering, National Yulin University of Science and Technology,Yulin 64002, Taiwan; [email protected]
4 Green intelligence Environmental School, Yangtze Normal University, Chongqing 408100, China;[email protected]
* Correspondence: [email protected]; Tel.: +420-377-634-816
Received: 2 September 2020; Accepted: 7 October 2020; Published: 12 October 2020�����������������
Abstract: It is essential to understand the adsorption of guest molecules on carbon-based materialsfor both theoretical and practical reasons. It is crucial to analyze the surface properties ofcarbon-based materials with a wide range of applications (e.g., catalyst supports, hydrogen storage,sensors, adsorbents, separation media, etc.). Inverse gas chromatography (IGC) as a powerfuland sensitive technique can be used to characterize the surface physicochemical properties (i.e.,Brunauer-Emmett-Teller (BET) surface area, surface energy heterogeneity, heat of adsorption, specificinteraction of adsorption, work of cohesion, glass transition temperatures, solubility, and so forth) ofvarious types of materials such as powders, films, and fibers. In this review, the principles, commonmethods, and application of IGC are discussed. In addition, the examples of various experimentsdeveloped for the IGC to characterize the carbonaceous materials (such as carbon nanotubes, graphite,and activated carbon) are discussed.
Keywords: inverse gas chromatography; carbonaceous materials; surface analysis; physicochemicalproperties
1. Introduction
Gas chromatography is a method often used to investigate gas–adsorbent and gas–liquid equilibria.A variant of this method is inverse gas chromatography. The term inverse indicates that the materialstudied is a nonvolatile stationary phase that is either liquid or solid. This modification of the classicalchromatographic approach was first introduced by Davis and Petersen [1]. There are a lot of researchstudies in the literature describing the physicochemical characteristics derived from inverse gaschromatography (IGC) experiments of silica, alumina, polymer and their blends, commercial stationaryphases, paper fillers, wood, minerals, carbon fibers, carbon blacks and graphite, and activated carbons.Therefore, a review of the literature could help researchers’ better understanding and useful applicationof the IGC method. Using this method is promising in the investigation of the surface activity of porousmaterial, which is challenging to measure by conventional methods such as contact angle. The effectof modification on surface properties as well as the effect of the IGC experiment conditions such astemperature and humidity can be evaluated [2].
Two different conditions may apply to perform IGC: infinite dilution (ID) and finite concentration(FC). In IGC-FC, the small amount of injected salutes leads to deformation of the chromatographic
Electrochem 2020, 1, 367–387; doi:10.3390/electrochem1040024 www.mdpi.com/journal/electrochem
Electrochem 2020, 1 368
peaks, and the measurement is based on the calculation of the peak deformation, adsorption isotherms,and adsorption energies distribution. The IGC-ID is based on the calculation of the interaction level ofsolid surface and probe molecules by the injection of very small amounts of probe molecules into achromatographic column. The degree of dilution is such that intermolecular interactions between theadsorbed molecules can be neglected. A pulse of a very diluted vapor of probe molecules is injectedinto the column, pushed by the carrier gas, after which the probe molecules explore the whole surfaceof the solid statistically before leaving the column. The flow of solute molecules leaving the column isdetected and recorded [3,4]. In this review, a theoretical background of IGC and methods to calculatethe dispersive surface energy are described and compared. In addition, examples of application ofIGC to characterize the physicochemical properties (such as surface energy, acid–base properties,solubility, etc.) of carbonaceous material (activated carbon, carbon nanotubes, carbon fiber, graphite,etc.) are described.
2. Theoretical Background of Inverse Gas Chromatography
Characterization of the surface properties of solid materials is the main application of the IGC.The measurement is based on the retention volume or retention time, which are the carrier gas volumeand time required to create a peak as a result of interactions of the probe molecule and the solid surface.Different features of a material such as dispersive surface energy and acid–base properties can bedetermined using IGC. The surface energy of the solid material is a combination of dispersive andspecific components.
2.1. Dispersive Component of Surface Free Energy
Two methods are used to calculate the dispersive component of the surface free energy, includingthe Schultz method [5] and Dorris–Gray method [6], which are discussed in the next sections.
2.1.1. Schultz Method
Schultz and Lavielle [7] suggested a method to calculate the surface dispersive free energy. In thismethod, the calculation of the surface-dispersive free energy (γD
S ) is based on the retention timeor volume of series of linear liquid n-alkane (non-polar) probe molecules at infinite dilution at theHenry’s Law region [8]. While using the non-polar alkanes, there are no interactions between theprobe molecules; thus, the IGC chromatograms are symmetrical Gaussian [9]. The required time for thenon-adsorbing probe molecule to pass the column after injection into the column, the dead time (t0),is typically determined using methane as an inert gas. The solute gross retention time is the requiredtime to pass the column completely (tR). The net retention volume (VN) of the probe is determinedby [9]:
VN = j·Fc·(tR − t0) (1)
where j is the James–Martin correction factor, and Fc is the flow rate of carrier gas in the column.The value of j is determined using Equation (2) [6,10]:
j =32
( Pi
P0
)2− 1( Pi
P0
)3− 1
(2)
where P0 is the entering pressure and Pi is the atmospheric pressure. The net retention time is anaverage required time for the probe molecules in the adsorbed state. The value of the retention of thetest solutes (t′R) is the difference between the retention time of the peak of the probe (tR) and the gashold-up time (tM), which can be calculated using the Grobler–Balizs procedure [11,12].
t′R = tR − tM (3)
Electrochem 2020, 1 369
The value of tR corresponds to the first-order moment of the peak of the probe. The specificretention volume (Vg) is the required volume of the carrier gas to push the probe molecules out of theGC column. The exact quantity in terms of the experimental variable is [6]:
Vg =32·t′R·j·Fc·273.15
mw·T(4)
where T is the measurement temperature, mw is the mass of the stationary phase. At infinite dilution,the net retention volume (VN) value of one or several probes is related to the concentration of theadsorbate in the gas phase, and it can be determined as [10]:
VN = KS S (5)
where KS is the surface partition coefficient, and S is the specific surface area of the examined material.The standard free energy change of adsorption ∆G0 of the probe on a solid surface can be shown as:
∆G0 = −RT Ln(
VNP0
Sgπ0
)(6)
where R is the gas constant, S is the specific surface area of the adsorbate, and g is the weight of theadsorbate in the column. Depending on the reference state Kemball and Rideal (P0 = 1.013 × 10⁵ Paand π0 = 6.08 × 10⁻⁵ Nm−1) or DeBoer (P0 = 1.013 × 10⁵ Pa and π0 = 3.38 × 10⁻⁴ Nm−1), ∆G0 can bewritten as [10,13]:
− ∆G0 = RT LnVN + K (7)
where K is a constant for the chromatographic column.
RT LnVN = N·a·WA + constant (8)
where N is Avogadro’s number, a is the surface area of the probe molecule, and WA is the adhesionenergy between probe molecules and solid per unit surface area of the solid adsorbate. When n-alkanesare used as probes and dispersion interactions are only being exchanged, the energy of adhesion canbe obtained based on the Fowkes relation [10]:
WA = 2(γD
S γDL
) 12 (9)
− ∆G = RT LnVN = 2N·a(γD
S γDL
) 12 + constant. (10)
For n-alkanes γDL = γH, thus:
− ∆G = RT LnVN = 2N·a(γD
S γH
) 12 + constant (11)
where γDL is the dispersive free surface energy of the probe molecule, γD
S is a dispersive componentof the surface free energy of the solid, and γH is the surface free energy for non-polar hydrocarbons.
The RT LnVN is a linear function of the quantity (γH)12 , and the slope of the straight line leads to the
γDS values.
γDS =
1γD
L
(RT LnVN
2N·a
)2(12)
When two alkanes of n and (n + 1) are used as probe molecules, the γDS can be expressed as:
Electrochem 2020, 1 370
γDS,Schultz =
RT Ln
V(Cn+1H2n+4)N,n+1
V(CnH2n+2)N
2
4N2(a2
n+1·γD, (Cn+1H2n+4)L − a2
n·γD, (Cn+1H2n+2)L
) . (13)
2.1.2. Dorris–Gray Method
Dorris and Gray [6] suggested another method to calculate the dispersive component of thesurface free energy. The γD
S can be calculated by considering the increment of free energy of adsorptionper CH2 group. The increase per CH2 in the free energy of adsorption between two alkanes of n andn+1 can be determined using [9]:
∆GCH2 = −RT Ln
V(Cn+1H2n+4)N,n+1
V(CnH2n+2)N
. (14)
By applying Foweks principle, Equation (14) can be expressed as:
− ∆GCH2 = 2N·a(γD
S γDCH2
) 12 + constant (15)
γDS =
14γCH2
(−∆GCH2
N·aCH2
)2
(16)
where aCH2 is the cross-sectional area of a CH2 group, and γCH2is the surface energy of a CH2 group
at the given temperature of T (K), which can be calculated by:
γCH2= 35.6 + 0.058(293− T) (17)
γDS,Dorris−Gray =
RTLnV(Cn+1H2n+4)N,n+1
V(CnH2n+2)N
2
4N2·a2
CH2·γCH2
. (18)
2.1.3. Comparison of Schultz and Dorris–Gray Methods
Generally, the dispersive results calculated from two methods of Dorris–Gray and Schultz aredifferent in a similar condition of measurement. A comparison of two methods can help find thedifferences in their results. The ratio of γD
S,Dorris−Gray and γDS,DSchultz can be calculated from Equations
(13) and (19):γD
S,Dorris−Gray
γDS,DSchultz
=a2
n+1·γ(Cn+1H2n+4)L − a2
n·γ(Cn+1H2n+2)L
a2CH2·γCH2
. (19)
If the ratio value is higher than one, it means that the calculated dispersive free energy by theDorris–Gray method is bigger than that calculated using the Schultz method. Shi et al. [14] reportedthat increasing the temperature resulted in an increment of the ratio. They have also reported that thevalues of γD
S were bigger than those calculated by the Dorris–Gray method. In comparison with theparameters in the solvents handbook, the calculated surface free energy parameters using the Schultzmethod were not accurate enough. Another study by Ylä-Mäihäniemi [15] confirmed that comparedto the γD
S calculated with the Schultz method, the obtained value with Dorris–Gray is more accuratewith a much lower experimental error. On the other hand, Kołodziejek et al. [16] reported that theγD
S values calculated with the Dorris–Gray and Schultz methods for different hybrid materials werewithout a certain difference.
Electrochem 2020, 1 371
2.2. Specific Component of Surface Free Energy
During the polar probes injection, both dispersive and specific interactions are established withthe solid surface, thus:
∆G = ∆Gd + ∆Gsp. (20)
Based on the theory of Good-Van Oss:
∆Gsp = 2N·a((γ+L γ−S
) 1/2+
(γ−Lγ
+S
) 1/2)
(21)
where γ+S and γ−S are the acidic and basic parameters of the solid surface, γ+L and γ−L are the acidic andbasic parameters of the probe molecules. For non-polar probes, γ−L = 0, and γ+L can be provided by theliterature. Thus,
∆Gsp = 2N·a((γ+L γ−S
) 1/2). (22)
Therefore,
γ−S =(∆Gsp
acidic/(2N·aacidic))2(
1/γ+acidic
). (23)
Similarly, the γ+S can be written as:
γ+S =(∆Gsp
basic/(2N·abasic))2(
1/γ+acidic
)(24)
γPS = 2
(γ+S γ−S
) 12 (25)
and the total surface energy (γTS ) is calculated as follows:
γTS = γD
S + γPS . (26)
The adsorption enthalpy, ∆HSP, assigned to the acid–base interactions can be determined asfollows [10]:
∆GSP = ∆HSP − T∆SSP (27)
where ∆SSP is the adsorption entropy of acid–base interactions. Following Papirer’s approach [17],the values of KA and KB were calculated using:
− ∆HSP = KA·DN + KB·AN∗. (28)
The KA and KB are describing the acid and base characteristics of the solids, while DN and AN∗
are Gutmann’s numbers for the acceptor and donor probes. The KA and KB values can be calculated
from the plot of (−∆HSP)AN∗ versus DN
AN∗ :
−(∆HSP)
AN∗= KA
DNAN∗
+ KB. (29)
IGC is a powerful, sensitive, and quick method to evaluate the surface properties of differentkinds of materials such as films, fiber, and powder in crystalline or amorphous structures such ascopolymers, polymer blends, pharmaceutical materials, and nanomaterials [18]. By increasing theinterest in material science, the IGC was invented in 1967, and the theory and methodology of IGCwere developed at the beginning of 1976 [10]. Various surface characterization and a wide range ofinformation about physicochemical properties can be obtained using this technique, such as solubility,thermodynamic interaction parameters, glass transition temperatures, surface area, surface energyheterogeneity, diffusion kinetics, acid–base properties, work of cohesion, work of adhesion, adsorptionisotherms, and polar functionality on the materials surface.
Electrochem 2020, 1 372
3. Applications of IGC for Carbonaceous Materials
Since carbonaceous materials are broadly used in many fields of industry, especially as adsorbentsand catalysts, the investigation of surface properties and interface characterization, interfacial tension,and surface energy are attracting more attention. IGC is an accurate and well-established methodto study the physicochemical properties of the surface of various materials such as pharmaceuticalmaterials, nanomaterials, fibers, porous materials, and carbonaceous materials.
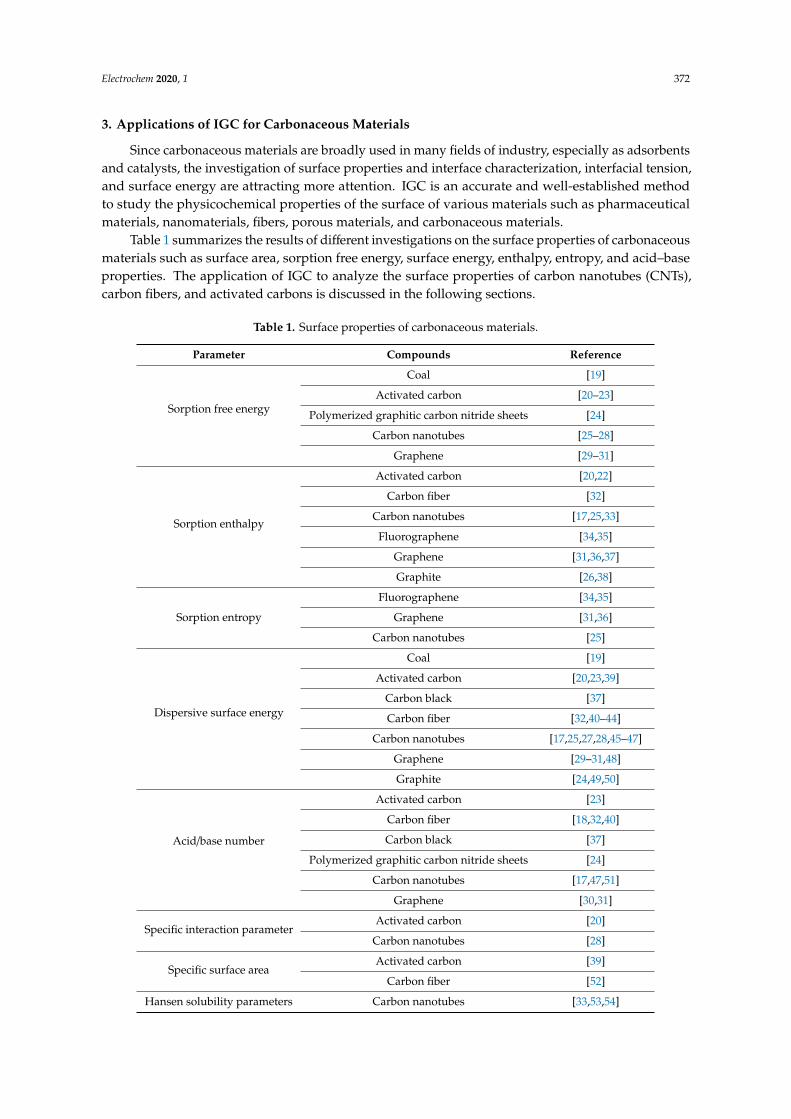
Table 1 summarizes the results of different investigations on the surface properties of carbonaceousmaterials such as surface area, sorption free energy, surface energy, enthalpy, entropy, and acid–baseproperties. The application of IGC to analyze the surface properties of carbon nanotubes (CNTs),carbon fibers, and activated carbons is discussed in the following sections.
Table 1. Surface properties of carbonaceous materials.
Parameter Compounds Reference
Sorption free energy
Coal [19]
Activated carbon [20–23]
Polymerized graphitic carbon nitride sheets [24]
Carbon nanotubes [25–28]
Graphene [29–31]
Sorption enthalpy
Activated carbon [20,22]
Carbon fiber [32]
Carbon nanotubes [17,25,33]
Fluorographene [34,35]
Graphene [31,36,37]
Graphite [26,38]
Sorption entropy
Fluorographene [34,35]
Graphene [31,36]
Carbon nanotubes [25]
Dispersive surface energy
Coal [19]
Activated carbon [20,23,39]
Carbon black [37]
Carbon fiber [32,40–44]
Carbon nanotubes [17,25,27,28,45–47]
Graphene [29–31,48]
Graphite [24,49,50]
Acid/base number
Activated carbon [23]
Carbon fiber [18,32,40]
Carbon black [37]
Polymerized graphitic carbon nitride sheets [24]
Carbon nanotubes [17,47,51]
Graphene [30,31]
Specific interaction parameterActivated carbon [20]
Carbon nanotubes [28]
Specific surface areaActivated carbon [39]
Carbon fiber [52]
Hansen solubility parameters Carbon nanotubes [33,53,54]
Electrochem 2020, 1 373
3.1. Carbon Nanotubes
Carbon nanotubes (CNTs) with unique and remarkable intrinsic chemical and physical propertiessuch as a large specific surface area, mechanical strength, stiffness, and high electrical conductivity havehigh potential for use in a wide range of applications in various field such as filtration, heterogeneouscatalyst, energy storage, gas sensors, and hybrid nanocomposites.
Their main applications were noncovalent adsorption or the wrapping of various functionalmolecules and the covalent attachment of chemical groups through reactions onto the π-conjugatedpolymers of CNTs. CNTs are ideal candidates as advanced reinforcing materials in composite materials,owing to their outstanding mechanical and electrical properties [55]. The investigation of CNTs’surface properties using analytical techniques are crucial. In nanocomposite applications, the chemicalmodification of CNTs is an effective method to increase the dispersion uniformity and strong bondto the matrix to enable effective stress transfer. Furthermore, their low concentration of surfacegroups, heterogeneity, low solubility, high optical absorbance, high surface area, and small sizelimited many characterization techniques. In this area, IGC is a powerful technique. The surfacecharacterization of CNTs has been investigated by different conventional analytical methods suchas scanning electron microscopy (SEM) [56], transmission electronic microscopy (TEM) [57], X-rayphotoelectron spectroscopy (XPS) [58], scanning tunneling microscopy [59,60], photoluminescencespectroscopy [61], neutron diffraction [62], infrared spectroscopy [63], Raman spectroscopy [64],electrophoretic zeta-potential measurements [65], and Boehm’s titration [66]. Applying IGC as apowerful method combined with other techniques such as Fourier-transform infrared spectroscopy(FTIR), transmission electron microscopy (TEM), and thermal gravimetric analysis (TGA) can provideuseful complementary information on the surface characterization of materials. Researchers haveused IGC as a method to measure the surface energy and acid/base properties of the gas diffusionlayer of proton exchange membrane fuel cells [67,68] and to identify relative humidity effects on thehydrophobic nature of gas diffusion layer (GDL) [69].
The IGC technique has been applied to investigate the adsorption of different alkanes, aromatics,and chlorohydrocarbons onto three kinds of nonmicroporous carbons, including multi-walled carbonnanotubes (MWCNTs), carbon nanofibers (CNFs), and high surface area graphite (HSAGs) [25].The enthalpy of adsorption of HSAG is higher than that of CNTs and CNFs; hence, adsorption on CNTsand CNFs is less energetically favorable than adsorption on HGAS. Thus, HSAG had considerablyhigher adsorption capacity compared to CNTs and CNFs. The surface energy and acid/base propertiesof MWCNTs and their derivatives using different probe molecules and conditions of near-zero surfacecoverage of MWCNTs were investigated by Zhang et al. [70] and found that the surface modificationof MWCNT is strongly affecting the acid/base characters.
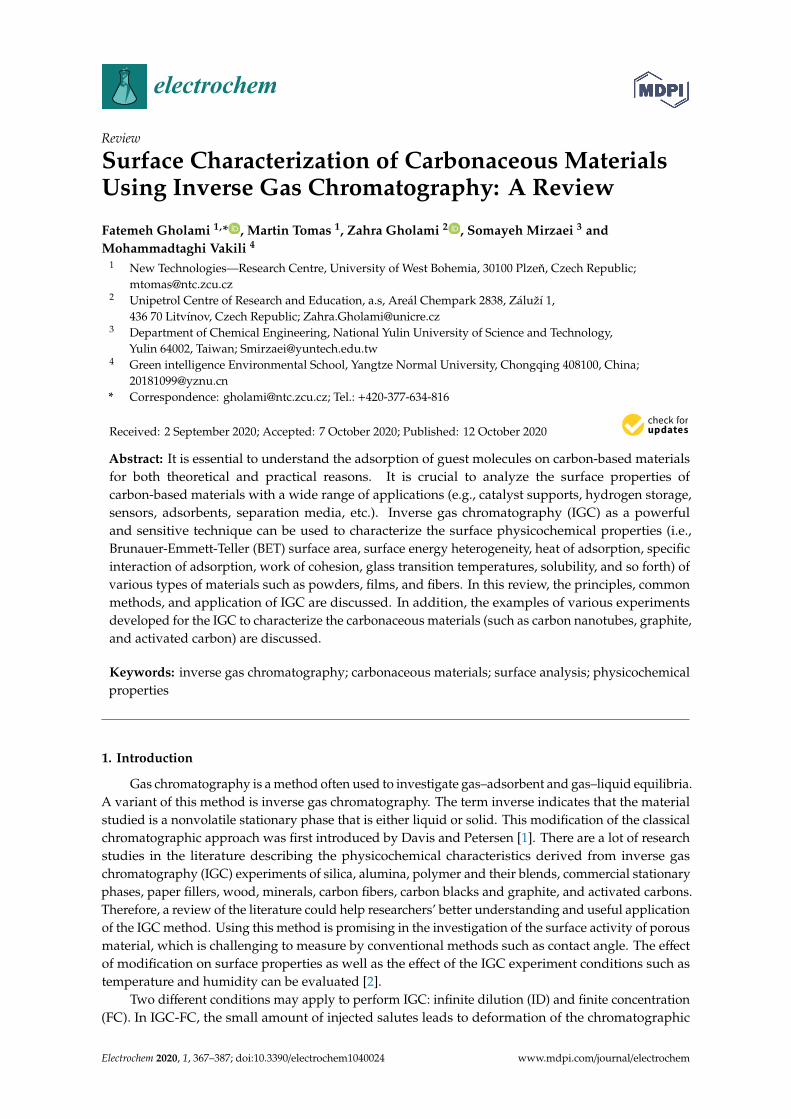
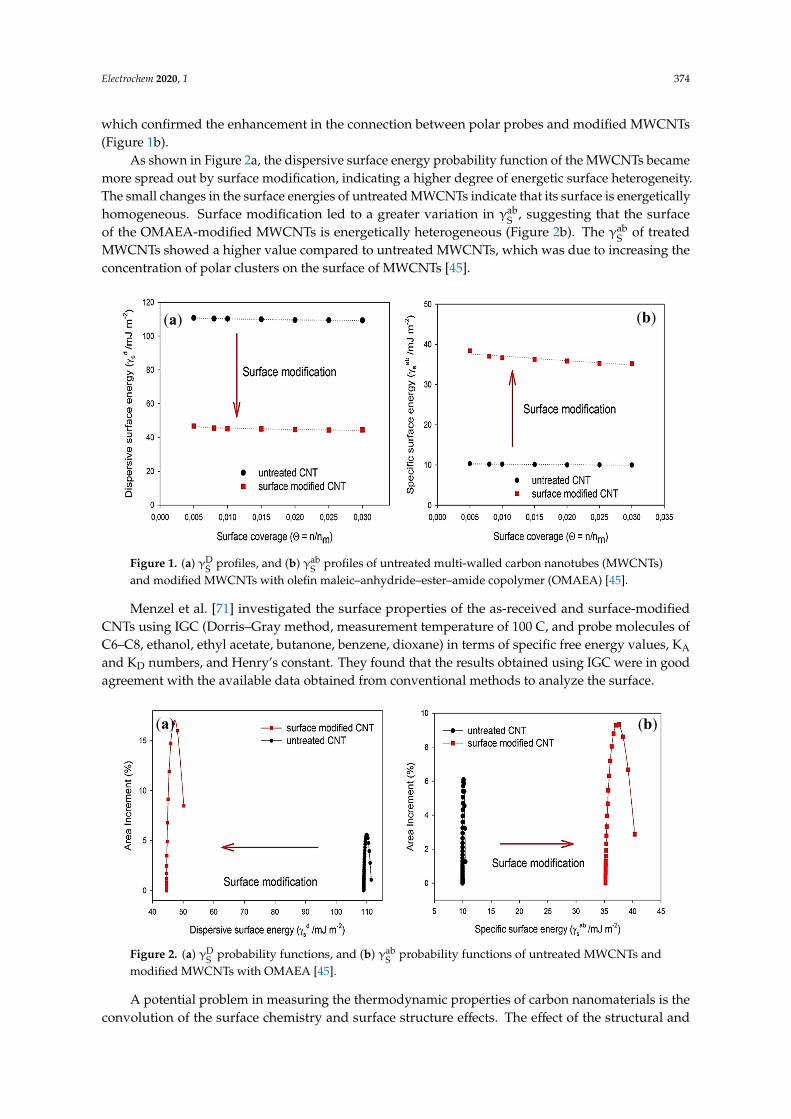
The IGC analysis is mainly considered as one of the standard methods for the surfacecharacterization of CNTs with polymer blends. Gerencser et al. [43] reported that the IGC is anefficient technique to characterize the surface properties of untreated and treated MWCNTs with theolefin maleic–anhydride–ester–amide copolymer (OMAEA) coupling agent. They have investigatedthe specific and dispersive surface energy (γab
S and γDS ) and acidic and basic component of the surface
energy (γs+ and γs-) by using n-hexane, n-heptane, n-octane, n-nonane, chloroform, and tolueneas test probe molecules. The IGC experiments were carried out at a column temperature of 353 K.The Dorris–Gray method was used to calculate the γD
S , and van Oss–Chaudhury–Good theory with theDella Volpe scale was applied to calculate γab
S . As shown in Figure 1a, the dispersive surface energy(γD
S ) of modified MWCNTs decreased considerably.Debey, Kessom, and London ascribed the strong physical attraction of untreated MWCNTs to
their high dispersive surface energy and high agglomeration tendency. The attachment of OMAEA onthe surface of MWCNTs caused a reduction in the dispersive surface energy of MWCNTs, indicatingthat the coupling agents are affecting the dispersive surface energy. The specific surface energy (γab
S )of modified MWCNTs increased by more than fourfold compared with that of untreated MWCNTs,
Electrochem 2020, 1 374
which confirmed the enhancement in the connection between polar probes and modified MWCNTs(Figure 1b).
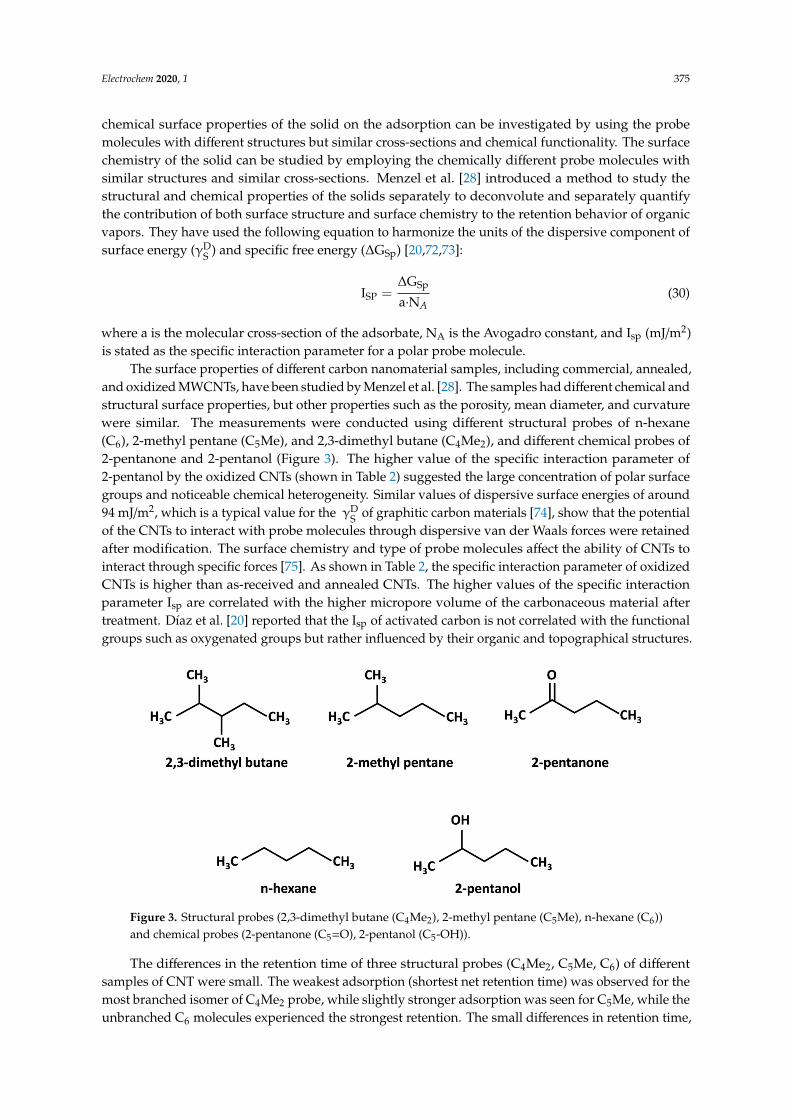
As shown in Figure 2a, the dispersive surface energy probability function of the MWCNTs becamemore spread out by surface modification, indicating a higher degree of energetic surface heterogeneity.The small changes in the surface energies of untreated MWCNTs indicate that its surface is energeticallyhomogeneous. Surface modification led to a greater variation in γab
S , suggesting that the surfaceof the OMAEA-modified MWCNTs is energetically heterogeneous (Figure 2b). The γab
S of treatedMWCNTs showed a higher value compared to untreated MWCNTs, which was due to increasing theconcentration of polar clusters on the surface of MWCNTs [45].
Electrochem 2020, 2, FOR PEER REVIEW 7
the specific and dispersive surface energy (γ and γ ) and acidic and basic component of the surface energy (γs+ and γs-) by using n-hexane, n-heptane, n-octane, n-nonane, chloroform, and toluene as test probe molecules. The IGC experiments were carried out at a column temperature of 353 K. The Dorris–Gray method was used to calculate the γ , and van Oss–Chaudhury–Good theory with the Della Volpe scale was applied to calculate γ . As shown in Figure 1a, the dispersive surface energy (γ ) of modified MWCNTs decreased considerably.
Debey, Kessom, and London ascribed the strong physical attraction of untreated MWCNTs to their high dispersive surface energy and high agglomeration tendency. The attachment of OMAEA on the surface of MWCNTs caused a reduction in the dispersive surface energy of MWCNTs, indicating that the coupling agents are affecting the dispersive surface energy. The specific surface energy (γ ) of modified MWCNTs increased by more than fourfold compared with that of untreated MWCNTs, which confirmed the enhancement in the connection between polar probes and modified MWCNTs (Figure 1b).
As shown in Figure 2a, the dispersive surface energy probability function of the MWCNTs became more spread out by surface modification, indicating a higher degree of energetic surface heterogeneity. The small changes in the surface energies of untreated MWCNTs indicate that its surface is energetically homogeneous. Surface modification led to a greater variation in γ , suggesting that the surface of the OMAEA-modified MWCNTs is energetically heterogeneous (Figure 2b). The γ of treated MWCNTs showed a higher value compared to untreated MWCNTs, which was due to increasing the concentration of polar clusters on the surface of MWCNTs [45].
Figure 1. (a) γ profiles, and (b) γ profiles of untreated multi-walled carbon nanotubes (MWCNTs) and modified MWCNTs with olefin maleic–anhydride–ester–amide copolymer (OMAEA) [45].
Menzel et al. [71] investigated the surface properties of the as-received and surface-modified CNTs using IGC (Dorris–Gray method, measurement temperature of 100 C, and probe molecules of C6–C8, ethanol, ethyl acetate, butanone, benzene, dioxane) in terms of specific free energy values, KA and KD numbers, and Henry’s constant. They found that the results obtained using IGC were in good agreement with the available data obtained from conventional methods to analyze the surface.
(a) (b)
Figure 1. (a) γDS profiles, and (b) γab
S profiles of untreated multi-walled carbon nanotubes (MWCNTs)and modified MWCNTs with olefin maleic–anhydride–ester–amide copolymer (OMAEA) [45].
Menzel et al. [71] investigated the surface properties of the as-received and surface-modifiedCNTs using IGC (Dorris–Gray method, measurement temperature of 100 C, and probe molecules ofC6–C8, ethanol, ethyl acetate, butanone, benzene, dioxane) in terms of specific free energy values, KA
and KD numbers, and Henry’s constant. They found that the results obtained using IGC were in goodagreement with the available data obtained from conventional methods to analyze the surface.Electrochem 2020, 2, FOR PEER REVIEW 8
Figure 2. (a) γ probability functions, and (b) γ probability functions of untreated MWCNTs and modified MWCNTs with OMAEA [45].
A potential problem in measuring the thermodynamic properties of carbon nanomaterials is the convolution of the surface chemistry and surface structure effects. The effect of the structural and chemical surface properties of the solid on the adsorption can be investigated by using the probe molecules with different structures but similar cross-sections and chemical functionality. The surface chemistry of the solid can be studied by employing the chemically different probe molecules with similar structures and similar cross-sections. Menzel et al. [28] introduced a method to study the structural and chemical properties of the solids separately to deconvolute and separately quantify the contribution of both surface structure and surface chemistry to the retention behavior of organic vapors. They have used the following equation to harmonize the units of the dispersive component of surface energy (γ ) and specific free energy (∆G ) [20,72,73]: I = ∆Ga. N (30)
where a is the molecular cross-section of the adsorbate, NA is the Avogadro constant, and Isp (mJ/m2) is stated as the specific interaction parameter for a polar probe molecule.
The surface properties of different carbon nanomaterial samples, including commercial, annealed, and oxidized MWCNTs, have been studied by Menzel et al. [28]. The samples had different chemical and structural surface properties, but other properties such as the porosity, mean diameter, and curvature were similar. The measurements were conducted using different structural probes of n-hexane (C6), 2-methyl pentane (C5Me), and 2,3-dimethyl butane (C4Me2), and different chemical probes of 2-pentanone and 2-pentanol (Figure 3). The higher value of the specific interaction parameter of 2-pentanol by the oxidized CNTs (shown in Table 2) suggested the large concentration of polar surface groups and noticeable chemical heterogeneity. Similar values of dispersive surface energies of around 94 mJ/m2, which is a typical value for the γ of graphitic carbon materials [74], show that the potential of the CNTs to interact with probe molecules through dispersive van der Waals forces were retained after modification. The surface chemistry and type of probe molecules affect the ability of CNTs to interact through specific forces [75]. As shown in Table 2, the specific interaction parameter of oxidized CNTs is higher than as-received and annealed CNTs. The higher values of the specific interaction parameter Isp are correlated with the higher micropore volume of the carbonaceous material after treatment. Díaz et al. [20] reported that the Isp of activated carbon is not correlated with the functional groups such as oxygenated groups but rather influenced by their organic and topographical structures.
(a) (b)
Figure 2. (a) γDS probability functions, and (b) γab
S probability functions of untreated MWCNTs andmodified MWCNTs with OMAEA [45].
A potential problem in measuring the thermodynamic properties of carbon nanomaterials is theconvolution of the surface chemistry and surface structure effects. The effect of the structural and
Electrochem 2020, 1 375
chemical surface properties of the solid on the adsorption can be investigated by using the probemolecules with different structures but similar cross-sections and chemical functionality. The surfacechemistry of the solid can be studied by employing the chemically different probe molecules withsimilar structures and similar cross-sections. Menzel et al. [28] introduced a method to study thestructural and chemical properties of the solids separately to deconvolute and separately quantifythe contribution of both surface structure and surface chemistry to the retention behavior of organicvapors. They have used the following equation to harmonize the units of the dispersive component ofsurface energy (γD
S ) and specific free energy (∆GSp) [20,72,73]:
ISP =∆GSp
a·NA(30)
where a is the molecular cross-section of the adsorbate, NA is the Avogadro constant, and Isp (mJ/m2)is stated as the specific interaction parameter for a polar probe molecule.
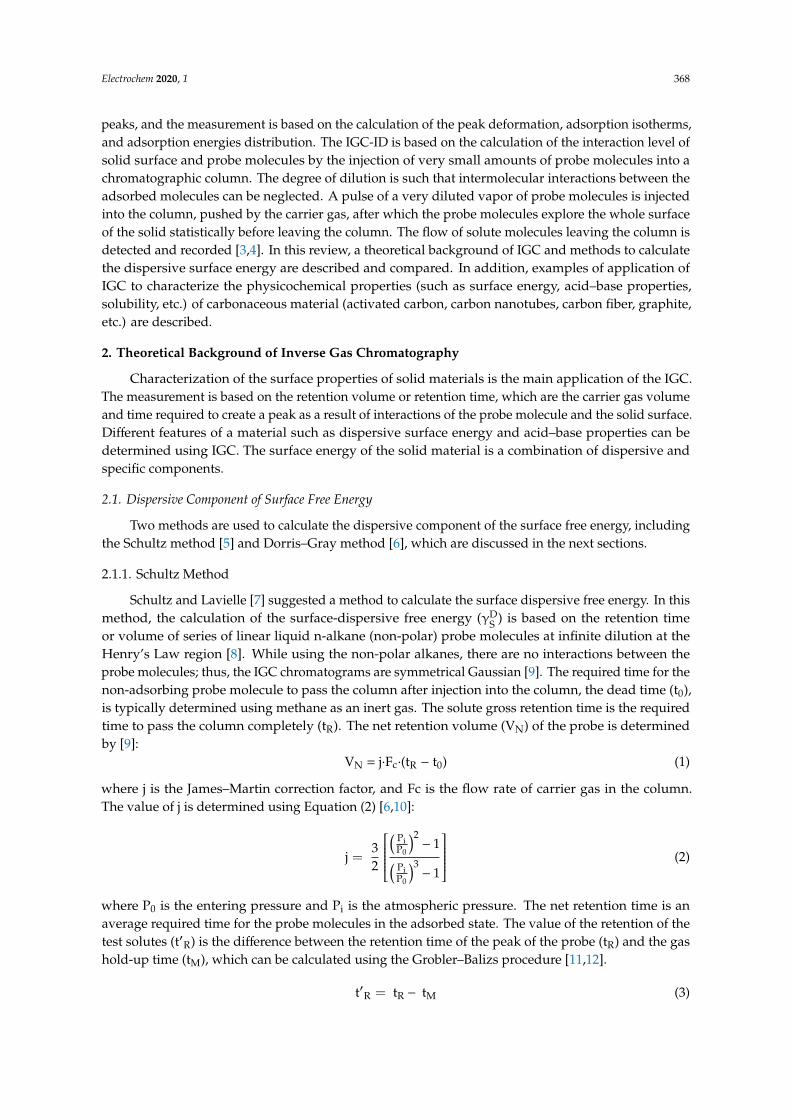
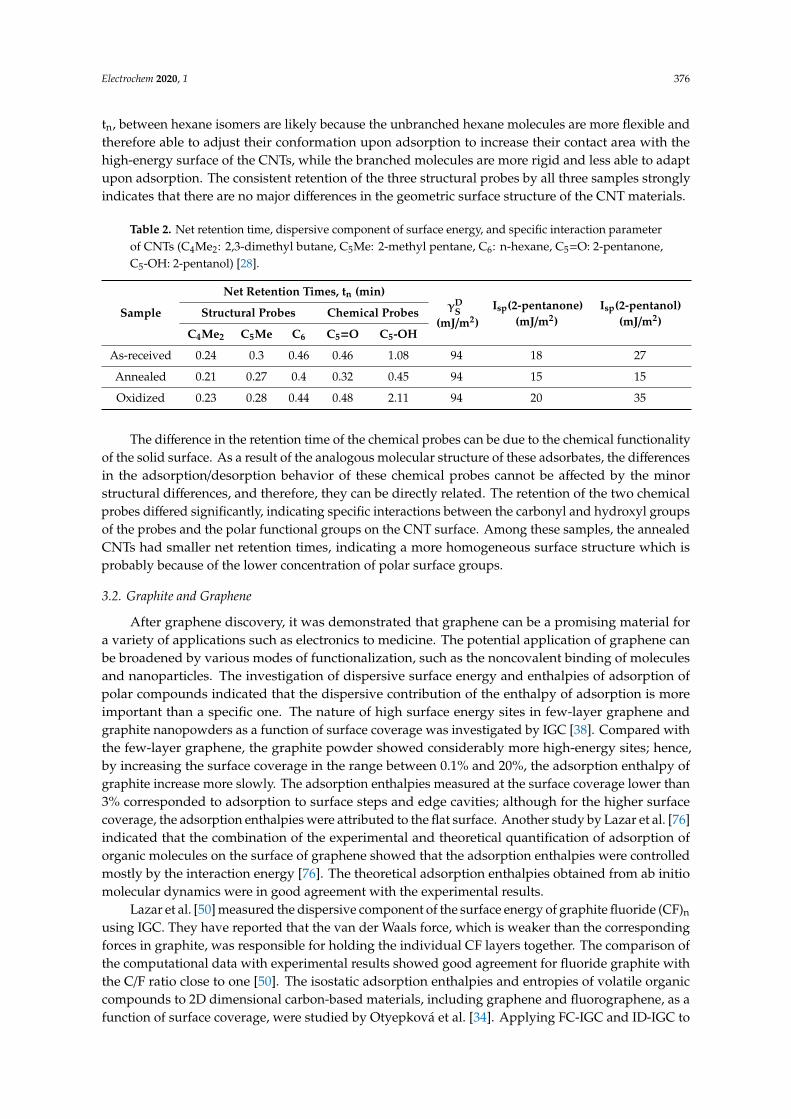
The surface properties of different carbon nanomaterial samples, including commercial, annealed,and oxidized MWCNTs, have been studied by Menzel et al. [28]. The samples had different chemical andstructural surface properties, but other properties such as the porosity, mean diameter, and curvaturewere similar. The measurements were conducted using different structural probes of n-hexane(C6), 2-methyl pentane (C5Me), and 2,3-dimethyl butane (C4Me2), and different chemical probes of2-pentanone and 2-pentanol (Figure 3). The higher value of the specific interaction parameter of2-pentanol by the oxidized CNTs (shown in Table 2) suggested the large concentration of polar surfacegroups and noticeable chemical heterogeneity. Similar values of dispersive surface energies of around94 mJ/m2, which is a typical value for the γD
S of graphitic carbon materials [74], show that the potentialof the CNTs to interact with probe molecules through dispersive van der Waals forces were retainedafter modification. The surface chemistry and type of probe molecules affect the ability of CNTs tointeract through specific forces [75]. As shown in Table 2, the specific interaction parameter of oxidizedCNTs is higher than as-received and annealed CNTs. The higher values of the specific interactionparameter Isp are correlated with the higher micropore volume of the carbonaceous material aftertreatment. Díaz et al. [20] reported that the Isp of activated carbon is not correlated with the functionalgroups such as oxygenated groups but rather influenced by their organic and topographical structures.Electrochem 2020, 2, FOR PEER REVIEW 9
Figure 3. Structural probes (2,3-dimethyl butane (C4Me2), 2-methyl pentane (C5Me), n-hexane (C6)) and chemical probes (2-pentanone (C5=O), 2-pentanol (C5-OH)).
Table 2. Net retention time, dispersive component of surface energy, and specific interaction parameter of CNTs (C4Me2: 2,3-dimethyl butane, C5Me: 2-methyl pentane, C6: n-hexane, C5=O: 2-pentanone, C5-OH: 2-pentanol) [28].
Sample Net Retention Times, tn (min) 𝛄𝐒𝐃
(mJ/m2) Isp(2-pentanone)
(mJ/m2) Isp(2-pentanol)
(mJ/m2) Structural Probes Chemical Probes C4Me2 C5Me C6 C5=O C5-OH
As-received 0.24 0.3 0.46 0.46 1.08 94 18 27 Annealed 0.21 0.27 0.4 0.32 0.45 94 15 15 Oxidized 0.23 0.28 0.44 0.48 2.11 94 20 35
The differences in the retention time of three structural probes (C4Me2, C5Me, C6) of different samples of CNT were small. The weakest adsorption (shortest net retention time) was observed for the most branched isomer of C4Me2 probe, while slightly stronger adsorption was seen for C5Me, while the unbranched C6 molecules experienced the strongest retention. The small differences in retention time, tn, between hexane isomers are likely because the unbranched hexane molecules are more flexible and therefore able to adjust their conformation upon adsorption to increase their contact area with the high-energy surface of the CNTs, while the branched molecules are more rigid and less able to adapt upon adsorption. The consistent retention of the three structural probes by all three samples strongly indicates that there are no major differences in the geometric surface structure of the CNT materials.
The difference in the retention time of the chemical probes can be due to the chemical functionality of the solid surface. As a result of the analogous molecular structure of these adsorbates, the differences in the adsorption/desorption behavior of these chemical probes cannot be affected by the minor structural differences, and therefore, they can be directly related. The retention of the two chemical probes differed significantly, indicating specific interactions between the carbonyl and hydroxyl groups of the probes and the polar functional groups on the CNT surface. Among these samples, the annealed CNTs had smaller net retention times, indicating a more homogeneous surface structure which is probably because of the lower concentration of polar surface groups.
3.2. Graphite and Graphene
After graphene discovery, it was demonstrated that graphene can be a promising material for a variety of applications such as electronics to medicine. The potential application of graphene can be broadened by various modes of functionalization, such as the noncovalent binding of molecules and nanoparticles. The investigation of dispersive surface energy and enthalpies of adsorption of polar
Figure 3. Structural probes (2,3-dimethyl butane (C4Me2), 2-methyl pentane (C5Me), n-hexane (C6))and chemical probes (2-pentanone (C5=O), 2-pentanol (C5-OH)).
The differences in the retention time of three structural probes (C4Me2, C5Me, C6) of differentsamples of CNT were small. The weakest adsorption (shortest net retention time) was observed for themost branched isomer of C4Me2 probe, while slightly stronger adsorption was seen for C5Me, while theunbranched C6 molecules experienced the strongest retention. The small differences in retention time,
Electrochem 2020, 1 376
tn, between hexane isomers are likely because the unbranched hexane molecules are more flexible andtherefore able to adjust their conformation upon adsorption to increase their contact area with thehigh-energy surface of the CNTs, while the branched molecules are more rigid and less able to adaptupon adsorption. The consistent retention of the three structural probes by all three samples stronglyindicates that there are no major differences in the geometric surface structure of the CNT materials.
Table 2. Net retention time, dispersive component of surface energy, and specific interaction parameterof CNTs (C4Me2: 2,3-dimethyl butane, C5Me: 2-methyl pentane, C6: n-hexane, C5=O: 2-pentanone,C5-OH: 2-pentanol) [28].
Sample
Net Retention Times, tn (min)γD
S(mJ/m2)
Isp(2-pentanone)(mJ/m2)
Isp(2-pentanol)(mJ/m2)
Structural Probes Chemical Probes
C4Me2 C5Me C6 C5=O C5-OH
As-received 0.24 0.3 0.46 0.46 1.08 94 18 27
Annealed 0.21 0.27 0.4 0.32 0.45 94 15 15
Oxidized 0.23 0.28 0.44 0.48 2.11 94 20 35
The difference in the retention time of the chemical probes can be due to the chemical functionalityof the solid surface. As a result of the analogous molecular structure of these adsorbates, the differencesin the adsorption/desorption behavior of these chemical probes cannot be affected by the minorstructural differences, and therefore, they can be directly related. The retention of the two chemicalprobes differed significantly, indicating specific interactions between the carbonyl and hydroxyl groupsof the probes and the polar functional groups on the CNT surface. Among these samples, the annealedCNTs had smaller net retention times, indicating a more homogeneous surface structure which isprobably because of the lower concentration of polar surface groups.
3.2. Graphite and Graphene
After graphene discovery, it was demonstrated that graphene can be a promising material fora variety of applications such as electronics to medicine. The potential application of graphene canbe broadened by various modes of functionalization, such as the noncovalent binding of moleculesand nanoparticles. The investigation of dispersive surface energy and enthalpies of adsorption ofpolar compounds indicated that the dispersive contribution of the enthalpy of adsorption is moreimportant than a specific one. The nature of high surface energy sites in few-layer graphene andgraphite nanopowders as a function of surface coverage was investigated by IGC [38]. Compared withthe few-layer graphene, the graphite powder showed considerably more high-energy sites; hence,by increasing the surface coverage in the range between 0.1% and 20%, the adsorption enthalpy ofgraphite increase more slowly. The adsorption enthalpies measured at the surface coverage lower than3% corresponded to adsorption to surface steps and edge cavities; although for the higher surfacecoverage, the adsorption enthalpies were attributed to the flat surface. Another study by Lazar et al. [76]indicated that the combination of the experimental and theoretical quantification of adsorption oforganic molecules on the surface of graphene showed that the adsorption enthalpies were controlledmostly by the interaction energy [76]. The theoretical adsorption enthalpies obtained from ab initiomolecular dynamics were in good agreement with the experimental results.
Lazar et al. [50] measured the dispersive component of the surface energy of graphite fluoride (CF)n
using IGC. They have reported that the van der Waals force, which is weaker than the correspondingforces in graphite, was responsible for holding the individual CF layers together. The comparison ofthe computational data with experimental results showed good agreement for fluoride graphite withthe C/F ratio close to one [50]. The isostatic adsorption enthalpies and entropies of volatile organiccompounds to 2D dimensional carbon-based materials, including graphene and fluorographene, as afunction of surface coverage, were studied by Otyepková et al. [34]. Applying FC-IGC and ID-IGC to
Electrochem 2020, 1 377
investigate a series of milled graphite in the function of the milling time parameter and oxygen contentproved that the IGC is a powerful method to analyze the surface [77]. Increasing the milling timecaused a considerable increase in dispersiveness of the surface energy (γD
S ). The milling of graphiteinduced the formation of high-energy sites and increased the nano-roughness surface characteristic ofthe lateral surface of lamellar solids.
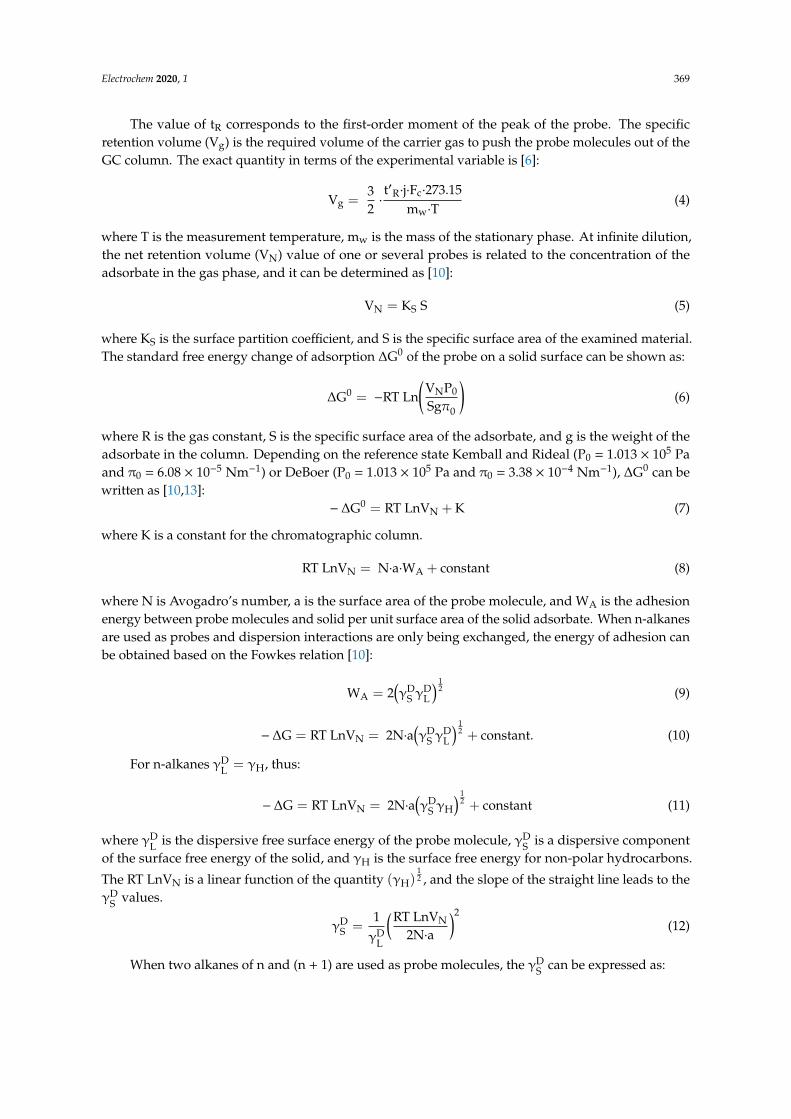
The solubility parameters theory has been used to study the solubility and dispersibility.The interaction of nanomaterials, such as graphene, and solvents, occur at their surface. Therefore,for these materials, the Hansen-like solubility parameters based on surface energy seem to be moreapplicable than Hildebrand parameters based on cohesive energy densities. The surface energy is animportant parameter to determine the interaction of nanomaterials and solvents [54]. The surfaceenergy is a combination of dispersive interactions, which are representative of van der Waals forcesand polar interactions, which themselves are representative of acid–base interactions, hydrogenbonding, and π–π stacking [78]. Dai et al. [29] studied the surface properties of graphene oxidessamples. The surface energies and dispersibility of different types of graphene oxide (GO) havebeen investigated. They found the relation between dispersion state and polar component (δP) andhydrogen-bonding component (δH) of solvents.
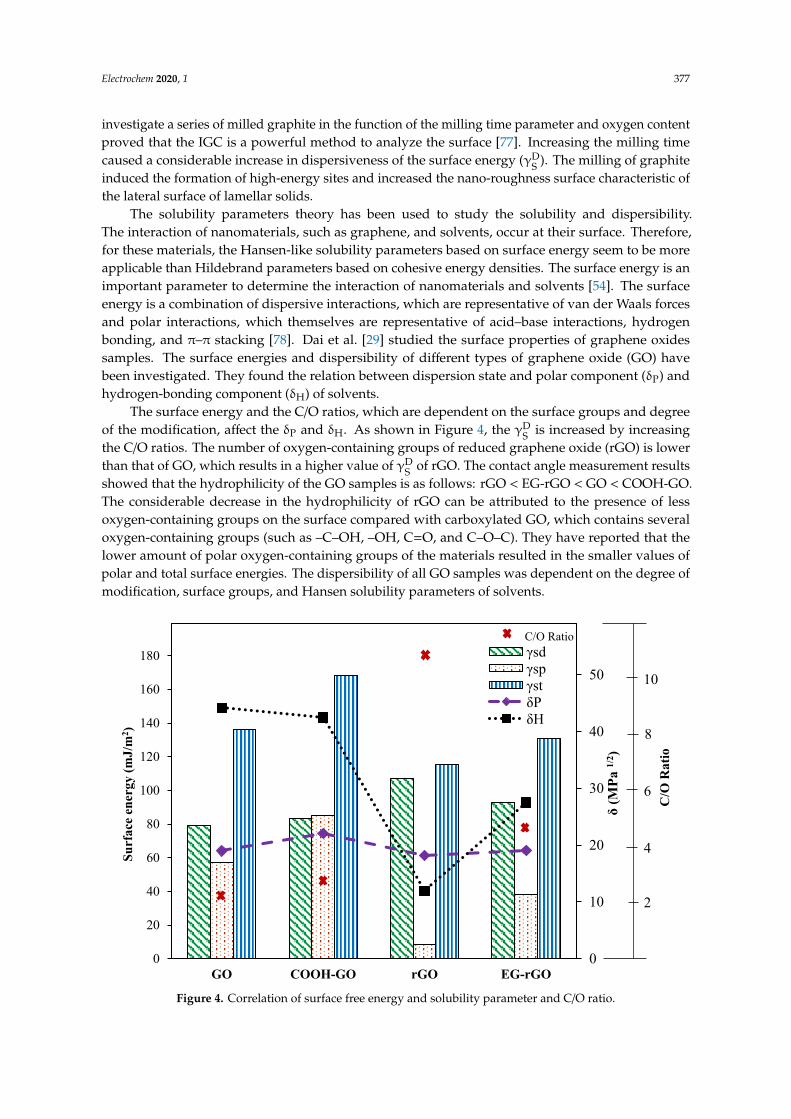
The surface energy and the C/O ratios, which are dependent on the surface groups and degreeof the modification, affect the δP and δH. As shown in Figure 4, the γD
S is increased by increasingthe C/O ratios. The number of oxygen-containing groups of reduced graphene oxide (rGO) is lowerthan that of GO, which results in a higher value of γD
S of rGO. The contact angle measurement resultsshowed that the hydrophilicity of the GO samples is as follows: rGO < EG-rGO < GO < COOH-GO.The considerable decrease in the hydrophilicity of rGO can be attributed to the presence of lessoxygen-containing groups on the surface compared with carboxylated GO, which contains severaloxygen-containing groups (such as –C–OH, –OH, C=O, and C–O–C). They have reported that thelower amount of polar oxygen-containing groups of the materials resulted in the smaller values ofpolar and total surface energies. The dispersibility of all GO samples was dependent on the degree ofmodification, surface groups, and Hansen solubility parameters of solvents.Electrochem 2020, 2, FOR PEER REVIEW 11
Figure 4. Correlation of surface free energy and solubility parameter and C/O ratio.
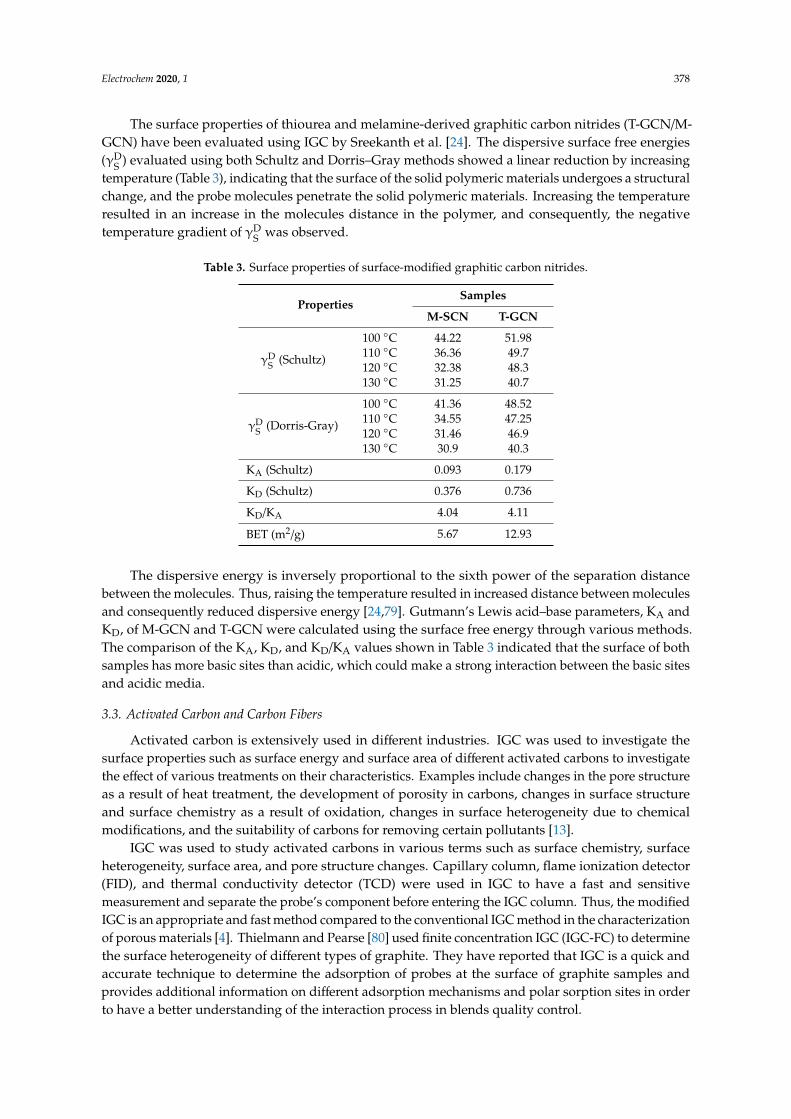
The surface properties of thiourea and melamine-derived graphitic carbon nitrides (T-GCN/M-GCN) have been evaluated using IGC by Sreekanth et al. [24]. The dispersive surface free energies (γ ) evaluated using both Schultz and Dorris–Gray methods showed a linear reduction by increasing temperature (Table 3), indicating that the surface of the solid polymeric materials undergoes a structural change, and the probe molecules penetrate the solid polymeric materials. Increasing the temperature resulted in an increase in the molecules distance in the polymer, and consequently, the negative temperature gradient of γ was observed.
Table 3. Surface properties of surface-modified graphitic carbon nitrides.
Properties Samples
M-SCN T-GCN
γ (Schultz)
100 °C 44.22 51.98 110 °C 36.36 49.7 120 °C 32.38 48.3 130 °C 31.25 40.7
γ (Dorris-Gray)
100 °C 41.36 48.52 110 °C 34.55 47.25 120 °C 31.46 46.9 130 °C 30.9 40.3
KA (Schultz) 0.093 0.179 KD (Schultz) 0.376 0.736 KD/KA 4.04 4.11 BET (m2/g) 5.67 12.93
The dispersive energy is inversely proportional to the sixth power of the separation distance between the molecules. Thus, raising the temperature resulted in increased distance between molecules and consequently reduced dispersive energy [24,79]. Gutmann’s Lewis acid–base parameters, KA and KD, of M-GCN and T-GCN were calculated using the surface free energy through
0
10
20
30
40
50
0
20
40
60
80
100
120
140
160
180
GO COOH-GO rGO EG-rGO
δ(M
Pa 1/
2 )
Surf
ace e
nerg
y (m
J/m
2 )
γsd γsp γst δP δH
10
8
6
4
2
C/O Ratio
C/O
Rat
io
Figure 4. Correlation of surface free energy and solubility parameter and C/O ratio.
Electrochem 2020, 1 378
The surface properties of thiourea and melamine-derived graphitic carbon nitrides (T-GCN/M-GCN) have been evaluated using IGC by Sreekanth et al. [24]. The dispersive surface free energies(γD
S ) evaluated using both Schultz and Dorris–Gray methods showed a linear reduction by increasingtemperature (Table 3), indicating that the surface of the solid polymeric materials undergoes a structuralchange, and the probe molecules penetrate the solid polymeric materials. Increasing the temperatureresulted in an increase in the molecules distance in the polymer, and consequently, the negativetemperature gradient of γD
S was observed.
Table 3. Surface properties of surface-modified graphitic carbon nitrides.
PropertiesSamples
M-SCN T-GCN
γDS (Schultz)
100 ◦C 44.22 51.98110 ◦C 36.36 49.7120 ◦C 32.38 48.3130 ◦C 31.25 40.7
γDS (Dorris-Gray)
100 ◦C 41.36 48.52110 ◦C 34.55 47.25120 ◦C 31.46 46.9130 ◦C 30.9 40.3
KA (Schultz) 0.093 0.179
KD (Schultz) 0.376 0.736
KD/KA 4.04 4.11
BET (m2/g) 5.67 12.93
The dispersive energy is inversely proportional to the sixth power of the separation distancebetween the molecules. Thus, raising the temperature resulted in increased distance between moleculesand consequently reduced dispersive energy [24,79]. Gutmann’s Lewis acid–base parameters, KA andKD, of M-GCN and T-GCN were calculated using the surface free energy through various methods.The comparison of the KA, KD, and KD/KA values shown in Table 3 indicated that the surface of bothsamples has more basic sites than acidic, which could make a strong interaction between the basic sitesand acidic media.
3.3. Activated Carbon and Carbon Fibers
Activated carbon is extensively used in different industries. IGC was used to investigate thesurface properties such as surface energy and surface area of different activated carbons to investigatethe effect of various treatments on their characteristics. Examples include changes in the pore structureas a result of heat treatment, the development of porosity in carbons, changes in surface structureand surface chemistry as a result of oxidation, changes in surface heterogeneity due to chemicalmodifications, and the suitability of carbons for removing certain pollutants [13].
IGC was used to study activated carbons in various terms such as surface chemistry, surfaceheterogeneity, surface area, and pore structure changes. Capillary column, flame ionization detector(FID), and thermal conductivity detector (TCD) were used in IGC to have a fast and sensitivemeasurement and separate the probe’s component before entering the IGC column. Thus, the modifiedIGC is an appropriate and fast method compared to the conventional IGC method in the characterizationof porous materials [4]. Thielmann and Pearse [80] used finite concentration IGC (IGC-FC) to determinethe surface heterogeneity of different types of graphite. They have reported that IGC is a quick andaccurate technique to determine the adsorption of probes at the surface of graphite samples andprovides additional information on different adsorption mechanisms and polar sorption sites in orderto have a better understanding of the interaction process in blends quality control.
Electrochem 2020, 1 379
Pal et al. [23] investigated the surface energy and acid–base properties of surface-treated ACwith KOH and H2 using IGC. Compared with the other samples, H2-treated AC showed the highestsurface energy due to the higher basicity and lower oxygen content after H2 treatment, which wasconfirmed by CHN and XPS analysis. The treatment of AC using H2 and KOH resulted in a decreasein surface energy. It is observed that the dispersive surface energy dominates for all AC samples.The Gutmann base constant (KD) of all samples was higher than the Gutmann acid constant (KA),which was attributed to the high concentration of basic functional groups on their surfaces [23].
Huber et al. [80] prepared the monolithic, nitrogen-doped carbon adsorbent from resorcinol–urea–formaldehyde resins. The synthesized material was physically activated with CO2.The physicochemical characteristics and water sorption behavior of the materials at various activationtimes were investigated. The results revealed that the value of the energy of adsorption and surfaceenergy is the highest for the non-activated carbon and the lowest for the carbon activated in CO2.Singh et al. [39] observed the maximum value for the free energy of adsorption, and the surface energyfor the sample occurs when the sample was activated in CO2 for the shortest period. Longer activationtimes lead to a slight decrease in the free energy of adsorption, which may be due to the pore wideningduring activation. These observations are in agreement with the results of the study by Huber et al. [81].
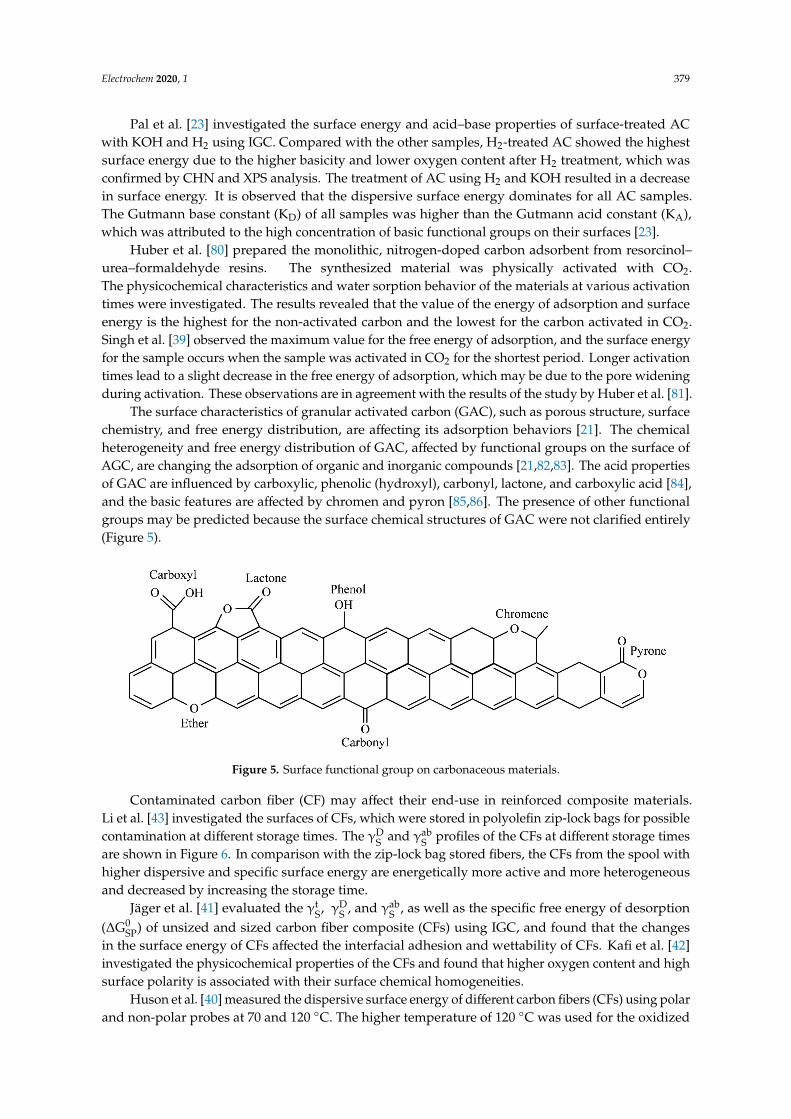
The surface characteristics of granular activated carbon (GAC), such as porous structure, surfacechemistry, and free energy distribution, are affecting its adsorption behaviors [21]. The chemicalheterogeneity and free energy distribution of GAC, affected by functional groups on the surface ofAGC, are changing the adsorption of organic and inorganic compounds [21,82,83]. The acid propertiesof GAC are influenced by carboxylic, phenolic (hydroxyl), carbonyl, lactone, and carboxylic acid [84],and the basic features are affected by chromen and pyron [85,86]. The presence of other functionalgroups may be predicted because the surface chemical structures of GAC were not clarified entirely(Figure 5).Electrochem 2020, 2, FOR PEER REVIEW 13
Figure 5. Surface functional group on carbonaceous materials.
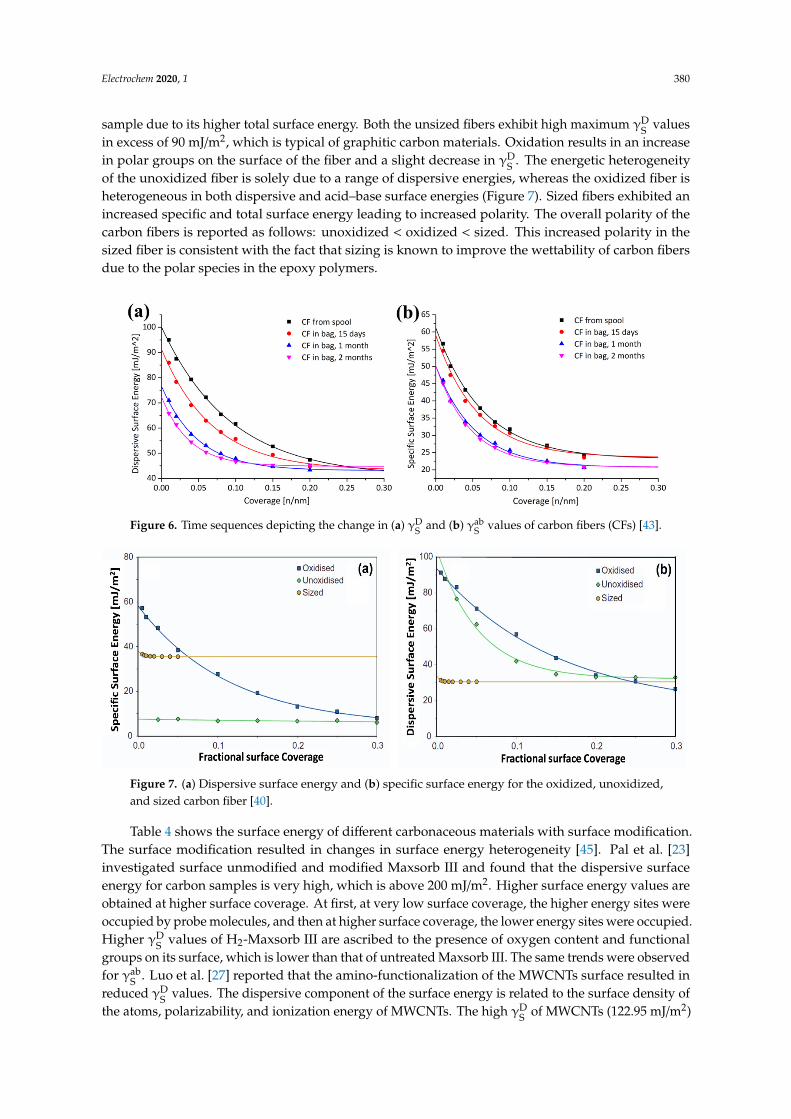
Contaminated carbon fiber (CF) may affect their end-use in reinforced composite materials. Li et al. [43] investigated the surfaces of CFs, which were stored in polyolefin zip-lock bags for possible contamination at different storage times. The γ and γ profiles of the CFs at different storage times are shown in Figure 6. In comparison with the zip-lock bag stored fibers, the CFs from the spool with higher dispersive and specific surface energy are energetically more active and more heterogeneous and decreased by increasing the storage time.
Jäger et al. [41] evaluated the γ , γ , and γ , as well as the specific free energy of desorption (∆𝐺 ) of unsized and sized carbon fiber composite (CFs) using IGC, and found that the changes in the surface energy of CFs affected the interfacial adhesion and wettability of CFs. Kafi et al. [42] investigated the physicochemical properties of the CFs and found that higher oxygen content and high surface polarity is associated with their surface chemical homogeneities.
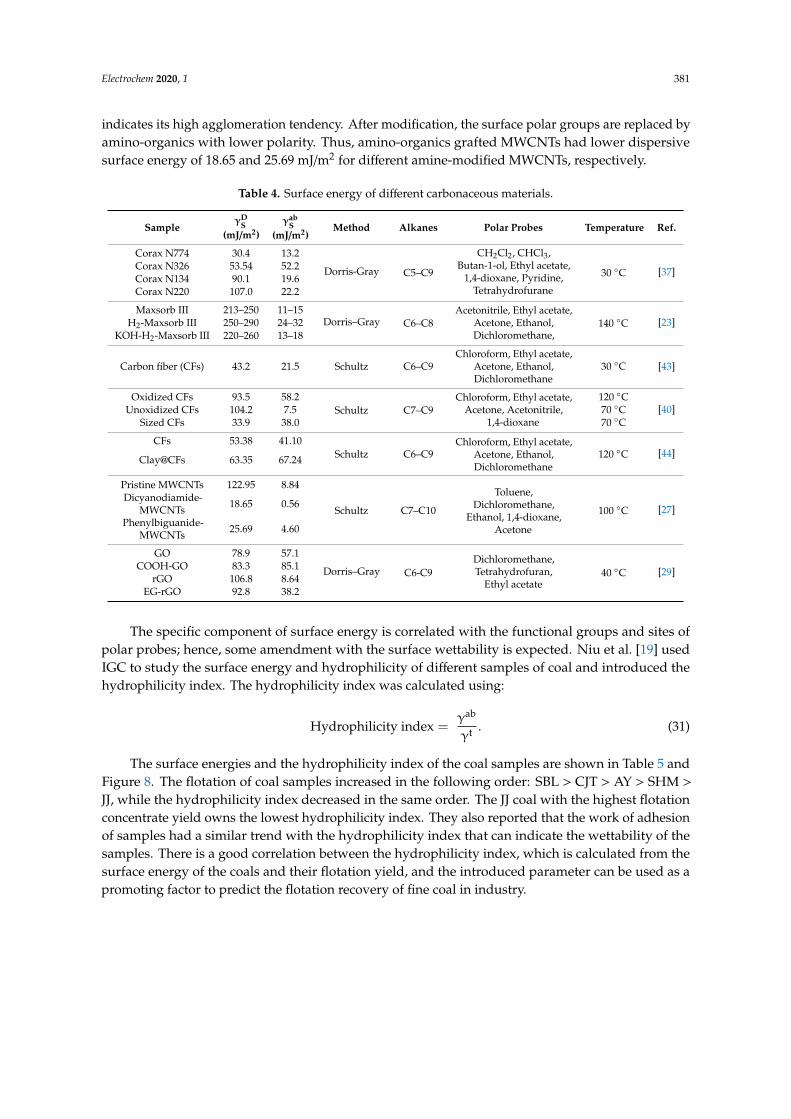
Huson et al. [40] measured the dispersive surface energy of different carbon fibers (CFs) using polar and non-polar probes at 70 and 120 °C. The higher temperature of 120 °C was used for the oxidized sample due to its higher total surface energy. Both the unsized fibers exhibit high maximum γ values in excess of 90 mJ/m2, which is typical of graphitic carbon materials. Oxidation results in an increase in polar groups on the surface of the fiber and a slight decrease in γ . The energetic heterogeneity of the unoxidized fiber is solely due to a range of dispersive energies, whereas the oxidized fiber is heterogeneous in both dispersive and acid–base surface energies (Figure 7). Sized fibers exhibited an increased specific and total surface energy leading to increased polarity. The overall polarity of the carbon fibers is reported as follows: unoxidized < oxidized < sized. This increased polarity in the sized fiber is consistent with the fact that sizing is known to improve the wettability of carbon fibers due to the polar species in the epoxy polymers.
Figure 6. Time sequences depicting the change in (a) γ and (b) γ values of carbon fibers (CFs) [43].
Figure 5. Surface functional group on carbonaceous materials.
Contaminated carbon fiber (CF) may affect their end-use in reinforced composite materials.Li et al. [43] investigated the surfaces of CFs, which were stored in polyolefin zip-lock bags for possiblecontamination at different storage times. The γD
S and γabS profiles of the CFs at different storage times
are shown in Figure 6. In comparison with the zip-lock bag stored fibers, the CFs from the spool withhigher dispersive and specific surface energy are energetically more active and more heterogeneousand decreased by increasing the storage time.
Jäger et al. [41] evaluated the γtS, γD
S , and γabS , as well as the specific free energy of desorption
(∆G0SP) of unsized and sized carbon fiber composite (CFs) using IGC, and found that the changes
in the surface energy of CFs affected the interfacial adhesion and wettability of CFs. Kafi et al. [42]investigated the physicochemical properties of the CFs and found that higher oxygen content and highsurface polarity is associated with their surface chemical homogeneities.
Huson et al. [40] measured the dispersive surface energy of different carbon fibers (CFs) using polarand non-polar probes at 70 and 120 ◦C. The higher temperature of 120 ◦C was used for the oxidized
Electrochem 2020, 1 380
sample due to its higher total surface energy. Both the unsized fibers exhibit high maximum γDS values
in excess of 90 mJ/m2, which is typical of graphitic carbon materials. Oxidation results in an increasein polar groups on the surface of the fiber and a slight decrease in γD
S . The energetic heterogeneityof the unoxidized fiber is solely due to a range of dispersive energies, whereas the oxidized fiber isheterogeneous in both dispersive and acid–base surface energies (Figure 7). Sized fibers exhibited anincreased specific and total surface energy leading to increased polarity. The overall polarity of thecarbon fibers is reported as follows: unoxidized < oxidized < sized. This increased polarity in thesized fiber is consistent with the fact that sizing is known to improve the wettability of carbon fibersdue to the polar species in the epoxy polymers.
Electrochem 2020, 2, FOR PEER REVIEW 13
Figure 5. Surface functional group on carbonaceous materials.
Contaminated carbon fiber (CF) may affect their end-use in reinforced composite materials. Li et al. [43] investigated the surfaces of CFs, which were stored in polyolefin zip-lock bags for possible contamination at different storage times. The γ and γ profiles of the CFs at different storage times are shown in Figure 6. In comparison with the zip-lock bag stored fibers, the CFs from the spool with higher dispersive and specific surface energy are energetically more active and more heterogeneous and decreased by increasing the storage time.
Jäger et al. [41] evaluated the γ , γ , and γ , as well as the specific free energy of desorption (∆𝐺 ) of unsized and sized carbon fiber composite (CFs) using IGC, and found that the changes in the surface energy of CFs affected the interfacial adhesion and wettability of CFs. Kafi et al. [42] investigated the physicochemical properties of the CFs and found that higher oxygen content and high surface polarity is associated with their surface chemical homogeneities.
Huson et al. [40] measured the dispersive surface energy of different carbon fibers (CFs) using polar and non-polar probes at 70 and 120 °C. The higher temperature of 120 °C was used for the oxidized sample due to its higher total surface energy. Both the unsized fibers exhibit high maximum γ values in excess of 90 mJ/m2, which is typical of graphitic carbon materials. Oxidation results in an increase in polar groups on the surface of the fiber and a slight decrease in γ . The energetic heterogeneity of the unoxidized fiber is solely due to a range of dispersive energies, whereas the oxidized fiber is heterogeneous in both dispersive and acid–base surface energies (Figure 7). Sized fibers exhibited an increased specific and total surface energy leading to increased polarity. The overall polarity of the carbon fibers is reported as follows: unoxidized < oxidized < sized. This increased polarity in the sized fiber is consistent with the fact that sizing is known to improve the wettability of carbon fibers due to the polar species in the epoxy polymers.
Figure 6. Time sequences depicting the change in (a) γ and (b) γ values of carbon fibers (CFs) [43]. Figure 6. Time sequences depicting the change in (a) γD
S and (b) γabS values of carbon fibers (CFs) [43].Electrochem 2020, 2, FOR PEER REVIEW 14
Figure 7. (a) Dispersive surface energy and (b) specific surface energy for the oxidized, unoxidized, and sized carbon fiber [40].
Table 4 shows the surface energy of different carbonaceous materials with surface modification. The surface modification resulted in changes in surface energy heterogeneity [45]. Pal et al. [23] investigated surface unmodified and modified Maxsorb III and found that the dispersive surface energy for carbon samples is very high, which is above 200 mJ/m2. Higher surface energy values are obtained at higher surface coverage. At first, at very low surface coverage, the higher energy sites were occupied by probe molecules, and then at higher surface coverage, the lower energy sites were occupied. Higher γ values of H2-Maxsorb III are ascribed to the presence of oxygen content and functional groups on its surface, which is lower than that of untreated Maxsorb III. The same trends were observed for γ . Luo et al. [27] reported that the amino-functionalization of the MWCNTs surface resulted in reduced γ values. The dispersive component of the surface energy is related to the surface density of the atoms, polarizability, and ionization energy of MWCNTs. The high γ of MWCNTs (122.95 mJ/m2) indicates its high agglomeration tendency. After modification, the surface polar groups are replaced by amino-organics with lower polarity. Thus, amino-organics grafted MWCNTs had lower dispersive surface energy of 18.65 and 25.69 mJ/m2 for different amine-modified MWCNTs, respectively.
Table 4. Surface energy of different carbonaceous materials.
Sample 𝛄𝐒𝐃 (mJ/m2)
𝛄𝐒𝐚𝐛 (mJ/m2) Method Alkanes Polar Probes Temperature Ref.
Corax N774 Corax N326 Corax N134 Corax N220
30.4 53.54 90.1
107.0
13.2 52.2 19.6 22.2
Dorris-Gray
C5–C9
CH2Cl2, CHCl3, Butan-1-ol, Ethyl
acetate, 1,4-dioxane, Pyridine,
Tetrahydrofurane
30 °C [37]
Maxsorb III H2-Maxsorb III
KOH-H2-Maxsorb III
213–250 250–290 220–260
11–15 24–32 13–18
Dorris–Gray
C6–C8
Acetonitrile, Ethyl acetate, Acetone,
Ethanol, Dichloromethane,
140 °C [23]
Carbon fiber (CFs)
43.2 21.5 Schultz C6–C9
Chloroform, Ethyl acetate, Acetone,
Ethanol, Dichloromethane
30 °C [43]
Oxidized CFs Unoxidized CFs
Sized CFs
93.5 104.2 33.9
58.2 7.5 38.0
Schultz C7–C9
Chloroform, Ethyl acetate, Acetone, Acetonitrile, 1,4-
dioxane
120 °C 70 °C 70 °C
[40]
Figure 7. (a) Dispersive surface energy and (b) specific surface energy for the oxidized, unoxidized,and sized carbon fiber [40].
Table 4 shows the surface energy of different carbonaceous materials with surface modification.The surface modification resulted in changes in surface energy heterogeneity [45]. Pal et al. [23]investigated surface unmodified and modified Maxsorb III and found that the dispersive surfaceenergy for carbon samples is very high, which is above 200 mJ/m2. Higher surface energy values areobtained at higher surface coverage. At first, at very low surface coverage, the higher energy sites wereoccupied by probe molecules, and then at higher surface coverage, the lower energy sites were occupied.Higher γD
S values of H2-Maxsorb III are ascribed to the presence of oxygen content and functionalgroups on its surface, which is lower than that of untreated Maxsorb III. The same trends were observedfor γab
S . Luo et al. [27] reported that the amino-functionalization of the MWCNTs surface resulted inreduced γD
S values. The dispersive component of the surface energy is related to the surface density ofthe atoms, polarizability, and ionization energy of MWCNTs. The high γD
S of MWCNTs (122.95 mJ/m2)
Electrochem 2020, 1 381
indicates its high agglomeration tendency. After modification, the surface polar groups are replaced byamino-organics with lower polarity. Thus, amino-organics grafted MWCNTs had lower dispersivesurface energy of 18.65 and 25.69 mJ/m2 for different amine-modified MWCNTs, respectively.
Table 4. Surface energy of different carbonaceous materials.
SampleγD
S(mJ/m2)
γabS
(mJ/m2)Method Alkanes Polar Probes Temperature Ref.
Corax N774 30.4 13.2
Dorris-Gray C5–C9
CH2Cl2, CHCl3,Butan-1-ol, Ethyl acetate,
1,4-dioxane, Pyridine,Tetrahydrofurane
30 ◦C [37]Corax N326 53.54 52.2Corax N134 90.1 19.6Corax N220 107.0 22.2
Maxsorb III 213–250 11–15Dorris–Gray C6–C8
Acetonitrile, Ethyl acetate,Acetone, Ethanol,Dichloromethane,
140 ◦C [23]H2-Maxsorb III 250–290 24–32KOH-H2-Maxsorb III 220–260 13–18
Carbon fiber (CFs) 43.2 21.5 Schultz C6–C9Chloroform, Ethyl acetate,
Acetone, Ethanol,Dichloromethane
30 ◦C [43]
Oxidized CFs 93.5 58.2Schultz C7–C9
Chloroform, Ethyl acetate,Acetone, Acetonitrile,
1,4-dioxane
120 ◦C[40]Unoxidized CFs 104.2 7.5 70 ◦C
Sized CFs 33.9 38.0 70 ◦C
CFs 53.38 41.10Schultz C6–C9
Chloroform, Ethyl acetate,Acetone, Ethanol,Dichloromethane
120 ◦C [44]Clay@CFs 63.35 67.24
Pristine MWCNTs 122.95 8.84
Schultz C7–C10
Toluene,Dichloromethane,
Ethanol, 1,4-dioxane,Acetone
100 ◦C [27]Dicyanodiamide-
MWCNTs 18.65 0.56
Phenylbiguanide-MWCNTs 25.69 4.60
GO 78.9 57.1
Dorris–Gray C6-C9Dichloromethane,Tetrahydrofuran,
Ethyl acetate40 ◦C [29]COOH-GO 83.3 85.1
rGO 106.8 8.64EG-rGO 92.8 38.2
The specific component of surface energy is correlated with the functional groups and sites ofpolar probes; hence, some amendment with the surface wettability is expected. Niu et al. [19] usedIGC to study the surface energy and hydrophilicity of different samples of coal and introduced thehydrophilicity index. The hydrophilicity index was calculated using:
Hydrophilicity index =γab
γt . (31)
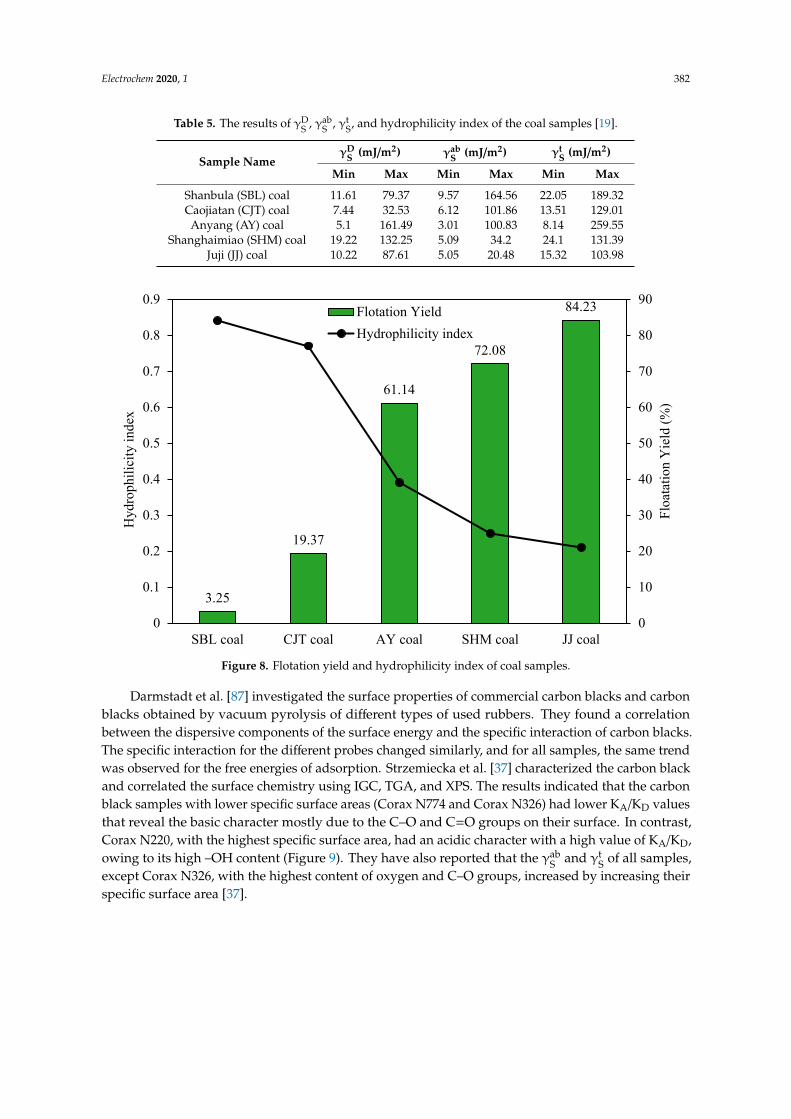
The surface energies and the hydrophilicity index of the coal samples are shown in Table 5 andFigure 8. The flotation of coal samples increased in the following order: SBL > CJT > AY > SHM >
JJ, while the hydrophilicity index decreased in the same order. The JJ coal with the highest flotationconcentrate yield owns the lowest hydrophilicity index. They also reported that the work of adhesionof samples had a similar trend with the hydrophilicity index that can indicate the wettability of thesamples. There is a good correlation between the hydrophilicity index, which is calculated from thesurface energy of the coals and their flotation yield, and the introduced parameter can be used as apromoting factor to predict the flotation recovery of fine coal in industry.
Electrochem 2020, 1 382
Table 5. The results of γDS , γab
S , γtS, and hydrophilicity index of the coal samples [19].
Sample NameγD
S (mJ/m2) γabS (mJ/m2) γt
S (mJ/m2)
Min Max Min Max Min Max
Shanbula (SBL) coal 11.61 79.37 9.57 164.56 22.05 189.32Caojiatan (CJT) coal 7.44 32.53 6.12 101.86 13.51 129.01Anyang (AY) coal 5.1 161.49 3.01 100.83 8.14 259.55
Shanghaimiao (SHM) coal 19.22 132.25 5.09 34.2 24.1 131.39Juji (JJ) coal 10.22 87.61 5.05 20.48 15.32 103.98Electrochem 2020, 2, FOR PEER REVIEW 16
Figure 8. Flotation yield and hydrophilicity index of coal samples.
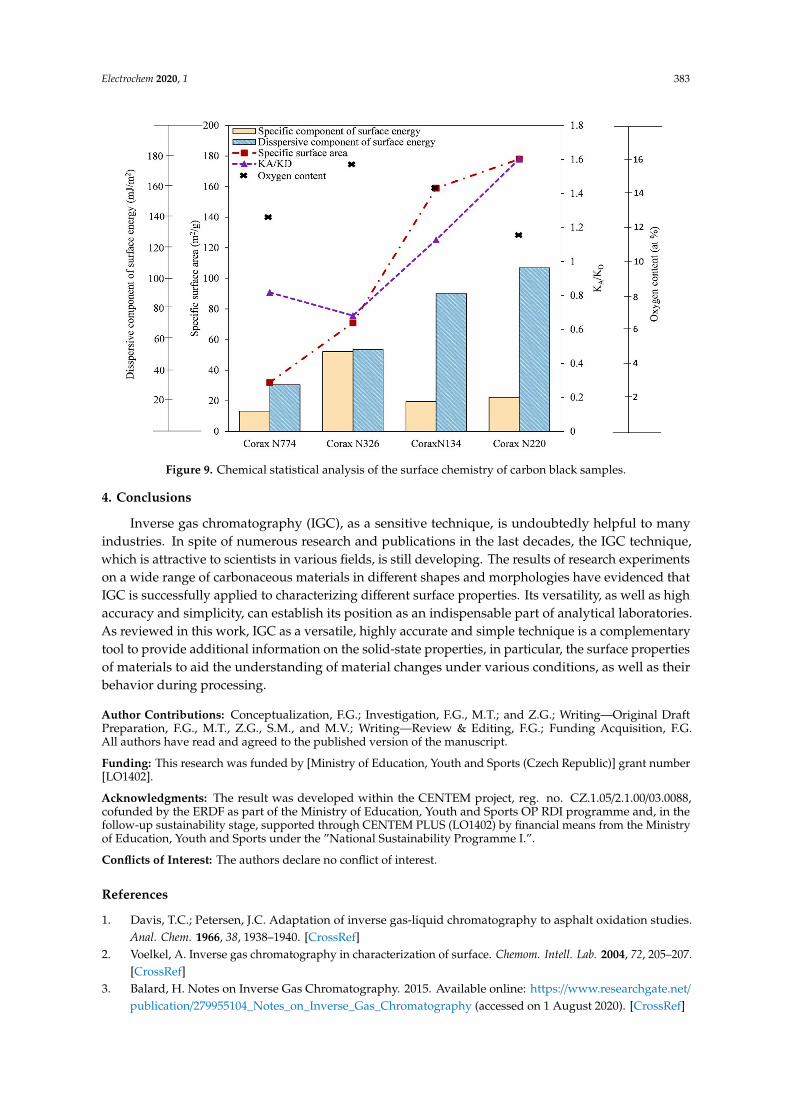
Darmstadt et al. [87] investigated the surface properties of commercial carbon blacks and carbon blacks obtained by vacuum pyrolysis of different types of used rubbers. They found a correlation between the dispersive components of the surface energy and the specific interaction of carbon blacks. The specific interaction for the different probes changed similarly, and for all samples, the same trend was observed for the free energies of adsorption. Strzemiecka et al. [37] characterized the carbon black and correlated the surface chemistry using IGC, TGA, and XPS. The results indicated that the carbon black samples with lower specific surface areas (Corax N774 and Corax N326) had lower KA/KD values that reveal the basic character mostly due to the C–O and C=O groups on their surface. In contrast, Corax N220, with the highest specific surface area, had an acidic character with a high value of KA/KD, owing to its high –OH content (Figure 9). They have also reported that the γ and γ of all samples, except Corax N326, with the highest content of oxygen and C–O groups, increased by increasing their specific surface area [37].
3.25
19.37
61.14
72.08
84.23
0
0.1
0.2
0.3
0.4
0.5
0.6
0.7
0.8
0.9
SBL coal CJT coal AY coal SHM coal JJ coal0
10
20
30
40
50
60
70
80
90
Hyd
roph
ilici
ty in
dex
Floa
tatio
n Y
ield
(%)
Flotation YieldHydrophilicity index
Figure 8. Flotation yield and hydrophilicity index of coal samples.
Darmstadt et al. [87] investigated the surface properties of commercial carbon blacks and carbonblacks obtained by vacuum pyrolysis of different types of used rubbers. They found a correlationbetween the dispersive components of the surface energy and the specific interaction of carbon blacks.The specific interaction for the different probes changed similarly, and for all samples, the same trendwas observed for the free energies of adsorption. Strzemiecka et al. [37] characterized the carbon blackand correlated the surface chemistry using IGC, TGA, and XPS. The results indicated that the carbonblack samples with lower specific surface areas (Corax N774 and Corax N326) had lower KA/KD valuesthat reveal the basic character mostly due to the C–O and C=O groups on their surface. In contrast,Corax N220, with the highest specific surface area, had an acidic character with a high value of KA/KD,owing to its high –OH content (Figure 9). They have also reported that the γab
S and γtS of all samples,
except Corax N326, with the highest content of oxygen and C–O groups, increased by increasing theirspecific surface area [37].
Electrochem 2020, 1 383Electrochem 2020, 2, FOR PEER REVIEW 17
Figure 9. Chemical statistical analysis of the surface chemistry of carbon black samples.
4. Conclusions
Inverse gas chromatography (IGC), as a sensitive technique, is undoubtedly helpful to many industries. In spite of numerous research and publications in the last decades, the IGC technique, which is attractive to scientists in various fields, is still developing. The results of research experiments on a wide range of carbonaceous materials in different shapes and morphologies have evidenced that IGC is successfully applied to characterizing different surface properties. Its versatility, as well as high accuracy and simplicity, can establish its position as an indispensable part of analytical laboratories. As reviewed in this work, IGC as a versatile, highly accurate and simple technique is a complementary tool to provide additional information on the solid-state properties, in particular, the surface properties of materials to aid the understanding of material changes under various conditions, as well as their behavior during processing.
Author Contributions: Conceptualization, F.G.; Investigation, F.G., M.T.; and Z.G.; Writing—Original Draft Preparation, F.G., M.T., Z.G., S.M., and M.V.; Writing—Review & Editing, F.G.; Funding Acquisition, F.G. All authors have read and agreed to the published version of the manuscript.
Funding: This research was funded by [Ministry of Education, Youth and Sports (Czech Republic)] grant number [LO1402].
Acknowledgments: The result was developed within the CENTEM project, reg. no. CZ.1.05/2.1.00/03.0088, cofunded by the ERDF as part of the Ministry of Education, Youth and Sports OP RDI programme and, in the follow-up sustainability stage, supported through CENTEM PLUS (LO1402) by financial means from the Ministry of Education, Youth and Sports under the ”National Sustainability Programme I.”.
Conflicts of Interest: The authors declare no conflict of interest.
References
1. Davis, T.C.; Petersen, J.C. Adaptation of inverse gas-liquid chromatography to asphalt oxidation studies. Anal. Chem. 1966, 38, 1938–1940.
2. Voelkel, A. Inverse gas chromatography in characterization of surface. Chemom. Intell. Lab. 2004, 72, 205–207.
Figure 9. Chemical statistical analysis of the surface chemistry of carbon black samples.
4. Conclusions
Inverse gas chromatography (IGC), as a sensitive technique, is undoubtedly helpful to manyindustries. In spite of numerous research and publications in the last decades, the IGC technique,which is attractive to scientists in various fields, is still developing. The results of research experimentson a wide range of carbonaceous materials in different shapes and morphologies have evidenced thatIGC is successfully applied to characterizing different surface properties. Its versatility, as well as highaccuracy and simplicity, can establish its position as an indispensable part of analytical laboratories.As reviewed in this work, IGC as a versatile, highly accurate and simple technique is a complementarytool to provide additional information on the solid-state properties, in particular, the surface propertiesof materials to aid the understanding of material changes under various conditions, as well as theirbehavior during processing.
Author Contributions: Conceptualization, F.G.; Investigation, F.G., M.T.; and Z.G.; Writing—Original DraftPreparation, F.G., M.T., Z.G., S.M., and M.V.; Writing—Review & Editing, F.G.; Funding Acquisition, F.G.All authors have read and agreed to the published version of the manuscript.
Funding: This research was funded by [Ministry of Education, Youth and Sports (Czech Republic)] grant number[LO1402].
Acknowledgments: The result was developed within the CENTEM project, reg. no. CZ.1.05/2.1.00/03.0088,cofunded by the ERDF as part of the Ministry of Education, Youth and Sports OP RDI programme and, in thefollow-up sustainability stage, supported through CENTEM PLUS (LO1402) by financial means from the Ministryof Education, Youth and Sports under the ”National Sustainability Programme I.”.
Conflicts of Interest: The authors declare no conflict of interest.
References
1. Davis, T.C.; Petersen, J.C. Adaptation of inverse gas-liquid chromatography to asphalt oxidation studies.Anal. Chem. 1966, 38, 1938–1940. [CrossRef]
2. Voelkel, A. Inverse gas chromatography in characterization of surface. Chemom. Intell. Lab. 2004, 72, 205–207.[CrossRef]
3. Balard, H. Notes on Inverse Gas Chromatography. 2015. Available online: https://www.researchgate.net/publication/279955104_Notes_on_Inverse_Gas_Chromatography (accessed on 1 August 2020). [CrossRef]
Electrochem 2020, 1 384
4. Mohammadi-Jam, S.; Waters, K. Inverse gas chromatography applications: A review. Adv. Colloid Interface Sci.2014, 212, 21–44. [CrossRef]
5. Schultz, J.A.; Lavielle, L.; Martin, C. The role of the interface in carbon fibre-epoxy composites. J. Adhes. 1987,23, 45–60. [CrossRef]
6. Dorris, G.M.; Gray, D.G. Adsorption of n-alkanes at zero surface coverage on cellulose paper and woodfibers. J. Colloid. Interface Sci. 1980, 77, 353–362. [CrossRef]
7. Schultz, J.; Lavielle, L. Interfacial Properties of Carbon Fiber—Epoxy Matrix Composites; ACS Publications:Washington, DC, USA, 1989.
8. Voelkel, A. Physicochemical measurements (inverse gas chromatography). In Gas Chromatography; Elsevier:Amsterdam, The Netherlands, 2012; pp. 477–494.
9. Ho, R.; Heng, J.Y. A review of inverse gas chromatography and its development as a tool to characterizeanisotropic surface properties of pharmaceutical solids. KONA Powder Part J. 2013, 30, 164–180. [CrossRef]
10. Lloyd, D.R.; Ward, T.C.; Schreiber, H.P. Inverse Gas Chromatography; American Chemical Society: Washington,DC, USA, 1989.
11. Grobler, A.; Balizs, G. Computer program for a statistical calculation of retention indices. J. Chromatogr. Sci.1974, 12, 57–58. [CrossRef]
12. Milczewska, K.; Voelkel, A. Inverse Gas Chromatography in Characterization of Composites Interaction. AdvancedGas Chromatography-Progress in Agricultural, Biomedical and Industrial Applications; InTech: Rijeka, Croatia,2012; pp. 421–436.
13. Bandosz, T. Inverse Gas Chromatography to Determine the Structural and Chemical Features of ActivatedCarbon Surfaces. In Encyclopedia of Surface and Colloid Science, 3rd ed.; Taylor & Francis, CRC press: Boca Raton,FL, USA, 2015; pp. 3365–3378.
14. Shi, B.; Wang, Y.; Jia, L. Comparison of Dorris–Gray and Schultz methods for the calculation of surfacedispersive free energy by inverse gas chromatography. J. Chromatogr. A 2011, 1218, 860–862. [CrossRef]
15. Ylä-MäIhäNiemi, P.P.; Heng, J.Y.; Thielmann, F.; Williams, D.R. Inverse gas chromatographic methodfor measuring the dispersive surface energy distribution for particulates. Langmuir 2008, 24, 9551–9557.[CrossRef] [PubMed]
16. Kołodziejek, J.; Voelkel, A.; Heberger, K. Characterization of hybrid materials by means of inverse gaschromatography and chemometrics. J. Pharm. Sci. 2013, 102, 1524–1531. [CrossRef] [PubMed]
17. Papirer, E.; Perrin, J.M.; Siffert, B.; Philipponneau, G. Surface characteristics of aluminas in relation withpolymer adsorption. J. Colloid Interface Sci. 1991, 144, 263–270. [CrossRef]
18. Dimopoulou, M.; Ritzoulis, C.; Panayiotou, C. Surface characterization of okra hydrocolloid extract byinverse gas chromatography (IGC). Colloids Surf. A Physicochem. Eng. Asp. 2015, 475, 37–43. [CrossRef]
19. Niu, C.; Xia, W.; Peng, Y. Analysis of coal wettability by inverse gas chromatography and its guidance forcoal flotation. Fuel 2018, 228, 290–296. [CrossRef]
20. Díaz, E.; Ordóñez, S.; Vega, A.; Coca, J. Comparison of adsorption properties of a chemically activated and asteam-activated carbon, using inverse gas chromatography. Microporous Mesoporous Mater. 2005, 82, 173–181.[CrossRef]
21. Fulazzaky, M.A. Study of the dispersion and specific interactions affected by chemical functions of thegranular activated carbons. Environ. Nanotechnol. Monit. Manag. 2019, 12, 100230. [CrossRef]
22. Wang, W.; Hua, Q.; Sha, Y.; Wu, D.; Zheng, S.; Liu, B. Surface properties of solid materials measured bymodified inverse gas chromatography. Talanta 2013, 112, 69–72. [CrossRef]
23. Pal, A.; Kondor, A.; Mitra, S.; Thu, K.; Harish, S.; Saha, B.B. On surface energy and acid–base propertiesof highly porous parent and surface treated activated carbons using inverse gas chromatography. J. Ind.Eng. Chem. 2019, 69, 432–443. [CrossRef]
24. Sreekanth, T.; Basivi, P.K.; Nagajyothi, P.; Dillip, G.; Shim, J.; Ko, T.; Yoo, K. Determination of surface propertiesand Gutmann’s Lewis acidity–basicity parameters of thiourea and melamine polymerized graphitic carbonnitride sheets by inverse gas chromatography. J. Chromatogr. A 2018, 1580, 134–141. [CrossRef]
25. Díaz, E.; Ordóñez, S.; Vega, A. Adsorption of volatile organic compounds onto carbon nanotubes, carbonnanofibers, and high-surface-area graphites. J. Colloid Interface Sci. 2007, 305, 7–16. [CrossRef]
26. Keru, G.; Ndungu, P.G.; Nyamori, V.O. Effect of boron concentration on physicochemical properties ofboron-doped carbon nanotubes. Mater. Chem. Phys. 2015, 153, 323–332. [CrossRef]
Electrochem 2020, 1 385
27. Luo, Y.; Zhao, Y.; Cai, J.; Duan, Y.; Du, S. Effect of amino-functionalization on the interfacial adhesion ofmulti-walled carbon nanotubes/epoxy nanocomposites. Mater. Des. 2012, 33, 405–412. [CrossRef]
28. Menzel, R.; Bismarck, A.; Shaffer, M.S. Deconvolution of the structural and chemical surface properties ofcarbon nanotubes by inverse gas chromatography. Carbon 2012, 50, 3416–3421. [CrossRef]
29. Dai, J.; Wang, G.; Ma, L.; Wu, C. Study on the surface energies and dispersibility of graphene oxide and itsderivatives. J. Mater. Sci. 2015, 50, 3895–3907. [CrossRef]
30. Dai, J.; Wang, G.J.; Wu, C.K. Investigation of the surface properties of graphene oxide and graphene byinverse gas chromatography. Chromatographia 2014, 77, 299–307. [CrossRef]
31. Grajek, H. The optimisation of chromatographic conditions for the determination of acceptor-donor propertiesof graphene oxide and reduced graphene oxide. Acta Innov. 2018, 26, 5–20. [CrossRef]
32. Yuan, X.; Zhu, B.; Cai, X.; Zhao, S.; Qiao, K.; Zhang, M. Effects of particle size and distribution of thesizing agent on carbon fiber/epoxy composites interfacial adhesion. Polym. Compos. 2018, 39, E2036–E2045.[CrossRef]
33. Lim, H.J.; Lee, K.; Cho, Y.S.; Kim, Y.S.; Kim, T.; Park, C.R. Experimental consideration of the Hansen solubilityparameters of as-produced multi-walled carbon nanotubes by inverse gas chromatography. Phys. Chem.Chem. Phys. 2014, 16, 17466–17472. [CrossRef]
34. Otyepková, E.; Lazar, P.; Cépe, K.; Tomanec, O.; Otyepka, M. Organic adsorbates have higher affinities tofluorographene than to graphene. Appl. Mater. Today 2016, 5, 142–149. [CrossRef]
35. Karlický, F.E.; Otyepkova, E.; Lo, R.; Pitonák, M.; Jurecka, P.; Pykal, M.; Otyepka, M. Adsorption of organicmolecules to van der Waals materials: Comparison of fluorographene and fluorographite with graphene andgraphite. J. Chem. Theory Comput. 2017, 13, 1328–1340. [CrossRef]
36. Karlický, F.E.; Otyepková, E.; Banáš, P.; Lazar, P.; Kocman, M.S.; Otyepka, M. Interplay between ethanoladsorption to high-energy sites and clustering on graphene and graphite alters the measured isostericadsorption enthalpies. J. Phys. Chem. C 2015, 119, 20535–20543. [CrossRef]
37. Strzemiecka, B.; Voelkel, A.; Donate-Robles, J.; Martín-Martínez, J.M. Assessment of the surface chemistry ofcarbon blacks by TGA-MS, XPS and inverse gas chromatography using statistical chemometric analysis.Appl. Surf. Sci. 2014, 316, 315–323. [CrossRef]
38. Lazar, P.; Otyepkova, E.; Banáš, P.; Fargašová, A.; Šafárová, K.; Lapcík, L.; Otyepka, M. The nature of highsurface energy sites in graphene and graphite. Carbon 2014, 73, 448–453. [CrossRef]
39. Singh, G.; Lal, D.; Tripathi, V. Study of microporosity of active carbon spheres using inverse gaschromatographic and static adsorption techniques. J. Chromatogr. A 2004, 1036, 189–195. [CrossRef][PubMed]
40. Huson, M.G.; Church, J.S.; Kafi, A.A.; Woodhead, A.L.; Khoo, J.; Kiran, M.; Fox, B.L. Heterogeneity of carbonfibre. Carbon 2014, 68, 240–249. [CrossRef]
41. Jäger, M.; Zabihi, O.; Ahmadi, M.; Li, Q.; Depalmeanar, A.; Naebe, M. Nano-enhanced interface in carbonfibre polymer composite using halloysite nanotubes. Compos. Part A Appl. Sci. Manuf. 2018, 109, 115–123.[CrossRef]
42. Kafi, A.; Li, Q.; Chaffraix, T.; Khoo, J.; Gengenbach, T.; Magniez, K.J.C. Surface treatment of carbon fibres forinterfacial property enhancement in composites via surface deposition of water soluble POSS nanowhiskers.Polymer 2018, 137, 97–106. [CrossRef]
43. Li, Q.; Woodhead, A.L.; Church, J.S.; Naebe, M. On the detection of carbon fibre storage contamination andits effect on the fibre–matrix interface. Sci. Rep. 2018, 8, 16446. [CrossRef]
44. Zabihi, O.; Ahmadi, M.; Li, Q.; Shafei, S.; Huson, M.G.; Naebe, M. Carbon fibre surface modification usingfunctionalized nanoclay: A hierarchical interphase for fibre-reinforced polymer composites. Compos. Sci.Technol. 2017, 148, 49–58. [CrossRef]
45. Gerencsér, F.; Rieder, N.; Varga, C.; Hancsók, J.; Dallos, A. Surface Energy Heterogeneity Profiles ofCarbon Nanotubes with a Copolymer-Modified Surface Using Surface Energy Mapping by Inverse GasChromatography. Hung. J. Ind. Chem. 2017, 45, 61–66. [CrossRef]
46. Mezgebe, M.; Jiang, L.H.; Shen, Q.; Du, C.; Yu, H.R. Studies and comparison of the liquid adsorption behaviorand surface properties of single-and multiwall carbon nanotubes by capillary rise method. Colloids Surf.A Physicochem. Eng. Asp. 2012, 415, 86–90. [CrossRef]
Electrochem 2020, 1 386
47. Ombaka, L.M.; Ndungu, P.G.; Nyamori, V.O. Tuning the nitrogen content and surface properties ofnitrogen-doped carbon nanotubes synthesized using a nitrogen-containing ferrocenyl derivative andethylbenzoate. J. Mater. Sci. 2015, 50, 1187–1200. [CrossRef]
48. Ferguson, A.; Harvey, A.; Godwin, I.J.; Bergin, S.D.; Coleman, J.N. The dependence of the measured surfaceenergy of graphene on nanosheet size. 2D Mater. 2016, 4, 015040. [CrossRef]
49. Ferguson, A.; Caffrey, I.T.; Backes, C.; Coleman, J.N.; Bergin, S.D. Differentiating defect and basal planecontributions to the surface energy of graphite using inverse gas chromatography. Chem. Mater. 2016, 28,6355–6366. [CrossRef]
50. Lazar, P.; Otyepková, E.; Karlický, F.; Cépe, K.; Otyepka, M. The surface and structural properties of graphitefluoride. Carbon 2015, 94, 804–809. [CrossRef]
51. Speltini, A.; Merli, D.; Quartarone, E.; Profumo, A. Separation of alkanes and aromatic compounds by packedcolumn gas chromatography using functionalized multi-walled carbon nanotubes as stationary phases.J. Chromatogr. A 2010, 1217, 2918–2924. [CrossRef]
52. Fakhrhoseini, S.M.; Li, Q.; Unnikrishnan, V.; Naebe, M. Nano-magnetite decorated carbon fibre for enhancedinterfacial shear strength. Carbon 2019, 148, 361–369. [CrossRef]
53. Kim, Y.S.; Oh, J.Y.; Kim, J.H.; Shin, M.H.; Jeong, Y.C.; Sung, S.J.; Park, C.R. Crucial role of oxidation debrisof carbon nanotubes in subsequent end-use applications of carbon nanotubes. ACS Appl. Mater. 2017, 9,17552–17564. [CrossRef]
54. Bergin, S.D.; Sun, Z.; Rickard, D.; Streich, P.V.; Hamilton, J.P.; Coleman, J.N. Multicomponent solubilityparameters for single-walled carbon nanotube—Solvent mixtures. ACS Nano 2009, 3, 2340–2350. [CrossRef][PubMed]
55. Basivi, P.K.; Sreekanth, T.; Sivalingam, R.; Thota, C.; Pasupuleti, V.R. Surface characterization andLondon dispersive surface free energy of functionalized single-walled carbon nanotubes with a blendof polytetrafluoroethylene by inverse gas chromatography. Surf. Interface Anal. 2019, 51, 516–524. [CrossRef]
56. Lehman, J.H.; Terrones, M.; Mansfield, E.; Hurst, K.E.; Meunier, V. Evaluating the characteristics of multiwallcarbon nanotubes. Carbon 2011, 49, 2581–2602. [CrossRef]
57. Ismagilov, Z.R.; Shalagina, A.E.; Podyacheva, O.Y.; Ischenko, A.V.; Kibis, L.S.; Boronin, A.I.; Anikeeva, O.B.Structure and electrical conductivity of nitrogen-doped carbon nanofibers. Carbon 2009, 47, 1922–1929.[CrossRef]
58. Wepasnick, K.A.; Smith, B.A.; Bitter, J.L.; Fairbrother, D.H. Chemical and structural characterization of carbonnanotube surfaces. Anal. Bioanal. Chem. 2010, 396, 1003–1014. [CrossRef] [PubMed]
59. Yao, Z.; Ge, L.; Yang, W.; Xia, M.; Ji, X.; Jin, M.; Dienstmaier, J.R. Finite dilution inverse gas chromatography asa versatile tool to determine the surface properties of biofillers for plastic composite applications. Anal. Chem.2015, 87, 6724–6729. [CrossRef] [PubMed]
60. Meunier, V.; Lambin, P. Scanning tunneling microscopy and spectroscopy of topological defects in carbonnanotubes. Carbon 2000, 38, 1729–1733. [CrossRef]
61. Maciel, I.O.; Anderson, N.; Pimenta, M.A.; Hartschuh, A.; Qian, H.; Terrones, M.; Novotny, L. Electron andphonon renormalization near charged defects in carbon nanotubes. Nat. Mater. 2008, 7, 878. [CrossRef]
62. Bauer, B.J.; Hobbie, E.K.; Becker, M.L. Small-angle neutron scattering from labeled single-wall carbonnanotubes. Macromolecules 2006, 39, 2637–2642. [CrossRef]
63. Branca, C.; Frusteri, F.; Magazu, V.; Mangione, A. Characterization of carbon nanotubes by TEM and infraredspectroscopy. J. Phys. Chem. B 2004, 108, 3469–3473. [CrossRef]
64. Dresselhaus, M.; Jorio, A.; Saito, R. Characterizing graphene, graphite, and carbon nanotubes by Ramanspectroscopy. Annu. Rev. Condens. Matter Phys. 2010, 1, 89–108. [CrossRef]
65. Hu, H.; Yu, A.; Kim, E.; Zhao, B.; Itkis, M.E.; Bekyarova, E.; Haddon, R.C. Influence of the zeta potential on thedispersability and purification of single-walled carbon nanotubes. J. Phys. Chem. B 2005, 109, 11520–11524.[CrossRef]
66. Scheibe, B.; Borowiak-Palen, E.; Kalenczuk, R.J. Oxidation and reduction of multiwalled carbonnanotubes—Preparation and characterization. Mater. Charact. 2010, 61, 185–191. [CrossRef]
67. Kannan, A.M.; Munukutla, L. Carbon nano-chain and carbon nano-fibers based gas diffusion layers forproton exchange membrane fuel cells. J. Power Sources 2007, 167, 330–335. [CrossRef]
Electrochem 2020, 1 387
68. Seidenberger, K.; Wilhelm, F.; Haußmann, J.; Markötter, H.; Manke, I.; Scholta, J. Grand canonical MonteCarlo study on water agglomerations within a polymer electrolyte membrane fuel cell gas diffusion layer.J. Power Sources 2013, 239, 628–641. [CrossRef]
69. Borup, R.; Davey, J.; Garzon, F.; Wood, D.; Welch, P.; More, K. PEM fuel cell durability with transportationtransient operation. ECS Trans. 2006, 3, 879–886. [CrossRef]
70. Zhang, X.; Yang, D.; Xu, P.; Wang, C.; Du, Q. Characterizing the surface properties of carbon nanotubes byinverse gas chromatography. J. Mater. Sci. 2007, 42, 7069–7075. [CrossRef]
71. Menzel, R.; Lee, A.; Bismarck, A.; Shaffer, M.S. Inverse gas chromatography of as-received and modifiedcarbon nanotubes. Langmuir 2009, 25, 8340–8348. [CrossRef]
72. Shih, Y.H.; Li, M.S. Adsorption of selected volatile organic vapors on multiwall carbon nanotubes. J. Hazard.Mater. 2008, 154, 21–28. [CrossRef]
73. Zhou, J.; Yu, T.; Wu, S.; Xie, Z.; Yang, Y. Inverse gas chromatography investigation of rubber reinforcementby modified pyrolytic carbon black from scrap tires. Ind. Eng. Chem. Res. 2010, 49, 1691–1696. [CrossRef]
74. Papirer, E.; Brendle, E.; Ozil, F.; Balard, H. Comparison of the surface properties of graphite, carbon blackand fullerene samples, measured by inverse gas chromatography. Carbon 1999, 37, 1265–1274. [CrossRef]
75. Brandao, S.; Andrada, D.; Mesquita, A.; Santos, A.; Gorgulho, H.; Paniago, R.; Furtado, C. The influence ofoxygen-containing functional groups on the dispersion of single-walled carbon nanotubes in amide solvents.J. Phys. Condens. Matter 2010, 22, 334222. [CrossRef]
76. Lazar, P.; Karlicky, F.; Jurecka, P.; Kocman, M.S.; Otyepková, E.; Šafárová, K.R.; Otyepka, M. Adsorption ofsmall organic molecules on graphene. J. Am. Chem. Soc. 2013, 135, 6372–6377. [CrossRef]
77. Balard, H.; Maafa, D.; Santini, A.; Donnet, J. Study by inverse gas chromatography of the surface propertiesof milled graphites. J. Chromatogr. A 2008, 1198, 173–180. [CrossRef] [PubMed]
78. Das, S.C.; Larson, I.; Morton, D.A.; Stewart, P.J. Determination of the polar and total surface energydistributions of particulates by inverse gas chromatography. Langmuir 2011, 27, 521–523. [CrossRef][PubMed]
79. Kondor, A.; Quellet, C.; Dallos, A. Surface characterization of standard cotton fibres and determination ofadsorption isotherms of fragrances by IGC. Surf. Interface Anal. 2015, 47, 1040–1050. [CrossRef]
80. Thielmann, F.; Pearse, D. Determination of surface heterogeneity profiles on graphite by finite concentrationinverse gas chromatography. J. Chromatogr. A 2002, 969, 323–327. [CrossRef]
81. Huber, L.; Hauser, S.B.; Brendlé, E.; Ruch, P.; Ammann, J.; Hauert, R.; Yoon, S. The effect of activation time onwater sorption behavior of nitrogen-doped, physically activated, monolithic carbon for adsorption cooling.Microporous Mesoporous Mater. 2019, 276, 239–250. [CrossRef]
82. Madhu, R.; Veeramani, V.; Chen, S.M. Heteroatom-enriched and renewable banana-stem-derived porouscarbon for the electrochemical determination of nitrite in various water samples. Sci. Rep. 2014, 4, 4679.[CrossRef]
83. Ania, C.O.; Bandosz, T.J. Importance of structural and chemical heterogeneity of activated carbon surfacesfor adsorption of dibenzothiophene. Langmuir 2005, 21, 7752–7759. [CrossRef]
84. Sajjadi, B.; Chen, W.Y.; Egiebor, N.O. A comprehensive review on physical activation of biochar for energyand environmental applications. Rev. Chem. Eng. 2019, 35, 735–776. [CrossRef]
85. Kern, A.M.; Zierath, B.; Fey, T.; Etzold, B.J. Adsorption of Nickel Ions on Oxygen-Functionalized Carbons.Chem. Eng. Technol. 2016, 39, 715–722. [CrossRef]
86. Shafeeyan, M.S.; Daud, W.; Ma, W.; Houshmand, A.; Shamiri, A. A review on surface modification ofactivated carbon for carbon dioxide adsorption. J. Anal. Appl. Pyrolysis 2010, 89, 143–151. [CrossRef]
87. Darmstadt, H.; Roy, C.; Kaliaguine, S.; Cormier, H. Surface energy of commercial and pyrolytic carbon blacksby inverse gas chromatography. Rubber Chem. Technol. 1997, 70, 759–768. [CrossRef]
© 2020 by the authors. Licensee MDPI, Basel, Switzerland. This article is an open accessarticle distributed under the terms and conditions of the Creative Commons Attribution(CC BY) license (http://creativecommons.org/licenses/by/4.0/).