Embed Size (px)
Citation preview
SURFACE OPTIMIZATION OF SILOXANE-POLYURETHANE MARINE COATINGS FOR IMPROVED
FOULING-RELEASE PROPERTIES
A Dissertation Submitted to the Graduate Faculty
of the North Dakota State University
of Agriculture and Applied Science
By
Teluka Pasan Galhenage
In Partial Fulfillment of the Requirements for the Degree of
DOCTOR OF PHILOSOPHY
Major Department: Coatings and Polymeric Materials
August 2016
Fargo, North Dakota
North Dakota State University
Graduate School
Title
Surface Optimization of Siloxane-Polyurethane Marine Coatings for Improved Fouling-Release Properties
By
Teluka Pasan Galhenage
The Supervisory Committee certifies that this disquisition complies with North
Dakota State University’s regulations and meets the accepted standards for the
degree of
DOCTOR OF PHILOSOPHY
SUPERVISORY COMMITTEE:
Dr. Dean C. Webster
Chair
Dr. Andriy Voronov
Dr. Dante Battocchi
Dr. Denley Jacobson
Approved: 08/16/2016 Dr. Dean C. Webster
Date Department Chair
iii
ABSTRACT
Biofouling has been an economically and environmentally costly problem to mankind ever since
they set sail. Biofouling causes frictional drag leading to slow vessel speeds, and increased fuel costs.
Antifouling (AF) coatings containing biocides have been used for decades, however, since some biocides
have shown undesired effects towards the environment, a non-toxic solution to combat fouling is desired.
Subsequently, fouling release (FR) coatings quickly gained acceptance as a non-toxic approach to
contend with biofouling. Unlike AF coatings, FR coatings not necessarily prevent settlement of organisms,
they permit weak adhesion which is easily released by water shear or light grooming.
The siloxane-polyurethane (SiPU) coatings based on the concept of self-stratification is a non-
toxic and durable approach to prepare FR coatings. In this work, several approaches were considered to
optimize surface properties of SiPU coatings. Incorporation of phenyl-methyl silicone oils led to improved
FR properties towards several marine organisms in laboratory assays and in ocean field immersion.
Enhancement in FR properties may be attributed to slowly exuding silicone oil providing surface lubricity,
weakening the adhesion of marine organisms.
Addition of diphenyldimethyl siloxane in to SiPU coatings at different ratios resulted in micro-scale
surface topographical features which negatively affected microfouling-release while several coatings
displayed good FR performance towards macrofouling organisms. In another study, decreasing the acid
group content helped to improve FR performance towards barnacles, but FR performance towards
diatoms were compromised.
Novel amphiphilic siloxane-polyurethane (AmSiPU) coatings from polyisocyanate pre-polymers
modified with polydimethyl siloxane and polyethylene glycol displayed excellent FR properties towards
several marine organisms during laboratory assays. These AmSiPU coatings show promise as
contenders to commercial FR standards. Initial development of SiPU coatings with hydrophilic surfaces
showed promise, as the coatings showed rapidly rearranging surfaces with comparable FR performance
to commercial standards which claim hydrophilic surface properties.
During freshwater field immersion trials, SiPU coatings displayed excellent mussel FR
performance up to 3 years. Surface analysis suggested that solvent content affected self-stratification and

iv
morphology of SiPU coatings. The SiPU coating system is a highly tunable, tough, environmentally
friendly, and practical FR solution which can evolve along with non-toxic commercial marine coatings.
v
ACKNOWLEDGEMENTS
I am so grateful to every single person who supported me to achieve my goals, celebrated my
accomplishments and motivated me to do my best. I am so blessed to have you all in my life.
To begin with, I want to thank Dr. Dean Webster for teaching, guiding, and supporting my studies
at NDSU. I consider you as an excellent mentor and a research advisor. I appreciate your advice and
patience throughout the past 6.5 years. Thank you for letting me be part of your research team, allowing
me to conduct research and develop my career which shaped me in to the scientist that I am today. I am
honored and privileged to have been your student. You have genuine interest about students’ scientific
career and I wish you well for the future.
To my committee members, Dr. Andriy Voronov, Dr. Dante Battocchi, and Dr. Denley Jacobson;
thank you for overseeing my growth as PhD student. I appreciate your timely advice and support
throughout the past 4 years. I could not have asked for a better committee that has the desire for
students’ success.
To my parents and my sister, I thank you for always supporting my decision to follow my dreams.
Dad, thanks for motivating me to achieve my goals and supporting me in every way. Mom, thank you for
always supporting, guiding me throughout life and being there for both me and my sister. To my sister, I
appreciate you standing by me to support my dreams. To my beloved Aunt Swarna and Uncle Senerath,
thank you for always looking out for me and my sister. I truly appreciate the love, support and
encouragement provided by all of you as a family.
To my mentors; Dr. Abhijit Jadhav, Dr. Thomas Nelson, and Dr. Neena Ravindran, Dr. Heather
Goulet, thank you for teaching me everything I know about paints and coatings. I also want to thank my
teachers at Nalanda College where I spent 13 years of my life pursuing primary, secondary and high
school education. All of you inspired me to advance my education and to build a career that I am so proud
of today. I would like to acknowledge all Webster group members, past and present, whom I had to
privilege of working with. Thank you for accepting me in to the team and making the whole undergraduate
/graduate experience an enjoyable and exciting one. To Dr. Samali Datta, Dr. Erin Pavlacky, Dr. Stacy
Sommer, Dr. Umesh Harkal, and Adlina Paramarta, thank you for helping me in numerous ways during
your time in Lab 228 and 230. Special thanks to Dr. Rajan Bodkhe who answered my call for help when I
vi
first started my graduate research work. My current group members; Alison Rohly, Madhura Pade, Arvin
Yu, and Eric Krall, I thank you all for valuable conversations in and out of the lab. I thoroughly enjoyed the
times we worked together, traveled to conferences, and enjoyed company outside of work. I will truly
cherish your friendship for the rest of my career. Ivan Hevus, thanks for sharing the office with me and
helping me when in need. I also want to thank my best friends in Fargo; Kushan, Shivanthi and Shevonne
for being there with me for the past 8 years, sharing both ups and downs. I value your friendship for the
rest of my life. I would also like to acknowledge the undergraduates who helped me with my research
over the past few years. Dylan Hoffman, Augusto Moreira, and Ryan Burgett; thank you for assisting me
with experiments, analyzing data, making huge libraries of coatings, and coordinating research. SURE
students; Kunyu Zheng, Samantha Silbert, and Day Nguyen for their assistance working in the lab over
the summers. I wish you all the best in your future pursuits and I am extremely grateful for your help.
To Shane Stafslien, Lyndsi Vanderwal, Justin Daniels, Jim Bahr, Kenneth Anderson, Greg
Strommen; thank you for all the support throughout the years while testing samples, operating
instruments, and using facilities. Also special thanks goes to Heidi J. Docktor and Chunju Gu for their
assistance in the characterization lab. Kathy, Lynn and Jacinda (Jaci) thank you for making all the office
work go smoothly, I do not know who I could rely on for getting administrative tasks done without you all. I
also want to acknowledge the ocean field test sites in Hawaii, Singapore, California, Florida and fresh
water field test site in Parker Dam CA. Special thanks to Dr. Allen Skaja for his assistance with freshwater
field testing. Thank you to collaborators from Newcastle University, Dr. John Finlay and Dr. Tony Clare for
their assistance in conducting fouling release testing.
Finally, I am extremely grateful to the Office of Naval Research for providing financial support for
this research under grant number N00014-12-1-0482. I am also appreciative of all the scholarships and
awards I have received throughout my career at NDSU from SSPC, Valpar, American Coatings
Association and NDSU College of Science and Mathematics.

vii
DEDICATION
I dedicate my dissertation to my mother Sujeewa Dharmasena, and my father Galhenage Rupadeva for
their sacrifices, providing everything I needed to pursue my education (even if it was thousands of miles
away from home), and encouraging me to do my best. I would not be able to achieve this goal without
your support.
viii
TABLE OF CONTENTS
ABSTRACT ................................................................................................................................................... iii
ACKNOWLEDGEMENTS ............................................................................................................................. v
DEDICATION ............................................................................................................................................... vii
LIST OF TABLES ........................................................................................................................................ xiv
LIST OF FIGURES ...................................................................................................................................... xv
LIST OF APPENDIX TABLES..................................................................................................................... xxi
LIST OF APPENDIX FIGURES ................................................................................................................. xxii
CHAPTER 1. GENERAL INTRODUCTION .................................................................................................. 1
Marine Biofouling and Impact .......................................................................................................... 1
Biofouling Process .............................................................................................................. 2
Economic Impact ................................................................................................................. 2
Strategies for Combating Biofouling ................................................................................................ 3
Non-toxic Marine Coatings ............................................................................................................... 4
Siloxane-Polyurethane (SiPU) Fouling Release Coatings .................................................. 6
Modern Approaches for Non-toxic Marine Coatings ........................................................................ 7
Bio-inspired Engineered Surfaces ...................................................................................... 8
Amphiphilic Coatings......................................................................................................... 13
Hydrophilic/ Zwitterionic Coatings ..................................................................................... 18
Research Scope and Purpose ....................................................................................................... 19
References ..................................................................................................................................... 20
CHAPTER 2. FOULING-RELEASE PERFORMANCE OF SILICONE OIL-MODIFIED SILOXANE-POLYURETHANE COATINGS ................................................................................................................... 29
Introduction .................................................................................................................................... 29
Experimental .................................................................................................................................. 31
Materials ............................................................................................................................ 31
Experimental Design ......................................................................................................... 32
Coating Formulation .......................................................................................................... 33
ix
Coating Application and Curing ........................................................................................ 33
Control and Standard Coatings ......................................................................................... 33
Water Aging ...................................................................................................................... 34
Surface Characterization of Coatings ............................................................................... 34
Laboratory Biological Assays ......................................................................................................... 35
Growth and Release of the Macroalga (Ulva linza) .......................................................... 35
Growth and Release of Microalgae (Navicula incerta) ..................................................... 36
Bacterial (Cellulophaga lytica) Biofilm Adhesion .............................................................. 36
Adult Barnacle (Amphibalanus amphitrite) Adhesion ....................................................... 37
Mussel (Geukensia demissa) Adhesion............................................................................ 37
Field Immersion Study ...................................................................................................... 38
Statistical Analysis ......................................................................................................................... 38
Results and Discussion .................................................................................................................. 39
Conclusions .................................................................................................................................... 54
References ..................................................................................................................................... 55
CHAPTER 3. SELF-STRATIFIED SILOXANE-POLYURETHANE COATINGS FROM DIPHENYL-DIMETHYL SILOXANE COPOLYMER; EFFECT OF SURFACE TEXTURE ON FOULING RELEASE PERFORMANCE OF MODEL ORGANISMS. ............................................................................................ 59
Introduction .................................................................................................................................... 59
Experimental .................................................................................................................................. 61
Materials ............................................................................................................................ 61
Synthesis of Aminopropyl Terminated Poly (diphenyl-dimethylsiloxane) Copolymer (APT-PDPDMS) ................................................................................................................ 61
Synthesis of Aminopropyl Terminated Poly (dimethylsiloxane) (APT-PDMS) .................. 62
Gel Permeation Chromatography (GPC) .......................................................................... 63
1H NMR Characterization .................................................................................................. 63
Coating Formulation .......................................................................................................... 63
Preparation of Standard Coatings ..................................................................................... 64
Water Aging ...................................................................................................................... 64
x
Surface Characterization of Coatings ............................................................................... 65
Biological Laboratory Assays ......................................................................................................... 65
Growth and Release of Macroalgae (Ulva linza) .............................................................. 65
Growth and Release of Microalgae (Navicula incerta) ..................................................... 66
Bacterial (Cellulophaga lytica) Biofilm Adhesion .............................................................. 66
Re-attached Adult Barnacle (Amphibalanus amphitrite) Adhesion ................................... 67
Mussel (Geukensia demissa) Adhesion............................................................................ 67
Results and Discussion .................................................................................................................. 68
Conclusions .................................................................................................................................... 78
References ..................................................................................................................................... 79
CHAPTER 4. FOULING-RELEASE PROPERTIES OF SILOXANE-POLYURETHANE COATINGS FROM ACID FUNCTIONALIZED POLYDIMETHYL SILOXANE BLENDS ................................................ 83
Introduction .................................................................................................................................... 83
Experimental .................................................................................................................................. 85
Materials ............................................................................................................................ 85
Acid Functional Aminopropyl Terminated Polydimethyl Siloxane (APT-PDMS-25A) Synthesis ........................................................................................................................... 86
Gel Permeation Chromatography (GPC) .......................................................................... 88
1H NMR Characterization .................................................................................................. 88
Coating Formulation .......................................................................................................... 88
Preparation of Standard Coatings ..................................................................................... 89
Water Aging ...................................................................................................................... 89
Surface Characterization of Coatings ............................................................................... 89
Biological Laboratory Assays ......................................................................................................... 90
Growth and Release of Macroalgae (Ulva linza) .............................................................. 90
Growth and Release of Microalgae (Navicula incerta) ..................................................... 90
Bacterial (Cellulophaga lytica) Biofilm Adhesion .............................................................. 91
Re-attached Adult Barnacle (Amphibalanus amphitrite) Adhesion ................................... 91
Mussel (Geukensia demissa) Adhesion............................................................................ 92
xi
Results and Discussion .................................................................................................................. 92
Conclusions .................................................................................................................................. 104
References ................................................................................................................................... 105
CHAPTER 5. POLY (ETHYLENE) GLYCOL-MODIFIED, AMPHIPHILIC, SILOXANE POLYURETHANE COATINGS AND THEIR PERFORMANCE AS EFFECTIVE FOULING-RELEASE SURFACES ............................................................................................................................................... 109
Introduction .................................................................................................................................. 109
Experimental ................................................................................................................................ 112
Materials .......................................................................................................................... 112
Synthesis of pre-polymers .............................................................................................. 112
Isocyanate titrations ........................................................................................................ 113
Instrumentation ............................................................................................................... 114
Coating Formulation and Curing ..................................................................................... 114
Control and Standard Coatings ....................................................................................... 115
Water Aging .................................................................................................................... 116
Biological Laboratory Assays ....................................................................................................... 116
Growth and Release of Macroalgae (Ulva linza) ............................................................ 116
Growth and Release of Microalgae (Navicula incerta) ................................................... 117
Bacterial (Cellulophaga lytica) Biofilm Adhesion ............................................................ 117
Re-attached Adult Barnacle (Amphibalanus amphitrite) Adhesion ................................. 117
Mussel (Geukensia demissa) Adhesion.......................................................................... 118
Surface Characterization ................................................................................................ 119
Results and Discussion ................................................................................................................ 120
Conclusions .................................................................................................................................. 137
References ................................................................................................................................... 138
CHAPTER 6. SILOXANE-POLYURETHANE MARINE COATINGS WITH HYDROPHILIC SIDE CHAINS FOR FOULING RELEASE APPLICATIONS .............................................................................. 142
Introduction .................................................................................................................................. 142
Experimental ................................................................................................................................ 145
xii
Materials .......................................................................................................................... 145
Synthesis of sulfobetaine modified monofunctional poly (ethylene oxide) methyl ether containing polyisocyanate (SB-BAY-304) .............................................................. 146
Synthesis of sulfobetaine modified isophone diisocyanate based polyisocyanate (SB-IPDI) ......................................................................................................................... 146
Synthesis of poly (ethylene oxide) modified isophone diisocyanate based polyisocyanate (PEG-IPDI) ............................................................................................. 146
Isocyanate Titrations ....................................................................................................... 147
Characterization .............................................................................................................. 147
Synthesis of Pre-polymers Part 1 ................................................................................... 147
Synthesis of Pre-polymers Part 2 ................................................................................... 147
Coating Formulation ........................................................................................................ 148
Control and Standard Coatings ....................................................................................... 149
Water Contact Angle Measurements .............................................................................. 150
Water Aging .................................................................................................................... 150
Biological Laboratory Assays ....................................................................................................... 150
Bacterial (Cellulophaga lytica) Biofilm Adhesion ............................................................ 150
Growth and Release of Microalgae (Navicula incerta) ................................................... 151
Adult Barnacle (Amphibalanus amphitrite) Adhesion ..................................................... 151
Mussel (Geukensia demissa) Adhesion.......................................................................... 152
Results and Discussion ................................................................................................................ 152
Conclusions .................................................................................................................................. 164
References ................................................................................................................................... 165
CHAPTER 7. FOULING-RELEASE PERFORMANCE OF SILOXANE-POLYURETHANE COATINGS IN FRESHWATER FIELD IMMERSION TRIALS...................................................................................... 169
Introduction .................................................................................................................................. 169
Experimental ................................................................................................................................ 171
Materials .......................................................................................................................... 171
Coating Formulation ........................................................................................................ 172
Water Aging .................................................................................................................... 172
xiii
Surface Characterization of Coatings ............................................................................. 173
Laboratory Biological Assays ....................................................................................................... 174
Adult Barnacle (Amphibalanus amphitrite) Adhesion ..................................................... 174
Mussel (Geukensia demissa) Adhesion.......................................................................... 174
Freshwater Field Immersion Trials ............................................................................................... 175
Results and Discussion ................................................................................................................ 175
Conclusions .................................................................................................................................. 185
References ................................................................................................................................... 186
CHAPTER 8. OVERALL CONCLUSIONS AND FUTURE WORK ........................................................... 188
APPENDIX ................................................................................................................................................ 193
Chapter 2. Supplemental Information .......................................................................................... 193
Chapter 5. Supplemental Information .......................................................................................... 202
xiv
LIST OF TABLES
Table Page
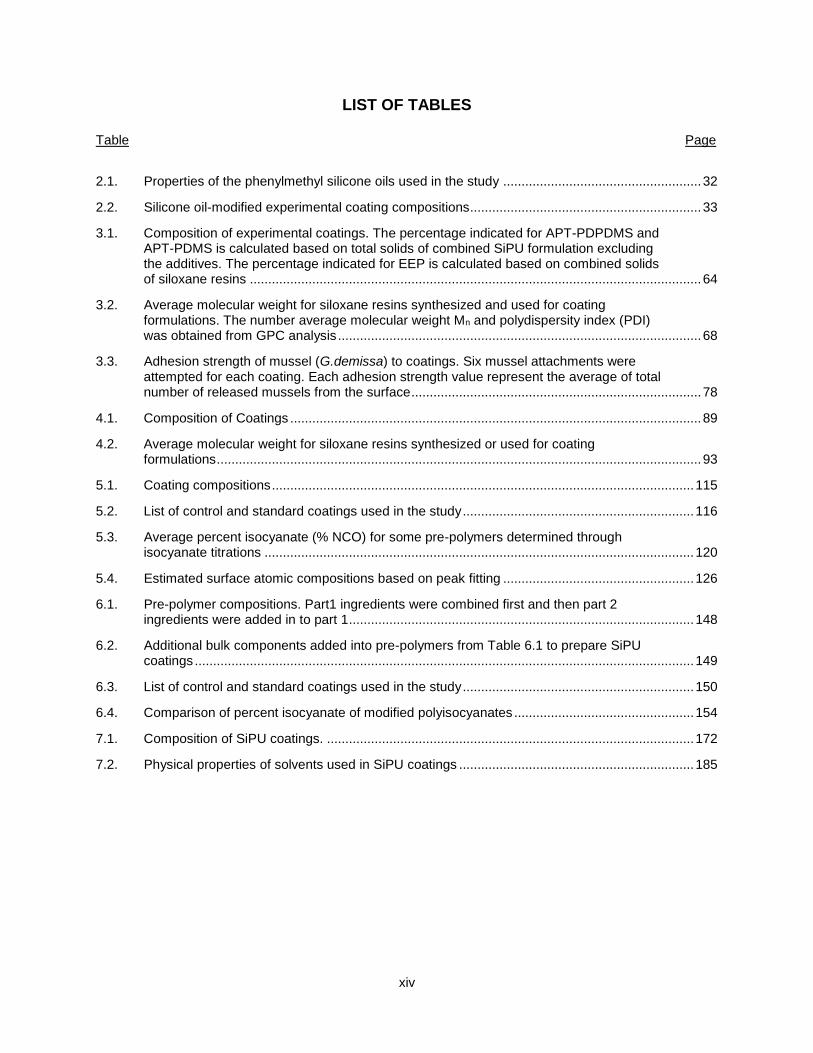
2.1. Properties of the phenylmethyl silicone oils used in the study ...................................................... 32
2.2. Silicone oil-modified experimental coating compositions............................................................... 33
3.1. Composition of experimental coatings. The percentage indicated for APT-PDPDMS and APT-PDMS is calculated based on total solids of combined SiPU formulation excluding the additives. The percentage indicated for EEP is calculated based on combined solids of siloxane resins ........................................................................................................................... 64
3.2. Average molecular weight for siloxane resins synthesized and used for coating formulations. The number average molecular weight Mn and polydispersity index (PDI) was obtained from GPC analysis ................................................................................................... 68
3.3. Adhesion strength of mussel (G.demissa) to coatings. Six mussel attachments were attempted for each coating. Each adhesion strength value represent the average of total number of released mussels from the surface ............................................................................... 78
4.1. Composition of Coatings ................................................................................................................ 89
4.2. Average molecular weight for siloxane resins synthesized or used for coating formulations .................................................................................................................................... 93
5.1. Coating compositions ................................................................................................................... 115
5.2. List of control and standard coatings used in the study ............................................................... 116
5.3. Average percent isocyanate (% NCO) for some pre-polymers determined through isocyanate titrations ..................................................................................................................... 120
5.4. Estimated surface atomic compositions based on peak fitting .................................................... 126
6.1. Pre-polymer compositions. Part1 ingredients were combined first and then part 2 ingredients were added in to part 1 .............................................................................................. 148
6.2. Additional bulk components added into pre-polymers from Table 6.1 to prepare SiPU coatings ........................................................................................................................................ 149
6.3. List of control and standard coatings used in the study ............................................................... 150
6.4. Comparison of percent isocyanate of modified polyisocyanates ................................................. 154
7.1. Composition of SiPU coatings. .................................................................................................... 172
7.2. Physical properties of solvents used in SiPU coatings ................................................................ 185
xv
LIST OF FIGURES
Figure Page
1.1. Schematic representing release of a stud glued to an elastomeric coating on a rigid substrate .......................................................................................................................................... 5
1.2. Self-stratified, crosslinked siloxane-polyurethane (SiPU) coating system. The top layer is concentrated with siloxane providing FR properties and polyurethane bulk adhering to primer surface .................................................................................................................................. 7
1.3. Ulva linza spore settlement on bio-inspired engineered SharkletTM AF patterns imprinted on PDMS elastomers. Reproduced from reference 2....................................................................... 9
1.4. Side-by-side view of surface topography features observed on a) skin of pilot whale (G. melas) and b) bio-inspired surfaces fabricated by polyelectrolyte self-assembly. Reproduced from reference 49 ....................................................................................................... 10
1.5. Activated, artificial cilia repelling small adhesive particles similar to the process of live cilia preventing biofouling. Reproduced from reference 47 ............................................................. 12
1.6. Left: settlement densities of spores of Ulva on SABCs. Right: percentage removal of sporeling biomass from SABCs. Reproduced from reference 81 ................................................... 15
1.7. Chemical structure of PEO-silane amphiphile (n = 3, 8, and 16) and surface reconstruction of bulk-modified silicone coating with PEO-silane amphiphile. Reproduced from reference 95 ............................................................................................................................ 17
2.1. Fouling development on a structure submerged in seawater ........................................................ 29
2.2. Chemical structure of silicone oils used for the experiment. a) phenylmethyl dimethyl siloxane copolymer oil and b) phenylmethyl siloxane homopolymer oil ........................................ 32
2.3. a) Water and methylene iodide contact angles before and after 28 days of water aging. Each data point represents the average and standard deviation of 3 measurements. b) Surface energy of coatings calculated by the Owens-Wendt method utilizing the average WCA and MICA measurements. Coatings labels: Coatings are arranged in the order of increasing phenylmethyl composition of the silicone oil (ex: 1-6, 7-12, 13-18) while the darkening of blue shade indicate increasing oil content from 1, 2 to 5% and the controls and standards are shaded in gray. ................................................................................................ 41
2.4. XPS atomic concentration depth profile of a) A4-20 siloxane-PU without oil; b) silicone oil-modified formulation 5; and c) silicone oil-modified formulation 17 ............................................... 43
2.5. Macroalgae (Ulva linza) removal from experimental and control/standard coatings after water-jet treatment at 9kPa and 67kPa. Each data point represents the average percent removal value of 6 replicates. Error bars indicate one standard error of the mean. Coatings labels: Coatings are arranged in the order of increasing phenylmethyl composition of the silicone oil (ex: 1-6, 7-12, 13-18) while the darkening of blue shade indicates increasing oil content from 1, 2 to 5% and the controls and standards are shaded in gray. ............................................................................................................................... 45
xvi
2.6. Diatom (Navicula incerta) removal from experimental and control/standard coatings after treatments with a 138 kPa (20 psi) water jet pressure for 10 s seconds. Each percent removal value represents the average of 3 replicates samples. Error bars indicate one standard deviation of the mean. Coatings labels: Coatings are arranged in the order of increasing phenylmethyl composition of the silicone oil (ex: 1-6, 7-12, 13-18) while the darkening of blue shade indicates increasing oil content from 1, 2 to 5% and the controls and standards are shaded in gray. ................................................................................................ 47
2.7. Bacterial (Cellulophaga lytica) biofilm removal from experimental and control/standard coatings after being exposed to a 69 kPa (10 psi) water-jet treatment for 5 s. The percent removal values represent the average of 3 replicate samples. Error bars indicate one standard deviation of the mean. Coatings labels: Coatings are arranged in the order of increasing phenylmethyl composition of the silicone oil (ex: 1-6, 7-12, 13-18) while the darkening of blue shade indicates increasing oil content from 1, 2 to 5% and the controls and standards are shaded in gray. ................................................................................................ 49
2.8. Adhesion of reattached barnacle (Amphibalanus amphitrite) experimental and control coatings. Five adult barnacle reattachments were attempted for each coating. Each adhesion strength value represents the average of total number of reattached barnacles released without damage. Error bars represent the standard deviation of average barnacle release stress. The ratio represents the number of measured barnacles over the number of broken/damaged barnacles. The blue digits represent the number of non-attached barnacles. Coatings labels: Coatings are arranged in the order of increasing phenylmethyl composition of the silicone oil (ex: 1-6, 7-12, 13-18) while the darkening of blue shade indicate increasing oil content from 1, 2 to 5% and the controls and standards are shaded in gray. ........................................................................................................................ 50
2.9. Adhesion of mussels (Geukensia demissa) to experimental and control coatings. Five mussels were introduced to each coating. Each adhesion strength value represents the average of total number of attached mussels released from the surface. Error bars represent the standard deviation of the average adhesion force. The ratio represents the number of attached mussels over the number of non-attached mussels. ** indicate the coatings that did not have any attached mussels. Coatings labels: Coatings are arranged in the order of increasing phenylmethyl composition of the silicone oil (ex: 1-6, 7-12, 13-18) while the darkening of blue shade indicates increasing oil content from 1, 2 to 5% and the controls and standards are shaded in gray. ............................................................................. 52
2.10. Visual appearance of coatings included in field immersion trials at California, Singapore and Hawaii test sites. In Hawaii and Singapore test sites, half of each panel was subjected to water jet cleaning while the other half represents the accumulated fouling. At the California test site, the entire panel was subjected to water jet treatment. Thus the picture on the left (2nd row) represent the accumulated fouling while picture on the right represent the coating after cleaning. .............................................................................................. 53
3.1. Behavior of water on rough surfaces. Left: Cassie-Baxter state where water droplet is sitting on the trapped air pockets. Right: Wenzel state where air pockets were displaced allowing liquid to be in complete contact with the solid .................................................................. 60
3.2. Reaction scheme for synthesis of APT-PDPDMS (with copolymer composition, 33% diphenyl- 66% dimethyl siloxane) .................................................................................................. 62
3.3. 1H NMR of APT-PDPDMS (obtained using a dilute sample in CDCl3) with peak assignments ................................................................................................................................... 69
xvii
3.4. Water and methylene iodide contact angles of APT-PDPDMS modified SiPU coatings analyzed following 28 days of tap water immersion. Each data point represents the average contact angle of three replicate measurements. X-axis is labeled in relation to percent wt. ratio of PDMS: PDPDMS and content of additional solvent EEP used to dilute the siloxane blends ........................................................................................................................ 70
3.5. Surface energy of APT-PDPDMS modified coatings evaluated following water immersion. Each data point was calculated using the average WCA and MICA for each coating. X-axis is labeled in relation to percent wt. ratio of PDMS: PDPDMS and content of additional solvent EEP used to dilute the siloxane blends ............................................................. 71
3.6. AFM height images of APT-PDPDMS modified SiPU coating surfaces after water immersion. For each coating surface area of 100µm×100µm was scanned in the tapping mode. The darker shade indicate depth while the lighter shade indicate height. The horizontal and vertical scales are labeled every 20µm .................................................................. 73
3.7. Removal of U. linza sporelings from coatings following water jet treatment at 111 kPa (16 psi). Each bar represent the average percent removal of 6 replicate measurements. X-axis is labeled in relation to percent wt. ratio of PDMS: PDPDMS and content of additional solvent EEP used to dilute the siloxane blends ............................................................. 74
3.8. Removal of diatom (N. incerta) from coatings after water jet treatment at 20 psi pressure. Each bar represents the average percent removal of 3 replicate measurements. X-axis is labeled in relation to percent wt. ratio of PDMS: PDPDMS and content of additional solvent EEP used to dilute the siloxane blends ............................................................................. 75
3.9. Percent removal of bacterial biofilm (C. lytica) from coatings after water jet treatment at 20 psi pressure. Each bar represents the average percent removal of 3 replicate measurements. X-axis is labeled in relation to percent wt. ratio of PDMS: PDPDMS and content of additional solvent EEP used to dilute the siloxane blends ............................................ 76
3.10. Adhesion strength of reattached barnacles (A.amphitrite) for coatings. Five adult barnacle reattachments were attempted for each coating. Each adhesion strength value represents the average of total number of reattached barnacles released without damage. The ratio represent the number of measured barnacles over the number of broken/damaged barnacles. X-axis is labeled in relation to percent wt. ratio of PDMS: PDPDMS and content of additional solvent EEP used to dilute the siloxane blends .................... 77
4.1. Reaction scheme for the synthesis of APT-PDMS-25A ................................................................. 87
4.2. 1H NMR of APT-PDMS-25A in solvent (80:20 mixture of CDCl3: methanol-d) .............................. 94
4.3. Water and methylene iodide contact angles of APT-PDMS-25A modified SiPU coatings analyzed before and after 28 days of tap water immersion. Each data point represents the average contact angle of three replicate measurements ......................................................... 95
4.4. Water and methylene iodide contact angles of APT-PDMS-25A modified SiPU coatings analyzed before and after 28 days of ASW immersion. Each data point represents the average contact angle of three replicate measurements ............................................................... 96
4.5. Surface energy of experimental coatings evaluated before and after water immersion. Each data point was calculated using the average WCA and MICA for each coating obtained from water aging study .................................................................................................... 97
4.6. Surface energy of experimental coatings evaluated before and after ASW immersion. Each data point was calculated using the average WCA and MICA for each coating obtained from ASW water aging study ........................................................................................... 97
4.7. AFM scans of experimental coatings after 28 days of water aging ............................................... 98
xviii
4.8. U.linza sporeling growth on experimental and standard coatings. Each bar represents the fluorescence of chlorophyll (averaged for 6 replicates per coating) which is directly proportional to amount of U.linza biomass present on the coating surface after 6 days of growth............................................................................................................................................. 99
4.9. Removal of U.linza sporelings from coatings following water jet treatment at 18, 67, and 111 kPa. Each bar represent the average percent removal of 6 replicate measurements ......... 100
4.10. Removal of C.lytica bacterial biofilm form coatings following water jet treatment at 10 and 20 psi. Each bar represents the average percent removal of 3 replicate measurements ........... 101
4.11. Removal of N.incerta microalgae from coatings after water jet treatment at 10 and 20 psi pressures. Each bar represents the average percent removal of 3 replicate measurements ............................................................................................................................. 102
4.12. Adhesion strength of reattached barnacles (A.amphitrite) for coatings. Five adult barnacle reattachments were attempted for each coating. Each adhesion strength value represent the average of total number of reattached barnacles released without damage. The ratio represent the number of measured barnacles over the number of broken/damaged barnacles ...................................................................................................................................... 103
4.13. Adhesion of mussel (G.demissa) to coatings. Six mussel attachments were attempted for each coating. Each adhesion strength value represent the average of total number of attached mussels released from the surface. The ratio represent the number of attached mussels over the number of non-attached mussels .................................................................... 104
5.1. General structure of the IPDI-PDMS-PEG pre-polymers ............................................................. 114
5.2. FTIR spectrum for IPDI-10-5kPDMS-550PEG pre-polymer ........................................................ 121
5.3. Water (WCA) and methylene iodide (MICA) contact angles for 12 experimental coatings and SiPU internal control before and after 28 days water immersion. Each data point represents the average and standard deviation of 3 measurements. X-axis is labeled to indicate the coating number, PEG MW used, PDMS MW used and wt. % of PEG and PDMS used in the coatings, respectively ..................................................................................... 122
5.4. Surface energy of coatings calculated by Owens-Wendt method utilizing the average WCA and MICA measurements. X-axis is labeled to indicate the coating number, PEG MW used, PDMS MW used and wt. % of PEG and PDMS used in the coatings, respectively .................................................................................................................................. 123
5.5. ATR-FTIR spectrum for water aged coatings (7, 8, and 9) containing pre-polymers IPDI-10-1kPDMS-550PEG, IPDI-10-5kPDMS-550PEG, IPDI-10-10kPDMS-550PEG ........................ 124
5.6. XPS spectra of AmSiPU coatings 10, 11 and 12. The plots represent C 1s and O 1s spectrum for each coating with peak fittings corresponding to chemical composition. Spectra a) and b) are for coatings 10, spectra c) and d) are for coating 11, and e) and f) are for coating 12 ......................................................................................................................... 127
5.7. AFM phase images of AmSiPU coatings for a scan area of 100µm x 100µm ............................. 129
5.8. Percent removal of macroalgae (U.linza) sporelings at water jet treatments 18 and 36 kPa. Each bar represents the average percent removal of six measurements and corresponding standard deviation. X-axis is labeled to indicate the coating number, PEG MW used, PDMS MW used and wt. % of PEG and PDMS used in the coatings, respectively .................................................................................................................................. 131
xix
5.9. Microalgae (N.incerta) attachment and retention (i.e., biomass remaining) after water-jet treatment at 20 psi pressure. Each bar represents the average of 3 replicate measurements along with standard deviation. Pink colored line indicates the amount of biomass remaining on the IS 1100 commercial standard after water-jetting. X-axis is labeled to indicate the coating number, PEG MW used, PDMS MW used and wt. % of PEG and PDMS used in the coatings, respectively ..................................................................... 132
5.10. Bacterial biofilm (C.lytica) growth and retention after water-jet treatment at 20 psi pressure. Each bar represents the average of 3 replicate measurements along with standard deviation. Pink colored line indicates the amount of biomass remaining on the IS 1100 commercial standard after water-jetting. X-axis is labeled to indicate the coating number, PEG MW used, PDMS MW used and wt. % of PEG and PDMS used in the coatings, respectively ................................................................................................................... 133
5.11. Photographs of crystal violet stained coating wells for AmSiPU coatings 8, 10, 11, standards Dow Corning® T2, polyurethane (PU), Intersleek® 1100SR and Hempasil® X3 before and after 20 psi water jet treatment. Biofilm on Intersleek® 1100SR is indicated by highlighted yellow line .................................................................................................................. 134
5.12. Reattached barnacle (A. amphitrite) adhesion strength. Six barnacles were used for each reattachment study, out of which blue numbers represent the non-attached barnacles. The ratio represents the number of released barnacles versus the number of broken/damaged barnacles during push off measurements. Each bar represents the average adhesion strength based on the number of successfully pushed barnacles. Pink colored line indicates the average adhesion strength for the IS 900 commercial standard. X-axis is labeled to indicate the coating number, PEG MW used, PDMS MW used and wt. % of PEG and PDMS used in the coatings, respectively ............................................................. 135
5.13. Marine mussel (G. demissa) adhesion evaluated with six attempted attachments for each coating. Each adhesion strength value represents the average force for removal of successfully attached mussels. The ratio represents the number of attached mussels over the number of non-attached mussels. X-axis is labeled to indicate the coating number, PEG MW used, PDMS MW used and wt. % of PEG and PDMS used in the coatings, respectively ................................................................................................................... 136
6.1. Representative structure of hydrophilic additive ethylene oxide-graft-dimethyl siloxane ............ 145
6.2. Schematic representing the coating formulation steps. In the case of coatings 9-12, part 3 was followed after part 1. The cores of polyisocyanates are color coordinated to indicate structural similarities ..................................................................................................................... 149
6.3. Sulfobetaine functionalization of polyisocyanates ....................................................................... 153
6.4. FTIR spectrum of modified polyisocyanate resins SB-BAY 304, SB-IPDI, and PEG-IPDI .......... 155
6.5. General representative structure for pre-polymers (part 1) ......................................................... 156
6.6. Water contact angles for coatings observed over 2 min interval for 10 min. Each bar represents the average of 3 replicate measurements and the error bars represent the standard deviation of the mean .................................................................................................... 158
6.7. Bacterial biofilm (C.lytica) growth and retention after water-jet treatment at 20 psi pressure. Each bar represents the average of 3 replicate measurements and the error bars represent the standard deviation of the mean ..................................................................... 159
6.8. Removal of C.lytica biofilm from coatings. Each bar represents the average of 3 replicate measurements and the error bars represent the standard deviation of the mean ...................... 160
xx
6.9. Microalgae (N.incerta) cell attachment and retention (i.e., biomass remaining) after water-jet treatment at 20 psi pressure. Each bar represents the average of 3 replicate measurements along with standard deviation.............................................................................. 161
6.10. Removal of diatom (N.incerta) from coatings. Each bar represents the average of 3 replicate measurements and the error bars represent the standard deviation of the mean ........ 162
6.11. Reattached barnacle (A. amphitrite) adhesion strength. Six barnacles were used for each reattachment study, out of which red numbers represent the non-attached barnacles and the black numbers represent the successfully reattached barnacles. No broken/damaged barnacles were reported during push off measurements for this study. Each bar represents the average adhesion strength based on the number of successfully pushed barnacles and the error bars represent the standard deviation of the mean. Red colored line indicates the average adhesion strength for the IS 900 commercial standard ..................... 163
6.12. Marine mussel (G. demissa) adhesion evaluated with six attempted attachments for each coating. Each adhesion strength value represents the average force for removal of successfully attached mussels. Error bars represent the standard deviation of the mean. The red number indicates the number of non-attached mussels and the black number indicates the number of attached mussels................................................................................... 164
7.1. WCA for SiPU coatings under as made condition and following 1 month pre-leaching. Additionally for A4 coatings, WCAs were also performed after 1.42 years of immersion in the field test site. Each bar represent the average WCA with error bar representing standard deviation of the mean .................................................................................................... 176
7.2. MICA for SiPU coatings under as made condition and following 1 month pre-leaching. Additionally for A4 coatings, MICAs were also performed after 1.42 years of immersion in the field test site. Each bar represent the average MICA with error bar representing standard deviation of the mean .................................................................................................... 177
7.3. SE of coatings measured initially and after 1 month of pre-leaching. Additionally, SE measurements for A4-10% and A4-20% coatings were performed following field immersion for 1.42 years.............................................................................................................. 177
7.4. Evaluation of barnacle (A.amphitrite) adhesion to SiPU and stadard coatings. Each bar represents the average adhesion strength observed for succeffuly released reattached barnacles from coating surface. Error bars represent the standard deviation of average barnacle release stress. The ratio represents the number of released barnacles over the number of broken/damaged barnacles ........................................................................................ 178
7.5. Evaluation of marine mussel (G demissa) adhesion to SiPU and standard coatings. Each bar represents the average force for removal of succeffuly attached mussels. The error bars represent the standard deviation of the mean adhesion force. The ratio represents the number of attached mussels over the number of non-attached mussels .............................. 179
7.6. Visual appearance of SiPU coatings during freshwater field immerion trials at the Parker Dam California site exposed to dynamic conditions. Pictures were provided by courtecy of the Bureau of Reclamation ...................................................................................................... 180
7.7. Visual appearance of C4-10% and C4-20% coatings during continuted freshwater field immerion trials at the Parker Dam California site exposed to dynamic conditions. Pictures were provided by courtecy of the Bureau of Reclamation ........................................................... 181
7.8. Graphs tracking atomic concentartion of C, Si, O and N during depth profiling of A4-20 and C4-20 SiPU coatings using XPS ........................................................................................... 183
xxi
LIST OF APPENDIX TABLES
Table Page
A1. Film thickness measurements of coatings analyzed using XPS.................................................. 193
A2. ANOVA results for U. linza removal at 9 kPa............................................................................... 193
A3. U. linza removal: Top five performing experimental coatings at 9 kPa statistically compared against control coatings. The table shows t-values for pairwise comparison and the corresponding p-value. *Significant Difference at α=0.05 .............................................. 193
A4. U. linza removal: Tukey’s comparison for Least squares means of U. linza removal for coatings at 9 kPa. Least square means with the same letter indicates non-significance ............ 194
A5. ANOVA results for U. linza removal at 67 kPa ............................................................................ 194
A6. U. linza removal: Top three performing experimental coatings at 67 kPa statistically compared against control coatings. The table shows t-values for each comparison and the corresponding p-value. *Significant Difference at α=0.05...................................................... 195
A7. U. linza removal: Tukey’s comparison for Least squares means of U. linza removal for coatings at 67 kPa. Least square means with the same letter indicates non-significance .......... 196
A8. ANOVA results for N. incerta (diatom) removal at 20 psi ............................................................ 197
A9. N. incerta (diatom) removal: Top five performing experimental coatings at 20 psi statistically compared against control coatings. The table shows t-values for each comparison and the corresponding p-value. *Significant Difference at α=0.05, No symbol means the two coatings are similar in performance .................................................................... 197
A10. Tukey’s comparison for Least squares means of diatom removal for coatings at 20 psi. Least square means with the same letter indicates non-significance .......................................... 198
A11. ANOVA results for C. lytica (bacteria) removal at 10 psi ............................................................. 198
A12. C. lytica (bacteria) removal: Top five performing experimental coatings at 10 psi statistically compared against control coatings. The table shows t-values for each comparison and the corresponding p-value in the parentheses. *Significant Difference at α=0.05, No symbol means the two coatings are similar in performance ..................................... 199
A13. Tukey’s comparison for Least squares means of C. lytica (bacteria) removal for coatings at 10 psi. Least square means with the same letter indicates non-significance .......................... 200
A14. ANOVA results for barnacle (A. amphitrite) adhesion ................................................................. 200
A15. Barnacle (A. amphitrite) adhesion: Top three performing experimental coatings statistically compared against control coatings. The table shows t-values for each comparison and the corresponding p-value. *Significant Difference at α=0.05, No symbol means the two coatings are similar in performance .................................................................... 201
A16. Tukey’s comparison for Least squares means of barnacle (A. amphitrite) adhesion for coatings. Least square means with the same letter indicates non-significance .......................... 201
A17. Detailed formulations for IPDI-M5KPDMS(10%)-550PEG(10%) pre-polymer portion of formulation 8 ................................................................................................................................ 202
A18. Compositions of pre-polymers investigated during AmSiPU study ............................................. 202
xxii
LIST OF APPENDIX FIGURES
Figure Page
A1. AFM height images for AmSiPU coatings .................................................................................... 203
A2. Percent removal of diatoms (Navicula incerta) from coatings ..................................................... 204
A3. Percent removal of bacterial biofilm (Cellulophaga lytica) from coatings .................................... 204
A4. Macroalgae (Ulva linza) initial attachment and retention (i.e., biomass remaining) after water-jet treatment at 36 kPa pressure ........................................................................................ 205
1
CHAPTER 1. GENERAL INTRODUCTION
Marine Biofouling and Impact
Marine biofouling is defined as the settlement and growth of marine organisms on all surfaces
that are immersed in seawater.1 Marine biofouling is a global concern affecting the shipping/ maritime
industry with both economic and environmental consequences.2 Accumulation of fouling on ship hulls
cause increased roughness contributing to frictional drag leading to severe loss in fuel efficacy.1, 3
Increased fuel cost due to frictional resistance can be an additional 40% which may contribute to a 77%
increase in overall voyage cost.1 On the other hand, heavy fouling of the ship hull requires frequent visits
to the dry-dock, costing the ship owner time, resources, toxic-waste and ultimately money.1 Marine
biofouling also has detrimental effects on protective paint of the ship hull.1 Chemical nature of the
adhesives and waste products from the organisms may contribute to the deterioration of marine coatings
making the ship hull susceptible to corrosion and degradation. Transport and release of non-native
organisms into far-away oceans poses a huge environmental threat with regard to transport of invasive
species, causing concerns for imbalanced marine ecosystem.1, 4 Given the widespread network of global
shipping routes, the risk of spreading invasive species (hull-mediated species transfer) can be very high.5
Marine biofouling can also indirectly contribute to another environmental concern; greenhouse gas
emissions.2 Significant increase in fuel consumption may lead to increased emission of greenhouse
gases releasing air pollutants.
Marine biofouling is a complex process that involves more than 4000 marine organisms.1, 3 If the
surface remains the same, several factors of the surrounding marine environment can affect the extent of
fouling, type and settlement of marine organisms, diversity of biofouling communities and their adhesion
strength. These factors include salinity, nutrients, temperature of water, flow of currents, sunlight, ions
and minerals present in the surrounding marine environment.6, 7 Marine organisms have shown diverse
adhesion mechanisms making it difficult for a specific coating to prevent their adhesion.8 On the other
hand, the miracle of nature has allowed these organisms the ability to recognize and respond to surface
cues allowing them to show adaptive behavior.2, 9, 10 Therefore developing a marine coating system to
combat biofouling is not an easy task. A potential coating solution for marine biofouling must constitute
2
economically feasible, environmentally friendly (non-toxic), durable, easy to use system with effective
performance towards all zones of oceans and all types of marine organisms.
Biofouling Process
Although most literature presents a simple successive model for biofouling,1, 11, 12 recent studies
and understanding of the biofouling process presents a more complex dynamic model with considerable
interactions and interplay of marine organisms.2, 3, 7 When a fresh surface is exposed to the marine
environment, a conditioning film is formed due to absorption of organic molecules. Once the surface is
conditioned, it is ready for wide range of marine organisms to explore, settle and to form communities.
Due to the dynamic nature of biofouling, attachment of marine organisms can be a combined effect of
surface chemistry of the substrate, nutrients available, competition and predation.13, 14 In a time scale of
seconds, marine bacteria, diatoms, and protozoa contribute to micro-fouling forming biofilms (slime) on
conditioned surfaces.2, 3 Within a few minutes to hours, soft fouling algae spores, tunicates, and sponges
also adhere to surfaces along with larvae of barnacles, mussels, hydroids, and tubeworms contributing to
macro-fouling.2, 3 Studies have reported that different species of the same organism can be found to
colonize separate locations of the ship hull.10, 13, 15 Hence biofouling is much more complex phenomenon
and a systematic understanding of biological processes involved during organism settlement, adhesion
and colonization is essential to find practical solutions.
Economic Impact
The magnitude of economic impact from biofouling is astounding. Although biofouling has a major
economic impact on the oceanic transportation sector, it can also have a significant effect on modern day
energy production (off shore oil rigs, hydropower turbines, wind mills and wave power generators).
However in this section, the economic impacts due to hull fouling is discussed. The effects of fouling on
frictional drag have been long studied and reviewed (1952).16 The results clearly indicate that fouling on
ship hulls leads to a considerable increase in frictional drag. However the magnitude of increase depend
mostly on the fouling type and extent of coverage.16-19 Schultz et al. described a method to predict the
ship’s resistance and powering due to drag based on laboratory-scale drag measurements and boundary
layer similarity law analysis.16 He later used this method to estimate economic impact due to biofouling on
a range of vessels and the predictions are consistent with results from ship powering trials.16, 19 These
3
studies highlight that the cost for increased fuel consumption is far more greater than the cost for painting,
dry-docking and hull cleaning.19 Estimates from the United States Navy Naval Sea Systems Command
indicate a 6-45% (depending on the size of vessels) increase in fuel cost alone due to 2% loss of
operating speed.12 Schultz et al. predicted that additional powering costs due to slime (light fouling) can
be 10-16% increase while that for heavy calcareous fouling may add up to 86%.16 A study conducted to
estimate the economic impact of fouling on mid-sized naval surface ships (Arleigh Burke DDG-51, 30% of
the entire navy fleet) in The United States Navy, found that hull fouling for the DDG-51s cost US$56
million per year.19 If they were to extend their predictions to the entire fleet of United States Navy ships,
the hull fouling cost can be US$180-260 million per year.19 However considering the direct and indirect
sources, cost of biofouling for the United States Navy may tower up to approximately US$1 billion per
year.10
Strategies for Combating Biofouling
In the early days of shipping, ship hulls are typically made of wood and a variety of strategies
were explored for preventing biofouling. Wooden ship hulls were protected with copper, lead, tar, wax,
asphalt and other materials available depending on the region.1, 3, 20 Soon after iron was used for building
ships, copper and lead sheathing were widely used for combating biofouling.20 Since this strategy
accelerated deterioration due to corrosion, anti-fouling (AF) paints with toxins emerged as a potential
solution.20 These early stage AF paints were prepared by dispersing toxins in to natural binders (linseed
oil, tar and rosin) which set the standard for AF paint systems. The toxins used in AF compositions were
later known as biocides.
Starting from the 1900s, effective AF compositions with active biocides were widely explored.1
Eventually organotin compounds were identified as very effective AF ingredient and in the 1960-1970s AF
coating compositions composed of self-polishing copolymers and tributyl-tin (TBT) were introduced.1, 3, 20
The release of TBT was controlled via the hydrolysis of organotin-ester linkage. The active ingredient TBT
was slowly released as the polymer eroded. These AF paints with TBT were very effective against
biofouling; TBT was toxic to targeted marine organism essentially killing them as they came into contact
with the ship hull.
4
Although TBT based AF paints were highly successful in preventing marine biofouling, leaching of
TBT posed a great threat to non-targeted marine organisms. First reports of oyster shell thickening were
reported from France.21 TBT led to the extinction of some marine organism such as Nucella due to its
interference with their reproduction process.22 A few decades later, accumulation of tin in fish, seals and
ducks was also observed.3 Therefore the success of TBT based AF coatings were short lived and copper
oxide based AF coating gained significant attention. The international Maritime Organization started
restricting the use of TBT from the early 2000s. Use of TBT in AF compositions was completely banned in
2003 and TBT based AF paints were required to be removed from vessels by 2008.3
Today, AF coatings with copper oxide or organic biocide contribute to majority of marine coatings
in the market.21 Although not as severe as TBT based paints, AF coating systems with biocides also have
negative environmental effects on marine life and they are less sustainable.3, 7 Release of copper oxide
has led to accumulation of copper in ports due to extended docking periods. Release of organic biocides
also poses a threat to local ecosystems. On the other hand, extensive amount of laboratory toxicity data
and risk assessments are required for new biocides to emerge and to be used in AF paints.3, 23 Few
number of organic biocides (12-15) remain on the approved list to be used as an ingredient in AF coating
compositions.3 Given all the negative impacts of AF coatings and the continued push by environmental
agencies, non-toxic alternatives are being widely explored.7
Non-toxic Marine Coatings
In the effort to find non-toxic solutions to combat biofouling, coatings with the ability to release
fouling due to hydrodynamic force became an area of research and technical interest. Although fouling-
release (FR) coatings were introduced in 1961 as a non-toxic alternative to AF coatings, their existence
was over shadowed by the excellent performance of the TBT-based self-polishing AF paints. Fouling-
release coatings started to gain market acceptance in 1990 to 2000 when the use of TBT in AF paints
was heavily regulated and leading to complete ban of TBT in 2003.1, 3 Fouling-release coatings do not
include any toxic AF ingredients to inhibit fouling, rather they have a surface that allows marine organism
to adhere weakly.1, 3, 12 Ideally, fouling would be washed off by hydrodynamic force (self-cleaned) or fall
off due to the weight of organisms (macrofouling organisms like barnacles can grow to have a height of 3-
5 cm).
5
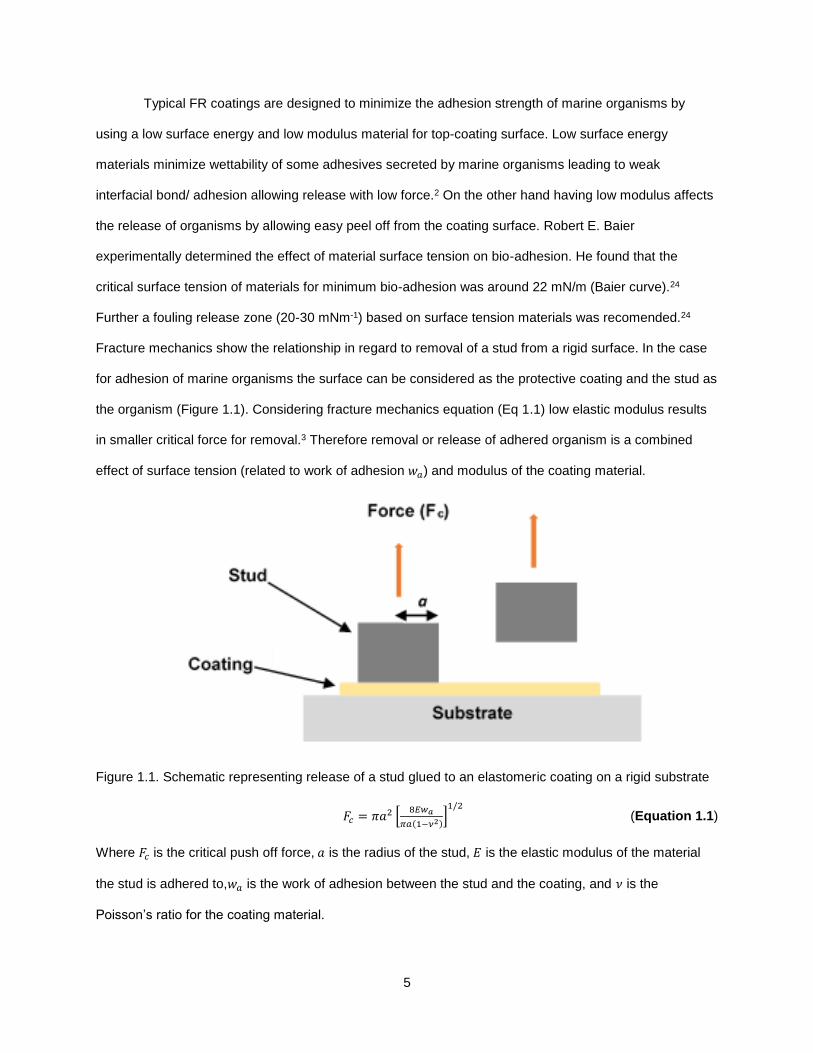
Typical FR coatings are designed to minimize the adhesion strength of marine organisms by
using a low surface energy and low modulus material for top-coating surface. Low surface energy
materials minimize wettability of some adhesives secreted by marine organisms leading to weak
interfacial bond/ adhesion allowing release with low force.2 On the other hand having low modulus affects
the release of organisms by allowing easy peel off from the coating surface. Robert E. Baier
experimentally determined the effect of material surface tension on bio-adhesion. He found that the
critical surface tension of materials for minimum bio-adhesion was around 22 mN/m (Baier curve).24
Further a fouling release zone (20-30 mNm-1) based on surface tension materials was recomended.24
Fracture mechanics show the relationship in regard to removal of a stud from a rigid surface. In the case
for adhesion of marine organisms the surface can be considered as the protective coating and the stud as
the organism (Figure 1.1). Considering fracture mechanics equation (Eq 1.1) low elastic modulus results
in smaller critical force for removal.3 Therefore removal or release of adhered organism is a combined
effect of surface tension (related to work of adhesion 𝑤𝑎) and modulus of the coating material.
Figure 1.1. Schematic representing release of a stud glued to an elastomeric coating on a rigid substrate
𝐹𝑐 = 𝜋𝑎2 [8𝐸𝑤𝑎
𝜋𝑎(1−𝜈2)]
1/2
(Equation 1.1)
Where 𝐹𝑐 is the critical push off force, 𝑎 is the radius of the stud, 𝐸 is the elastic modulus of the material
the stud is adhered to,𝑤𝑎 is the work of adhesion between the stud and the coating, and 𝜈 is the
Poisson’s ratio for the coating material.
6
Polydimethyl siloxane has a surface tension of ≈22 mN/m and an elastic modulus of 0.5-5 MPa.
Polydimethyl siloxane (PDMS) elastomers satisfy both surface tension and modulus requirements for
minimizing bioadhesion. Therefore, PDMS elastomer based materials are commonly used in most FR
coatings.1, 25 However, PDMS elastomeric coatings have poor mechanical durability (soft and rubbery)
leading to easy surface damage.6, 26 Due to the low surface energy, obtaining sufficient adhesion to
underlying paint layers (primer) is extremely difficult. A tie coat is commonly used to enhance adhesion of
FR top coat to subsequent paint layers. However the adhesion of top coat on to subsequent paint layers
is still a problem.6, 26 On the other hand PDMS is a relatively expensive polymer compared to typical
polymers used for coatings. However PDMS combine some unique features which is often difficult to
achieve with other organic polymers. They are chemically and thermally stable, non-toxic to marine
organism, and use well known chemistries for crosslinking.27 PDMS based polymer chains are very
flexible which arise from the silicon oxygen bond in the backbone. The silicon oxygen bond has wide
bond angles which allows easy rotation around the polymer backbone to configure into
thermodynamically stable state. This flexible nature of PDMS contributes to the surface rearrangement to
provide low surface energy surface. For these reasons PDMS elastomers make good FR coating
systems with tunable properties.
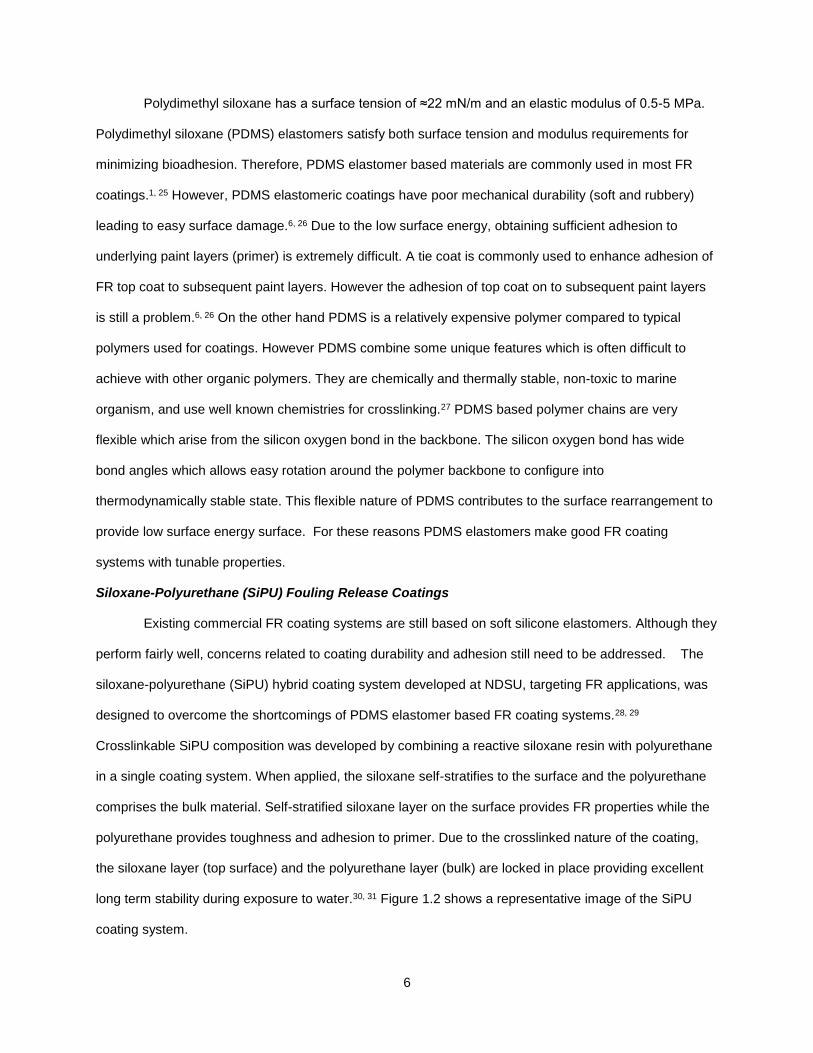
Siloxane-Polyurethane (SiPU) Fouling Release Coatings
Existing commercial FR coating systems are still based on soft silicone elastomers. Although they
perform fairly well, concerns related to coating durability and adhesion still need to be addressed. The
siloxane-polyurethane (SiPU) hybrid coating system developed at NDSU, targeting FR applications, was
designed to overcome the shortcomings of PDMS elastomer based FR coating systems.28, 29
Crosslinkable SiPU composition was developed by combining a reactive siloxane resin with polyurethane
in a single coating system. When applied, the siloxane self-stratifies to the surface and the polyurethane
comprises the bulk material. Self-stratified siloxane layer on the surface provides FR properties while the
polyurethane provides toughness and adhesion to primer. Due to the crosslinked nature of the coating,
the siloxane layer (top surface) and the polyurethane layer (bulk) are locked in place providing excellent
long term stability during exposure to water.30, 31 Figure 1.2 shows a representative image of the SiPU
coating system.
7
Figure 1.2. Self-stratified, crosslinked siloxane-polyurethane (SiPU) coating system. The top layer is concentrated with siloxane providing FR properties and polyurethane bulk adhering to primer surface
The typical SiPU coating system consists of amine terminated siloxane resin, an acrylic polyol,
polyisocyanate, catalyst and pot-life extender. The SiPU coating system composition was optimized using
combinatorial and high throughput experimentation in terms of formulation ingredients and several studies
have demonstrated the fouling release performance.31-37 Siloxane-polyurethane coatings demonstrated
comparable FR properties to commercial standards during laboratory biological assays (for bacteria,
algae, and barnacles) and field immersion trials.35, 37-39 Given the durability of the SiPU system, it serves
as a viable candidate for marine coating applications that can be groomed periodically using an
automated device to minimize fouling.39 The SiPU coating system provides a platform to develop non-
toxic durable FR coatings. The versatility of the SiPU system allows easy tuning of FR and surface
properties of coatings by modification to one or more ingredients. Previous studies bear evidence to the
high level of tunability of SiPU coatings to improve the FR properties.35-38, 40 Modifications to further
improve FR performance of SiPU coatings can be drawn from recently popular strategies for non-toxic
marine coatings.
Modern Approaches for Non-toxic Marine Coatings
Developing a non-toxic marine coating system is not an easy task. During the past several years
researchers have been exploring multiple strategies to contend with biofouling. However these new
strategies need to demonstrate feasibility as a practical solution, cost effective, long performing,
environmentally friendly, and highly tunable. Approaches such as bio-inspired surfaces, amphiphilic
8
coatings and hydrophilic/ zwitterionic surfaces appear to be among the most popular topics in the area of
non-toxic marine coating solutions for combating biofouling.
Bio-inspired Engineered Surfaces
Nature uses multiple defense techniques to combat fouling.41 In the search for non-toxic solutions
for biofouling, utilizing inspiration from nature or mimicking natural AF/FR mechanisms to engineer
surfaces that can defend against fouling is one approach which has gained popularity during the recent
years.12 Marine organisms and plants in aquatic environments have a variety of natural mechanisms to
combat biofouling. Some of the natural defense mechanisms include structurally hierarchical
topographies, secretion of oils and mucus, replenishing surfaces by sloughing skin layers, release of bio-
active molecules and enzymes.2 In most cases marine organism tend to use a combination of chemical,
physical, mechanical and behavioral strategies to combat fouling.42 These bio-inspired techniques have
been closely observed, and attempts have been made to mimic (biomimetic) these mechanisms using
modern day materials and to use inspiration from nature to develop novel material solutions to biofouling
prevention.12, 42
In the area of bio-inspired coatings, much of the research effort is devoted to designing surfaces
with topographies that reduce the settlement or promote the easy release of marine organisms. The Lotus
leaf effect, texture of marine mammal skin, and other hierarchically complex plant/animal microstructures
are a few key concepts that have been investigated for AF/FR coatings.43-49 Engineered surfaces with
topographies inspired by fast moving shark skin were developed in the early 2000s and known as
SharkletTM AF.44, 50 These SharkletTM AF surfaces were prepared using PDMS and their effect on
biofouling was evaluated varying the size and the scale of the features.9, 44, 50-52 Interestingly, marine
organisms showed a response to surface features although correlating their response to size and scale of
textures became a complex undertaking. Ulva linza is one of the most common green algae in the marine
environment that contribute to fouling on ship hulls. Extensively studied settlement and adhesion behavior
of U.linza enable it as a tractable model system for evaluating FR coatings.9, 53-57 SharkletTM AF surfaces
with 2µm wide ridges (n3-n5 Figure 1.3) displayed up to 85% reduction in U.linza spore settlement.44, 52
Schumacher et al. studied the correlation of spore settlement and engineered roughness index (ERI1) and
found an indirect correlation based on feature size, geometry and roughness of SharkletTM AF surfaces.52
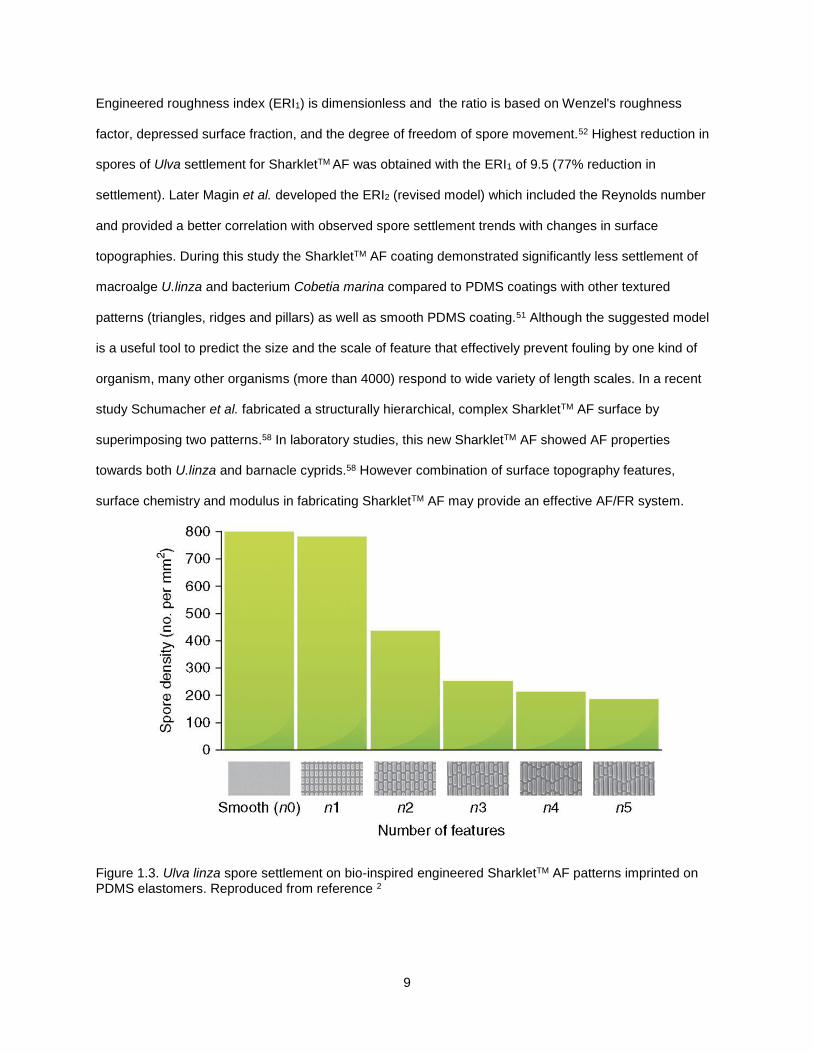
9
Engineered roughness index (ERI1) is dimensionless and the ratio is based on Wenzel's roughness
factor, depressed surface fraction, and the degree of freedom of spore movement.52 Highest reduction in
spores of Ulva settlement for SharkletTM AF was obtained with the ERI1 of 9.5 (77% reduction in
settlement). Later Magin et al. developed the ERI2 (revised model) which included the Reynolds number
and provided a better correlation with observed spore settlement trends with changes in surface
topographies. During this study the SharkletTM AF coating demonstrated significantly less settlement of
macroalge U.linza and bacterium Cobetia marina compared to PDMS coatings with other textured
patterns (triangles, ridges and pillars) as well as smooth PDMS coating.51 Although the suggested model
is a useful tool to predict the size and the scale of feature that effectively prevent fouling by one kind of
organism, many other organisms (more than 4000) respond to wide variety of length scales. In a recent
study Schumacher et al. fabricated a structurally hierarchical, complex SharkletTM AF surface by
superimposing two patterns.58 In laboratory studies, this new SharkletTM AF showed AF properties
towards both U.linza and barnacle cyprids.58 However combination of surface topography features,
surface chemistry and modulus in fabricating SharkletTM AF may provide an effective AF/FR system.
Figure 1.3. Ulva linza spore settlement on bio-inspired engineered SharkletTM AF patterns imprinted on PDMS elastomers. Reproduced from reference 2
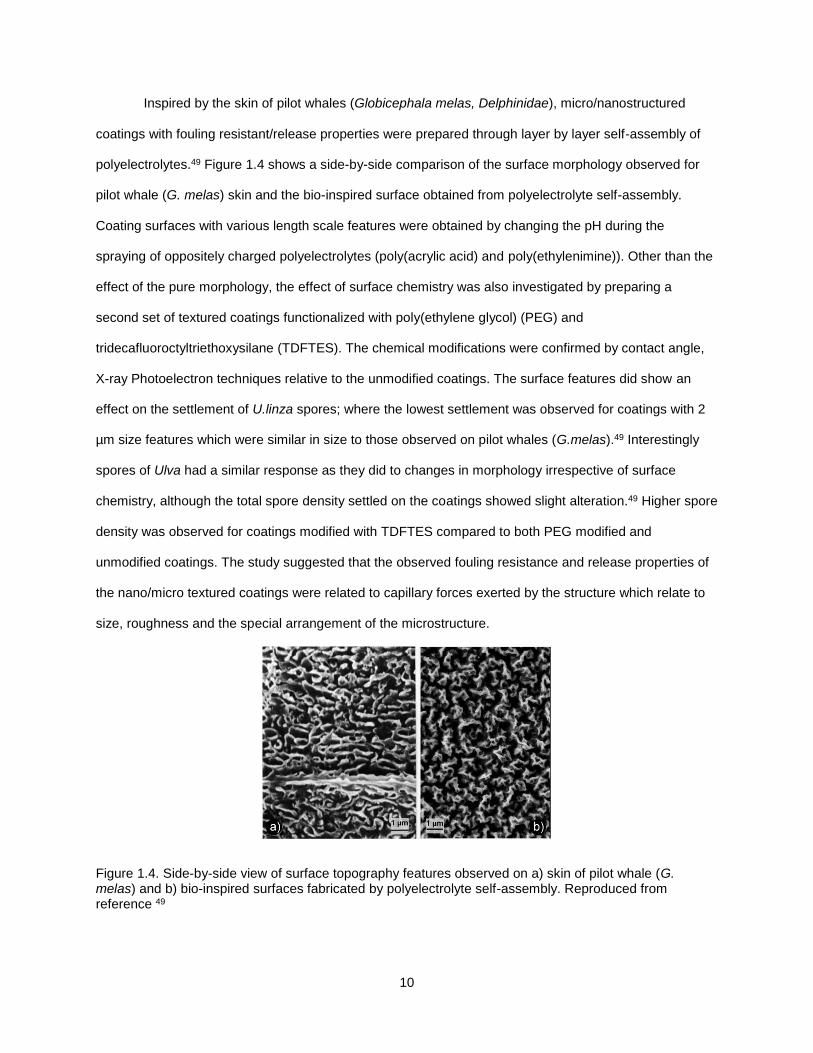
10
Inspired by the skin of pilot whales (Globicephala melas, Delphinidae), micro/nanostructured
coatings with fouling resistant/release properties were prepared through layer by layer self-assembly of
polyelectrolytes.49 Figure 1.4 shows a side-by-side comparison of the surface morphology observed for
pilot whale (G. melas) skin and the bio-inspired surface obtained from polyelectrolyte self-assembly.
Coating surfaces with various length scale features were obtained by changing the pH during the
spraying of oppositely charged polyelectrolytes (poly(acrylic acid) and poly(ethylenimine)). Other than the
effect of the pure morphology, the effect of surface chemistry was also investigated by preparing a
second set of textured coatings functionalized with poly(ethylene glycol) (PEG) and
tridecafluoroctyltriethoxysilane (TDFTES). The chemical modifications were confirmed by contact angle,
X-ray Photoelectron techniques relative to the unmodified coatings. The surface features did show an
effect on the settlement of U.linza spores; where the lowest settlement was observed for coatings with 2
µm size features which were similar in size to those observed on pilot whales (G.melas).49 Interestingly
spores of Ulva had a similar response as they did to changes in morphology irrespective of surface
chemistry, although the total spore density settled on the coatings showed slight alteration.49 Higher spore
density was observed for coatings modified with TDFTES compared to both PEG modified and
unmodified coatings. The study suggested that the observed fouling resistance and release properties of
the nano/micro textured coatings were related to capillary forces exerted by the structure which relate to
size, roughness and the special arrangement of the microstructure.
Figure 1.4. Side-by-side view of surface topography features observed on a) skin of pilot whale (G. melas) and b) bio-inspired surfaces fabricated by polyelectrolyte self-assembly. Reproduced from reference 49
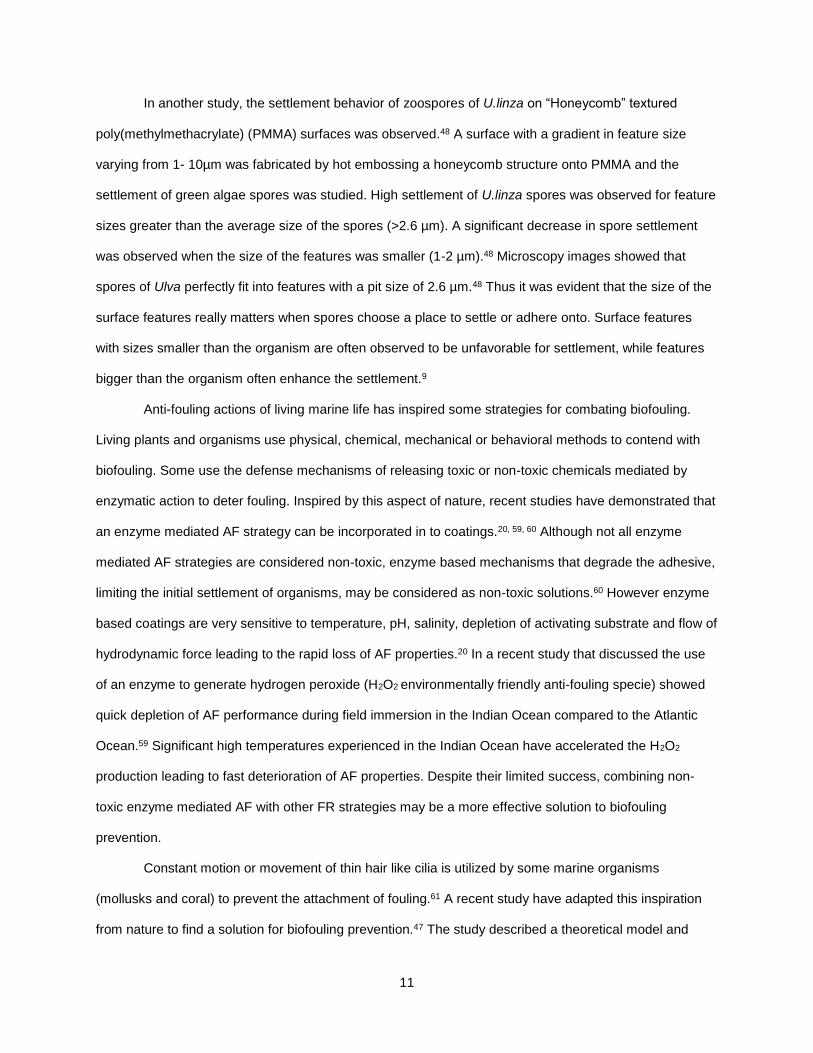
11
In another study, the settlement behavior of zoospores of U.linza on “Honeycomb” textured
poly(methylmethacrylate) (PMMA) surfaces was observed.48 A surface with a gradient in feature size
varying from 1- 10µm was fabricated by hot embossing a honeycomb structure onto PMMA and the
settlement of green algae spores was studied. High settlement of U.linza spores was observed for feature
sizes greater than the average size of the spores (>2.6 µm). A significant decrease in spore settlement
was observed when the size of the features was smaller (1-2 µm).48 Microscopy images showed that
spores of Ulva perfectly fit into features with a pit size of 2.6 µm.48 Thus it was evident that the size of the
surface features really matters when spores choose a place to settle or adhere onto. Surface features
with sizes smaller than the organism are often observed to be unfavorable for settlement, while features
bigger than the organism often enhance the settlement.9
Anti-fouling actions of living marine life has inspired some strategies for combating biofouling.
Living plants and organisms use physical, chemical, mechanical or behavioral methods to contend with
biofouling. Some use the defense mechanisms of releasing toxic or non-toxic chemicals mediated by
enzymatic action to deter fouling. Inspired by this aspect of nature, recent studies have demonstrated that
an enzyme mediated AF strategy can be incorporated in to coatings.20, 59, 60 Although not all enzyme
mediated AF strategies are considered non-toxic, enzyme based mechanisms that degrade the adhesive,
limiting the initial settlement of organisms, may be considered as non-toxic solutions.60 However enzyme
based coatings are very sensitive to temperature, pH, salinity, depletion of activating substrate and flow of
hydrodynamic force leading to the rapid loss of AF properties.20 In a recent study that discussed the use
of an enzyme to generate hydrogen peroxide (H2O2 environmentally friendly anti-fouling specie) showed
quick depletion of AF performance during field immersion in the Indian Ocean compared to the Atlantic
Ocean.59 Significant high temperatures experienced in the Indian Ocean have accelerated the H2O2
production leading to fast deterioration of AF properties. Despite their limited success, combining non-
toxic enzyme mediated AF with other FR strategies may be a more effective solution to biofouling
prevention.
Constant motion or movement of thin hair like cilia is utilized by some marine organisms
(mollusks and coral) to prevent the attachment of fouling.61 A recent study have adapted this inspiration
from nature to find a solution for biofouling prevention.47 The study described a theoretical model and
12
computational simulations investigating the ability of actuated artificial cilia to repel adhesive particles due
to an oscillating shear force (Figure 1.5).47 Modeling the oscillating motion of the artificial cilia in a flow
channel allowed for a demonstration that the flow-driven motion of cilia was able to repel adhesive
particles. In the marine environment the movement of cilia can be induced by hydrodynamic flow.
Findings from this study may lead to bio-inspired, self-cleaning surfaces that repel micro-debris and
micro-biological organisms.
Figure 1.5. Activated, artificial cilia repelling small adhesive particles similar to the process of live cilia preventing biofouling. Reproduced from reference 47
Slippery liquid infused porous surface (SLIPS) inspired by the slippery surface of pitcher plants
has shown success as a non-toxic fouling resistant and release surface.62 SLIPS are fabricated by
infusing a liquid in to a porous mesh with similar surface energy allowing the formation of a highly smooth,
dynamic, and liquid-like surface.45 The infused liquid is immiscible with a variety of liquids allowing
omniphobicity. In laboratory studies SLIPS have no toxicity concerns and have extremely low biofilm
attachment, outperforming poly(tetrafluoroethylene) (PTFE), nanostructured superhydrophobic, and PEG
modified surfaces.62 Complexity in fabrication, and tailoring towards multiple substrates are concerns for
future commercial viability of SLIPS.
Superhydrophobic surfaces inspired by the Lotus leaf effect are also investigated as a potential
solution to controlling biofouling. Superhydrophobic coatings are prepared by combining micro/nano-scale
roughness with low surface energy surface which allow >150° water contact angles leading to water
repellence. Superhydrophobicity is a physical phenomenon due to fewer contact points and trapped air-
pockets resulted from surface roughness. This state is commonly known as the Cassie-Baxter state.63
Anti-fouling performance of superhydrophobic surfaces have been studied although some results suggest
a decrease in fouling settlement while some show increased settlement over time.64-66 The observed
trends in fouling settlement is attributed to the size scale of surface features and loss of
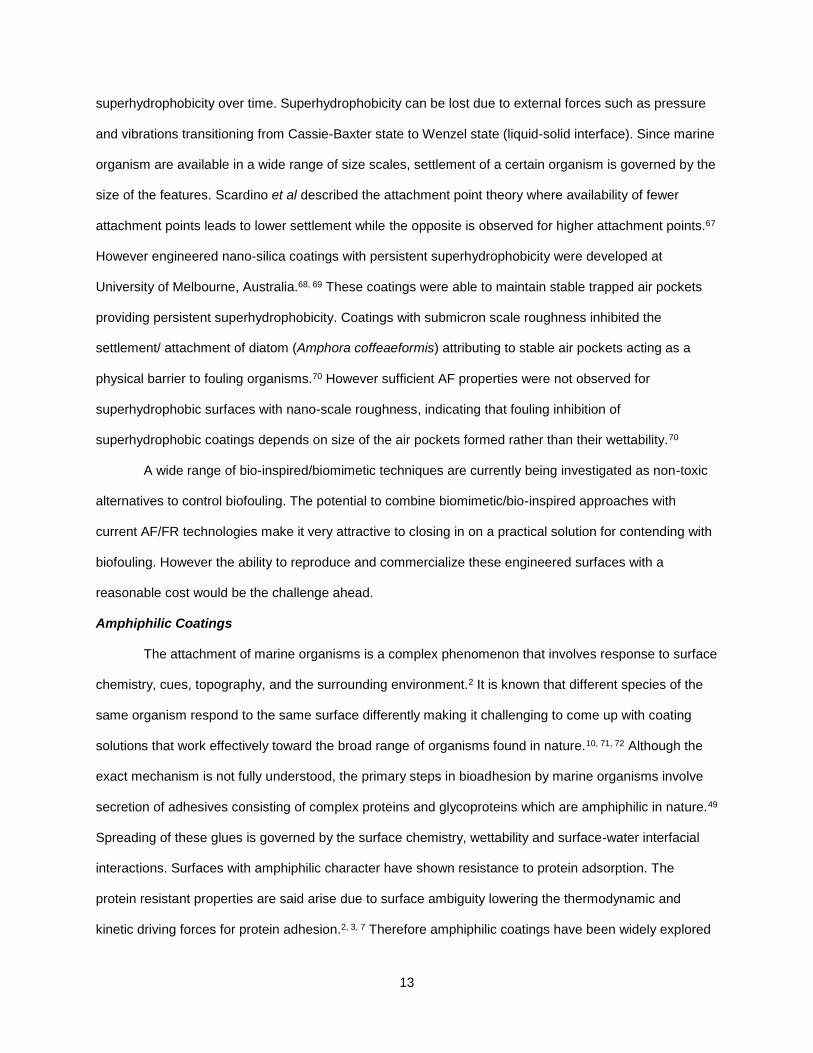
13
superhydrophobicity over time. Superhydrophobicity can be lost due to external forces such as pressure
and vibrations transitioning from Cassie-Baxter state to Wenzel state (liquid-solid interface). Since marine
organism are available in a wide range of size scales, settlement of a certain organism is governed by the
size of the features. Scardino et al described the attachment point theory where availability of fewer
attachment points leads to lower settlement while the opposite is observed for higher attachment points.67
However engineered nano-silica coatings with persistent superhydrophobicity were developed at
University of Melbourne, Australia.68, 69 These coatings were able to maintain stable trapped air pockets
providing persistent superhydrophobicity. Coatings with submicron scale roughness inhibited the
settlement/ attachment of diatom (Amphora coffeaeformis) attributing to stable air pockets acting as a
physical barrier to fouling organisms.70 However sufficient AF properties were not observed for
superhydrophobic surfaces with nano-scale roughness, indicating that fouling inhibition of
superhydrophobic coatings depends on size of the air pockets formed rather than their wettability.70
A wide range of bio-inspired/biomimetic techniques are currently being investigated as non-toxic
alternatives to control biofouling. The potential to combine biomimetic/bio-inspired approaches with
current AF/FR technologies make it very attractive to closing in on a practical solution for contending with
biofouling. However the ability to reproduce and commercialize these engineered surfaces with a
reasonable cost would be the challenge ahead.
Amphiphilic Coatings
The attachment of marine organisms is a complex phenomenon that involves response to surface
chemistry, cues, topography, and the surrounding environment.2 It is known that different species of the
same organism respond to the same surface differently making it challenging to come up with coating
solutions that work effectively toward the broad range of organisms found in nature.10, 71, 72 Although the
exact mechanism is not fully understood, the primary steps in bioadhesion by marine organisms involve
secretion of adhesives consisting of complex proteins and glycoproteins which are amphiphilic in nature.49
Spreading of these glues is governed by the surface chemistry, wettability and surface-water interfacial
interactions. Surfaces with amphiphilic character have shown resistance to protein adsorption. The
protein resistant properties are said arise due to surface ambiguity lowering the thermodynamic and
kinetic driving forces for protein adhesion.2, 3, 7 Therefore amphiphilic coatings have been widely explored
14
recently as a non-toxic solution to combat biofouling by discouraging fouling attachment and promote
effective fouling release.
A first amphiphilic coating system with surface ambiguity geared towards marine AF was reported
in 2004.73 Complex surfaces with hydrophobic and hydrophilic domains were prepared by combining
hyperbranched fluoropolymer (HBFP) and polyethylene glycol (PEG), where surface compositions were
tuned by the relative concentration of the two polymer components.73 When the coatings were exposed to
artificial seawater, surface reconstruction was observed which was attributed to the possible swelling of
PEG domains providing a micro/nano scale heterogeneous surface.73 In another study HBFP-PEG
coatings showed reduced adhesion of protein lipopolysaccharide and spores of Ulva.74 During this study,
the coating with 45% of the PEG component provided the best FR properties towards U. linza
sporelings.74 A full scale study was conducted for HBFP-PEG coatings to demonstrate composition
tenability, mechanical performance, and anti-fouling properties. These coatings resisted barnacle cyprid
settlement, showed 2-3 fold better removal of diatoms (compared PDMS) yet green algae (U.linza)
adhered strongly.75 A recent study incorporating PDMS into the coating system still provided nano-
complexity and 60% more resistance to protein adsorption compared commercial control.76
Mechanically robust non-toxic AF/FR coating systems were developed by having a surface active
block copolymer (SABC) layer sprayed (or blended in) onto a poly(styrene-block-ethylene-random-
butylene)-block-poly(styrene) (SEBS) thermoplastic elastomer.72, 77-80 Several amphiphilic coatings were
reported based on this coating system which allow to simply modify the surface active polymer layer for
tuning surface morphology which in turn affects FR properties. Two species of algae U.linza and N.
incerta (diatom) having opposite adhesion preferences displayed weak adhesion to coatings with
amphiphilic SABC modified through grafting ethoxylated-fluoroalkyl side chains compared to SABC with
either hydrophilic or hydrophobic side chains alone.77 Diatoms adhered strongly to surfaces with
hydrophobic fluorinated side chain grafted SABC, whereas U. linza showed strong adhesion to
hydrophilic PEG side chain grafted SABC.72 Atom transfer radical polymerization (ATRP) allows the
control over the composition of SABC synthesis.80 Compositional variation of amphiphilic SABC on AF/FR
properties were studied.80 The study relieved that increasing PEG composition of the SABC greatly
reduced the settlement of U. linza.80 The compositions of SABCs were tuned by changing the density of

15
the fluoroalkyl and PEG side chains to demonstrate the tenability of FR properties.81 Figure 1.6 shows the
trends observed in U.linza spore settlement and sporeling removal with respect to compositional
variations in SABC. Reduced settlement density of U.linza spores and easy removal of sporelings were
observed with increasing density of PEG side chains. Also diatoms with opposite adhesion behavior to
U.linza also showed a similar trend with increasing PEG side chain density. Surface characteristics of the
amphiphilic SABC-SBES coatings were studied thoroughly using several surface analysis techniques to
understand the surface morphology, rearrangement and wettability which intern affect the AF/FR
behavior.78, 80, 82 Another study was conducted using a thermoplastic base layer with low (almost similar to
PDMS) and high young’s modulus while having the same amphiphilic SABC layer.79 Having a lower
modulus base layer displayed higher fouling release of grown sporelings of Ulva exhibiting effect of
modulus on release of adhered marine organisms.79
Figure 1.6. Left: settlement densities of spores of Ulva on SABCs. Right: percentage removal of sporeling biomass from SABCs. Reproduced from reference 81
In more recent developments, blending the SABC with the thermoplastic base layer were
investigated. During this approach, long and short chain fluoroalkyl side chain were studies for their ability
to self-stratify to the surface bringing along the hydrophilic side chains providing an amphiphilic surface.
In order to match similar FR performance to previous system (where SABC was sprayed on to SBES),
SABC with longer fluoroalkyl side chain was needed.83 Due to the relatively high cost and the risk
associated with environmental resistance of fluorinated materials (compared to PDMS), fluorine-free
amphiphilic SABC based coatings were also developed by replacing fluoroalkyl groups with PDMS.84, 85
Similar fouling resistance/release performance trends were observed for fluorine-free amphiphilic
coatings compared to their fluorine containing counter parts. 84, 85 Changing the length of the hydrophilic
16
PEG segment also affected the AF and FR properties of SABCs.86 Longer PEG segments improved AF
and FR of SABCs towards both algae N. incerta and U.linza.86 SABCs modified with amphiphilic
segments with non-natural oligopeptides was also reported.87 The sequence of non-natural amino acid
arrangement can result in variety of functionalities and polarities which can be used for optimization of AF
and FR properties of coatings.87 Several different sequences of non-natural peptides were synthesized
and attached to the SABC via thiol-ene click reaction and the FR and AF behavior was studied.
Interestingly, peptide sequences with large side groups that sterically hinder hydrogen bond donating
amides significantly reduced the settlement of U. linza.87 The coatings systems based on the SABC and
thermoplastic base layer are a very attractive approach given the fact that surface properties and the
modulus can be tuned independently. On the other hand it only requires small amount of the SABC as it
is applied as a thin layer thus meeting the criterion for cost effectiveness.
Martinelli et al. reported PDMS and amphiphilic acrylic copolymer blends. They synthesized an
array of amphiphilic copolymer compositions consisting of varying amounts of poly(ethylene glycol)-
fluoroalkyl acrylate (PEGFAA) and polysiloxane methacrylate (SiMA).88 The amphiphilic copolymer was
then blended at various proportions with a PDMS matrix to study the effect of copolymer composition and
amphiphilic polymer loading on biofouling. Laboratory bioassays for U.linza showed that a copolymer with
a 10:90 mole ratio of PEGFAA/SiMA was effective in inhibiting settlement and had higher biomass
removal at 1% and 4% concentrations in the PDMS matrix.88 Similarly, barnacles displayed lower critical
removal stress for the same coatings described above.88 Atomic force microscopy (AFM) showed that the
coatings had nano-scale heterogeneity attributed to their amphiphilic nature. Also the coatings with the
best performance at laboratory assays displayed comparable FR performance to Intersleek® 700
(commercial FR coating).88
An amphiphilic coating system comprised of a silanol-terminated polydimethylsiloxane, a silanol-
terminated polytrifluorpropylmethylsiloxane (CF3-PDMS), 2-(methoxy(polyethyleneoxy)propyl)-
trimethoxysilane (TMS-PEG), methyltriacetoxysilane and hexamethyldisilazane-treated fumed silica was
formulated and studied for FR performance using high-throughput methods.89 The study suggested that
the FR properties towards bacteria (C. lytica and H. pacifica) and barnacles were improved for coatings
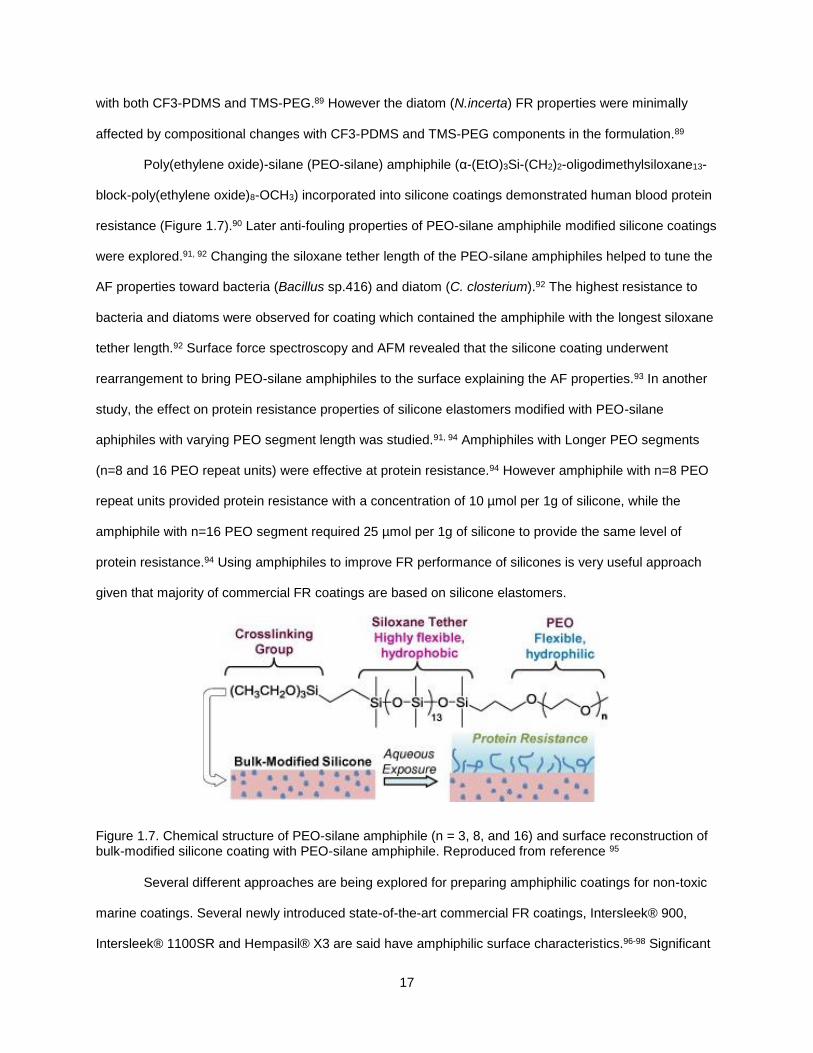
17
with both CF3-PDMS and TMS-PEG.89 However the diatom (N.incerta) FR properties were minimally
affected by compositional changes with CF3-PDMS and TMS-PEG components in the formulation.89
Poly(ethylene oxide)-silane (PEO-silane) amphiphile (α-(EtO)3Si-(CH2)2-oligodimethylsiloxane13-
block-poly(ethylene oxide)8-OCH3) incorporated into silicone coatings demonstrated human blood protein
resistance (Figure 1.7).90 Later anti-fouling properties of PEO-silane amphiphile modified silicone coatings
were explored.91, 92 Changing the siloxane tether length of the PEO-silane amphiphiles helped to tune the
AF properties toward bacteria (Bacillus sp.416) and diatom (C. closterium).92 The highest resistance to
bacteria and diatoms were observed for coating which contained the amphiphile with the longest siloxane
tether length.92 Surface force spectroscopy and AFM revealed that the silicone coating underwent
rearrangement to bring PEO-silane amphiphiles to the surface explaining the AF properties.93 In another
study, the effect on protein resistance properties of silicone elastomers modified with PEO-silane
aphiphiles with varying PEO segment length was studied.91, 94 Amphiphiles with Longer PEO segments
(n=8 and 16 PEO repeat units) were effective at protein resistance.94 However amphiphile with n=8 PEO
repeat units provided protein resistance with a concentration of 10 µmol per 1g of silicone, while the
amphiphile with n=16 PEO segment required 25 µmol per 1g of silicone to provide the same level of
protein resistance.94 Using amphiphiles to improve FR performance of silicones is very useful approach
given that majority of commercial FR coatings are based on silicone elastomers.
Figure 1.7. Chemical structure of PEO-silane amphiphile (n = 3, 8, and 16) and surface reconstruction of bulk-modified silicone coating with PEO-silane amphiphile. Reproduced from reference 95
Several different approaches are being explored for preparing amphiphilic coatings for non-toxic
marine coatings. Several newly introduced state-of-the-art commercial FR coatings, Intersleek® 900,
Intersleek® 1100SR and Hempasil® X3 are said have amphiphilic surface characteristics.96-98 Significant
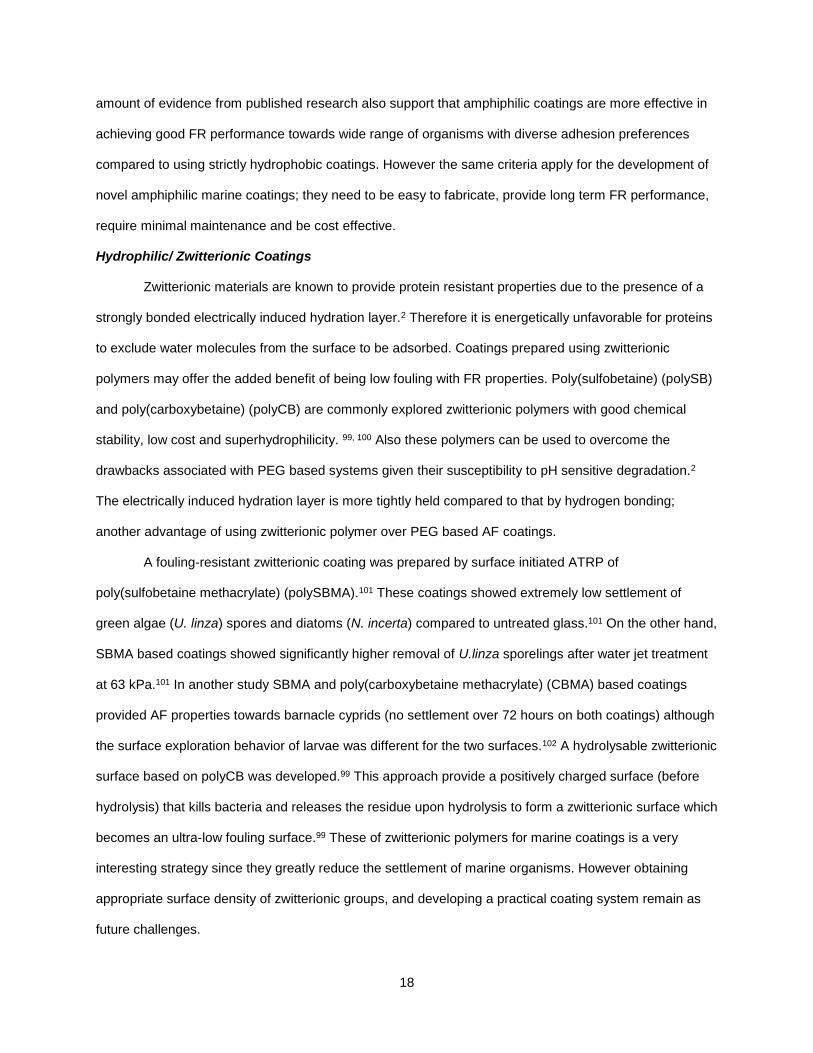
18
amount of evidence from published research also support that amphiphilic coatings are more effective in
achieving good FR performance towards wide range of organisms with diverse adhesion preferences
compared to using strictly hydrophobic coatings. However the same criteria apply for the development of
novel amphiphilic marine coatings; they need to be easy to fabricate, provide long term FR performance,
require minimal maintenance and be cost effective.
Hydrophilic/ Zwitterionic Coatings
Zwitterionic materials are known to provide protein resistant properties due to the presence of a
strongly bonded electrically induced hydration layer.2 Therefore it is energetically unfavorable for proteins
to exclude water molecules from the surface to be adsorbed. Coatings prepared using zwitterionic
polymers may offer the added benefit of being low fouling with FR properties. Poly(sulfobetaine) (polySB)
and poly(carboxybetaine) (polyCB) are commonly explored zwitterionic polymers with good chemical
stability, low cost and superhydrophilicity. 99, 100 Also these polymers can be used to overcome the
drawbacks associated with PEG based systems given their susceptibility to pH sensitive degradation.2
The electrically induced hydration layer is more tightly held compared to that by hydrogen bonding;
another advantage of using zwitterionic polymer over PEG based AF coatings.
A fouling-resistant zwitterionic coating was prepared by surface initiated ATRP of
poly(sulfobetaine methacrylate) (polySBMA).101 These coatings showed extremely low settlement of
green algae (U. linza) spores and diatoms (N. incerta) compared to untreated glass.101 On the other hand,
SBMA based coatings showed significantly higher removal of U.linza sporelings after water jet treatment
at 63 kPa.101 In another study SBMA and poly(carboxybetaine methacrylate) (CBMA) based coatings
provided AF properties towards barnacle cyprids (no settlement over 72 hours on both coatings) although
the surface exploration behavior of larvae was different for the two surfaces.102 A hydrolysable zwitterionic
surface based on polyCB was developed.99 This approach provide a positively charged surface (before
hydrolysis) that kills bacteria and releases the residue upon hydrolysis to form a zwitterionic surface which
becomes an ultra-low fouling surface.99 These of zwitterionic polymers for marine coatings is a very
interesting strategy since they greatly reduce the settlement of marine organisms. However obtaining
appropriate surface density of zwitterionic groups, and developing a practical coating system remain as
future challenges.
19
Research Scope and Purpose
The purpose of this research is to modify the SiPU coating system to achieve improved FR
performance through tailoring the surface properties. Ideally the modifications considered should not
compromise the mechanical durability of the coating system while having comparable or better FR
properties over leading commercial FR standards. This work also hopes to demonstrate that the SiPU
coating system is a highly tunable and practical marine coating system that is able to evolve along with
improving technology in non-toxic marine coatings research while addressing the drawbacks of silicone
elastomer based FR standards.
Preliminary work has been conducted to show improvements to the SiPU coating system with
intentions to improve FR properties for broad range of marine organisms. Initial attempts to formulate
amphiphilic siloxane-polyurethane (AmSiPU) coatings was reported in 2012.38 Bodkhe et al. prepared two
types of amphiphilic siloxane-polyurethane coatings; one AmSiPU system was developed using an
amphiphilic carboxylic acid functionalized PDMS (with amine terminal groups) and the other using a
PDMS with PEO side chains.38, 103 Both systems were prepared based on the concept of the self-stratified
SiPU system. Surface characterization using contact angle measurements, AFM, confocal Raman, and
ATR-FTIR suggested that the coating surfaces demonstrated amphiphilic character. When these coatings
were tested against biological laboratory assays for FR properties, AmSiPU coatings with acid
functionalized PDMS showed excellent FR of diatoms (N. incerta) although critical removal for barnacles
were very high (strong adhesion of barnacles).38 In the case of PEG modified AmSiPU coatings, FR
properties of green algae (U. linza) was compromised while improved FR properties towards diatoms (N.
incerta) compared to first generation SiPU coatings without hydrophilic groups.74 In a similar study, using
a zwitterionic SBMA-PDMS-SBMA triblock copolymer provided good FR properties for diatoms,
comparable to Intersleek® 900, yet sporelings of Ulva adhered strongly showing impaired FR.104 These
previous attempts to develop AmSiPU coating systems show that achieving an appropriate balance of
hydrophilic vs. hydrophobic moieties is the key to obtaining effective FR surfaces with FR performance for
a broad range of organisms. In order to overcome the shortcomings of the previous studies, surface
properties of SiPU coatings needed to be optimized. Thus it led to the work discussed in this dissertation
considering various approaches to surface modify SiPU coatings for improved FR performance.
20
During this research, several approaches were considered to modify the SiPU coatings. The
effects on FR performance by incorporating a small amount of phenyl-methyl silicone oil into SiPU
coatings were investigated. The mobility of the free silicone oil should provide lubricity to the coating
water interface, weakening the attachment of marine organisms, thus improving FR properties. Siloxane-
polyurethane coatings with phenyl modified siloxane resins were investigated to understand the effects of
phenyl functionality on surface properties and FR performance of SiPU. Field immersion trials were
conducted for selected silicone oil modified SiPU coatings. Fouling release properties of coatings
prepared by blending amphiphilic acid functional PDMS and PDMS resin were explored with varying
compositions. This approach aimed at reducing the hydrophilic acid groups on the coating surface with
the intention to improve FR properties towards barnacles. Novel AmSiPU coatings were developed based
on amphiphilic polyisocyanate pre-polymers. The coatings were also tested for FR properties along with
several commercial standards expecting broad spectrum FR properties. Initial attempts to develop highly
hydrated SiPU coatings were also investigated. The presence of a hydration layer may provide improved
AF and FR properties to SiPU coatings. Fouling release properties of coatings were evaluated using
laboratory biological assays and select coatings were also tested in field immersion trials. Surface
characteristics of the SiPU coatings were evaluated using a variety of techniques such as contact angle
measurements, AFM, X-ray photoelectron spectroscopy, and ATR-FTIR.
References
1. Yebra, D. M.; Kiil, S. K.; Dam-Johansen, K., Antifouling Technology—Past, Present and Future Steps Towards Efficientand Environmentally Friendly Antifouling Coatings. Progress in Organic Coatings 2004, 50 (2), 75-104.
2. Callow, J. A.; Callow, M. E., Trends in the Development of Environmentally Friendly Fouling-resistant Marine Coatings. Nat Commun 2011, 2, 244.
3. Lejars, M.; Margaillan, A.; Bressy, C., Fouling Release Coatings: A Nontoxic Alternative to Biocidal Antifouling Coatings. Chemical Reviews 2012, 112 (8), 4347-4390.
4. Drake, J. M.; Lodge, D. M., Hull Fouling is a Risk Factor for Intercontinental Species Exchange in Aquatic Ecosystems. Aquatic Invasions 2007, 2 (2), 121-131.
5. Davidson, I. C.; McCann, L. D.; Fofonoff, P. W.; Sytsma, M. D.; Ruiz, G. M., The Potential for Hull-mediated Species Transfers by Obsolete Ships on their Final Voyages. Diversity and Distributions 2008, 14 (3), 518-529.
6. Brady, R. F., Jr., Clean Hulls Without Poisons: Devising and Testing Nontoxic Marine Coatings. Journal of Coatings Technology 2000, 72 (900), 45-56.
21
7. Nurioglu, A. G.; Esteves, A. C. C.; de With, G., Non-toxic, Non-biocide-release Antifouling Coatings Based on Molecular Structure Design for Marine Applications. Journal of Materials Chemistry B 2015, 3 (32), 6547-6570.
8. Holm, E. R.; Kavanagh, C. J.; Meyer, A. E.; Wiebe, D.; Nedved, B. T.; Wendt, D.; Smith, C. M.; Hadfield, M. G.; Swain, G.; Wood, C. D.; Truby, K.; Stein, J.; Montemarano, J., Interspecific Variation in Patterns of Adhesion of Marine Fouling to Silicone Surfaces. Biofouling 2006, 22 (4), 233-243.
9. Callow, M. E.; Jennings, A. R.; Brennan, A. B.; Seegert, C. E.; Gibson, A.; Wilson, L.; Feinberg, A.; Baney, R.; Callow, J. A., Microtopographic Cues for Settlement of Zoospores of the Green Fouling Alga Enteromorpha. Biofouling 2002, 18 (3), 229-236.
10. Callow, M. E.; Callow, J. A., Marine Biofouling: A Sticky Problem. Biologist 2002, 49 (1), 10.
11. Chambers, L. D.; Stokes, K. R.; Walsh, F. C.; Wood, R. J. K., Modern Approaches to Marine Antifouling Coatings. Surface and Coatings Technology 2006, 201 (6), 3642-3652.
12. Magin, C. M.; Cooper, S. P.; Brennan, A. B., Non-toxic Antifouling Strategies. Materials Today 2010, 13 (4), 36-44.
13. Zargiel, K. A.; Coogan, J. S.; Swain, G. W., Diatom Community Structure on Commercially Available Ship Hull Coatings. Biofouling 2011, 27 (9), 955-965.
14. Zargiel, K. A.; Swain, G. W., Static vs Dynamic Settlement and Adhesion of Diatoms to Ship Hull Coatings. Biofouling 2013, 1-15.
15. Hunsucker, K. Z.; Koka, A.; Lund, G.; Swain, G., Diatom Community Structure on In-service Cruise Ship Hulls. Biofouling 2014, 30 (9), 1133-1140.
16. Schultz, M. P., Effects of Coating Roughness and Biofouling on Ship Resistance and Powering. Biofouling 2007, 23 (5), 331-341.
17. Schultz, M. P.; Swain, G. W., The Influence of Biofilms on Skin Friction Drag. Biofouling 2000, 15 (1-3), 129-139.
18. Schultz, M. P., Frictional Resistance of Antifouling Coating Systems. Journal of Fluids Engineering 2005, 126 (6), 1039-1047.
19. Schultz, M. P.; Bendick, J. A.; Holm, E. R.; Hertel, W. M., Economic Impact of Biofouling on A Naval Surface Ship. Biofouling 2010, 27 (1), 87-98.
20. Hellio, C.; Yebra, D. M., Advances in Marine Antifouling Coatings and Technologies. Woodhead Publishing Limited: Cambridge, UK, 2009.
21. Konstantinou, I. K.; Albanis, T. A., Worldwide Occurrence and Effects of Antifouling Paint Booster Biocides in the Aquatic Environment: A Review. Environment International 2004, 30 (2), 235-248.
22. Abbott, A.; Abel, P. D.; Arnold, D. W.; Milne, A., Cost–benefit Analysis of the Use Of TBT: The Case for A Treatment Approach. Science of The Total Environment 2000, 258 (1–2), 5-19.
23. Thomas, K. V.; Brooks, S., The Environmental Fate and Effects of Antifouling Paint Biocides. Biofouling 2010, 26 (1), 73-88.
22
24. Baier, R. E., Surface Behaviour of Biomaterials: The Theta Surface for Biocompatibility. Journal of Materials Science: Materials in Medicine 2006, 17 (11), 1057-1062.
25. Dafforn, K. A.; Lewis, J. A.; Johnston, E. L., Antifouling strategies: History and Regulation, Ecological Impacts and Mitigation. Marine Pollution Bulletin 2011, 62 (3), 453-465.
26. Adkins, J. D.; Mera, A. E.; Roe-Short, M. A.; Pawlikowski, G. T.; Brady Jr, R. F., Novel Non-toxic Coatings Designed to Resist Marine Fouling. Progress in Organic Coatings 1996, 29 (1–4), 1-5.
27. Wu, Y.; Huang, Y.; Ma, H., A Facile Method for Permanent and Functional Surface Modification of Poly(dimethylsiloxane). Journal of the American Chemical Society 2007, 129 (23), 7226-7227.
28. Partha, M.; Abdullah, E.; Dean, C. W., Thermoset Siloxane-Urethane Fouling Release Coatings. In Smart Coatings, American Chemical Society: 2007; Vol. 957, pp 61-75.
29. Webster, D. C.; Pieper, R. J.; Ekin, A. Thermoset Siloxane-Urethane Fouling Release Coatings. US 7,989,074 B2, 2011.
30. Ekin, A.; Webster, D. C., Combinatorial and High-Throughput Screening of the Effect of Siloxane Composition on the Surface Properties of Crosslinked Siloxane−Polyurethane Coatings. Journal of Combinatorial Chemistry 2006, 9 (1), 178-188.
31. Ekin, A.; Webster, D. C.; Daniels, J. W.; Stafslien, S. J.; Cassé, F.; Callow, J. A.; Callow, M. E., Synthesis, Formulation, and Characterization of Siloxane–Polyurethane Coatings for Underwater Marine Applications Using Combinatorial High-throughput Experimentation. Journal of Coatings Technology Research 2007, 4 (4), 435-451.
32. Ekin, A. E.; Webster, D. C., Library Synthesis and Characterization of 3-aminopropyl Terminated Poly(dimethylsiloxane)s and Poly(ε-caprolactone)-b-Poly(dimethylsiloxane)s. Journal of Polymer Science Part A: Polymer Chemistry 2006, 44 (16), 4880-4894.
33. Ekin, A.; Webster, D. C., Synthesis and Characterization of Novel Hydroxyalkyl Carbamate and Dihydroxyalkyl Carbamate Terminated Poly(dimethylsiloxane) Oligomers and Their Block Copolymers with Poly(ε-caprolactone). Macromolecules 2006, 39 (25), 8659-8668.
34. Pieper, R. J.; Ekin, A.; Webster, D. C.; Casse, F.; Callow, J. A.; Callow, M. E., A Combinatorial Approach to Study the Effect of Acrylic Polyol Composition on the Properties of Crosslinked Siloxane-Polyurethane Fouling-Release Coatings. Journal of Coatings Technology Research 2007, 4 (4), 453-461.
35. Sommer, S.; Ekin, A.; Webster, D. C.; Stafslien, S. J.; Daniels, J.; VanderWal, L. J.; Thompson, S. E. M.; Callow, M. E.; Callow, J. A., A Preliminary Study on the Properties and Fouling-release Performance of Siloxane-Polyurethane Coatings Prepared from PDMS Macromers. Biofouling 2010, 26 (8), 961-972.
36. Sommer, S. A.; Joseph, B. R.; Fischer, H. D.; Bodkhe, R. B.; Staflien, S. J.; Daniels, J.; Yehle, C.; Webster, D. C., Effect of Pigmentation on Siloxane-Polyurethane Coatings. Journal of Coatings Technology Research 2011, 8 (6), 661-670.
37. Bodkhe, R. B.; Thompson, S. E. M.; Yehle, C.; Cilz, N.; Daniels, J.; Stafslien, S. J.; Callow, M. E.; Callow, J. A.; Webster, D. C., The Effect of Formulation Variables on Fouling-release Performance of Stratified Siloxane-Polyurethane Coatings. Journal of Coatings Technology Research 2012, 9 (3), 235-249.
23
38. Bodkhe, R. B.; Stafslien, S. J.; Cilz, N.; Daniels, J.; Thompson, S. E. M.; Callow, M. E.; Callow, J. A.; Webster, D. C., Polyurethanes with Amphiphilic Surfaces made using Telechelic Functional PDMS Having Orthogonal Acid Functional Groups. Progress in Organic Coatings 2012, 75 (1–2), 38-48.
39. Stafslien, S. J.; Sommer, S.; Webster, D. C.; Bodkhe, R.; Pieper, R.; Daniels, J.; Vander Wal, L.; Callow, M. C.; Callow, J. A.; Ralston, E.; Swain, G.; Brewer, L.; Wendt, D.; Dickinson, G. H.; Lim, C.-S.; Teo, S. L.-M., Comparison of Laboratory and Field Testing Performance Evaluations of Siloxane-Polyurethane Fouling-release Marine Coatings. Biofouling 2016, 32 (8), 949-968.
40. Webster, D. C.; Ekin, A.; Sommer, S. A. Anchored Polysiloxane Modified Polyurethane Coatings and Uses Thereof. US 8,299,200 B2, 2012.
41. Scardino, A. J.; de Nys, R., Mini Review: Biomimetic Models and Bioinspired Surfaces for Fouling Control. Biofouling 2011, 27 (1), 73-86.
42. Emily Ralston and Geoffrey, S., Bioinspiration—The Solution for Biofouling Control? Bioinspiration & Biomimetics 2009, 4 (1), 015007.
43. Genzer, J.; Efimenko, K., Recent Developments in Superhydrophobic Surfaces and Their Relevance to Marine Fouling: A Review. Biofouling 2006, 22 (5), 339-360.
44. Carman, M. L.; Estes, T. G.; Feinberg, A. W.; Schumacher, J. F.; Wilkerson, W.; Wilson, L. H.; Callow, M. E.; Callow, J. A.; Brennan, A. B., Engineered Antifouling Microtopographies – Correlating Wettability with Cell Attachment. Biofouling 2006, 22 (1), 11-21.
45. Wong, T.-S.; Kang, S. H.; Tang, S. K. Y.; Smythe, E. J.; Hatton, B. D.; Grinthal, A.; Aizenberg, J., Bioinspired Self-repairing Slippery Surfaces with Pressure-stable Omniphobicity. Nature 2011, 477 (7365), 443-447.
46. Xiao, L.; Li, J.; Mieszkin, S.; Di Fino, A.; Clare, A. S.; Callow, M. E.; Callow, J. A.; Grunze, M.; Rosenhahn, A.; Levkin, P. A., Slippery Liquid-Infused Porous Surfaces Showing Marine Antibiofouling Properties. ACS Applied Materials & Interfaces 2013, 5 (20), 10074-10080.
47. Balazs, A. C.; Bhattacharya, A.; Tripathi, A.; Shum, H., Designing Bioinspired Artificial Cilia to Regulate Particle–Surface Interactions. The Journal of Physical Chemistry Letters 2014, 5 (10), 1691-1700.
48. Xiao, L.; Thompson, S. E. M.; Röhrig, M.; Callow, M. E.; Callow, J. A.; Grunze, M.; Rosenhahn, A., Hot Embossed Microtopographic Gradients Reveal Morphological Cues That Guide the Settlement of Zoospores. Langmuir 2012, 29 (4), 1093-1099.
49. Cao, X.; Pettitt, M. E.; Wode, F.; Arpa Sancet, M. P.; Fu, J.; Ji, J.; Callow, M. E.; Callow, J. A.; Rosenhahn, A.; Grunze, M., Interaction of Zoospores of the Green Alga Ulva with Bioinspired Micro- and Nanostructured Surfaces Prepared by Polyelectrolyte Layer-by-Layer Self-Assembly. Advanced Functional Materials 2010, 20 (12), 1984-1993.
50. Hoipkemeier-Wilson, L.; Schumacher, J. F.; Carman, M. L.; Gibson, A. L.; Feinberg, A. W.; Callow, M. E.; Finlay, J. A.; Callow, J. A.; Brennan, A. B., Antifouling Potential of Lubricious, Micro-engineered, PDMS Elastomers against Zoospores of the Green Fouling Alga Ulva (Enteromorpha). Biofouling 2004, 20 (1), 53-63.
51. Magin, C. M.; Long, C. J.; Cooper, S. P.; Ista, L. K.; López, G. P.; Brennan, A. B., Engineered Antifouling Microtopographies: The Role of Reynolds Number in A Model that Predicts Attachment of Zoospores of Ulva and Cells of Cobetia Marina. Biofouling 2010, 26 (6), 719-727.
24
52. Schumacher, J. F.; Carman, M. L.; Estes, T. G.; Feinberg, A. W.; Wilson, L. H.; Callow, M. E.; Callow, J. A.; Finlay, J. A.; Brennan, A. B., Engineered Antifouling Microtopographies – Effect of Feature Size, Geometry, and Roughness on Settlement of Zoospores of the Green Alga Ulva. Biofouling 2007, 23 (1), 55-62.
53. Callow, M. E.; Callow, J. A.; Pickett-Heaps, J. D.; Wetherbee, R., Primary Adhesion of Enteromorpha (Chlorophyta, Ulvales) Propagules: Quantitative Settlement Studies and Viedo Microscopy. Journal of Phycology 1997, 33, 938-947.
54. Callow, M. E.; Callow, J. A.; Ista, L. K.; Coleman, S. E.; Nolasco, A. C.; Lopez, G. P., Use of Self Assembled Monolayers of Different Wettabilities to Study Surface Selection and Primary Adhesion Processes Of Green Algae (Enteromorpha) Zoospores. Applied and Enviornmental Microbiology 2000, 66 (8), 3249-3254.
55. Finlay, J. A.; Callow, M. E.; Ista, L. K.; Lopez, G. P.; Callow, J. A., The Influence of Surface Wettability on the Adhesion Strength of Settled Spores of the Green Alga Enteromorpha and the Diatom Amphora. Integrative and Comparative Biology 2002, 42 (6), 1116-1122.
56. Callow, J. A.; Callow, M. E.; Ista, L. K.; Lopez, G.; Chaudhury, M. K., The Influence of Surface Energy on the Wetting Behavior of the Spore Adhesive of Marine Alga Ulva linza. Journal of Royal Society Interface 2005, 2, 319-325.
57. Ederth, T.; Nygren, P.; Pettitt, M. E.; Östblom, M.; Du, C. X.; Broo, K.; Callow, M. E.; Callow, J.; Liedberg, B., Anomalous Settlement Behavior of Ulva linza Zoospores on Cationic Oligopeptide Surfaces. Biofouling 2008, 24 (4), 303-312.
58. Schumacher, J. F.; Aldred, N.; Callow, M. E.; Finlay, J. A.; Callow, J. A.; Clare, A. S.; Brennan, A. B., Species-specific Engineered Antifouling Topographies: Correlations Between the Settlement of Algal Zoospores and Barnacle Cyprids. Biofouling 2007, 23 (5), 307-317.
59. Olsen, S. M.; Kristensen, J. B.; Laursen, B. S.; Pedersen, L. T.; Dam-Johansen, K.; Kiil, S., Antifouling effect of Hydrogen Peroxide Release from Enzymatic Marine Coatings: Exposure Testing Under Equatorial and Mediterranean Conditions. Progress in Organic Coatings 2010, 68 (3), 248-257.
60. Olsen, S. M.; Pedersen, L. T.; Laursen, M. H.; Kiil, S.; Dam-Johansen, K., Enzyme-based Antifouling Coatings: A Review. Biofouling 2007, 23 (5), 369-383.
61. Stafford-Smith, M. G.; Ormond, R. F. G., Sediment-rejection Mechanisms of 42 Species Of Australian Scleractinian Corals. Marine and Freshwater Research 1992, 43 (4), 683-705.
62. Epstein, A. K.; Wong, T.-S.; Belisle, R. A.; Boggs, E. M.; Aizenberg, J., Liquid-infused Structured Surfaces with Exceptional Anti-biofouling Performance. Proceedings of the National Academy of Sciences 2012, 109 (33), 13182-13187.
63. Cassie, A. B. D.; Baxter, S., Wettability of Porous Surfaces. Transactions of the Faraday Society 1944, 40 (0), 546-551.
64. Lewis, H. Z. a. R. L. a. J., Engineering Nanoscale Roughness on Hydrophobic Surface—preliminary Assessment of Fouling Behaviour. Science and Technology of Advanced Materials 2005, 6 (3-4), 236.
65. Scardino, A. J.; Zhang, H.; Cookson, D. J.; Lamb, R. N.; Nys, R. d., The role of nano-roughness in antifouling. Biofouling 2009, 25 (8), 757-767.
25
66. Zhang, X.; Shi, F.; Niu, J.; Jiang, Y.; Wang, Z., Superhydrophobic Surfaces: From Structural Control to Functional Application. Journal of Materials Chemistry 2008, 18 (6), 621-633.
67. Scardino, A. J.; Guenther, J.; de Nys, R., Attachment Point Theory Revisited: the Fouling Response to A Microtextured Matrix. Biofouling 2008, 24 (1), 45-53.
68. Chan, D. Y. C.; Hemayet Uddin, M.; Cho, K. L.; Liaw, I. I.; Lamb, R. N.; Stevens, G. W.; Grieser, F.; Dagastine, R. R., Silica Nano-particle Super-Hydrophobic Surfaces: the Effects of Surface Morphology and Trapped Air Pockets on Hydrodynamic Drainage Forces. Faraday Discussions 2009, 143 (0), 151-168.
69. Cho, K. L.; Liaw, I. I.; Wu, A. H. F.; Lamb, R. N., Influence of Roughness on a Transparent Superhydrophobic Coating. The Journal of Physical Chemistry C 2010, 114 (25), 11228-11233.
70. Wu, A. H. F.; Nakanishi, K.; Cho, K. L.; Lamb, R., Diatom Attachment Inhibition: Limiting Surface Accessibility Through Air Entrapment. Biointerphases 2013, 8 (1), 1-10.
71. Iguerb, O.; Poleunis, C.; Mazéas, F.; Compère, C.; Bertrand, P., Antifouling Properties of Poly(methyl methacrylate) Films Grafted with Poly(ethylene glycol) Monoacrylate Immersed in Seawater. Langmuir 2008, 24 (21), 12272-12281.
72. Krishnan, S.; Wang, N.; Ober, C. K.; Finlay, J. A.; Callow, M. E.; Callow, J. A.; Hexemer, A.; Sohn, K. E.; Kramer, E. J.; Fischer, D. A., Comparison of the Fouling Release Properties of Hydrophobic Fluorinated and Hydrophilic PEGylated Block Copolymer Surfaces: Attachment Strength of the Diatom Navicula and the Green Alga Ulva. Biomacromolecules 2006, 7 (5), 1449-1462.
73. Gudipati, C. S.; Greenlief, C. M.; Johnson, J. A.; Prayongpan, P.; Wooley, K. L., Hyperbranched Fluoropolymer and Linear Poly(ethylene glycol) Based Amphiphilic Crosslinked Networks as Efficient Antifouling Coatings: An Insight into the Surface Compositions, Topographies, and Morphologies. Journal of Polymer Science Part A: Polymer Chemistry 2004, 42 (24), 6193-6208.
74. Gudipati, C. S.; Finlay, J. A.; Callow, J. A.; Callow, M. E.; Wooley, K. L., The Antifouling and Fouling-Release Perfomance of Hyperbranched Fluoropolymer (HBFP)−Poly(ethylene glycol) (PEG) Composite Coatings Evaluated by Adsorption of Biomacromolecules and the Green Fouling Alga Ulva. Langmuir 2005, 21 (7), 3044-3053.
75. Imbesi, P. M.; Finlay, J. A.; Aldred, N.; Eller, M. J.; Felder, S. E.; Pollack, K. A.; Lonnecker, A. T.; Raymond, J. E.; Mackay, M. E.; Schweikert, E. A.; Clare, A. S.; Callow, J. A.; Callow, M. E.; Wooley, K. L., Targeted Surface Nanocomplexity: Two-dimensional Control Over the Composition, Physical Properties and Anti-Biofouling Performance of Hyperbranched Fluoropolymer-Poly(ethylene glycol) Amphiphilic Crosslinked Networks. Polymer Chemistry 2012, 3 (11), 3121-3131.
76. Pollack, K. A.; Imbesi, P. M.; Raymond, J. E.; Wooley, K. L., Hyperbranched Fluoropolymer-Polydimethylsiloxane-Poly(ethylene glycol) Cross-Linked Terpolymer Networks Designed for Marine and Biomedical Applications: Heterogeneous Nontoxic Antibiofouling Surfaces. ACS Applied Materials & Interfaces 2014, 6 (21), 19265-19274.
77. Krishnan, S.; Ayothi, R.; Hexemer, A.; Finlay, J. A.; Sohn, K. E.; Perry, R.; Ober, C. K.; Kramer, E. J.; Callow, M. E.; Callow, J. A.; Fischer, D. A., Anti-Biofouling Properties of Comblike Block Copolymers with Amphiphilic Side Chains. Langmuir 2006, 22 (11), 5075-5086.
26
78. Martinelli, E.; Menghetti, S.; Galli, G.; Glisenti, A.; Krishnan, S.; Paik, M. Y.; Ober, C. K.; Smilgies, D.-M.; Fischer, D. A., Surface Engineering of Styrene/PEGylated-fluoroalkyl Styrene Block Copolymer Thin Films. Journal of Polymer Science Part A: Polymer Chemistry 2009, 47 (1), 267-284.
79. Weinman, C. J.; Finlay, J. A.; Park, D.; Paik, M. Y.; Krishnan, S.; Sundaram, H. S.; Dimitriou, M.; Sohn, K. E.; Callow, M. E.; Callow, J. A.; Handlin, D. L.; Willis, C. L.; Kramer, E. J.; Ober, C. K., ABC Triblock Surface Active Block Copolymer with Grafted Ethoxylated Fluoroalkyl Amphiphilic Side Chains for Marine Antifouling/Fouling-release Applications. Langmuir 2009, 25 (20), 12266-12274.
80. Martinelli, E.; Agostini, S.; Galli, G.; Chiellini, E.; Glisenti, A.; Pettitt, M. E.; Callow, M. E.; Callow, J. A.; Graf, K.; Bartels, F. W., Nanostructured Films of Amphiphilic Fluorinated Block Copolymers for Fouling Release Application. Langmuir 2008, 24 (22), 13138-13147.
81. Park, D.; Weinman, C. J.; Finlay, J. A.; Fletcher, B. R.; Paik, M. Y.; Sundaram, H. S.; Dimitriou, M. D.; Sohn, K. E.; Callow, M. E.; Callow, J. A.; Handlin, D. L.; Willis, C. L.; Fischer, D. A.; Kramer, E. J.; Ober, C. K., Amphiphilic Surface Active Triblock Copolymers with Mixed Hydrophobic and Hydrophilic Side Chains for Tuned Marine Fouling-Release Properties. Langmuir 2010, 26 (12), 9772-9781.
82. Kristalyn, C. B.; Lu, X.; Weinman, C. J.; Ober, C. K.; Kramer, E. J.; Chen, Z., Surface Structures of an Amphiphilic Tri-Block Copolymer in Air and in Water Probed Using Sum Frequency Generation Vibrational Spectroscopy. Langmuir 2010, 26 (13), 11337-11343.
83. Sundaram, H. S.; Cho, Y.; Dimitriou, M. D.; Finlay, J. A.; Cone, G.; Williams, S.; Handlin, D.; Gatto, J.; Callow, M. E.; Callow, J. A.; Kramer, E. J.; Ober, C. K., Fluorinated Amphiphilic Polymers and Their Blends for Fouling-Release Applications: The Benefits of a Triblock Copolymer Surface. ACS Applied Materials & Interfaces 2011, 3 (9), 3366-3374.
84. Sundaram, H. S.; Cho, Y.; Dimitriou, M. D.; Weinman, C. J.; Finlay, J. A.; Cone, G.; Callow, M. E.; Callow, J. A.; Kramer, E. J.; Ober, C. K., Fluorine-free Mixed Amphiphilic Polymers Based on PDMS and PEG Side Chains for Fouling Release Applications. Biofouling 2011, 27 (6), 589-602.
85. Cho, Y.; Sundaram, H. S.; Weinman, C. J.; Paik, M. Y.; Dimitriou, M. D.; Finlay, J. A.; Callow, M. E.; Callow, J. A.; Kramer, E. J.; Ober, C. K., Triblock Copolymers with Grafted Fluorine-Free, Amphiphilic, Non-Ionic Side Chains for Antifouling and Fouling-release Applications. Macromolecules 2011, 44 (12), 4783-4792.
86. Zhou, Z.; Calabrese, D. R.; Taylor, W.; Finlay, J. A.; Callow, M. E.; Callow, J. A.; Fischer, D.; Kramer, E. J.; Ober, C. K., Amphiphilic Triblock Copolymers with Pegylated Hydrocarbon Structures as Environmentally Friendly Marine Antifouling and Fouling-release Coatings. Biofouling 2014, 30 (5), 589-604.
87. Calabrese, D. R.; Wenning, B.; Finlay, J. A.; Callow, M. E.; Callow, J. A.; Fischer, D.; Ober, C. K., Amphiphilic Oligopeptides Grafted to PDMS-based Diblock Copolymers for use in Antifouling and Fouling Release Coatings. Polymers for Advanced Technologies 2015, 26 (7), 829-836.
88. Martinelli, E.; Sarvothaman, M. K.; Galli, G.; Pettitt, M. E.; Callow, M. E.; Callow, J. A.; Conlan, S. L.; Clare, A. S.; Sugiharto, A. B.; Davies, C.; Williams, D., Poly(dimethyl siloxane) (PDMS) Network Blends of Amphiphilic Acrylic Copolymers with poly(ethylene glycol)-fluoroalkyl side chains for Fouling-release Coatings. II. Laboratory Assays and Field Immersion Trials. Biofouling 2012, 28 (6), 571-582.
27
89. Stafslien, S. J.; Christianson, D.; Daniels, J.; VanderWal, L.; Chernykh, A.; Chisholm, B. J., Combinatorial Materials Research Applied to the Development of New Surface Coatings XVI: Fouling-release Properties of Amphiphilic Polysiloxane Coatings. Biofouling 2015, 31 (2), 135-149.
90. Hawkins, M. L.; Grunlan, M. A., The Protein Resistance of Silicones Prepared with a PEO-silane Amphiphile. Journal of Materials Chemistry 2012, 22 (37), 19540-19546.
91. Rufin, M. A.; Gruetzner, J. A.; Hurley, M. J.; Hawkins, M. L.; Raymond, E. S.; Raymond, J. E.; Grunlan, M. A., Enhancing the Protein Resistance of Silicone via Surface-restructuring PEO-silane Amphiphiles with Variable PEO Length. Journal of Materials Chemistry B 2015, 3 (14), 2816-2825.
92. Hawkins, M. L.; Faÿ, F.; Réhel, K.; Linossier, I.; Grunlan, M. A., Bacteria and Diatom Resistance of Silicones Modified with PEO-silane Amphiphiles. Biofouling 2014, 30 (2), 247-258.
93. Hawkins, M. L.; Rufin, M. A.; Raymond, J. E.; Grunlan, M. A., Direct Observation of the Nanocomplex Surface Reorganization of Antifouling Silicones Containing a Highly Mobile PEO-silane Amphiphile. Journal of Materials Chemistry B 2014, 2 (34), 5689-5697.
94. Rufin, M. A.; Barry, M. E.; Adair, P. A.; Hawkins, M. L.; Raymond, J. E.; Grunlan, M. A., Protein Resistance Efficacy of PEO-silane Amphiphiles: Dependence on PEO-segment Length and Concentration. Acta Biomaterialia 2016, 247-252.
95. Rufin, M. A.; Barry, M. E.; Adair, P. A.; Hawkins, M. L.; Raymond, J. E.; Grunlan, M. A., Protein Resistance Efficacy of PEO-silane Amphiphiles: Dependence on PEO-segment Length and Concentration. Acta Biomaterialia.
96. Williams, D. N.; Stark, D. A.; Lee, A. J.; Davies, C. M. Antifouling Coating Composition Based on Curable Polyorganosiloxane Polyoxyalkylene Copolymers. US 20100137529 A1, 2013.
97. Thorlaksen, P. C. W.; Blom, A.; Bork, U. Novel Fouling Control Coating Compositions. US20120264847 A1, 2012.
98. Thorlaksen, P. C. W.; Blom, A.; Yebra, D. M. Fouling Control Coating Compositions. US20140135422 A1, 2014.
99. Jiang, S.; Cao, Z., Ultralow-Fouling, Functionalizable, and Hydrolyzable Zwitterionic Materials and Their Derivatives for Biological Applications. Advanced Materials 2010, 22 (9), 920-932.
100. Wu, C.-J.; Huang, C.-J.; Jiang, S.; Sheng, Y.-J.; Tsao, H.-K., Superhydrophilicity and Spontaneous Spreading on Zwitterionic Surfaces: Carboxybetaine and Sulfobetaine. RSC Advances 2016, 6 (30), 24827-24834.
101. Zhang, Z.; Finlay, J. A.; Wang, L.; Gao, Y.; Callow, J. A.; Callow, M. E.; Jiang, S., Polysulfobetaine-Grafted Surfaces as Environmentally Benign Ultralow Fouling Marine Coatings. Langmuir 2009, 25 (23), 13516-13521.
102. Aldred, N.; Li, G.; Gao, Y.; Clare, A. S.; Jiang, S., Modulation of Barnacle (Balanus Amphitrite Darwin) Cyprid Settlement Behavior by Sulfobetaine and Carboxybetaine Methacrylate Polymer Coatings. Biofouling 2010, 26 (6), 673-683.
103. Webster, D. C.; Bodkhe, R. B. Functionalized Silicones with Polyalkylene Oxide Side Chains. US 9,169,359 B2, 2015, 2015.
28
104. Bodkhe, R. B.; Stafslien, S. J.; Daniels, J.; Cilz, N.; Muelhberg, A. J.; Thompson, S. E. M.; Callow, M. E.; Callow, J. A.; Webster, D. C., Zwitterionic Siloxane-Polyurethane Fouling-release Coatings. Progress in Organic Coatings 2015, 78, 369-380.
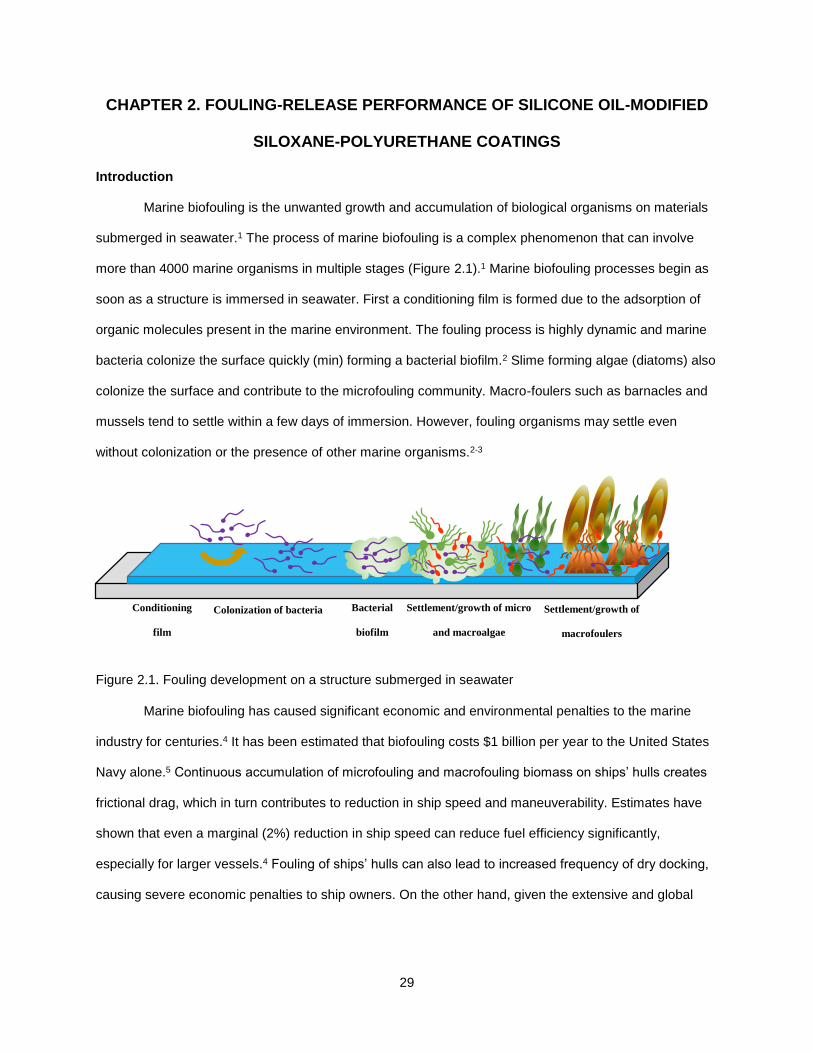
29
CHAPTER 2. FOULING-RELEASE PERFORMANCE OF SILICONE OIL-MODIFIED
SILOXANE-POLYURETHANE COATINGS
Introduction
Marine biofouling is the unwanted growth and accumulation of biological organisms on materials
submerged in seawater.1 The process of marine biofouling is a complex phenomenon that can involve
more than 4000 marine organisms in multiple stages (Figure 2.1).1 Marine biofouling processes begin as
soon as a structure is immersed in seawater. First a conditioning film is formed due to the adsorption of
organic molecules present in the marine environment. The fouling process is highly dynamic and marine
bacteria colonize the surface quickly (min) forming a bacterial biofilm.2 Slime forming algae (diatoms) also
colonize the surface and contribute to the microfouling community. Macro-foulers such as barnacles and
mussels tend to settle within a few days of immersion. However, fouling organisms may settle even
without colonization or the presence of other marine organisms.2-3
Figure 2.1. Fouling development on a structure submerged in seawater
Marine biofouling has caused significant economic and environmental penalties to the marine
industry for centuries.4 It has been estimated that biofouling costs $1 billion per year to the United States
Navy alone.5 Continuous accumulation of microfouling and macrofouling biomass on ships’ hulls creates
frictional drag, which in turn contributes to reduction in ship speed and maneuverability. Estimates have
shown that even a marginal (2%) reduction in ship speed can reduce fuel efficiency significantly,
especially for larger vessels.4 Fouling of ships’ hulls can also lead to increased frequency of dry docking,
causing severe economic penalties to ship owners. On the other hand, given the extensive and global
Conditioning
film
Colonization of bacteria Bacterial
biofilm
Settlement/growth of micro
and macroalgae
Settlement/growth of
macrofoulers
30
nature of shipping routes, biofouling also poses an environmental threat through the introduction of non-
native species.6
Historically, ships’ hulls made from copper alloys and lead sheaths were used to contend with
biofouling.4, 7 Even though they were very effective antifouling strategies, issues with corrosion of iron
hulls and declining availability of resources limited their use in the post medieval era. Thus, antifouling
paints with active biocides were investigated as a possible solution in the 1900s.7 Biofouling was
managed well with the introduction of tributyl tin (TBT) based self-polishing copolymer coatings in the
1970s until their toxicity to non-targeted marine organisms was discovered several decades later resulting
in restrictions of their use in France.3, 8 In 2003, the use of TBT in antifouling coatings was largely banned
by an International Maritime Organization (IMO) treaty due to the harmful effects of TBT to aquatic
ecosystems.3
Today antifouling coatings using copper oxide and other organic biocides contribute to the
majority of ship hull paints used. These antifouling coatings with active biocides function by the release of
toxic substances, which are able to kill or deter settlement of organisms that come in contact with or near
the surface. These coatings allow ships to maintain clean hulls for as long as 5-10 years.3 Fouling-release
coatings were introduced in 1961 as a non-toxic alternative to biocide-based antifouling coatings,
although they became a more widely mentioned topic between 1990 to 2000.1, 3 Fouling-release coatings
have no harmful chemical interactions and do not necessarily inhibit fouling, rather they provide a surface
with significantly reduced adhesion strength to organisms.1, 3, 4 Ideally, fouling-release surfaces achieve
‘self-cleaning’ due to the hydrodynamic forces of the vessel moving through the water.
Although antifouling coatings with biocides are largely used to contend with biofouling, fouling-
release coatings have remained of special interest due to the ever-increasing desire to eliminate the use
of biocide-containing paints. Polydimethyl siloxane (PDMS) elastomers are a commonly used system in
most fouling-release coatings and contribute to fouling-release properties due to their low surface energy
and high elasticity.1, 7 However, PDMS has poor mechanical durability and low adhesion to substrates
and primers making it difficult to use in marine coatings.9, 10 Siloxane-polyurethane (SiPU) coatings
invented in the Webster research group, on the other hand, have combined the mechanical and adhesion
properties of polyurethanes and the fouling-release performance of siloxane.11, 12 Siloxane-polyurethane
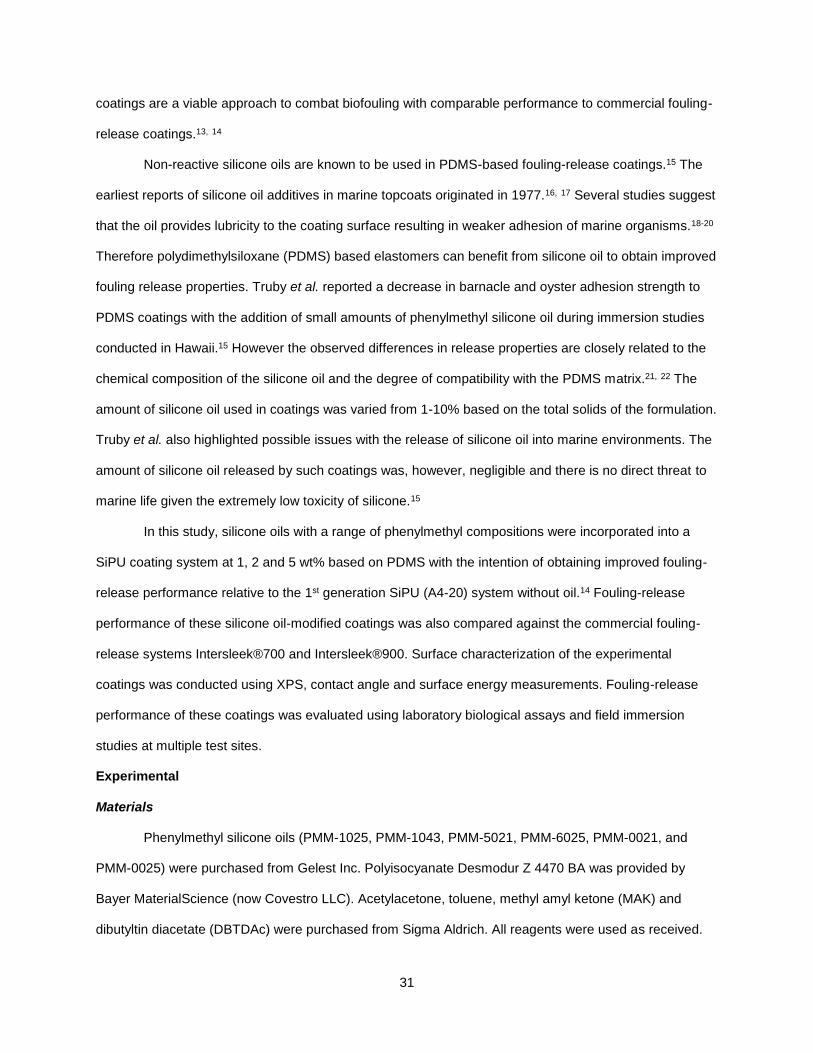
31
coatings are a viable approach to combat biofouling with comparable performance to commercial fouling-
release coatings.13, 14
Non-reactive silicone oils are known to be used in PDMS-based fouling-release coatings.15 The
earliest reports of silicone oil additives in marine topcoats originated in 1977.16, 17 Several studies suggest
that the oil provides lubricity to the coating surface resulting in weaker adhesion of marine organisms.18-20
Therefore polydimethylsiloxane (PDMS) based elastomers can benefit from silicone oil to obtain improved
fouling release properties. Truby et al. reported a decrease in barnacle and oyster adhesion strength to
PDMS coatings with the addition of small amounts of phenylmethyl silicone oil during immersion studies
conducted in Hawaii.15 However the observed differences in release properties are closely related to the
chemical composition of the silicone oil and the degree of compatibility with the PDMS matrix.21, 22 The
amount of silicone oil used in coatings was varied from 1-10% based on the total solids of the formulation.
Truby et al. also highlighted possible issues with the release of silicone oil into marine environments. The
amount of silicone oil released by such coatings was, however, negligible and there is no direct threat to
marine life given the extremely low toxicity of silicone.15
In this study, silicone oils with a range of phenylmethyl compositions were incorporated into a
SiPU coating system at 1, 2 and 5 wt% based on PDMS with the intention of obtaining improved fouling-
release performance relative to the 1st generation SiPU (A4-20) system without oil.14 Fouling-release
performance of these silicone oil-modified coatings was also compared against the commercial fouling-
release systems Intersleek®700 and Intersleek®900. Surface characterization of the experimental
coatings was conducted using XPS, contact angle and surface energy measurements. Fouling-release
performance of these coatings was evaluated using laboratory biological assays and field immersion
studies at multiple test sites.
Experimental
Materials
Phenylmethyl silicone oils (PMM-1025, PMM-1043, PMM-5021, PMM-6025, PMM-0021, and
PMM-0025) were purchased from Gelest Inc. Polyisocyanate Desmodur Z 4470 BA was provided by
Bayer MaterialScience (now Covestro LLC). Acetylacetone, toluene, methyl amyl ketone (MAK) and
dibutyltin diacetate (DBTDAc) were purchased from Sigma Aldrich. All reagents were used as received.
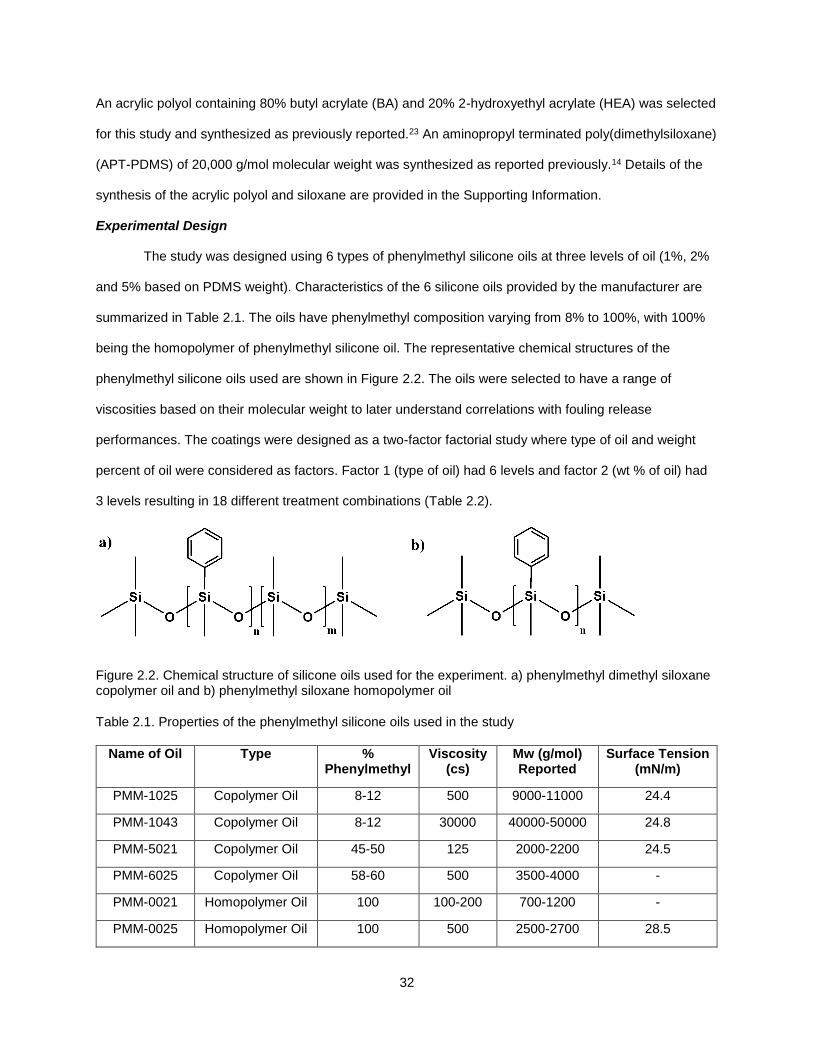
32
An acrylic polyol containing 80% butyl acrylate (BA) and 20% 2-hydroxyethyl acrylate (HEA) was selected
for this study and synthesized as previously reported.23 An aminopropyl terminated poly(dimethylsiloxane)
(APT-PDMS) of 20,000 g/mol molecular weight was synthesized as reported previously.14 Details of the
synthesis of the acrylic polyol and siloxane are provided in the Supporting Information.
Experimental Design
The study was designed using 6 types of phenylmethyl silicone oils at three levels of oil (1%, 2%
and 5% based on PDMS weight). Characteristics of the 6 silicone oils provided by the manufacturer are
summarized in Table 2.1. The oils have phenylmethyl composition varying from 8% to 100%, with 100%
being the homopolymer of phenylmethyl silicone oil. The representative chemical structures of the
phenylmethyl silicone oils used are shown in Figure 2.2. The oils were selected to have a range of
viscosities based on their molecular weight to later understand correlations with fouling release
performances. The coatings were designed as a two-factor factorial study where type of oil and weight
percent of oil were considered as factors. Factor 1 (type of oil) had 6 levels and factor 2 (wt % of oil) had
3 levels resulting in 18 different treatment combinations (Table 2.2).
Figure 2.2. Chemical structure of silicone oils used for the experiment. a) phenylmethyl dimethyl siloxane copolymer oil and b) phenylmethyl siloxane homopolymer oil
Table 2.1. Properties of the phenylmethyl silicone oils used in the study
Name of Oil Type % Phenylmethyl
Viscosity (cs)
Mw (g/mol) Reported
Surface Tension (mN/m)
PMM-1025 Copolymer Oil 8-12 500 9000-11000 24.4
PMM-1043 Copolymer Oil 8-12 30000 40000-50000 24.8
PMM-5021 Copolymer Oil 45-50 125 2000-2200 24.5
PMM-6025 Copolymer Oil 58-60 500 3500-4000 -
PMM-0021 Homopolymer Oil 100 100-200 700-1200 -
PMM-0025 Homopolymer Oil 100 500 2500-2700 28.5
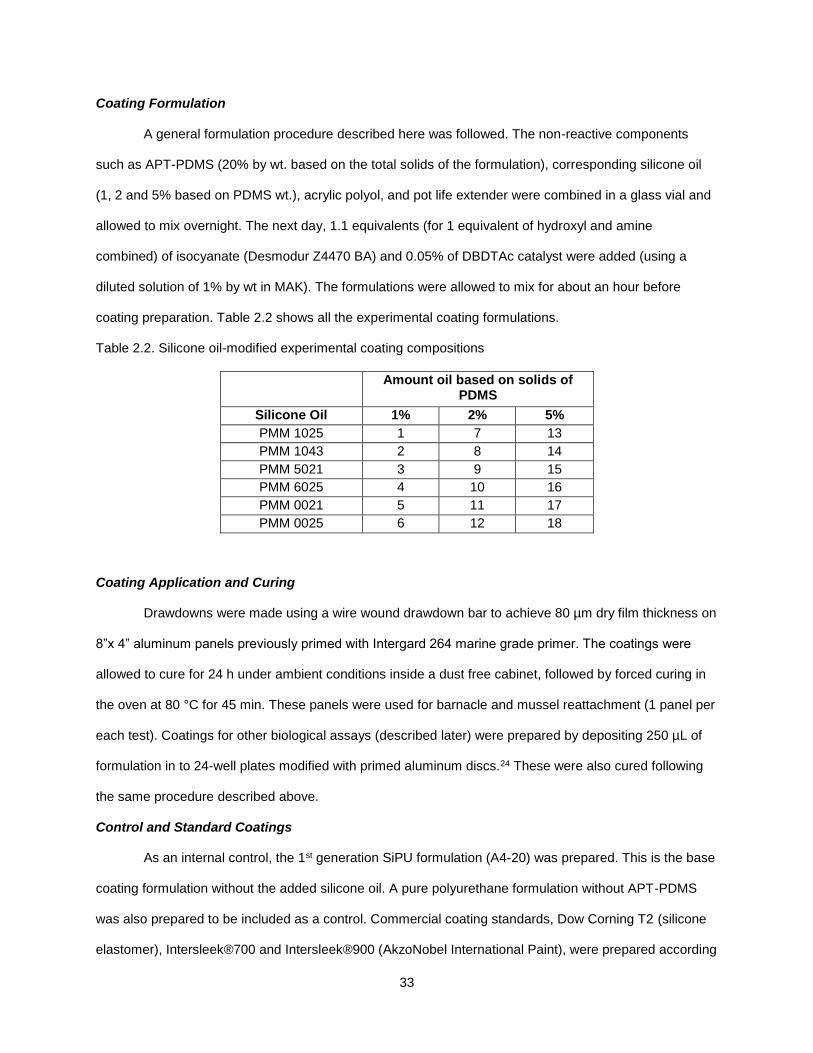
33
Coating Formulation
A general formulation procedure described here was followed. The non-reactive components
such as APT-PDMS (20% by wt. based on the total solids of the formulation), corresponding silicone oil
(1, 2 and 5% based on PDMS wt.), acrylic polyol, and pot life extender were combined in a glass vial and
allowed to mix overnight. The next day, 1.1 equivalents (for 1 equivalent of hydroxyl and amine
combined) of isocyanate (Desmodur Z4470 BA) and 0.05% of DBDTAc catalyst were added (using a
diluted solution of 1% by wt in MAK). The formulations were allowed to mix for about an hour before
coating preparation. Table 2.2 shows all the experimental coating formulations.
Table 2.2. Silicone oil-modified experimental coating compositions
Amount oil based on solids of PDMS
Silicone Oil 1% 2% 5%
PMM 1025 1 7 13
PMM 1043 2 8 14
PMM 5021 3 9 15
PMM 6025 4 10 16
PMM 0021 5 11 17
PMM 0025 6 12 18
Coating Application and Curing
Drawdowns were made using a wire wound drawdown bar to achieve 80 µm dry film thickness on
8”x 4” aluminum panels previously primed with Intergard 264 marine grade primer. The coatings were
allowed to cure for 24 h under ambient conditions inside a dust free cabinet, followed by forced curing in
the oven at 80 °C for 45 min. These panels were used for barnacle and mussel reattachment (1 panel per
each test). Coatings for other biological assays (described later) were prepared by depositing 250 µL of
formulation in to 24-well plates modified with primed aluminum discs.24 These were also cured following
the same procedure described above.
Control and Standard Coatings
As an internal control, the 1st generation SiPU formulation (A4-20) was prepared. This is the base
coating formulation without the added silicone oil. A pure polyurethane formulation without APT-PDMS
was also prepared to be included as a control. Commercial coating standards, Dow Corning T2 (silicone
elastomer), Intersleek®700 and Intersleek®900 (AkzoNobel International Paint), were prepared according
34
to manufacturer’s specifications to serve as standards. All internal control coatings and commercial
standards were prepared on both primed aluminum panels and in 24-well plates in order to be
characterized in parallel with the experimental coatings.
Water Aging
All the coatings prepared on both panels and plates were pre-leached in running tap water for 28
days (45 days of pre-leaching in the case of samples for green algae Ulva linza) in tanks separated by the
oil type. The water tanks were equipped to automatically fill and empty every 4 h. Water aging of the
coatings is carried out for two purposes: To leach out any impurities that could interfere with the fouling-
release assays and to determine if there are any significant surface rearrangements of the coatings after
being on contact with water.25 All biological laboratory assays were carried out after the pre-leaching
process was complete.
Surface Characterization of Coatings
All experimental coatings were characterized for water and methylene iodide contact angles
(WCA and MICA) using a Symyx®/First Ten Angstroms™ surface energy system. Three measurements
the contact angle of each test liquid were obtained using a CCD camera and First Ten AngstromsTM
software. Then the average WCA and MICA contact angles were used to calculate the SE for each
coating by Owens-Wendt method.26 Contact angle and SE analysis were performed both before and after
water aging.
X-ray photoelectron spectroscopy (XPS) was utilized to investigate the effects of silicone oil
incorporation on coating morphology. A Thermo ScientificTM K-AlphaTM XPS equipped with
monochromatic Al Kα (1486.68 eV) X-ray source and Ar+ ion source (up to 4000 eV) for depth profiling
was used for the XPS experiments. Initially an etch rate calibration experiment was performed to
determine the appropriate etch rate for depth profiling experiment using thin film of silicone elastomer of
known thickness (287.3 nm). Dow Corning T2 silicone elastomer was spin coated on a silicon wafer at a
speed of 6000 rpm for 35 s using a Laurell WS-400A-6NPP spin coater. Following spin coating, the
sample was carefully transferred to a dust free cabinet and allowed to cure under ambient conditions. For
accurate film thickness measurements, a First Optec Micro Master Excimer laser was used to ablate and
remove a thin strip of coating from the spin coated sample and then a KLA-Tencor profilometer was used
35
to measure step height from the top of the coating to the wafer substrate. The thickness of the silicone
elastomer was determined to be 287.3±25.3 nm. Depth profiling of the silicone elastomer was performed
using a 1000 eV Ar+ source sputtering on a spot of 1 mm2 in 30 s intervals for about 50 min (until
complete penetration into the silicon wafer). Chamber pressure was maintained below 1.5×10⁻⁷ Torr.
Photoemission lines for C 1s, N 1s, O 1s, and Si 2p were collected after each etch for an interval of 5s at
constant analyzer pass energy 155 eV, and an energy increment of 0.167 eV. Silicone elastomer etch
rate with Ar+ ion etch power of 1000eV was determined to be 0.0384 nm s-1.
Several experimental coatings prepared on aluminum substrates were analyzed through depth
profiling using similar settings mentioned above. Ar+ sputtering was performed on a spot of 1 mm2 of
experimental coating with an etch power of 1000eV in 10s intervals for 25-50 min. Following each etch
photoemission lines for C 1s, N 1s, O 1s, and Si 2p were collected as described before. Atomic
concentrations were determined using the integrated areas after subtracting the background and atomic
sensitivity factors of 1.000, 1.676, 2.881, and 0.900 for C 1s, N 1s, O 1s, and Si 2p lines respectively.
Previously determined etch rate was used to convert etch time to etch depth and atomic concentration
with etch depth for each sample were plotted to observe composition variations.
Laboratory Biological Assays
Growth and Release of the Macroalga (Ulva linza)
A detailed description of the Ulva linza growth and removal assay using high-throughput
screening methodologies can be found elsewhere.27 A brief description of the procedure is provided here.
All 24-well plates for the U. linza removal assay were aged in water for 45 days. The coatings were
equilibrated with filtered artificial seawater (ASW; Tropic Marin) for 2 hours h before starting the
experiment. Then 1 mL of U. linza spores in a single strength enriched ASW suspension (with 3.3×10⁵
spores/mL, adjusted to 0.05 OD at absorbance 660 nm) was deposited into each coating well. Spores
were allowed to settle and cultured for 6 days by incubating at 18 °C with a 16:8 light: dark cycle (photon
flux density 15.39 Wm-2) with nutrients renewed every 48 h. To evaluate ease of removal the ASW
medium was removed and three of the rows of wells were subjected to water-jetting at 9 and 67 kPa
using a spinning water-jet apparatus. One row of wells was not subjected to the water jet and was used
as the measure of growth. 28 Biomass of sporelings in coated wells was determined using chlorophyll
36
extraction. Chlorophyll was extracted by adding 1 mL of DMSO to each well and the fluorescence
determined at excitation 360 nm and emission at 670 nm wavelengths. Fluorescence is directly
proportional to the biomass present on each coating surface. The fluorescence from water-jetted vs. non-
jetted wells was used to determine relative percent removal of sporelings.
Growth and Release of Microalgae (Navicula incerta)
The microalga (Navicula incerta) assay was conducted using methods described elsewhere.29, 30
Briefly, coatings prepared in 24-well plates were used for assessments of diatom attachment and
adhesion following 28 days of water immersion pre-conditioning in running tap water. A suspension with
4×10⁵ cells/mL of N. incerta (adjusted to 0.03 OD at absorbance 660 nm) in Guillard’s F/2 medium was
deposited into each well (1 mL per well) and cell attachment was encouraged by static incubation for 2 h
under ambient conditions in the dark. Coating surfaces were then subjected to water-jet treatments.28
Three replicate wells did not receive the water-jet treatment so that initial cell attachment could be
determined and three replicate wells were water-jetted at 138 kPa (20 psi) for 10 s. Microalgae biomass
was quantified by extracting chlorophyll using 0.5 mL of DMSO and measuring fluorescence of the
transferred extracts at an excitation wavelength of 360 nm and emission wavelength at 670 nm. Relative
fluorescence (RFU) measured from the extracts was considered directly proportional to the biomass
present or remaining on the coating surfaces after water-jetting. Percent removal of attached microalgae
was determined using relative fluorescence of non-jetted and water-jetted wells.
Bacterial (Cellulophaga lytica) Biofilm Adhesion
A detailed description of the marine bacterial retention and adhesion assays for evaluating
fouling-release coatings can be found elsewhere.28, 30-31 Similar to the microalgal attachment and
adhesion assay, 24-well plates were incubated statically at 28°C for 24 h with a 1 mL/well of suspension
consisting of the marine bacterium Cellulophaga lytica at 107 cells/mL concentration in ASW containing
0.5 g/L peptone and 0.1g/L yeast extract. The ASW growth medium was then removed and the coatings
were subjected to water-jet treatments. The first column of each coating (3 replicate wells) was not
treated and served as the initial amount of bacterial biofilm growth. The second column (3 replicate wells)
was subjected to water-jetting at 69 kPa (10 psi) for 5 s. Following water-jet treatments, the coating
surfaces were stained with 0.5 mL of a crystal violet solution (0.3 wt. % in deionized water) for 15 minutes
37
and then rinsed three times with deionized water. After 1 hour of drying at ambient laboratory conditions,
the crystal violet dye was extracted from the coating surfaces by adding 0.5 mL of 33% acetic acid
solution for 15 min. The resulting eluates were transferred to a 96-well plate (0.15 mL/coating replicate)
and subjected to absorbance measurements at 600nm wavelength using a multi-well plate
spectrophotometer. The absorbance values were considered to be directly proportional to the amount of
bacterial biofilm present on coating surfaces before and after water-jetting treatments. Percent removal of
bacterial biofilm was quantified by comparing the mean absorbance values of the non-jetted and water-
jetted coating surfaces.27
Adult Barnacle (Amphibalanus amphitrite) Adhesion
An adult barnacle reattachment and adhesion assay was used to evaluate the fouling-release
properties of the coatings towards macrofouling organisms.32, 33 Barnacles were removed from silicone
substrates sent from Duke University and placed on experimental coatings (5 barnacles per coating)
using a custom-designed immobilization template. The immobilized barnacles were allowed to reattach
and grow for 2 weeks via immersion in an ASW aquarium tank system with daily feedings of brine shrimp
Artemia nauplii (Florida Aqua Farms). The number of non-attached barnacles was recorded and the
attached barnacles were pushed off (in shear) using a hand-held force gauge mounted onto a semi-
automated stage. Once the barnacles were dislodged, their basal plate areas were determined from
scanned images using Sigma Scan Pro 5.0 software program. Barnacle adhesion strength (MPa) was
calculated by dividing the peak force of removal by the basal plate area for each reattached barnacle. The
average barnacle adhesion strength for each coating was reported as a function of the number of
barnacles released with a measureable force and that exhibited no visible damage to the basis or shell
plates.
Mussel (Geukensia demissa) Adhesion
The assessment of marine mussel adhesion to the coating surfaces was evaluated using a
modified version of previously published protocols.34-36 Marine ribbed mussels (Geukensia demissa; 3-5
cm length) were received from Duke University Marine Laboratory in Beaufort, North Carolina, USA. Prior
to the attachment study, a 4 cm long acetal plastic rod (product# 98873A105, McMaster-Carr) was
attached to each mussel perpendicular to the ventral edge, using a 3M® acrylic adhesive (product#
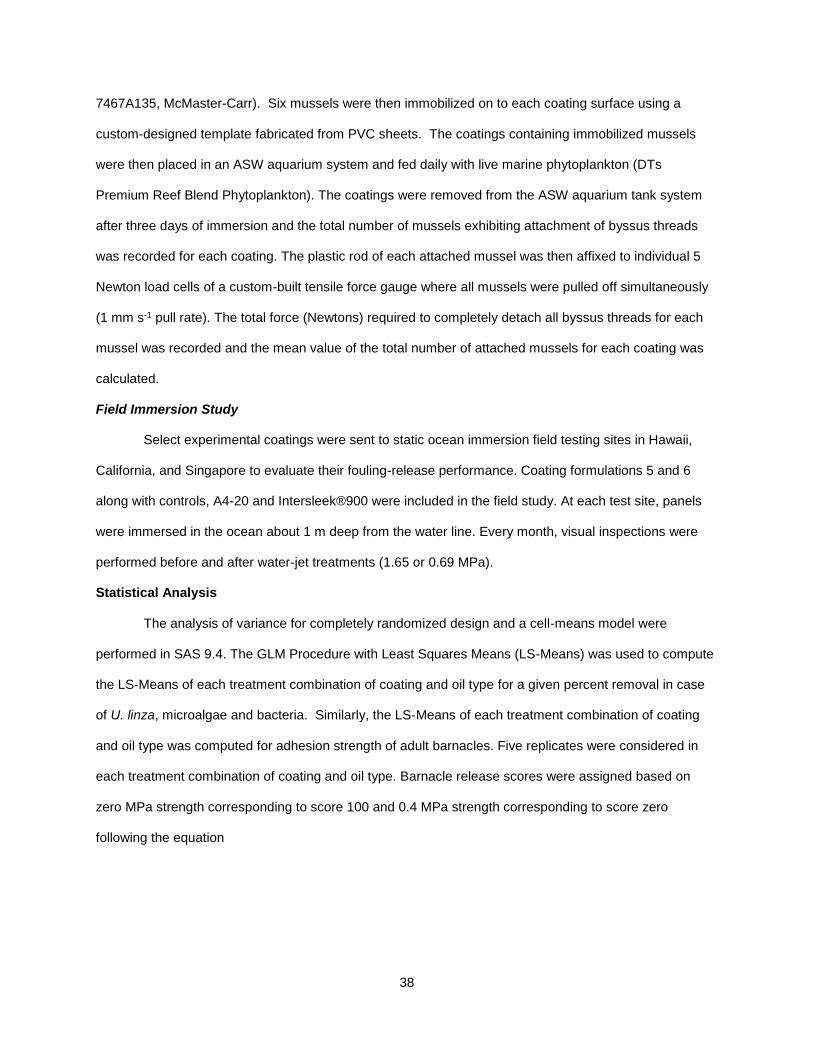
38
7467A135, McMaster-Carr). Six mussels were then immobilized on to each coating surface using a
custom-designed template fabricated from PVC sheets. The coatings containing immobilized mussels
were then placed in an ASW aquarium system and fed daily with live marine phytoplankton (DTs
Premium Reef Blend Phytoplankton). The coatings were removed from the ASW aquarium tank system
after three days of immersion and the total number of mussels exhibiting attachment of byssus threads
was recorded for each coating. The plastic rod of each attached mussel was then affixed to individual 5
Newton load cells of a custom-built tensile force gauge where all mussels were pulled off simultaneously
(1 mm s-1 pull rate). The total force (Newtons) required to completely detach all byssus threads for each
mussel was recorded and the mean value of the total number of attached mussels for each coating was
calculated.
Field Immersion Study
Select experimental coatings were sent to static ocean immersion field testing sites in Hawaii,
California, and Singapore to evaluate their fouling-release performance. Coating formulations 5 and 6
along with controls, A4-20 and Intersleek®900 were included in the field study. At each test site, panels
were immersed in the ocean about 1 m deep from the water line. Every month, visual inspections were
performed before and after water-jet treatments (1.65 or 0.69 MPa).
Statistical Analysis
The analysis of variance for completely randomized design and a cell-means model were
performed in SAS 9.4. The GLM Procedure with Least Squares Means (LS-Means) was used to compute
the LS-Means of each treatment combination of coating and oil type for a given percent removal in case
of U. linza, microalgae and bacteria. Similarly, the LS-Means of each treatment combination of coating
and oil type was computed for adhesion strength of adult barnacles. Five replicates were considered in
each treatment combination of coating and oil type. Barnacle release scores were assigned based on
zero MPa strength corresponding to score 100 and 0.4 MPa strength corresponding to score zero
following the equation
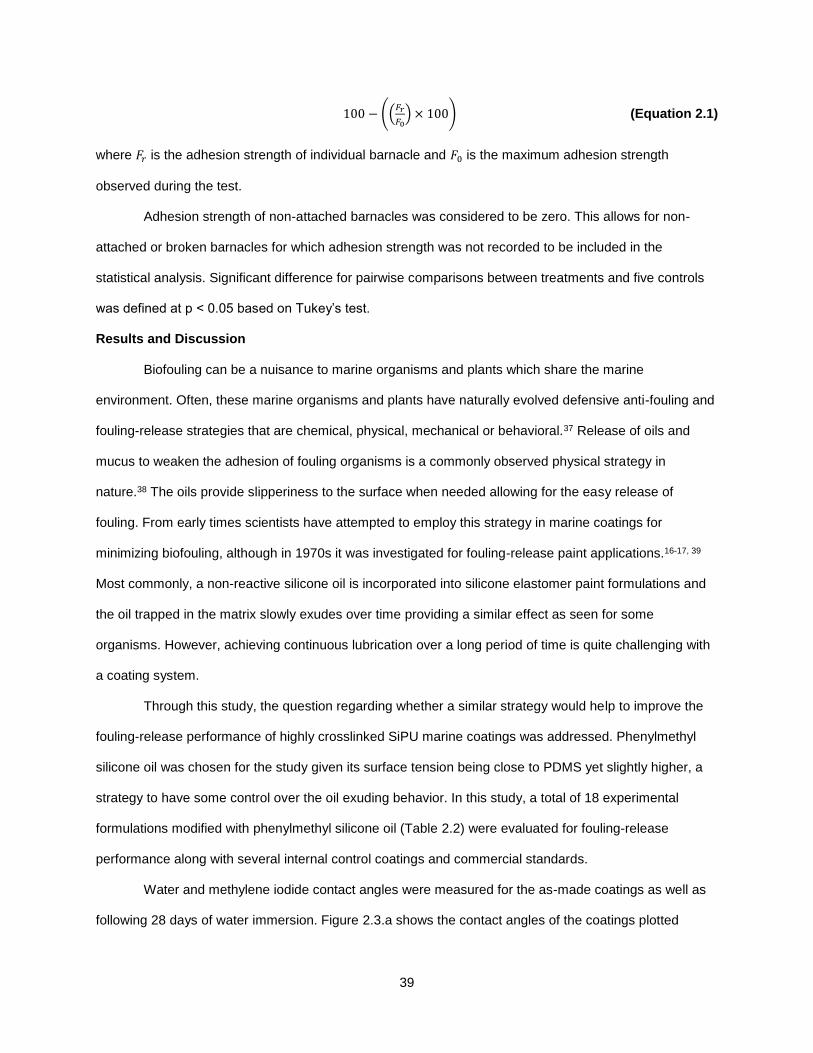
39
100 − ((𝐹𝑟
𝐹0) × 100) (Equation 2.1)
where 𝐹𝑟 is the adhesion strength of individual barnacle and 𝐹0 is the maximum adhesion strength
observed during the test.
Adhesion strength of non-attached barnacles was considered to be zero. This allows for non-
attached or broken barnacles for which adhesion strength was not recorded to be included in the
statistical analysis. Significant difference for pairwise comparisons between treatments and five controls
was defined at p < 0.05 based on Tukey’s test.
Results and Discussion
Biofouling can be a nuisance to marine organisms and plants which share the marine
environment. Often, these marine organisms and plants have naturally evolved defensive anti-fouling and
fouling-release strategies that are chemical, physical, mechanical or behavioral.37 Release of oils and
mucus to weaken the adhesion of fouling organisms is a commonly observed physical strategy in
nature.38 The oils provide slipperiness to the surface when needed allowing for the easy release of
fouling. From early times scientists have attempted to employ this strategy in marine coatings for
minimizing biofouling, although in 1970s it was investigated for fouling-release paint applications.16-17, 39
Most commonly, a non-reactive silicone oil is incorporated into silicone elastomer paint formulations and
the oil trapped in the matrix slowly exudes over time providing a similar effect as seen for some
organisms. However, achieving continuous lubrication over a long period of time is quite challenging with
a coating system.
Through this study, the question regarding whether a similar strategy would help to improve the
fouling-release performance of highly crosslinked SiPU marine coatings was addressed. Phenylmethyl
silicone oil was chosen for the study given its surface tension being close to PDMS yet slightly higher, a
strategy to have some control over the oil exuding behavior. In this study, a total of 18 experimental
formulations modified with phenylmethyl silicone oil (Table 2.2) were evaluated for fouling-release
performance along with several internal control coatings and commercial standards.
Water and methylene iodide contact angles were measured for the as-made coatings as well as
following 28 days of water immersion. Figure 2.3.a shows the contact angles of the coatings plotted
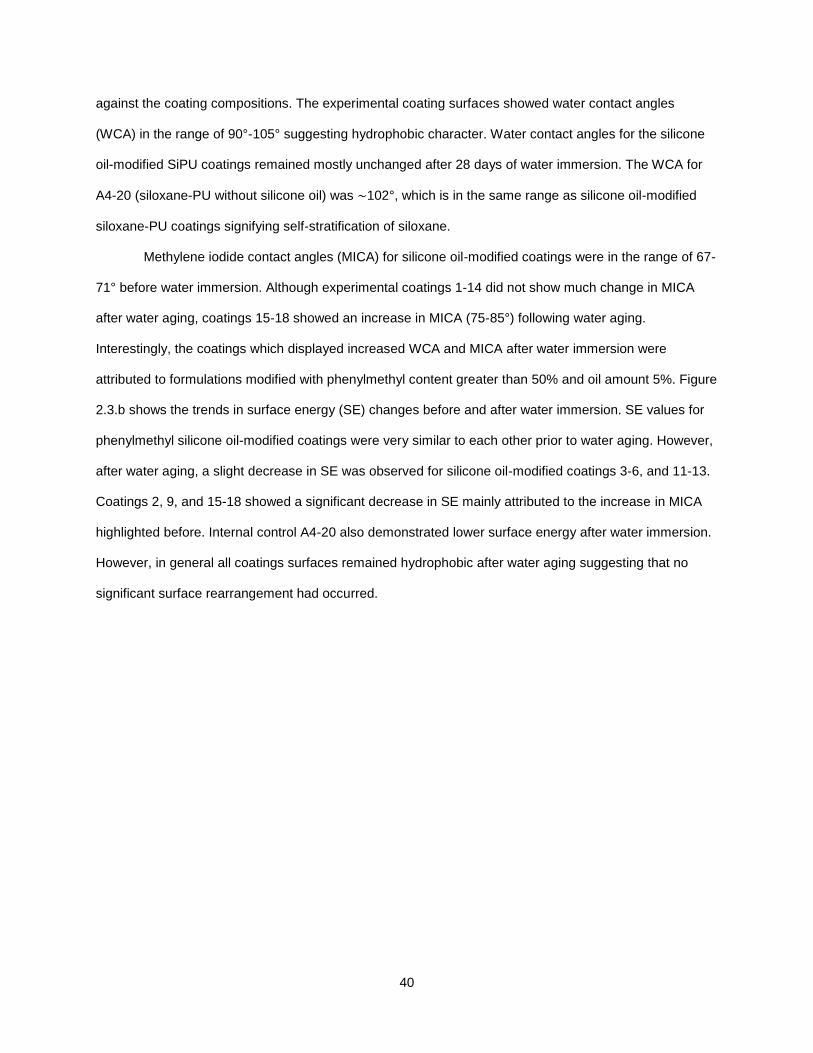
40
against the coating compositions. The experimental coating surfaces showed water contact angles
(WCA) in the range of 90°-105° suggesting hydrophobic character. Water contact angles for the silicone
oil-modified SiPU coatings remained mostly unchanged after 28 days of water immersion. The WCA for
A4-20 (siloxane-PU without silicone oil) was ∼102°, which is in the same range as silicone oil-modified
siloxane-PU coatings signifying self-stratification of siloxane.
Methylene iodide contact angles (MICA) for silicone oil-modified coatings were in the range of 67-
71° before water immersion. Although experimental coatings 1-14 did not show much change in MICA
after water aging, coatings 15-18 showed an increase in MICA (75-85°) following water aging.
Interestingly, the coatings which displayed increased WCA and MICA after water immersion were
attributed to formulations modified with phenylmethyl content greater than 50% and oil amount 5%. Figure
2.3.b shows the trends in surface energy (SE) changes before and after water immersion. SE values for
phenylmethyl silicone oil-modified coatings were very similar to each other prior to water aging. However,
after water aging, a slight decrease in SE was observed for silicone oil-modified coatings 3-6, and 11-13.
Coatings 2, 9, and 15-18 showed a significant decrease in SE mainly attributed to the increase in MICA
highlighted before. Internal control A4-20 also demonstrated lower surface energy after water immersion.
However, in general all coatings surfaces remained hydrophobic after water aging suggesting that no
significant surface rearrangement had occurred.
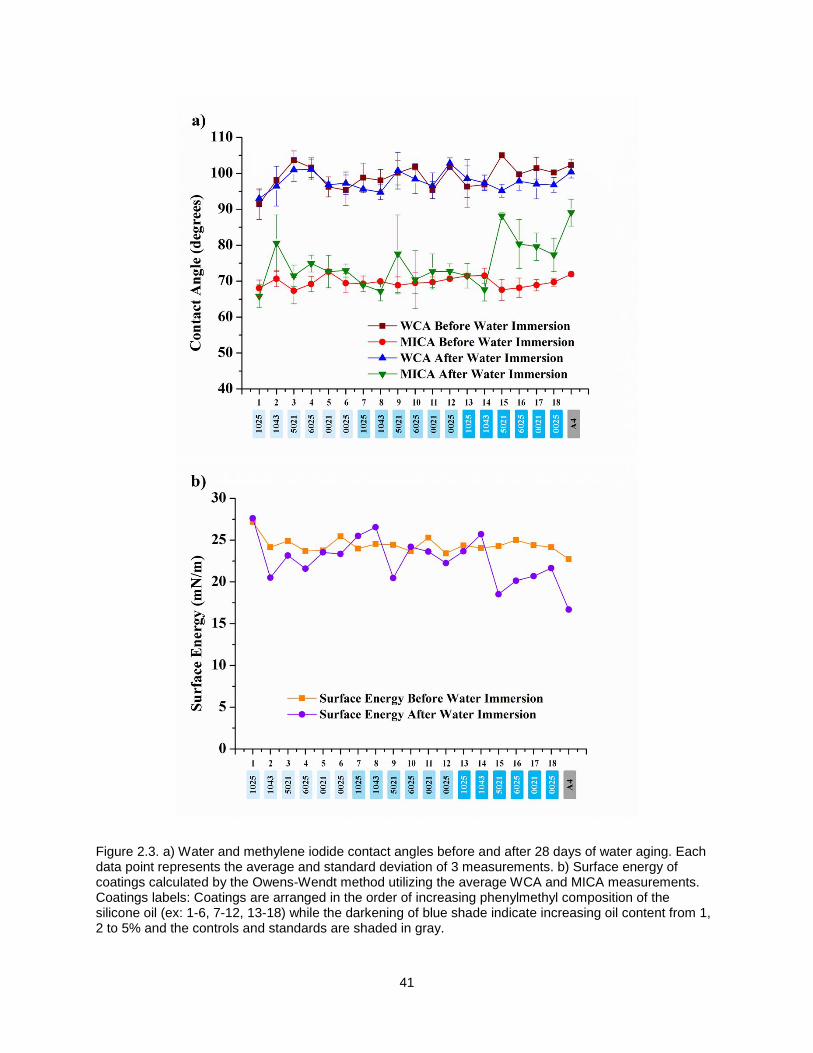
41
Figure 2.3. a) Water and methylene iodide contact angles before and after 28 days of water aging. Each data point represents the average and standard deviation of 3 measurements. b) Surface energy of coatings calculated by the Owens-Wendt method utilizing the average WCA and MICA measurements. Coatings labels: Coatings are arranged in the order of increasing phenylmethyl composition of the silicone oil (ex: 1-6, 7-12, 13-18) while the darkening of blue shade indicate increasing oil content from 1, 2 to 5% and the controls and standards are shaded in gray.
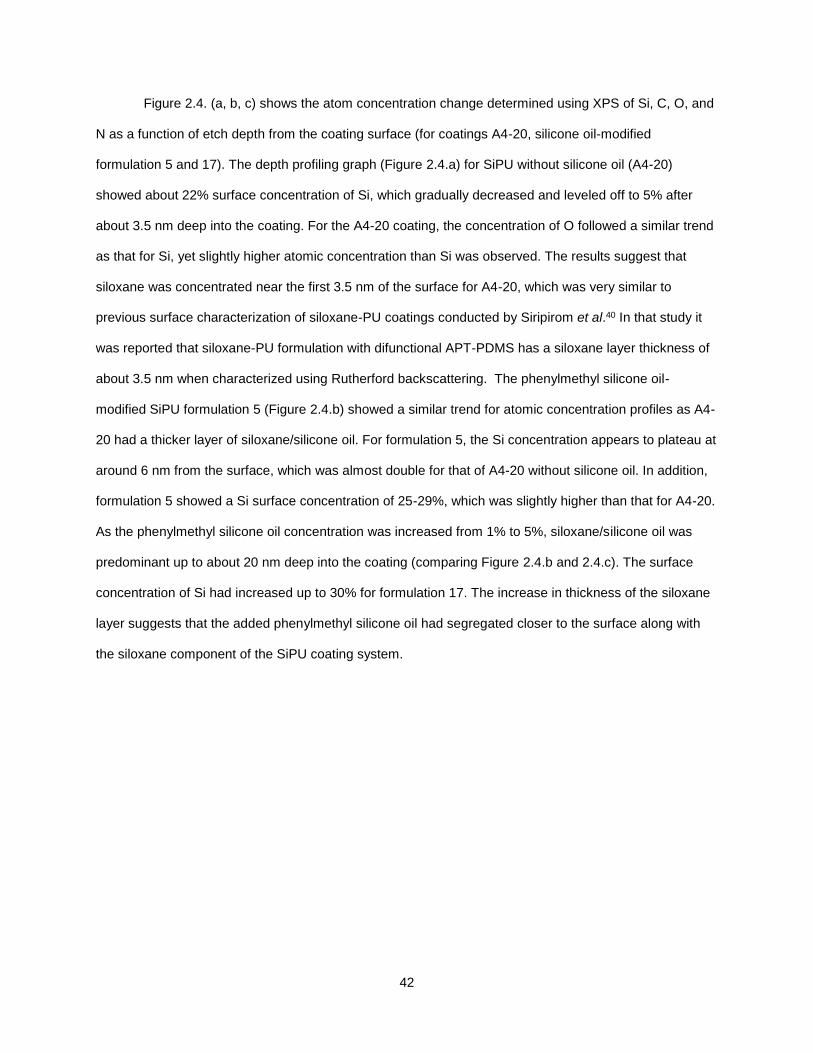
42
Figure 2.4. (a, b, c) shows the atom concentration change determined using XPS of Si, C, O, and
N as a function of etch depth from the coating surface (for coatings A4-20, silicone oil-modified
formulation 5 and 17). The depth profiling graph (Figure 2.4.a) for SiPU without silicone oil (A4-20)
showed about 22% surface concentration of Si, which gradually decreased and leveled off to 5% after
about 3.5 nm deep into the coating. For the A4-20 coating, the concentration of O followed a similar trend
as that for Si, yet slightly higher atomic concentration than Si was observed. The results suggest that
siloxane was concentrated near the first 3.5 nm of the surface for A4-20, which was very similar to
previous surface characterization of siloxane-PU coatings conducted by Siripirom et al.40 In that study it
was reported that siloxane-PU formulation with difunctional APT-PDMS has a siloxane layer thickness of
about 3.5 nm when characterized using Rutherford backscattering. The phenylmethyl silicone oil-
modified SiPU formulation 5 (Figure 2.4.b) showed a similar trend for atomic concentration profiles as A4-
20 had a thicker layer of siloxane/silicone oil. For formulation 5, the Si concentration appears to plateau at
around 6 nm from the surface, which was almost double for that of A4-20 without silicone oil. In addition,
formulation 5 showed a Si surface concentration of 25-29%, which was slightly higher than that for A4-20.
As the phenylmethyl silicone oil concentration was increased from 1% to 5%, siloxane/silicone oil was
predominant up to about 20 nm deep into the coating (comparing Figure 2.4.b and 2.4.c). The surface
concentration of Si had increased up to 30% for formulation 17. The increase in thickness of the siloxane
layer suggests that the added phenylmethyl silicone oil had segregated closer to the surface along with
the siloxane component of the SiPU coating system.
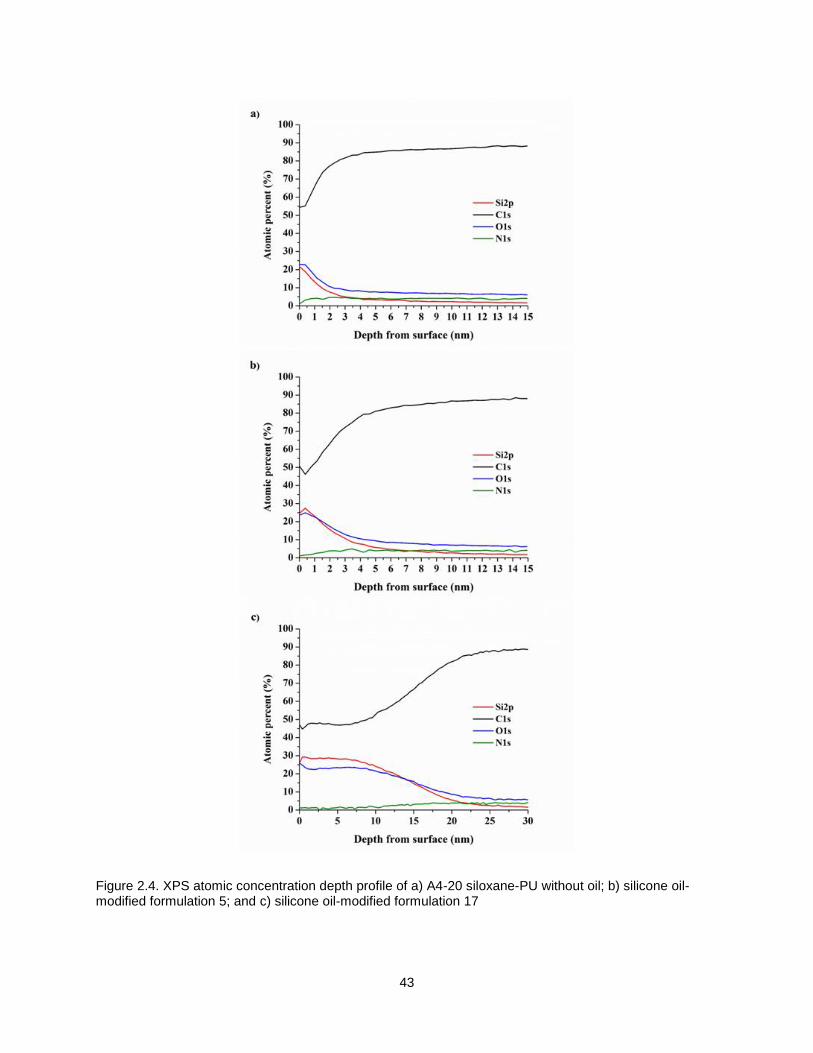
43
Figure 2.4. XPS atomic concentration depth profile of a) A4-20 siloxane-PU without oil; b) silicone oil-modified formulation 5; and c) silicone oil-modified formulation 17
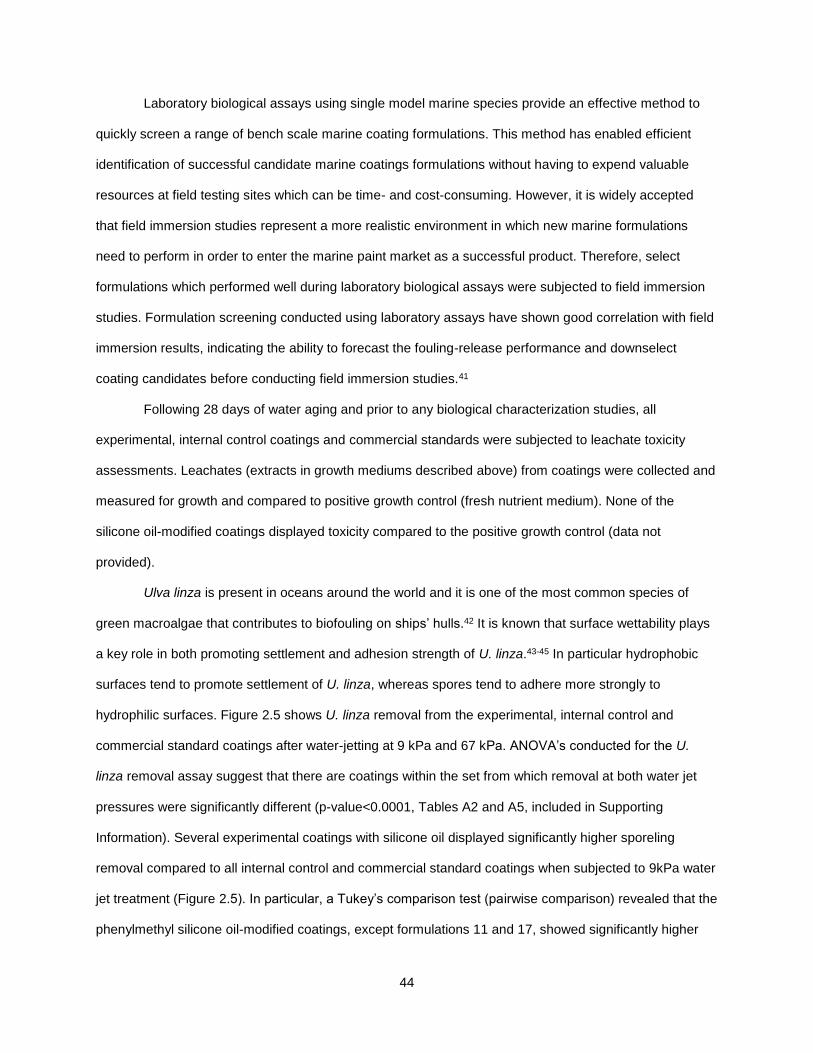
44
Laboratory biological assays using single model marine species provide an effective method to
quickly screen a range of bench scale marine coating formulations. This method has enabled efficient
identification of successful candidate marine coatings formulations without having to expend valuable
resources at field testing sites which can be time- and cost-consuming. However, it is widely accepted
that field immersion studies represent a more realistic environment in which new marine formulations
need to perform in order to enter the marine paint market as a successful product. Therefore, select
formulations which performed well during laboratory biological assays were subjected to field immersion
studies. Formulation screening conducted using laboratory assays have shown good correlation with field
immersion results, indicating the ability to forecast the fouling-release performance and downselect
coating candidates before conducting field immersion studies.41
Following 28 days of water aging and prior to any biological characterization studies, all
experimental, internal control coatings and commercial standards were subjected to leachate toxicity
assessments. Leachates (extracts in growth mediums described above) from coatings were collected and
measured for growth and compared to positive growth control (fresh nutrient medium). None of the
silicone oil-modified coatings displayed toxicity compared to the positive growth control (data not
provided).
Ulva linza is present in oceans around the world and it is one of the most common species of
green macroalgae that contributes to biofouling on ships’ hulls.42 It is known that surface wettability plays
a key role in both promoting settlement and adhesion strength of U. linza.43-45 In particular hydrophobic
surfaces tend to promote settlement of U. linza, whereas spores tend to adhere more strongly to
hydrophilic surfaces. Figure 2.5 shows U. linza removal from the experimental, internal control and
commercial standard coatings after water-jetting at 9 kPa and 67 kPa. ANOVA’s conducted for the U.
linza removal assay suggest that there are coatings within the set from which removal at both water jet
pressures were significantly different (p-value<0.0001, Tables A2 and A5, included in Supporting
Information). Several experimental coatings with silicone oil displayed significantly higher sporeling
removal compared to all internal control and commercial standard coatings when subjected to 9kPa water
jet treatment (Figure 2.5). In particular, a Tukey’s comparison test (pairwise comparison) revealed that the
phenylmethyl silicone oil-modified coatings, except formulations 11 and 17, showed significantly higher
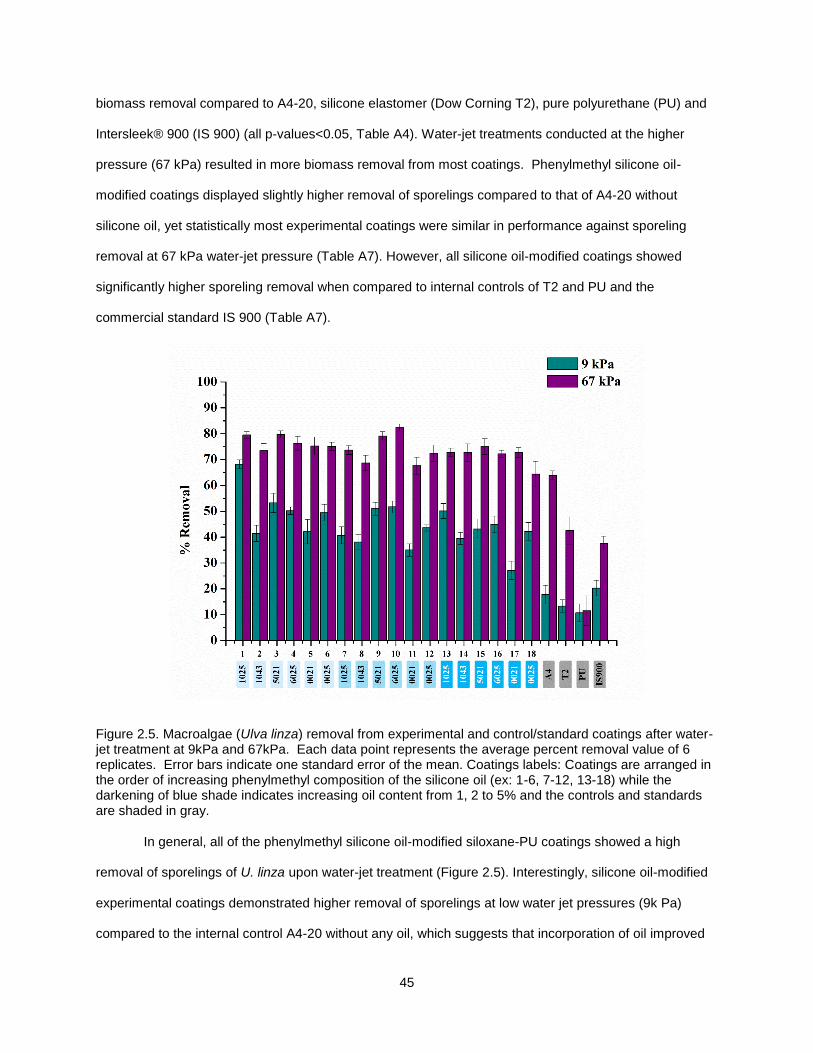
45
biomass removal compared to A4-20, silicone elastomer (Dow Corning T2), pure polyurethane (PU) and
Intersleek® 900 (IS 900) (all p-values<0.05, Table A4). Water-jet treatments conducted at the higher
pressure (67 kPa) resulted in more biomass removal from most coatings. Phenylmethyl silicone oil-
modified coatings displayed slightly higher removal of sporelings compared to that of A4-20 without
silicone oil, yet statistically most experimental coatings were similar in performance against sporeling
removal at 67 kPa water-jet pressure (Table A7). However, all silicone oil-modified coatings showed
significantly higher sporeling removal when compared to internal controls of T2 and PU and the
commercial standard IS 900 (Table A7).
Figure 2.5. Macroalgae (Ulva linza) removal from experimental and control/standard coatings after water-jet treatment at 9kPa and 67kPa. Each data point represents the average percent removal value of 6 replicates. Error bars indicate one standard error of the mean. Coatings labels: Coatings are arranged in the order of increasing phenylmethyl composition of the silicone oil (ex: 1-6, 7-12, 13-18) while the darkening of blue shade indicates increasing oil content from 1, 2 to 5% and the controls and standards are shaded in gray.
In general, all of the phenylmethyl silicone oil-modified siloxane-PU coatings showed a high
removal of sporelings of U. linza upon water-jet treatment (Figure 2.5). Interestingly, silicone oil-modified
experimental coatings demonstrated higher removal of sporelings at low water jet pressures (9k Pa)
compared to the internal control A4-20 without any oil, which suggests that incorporation of oil improved
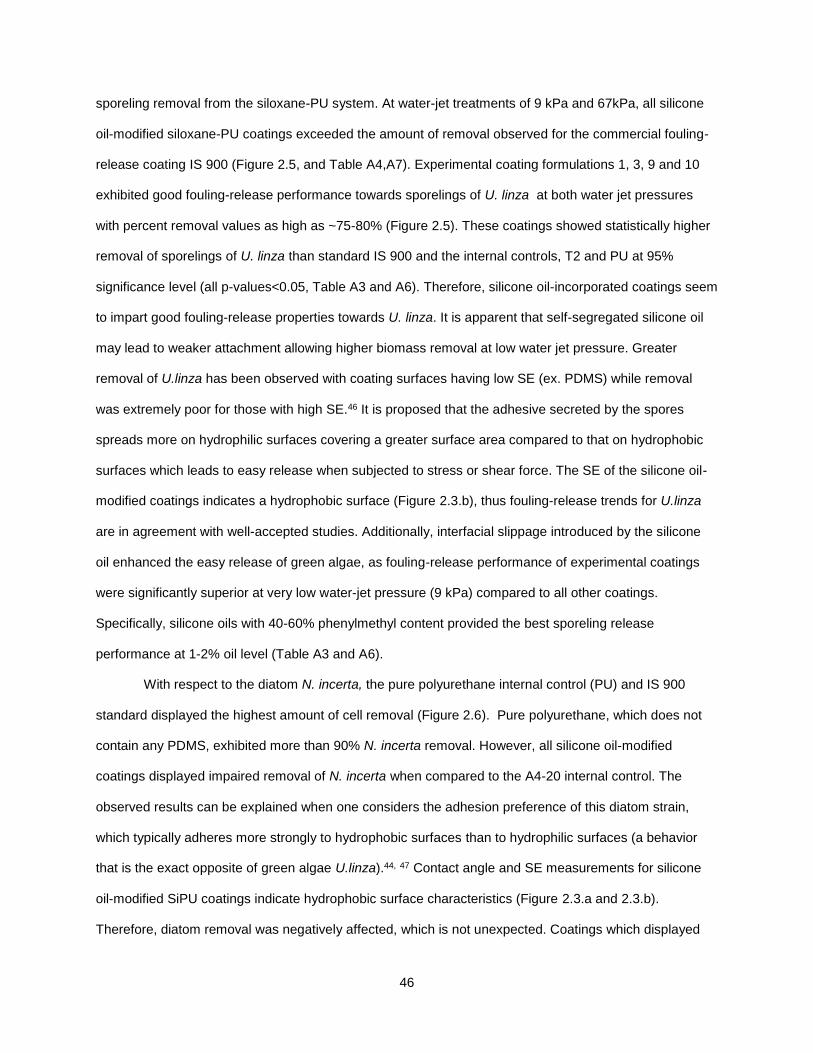
46
sporeling removal from the siloxane-PU system. At water-jet treatments of 9 kPa and 67kPa, all silicone
oil-modified siloxane-PU coatings exceeded the amount of removal observed for the commercial fouling-
release coating IS 900 (Figure 2.5, and Table A4,A7). Experimental coating formulations 1, 3, 9 and 10
exhibited good fouling-release performance towards sporelings of U. linza at both water jet pressures
with percent removal values as high as ~75-80% (Figure 2.5). These coatings showed statistically higher
removal of sporelings of U. linza than standard IS 900 and the internal controls, T2 and PU at 95%
significance level (all p-values<0.05, Table A3 and A6). Therefore, silicone oil-incorporated coatings seem
to impart good fouling-release properties towards U. linza. It is apparent that self-segregated silicone oil
may lead to weaker attachment allowing higher biomass removal at low water jet pressure. Greater
removal of U.linza has been observed with coating surfaces having low SE (ex. PDMS) while removal
was extremely poor for those with high SE.46 It is proposed that the adhesive secreted by the spores
spreads more on hydrophilic surfaces covering a greater surface area compared to that on hydrophobic
surfaces which leads to easy release when subjected to stress or shear force. The SE of the silicone oil-
modified coatings indicates a hydrophobic surface (Figure 2.3.b), thus fouling-release trends for U.linza
are in agreement with well-accepted studies. Additionally, interfacial slippage introduced by the silicone
oil enhanced the easy release of green algae, as fouling-release performance of experimental coatings
were significantly superior at very low water-jet pressure (9 kPa) compared to all other coatings.
Specifically, silicone oils with 40-60% phenylmethyl content provided the best sporeling release
performance at 1-2% oil level (Table A3 and A6).
With respect to the diatom N. incerta, the pure polyurethane internal control (PU) and IS 900
standard displayed the highest amount of cell removal (Figure 2.6). Pure polyurethane, which does not
contain any PDMS, exhibited more than 90% N. incerta removal. However, all silicone oil-modified
coatings displayed impaired removal of N. incerta when compared to the A4-20 internal control. The
observed results can be explained when one considers the adhesion preference of this diatom strain,
which typically adheres more strongly to hydrophobic surfaces than to hydrophilic surfaces (a behavior
that is the exact opposite of green algae U.linza).44, 47 Contact angle and SE measurements for silicone
oil-modified SiPU coatings indicate hydrophobic surface characteristics (Figure 2.3.a and 2.3.b).
Therefore, diatom removal was negatively affected, which is not unexpected. Coatings which displayed
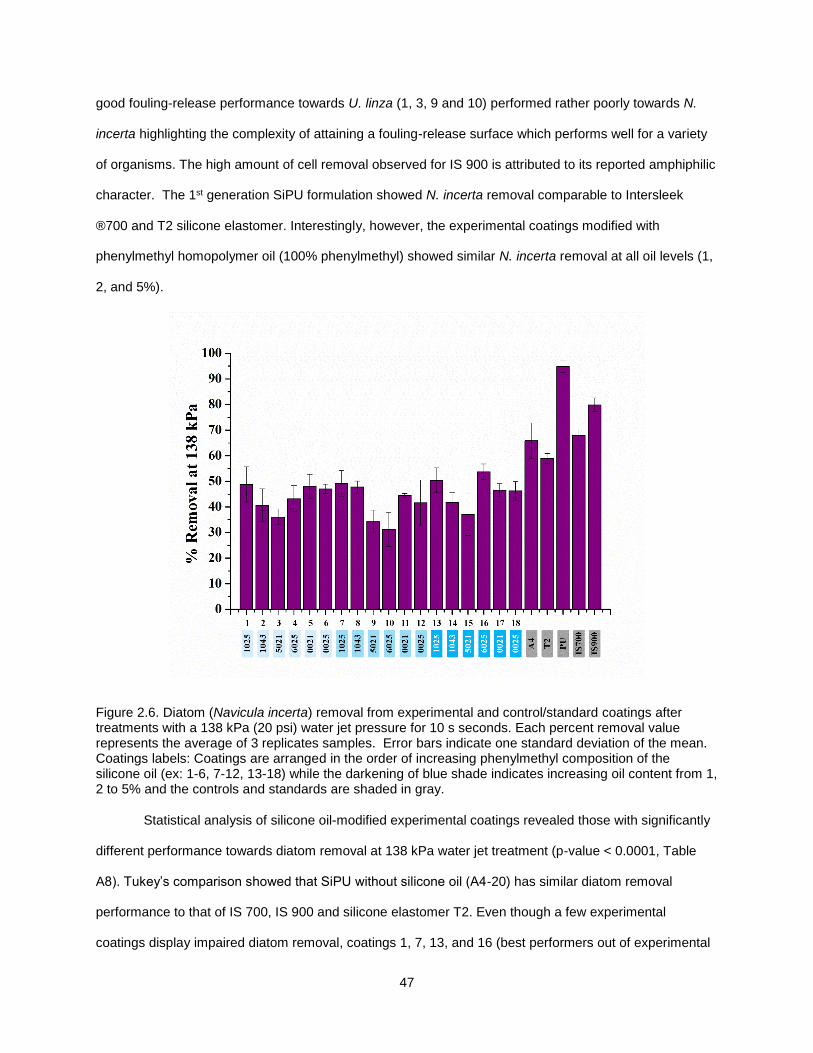
47
good fouling-release performance towards U. linza (1, 3, 9 and 10) performed rather poorly towards N.
incerta highlighting the complexity of attaining a fouling-release surface which performs well for a variety
of organisms. The high amount of cell removal observed for IS 900 is attributed to its reported amphiphilic
character. The 1st generation SiPU formulation showed N. incerta removal comparable to Intersleek
®700 and T2 silicone elastomer. Interestingly, however, the experimental coatings modified with
phenylmethyl homopolymer oil (100% phenylmethyl) showed similar N. incerta removal at all oil levels (1,
2, and 5%).
Figure 2.6. Diatom (Navicula incerta) removal from experimental and control/standard coatings after treatments with a 138 kPa (20 psi) water jet pressure for 10 s seconds. Each percent removal value represents the average of 3 replicates samples. Error bars indicate one standard deviation of the mean. Coatings labels: Coatings are arranged in the order of increasing phenylmethyl composition of the silicone oil (ex: 1-6, 7-12, 13-18) while the darkening of blue shade indicates increasing oil content from 1, 2 to 5% and the controls and standards are shaded in gray.
Statistical analysis of silicone oil-modified experimental coatings revealed those with significantly
different performance towards diatom removal at 138 kPa water jet treatment (p-value < 0.0001, Table
A8). Tukey’s comparison showed that SiPU without silicone oil (A4-20) has similar diatom removal
performance to that of IS 700, IS 900 and silicone elastomer T2. Even though a few experimental
coatings display impaired diatom removal, coatings 1, 7, 13, and 16 (best performers out of experimental
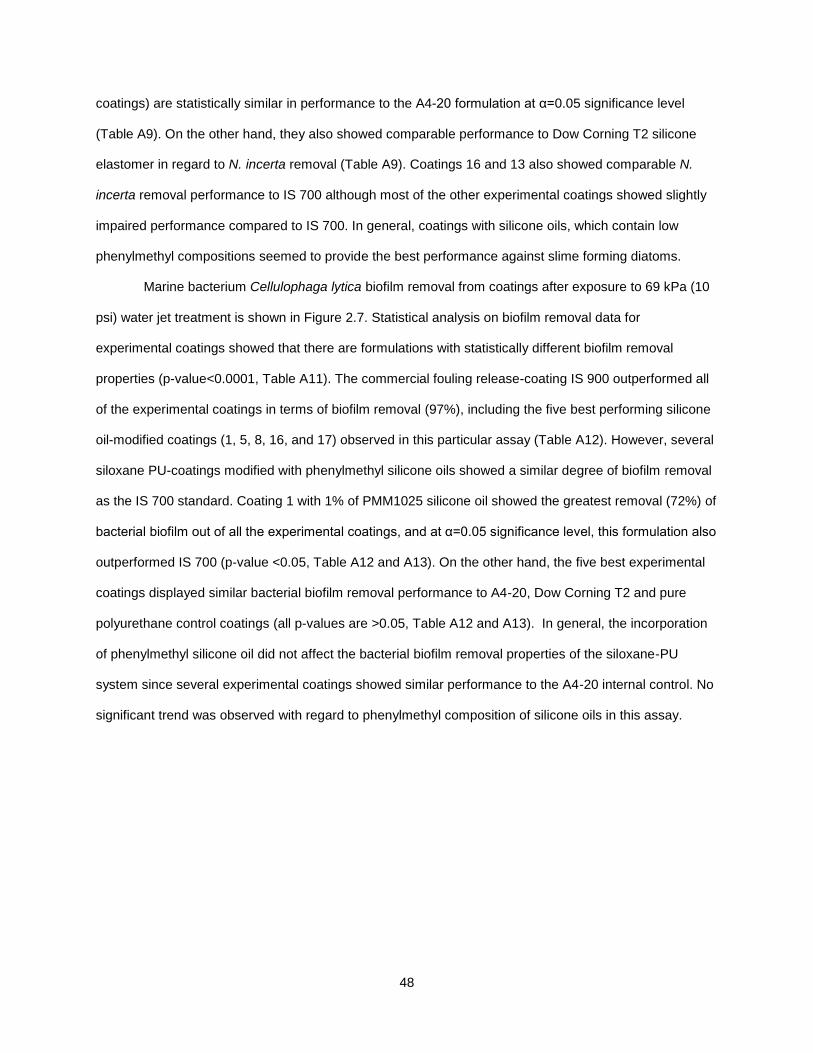
48
coatings) are statistically similar in performance to the A4-20 formulation at α=0.05 significance level
(Table A9). On the other hand, they also showed comparable performance to Dow Corning T2 silicone
elastomer in regard to N. incerta removal (Table A9). Coatings 16 and 13 also showed comparable N.
incerta removal performance to IS 700 although most of the other experimental coatings showed slightly
impaired performance compared to IS 700. In general, coatings with silicone oils, which contain low
phenylmethyl compositions seemed to provide the best performance against slime forming diatoms.
Marine bacterium Cellulophaga lytica biofilm removal from coatings after exposure to 69 kPa (10
psi) water jet treatment is shown in Figure 2.7. Statistical analysis on biofilm removal data for
experimental coatings showed that there are formulations with statistically different biofilm removal
properties (p-value<0.0001, Table A11). The commercial fouling release-coating IS 900 outperformed all
of the experimental coatings in terms of biofilm removal (97%), including the five best performing silicone
oil-modified coatings (1, 5, 8, 16, and 17) observed in this particular assay (Table A12). However, several
siloxane PU-coatings modified with phenylmethyl silicone oils showed a similar degree of biofilm removal
as the IS 700 standard. Coating 1 with 1% of PMM1025 silicone oil showed the greatest removal (72%) of
bacterial biofilm out of all the experimental coatings, and at α=0.05 significance level, this formulation also
outperformed IS 700 (p-value <0.05, Table A12 and A13). On the other hand, the five best experimental
coatings displayed similar bacterial biofilm removal performance to A4-20, Dow Corning T2 and pure
polyurethane control coatings (all p-values are >0.05, Table A12 and A13). In general, the incorporation
of phenylmethyl silicone oil did not affect the bacterial biofilm removal properties of the siloxane-PU
system since several experimental coatings showed similar performance to the A4-20 internal control. No
significant trend was observed with regard to phenylmethyl composition of silicone oils in this assay.
49
Figure 2.7. Bacterial (Cellulophaga lytica) biofilm removal from experimental and control/standard coatings after being exposed to a 69 kPa (10 psi) water-jet treatment for 5 s. The percent removal values represent the average of 3 replicate samples. Error bars indicate one standard deviation of the mean. Coatings labels: Coatings are arranged in the order of increasing phenylmethyl composition of the silicone oil (ex: 1-6, 7-12, 13-18) while the darkening of blue shade indicates increasing oil content from 1, 2 to 5% and the controls and standards are shaded in gray.
Macrofouling organisms are the main culprits of heavy calcareous fouling which leads to
increased hull roughness and severe powering penalties.48 Barnacle cyprids are known to conduct
surface exploration before permanently cementing themselves (a process known as metamorphism).49-
50Like other marine organisms, barnacles also display species specific adhesion preferences according to
surface chemistry and wettability.49 Therefore, barnacle adhesion strength to silicone oil-modified
coatings reflect the surface properties of these coatings. Figure 2.8 shows the adhesion strength
measurements of adult barnacles that were reattached to the experimental and control/standard coatings.
During this test, reattached barnacles were pushed off in shear using a force gauge. If the barnacle is
adhered weakly, the barnacle will release without any damage. Strongly adhered barnacles would break
during the test indicating poor fouling-release. For a good fouling-release coating, the adhesion strength
of barnacles should be minimal and have several non-attached barnacles. Poor fouling-release surfaces
show high adhesion strength of barnacles and multiple broken barnacles.
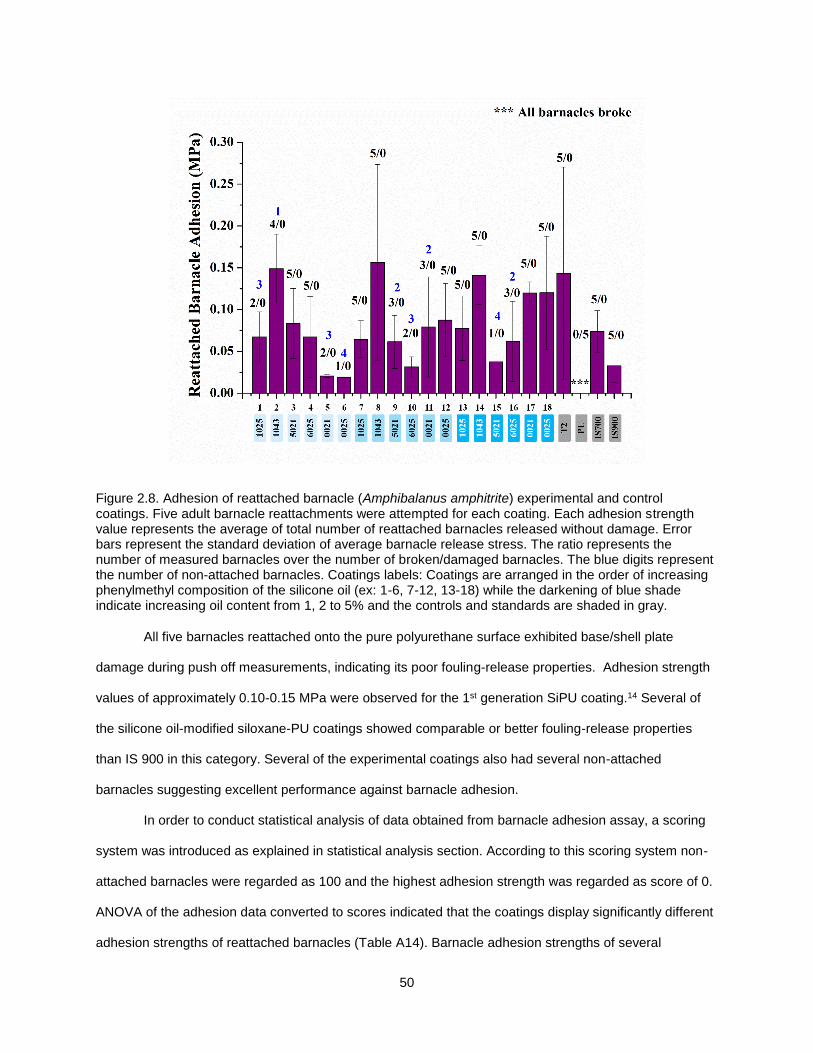
50
Figure 2.8. Adhesion of reattached barnacle (Amphibalanus amphitrite) experimental and control coatings. Five adult barnacle reattachments were attempted for each coating. Each adhesion strength value represents the average of total number of reattached barnacles released without damage. Error bars represent the standard deviation of average barnacle release stress. The ratio represents the number of measured barnacles over the number of broken/damaged barnacles. The blue digits represent the number of non-attached barnacles. Coatings labels: Coatings are arranged in the order of increasing phenylmethyl composition of the silicone oil (ex: 1-6, 7-12, 13-18) while the darkening of blue shade indicate increasing oil content from 1, 2 to 5% and the controls and standards are shaded in gray.
All five barnacles reattached onto the pure polyurethane surface exhibited base/shell plate
damage during push off measurements, indicating its poor fouling-release properties. Adhesion strength
values of approximately 0.10-0.15 MPa were observed for the 1st generation SiPU coating.14 Several of
the silicone oil-modified siloxane-PU coatings showed comparable or better fouling-release properties
than IS 900 in this category. Several of the experimental coatings also had several non-attached
barnacles suggesting excellent performance against barnacle adhesion.
In order to conduct statistical analysis of data obtained from barnacle adhesion assay, a scoring
system was introduced as explained in statistical analysis section. According to this scoring system non-
attached barnacles were regarded as 100 and the highest adhesion strength was regarded as score of 0.
ANOVA of the adhesion data converted to scores indicated that the coatings display significantly different
adhesion strengths of reattached barnacles (Table A14). Barnacle adhesion strengths of several
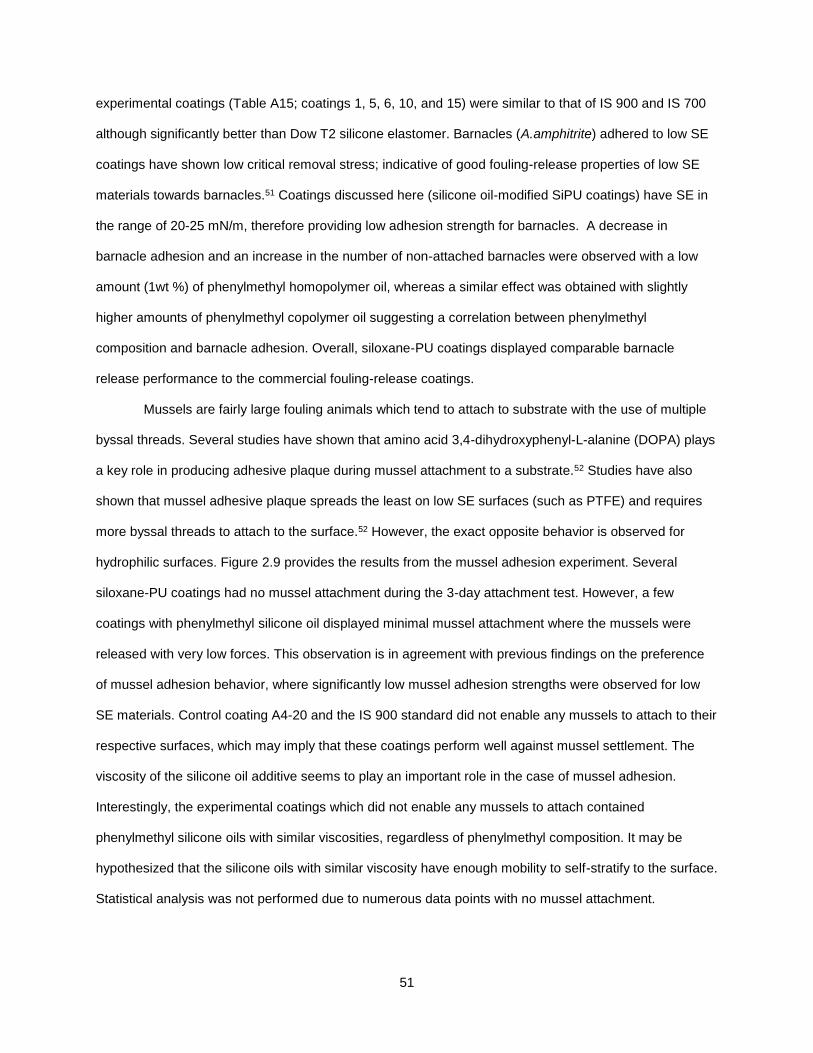
51
experimental coatings (Table A15; coatings 1, 5, 6, 10, and 15) were similar to that of IS 900 and IS 700
although significantly better than Dow T2 silicone elastomer. Barnacles (A.amphitrite) adhered to low SE
coatings have shown low critical removal stress; indicative of good fouling-release properties of low SE
materials towards barnacles.51 Coatings discussed here (silicone oil-modified SiPU coatings) have SE in
the range of 20-25 mN/m, therefore providing low adhesion strength for barnacles. A decrease in
barnacle adhesion and an increase in the number of non-attached barnacles were observed with a low
amount (1wt %) of phenylmethyl homopolymer oil, whereas a similar effect was obtained with slightly
higher amounts of phenylmethyl copolymer oil suggesting a correlation between phenylmethyl
composition and barnacle adhesion. Overall, siloxane-PU coatings displayed comparable barnacle
release performance to the commercial fouling-release coatings.
Mussels are fairly large fouling animals which tend to attach to substrate with the use of multiple
byssal threads. Several studies have shown that amino acid 3,4-dihydroxyphenyl-L-alanine (DOPA) plays
a key role in producing adhesive plaque during mussel attachment to a substrate.52 Studies have also
shown that mussel adhesive plaque spreads the least on low SE surfaces (such as PTFE) and requires
more byssal threads to attach to the surface.52 However, the exact opposite behavior is observed for
hydrophilic surfaces. Figure 2.9 provides the results from the mussel adhesion experiment. Several
siloxane-PU coatings had no mussel attachment during the 3-day attachment test. However, a few
coatings with phenylmethyl silicone oil displayed minimal mussel attachment where the mussels were
released with very low forces. This observation is in agreement with previous findings on the preference
of mussel adhesion behavior, where significantly low mussel adhesion strengths were observed for low
SE materials. Control coating A4-20 and the IS 900 standard did not enable any mussels to attach to their
respective surfaces, which may imply that these coatings perform well against mussel settlement. The
viscosity of the silicone oil additive seems to play an important role in the case of mussel adhesion.
Interestingly, the experimental coatings which did not enable any mussels to attach contained
phenylmethyl silicone oils with similar viscosities, regardless of phenylmethyl composition. It may be
hypothesized that the silicone oils with similar viscosity have enough mobility to self-stratify to the surface.
Statistical analysis was not performed due to numerous data points with no mussel attachment.
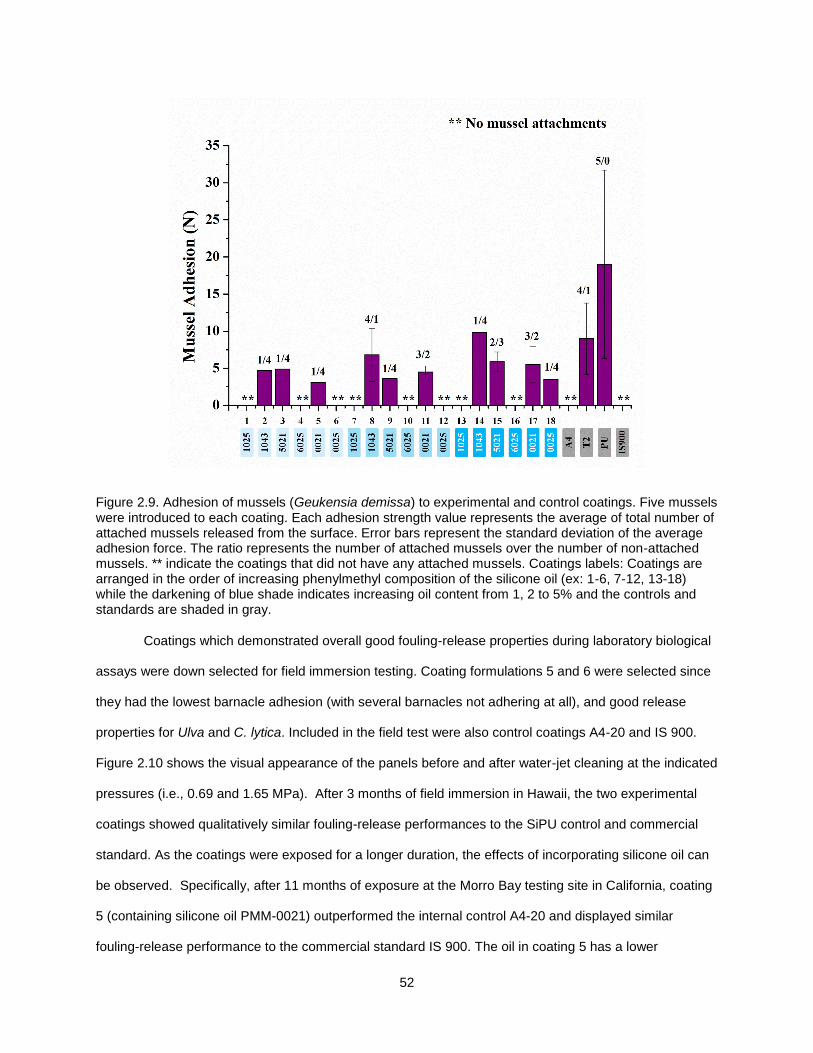
52
Figure 2.9. Adhesion of mussels (Geukensia demissa) to experimental and control coatings. Five mussels were introduced to each coating. Each adhesion strength value represents the average of total number of attached mussels released from the surface. Error bars represent the standard deviation of the average adhesion force. The ratio represents the number of attached mussels over the number of non-attached mussels. ** indicate the coatings that did not have any attached mussels. Coatings labels: Coatings are arranged in the order of increasing phenylmethyl composition of the silicone oil (ex: 1-6, 7-12, 13-18) while the darkening of blue shade indicates increasing oil content from 1, 2 to 5% and the controls and standards are shaded in gray.
Coatings which demonstrated overall good fouling-release properties during laboratory biological
assays were down selected for field immersion testing. Coating formulations 5 and 6 were selected since
they had the lowest barnacle adhesion (with several barnacles not adhering at all), and good release
properties for Ulva and C. lytica. Included in the field test were also control coatings A4-20 and IS 900.
Figure 2.10 shows the visual appearance of the panels before and after water-jet cleaning at the indicated
pressures (i.e., 0.69 and 1.65 MPa). After 3 months of field immersion in Hawaii, the two experimental
coatings showed qualitatively similar fouling-release performances to the SiPU control and commercial
standard. As the coatings were exposed for a longer duration, the effects of incorporating silicone oil can
be observed. Specifically, after 11 months of exposure at the Morro Bay testing site in California, coating
5 (containing silicone oil PMM-0021) outperformed the internal control A4-20 and displayed similar
fouling-release performance to the commercial standard IS 900. The oil in coating 5 has a lower
53
molecular weight and viscosity than the one used in coating 6 and may contribute more effectively to
interfacial slippage. After 11 months of exposure in Singapore, Formulation 5 showed comparable
performance to A4-20 slightly edging over formulation 6. However, it is worth noting that a lower water-jet
pressure was used at the Singapore test site. Variations in the marine environments in these different
bodies of water could contribute to the observed trend in fouling-release properties of formulations 5 and
6. In the past, studies have shown that oceanic conditions vary quite a bit based on their location.53-54
Although it is well recognized that different sea water parameters such as temperature, salinity, density,
and pH have an influence over biofouling, little attention has been given to understand their exact effects.1
Figure 2.10. Visual appearance of coatings included in field immersion trials at California, Singapore and Hawaii test sites. In Hawaii and Singapore test sites, half of each panel was subjected to water jet cleaning while the other half represents the accumulated fouling. At the California test site, the entire panel was subjected to water jet treatment. Thus the picture on the left (2nd row) represent the accumulated fouling while picture on the right represent the coating after cleaning.
Incorporation of phenylmethyl silicone oil into siloxane-PU coatings has been shown to improve
the fouling-release performance towards macrofouling organisms during laboratory biological assay tests;
in particular, for macroalgae sporeling release, where coatings with silicone oils containing <60%
phenylmethyl composition showed significantly better performance than the SiPU control and commercial
standards. Coatings modified with 1 % of silicone oils PMM-0021 and PMM-0025 (phenylmethyl
54
homopolymer) showed reduced barnacle adhesion. For phenylmethyl copolymer oils PMM-5021 and
PMM-6025, low barnacle adhesion strength was observed with slightly higher oil amount (2%or 5% by
wt.). Several silicone oil-modified coatings showed excellent fouling-release performance towards marine
mussels where the SiPU coatings that did not allow any mussels to adhere to their surface contained
phenylmethyl silicone oils with a viscosity of 500 cs. However, silicone oil incorporation did not seem to
substantially affect the bacterial biofilm and microalgae removal properties compared to the SiPU
formulation without silicone oil (A4-20). The field immersion studies showed that incorporating small
amounts of phenylmethyl silicone oil could enhance the fouling-release properties of SiPU coatings.
Conclusions
Previous studies had suggested that inclusion of phenylmethyl silicone oil in silicone elastomer-
based fouling-release coatings led to improved fouling-release performance.15-22 These improvements
were reasoned by hypothesizing that the reduced adhesion strength of marine organisms was due to
increased interfacial slippage induced by the exuding silicone oil. This study investigated the effects of
incorporating phenylmethyl silicone oils in a SiPU fouling-release coating system. Contact angle and
surface energy measurements suggested that the coating surfaces were hydrophobic and remained
hydrophobic after 1 month of water immersion. XPS analysis was helpful to understand the effects of
silicone oil on coating morphology and indicated that stratification of the silicone oil occurred along with
siloxane and formed a thicker interfacial layer. Laboratory biological assays indicated that an
improvement in release properties for several types of model fouling organisms might have reflected the
silicone oil modification. Siloxane-PU coatings modified with silicone oils demonstrated excellent release
properties against the macroalga U. linza; high removal was observed at low water-jet pressures. An
improvement in lower adhesion strength of macrofouling organisms was also observed with incorporation
of silicone oil. In particular, silicone oils with high phenylmethyl composition provided good fouling-release
performance towards barnacles (A. amphitrite). Excellent fouling-release performance towards marine
mussels (G. demissa) was observed for coatings containing phenylmethyl silicone oil with an approximate
viscosity of 500 cs, regardless of oil type or composition. However, fouling-release performance towards
diatoms (N. incerta) and bacteria (C. lytica) was largely unaffected by silicone oil modification into SiPU
coating system. Selected phenylmethyl silicone oil-modified siloxane-PU coatings also displayed long-
55
term fouling-release performance comparable to commercial IS 900 standard during field immersion tests
at three different test sites.
References
1. Yebra, D. M.; Kiil, S. K.; Dam-Johansen, K., Antifouling Technology—Past, Present and Future Steps Towards Efficient and Environmentally Friendly Antifouling Coatings. Progress in Organic Coatings 2004, 50 (2), 75-104.
2. Callow, J. A.; Callow, M. E., Trends in the Development of Environmentally Friendly Fouling-Resistant Marine Coatings. Nat Commun 2011, 2, 244.
3. Lejars, M.; Margaillan, A.; Bressy, C., Fouling Release Coatings: A Nontoxic Alternative to Biocidal Antifouling Coatings. Chemical Reviews 2012, 112 (8), 4347-4390.
4. Magin, C. M.; Cooper, S. P.; Brennan, A. B., Non-Toxic Antifouling Strategies. Materials Today 2010, 13 (4), 36-44.
5. Callow, M. E.; Callow, J. A., Marine Biofouling: A Sticky Problem. Biologist 2002, 49 (1), 10.
6. Genzer, J.; Efimenko, K., Recent Developments in Superhydrophobic Surfaces and Their Relevance to Marine Fouling: A Review. Biofouling 2006, 22 (5), 339-360.
7. Dafforn, K. A.; Lewis, J. A.; Johnston, E. L., Antifouling Strategies: History and Regulation, Ecological Impacts and Mitigation. Marine Pollution Bulletin 2011, 62 (3), 453-465.
8. Konstantinou, I. K.; Albanis, T. A., Worldwide Occurrence and Effects of Antifouling Paint Booster Biocides in the Aquatic Environment: A Review. Environment International 2004, 30 (2), 235-248.
9. Adkins, J. D.; Mera, A. E.; Roe-Short, M. A.; Pawlikowski, G. T.; Brady Jr, R. F., Novel Non-Toxic Coatings Designed to Resist Marine Fouling. Progress in Organic Coatings 1996, 29 (1–4), 1-5.
10. Brady, R. F., Jr., Clean Hulls without Poisons: Devising and Testing Nontoxic Marine Coatings. Journal of Coatings Technology 2000, 72 (900), 45-56.
11. Webster, D. C.; Ekin, A. Functionalized Polysiloxane Polymers. US7799434 B2, 2010.
12. Sommer, S. A.; Joseph, B. R.; Fischer, H. D.; Bodkhe, R. B.; Staflien, S. J.; Daniels, J.; Yehle, C.; Webster, D. C., Effect of Pigmentation on Siloxane-Polyurethane Coatings. Journal of Coatings Technology Research 2011, 8 (6), 661-670.
13. Sommer, S.; Ekin, A.; Webster, D. C.; Stafslien, S. J.; Daniels, J.; VanderWal, L. J.; Thompson, S. E. M.; Callow, M. E.; Callow, J. A., A Preliminary Study on the Properties and Fouling-Release Performance of Siloxane-Polyurethane Coatings Prepared from Pdms Macromers. Biofouling 2010, 26 (8), 961-972.
14. Bodkhe, R. B.; Thompson, S. E. M.; Yehle, C.; Cilz, N.; Daniels, J.; Stafslien, S. J.; Callow, M. E.; Callow, J. A.; Webster, D. C., The Effect of Formulation Variables on Fouling-Release Performance of Stratified Siloxane-Polyurethane Coatings. Journal of Coatings Technology Research 2012, 9 (3), 235-249.
56
15. Truby, K.; Wood, C. D.; Stein, J.; Cella, J.; Carpenter, J.; Kavanagh, C.; Swain, G.; Wiebe, D.; Lapota, D.; Meyer, A.; Holm, E.; Wendt, D.; Smith, C.; Montemarano, J., Evaluation of the Performance Enhancement of the Silicone Biofouling-Release Coatings by Oil Incorporation. Biofouling 2000, 15 (1-3), 141-150.
16. Miline, A. Anti-Fouling Marine Compositions. US 4025693, May 24, 1977.
17. Miline, A. Coated Marine Surfaces. UK 1470465, 1977.
18. Edwards, D. P.; Nevell, T. G.; Plunkett, B. A.; Ochiltree, B. C., Resistance to Marine Fouling of Elastomeric Coatings of Some Poly (Dimethylsiloxanes) and Poly (Dimethyldiphenyl-Siloxanes). International Biodeterioration & Biodegradation 1994, 34, 349-359.
19. Nevell, T. G.; Edwards, D. P.; Davis, A. J.; Pullin, R. A., The Surface Properties of Silicone Elastomer Exposed to Sea Water. Biofouling 1996, 10, 199-212.
20. Newby, B.; Chaudhury, M.; Brown, H., Macroscopic Evidence of the Effect of Interfacial Slippage on Adhesion. Science 1995, 269, 1407-109.
21. Stein, J.; Truby, K.; Wood, C. D.; Takemori, M.; Vallance, M.; Swain, G.; Kavanagh, C.; Kovach, B.; Schultz, M.; Wiebe, D.; Holm, E.; Montemarano, J.; Wendt, D.; Smith, C.; Meyer, A., Structure–Property Relationships of Silicone Biofouling-Release Coatings: Effect of Silicone Network Architecture on Pseudobarnacle Attachment Strengths. Biofouling 2003, 19 (2), 87-94.
22. Stein, J.; Truby, K.; Wood, C. D.; Stein, J.; Gardner, M.; Swain, G.; Kavanagh, C.; Kovach, B.; Schultz, M.; Wiebe, D.; Holm, E.; Montemarano, J.; Wendt, D.; Smith, C.; Meyer, A., Silicone Foul Release Coatings: Effect of the Interaction of Oil and Coating Functionalities on the Magnitude of Macrofouling Attachment Strengths. Biofouling 2003, 19, 71-82.
23. Pieper, R. J.; Ekin, A.; Webster, D. C.; Casse, F.; Callow, J. A.; Callow, M. E., A Combinatorial Approach to Study the Effect of Acrylic Polyol Composition on the Properties of Crosslinked Siloxane-Polyurethane Fouling-Release Coatings. Journal of Coatings Technology Research 2007, 4 (4), 453-461.
24. Stafslien, S. J.; Bahr, J. A.; Feser, J. M.; Weisz, J. C.; Chisholm, B. J.; Ready, T. E.; Boudjouk, P., Combinatorial Materials Research Applied to the Development of New Surface Coatings I: A multiwell plate screening method for the High-Throughput Assessment of Bacterial Biofilm Retention on Surfaces. Journal of Combinatorial Chemistry 2006, 8 (2), 156-162.
25. Ekin, A.; Webster, D. C., Combinatorial and High-Throughput Screening of the Effect of Siloxane Composition on the Surface Properties of Crosslinked Siloxane−Polyurethane Coatings. Journal of Combinatorial Chemistry 2006, 9 (1), 178-188.
26. Owens, D. K.; Wendt, R. C., Estimation of the Surface Free Energy of Polymers. Journal of Applied Polymer Science 1969, 13 (8), 1741-1747.
27. Casse, F.; Ribeiro, E.; Ekin, A.; Webster, D. C.; Callow, J. A.; Callow, M. E., Laboratory Screening of Coating Libraries for Algal Adhesion. Biofouling 2007, 23 (3/4), 267-276.
28. Stafslien, S. J.; Bahr, J. A.; Daniels, J. W.; Wal, L. V.; Nevins, J.; Smith, J.; Schiele, K.; Chisholm, B., Combinatorial Materials Research Applied to the Development of New Surface Coatings Vi: An Automated Spinning Water Jet Apparatus for the High-Throughput Characterization of Fouling-Release Marine Coatings. Review of Scientific Instruments 2007, 78 (7), 072204.
57
29. Cassé, F.; Stafslien, S. J.; Bahr, J. A.; Daniels, J.; Finlay, J. A.; Callow, J. A.; Callow, M. E., Combinatorial Materials Research Applied to the Development of New Surface Coatings V. Application of a Spinning Water-Jet for the Semi-High Throughput Assessment of the Attachment Strength of Marine Fouling Algae. Biofouling 2007, 23 (2), 121-130.
30. Callow, M. E.; Callow, J. A.; Conlan, S.; Clare, A. S.; Stafslien, S., Efficacy Testing of Nonbiocidal and Fouling-Release Coatings. In Biofouling Methods, John Wiley & Sons, Ltd: 2014; pp 291-316.
31. Stafslien, S.; Daniels, J.; Mayo, B.; Christianson, D.; Chisholm, B.; Ekin, A.; Webster, D.; Swain, G., Combinatorial Materials Research Applied to the Development of New Surface Coatings. Iv: A High-Throughput Bacterial Retention and Retraction Assay for Screening Fouling-Release Performance of Coatings. Biofouling 2007, 23 (1), 45-54.
32. Stafslien, S.; Daniels, J.; Bahr, J.; Chisholm, B.; Ekin, A.; Webster, D.; Orihuela, B.; Rittschof, D., An Improved Laboratory Reattachment Method for the Rapid Assessment of Adult Barnacle Adhesion Strength to Fouling-Release Marine Coatings. Journal of Coatings Technology and Research 2012, 9 (6), 651-665.
33. Rittschof, D.; Orihuela, B.; Stafslien, S.; Daniels, J.; Christianson, D.; Chisholm, B.; Holm, E., Barnacle Reattachment: A Tool for Studying Barnacle Adhesion. Biofouling 2008, 24 (1), 1-9.
34. Emily, C. B.; John, M. G., Strategies for Life in Flow: Tenacity, Morphometry, and Probability of Dislodgment of Two Mytilus Species. Marine Ecology Progress Series 1997, 159, 197-208.
35. Burkett, J. R.; Wojtas, J. L.; Cloud, J. L.; Wilker, J. J., A Method for Measuring the Adhesion Strength of Marine Mussels. The Journal of Adhesion 2009, 85 (9), 601-615.
36. Crisp, D. J.; Walker, G.; Young, G. A.; Yule, A. B., Adhesion and Substrate Choice in Mussels and Barnacles. Journal of Colloid and Interface Science 1985, 104 (1), 40-50.
37. Emily Ralston and Geoffrey, S., Bioinspiration—the Solution for Biofouling Control? Bioinspiration & Biomimetics 2009, 4 (1), 015007.
38. Scardino, A. J.; de Nys, R., Mini Review: Biomimetic Models and Bioinspired Surfaces for Fouling Control. Biofouling 2011, 27 (1), 73-86.
39. Hellio, C.; Yebra, D. M., Advances in Marine Antifouling Coatings and Technologies. Woodhead Publishing Limited: Cambridge, UK, 2009.
40. Siripirom, C. High-Throughput Methods for Characterizing the Mechanical Properties of Coatings. North Dakota State University, Fargo, 2012.
41. Stafslien, S. J.; Sommer, S.; Webster, D. C.; Bodkhe, R.; Pieper, R.; Daniels, J.; Vander Wal, L.; Callow, M. C.; Callow, J. A.; Ralston, E.; Swain, G.; Brewer, L.; Wendt, D.; Dickinson, G. H.; Lim, C.-S.; Teo, S. L.-M., Comparison of Laboratory and Field Testing Performance Evaluations of Siloxane-Polyurethane Fouling-Release Marine Coatings. Biofouling 2016, 32 (8), 949-968.
42. Hoipkemeier-Wilson, L.; Schumacher, J. F.; Carman, M. L.; Gibson, A. L.; Feinberg, A. W.; Callow, M. E.; Finlay, J. A.; Callow, J. A.; Brennan, A. B., Antifouling Potential of Lubricious, Micro-Engineered, Pdms Elastomers against Zoospores of the Green Fouling Alga Ulva (Enteromorpha). Biofouling 2004, 20 (1), 53-63.
58
43. Callow, M. E.; Callow, J. A.; Ista, L. K.; Coleman, S. E.; Nolasco, A. C.; Lopez, G. P., Use of Self Assembled Monolayers of Different Wettabilities to Study Surface Selection and Primary Adhesion Processes of Green Algae (Enteromorpha) Zoosporesuse of Self Assembled Monolayers of Different Wettabilities to Study Surface Selection and Primary Adhesion Processes of Green Algae (Enteromorpha) Zoospores. Applied and Enviornmental Microbiology 2000, 66 (8), 3249-3254.
44. Finlay, J. A.; Callow, M. E.; Ista, L. K.; Lopez, G. P.; Callow, J. A., The Influence of Surface Wettability on the Adhesion Strength of Settled Spores of the Green Alga Enteromorpha and the Diatom Amphora. Integrative and Comparative Biology 2002, 42 (6), 1116-1122.
45. Callow, J. A.; Callow, M. E.; Ista, L. K.; Lopez, G.; Chaudhury, M. K., The Influence of Surface Energy on the Wetting Behavior of the Spore Adhesive of Marine Alga Ulva Linza. Journal of Royal Society Interface 2005, 2, 319-325.
46. Krishnan, S.; Wang, N.; Ober, C. K.; Finlay, J. A.; Callow, M. E.; Callow, J. A.; Hexemer, A.; Sohn, K. E.; Kramer, E. J.; Fischer, D. A., Comparison of the Fouling Release Properties of Hydrophobic Fluorinated and Hydrophilic Pegylated Block Copolymer Surfaces: Attachment Strength of the Diatom Navicula and the Green Alga Ulva. Biomacromolecules 2006, 7 (5), 1449-1462.
47. Holland, R.; Dugdale, T. M.; Wetherbee, R.; Brennan, A. B.; Finlay, J. A.; Callow, J. A.; Callow, M. E., Adhesion and Motility of Fouling Diatoms on a Silicone Elastomer. Biofouling 2004, 20 (6), 323-329.
48. Schultz, M. P.; Bendick, J. A.; Holm, E. R.; Hertel, W. M., Economic Impact of Biofouling on a Naval Surface Ship. Biofouling 2010, 27 (1), 87-98.
49. Guo, S.; Puniredd, S. R.; Jańczewski, D.; Lee, S. S. C.; Teo, S. L. M.; He, T.; Zhu, X.; Vancso, G. J., Barnacle Larvae Exploring Surfaces with Variable Hydrophilicity: Influence of Morphology and Adhesion of “Footprint” Proteins by Afm. ACS Appl. Mater. Interfaces 2014, 6 (16), 13667-13676.
50. Aldred, N.; Høeg, J. T.; Maruzzo, D.; Clare, A. S., Analysis of the Behaviours Mediating Barnacle Cyprid Reversible Adhesion. PLoS ONE 2013, 8 (7), e68085.
51. Petrone, L.; Di Fino, A.; Aldred, N.; Sukkaew, P.; Ederth, T.; Clare, A. S.; Liedberg, B., Effects of Surface Charge and Gibbs Surface Energy on the Settlement Behaviour of Barnacle Cyprids (Balanus Amphitrite). Biofouling 2011, 27 (9), 1043-1055.
52. Aldred, N.; Ista, L. K.; Callow, M. E.; Callow, J. A.; Lopez, G. P.; Clare, A. S., Mussel (Mytilus Edulis) Byssus Deposition in Response to Variations in Surface Wettability. Journal of the Royal Society Interface 2006, 3 (6), 37-43.
53. Talley, L. D.; Pickard, G. L.; Emery, W. J.; Swift, J. H., Chapter 3 - Physical Properties of Seawater. In Descriptive Physical Oceanography (Sixth Edition), Academic Press: Boston, 2011; pp 29-65.
54. Talley, L. D.; Pickard, G. L.; Emery, W. J.; Swift, J. H., Chapter 4 - Typical Distributions of Water Characteristics. In Descriptive Physical Oceanography (Sixth Edition), Academic Press: Boston, 2011; pp 67-110.
59
CHAPTER 3. SELF-STRATIFIED SILOXANE-POLYURETHANE COATINGS FROM
DIPHENYL-DIMETHYL SILOXANE COPOLYMER; EFFECT OF SURFACE TEXTURE
ON FOULING RELEASE PERFORMANCE OF MODEL ORGANISMS.
Introduction
Water repelling surfaces are actively investigated for wide range of applications, from anti-ice
coatings, self-cleaning surfaces, microfluidic devices, liquid transport, oil water separation and non-
wetting fabrics, etc.1 Although their use in anti-fouling (AF)/fouling-release (FR) applications have shown
promising results towards some marine organisms, obtaining broad spectrum and long term FR
performance can be quite challenging.2, 3 Anti-fouling coatings based on the approach of surface texture
and microstructure have been investigated as a potential solution for combating biofouling. Inspired by
micro-topography features of shark-skin, research lead by Professor Anthony Brennan at University of
Florida developed engineered textured surfaces from polydimethyl siloxane (PDMS) elastomers known as
Sharklet AF™.4-8 Textured and engineered Sharklet AFTM surfaces demonstrated AF properties towards
several marine organisms (diatoms, green algae, bacteria and barnacle) in laboratory assays.6, 9, 10
However the roughness scale and size required for preventing settlement of one particular organism does
not necessarily prevent settlement of other organisms. In fact, surfaces that deter barnacle settlement
may provide a refuge to green algae spores or vice-versa.3, 6, 9 Therefore a hierarchical, newer version of
Sharklet AFTM surface was developed by superimposing topography that resists U. linza spores onto that
for barnacle cyprids.9 However this approach may not be very practical given that the number of identified
marine organisms that contribute to fouling has surpassed 4000.11, 12
The presence of surface features/texture have been shown to affect the wettability of surfaces.
Lotus leaves were one of the famous inspirations adapted from nature to engineer water repellent
materials.1 The observed water repellency of lotus leaves is attributed to its surface microstructure
(roughness).1, 13 Thus the concept of superhydrophobicity is a combination of surface chemistry and
surface roughness. Roughened hydrophobic surfaces can provide superhydrophobicity due to trapped air
pockets. This concept was explained by the Cassie-Baxter model (Figure 3.1 left), when water comes in
contact a solid-air-liquid an interface is formed and the water droplet sits on the air pockets.14 This stage
allows for the minimum contact between the solid and the liquid resulting in spherical water droplets,
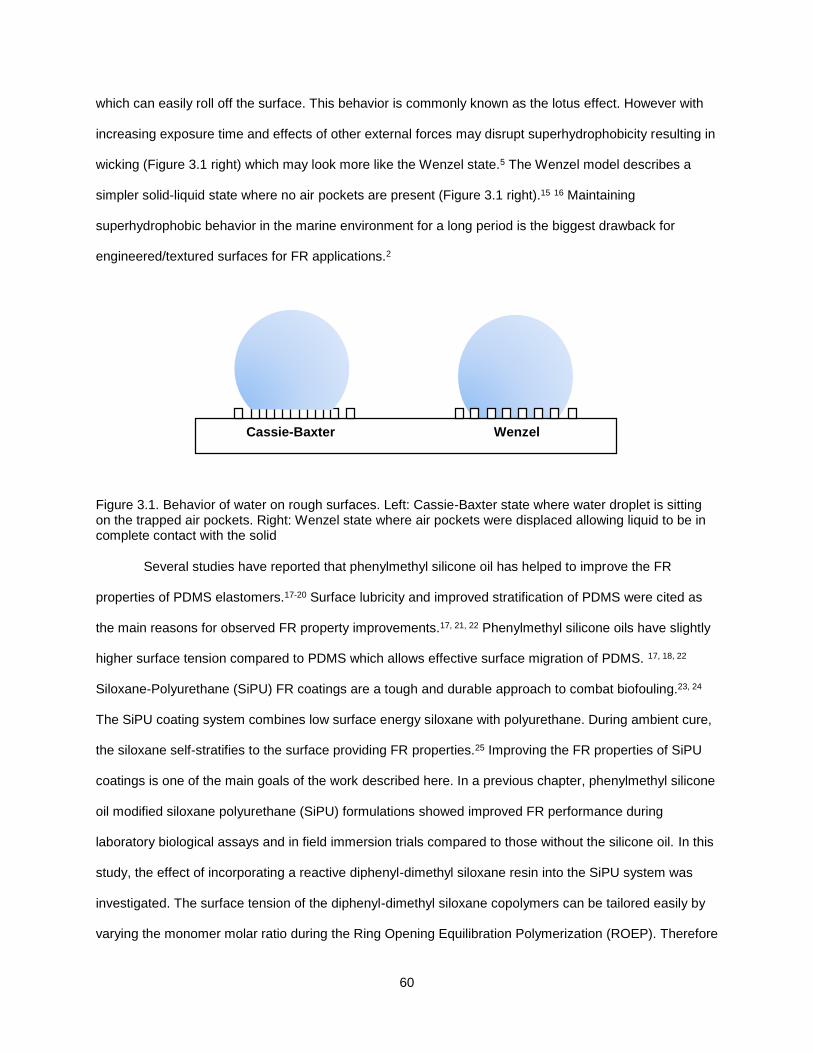
60
which can easily roll off the surface. This behavior is commonly known as the lotus effect. However with
increasing exposure time and effects of other external forces may disrupt superhydrophobicity resulting in
wicking (Figure 3.1 right) which may look more like the Wenzel state.5 The Wenzel model describes a
simpler solid-liquid state where no air pockets are present (Figure 3.1 right).15 16 Maintaining
superhydrophobic behavior in the marine environment for a long period is the biggest drawback for
engineered/textured surfaces for FR applications.2
Figure 3.1. Behavior of water on rough surfaces. Left: Cassie-Baxter state where water droplet is sitting on the trapped air pockets. Right: Wenzel state where air pockets were displaced allowing liquid to be in complete contact with the solid
Several studies have reported that phenylmethyl silicone oil has helped to improve the FR
properties of PDMS elastomers.17-20 Surface lubricity and improved stratification of PDMS were cited as
the main reasons for observed FR property improvements.17, 21, 22 Phenylmethyl silicone oils have slightly
higher surface tension compared to PDMS which allows effective surface migration of PDMS. 17, 18, 22
Siloxane-Polyurethane (SiPU) FR coatings are a tough and durable approach to combat biofouling.23, 24
The SiPU coating system combines low surface energy siloxane with polyurethane. During ambient cure,
the siloxane self-stratifies to the surface providing FR properties.25 Improving the FR properties of SiPU
coatings is one of the main goals of the work described here. In a previous chapter, phenylmethyl silicone
oil modified siloxane polyurethane (SiPU) formulations showed improved FR performance during
laboratory biological assays and in field immersion trials compared to those without the silicone oil. In this
study, the effect of incorporating a reactive diphenyl-dimethyl siloxane resin into the SiPU system was
investigated. The surface tension of the diphenyl-dimethyl siloxane copolymers can be tailored easily by
varying the monomer molar ratio during the Ring Opening Equilibration Polymerization (ROEP). Therefore
Cassie-Baxter Wenzel
61
diphenyl-dimethyl siloxane copolymers can be considered for tuning the surface properties of SiPU
coatings.
For this study, an aminopropyl terminated, 33% diphenyl- 66% dimethyl containing siloxane
copolymer was synthesized (APT-PDPDMS). Then the APT-PDPDMS was blended with APT-PDMS to
formulate SiPU coatings. Although it was unexpected, the SiPU coatings with APT-PDPDMS showed
unique topographical features which were rarely observed before for SiPU coatings. These surface
features were evident from surface scans obtained using Atomic Force Microscopy (AFM). Fouling
release performance was evaluated through laboratory biological assays for bacteria (Cytophaga lytica),
algae (Navicula incerta and Ulva linza), barnacles (Amphibalanus amphitrite), and mussels (Geukensia
demissa).
Experimental
Materials
Octamethylcyclotetrasiloxane (D4), octaphenylcyclotetrasiloxane (D4Ph), and bis (3-aminopropyl)-
tetramethyldisiloxane (BAPTMDS) were purchased from Gelest, Inc. Benzyltrimethylammonium hydroxide
(in 40% methanol), tetrahydrofuran (THF), 2-heptanone, toluene, chloroform-d (CDCl3), acetylacetone,
dibutyltin diacetate (DBTDAc) were purchased from Sigma Aldrich. Polyisocyanate Desmodur Z 4470 BA
was provided by Covestro. All reagents were used under as received conditions unless otherwise specified.
An acrylic polyol used for this study composed of 80% butyl acrylate (BA) and 20% 2-hydroxyethyl acrylate
(HEA) and synthesized following a procedure reported previously.26
Synthesis of Aminopropyl Terminated Poly (diphenyl-dimethylsiloxane) Copolymer (APT-
PDPDMS)
In this study 33% diphenyl containing siloxane copolymer was synthesized through ROEP
reaction of D4 and D4Ph, cyclic siloxane monomers (Figure 3.2). First D4 (129.61 g) and benzyltrimethyl
ammonium hydroxide (0.82 g) were combined in a 500 mL single neck round bottom flask. The content
was rotary evaporated for about 30 mins (to remove methanol from catalyst solution). The rotary
evaporated mixture was added to 4-neck, 500mL round bottom flask containing BAPTMDS (g) and a
reaction set up with mechanical stirring, reflux condenser, thermocouple and N2 purging. The reaction
temperature was set to 80 °C and allowed to equilibrate for 4 hrs. After 4 hrs D4Ph (171 g, white powder)
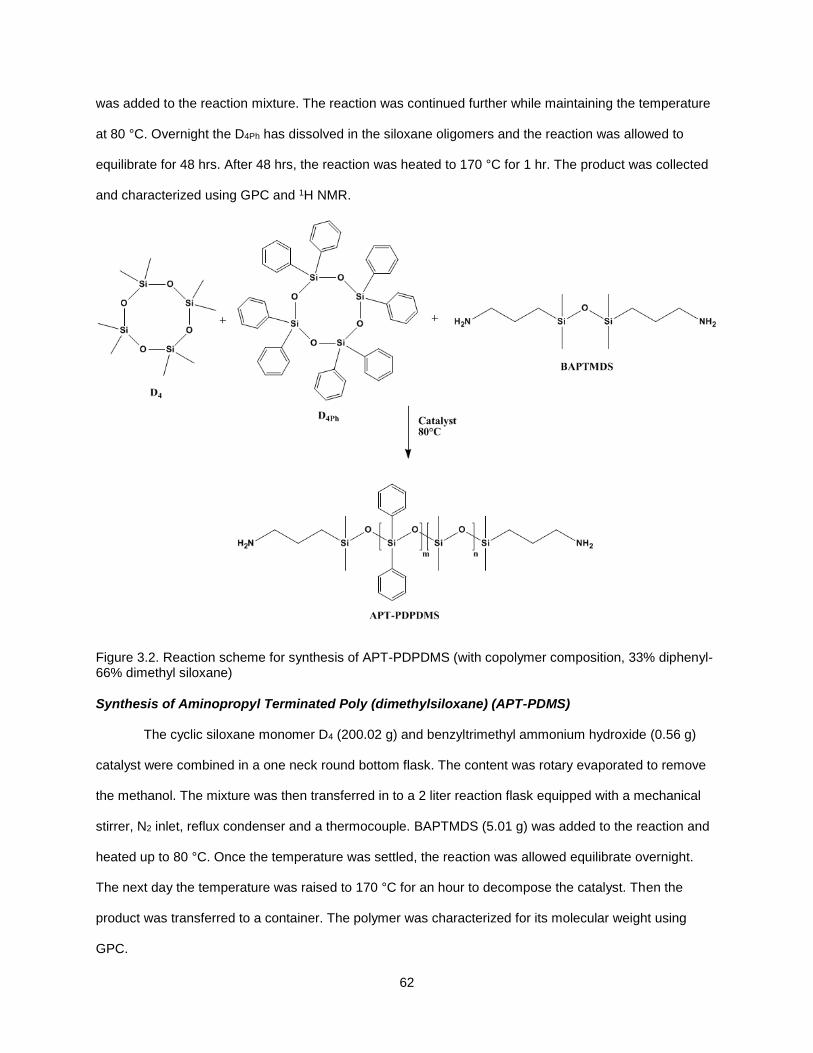
62
was added to the reaction mixture. The reaction was continued further while maintaining the temperature
at 80 °C. Overnight the D4Ph has dissolved in the siloxane oligomers and the reaction was allowed to
equilibrate for 48 hrs. After 48 hrs, the reaction was heated to 170 °C for 1 hr. The product was collected
and characterized using GPC and 1H NMR.
Figure 3.2. Reaction scheme for synthesis of APT-PDPDMS (with copolymer composition, 33% diphenyl- 66% dimethyl siloxane)
Synthesis of Aminopropyl Terminated Poly (dimethylsiloxane) (APT-PDMS)
The cyclic siloxane monomer D4 (200.02 g) and benzyltrimethyl ammonium hydroxide (0.56 g)
catalyst were combined in a one neck round bottom flask. The content was rotary evaporated to remove
the methanol. The mixture was then transferred in to a 2 liter reaction flask equipped with a mechanical
stirrer, N2 inlet, reflux condenser and a thermocouple. BAPTMDS (5.01 g) was added to the reaction and
heated up to 80 °C. Once the temperature was settled, the reaction was allowed equilibrate overnight.
The next day the temperature was raised to 170 °C for an hour to decompose the catalyst. Then the
product was transferred to a container. The polymer was characterized for its molecular weight using
GPC.
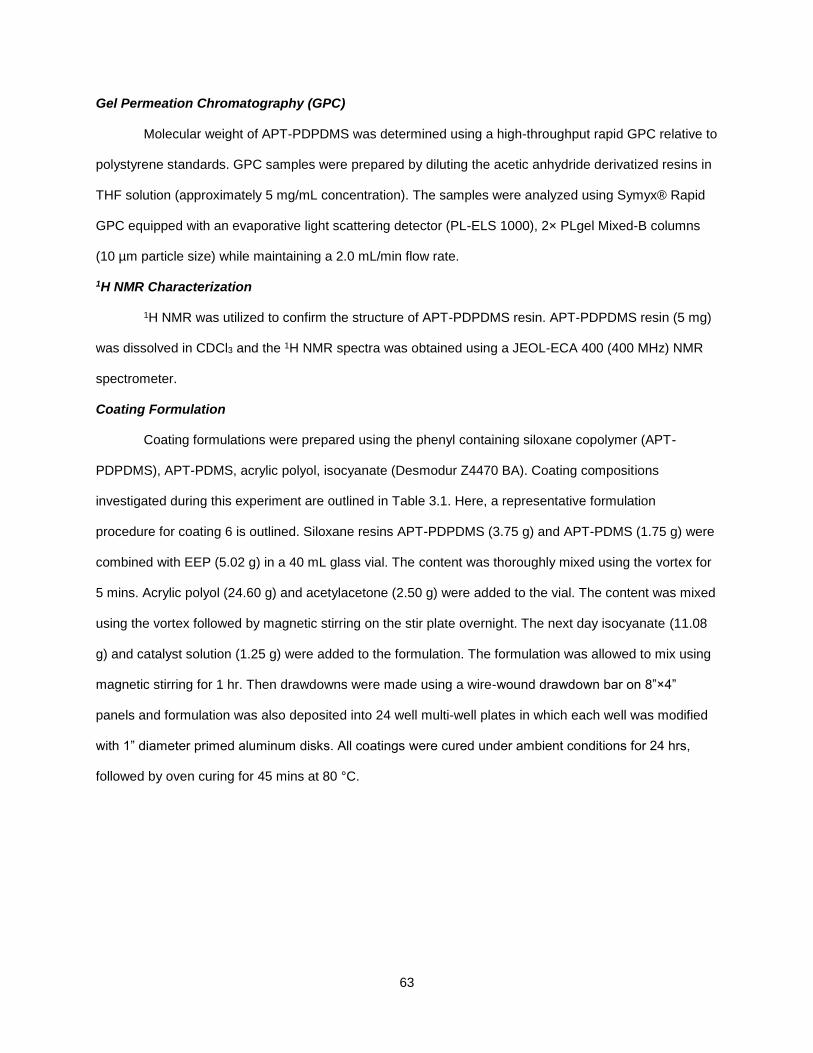
63
Gel Permeation Chromatography (GPC)
Molecular weight of APT-PDPDMS was determined using a high-throughput rapid GPC relative to
polystyrene standards. GPC samples were prepared by diluting the acetic anhydride derivatized resins in
THF solution (approximately 5 mg/mL concentration). The samples were analyzed using Symyx® Rapid
GPC equipped with an evaporative light scattering detector (PL-ELS 1000), 2× PLgel Mixed-B columns
(10 µm particle size) while maintaining a 2.0 mL/min flow rate.
1H NMR Characterization
1H NMR was utilized to confirm the structure of APT-PDPDMS resin. APT-PDPDMS resin (5 mg)
was dissolved in CDCl3 and the 1H NMR spectra was obtained using a JEOL-ECA 400 (400 MHz) NMR
spectrometer.
Coating Formulation
Coating formulations were prepared using the phenyl containing siloxane copolymer (APT-
PDPDMS), APT-PDMS, acrylic polyol, isocyanate (Desmodur Z4470 BA). Coating compositions
investigated during this experiment are outlined in Table 3.1. Here, a representative formulation
procedure for coating 6 is outlined. Siloxane resins APT-PDPDMS (3.75 g) and APT-PDMS (1.75 g) were
combined with EEP (5.02 g) in a 40 mL glass vial. The content was thoroughly mixed using the vortex for
5 mins. Acrylic polyol (24.60 g) and acetylacetone (2.50 g) were added to the vial. The content was mixed
using the vortex followed by magnetic stirring on the stir plate overnight. The next day isocyanate (11.08
g) and catalyst solution (1.25 g) were added to the formulation. The formulation was allowed to mix using
magnetic stirring for 1 hr. Then drawdowns were made using a wire-wound drawdown bar on 8”×4”
panels and formulation was also deposited into 24 well multi-well plates in which each well was modified
with 1” diameter primed aluminum disks. All coatings were cured under ambient conditions for 24 hrs,
followed by oven curing for 45 mins at 80 °C.
64
Table 3.1. Composition of experimental coatings. The percentage indicated for APT-PDPDMS and APT-PDMS is calculated based on total solids of combined SiPU formulation excluding the additives. The percentage indicated for EEP is calculated based on combined solids of siloxane resins
Coating #
APT-PDPDMS
(g)
APT-PDMS (g)
EEP (g) Acrylic Polyol
(g)
Pot-life extender
(g)
Desmodur Z 4470 BA
(g)
Catalyst solution
(g)
1 0.00 (0%) 5.02 (20%) 0.00 (0%) 24.61 2.51 11.07 1.26
2 0.00 (0%) 5.01 (20%) 2.51 (25%) 24.64 2.50 11.05 1.25
3 0.00 (0%) 5.01 (20%) 5.05 (50%) 24.61 2.51 11.07 1.26
4 1.26 (5%) 3.76 (15%) 0.00 (0%) 24.62 2.51 11.09 1.25
5 1.25 (5%) 3.76 (15%) 2.50 (25%) 24.67 2.51 11.05 1.26
6 1.25 (5%) 3.75 (15%) 5.02 (50%) 24.60 2.50 11.08 1.25
7 3.82 (15%) 1.26 (5%) 0.00 (0%) 24.62 2.52 11.08 1.25
8 3.79 (15%) 1.26 (5%) 2.50 (25%) 24.61 2.50 11.05 1.26
9 3.75 (15%) 1.25 (5%) 5.02 (50%) 24.63 2.51 11.05 1.25
10 5.00 (20%) 0.00 (0%) 0.00 (0%) 24.65 2.51 11.10 1.31
11 5.09 (20%) 0.00 (0%) 2.50 (25%) 24.60 2.50 11.08 1.25
12 5.07 (20%) 0.00 (0%) 5.07 (20%) 24.60 2.52 11.06 1.25
Preparation of Standard Coatings
Commercial coating standards Dow Corning T2 (silicone elastomer), Intersleek®700,
Intersleek®900, and Intersleek® 1100 (AkzoNobel International Paint) were prepared according to
manufacturer’s specifications to serve as standards. A pure polyurethane formulation without APT-PDMS
was also prepared to be included as a standard. All standards were prepared on both primed aluminum
panels and in 24-well plates in order to be evaluated along with the experimental coatings.
Water Aging
All the coatings were pre-leached for 28 days using running tap water. Both multi-well plates and
panels with coatings were placed in a tap-water aquarium system which automatically filled and emptied
65
every 4 hrs. Another set of coatings were immersed in artificial sea water for 28 days (ASW) and water
was manually changed every day.
Surface Characterization of Coatings
A Symyx® surface energy system was utilized to measure WCA and MICA for all experimental
coatings. Three measurements of each water and methylene iodide contact angle were obtained using
First Ten AngstromsTM software. The average WCA and MICA were used to calculate the SE for each
coating by Owens-Wendt method.27 Contact angle and SE analysis were performed both before and after
water aging.
Atomic Force Microscopy (AFM) was used to study the topography of experimental coatings. A
Dimension 3100 microscope with Nanoscope controller was used to scan the surface of experimental
coatings before and after water-leaching. A cantilever with a silicon probe (with a spring constant 0.1-0.6
N/m and resonant frequency 15-30 kHz) was used to scan a sample area of 20×20µm for each coating in
tapping mode under ambient conditions.
Biological Laboratory Assays
Growth and Release of Macroalgae (Ulva linza)
Following 28 days of pre-leaching, a set of multi-well plates were sent to Newcastle University for
evaluating FR properties towards U.linza. More detailed procedure of the U.linza growth and removal
assay using high throughput screening can be found elsewhere.28 Before conducting any analysis, all 24-
well plates were equilibrated in 0.22µm filtered seawater for 2 hrs. To each well containing coating, 1 mL
Ulva spore suspension adjusted to 0.05 OD at absorbance 660 nm (3.3 x 10⁵ spores mL-1) in single
strength enriched seawater medium was added. Spores settled on the plates were grown for 6 days
inside an illuminated incubator at 18°C with a 16:8 light: dark cycle (photon flux density 45 μmol.m-2.s-1)
with renewal of nutrients every 48 hours. Post-settlement, No washing was performed to remove
unsettled spores. After 6 days, first row of wells (6) were maintained untouched, which was later used to
quantify the biomass generated for each coating. Consequent row of wells on each plate were sprayed
using the spinjet apparatus at 111 kPa impact pressure. In order to quantify the biomass, chlorophyll
extraction was performed by adding 1 mL of DMSO to each well followed by determining fluorescence at
excitation at 360 nm and emission at 670 nm wavelengths. Fluorescence is directly proportional to the
66
biomass present on each coating surface. The removal of sporelings corresponding to 111 kPa water jet
treatment was compared with the unsprayed wells (that were used to assess sporeling growth above).
Growth and Release of Microalgae (Navicula incerta)
Fouling release properties of coatings towards microalgae (N.incerta) were evaluated through a
laboratory assay conducted at NDSU using methods described previously.29 30 Following the 28 day pre-
leach, 1 mL of diatom (N.incerta) suspension with 4 x 10⁵ cells/mL (adjusted to 0.03 OD at absorbance
660 nm) in Guillard’s F2 medium was deposited in to each well with coating. In order to facilitate cell
attachment, the plates were incubated for 2 hrs under ambient conditions. The 1st column of wells (3)
were left untreated to be used as a measurement of initial amount of cell attachment. Consequent coating
wells were then subjected to water jet treatment, with water jet pressure of 20 psi (138k Pa) for 10 s.
Biomass on untreated and treated wells was quantified through chlorophyll extraction using 0.5 mL of
DMSO and measuring fluorescence of the extracts (excitation wavelength at 360 nm; emission
wavelength at 670 nm). The relative fluorescence from the extract is directly proportional to the amount of
algae biomass present on the coating surface. Percent removal of diatoms was determined using relative
fluorescence of non-jetted and water-jetted wells.
Bacterial (Cellulophaga lytica) Biofilm Adhesion
Fouling-release properties of the coatings towards marine bacterium C.lytica was performed at
NDSU following the procedure outlined previously.30 31 Multi-well plates containing coatings were
inoculated by dispensing a 1 mL suspension of marine bacteria (C.lytica; 107 cells/mL) in FSW
supplemented with 0.5 g/L of peptone and 0.1 g/L of yeast extract. Bacteria settlement was facilitated by
static incubation of multi-well plates for 24 hrs at 28°C. The first column of wells (3) were untreated and
used as the initial bacterial biofilm growth while the next column was treated with water jet treatment at 20
psi (138 kPa) for 5 seconds. Then a 0.3% crystal violet solution in deionized water was used to stain the
coating surfaces. The stained crystal violet was extracted using 33% acetic acid solution and eluates
were collected from each coating well. The resulting eluates (0.15 mL aliquots) were measured for
absorbance at 600nm wavelength. The absorbance values obtained for eluates were directly proportional
to the amount of bacterial biofilm present on coatings. Biofilm removal from the coatings was quantified
by comparing the relative absorbance values obtained for the non-jetted and water-jetted wells.
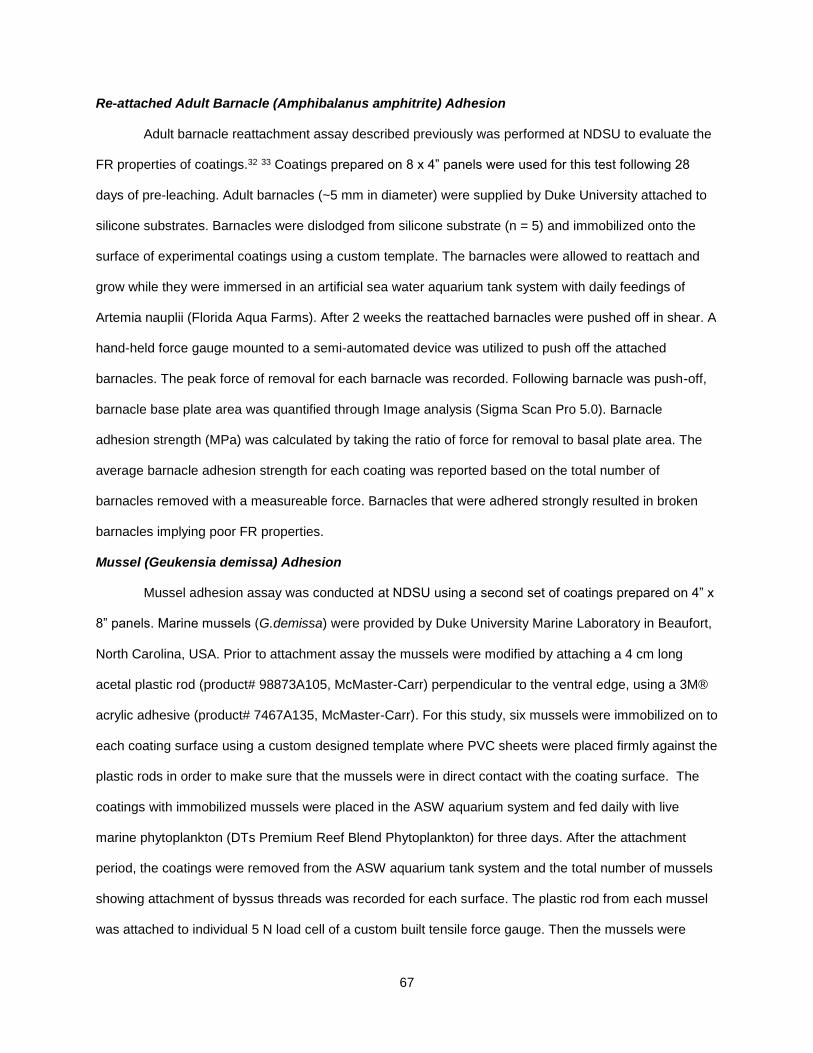
67
Re-attached Adult Barnacle (Amphibalanus amphitrite) Adhesion
Adult barnacle reattachment assay described previously was performed at NDSU to evaluate the
FR properties of coatings.32 33 Coatings prepared on 8 x 4” panels were used for this test following 28
days of pre-leaching. Adult barnacles (~5 mm in diameter) were supplied by Duke University attached to
silicone substrates. Barnacles were dislodged from silicone substrate (n = 5) and immobilized onto the
surface of experimental coatings using a custom template. The barnacles were allowed to reattach and
grow while they were immersed in an artificial sea water aquarium tank system with daily feedings of
Artemia nauplii (Florida Aqua Farms). After 2 weeks the reattached barnacles were pushed off in shear. A
hand-held force gauge mounted to a semi-automated device was utilized to push off the attached
barnacles. The peak force of removal for each barnacle was recorded. Following barnacle was push-off,
barnacle base plate area was quantified through Image analysis (Sigma Scan Pro 5.0). Barnacle
adhesion strength (MPa) was calculated by taking the ratio of force for removal to basal plate area. The
average barnacle adhesion strength for each coating was reported based on the total number of
barnacles removed with a measureable force. Barnacles that were adhered strongly resulted in broken
barnacles implying poor FR properties.
Mussel (Geukensia demissa) Adhesion
Mussel adhesion assay was conducted at NDSU using a second set of coatings prepared on 4” x
8” panels. Marine mussels (G.demissa) were provided by Duke University Marine Laboratory in Beaufort,
North Carolina, USA. Prior to attachment assay the mussels were modified by attaching a 4 cm long
acetal plastic rod (product# 98873A105, McMaster-Carr) perpendicular to the ventral edge, using a 3M®
acrylic adhesive (product# 7467A135, McMaster-Carr). For this study, six mussels were immobilized on to
each coating surface using a custom designed template where PVC sheets were placed firmly against the
plastic rods in order to make sure that the mussels were in direct contact with the coating surface. The
coatings with immobilized mussels were placed in the ASW aquarium system and fed daily with live
marine phytoplankton (DTs Premium Reef Blend Phytoplankton) for three days. After the attachment
period, the coatings were removed from the ASW aquarium tank system and the total number of mussels
showing attachment of byssus threads was recorded for each surface. The plastic rod from each mussel
was attached to individual 5 N load cell of a custom built tensile force gauge. Then the mussels were
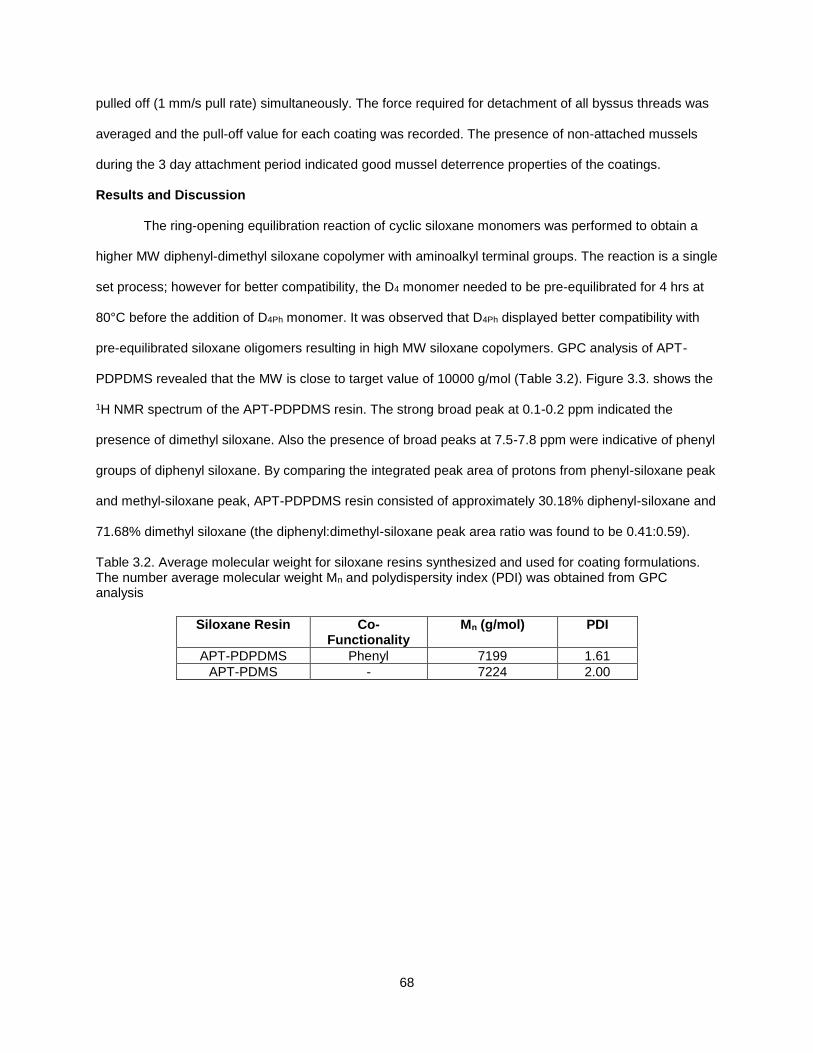
68
pulled off (1 mm/s pull rate) simultaneously. The force required for detachment of all byssus threads was
averaged and the pull-off value for each coating was recorded. The presence of non-attached mussels
during the 3 day attachment period indicated good mussel deterrence properties of the coatings.
Results and Discussion
The ring-opening equilibration reaction of cyclic siloxane monomers was performed to obtain a
higher MW diphenyl-dimethyl siloxane copolymer with aminoalkyl terminal groups. The reaction is a single
set process; however for better compatibility, the D4 monomer needed to be pre-equilibrated for 4 hrs at
80°C before the addition of D4Ph monomer. It was observed that D4Ph displayed better compatibility with
pre-equilibrated siloxane oligomers resulting in high MW siloxane copolymers. GPC analysis of APT-
PDPDMS revealed that the MW is close to target value of 10000 g/mol (Table 3.2). Figure 3.3. shows the
1H NMR spectrum of the APT-PDPDMS resin. The strong broad peak at 0.1-0.2 ppm indicated the
presence of dimethyl siloxane. Also the presence of broad peaks at 7.5-7.8 ppm were indicative of phenyl
groups of diphenyl siloxane. By comparing the integrated peak area of protons from phenyl-siloxane peak
and methyl-siloxane peak, APT-PDPDMS resin consisted of approximately 30.18% diphenyl-siloxane and
71.68% dimethyl siloxane (the diphenyl:dimethyl-siloxane peak area ratio was found to be 0.41:0.59).
Table 3.2. Average molecular weight for siloxane resins synthesized and used for coating formulations. The number average molecular weight Mn and polydispersity index (PDI) was obtained from GPC analysis
Siloxane Resin Co-Functionality
Mn (g/mol) PDI
APT-PDPDMS Phenyl 7199 1.61
APT-PDMS - 7224 2.00
69
Figure 3.3. 1H NMR of APT-PDPDMS (obtained using a dilute sample in CDCl3) with peak assignments
In order to explore the effect of phenyl content on the performance of the siloxane-polyurethane
coatings, a series of coatings were prepared containing mixtures of APT-PDPDMS and APT-PDMS as
shown in Table 3.1 In the past, adding EEP has shown to affect the self-stratification of APT-PDMS.23
Thus varying amounts of EEP were also used to evaluate effects of additional solvent on FR properties.
Considering the siloxane resin composition of the formulations, coatings 1-6 have a higher content of
APT-PDMS rather than APT-PDPDMS; the opposite relationship is evident for coatings 7-12. In each
combination of APT-PDMS and APT-PDMS, coatings with no EEP, 25% EEP, and 50% EEP were
included. Figure 3.4 shows the WCAs and MICAs for the experimental coatings following water
immersion. The coatings with higher APT-PDMS content (1-6) showed similar WCAs and MICAs after
pre-leaching for 28 days, regardless of the variations in solvent (EEP) content. In contrast, the coatings
with higher APT-PDPDMS content displayed WCAs above 100°; relatively higher than those for coatings
1-6. Compared to all experimental coatings, coatings 7-9 showed the highest MICAs while coatings 10-12
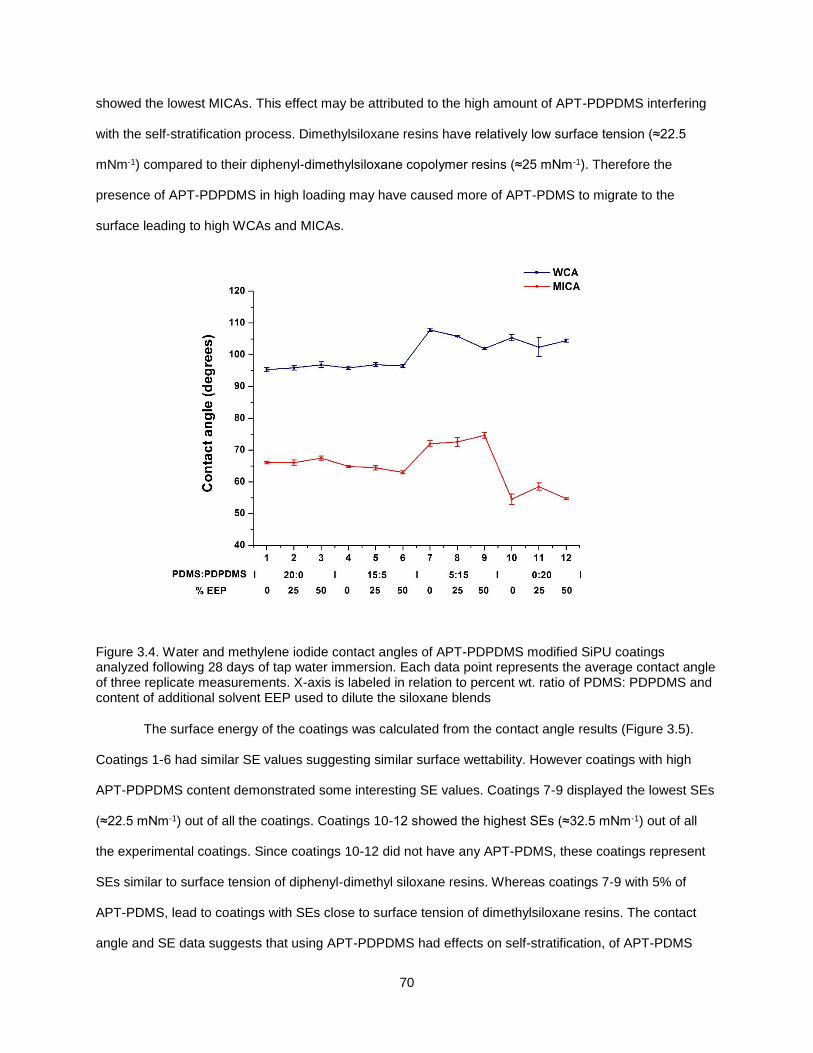
70
showed the lowest MICAs. This effect may be attributed to the high amount of APT-PDPDMS interfering
with the self-stratification process. Dimethylsiloxane resins have relatively low surface tension (≈22.5
mNm-1) compared to their diphenyl-dimethylsiloxane copolymer resins (≈25 mNm-1). Therefore the
presence of APT-PDPDMS in high loading may have caused more of APT-PDMS to migrate to the
surface leading to high WCAs and MICAs.
Figure 3.4. Water and methylene iodide contact angles of APT-PDPDMS modified SiPU coatings analyzed following 28 days of tap water immersion. Each data point represents the average contact angle of three replicate measurements. X-axis is labeled in relation to percent wt. ratio of PDMS: PDPDMS and content of additional solvent EEP used to dilute the siloxane blends
The surface energy of the coatings was calculated from the contact angle results (Figure 3.5).
Coatings 1-6 had similar SE values suggesting similar surface wettability. However coatings with high
APT-PDPDMS content demonstrated some interesting SE values. Coatings 7-9 displayed the lowest SEs
(≈22.5 mNm-1) out of all the coatings. Coatings 10-12 showed the highest SEs (≈32.5 mNm-1) out of all
the experimental coatings. Since coatings 10-12 did not have any APT-PDMS, these coatings represent
SEs similar to surface tension of diphenyl-dimethyl siloxane resins. Whereas coatings 7-9 with 5% of
APT-PDMS, lead to coatings with SEs close to surface tension of dimethylsiloxane resins. The contact
angle and SE data suggests that using APT-PDPDMS had effects on self-stratification, of APT-PDMS
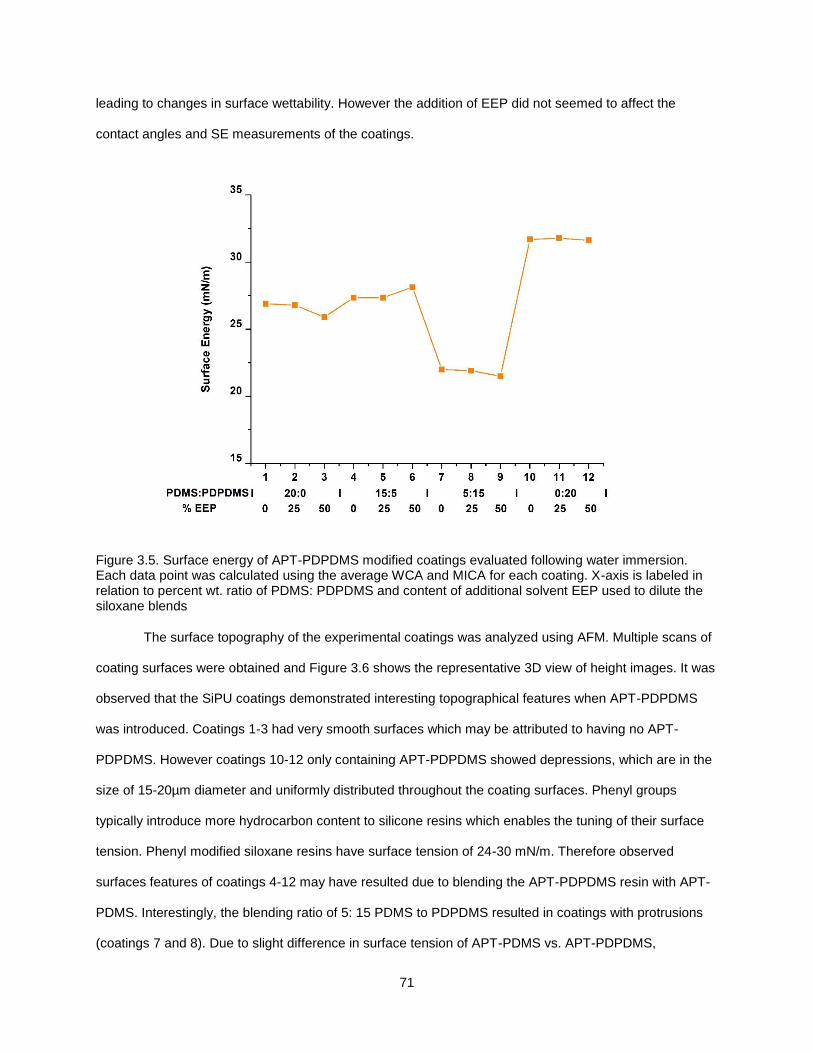
71
leading to changes in surface wettability. However the addition of EEP did not seemed to affect the
contact angles and SE measurements of the coatings.
Figure 3.5. Surface energy of APT-PDPDMS modified coatings evaluated following water immersion. Each data point was calculated using the average WCA and MICA for each coating. X-axis is labeled in relation to percent wt. ratio of PDMS: PDPDMS and content of additional solvent EEP used to dilute the siloxane blends
The surface topography of the experimental coatings was analyzed using AFM. Multiple scans of
coating surfaces were obtained and Figure 3.6 shows the representative 3D view of height images. It was
observed that the SiPU coatings demonstrated interesting topographical features when APT-PDPDMS
was introduced. Coatings 1-3 had very smooth surfaces which may be attributed to having no APT-
PDPDMS. However coatings 10-12 only containing APT-PDPDMS showed depressions, which are in the
size of 15-20µm diameter and uniformly distributed throughout the coating surfaces. Phenyl groups
typically introduce more hydrocarbon content to silicone resins which enables the tuning of their surface
tension. Phenyl modified siloxane resins have surface tension of 24-30 mN/m. Therefore observed
surfaces features of coatings 4-12 may have resulted due to blending the APT-PDPDMS resin with APT-
PDMS. Interestingly, the blending ratio of 5: 15 PDMS to PDPDMS resulted in coatings with protrusions
(coatings 7 and 8). Due to slight difference in surface tension of APT-PDMS vs. APT-PDPDMS,
72
dimethylsiloxane preferably migrated to the surface minimizing the surface energy. This rearrangement
may have led to spike like surface features. Additionally results observed for contact angle and SE
measurements were in agreement with variation in surface features observed through AFM imaging.SE
Although addition of EEP did not seemed to affect the contact angle and SE of phenyl modified
coatings, surface topography of phenyl modified coatings showed some interesting trends. In general,
increasing EEP content resulted in more uniform sized and fairly well spaced surface features for APT-
PDPDMS modified coatings. The solvent EEP has a high boiling point (169 °C) and low evaporation rate
(0.12, relative to 1 for butyl acetate) compared other solvents used in the SiPU formulation. Slow
evaporation of EEP during curing process my allow solvent-polymer interactions leading to changes in
surface morphology of coatings. Previous studies show that solvent-polymer interactions of polystyrene-
b-PDMS under different vapor pressure affect the size and scale of surface domains.34
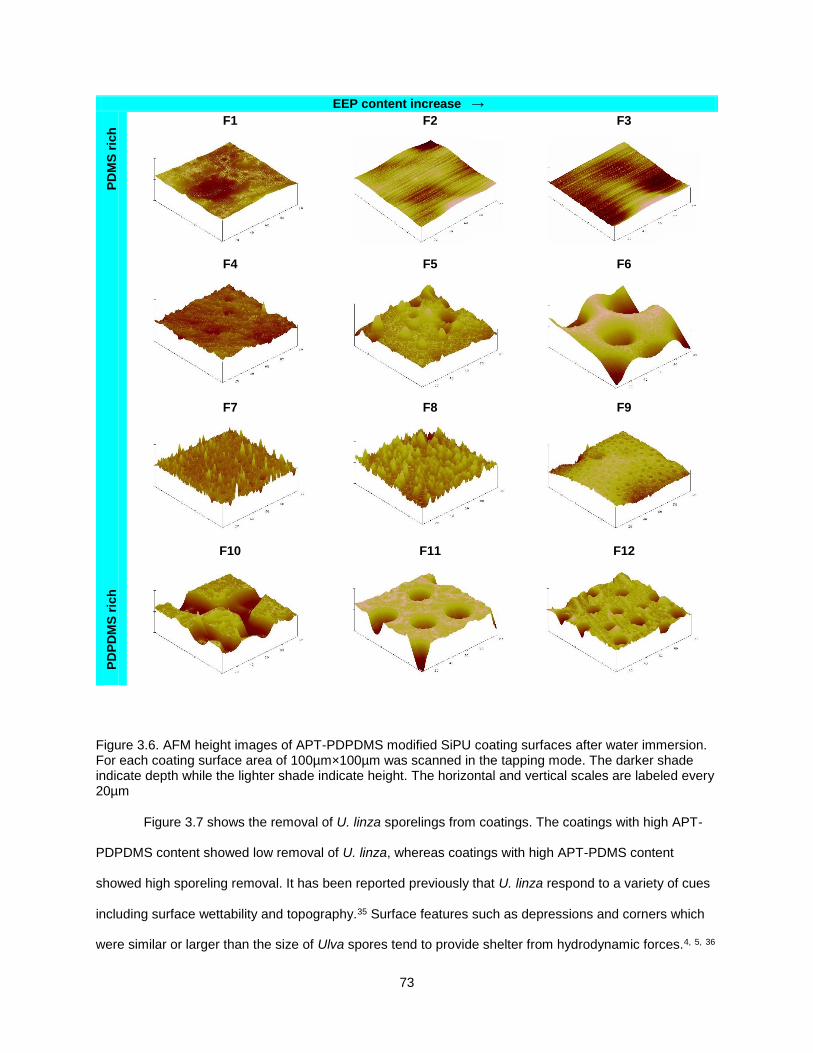
73
Figure 3.6. AFM height images of APT-PDPDMS modified SiPU coating surfaces after water immersion. For each coating surface area of 100µm×100µm was scanned in the tapping mode. The darker shade indicate depth while the lighter shade indicate height. The horizontal and vertical scales are labeled every 20µm
Figure 3.7 shows the removal of U. linza sporelings from coatings. The coatings with high APT-
PDPDMS content showed low removal of U. linza, whereas coatings with high APT-PDMS content
showed high sporeling removal. It has been reported previously that U. linza respond to a variety of cues
including surface wettability and topography.35 Surface features such as depressions and corners which
were similar or larger than the size of Ulva spores tend to provide shelter from hydrodynamic forces.4, 5, 36
EEP content increase → P
DP
DM
S r
ich
P
DM
S r
ich
F1 F2 F3
F4 F5 F6
F7 F8 F9
F10 F11 F12
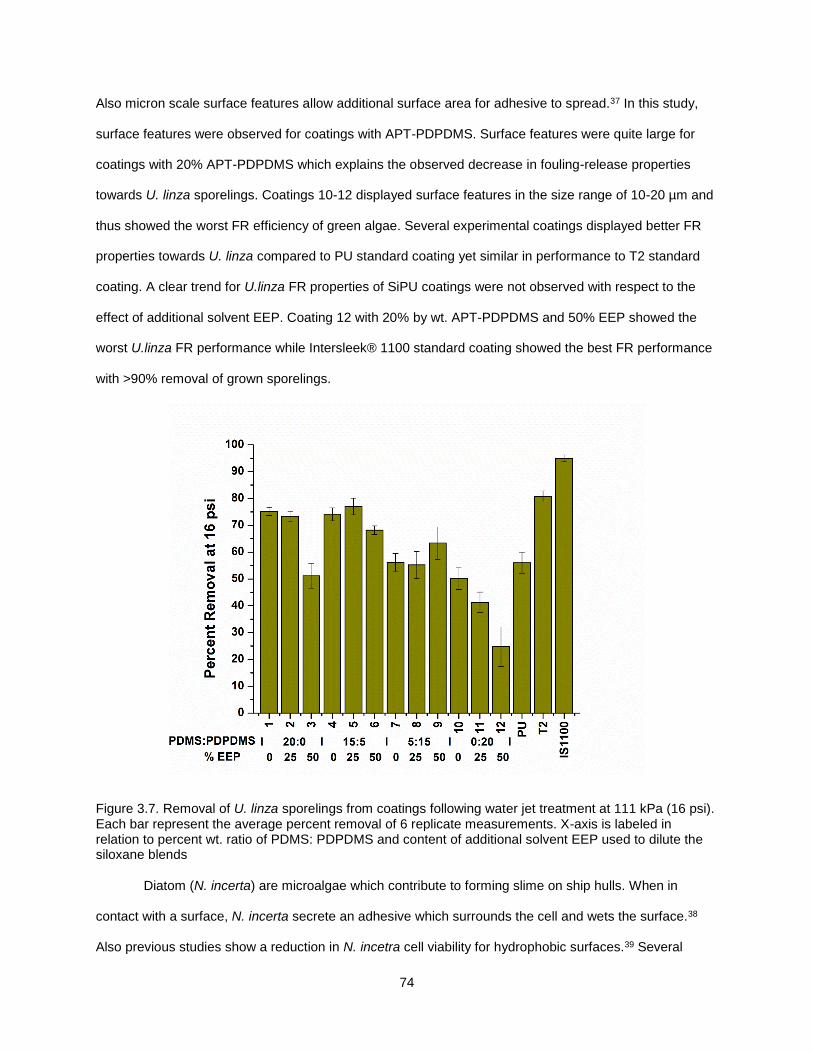
74
Also micron scale surface features allow additional surface area for adhesive to spread.37 In this study,
surface features were observed for coatings with APT-PDPDMS. Surface features were quite large for
coatings with 20% APT-PDPDMS which explains the observed decrease in fouling-release properties
towards U. linza sporelings. Coatings 10-12 displayed surface features in the size range of 10-20 µm and
thus showed the worst FR efficiency of green algae. Several experimental coatings displayed better FR
properties towards U. linza compared to PU standard coating yet similar in performance to T2 standard
coating. A clear trend for U.linza FR properties of SiPU coatings were not observed with respect to the
effect of additional solvent EEP. Coating 12 with 20% by wt. APT-PDPDMS and 50% EEP showed the
worst U.linza FR performance while Intersleek® 1100 standard coating showed the best FR performance
with >90% removal of grown sporelings.
Figure 3.7. Removal of U. linza sporelings from coatings following water jet treatment at 111 kPa (16 psi). Each bar represent the average percent removal of 6 replicate measurements. X-axis is labeled in relation to percent wt. ratio of PDMS: PDPDMS and content of additional solvent EEP used to dilute the siloxane blends
Diatom (N. incerta) are microalgae which contribute to forming slime on ship hulls. When in
contact with a surface, N. incerta secrete an adhesive which surrounds the cell and wets the surface.38
Also previous studies show a reduction in N. incetra cell viability for hydrophobic surfaces.39 Several
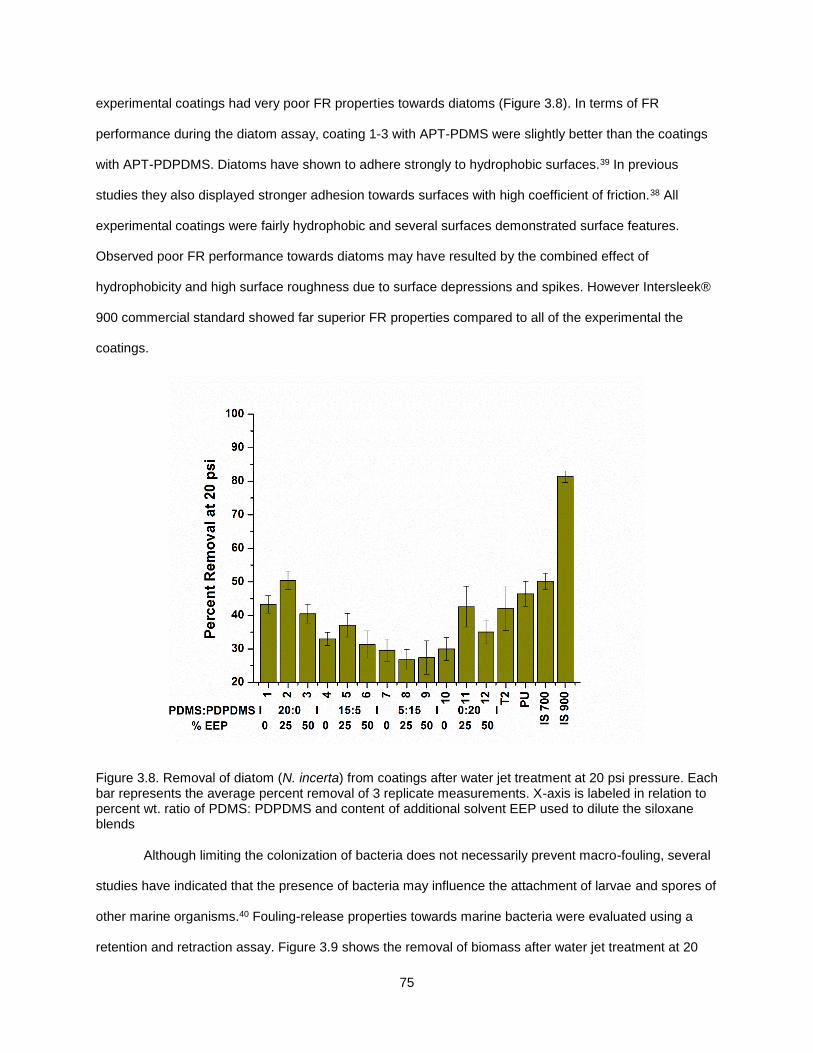
75
experimental coatings had very poor FR properties towards diatoms (Figure 3.8). In terms of FR
performance during the diatom assay, coating 1-3 with APT-PDMS were slightly better than the coatings
with APT-PDPDMS. Diatoms have shown to adhere strongly to hydrophobic surfaces.39 In previous
studies they also displayed stronger adhesion towards surfaces with high coefficient of friction.38 All
experimental coatings were fairly hydrophobic and several surfaces demonstrated surface features.
Observed poor FR performance towards diatoms may have resulted by the combined effect of
hydrophobicity and high surface roughness due to surface depressions and spikes. However Intersleek®
900 commercial standard showed far superior FR properties compared to all of the experimental the
coatings.
Figure 3.8. Removal of diatom (N. incerta) from coatings after water jet treatment at 20 psi pressure. Each bar represents the average percent removal of 3 replicate measurements. X-axis is labeled in relation to percent wt. ratio of PDMS: PDPDMS and content of additional solvent EEP used to dilute the siloxane blends
Although limiting the colonization of bacteria does not necessarily prevent macro-fouling, several
studies have indicated that the presence of bacteria may influence the attachment of larvae and spores of
other marine organisms.40 Fouling-release properties towards marine bacteria were evaluated using a
retention and retraction assay. Figure 3.9 shows the removal of biomass after water jet treatment at 20
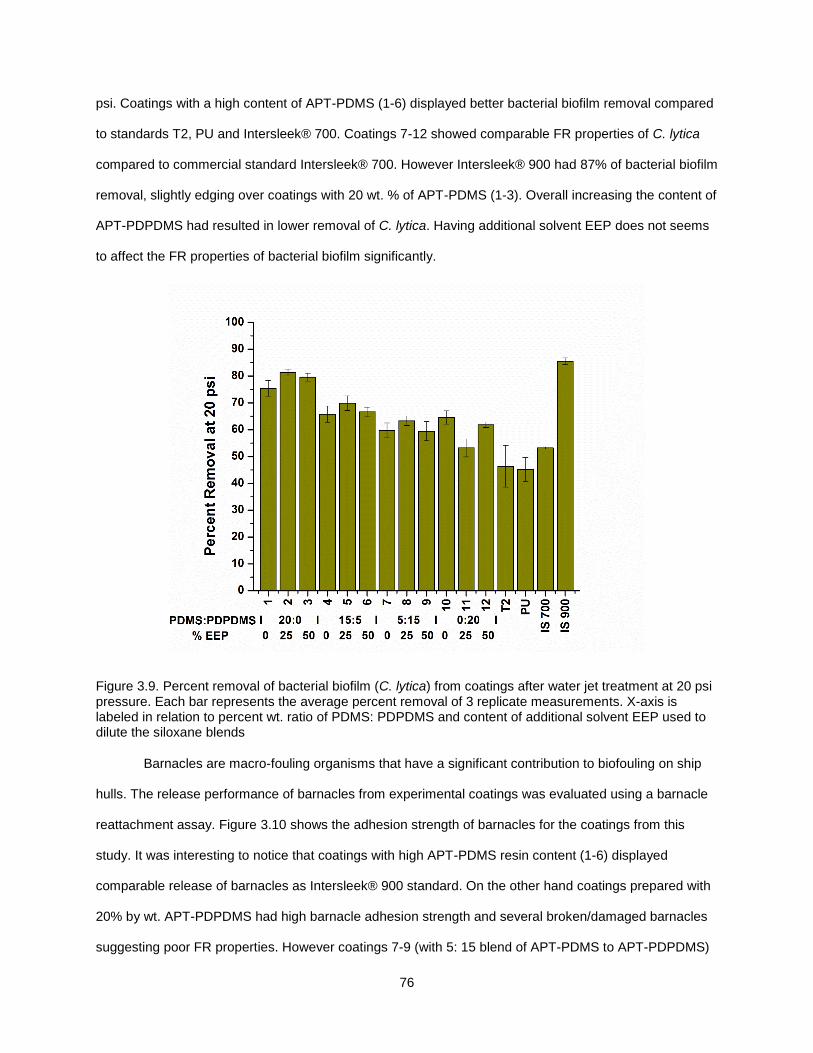
76
psi. Coatings with a high content of APT-PDMS (1-6) displayed better bacterial biofilm removal compared
to standards T2, PU and Intersleek® 700. Coatings 7-12 showed comparable FR properties of C. lytica
compared to commercial standard Intersleek® 700. However Intersleek® 900 had 87% of bacterial biofilm
removal, slightly edging over coatings with 20 wt. % of APT-PDMS (1-3). Overall increasing the content of
APT-PDPDMS had resulted in lower removal of C. lytica. Having additional solvent EEP does not seems
to affect the FR properties of bacterial biofilm significantly.
Figure 3.9. Percent removal of bacterial biofilm (C. lytica) from coatings after water jet treatment at 20 psi pressure. Each bar represents the average percent removal of 3 replicate measurements. X-axis is labeled in relation to percent wt. ratio of PDMS: PDPDMS and content of additional solvent EEP used to dilute the siloxane blends
Barnacles are macro-fouling organisms that have a significant contribution to biofouling on ship
hulls. The release performance of barnacles from experimental coatings was evaluated using a barnacle
reattachment assay. Figure 3.10 shows the adhesion strength of barnacles for the coatings from this
study. It was interesting to notice that coatings with high APT-PDMS resin content (1-6) displayed
comparable release of barnacles as Intersleek® 900 standard. On the other hand coatings prepared with
20% by wt. APT-PDPDMS had high barnacle adhesion strength and several broken/damaged barnacles
suggesting poor FR properties. However coatings 7-9 (with 5: 15 blend of APT-PDMS to APT-PDPDMS)
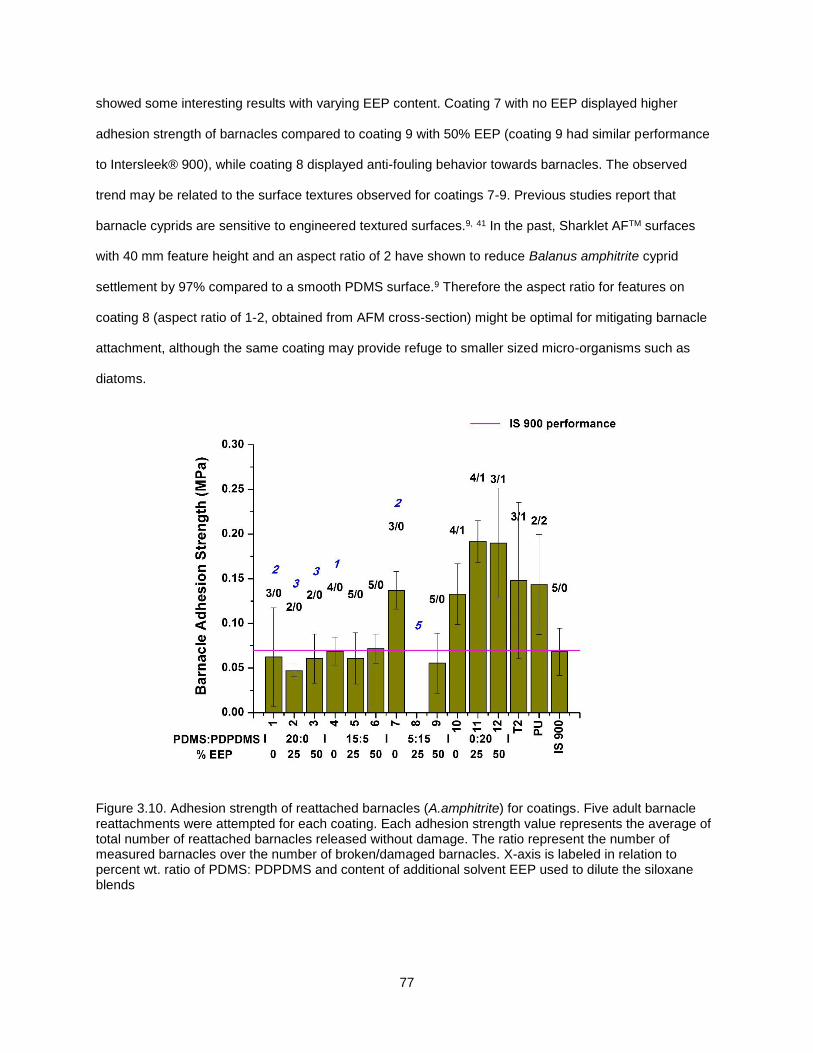
77
showed some interesting results with varying EEP content. Coating 7 with no EEP displayed higher
adhesion strength of barnacles compared to coating 9 with 50% EEP (coating 9 had similar performance
to Intersleek® 900), while coating 8 displayed anti-fouling behavior towards barnacles. The observed
trend may be related to the surface textures observed for coatings 7-9. Previous studies report that
barnacle cyprids are sensitive to engineered textured surfaces.9, 41 In the past, Sharklet AFTM surfaces
with 40 mm feature height and an aspect ratio of 2 have shown to reduce Balanus amphitrite cyprid
settlement by 97% compared to a smooth PDMS surface.9 Therefore the aspect ratio for features on
coating 8 (aspect ratio of 1-2, obtained from AFM cross-section) might be optimal for mitigating barnacle
attachment, although the same coating may provide refuge to smaller sized micro-organisms such as
diatoms.
Figure 3.10. Adhesion strength of reattached barnacles (A.amphitrite) for coatings. Five adult barnacle reattachments were attempted for each coating. Each adhesion strength value represents the average of total number of reattached barnacles released without damage. The ratio represent the number of measured barnacles over the number of broken/damaged barnacles. X-axis is labeled in relation to percent wt. ratio of PDMS: PDPDMS and content of additional solvent EEP used to dilute the siloxane blends
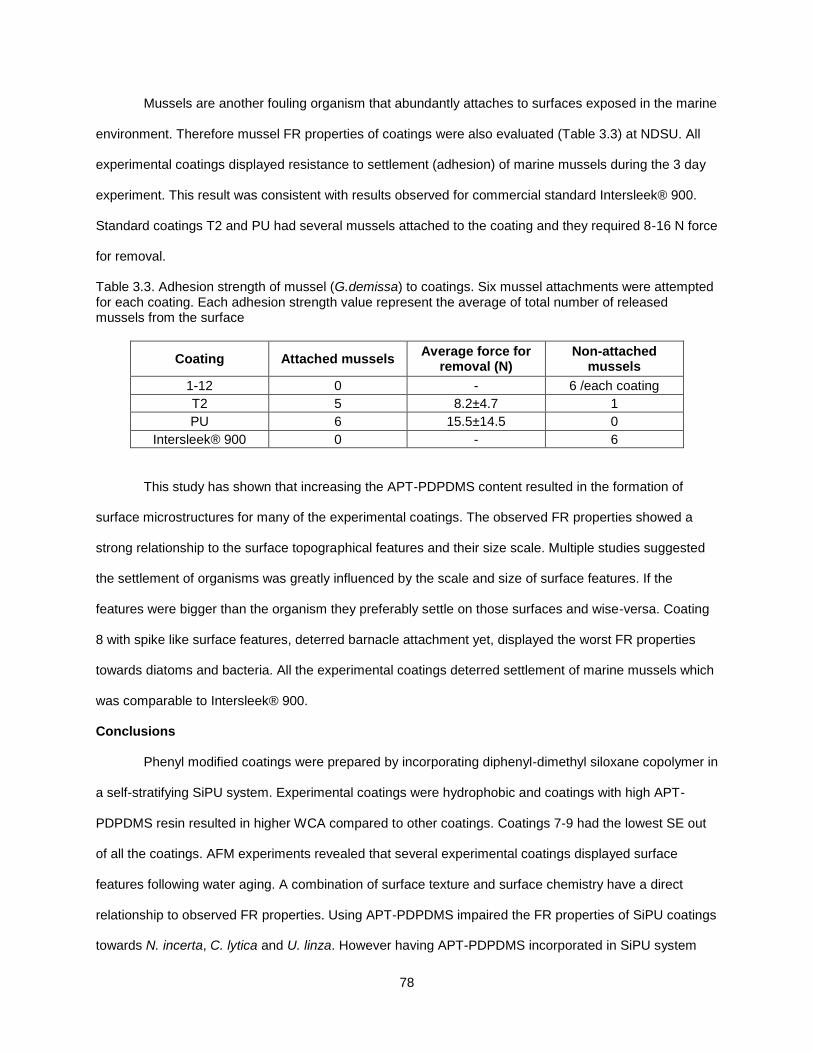
78
Mussels are another fouling organism that abundantly attaches to surfaces exposed in the marine
environment. Therefore mussel FR properties of coatings were also evaluated (Table 3.3) at NDSU. All
experimental coatings displayed resistance to settlement (adhesion) of marine mussels during the 3 day
experiment. This result was consistent with results observed for commercial standard Intersleek® 900.
Standard coatings T2 and PU had several mussels attached to the coating and they required 8-16 N force
for removal.
Table 3.3. Adhesion strength of mussel (G.demissa) to coatings. Six mussel attachments were attempted for each coating. Each adhesion strength value represent the average of total number of released mussels from the surface
Coating Attached mussels Average force for
removal (N) Non-attached
mussels
1-12 0 - 6 /each coating
T2 5 8.2±4.7 1
PU 6 15.5±14.5 0
Intersleek® 900 0 - 6
This study has shown that increasing the APT-PDPDMS content resulted in the formation of
surface microstructures for many of the experimental coatings. The observed FR properties showed a
strong relationship to the surface topographical features and their size scale. Multiple studies suggested
the settlement of organisms was greatly influenced by the scale and size of surface features. If the
features were bigger than the organism they preferably settle on those surfaces and wise-versa. Coating
8 with spike like surface features, deterred barnacle attachment yet, displayed the worst FR properties
towards diatoms and bacteria. All the experimental coatings deterred settlement of marine mussels which
was comparable to Intersleek® 900.
Conclusions
Phenyl modified coatings were prepared by incorporating diphenyl-dimethyl siloxane copolymer in
a self-stratifying SiPU system. Experimental coatings were hydrophobic and coatings with high APT-
PDPDMS resin resulted in higher WCA compared to other coatings. Coatings 7-9 had the lowest SE out
of all the coatings. AFM experiments revealed that several experimental coatings displayed surface
features following water aging. A combination of surface texture and surface chemistry have a direct
relationship to observed FR properties. Using APT-PDPDMS impaired the FR properties of SiPU coatings
towards N. incerta, C. lytica and U. linza. However having APT-PDPDMS incorporated in SiPU system
79
lead to anti-fouling properties towards macro-fouling organisms. Coating 8 did not allow any barnacles to
reattach to the surface, outperforming all standards including Intersleek® 900. Interestingly, none of the
experimental coatings allowed any mussels to attach displaying anti-fouling properties. Overall, the
results suggest that incorporation of the diphenyl-dimethyl siloxane copolymer negatively affected the FR
properties towards micro-foulers yet lead to anti-fouling behavior towards macro-foulers. This study
demonstrated that surface texture dependent anti-fouling/FR solution may not be a practical solution
given the number of marine organisms and their complex adhesion profiles.
References
1. Zhang, X.; Shi, F.; Niu, J.; Jiang, Y.; Wang, Z., Superhydrophobic Surfaces: From Structural Control to Functional Application. Journal of Materials Chemistry 2008, 18 (6), 621-633.
2. Lewis, H. Z. a. R. L. a. J., Engineering Nanoscale Roughness on Hydrophobic Surface—Preliminary Assessment of Fouling Behaviour. Science and Technology of Advanced Materials 2005, 6 (3-4), 236.
3. Genzer, J.; Efimenko, K., Recent Developments in Superhydrophobic Surfaces and their Relevance to Marine Fouling: A Review. Biofouling 2006, 22 (5), 339-360.
4. Hoipkemeier-Wilson, L.; Schumacher, J. F.; Carman, M. L.; Gibson, A. L.; Feinberg, A. W.; Callow, M. E.; Finlay, J. A.; Callow, J. A.; Brennan, A. B., Antifouling Potential of Lubricious, Micro-engineered, PDMS Elastomers against Zoospores of the Green Fouling Alga Ulva (Enteromorpha). Biofouling 2004, 20 (1), 53-63.
5. Carman, M. L.; Estes, T. G.; Feinberg, A. W.; Schumacher, J. F.; Wilkerson, W.; Wilson, L. H.; Callow, M. E.; Callow, J. A.; Brennan, A. B., Engineered Antifouling Microtopographies – Correlating Wettability with Cell Attachment. Biofouling 2006, 22 (1), 11-21.
6. Schumacher, J. F.; Carman, M. L.; Estes, T. G.; Feinberg, A. W.; Wilson, L. H.; Callow, M. E.; Callow, J. A.; Finlay, J. A.; Brennan, A. B., Engineered Antifouling Microtopographies – Effect of Feature Size, Geometry, and Roughness on Settlement of Zoospores of the Green Alga Ulva. Biofouling 2007, 23 (1), 55-62.
7. Magin, C. M.; Cooper, S. P.; Brennan, A. B., Non-toxic Antifouling Strategies. Materials Today 2010, 13 (4), 36-44.
8. Kirschner, C. M.; Brennan, A. B., Bio-Inspired Antifouling Strategies. Annual Review of Materials Research 2012, 42 (1), 211-229.
9. Schumacher, J. F.; Aldred, N.; Callow, M. E.; Finlay, J. A.; Callow, J. A.; Clare, A. S.; Brennan, A. B., Species-specific Engineered Antifouling Topographies: Correlations Between the Settlement of Algal Zoospores and Barnacle Cyprids. Biofouling 2007, 23 (5), 307-317.
10. Magin, C. M.; Long, C. J.; Cooper, S. P.; Ista, L. K.; López, G. P.; Brennan, A. B., Engineered Antifouling Microtopographies: the Role of Reynolds Number in A Model that Predicts Attachment of Zoospores of Ulva and Cells of Cobetia Marina. Biofouling 2010, 26 (6), 719-727.
80
11. Yebra, D. M.; Kiil, S. K.; Dam-Johansen, K., Antifouling Technology—Past, Present and Future Steps Towards Efficientand Environmentally Friendly Antifouling Coatings. Progress in Organic Coatings 2004, 50 (2), 75-104.
12. Lejars, M.; Margaillan, A.; Bressy, C., Fouling Release Coatings: A Nontoxic Alternative to Biocidal Antifouling Coatings. Chemical Reviews 2012, 112 (8), 4347-4390.
13. Barthlott, W.; Neinhuis, C., Purity of the Sacred Lotus, or Escape from Contamination in Biological Surfaces. Planta 1997, 202 (1), 1-8.
14. Cassie, A. B. D.; Baxter, S., Wettability of Porous Surfaces. Transactions of the Faraday Society 1944, 40 (0), 546-551.
15. Wenzel, R. N., Resistance of Solid Surfaces to Wetting by Water. Industrial & Engineering Chemistry 1936, 28 (8), 988-994.
16. Quéré, J. B. a. C. T. a. D., Rough Wetting. EPL (Europhysics Letters) 2001, 55 (2), 214.
17. Stein, J.; Truby, K.; Wood, C. D.; Stein, J.; Gardner, M.; Swain, G.; Kavanagh, C.; Kovach, B.; Schultz, M.; Wiebe, D.; Holm, E.; Montemarano, J.; Wendt, D.; Smith, C.; Meyer, A., Silicone Foul Release Coatings: Effect of the Interaction of Oil and Coating Functionalities on the Magnitude of Macrofouling Attachment Strengths. Biofouling 2003, 19, 71-82.
18. Truby, K.; Wood, C. D.; Stein, J.; Cella, J.; Carpenter, J.; Kavanagh, C.; Swain, G.; Wiebe, D.; Lapota, D.; Meyer, A.; Holm, E.; Wendt, D.; Smith, C.; Montemarano, J., Evaluation of the Performance Enhancement of the Silicone Biofouling-release Coatings by Oil Incorporation. Biofouling 2000, 15 (1-3), 141-150.
19. Miline, A. Anti-fouling Marine Compositions. US 4025693, May 24, 1977.
20. Miline, A. Coated Marine Surfaces. UK 1470465, 1977.
21. Newby, B.; Chaudhury, M.; Brown, H., Macroscopic Evidence of the Effect of Interfacial Slippage on Adhesion. Science 1995, 269, 1407-109.
22. Stein, J.; Truby, K.; Wood, C. D.; Takemori, M.; Vallance, M.; Swain, G.; Kavanagh, C.; Kovach, B.; Schultz, M.; Wiebe, D.; Holm, E.; Montemarano, J.; Wendt, D.; Smith, C.; Meyer, A., Structure–Property Relationships of Silicone Biofouling-release Coatings: Effect of Silicone Network Architecture on Pseudobarnacle Attachment Strengths. Biofouling 2003, 19 (2), 87-94.
23. Bodkhe, R. B.; Thompson, S. E. M.; Yehle, C.; Cilz, N.; Daniels, J.; Stafslien, S. J.; Callow, M. E.; Callow, J. A.; Webster, D. C., The Effect of Formulation Variables on Fouling-release Performance of Stratified Siloxane-Polyurethane Coatings. Journal of Coatings Technology Research 2012, 9 (3), 235-249.
24. Sommer, S.; Ekin, A.; Webster, D. C.; Stafslien, S. J.; Daniels, J.; VanderWal, L. J.; Thompson, S. E. M.; Callow, M. E.; Callow, J. A., A Preliminary Study on the Properties and Fouling-release Performance of Siloxane-Polyurethane Coatings Prepared from PDMS Macromers. Biofouling 2010, 26 (8), 961-972.
25. Webster, D. C.; Pieper, R. J.; Ekin, A. Thermoset Siloxane-Urethane Fouling Release Coatings. US 7,989,074 B2, 2011.
81
26. Pieper, R. J.; Ekin, A.; Webster, D. C.; Casse, F.; Callow, J. A.; Callow, M. E., A Combinatorial Approach to Study the Effect of Acrylic Polyol Composition on the Properties of Crosslinked Siloxane-Polyurethane Fouling-release Coatings. Journal of Coatings Technology Research 2007, 4 (4), 453-461.
27. Owens, D. K.; Wendt, R. C., Estimation of The Surface Free Energy of Polymers. Journal of Applied Polymer Science 1969, 13 (8), 1741-1747.
28. Casse, F.; Ribeiro, E.; Ekin, A.; Webster, D. C.; Callow, J. A.; Callow, M. E., Laboratory Screening of Coating Libraries for Algal Adhesion. Biofouling 2007, 23 (3/4), 267-276.
29. Cassé, F.; Stafslien, S. J.; Bahr, J. A.; Daniels, J.; Finlay, J. A.; Callow, J. A.; Callow, M. E., Combinatorial Materials Research Applied to the Development of New Surface Coatings V. Application of A Spinning Water-jet for The Semi-high Throughput Assessment of the Attachment Strength Of Marine Fouling Algae. Biofouling 2007, 23 (2), 121-130.
30. Callow, M. E.; Callow, J. A.; Conlan, S.; Clare, A. S.; Stafslien, S., Efficacy Testing of Nonbiocidal and Fouling-release Coatings. In Biofouling Methods, John Wiley & Sons, Ltd: 2014; pp 291-316.
31. Stafslien, S. J.; Bahr, J. A.; Daniels, J. W.; Wal, L. V.; Nevins, J.; Smith, J.; Schiele, K.; Chisholm, B., Combinatorial Materials Research Applied to The Development of New Surface Coatings VI: An Automated Spinning Water Jet Apparatus for The High-throughput Characterization of Fouling-release Marine Coatings. Review of Scientific Instruments 2007, 78 (7), 072204.
32. Rittschof, D.; Orihuela, B.; Stafslien, S.; Daniels, J.; Christianson, D.; Chisholm, B.; Holm, E., Barnacle Reattachment: A Tool for Studying Barnacle Adhesion. Biofouling 2008, 24 (1), 1-9.
33. Stafslien, S.; Daniels, J.; Bahr, J.; Chisholm, B.; Ekin, A.; Webster, D.; Orihuela, B.; Rittschof, D., An Improved Laboratory Reattachment Method for The Rapid Assessment of Adult Barnacle Adhesion Strength to Fouling-release Marine Coatings. Journal of Coatings Technology and Research 2012, 9 (6), 651-665.
34. Jung, Y. S.; Ross, C. A., Solvent-Vapor-Induced Tunability of Self-Assembled Block Copolymer Patterns. Advanced Materials 2009, 21 (24), 2540-2545.
35. Maureen E. Callow, J. A. C., Linnea K.Ista, Sarah E. Coleman, Aleece C. Nolasco, and Gabriel P. Lopez, Use of Self-Assembled Monolayers of Different Wettabilities To Study Surface Selection and Primary Adhesion Processes ofGreen Algal (Enteromorpha) Zoospores. Applied and Environmental Microbiology 2000, 66 (8), 3249–3254.
36. Callow, M. E.; Jennings, A. R.; Brennan, A. B.; Seegert, C. E.; Gibson, A.; Wilson, L.; Feinberg, A.; Baney, R.; Callow, J. A., Microtopographic Cues for Settlement of Zoospores of the Green Fouling Alga Enteromorpha. Biofouling 2002, 18 (3), 229-236.
37. Granhag, L. M.; Finlay, J. A.; Jonsson, P. R.; Callow, J. A.; Callow, M. E., Roughness-dependent Removal of Settled Spores of the Green Alga Ulva (syn. Enteromorpha) Exposed to Hydrodynamic Forces from a Water Jet. Biofouling 2004, 20 (2), 117-122.
38. Bowen, J.; Pettitt, M. E.; Kendall, K.; Leggett, G. J.; Preece, J. A.; Callow, M. E.; Callow, J. A., The Influence of Surface Lubricity on the Adhesion of Navicula perminuta and Ulva linza to Alkanethiol Self-assembled Monolayers. Journal of The Royal Society Interface 2007, 4 (14), 473-477.
82
39. Finlay, J. A.; Callow, M. E.; Ista, L. K.; Lopez, G. P.; Callow, J. A., The Influence of Surface Wettability on the Adhesion Strength of Settled Spores of the Green Alga Enteromorpha and the Diatom Amphora. Integrative and Comparative Biology 2002, 42 (6), 1116-1122.
40. Callow, J. A.; Callow, M. E., Trends in The Development of Environmentally Friendly Fouling-resistant Marine Coatings. Nat Commun 2011, 2, 244.
41. Aldred, N.; Scardino, A.; Cavaco, A.; de Nys, R.; Clare, A. S., Attachment Strength is A Key Factor in the Selection of Surfaces by Barnacle Cyprids (Balanus Amphitrite) During Settlement. Biofouling 2010, 26 (3), 287-299.
83
CHAPTER 4. FOULING-RELEASE PROPERTIES OF SILOXANE-POLYURETHANE
COATINGS FROM ACID FUNCTIONALIZED POLYDIMETHYL SILOXANE BLENDS
Introduction
Marine biofouling has been an area of concern since man started sailing.1 Unwanted settlement
of marine organisms on any surface exposed to the marine environment leads to a decrease in
performance and productivity.2 For ocean going vessels, light fouling (slime) can result in additional
powering penalties up to 10-16% and for ship hulls with heavy fouling these penalties may add up to
86%.1, 3, 4 The United States Navy has estimated that the approximate cost of biofouling is around 180-
260 million per year for their entire fleet; which highlights the magnitude of the economic impact of
biofouling to ocean going vessels.1, 3, 5Also increased emissions and spread of fouling species around
world (given the widespread network of shipping routes) may have a major impact on the environment. 3, 6
Anti-fouling coatings with active biocides remain the most widely used approach for biofouling
control.7-9 However non-toxic fouling-release (FR) coatings have gained the most recent interest in
research and development of marine coatings.10-12 Regulatory concerns and the process of authorizing
new biocides can be extensive and time consuming.10 Several risk assessment and toxicity studies are
mandatory by the European Biocidal Products Directive in order to register and market new biocides for
anti-fouling paints.10 Currently Cu or CuO is used as the active ingredient in many anti-fouling paints and
typically a high loading of Cu/CuO is required for long term performance. The use of Cu may also pose
environmental concerns given the possibility of accumulation in the marine environment.10 Low surface
energy FR coatings are non-toxic, they may allow settlement of marine organisms on surfaces but
perform as self-cleaning surfaces.3, 11 Settled fouling is removed due to hydrodynamic forces maintaining
a clean and smooth ship hull. Typical FR coatings are designed using siloxanes or fluoropolymers to
obtain low surface energy materials.13 In theory, low surface energy coatings help minimize the adhesion
strength of marine organisms, thus allowing easy release upon exposure to hydrodynamic pressure. 1
Lately with better understanding of adhesion processes of marine organisms have allowed continued
development of non-toxic FR coatings.14-16
The diversity of marine organisms, their adhesion preferences and the complexity of their
adhesives presents the biggest challenge in developing FR/ anti-fouling coatings. Biofouling on medical
84
implants is considered to as serious an issue as on marine vessels.17-19 The use of amphiphilic materials
is an approach that has been widely explored in the area of biomedical research for controlling biofouling
on implants and devices that are in contact with human body fluids.17, 18, 20 This approach has become a
recent area of interest for FR/ anti-fouling technology. The main difference between fouling on marine
vessels and medical implants is attributed to the type of environment being exposed to demining the
outcome and the extent of biofouling. It is widely understood that body fluids consist of complex
macromolecules, proteins, glycoproteins which typically interact with freshly exposed surfaces preparing
the surface for colonization of cells.21, 22 A significant amount of research has been focused on reducing
or controlling the adsorption of these macromolecules.22 Surfaces with mixed hydrophilic and hydrophobic
character have shown promise in reducing the adsorption of macromolecules yet a material that is
completely inert towards protein adsorption is still to be discovered.20 Nevertheless designing FR coatings
with amphiphilic surface characteristics can be helpful for broad resistance of marine biofouling given the
recent developments in performance observed for coatings in academic research and in the marine
coatings industry. 23-27
One common hydrophilic group that has been extensively studied for amphiphilic materials is the
carboxylic acid group. It is observed that COOH groups expressed on the surface may be deprotonated
at slightly basic pH, providing a COO- charged surface.28 Surfaces with COO- groups have demonstrated
easy elution of proteins in several studies.29 In another study discussing the effects of surface chemistry
on bacteria adhesion, SAM surfaces with COOH moieties showed low biomass generated compared to
surfaces modified with hydrophobic groups (CH3).30 However the behavior/ response of two different
strains of bacteria were significantly different.
Siloxane polyurethane (SiPU) marine coatings are a practically sound approach to a tough and
environmentally friendly FR solution.31-34 Unlike silicone elastomer based FR top coats, SiPU coatings
have been able address the mechanical durability and adhesion concerns.35 They have also
demonstrated comparable FR properties to leading commercial standards in field immersion trials.
Recently initial attempts of amphiphilic SiPU coatings were explored by incorporating carboxylic
acid and polyethylene glycol groups.36, 37 Although these new systems showed promise in improving the
FR properties of SiPU coatings, an optimum hydrophilic/hydrophobic balance needs to be achieved for
85
broad spectrum FR. More specifically, in an approach to use pendent acid functionalized siloxane resins
in SiPU coatings, major improvements in the FR properties towards diatoms was observed, yet that of
barnacles was compromised.36 Therefore, to address the shortcomings of these previous studies,
coatings with lower hydrophilic COOH content were prepared.
In this study, a 25% pendent acid functionalized aminopropyl terminated siloxane (APT-PDMS-
25A) was synthesized and utilized in coating formulations. As an approach to manipulate the
concentration of hydrophilic groups on coating surface, several coating formulations were prepared with
varying the APT-PDMS-25A content from 20%, 16%, 12%, 8%, 4% and 0% by wt. In order to maintain a
total combined siloxane content of 20% by wt, aminopropyl terminated siloxane (APT-PDMS) was
blended in (at 0%, 4%, 8%, 12%, 16% and 20% respectively). Coating surfaces were characterized using
water/methylene iodide contact angle measurements and atomic force microscopy (AFM). Coatings were
tested for toxicity and FR properties towards microalgae (Navicula incerta), macroalage (Ulva linza),
bacteria (Cellulophaga lytica), barnacles (Amphibalanus amphitrite), and mussels (Geukensia demissa)
using laboratory biological assays.
Experimental
Materials
Octamethylcyclotetrasiloxane (D4), 3-Aminopropyl terminated polydimethyl siloxane having a
number average molecular weight of 875 (APT-PDMS-875), and 1, 3, 5, 7-tetramethyl- 1, 3, 5, 7-
tetravinylcyclotetrasiloxane (D4V) were purchased from Gelest Inc. Benzyltrimethyl ammonium hydroxide
(40% in methanol), tetrahydrofuran (THF), hexanes, 2-heptanone, toluene, methanol-d, chloroform-d
(CDCl3), 3-mercaptopropionic acid (MPA), acetylacetone, dibutyltin diacetate (DBTDAc) were purchased
from Sigma Aldrich. Polyisocyanate Desmodur Z 4470 BA was provided by Covestro. All reagents were
used under as-received conditions. An acrylic polyol containing 80% butyl acrylate (BA) and 20% 2-
hydroxyethyl acrylate (HEA) was utilized for this study and synthesized following a procedure reported
previously.38 An aminopropyl terminated poly(dimethylsiloxane) (APT-PDMS) of 20,000 g/mol molecular
weight (MW) was also synthesized as reported previously.34
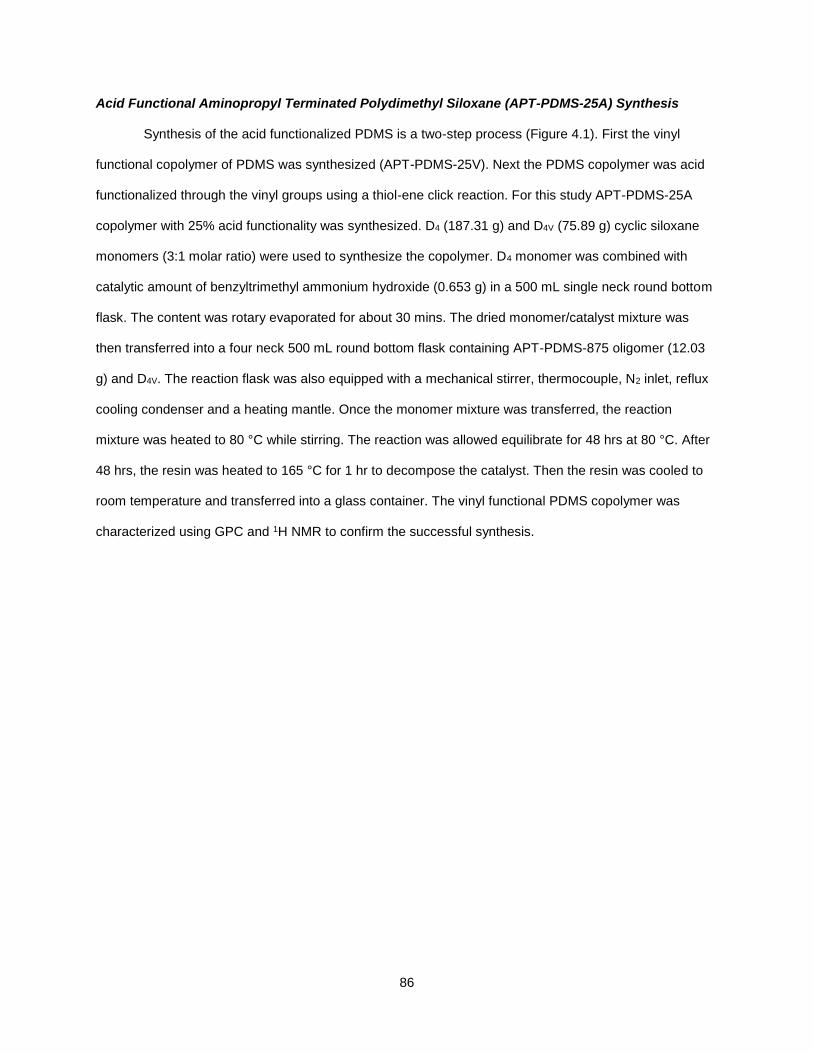
86
Acid Functional Aminopropyl Terminated Polydimethyl Siloxane (APT-PDMS-25A) Synthesis
Synthesis of the acid functionalized PDMS is a two-step process (Figure 4.1). First the vinyl
functional copolymer of PDMS was synthesized (APT-PDMS-25V). Next the PDMS copolymer was acid
functionalized through the vinyl groups using a thiol-ene click reaction. For this study APT-PDMS-25A
copolymer with 25% acid functionality was synthesized. D4 (187.31 g) and D4V (75.89 g) cyclic siloxane
monomers (3:1 molar ratio) were used to synthesize the copolymer. D4 monomer was combined with
catalytic amount of benzyltrimethyl ammonium hydroxide (0.653 g) in a 500 mL single neck round bottom
flask. The content was rotary evaporated for about 30 mins. The dried monomer/catalyst mixture was
then transferred into a four neck 500 mL round bottom flask containing APT-PDMS-875 oligomer (12.03
g) and D4V. The reaction flask was also equipped with a mechanical stirrer, thermocouple, N2 inlet, reflux
cooling condenser and a heating mantle. Once the monomer mixture was transferred, the reaction
mixture was heated to 80 °C while stirring. The reaction was allowed equilibrate for 48 hrs at 80 °C. After
48 hrs, the resin was heated to 165 °C for 1 hr to decompose the catalyst. Then the resin was cooled to
room temperature and transferred into a glass container. The vinyl functional PDMS copolymer was
characterized using GPC and 1H NMR to confirm the successful synthesis.
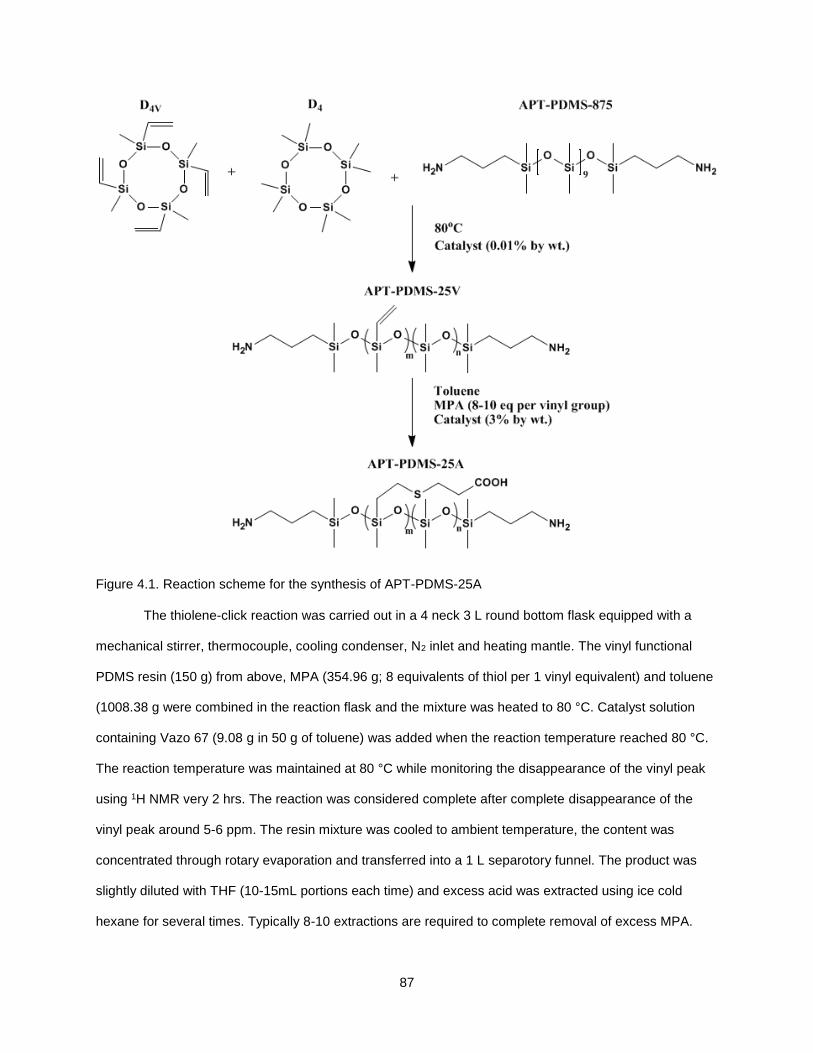
87
Figure 4.1. Reaction scheme for the synthesis of APT-PDMS-25A
The thiolene-click reaction was carried out in a 4 neck 3 L round bottom flask equipped with a
mechanical stirrer, thermocouple, cooling condenser, N2 inlet and heating mantle. The vinyl functional
PDMS resin (150 g) from above, MPA (354.96 g; 8 equivalents of thiol per 1 vinyl equivalent) and toluene
(1008.38 g were combined in the reaction flask and the mixture was heated to 80 °C. Catalyst solution
containing Vazo 67 (9.08 g in 50 g of toluene) was added when the reaction temperature reached 80 °C.
The reaction temperature was maintained at 80 °C while monitoring the disappearance of the vinyl peak
using 1H NMR very 2 hrs. The reaction was considered complete after complete disappearance of the
vinyl peak around 5-6 ppm. The resin mixture was cooled to ambient temperature, the content was
concentrated through rotary evaporation and transferred into a 1 L separotory funnel. The product was
slightly diluted with THF (10-15mL portions each time) and excess acid was extracted using ice cold
hexane for several times. Typically 8-10 extractions are required to complete removal of excess MPA.
88
After purifying the product, the resin was concentrated and diluted in butyl acetate to obtain a 20% solid
solution.
Gel Permeation Chromatography (GPC)
Approximate molecular weight of APT-PDMS-25V and APT-PDMS-25A were determined using a
high-throughput GPC relative to polystyrene standard. For each resin, a polymer solution derivatized with
acetic anhydride (approximately 5 mg/mL concentration) in THF was prepared. The samples were
analyzed using Symyx® Rapid GPC equipped with an evaporative light scattering detector (PL-ELS
1000), 2× PLgel Mixed-B columns (10 µm particle size) while maintaining a 2.0 mL/min flow rate.
1H NMR Characterization
The siloxane copolymers were characterized using 1H NMR. Also 1H NMR was utilized to
determine the completion of the thiol-ene click reaction during acid functionalization of APT-PDMS-25V.
All 1H NMR spectra were obtained using the JEOL-ECA 400 (400 MHz) NMR spectrometer. In order to
prepare samples for analysis, small amount of APT-PDMS-25V was diluted using CDCl3 and APT-PDMS-
25A samples were diluted using a solvent mixture consist of 80% CDCl3 and 20% methanol-d by volume.
Coating Formulation
Coating formulations were prepared using the acid functionalized siloxane copolymer (APT-
PDMS-25A), APT-PDMS, acrylic polyol, isocyanate (Desmodur Z4470 BA). Coating compositions
prepared during this experiment are outlined in Table 4.1. A representative formulation procedure for
coating 2 is described here. Siloxane resins APT-PDMS-25A (8.0 g) and APT-PDMS (0.4 g) were
combined with acrylic polyol (10.0 g) and acetylacetone (1.0 g) in a 20 mL glass vial equipped with a
magnetic stir bar. The content was allowed to mix overnight using a magnetic stir plate. After 24 hrs,
Desmodur Z4470 BA (4.3 g) and DBTDAc catalyst solution (0.5 g) were added to the vial and allowed to
mix under magnetic stirring before making coatings. After 1hr, the coating formulation was used to
prepare drawdowns and depositions. Drawdowns were made on primed aluminum panels using a wire-
wound drawdown bar and formulation (250µL sample/ well) was also deposited in to multi-well plates
modified with primed aluminum disks. All coatings were allowed to cure under ambient conditions for 24
hrs and on the next day they were oven cured at 80 °C for 45 mins.
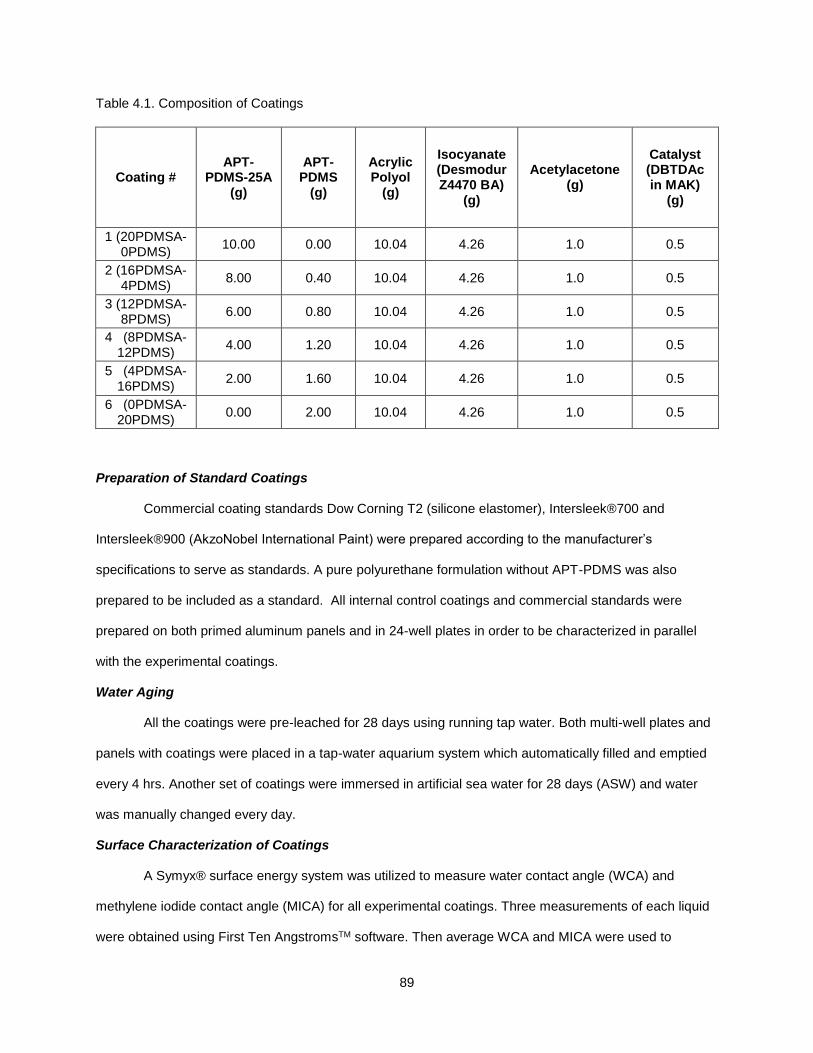
89
Table 4.1. Composition of Coatings
Coating # APT-
PDMS-25A (g)
APT-PDMS
(g)
Acrylic Polyol
(g)
Isocyanate (Desmodur Z4470 BA)
(g)
Acetylacetone (g)
Catalyst (DBTDAc in MAK)
(g)
1 (20PDMSA-0PDMS)
10.00 0.00 10.04 4.26 1.0 0.5
2 (16PDMSA-4PDMS)
8.00 0.40 10.04 4.26 1.0 0.5
3 (12PDMSA-8PDMS)
6.00 0.80 10.04 4.26 1.0 0.5
4 (8PDMSA-12PDMS)
4.00 1.20 10.04 4.26 1.0 0.5
5 (4PDMSA-16PDMS)
2.00 1.60 10.04 4.26 1.0 0.5
6 (0PDMSA-20PDMS)
0.00 2.00 10.04 4.26 1.0 0.5
Preparation of Standard Coatings
Commercial coating standards Dow Corning T2 (silicone elastomer), Intersleek®700 and
Intersleek®900 (AkzoNobel International Paint) were prepared according to the manufacturer’s
specifications to serve as standards. A pure polyurethane formulation without APT-PDMS was also
prepared to be included as a standard. All internal control coatings and commercial standards were
prepared on both primed aluminum panels and in 24-well plates in order to be characterized in parallel
with the experimental coatings.
Water Aging
All the coatings were pre-leached for 28 days using running tap water. Both multi-well plates and
panels with coatings were placed in a tap-water aquarium system which automatically filled and emptied
every 4 hrs. Another set of coatings were immersed in artificial sea water for 28 days (ASW) and water
was manually changed every day.
Surface Characterization of Coatings
A Symyx® surface energy system was utilized to measure water contact angle (WCA) and
methylene iodide contact angle (MICA) for all experimental coatings. Three measurements of each liquid
were obtained using First Ten AngstromsTM software. Then average WCA and MICA were used to
90
calculate the SE for each coating by Owens-Wendt method.39 Contact angle and SE analysis were
performed both before and after water aging.
Atomic Force Microscopy (AFM) was used to observe the topography of the experimental
coatings. A Dimension 3100 microscope with Nanoscope controller was used to scan the surface of the
experimental coatings before and after water-leaching. A cantilever with a silicon probe (with a spring
constant 0.1-0.6 N/m and resonant frequency 15-30 kHz) was used to scan a sample area of 20×20µm
for each coating in tapping mode under ambient conditions.
Biological Laboratory Assays
Growth and Release of Macroalgae (Ulva linza)
Fouling-release assay for the microalga U.linza was conducted at Newcastle University, using a
set of multi-well plates following 28 days of pre-leaching. More detailed procedure of the U.linza growth
and removal assay using high throughput screening can be found elsewhere.40 Before starting the
experiment, all multi-well plates were equilibrated in 0.22µm-filtered artificial seawater (FSW) for 2 hrs. To
each well, 1 mL U.linza spore suspension adjusted to 0.05 OD at absorbance 660 nm (3.3 x 10⁵ spores
ml-1) in single strength enriched seawater medium was added. Spores settled on the plates were allowed
to grow for 6 days inside an illuminated incubator at 18 °C with a 16:8 light: dark cycle (photon flux
density 45 μmol.m-2.s-1) while renewing nutrients every 48 hrs (there was no washing performed to
remove unsettled spores after settlement). After 6 days, the biomass generated was assessed from a
single row of wells (6) from each plate. Single rows of wells on each plate were sprayed using the spinjet
apparatus at 18, 67 and 111 kPa impact pressure. Chlorophyll extraction was performed by adding 1 mL
of DMSO to each well followed by determining fluorescence at excitation at 360 nm and emission at 670
nm wavelengths. Fluorescence is directly proportional to the biomass present on each coating surface.
The removal of sporelings at each pressure was compared with the unsprayed wells (that were used to
assess sporeling growth above).
Growth and Release of Microalgae (Navicula incerta)
Microalgae (N.incerta) assay was conducted at NDSU using methods described previously.41, 42
Pre-leached coatings were inoculated using a (1 mL per well) diatom (N.incerta) suspension with 4 x 10⁵
cells/mL (adjusted to 0.03 OD at absorbance 660 nm) in Guillard’s F2 medium. The plates were
91
incubated for 2 hrs under ambient conditions to facilitate cell attachment. Three replicate wells (1st
column) were left untreated to be used as a measurement of initial amount of cell attachment.
Consequent coating wells were then subjected to water jet treatments, with water jet pressures 10 and 20
psi (138k Pa) for 10 seconds each. Biomass was quantified through chlorophyll extraction using 0.5 mL of
DMSO and measuring fluorescence of the extracts (excitation wavelength at 360 nm; emission
wavelength at 670 nm). The relative fluorescence from the extract is directly proportional to the algae
biomass present on the coating surface before and after water jet treatment. Percent removal of diatoms
was determined using relative fluorescence of non-jetted and water-jetted wells.
Bacterial (Cellulophaga lytica) Biofilm Adhesion
Fouling-release assay for marine bacterium C.lytica was performance following the procedure
previously described by Stafslien et al.42, 43 Multi-well plates containing coatings were inoculated by
dispensing a 1 mL suspension of marine bacteria (C.lytica; 107 cells/mL) in FSW supplemented with 0.5
g/L of peptone and 0.1 g/L of yeast extract. The plates were subjected to static incubation for 24 hrs at
28°C. The first column of wells (3 wells) were untreated and used as the initial bacterial biofilm growth
while the next columns (3 wells) were treated with subsequent water jet treatment at 10 and 20 psi (69
and 138 kPa) for 5 seconds. The coating surfaces were then stained with 0.3% crystal violet solution in
deionized water. The stained crystal violet was extracted using 33% acetic acid solution and eluates were
collected from each coating well. Then 0.15 mL aliquots of the resulting eluates were measured for
absorbance at 600nm wavelength. The absorbance values were directly proportional to the amount of
bacterial biofilm present on coatings. Biofilm removal from the coatings was quantified by comparing the
relative absorbance values obtained for the non-jetted and water-jetted wells.
Re-attached Adult Barnacle (Amphibalanus amphitrite) Adhesion
Fouling-release performance towards barnacles were determined using an adult barnacle
reattachment assay described by Stafslien et al.44, 45 Coatings were prepared on 8 x 4” panels and
evaluated after 28 days of pre-leaching. Adult barnacles (~5 mm in diameter) were supplied by Duke
University attached to silicone substrates. Barnacles were dislodged (n = 5) and immobilized onto the
surface of experimental coatings using a custom template. The barnacles were allowed to reattach and
grow while they were immersed in an artificial sea water aquarium tank system with daily feedings of
92
Artemia nauplii (Florida Aqua Farms). A hand-held force gauge mounted to a semi-automated device was
utilized to push of the attached barnacles (in shear) following 2 weeks attachment period. The peak force
of removal for each barnacle was recorded. After each barnacle was dislodged, barnacle base plate area
was quantified through Image analysis (Sigma Scan Pro 5.0). Barnacle adhesion strength (MPa) was
calculated by taking the ratio of force for removal to basal plate area. The average barnacle adhesion
strength for each coating was reported based on the total number of barnacles removed with a
measureable force. Barnacles that were adhered strongly resulted in broken barnacles implying poor FR
properties.
Mussel (Geukensia demissa) Adhesion
Another set of coatings prepared on 4” x 8” panels were used for the mussel adhesion assay.
Marine mussels (G.demissa) were provided by Duke University Marine Laboratory in Beaufort, North
Carolina, USA. Prior to attachment assay the mussels were modified by attaching a plastic rod. A 4 cm
long acetal plastic rod (product# 98873A105, McMaster-Carr) was attached to each mussel perpendicular
to the ventral edge, using a 3M® acrylic adhesive (product# 7467A135, McMaster-Carr). For this study,
six mussels were immobilized on to each coating surface and placed PVC sheets (custom-designed
template) firmly against the plastic rods in order to make sure that the mussels were in contact with the
coating surface. The coatings with immobilized mussels were placed in the ASW aquarium system and
fed daily with live marine phytoplankton (DTs Premium Reef Blend Phytoplankton) for three days. Then
the coatings were removed from the ASW aquarium tank system and the total number of mussels
showing attachment of byssus threads was recorded for each surface. The plastic rod from each mussel
was attached to individual 5 N load cell of a custom built tensile force gauge. Then the mussels were
pulled off (1 mm/s pull rate) simultaneously. The force required for detachment of all byssus threads was
averaged and the pull-off value for each coating was recorded. The presence of non-attached mussels
during the 3 day attachment period indicated good mussel deterrence properties of the coatings.
Results and Discussion
In this study 25% acid functionalized siloxane polymer (APT-PDMS-25A) was utilized to prepare
SiPU coatings with hydrophilic COOH groups on the surface. First the siloxane resin with vinyl functional
groups was synthesized using D4 and D4V cyclic siloxane monomers at a molar ratio of 3:1 via a ring
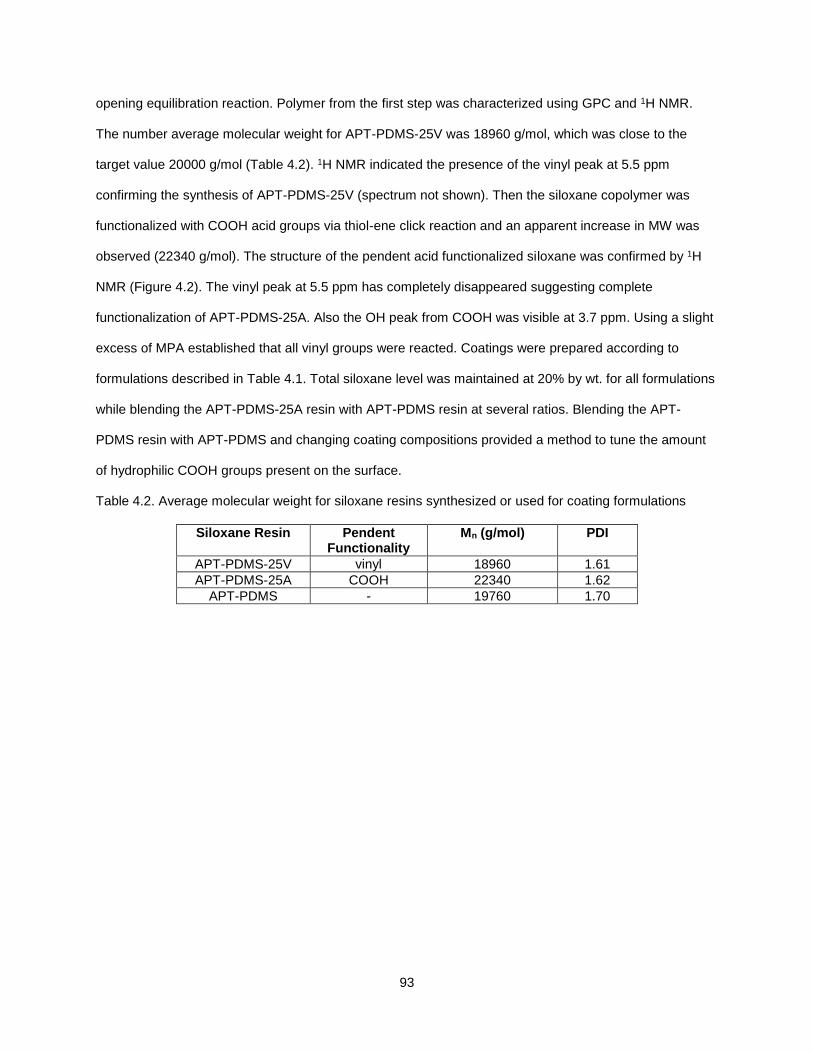
93
opening equilibration reaction. Polymer from the first step was characterized using GPC and 1H NMR.
The number average molecular weight for APT-PDMS-25V was 18960 g/mol, which was close to the
target value 20000 g/mol (Table 4.2). 1H NMR indicated the presence of the vinyl peak at 5.5 ppm
confirming the synthesis of APT-PDMS-25V (spectrum not shown). Then the siloxane copolymer was
functionalized with COOH acid groups via thiol-ene click reaction and an apparent increase in MW was
observed (22340 g/mol). The structure of the pendent acid functionalized siloxane was confirmed by 1H
NMR (Figure 4.2). The vinyl peak at 5.5 ppm has completely disappeared suggesting complete
functionalization of APT-PDMS-25A. Also the OH peak from COOH was visible at 3.7 ppm. Using a slight
excess of MPA established that all vinyl groups were reacted. Coatings were prepared according to
formulations described in Table 4.1. Total siloxane level was maintained at 20% by wt. for all formulations
while blending the APT-PDMS-25A resin with APT-PDMS resin at several ratios. Blending the APT-
PDMS resin with APT-PDMS and changing coating compositions provided a method to tune the amount
of hydrophilic COOH groups present on the surface.
Table 4.2. Average molecular weight for siloxane resins synthesized or used for coating formulations
Siloxane Resin Pendent Functionality
Mn (g/mol) PDI
APT-PDMS-25V vinyl 18960 1.61
APT-PDMS-25A COOH 22340 1.62
APT-PDMS - 19760 1.70
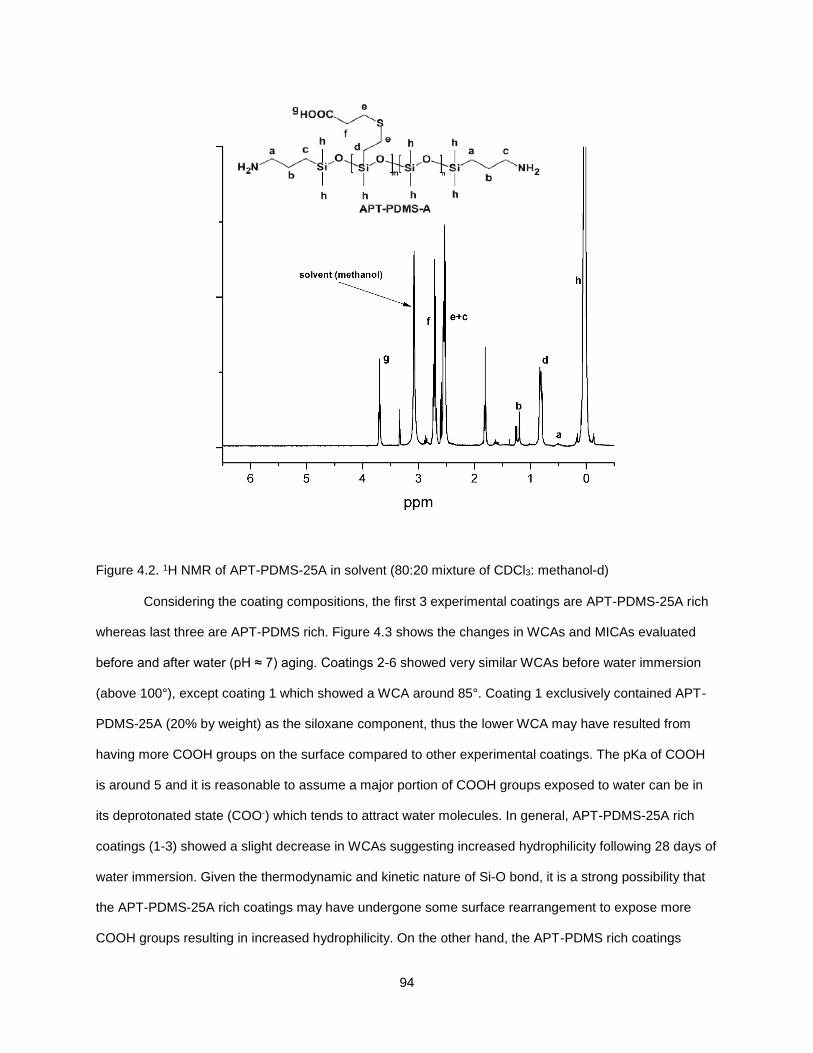
94
Figure 4.2. 1H NMR of APT-PDMS-25A in solvent (80:20 mixture of CDCl3: methanol-d)
Considering the coating compositions, the first 3 experimental coatings are APT-PDMS-25A rich
whereas last three are APT-PDMS rich. Figure 4.3 shows the changes in WCAs and MICAs evaluated
before and after water (pH ≈ 7) aging. Coatings 2-6 showed very similar WCAs before water immersion
(above 100°), except coating 1 which showed a WCA around 85°. Coating 1 exclusively contained APT-
PDMS-25A (20% by weight) as the siloxane component, thus the lower WCA may have resulted from
having more COOH groups on the surface compared to other experimental coatings. The pKa of COOH
is around 5 and it is reasonable to assume a major portion of COOH groups exposed to water can be in
its deprotonated state (COO-) which tends to attract water molecules. In general, APT-PDMS-25A rich
coatings (1-3) showed a slight decrease in WCAs suggesting increased hydrophilicity following 28 days of
water immersion. Given the thermodynamic and kinetic nature of Si-O bond, it is a strong possibility that
the APT-PDMS-25A rich coatings may have undergone some surface rearrangement to expose more
COOH groups resulting in increased hydrophilicity. On the other hand, the APT-PDMS rich coatings
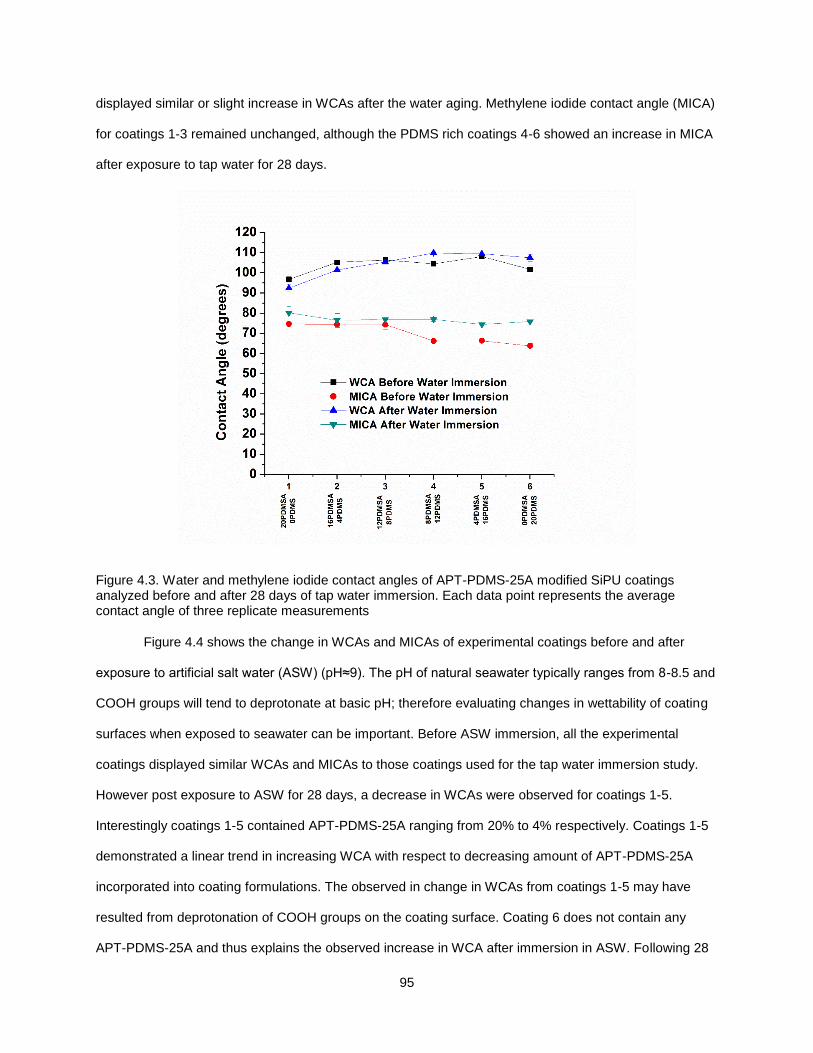
95
displayed similar or slight increase in WCAs after the water aging. Methylene iodide contact angle (MICA)
for coatings 1-3 remained unchanged, although the PDMS rich coatings 4-6 showed an increase in MICA
after exposure to tap water for 28 days.
Figure 4.3. Water and methylene iodide contact angles of APT-PDMS-25A modified SiPU coatings analyzed before and after 28 days of tap water immersion. Each data point represents the average contact angle of three replicate measurements
Figure 4.4 shows the change in WCAs and MICAs of experimental coatings before and after
exposure to artificial salt water (ASW) (pH≈9). The pH of natural seawater typically ranges from 8-8.5 and
COOH groups will tend to deprotonate at basic pH; therefore evaluating changes in wettability of coating
surfaces when exposed to seawater can be important. Before ASW immersion, all the experimental
coatings displayed similar WCAs and MICAs to those coatings used for the tap water immersion study.
However post exposure to ASW for 28 days, a decrease in WCAs were observed for coatings 1-5.
Interestingly coatings 1-5 contained APT-PDMS-25A ranging from 20% to 4% respectively. Coatings 1-5
demonstrated a linear trend in increasing WCA with respect to decreasing amount of APT-PDMS-25A
incorporated into coating formulations. The observed in change in WCAs from coatings 1-5 may have
resulted from deprotonation of COOH groups on the coating surface. Coating 6 does not contain any
APT-PDMS-25A and thus explains the observed increase in WCA after immersion in ASW. Following 28
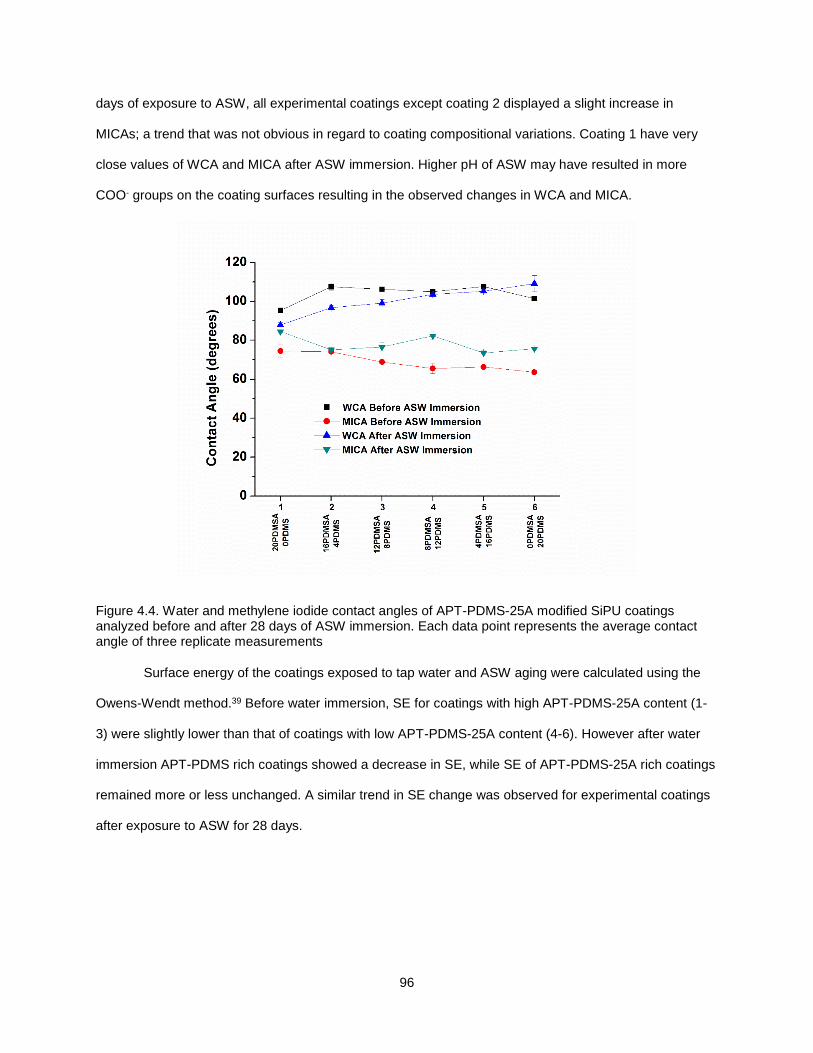
96
days of exposure to ASW, all experimental coatings except coating 2 displayed a slight increase in
MICAs; a trend that was not obvious in regard to coating compositional variations. Coating 1 have very
close values of WCA and MICA after ASW immersion. Higher pH of ASW may have resulted in more
COO- groups on the coating surfaces resulting in the observed changes in WCA and MICA.
Figure 4.4. Water and methylene iodide contact angles of APT-PDMS-25A modified SiPU coatings analyzed before and after 28 days of ASW immersion. Each data point represents the average contact angle of three replicate measurements
Surface energy of the coatings exposed to tap water and ASW aging were calculated using the
Owens-Wendt method.39 Before water immersion, SE for coatings with high APT-PDMS-25A content (1-
3) were slightly lower than that of coatings with low APT-PDMS-25A content (4-6). However after water
immersion APT-PDMS rich coatings showed a decrease in SE, while SE of APT-PDMS-25A rich coatings
remained more or less unchanged. A similar trend in SE change was observed for experimental coatings
after exposure to ASW for 28 days.
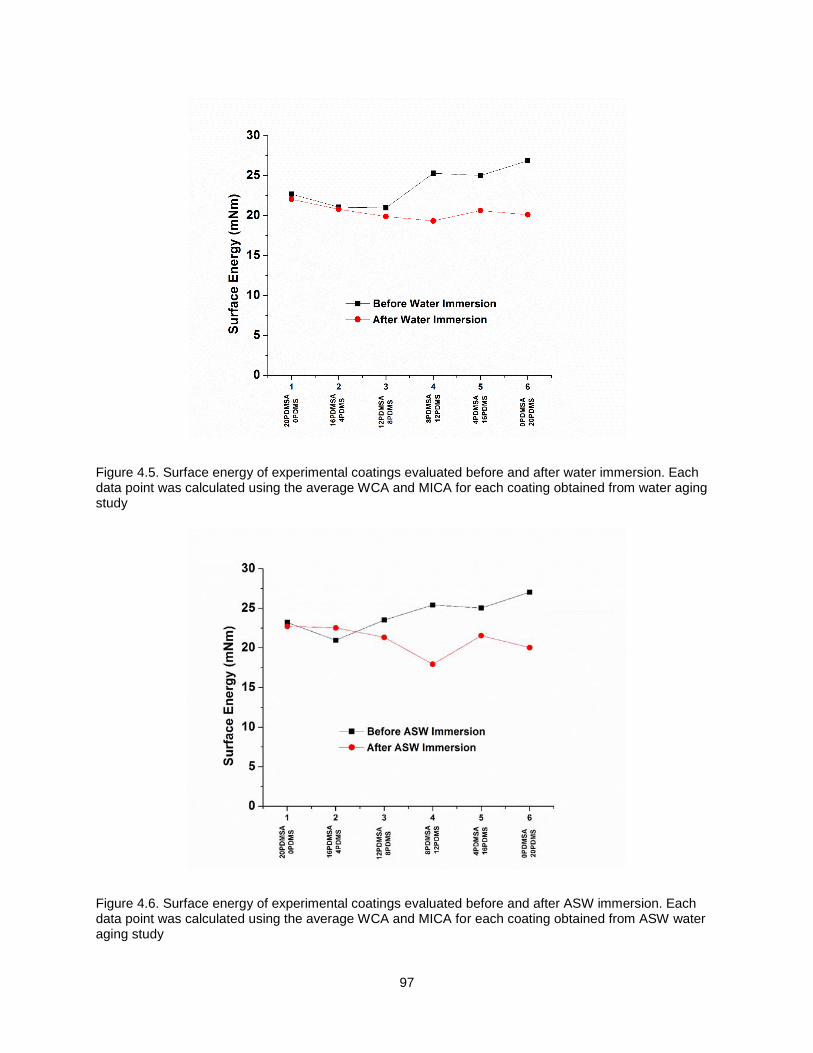
97
Figure 4.5. Surface energy of experimental coatings evaluated before and after water immersion. Each data point was calculated using the average WCA and MICA for each coating obtained from water aging study
Figure 4.6. Surface energy of experimental coatings evaluated before and after ASW immersion. Each data point was calculated using the average WCA and MICA for each coating obtained from ASW water aging study
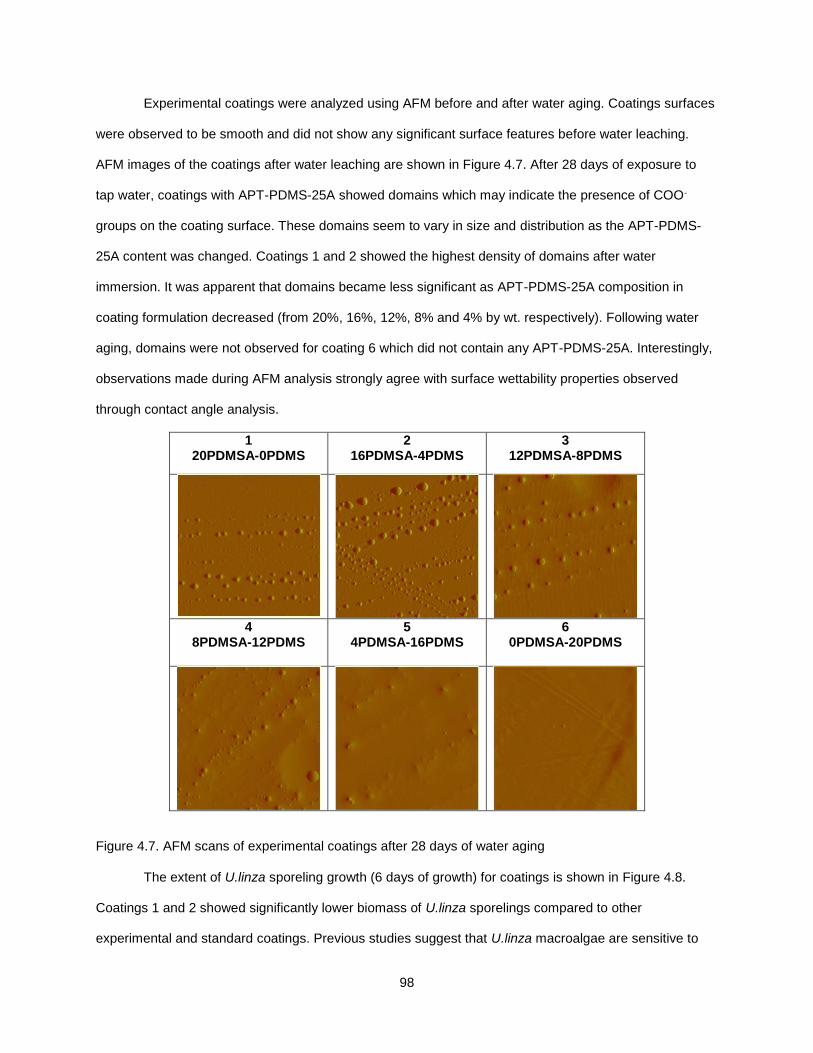
98
Experimental coatings were analyzed using AFM before and after water aging. Coatings surfaces
were observed to be smooth and did not show any significant surface features before water leaching.
AFM images of the coatings after water leaching are shown in Figure 4.7. After 28 days of exposure to
tap water, coatings with APT-PDMS-25A showed domains which may indicate the presence of COO-
groups on the coating surface. These domains seem to vary in size and distribution as the APT-PDMS-
25A content was changed. Coatings 1 and 2 showed the highest density of domains after water
immersion. It was apparent that domains became less significant as APT-PDMS-25A composition in
coating formulation decreased (from 20%, 16%, 12%, 8% and 4% by wt. respectively). Following water
aging, domains were not observed for coating 6 which did not contain any APT-PDMS-25A. Interestingly,
observations made during AFM analysis strongly agree with surface wettability properties observed
through contact angle analysis.
1 20PDMSA-0PDMS
2 16PDMSA-4PDMS
3 12PDMSA-8PDMS
4 8PDMSA-12PDMS
5 4PDMSA-16PDMS
6 0PDMSA-20PDMS
Figure 4.7. AFM scans of experimental coatings after 28 days of water aging
The extent of U.linza sporeling growth (6 days of growth) for coatings is shown in Figure 4.8.
Coatings 1 and 2 showed significantly lower biomass of U.linza sporelings compared to other
experimental and standard coatings. Previous studies suggest that U.linza macroalgae are sensitive to
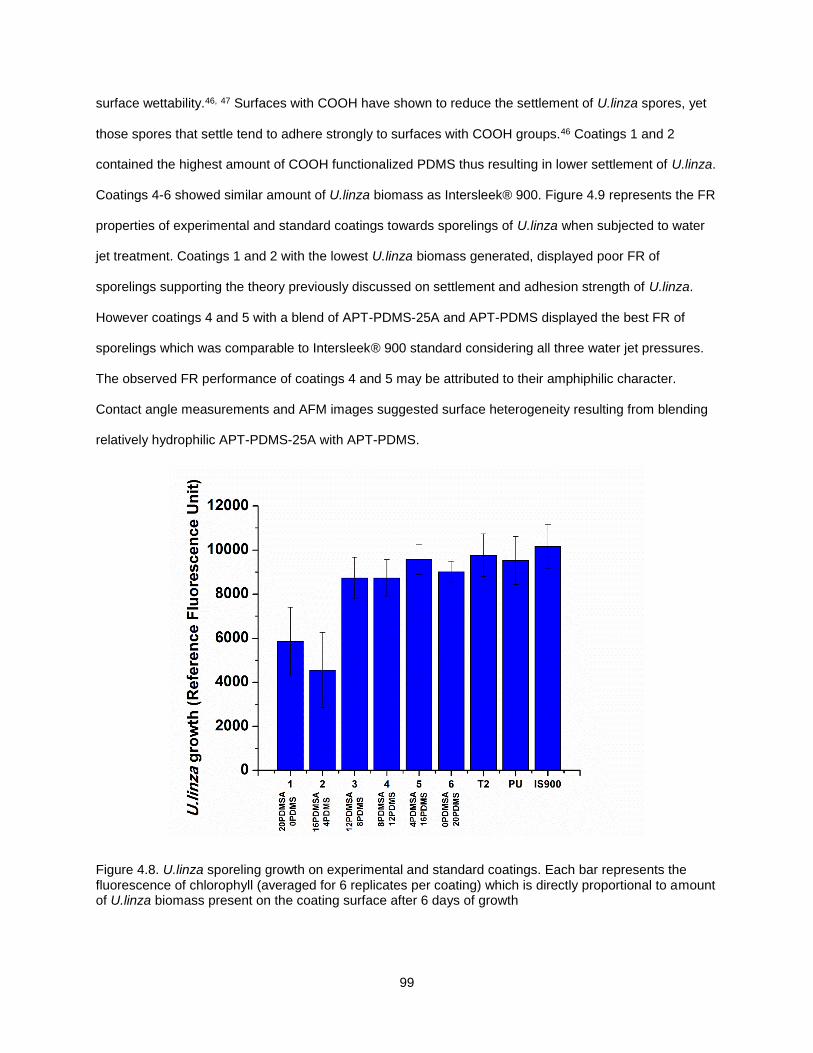
99
surface wettability.46, 47 Surfaces with COOH have shown to reduce the settlement of U.linza spores, yet
those spores that settle tend to adhere strongly to surfaces with COOH groups.46 Coatings 1 and 2
contained the highest amount of COOH functionalized PDMS thus resulting in lower settlement of U.linza.
Coatings 4-6 showed similar amount of U.linza biomass as Intersleek® 900. Figure 4.9 represents the FR
properties of experimental and standard coatings towards sporelings of U.linza when subjected to water
jet treatment. Coatings 1 and 2 with the lowest U.linza biomass generated, displayed poor FR of
sporelings supporting the theory previously discussed on settlement and adhesion strength of U.linza.
However coatings 4 and 5 with a blend of APT-PDMS-25A and APT-PDMS displayed the best FR of
sporelings which was comparable to Intersleek® 900 standard considering all three water jet pressures.
The observed FR performance of coatings 4 and 5 may be attributed to their amphiphilic character.
Contact angle measurements and AFM images suggested surface heterogeneity resulting from blending
relatively hydrophilic APT-PDMS-25A with APT-PDMS.
Figure 4.8. U.linza sporeling growth on experimental and standard coatings. Each bar represents the fluorescence of chlorophyll (averaged for 6 replicates per coating) which is directly proportional to amount of U.linza biomass present on the coating surface after 6 days of growth
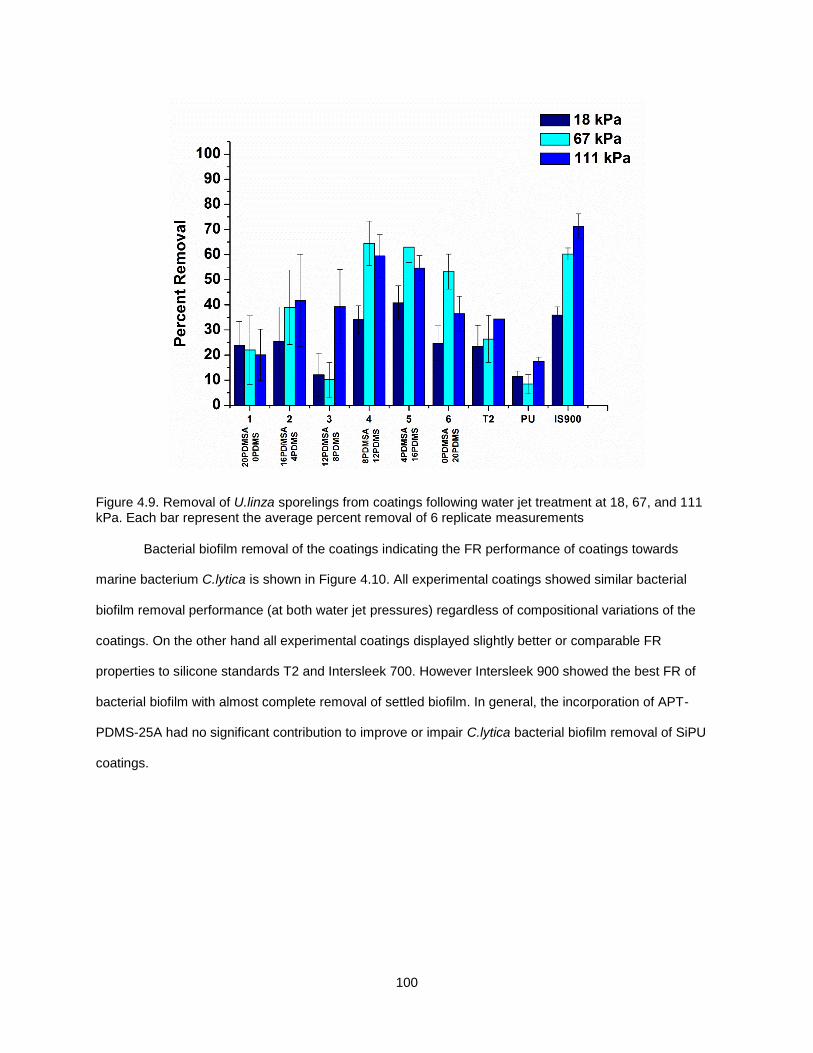
100
Figure 4.9. Removal of U.linza sporelings from coatings following water jet treatment at 18, 67, and 111 kPa. Each bar represent the average percent removal of 6 replicate measurements
Bacterial biofilm removal of the coatings indicating the FR performance of coatings towards
marine bacterium C.lytica is shown in Figure 4.10. All experimental coatings showed similar bacterial
biofilm removal performance (at both water jet pressures) regardless of compositional variations of the
coatings. On the other hand all experimental coatings displayed slightly better or comparable FR
properties to silicone standards T2 and Intersleek 700. However Intersleek 900 showed the best FR of
bacterial biofilm with almost complete removal of settled biofilm. In general, the incorporation of APT-
PDMS-25A had no significant contribution to improve or impair C.lytica bacterial biofilm removal of SiPU
coatings.
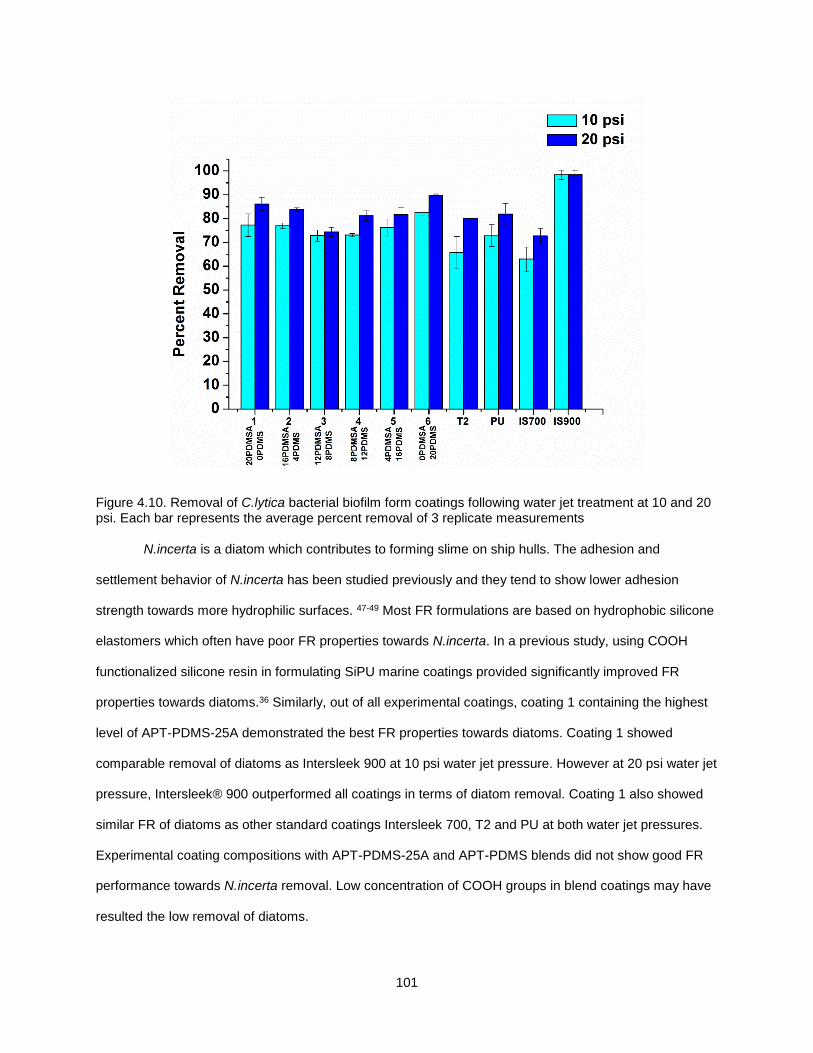
101
Figure 4.10. Removal of C.lytica bacterial biofilm form coatings following water jet treatment at 10 and 20 psi. Each bar represents the average percent removal of 3 replicate measurements
N.incerta is a diatom which contributes to forming slime on ship hulls. The adhesion and
settlement behavior of N.incerta has been studied previously and they tend to show lower adhesion
strength towards more hydrophilic surfaces. 47-49 Most FR formulations are based on hydrophobic silicone
elastomers which often have poor FR properties towards N.incerta. In a previous study, using COOH
functionalized silicone resin in formulating SiPU marine coatings provided significantly improved FR
properties towards diatoms.36 Similarly, out of all experimental coatings, coating 1 containing the highest
level of APT-PDMS-25A demonstrated the best FR properties towards diatoms. Coating 1 showed
comparable removal of diatoms as Intersleek 900 at 10 psi water jet pressure. However at 20 psi water jet
pressure, Intersleek® 900 outperformed all coatings in terms of diatom removal. Coating 1 also showed
similar FR of diatoms as other standard coatings Intersleek 700, T2 and PU at both water jet pressures.
Experimental coating compositions with APT-PDMS-25A and APT-PDMS blends did not show good FR
performance towards N.incerta removal. Low concentration of COOH groups in blend coatings may have
resulted the low removal of diatoms.
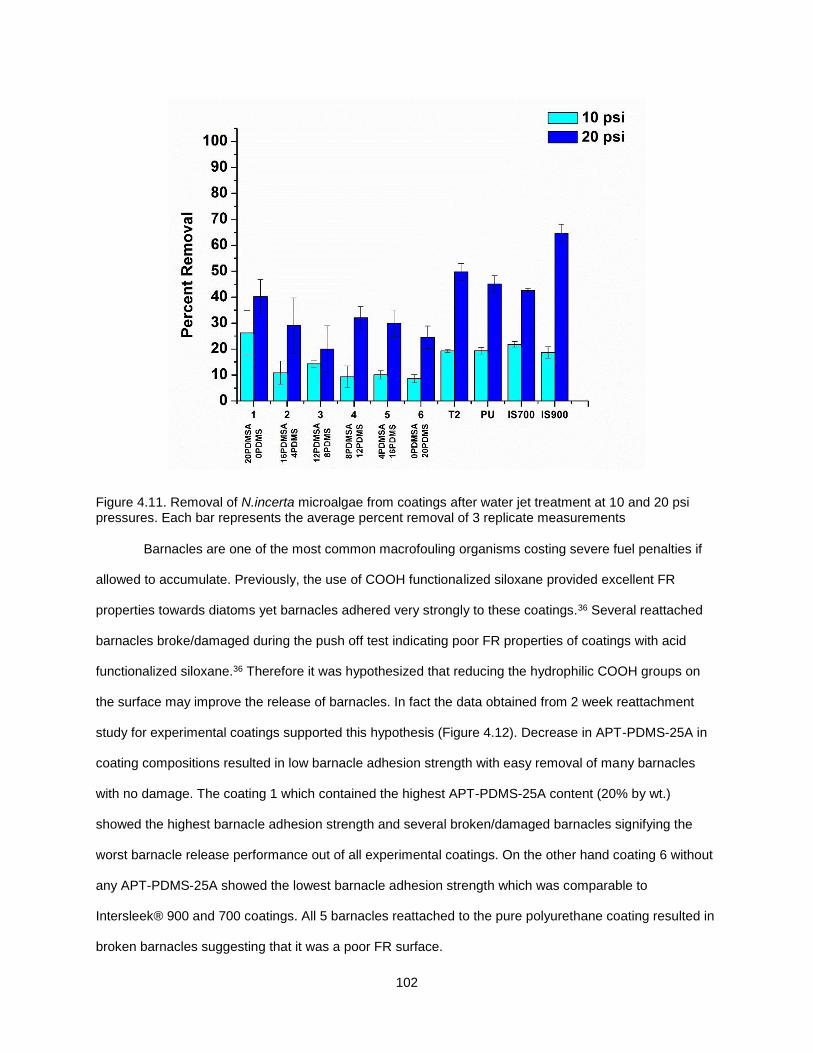
102
Figure 4.11. Removal of N.incerta microalgae from coatings after water jet treatment at 10 and 20 psi pressures. Each bar represents the average percent removal of 3 replicate measurements
Barnacles are one of the most common macrofouling organisms costing severe fuel penalties if
allowed to accumulate. Previously, the use of COOH functionalized siloxane provided excellent FR
properties towards diatoms yet barnacles adhered very strongly to these coatings.36 Several reattached
barnacles broke/damaged during the push off test indicating poor FR properties of coatings with acid
functionalized siloxane.36 Therefore it was hypothesized that reducing the hydrophilic COOH groups on
the surface may improve the release of barnacles. In fact the data obtained from 2 week reattachment
study for experimental coatings supported this hypothesis (Figure 4.12). Decrease in APT-PDMS-25A in
coating compositions resulted in low barnacle adhesion strength with easy removal of many barnacles
with no damage. The coating 1 which contained the highest APT-PDMS-25A content (20% by wt.)
showed the highest barnacle adhesion strength and several broken/damaged barnacles signifying the
worst barnacle release performance out of all experimental coatings. On the other hand coating 6 without
any APT-PDMS-25A showed the lowest barnacle adhesion strength which was comparable to
Intersleek® 900 and 700 coatings. All 5 barnacles reattached to the pure polyurethane coating resulted in
broken barnacles suggesting that it was a poor FR surface.
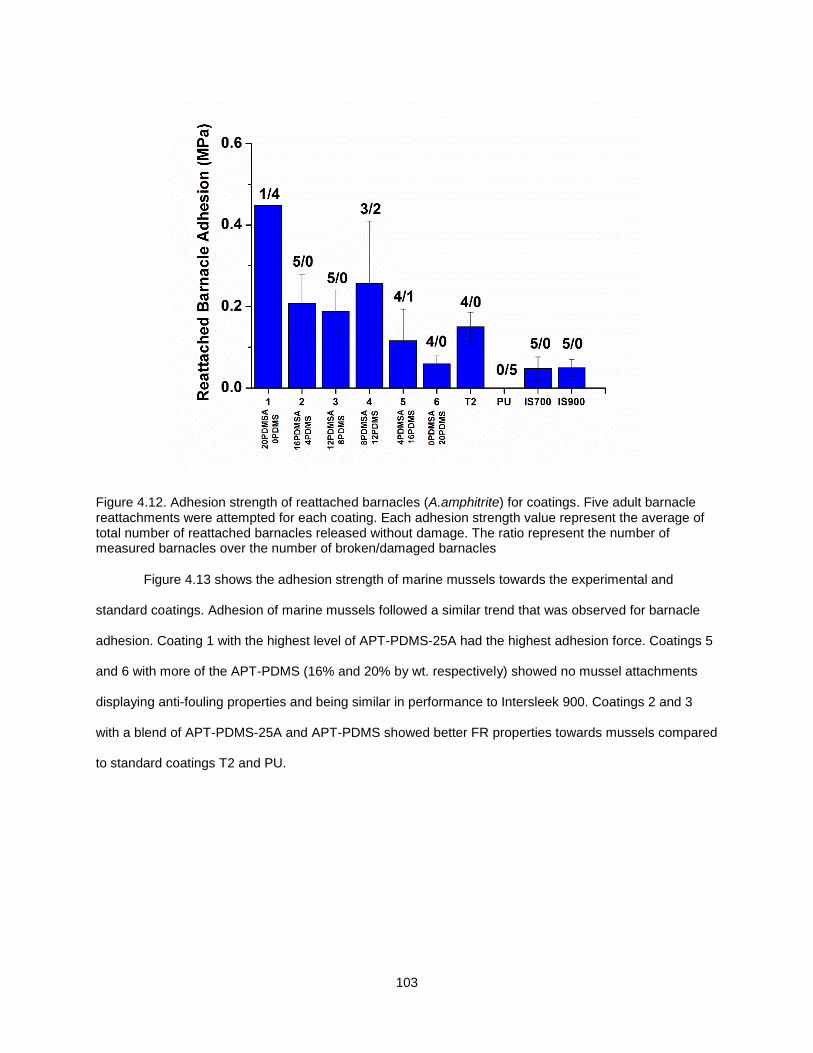
103
Figure 4.12. Adhesion strength of reattached barnacles (A.amphitrite) for coatings. Five adult barnacle reattachments were attempted for each coating. Each adhesion strength value represent the average of total number of reattached barnacles released without damage. The ratio represent the number of measured barnacles over the number of broken/damaged barnacles
Figure 4.13 shows the adhesion strength of marine mussels towards the experimental and
standard coatings. Adhesion of marine mussels followed a similar trend that was observed for barnacle
adhesion. Coating 1 with the highest level of APT-PDMS-25A had the highest adhesion force. Coatings 5
and 6 with more of the APT-PDMS (16% and 20% by wt. respectively) showed no mussel attachments
displaying anti-fouling properties and being similar in performance to Intersleek 900. Coatings 2 and 3
with a blend of APT-PDMS-25A and APT-PDMS showed better FR properties towards mussels compared
to standard coatings T2 and PU.
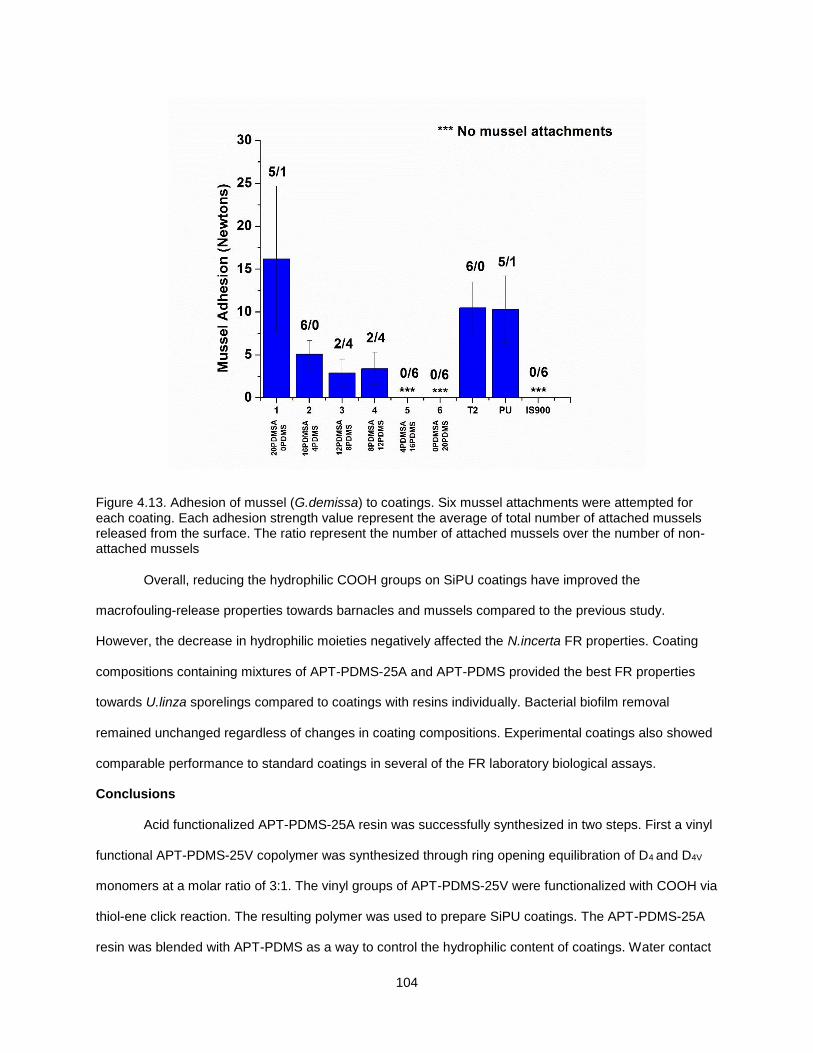
104
Figure 4.13. Adhesion of mussel (G.demissa) to coatings. Six mussel attachments were attempted for each coating. Each adhesion strength value represent the average of total number of attached mussels released from the surface. The ratio represent the number of attached mussels over the number of non-attached mussels
Overall, reducing the hydrophilic COOH groups on SiPU coatings have improved the
macrofouling-release properties towards barnacles and mussels compared to the previous study.
However, the decrease in hydrophilic moieties negatively affected the N.incerta FR properties. Coating
compositions containing mixtures of APT-PDMS-25A and APT-PDMS provided the best FR properties
towards U.linza sporelings compared to coatings with resins individually. Bacterial biofilm removal
remained unchanged regardless of changes in coating compositions. Experimental coatings also showed
comparable performance to standard coatings in several of the FR laboratory biological assays.
Conclusions
Acid functionalized APT-PDMS-25A resin was successfully synthesized in two steps. First a vinyl
functional APT-PDMS-25V copolymer was synthesized through ring opening equilibration of D4 and D4V
monomers at a molar ratio of 3:1. The vinyl groups of APT-PDMS-25V were functionalized with COOH via
thiol-ene click reaction. The resulting polymer was used to prepare SiPU coatings. The APT-PDMS-25A
resin was blended with APT-PDMS as a way to control the hydrophilic content of coatings. Water contact
105
angle measurements showed an increased hydrophobicity with decreasing content of APT-PDMS-25A in
formulations. After water and ASW immersion for 28 days, coatings with high APT-PDMS-25A content
displayed decrease in WCAs implying presence of COO- groups on the surface. Coatings with 20% and
16% APT-PDMS-25A minimized the settlement of U.linza spores, yet settled spores adhered strongly
resulting in poor release of sporelings. The coating compositions with APT-PDMS-25A and APT-PDMS
blends had comparable or better at FR of U.linza sporelings as Intersleek 900. Reducing the APT-PDMS-
25A resin content lead to impaired FR properties towards diatoms although significantly improved that for
barnacles. While this study did not result in the identification of a materials having good FR performance
for all of the marine fouling organisms studied, it is clear that the adhesion of the organisms is highly
responsive to the chemistry of the surfaces. The amphiphilic approach is still a viable option to find
solutions to biofouling. However new coating systems need to be explored using other hydrophilic
moieties for broad spectrum FR. Obtaining the optimum hydrophilic/hydrophobic balance suitable for
marine fouling applications still remains a challenge.
References
1. Callow, J. A.; Callow, M. E., Trends in the Development of Environmentally Friendly Fouling-resistant Marine Coatings. Nat Commun 2011, 2, 244.
2. Yebra, D. M.; Kiil, S. K.; Dam-Johansen, K., Antifouling Technology—Past, Present and Future Steps Towards Efficientand Environmentally Friendly Antifouling Coatings. Progress in Organic Coatings 2004, 50 (2), 75-104.
3. Magin, C. M.; Cooper, S. P.; Brennan, A. B., Non-toxic Antifouling Strategies. Materials Today 2010, 13 (4), 36-44.
4. Schultz, M. P.; Bendick, J. A.; Holm, E. R.; Hertel, W. M., Economic Impact of Biofouling on A Naval Surface Ship. Biofouling 2010, 27 (1), 87-98.
5. Callow, M. E.; Callow, J. A., Marine Biofouling: A Sticky Problem. Biologist 2002, 49 (1), 10.
6. Genzer, J.; Efimenko, K., Recent Developments in Superhydrophobic Surfaces and Their Relevance to Marine Fouling: A Review. Biofouling 2006, 22 (5), 339-360.
7. Dafforn, K. A.; Lewis, J. A.; Johnston, E. L., Antifouling strategies: History and regulation, ecological Impacts and Mitigation. Marine Pollution Bulletin 2011, 62 (3), 453-465.
8. Konstantinou, I. K.; Albanis, T. A., Worldwide Occurrence and Effects of Antifouling Paint Booster Biocides in the Aquatic Environment: A Review. Environment International 2004, 30 (2), 235-248.
9. Brooks, S.; Waldock, M., Advances in Marine Antifouling Coatings and Technology 2009, 492.
106
10. Lejars, M.; Margaillan, A.; Bressy, C., Fouling Release Coatings: A Nontoxic Alternative to Biocidal Antifouling Coatings. Chemical Reviews 2012, 112 (8), 4347-4390.
11. Adkins, J. D.; Mera, A. E.; Roe-Short, M. A.; Pawlikowski, G. T.; Brady Jr, R. F., Novel Non-Toxic Coatings Designed to Resist Marine Fouling. Progress in Organic Coatings 1996, 29 (1–4), 1-5.
12. Brady, R. F., Jr., Clean Hulls Without Poisons: Devising and Testing Nontoxic Marine Coatings. Journal of Coatings Technology 2000, 72 (900), 45-56.
13. Dobretsov, S.; Thomason, J. C., The Development of Marine Biofilms on Two Commercial Non-biocidal Coatings: A Comparison Between Silicone and Fluoropolymer Technologies. Biofouling 2011, 27 (8), 869-880.
14. Berglin, M.; Gatenholm, P., The Barnacle Adhesive Plaque: Morphological and Chemical Differences as a Response to Substrate Properties. Colloids and Surfaces B: Biointerfaces 2003, 28 (2–3), 107-117.
15. Petrone, L.; Di Fino, A.; Aldred, N.; Sukkaew, P.; Ederth, T.; Clare, A. S.; Liedberg, B., Effects of Surface Charge and Gibbs Surface Energy on the Settlement Behaviour of Barnacle Cyprids (Balanus Amphitrite). Biofouling 2011, 27 (9), 1043-1055.
16. Krishnan, S.; Wang, N.; Ober, C. K.; Finlay, J. A.; Callow, M. E.; Callow, J. A.; Hexemer, A.; Sohn, K. E.; Kramer, E. J.; Fischer, D. A., Comparison of the Fouling Release Properties of Hydrophobic Fluorinated and Hydrophilic PEGylated Block Copolymer Surfaces: Attachment Strength of the Diatom Navicula and the Green Alga Ulva. Biomacromolecules 2006, 7 (5), 1449-1462.
17. Wyszogrodzka, M.; Haag, R., Synthesis and Characterization of Glycerol Dendrons, Self-Assembled Monolayers on Gold: A Detailed Study of Their Protein Resistance. Biomacromolecules 2009, 10 (5), 1043-1054.
18. Statz, A. R.; Meagher, R. J.; Barron, A. E.; Messersmith, P. B., New Peptidomimetic Polymers for Antifouling Surfaces. Journal of the American Chemical Society 2005, 127 (22), 7972-7973.
19. Kingshott, P.; Griesser, H. J., Surfaces that Resist Bioadhesion. Current Opinion in Solid State and Materials Science 1999, 4 (4), 403-412.
20. Zhang, J.; Liu, K.; Mullen, K.; Yin, M., Self-assemblies of Amphiphilic Homopolymers: Synthesis, Morphology Studies and Biomedical Applications. Chemical Communications 2015, 51 (58), 11541-11555.
21. Zhang, H.; Chiao, M., Anti-fouling Coatings of Poly(dimethylsiloxane) Devices for Biological and Biomedical Applications. Journal of Medical and Biological Engineering 2015, 35 (2), 143-155.
22. Castner, D. G.; Ratner, B. D., Biomedical Surface Science: Foundations to Frontiers. Surface Science 2002, 500 (1–3), 28-60.
23. Krishnan, S.; Ayothi, R.; Hexemer, A.; Finlay, J. A.; Sohn, K. E.; Perry, R.; Ober, C. K.; Kramer, E. J.; Callow, M. E.; Callow, J. A.; Fischer, D. A., Anti-Biofouling Properties of Comblike Block Copolymers with Amphiphilic Side Chains. Langmuir 2006, 22 (11), 5075-5086.
24. Bauer, S.; Arpa-Sancet, M. P.; Finlay, J. A.; Callow, M. E.; Callow, J. A.; Rosenhahn, A., Adhesion of Marine Fouling Organisms on Hydrophilic and Amphiphilic Polysaccharides. Langmuir 2013.
107
25. Sundaram, H. S.; Cho, Y.; Dimitriou, M. D.; Finlay, J. A.; Cone, G.; Williams, S.; Handlin, D.; Gatto, J.; Callow, M. E.; Callow, J. A.; Kramer, E. J.; Ober, C. K., Fluorinated Amphiphilic Polymers and Their Blends for Fouling-Release Applications: The Benefits of a Triblock Copolymer Surface. ACS Applied Materials & Interfaces 2011, 3 (9), 3366-3374.
26. Sundaram, H. S.; Cho, Y.; Dimitriou, M. D.; Weinman, C. J.; Finlay, J. A.; Cone, G.; Callow, M. E.; Callow, J. A.; Kramer, E. J.; Ober, C. K., Fluorine-free Mixed Amphiphilic Polymers Based on PDMS and PEG Side Chains for Fouling Release Applications. Biofouling 2011, 27 (6), 589-602.
27. Cao, X.; Pettitt, M. E.; Wode, F.; Arpa Sancet, M. P.; Fu, J.; Ji, J.; Callow, M. E.; Callow, J. A.; Rosenhahn, A.; Grunze, M., Interaction of Zoospores of the Green Alga Ulva with Bioinspired Micro- and Nanostructured Surfaces Prepared by Polyelectrolyte Layer-by-Layer Self-Assembly. Advanced Functional Materials 2010, 20 (12), 1984-1993.
28. Liping, T.; Paul Thevenot and Wenjing, H., Surface Chemistry Influences Implant Biocompatibility. Current Topics in Medicinal Chemistry 2008, 8 (4), 270-280.
29. Tidwell, C. D.; Ertel, S. I.; Ratner, B. D.; Tarasevich, B. J.; Atre, S.; Allara, D. L., Endothelial Cell Growth and Protein Adsorption on Terminally Functionalized, Self-Assembled Monolayers of Alkanethiolates on Gold. Langmuir 1997, 13 (13), 3404-3413.
30. Zhao, C.; Brinkhoff, T.; Burchardt, M.; Simon, M.; Wittstock, G., Surface Selection, Adhesion, and Retention Behavior of Marine Bacteria on Synthetic Organic Surfaces using Self-assembled Monolayers and Atomic Force Microscopy. Ocean Dynamics 2009, 59 (2), 305-315.
31. Partha, M.; Abdullah, E.; Dean, C. W., Thermoset Siloxane-Urethane Fouling Release Coatings. In Smart Coatings, American Chemical Society: 2007; Vol. 957, pp 61-75.
32. Webster, D. C.; Pieper, R. J.; Ekin, A. Thermoset Siloxane-Urethane Fouling Release Coatings. US 7,989,074 B2, 2011.
33. Sommer, S.; Ekin, A.; Webster, D. C.; Stafslien, S. J.; Daniels, J.; VanderWal, L. J.; Thompson, S. E. M.; Callow, M. E.; Callow, J. A., A Preliminary Study on the Properties and Fouling-release Performance of Siloxane-Polyurethane Coatings Prepared from PDMS Macromers. Biofouling 2010, 26 (8), 961-972.
34. Bodkhe, R. B.; Thompson, S. E. M.; Yehle, C.; Cilz, N.; Daniels, J.; Stafslien, S. J.; Callow, M. E.; Callow, J. A.; Webster, D. C., The Effect of Formulation Variables on Fouling-release Performance of Stratified Siloxane-Polyurethane Coatings. Journal of Coatings Technology Research 2012, 9 (3), 235-249.
35. Webster, D. C.; Ekin, A.; Sommer, S. A. Anchored Polysiloxane Modified Polyurethane Coatings and Uses Thereof. US 8,299,200 B2, 2012.
36. Bodkhe, R. B.; Stafslien, S. J.; Cilz, N.; Daniels, J.; Thompson, S. E. M.; Callow, M. E.; Callow, J. A.; Webster, D. C., Polyurethanes with Amphiphilic Surfaces Made Using Telechelic Functional PDMS Having Orthogonal Acid Functional Groups. Progress in Organic Coatings 2012, 75 (1–2), 38-48.
37. Webster, D. C.; Bodkhe, R. B. Functionalized Silicones with Polyalkylene Oxide Side Chains. US 9,169,359 B2, 2015, 2015.
108
38. Pieper, R. J.; Ekin, A.; Webster, D. C.; Casse, F.; Callow, J. A.; Callow, M. E., A Combinatorial Approach to Study the Effect of Acrylic Polyol Composition on the Properties of Crosslinked Siloxane-Polyurethane Fouling-Release Coatings. Journal of Coatings Technology Research 2007, 4 (4), 453-461.
39. Owens, D. K.; Wendt, R. C., Estimation of the Surface Free Energy Of Polymers. Journal of Applied Polymer Science 1969, 13 (8), 1741-1747.
40. Casse, F.; Ribeiro, E.; Ekin, A.; Webster, D. C.; Callow, J. A.; Callow, M. E., Laboratory Screening of Coating Libraries for Algal Adhesion. Biofouling 2007, 23 (3/4), 267-276.
41. Cassé, F.; Stafslien, S. J.; Bahr, J. A.; Daniels, J.; Finlay, J. A.; Callow, J. A.; Callow, M. E., Combinatorial Materials Research Applied to the Development of New Surface Coatings V. Application of a Spinning Water-jet for the Semi-high Throughput Assessment of the Attachment Strength of Marine Fouling Algae. Biofouling 2007, 23 (2), 121-130.
42. Callow, M. E.; Callow, J. A.; Conlan, S.; Clare, A. S.; Stafslien, S., Efficacy Testing of Nonbiocidal and Fouling-release Coatings. In Biofouling Methods, John Wiley & Sons, Ltd: 2014; pp 291-316.
43. Stafslien, S. J.; Bahr, J. A.; Daniels, J. W.; Wal, L. V.; Nevins, J.; Smith, J.; Schiele, K.; Chisholm, B., Combinatorial Materials Research Applied to the Development of New Surface Coatings VI: An Automated Spinning Water Jet Apparatus for the High-Throughput Characterization of Fouling-Release Marine Coatings. Review of Scientific Instruments 2007, 78 (7), 072204.
44. Rittschof, D.; Orihuela, B.; Stafslien, S.; Daniels, J.; Christianson, D.; Chisholm, B.; Holm, E., Barnacle Reattachment: A Tool for Studying Barnacle Adhesion. Biofouling 2008, 24 (1), 1-9.
45. Stafslien, S.; Daniels, J.; Bahr, J.; Chisholm, B.; Ekin, A.; Webster, D.; Orihuela, B.; Rittschof, D., An Improved Laboratory Reattachment Method for the Rapid Assessment of Adult Barnacle Adhesion Strength to Fouling-release Marine Coatings. Journal of Coatings Technology and Research 2012, 9 (6), 651-665.
46. J.A Callow, M. E. C., L.K Ista, G Lopez, M.K Chaudhury, The Influence of Surface Energy on the Wetting Behavior of the Spore Adhesive of Marine Alga Ulva linza. Journal of Royal Society Interface 2005, 2, 319-325.
47. M.E Callow, J. A. C., L.K Ista, S.E Coleman, A.C Nolasco, G.P Lopez, Use of Self Assembled Monolayers of Different Wettabilities to Study Surface Selection and Primary Adhesion Processes of Green Algae (Enteromorpha) Zoospores. Applied and Enviornmental Microbiology 2000, 66 (8), 3249-3254.
48. Finlay, J. A.; Callow, M. E.; Ista, L. K.; Lopez, G. P.; Callow, J. A., The Influence of Surface Wettability on the Adhesion Strength of Settled Spores of the Green Alga Enteromorpha and the Diatom Amphora. Integrative and Comparative Biology 2002, 42 (6), 1116-1122.
49. Holland, R.; Dugdale, T. M.; Wetherbee, R.; Brennan, A. B.; Finlay, J. A.; Callow, J. A.; Callow, M. E., Adhesion and Motility of Fouling Diatoms on A Silicone Elastomer. Biofouling 2004, 20 (6), 323-329.
109
CHAPTER 5. POLY (ETHYLENE) GLYCOL-MODIFIED, AMPHIPHILIC, SILOXANE
POLYURETHANE COATINGS AND THEIR PERFORMANCE AS EFFECTIVE
FOULING-RELEASE SURFACES
Introduction
Biofouling is created by the buildup of micro- and macro-organisms on materials that are
immersed in natural bodies of water.1 Biofouling is a complex process which is often fast and dynamic. It
may also involve more than 4000 marine organisms which span a range of sizes and several adhesion
mechanisms.1-3 Biofouling begins with formation of a conditioning film.4 A conditioning film is formed as
soon as a material is immersed in seawater due to the absorption of proteins and organic molecules.
Once the surface is conditioned, colonization of organisms is rather dynamic attributing to available
nutrients, types of marine organisms available, surface exploration and their adhesion preferences.5
Although a successional model of biofouling is frequently advanced,3 a dynamic model, reflecting a more
complex interplay between fouling species, is gaining acceptance.5 Marine bacteria; unicellular
microorganisms colonize the surface first reversibly by electrostatic forces then irreversibly by covalent
interactions. Slime forming diatoms and algae spores settle on the substrate contributing to form complex
biofilms. Larvae of macrofouling organisms such as barnacles, mussels and tubeworms are often
attracted to microfouling yet they can settle on freshly conditioned surfaces illustrating the highly dynamic
nature of biofouling.5
Contending with biofouling has been a challenging problem since the beginning of navigation.2
Extensive and rapid buildup of fouling on a ship hull causes reduction in ship speed and maneuverability
which in turn increases operating costs and environmental penalties.6-8 Environmental concerns include
the spreading of non-native species around the world and increased emissions due to decreased fuel
efficiency. It is estimated that marine biofouling costs the United States Navy approximately 56 million
dollars per year (for their mid-sized vessels) and it could add up to 1 billion dollars for 15 years.7, 8
Historically, copper and lead sheathing covering the ship hulls were used as the primary method of
controlling biofouling.2 Advancements in polymer and resin technology in the 1960 - 1970s led to the use
of self-polishing copolymers with controlled release of biocides such as tributyl tin (TBT).1, 2 However, by
the late 1970s the deleterious effects of TBT towards non-targeted aquatic life was recognized. This issue
110
was addressed by introducing new regulations to reduce the use of TBT which later culminated in a
complete ban of tin based antifouling paints by the International Maritime Organization (IMO) in 2003.1
Antifouling technologies using copper oxide (CuO) as biocides have predominated in recent decades.9
More recently, a considerable amount of research has been conducted towards using non-toxic anti-
fouling (AF)/fouling release (FR) technologies that are environmentally friendly.3
Paints containing CuO and/or organic biocides are still the main AF coatings used on ship hulls.
However, they are considered to be a less sustainable and more an environmentally costly solution to
marine biofouling control. Commercial FR coatings primarily consist of silicone elastomers which only
allow weak attachment of fouling organisms that can be removed later by hydrodynamic forces or light
cleaning.3 However these silicone based FR coatings have some drawbacks such as deterioration of FR
properties over time and poor mechanical durability compared to anti-fouling coatings with controlled
release of biocides.1, 3 Siloxane polyurethane (SiPU) FR coatings have been able to address the issues
with durability by incorporating polydimethyl siloxane (PDMS) into a polyurethane matrix.10-12 Self-
stratification of PDMS to the coating surface provides the FR properties on par with commercial FR
coatings and the polyurethane bulk provides mechanical performance that is several orders of magnitude
higher than silicone elastomers.13-15 Unlike silicone elastomer-based FR coatings, siloxane polyurethane
coatings have excellent adhesion to primers which eliminates the need for a tie-coat.14
Adhesion of marine organisms to surfaces is a complex phenomenon that is often not completely
understood.1, 2 However, the primary method of adhesion involves spreading of an adhesive consisting of
a complex protein or glycoprotein.16 Surfaces modified with polyethylene glycol (PEG) are of great
interest mainly due to their ability to resist protein adhesion.17 PEG-based materials tend to prevent
biofoulant settlement and adhesion via hydrophilic interaction.4 Although there is no well-established
reasoning for biofouling resistance of PEG, several theories have been proposed to explain this complex
phenomenon. One reasoning considers the extremely low interfacial tension attributed to PEG (5 mN m-1)
when in contact with water allowing minimal absorption of organic material due to surface energy
minimization.18 PEG chains can hydrogen bond with neighboring water molecules and bind water tightly
to the surface. Some argue that the protein-resistant properties of PEG arise from a high degree of
organization in this PEG-water complex, which is unfavorable to be disrupted due to considerations of
111
thermodynamics and kinetics.19, 20 Although the exact method is still controversial, PEG is very efficient in
biofouling prevention.4 Self-assembled mono-layers (SAM) containing PEG are commonly used as
protein-resistant materials.17, 21 However, SAMs are not practical as marine coatings.22 Polyurethanes
modified with PEG on the other hand have demonstrated their versatility in biomedical applications. A
number of different parameters are commonly discussed in the literature to tune protein resistant
properties of PEG-based coatings; the MW weight of PEG and chain density of PEG are most commonly
considered.4
The complexity and diversity in the adhesion mechanisms of marine organisms has led to the
investigation of amphiphilic surfaces with mixed hydrophobic and hydrophilic character.3, 4 However,
achieving the right balance between hydrophilicity and hydrophobicity is still a significant challenge.
Several studies of amphiphilic coatings have shown promise as effective fouling release surfaces. 23-28
Lately, state-of-the-art commercial FR coatings have also incorporated amphiphilic character. In previous
attempts to modify SiPU with polyethylene glycol, amino propyl terminated siloxane with pendent PEG
chains provided amphiphilic coatings with improved algae removal compared to the first generation
siloxane polyurethane coatings.29 However, the synthesis of polydimethyl siloxane with pendent PEG
chains involves multiple steps. Although the use of PDMS with PEG side chains in the siloxane-
polyurethane coating system helped to improve microfouling release performance, macrofouling release
performance was impaired.29
In this study, a new approach to generating polyurethanes having amphiphilic surface character is
explored. A series of isophorone diisocyanate-based polyisocyanate pre-polymers was prepared by
reacting with PDMS and PEG. The pre-polymers were then used to formulate amphiphilic siloxane-
polyurethane (AmSiPU) FR coatings. The polyisocyanate pre-polymers were prepared by reacting an
isophorone diisocyanate (IPDI) trimer with monocarbinol terminated PDMS and polyethylene glycol
methyl ether (PEG). The ratio of isocyanate: hydroxyl groups was maintained at 3:2 for the pre-polymer
synthesis. Several variations of the pre-polymers were obtained by varying the molecular weight of PDMS
and PEG. The pre-polymers were characterized using FTIR and isocyanate titrations. Later these pre-
polymers were mixed with an acrylic polyol and additional polyisocyanate to form the siloxane
polyurethane coatings. Overall, the formulations were adjusted so that the PDMS and PEG content was
112
maintained at 5 and 10 weight % based on solids of the coating formulation. Water contact angle (WCA)
and methylene iodide contact angle (MICA) were evaluated before and after water immersion for 28 days
and SE was also determined. Water aged coatings were characterized using ATR-FTIR, XPS and AFM to
understand the coating surface morphology. The FR properties of the AmSiPU coatings were assessed
using biological laboratory assays for bacteria (Cellulophaga lytica), microalgae (Navicula incerta),
macroalgae (Ulva linza), barnacles (Amphibalanus amphitrite) and marine mussel (Geukensia demissa).
Experimental
Materials
Monocarbinol terminated polydimethyl siloxane (PDMS) with three molecular weights (MCR-
C12:1000, MCR-C18:5000, MCR-C22:10000 g/mole) were purchased from Gelest, Inc. Polyisocyanate
Desmodur Z 4470 BA was provided by Bayer MaterialScience (now Covestro LLC). Acetylacetone,
methyl amyl ketone (MAK), ethyl-3-ethoxypropionate (EEP), polyethylene glycol methyl ether (PEG 550
and 750 g/mole), and dibutyltin diacetate (DBTDAc) were purchased from Sigma Aldrich. An acrylic polyol
composed of 80% butyl acrylate and 20% 2-hydroxylethyl acrylate was synthesized via conventional free
radical polymerization and diluted to 50% in toluene. Aminopropyl terminated polydimethyl siloxane (APT-
PDMS) with molecular weight 20000g/mole was also synthesized through a ring-opening equilibration
reaction. Detailed descriptions of the synthesis procedures for the acrylic polyol and APT-PDMS can be
found elsewhere.14 Both the acrylic polyol and APT-PDMS were used for the internal control (A4-20).
Intersleek® 700 (IS 700), Intersleek® 900 (IS 900), Intersleek® 1100 SR (IS 1100SR)
commercial FR coatings and Intergard 264 marine primer were provided by AkzoNobel International
Paint. Hempasil® X3 commercial FR coating was provided by Hempel. Silicone elastomer, Silastic® T2
(T2) was provided by Dow Corning. Aluminum panels (4 x 8 in., 0.6 mm thick, type A, alloy 3003 H14)
purchased from Q-lab were sand blasted and primed with Intergard 264 using air-assisted spray
application. Multi-well plates were modified using circular disks (1 inch diameter) of primed aluminum.
Synthesis of pre-polymers
A commercially available IPDI trimer (Desmodur Z4470 BA) polyisocyanate was modified with
PDMS and polyethylene glycol to prepare pre-polymers with several different compositions (Table 5.1). A
general formulation procedure for pre-polymer IPDI-10-5kPDMS-550PEG (formulation 8) modified with
113
PDMS (MW=5000) and PEG (MW=550) is described here (for the pre-polymer described here, amount of
PDMS and PEG are 10% each by wt. based on the total weight of final SiPU formulation). First PEG
(1.6000g) was diluted with EEP (1.6000g) in a 40 mL glass vial with a magnetic stir bar. Next, PDMS
(1.6000g) was added to the vial and mixed using a vortex mixer for 5 mins. Isocyanate (2.4567g) and
DBTDAc catalyst solution (1% by wt. in MAK) (0.3200g) were added into the vial. The contents were
mixed using a vortex mixer for 5-10 min followed by further stirring for 24 hrs using a magnetic stir bar.
The isocyanate to total hydroxyl equivalents ratio was maintained at 3:2 for all pre-polymers. Detailed
formulations can be found in Appendix Table A17.
A general structure depicted in Figure 5.1 is proposed for the pre-polymers synthesized. In the
proposed structure, X can be either an unreacted isocyanate group, PDMS chain linked through urethane
or PEG chain linked through urethane. Several pre-polymer compositions were explored in this study and
their compositional variations can be found in Appendix Table A18. Pre-polymer compositions
investigated in this study contain isocyanate equivalents (X1) 0.000573-0.00225, PDMS equivalents (X2)
0.00008-0.0016, and PEG equivalents (X3) 0.00107-0.00291.
Isocyanate titrations
Isocyanate titration was used to confirm the presence of NCO groups after the pre-polymer
synthesis. In general, a sample of pre-polymer (0.3-0.5g) was placed in Erlenmeyer flask and diluted with
isopropanol. Then 25mL of 0.1N dibutyl amine solution was added to the flask followed by additional
isopropanol (25 mL). Next the solution was mixed for 15 mins. A few drops of bromophenyl blue indicator
were added and titrated using a standardized 0.1N hydrochloric acid solution until the end point blue to
yellow. A blank prepared only with 25 mL of dibutyl amine solution was also titrated using the same acid
solution and then the % NCO of the pre-polymer was determined.
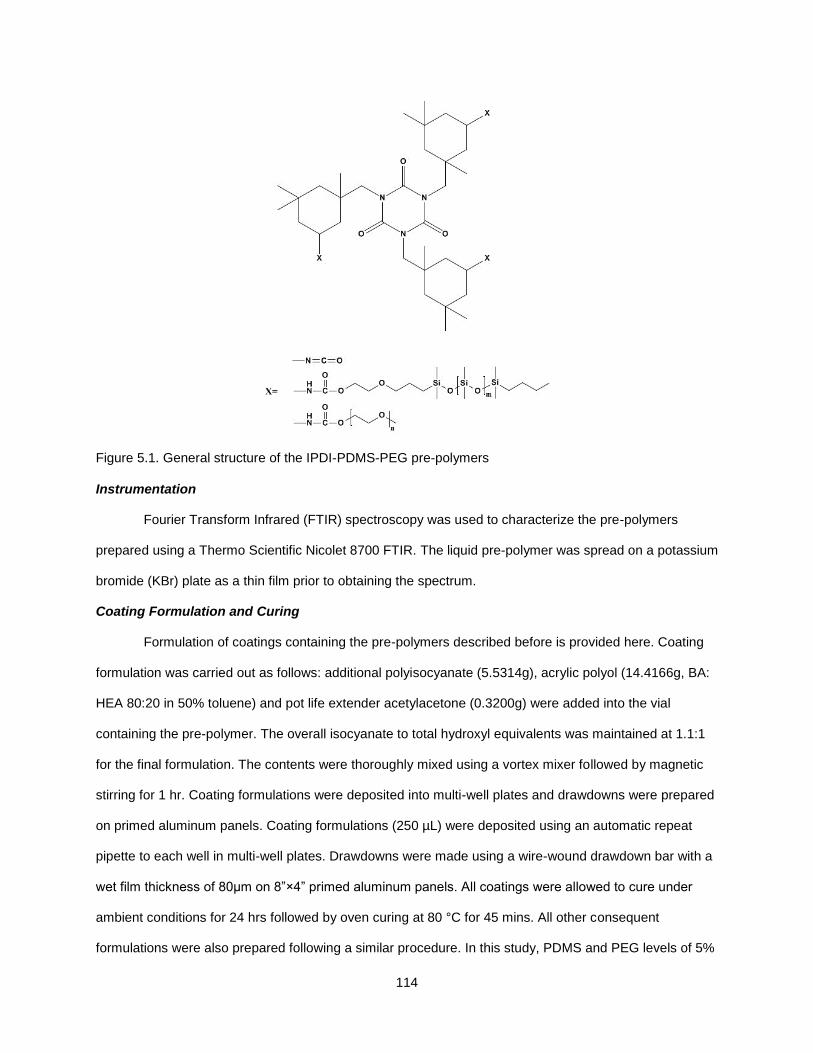
114
Figure 5.1. General structure of the IPDI-PDMS-PEG pre-polymers
Instrumentation
Fourier Transform Infrared (FTIR) spectroscopy was used to characterize the pre-polymers
prepared using a Thermo Scientific Nicolet 8700 FTIR. The liquid pre-polymer was spread on a potassium
bromide (KBr) plate as a thin film prior to obtaining the spectrum.
Coating Formulation and Curing
Formulation of coatings containing the pre-polymers described before is provided here. Coating
formulation was carried out as follows: additional polyisocyanate (5.5314g), acrylic polyol (14.4166g, BA:
HEA 80:20 in 50% toluene) and pot life extender acetylacetone (0.3200g) were added into the vial
containing the pre-polymer. The overall isocyanate to total hydroxyl equivalents was maintained at 1.1:1
for the final formulation. The contents were thoroughly mixed using a vortex mixer followed by magnetic
stirring for 1 hr. Coating formulations were deposited into multi-well plates and drawdowns were prepared
on primed aluminum panels. Coating formulations (250 µL) were deposited using an automatic repeat
pipette to each well in multi-well plates. Drawdowns were made using a wire-wound drawdown bar with a
wet film thickness of 80µm on 8”×4” primed aluminum panels. All coatings were allowed to cure under
ambient conditions for 24 hrs followed by oven curing at 80 °C for 45 mins. All other consequent
formulations were also prepared following a similar procedure. In this study, PDMS and PEG levels of 5%
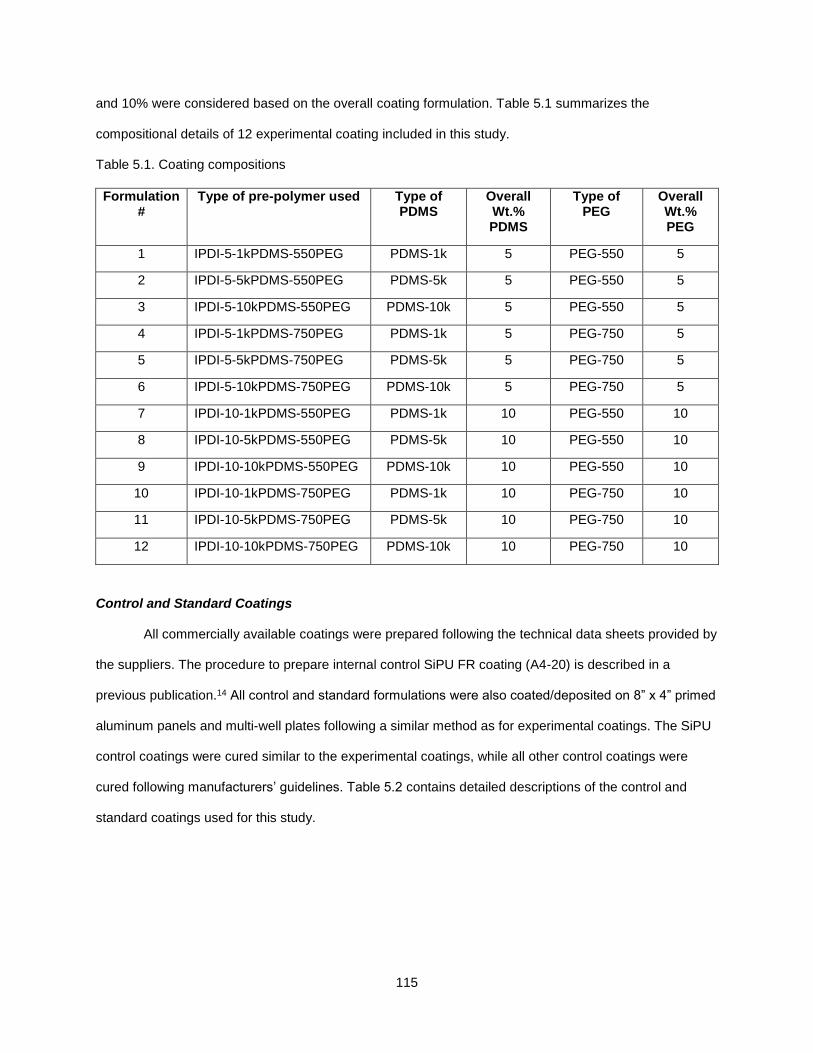
115
and 10% were considered based on the overall coating formulation. Table 5.1 summarizes the
compositional details of 12 experimental coating included in this study.
Table 5.1. Coating compositions
Formulation #
Type of pre-polymer used Type of PDMS
Overall Wt.% PDMS
Type of PEG
Overall Wt.% PEG
1 IPDI-5-1kPDMS-550PEG PDMS-1k 5 PEG-550 5
2 IPDI-5-5kPDMS-550PEG PDMS-5k 5 PEG-550 5
3 IPDI-5-10kPDMS-550PEG PDMS-10k 5 PEG-550 5
4 IPDI-5-1kPDMS-750PEG PDMS-1k 5 PEG-750 5
5 IPDI-5-5kPDMS-750PEG PDMS-5k 5 PEG-750 5
6 IPDI-5-10kPDMS-750PEG PDMS-10k 5 PEG-750 5
7 IPDI-10-1kPDMS-550PEG PDMS-1k 10 PEG-550 10
8 IPDI-10-5kPDMS-550PEG PDMS-5k 10 PEG-550 10
9 IPDI-10-10kPDMS-550PEG PDMS-10k 10 PEG-550 10
10 IPDI-10-1kPDMS-750PEG PDMS-1k 10 PEG-750 10
11 IPDI-10-5kPDMS-750PEG PDMS-5k 10 PEG-750 10
12 IPDI-10-10kPDMS-750PEG PDMS-10k 10 PEG-750 10
Control and Standard Coatings
All commercially available coatings were prepared following the technical data sheets provided by
the suppliers. The procedure to prepare internal control SiPU FR coating (A4-20) is described in a
previous publication.14 All control and standard formulations were also coated/deposited on 8” x 4” primed
aluminum panels and multi-well plates following a similar method as for experimental coatings. The SiPU
control coatings were cured similar to the experimental coatings, while all other control coatings were
cured following manufacturers’ guidelines. Table 5.2 contains detailed descriptions of the control and
standard coatings used for this study.
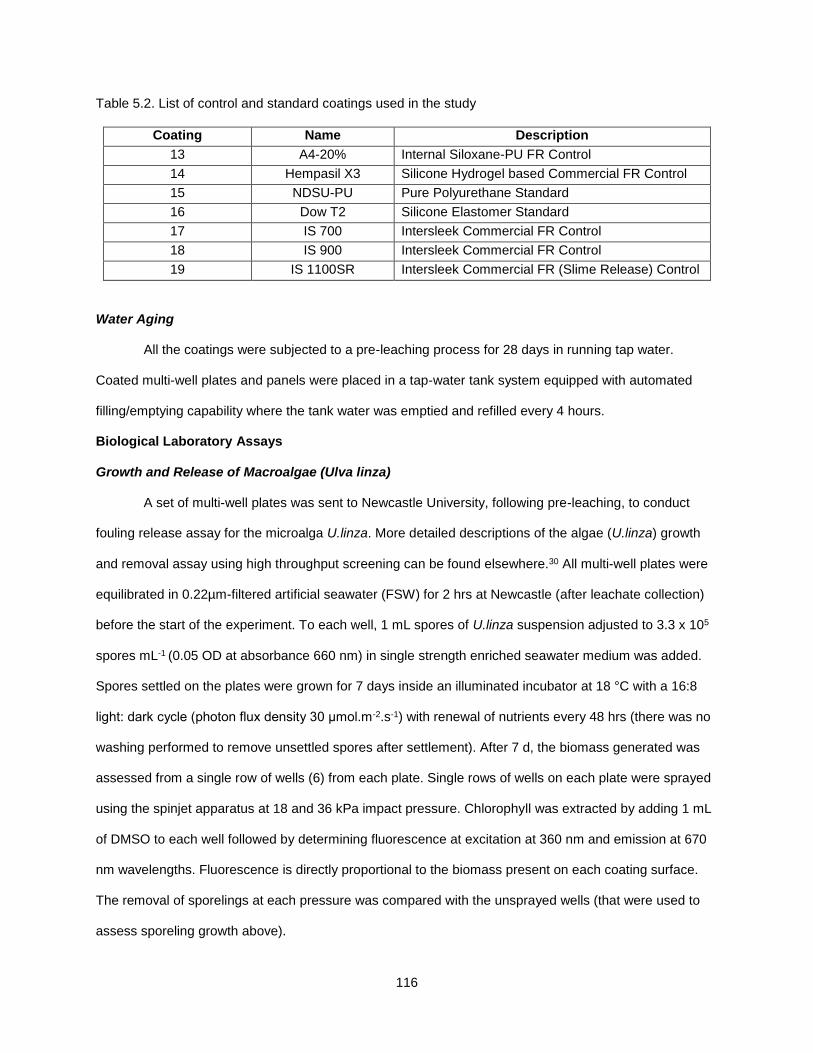
116
Table 5.2. List of control and standard coatings used in the study
Coating Name Description
13 A4-20% Internal Siloxane-PU FR Control
14 Hempasil X3 Silicone Hydrogel based Commercial FR Control
15 NDSU-PU Pure Polyurethane Standard
16 Dow T2 Silicone Elastomer Standard
17 IS 700 Intersleek Commercial FR Control
18 IS 900 Intersleek Commercial FR Control
19 IS 1100SR Intersleek Commercial FR (Slime Release) Control
Water Aging
All the coatings were subjected to a pre-leaching process for 28 days in running tap water.
Coated multi-well plates and panels were placed in a tap-water tank system equipped with automated
filling/emptying capability where the tank water was emptied and refilled every 4 hours.
Biological Laboratory Assays
Growth and Release of Macroalgae (Ulva linza)
A set of multi-well plates was sent to Newcastle University, following pre-leaching, to conduct
fouling release assay for the microalga U.linza. More detailed descriptions of the algae (U.linza) growth
and removal assay using high throughput screening can be found elsewhere.30 All multi-well plates were
equilibrated in 0.22µm-filtered artificial seawater (FSW) for 2 hrs at Newcastle (after leachate collection)
before the start of the experiment. To each well, 1 mL spores of U.linza suspension adjusted to 3.3 x 10⁵
spores mL-1 (0.05 OD at absorbance 660 nm) in single strength enriched seawater medium was added.
Spores settled on the plates were grown for 7 days inside an illuminated incubator at 18 °C with a 16:8
light: dark cycle (photon flux density 30 μmol.m-2.s-1) with renewal of nutrients every 48 hrs (there was no
washing performed to remove unsettled spores after settlement). After 7 d, the biomass generated was
assessed from a single row of wells (6) from each plate. Single rows of wells on each plate were sprayed
using the spinjet apparatus at 18 and 36 kPa impact pressure. Chlorophyll was extracted by adding 1 mL
of DMSO to each well followed by determining fluorescence at excitation at 360 nm and emission at 670
nm wavelengths. Fluorescence is directly proportional to the biomass present on each coating surface.
The removal of sporelings at each pressure was compared with the unsprayed wells (that were used to
assess sporeling growth above).
117
Growth and Release of Microalgae (Navicula incerta)
Pre-leached coatings prepared in multi-well plates were used for the microalgae (N.incerta) assay
at NDSU using methods described previously.31, 32 To each coating well, 1 mL of diatom (N.incerta)
suspension with 4 x 10⁵ cells/mL (adjusted to 0.03 OD at absorbance 660 nm) in Guillard’s F2 medium
was deposited. The plates were incubated for 2 hrs under ambient conditions to allow for cell attachment.
Coating wells were then subjected to water jet treatments, where 3 replicate wells (1st column) were kept
untreated while other columns of wells were treated with water jet pressure 20 psi (138k Pa) for 10
seconds. Biomass was quantified through chlorophyll extraction using 0.5 mL of DMSO and measuring
fluorescence of the extracts (excitation wavelength at 360 nm; emission wavelength at 670 nm). The
relative fluorescence from the extract is directly proportional to the algae biomass present on the coating
surface before and after water jet treatment. Percent removal of diatoms was determined using relative
fluorescence of non-jetted and water-jetted wells.
Bacterial (Cellulophaga lytica) Biofilm Adhesion
Evaluating fouling release performance of coatings towards marine bacteria (C.lytica) has been
outlined by Stafslien et al.32, 33 Multi-well plates containing coatings were inoculated by dispensing a 1 mL
suspension of marine bacteria (C.lytica; 107 cells/mL) in FSW supplemented with 0.5 g/L of peptone and
0.1 g/L of yeast extract. The plates were incubated statically for 24 hrs at 37°C. The plates were carefully
rinsed 3 times with DI water to remove any unattached bacteria cells. The first column (3 wells) was
saved as the initial bacterial biofilm growth while the next columns (3 wells) were subjected to water jet
treatment at 20 psi (138 kPa) for 5 seconds. The coating surfaces were then stained with crystal violet
(0.3% solution in deionized water). The crystal violet was extracted using 33% acetic acid solution and
0.15 mL aliquots of the resulting eluates were measured for absorbance at 600nm wavelength. The
absorbance values were directly proportional to the amount of bacterial biofilm present on coatings.
Biofilm removal from the coatings was quantified by comparing the relative absorbance values obtained
for the non-jetted and water-jetted wells.
Re-attached Adult Barnacle (Amphibalanus amphitrite) Adhesion
An adult barnacle reattachment assay described by Stafslien et al was used to evaluate the
fouling release performance of the coatings towards macrofouling organisms.34, 35 Coatings were
118
prepared on 8 x 4” panels and evaluated following 28 days of pre-leaching. Adult barnacles (~5 mm in
diameter) supplied by Duke University attached to silicone substrates were dislodged (n = 6) and
immobilized onto the surface of experimental coatings using a custom template. The barnacles were
allowed to reattach and grow while they were immersed in an artificial sea water aquarium tank system
with daily feedings of Artemia nauplii (Florida Aqua Farms). After two weeks, the barnacles were pushed
off in shear using a hand-held force gauge mounted to a semi-automated device and the peak force of
removal for each barnacle was recorded. Image analysis (Sigma Scan Pro 5.0) was used to quantify the
base plate area for each barnacle after it was dislodged. Barnacle adhesion strength (MPa) was
calculated by taking the ratio of force for removal to basal plate area. The average barnacle adhesion
strength for each coating was reported as the total number of barnacles removed with a measureable
force. Barnacles that were adhered strongly resulted in broken barnacles implying poor FR. In some
cases, barnacles were unable to reattach to the coating surfaces, in which case the lack of attachment
was considered to be an advantage for fouling release coatings.
Mussel (Geukensia demissa) Adhesion
Coatings prepared on 4” x 8” panels were also utilized for the mussel adhesion assay. Marine
mussels (G.demissa) were provided by Duke University Marine Laboratory in Beaufort, North Carolina,
USA. Each mussel was modified by attaching a 4 cm long acetal plastic rod (product# 98873A105,
McMaster-Carr) perpendicular to the ventral edge, using a 3M® acrylic adhesive (product# 7467A135,
McMaster-Carr) prior to attachment assay. Six mussels were immobilized on to each coating surface
followed by placing PVC sheets (custom-designed template) firmly against the plastic rods so that the
mussels were in contact with the coating surface. The coatings with immobilized mussels were placed in
the ASW aquarium system and fed daily with live marine phytoplankton (DTs Premium Reef Blend
Phytoplankton) for three days. The coatings were removed from the ASW aquarium tank system and the
total number of mussels showing attachment of byssus threads was recorded for each surface. The
plastic rod from each mussel was attached to individual 5 N load cell of a custom built tensile force gauge
where mussels were pulled off (1 mm/s pull rate) simultaneously. The force required for detachment of all
byssus threads was averaged and the pull-off value for each coating was recorded. As in the barnacle
119
assay, the presence of non-attached mussels during the 3 day attachment period indicated good mussel
deterrence properties.
Surface Characterization
A Symyx®/First Ten Angstroms surface energy system was used to evaluate wettability of
experimental coatings. Water/methylene iodide contact angles measurements were performed before and
after 28 days of water immersion. Three measurements of each water and methylene iodide contact
angle were obtained using First Ten AngstromsTM software. The average WCA and MICA were used to
calculate the SE for each coating by Owens-Wendt method.36
Attenuated Total Reflectance Fourier Transformed Infrared spectroscopy (ATR-FTIR) was utilized
to characterize the coating surfaces after water aging. A Bruker Vertex 70 with Harrick’s ATRTM accessory
using a hemispherical Ge crystal was used to obtain ATR-FTIR spectra of the coatings.
X-ray photoelectron spectroscopy was utilized to investigate the surface composition of the
experimental coatings. A Thermo ScientificTM K-AlphaTM XPS equipped with monochromatic Al Kα
(1486.68 eV) X-ray source and Ar+ ion source (up to 4000 eV) was utilized for the XPS experiments. All
the samples were cleaned to remove trace contaminants. A 2 mm × 2 mm area of the sample was
sputtered with a large Ar+ ion cluster with a power of 4000 eV using the MAGCIS® cluster gun before
analysis. Survey spectra were collected at low resolution with a constant analyzer pass energy of 200 eV.
Three scans were collected with an energy increment of 1.000 eV/step for a total of 10 ms. High
resolution spectra was collected with a constant analyzer pass energy of 50 eV. Ten scans were collected
using an energy increment of 0.100 eV/step for a total of 50 ms. For each run, photoemission lines for C
1s, N 1s, O 1s, and Si 2p were observed and the spectrum consists of the average of 10 cycles. Spectra
were collected at an angle normal to the surface (90°) of a circular analysis area with a 400 µm diameter.
Throughout the experiments chamber pressure was maintained below 1.5×10⁻⁷ Torr and samples were
analyzed at ambient temperature. Atomic concentrations were determined utilizing the integrated areas
after subtracting Smart background and corresponding atomic sensitivity factors of 1.000, 1.676, 2.881,
and 0.900 for C 1s, N 1s, O 1s, and Si 2p lines respectively.
Atomic Force Microscopy (AFM) was used to observe the topography of experimental coatings. A
Dimension 3100 microscope with Nanoscope controller was used to scan the surface of water-leached
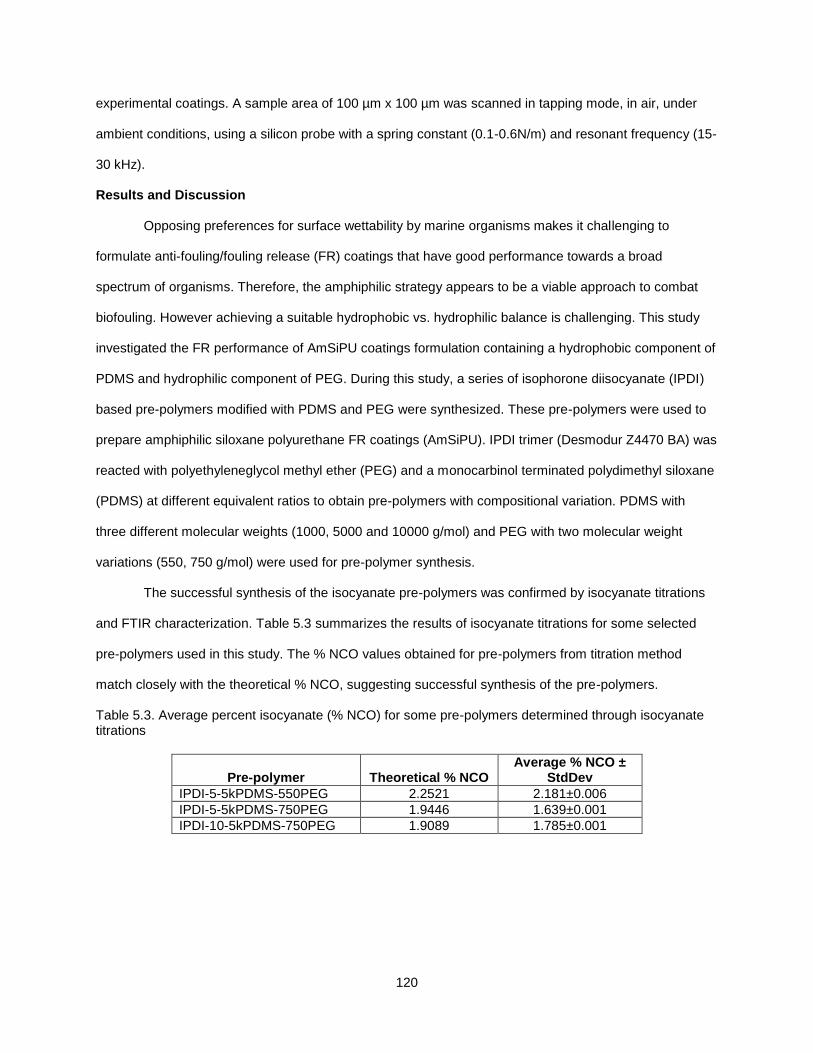
120
experimental coatings. A sample area of 100 µm x 100 µm was scanned in tapping mode, in air, under
ambient conditions, using a silicon probe with a spring constant (0.1-0.6N/m) and resonant frequency (15-
30 kHz).
Results and Discussion
Opposing preferences for surface wettability by marine organisms makes it challenging to
formulate anti-fouling/fouling release (FR) coatings that have good performance towards a broad
spectrum of organisms. Therefore, the amphiphilic strategy appears to be a viable approach to combat
biofouling. However achieving a suitable hydrophobic vs. hydrophilic balance is challenging. This study
investigated the FR performance of AmSiPU coatings formulation containing a hydrophobic component of
PDMS and hydrophilic component of PEG. During this study, a series of isophorone diisocyanate (IPDI)
based pre-polymers modified with PDMS and PEG were synthesized. These pre-polymers were used to
prepare amphiphilic siloxane polyurethane FR coatings (AmSiPU). IPDI trimer (Desmodur Z4470 BA) was
reacted with polyethyleneglycol methyl ether (PEG) and a monocarbinol terminated polydimethyl siloxane
(PDMS) at different equivalent ratios to obtain pre-polymers with compositional variation. PDMS with
three different molecular weights (1000, 5000 and 10000 g/mol) and PEG with two molecular weight
variations (550, 750 g/mol) were used for pre-polymer synthesis.
The successful synthesis of the isocyanate pre-polymers was confirmed by isocyanate titrations
and FTIR characterization. Table 5.3 summarizes the results of isocyanate titrations for some selected
pre-polymers used in this study. The % NCO values obtained for pre-polymers from titration method
match closely with the theoretical % NCO, suggesting successful synthesis of the pre-polymers.
Table 5.3. Average percent isocyanate (% NCO) for some pre-polymers determined through isocyanate titrations
Pre-polymer Theoretical % NCO Average % NCO ±
StdDev
IPDI-5-5kPDMS-550PEG 2.2521 2.181±0.006
IPDI-5-5kPDMS-750PEG 1.9446 1.639±0.001
IPDI-10-5kPDMS-750PEG 1.9089 1.785±0.001
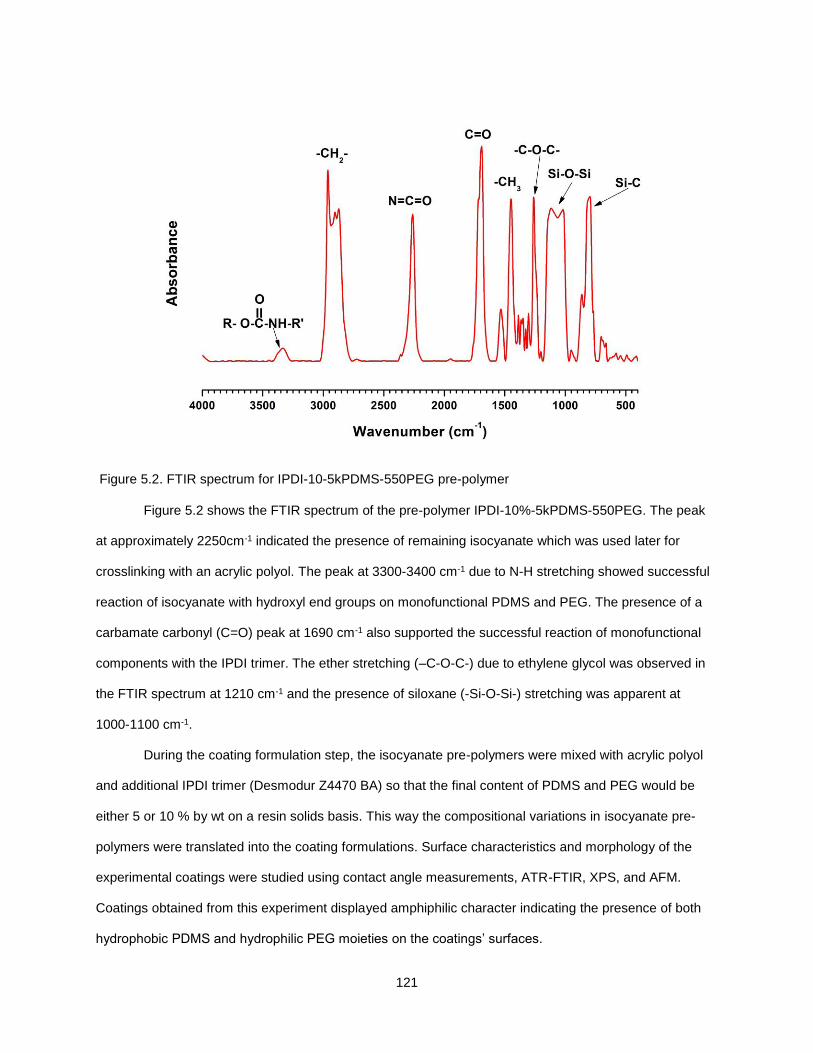
121
Figure 5.2. FTIR spectrum for IPDI-10-5kPDMS-550PEG pre-polymer
Figure 5.2 shows the FTIR spectrum of the pre-polymer IPDI-10%-5kPDMS-550PEG. The peak
at approximately 2250cm-1 indicated the presence of remaining isocyanate which was used later for
crosslinking with an acrylic polyol. The peak at 3300-3400 cm-1 due to N-H stretching showed successful
reaction of isocyanate with hydroxyl end groups on monofunctional PDMS and PEG. The presence of a
carbamate carbonyl (C=O) peak at 1690 cm-1 also supported the successful reaction of monofunctional
components with the IPDI trimer. The ether stretching (–C-O-C-) due to ethylene glycol was observed in
the FTIR spectrum at 1210 cm-1 and the presence of siloxane (-Si-O-Si-) stretching was apparent at
1000-1100 cm-1.
During the coating formulation step, the isocyanate pre-polymers were mixed with acrylic polyol
and additional IPDI trimer (Desmodur Z4470 BA) so that the final content of PDMS and PEG would be
either 5 or 10 % by wt on a resin solids basis. This way the compositional variations in isocyanate pre-
polymers were translated into the coating formulations. Surface characteristics and morphology of the
experimental coatings were studied using contact angle measurements, ATR-FTIR, XPS, and AFM.
Coatings obtained from this experiment displayed amphiphilic character indicating the presence of both
hydrophobic PDMS and hydrophilic PEG moieties on the coatings’ surfaces.
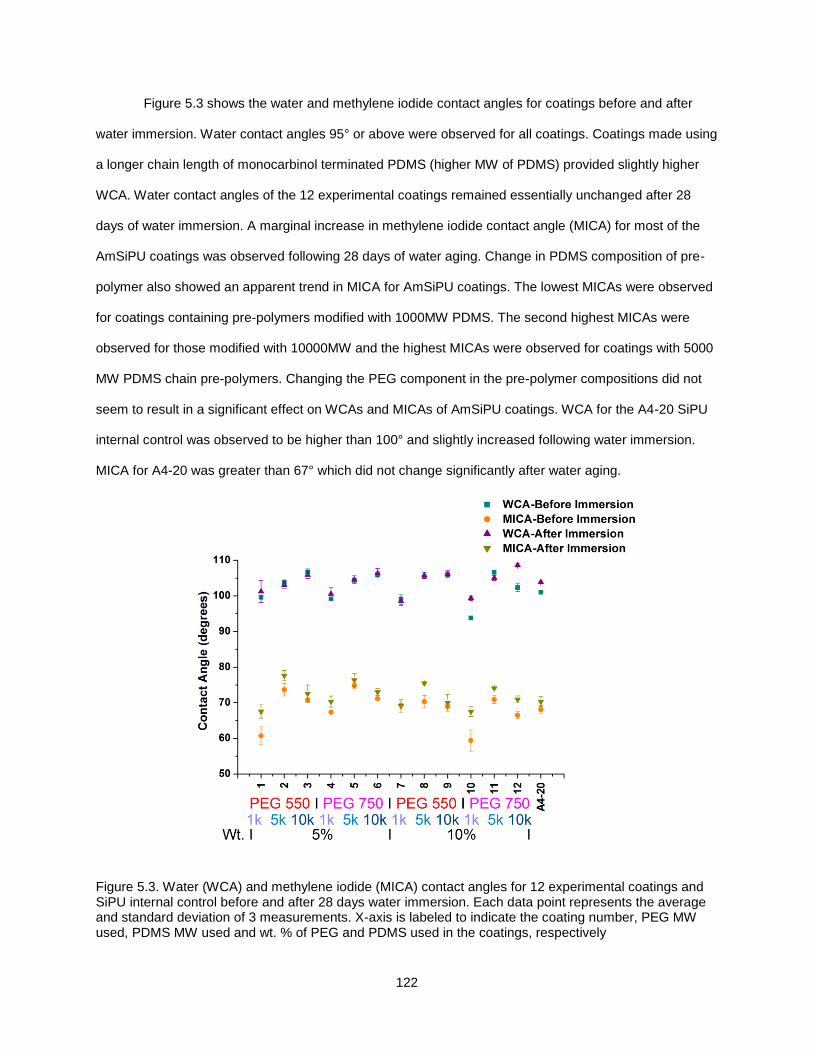
122
Figure 5.3 shows the water and methylene iodide contact angles for coatings before and after
water immersion. Water contact angles 95° or above were observed for all coatings. Coatings made using
a longer chain length of monocarbinol terminated PDMS (higher MW of PDMS) provided slightly higher
WCA. Water contact angles of the 12 experimental coatings remained essentially unchanged after 28
days of water immersion. A marginal increase in methylene iodide contact angle (MICA) for most of the
AmSiPU coatings was observed following 28 days of water aging. Change in PDMS composition of pre-
polymer also showed an apparent trend in MICA for AmSiPU coatings. The lowest MICAs were observed
for coatings containing pre-polymers modified with 1000MW PDMS. The second highest MICAs were
observed for those modified with 10000MW and the highest MICAs were observed for coatings with 5000
MW PDMS chain pre-polymers. Changing the PEG component in the pre-polymer compositions did not
seem to result in a significant effect on WCAs and MICAs of AmSiPU coatings. WCA for the A4-20 SiPU
internal control was observed to be higher than 100° and slightly increased following water immersion.
MICA for A4-20 was greater than 67° which did not change significantly after water aging.
Figure 5.3. Water (WCA) and methylene iodide (MICA) contact angles for 12 experimental coatings and SiPU internal control before and after 28 days water immersion. Each data point represents the average and standard deviation of 3 measurements. X-axis is labeled to indicate the coating number, PEG MW used, PDMS MW used and wt. % of PEG and PDMS used in the coatings, respectively
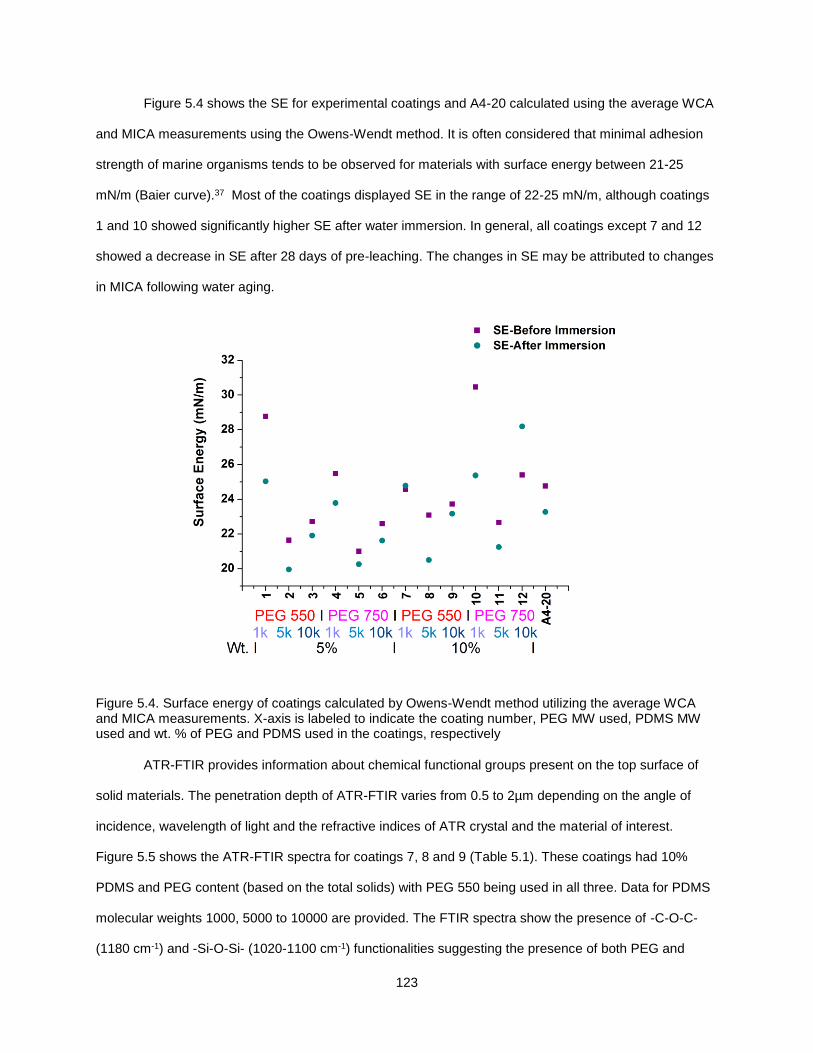
123
Figure 5.4 shows the SE for experimental coatings and A4-20 calculated using the average WCA
and MICA measurements using the Owens-Wendt method. It is often considered that minimal adhesion
strength of marine organisms tends to be observed for materials with surface energy between 21-25
mN/m (Baier curve).37 Most of the coatings displayed SE in the range of 22-25 mN/m, although coatings
1 and 10 showed significantly higher SE after water immersion. In general, all coatings except 7 and 12
showed a decrease in SE after 28 days of pre-leaching. The changes in SE may be attributed to changes
in MICA following water aging.
Figure 5.4. Surface energy of coatings calculated by Owens-Wendt method utilizing the average WCA and MICA measurements. X-axis is labeled to indicate the coating number, PEG MW used, PDMS MW used and wt. % of PEG and PDMS used in the coatings, respectively
ATR-FTIR provides information about chemical functional groups present on the top surface of
solid materials. The penetration depth of ATR-FTIR varies from 0.5 to 2µm depending on the angle of
incidence, wavelength of light and the refractive indices of ATR crystal and the material of interest.
Figure 5.5 shows the ATR-FTIR spectra for coatings 7, 8 and 9 (Table 5.1). These coatings had 10%
PDMS and PEG content (based on the total solids) with PEG 550 being used in all three. Data for PDMS
molecular weights 1000, 5000 to 10000 are provided. The FTIR spectra show the presence of -C-O-C-
(1180 cm-1) and -Si-O-Si- (1020-1100 cm-1) functionalities suggesting the presence of both PEG and
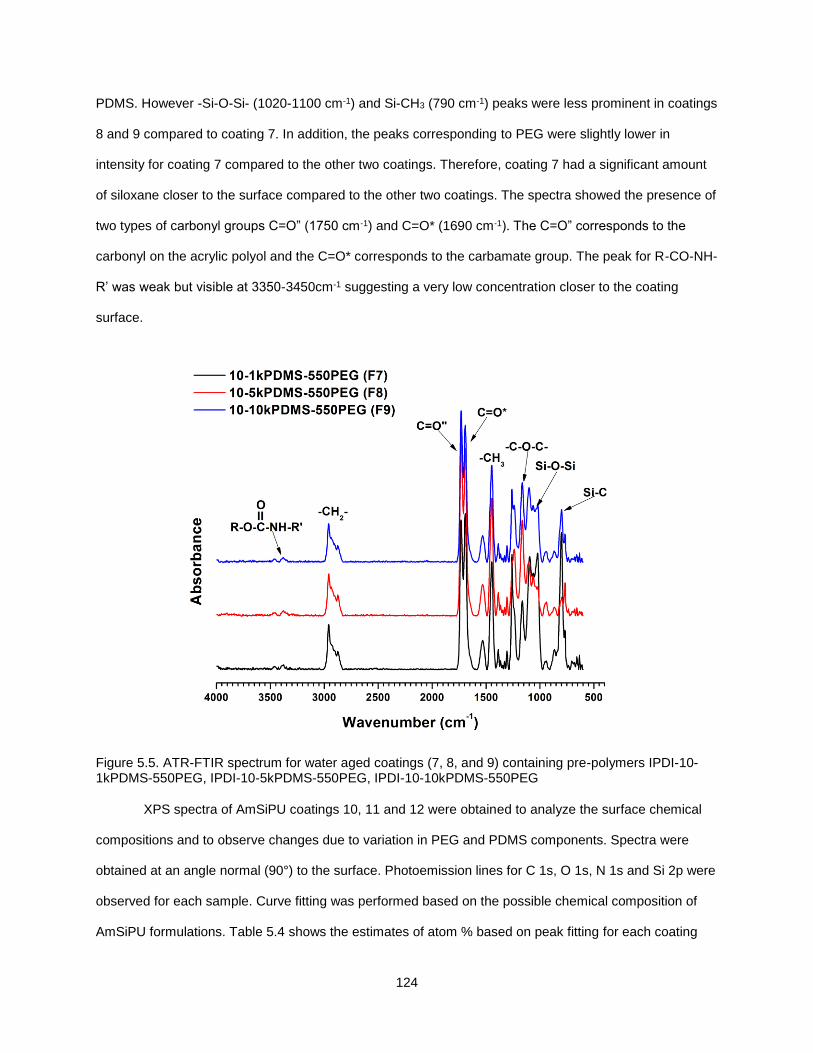
124
PDMS. However -Si-O-Si- (1020-1100 cm-1) and Si-CH3 (790 cm-1) peaks were less prominent in coatings
8 and 9 compared to coating 7. In addition, the peaks corresponding to PEG were slightly lower in
intensity for coating 7 compared to the other two coatings. Therefore, coating 7 had a significant amount
of siloxane closer to the surface compared to the other two coatings. The spectra showed the presence of
two types of carbonyl groups C=O” (1750 cm-1) and C=O* (1690 cm-1). The C=O” corresponds to the
carbonyl on the acrylic polyol and the C=O* corresponds to the carbamate group. The peak for R-CO-NH-
R’ was weak but visible at 3350-3450cm-1 suggesting a very low concentration closer to the coating
surface.
Figure 5.5. ATR-FTIR spectrum for water aged coatings (7, 8, and 9) containing pre-polymers IPDI-10-1kPDMS-550PEG, IPDI-10-5kPDMS-550PEG, IPDI-10-10kPDMS-550PEG
XPS spectra of AmSiPU coatings 10, 11 and 12 were obtained to analyze the surface chemical
compositions and to observe changes due to variation in PEG and PDMS components. Spectra were
obtained at an angle normal (90°) to the surface. Photoemission lines for C 1s, O 1s, N 1s and Si 2p were
observed for each sample. Curve fitting was performed based on the possible chemical composition of
AmSiPU formulations. Table 5.4 shows the estimates of atom % based on peak fitting for each coating
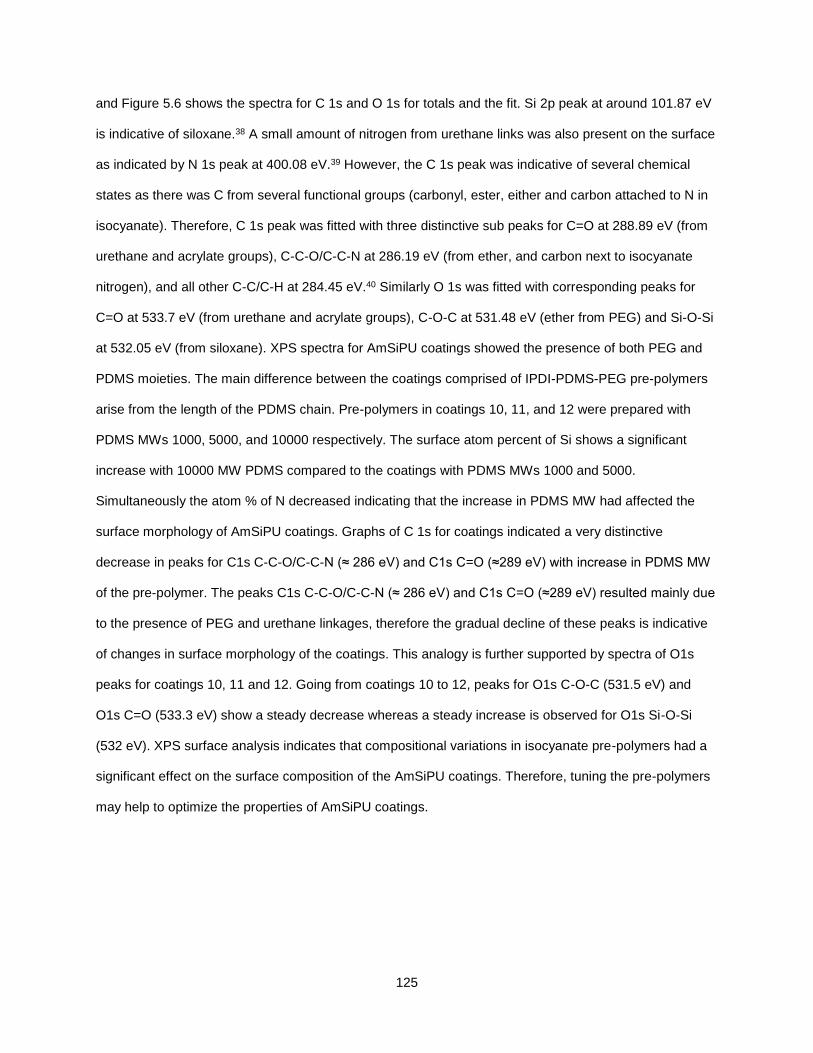
125
and Figure 5.6 shows the spectra for C 1s and O 1s for totals and the fit. Si 2p peak at around 101.87 eV
is indicative of siloxane.38 A small amount of nitrogen from urethane links was also present on the surface
as indicated by N 1s peak at 400.08 eV.39 However, the C 1s peak was indicative of several chemical
states as there was C from several functional groups (carbonyl, ester, either and carbon attached to N in
isocyanate). Therefore, C 1s peak was fitted with three distinctive sub peaks for C=O at 288.89 eV (from
urethane and acrylate groups), C-C-O/C-C-N at 286.19 eV (from ether, and carbon next to isocyanate
nitrogen), and all other C-C/C-H at 284.45 eV.40 Similarly O 1s was fitted with corresponding peaks for
C=O at 533.7 eV (from urethane and acrylate groups), C-O-C at 531.48 eV (ether from PEG) and Si-O-Si
at 532.05 eV (from siloxane). XPS spectra for AmSiPU coatings showed the presence of both PEG and
PDMS moieties. The main difference between the coatings comprised of IPDI-PDMS-PEG pre-polymers
arise from the length of the PDMS chain. Pre-polymers in coatings 10, 11, and 12 were prepared with
PDMS MWs 1000, 5000, and 10000 respectively. The surface atom percent of Si shows a significant
increase with 10000 MW PDMS compared to the coatings with PDMS MWs 1000 and 5000.
Simultaneously the atom % of N decreased indicating that the increase in PDMS MW had affected the
surface morphology of AmSiPU coatings. Graphs of C 1s for coatings indicated a very distinctive
decrease in peaks for C1s C-C-O/C-C-N (≈ 286 eV) and C1s C=O (≈289 eV) with increase in PDMS MW
of the pre-polymer. The peaks C1s C-C-O/C-C-N (≈ 286 eV) and C1s C=O (≈289 eV) resulted mainly due
to the presence of PEG and urethane linkages, therefore the gradual decline of these peaks is indicative
of changes in surface morphology of the coatings. This analogy is further supported by spectra of O1s
peaks for coatings 10, 11 and 12. Going from coatings 10 to 12, peaks for O1s C-O-C (531.5 eV) and
O1s C=O (533.3 eV) show a steady decrease whereas a steady increase is observed for O1s Si-O-Si
(532 eV). XPS surface analysis indicates that compositional variations in isocyanate pre-polymers had a
significant effect on the surface composition of the AmSiPU coatings. Therefore, tuning the pre-polymers
may help to optimize the properties of AmSiPU coatings.
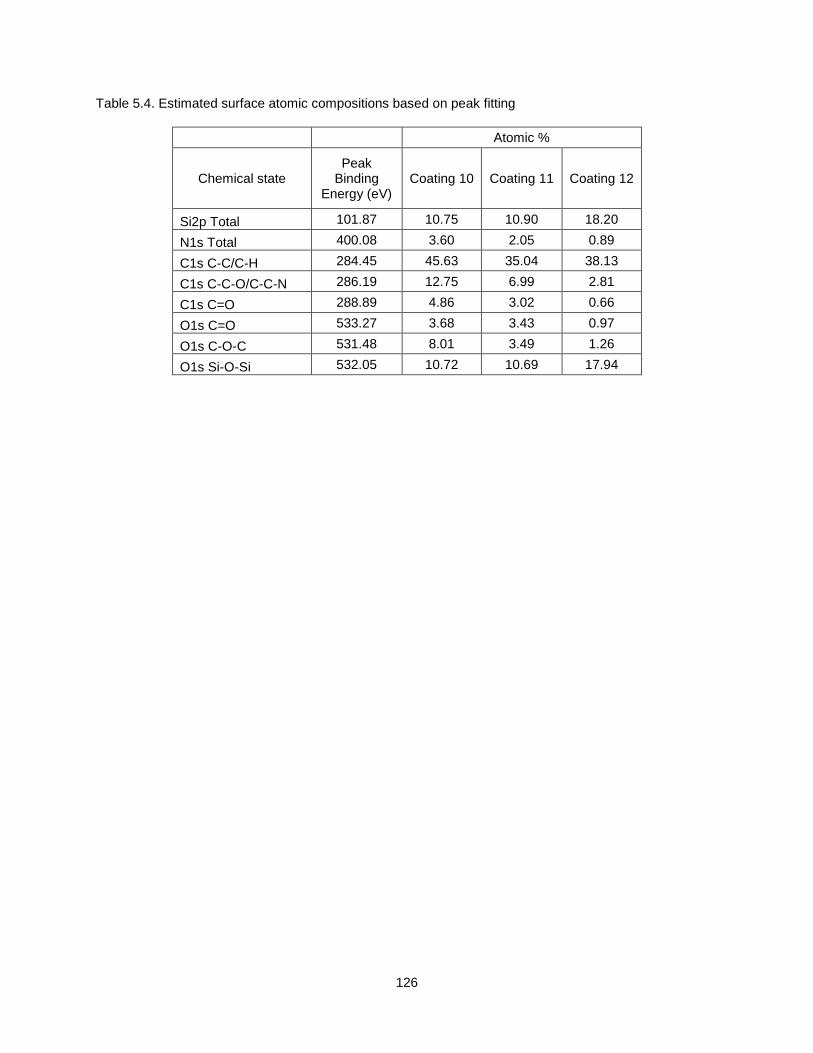
126
Table 5.4. Estimated surface atomic compositions based on peak fitting
Atomic %
Chemical state Peak
Binding Energy (eV)
Coating 10 Coating 11 Coating 12
Si2p Total 101.87 10.75 10.90 18.20
N1s Total 400.08 3.60 2.05 0.89
C1s C-C/C-H 284.45 45.63 35.04 38.13
C1s C-C-O/C-C-N 286.19 12.75 6.99 2.81
C1s C=O 288.89 4.86 3.02 0.66
O1s C=O 533.27 3.68 3.43 0.97
O1s C-O-C 531.48 8.01 3.49 1.26
O1s Si-O-Si 532.05 10.72 10.69 17.94
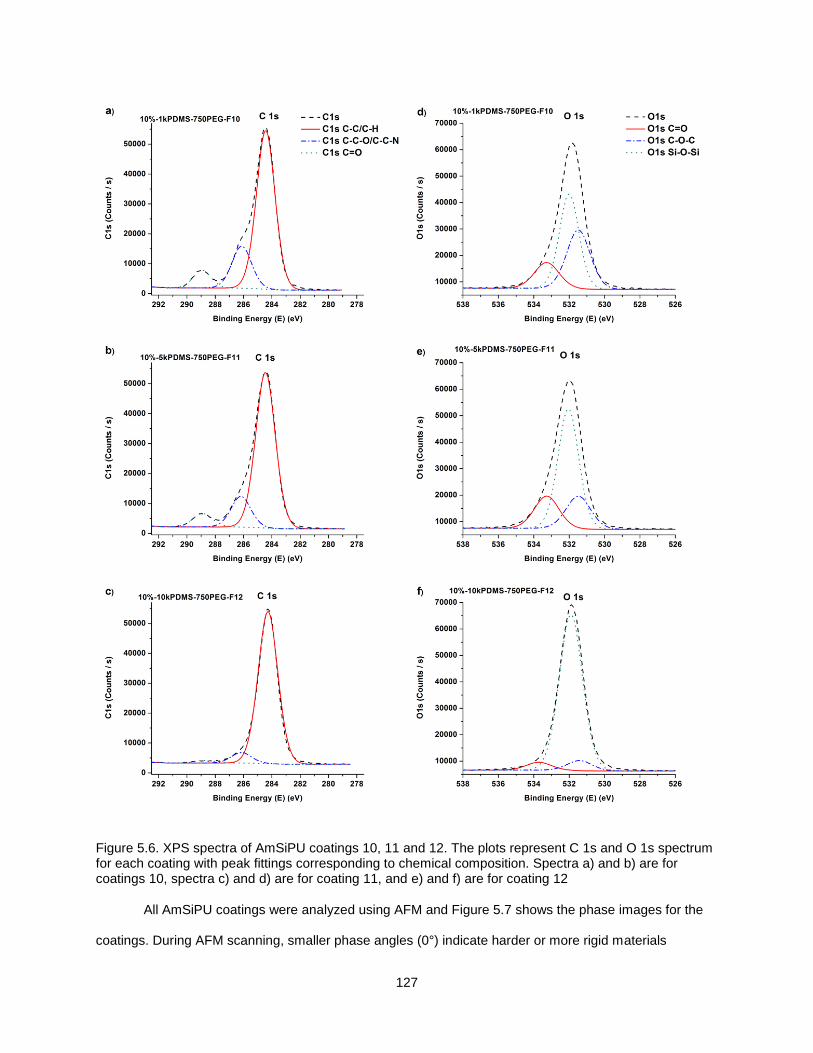
127
Figure 5.6. XPS spectra of AmSiPU coatings 10, 11 and 12. The plots represent C 1s and O 1s spectrum for each coating with peak fittings corresponding to chemical composition. Spectra a) and b) are for coatings 10, spectra c) and d) are for coating 11, and e) and f) are for coating 12
All AmSiPU coatings were analyzed using AFM and Figure 5.7 shows the phase images for the
coatings. During AFM scanning, smaller phase angles (0°) indicate harder or more rigid materials
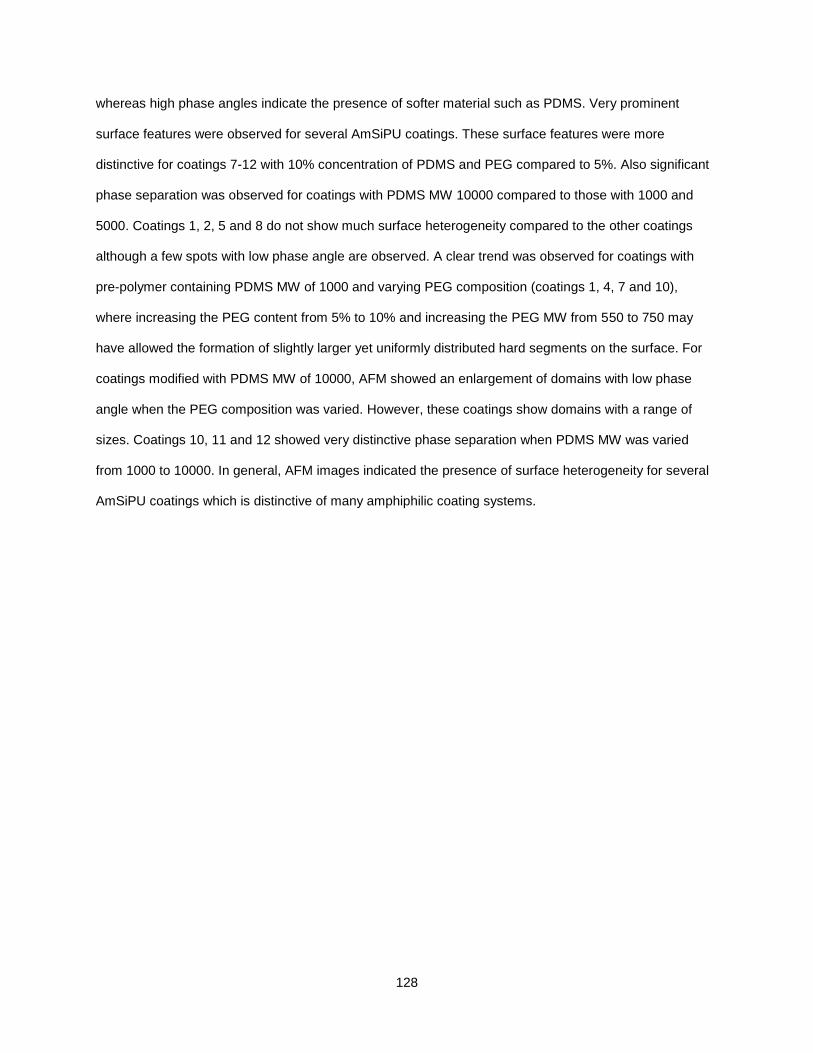
128
whereas high phase angles indicate the presence of softer material such as PDMS. Very prominent
surface features were observed for several AmSiPU coatings. These surface features were more
distinctive for coatings 7-12 with 10% concentration of PDMS and PEG compared to 5%. Also significant
phase separation was observed for coatings with PDMS MW 10000 compared to those with 1000 and
5000. Coatings 1, 2, 5 and 8 do not show much surface heterogeneity compared to the other coatings
although a few spots with low phase angle are observed. A clear trend was observed for coatings with
pre-polymer containing PDMS MW of 1000 and varying PEG composition (coatings 1, 4, 7 and 10),
where increasing the PEG content from 5% to 10% and increasing the PEG MW from 550 to 750 may
have allowed the formation of slightly larger yet uniformly distributed hard segments on the surface. For
coatings modified with PDMS MW of 10000, AFM showed an enlargement of domains with low phase
angle when the PEG composition was varied. However, these coatings show domains with a range of
sizes. Coatings 10, 11 and 12 showed very distinctive phase separation when PDMS MW was varied
from 1000 to 10000. In general, AFM images indicated the presence of surface heterogeneity for several
AmSiPU coatings which is distinctive of many amphiphilic coating systems.
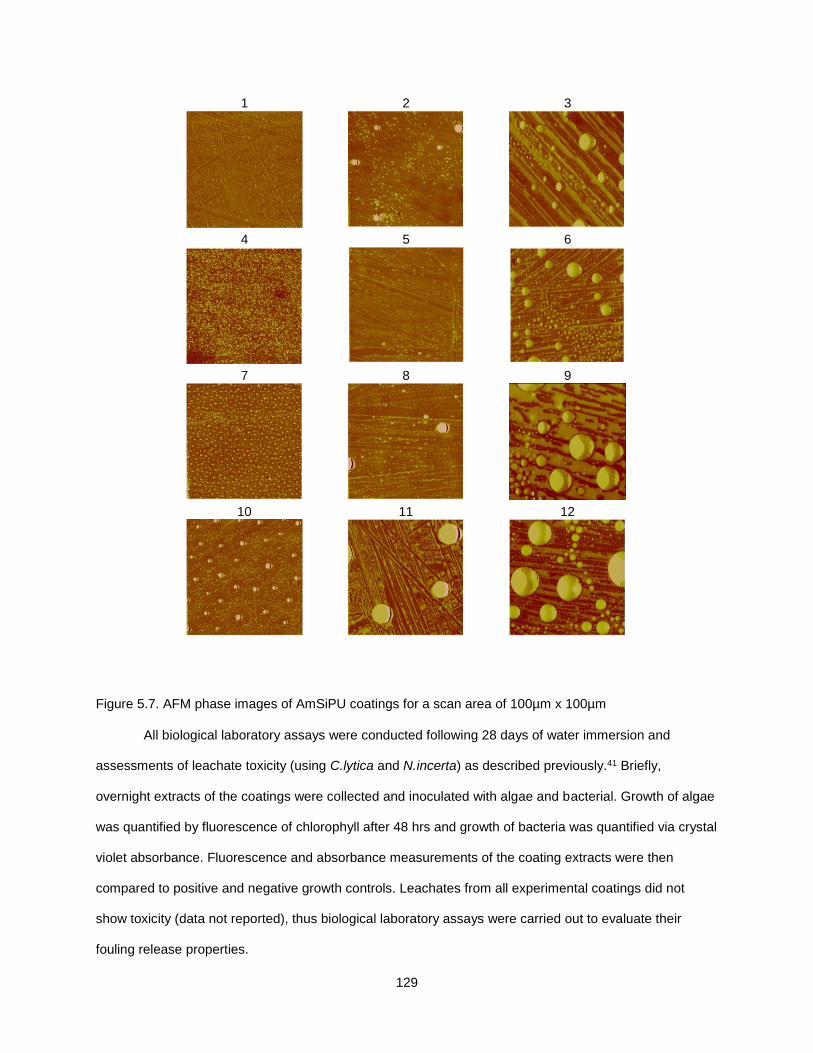
129
Figure 5.7. AFM phase images of AmSiPU coatings for a scan area of 100µm x 100µm
All biological laboratory assays were conducted following 28 days of water immersion and
assessments of leachate toxicity (using C.lytica and N.incerta) as described previously.41 Briefly,
overnight extracts of the coatings were collected and inoculated with algae and bacterial. Growth of algae
was quantified by fluorescence of chlorophyll after 48 hrs and growth of bacteria was quantified via crystal
violet absorbance. Fluorescence and absorbance measurements of the coating extracts were then
compared to positive and negative growth controls. Leachates from all experimental coatings did not
show toxicity (data not reported), thus biological laboratory assays were carried out to evaluate their
fouling release properties.
1
2
3
4
5
6
7
8
9
10
11
12
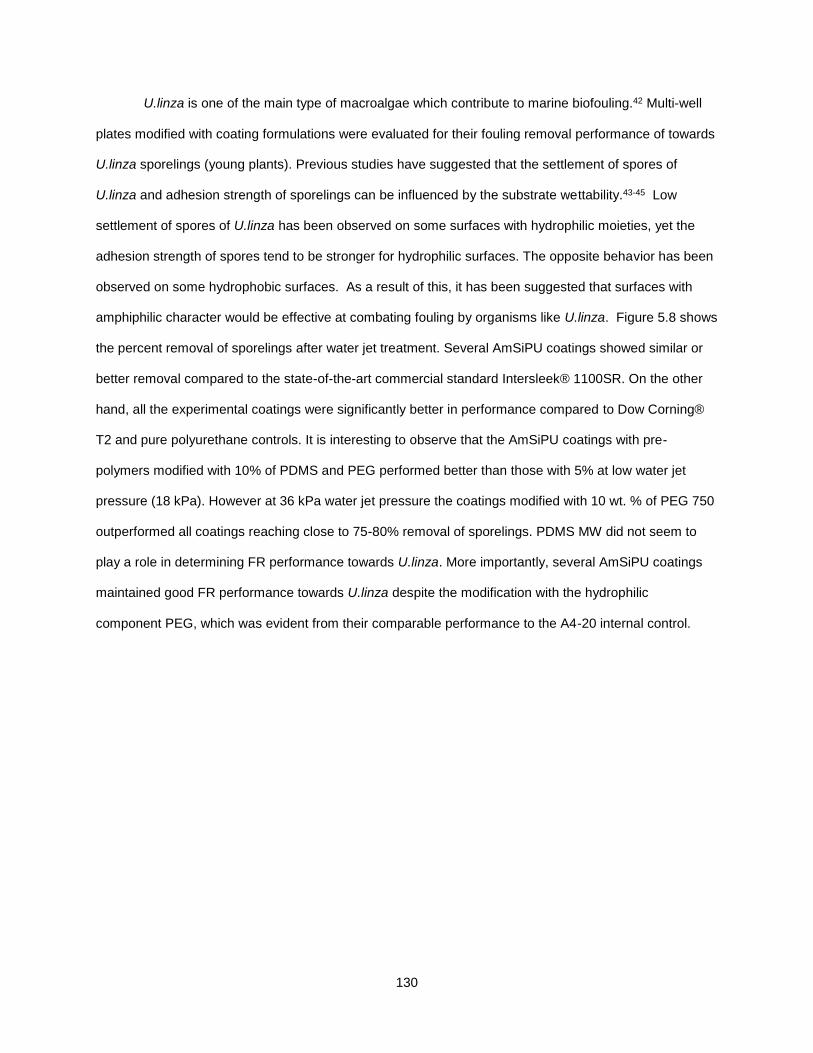
130
U.linza is one of the main type of macroalgae which contribute to marine biofouling.42 Multi-well
plates modified with coating formulations were evaluated for their fouling removal performance of towards
U.linza sporelings (young plants). Previous studies have suggested that the settlement of spores of
U.linza and adhesion strength of sporelings can be influenced by the substrate wettability.43-45 Low
settlement of spores of U.linza has been observed on some surfaces with hydrophilic moieties, yet the
adhesion strength of spores tend to be stronger for hydrophilic surfaces. The opposite behavior has been
observed on some hydrophobic surfaces. As a result of this, it has been suggested that surfaces with
amphiphilic character would be effective at combating fouling by organisms like U.linza. Figure 5.8 shows
the percent removal of sporelings after water jet treatment. Several AmSiPU coatings showed similar or
better removal compared to the state-of-the-art commercial standard Intersleek® 1100SR. On the other
hand, all the experimental coatings were significantly better in performance compared to Dow Corning®
T2 and pure polyurethane controls. It is interesting to observe that the AmSiPU coatings with pre-
polymers modified with 10% of PDMS and PEG performed better than those with 5% at low water jet
pressure (18 kPa). However at 36 kPa water jet pressure the coatings modified with 10 wt. % of PEG 750
outperformed all coatings reaching close to 75-80% removal of sporelings. PDMS MW did not seem to
play a role in determining FR performance towards U.linza. More importantly, several AmSiPU coatings
maintained good FR performance towards U.linza despite the modification with the hydrophilic
component PEG, which was evident from their comparable performance to the A4-20 internal control.
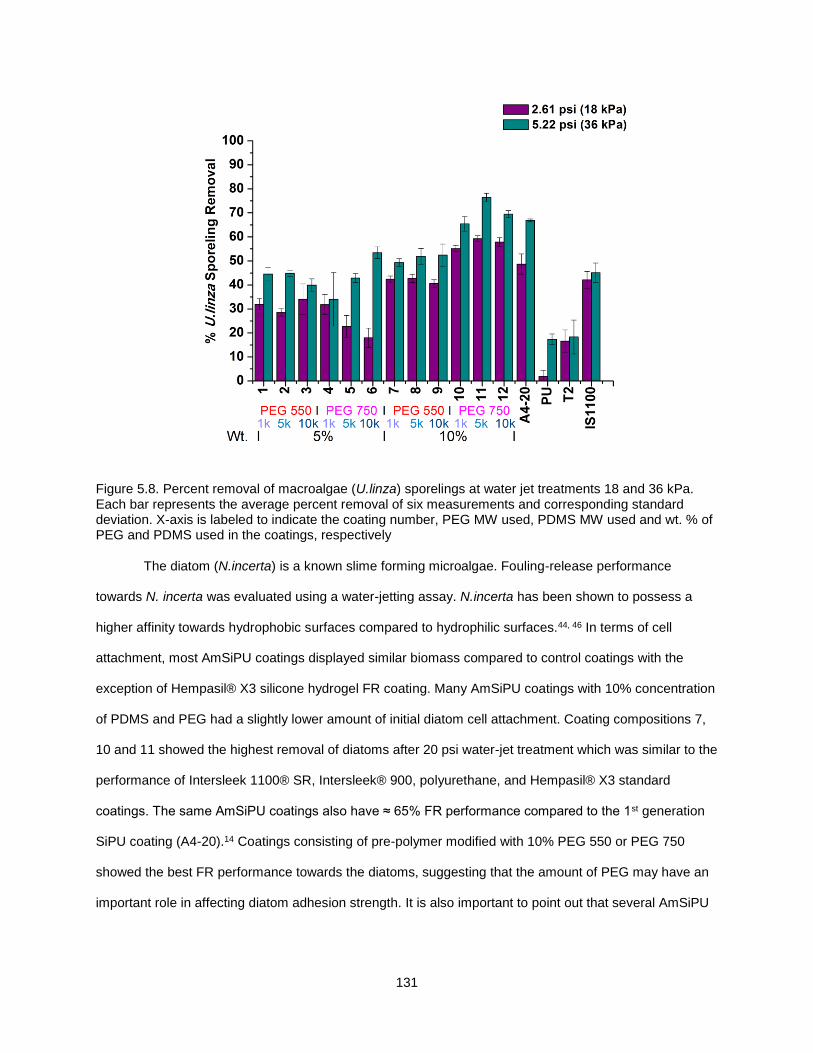
131
Figure 5.8. Percent removal of macroalgae (U.linza) sporelings at water jet treatments 18 and 36 kPa. Each bar represents the average percent removal of six measurements and corresponding standard deviation. X-axis is labeled to indicate the coating number, PEG MW used, PDMS MW used and wt. % of PEG and PDMS used in the coatings, respectively
The diatom (N.incerta) is a known slime forming microalgae. Fouling-release performance
towards N. incerta was evaluated using a water-jetting assay. N.incerta has been shown to possess a
higher affinity towards hydrophobic surfaces compared to hydrophilic surfaces.44, 46 In terms of cell
attachment, most AmSiPU coatings displayed similar biomass compared to control coatings with the
exception of Hempasil® X3 silicone hydrogel FR coating. Many AmSiPU coatings with 10% concentration
of PDMS and PEG had a slightly lower amount of initial diatom cell attachment. Coating compositions 7,
10 and 11 showed the highest removal of diatoms after 20 psi water-jet treatment which was similar to the
performance of Intersleek 1100® SR, Intersleek® 900, polyurethane, and Hempasil® X3 standard
coatings. The same AmSiPU coatings also have ≈ 65% FR performance compared to the 1st generation
SiPU coating (A4-20).14 Coatings consisting of pre-polymer modified with 10% PEG 550 or PEG 750
showed the best FR performance towards the diatoms, suggesting that the amount of PEG may have an
important role in affecting diatom adhesion strength. It is also important to point out that several AmSiPU
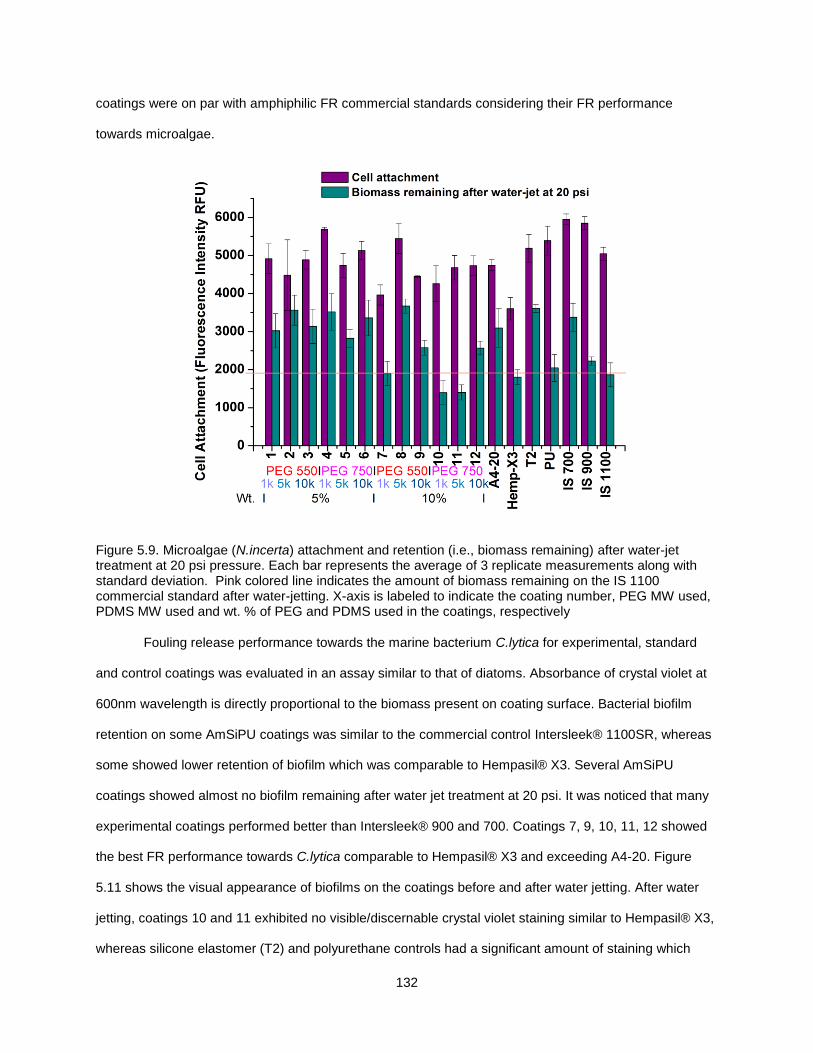
132
coatings were on par with amphiphilic FR commercial standards considering their FR performance
towards microalgae.
Figure 5.9. Microalgae (N.incerta) attachment and retention (i.e., biomass remaining) after water-jet treatment at 20 psi pressure. Each bar represents the average of 3 replicate measurements along with standard deviation. Pink colored line indicates the amount of biomass remaining on the IS 1100 commercial standard after water-jetting. X-axis is labeled to indicate the coating number, PEG MW used, PDMS MW used and wt. % of PEG and PDMS used in the coatings, respectively
Fouling release performance towards the marine bacterium C.lytica for experimental, standard
and control coatings was evaluated in an assay similar to that of diatoms. Absorbance of crystal violet at
600nm wavelength is directly proportional to the biomass present on coating surface. Bacterial biofilm
retention on some AmSiPU coatings was similar to the commercial control Intersleek® 1100SR, whereas
some showed lower retention of biofilm which was comparable to Hempasil® X3. Several AmSiPU
coatings showed almost no biofilm remaining after water jet treatment at 20 psi. It was noticed that many
experimental coatings performed better than Intersleek® 900 and 700. Coatings 7, 9, 10, 11, 12 showed
the best FR performance towards C.lytica comparable to Hempasil® X3 and exceeding A4-20. Figure
5.11 shows the visual appearance of biofilms on the coatings before and after water jetting. After water
jetting, coatings 10 and 11 exhibited no visible/discernable crystal violet staining similar to Hempasil® X3,
whereas silicone elastomer (T2) and polyurethane controls had a significant amount of staining which
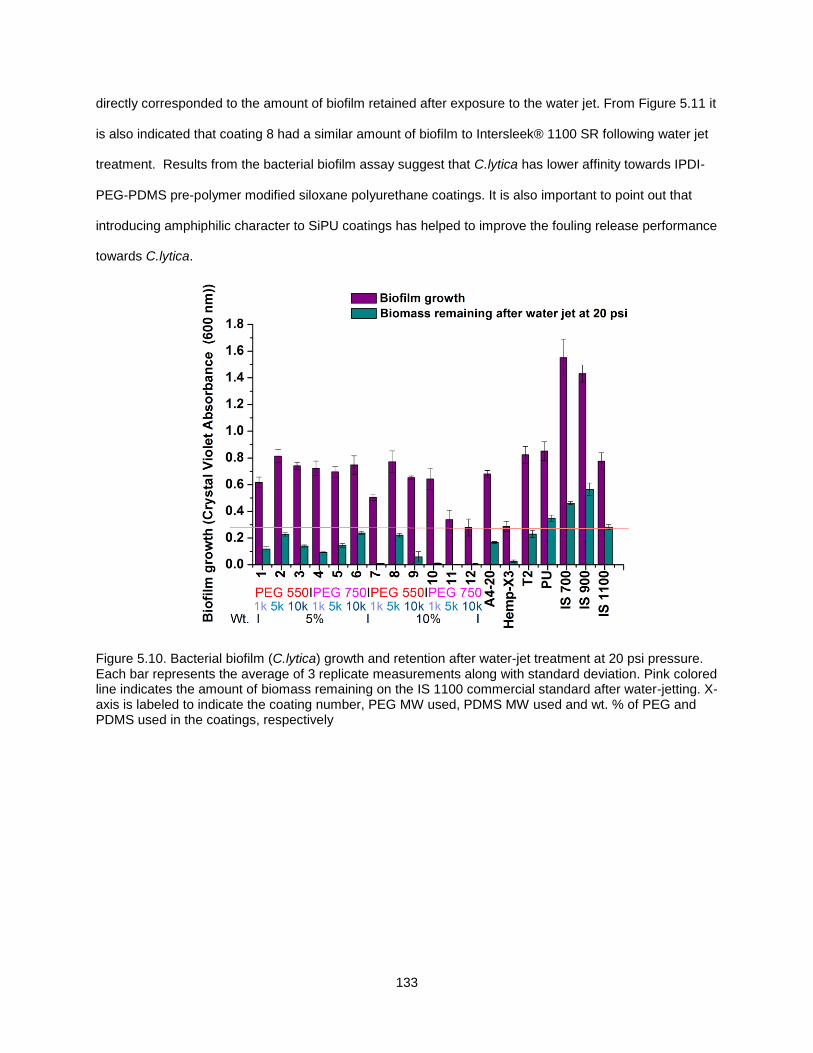
133
directly corresponded to the amount of biofilm retained after exposure to the water jet. From Figure 5.11 it
is also indicated that coating 8 had a similar amount of biofilm to Intersleek® 1100 SR following water jet
treatment. Results from the bacterial biofilm assay suggest that C.lytica has lower affinity towards IPDI-
PEG-PDMS pre-polymer modified siloxane polyurethane coatings. It is also important to point out that
introducing amphiphilic character to SiPU coatings has helped to improve the fouling release performance
towards C.lytica.
Figure 5.10. Bacterial biofilm (C.lytica) growth and retention after water-jet treatment at 20 psi pressure. Each bar represents the average of 3 replicate measurements along with standard deviation. Pink colored line indicates the amount of biomass remaining on the IS 1100 commercial standard after water-jetting. X-axis is labeled to indicate the coating number, PEG MW used, PDMS MW used and wt. % of PEG and PDMS used in the coatings, respectively
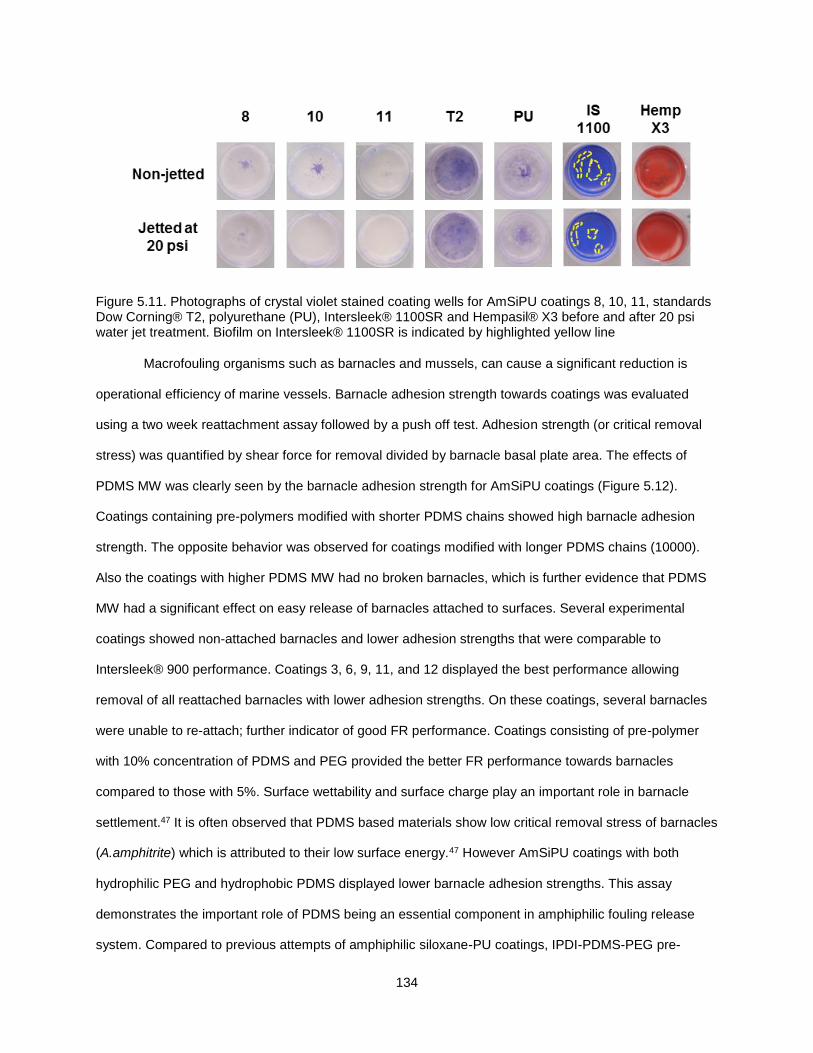
134
Figure 5.11. Photographs of crystal violet stained coating wells for AmSiPU coatings 8, 10, 11, standards Dow Corning® T2, polyurethane (PU), Intersleek® 1100SR and Hempasil® X3 before and after 20 psi water jet treatment. Biofilm on Intersleek® 1100SR is indicated by highlighted yellow line
Macrofouling organisms such as barnacles and mussels, can cause a significant reduction is
operational efficiency of marine vessels. Barnacle adhesion strength towards coatings was evaluated
using a two week reattachment assay followed by a push off test. Adhesion strength (or critical removal
stress) was quantified by shear force for removal divided by barnacle basal plate area. The effects of
PDMS MW was clearly seen by the barnacle adhesion strength for AmSiPU coatings (Figure 5.12).
Coatings containing pre-polymers modified with shorter PDMS chains showed high barnacle adhesion
strength. The opposite behavior was observed for coatings modified with longer PDMS chains (10000).
Also the coatings with higher PDMS MW had no broken barnacles, which is further evidence that PDMS
MW had a significant effect on easy release of barnacles attached to surfaces. Several experimental
coatings showed non-attached barnacles and lower adhesion strengths that were comparable to
Intersleek® 900 performance. Coatings 3, 6, 9, 11, and 12 displayed the best performance allowing
removal of all reattached barnacles with lower adhesion strengths. On these coatings, several barnacles
were unable to re-attach; further indicator of good FR performance. Coatings consisting of pre-polymer
with 10% concentration of PDMS and PEG provided the better FR performance towards barnacles
compared to those with 5%. Surface wettability and surface charge play an important role in barnacle
settlement.47 It is often observed that PDMS based materials show low critical removal stress of barnacles
(A.amphitrite) which is attributed to their low surface energy.47 However AmSiPU coatings with both
hydrophilic PEG and hydrophobic PDMS displayed lower barnacle adhesion strengths. This assay
demonstrates the important role of PDMS being an essential component in amphiphilic fouling release
system. Compared to previous attempts of amphiphilic siloxane-PU coatings, IPDI-PDMS-PEG pre-
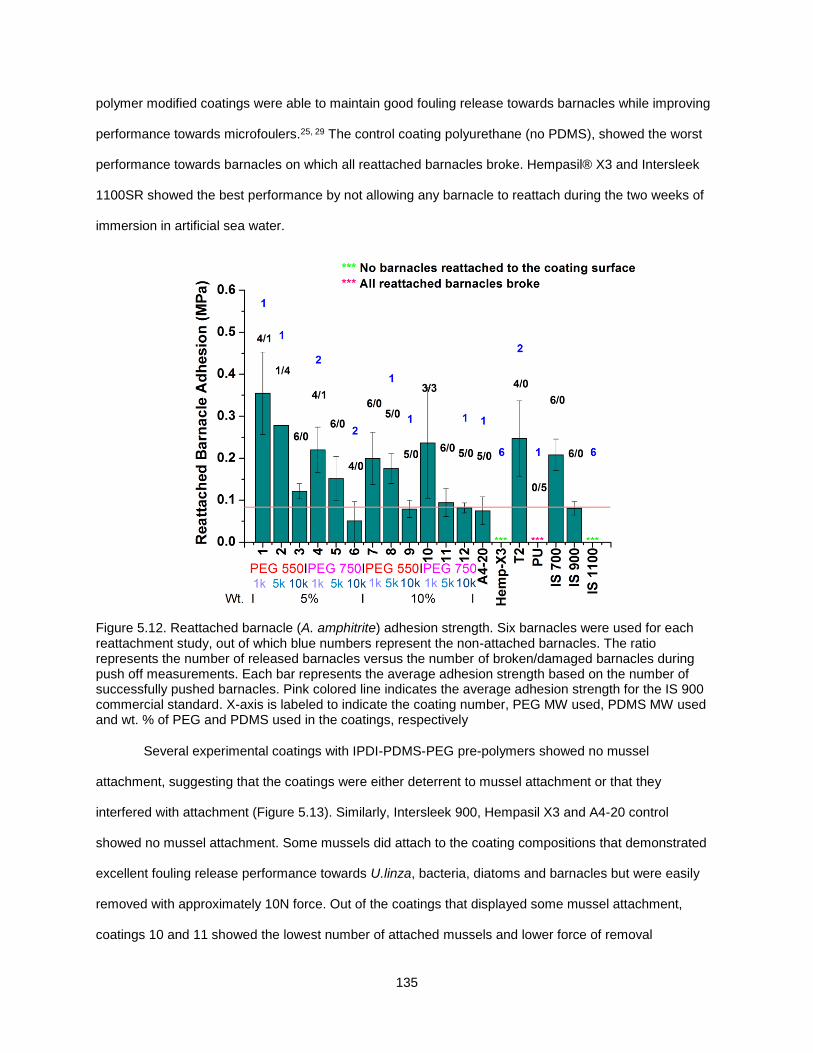
135
polymer modified coatings were able to maintain good fouling release towards barnacles while improving
performance towards microfoulers.25, 29 The control coating polyurethane (no PDMS), showed the worst
performance towards barnacles on which all reattached barnacles broke. Hempasil® X3 and Intersleek
1100SR showed the best performance by not allowing any barnacle to reattach during the two weeks of
immersion in artificial sea water.
Figure 5.12. Reattached barnacle (A. amphitrite) adhesion strength. Six barnacles were used for each reattachment study, out of which blue numbers represent the non-attached barnacles. The ratio represents the number of released barnacles versus the number of broken/damaged barnacles during push off measurements. Each bar represents the average adhesion strength based on the number of successfully pushed barnacles. Pink colored line indicates the average adhesion strength for the IS 900 commercial standard. X-axis is labeled to indicate the coating number, PEG MW used, PDMS MW used and wt. % of PEG and PDMS used in the coatings, respectively
Several experimental coatings with IPDI-PDMS-PEG pre-polymers showed no mussel
attachment, suggesting that the coatings were either deterrent to mussel attachment or that they
interfered with attachment (Figure 5.13). Similarly, Intersleek 900, Hempasil X3 and A4-20 control
showed no mussel attachment. Some mussels did attach to the coating compositions that demonstrated
excellent fouling release performance towards U.linza, bacteria, diatoms and barnacles but were easily
removed with approximately 10N force. Out of the coatings that displayed some mussel attachment,
coatings 10 and 11 showed the lowest number of attached mussels and lower force of removal
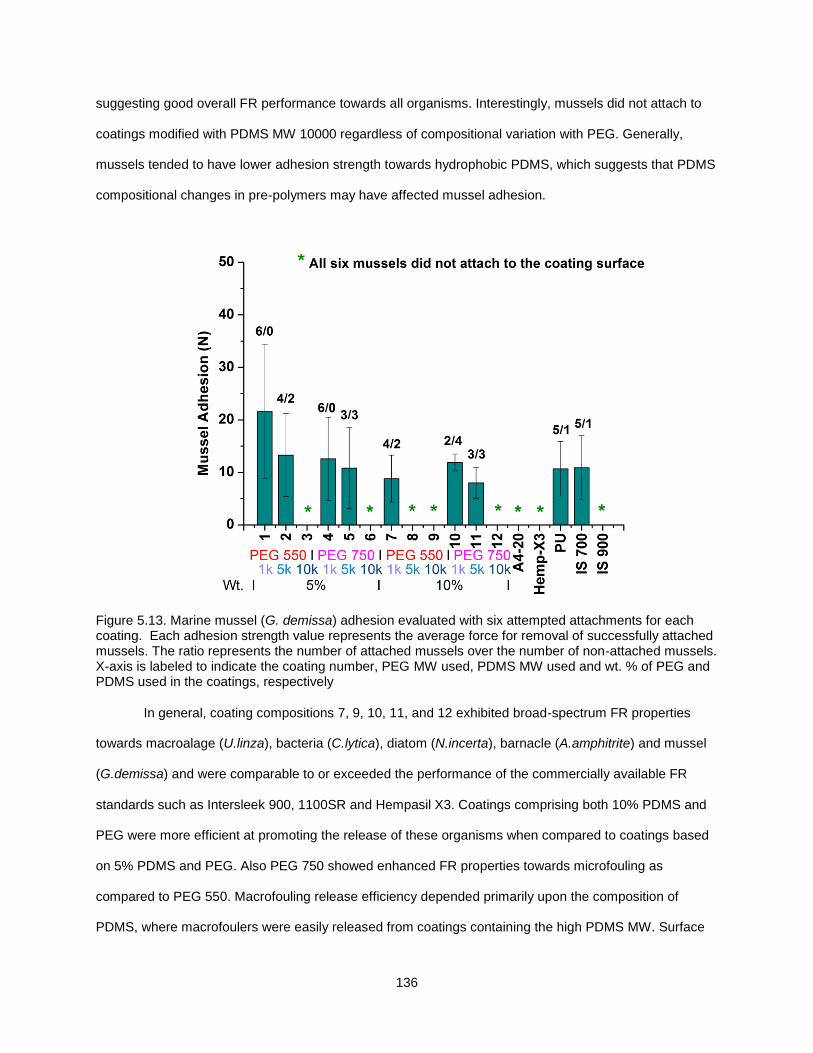
136
suggesting good overall FR performance towards all organisms. Interestingly, mussels did not attach to
coatings modified with PDMS MW 10000 regardless of compositional variation with PEG. Generally,
mussels tended to have lower adhesion strength towards hydrophobic PDMS, which suggests that PDMS
compositional changes in pre-polymers may have affected mussel adhesion.
Figure 5.13. Marine mussel (G. demissa) adhesion evaluated with six attempted attachments for each coating. Each adhesion strength value represents the average force for removal of successfully attached mussels. The ratio represents the number of attached mussels over the number of non-attached mussels. X-axis is labeled to indicate the coating number, PEG MW used, PDMS MW used and wt. % of PEG and PDMS used in the coatings, respectively
In general, coating compositions 7, 9, 10, 11, and 12 exhibited broad-spectrum FR properties
towards macroalage (U.linza), bacteria (C.lytica), diatom (N.incerta), barnacle (A.amphitrite) and mussel
(G.demissa) and were comparable to or exceeded the performance of the commercially available FR
standards such as Intersleek 900, 1100SR and Hempasil X3. Coatings comprising both 10% PDMS and
PEG were more efficient at promoting the release of these organisms when compared to coatings based
on 5% PDMS and PEG. Also PEG 750 showed enhanced FR properties towards microfouling as
compared to PEG 550. Macrofouling release efficiency depended primarily upon the composition of
PDMS, where macrofoulers were easily released from coatings containing the high PDMS MW. Surface
137
characterization techniques demonstrated that both hydrophobic and hydrophilic moieties were present
on the surfaces of the AmSiPU coatings. However, the surface morphology was clearly affected by the
pre-polymer chemical compositional variations. Differences in surface morphology might also explain the
improvement in fouling release performance of certain coatings compared to others. As SiPU coatings
rely on self-stratification for fouling release properties, there are more variables that need to be
considered for fine tuning surface properties of these AmSiPU which need to be addressed in future.
Conclusions
Several pre-polymers with compositional variation in PDMS and PEG were synthesized and
incorporated into a siloxane polyurethane (SiPU) coating system. Coatings derived from these novel pre-
polymers demonstrated amphiphilic surface properties. Surface wettability of the coatings remained
mostly unchanged before and after water aging. Self-stratification of PDMS and PEG moieties was
evident from ATR-FTIR, XPS and AFM characterization. ATR-FTIR suggests that both PDMS and PEG
are present on the surface after water aging. Surface morphology of AmSiPU coatings were clearly
affected by the variations in PDMS and PEG components used for pre-polymer synthesis. XPS spectra
indicated that increasing PDMS MW in pre-polymers resulted in higher self-segregation of siloxane
increasing the concentration of hydrophobic moieties. AFM images of AmSiPU coatings showed the
presence of microdomains with soft and hard segments indicative of phase separation on the surface.
Several coatings showed excellent FR performance towards bacteria (C.lytica), in terms of water jet
removal of attached sporelings. In most cases, >90% of bacterial biofilms were cleaned off after a 20 psi
water jet treatment. Fouling release performance of AmSiPU coatings also showed significant
improvement in microalgae (N.incerta) compared to internal control A4-20 (1st generation SiPU).
Interestingly, many of the AmSiPU coatings demonstrated comparable or superior fouling release
properties towards bacteria and microalgae in comparison to the state-of-the-art commercial fouling
release coatings. Biological assays for macroalgae (U.linza), suggest that AmSiPU coatings have similar
fouling release performance compared to Intersleek 1100SR despite the inclusion of hydrophilic PEG.
The adhesion strength of barnacles was very low and some non-attached barnacles were observed for
several AmSiPU coatings. Generally most AmSiPU coatings displayed similar fouling release properties
to Intersleek® 900 in relation to barnacle attachment. Marine mussel (G.demissa) adhesion was observed
138
for coatings which performed well in microfouling release. However, the mussels were easily removed
with a low force. In general, coatings comprised of pre-polymer with 10% of PDMS and PEG perform
better than the ones derived from 5% PDMS and PEG. Also coatings made using PEG MW of 750
showed better FR properties in many assays when compared to the ones with PEG 550; which implies
that longer PEG chain may be more effective in FR. A number of coatings provided broad-spectrum FR
properties for a variety of representative marine organisms with diverse adhesion profiles, suggesting
amphiphilic coatings are very effective in combating biofouling. Overall AmSiPU coatings showed
superior or comparable FR properties to the leading commercial standards such as Intersleek® 900,
Intersleek® 1100SR and Hempasil® X3 but with the additional desirable features of being tougher and
more durable.
References
1. Yebra, D. M.; Kiil, S. K.; Dam-Johansen, K., Antifouling Technology—Past, Present and Future Steps Towards Efficient and Environmentally Friendly Antifouling Coatings. Progress in Organic Coatings 2004, 50 (2), 75-104.
2. Hellio, C.; Yebra, D. M., Advances in Marine Antifouling Coatings and Technologies. Woodhead Publishing Limited: Cambridge, UK, 2009.
3. Lejars, M.; Margaillan, A.; Bressy, C., Fouling Release Coatings: A Nontoxic Alternative to Biocidal Antifouling Coatings. Chemical Reviews 2012, 112 (8), 4347-4390.
4. Nurioglu, A. G.; Esteves, A. C. C.; de With, G., Non-toxic, Non-Biocide-release Antifouling Coatings Based on Molecular Structure Design for Marine Applications. Journal of Materials Chemistry B 2015, 3 (32), 6547-6570.
5. Callow, J. A.; Callow, M. E., Trends in the Development of Environmentally Friendly Fouling-resistant Marine Coatings. Nat Commun 2011, 2, 244.
6. Magin, C. M.; Cooper, S. P.; Brennan, A. B., Non-toxic Antifouling Strategies. Materials Today 2010, 13 (4), 36-44.
7. Schultz, M. P.; Bendick, J. A.; Holm, E. R.; Hertel, W. M., Economic Impact of Biofouling on A Naval Surface Ship. Biofouling 2011, 27 (1), 87-98.
8. Callow, M. E.; Callow, J. A., Marine Biofouling: A Sticky Problem. Biologist 2002, 49 (1), 10.
9. Konstantinou, I. K.; Albanis, T. A., Worldwide Occurrence and Effects of Antifouling Paint Booster Biocides in the Aquatic Environment: A Review. Environment International 2004, 30 (2), 235-248.
10. Partha, M.; Abdullah, E.; Dean, C. W., Thermoset Siloxane-Urethane Fouling Release Coatings. In Smart Coatings, American Chemical Society: 2007; Vol. 957, pp 61-75.
11. Webster, D. C.; Ekin, A. Functionalized Polysiloxane Polymers. US 7,799,434 B2, 2010.
139
12. Webster, D. C.; Pieper, R. J.; Ekin, A. Thermoset Siloxane-Urethane Fouling Release Coatings. US 7,989,074 B2, 2011.
13. Ekin, A.; Webster, D. C., Combinatorial and High-Throughput Screening of the Effect of Siloxane Composition on the Surface Properties of Crosslinked Siloxane−Polyurethane Coatings. Journal of Combinatorial Chemistry 2006, 9 (1), 178-188.
14. Bodkhe, R. B.; Thompson, S. E. M.; Yehle, C.; Cilz, N.; Daniels, J.; Stafslien, S. J.; Callow, M. E.; Callow, J. A.; Webster, D. C., The Effect of Formulation Variables on Fouling-release Performance of Stratified Siloxane-Polyurethane Coatings. Journal of Coatings Technology Research 2012, 9 (3), 235-249.
15. Sommer, S.; Ekin, A.; Webster, D. C.; Stafslien, S. J.; Daniels, J.; VanderWal, L. J.; Thompson, S. E. M.; Callow, M. E.; Callow, J. A., A Preliminary Study on the Properties and Fouling-release Performance of Siloxane-Polyurethane Coatings Prepared from PDMS Macromers. Biofouling 2010, 26 (8), 961-972.
16. Iguerb, O.; Poleunis, C.; Mazéas, F.; Compère, C.; Bertrand, P., Antifouling Properties of Poly(methyl methacrylate) Films Grafted with Poly(ethylene glycol) Monoacrylate Immersed in Seawater†. Langmuir 2008, 24 (21), 12272-12281.
17. Wyszogrodzka, M.; Haag, R., Synthesis and Characterization of Glycerol Dendrons, Self-Assembled Monolayers on Gold: A Detailed Study of Their Protein Resistance. Biomacromolecules 2009, 10 (5), 1043-1054.
18. Andrade, J. D.; King, R. N.; Gregonis, D. E.; Coleman, D. L., Surface Characterization of Poly(hydroxyethyl methacrylate) and Related Polymers. I. Contact Angle Methods in Water. Journal of Polymer Science: Polymer Symposia 1979, 66 (1), 313-336.
19. Heuberger, M.; Drobek, T.; Spencer, N. D., Interaction Forces and Morphology of a Protein-Resistant Poly(ethylene glycol) Layer. Biophysical Journal 2005, 88 (1), 495-504.
20. Jeon, S. I.; Lee, J. H.; Andrade, J. D.; De Gennes, P. G., Protein—Surface Interactions in the Presence of Polyethylene Oxide. Journal of Colloid and Interface Science 1991, 142 (1), 149-158.
21. Szleifer, I., Polymers and Proteins: Interactions at Interfaces. Current Opinion in Solid State and Materials Science 1997, 2 (3), 337-344.
22. Prime, K. L.; Whitesides, G. M., Adsorption of Proteins onto Surfaces Containing End-attached Oligo(ethylene oxide): A Model System Using Self-assembled Monolayers. Journal of the American Chemical Society 1993, 115 (23), 10714-10721.
23. Sundaram, H. S.; Cho, Y.; Dimitriou, M. D.; Weinman, C. J.; Finlay, J. A.; Cone, G.; Callow, M. E.; Callow, J. A.; Kramer, E. J.; Ober, C. K., Fluorine-free Mixed Amphiphilic Polymers Based on PDMS and PEG Side Chains for Fouling Release Applications. Biofouling 2011, 27 (6), 589-602.
24. Sundaram, H. S.; Cho, Y.; Dimitriou, M. D.; Finlay, J. A.; Cone, G.; Williams, S.; Handlin, D.; Gatto, J.; Callow, M. E.; Callow, J. A.; Kramer, E. J.; Ober, C. K., Fluorinated Amphiphilic Polymers and Their Blends for Fouling-Release Applications: The Benefits of a Triblock Copolymer Surface. ACS Applied Materials & Interfaces 2011, 3 (9), 3366-3374.
25. Bodkhe, R. B.; Stafslien, S. J.; Cilz, N.; Daniels, J.; Thompson, S. E. M.; Callow, M. E.; Callow, J. A.; Webster, D. C., Polyurethanes with Amphiphilic Surfaces Made Using Telechelic Functional PDMS Having Orthogonal Acid Functional Groups. Progress in Organic Coatings 2012, 75 (1–2), 38-48.
140
26. Martinelli, E.; Sarvothaman, M. K.; Galli, G.; Pettitt, M. E.; Callow, M. E.; Callow, J. A.; Conlan, S. L.; Clare, A. S.; Sugiharto, A. B.; Davies, C.; Williams, D., Poly(dimethyl siloxane) (PDMS) Network Blends of Amphiphilic Acrylic Copolymers with Poly(ethylene glycol)-fluoroalkyl Side Chains for Fouling-release Coatings. II. Laboratory assays and field immersion trials. Biofouling 2012, 28 (6), 571-582.
27. Imbesi, P. M.; Finlay, J. A.; Aldred, N.; Eller, M. J.; Felder, S. E.; Pollack, K. A.; Lonnecker, A. T.; Raymond, J. E.; Mackay, M. E.; Schweikert, E. A.; Clare, A. S.; Callow, J. A.; Callow, M. E.; Wooley, K. L., Targeted Surface Nanocomplexity: Two-dimensional Control Over the Composition, Physical Properties and Anti-biofouling Performance of Hyperbranched Fluoropolymer-poly(ethylene glycol) Amphiphilic Crosslinked Networks. Polymer Chemistry 2012, 3 (11), 3121-3131.
28. Stafslien, S. J.; Christianson, D.; Daniels, J.; VanderWal, L.; Chernykh, A.; Chisholm, B. J., Combinatorial Materials Research Applied to the Development of New Surface Coatings XVI: Fouling-release Properties of Amphiphilic Polysiloxane Coatings. Biofouling 2015, 31 (2), 135-149.
29. Webster, D. C.; Bodkhe, R. B. Functionalized Silicones with Polyalkylene Oxide Side Chains. US 9,169,359 B2, 2015.
30. Casse, F.; Ribeiro, E.; Ekin, A.; Webster, D. C.; Callow, J. A.; Callow, M. E., Laboratory Screening of Coating Libraries for Algal Adhesion. Biofouling 2007, 23 (3/4), 267-276.
31. Cassé, F.; Stafslien, S. J.; Bahr, J. A.; Daniels, J.; Finlay, J. A.; Callow, J. A.; Callow, M. E., Combinatorial Materials Research Applied to the Development of New Surface Coatings V. Application of a Spinning Water-jet for the Semi-high Throughput Assessment of the Attachment Strength of Marine Fouling Algae. Biofouling 2007, 23 (2), 121-130.
32. Callow, M. E.; Callow, J. A.; Conlan, S.; Clare, A. S.; Stafslien, S., Efficacy Testing of Nonbiocidal and Fouling-release Coatings. In Biofouling Methods, John Wiley & Sons, Ltd: 2014; pp 291-316.
33. Stafslien, S. J.; Bahr, J. A.; Daniels, J. W.; Wal, L. V.; Nevins, J.; Smith, J.; Schiele, K.; Chisholm, B., Combinatorial Materials Research Applied to the Development of New Surface Coatings VI: An Automated Spinning Water Jet Apparatus for the High-Throughput Characterization of Fouling-release Marine Coatings. Review of Scientific Instruments 2007, 78 (7), 072204.
34. Rittschof, D.; Orihuela, B.; Stafslien, S.; Daniels, J.; Christianson, D.; Chisholm, B.; Holm, E., Barnacle Reattachment: A Tool for Studying Barnacle Adhesion. Biofouling 2008, 24 (1), 1-9.
35. Stafslien, S.; Daniels, J.; Bahr, J.; Chisholm, B.; Ekin, A.; Webster, D.; Orihuela, B.; Rittschof, D., An Improved Laboratory Reattachment Method for the Rapid Assessment of Adult Barnacle Adhesion Strength to Fouling-release Marine Coatings. Journal of Coatings Technology and Research 2012, 9 (6), 651-665.
36. Owens, D. K.; Wendt, R. C., Estimation of the Surface Free Energy of Polymers. Journal of Applied Polymer Science 1969, 13 (8), 1741-1747.
37. Baier, R. E., Surface Behaviour of Biomaterials: The Theta Surface for Biocompatibility. Journal of Materials Science : Materials in Medicine 2006, 17 (11), 1057-62.
38. Louette, P.; Bodino, F.; Pireaux, J.-J., Poly(dimethyl siloxane) (PDMS) XPS Reference Core Level and Energy Loss Spectra. Surface Science Spectra 2005, 12 (1), 38.
141
39. Mishra, A. K.; Chattopadhyay, D. K.; Sreedhar, B.; Raju, K. V. S. N., FT-IR and XPS Studies of Polyurethane-urea-imide Coatings. Progress in Organic Coatings 2006, 55 (3), 231-243.
40. Hearn, M. J.; Ratner, B. D.; Briggs, D., SIMS and XPS Studies of Polyurethane Surfaces. 1. Preliminary Studies. Macromolecules 1988, 21 (10), 2950-2959.
41. Majumdar, P.; Lee, E.; Patel, N.; Ward, K.; Stafslien, S. J.; Daniels, J.; Chisholm, B. J.; Boudjouk, P.; Callow, M. E.; Callow, J. A.; Thompson, S. E. M., Combinatorial Materials Research Applied to the Development of New Surface Coatings IX: An Investigation of Novel Antifouling/Fouling-release Coatings Containing Quaternary Ammonium Salt Groups. Biofouling 2008, 24 (3), 185-200.
42. Hoipkemeier-Wilson, L.; Schumacher, J. F.; Carman, M. L.; Gibson, A. L.; Feinberg, A. W.; Callow, M. E.; Finlay, J. A.; Callow, J. A.; Brennan, A. B., Antifouling Potential of Lubricious, Micro-engineered, PDMS Elastomers Against Zoospores of the Green Fouling Alga Ulva (Enteromorpha). Biofouling 2004, 20 (1), 53-63.
43. M.E Callow, J. A. C., L.K Ista, S.E Coleman, A.C Nolasco, G.P Lopez, Use of Self Assembled Monolayers of Different Wettabilities to Study Surface Selection and Primary Adhesion Processes of Green Algae (Enteromorpha) Zoospores. Applied and Enviornmental Microbiology 2000, 66 (8), 3249-3254.
44. Finlay, J. A.; Callow, M. E.; Ista, L. K.; Lopez, G. P.; Callow, J. A., The Influence of Surface Wettability on the Adhesion Strength of Settled Spores of the Green Alga Enteromorpha and the Diatom Amphora. Integrative and Comparative Biology 2002, 42 (6), 1116-1122.
45. J.A Callow, M. E. C., L.K Ista, G Lopez, M.K Chaudhury, The Influence of Surface Energy on the Wetting Behavior of the Spore Adhesive of Marine Alga Ulva linza. Journal of Royal Society Interface 2005, 2, 319-325.
46. Holland, R.; Dugdale, T. M.; Wetherbee, R.; Brennan, A. B.; Finlay, J. A.; Callow, J. A.; Callow, M. E., Adhesion and Motility of Fouling Diatoms on a Silicone Elastomer. Biofouling 2004, 20 (6), 323-329.
47. Petrone, L.; Di Fino, A.; Aldred, N.; Sukkaew, P.; Ederth, T.; Clare, A. S.; Liedberg, B., Effects of Surface Charge and Gibbs Surface Energy on the Settlement Behaviour of Barnacle Cyprids (Balanus Amphitrite). Biofouling 2011, 27 (9), 1043-1055.
142
CHAPTER 6. SILOXANE-POLYURETHANE MARINE COATINGS WITH
HYDROPHILIC SIDE CHAINS FOR FOULING RELEASE APPLICATIONS
Introduction
Developing an effective non-toxic coating solution to marine biofouling is a modern day challenge
given the number of marine organisms in the oceans and their diverse surface preferences. Constant
colonization and accumulation of marine organisms on ocean immersed structures is known as marine
biofouling.1 The magnitude of the economic and environmental costs of biofouling is well recognized and
an environmentally friendly solution is being sought after to benefit the global shipping industry.2-4
Coatings with active tri-butyl-tin (TBT) were very effective against biofouling although they were soon
found to be causing detrimental effects to non-targeted marine life.4 In 2003, use of TBT in marine paints
was prohibited by the International Maritime Organization (IMO).1, 4 Due to the prohibition of tri-butyl-tin
(TBT) based antifouling (AF) coatings, copper oxide based AF coatings and fouling-release (FR) coatings
gained popularity.3-5 However, FR coatings have gained market attention as a completely non-toxic and
eco-friendly approach to contend with biofouling.
Fouling-release coatings do not release toxins, rather only allowing weak attachment of marine
organisms which facilitate easy removal of organisms when subjected to hydrodynamic pressure or light
cleaning.3, 4 Polydimethyl siloxane (PDMS) combines several required material elements for such fouling
release applications.1, 4 Therefore, most commercial FR coating systems are often formulated with PDMS
elastomers. Although early versions of PDMS based FR coatings have demonstrated excellent fouling
release behavior at higher ship speeds, settlement of fouling during idle periods leads to decrease in
performance over time.6 Also, it is widely accepted that some microfouling organisms settle easily on
static surfaces compared to dynamic surfaces.7 On the other hand, the slime resulting from microfouling
is difficult to release even with high hydrodynamic forces given the low surface profile of slime (typically a
thin layer).8-10 However slime fouling can significantly affect fuel consumption due to increased frictional
drag. Studies have shown heavy slime can result in 10.1% increase in fuel costs.11 Recent developments
in FR technology has been focused on inhibiting settlement of microfouling organisms during idle periods.
The attachment and settlement of marine animals on surfaces is a significantly dynamic process
which involves complex interfacial interactions between the organisms and the surfaces. These
143
interactions involve physico-dynamic events which biologists have attempted to understand, although the
exact nature and triggers for such behavior still remains a mystery.1, 12 Recent studies have suggested
that the primary interaction of marine organisms with surfaces is through the conditioning layer of
adsorbed adhesive proteins and macromoclecules.13 Therefore, protein resistant materials are being
widely explored for non-toxic marine coatings to delay the settlement of fouling specially during idle
periods. Polyethylene glycol (PEG) is more commonly investigated for protein resistant materials given its
ability to inhibit protein adsorbtion.14 PEG-modified surfaces display protein resistance properties due to
hydrophilic interactions with water.5 PEG chains on the surface can bind water molecules through
hydrogen bonding, creating a highly hydrated water layer minimizing the interfacial surface energy.15
Studies have shown that water content inside the surface grafted PEG chains can be very high (about
80% by volume).5 Disrupting the highly organized PEG-water complex is energetically costly for proteins
and organic molecules, which is in fact thermodynamically unfavorable.16, 17 Also, on the other hand,
when in contact with water, PEG has an interfacial low surface energy (5 mNm-1) compared to that of
PDMS (52 mNm-1) minimizing protein adsorption.5 Although there is active discussion about the role of
PEG in protein resistance, factors such as number of repeat units of ethylene glycol and surface density
of PEG have been observed to affect the degree of protein resistance.5 Self-assembled mono-layers
(SAM) containing PEG are commonly explored as protein-resistant materials for biomedical
applications.14, 18 Several studies have demonstrated that protein resistant properties of SAMs can be
tuned by variations introduced through the PEG component.7, 19 However, practical application of SAM for
marine applications can be an over reach.20
Zwitterionic surfaces are also investigated as a potential non-toxic fouling resistant strategy. In
contrast to PEG, protein resistant properties of zwitterionic surfaces arise from a very strongly bound
electrically induced hydration layer.3 Therefore, coatings prepared using zwitterionic polymers provide low
fouling and FR properties. Zwitterionic coatings are often superhydrophillic, attributing to the tightly and
commonly used poly (sulfobetaine) and poly (carboxybetaine) polymers with strong chemical stability.21, 22
Zwitterionic coatings can also overcome the shortcomings associated with PEG based systems. Several
studies have shown that zwitterionic coatings greatly reduce the settlement of marine organisms (Ulva
linza and barnacles) while demonstrating FR properties towards those organisms.21-23 Although a
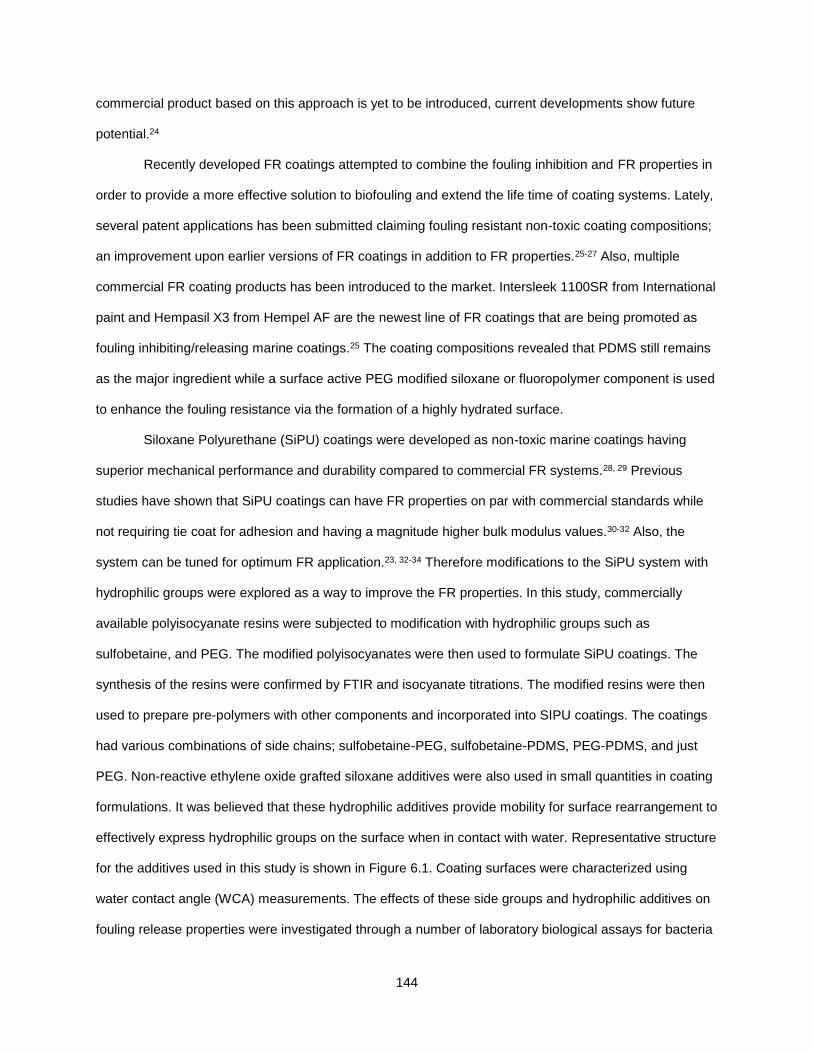
144
commercial product based on this approach is yet to be introduced, current developments show future
potential.24
Recently developed FR coatings attempted to combine the fouling inhibition and FR properties in
order to provide a more effective solution to biofouling and extend the life time of coating systems. Lately,
several patent applications has been submitted claiming fouling resistant non-toxic coating compositions;
an improvement upon earlier versions of FR coatings in addition to FR properties.25-27 Also, multiple
commercial FR coating products has been introduced to the market. Intersleek 1100SR from International
paint and Hempasil X3 from Hempel AF are the newest line of FR coatings that are being promoted as
fouling inhibiting/releasing marine coatings.25 The coating compositions revealed that PDMS still remains
as the major ingredient while a surface active PEG modified siloxane or fluoropolymer component is used
to enhance the fouling resistance via the formation of a highly hydrated surface.
Siloxane Polyurethane (SiPU) coatings were developed as non-toxic marine coatings having
superior mechanical performance and durability compared to commercial FR systems.28, 29 Previous
studies have shown that SiPU coatings can have FR properties on par with commercial standards while
not requiring tie coat for adhesion and having a magnitude higher bulk modulus values.30-32 Also, the
system can be tuned for optimum FR application.23, 32-34 Therefore modifications to the SiPU system with
hydrophilic groups were explored as a way to improve the FR properties. In this study, commercially
available polyisocyanate resins were subjected to modification with hydrophilic groups such as
sulfobetaine, and PEG. The modified polyisocyanates were then used to formulate SiPU coatings. The
synthesis of the resins were confirmed by FTIR and isocyanate titrations. The modified resins were then
used to prepare pre-polymers with other components and incorporated into SIPU coatings. The coatings
had various combinations of side chains; sulfobetaine-PEG, sulfobetaine-PDMS, PEG-PDMS, and just
PEG. Non-reactive ethylene oxide grafted siloxane additives were also used in small quantities in coating
formulations. It was believed that these hydrophilic additives provide mobility for surface rearrangement to
effectively express hydrophilic groups on the surface when in contact with water. Representative structure
for the additives used in this study is shown in Figure 6.1. Coating surfaces were characterized using
water contact angle (WCA) measurements. The effects of these side groups and hydrophilic additives on
fouling release properties were investigated through a number of laboratory biological assays for bacteria
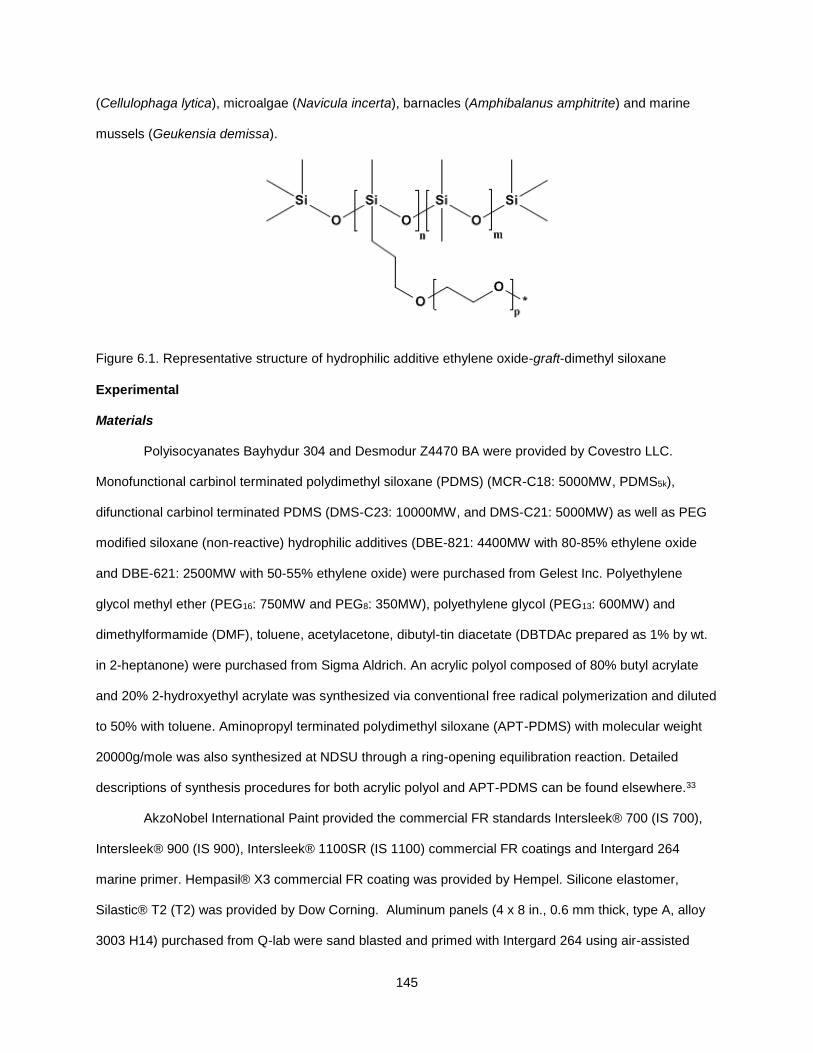
145
(Cellulophaga lytica), microalgae (Navicula incerta), barnacles (Amphibalanus amphitrite) and marine
mussels (Geukensia demissa).
Figure 6.1. Representative structure of hydrophilic additive ethylene oxide-graft-dimethyl siloxane
Experimental
Materials
Polyisocyanates Bayhydur 304 and Desmodur Z4470 BA were provided by Covestro LLC.
Monofunctional carbinol terminated polydimethyl siloxane (PDMS) (MCR-C18: 5000MW, PDMS5k),
difunctional carbinol terminated PDMS (DMS-C23: 10000MW, and DMS-C21: 5000MW) as well as PEG
modified siloxane (non-reactive) hydrophilic additives (DBE-821: 4400MW with 80-85% ethylene oxide
and DBE-621: 2500MW with 50-55% ethylene oxide) were purchased from Gelest Inc. Polyethylene
glycol methyl ether (PEG16: 750MW and PEG8: 350MW), polyethylene glycol (PEG13: 600MW) and
dimethylformamide (DMF), toluene, acetylacetone, dibutyl-tin diacetate (DBTDAc prepared as 1% by wt.
in 2-heptanone) were purchased from Sigma Aldrich. An acrylic polyol composed of 80% butyl acrylate
and 20% 2-hydroxyethyl acrylate was synthesized via conventional free radical polymerization and diluted
to 50% with toluene. Aminopropyl terminated polydimethyl siloxane (APT-PDMS) with molecular weight
20000g/mole was also synthesized at NDSU through a ring-opening equilibration reaction. Detailed
descriptions of synthesis procedures for both acrylic polyol and APT-PDMS can be found elsewhere.33
AkzoNobel International Paint provided the commercial FR standards Intersleek® 700 (IS 700),
Intersleek® 900 (IS 900), Intersleek® 1100SR (IS 1100) commercial FR coatings and Intergard 264
marine primer. Hempasil® X3 commercial FR coating was provided by Hempel. Silicone elastomer,
Silastic® T2 (T2) was provided by Dow Corning. Aluminum panels (4 x 8 in., 0.6 mm thick, type A, alloy
3003 H14) purchased from Q-lab were sand blasted and primed with Intergard 264 using air-assisted
146
spray application. Multi-well plates were modified using circular disks (1 inch diameter) of primed
aluminum.
Synthesis of sulfobetaine modified monofunctional poly (ethylene oxide) methyl ether containing
polyisocyanate (SB-BAY-304)
Polyisocyanate Bayhydur 304 is based on hexmethylene diamine (HDI) and modified with
emulsifying PEG chain. This resin was further modified to contain sulfobetaine functionality (4:1
equivalence of NCO to hydroxyl). Bayhydur 304 (28.03 g), toluene (28.00 g), and N,N’-
dimethylethanolamine (2.72 g) were combined in a 250 mL 3-neck round bottom flask equipped with
mechanical stirring, N2 inlet, and thermocouple. The reaction mixture was heated to 40°C using a heating
mantle. The DBTDAc catalyst solution (0.57 g) was added once the reaction mixture reached the set
temperature. The reaction was allowed to equilibrate for 24 hrs. Next day reaction mixture was further
diluted with toluene (40.01 g) and 1, 3-propanesultone (3.74 g) was added. The reaction was carried out
for another 24 hrs at 40°C. The presence of sulfobetaine groups were confirmed by FTIR analysis. Also,
the isocyanate content of the modified resin was determined post reaction.
Synthesis of sulfobetaine modified isophone diisocyanate based polyisocyanate (SB-IPDI)
Isophorone diisocyanate-based polyisocyanate (Desmodur Z4470 BA) (38.54 g) was combined
with toluene (17.72 g), and N, N’-dimethylethanolamine (2.38 g) were combined in a 100 mL 3-neck
round bottom flask equipped with mechanical stirring, N2 inlet, and thermocouple. The reaction mixture
was heated to 40°C using a heating mantle. Once the set temperature was reached, DBTDAc catalyst
solution (0.44 g) was added and allowed the reaction to equilibrate for 24 hrs. Next day, 1, 3-
propanesultone (3.21 g) was added. The reaction was carried out for another 24 hrs at 40°C. During the
reaction, NCO to hydroxyl equivalent ratio was maintained at 3:1. Post functionalization the presence of
sulfobetaine groups were confirmed by FTIR and isocyanate titrations.
Synthesis of poly (ethylene oxide) modified isophone diisocyanate based polyisocyanate (PEG-
IPDI)
Desmodur Z4470 BA resin was modified with PEG chains. In a 40 mL glass vial, Desmodur
Z4470 BA (20.56 g), PEG 350 (4.94 g) and DBTDAc catalyst solution (0.16 g) were combined (3:1 NCO
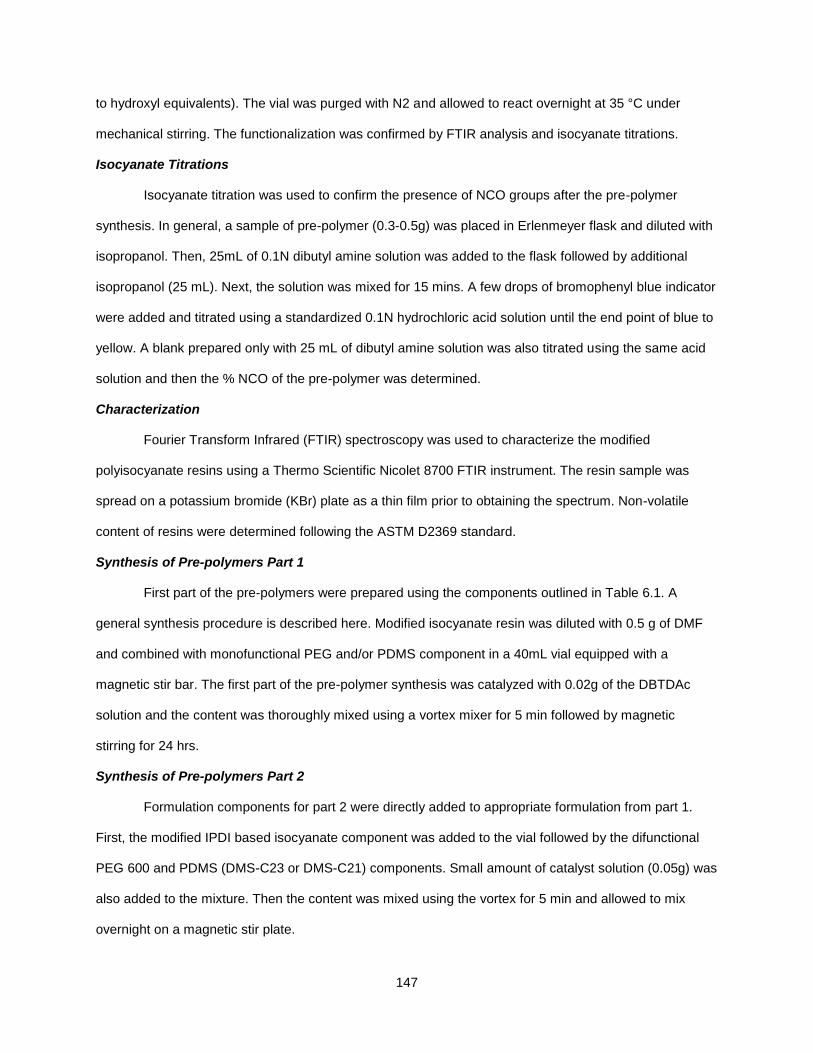
147
to hydroxyl equivalents). The vial was purged with N2 and allowed to react overnight at 35 °C under
mechanical stirring. The functionalization was confirmed by FTIR analysis and isocyanate titrations.
Isocyanate Titrations
Isocyanate titration was used to confirm the presence of NCO groups after the pre-polymer
synthesis. In general, a sample of pre-polymer (0.3-0.5g) was placed in Erlenmeyer flask and diluted with
isopropanol. Then, 25mL of 0.1N dibutyl amine solution was added to the flask followed by additional
isopropanol (25 mL). Next, the solution was mixed for 15 mins. A few drops of bromophenyl blue indicator
were added and titrated using a standardized 0.1N hydrochloric acid solution until the end point of blue to
yellow. A blank prepared only with 25 mL of dibutyl amine solution was also titrated using the same acid
solution and then the % NCO of the pre-polymer was determined.
Characterization
Fourier Transform Infrared (FTIR) spectroscopy was used to characterize the modified
polyisocyanate resins using a Thermo Scientific Nicolet 8700 FTIR instrument. The resin sample was
spread on a potassium bromide (KBr) plate as a thin film prior to obtaining the spectrum. Non-volatile
content of resins were determined following the ASTM D2369 standard.
Synthesis of Pre-polymers Part 1
First part of the pre-polymers were prepared using the components outlined in Table 6.1. A
general synthesis procedure is described here. Modified isocyanate resin was diluted with 0.5 g of DMF
and combined with monofunctional PEG and/or PDMS component in a 40mL vial equipped with a
magnetic stir bar. The first part of the pre-polymer synthesis was catalyzed with 0.02g of the DBTDAc
solution and the content was thoroughly mixed using a vortex mixer for 5 min followed by magnetic
stirring for 24 hrs.
Synthesis of Pre-polymers Part 2
Formulation components for part 2 were directly added to appropriate formulation from part 1.
First, the modified IPDI based isocyanate component was added to the vial followed by the difunctional
PEG 600 and PDMS (DMS-C23 or DMS-C21) components. Small amount of catalyst solution (0.05g) was
also added to the mixture. Then the content was mixed using the vortex for 5 min and allowed to mix
overnight on a magnetic stir plate.
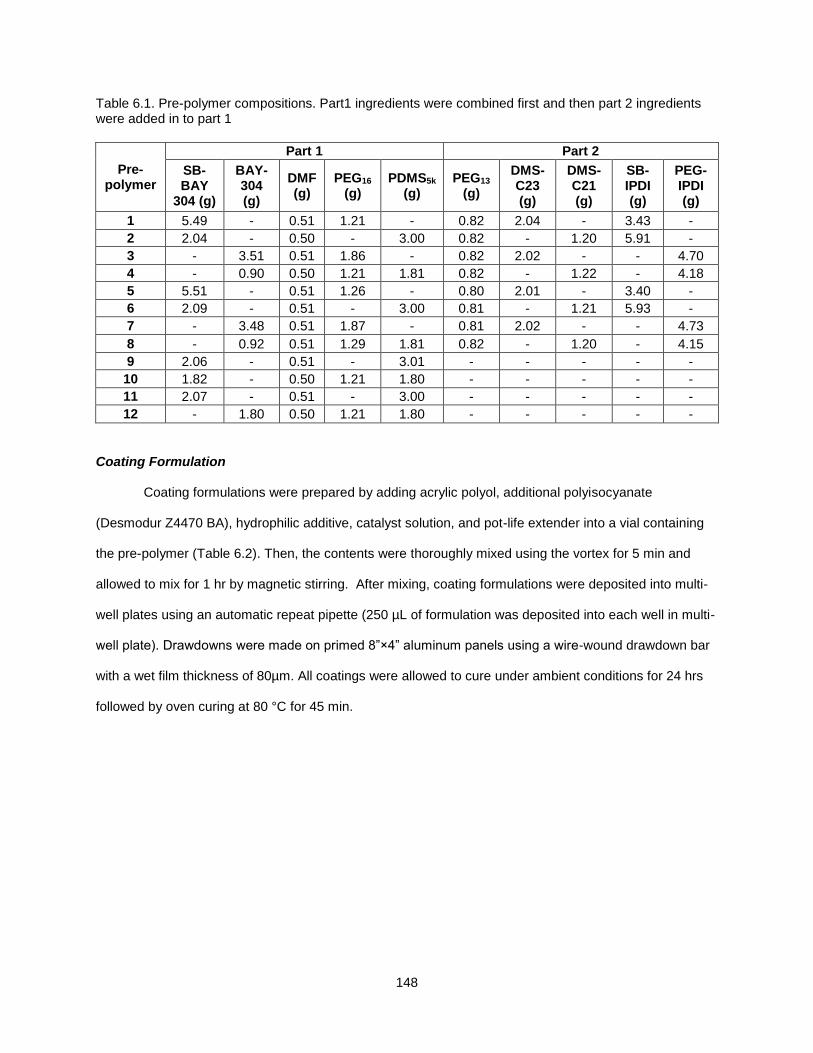
148
Table 6.1. Pre-polymer compositions. Part1 ingredients were combined first and then part 2 ingredients were added in to part 1
Pre-polymer
Part 1 Part 2
SB-BAY
304 (g)
BAY- 304 (g)
DMF (g)
PEG16 (g)
PDMS5k (g)
PEG13 (g)
DMS-C23 (g)
DMS-C21 (g)
SB-IPDI (g)
PEG-IPDI (g)
1 5.49 - 0.51 1.21 - 0.82 2.04 - 3.43 -
2 2.04 - 0.50 - 3.00 0.82 - 1.20 5.91 -
3 - 3.51 0.51 1.86 - 0.82 2.02 - - 4.70
4 - 0.90 0.50 1.21 1.81 0.82 - 1.22 - 4.18
5 5.51 - 0.51 1.26 - 0.80 2.01 - 3.40 -
6 2.09 - 0.51 - 3.00 0.81 - 1.21 5.93 -
7 - 3.48 0.51 1.87 - 0.81 2.02 - - 4.73
8 - 0.92 0.51 1.29 1.81 0.82 - 1.20 - 4.15
9 2.06 - 0.51 - 3.01 - - - - -
10 1.82 - 0.50 1.21 1.80 - - - - -
11 2.07 - 0.51 - 3.00 - - - - -
12 - 1.80 0.50 1.21 1.80 - - - - -
Coating Formulation
Coating formulations were prepared by adding acrylic polyol, additional polyisocyanate
(Desmodur Z4470 BA), hydrophilic additive, catalyst solution, and pot-life extender into a vial containing
the pre-polymer (Table 6.2). Then, the contents were thoroughly mixed using the vortex for 5 min and
allowed to mix for 1 hr by magnetic stirring. After mixing, coating formulations were deposited into multi-
well plates using an automatic repeat pipette (250 µL of formulation was deposited into each well in multi-
well plate). Drawdowns were made on primed 8”×4” aluminum panels using a wire-wound drawdown bar
with a wet film thickness of 80µm. All coatings were allowed to cure under ambient conditions for 24 hrs
followed by oven curing at 80 °C for 45 min.
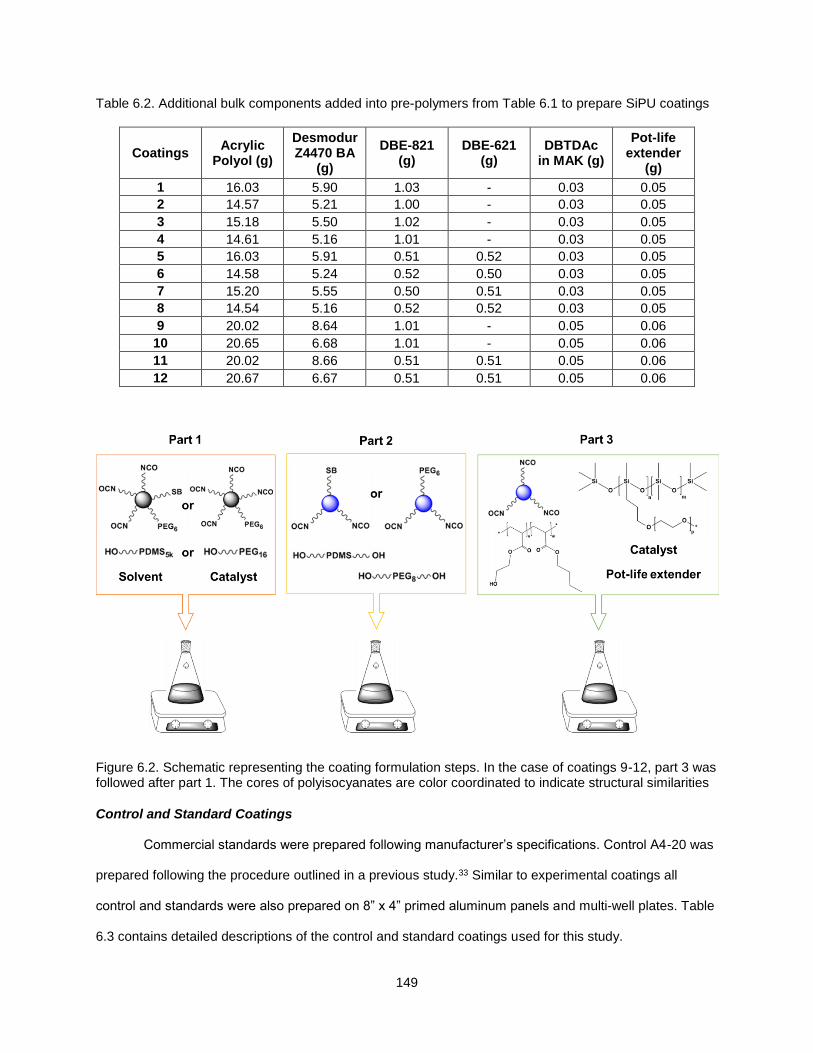
149
Table 6.2. Additional bulk components added into pre-polymers from Table 6.1 to prepare SiPU coatings
Coatings Acrylic
Polyol (g)
Desmodur Z4470 BA
(g)
DBE-821 (g)
DBE-621 (g)
DBTDAc in MAK (g)
Pot-life extender
(g)
1 16.03 5.90 1.03 - 0.03 0.05
2 14.57 5.21 1.00 - 0.03 0.05
3 15.18 5.50 1.02 - 0.03 0.05
4 14.61 5.16 1.01 - 0.03 0.05
5 16.03 5.91 0.51 0.52 0.03 0.05
6 14.58 5.24 0.52 0.50 0.03 0.05
7 15.20 5.55 0.50 0.51 0.03 0.05
8 14.54 5.16 0.52 0.52 0.03 0.05
9 20.02 8.64 1.01 - 0.05 0.06
10 20.65 6.68 1.01 - 0.05 0.06
11 20.02 8.66 0.51 0.51 0.05 0.06
12 20.67 6.67 0.51 0.51 0.05 0.06
Figure 6.2. Schematic representing the coating formulation steps. In the case of coatings 9-12, part 3 was followed after part 1. The cores of polyisocyanates are color coordinated to indicate structural similarities
Control and Standard Coatings
Commercial standards were prepared following manufacturer’s specifications. Control A4-20 was
prepared following the procedure outlined in a previous study.33 Similar to experimental coatings all
control and standards were also prepared on 8” x 4” primed aluminum panels and multi-well plates. Table
6.3 contains detailed descriptions of the control and standard coatings used for this study.
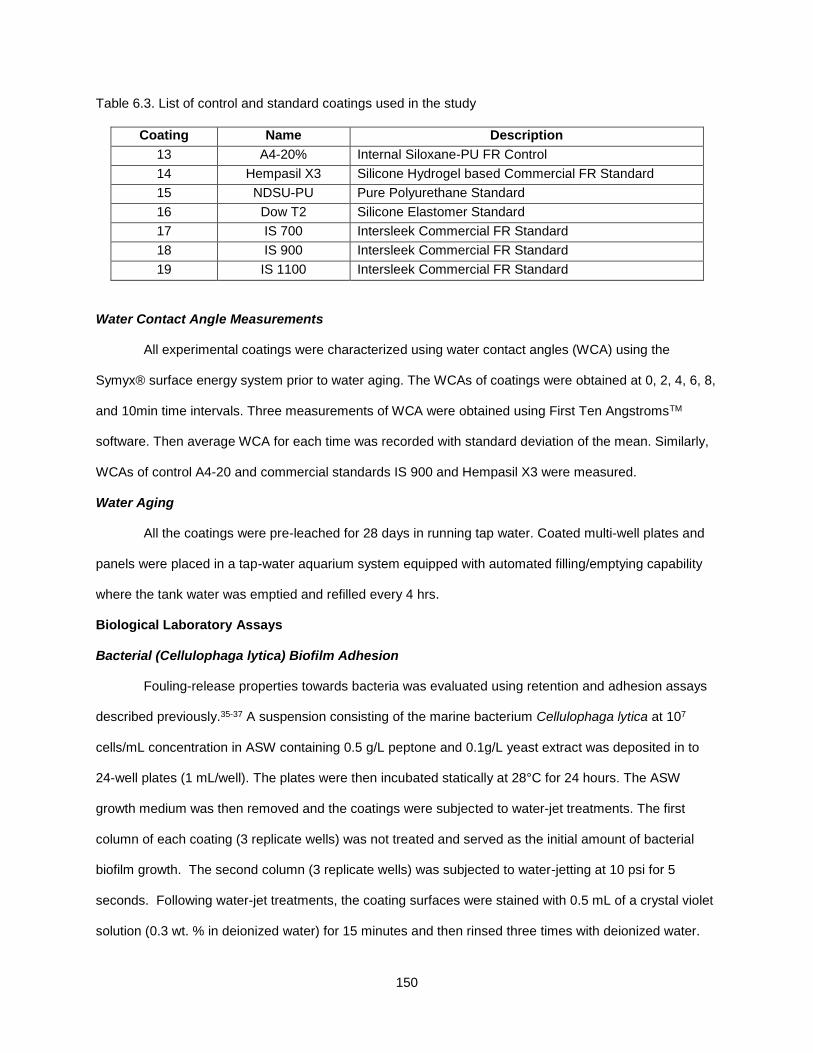
150
Table 6.3. List of control and standard coatings used in the study
Coating Name Description
13 A4-20% Internal Siloxane-PU FR Control
14 Hempasil X3 Silicone Hydrogel based Commercial FR Standard
15 NDSU-PU Pure Polyurethane Standard
16 Dow T2 Silicone Elastomer Standard
17 IS 700 Intersleek Commercial FR Standard
18 IS 900 Intersleek Commercial FR Standard
19 IS 1100 Intersleek Commercial FR Standard
Water Contact Angle Measurements
All experimental coatings were characterized using water contact angles (WCA) using the
Symyx® surface energy system prior to water aging. The WCAs of coatings were obtained at 0, 2, 4, 6, 8,
and 10min time intervals. Three measurements of WCA were obtained using First Ten AngstromsTM
software. Then average WCA for each time was recorded with standard deviation of the mean. Similarly,
WCAs of control A4-20 and commercial standards IS 900 and Hempasil X3 were measured.
Water Aging
All the coatings were pre-leached for 28 days in running tap water. Coated multi-well plates and
panels were placed in a tap-water aquarium system equipped with automated filling/emptying capability
where the tank water was emptied and refilled every 4 hrs.
Biological Laboratory Assays
Bacterial (Cellulophaga lytica) Biofilm Adhesion
Fouling-release properties towards bacteria was evaluated using retention and adhesion assays
described previously.35-37 A suspension consisting of the marine bacterium Cellulophaga lytica at 107
cells/mL concentration in ASW containing 0.5 g/L peptone and 0.1g/L yeast extract was deposited in to
24-well plates (1 mL/well). The plates were then incubated statically at 28°C for 24 hours. The ASW
growth medium was then removed and the coatings were subjected to water-jet treatments. The first
column of each coating (3 replicate wells) was not treated and served as the initial amount of bacterial
biofilm growth. The second column (3 replicate wells) was subjected to water-jetting at 10 psi for 5
seconds. Following water-jet treatments, the coating surfaces were stained with 0.5 mL of a crystal violet
solution (0.3 wt. % in deionized water) for 15 minutes and then rinsed three times with deionized water.
151
After 1 hour of drying at ambient laboratory conditions, the crystal violet dye was extracted from the
coating surfaces by adding 0.5 mL of 33% acetic acid solution for 15 minutes. The resulting eluates were
transferred to a 96-well plate (0.15 mL/coating replicate) and subjected to absorbance measurements at
600nm wavelength using a multi-well plate spectrophotometer. The absorbance values were considered
to be directly proportional to the amount of bacterial biofilm present on coating surfaces before and after
water-jetting treatments. Percent removal of bacterial biofilm was quantified by comparing the mean
absorbance values of the non-jetted and water-jetted coating surfaces.38
Growth and Release of Microalgae (Navicula incerta)
Laboratory biological assay to evaluate FR properties of coatings towards diatom (Navicula
incerta) was conducted at NDSU following a similar procedure described previously.36, 39 Briefly, a
suspension with 4×10⁵ cells/mL of N. incerta (adjusted to 0.03 OD at absorbance 660 nm) in Guillard’s
F/2 medium was deposited into each well (1 mL per well) and cell attachment was stimulated by static
incubation for 2 hours under ambient conditions in the dark. Coating surfaces were then subjected to
water-jet treatments.35 First column of wells (3 wells) were not water-jetted so that initial cell attachment
could be determined and the next column of wells (3 wells) were water-jetted at 20 psi for 10 seconds.
Microalgae biomass was quantified by extracting chlorophyll using 0.5 mL of DMSO and measuring
fluorescence of the transferred extracts at an excitation wavelength of 360 nm and emission wavelength
at 670 nm. The relative fluorescence (RFU) measured from the extracts was considered to be directly
proportional to the biomass remaining on the coating surfaces after water-jetting. Percent removal of
attached microalgae was determined using relative fluorescence of non-jetted and water-jetted wells.
Adult Barnacle (Amphibalanus amphitrite) Adhesion
An adult barnacle reattachment and adhesion assay was used to evaluate the fouling-release
properties of the coatings towards macrofoulers.40, 41 Coatings prepared on 8 x 4” panels after water aging
were utilized for this laboratory assay. Barnacles were dislodged from silicone substrates sent from Duke
University and immobilized on experimental coatings (6 barnacles per coating) using a custom-designed
immobilization template. The immobilized barnacles were allowed to reattach and grow for 2 weeks while
immersed in an ASW aquarium tank system with daily feedings of brine shrimp Artemia nauplii (Florida
Aqua Farms). After the 2 week attachment period, the number of non-attached barnacles was recorded
152
and the attached barnacles were pushed off (in shear) using a hand-held force gauge mounted onto a
semi-automated stage. Once the barnacles were dislodged, their basal plate areas were determined from
scanned images using Sigma Scan Pro 5.0 software program. Barnacle adhesion strength (MPa) was
calculated by taking the ratio of peak force of removal to the basal plate area for each reattached
barnacle. The average barnacle adhesion strength for each coating was reported as a function of the
number of barnacles released with a measureable force and that exhibited no visible damage to the basis
or shell plates.
Mussel (Geukensia demissa) Adhesion
Slightly modified version of previously published protocol was used to evaluate adhesion of
marine mussels to coatings in a laboratory assay.42-44 Marine ribbed mussels (Geukensia demissa; 3-5
cm length) were received from Duke University Marine Laboratory in Beaufort, North Carolina, USA. Prior
to the attachment study, each mussel was modified with a 4 cm long acetal plastic rod (product#
98873A105, McMaster-Carr) (perpendicular to the ventral edge) glued using a 3M® acrylic adhesive
(product# 7467A135, McMaster-Carr). Six mussels were then immobilized on to each coating surface
using a custom-designed template fabricated from PVC sheets. The coatings with immobilized mussels
were then placed in an ASW aquarium system and fed daily with live marine phytoplankton (DTs
Premium Reef Blend Phytoplankton) for 3 days. After 3 days, the coatings were removed from the ASW
aquarium tank system and the total number of mussels exhibiting attachment of byssus threads was
recorded for each coating. The plastic rod glued to each attached mussel was then affixed to individual 5
Newton load cells of a custom-built tensile force gauge where all mussels were pulled off simultaneously
(1 mm s-1 pull rate). The total force (Newton) required to completely detach all byssus threads for each
mussel was recorded and the mean value of the total number of attached mussels for each coating was
calculated.
Results and Discussion
In this study, polyisocyanates were modified with sulfobetaine, PEG, and PDMS side chains to be
incorporated into SiPU coatings. Commercially available polyisocyanate resins were subjected to
modification and successful modification was confirmed by FTIR and isocyanate titrations. The coatings
had various combinations of side chains; sulfobetaine-PEG, sulfobetaine-PDMS, PEG-PDMS, and just
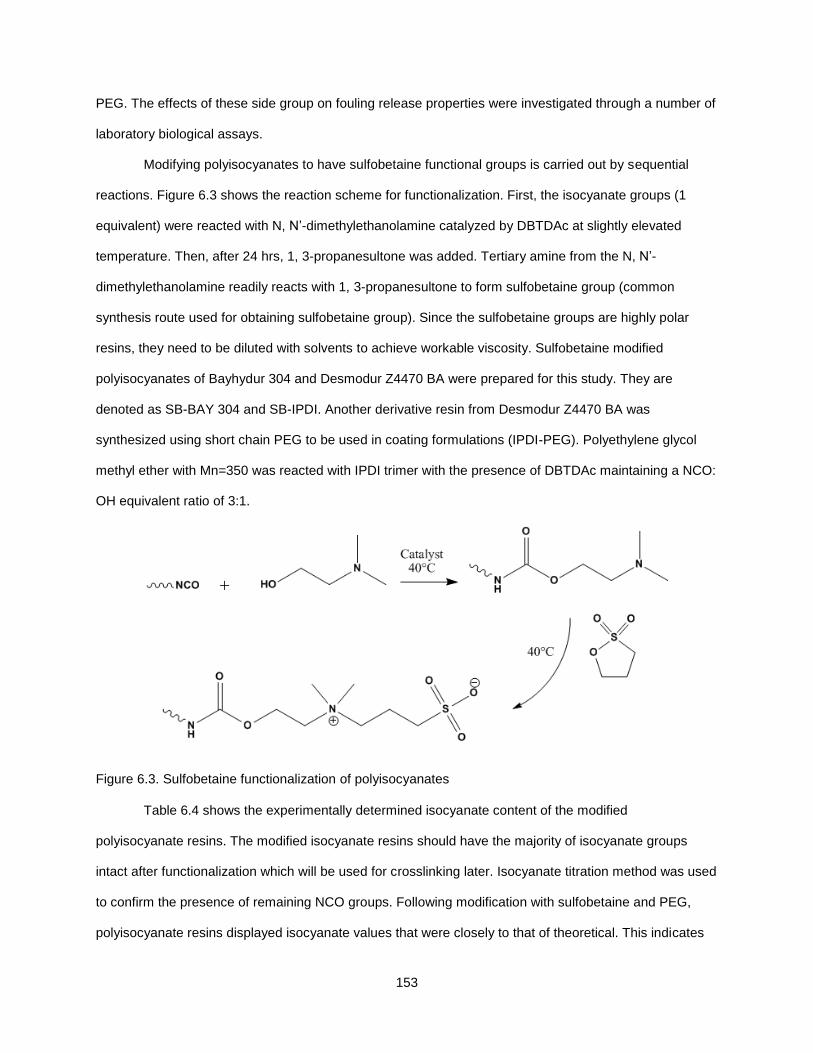
153
PEG. The effects of these side group on fouling release properties were investigated through a number of
laboratory biological assays.
Modifying polyisocyanates to have sulfobetaine functional groups is carried out by sequential
reactions. Figure 6.3 shows the reaction scheme for functionalization. First, the isocyanate groups (1
equivalent) were reacted with N, N’-dimethylethanolamine catalyzed by DBTDAc at slightly elevated
temperature. Then, after 24 hrs, 1, 3-propanesultone was added. Tertiary amine from the N, N’-
dimethylethanolamine readily reacts with 1, 3-propanesultone to form sulfobetaine group (common
synthesis route used for obtaining sulfobetaine group). Since the sulfobetaine groups are highly polar
resins, they need to be diluted with solvents to achieve workable viscosity. Sulfobetaine modified
polyisocyanates of Bayhydur 304 and Desmodur Z4470 BA were prepared for this study. They are
denoted as SB-BAY 304 and SB-IPDI. Another derivative resin from Desmodur Z4470 BA was
synthesized using short chain PEG to be used in coating formulations (IPDI-PEG). Polyethylene glycol
methyl ether with Mn=350 was reacted with IPDI trimer with the presence of DBTDAc maintaining a NCO:
OH equivalent ratio of 3:1.
Figure 6.3. Sulfobetaine functionalization of polyisocyanates
Table 6.4 shows the experimentally determined isocyanate content of the modified
polyisocyanate resins. The modified isocyanate resins should have the majority of isocyanate groups
intact after functionalization which will be used for crosslinking later. Isocyanate titration method was used
to confirm the presence of remaining NCO groups. Following modification with sulfobetaine and PEG,
polyisocyanate resins displayed isocyanate values that were closely to that of theoretical. This indicates
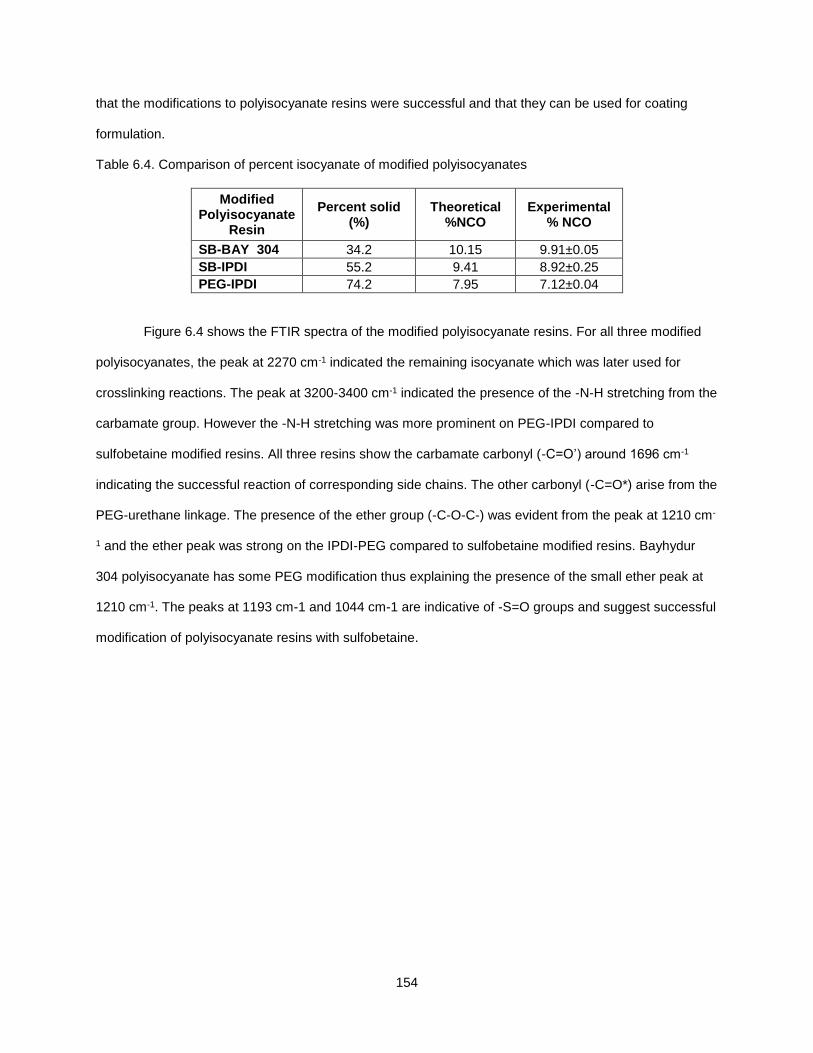
154
that the modifications to polyisocyanate resins were successful and that they can be used for coating
formulation.
Table 6.4. Comparison of percent isocyanate of modified polyisocyanates
Modified Polyisocyanate
Resin
Percent solid (%)
Theoretical %NCO
Experimental % NCO
SB-BAY 304 34.2 10.15 9.91±0.05
SB-IPDI 55.2 9.41 8.92±0.25
PEG-IPDI 74.2 7.95 7.12±0.04
Figure 6.4 shows the FTIR spectra of the modified polyisocyanate resins. For all three modified
polyisocyanates, the peak at 2270 cm-1 indicated the remaining isocyanate which was later used for
crosslinking reactions. The peak at 3200-3400 cm-1 indicated the presence of the -N-H stretching from the
carbamate group. However the -N-H stretching was more prominent on PEG-IPDI compared to
sulfobetaine modified resins. All three resins show the carbamate carbonyl (-C=O’) around 1696 cm-1
indicating the successful reaction of corresponding side chains. The other carbonyl (-C=O*) arise from the
PEG-urethane linkage. The presence of the ether group (-C-O-C-) was evident from the peak at 1210 cm-
1 and the ether peak was strong on the IPDI-PEG compared to sulfobetaine modified resins. Bayhydur
304 polyisocyanate has some PEG modification thus explaining the presence of the small ether peak at
1210 cm-1. The peaks at 1193 cm-1 and 1044 cm-1 are indicative of -S=O groups and suggest successful
modification of polyisocyanate resins with sulfobetaine.
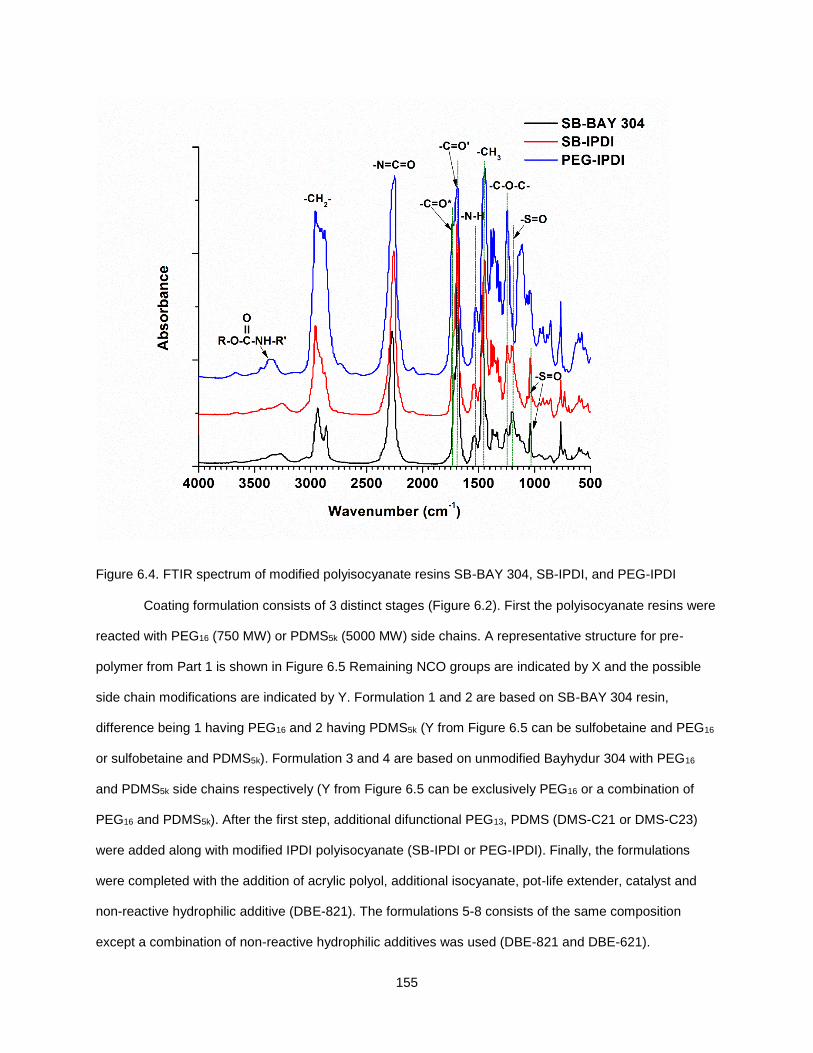
155
Figure 6.4. FTIR spectrum of modified polyisocyanate resins SB-BAY 304, SB-IPDI, and PEG-IPDI
Coating formulation consists of 3 distinct stages (Figure 6.2). First the polyisocyanate resins were
reacted with PEG16 (750 MW) or PDMS5k (5000 MW) side chains. A representative structure for pre-
polymer from Part 1 is shown in Figure 6.5 Remaining NCO groups are indicated by X and the possible
side chain modifications are indicated by Y. Formulation 1 and 2 are based on SB-BAY 304 resin,
difference being 1 having PEG16 and 2 having PDMS5k (Y from Figure 6.5 can be sulfobetaine and PEG16
or sulfobetaine and PDMS5k). Formulation 3 and 4 are based on unmodified Bayhydur 304 with PEG16
and PDMS5k side chains respectively (Y from Figure 6.5 can be exclusively PEG16 or a combination of
PEG16 and PDMS5k). After the first step, additional difunctional PEG13, PDMS (DMS-C21 or DMS-C23)
were added along with modified IPDI polyisocyanate (SB-IPDI or PEG-IPDI). Finally, the formulations
were completed with the addition of acrylic polyol, additional isocyanate, pot-life extender, catalyst and
non-reactive hydrophilic additive (DBE-821). The formulations 5-8 consists of the same composition
except a combination of non-reactive hydrophilic additives was used (DBE-821 and DBE-621).
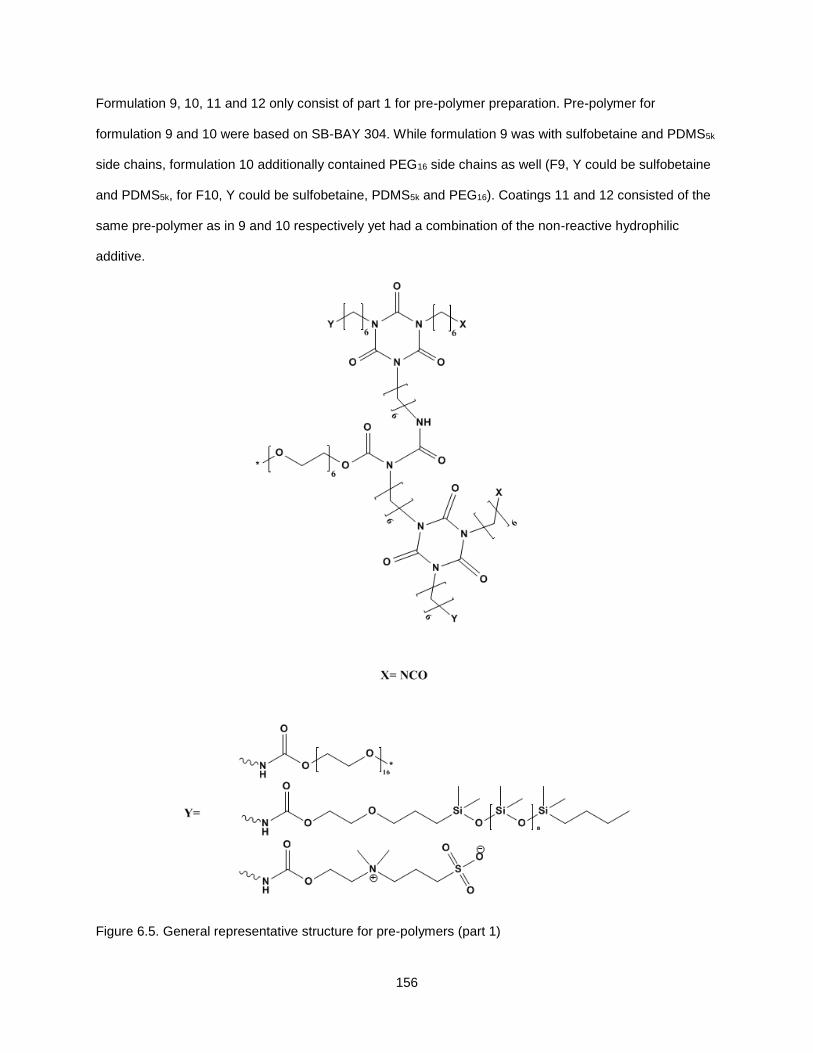
156
Formulation 9, 10, 11 and 12 only consist of part 1 for pre-polymer preparation. Pre-polymer for
formulation 9 and 10 were based on SB-BAY 304. While formulation 9 was with sulfobetaine and PDMS5k
side chains, formulation 10 additionally contained PEG16 side chains as well (F9, Y could be sulfobetaine
and PDMS5k, for F10, Y could be sulfobetaine, PDMS5k and PEG16). Coatings 11 and 12 consisted of the
same pre-polymer as in 9 and 10 respectively yet had a combination of the non-reactive hydrophilic
additive.
Figure 6.5. General representative structure for pre-polymers (part 1)
157
Figure 6.6 shows the water contact angle measurements of the coatings taken every two minutes
over a period of ten minutes. Several of the coatings prepared for this study displayed a change in WCA
over time. Almost all experimental coatings showed a change in WCA from hydrophobic to hydrophilic
whereas some changed more than others. In general all the experimental coatings showed WCA of equal
or less than 100° initially. Coating 1 (with sulfobetaine-PEG side chains) displayed a higher drop in WCA
at each time interval compared to Coating 2 (with sulfobetaine-PDMS side chains). Coating 3 (PEG side
chains) showed a more gradual decrease in WCA while coating 4 (PEG-PDMS side chains) showed a
significant drop in WCA initially and very little change over time. Coatings 5-8 displayed lower WCA
angles than that of coatings 1-4. The WCAs for coatings 5-8 suggest that the surfaces were more
hydrophilic compared to those of coatings 1-4. After 10 min coating 5, 7, and 8 show WCA in 35-40°
range. Since coatings 5-8 were made using the same pre-polymers used in coatings 1-4, the observed
difference in WCA may be attributed due to the addition of the non-reactive hydrophilic additive DBE-621.
Coatings 9-12 also showed decreasing WCA with time, yet having a combination of multiple hydrophilic
additives (DBE 621 and 821) vs. a single hydrophilic additive (DBE-821) did not affect the WCAs of the
coatings significantly. Commercial standards Hempasil X3 and IS 900 also demonstrated decreasing
WCAs, a trend comparable to that observed for several experimental coatings. However, IS 900 was
relatively hydrophilic to begin with compared to Hempasil X3. Results suggest that during WCA
experiment, coatings 1, 2, 3, and 6 behaved similarly to Hempasil X3 while coatings 5, 7, 8, 10 and 12
behaved similarly to IS 900. This rapid change in surface wettability has not been observed for SiPU
coating systems previously. In fact, the A4-20 control did not show much change in WCA with time. This
new feature may influence the FR properties of SiPU coatings. However, further characterization of
surface morphology is needed to identify the underlying principle for rapid surface wettability change in
coatings. X-ray photoelectron spectroscopy (XPS) and atomic force microscopy (AFM) may provide in
depth details of the coating surface compositions.
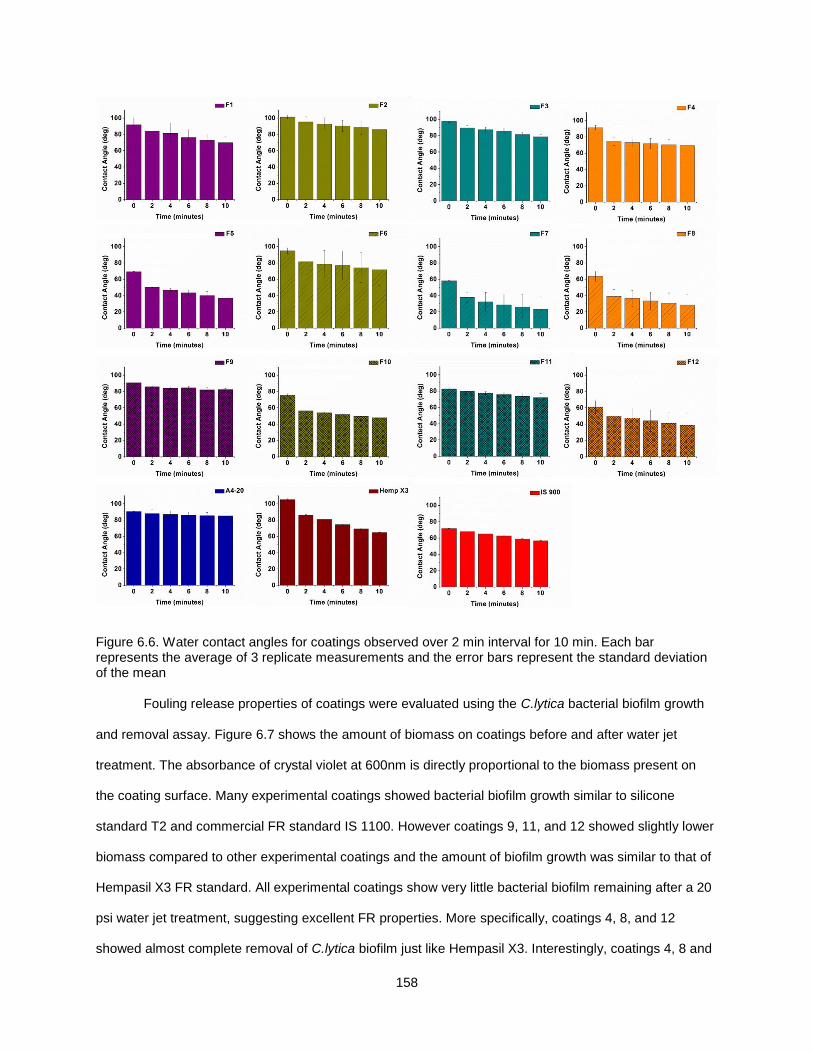
158
Figure 6.6. Water contact angles for coatings observed over 2 min interval for 10 min. Each bar represents the average of 3 replicate measurements and the error bars represent the standard deviation of the mean
Fouling release properties of coatings were evaluated using the C.lytica bacterial biofilm growth
and removal assay. Figure 6.7 shows the amount of biomass on coatings before and after water jet
treatment. The absorbance of crystal violet at 600nm is directly proportional to the biomass present on
the coating surface. Many experimental coatings showed bacterial biofilm growth similar to silicone
standard T2 and commercial FR standard IS 1100. However coatings 9, 11, and 12 showed slightly lower
biomass compared to other experimental coatings and the amount of biofilm growth was similar to that of
Hempasil X3 FR standard. All experimental coatings show very little bacterial biofilm remaining after a 20
psi water jet treatment, suggesting excellent FR properties. More specifically, coatings 4, 8, and 12
showed almost complete removal of C.lytica biofilm just like Hempasil X3. Interestingly, coatings 4, 8 and
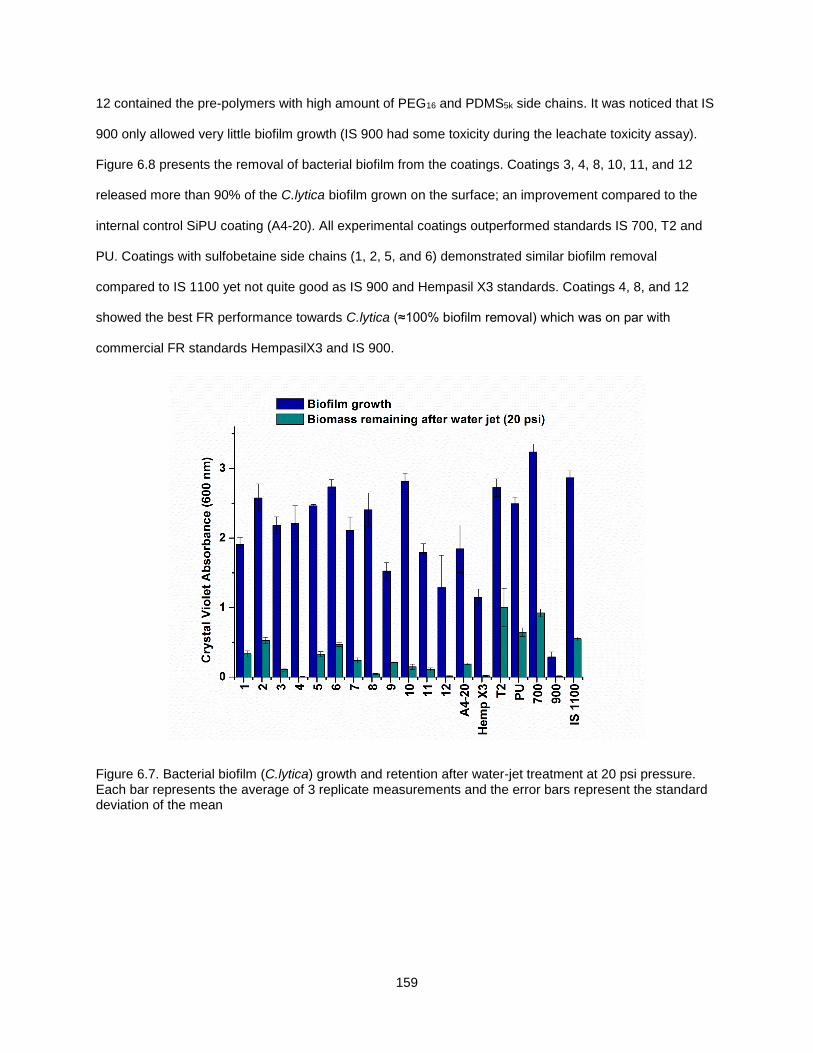
159
12 contained the pre-polymers with high amount of PEG16 and PDMS5k side chains. It was noticed that IS
900 only allowed very little biofilm growth (IS 900 had some toxicity during the leachate toxicity assay).
Figure 6.8 presents the removal of bacterial biofilm from the coatings. Coatings 3, 4, 8, 10, 11, and 12
released more than 90% of the C.lytica biofilm grown on the surface; an improvement compared to the
internal control SiPU coating (A4-20). All experimental coatings outperformed standards IS 700, T2 and
PU. Coatings with sulfobetaine side chains (1, 2, 5, and 6) demonstrated similar biofilm removal
compared to IS 1100 yet not quite good as IS 900 and Hempasil X3 standards. Coatings 4, 8, and 12
showed the best FR performance towards C.lytica (≈100% biofilm removal) which was on par with
commercial FR standards HempasilX3 and IS 900.
Figure 6.7. Bacterial biofilm (C.lytica) growth and retention after water-jet treatment at 20 psi pressure. Each bar represents the average of 3 replicate measurements and the error bars represent the standard deviation of the mean
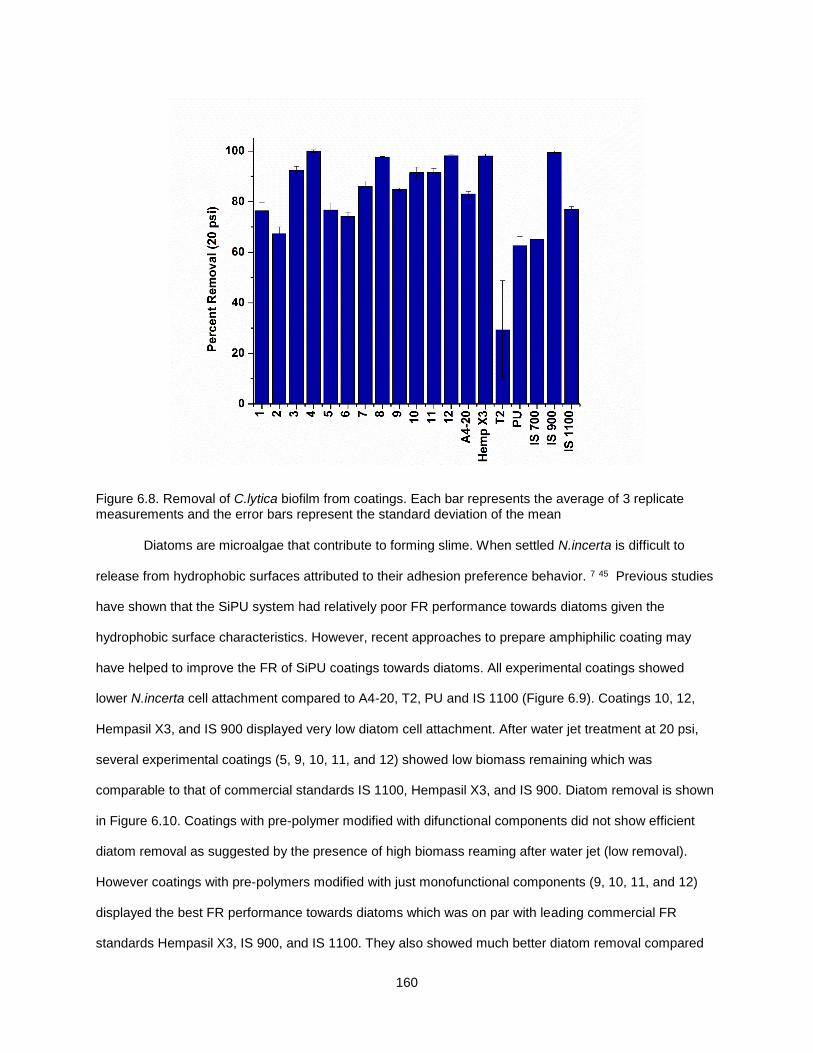
160
Figure 6.8. Removal of C.lytica biofilm from coatings. Each bar represents the average of 3 replicate measurements and the error bars represent the standard deviation of the mean
Diatoms are microalgae that contribute to forming slime. When settled N.incerta is difficult to
release from hydrophobic surfaces attributed to their adhesion preference behavior. 7 45 Previous studies
have shown that the SiPU system had relatively poor FR performance towards diatoms given the
hydrophobic surface characteristics. However, recent approaches to prepare amphiphilic coating may
have helped to improve the FR of SiPU coatings towards diatoms. All experimental coatings showed
lower N.incerta cell attachment compared to A4-20, T2, PU and IS 1100 (Figure 6.9). Coatings 10, 12,
Hempasil X3, and IS 900 displayed very low diatom cell attachment. After water jet treatment at 20 psi,
several experimental coatings (5, 9, 10, 11, and 12) showed low biomass remaining which was
comparable to that of commercial standards IS 1100, Hempasil X3, and IS 900. Diatom removal is shown
in Figure 6.10. Coatings with pre-polymer modified with difunctional components did not show efficient
diatom removal as suggested by the presence of high biomass reaming after water jet (low removal).
However coatings with pre-polymers modified with just monofunctional components (9, 10, 11, and 12)
displayed the best FR performance towards diatoms which was on par with leading commercial FR
standards Hempasil X3, IS 900, and IS 1100. They also showed much better diatom removal compared
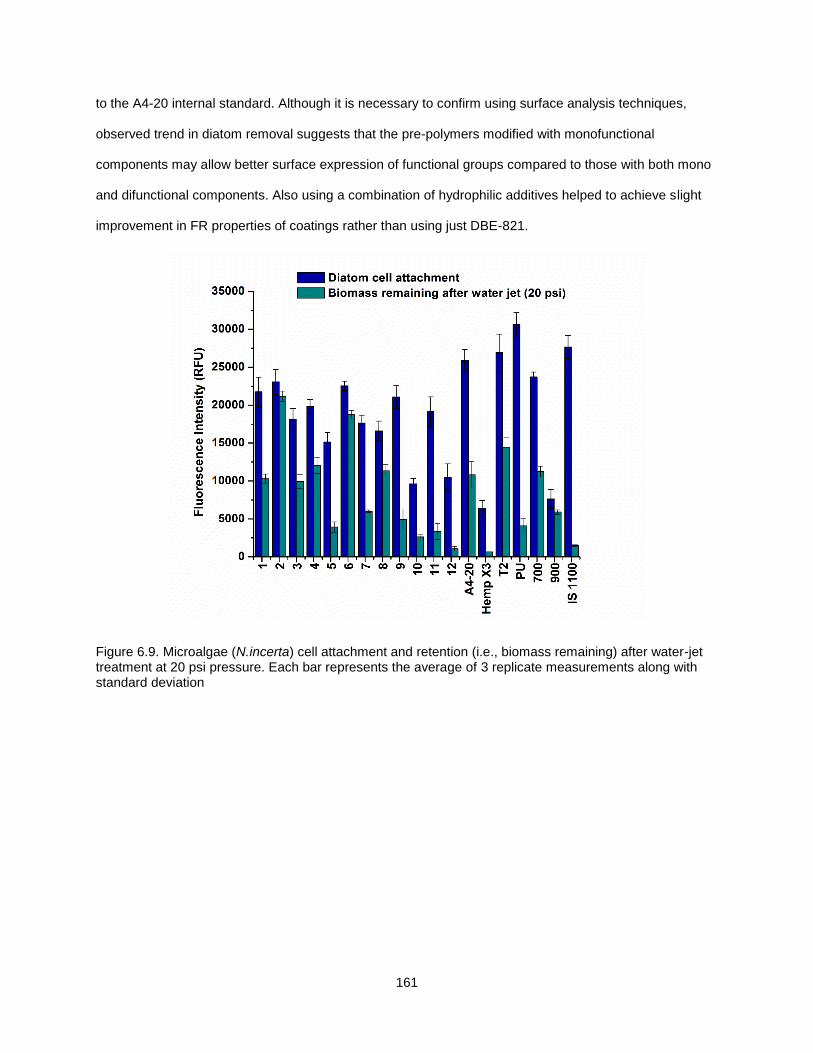
161
to the A4-20 internal standard. Although it is necessary to confirm using surface analysis techniques,
observed trend in diatom removal suggests that the pre-polymers modified with monofunctional
components may allow better surface expression of functional groups compared to those with both mono
and difunctional components. Also using a combination of hydrophilic additives helped to achieve slight
improvement in FR properties of coatings rather than using just DBE-821.
Figure 6.9. Microalgae (N.incerta) cell attachment and retention (i.e., biomass remaining) after water-jet treatment at 20 psi pressure. Each bar represents the average of 3 replicate measurements along with standard deviation
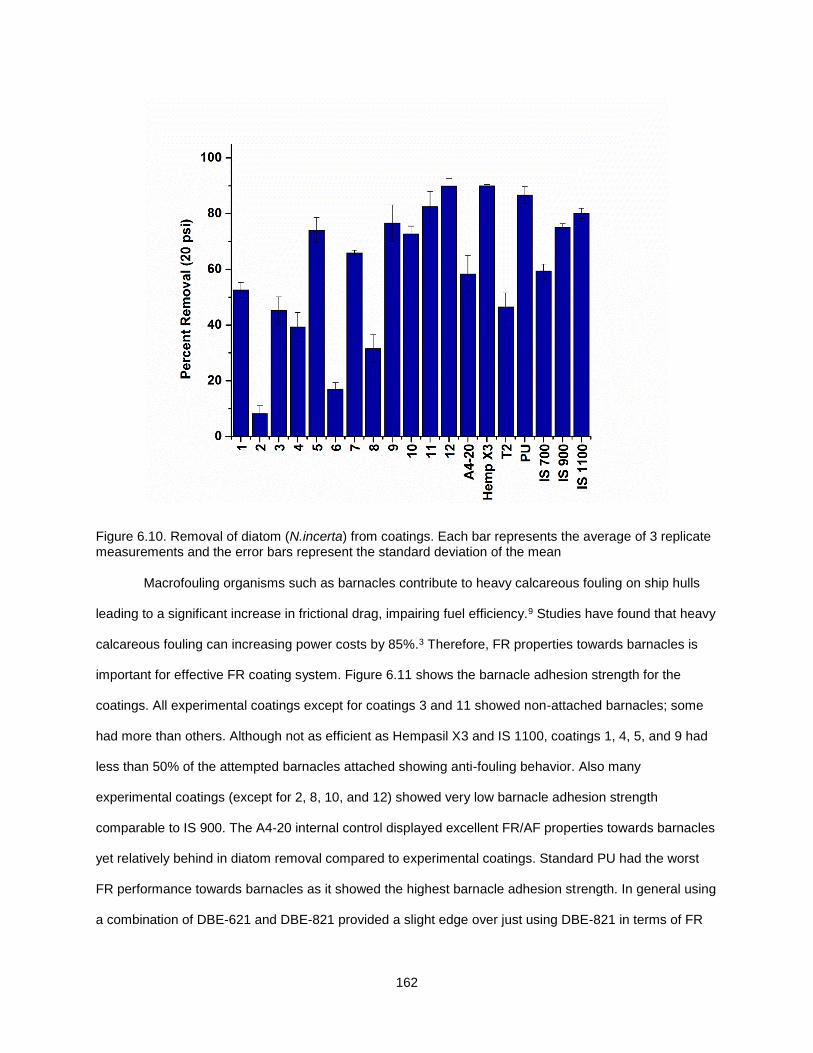
162
Figure 6.10. Removal of diatom (N.incerta) from coatings. Each bar represents the average of 3 replicate measurements and the error bars represent the standard deviation of the mean
Macrofouling organisms such as barnacles contribute to heavy calcareous fouling on ship hulls
leading to a significant increase in frictional drag, impairing fuel efficiency.9 Studies have found that heavy
calcareous fouling can increasing power costs by 85%.3 Therefore, FR properties towards barnacles is
important for effective FR coating system. Figure 6.11 shows the barnacle adhesion strength for the
coatings. All experimental coatings except for coatings 3 and 11 showed non-attached barnacles; some
had more than others. Although not as efficient as Hempasil X3 and IS 1100, coatings 1, 4, 5, and 9 had
less than 50% of the attempted barnacles attached showing anti-fouling behavior. Also many
experimental coatings (except for 2, 8, 10, and 12) showed very low barnacle adhesion strength
comparable to IS 900. The A4-20 internal control displayed excellent FR/AF properties towards barnacles
yet relatively behind in diatom removal compared to experimental coatings. Standard PU had the worst
FR performance towards barnacles as it showed the highest barnacle adhesion strength. In general using
a combination of DBE-621 and DBE-821 provided a slight edge over just using DBE-821 in terms of FR
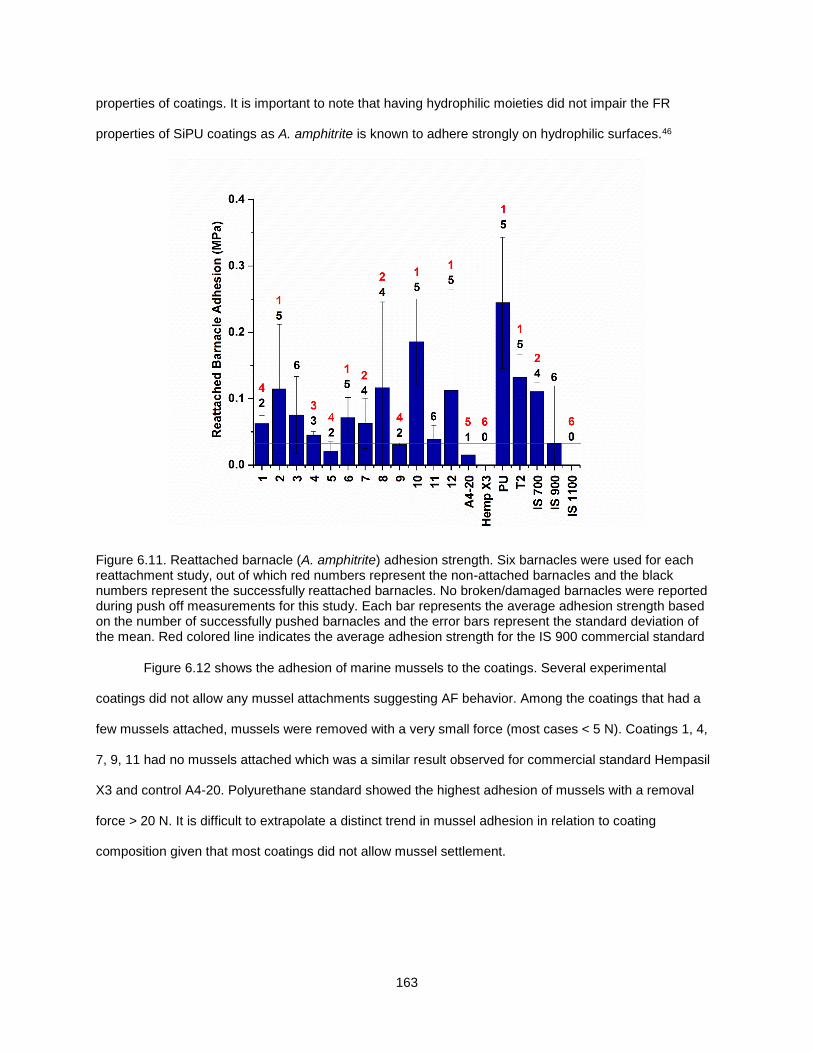
163
properties of coatings. It is important to note that having hydrophilic moieties did not impair the FR
properties of SiPU coatings as A. amphitrite is known to adhere strongly on hydrophilic surfaces.46
Figure 6.11. Reattached barnacle (A. amphitrite) adhesion strength. Six barnacles were used for each reattachment study, out of which red numbers represent the non-attached barnacles and the black numbers represent the successfully reattached barnacles. No broken/damaged barnacles were reported during push off measurements for this study. Each bar represents the average adhesion strength based on the number of successfully pushed barnacles and the error bars represent the standard deviation of the mean. Red colored line indicates the average adhesion strength for the IS 900 commercial standard
Figure 6.12 shows the adhesion of marine mussels to the coatings. Several experimental
coatings did not allow any mussel attachments suggesting AF behavior. Among the coatings that had a
few mussels attached, mussels were removed with a very small force (most cases < 5 N). Coatings 1, 4,
7, 9, 11 had no mussels attached which was a similar result observed for commercial standard Hempasil
X3 and control A4-20. Polyurethane standard showed the highest adhesion of mussels with a removal
force > 20 N. It is difficult to extrapolate a distinct trend in mussel adhesion in relation to coating
composition given that most coatings did not allow mussel settlement.
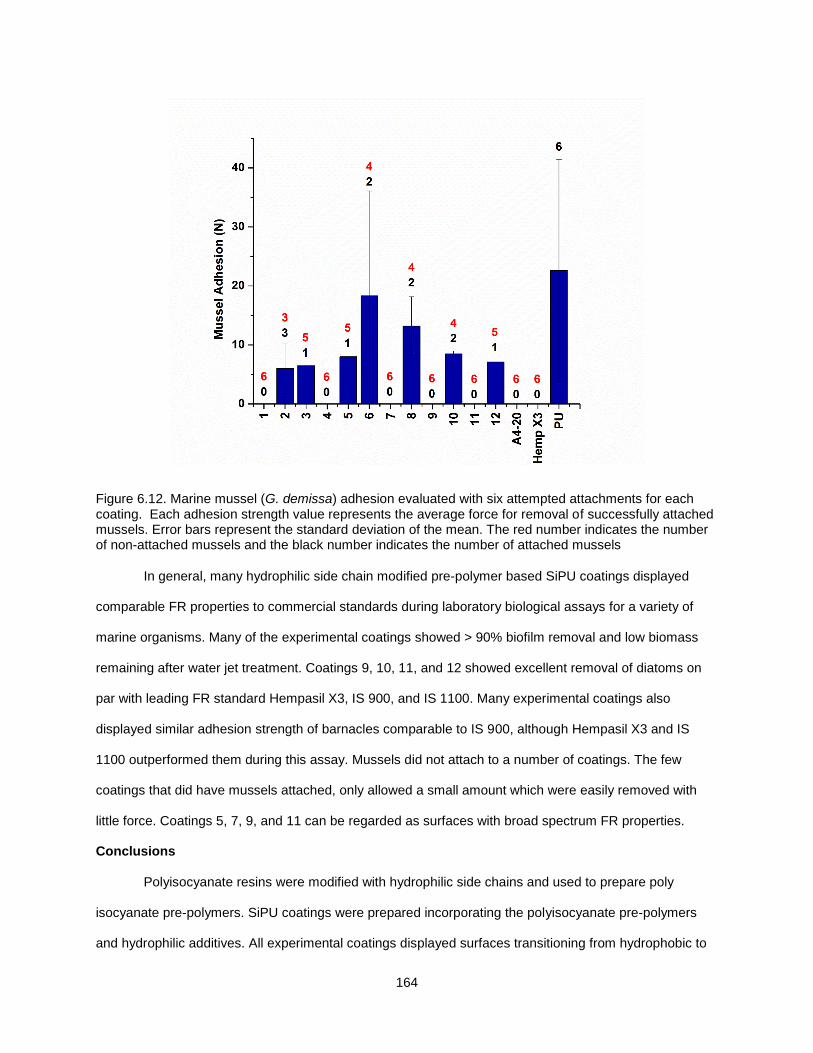
164
Figure 6.12. Marine mussel (G. demissa) adhesion evaluated with six attempted attachments for each coating. Each adhesion strength value represents the average force for removal of successfully attached mussels. Error bars represent the standard deviation of the mean. The red number indicates the number of non-attached mussels and the black number indicates the number of attached mussels
In general, many hydrophilic side chain modified pre-polymer based SiPU coatings displayed
comparable FR properties to commercial standards during laboratory biological assays for a variety of
marine organisms. Many of the experimental coatings showed > 90% biofilm removal and low biomass
remaining after water jet treatment. Coatings 9, 10, 11, and 12 showed excellent removal of diatoms on
par with leading FR standard Hempasil X3, IS 900, and IS 1100. Many experimental coatings also
displayed similar adhesion strength of barnacles comparable to IS 900, although Hempasil X3 and IS
1100 outperformed them during this assay. Mussels did not attach to a number of coatings. The few
coatings that did have mussels attached, only allowed a small amount which were easily removed with
little force. Coatings 5, 7, 9, and 11 can be regarded as surfaces with broad spectrum FR properties.
Conclusions
Polyisocyanate resins were modified with hydrophilic side chains and used to prepare poly
isocyanate pre-polymers. SiPU coatings were prepared incorporating the polyisocyanate pre-polymers
and hydrophilic additives. All experimental coatings displayed surfaces transitioning from hydrophobic to
165
hydrophilic with increasing contact time with water. Coatings with hydrophilic additive combination (DBE-
621 and 821) provided coatings that transform to being hydrophilic quickly, whereas using of a single
(DBE-821) additive provided a more swiftly changing surface with exposure to water. Side chain
combination of PEG-PDMS seems to provide excellent FR properties for marine bacteria which was on
par with commercial FR standards. Excellent FR performance towards diatoms were displayed by
coatings prepared only using monofunctional components. Many coating compositions showed improved
FR properties compared to that of the A4-20 control considering microfouling. Several experimental
coating also displayed good AF and FR properties towards barnacles and mussels. More in depth surface
characterization would provide better understanding of observed trends for adhesion and release of
marine organisms. This work will provide the foundation to further develop SiPU coating surfaces with
hydrophilic character for FR applications. Tailoring the surface balance of protein resistant hydrophilic
groups will enable broad spectrum FR properties.
References
1. Yebra, D. M.; Kiil, S. K.; Dam-Johansen, K., Antifouling Technology—Past, Present and Future Steps Towards Efficientand Environmentally Friendly Antifouling Coatings. Progress in Organic Coatings 2004, 50 (2), 75-104.
2. Callow, M. E.; Callow, J. A., Marine Biofouling: A Sticky Problem. Biologist 2002, 49 (1), 10.
3. Callow, J. A.; Callow, M. E., Trends in The Development of Environmentally Friendly Fouling-resistant Marine Coatings. Nat Commun 2011, 2, 244.
4. Lejars, M.; Margaillan, A.; Bressy, C., Fouling Release Coatings: A Nontoxic Alternative to Biocidal Antifouling Coatings. Chemical Reviews 2012, 112 (8), 4347-4390.
5. Nurioglu, A. G.; Esteves, A. C. C.; de With, G., Non-toxic, Non-biocide-release Antifouling Coatings Based on Molecular Structure Design for Marine Applications. Journal of Materials Chemistry B 2015, 3 (32), 6547-6570.
6. Tribou, M.; Swain, G., The Use of Proactive In-water Grooming to Improve the Performance of Ship Hull Antifouling Coatings. Biofouling 2010, 26 (1), 47-56.
7. Finlay, J. A.; Callow, M. E.; Ista, L. K.; Lopez, G. P.; Callow, J. A., The Influence of Surface Wettability on the Adhesion Strength of Settled Spores of the Green Alga Enteromorpha and the Diatom Amphora. Integrative and Comparative Biology 2002, 42 (6), 1116-1122.
8. Schultz, M. P.; Swain, G. W., The Influence of Biofilms on Skin Friction Drag. Biofouling 2000, 15 (1-3), 129-139.
9. Schultz, M. P., Frictional Resistance of Antifouling Coating Systems. Journal of Fluids Engineering 2005, 126 (6), 1039-1047.
166
10. Schultz, M. P.; Bendick, J. A.; Holm, E. R.; Hertel, W. M., Economic Impact of Biofouling on A Naval Surface Ship. Biofouling 2010, 27 (1), 87-98.
11. Schultz, M. P.; Walker, J. M.; Steppe, C. N.; Flack, K. A., Impact of Diatomaceous Biofilms on the Frictional Drag of Fouling-release Coatings. Biofouling 2015, 31 (9-10), 759-773.
12. Hellio, C.; Yebra, D. M., Advances in Marine Antifouling Coatings and Technologies. Woodhead Publishing Limited: Cambridge, UK, 2009.
13. Iguerb, O.; Poleunis, C.; Mazéas, F.; Compère, C.; Bertrand, P., Antifouling Properties of Poly(methyl methacrylate) Films Grafted with Poly(ethylene glycol) Monoacrylate Immersed in Seawater†. Langmuir 2008, 24 (21), 12272-12281.
14. Wyszogrodzka, M.; Haag, R., Synthesis and Characterization of Glycerol Dendrons, Self-Assembled Monolayers on Gold: A Detailed Study of Their Protein Resistance. Biomacromolecules 2009, 10 (5), 1043-1054.
15. Andrade, J. D.; King, R. N.; Gregonis, D. E.; Coleman, D. L., Surface Characterization of Poly(hydroxyethyl methacrylate) and Related Polymers. I. Contact Angle Methods in Water. Journal of Polymer Science: Polymer Symposia 1979, 66 (1), 313-336.
16. Heuberger, M.; Drobek, T.; Spencer, N. D., Interaction Forces and Morphology of a Protein-Resistant Poly(ethylene glycol) Layer. Biophysical Journal 2005, 88 (1), 495-504.
17. Jeon, S. I.; Lee, J. H.; Andrade, J. D.; De Gennes, P. G., Protein—Surface Interactions in the Presence of Polyethylene Oxide. Journal of Colloid and Interface Science 1991, 142 (1), 149-158.
18. Szleifer, I., Polymers and Proteins: Interactions at Interfaces. Current Opinion in Solid State and Materials Science 1997, 2 (3), 337-344.
19. Bowen, J.; Pettitt, M. E.; Kendall, K.; Leggett, G. J.; Preece, J. A.; Callow, M. E.; Callow, J. A., The Influence of Surface Lubricity on the Adhesion of Navicula Perminuta and Ulva linza to Alkanethiol Self-Assembled Monolayers. Journal of The Royal Society Interface 2007, 4 (14), 473-477.
20. Prime, K. L.; Whitesides, G. M., Adsorption of Proteins onto Surfaces Containing End-attached Oligo(ethylene oxide): a Model System Using Self-assembled Monolayers. Journal of the American Chemical Society 1993, 115 (23), 10714-10721.
21. Jiang, S.; Cao, Z., Ultralow-Fouling, Functionalizable, and Hydrolyzable Zwitterionic Materials and Their Derivatives for Biological Applications. Advanced Materials 2010, 22 (9), 920-932.
22. Wu, C.-J.; Huang, C.-J.; Jiang, S.; Sheng, Y.-J.; Tsao, H.-K., Superhydrophilicity and Spontaneous Spreading on Zwitterionic Surfaces: Carboxybetaine and Sulfobetaine. RSC Advances 2016, 6 (30), 24827-24834.
23. Bodkhe, R. B.; Stafslien, S. J.; Daniels, J.; Cilz, N.; Muelhberg, A. J.; Thompson, S. E. M.; Callow, M. E.; Callow, J. A.; Webster, D. C., Zwitterionic Siloxane-Polyurethane Fouling-release Coatings. Progress in Organic Coatings 2015, 78, 369-380.
24. Coneski, P. N.; Wynne, J. H., Zwitterionic Polyurethane Hydrogels Derived from Carboxybetaine-Functionalized Diols. ACS Applied Materials & Interfaces 2012, 4 (9), 4465-4469.
25. Thorlaksen, P. C. W.; Blom, A.; Bork, U. Novel Fouling Control Coating Compositions. US20120264847 A1, 2012.
167
26. Thorlaksen, P. C. W. Novel Fouling Control Coating Compositions. US20140170426 A1, 2014.
27. Thorlaksen, P. C. W.; Blom, A.; Yebra, D. M. Fouling Control Coating Compositions. US20140135422 A1, 2014.
28. Ekin, A.; Webster, D. C., Combinatorial and High-Throughput Screening of the Effect of Siloxane Composition on the Surface Properties of Crosslinked Siloxane−Polyurethane Coatings. Journal of Combinatorial Chemistry 2006, 9 (1), 178-188.
29. Webster, D. C.; Pieper, R. J.; Ekin, A. Thermoset Siloxane-Urethane Fouling Release Coatings. US 7,989,074 B2, 2011.
30. Sommer, S.; Ekin, A.; Webster, D. C.; Stafslien, S. J.; Daniels, J.; VanderWal, L. J.; Thompson, S. E. M.; Callow, M. E.; Callow, J. A., A Preliminary Study on the Properties and Fouling-release Performance of Siloxane-Polyurethane coatings Prepared from PDMS Macromers. Biofouling 2010, 26 (8), 961-972.
31. Sommer, S. A.; Joseph, B. R.; Fischer, H. D.; Bodkhe, R. B.; Staflien, S. J.; Daniels, J.; Yehle, C.; Webster, D. C., Effect of Pigmentation on Siloxane-Polyurethane Coatings. Journal of Coatings Technology Research 2011, 8 (6), 661-670.
32. Bodkhe, R. B.; Stafslien, S. J.; Cilz, N.; Daniels, J.; Thompson, S. E. M.; Callow, M. E.; Callow, J. A.; Webster, D. C., Polyurethanes with Amphiphilic Surfaces Made Using Telechelic Functional PDMS Having Orthogonal Acid Functional Groups. Progress in Organic Coatings 2012, 75 (1–2), 38-48.
33. Bodkhe, R. B.; Thompson, S. E. M.; Yehle, C.; Cilz, N.; Daniels, J.; Stafslien, S. J.; Callow, M. E.; Callow, J. A.; Webster, D. C., The Effect of Formulation Variables on Fouling-release Performance of Stratified Siloxane-Polyurethane Coatings. Journal of Coatings Technology Research 2012, 9 (3), 235-249.
34. Webster, D. C.; Bodkhe, R. B. Functionalized Silicones with Polyalkylene Oxide Side Chains. US 9,169,359 B2, 2015, 2015.
35. Stafslien, S. J.; Bahr, J. A.; Daniels, J. W.; Wal, L. V.; Nevins, J.; Smith, J.; Schiele, K.; Chisholm, B., Combinatorial Materials Research Applied to the Development of New Surface Coatings VI: An Automated Spinning Water Jet Apparatus for the High-Throughput Characterization of Fouling-release Marine Coatings. Review of Scientific Instruments 2007, 78 (7), 072204.
36. Callow, M. E.; Callow, J. A.; Conlan, S.; Clare, A. S.; Stafslien, S., Efficacy Testing of Nonbiocidal and Fouling-release Coatings. In Biofouling Methods, John Wiley & Sons, Ltd: 2014; pp 291-316.
37. Stafslien, S.; Daniels, J.; Mayo, B.; Christianson, D.; Chisholm, B.; Ekin, A.; Webster, D.; Swain, G., Combinatorial Materials Research Applied to the Development of New Surface Coatings. IV: A High-Throughput Bacterial Retention and Retraction Assay for Screening Fouling-release Performance of Coatings. Biofouling 2007, 23 (1), 45-54.
38. Casse, F.; Ribeiro, E.; Ekin, A.; Webster, D. C.; Callow, J. A.; Callow, M. E., Laboratory Screening of Coating Libraries for Algal Adhesion. Biofouling 2007, 23 (3/4), 267-276.
39. Cassé, F.; Stafslien, S. J.; Bahr, J. A.; Daniels, J.; Finlay, J. A.; Callow, J. A.; Callow, M. E., Combinatorial Materials Research Applied to the Development of New Surface Coatings V. Application of a Spinning Water-jet for the Semi-high Throughput Assessment of the Attachment Strength of Marine Fouling Algae. Biofouling 2007, 23 (2), 121-130.
168
40. Stafslien, S.; Daniels, J.; Bahr, J.; Chisholm, B.; Ekin, A.; Webster, D.; Orihuela, B.; Rittschof, D., An Improved Laboratory Reattachment Method for the Rapid Assessment of Adult Barnacle Adhesion Strength to Fouling-release Marine Coatings. Journal of Coatings Technology and Research 2012, 9 (6), 651-665.
41. Rittschof, D.; Orihuela, B.; Stafslien, S.; Daniels, J.; Christianson, D.; Chisholm, B.; Holm, E., Barnacle Reattachment: A Tool for Studying Barnacle Adhesion. Biofouling 2008, 24 (1), 1-9.
42. Emily, C. B.; John, M. G., Strategies for Life in Flow: Tenacity, Morphometry, and Probability of Dislodgment of Two Mytilus Species. Marine Ecology Progress Series 1997, 159, 197-208.
43. Burkett, J. R.; Wojtas, J. L.; Cloud, J. L.; Wilker, J. J., A Method for Measuring the Adhesion Strength of Marine Mussels. The Journal of Adhesion 2009, 85 (9), 601-615.
44. Crisp, D. J.; Walker, G.; Young, G. A.; Yule, A. B., Adhesion and Substrate Choice in Mussels and Barnacles. Journal of Colloid and Interface Science 1985, 104 (1), 40-50.
45. Holland, R.; Dugdale, T. M.; Wetherbee, R.; Brennan, A. B.; Finlay, J. A.; Callow, J. A.; Callow, M. E., Adhesion and Motility of Fouling Diatoms on A Silicone Elastomer. Biofouling 2004, 20 (6), 323-329.
46. Aldred, N.; Scardino, A.; Cavaco, A.; de Nys, R.; Clare, A. S., Attachment Strength is A Key Factor in the Selection of Surfaces by Barnacle Cyprids (Balanus Amphitrite) During Settlement. Biofouling 2010, 26 (3), 287-299.
169
CHAPTER 7. FOULING-RELEASE PERFORMANCE OF SILOXANE-
POLYURETHANE COATINGS IN FRESHWATER FIELD IMMERSION TRIALS
Introduction
Biofouling, the buildup of aquatic animals and plants on underwater structures has caused great
degree of economic impact to the seafaring vessels and the shipping industry.1 Biofouling can negatively
impact our lives in ways that we have never imagined. Unwanted accumulation of biomass on surfaces in
contact with marine, human body and freshwater can significantly affect the productivity of processes
involved in our daily lives. Developing practical, and environmentally friendly solution to mitigating
biofouling is a modern day challenge. Even though there are many invertebrates that cause freshwater
fouling, nothing can be compared to the invasion of zebra mussels which started in the Europe (around
the 19th century) and more recently spread into North America.2 Freshwater fouling has become a
national concern in the United States ever since the discovery of zebra mussels (Dreissena polymorpha)
in the great lakes (mid 1980s).3 Zebra mussels were believed to be brought by ballast water from many
cargo vessels that visited the Great Lakes from Europe.2 This unintentional introduction of non-native
species causing an imbalance in the ecosystem can be highlighted as an example for negative
environmental impacts of biofouling.
Since their introduction to Great Lakes, zebra mussels have spread in to freshwater bodies and
lakes in North America. In 2007, quagga mussels (Dreissena bugensis), a close cousin of zebra mussels
were also spotted in Lake Mead near Hoover Dam.3 Invasion of freshwater mussels have become a huge
economic burden to hydropower plants, water purification plants, heat exchangers, and industrial
complexes located in mussel infested areas costing an estimated US$500 million or more per year.4
Considering the environmental aspects, the invasion of zebra and quagga mussels have posed concerns
for balance of biodiversity in freshwater ecosystems. Studies have shown a severe decline in population
density of some native freshwater bivalve species. A sudden drop of 65-100% of the Great Lakes’ native
bivalve population density were reported in the period from 1992 to 1999.5 For some native species, the
Introduction of mussels have led to exploitative competition for food. For others, mussel fouling
(overgrowth) on their shells have led to shorten life span.5, 6 Lately, mussels have spread down to the
west affecting hydropower generation. Given the relatively warm temperatures of the water in southwest
170
regions, mussels are being able to reproduce at faster rates compared to those in the Northern American
region.3 It is known that female mussels that have reached sexual maturity may produce 30000-40000
larvae during the reproductive season.2 Mussels attach to surfaces by first using the byssus foot and later
producing byssus threads that ends with a pad which they glue to the surface. Mussels can reposition
themselves by dislodging the byssus and reattach using a new one.2, 7 For low surface energy materials,
the pad on the end of byssus thread may cover a relatively larger surface area.7 However, given a choice
they prefer not to settle on low energy surfaces.2, 7 Also a mussel’s ability to survive out of water for
extended periods of time makes it difficult to control their rapid spreading through transportation of
recreational boats.4, 8
The United States Bureau of Reclamation is the largest supplier of water and hydropower in 17
western states. They manage 476 dams, provide water to approximately 31 million people, and contribute
to 17% of the hydropower generated in the United States.3 Therefore the United States Bureau of
Reclamation is responsible for managing, developing, and protecting water resources in an economical
manner with the least impact on the environment in the best interest of the American public. The Bureau
is facing difficulties in maintaining reservoir structures due to the uncontrollable growth of Zebra and
Quagga mussels.3 The mussels grow rapidly on structures that are submerged in water blocking water
supply and transportation. In some cases attachment of mussels have completely clogged small diameter
pipes and greatly reduced the flow rate of large diameter pipes. This negatively affects the efficiency of
hydropower generation and created a huge economic and environmental impact. The Bureau of
Reclamation has conducted a detailed study evaluating potential coating solutions for this problem.
Summarizing a 3 year study they have found that fouling release coatings outperformed many other
contenders during field immersion trials under both static and dynamic conditions.3 However the silicone
based fouling release coatings were eventually fouled by algae and bryozoans which may act as
locations for mussel attachment.3
Given the service environment of the reservoir structures, the Bureau of Reclamation sought for
certain requirements for coating solutions to mitigate mussel fouling. These requirements include
mechanical durability, long term chemical stability, and consistent performance under highly variable
water quality (sediment, debris, ice etc.). Thus siloxane-polyurethane (SiPU) fouling release coatings
171
developed at NDSU appeared as viable candidates for fresh water fouling applications. The SiPU
coatings based on the concept of self-stratification are able to combine the mechanical durability of
polyurethane and the FR properties of silicone.9, 10 Siloxane and polyurethane are incompatible with each
other, once the coating is applied, siloxane self-stratifies to the surface while the polyurethane bulk
provide toughness and excellent adhesion to the primed substrate. These coatings have shown similar
FR properties to silicone elastomer based commercial FR coatings when evaluated through laboratory
biological assays for a variety of marine organisms and in field immersion trials.11, 12 However the FR
performance of SiPU coatings have never been evaluated in freshwater environments. Therefore, select
formulations from previous studies were sent to the Bureau of Reclamation upon their request for
freshwater field immersion trials. Four SiPU coating compositions with slight variation in siloxane and
solvent content were prepared. Panels were shipped to the Bureau in Denver and then deployed at a field
test site in Parker Dam, California. Duplicate coatings were evaluated using laboratory barnacle
(Amphibalanus amphitrite) and marine mussel (Geukensia demissa) assays at NDSU. Coating surfaces
were characterized using contact angle, surface, and X-ray photoelectron spectroscopy (XPS) to
understand the surface morphology.
Experimental
Materials
Polyisocyanate Desmodur Z 4470 BA was provided by Covestro LLC. Acetylacetone, Ethyl-3-
ethoxy propionate (EEP), toluene, methyl amyl ketone (MAK) and dibutyltin diacetate (DBTDAc) were
purchased from Sigma Aldrich. All reagents were used as received. A catalyst solution was prepared by
diluting DBTDAc in MAK (1% by wt.). An acrylic polyol containing 80% butyl acrylate (BA) and 20% 2-
hydroxyethyl acrylate (HEA) synthesized through free radical polymerization was used. The detailed
synthesis of the acrylic polyol was reported previously.13 An aminopropyl terminated
poly(dimethylsiloxane) (APT-PDMS) of 20,000 g/mol molecular weight was synthesized by ring opening
equilibration reaction was used as the siloxane resin. Detailed method of synthesis can be found from a
previous study.12 Intersleek® 700 (IS 700), Intersleek® 900 (IS 900), commercial FR coatings and
Intergard 264 marine primer were provided by AkzoNobel International Paint. Silicone elastomer,
Silastic® T2 (T2) was provided by Dow Corning (prepared coatings according to manufacturer’s
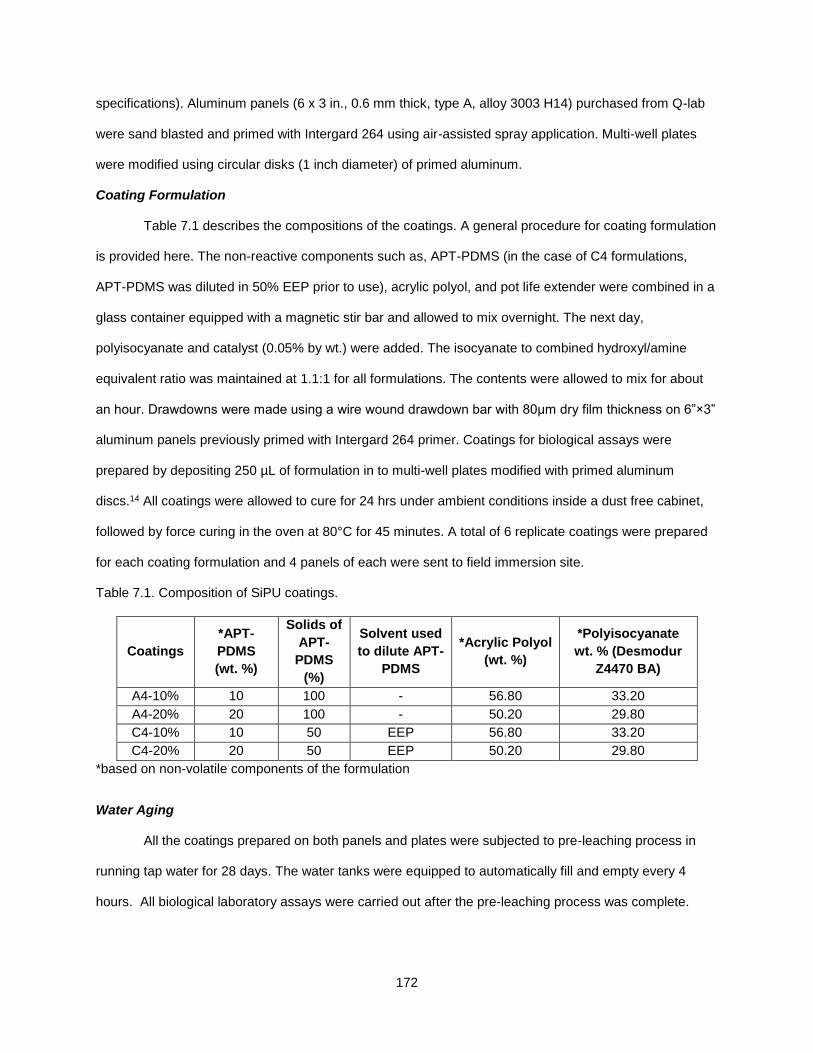
172
specifications). Aluminum panels (6 x 3 in., 0.6 mm thick, type A, alloy 3003 H14) purchased from Q-lab
were sand blasted and primed with Intergard 264 using air-assisted spray application. Multi-well plates
were modified using circular disks (1 inch diameter) of primed aluminum.
Coating Formulation
Table 7.1 describes the compositions of the coatings. A general procedure for coating formulation
is provided here. The non-reactive components such as, APT-PDMS (in the case of C4 formulations,
APT-PDMS was diluted in 50% EEP prior to use), acrylic polyol, and pot life extender were combined in a
glass container equipped with a magnetic stir bar and allowed to mix overnight. The next day,
polyisocyanate and catalyst (0.05% by wt.) were added. The isocyanate to combined hydroxyl/amine
equivalent ratio was maintained at 1.1:1 for all formulations. The contents were allowed to mix for about
an hour. Drawdowns were made using a wire wound drawdown bar with 80µm dry film thickness on 6”×3”
aluminum panels previously primed with Intergard 264 primer. Coatings for biological assays were
prepared by depositing 250 µL of formulation in to multi-well plates modified with primed aluminum
discs.14 All coatings were allowed to cure for 24 hrs under ambient conditions inside a dust free cabinet,
followed by force curing in the oven at 80°C for 45 minutes. A total of 6 replicate coatings were prepared
for each coating formulation and 4 panels of each were sent to field immersion site.
Table 7.1. Composition of SiPU coatings.
Coatings
*APT-
PDMS
(wt. %)
Solids of
APT-
PDMS
(%)
Solvent used
to dilute APT-
PDMS
*Acrylic Polyol
(wt. %)
*Polyisocyanate
wt. % (Desmodur
Z4470 BA)
A4-10% 10 100 - 56.80 33.20
A4-20% 20 100 - 50.20 29.80
C4-10% 10 50 EEP 56.80 33.20
C4-20% 20 50 EEP 50.20 29.80
*based on non-volatile components of the formulation
Water Aging
All the coatings prepared on both panels and plates were subjected to pre-leaching process in
running tap water for 28 days. The water tanks were equipped to automatically fill and empty every 4
hours. All biological laboratory assays were carried out after the pre-leaching process was complete.
173
Surface Characterization of Coatings
Surface wettability of coatings were characterized through analysis of water and methylene iodide
contact angles (WCA and MICA) using the Symyx® surface energy system. Three replicate
measurements of each WCA and MICA were obtained using First Ten AngstromsTM software. Then,
according to Owens-Wendt method, the surface energy for each coating was calculated using the
average WCA and MICA values.15 Contact angle and SE analysis were performed for as made coatings
and 1 month after water immersion. Additionally, contact angle and SE measurements were performed
for A4-10% and A4-20% coatings 1.42 years after withdrawal from the field test.
X-ray photoelectron spectroscopy (XPS) was utilized to investigate the morphology differences in
A4-20% and C4-20% coatings. XPS experiments were conducted using the Thermo ScientificTM K-
AlphaTM XPS equipped with monochromatic Al Kα (1486.68 eV) X-ray source and Ar+ ion source (up to
4000 eV for depth profiling). Prior to conduct depth profiling of SiPU coatings, an etch rate calibration
experiment was performed to determine the appropriate etch rate for silicone elastomer. Dow Corning T2
silicone elastomer was spin coated on a silicon wafer at a speed of 6000 rpm for 35 s using a Laurell WS-
400A-6NPP spin coater. The coated sample was then carefully transferred to a dust free cabinet and
allowed to cure under ambient conditions for 48hrs. Film thickness was determined by removing a thin
strip of coating by laser ablation using the First Optec Micro Master Excimer and measuring step height
from the top of the coating to the wafer substrate using a KLA-Tencor profilometer. The thickness of the
silicone elastomer was determined to be 287.3±25.3 nm. Depth profiling of the silicone elastomer was
performed using a 4000 eV Ar+ source sputtering on a spot of 1 mm2 in 30 s intervals for about 120 min
(until complete penetration into the silicon wafer). Chamber pressure was maintained below 1.5×10⁻⁷ Torr.
Photoemission lines for C 1s, N 1s, O 1s, and Si 2p were collected after each etch for an interval of 5s at
constant analyzer pass energy 151.2 eV, and an energy increment of 0.167 eV. Silicone elastomer etch
rate with Ar+ ion etch power of 4000eV was determined to be 0.0068 nm s-1. Surface morphology of SiPU
coatings A4-20% and C4-20% prepared on aluminum substrates were analyzed through depth profiling
experiment using same settings as above. Ar+ sputtering was performed on a spot of 1 mm2 of each
coating with an etch power of 4000eV in 10s intervals for 25-50 min. Following each etch photoemission
lines for C 1s, N 1s, O 1s, and Si 2p were collected. Atomic concentrations were determined using the
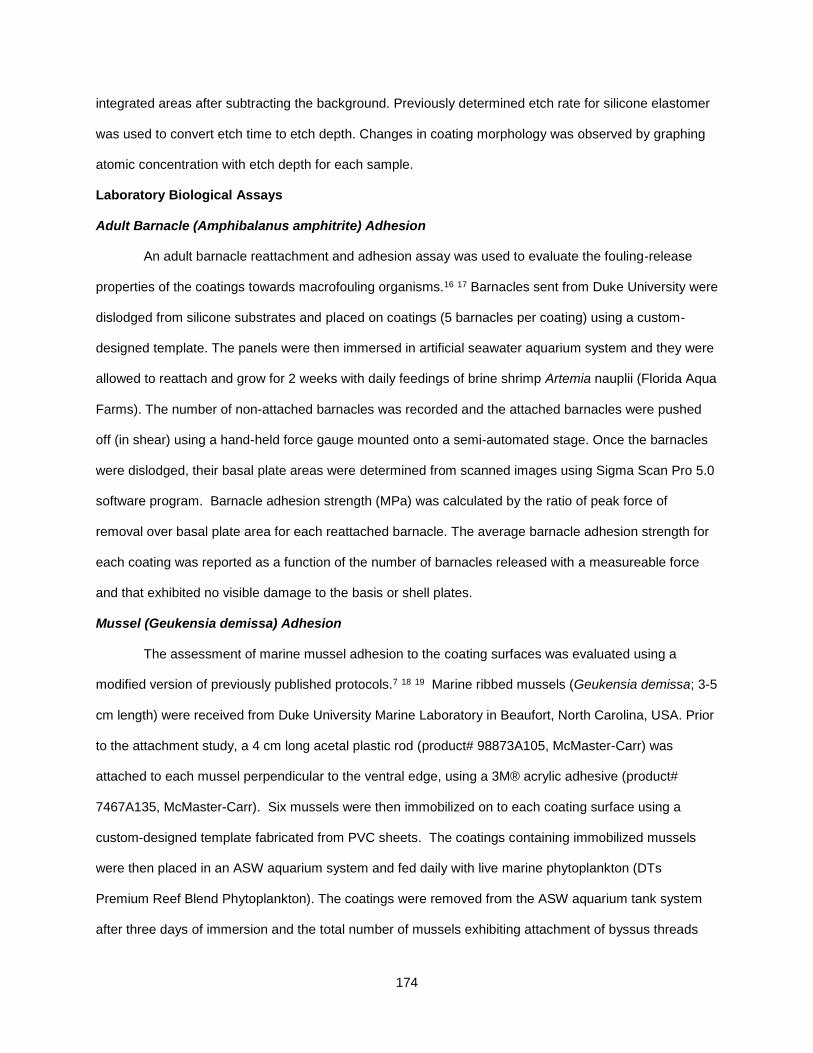
174
integrated areas after subtracting the background. Previously determined etch rate for silicone elastomer
was used to convert etch time to etch depth. Changes in coating morphology was observed by graphing
atomic concentration with etch depth for each sample.
Laboratory Biological Assays
Adult Barnacle (Amphibalanus amphitrite) Adhesion
An adult barnacle reattachment and adhesion assay was used to evaluate the fouling-release
properties of the coatings towards macrofouling organisms.16 17 Barnacles sent from Duke University were
dislodged from silicone substrates and placed on coatings (5 barnacles per coating) using a custom-
designed template. The panels were then immersed in artificial seawater aquarium system and they were
allowed to reattach and grow for 2 weeks with daily feedings of brine shrimp Artemia nauplii (Florida Aqua
Farms). The number of non-attached barnacles was recorded and the attached barnacles were pushed
off (in shear) using a hand-held force gauge mounted onto a semi-automated stage. Once the barnacles
were dislodged, their basal plate areas were determined from scanned images using Sigma Scan Pro 5.0
software program. Barnacle adhesion strength (MPa) was calculated by the ratio of peak force of
removal over basal plate area for each reattached barnacle. The average barnacle adhesion strength for
each coating was reported as a function of the number of barnacles released with a measureable force
and that exhibited no visible damage to the basis or shell plates.
Mussel (Geukensia demissa) Adhesion
The assessment of marine mussel adhesion to the coating surfaces was evaluated using a
modified version of previously published protocols.7 18 19 Marine ribbed mussels (Geukensia demissa; 3-5
cm length) were received from Duke University Marine Laboratory in Beaufort, North Carolina, USA. Prior
to the attachment study, a 4 cm long acetal plastic rod (product# 98873A105, McMaster-Carr) was
attached to each mussel perpendicular to the ventral edge, using a 3M® acrylic adhesive (product#
7467A135, McMaster-Carr). Six mussels were then immobilized on to each coating surface using a
custom-designed template fabricated from PVC sheets. The coatings containing immobilized mussels
were then placed in an ASW aquarium system and fed daily with live marine phytoplankton (DTs
Premium Reef Blend Phytoplankton). The coatings were removed from the ASW aquarium tank system
after three days of immersion and the total number of mussels exhibiting attachment of byssus threads
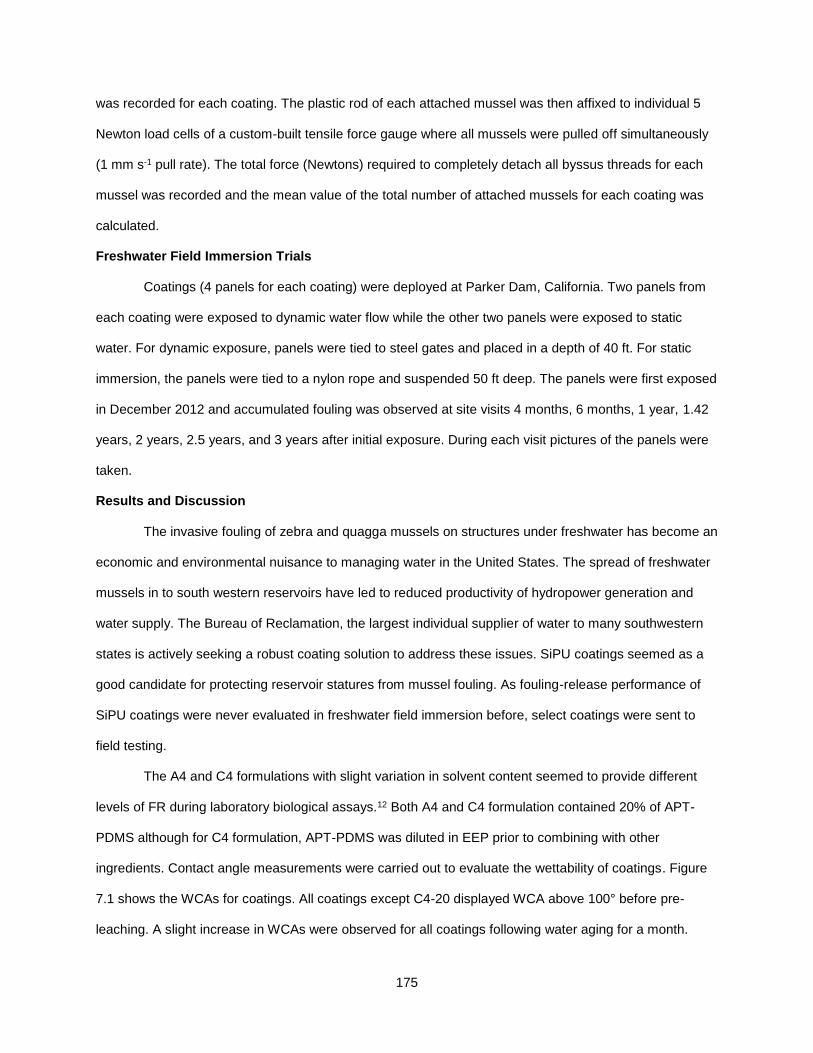
175
was recorded for each coating. The plastic rod of each attached mussel was then affixed to individual 5
Newton load cells of a custom-built tensile force gauge where all mussels were pulled off simultaneously
(1 mm s-1 pull rate). The total force (Newtons) required to completely detach all byssus threads for each
mussel was recorded and the mean value of the total number of attached mussels for each coating was
calculated.
Freshwater Field Immersion Trials
Coatings (4 panels for each coating) were deployed at Parker Dam, California. Two panels from
each coating were exposed to dynamic water flow while the other two panels were exposed to static
water. For dynamic exposure, panels were tied to steel gates and placed in a depth of 40 ft. For static
immersion, the panels were tied to a nylon rope and suspended 50 ft deep. The panels were first exposed
in December 2012 and accumulated fouling was observed at site visits 4 months, 6 months, 1 year, 1.42
years, 2 years, 2.5 years, and 3 years after initial exposure. During each visit pictures of the panels were
taken.
Results and Discussion
The invasive fouling of zebra and quagga mussels on structures under freshwater has become an
economic and environmental nuisance to managing water in the United States. The spread of freshwater
mussels in to south western reservoirs have led to reduced productivity of hydropower generation and
water supply. The Bureau of Reclamation, the largest individual supplier of water to many southwestern
states is actively seeking a robust coating solution to address these issues. SiPU coatings seemed as a
good candidate for protecting reservoir statures from mussel fouling. As fouling-release performance of
SiPU coatings were never evaluated in freshwater field immersion before, select coatings were sent to
field testing.
The A4 and C4 formulations with slight variation in solvent content seemed to provide different
levels of FR during laboratory biological assays.12 Both A4 and C4 formulation contained 20% of APT-
PDMS although for C4 formulation, APT-PDMS was diluted in EEP prior to combining with other
ingredients. Contact angle measurements were carried out to evaluate the wettability of coatings. Figure
7.1 shows the WCAs for coatings. All coatings except C4-20 displayed WCA above 100° before pre-
leaching. A slight increase in WCAs were observed for all coatings following water aging for a month.
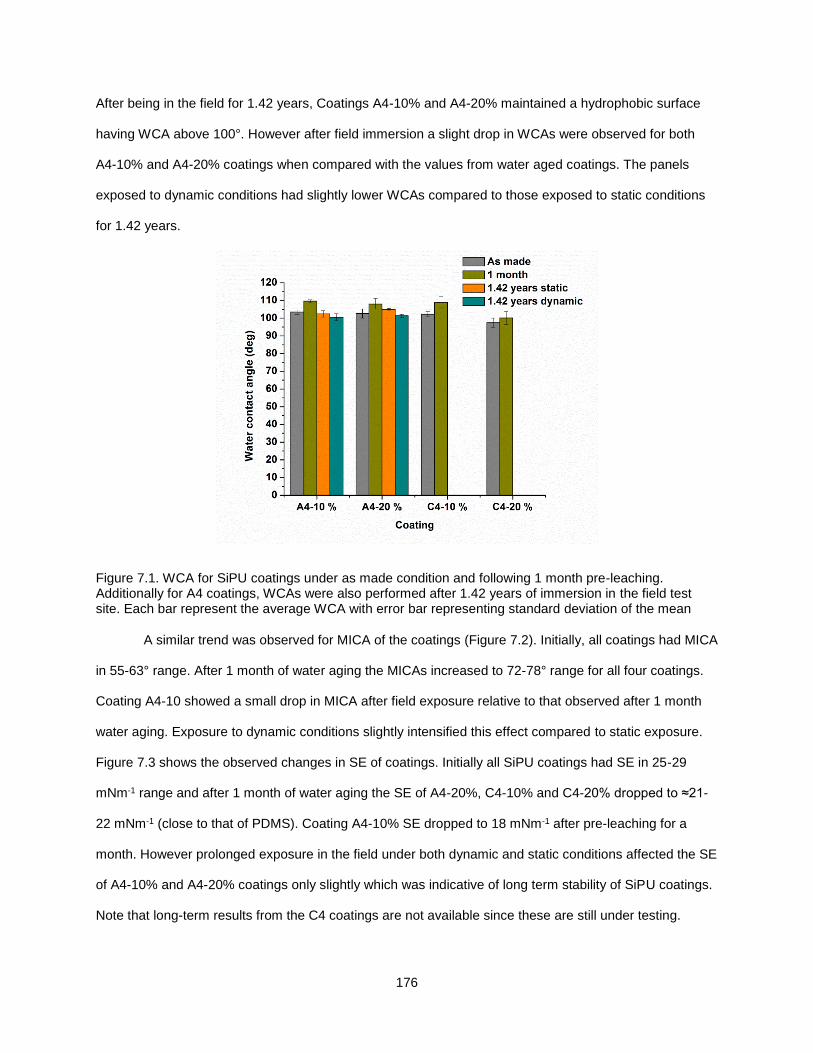
176
After being in the field for 1.42 years, Coatings A4-10% and A4-20% maintained a hydrophobic surface
having WCA above 100°. However after field immersion a slight drop in WCAs were observed for both
A4-10% and A4-20% coatings when compared with the values from water aged coatings. The panels
exposed to dynamic conditions had slightly lower WCAs compared to those exposed to static conditions
for 1.42 years.
Figure 7.1. WCA for SiPU coatings under as made condition and following 1 month pre-leaching. Additionally for A4 coatings, WCAs were also performed after 1.42 years of immersion in the field test site. Each bar represent the average WCA with error bar representing standard deviation of the mean
A similar trend was observed for MICA of the coatings (Figure 7.2). Initially, all coatings had MICA
in 55-63° range. After 1 month of water aging the MICAs increased to 72-78° range for all four coatings.
Coating A4-10 showed a small drop in MICA after field exposure relative to that observed after 1 month
water aging. Exposure to dynamic conditions slightly intensified this effect compared to static exposure.
Figure 7.3 shows the observed changes in SE of coatings. Initially all SiPU coatings had SE in 25-29
mNm-1 range and after 1 month of water aging the SE of A4-20%, C4-10% and C4-20% dropped to ≈21-
22 mNm-1 (close to that of PDMS). Coating A4-10% SE dropped to 18 mNm-1 after pre-leaching for a
month. However prolonged exposure in the field under both dynamic and static conditions affected the SE
of A4-10% and A4-20% coatings only slightly which was indicative of long term stability of SiPU coatings.
Note that long-term results from the C4 coatings are not available since these are still under testing.
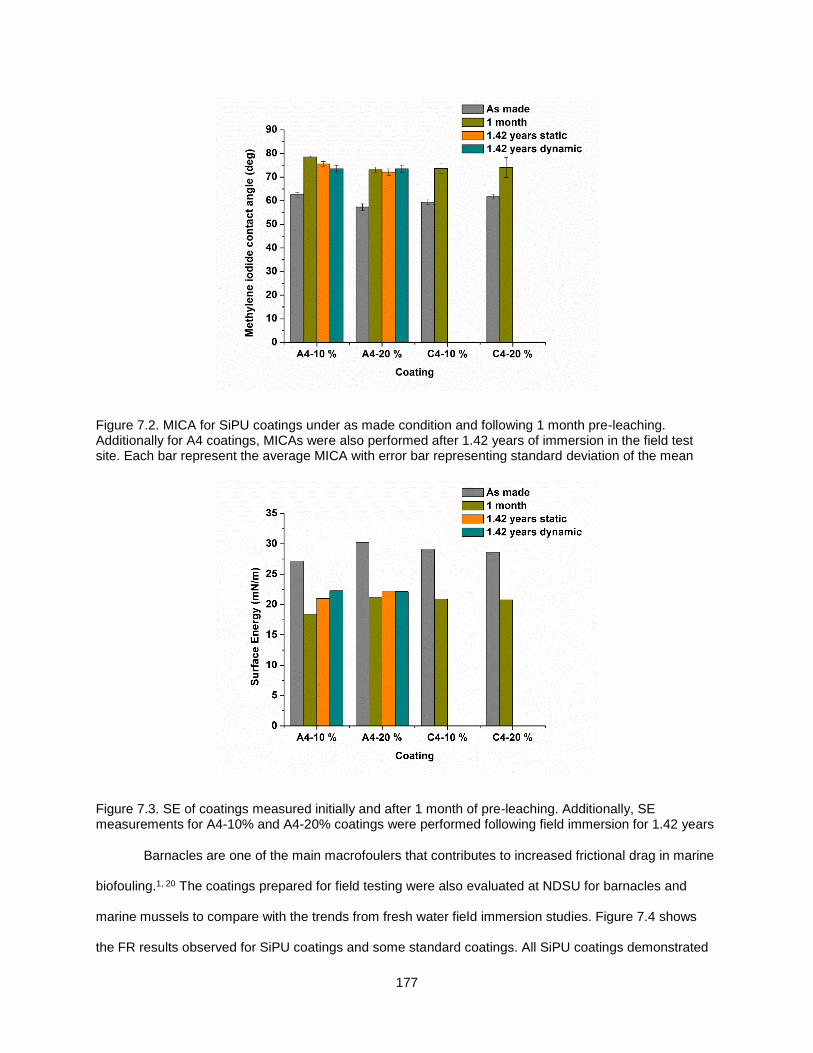
177
Figure 7.2. MICA for SiPU coatings under as made condition and following 1 month pre-leaching. Additionally for A4 coatings, MICAs were also performed after 1.42 years of immersion in the field test site. Each bar represent the average MICA with error bar representing standard deviation of the mean
Figure 7.3. SE of coatings measured initially and after 1 month of pre-leaching. Additionally, SE measurements for A4-10% and A4-20% coatings were performed following field immersion for 1.42 years
Barnacles are one of the main macrofoulers that contributes to increased frictional drag in marine
biofouling.1, 20 The coatings prepared for field testing were also evaluated at NDSU for barnacles and
marine mussels to compare with the trends from fresh water field immersion studies. Figure 7.4 shows
the FR results observed for SiPU coatings and some standard coatings. All SiPU coatings demonstrated
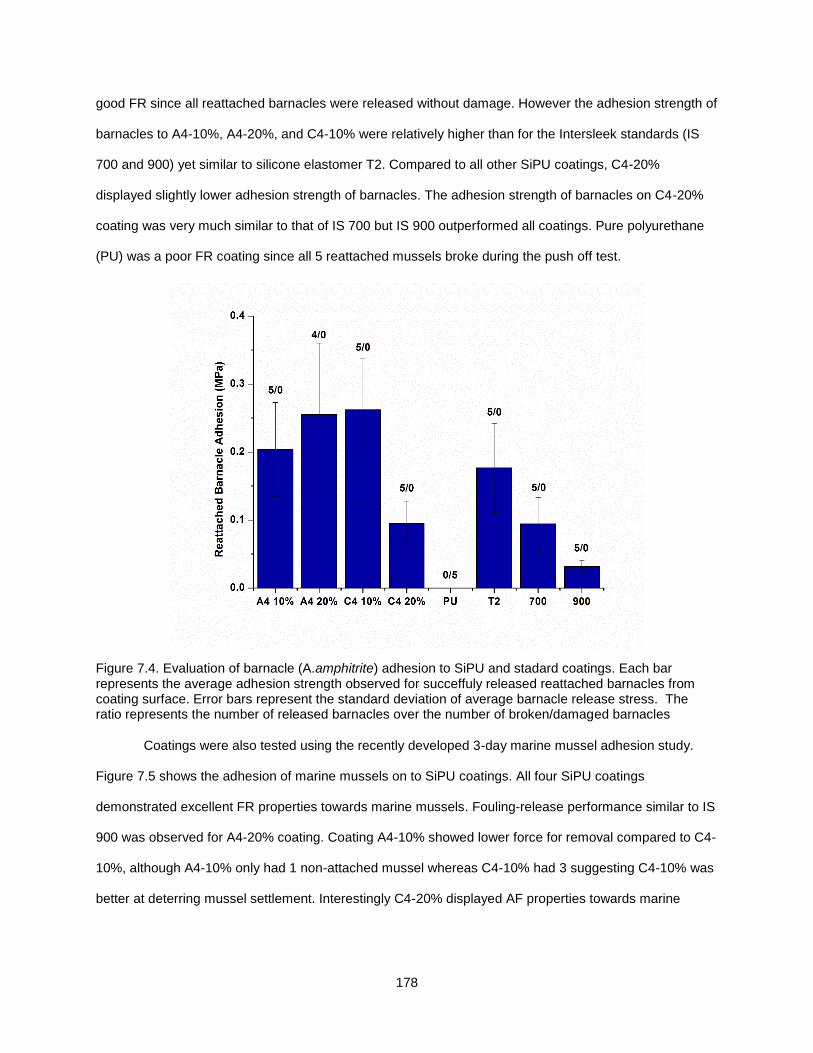
178
good FR since all reattached barnacles were released without damage. However the adhesion strength of
barnacles to A4-10%, A4-20%, and C4-10% were relatively higher than for the Intersleek standards (IS
700 and 900) yet similar to silicone elastomer T2. Compared to all other SiPU coatings, C4-20%
displayed slightly lower adhesion strength of barnacles. The adhesion strength of barnacles on C4-20%
coating was very much similar to that of IS 700 but IS 900 outperformed all coatings. Pure polyurethane
(PU) was a poor FR coating since all 5 reattached mussels broke during the push off test.
Figure 7.4. Evaluation of barnacle (A.amphitrite) adhesion to SiPU and stadard coatings. Each bar represents the average adhesion strength observed for succeffuly released reattached barnacles from coating surface. Error bars represent the standard deviation of average barnacle release stress. The ratio represents the number of released barnacles over the number of broken/damaged barnacles
Coatings were also tested using the recently developed 3-day marine mussel adhesion study.
Figure 7.5 shows the adhesion of marine mussels on to SiPU coatings. All four SiPU coatings
demonstrated excellent FR properties towards marine mussels. Fouling-release performance similar to IS
900 was observed for A4-20% coating. Coating A4-10% showed lower force for removal compared to C4-
10%, although A4-10% only had 1 non-attached mussel whereas C4-10% had 3 suggesting C4-10% was
better at deterring mussel settlement. Interestingly C4-20% displayed AF properties towards marine
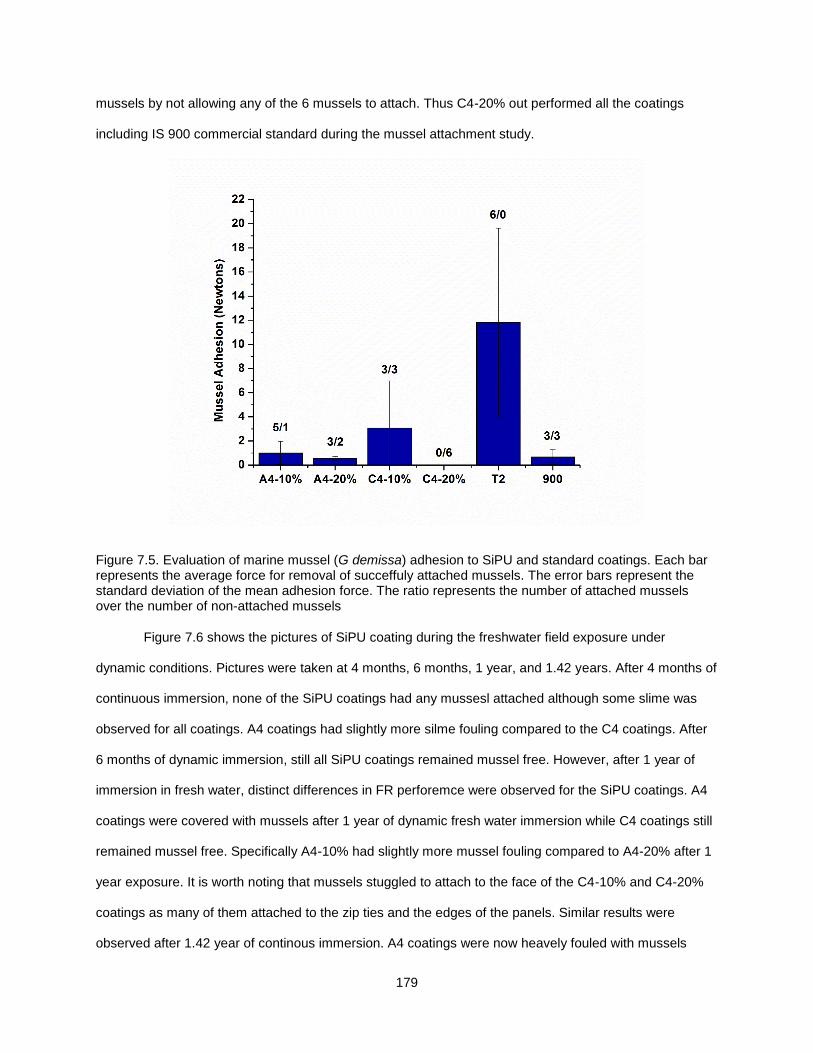
179
mussels by not allowing any of the 6 mussels to attach. Thus C4-20% out performed all the coatings
including IS 900 commercial standard during the mussel attachment study.
Figure 7.5. Evaluation of marine mussel (G demissa) adhesion to SiPU and standard coatings. Each bar represents the average force for removal of succeffuly attached mussels. The error bars represent the standard deviation of the mean adhesion force. The ratio represents the number of attached mussels over the number of non-attached mussels
Figure 7.6 shows the pictures of SiPU coating during the freshwater field exposure under
dynamic conditions. Pictures were taken at 4 months, 6 months, 1 year, and 1.42 years. After 4 months of
continuous immersion, none of the SiPU coatings had any mussesl attached although some slime was
observed for all coatings. A4 coatings had slightly more silme fouling compared to the C4 coatings. After
6 months of dynamic immersion, still all SiPU coatings remained mussel free. However, after 1 year of
immersion in fresh water, distinct differences in FR perforemce were observed for the SiPU coatings. A4
coatings were covered with mussels after 1 year of dynamic fresh water immersion while C4 coatings still
remained mussel free. Specifically A4-10% had slightly more mussel fouling compared to A4-20% after 1
year exposure. It is worth noting that mussels stuggled to attach to the face of the C4-10% and C4-20%
coatings as many of them attached to the zip ties and the edges of the panels. Similar results were
observed after 1.42 year of continous immersion. A4 coatings were now heavely fouled with mussels
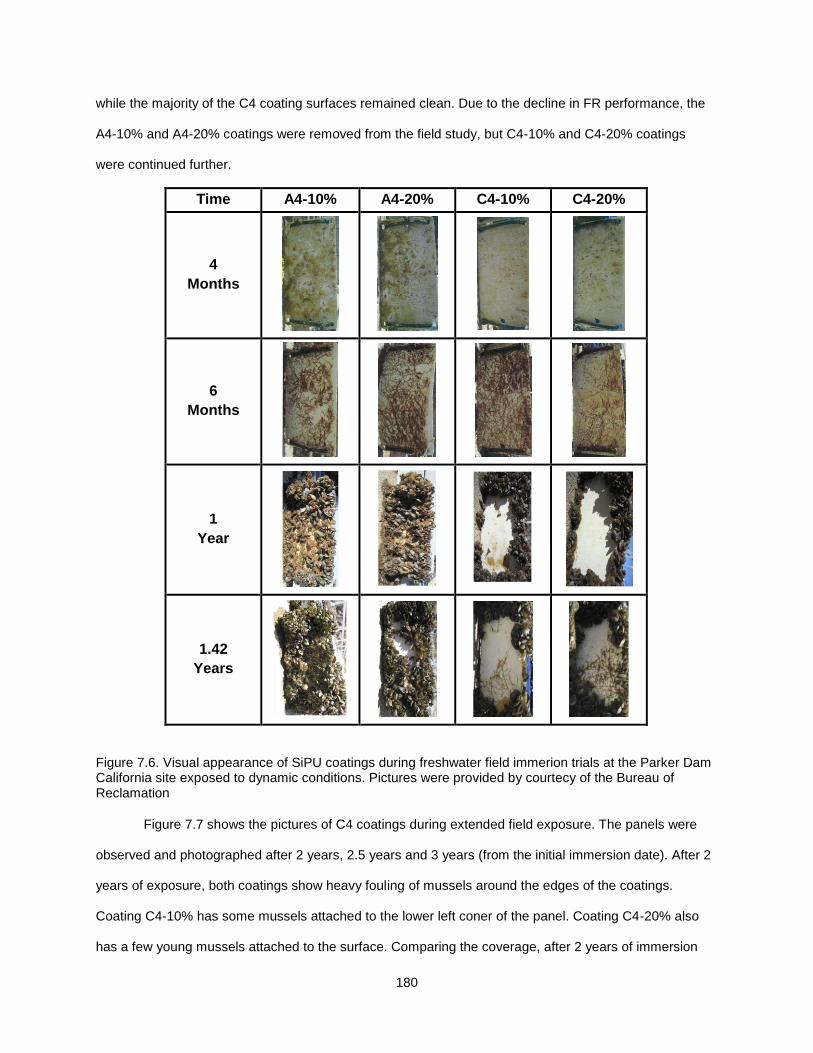
180
while the majority of the C4 coating surfaces remained clean. Due to the decline in FR performance, the
A4-10% and A4-20% coatings were removed from the field study, but C4-10% and C4-20% coatings
were continued further.
Figure 7.6. Visual appearance of SiPU coatings during freshwater field immerion trials at the Parker Dam California site exposed to dynamic conditions. Pictures were provided by courtecy of the Bureau of Reclamation
Figure 7.7 shows the pictures of C4 coatings during extended field exposure. The panels were
observed and photographed after 2 years, 2.5 years and 3 years (from the initial immersion date). After 2
years of exposure, both coatings show heavy fouling of mussels around the edges of the coatings.
Coating C4-10% has some mussels attached to the lower left coner of the panel. Coating C4-20% also
has a few young mussels attached to the surface. Comparing the coverage, after 2 years of immersion
Time A4-10% A4-20% C4-10% C4-20%
4
Months
6
Months
1
Year
1.42
Years
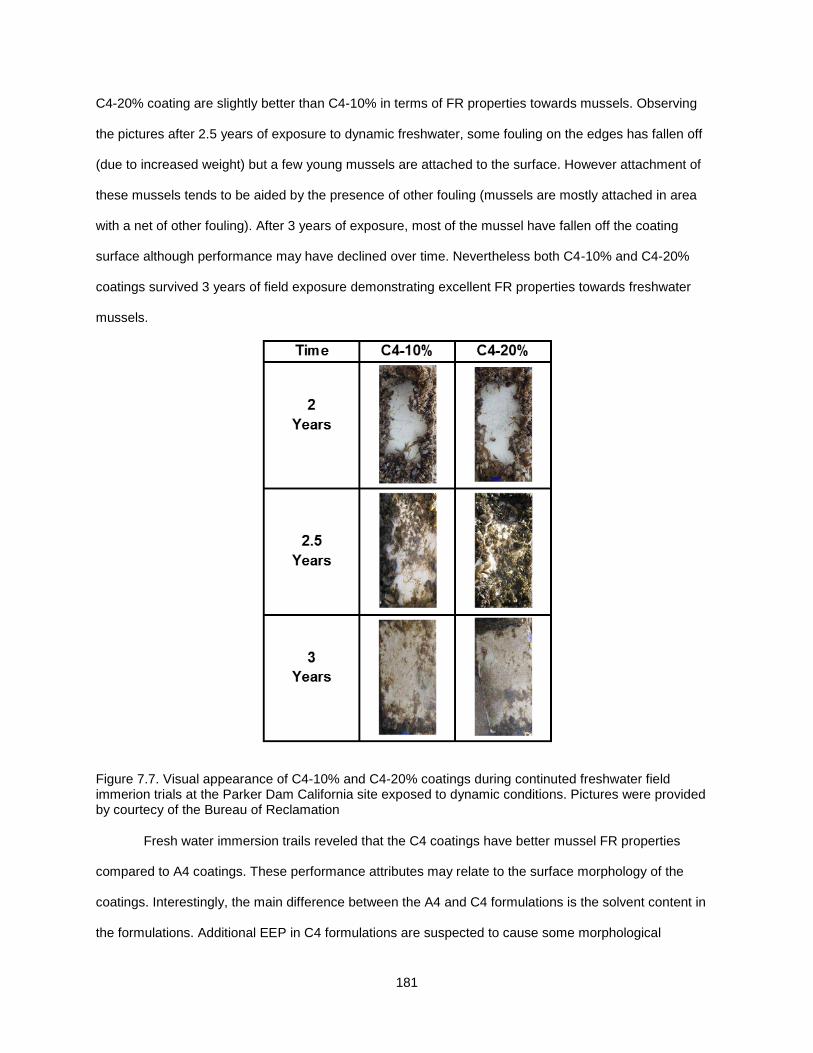
181
C4-20% coating are slightly better than C4-10% in terms of FR properties towards mussels. Observing
the pictures after 2.5 years of exposure to dynamic freshwater, some fouling on the edges has fallen off
(due to increased weight) but a few young mussels are attached to the surface. However attachment of
these mussels tends to be aided by the presence of other fouling (mussels are mostly attached in area
with a net of other fouling). After 3 years of exposure, most of the mussel have fallen off the coating
surface although performance may have declined over time. Nevertheless both C4-10% and C4-20%
coatings survived 3 years of field exposure demonstrating excellent FR properties towards freshwater
mussels.
Figure 7.7. Visual appearance of C4-10% and C4-20% coatings during continuted freshwater field immerion trials at the Parker Dam California site exposed to dynamic conditions. Pictures were provided by courtecy of the Bureau of Reclamation
Fresh water immersion trails reveled that the C4 coatings have better mussel FR properties
compared to A4 coatings. These performance attributes may relate to the surface morphology of the
coatings. Interestingly, the main difference between the A4 and C4 formulations is the solvent content in
the formulations. Additional EEP in C4 formulations are suspected to cause some morphological
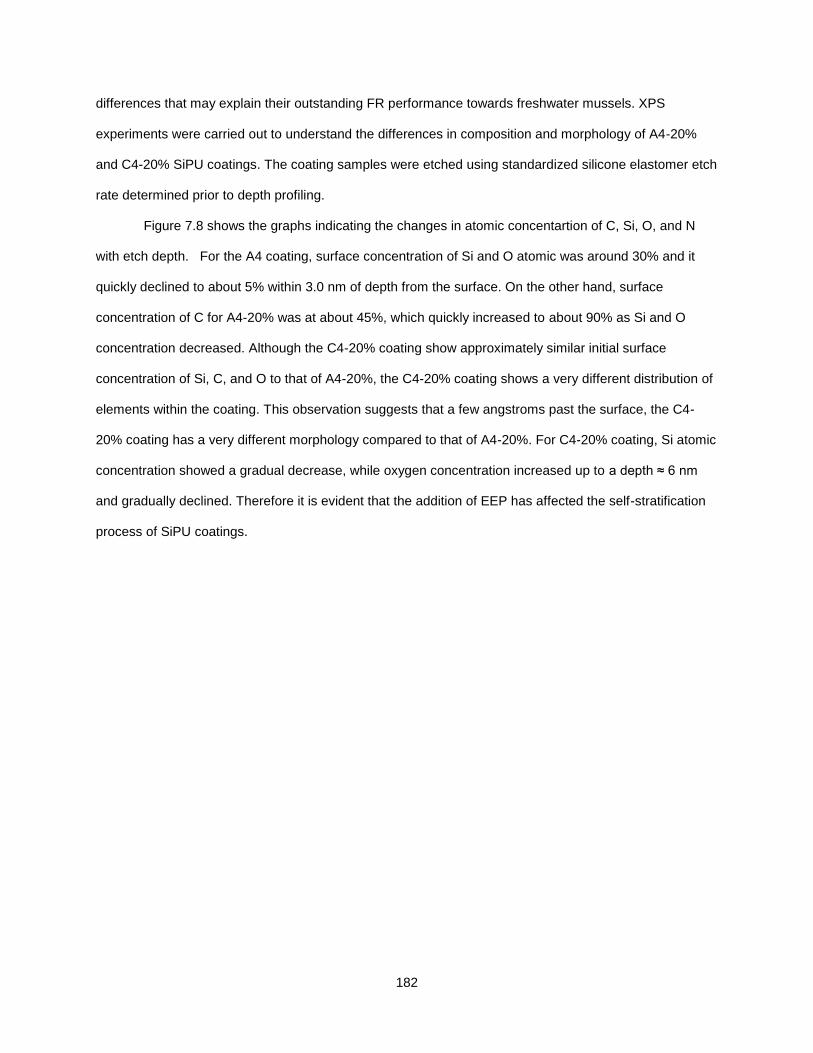
182
differences that may explain their outstanding FR performance towards freshwater mussels. XPS
experiments were carried out to understand the differences in composition and morphology of A4-20%
and C4-20% SiPU coatings. The coating samples were etched using standardized silicone elastomer etch
rate determined prior to depth profiling.
Figure 7.8 shows the graphs indicating the changes in atomic concentartion of C, Si, O, and N
with etch depth. For the A4 coating, surface concentration of Si and O atomic was around 30% and it
quickly declined to about 5% within 3.0 nm of depth from the surface. On the other hand, surface
concentration of C for A4-20% was at about 45%, which quickly increased to about 90% as Si and O
concentration decreased. Although the C4-20% coating show approximately similar initial surface
concentration of Si, C, and O to that of A4-20%, the C4-20% coating shows a very different distribution of
elements within the coating. This observation suggests that a few angstroms past the surface, the C4-
20% coating has a very different morphology compared to that of A4-20%. For C4-20% coating, Si atomic
concentration showed a gradual decrease, while oxygen concentration increased up to a depth ≈ 6 nm
and gradually declined. Therefore it is evident that the addition of EEP has affected the self-stratification
process of SiPU coatings.
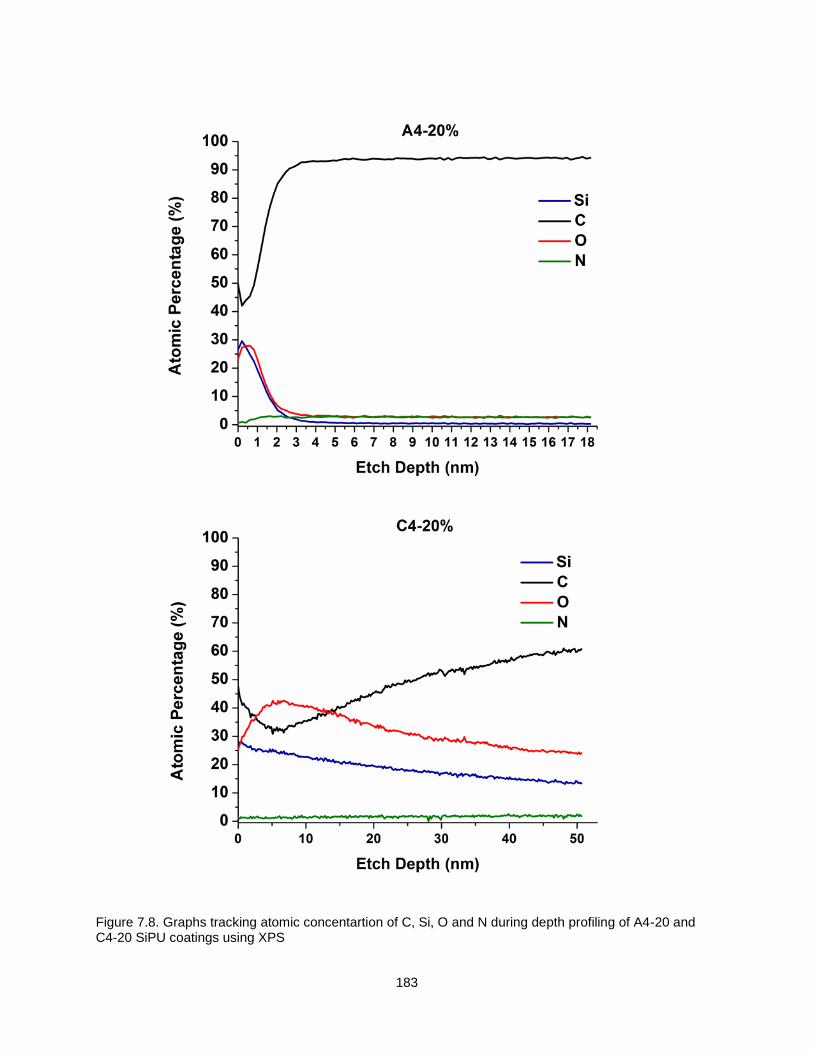
183
Figure 7.8. Graphs tracking atomic concentartion of C, Si, O and N during depth profiling of A4-20 and C4-20 SiPU coatings using XPS
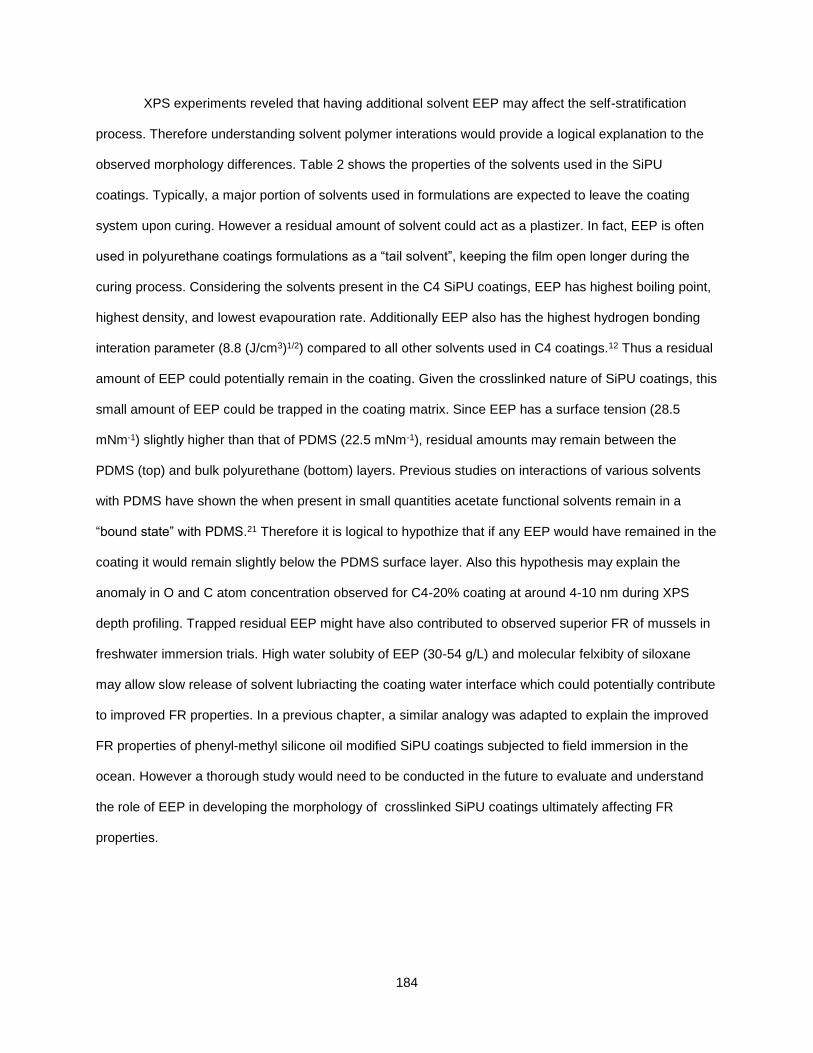
184
XPS experiments reveled that having additional solvent EEP may affect the self-stratification
process. Therefore understanding solvent polymer interations would provide a logical explanation to the
observed morphology differences. Table 2 shows the properties of the solvents used in the SiPU
coatings. Typically, a major portion of solvents used in formulations are expected to leave the coating
system upon curing. However a residual amount of solvent could act as a plastizer. In fact, EEP is often
used in polyurethane coatings formulations as a “tail solvent”, keeping the film open longer during the
curing process. Considering the solvents present in the C4 SiPU coatings, EEP has highest boiling point,
highest density, and lowest evapouration rate. Additionally EEP also has the highest hydrogen bonding
interation parameter (8.8 (J/cm3)1/2) compared to all other solvents used in C4 coatings.12 Thus a residual
amount of EEP could potentially remain in the coating. Given the crosslinked nature of SiPU coatings, this
small amount of EEP could be trapped in the coating matrix. Since EEP has a surface tension (28.5
mNm-1) slightly higher than that of PDMS (22.5 mNm-1), residual amounts may remain between the
PDMS (top) and bulk polyurethane (bottom) layers. Previous studies on interactions of various solvents
with PDMS have shown the when present in small quantities acetate functional solvents remain in a
“bound state” with PDMS.21 Therefore it is logical to hypothize that if any EEP would have remained in the
coating it would remain slightly below the PDMS surface layer. Also this hypothesis may explain the
anomaly in O and C atom concentration observed for C4-20% coating at around 4-10 nm during XPS
depth profiling. Trapped residual EEP might have also contributed to observed superior FR of mussels in
freshwater immersion trials. High water solubity of EEP (30-54 g/L) and molecular felxibity of siloxane
may allow slow release of solvent lubriacting the coating water interface which could potentially contribute
to improved FR properties. In a previous chapter, a similar analogy was adapted to explain the improved
FR properties of phenyl-methyl silicone oil modified SiPU coatings subjected to field immersion in the
ocean. However a thorough study would need to be conducted in the future to evaluate and understand
the role of EEP in developing the morphology of crosslinked SiPU coatings ultimately affecting FR
properties.
185
Table 7.2. Physical properties of solvents used in SiPU coatings
Solvent Boiling
Point
(°C)
Density
(g/mL)
Surface
Tension
(mNm-1)
Water
Solubility (g/L
of water)
Evaporation
Rate (Butyl
Acetate =1)
H-bonding
parameter
(J/cm3)1/2
EEP 169.7 0.951 28.1 30.0-54.1 0.12 8.8
Toluene 110.6 0.867 28.5 0.52 1.50 2.0
Butyl Acetate 126.0 0.882 25.3 6.8 1.00 6.3
2-Heptanone 151.0 0.800 24.9 4.3 0.40 4.1
Freshwater FR performance of SiPU coatings were evaluated mainly targeting to mitigate zebra
and quagga mussel fouling. SiPU coatings maintained hydrophobic surface charcateristics after water
immerion. Coatings showed excellent FR properties towards marine mussels (G. demissa) in laboratory
assays. A4 coatings maintained FR proeprties towards freshwater mussels for more than 6 months while
C4 coatings performed efficiently upto 2.5-3.0 years. Surface analysis of SiPU catings reveled that
additional solvent EEP may affect the morphology of the coatings.
Conclusions
Select SiPU formulations were included in a freshwater field immersion study in collaboration with
the United States Bureau of Reclamation. Four coatings formulations evaluated at a field test site in Parker
Dam California beginning in December 2012. Results from the dynamic freshwater immersion revealed that
the C4 SiPU coatings were far superior in mitigating mussel fouling in fresh water compared to the A4 SiPU
coatings. Coatings C4-10% and C4-20% coatings remained mussel free up to 2-3 years while A4-10% and
A4-20% declined in FR performance after a year in the field. Also C4-20% coating demonstrated the best
AF properties towards marine mussels during a laboratory biological assay test and in agreement with
results observed in the fresh water field testing. Surface analysis experiments were conducted using XPS
to understand the variations in coating morphology to possibly explain the observed FR performance
differences. A4-20% and C4-20 coatings had different morphologies which may be attributed to additional
solvent EEP used to formulate C4 coatings. Also, contact angle and SE measurements suggested that
SiPU coatings maintain a fairly hydrophobic surface even after prolonged exposure in the field. On another
note, all SiPU coatings maintained their mechanical integrity throughout field testing which make them
viable candidates for durable FR applications. This study also opened up a new area of application for SiPU
coatings.
186
References
1. Schultz, M. P.; Bendick, J. A.; Holm, E. R.; Hertel, W. M., Economic Impact of Biofouling on A Naval Surface Ship. Biofouling 2010, 27 (1), 87-98.
2. Callow, M. E., A Review of Fouling in Freshwaters. Biofouling 1993, 7 (4), 313-327.
3. Skaja, A. D.; Tordonato, D. S.; Merten, B. J. Coatings for Mussel Control — Three Years of Laboratory and Field Testing; Denver, CO, 2012.
4. Hoddle, M. Quagga & Zebra Mussels. http://cisr.ucr.edu/quagga_zebra_mussels.html (accessed August, 2nd).
5. Strayer, D. L.; Malcom, H. M., Effects of Zebra Mussels (Dreissena Polymorpha) on Native Bivalves: the Beginning of the End or the End of the Beginning? Journal of the North American Benthological Society 2007, 26 (1), 111-122.
6. Jokela, A.; Ricciardi, A., Predicting Zebra Mussel Fouling on Native Mussels from Physicochemical Variables. Freshwater Biology 2008, 53 (9), 1845-1856.
7. Emily, C. B.; John, M. G., Strategies for Life in Flow: Tenacity, Morphometry, and Probability of Dislodgment of Two Mytilus Species. Marine Ecology Progress Series 1997, 159, 197-208.
8. De Ventura, L.; Weissert, N.; Tobias, R.; Kopp, K.; Jokela, J., Overland Transport of Recreational Boats as a Spreading Vector of Zebra Mussel Dreissena Polymorpha. Biological Invasions 2016, 18 (5), 1451-1466.
9. Ekin, A.; Webster, D. C.; Daniels, J. W.; Stafslien, S. J.; Cassé, F.; Callow, J. A.; Callow, M. E., Synthesis, Formulation, and Characterization of Siloxane–Polyurethane Coatings for Underwater Marine Applications using Combinatorial High-throughput Experimentation. Journal of Coatings Technology Research 2007, 4 (4), 435-451.
10. Webster, D. C.; Pieper, R. J.; Ekin, A. Thermoset Siloxane-Urethane Fouling Release Coatings. US 7,989,074 B2, 2011.
11. Sommer, S.; Ekin, A.; Webster, D. C.; Stafslien, S. J.; Daniels, J.; VanderWal, L. J.; Thompson, S. E. M.; Callow, M. E.; Callow, J. A., A Preliminary Study on the Properties and Fouling-Release Performance of Siloxane-Polyurethane Coatings Prepared from PDMS Macromers. Biofouling 2010, 26 (8), 961-972.
12. Bodkhe, R. B.; Thompson, S. E. M.; Yehle, C.; Cilz, N.; Daniels, J.; Stafslien, S. J.; Callow, M. E.; Callow, J. A.; Webster, D. C., The Effect of Formulation Variables on Fouling-release Performance of Stratified Siloxane-Polyurethane Coatings. Journal of Coatings Technology Research 2012, 9 (3), 235-249.
13. Pieper, R. J.; Ekin, A.; Webster, D. C.; Casse, F.; Callow, J. A.; Callow, M. E., A Combinatorial Approach to Study the Effect of Acrylic Polyol Composition on the Properties of Crosslinked Siloxane-Polyurethane Fouling-release Coatings. Journal of Coatings Technology Research 2007, 4 (4), 453-461.
14. Stafslien, S. J.; Bahr, J. A.; Feser, J. M.; Weisz, J. C.; Chisholm, B. J.; Ready, T. E.; Boudjouk, P., Combinatorial Materials Research Applied to the Development of New Surface Coatings I: A Multiwell Plate Screening Method for the High-Throughput Assessment of Bacterial Biofilm Retention on Surfaces. Journal of Combinatorial Chemistry 2006, 8 (2), 156-162.
187
15. Owens, D. K.; Wendt, R. C., Estimation of the Surface Free Energy of Polymers. Journal of Applied Polymer Science 1969, 13 (8), 1741-1747.
16. Stafslien, S.; Daniels, J.; Bahr, J.; Chisholm, B.; Ekin, A.; Webster, D.; Orihuela, B.; Rittschof, D., An Improved Laboratory Reattachment Method for the Rapid Assessment of Adult Barnacle Adhesion Strength to Fouling-release Marine Coatings. Journal of Coatings Technology and Research 2012, 9 (6), 651-665.
17. Rittschof, D.; Orihuela, B.; Stafslien, S.; Daniels, J.; Christianson, D.; Chisholm, B.; Holm, E., Barnacle Reattachment: A Tool for Studying Barnacle Adhesion. Biofouling 2008, 24 (1), 1-9.
18. Burkett, J. R.; Wojtas, J. L.; Cloud, J. L.; Wilker, J. J., A Method for Measuring the Adhesion Strength of Marine Mussels. The Journal of Adhesion 2009, 85 (9), 601-615.
19. Crisp, D. J.; Walker, G.; Young, G. A.; Yule, A. B., Adhesion and Substrate Choice in Mussels and Barnacles. Journal of Colloid and Interface Science 1985, 104 (1), 40-50.
20. Schultz, M. P., Effects of Coating Roughness and Biofouling on Ship Resistance and Powering. Biofouling 2007, 23 (5), 331-341.
21. Yang, H.; Nguyen, Q. T.; Ding, Y.; Long, Y.; Ping, Z., Investigation of Poly(dimethyl siloxane) (PDMS)–solvent Interactions by DSC. Journal of Membrane Science 2000, 164 (1–2), 37-43.
188
CHAPTER 8. OVERALL CONCLUSIONS AND FUTURE WORK
Several approaches were explored to optimize the surface properties of siloxane-polyurethane
(SiPU) coatings with the intention to improve fouling-release (FR) performance. Non-reactive phenyl-
methyl silicone oils were used as an additive in SiPU coatings and the effects on FR properties were
studied in relation to characteristics of the oils. SiPU coatings were formulated incorporating wide variety
of phenyl-methyl silicone oils into the optimum SiPU formulation which was identified from previous
studies (A4-20) and evaluated for their FR performance through a series of laboratory biological assays.
Improvement in FR properties was observed for green algae, barnacles and mussels due to the
incorporation of nonreactive silicone oils. Several phenyl-methyl silicone oil modified coatings showed
efficient Ulva linza sporeling removal (at light water jet pressures), comparable to commercial standards.
Low adhesion strength of reattached barnacles (Amphibalanus amphitrite) was observed for SiPU
coatings with phenyl-methyl homopolymer oils. Regardless of the phenyl-methyl composition, good anti-
fouling (AF) properties towards marine mussels (G. demissa) were observed for SiPU coatings modified
with 500 cs viscosity silicone oils. Improvements in FR properties were consistent with the results
observed for select silicone oil modified coatings in field immersion trials. SiPU coatings modified with
phenyl-methyl silicone oils showed better FR properties than A4-20 and comparable performance to
Intersleek 900 standard during prolonged field exposure in natural marine environment. Surface analysis
using X-ray photoelectron spectroscopy revealed that silicone oil self-stratified with PDMS and remained
close to the surface. Therefore, it was proposed that silicone oil may exude over time, providing interfacial
slippage which may have led to improved FR properties both in laboratory assays for model organisms
and in seawater field immersion trials.
Improving surface lubricity seems to help in minimizing the adhesion strength of marine
organisms. However FR properties may eventually decline when lubricating oil is depleted. Therefore,
methods to replenish or control the release of lubricating oil would be beneficial for long term FR
performance. However, a way to effectively incorporate and release lubricant fluid in a controlled manner
can be challenging. Encapsulating lubricant fluids like silicone oil and incorporating them into the coating
matrix can be pursued as a potential way to improve FR performance of SiPU coatings. There are many
studies that discuss methods to encapsulate silicone oil, one of the more frequent methods mentioned is
189
through emulsion polymerization. Silicone oil incorporated gels are widely discussed for applications in
the cosmetics industry which may be modified and adapted to prepare SiPU coatings with oil
encapsulated gels.
Since phenyl-methyl silicone oils provided improved FR properties, the effect of phenyl
functionality on FR properties of crosslinked SiPU coating system was investigated. Aminopropyl
terminated polydiphenyldimethyl siloxane (APT-PDPDMS) copolymer was synthesized and blended with
APT-PDMS at different weight ratios to study the effect of phenyl content on FR properties of SiPU
coatings. Phenyl modified SiPU coatings displayed micro-scale surface features in regard to
compositional variations when characterized using Atomic Force Microscopy (AFM). The FR properties of
these coatings were strongly affected by the presence of surface features. Microfouling organisms
demonstrated weak FR properties while macrofouling organisms seemed to show good AF/FR properties.
Marine mussels were unable to attach to any of the phenyl modified SiPU coatings during the 3 day
attachment period and several coating compositions showed non-attached barnacles. While a coating
with spike-like surface features did not allow adhesion of barnacles, a few experienced high adhesion
strength of barnacles. The results observed for FR properties of phenyl modified coatings towards model
organisms may be explained using the attachment point theory. Since the size scale of the surface
features observed for phenyl modified coatings were relatively larger than that of microfoulers, organisms
adhered strongly finding refuge settling between the gaps of the features.
In previous studies, amphiphilic acid functional PDMS showed excellent FR properties towards
diatoms while that of barnacles were impaired. In order to address the short comings, 25% acid
functionalized aminopropyl terminated PDMS (APT-PDMS-25A) was blended with APT-PDMS to prepare
SiPU coatings. It was hypothesized that tuning the hydrophilic acid groups on the surface may result in
improved FR properties towards barnacles while maintaining diatom FR properties. In fact, water contact
angle measurements indicated that the wettability of SiPU surface went from being hydrophobic to
hydrophilic with increasing concentration of APT-PDMS-25A copolymer in the coating composition.
Interestingly, the FR performance of APT-PDMS-25A modified coatings showed improvement towards
barnacles yet diatom removal was significantly affected. The coating compositions with high APT-PDMS-
25A concentration also showed low settlement of U.linza although sporelings adhered strongly to those
190
coatings. Obtaining FR properties to a broad range of marine organisms seems to be quite challenging
using acid functional PDMS. Also, some marine organisms secrete proteins that may be more accretive to
surfaces with surface net charge (in the case of acid modified surfaces COO- groups). Therefore alternate
hydrophilic functionality should be used for further exploration.
An amphiphilic approach to mitigate biofouling using polyethylene glycol (PEG) was also explored
previously. In an earlier study, siloxane polymer with PEG side chains was used to prepare SiPU
coatings. Although the synthesis of PEG modified siloxane resin included multiple steps, some
improvements in FR properties were observed. Therefore, a more straight forward method to obtain
amphiphilic siloxane-polyurethane (AmSiPU) coatings was attempted. In a recent study, polyisocyanate
pre-polymers modified with monofunctional PDMS and PEG were used to formulate AmSiPU coatings.
Surface characterization performed using XPS, AFM, and Attenuated Total Reflection Fourier
Transformed Infrared Spectroscopy (ATR-FTIR) indicated the presence of both PDMS and PEG on the
coating surface. The surface morphology of AmSiPU coatings were greatly affected by the compositional
variations linked to pre-polymers. Several coatings showed excellent FR properties towards several
model organisms indicating broad spectrum FR effectiveness. AmSiPU coatings had improved FR
towards bacteria, diatoms, green algae, and barnacles when compared to A4-20 SiPU control. Also,
many AmSiPU compositions displayed similar or better FR performance to latest commercial standards
such as Intersleek® 1100 (IS 1100) and Hempasil® X3 (Hemp X3) during laboratory biological assays.
More importantly, it is worth to note that incorporation of hydrophilic PEG component in to SiPU coatings
did not negatively affect the FR performance towards any particular model organism tested; which was
not the case for previous attempts to prepare PEG modified SiPU coatings. In future, select AmSiPU
coatings should be included in field immersion trials to evaluate long term FR properties.
Highly hydrated surfaces have recently become attractive as antifouling surfaces given the
thermodynamic and kinetic factors negatively affecting protein adhesion. Zwitterionic components and
PEG are most commonly used for protein resistant materials. In order to obtain highly hydrated surfaces,
several hydrophilically modified surface active pre-polymers based on PEG-PDMS and sulfobetaine-
PDMS were investigated. Additionally, a small amount of non-reactive hydrophilic additives were also
included in the coating formulations. Surface wettability of these SiPU coatings seemed to change rapidly
191
from hydrophobic to hydrophilic (in a time scale of minutes). Coatings with PEG-PDMS side chains were
efficient in FR of bacteria compared to those with sulfobetaine-PDMS. Several coatings also showed
excellent diatom removal, comparable to commercial standards IS 1100 and Hemp X3. A marked
improvement in microfouling release was observed for hydrophilically modified SiPU coatings compared
to A4-20. Experimental coatings also showed good AF/FR properties towards barnacles and mussels.
However, more sophisticated surface analysis is required to build strong conclusions related to surface
characteristic vs. FR trends observed. Surface imaging using AFM in air and in water can be very useful
techniques to investigate the existence of hydration layer. Also XPS experiments can be used to
understand the surface morphology differences between coatings. Observing the wettability and surface
energy after prolonged exposure to water would be helpful in future to understand the stability of the
coatings.
Further exploration with amphiphilic and hydrophilic strategies to improve FR performance of
SiPU coatings remain as the most prolific direction for the future. A study could be conducted to
investigate the effects of non-reactive hydrophilic additive on FR performance of SiPU coatings. Effects of
FR properties of A4-20 based formulation modified with hydrophilic additives with different molecular
weight (MW), PEG chain density and additive concentration can be studied. Also designing siloxane
resins with grafted PDMS-PEG or PDMS-zwitterionic chains and incorporating it in to SiPU coating
system could be another possible route to obtain amphiphilic/ hydrophilic FR surface. Grafting could be
performed via hydrosilylation of allyl PEG and allyl PDMS on to PDMS copolymer with silane groups on
the backbone.
SiPU coatings with slight modification in solvent content provided two differently performing
coating formulations towards mussel adhesion (both fresh water and marine mussels). The coating C4-
20% displayed excellent AF/FR properties compared to A4-20%. The C4 formulations retained mussel FR
up to 3 years, whereas FR performance of A4 coatings seemed to decline close to 1 year in field
immersion with the only variability in the formulations attributing to the addition of ethyl-3-
ethoxypropionate (EEP) into C4-20% formulation. The surface analysis conducted using X-ray
photoelectron spectroscopy (XPS) suggested that self-stratification was affected by addition of EEP.
Therefore, it would be important to understand the effect of EEP on long term FR properties of SiPU
192
coatings in regard to mussels. An experiment can be designed to study the change in morphology and
fouling release properties of C4-20% coating. The effect of coating curing condition can be studied by
formulating C4 coatings and curing replicate panels under different conditions. For example, the same
formulation can be subjected to several curing conditions; ambient curing, oven curing at elevated
temperatures and curing under reduced pressure (vacuum oven) and elevated temperature. Also, the
effect of immersion time can be studied as well. Coatings can be exposed to different immersion times in
the pre-leaching tank (1 month, 3 months, 6 months, 9 months, and 12 months). In each case
morphology of the coating can be analyzed using XPS, ATR-FTIR, contact angle and surface energy
measurements. Then observed variations in morphology may be correlated to FR properties evaluated
using laboratory biological assays.
Overall the versatility of modifying SiPU coating system to improve FR properties has been
demonstrated. Throughout this work, multiple approaches were explored to tailor the surface properties of
SiPU coatings which resulted in progress towards better FR performance. Novel approaches to fine tune
the surface balance of hydrophilic and hydrophobic characteristics have led to broad spectrum FR
properties during laboratory biological assays. Incorporation of silicone oil helped to prolong the service
life of SiPU coatings in field immersion tests. Freshwater fouling release performance of SiPU coatings
were evaluated for the first time, showing promise as viable candidate for contending with mussel fouling.
So far the research and development efforts revolved around SiPU marine coatings show that it is an
environmentally friendly, highly tunable robust coatings system with comparable FR performance to
commercial standards with the added advantage of mechanical durability and toughness.
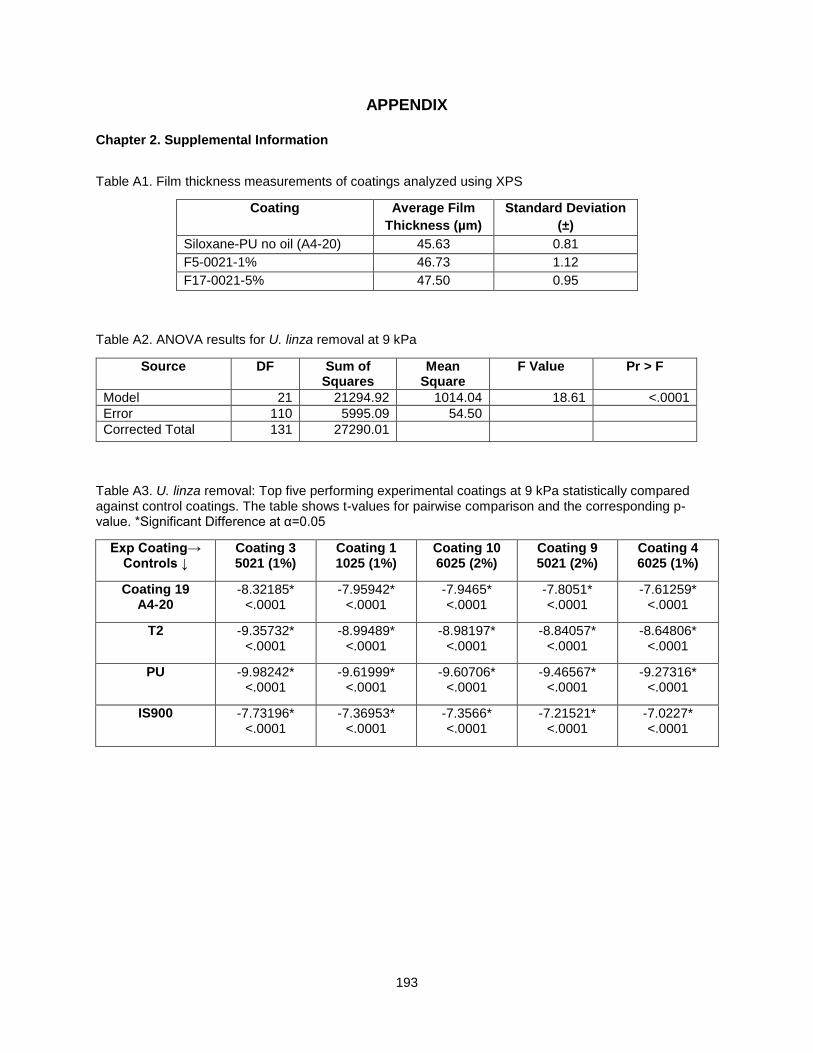
193
APPENDIX
Chapter 2. Supplemental Information
Table A1. Film thickness measurements of coatings analyzed using XPS
Coating Average Film
Thickness (µm)
Standard Deviation
(±)
Siloxane-PU no oil (A4-20) 45.63 0.81
F5-0021-1% 46.73 1.12
F17-0021-5% 47.50 0.95
Table A2. ANOVA results for U. linza removal at 9 kPa
Source DF Sum of Squares
Mean Square
F Value Pr > F
Model 21 21294.92 1014.04 18.61 <.0001
Error 110 5995.09 54.50
Corrected Total 131 27290.01
Table A3. U. linza removal: Top five performing experimental coatings at 9 kPa statistically compared against control coatings. The table shows t-values for pairwise comparison and the corresponding p-value. *Significant Difference at α=0.05
Exp Coating→ Controls ↓
Coating 3 5021 (1%)
Coating 1 1025 (1%)
Coating 10 6025 (2%)
Coating 9 5021 (2%)
Coating 4 6025 (1%)
Coating 19 A4-20
-8.32185* <.0001
-7.95942* <.0001
-7.9465* <.0001
-7.8051* <.0001
-7.61259* <.0001
T2 -9.35732* <.0001
-8.99489* <.0001
-8.98197* <.0001
-8.84057* <.0001
-8.64806* <.0001
PU -9.98242* <.0001
-9.61999* <.0001
-9.60706* <.0001
-9.46567* <.0001
-9.27316* <.0001
IS900 -7.73196* <.0001
-7.36953* <.0001
-7.3566* <.0001
-7.21521* <.0001
-7.0227* <.0001
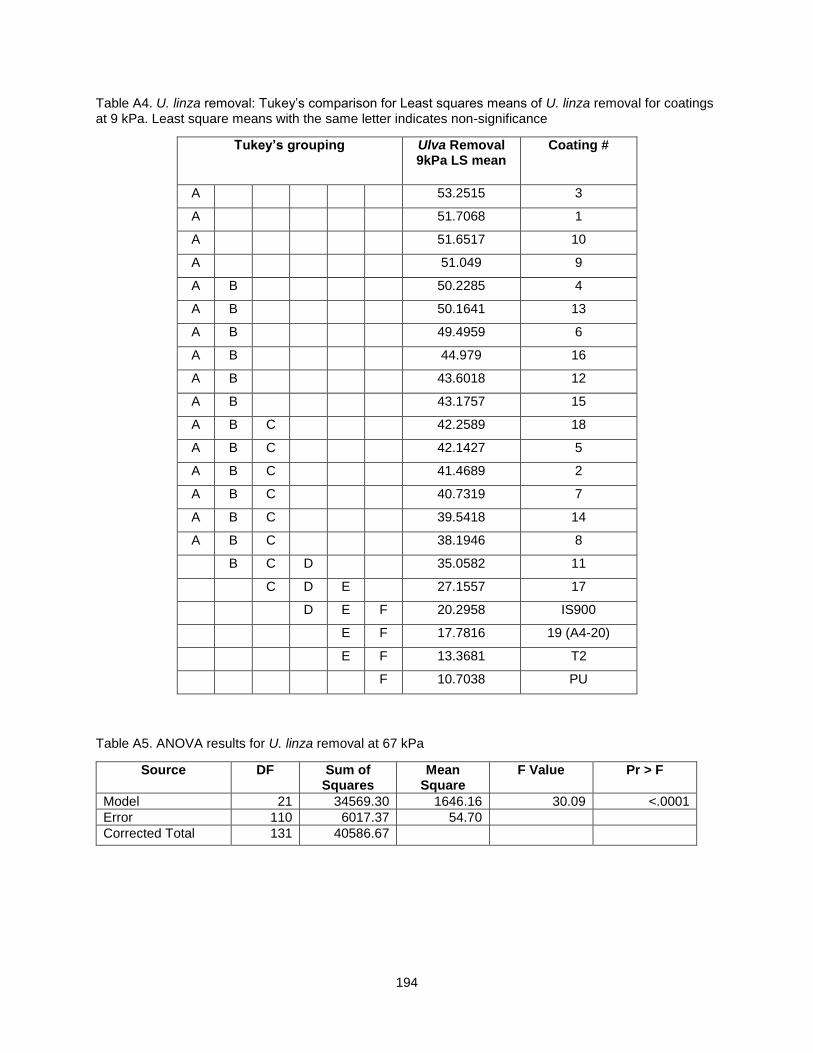
194
Table A4. U. linza removal: Tukey’s comparison for Least squares means of U. linza removal for coatings at 9 kPa. Least square means with the same letter indicates non-significance
Tukey’s grouping Ulva Removal 9kPa LS mean
Coating #
A 53.2515 3
A 51.7068 1
A 51.6517 10
A 51.049 9
A B 50.2285 4
A B 50.1641 13
A B 49.4959 6
A B 44.979 16
A B 43.6018 12
A B 43.1757 15
A B C 42.2589 18
A B C 42.1427 5
A B C 41.4689 2
A B C 40.7319 7
A B C 39.5418 14
A B C 38.1946 8
B C D 35.0582 11
C D E 27.1557 17
D E F 20.2958 IS900
E F 17.7816 19 (A4-20)
E F 13.3681 T2
F 10.7038 PU
Table A5. ANOVA results for U. linza removal at 67 kPa
Source DF Sum of Squares
Mean Square
F Value Pr > F
Model 21 34569.30 1646.16 30.09 <.0001
Error 110 6017.37 54.70
Corrected Total 131 40586.67
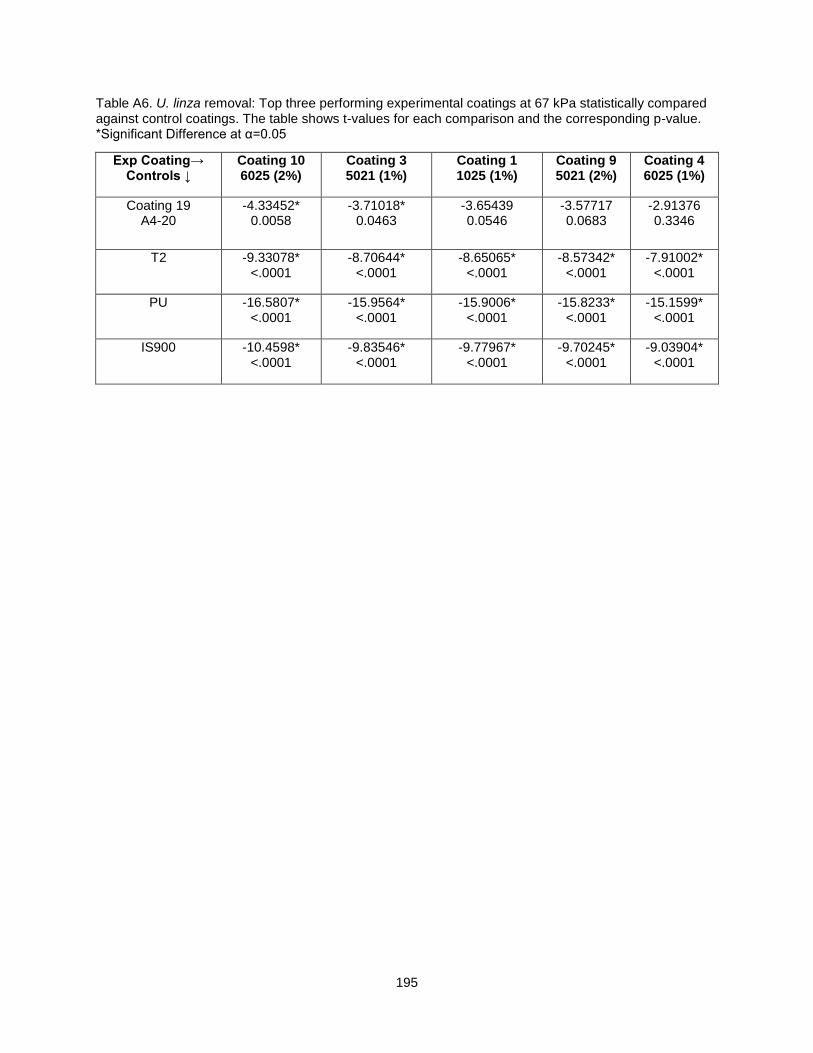
195
Table A6. U. linza removal: Top three performing experimental coatings at 67 kPa statistically compared against control coatings. The table shows t-values for each comparison and the corresponding p-value. *Significant Difference at α=0.05
Exp Coating→ Controls ↓
Coating 10 6025 (2%)
Coating 3 5021 (1%)
Coating 1 1025 (1%)
Coating 9 5021 (2%)
Coating 4 6025 (1%)
Coating 19 A4-20
-4.33452* 0.0058
-3.71018* 0.0463
-3.65439 0.0546
-3.57717 0.0683
-2.91376 0.3346
T2 -9.33078* <.0001
-8.70644* <.0001
-8.65065* <.0001
-8.57342* <.0001
-7.91002* <.0001
PU -16.5807* <.0001
-15.9564* <.0001
-15.9006* <.0001
-15.8233* <.0001
-15.1599* <.0001
IS900 -10.4598* <.0001
-9.83546* <.0001
-9.77967* <.0001
-9.70245* <.0001
-9.03904* <.0001
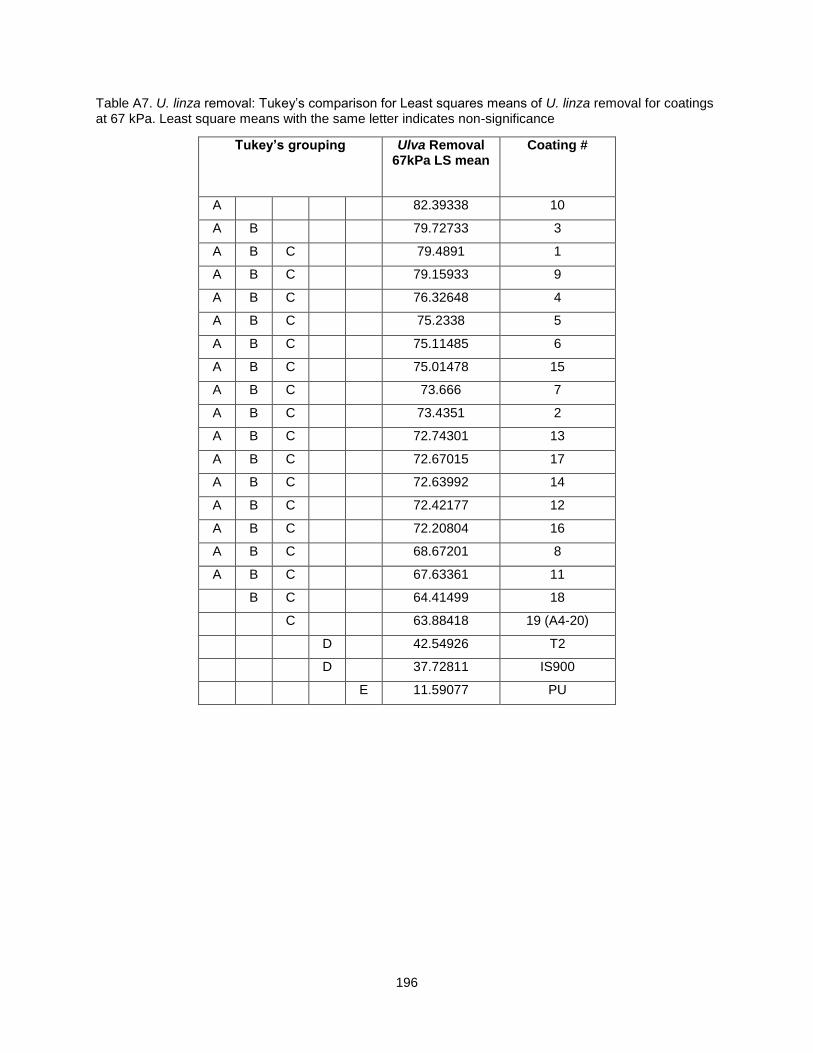
196
Table A7. U. linza removal: Tukey’s comparison for Least squares means of U. linza removal for coatings at 67 kPa. Least square means with the same letter indicates non-significance
Tukey’s grouping Ulva Removal 67kPa LS mean
Coating #
A 82.39338 10
A B 79.72733 3
A B C 79.4891 1
A B C 79.15933 9
A B C 76.32648 4
A B C 75.2338 5
A B C 75.11485 6
A B C 75.01478 15
A B C 73.666 7
A B C 73.4351 2
A B C 72.74301 13
A B C 72.67015 17
A B C 72.63992 14
A B C 72.42177 12
A B C 72.20804 16
A B C 68.67201 8
A B C 67.63361 11
B C 64.41499 18
C 63.88418 19 (A4-20)
D 42.54926 T2
D 37.72811 IS900
E 11.59077 PU
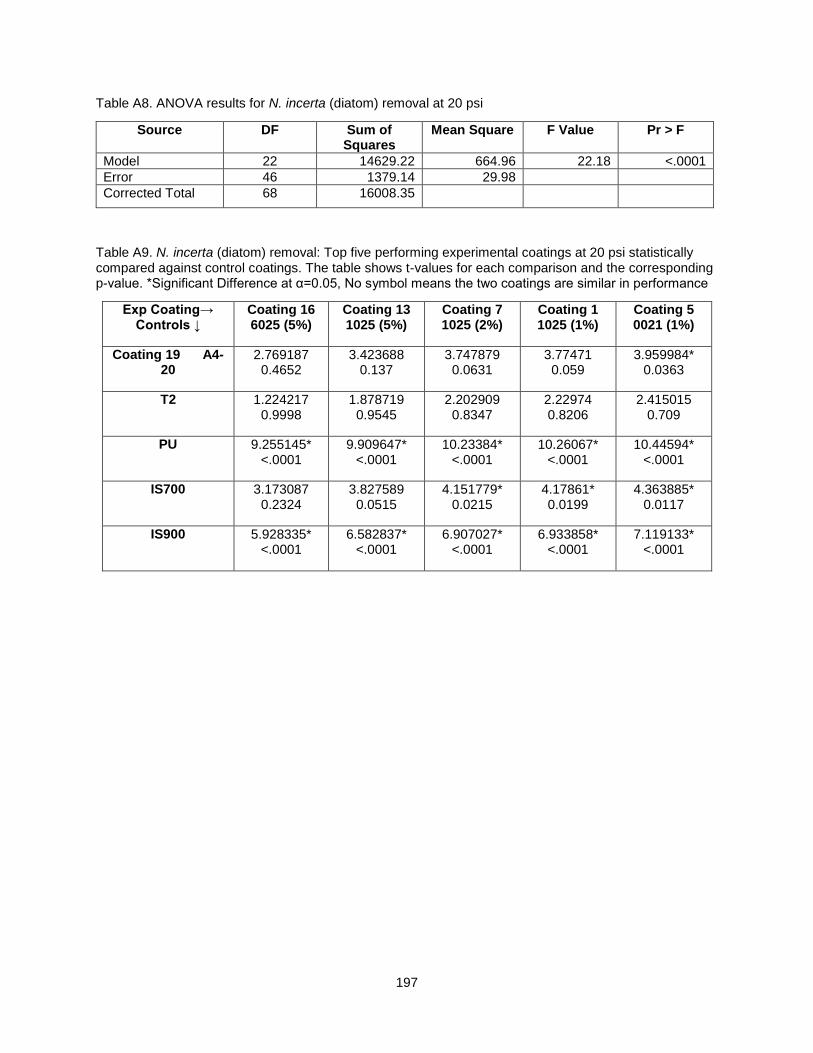
197
Table A8. ANOVA results for N. incerta (diatom) removal at 20 psi
Source DF Sum of Squares
Mean Square F Value Pr > F
Model 22 14629.22 664.96 22.18 <.0001
Error 46 1379.14 29.98
Corrected Total 68 16008.35
Table A9. N. incerta (diatom) removal: Top five performing experimental coatings at 20 psi statistically compared against control coatings. The table shows t-values for each comparison and the corresponding p-value. *Significant Difference at α=0.05, No symbol means the two coatings are similar in performance
Exp Coating→ Controls ↓
Coating 16 6025 (5%)
Coating 13 1025 (5%)
Coating 7 1025 (2%)
Coating 1 1025 (1%)
Coating 5 0021 (1%)
Coating 19 A4-20
2.769187 0.4652
3.423688 0.137
3.747879 0.0631
3.77471 0.059
3.959984* 0.0363
T2 1.224217 0.9998
1.878719 0.9545
2.202909 0.8347
2.22974 0.8206
2.415015 0.709
PU 9.255145* <.0001
9.909647* <.0001
10.23384* <.0001
10.26067* <.0001
10.44594* <.0001
IS700 3.173087 0.2324
3.827589 0.0515
4.151779* 0.0215
4.17861* 0.0199
4.363885* 0.0117
IS900 5.928335* <.0001
6.582837* <.0001
6.907027* <.0001
6.933858* <.0001
7.119133* <.0001
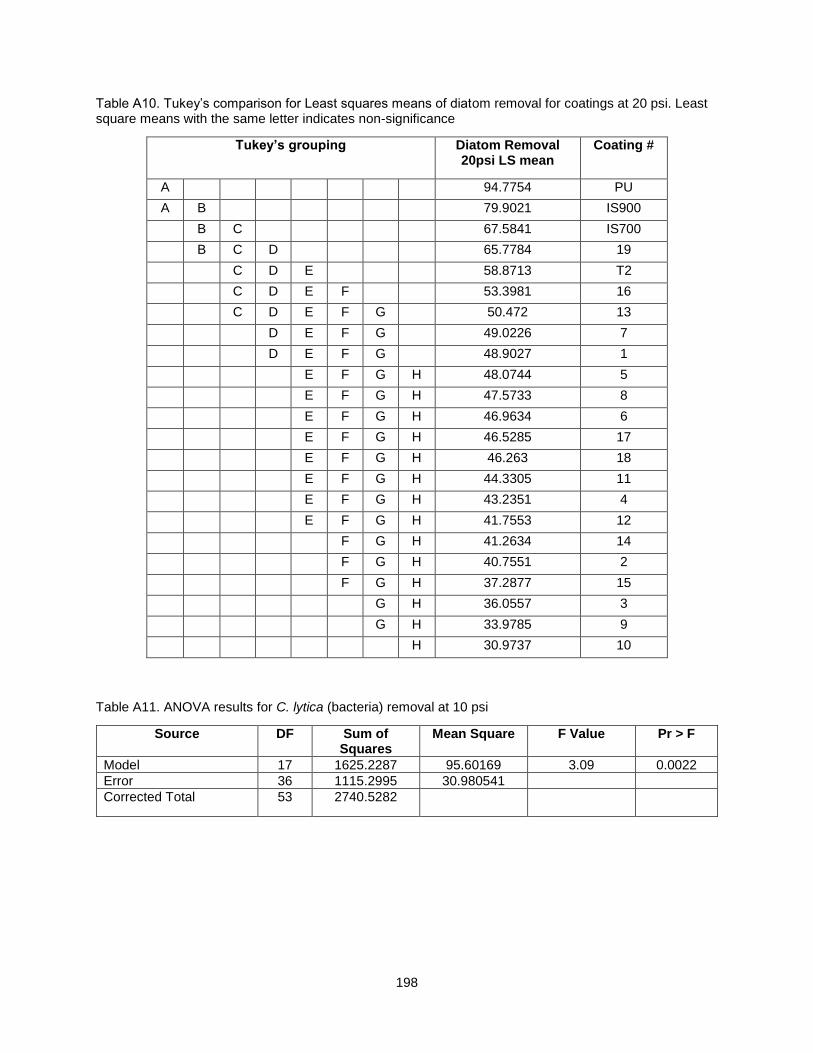
198
Table A10. Tukey’s comparison for Least squares means of diatom removal for coatings at 20 psi. Least square means with the same letter indicates non-significance
Tukey’s grouping Diatom Removal 20psi LS mean
Coating #
A 94.7754 PU
A B 79.9021 IS900
B C 67.5841 IS700
B C D 65.7784 19
C D E 58.8713 T2
C D E F 53.3981 16
C D E F G 50.472 13
D E F G 49.0226 7
D E F G 48.9027 1
E F G H 48.0744 5
E F G H 47.5733 8
E F G H 46.9634 6
E F G H 46.5285 17
E F G H 46.263 18
E F G H 44.3305 11
E F G H 43.2351 4
E F G H 41.7553 12
F G H 41.2634 14
F G H 40.7551 2
F G H 37.2877 15
G H 36.0557 3
G H 33.9785 9
H 30.9737 10
Table A11. ANOVA results for C. lytica (bacteria) removal at 10 psi
Source DF Sum of Squares
Mean Square F Value Pr > F
Model 17 1625.2287 95.60169 3.09 0.0022
Error 36 1115.2995 30.980541
Corrected Total 53 2740.5282
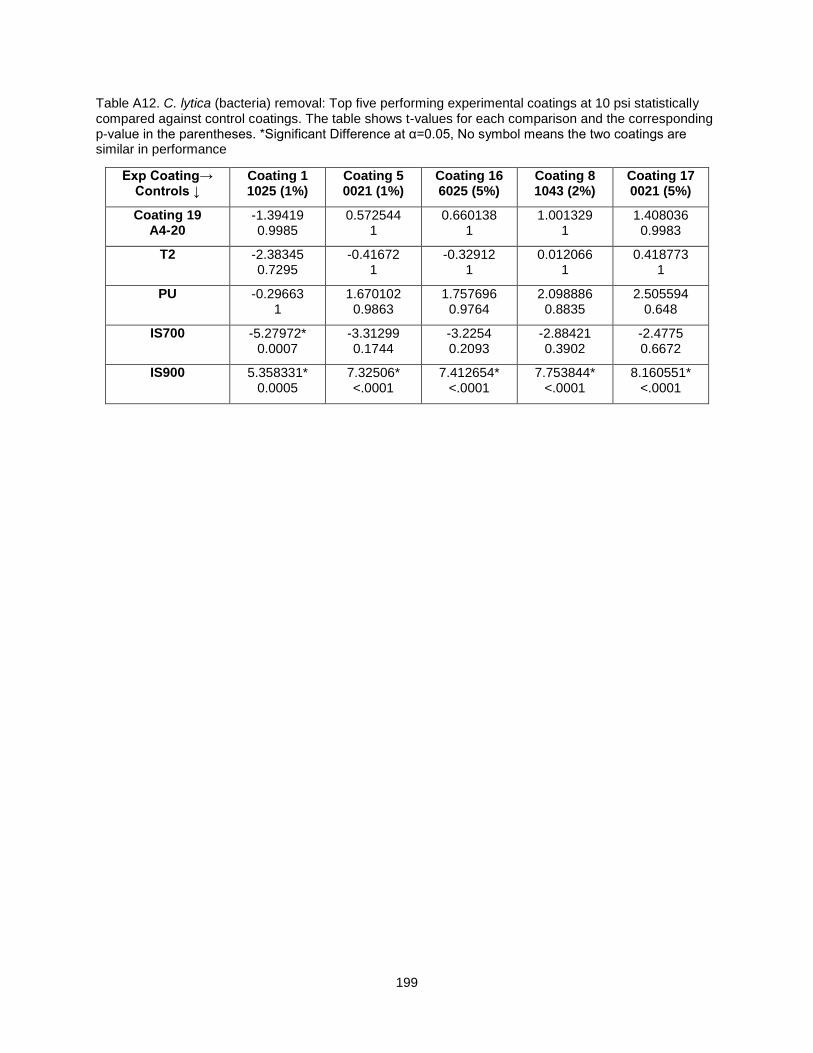
199
Table A12. C. lytica (bacteria) removal: Top five performing experimental coatings at 10 psi statistically compared against control coatings. The table shows t-values for each comparison and the corresponding p-value in the parentheses. *Significant Difference at α=0.05, No symbol means the two coatings are similar in performance
Exp Coating→ Controls ↓
Coating 1 1025 (1%)
Coating 5 0021 (1%)
Coating 16 6025 (5%)
Coating 8 1043 (2%)
Coating 17 0021 (5%)
Coating 19 A4-20
-1.39419 0.9985
0.572544 1
0.660138 1
1.001329 1
1.408036 0.9983
T2 -2.38345 0.7295
-0.41672 1
-0.32912 1
0.012066 1
0.418773 1
PU -0.29663 1
1.670102 0.9863
1.757696 0.9764
2.098886 0.8835
2.505594 0.648
IS700 -5.27972* 0.0007
-3.31299 0.1744
-3.2254 0.2093
-2.88421 0.3902
-2.4775 0.6672
IS900 5.358331* 0.0005
7.32506* <.0001
7.412654* <.0001
7.753844* <.0001
8.160551* <.0001
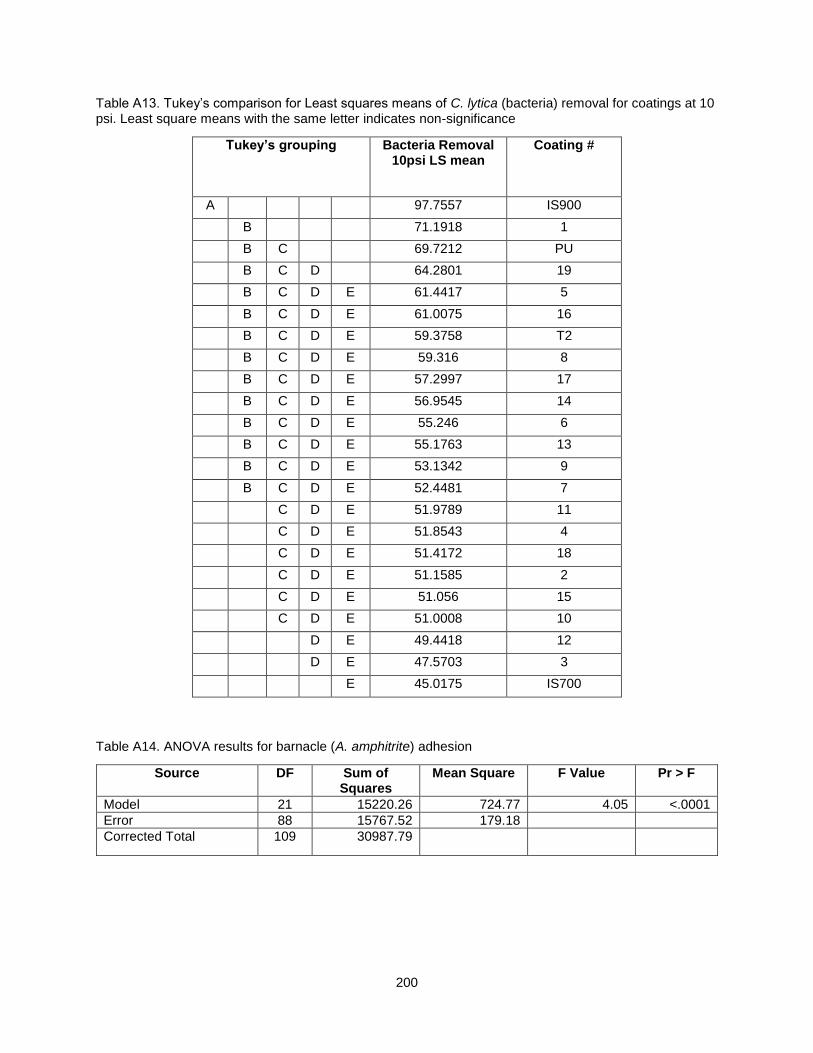
200
Table A13. Tukey’s comparison for Least squares means of C. lytica (bacteria) removal for coatings at 10 psi. Least square means with the same letter indicates non-significance
Tukey’s grouping Bacteria Removal 10psi LS mean
Coating #
A 97.7557 IS900
B 71.1918 1
B C 69.7212 PU
B C D 64.2801 19
B C D E 61.4417 5
B C D E 61.0075 16
B C D E 59.3758 T2
B C D E 59.316 8
B C D E 57.2997 17
B C D E 56.9545 14
B C D E 55.246 6
B C D E 55.1763 13
B C D E 53.1342 9
B C D E 52.4481 7
C D E 51.9789 11
C D E 51.8543 4
C D E 51.4172 18
C D E 51.1585 2
C D E 51.056 15
C D E 51.0008 10
D E 49.4418 12
D E 47.5703 3
E 45.0175 IS700
Table A14. ANOVA results for barnacle (A. amphitrite) adhesion
Source DF Sum of Squares
Mean Square F Value Pr > F
Model 21 15220.26 724.77 4.05 <.0001
Error 88 15767.52 179.18
Corrected Total 109 30987.79
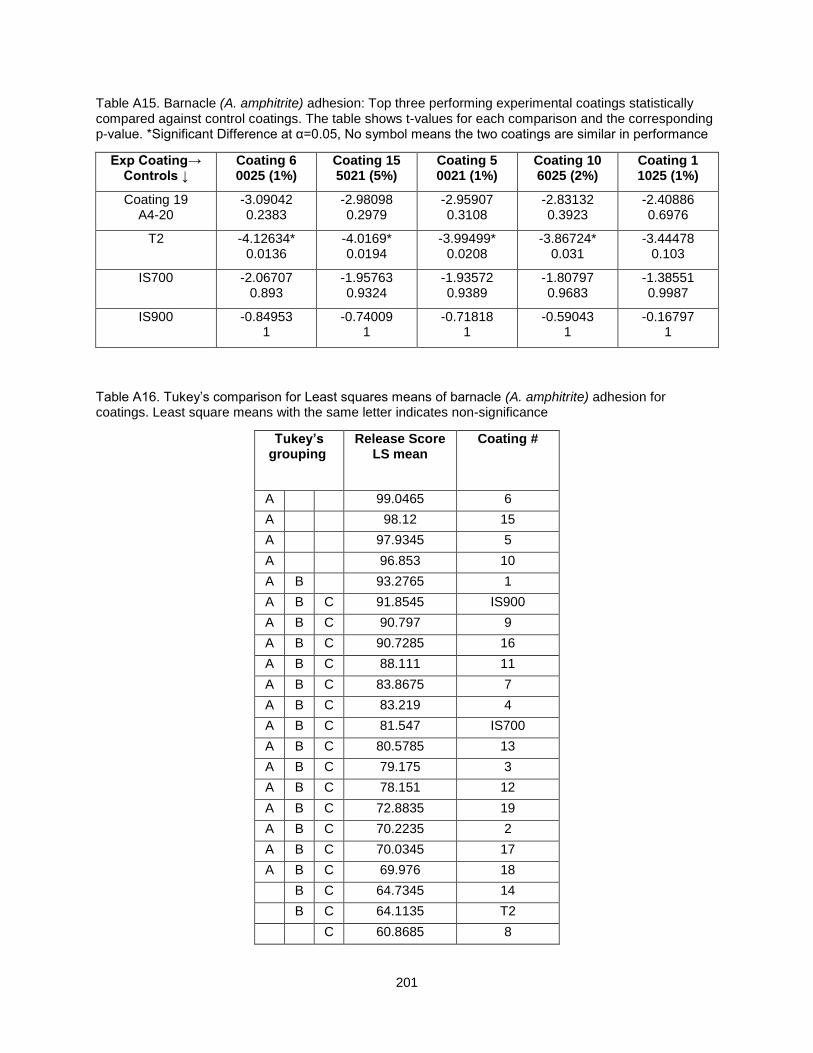
201
Table A15. Barnacle (A. amphitrite) adhesion: Top three performing experimental coatings statistically compared against control coatings. The table shows t-values for each comparison and the corresponding p-value. *Significant Difference at α=0.05, No symbol means the two coatings are similar in performance
Exp Coating→ Controls ↓
Coating 6 0025 (1%)
Coating 15 5021 (5%)
Coating 5 0021 (1%)
Coating 10 6025 (2%)
Coating 1 1025 (1%)
Coating 19 A4-20
-3.09042 0.2383
-2.98098 0.2979
-2.95907 0.3108
-2.83132 0.3923
-2.40886 0.6976
T2 -4.12634* 0.0136
-4.0169* 0.0194
-3.99499* 0.0208
-3.86724* 0.031
-3.44478 0.103
IS700 -2.06707 0.893
-1.95763 0.9324
-1.93572 0.9389
-1.80797 0.9683
-1.38551 0.9987
IS900 -0.84953 1
-0.74009 1
-0.71818 1
-0.59043 1
-0.16797 1
Table A16. Tukey’s comparison for Least squares means of barnacle (A. amphitrite) adhesion for coatings. Least square means with the same letter indicates non-significance
Tukey’s grouping
Release Score LS mean
Coating #
A 99.0465 6
A 98.12 15
A 97.9345 5
A 96.853 10
A B 93.2765 1
A B C 91.8545 IS900
A B C 90.797 9
A B C 90.7285 16
A B C 88.111 11
A B C 83.8675 7
A B C 83.219 4
A B C 81.547 IS700
A B C 80.5785 13
A B C 79.175 3
A B C 78.151 12
A B C 72.8835 19
A B C 70.2235 2
A B C 70.0345 17
A B C 69.976 18
B C 64.7345 14
B C 64.1135 T2
C 60.8685 8
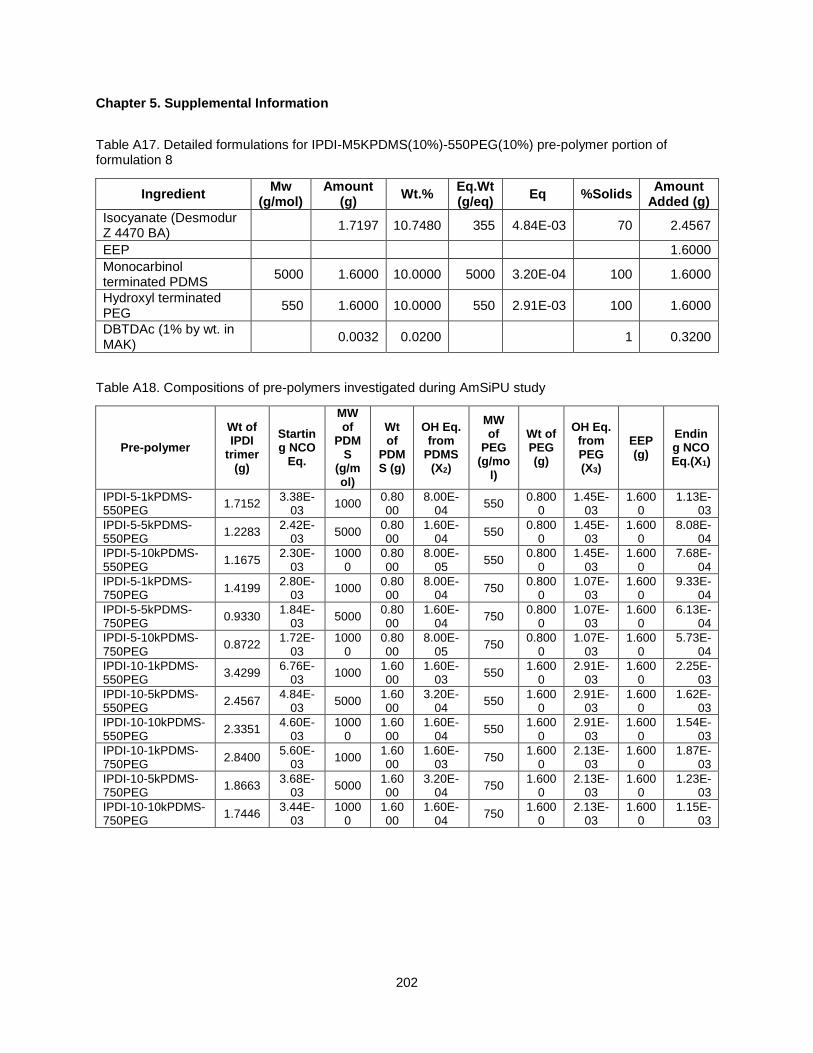
202
Chapter 5. Supplemental Information
Table A17. Detailed formulations for IPDI-M5KPDMS(10%)-550PEG(10%) pre-polymer portion of formulation 8
Ingredient Mw
(g/mol) Amount
(g) Wt.%
Eq.Wt (g/eq)
Eq %Solids Amount
Added (g)
Isocyanate (Desmodur Z 4470 BA)
1.7197 10.7480 355 4.84E-03 70 2.4567
EEP 1.6000
Monocarbinol terminated PDMS
5000 1.6000 10.0000 5000 3.20E-04 100 1.6000
Hydroxyl terminated PEG
550 1.6000 10.0000 550 2.91E-03 100 1.6000
DBTDAc (1% by wt. in MAK)
0.0032 0.0200 1 0.3200
Table A18. Compositions of pre-polymers investigated during AmSiPU study
Pre-polymer
Wt of IPDI
trimer (g)
Starting NCO
Eq.
MW of
PDMS
(g/mol)
Wt of
PDMS (g)
OH Eq. from
PDMS (X2)
MW of
PEG (g/mo
l)
Wt of PEG (g)
OH Eq. from PEG (X3)
EEP (g)
Ending NCO Eq.(X1)
IPDI-5-1kPDMS-550PEG
1.7152 3.38E-
03 1000
0.8000
8.00E-04
550 0.800
0 1.45E-
03 1.600
0 1.13E-
03
IPDI-5-5kPDMS-550PEG
1.2283 2.42E-
03 5000
0.8000
1.60E-04
550 0.800
0 1.45E-
03 1.600
0 8.08E-
04
IPDI-5-10kPDMS-550PEG
1.1675 2.30E-
03 1000
0 0.8000
8.00E-05
550 0.800
0 1.45E-
03 1.600
0 7.68E-
04
IPDI-5-1kPDMS-750PEG
1.4199 2.80E-
03 1000
0.8000
8.00E-04
750 0.800
0 1.07E-
03 1.600
0 9.33E-
04
IPDI-5-5kPDMS-750PEG
0.9330 1.84E-
03 5000
0.8000
1.60E-04
750 0.800
0 1.07E-
03 1.600
0 6.13E-
04
IPDI-5-10kPDMS-750PEG
0.8722 1.72E-
03 1000
0 0.8000
8.00E-05
750 0.800
0 1.07E-
03 1.600
0 5.73E-
04
IPDI-10-1kPDMS-550PEG
3.4299 6.76E-
03 1000
1.6000
1.60E-03
550 1.600
0 2.91E-
03 1.600
0 2.25E-
03
IPDI-10-5kPDMS-550PEG
2.4567 4.84E-
03 5000
1.6000
3.20E-04
550 1.600
0 2.91E-
03 1.600
0 1.62E-
03
IPDI-10-10kPDMS-550PEG
2.3351 4.60E-
03 1000
0 1.6000
1.60E-04
550 1.600
0 2.91E-
03 1.600
0 1.54E-
03
IPDI-10-1kPDMS-750PEG
2.8400 5.60E-
03 1000
1.6000
1.60E-03
750 1.600
0 2.13E-
03 1.600
0 1.87E-
03
IPDI-10-5kPDMS-750PEG
1.8663 3.68E-
03 5000
1.6000
3.20E-04
750 1.600
0 2.13E-
03 1.600
0 1.23E-
03
IPDI-10-10kPDMS-750PEG
1.7446 3.44E-
03 1000
0 1.6000
1.60E-04
750 1.600
0 2.13E-
03 1.600
0 1.15E-
03
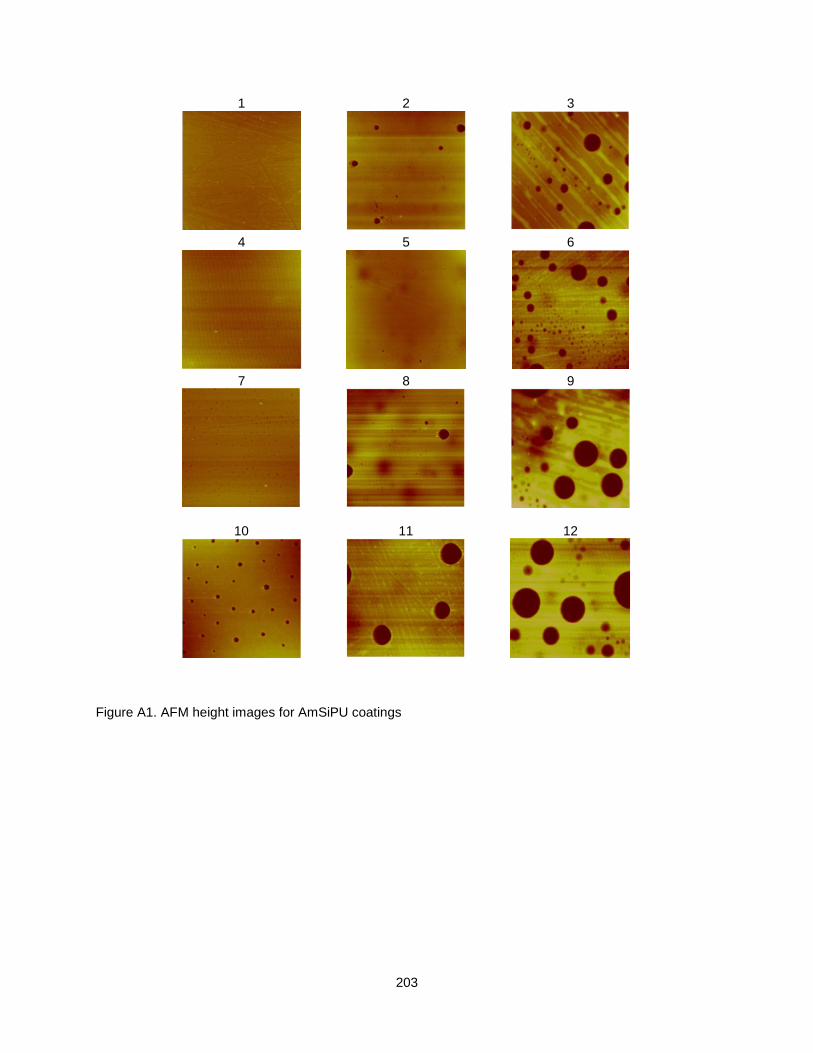
203
Figure A1. AFM height images for AmSiPU coatings
1
2
3
4
5
6
7
8
9
10
11
12
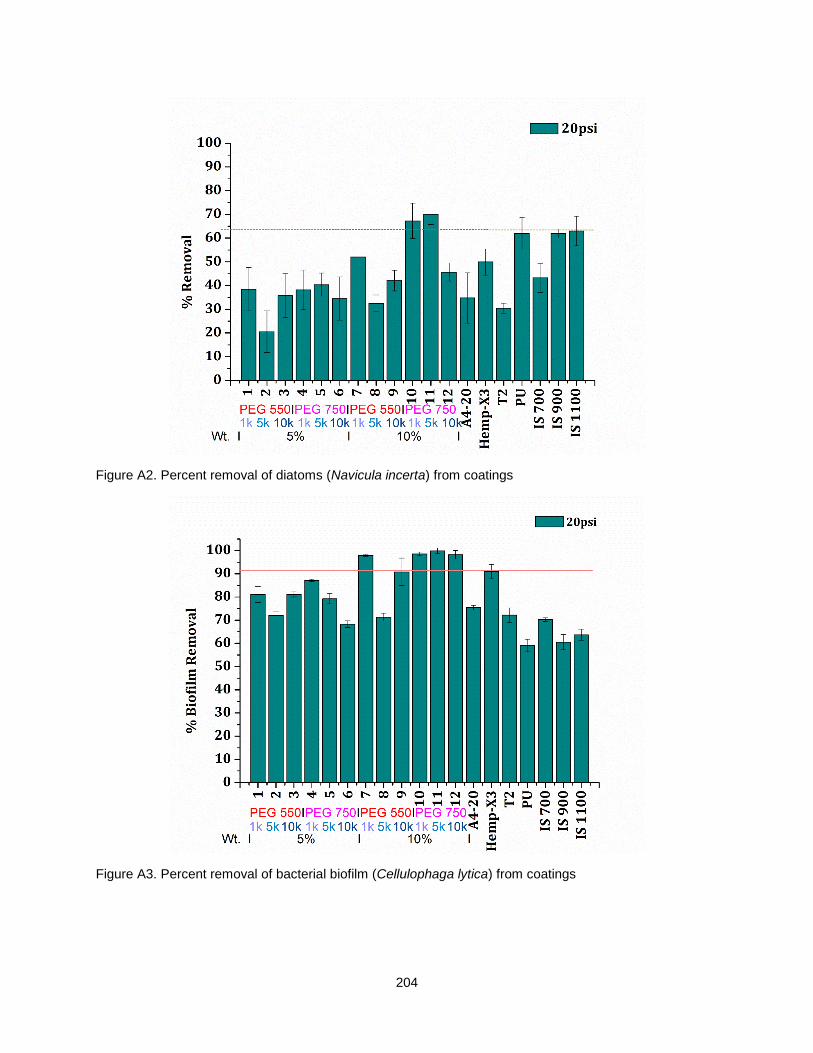
204
Figure A2. Percent removal of diatoms (Navicula incerta) from coatings
Figure A3. Percent removal of bacterial biofilm (Cellulophaga lytica) from coatings
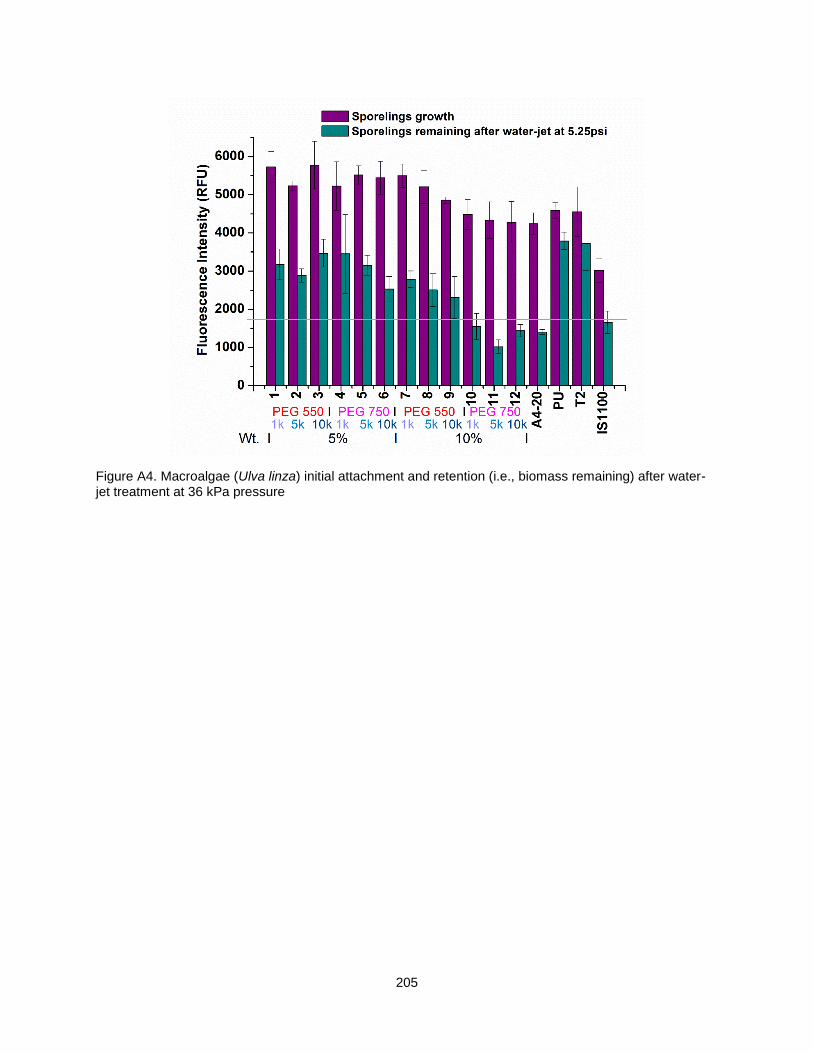
205
Figure A4. Macroalgae (Ulva linza) initial attachment and retention (i.e., biomass remaining) after water-jet treatment at 36 kPa pressure


