Embed Size (px)
Citation preview
ORIGINAL ARTICLE
Surface settlement predictions for Istanbul Metro tunnelsexcavated by EPB-TBM
S. G. Ercelebi • H. Copur • I. Ocak
Received: 13 July 2009 / Accepted: 15 March 2010
� Springer-Verlag 2010
Abstract In this study, short-term surface settlements are
predicted for twin tunnels, which are to be excavated in the
chainage of 0 ? 850 to 0 ? 900 m between the Esenler
and Kirazlı stations of the Istanbul Metro line, which is
4 km in length. The total length of the excavation line is
21.2 km between Esenler and Basaksehir. Tunnels are
excavated by employing two earth pressure balance (EPB)
tunnel boring machines (TBMs) that have twin tubes of
6.5 m diameter and with 14 m distance from center to
center. The TBM in the right tube follows about 100 m
behind the other tube. Segmental lining of 1.4 m length is
currently employed as the final support. Settlement pre-
dictions are performed with finite element method by using
Plaxis finite element program. Excavation, ground support
and face support steps in FEM analyses are simulated as
applied in the field. Predictions are performed for a typical
geological zone, which is considered as critical in terms of
surface settlement. Geology in the study area is composed
of fill, very stiff clay, dense sand, very dense sand and hard
clay, respectively, starting from the surface. In addition to
finite element modeling, the surface settlements are also
predicted by using semi-theoretical (semi-empirical) and
analytical methods. The results indicate that the FE model
predicts well the short-term surface settlements for a given
volume loss value. The results of semi-theoretical and
analytical methods are found to be in good agreement with
the FE model. The results of predictions are compared and
verified by field measurements. It is suggested that grouting
of the excavation void should be performed as fast as
possible after excavation of a section as a precaution
against surface settlements during excavation. Face pres-
sure of the TBMs should be closely monitored and adjusted
for different zones.
Keywords Surface settlement prediction �Finite element method � Analytical method �Semi-theoretical method � EPB-TBM tunneling �Istanbul Metro
Introduction
Increasing demand on infrastructures increases attention to
shallow soft ground tunneling methods in urbanized areas.
Many surface and sub-surface structures make under-
ground construction works very delicate due to the influ-
ence of ground deformation, which should be definitely
limited/controlled to acceptable levels. Independent of the
excavation method, the short- and long-term surface and
sub-surface ground deformations should be predicted and
remedial precautions against any damage to existing
structures planned prior to construction. Tunneling cost
substantially increases due to damages to structures
resulting from surface settlements, which are above toler-
able limits (Bilgin et al. 2009).
Basic parameters affecting the ground deformations are
ground conditions, technical/environmental parameters and
tunneling or construction methods (O’Reilly and New
1982; Arioglu 1992; Karakus and Fowell 2003; Tan and
Ranjit 2003; Minguez et al. 2005; Ellis 2005; Suwansawat
and Einstein 2006). A thorough study of the ground by site
investigations should be performed to find out the physical
S. G. Ercelebi (&) � H. Copur
Mining Engineering Department, Istanbul Technical University,
Maslak, 34469 Istanbul, Turkey
e-mail: [email protected]
I. Ocak
Rail Transportation Department (IETT), Istanbul Metropolitan
Municipality, Istanbul, Turkey
123
Environ Earth Sci
DOI 10.1007/s12665-010-0530-6
and mechanical properties of the ground and existence of
underground water, as well as deformation characteristics,
especially the stiffness. Technical parameters include tun-
nel depth and geometry, tunnel diameter–line–grade, single
or double track lines and neighboring structures. The
construction method, which should lead to a safe and
economic project, is selected based on site characteristics
and technical project constraints and should be planned so
that the ground movements are limited to an acceptable
level. Excavation method, face support pressure, advance
(excavation) rate, stiffness of support system, excavation
sequence and ground treatment/improvement have dra-
matic effects on the ground deformations occurring due to
tunneling operations.
The primary reason for ground movements above the
tunnel, also known as surface settlements, is convergence
of the ground into the tunnel after excavation, which
changes the in situ stress state of the ground and results in
stress relief. Convergence of the ground is also known as
ground loss or volume loss. The volume of the settlement
on the surface is usually assumed to be equal to the ground
(volume) loss inside the tunnel (O’Reilly and New 1982).
Ground loss can be classified as radial loss around the
tunnel periphery and axial (face) loss at the excavation face
(Attewell et al. 1986; Schmidt 1974). The exact ratio of
radial and axial volume losses is not fully demonstrated or
generalized in any study. However, it is possible to
diminish or minimize the face loss in full-face mechanized
excavations by applying a face pressure as a slurry of
bentonite–water mixture or foam-processed muck. The
ground loss is usually more in granular soils than in
cohesive soils for similar construction conditions. The
width of the settlement trough on both sides of the tunnel
axis is wider in the case of cohesive soils, which means
lower maximum settlement for the same amount of ground
loss.
Time dependency of ground behavior and existence of
underground water distinguish short- and long-term set-
tlements (Attewell et al. 1986). Short-term settlements
occur during or after a few days (mostly a few weeks) of
excavation, assuming that undrained soil conditions are
dominant. Long-term settlements are mostly due to creep,
stress redistribution and consolidation of soil after drainage
of the underground water and elimination of pore water
pressure inside the soil, and it may take a few months to a
few years to reach a stabilized level. In dry soil conditions,
the long-term settlements may be considered as very
limited.
There are mainly three settlement prediction approaches
for mechanized tunnel excavations: (1) numerical analysis
such as finite element method, (2) analytical method and
(3) semi-theoretical (semi-empirical) method. Among
them, the numerical approaches are the most reliable ones.
However, the results of all methods should be used care-
fully by an experienced field engineer in designing the
stage of an excavation project.
In this study, all three prediction methods are employed
for a critical zone to predict the short-term maximum
surface settlements above the twin tunnels of the chainage
between 0 ? 850 and 0 ? 900 m between Esenler and
Kirazlı stations of Istanbul Metro line, which is 4 km in
length. Plaxis finite element modeling program is used for
numerical modeling; the method suggested by Loganathan
and Poulos (1998) is used for the analytical solution. A few
different semi-theoretical models are also used for predic-
tions. The results are compared and validated by field
measurements.
Description of the project, site and construction method
The first construction phase of Istanbul Metro line was
started in 1992 and opened to public in 2000. This line is
being extended gradually, as well as new lines are being
constructed in other locations. One of these metro lines is
the twin line between Esenler and Basaksehir, which is
21.2 km. The excavation of this section has been started
in May 2006. Currently, around 1,400 m of excavation
has already been completed. The region is highly popu-
lated including several story buildings, industrial zones
and heavy traffic. Alignment and stations of the metro
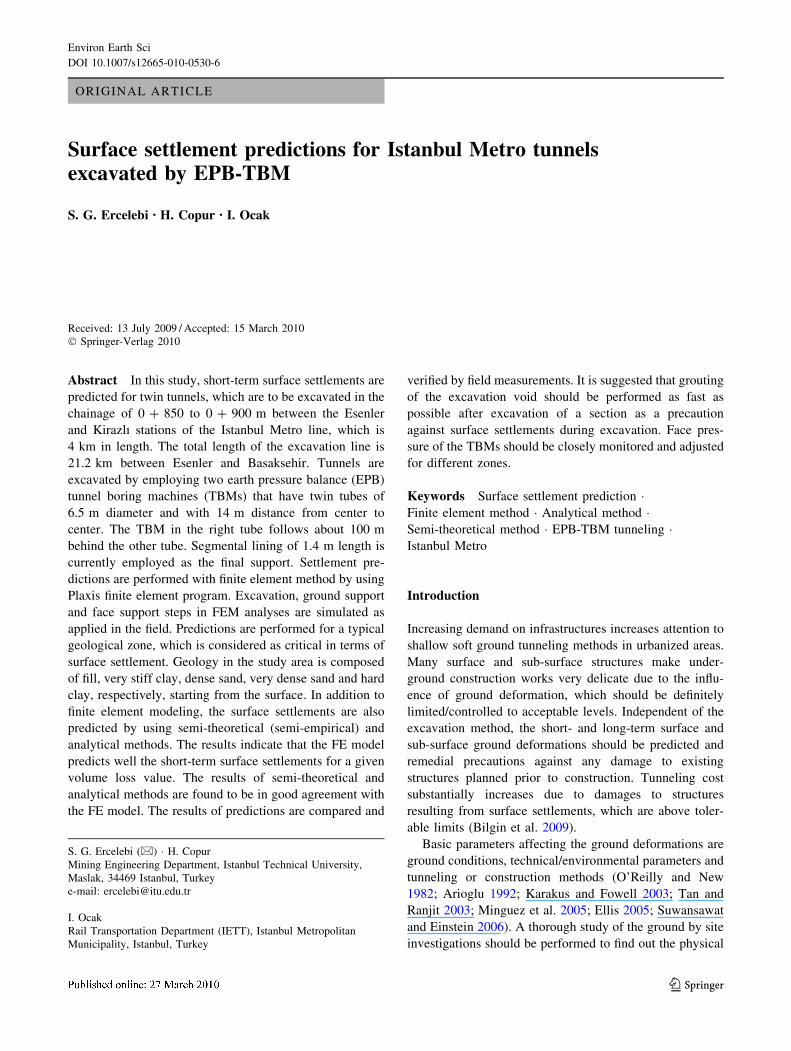
line between Esenler and Basaksehir is presented in
Fig. 1.
Totally four earth pressure balance (EPB) tunnel bor-
ing machines (TBM) are used for excavation of the
tunnels. The metro lines in the study area are excavated
by a Herrenknecht EPB-TBM in the right tube and a
Lovat EPB-TBM in the left tube. Right tube excavation
follows around 100 m behind the left tube. Some of the
technical features of the machines are summarized in
Table 1.
Excavated material is removed by auger (screw con-
veyor) through the machine to a belt conveyor and than
loaded to rail cars for transporting to the portal. Since the
excavated ground bears water and includes stability prob-
lems, the excavation chamber is pressurized by 300 kPa
and conditioned by applying water, foam, bentonite and
polymers through the injection ports. Chamber pressure is
continuously monitored by pressure sensors inside the
chamber and auger. Installation of a segment ring with 1.4-
m length (inner diameter of 5.7 m and outer diameter of
6.3 m) and 30-cm thickness is realized by a wing-type
vacuum erector. The ring is configured as five segments
plus a key segment. After installation of the ring, the
excavation restarts and the void between the segment outer
perimeter and excavated tunnel perimeter is grouted by
Environ Earth Sci
123
300 kPa of pressure through the grout cannels in the
trailing shield. This method of construction has been pro-
ven to minimize the surface settlements.
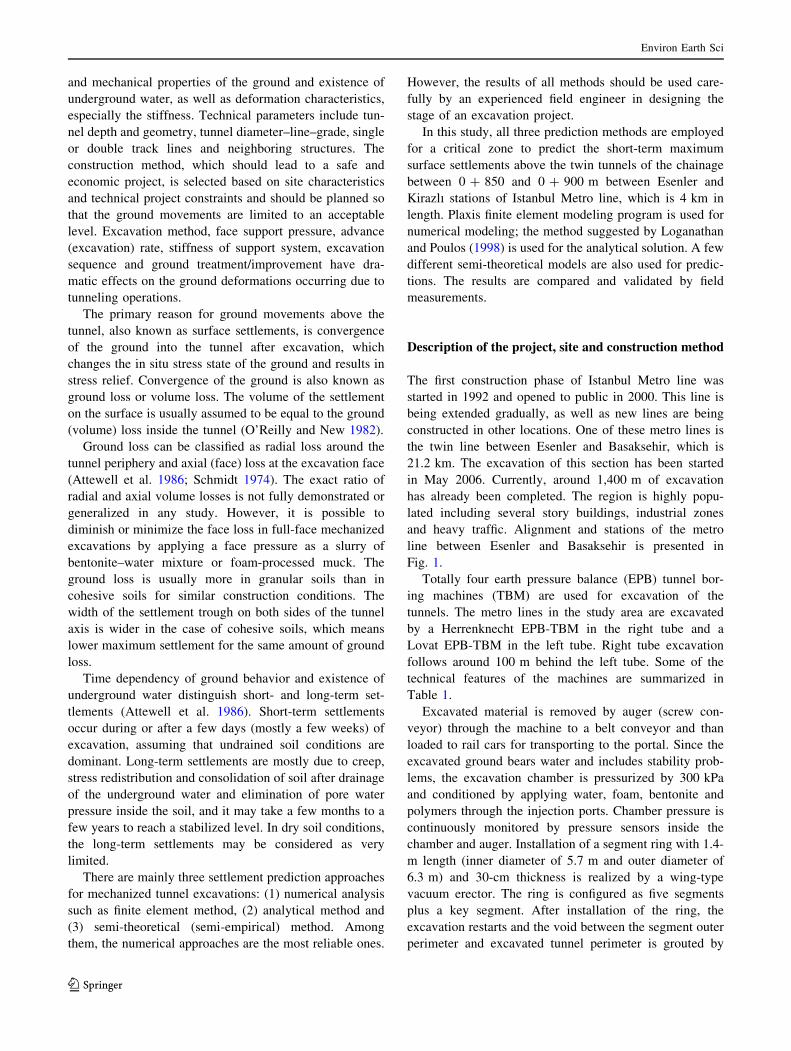
The study area includes the twin tunnels of the chai-
nage between 0 ? 850 and 0 ? 900 m, between Esenler
and Kirazlı stations. Gungoren Formation of the Miosen
age is found in the study area. Laboratory and in situ tests
are applied to define the geotechnical features of the
formations that the tunnels pass through. The name,
thickness and some of the geotechnical properties of the
layers are summarized in Table 2 (Ayson 2005). Fill layer
of 2.5-m thick consists of sand, clay, gravel and some
pieces of masonry. The very stiff clay layer of 4 m is
grayish green in color, consisting of gravel and sand. The
dense sand layer of 5 m is brown at the upper levels and
greenish yellow at the lower levels, consisting of clay, silt
and mica. Dense sand of 3 m is greenish yellow and
consists of mica. The base layer of the tunnel is hard clay,
which is dark green, consisting of shell. The underground
water table starts at 4.5 m below the surface. The tunnel
axis is 14.5 m below the surface, close to the contact
between very dense sand and hard clay. This depth is
Marmara Sea
Aksaray
Otogar
Ba ak ehir
0 km 5 km
European Side
Anatolia Side
Bosphorus
Bakırkoy IDO
Halkalı
Olimpiyat köyü
Güney sanayi
Atatürk Airport
Golden Horn
Kirazlı 1
0+000 0+500 1+000 1+500 2+000 2+500 3+000 3+500 4+000 4+500 5+000 Viad. At Grade R.W Bored Tunnel Bored Tunnel Bored Tunnel Bored Tunnel
10
20
30
40
50
60
70
80
Cut& Cover
Cut&Cover
Cut&Cover
Cut&Cover
Structure Type
Kilometer
Fill Clay
Sand Trakya formation
Metro line
0 m 250 m
Fig. 1 Main route and geological section of Esenler and Basaksehir Metro Line (Ocak 2009)
Table 1 Some of the technical features of the EPB-TBMs
Herrenknecht Lovat
Excavation diameter 6.500 m 6.564 m
Shield outside diameter 6.45 m 6.52 m
TBM length 7.68 m 9.30 m
Backup length 80 m 65 m
Total weight 578 t 534 t
Maximum cutter head RPM 0–2.5 0–6.0
Total installed power 963 kW 1,622 kW
Cutter head type Mixed ground Mixed ground
Cutter head power 630 kW 900 kW
Maximum torque 435 t m 445 t m
Maximum thrust 32.000 kN 54.000 kN
Environ Earth Sci
123
quite uniform in the chainage between 0 ? 850 and
0 ? 900 m.
Surface settlement prediction with finite element
modeling
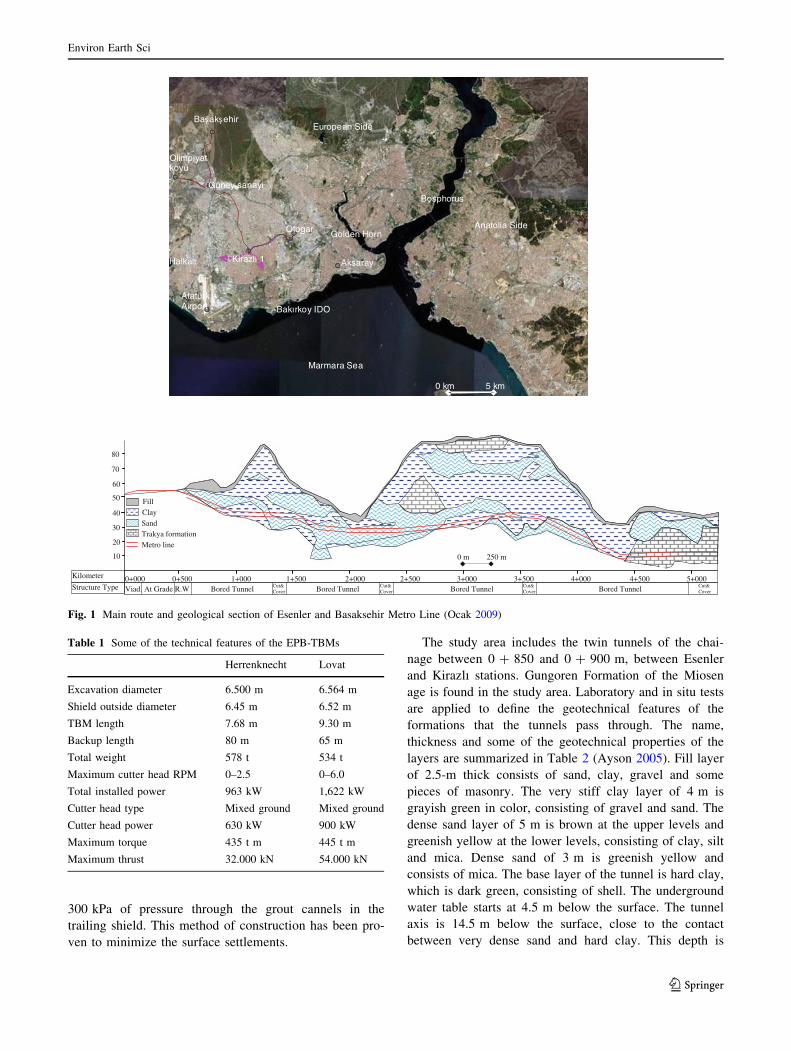
Plaxis finite element code for soil and rock analysis is used
to predict the surface settlement. First, the right tube is
constructed, and then the left tube 100 m behind the right
tube is excavated. This is based on the assumption that
ground deformations caused by the excavation of the right
tube are stabilized before the excavation of the left tube.
The finite element mesh is shown in Fig. 2 using 15 stress
point triangular elements. The FEM model consists of
1,838 elements and 15,121 nodes. In FE modeling, the
Mohr–Coulomb failure criterion is applied.
Staged construction is used in the FE model. Excavation
of the soil and the construction of the tunnel lining are
carried out in different phases. In the first phase, the soil in
front of TBM is excavated, and a support pressure of
300 kPa is applied at the tunnel face to prevent failure at
the face. In the first phase, TBM is modeled as shell ele-
ments. In the second phase, the tunnel lining is constructed
using prefabricated concrete ring segments, which are
bolted together within the tunnel boring machine. During
the erection of the lining, TBM remains stationary. Once a
lining ring has been bolted, excavation is resumed until
sufficient soil excavation is carried out for the next lining.
The tunnel lining is modeled using volume elements. In the
second phase, the lining is activated and TBM shell ele-
ments are deactivated.
When applying finite element models, volume loss
values are usually assumed prior to excavation. In this
study, the FEM model is run with the assumption of 0.5,
0.75, 1 and 1.5% volume loss caused by the convergence of
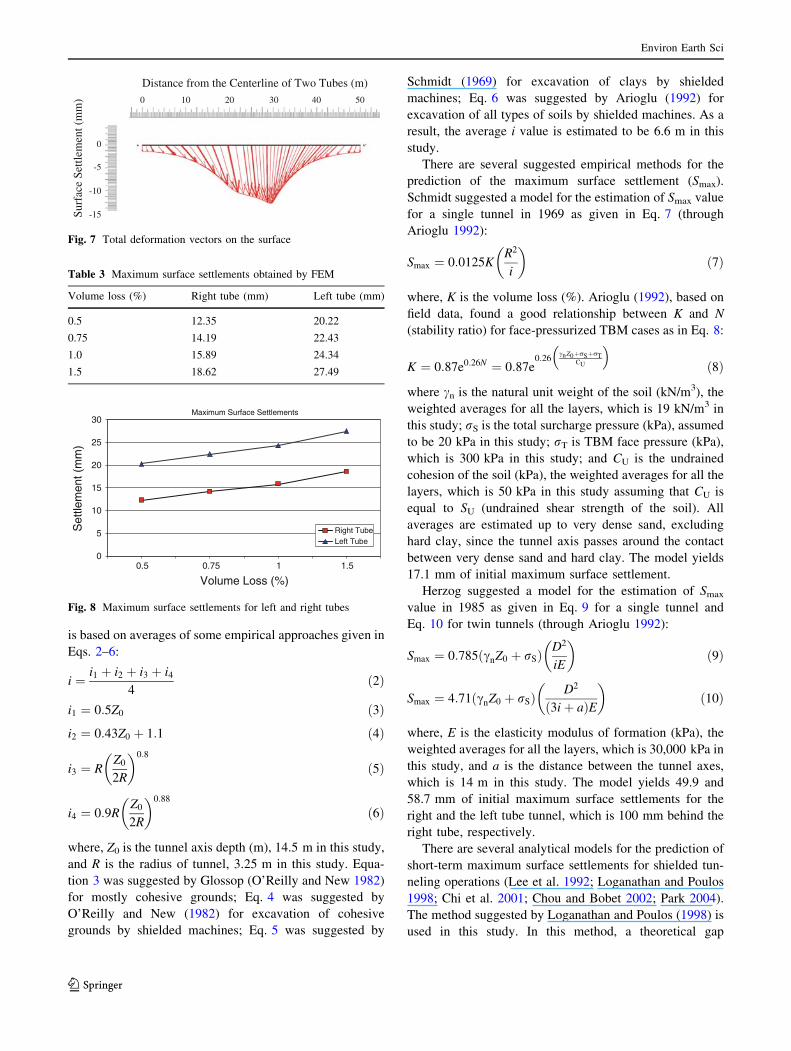
the ground into the tunnel after excavation. Figures 3 and 4
show total and vertical deformations after both tubes are
constructed. The vertical ground settlement profile after the
right tube construction is given in Fig. 5, which is in the
shape of a Gaussian curve, and that after construction of
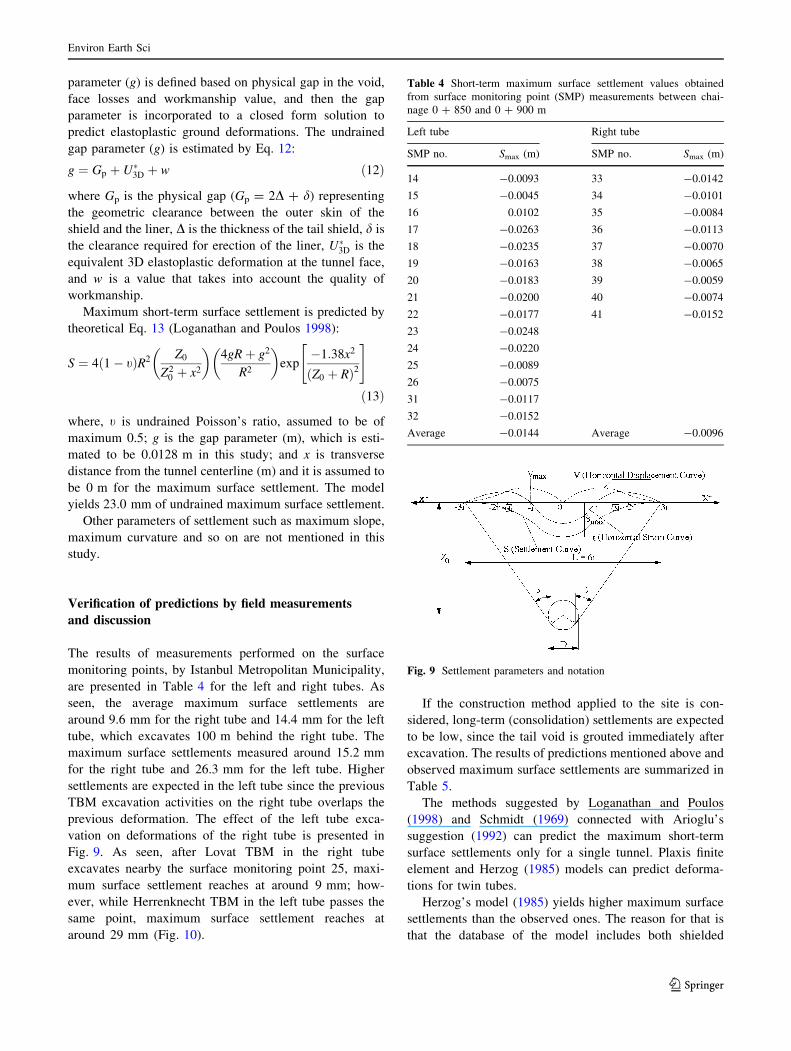
both tubes is given in Fig. 6. Figure 7 shows the total
deformation vectors.
The maximum ground deformations under different
volume loss assumptions are summarized in Table 3.
Surface settlement prediction with semi-theoretical
and analytical methods
Semi-theoretical predictions for short-term maximum set-
tlement are performed using the Gaussian curve approach,
which is a classical and conventional method. The settle-
ment parameters used in semi-theoretical estimations and
notations are presented in Fig. 8.
The theoretical settlement (Gaussian) curve is presented
as in Eq. 1 (O’Reilly and New 1982):
S ¼ Smaxe�x2
2i2
� �ð1Þ
where, S is the theoretical settlement (Gauss error function,
normal probability curve), Smax is the maximum short-term
(initial, undrained) settlement at the tunnel centerline (m),
x is the transverse horizontal distance from the tunnel
center line (m), and i is the point of inflexion (m). To
determine the shape of a settlement curve, it is necessary to
predict i and Smax values.
There are several suggested methods for prediction of
the point of inflexion (i). Estimation of i value in this study
Table 2 Geotechnical properties of the study area (Ayson 2005)
Formation Thickness (m) N30 SU (kPa) / (�) Ea (kPa) cn (kN/m3) cdry (kN/m3) PI (%) Permeability (cm/s)
Fill 2.5 10 13 20 8,000 19.8 13.8 – 1.0
Very stiff clay 4.0 20 85 9 51,000 18.2 12.7 33 1.0 9 10-4
Dense sand 5.0 35 40 35 24,000 19.0 13.5 – 0.5
Very dense sand 3.0 64 50 35 30,000 19.5 15.0 – 0.25
Hard clay Base 45 150 12 90,000 18.6 14.0 45 1.0 9 10-4
N30 Standard penetration number, SU undrained shear strength, / internal friction angle, E elasticity modulus, cn natural unit weight, cdry dry unit
weight, PI plasticity indexa Estimated as E = 600 SU
Fig. 2 Finite element model
Environ Earth Sci
123
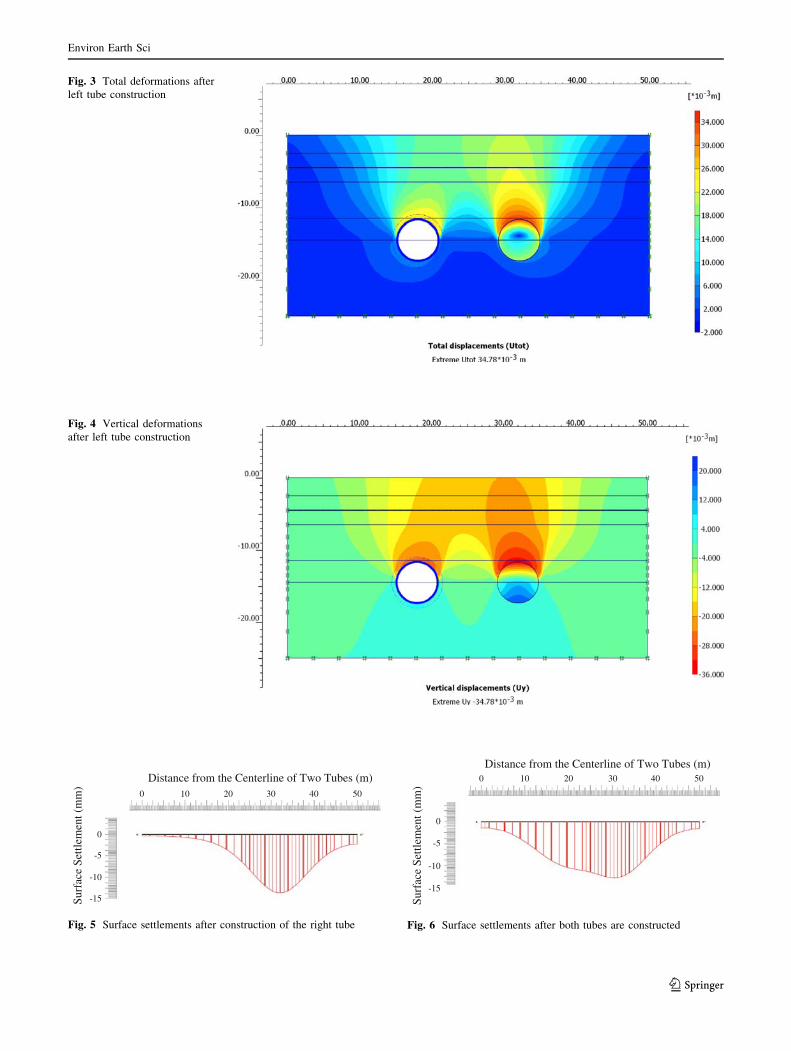
Fig. 3 Total deformations after
left tube construction
Fig. 4 Vertical deformations
after left tube construction
0
-5
-10
-15 Surf
ace
Settl
emen
t (m
m)
0 10 20 30 40 50
Distance from the Centerline of Two Tubes (m)
Fig. 5 Surface settlements after construction of the right tube
0 10 20 30 40 50
Distance from the Centerline of Two Tubes (m)
0
-5
-10
-15
Surf
ace
Settl
emen
t (m
m)
Fig. 6 Surface settlements after both tubes are constructed
Environ Earth Sci
123
is based on averages of some empirical approaches given in
Eqs. 2–6:
i ¼ i1 þ i2 þ i3 þ i4
4ð2Þ
i1 ¼ 0:5Z0 ð3Þi2 ¼ 0:43Z0 þ 1:1 ð4Þ
i3 ¼ RZ0
2R
� �0:8
ð5Þ
i4 ¼ 0:9RZ0
2R
� �0:88
ð6Þ
where, Z0 is the tunnel axis depth (m), 14.5 m in this study,
and R is the radius of tunnel, 3.25 m in this study. Equa-
tion 3 was suggested by Glossop (O’Reilly and New 1982)
for mostly cohesive grounds; Eq. 4 was suggested by
O’Reilly and New (1982) for excavation of cohesive
grounds by shielded machines; Eq. 5 was suggested by
Schmidt (1969) for excavation of clays by shielded
machines; Eq. 6 was suggested by Arioglu (1992) for
excavation of all types of soils by shielded machines. As a
result, the average i value is estimated to be 6.6 m in this
study.
There are several suggested empirical methods for the
prediction of the maximum surface settlement (Smax).
Schmidt suggested a model for the estimation of Smax value
for a single tunnel in 1969 as given in Eq. 7 (through
Arioglu 1992):
Smax ¼ 0:0125KR2
i
� �ð7Þ
where, K is the volume loss (%). Arioglu (1992), based on
field data, found a good relationship between K and N
(stability ratio) for face-pressurized TBM cases as in Eq. 8:
K ¼ 0:87e0:26N ¼ 0:87e0:26
cnZ0þrSþrTCU
� �
ð8Þ
where cn is the natural unit weight of the soil (kN/m3), the
weighted averages for all the layers, which is 19 kN/m3 in
this study; rS is the total surcharge pressure (kPa), assumed
to be 20 kPa in this study; rT is TBM face pressure (kPa),
which is 300 kPa in this study; and CU is the undrained
cohesion of the soil (kPa), the weighted averages for all the
layers, which is 50 kPa in this study assuming that CU is
equal to SU (undrained shear strength of the soil). All
averages are estimated up to very dense sand, excluding
hard clay, since the tunnel axis passes around the contact
between very dense sand and hard clay. The model yields
17.1 mm of initial maximum surface settlement.
Herzog suggested a model for the estimation of Smax
value in 1985 as given in Eq. 9 for a single tunnel and
Eq. 10 for twin tunnels (through Arioglu 1992):
Smax ¼ 0:785 cnZ0 þ rSð Þ D2
iE
� �ð9Þ
Smax ¼ 4:71 cnZ0 þ rSð Þ D2
3iþ að ÞE
� �ð10Þ
where, E is the elasticity modulus of formation (kPa), the
weighted averages for all the layers, which is 30,000 kPa in
this study, and a is the distance between the tunnel axes,
which is 14 m in this study. The model yields 49.9 and
58.7 mm of initial maximum surface settlements for the
right and the left tube tunnel, which is 100 mm behind the
right tube, respectively.
There are several analytical models for the prediction of
short-term maximum surface settlements for shielded tun-
neling operations (Lee et al. 1992; Loganathan and Poulos
1998; Chi et al. 2001; Chou and Bobet 2002; Park 2004).
The method suggested by Loganathan and Poulos (1998) is
used in this study. In this method, a theoretical gap
0
-5
-10
-15 Surf
ace
Settl
emen
t (m
m) 0 10 20 30 40 50
Distance from the Centerline of Two Tubes (m)
Fig. 7 Total deformation vectors on the surface
Table 3 Maximum surface settlements obtained by FEM
Volume loss (%) Right tube (mm) Left tube (mm)
0.5 12.35 20.22
0.75 14.19 22.43
1.0 15.89 24.34
1.5 18.62 27.49
Maximum Surface Settlements
0
5
10
15
20
25
30
0.5 0.75 1 1.5
Volume Loss (%)
Set
tlem
ent (
mm
)
Right TubeLeft Tube
Fig. 8 Maximum surface settlements for left and right tubes
Environ Earth Sci
123
parameter (g) is defined based on physical gap in the void,
face losses and workmanship value, and then the gap
parameter is incorporated to a closed form solution to
predict elastoplastic ground deformations. The undrained
gap parameter (g) is estimated by Eq. 12:
g ¼ Gp þ U�3D þ w ð12Þ
where Gp is the physical gap (Gp = 2D ? d) representing
the geometric clearance between the outer skin of the
shield and the liner, D is the thickness of the tail shield, d is
the clearance required for erection of the liner, U�3D is the
equivalent 3D elastoplastic deformation at the tunnel face,
and w is a value that takes into account the quality of
workmanship.
Maximum short-term surface settlement is predicted by
theoretical Eq. 13 (Loganathan and Poulos 1998):
S ¼ 4 1� tð ÞR2 Z0
Z20 þ x2
� �4gRþ g2
R2
� �exp
�1:38x2
Z0 þ Rð Þ2
" #
ð13Þ
where, t is undrained Poisson’s ratio, assumed to be of
maximum 0.5; g is the gap parameter (m), which is esti-
mated to be 0.0128 m in this study; and x is transverse
distance from the tunnel centerline (m) and it is assumed to
be 0 m for the maximum surface settlement. The model
yields 23.0 mm of undrained maximum surface settlement.
Other parameters of settlement such as maximum slope,
maximum curvature and so on are not mentioned in this
study.
Verification of predictions by field measurements
and discussion
The results of measurements performed on the surface
monitoring points, by Istanbul Metropolitan Municipality,
are presented in Table 4 for the left and right tubes. As
seen, the average maximum surface settlements are
around 9.6 mm for the right tube and 14.4 mm for the left
tube, which excavates 100 m behind the right tube. The
maximum surface settlements measured around 15.2 mm
for the right tube and 26.3 mm for the left tube. Higher
settlements are expected in the left tube since the previous
TBM excavation activities on the right tube overlaps the
previous deformation. The effect of the left tube exca-
vation on deformations of the right tube is presented in
Fig. 9. As seen, after Lovat TBM in the right tube
excavates nearby the surface monitoring point 25, maxi-
mum surface settlement reaches at around 9 mm; how-
ever, while Herrenknecht TBM in the left tube passes the
same point, maximum surface settlement reaches at
around 29 mm (Fig. 10).
If the construction method applied to the site is con-
sidered, long-term (consolidation) settlements are expected
to be low, since the tail void is grouted immediately after
excavation. The results of predictions mentioned above and
observed maximum surface settlements are summarized in
Table 5.
The methods suggested by Loganathan and Poulos
(1998) and Schmidt (1969) connected with Arioglu’s
suggestion (1992) can predict the maximum short-term
surface settlements only for a single tunnel. Plaxis finite
element and Herzog (1985) models can predict deforma-
tions for twin tubes.
Herzog’s model (1985) yields higher maximum surface
settlements than the observed ones. The reason for that is
that the database of the model includes both shielded
Table 4 Short-term maximum surface settlement values obtained
from surface monitoring point (SMP) measurements between chai-
nage 0 ? 850 and 0 ? 900 m
Left tube Right tube
SMP no. Smax (m) SMP no. Smax (m)
14 -0.0093 33 -0.0142
15 -0.0045 34 -0.0101
16 0.0102 35 -0.0084
17 -0.0263 36 -0.0113
18 -0.0235 37 -0.0070
19 -0.0163 38 -0.0065
20 -0.0183 39 -0.0059
21 -0.0200 40 -0.0074
22 -0.0177 41 -0.0152
23 -0.0248
24 -0.0220
25 -0.0089
26 -0.0075
31 -0.0117
32 -0.0152
Average -0.0144 Average -0.0096
Fig. 9 Settlement parameters and notation
Environ Earth Sci
123
tunnels and NATM (New Austrian Tunneling Method)
tunnels, of which surface settlements are usually higher
compared to shielded tunnels. Schmidt (1969), along with
Arioglu’s suggestion (1992), yields predictions close to
observed values.
Plaxis finite element modeling gives the most realistic
results, provided there is correct assumption of volume loss
parameter, which is usually difficult to predict. The model
provides simulation of excavation, lining, grouting and
face pressure in a realistic manner to predict surface and
sub-surface settlements. The volume loss parameter is
usually assumed to be \1% for excavation with face
pressure-balanced tunnel boring machines. The realized
volume loss in the site is around 1% for this study.
Currently, there is difficulty yet in modeling the defor-
mation behavior of twin tunnels. One of the most impres-
sive studies on this issue was performed by Chapman et al.
(2004). However, Chapman’s semi-theoretical method still
requires enlargement of the database to improve the sug-
gested model in his paper.
Conclusions
In this study, three surface settlement prediction methods
for mechanized twin tunnel excavations between Esenler
and Kirazlı stations of Istanbul Metro Line are applied.
Tunnels of 6.5-m diameters with 14-m distance between
their centers are excavated by EPM tunnel boring
machines. The geologic structure of the area can be clas-
sified as soft ground.
Settlement predictions are performed by using FE
modeling, and semi-theoretical (semi-empirical) and ana-
lytical methods. The measured results after tunneling are
compared to predicted results. These indicate that the FE
model predicts well the short time surface settlements for a
given volume loss value. The results of some semi-theo-
retical and analytical methods are found to be in good
agreement with the FE model, whereas some methods
overestimate the measured settlements. The FE model
predicted the maximum surface settlement as 15.89 mm
(1% volume loss) for the right tube, while the measured
Settlement - Heave
Dis
tanc
e fr
om T
unne
l Fac
e (k
m)
Sur
face
Set
tlem
ent -
Hea
ve (
dm)
Distance from Herrenknetch TBM
Distance from Lovat TBM
-0.200
-0.100
0.000
0.100
0.200
5/11
/200
6
5/18
/200
6
5/25
/200
6
6/1/
2006
6/8/
2006
6/15
/200
6
6/22
/200
6
6/29
/200
6
7/6/
2006
7/13
/200
6
7/20
/200
6
7/27
/200
6
8/3/
2006
8/10
/200
6
8/17
/200
6
8/24
/200
6
8/31
/200
6
9/7/
2006
Date
Fig. 10 The effect of the
left tube excavation on
deformations of the right tube
(surface monitoring point no.
25, located on the axis of the
right tube)
Table 5 Summary of predicted
and observed short-term
maximum surface settlements
Prediction method Maximum surface settlement
Plaxis FEM (left tube) 20.22 mm (0.5% volume loss)
24.34 mm (1% volume loss
Plaxis FEM (right tube) 12.35 mm (0.5% volume loss)
15.89 mm (1% volume loss)
Schmidt (1969) and Arioglu (1992) 17.1 mm
Loganathan and Poulos (1998) 23.0 mm
Herzog (1985), right tube 49.9 mm
Herzog (1985), left tube 58.7 mm
Observed (right tube) 9.6 mm average, 15.2 mm maximum
Observed (left tube) 14.4 mm average, 26.3 mm maximum
Environ Earth Sci
123
maximum settlement was 15.20 mm. For the left tube
(opened after the right), FE prediction was 24.34 mm,
while measured maximum settlement was 26.30 mm.
Acknowledgments The authors greatly appreciate the Istanbul
Metropolitan Municipality, IETT, Prof. Dr. Nuh Bilgin and Prof. Dr.
Ergin Arioglu for their valuable support and contributions to the
studies.
References
Arioglu E (1992) Surface movements due to tunneling activities in
urban areas and minimization of building damages. Short
Course, Istanbul Technical University, Mining Engineering
Department (in Turkish)
Attewell PB, Yeates J, Selby AR (1986) Soil movement induced by
tunneling and their effects on pipelines and structures. Chapman
and Hall, New York
Ayson Drill Research and Build. A.S. (2005) Otogar-Bagcılar Station
Geological-Geotechnical Report. July (in Turkish)
Bilgin N, Ozbayir T, Sozak N, Eyigun Y (2009) Factors affecting the
economy and the efficiency of metro tunnel drivage with two
TBM’s in Istanbul in very fractured rock. ITA-World Tunnel
Congress 2009, Safe tunnelling for the City and for the
environment, 23–28 May, Budapest, Hungary
Chapman DN, Rogers CDF, Hunt DVL (2004) Predicting the
settlements above twin tunnels constructed in soft ground. In:
Shirlaw JN, Zhao J, Krishnan R (eds) Proceedings of the 30th
ITA-AITES World Tunnel Congress, 22–27 May, Singapore
Chi SY, Chern JC, Lin CC (2001) Optimized back analysis for
tunneling-induced ground movement using equivalent ground
loss model. Tunn Undergr Space Technol 16:159–165
Chou WI, Bobet A (2002) Predictions of ground deformations in
shallow tunnels in clay. Tunn Undergr Space Technol 17:3–19
Ellis D (2005) High standards in Heatrow’s art. Tunnels and
Tunnelling International, pp 29–34
Herzog M (1985) Surface subsidence above shallow tunnels,
Bautechnik 62(11):375–377 (in German)
Karakus M, Fowell RJ (2003) Effects of different tunnel face advance
excavation on the settlement by FEM. Tunn Undergr Space
Technol 18:513–523
Lee KM, Rowe RK, Lo KY (1992) Subsidence owing to tunneling I:
estimating the gap parameter. Can Geotech J 29:929–940
Loganathan N, Poulos HG (1998) Analytical prediction for tunnel-
ling-induced ground movements in clays. J Geotech Geoenviron
Eng 124:846–856
Minguez F, Gregory A, Guglielmetti V (2005) Best practice in EPB
management. Tunnels and Tunnelling International, pp 21–25
O’Reilly MP, New BM (1982) Settlement above tunnels in the United
Kingdom—their magnitude and prediction. Proceedings of the
Tunneling 82 Conference, Brighton, pp 173–181
Ocak I (2009) Environmental effects of tunnel excavation in soft and
shallow ground with EPBM: the case of Istanbul. Environ Earth
Sci 59:347–352
Park KH (2004) Elastic solution for tunneling-induced ground
movements in clays. Int J Geomech 4:310–318
Schmidt B (1969) A method of estimating surface settlement above
tunnels constructed in soft ground. Can Geotech J 20:11–22
Schmidt B (1974) Prediction of settlements due to tunneling in soil:
three case histories. Rapid Excavation and Tunneling Confer-
ence, pp 1179–1199
Suwansawat S, Einstein HH (2006) Artificial neural networks for
predicting the maximum surface settlement caused by EPB
shield tunnelling. Tunn Undergr Space Technol 21:133–150
Tan WL, Ranjit PG (2003) Parameters and considerations in soft
ground tunnelling. Electron J Geotech Eng 344
Environ Earth Sci
123


