Embed Size (px)
Citation preview

arX
iv:1
011.
0690
v2 [
astr
o-ph
.GA
] 4
Nov
201
0
Mon. Not. R. Astron. Soc. 000, (0000) Printed 5 November 2010 (MN LATEX style file v2.2)
Survey of O VI absorption in the Large Magellanic Cloud
A. Pathak⋆, A. C. Pradhan, N. V. Sujatha and J. MurthyIndian Institute of Astrophysics, Koramangala II Block, Bangalore 560034, India
ABSTRACT
We present a survey of interstellar O VI absorption in the Large Magellanic Cloud(LMC) towards 70 lines of sight based on Far Ultraviolet Spectroscopic Explorer(FUSE) observations. The survey covers O VI absorption in a large number of ob-jects in different environmental conditions of the LMC. Overall, a high abundance ofO VI is present in active and inactive regions of the LMC with mean log N(O VI)= 14.23 atoms cm−2. There is no correlation observed between O VI absorption andemissions from the hot gas (X-ray surface brightness) or the warm gas (Hα surfacebrightness). O VI absorption in the LMC is patchy and the properties are similar tothat of the Milky Way (MW). In comparison to the Small Magellanic Cloud (SMC),O VI is lower in abundance even though SMC has a lower metallicity compared to theLMC and the MW. We present observations in 10 superbubbles of the LMC of whichwe detect O VI absorption in 5 superbubbles for the first time and the superbubblesshow an excess O VI absorption of about 40% compared to non-superbubble lines ofsight. We have also studied the properties of O VI absorption in the 30 Doradus region.Even though O VI does not show any correlation with X-ray emission for the LMC,a good correlation between log N(O VI) and X-ray surface brightness for 30 Doradusregion is present. We also find that O VI abundance decreases with increasing distancefrom the star cluster R136.
Key words: galaxies: ISM – ISM: structure – ISM: atoms – galaxies: individual:Large Magellanic Cloud – ultraviolet: ISM
1 INTRODUCTION
The interstellar medium (ISM) of the Milky Way (MW) andother galaxies is a complex mix of gas and dust. The pro-cesses involved in maintaining the mass, energy, and ion-ization balance of the ISM are not properly understood.High resolution ultraviolet (UV) spectra provides informa-tion about these processes as many absorption lines ofatoms, ions and molecules are present in the UV band ofthe electromagnetic spectrum, one of the most importantof which is O+5 (O VI), a diagnostic of temperatures ofabout 3 × 10⁵ K (Cox 2005). Such temperatures are foundat the interface of hot (T > 106 K) and warm (T ∼ 104
K) ionized gas in the ISM. Thus, O VI absorption lines at1031.9 A and 1037.6 A are crucial diagnostics of the en-ergetic processes of interface environments in the ISM ofgalaxies. The gas at such temperatures is cooling radiativelyand the cooling is essentially independent of density, metal-licity and the heating mechanism (Edgar & Chevalier 1986;Heckman et al. 2002). O VI formation by photo-ionizationis unable to explain the observed abundances, given the en-ergy of photons needed to get such high ionization (114 eV).
⋆ e-mail: [email protected]; [email protected]
O VI is mostly produced by shock heating and is collisionallyionized (Indebetouw & Shull 2004).
Previous studies of O VI have been limited to ob-servations by the Copernicus satellite (Jenkins 1978a,b)and the Hopkins Ultraviolet Telescope (Dixon et al. 1996).Shelton & Cox (1994) concluded that the hot gas ex-ists in discrete regions rather than being continuouslypresent in the ISM. The launch of Far Ultraviolet Spectro-scopic Explorer (FUSE); (Moos et al. 2000; Sahnow et al.2000) enabled a wider and more descriptive study ofO VI absorption and emission in the ISM and the in-tergalactic medium (IGM). With a spectral resolutionof 20,000, FUSE has been able to resolve fine de-tails of O VI in many different environments. FUSE ob-served O VI absorption lines in the local ISM of theMW (Savage et al. 2000; Wakker et al. 2003; Oegerle et al.2005; Savage & Lehner 2006; Welsh & Lallement 2008),disk of the MW (Bowen et al. 2008), halo of the MW(Savage et al. 2003), the Large Magellanic Cloud (LMC;Howk et al. (2002a); Lehner & Howk (2007)), the SmallMagellanic Cloud (SMC; Hoopes et al. (2002)), starburstgalaxies (Grimes et al. 2009), IGM (Danforth & Shull 2005;Danforth et al. 2006), etc. Apart from absorption studies,FUSE has also recorded O VI spectra in emission from ob-servations of diffuse ISM in the MW (Shelton et al. 2001;

2 A. Pathak et al.
Shelton 2002; Dixon et al. 2006; Dixon & Sankrit 2008) andsuperbubbles in the LMC (Sankrit & Dixon 2007). Thesestudies have not only augmented our knowledge about theformation and distribution of O VI in the MW and the Mag-ellanic Clouds but have also helped in better understandingof the complexities of the ISM.
Owing to the contiguity to the MW (∼ 50 kpc; Feast(1999)) and being nearly a face-on galaxy with a low in-clination angle (∼ 35◦; van der Marel & Cioni (2001)), theLMC has been the subject of numerous studies to under-stand and interpret the properties of ISM. Recent stud-ies of the ISM in the LMC include observations of dif-fuse UV emission (Cole et al. 1999a,b; Pradhan et al. 2010),the SPITZER infrared dust survey (SAGE; Meixner et al.(2006); Bernard et al. (2008)), the HI survey (Kim et al.2003), the Hα survey (Gaustad et al. 2001), the O VI dis-tribution (Howk et al. 2002a), and the survey of hot gas inthe X-ray bands (Snowden & Petre 1994). More recently,Lehner & Howk (2007) analyzed the absorption of O VI, CIV, Si IV and N V ions towards four early type stars in theLMC and provide crucial details about the environmentsthat may be probed through the study of these ions.
Howk et al. (2002a) surveyed the distribution and kine-matics of O VI towards 12 early type stars in the LMC, whichwas very selective and the targets were restricted to Wolf-Rayet stars and O-type stars of spectral types O7 and ear-lier. Here we report an extensive survey of O VI absorptionat 1032 A in the LMC. The observation log is given in Table1. The results presented in this survey become important asthey not only provide a detailed mapping of the interfacegas traced by O VI but also throw light on the small scalestructure of the O VI distribution in various regions of theLMC. Fig. 1 shows the lines of sight and different regionsof the LMC including the superbubbles (marked by circles)that have been studied in this survey.
2 OBSERVATIONS AND DATA ANALYSIS
2.1 FUSE data analysis and possible
contamination
The FUSE mission and its operations are described byMoos et al. (2000) and Sahnow et al. (2000). Observationsare made through one of 3 apertures: the HIRS (1.25′′ ×20′′); the MDRS (4′′ × 20′′); and the LWRS (30′′ × 30′′),with all three obtaining data simultaneously. Depending onthe coating of the spectrograph, observations are possiblethrough SiC and LiF channels that are further divided intoeight different segments; the SiC 1A, SiC 2A, SiC 1B andSiC 2B segments covering the wavelength range 905 to 1105A and LiF 1A, LiF 2A, LiF 1B and LiF 2B segments cover-ing the wavelength range 1000 to 1187 A. The data from SiC2B segment have been known to suffer from a fixed noise.The sensitivity of LiF 1A segment near 1032 A is almostdouble that of other segments and therefore, we have usedonly the LiF 1A observations (Sahnow et al. 2000). Most ofthe data are from the large aperture LWRS with a few fromthe MDRS aperture.
The fully calibrated FUSE spectra were downloadedfrom the Multimission Archive at STScI (MAST) processedby the latest FUSE data reduction pipeline (CALFUSE ver-sion 3.2; Dixon et al. (2007)). FUSE made more than 600
pointings in and around the LMC. Several of the observa-tions were rejected initially by just looking at the spectra(with non-existent or low signal-to-noise of O VI absorption).70 unique FUSE targets were selected based mainly on thesimplicity of the continuum fitting in the vicinity of O VI (at1031.9 A). O VI absorption for 1 of the sightline has been re-ported by Friedman et al. (2000), 11 have been covered byHowk et al. (2002a) survey, 3 by Danforth & Blair (2006)and 1 by Lehner & Howk (2007). Spectral types and otherstellar information was taken from Danforth et al. (2002)and Blair et al. (2009). We have downgraded all the spectrareported here to 35 km s−1 to have a higher signal-to-noise.This has been done for all the spectra irrespective of thequality to maintain uniformity in the data analysis proce-dure.
Fitting the stellar continuum in the neighbourhood ofthe O VI absorption profile has been discussed in detail byFriedman et al. (2000) and Howk et al. (2002a). Howk et al.(2002a) have limited their study to early type stars basedon the fact that these stars have completely developed O VI
P Cygni profiles that are easier to fit as the early type starshave a high mass loss rate and have minimal wind variations.Lehner et al. (2001, 2003) have shown that for Galactic sightlines, the stellar wind variability has negligible effect on O VI
absorption but may introduce substantial errors towards tar-gets in the Magellanic clouds. Lehner et al. (2001) did findvariation in the equivalent width and column density to-wards a LMC star when estimated at two different times.This warrants for extra care while fitting the continuum forMagellanic cloud targets.
As discussed above, for the LMC, the estimation of stel-lar continuum in the vicinity of O VI absorption is not triv-ial. Our background targets are mostly early O and B typestars with several Wolf-Rayets. These have been selectedbased on the fact that the the continuum near the O VI
absorption at 1031.9 A is simple to fit. A few of the linesof sight do show a complex behaviour near O VI absorption(for e.g., Sk-67D05, Sk-67D168, Sk-70D115, etc.). For suchexceptional lines of sight, the complexity in the continuumfitting is due to a local dip or a sudden rise near the O VI
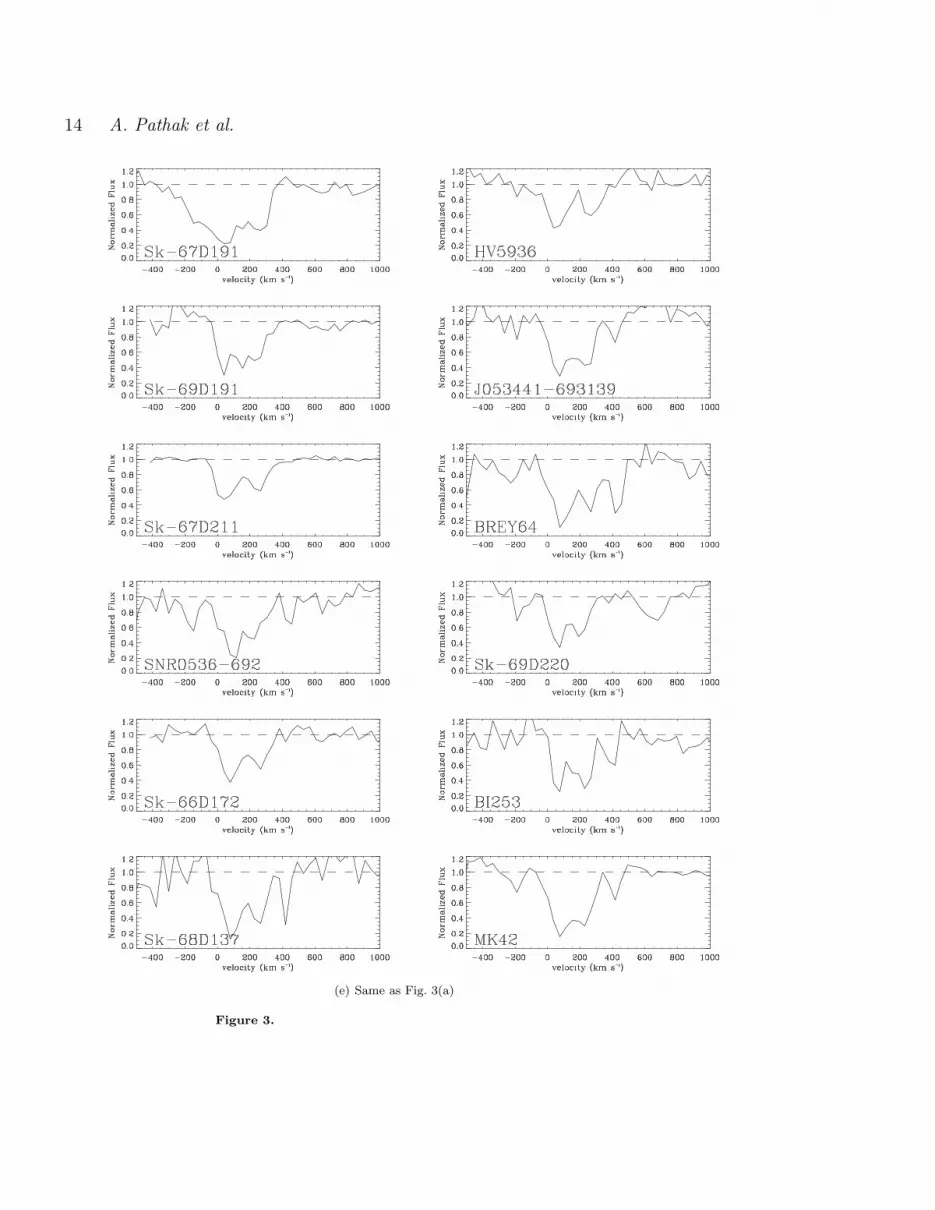
absorption and these targets needed a comparatively higherorder polynomial for the fitting. For a flavour of the com-plexity involved, sample continuum fitting for three lines ofsight, BI13, Sk-70D115 and Sk-67D168 are shown in Fig. 2.Following the fitting procedure of Howk et al. (2002a) andSembach & Savage (1992), the local stellar continuum wasestimated for all the targets and were fitted by a Legen-dre polynomial fit of low order (6 5). Several continua weretested and the uncertainties involved for the complete dataset were used in the measurement of the O VI column densi-ties. The normalized spectra in the vicinity of O VI absorp-tion are presented in Fig. 3.
The O VI absorption may be contaminated by absorp-tion from molecular hydrogen, however, it is minimal in theLMC velocity range. This is because the molecular fractionof H2 in the LMC is only about 12% of the molecular frac-tion in the Galactic disk (Tumlinson et al. 2002). The closestabsorption line of H2 to O VI absorption in the LMC lies at1032.35 A (at vlsr ∼ +123 km s−1), which is due to (6–0)R(4) transition. An estimation of possible contamination byH2 towards 12 lines of sight in the LMC has been done byHowk et al. (2002a) where they find that H2 absorption does

Survey of O VI in the LMC 3
not affect the LMC O VI column densities significantly. TheH2 absorption feature are usually not a problem for mea-surements of O VI absorption at velocities more than 20km s−1 apart (Savage et al. (2003) and references therein).We estimate the contamination from H2 lines by fitting the(6–0) P(3) H2 transition for the MW and (6–0) R(4) H2
transition for the LMC (Fig. 4). From this, we are able toestimate the contamination due to (6–0) R(4) MW H2 lineand (6–0) P(3) LMC H2 line. Noticeable contamination isseen for the sightlines Sk-71D45 and Sk-67D250 which iswell within the error bar of the derived column densities.An example of a sightline is also shown in Fig. 4 in whichthe LMC O VI absorption is free from any contaminationfrom molecular hydrogen. Owing to the negligible contribu-tion, we have not excluded the contamination by H2 in theO VI measurements for the LMC.
Another possible contaminant is the (6–0) R(0) transi-tion of the HD molecule at 1031.91 A that overlaps withthe MW O VI absorption. Several lines of HD moleculeis covered by FUSE (see Sembach (1999) for a completelist). H2 column densities are significantly low in the LMCand contamination due to molecular hydrogen lines is non-significant for O VI measurements in the LMC. Absorp-tion due to HD is about 4 orders weaker compared to H2
transitions. Therefore, we neglect any contribution from HDmolecule to the column densities of O VI in the LMC.
2.2 Measurement of O VI column densities
The measurement of equivalent widths and column densitiesof O VI absorption for all the lines of sight were done follow-ing Savage & Sembach (1991); Sembach & Savage (1992)and Howk et al. (2002a). This apparent optical depth tech-nique (Savage & Sembach 1991) is now commonly used inthe analysis of interstellar absorption lines and is applicableto cases with non-saturated absorption profiles. Briefly thetechnique uses an apparent optical depth in terms of veloc-ity, i.e., an instrumentally blurred version of the true opticaldepth, given as
τa(v) = ln[Io(v)/Iobs(v)], (1)
where Io is the estimated continuum intensity and Iobs is theintensity of the absorption line as a function of velocity. Ifthe resolution of the instrument is very high compared to theFWHM of the absorption line, the apparent optical depthis a very good representation of the true optical depth. Theapparent column density (Na(v) [atoms cm−2 (km s−1)−1])is calculated by the following relation
Na(v) =mecτa(v)
πe2fλ= 3.768 × 10¹⁴
τa(v)
fλ, (2)
where λ is the wavelength (in A) and f is the oscillatorstrength of the atomic species (for O VI, f value of 0.1325 hasbeen adopted from Yan et al. (1998)). Similar to Howk et al.(2002a), we find that the 1032 A O VI profile is broad andis fully resolved by FUSE. However, the weaker absorptionof the O VI doublet at 1037.6 A is found to be inseparablefrom the CII* and H2 absorption.
The details of the apparent optical depth measure-ments are listed in Table 2. The overlap of the O VI ab-sorption of the MW and the LMC does not allow a pre-cise measurement of column densities for the LMC. For the
lines of sight (Sk-65D21, Sk-67D69, Sk-67D105, HV2543, Sk-66D100, HV5936, Sk-67D211, Sk-69D220, Sk-66D172, Sk-68D137, D301-1005, and D301-NW8) where the LMC O VI
is distinct from the MW O VI, the limits of velocities overwhich integration was performed were easy to obtain. Takingcue from these lines of sight, we estimate the lower velocitylimit for the lines of sight where the LMC O VI was not sepa-rated from the MWO VI. The errors in the equivalent widthsand column densities are 1σ uncertainties derived using theuncertainty in the FUSE data and the fitting procedures.The principal contributor to these errors is the ambiguity inthe continuum fitting of several of the spectra.
3 DISTRIBUTION AND PROPERTIES OF
O VI IN THE LMC
3.1 Abundance and linewidth of O VI
The LMC spectra were selected based on the quality of thespectra around O VI spectral feature. The survey presentedhere has more-or-less complete coverage of the well knownregions of the LMC such as 30 Doradus, N11, LMC 4, etc.,and thus, is very useful in studying the variation of O VI atsmall scales as well. We find a significant amount of varia-tion in the O VI column densities in a single region and indifferent regions of the LMC.
Our data cover a wide range of targets; O type stars,B type stars, Wolf-Rayet objects, supernova remnants, etc.The complete list of the background targets is provided inTable 1. These observations give fine details of the smallscale structure of O VI column density in the LMC probingto a scale of ∼ 10 pc in some regions. We find the O VI
absorption in the LMC to be very patchy as is true for theMW. The O VI column density varies from the lowest valueof 5.28 ×10¹³ atoms cm−2 near a HII region (DEM 7) tothe highest value of 3.74 ×10¹⁴ atoms cm−2 just north ofthe LMC bar. Howk et al. (2002a) report the distribution ofO VI in the LMC to be patchy as well with the log N(O VI)value in the LMC varying from 13.9 to 14.6 atoms cm−2 anda mean of 14.37 atoms cm−2. Their data did not provide anysmall scale variation in the column density of O VI with thesmallest scale probed is about 450–500 pc.
Given the coverage of our data, we have studied thevariation in O VI absorption in different regions of theLMC. We find that the 30 Doradus and SN 1987 A re-gions dominate in terms of the abundance of O VI. Themean and median values of log N(O VI) for targets inand around 30 Doradus and SNR 1987A are 14.30 and14.27 atoms cm−2 respectively. 30 Doradus is the largestHII region of LMC with a dense concentration of earlytype massive stars and has thus, attracted extensive re-search in different wavelength bands (Walborn et al. 1992;Parker 1993; Malumuth & Heap 1994; Walborn & Blades1997; Townsley et al. 2006; Indebetouw et al. 2009). We dis-cuss in detail about the O VI distribution and its propertiesin 30 Doradus region in section 5.
N11 region, which is associated with several OB asso-ciations and has a superbubble at its center, shows a highvalue of O VI column density. The mean of log N(O VI) inthe N11 region is 14.21 atoms cm−2.
Another interesting region is the LMC 4 Supergiant

4 A. Pathak et al.
shell that includes the Shapley Constellation III, whichis one of the largest region associated with star for-mation (Dopita et al. 1985; Dolphin & Hunter 1998). Thelog N(O VI) value in LMC 4 supershell varies from a min-imum of 13.86 atoms cm−2 to a maximum of 14.45 atomscm−2 with a mean value of 14.20 atoms cm−2 and a medianvalue of 14.25 atoms cm−2. Other regions of the LMC alsoshow patchiness in the O VI distribution. Statistically, themean of the O VI column density in the LMC is 1.88 ×10¹⁴
atoms cm−2 which is lower than 2.34 ×10¹⁴ atoms cm−2
given by Howk et al. (2002) for 12 lines of sight. The differ-ence is most likely due to the wide coverage of backgroundtargets in our data. The median value of the O VI columndensity is 1.66 ×10¹⁴ atoms cm−2 which also is less thanthe value reported by Howk et al. (2002a). Overall we findthat there is an ubiquitous presence of O VI throughout theLMC.
The kinematics of O VI in the LMC is difficult to studybecause of the ambiguity in separating the LMC O VI ab-sorption from the MW absorption. For some of the FUSEtargets, i.e., for Sk-65D21, Sk-67D69, Sk-67D105, HV2543,Sk-66D100, HV5936, Sk-67D211, Sk-69D220, Sk-66D172,Sk-68D137, D301-1005, and D301-NW8, O VI absorption atLMC velocities are distinct from the MW (Fig. 3). Linewidthfor the LMC O VI profiles are obtained with relatively lesserror for these lines of sight. The LMC O VI absorptionprofiles have all been fitted with a single Gaussian. The cor-responding FWHM for these lines of sight are 55, 85, 78, 90,90, 113, 100, 85, 105, 94, 107, and 91 km s−1 respectively.The temperature range estimated from these widths is T ∼1 × 10⁶ – 5 × 10⁶ K. O VI abundance is maximum at a tem-perature of 3 × 10⁵ K, thus, higher FWHM of these profilesis probably due to other broadening mechanisms such asmore than one velocity component and/or collision and tur-bulence. This also represents the kinematic flow structure ofO VI in the LMC.
The linewidth for the MW O VI profiles are narrowerthan the LMC profiles (Savage et al. 2003; Oegerle et al.2005; Savage & Lehner 2006). For the Galactic halo,Savage et al. (2003) report a range for σ (linewidth) from16 to 65 km s−1 (corresponding FWHM range is 38–153km s−1). Oegerle et al. (2005), for the local ISM, reportaverage σ to be 16 km s−1 (FWHM = 38 km s−1) whileSavage & Lehner (2006) report σ values ranging from 15km s−1 to 36 km s−1 (FWHM ranging from 35 km s−1 to 85km s−1). The linewidth of the SMC O VI absorption profileare comparable to that of the LMC. The FWHM range forthe SMC O VI absorption is from 82 to 115 km s−1 witha mean of 94 km s−1 (Hoopes et al. 2002). We obtained amean FWHM value of 91 km s−1 for the LMC selected linesof sight. Howk et al. (2002a) have compared O VI absorp-tion profiles of the LMC with Fe II absorption and find thatthe Fe II profiles are much narrower suggesting that thethermal broadening effect for O VI absorption is much moresignificant.
3.2 Comparison with the MW and the SMC
The MW and the SMC offer a different ISM environmentcompared to the LMC especially due to the difference in themetallicity. The absorption profiles of the MW O VI are dif-ferent from the LMC O VI and sometimes these profiles are
difficult to separate in an unambiguous manner, thus, a com-parison of the kinematics is not possible. Howk et al. (2002a)have compared the O VI absorption with Fe II absorption at1125.45 A (fig. 9 in Howk et al. (2002a)). While, the Fe IIprofiles for the MW and the LMC are clearly separated fromeach other, the O VI absorption suffers an overlap. This isdue to the difference in width of the two absorption. Theoverlap of the MW O VI absorption profile with the LMCO VI absorption constrained Howk et al. (2002a) to arriveat a definite conclusion about the existence of outflows fromthe LMC. Following the discussion about the distribution ofO VI in the LMC in the previous section, we now present anoverview of O VI in the MW and the SMC.
O VI in the MW has been extensively studied sincethe launch of FUSE (Savage et al. 2000; Howk et al. 2002b;Wakker et al. 2003; Savage et al. 2003; Oegerle et al. 2005;Savage & Lehner 2006; Bowen et al. 2008). Savage et al.(2000) were the first to study the O VI absorption in thedisk and halo of the MW as seen towards 11 extragalacticobjects (active galactic nuclei) using FUSE, confirming thelarge scale presence of hot gas in the halo (Spitzer 1956).The authors find that log N⊥(O VI) varies from 13.80 to14.64 atoms cm−2 and the distribution of O VI is quitepatchy. To compare with the projected O VI column den-sity on the plane of the MW, we calculated the projectionof O VI column on to the plane of the LMC. Taking the in-clination angle of the LMC to be 33◦, we find the mean valueof log N⊥(O VI) ≡ log N(O VI) cos θ = 14.16 atoms cm−2.Savage et al. (2000) quote a mean value of 14.29 atoms cm−2
for their sample. The median value of our sample is 14.14atoms cm−2, while for the Savage et al. (2000) sample, it is14.21 atoms cm−2.
Savage et al. (2003) report FUSE observations of O VI
absorption towards 100 extragalactic lines of sight to studythe properties and distribution of O VI in the galactic halo.The average log N (O VI) for the complete sample is 14.36atoms cm−2 while log N (O VI) sin |b| value for the completesample is 14.21 atoms cm−2. The results reveal that thereare substantial differences in the values of log N(O VI) andlog N(O VI) sin|b| in the northern Galactic hemisphere com-pared to the southern Galactic hemisphere. The patchinessin the distribution of O VI absorption is found to be similarover angular scales extending from 6 1◦ to 180◦. An exten-sive survey of O VI in the MW disk has been reported byBowen et al. (2008) in which the authors have studied O VI
column density towards 148 early type stars. The correla-tion between O VI column density and effective distance toa star establishes the fact that the O VI is interstellar in na-ture and points to the universal presence of the interstellarphenomena that gives rise to O VI throughout the Galaxy.
Hoopes et al. (2002) have surveyed O VI absorptiontowards 18 early type stars in the SMC and report awidespread presence of O VI. The mean value of log N(O VI)in the SMC is 14.53, which is higher than the LMC and theMW values. The O VI column density in the SMC correlateswith the distance from NGC 346, a star forming region thatshows the highest abundance of O VI in the SMC.
3.3 Comparison with X-ray and Hα
The LMC has been the focus of Hα and X-ray surveys tosearch for ionized structures in the ISM. Hα surveys have

Survey of O VI in the LMC 5
revealed the presence of HII regions, supernova remnants,and large scale structures including superbubbles and super-shells (Davies et al. 1976), whereas, X-ray observations havebeen done to study bright X-ray sources (Trumper et al.1991), the hot gas in the ISM (Wang et al. 1989, 1991)and diffuse X-ray emission (Bomans et al. 1994). Since O VI
traces the ISM gas with temperatures ∼ 105K, which is atthe interface between hot gas (temperature > 106K) tracedby X-rays and warm gas (temperature ∼ 104K) traced byHα, correlation between O VI abundance and X-ray and Hα
emissions is expected.The O VI observations cover specific regions of the LMC
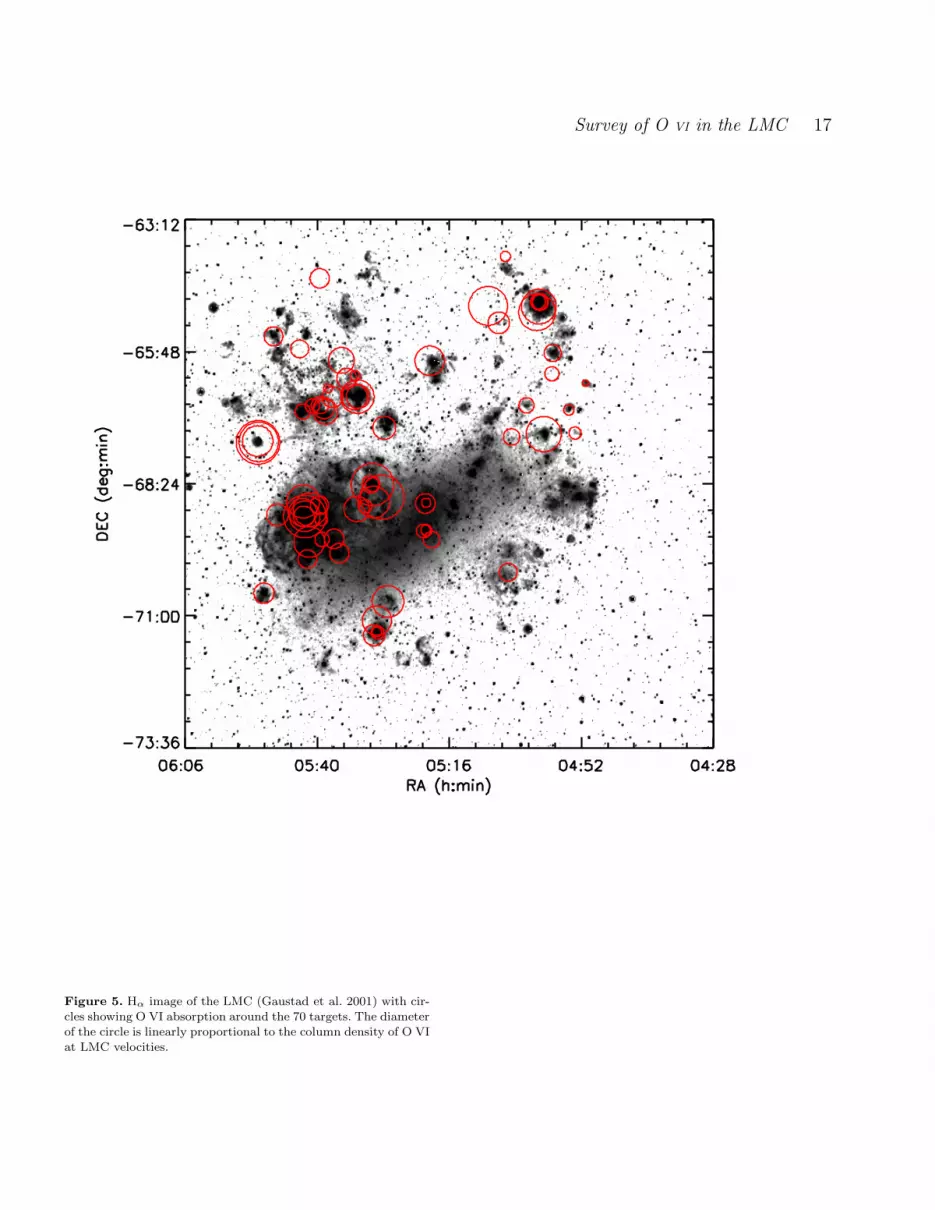
with varying environmental conditions. To get an idea aboutthe variation of O VI column densities with different environ-ments in the LMC, we have overlaid O VI column densitiesas circles on Hα image (Gaustad et al. (2001); Fig. 5). Thediameter of the circle is linearly proportional to log N(O VI).Interestingly, it is noted that O VI abundance is high in re-gions with low Hα and X-ray emissions, i.e., regions thatare relatively inactive. However, regions like superbubblesare O VI rich, for e.g., 30 Doradus C and N11. The grosspicture suggests that O VI does not correlate with either Hα
or X-ray emissions. We have plotted log N(O VI) against logrelative Hα and X-ray surface brightnesses to have a bet-ter insight. The X-ray surface brightness is obtained fromROSAT PSPC mosaic image of the LMC covering the en-ergy range 0.5–2.0 keV (Snowden & Petre 1994). Figures 6and 7 show the correlation of log N(O VI) with Hα and X-raysurface brightnesses for the LMC barring five lines of sight inthe X-ray correlation plot. Four of the excluded lines of sight(Sk-67D250, D301-1005, D301-NW8 and Sk-65D63) are notcovered by the X-ray observations and one (Sk-69D257) hasextremely high X-ray emission (about 2 orders of magnitudehigher than other lines of sight). The Hα and X-ray surfacebrightness are measured by re-binning the corresponding im-ages to increase the signal to noise. The lack of correlation isevident in both plots, as also found by Howk et al. (2002a).Since, Hα traces warm ISM and star formation, there seemsto be no direct relation between O VI formation and theseprocesses. A better correlation with X-ray is expected asthe hot gas traced by X-ray is presumed to cool throughtemperatures where O VI formation takes place. There isa high abundance of O VI in supernova remnants and su-perbubbles of the LMC, whereas, bright X-ray emission isobserved mostly from the supernova remnants of the LMC.X-ray emission associated with supernova remnants in theLMC is a factor of 2 to 3 times greater than the X-ray emis-sion associated with supergiant shells and the Bar in theLMC (Points et al. 2001).
4 O VI IN SUPERBUBBLES OF THE LMC
Superbubbles may be formed due to the strong stellar windfrom young stars and/or supernova explosions forming a lo-cal cavity in the surrounding ISM. These are excellent exam-ples of the interaction of young hot stars and the ISM. Super-bubbles contain hot gas (∼ 106K) that is heated by shockscreated by stellar winds (Castor et al. 1975; Weaver et al.1977; Chu & Mac Low 1990), which is an ideal conditionfor the formation of O VI. The LMC hosts more than 20superbubbles and recently O VI has been detected in a su-
perbubble N70 (Danforth & Blair 2006), where they havereported around 60% excess in abundance of O VI in com-parison to non-superbubble lines of sight in the proximityof N70. The authors conclude that superbubbles act as lo-cal O VI reservoirs and have a different absorption profilecompared to the non-superbubble O VI absorption profiles.They find that the O VI is formed by the thermal conductionbetween the interior hot X-ray producing gas and the coolphoto-ionized shell of N70. Sankrit & Dixon (2007) have de-tected O VI in emission in several superbubbles in the LMCfurther emphasizing that superbubbles are important con-tributors to the overall O VI budget.
We have 22 O VI observations covering 10 superbubbles.Of the 22 observations, 3 are in N70 (Sk-67D250, D301-1005 and D301-NW8) which have already been reported byDanforth & Blair (2006) and 4 are in N144, N204, N206 andN154 respectively which have been discussed by Howk et al.(2002a). We report 15 new observations of O VI absorptionin the superbubbles 30 Doradus C, N158, N11, N51, andN57. Significant variation in O VI abundance exists towardsthese lines of sight. The minimum value of log N(O VI) is14.04 atoms cm−2 in superbubble N206 and the maximumvalue of log N(O VI) is 14.57 atoms cm−2 in superbubbleN70. The properties of O VI in superbubbles reported hereare tabulated in Table 3. Comparing the abundance of O VI
for the superbubble and non-superbubble lines of sight, wefind that the mean log N(O VI) for superbubble lines of sightis 〈NSB〉 = 14.35 atoms cm−2 while for the non-superbubblelines of sight this is 〈Nnon−SB〉 = 14.19 atoms cm−2. Thus,an excess O VI abundance of about 40% in superbubbles ofthe LMC is found in comparison to non-superbubble regions.Combining the Danforth & Blair (2006) and Howk et al.(2002a) data for superbubble and non-superbubble lines ofsight (excluding Sk-67D05 sightline; see Howk et al. (2002a)for details), the O VI excess in superbubbles is about 46%,which is comparable to our results. Thus, results reportedhere support and confirm that superbubbles do show higherO VI abundance in comparison to the general halo absorp-tion seen in other LMC lines of sight. Some of the non-superbubble lines of sight show an enhanced O VI columndensity owing to local effects. Lehner & Howk (2007) com-pared superbubble and non-superbubble lines of sight for theLMC and found that some quiescent environments showedan enhanced O VI abundance, sometimes even larger thanthat of superbubbles.
Even in a single superbubble, there are significant vari-ations in the O VI column densities. We have four obser-vations each for the superbubbles 30 Doradus C and N11.In the case of 30 Doradus C, we find that the variation inN(O VI) is more than a factor of 2 (from the minimum valueof N(O VI) to the maximum value). For N11, this variationis about a factor of 2.5. The variation in N(O VI) for N70is not much (for the three lines of sight included here) andthis corroborates with the Danforth & Blair (2006) data.
5 PROPERTIES OF O VI IN 30 DORADUS
The 30 Doradus region of the LMC is ideally suited to studythe interaction between a high rate of star formation andthe surrounding ISM. This region is dominated by the starforming cluster NGC 2070 that contains the very interesting

6 A. Pathak et al.
star cluster R136 at the center. The proximity to 30 Do-radus has allowed extensive research on the stellar content(Parker 1992; Parker & Garmany 1993; Walborn & Blades1997) and initial mass function (Andersen et al. (2009) andreferences therein). 30 Doradus has also been investigatedin detail in the infrared bands to study the dust proper-ties (Sturm et al. 2000; Vermeij et al. 2002; Meixner et al.2006). Indebetouw et al. (2009) studied the 30 Doradus inthe mid-infrared wavelength band to determine the physi-cal conditions of the ionized gas and found that the localeffects of hot stars in 30 Doradus appear to dominate overany large-scale trend with distance from the central clusterR136.
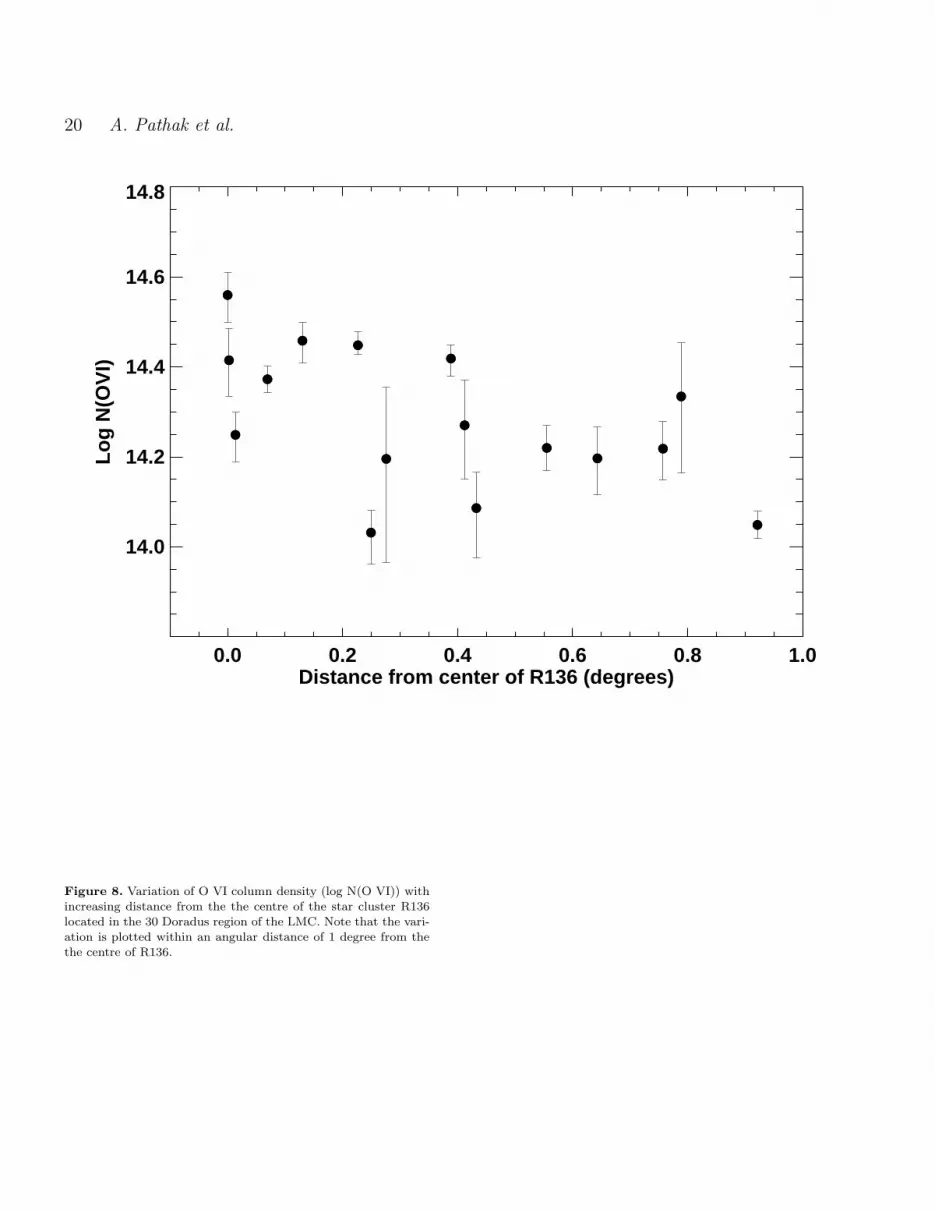
The O VI abundance in 30 Doradus is higher thanin other regions of the LMC with the highest value oflog N(O VI) being 14.56 atoms cm−2 near the center of thecluster R136. Fig. 8 shows the change in the log N(O VI)values from the center of R136 up to an angular distanceof 1 degree. We find an overall decrease in the O VI abun-dance away from the center of R136. An interpretation ofthis plot could be that the processes involved in the forma-tion of O VI are likely to be associated with stellar radiationfield but local effects cannot be neglected on a large angularscale. It should be noted that we do not find any correla-tion between O VI absorption and Hα emission for LMC andthus, no relation between star formation is established on alarger scale.
As noticed earlier, log N(O VI) does not correlate withX-ray emission for the LMC as a whole but surprisinglythere is a good correlation for the 30 Doradus lines of sight(Fig. 9). The correlation is between log N(O VI) and X-rayemission from 30 Doradus considering all the lines of sightwithin 1 degree around R136 except for one sightline (SK-69D257) that has exceptionally high value of X-ray surfacebrightness. One of the reasons for such high X-ray emissionfrom SK-69D257 is its proximity to a high mass X-ray binaryLMC X-1 (Points et al. 2001). The correlation in 30 Doradussuggests that O VI observed in this region is present in theISM gas surrounding the X-ray emitting plasma, which maybe due to the compactness, high density and non-uniformstructure of 30 Doradus. The correlation confirms that theX-ray emitting gas cools through temperatures where O VI
is being formed and supports the general consensus aboutthe formation of O VI by collisional ionization in the inter-face regions between cooler photo-ionized ISM gas and hotexterior ISM gas (Slavin & Frisch 2002; Indebetouw & Shull2004).
6 SUMMARY & CONCLUSIONS
We have presented O VI column density measurements forthe LMC using FUSE data for 70 lines of sight. This is thewidest coverage of the LMC to date. The results reportedhere reveal significant variation in O VI column densitiesover a very small angular scale thus confirming the patchi-ness of O VI distribution in the LMC. The most importantinferences drawn from this work are following:
(i) This survey probes 70 lines of sight with varying en-vironmental conditions. We find strong O VI absorption inthe LMC that is not restricted to active regions. High O VI
abundance is present even in relatively inactive regions ofthe LMC.
(ii) There are significant variations in the velocity profilesof O VI absorption. The O VI absorption profile is broaderthan the MW absorption for many lines of sight but it shouldbe noted that unambiguous separation of the MW and theLMC components is not possible for most of the lines ofsight. This proves to be a significant hurdle in interpretingexact kinematics for O VI in the LMC (for e.g. outflows fromthe LMC, etc.).
(iii) The maximum column density measured for theLMC is log N(O VI) = 14.57 atoms cm−2 and minimumvalue is log N(O VI) = 13.72 atoms cm−2. The mean valueof O VI column density is <log N(O VI)> = 14.23 atomscm−2, which is slightly lower than the earlier reported value.The median value of O VI column density in the LMC comesto be 14.22 atoms cm−2. The results corroborates with theprevious finding that the distribution of O VI in the LMCis patchy.
(iv) Despite the fact that the LMC has lower metallicitythan the MW, the abundance of O VI and properties of O VI
absorption are similar in both the galaxies. The mean of logN⊥(O VI) value for the MW is 14.29 atoms cm−2 while theprojected column density for the LMC, i.e., log N⊥(O VI)is 14.15 atoms cm−2. A more extensive study for the MWsuggests this value to be 14.21 atoms cm−2. The SMC witheven lower metallicity has higher O VI abundance with meanlog N(O VI) = 14.53 atoms cm−2.
(v) O VI absorption in the LMC does not correlate withHα (warm gas) or X-ray (hot gas) emission but we find agood correlation between O VI absorption and X-ray emis-sion in the 30 Doradus region. It is also seen that the O VI
absorption is decreasing with increasing angular distancefrom the star cluster R136 suggesting some correlation withstellar radiation field.
(vi) The observations reported cover 10 superbubbles ofthe LMC and for 5 superbubbles (30 Doradus C, N158, N51,N11 and N57) O VI absorption is reported for the first time.Superbubbles are O VI rich and have 40% excess comparedto non-superbubble lines of sight.
ACKNOWLEDGMENTS
AP and NVS acknowledge fellowships from the Depart-ment of Science and Technology, New Delhi. This researchhas made use of Far Ultraviolet Spectroscopic Explorerdata. FUSE was operated by Johns Hopkins University forNASA. We acknowledge the use of Multimission Archive atSpace Telescope Science Institute (MAST) and NASA As-trophysics Data System (ADS).
REFERENCES
Andersen M., Zinnecker H., Moneti A., McCaughrean M.J., Brandl B., Brandner W., Meylan G., Hunter D., 2009,ApJ, 707, 1347
Bernard J. P. et al., 2008, AJ, 136, 919Blair W. P., Oliveira C., Lamassa S., Gutman S., DanforthC. W., Fullerton A. W., Sankrit R., Gruendl R., 2009,PASP, 121, 634

Survey of O VI in the LMC 7
Bomans D. J., Dennerl K., Kurster M., 1994, A&A, 283,L21
Bothun G. D., Thompson I. B., 1988, AJ, 96, 877Bowen D.V. et al., 2008, ApJS, 176, 59Castor J., McCray R., Weaver R., 1975, ApJ, 200, L107Chu Y. -H., Mac Low M. -M., 1990, ApJ, 365, 510Conti P. S., Garmany C. D., Massey P., 1986, AJ, 92, 48Cole A. A., Nordsieck K. H., Gibson S. J., Harris W. M.1999a, AJ, 118, 2280
Cole A. A., Wood K., Nordsieck K. H. 1999b, AJ, 118, 2292Cox, D. P., 2005, ARA&A, 43, 337Danforth C. W., Howk J. C., Fullerton A. W., Blair W. P.,Sembach K. R., 2002, ApJS, 139, 81
Danforth C. W., Shull J. M., 2005, ApJ, 624, 555Danforth C. W., Shull J. M., Rosenberg J. L., Stocke J. T.,2006, ApJ, 640, 716
Danforth C. W., Blair W. P., 2006, ApJ, 646, 205Davies R. D., Elliott K. H., Meaburn J., 1976, MNRAS,81, 89
Dixon W. Van D., Hurwitz M, Ferguson H. C., 1996, ApJ,469, L77
Dixon W. V. D., Sankrit R., Otte B., 2006, ApJ, 647, 328Dixon W. V. D. et al., 2007, PASP, 119, 527Dixon W. V. D, Sankrit R., 2008, ApJ, 686, 1162Dolphin A. E., Hunter D. A., 1998, AJ, 116, 1275Dopita M. A., Mathewson D. S., Ford V. L., 1985, ApJ,297, 599
Edgar R. J., Chevalier R. A., 1986, ApJ, 310, L27Feast M., 1999, in Chu Y. -H., Suntzeff N., Hesser J.,Bohlender D., eds, New Views of the Magellanic Clouds,IAU Symp., 190, 542
Fitzpatrick E. L., 1988, ApJ, 335, 703Friedman S. D. et al., 2000, ApJ, 538, L39Garmany C. D., Walborn N. R., 1987, PASP, 99, 240Gaustad J. E., McCullough P. R., Rosing W., Van BurenD., 2001, PASP, 113, 1326
Grimes J. P. et al., 2009, ApJS, 181, 272Heckman T. M., Norman C. A., Strickland D. K., SembachK. R., 2002, ApJ, 577, 691
Hoopes C. G., Sembach K. R., Howk J. C., Savage B. D.,Fullerton A. W., 2002, ApJ, 569, 233
Howk J. C., Sembach K. R., Savage B. D., Massa D., Fried-man S. D., Fullerton A. W., 2002a, ApJ, 569, 214
Howk J. C, Savage Blair D., Sembach K. R., Hoopes, C.G., 2002, ApJ, 572, 264
Indebetouw R., Shull J. M., 2004, ApJ, 605, 205Indebetouw R. et al., 2009, ApJ, 694, 84Jenkins E. B., 1978a, ApJ, 219, 845Jenkins E. B., 1978b, ApJ, 220, 107Kim S., Staveley-Smith L., Dopita M. A., Sault R. J., Free-man K. C., Lee Y., Chu, Y. -H., 2003, ApJS, 148, 473
Lehner N., Fullerton A. W., Sembach K. R., Massa D. L.,Jenkins E. B., 2001, ApJ, 556, L103
Lehner N., Fullerton A. W., Massa D., Sembach K. R.,Zsargo, J., 2003, ApJ, 589, 526
Lehner N., Howk J. C., 2007, MNRAS, 377, 687Malumuth E. M., Heap S. R., 1994, AJ, 107, 1054Massey P., Lang C. C., Degioia-Eastwood K., Garmany C.D., 1995, ApJ, 438, 188
Massey P., Hunter D. A., 1998, ApJ, 493, 180Massey P., 2002, ApJS, 141, 81Meixner M. et al., 2006, AJ, 132, 2268
Moffat A. F. J., Niemela V. S., Marraco H. G., 1990, ApJ,348, 232
Moos H. W. et al., 2000, ApJ, 538, L1Oegerle W. R., Jenkins E. B., Shelton R., Bowen D. V.,Chayer P., 2005, ApJ, 622, 377
Parker J. W., 1992, PASP, 104, 1107Parker J. W., 1993, SSRv, 66, 55Parker J. W., Garmany, C. D., 1993, AJ, 106, 1471Points S. D., Chu Y.-H., Snowden S. L., Smith R. C., 2001,ApJS, 136, 99
Pradhan A. C., Pathak A., Murthy J., 2010, ApJ, 718, L141Rousseau J., Martin N., Prevot L., Rebeirot E., Robin A.,Brunet J. P., 1978, A&AS, 31, 243
Sahnow D. J. et al., 2000, ApJ, 538, L7Sankrit R., Dixon W. V. D., 2007, PASP, 119, 284Savage B. D., Sembach K. R., 1991, ApJ, 379, 245Savage B. D. et al., 2000, ApJ, 538, L27Savage B. D. et al., 2003, ApJS, 146, 125Savage B. D., Lehner N., 2006, ApJS, 162, 134Sembach K. R., Savage B. D., 1992, ApJS, 83, 147Sembach K.R., 1999, in Gibson, B. K., Putman, M. E. eds.,ASP Conf. Ser. 166, Stromlo Workshop on High VelocityClouds (San Francisco:ASP), 243
Shelton R., Cox D. P., 1994, ApJ, 434, 599Shelton R. L. et al., 2001, ApJ, 560, 730Shelton R. L., 2002, ApJS, 569, 758Slavin J. D., Frisch P. C., 2002, ApJ, 565, 364Smith L. F., Shara M. M., Moffat A. F. J., 1990, ApJ, 358,229
Smith L. F., Shara M. M., Moffat A. F. J., 1996, MNRAS,281, 163
Snowden S. L., Petre R., 1994, ApJ, 436, L123Spitzer L., 1956, ApJ, 124, 20Sturm E., Lutz D., Tran D., Feuchtgruber H., Genzel R.,Kunze D., Moorwood A. F. M., Thornley M. D., 2000,A&A, 358, 481
Torres-Dodgen A. V., Massey, P., 1988, AJ, 96, 1076Townsley L. K., Broos P. S., Feigelson E. D., Garmire G.P., Getman K. V., 2006, AJ, 131, 2164
Trumper J. et al., 1991, Nat, 349, 579Tumlinson J. et al., 2002, ApJ, 566, 857van der Marel R. P., Cioni, M. -R. L., 2001, AJ, 122, 1807Vermeij R., Peeters E., Tielens A. G. G. M., van der HulstJ. M., 2002, A&A, 382, 1042
Wakker B. P. et al., 2003, ApJS, 146, 1Walborn N. R., 1977, ApJ, 215, 53Walborn N. R., Ebbets D. C., Parker J. Wm., Nichols-Bohlin J., White R. L., 1992, ApJ, 393, L13
Walborn N. R., Lennon D. J., Haser S. M., Kudritzki R.-P., Voels S. A., 1995, PASP, 107, 104
Walborn N. R., Blades J. C., 1997, ApJS, 112, 457Walborn N. R. et al., 2002a, AJ, 123, 2754Walborn N. R. et al., 2002b, ApJS, 141, 443Wang Q., Hamilton T., Helfand D. J., 1989, Nat, 341, 309Wang Q., Hamilton T., Helfand D. J., Wu X., 1991, ApJ,374, 475
Weaver R., McCray R., Castor J., Shapiro P., Moore R.,1977, ApJ, 218, 377
Welsh B. Y., Lallement R., 2008, A&A, 490, 707Yan Z. -C., Tambasco M., Drake G. W. F., 1998, Phys.Rev. A, 57, 1652

8 A. Pathak et al.
Figure 1. R-band image of the LMC (Bothun & Thompson1988) showing the targets towards which O VI absorption havebeen studied. Superbubbles have been shown by circles.

Survey of O VI in the LMC 9
Figure 2. Examples for continuum fitting for three sightlinesin the region near O VI absorption at 1031.92 A. The top tobottom panels show the increasing complexity of fitting the stellarcontinuum.

10 A. Pathak et al.
(a) Normalized O VI absorption profiles for the 70 lines of sight. Table 1 gives the details of each sightline.
Figure 3.

Survey of O VI in the LMC 11
(b) Same as Fig. 3(a)
Figure 3.

12 A. Pathak et al.
(c) Same as Fig. 3(a)
Figure 3.

Survey of O VI in the LMC 13
(d) Same as Fig. 3(a)
Figure 3.
14 A. Pathak et al.
(e) Same as Fig. 3(a)
Figure 3.

Survey of O VI in the LMC 15
(f) Same as Fig. 3(a)
Figure 3. *

16 A. Pathak et al.
Figure 4.Model for H2 absorption overplotted on the normalizedO VI absorption profiles for 3 lines of sight. For Sk-65D21, H2
absorption does not contaminate the LMC O VI absorption, whileSk-71D45 shows the maximum contamination. Sk-67D250 showsmoderate contamination.
Survey of O VI in the LMC 17
Figure 5. Hα image of the LMC (Gaustad et al. 2001) with cir-cles showing O VI absorption around the 70 targets. The diameterof the circle is linearly proportional to the column density of O VIat LMC velocities.

18 A. Pathak et al.
0.0 0.5 1.0 1.5 2.0Log Relative H-alpha Surface Brightness
13.4
13.6
13.8
14.0
14.2
14.4
14.6
14.8
Lo
g N
(OV
I)
Figure 6. O VI column density (log N(O VI)) vs. log relative Hα
surface brightness for all the 70 targets. Hα surface brightness isfrom Gaustad et al. (2001).

Survey of O VI in the LMC 19
0.0 0.5 1.0 1.5 2.0 2.5Log Relative X-ray Surface Brightness
13.4
13.6
13.8
14.0
14.2
14.4
14.6
14.8
Lo
g N
(OV
I)
Figure 7. O VI column density (log N(O VI)) vs. log relative X-ray surface brightness for 65 targets. The X-ray surface brightnessis taken from the ROSAT PSPC mosaic image (energy range 0.5–2.0 keV) (Snowden & Petre 1994). 4 targets (Sk-67D250, D301-1005, D301-NW8 and Sk-65D63) have not been covered by X-ray
observations and one of the target Sk-69D257 has been excludedbecause it has extremely high X-ray emission.
20 A. Pathak et al.
0.0 0.2 0.4 0.6 0.8 1.0Distance from center of R136 (degrees)
14.0
14.2
14.4
14.6
14.8
Lo
g N
(OV
I)
Figure 8. Variation of O VI column density (log N(O VI)) withincreasing distance from the the centre of the star cluster R136located in the 30 Doradus region of the LMC. Note that the vari-ation is plotted within an angular distance of 1 degree from thethe centre of R136.

Survey of O VI in the LMC 21
0.5 1.0 1.5 2.0 2.5Log Relative X-ray Surface Brightness
14.0
14.2
14.4
14.6
14.8
Lo
g N
(OV
I)
Figure 9. O VI column density (log N(O VI)) vs. X-ray lumi-nosity for the 30 Doradus region of the LMC. The X-ray surfacebrightness is taken from the ROSAT PSPC mosaic image (energyrange 0.5–2.0 keV) (Snowden & Petre 1994). A linear correlationis present which is not seen when all the targets of LMC are in-
cluded (Fig. 7) and for other individual regions in the LMC. Theplot includes all lines of sight from Fig. 8 except for 1 sightline(SK-69D257) as it shows an exceptionally high X-ray emission dueto its proximity to X-ray binary LMC-X1 (Points et al. 2001).

22 A. Pathak et al.
i
Table 1: Log of FUSE observations for the 70 targets in the LMC.
FUSE ID Object name FUSE aperture RA Dec Spectral Type V mag. Reference
P1030703 Sk-67D05 LWRS 04 50 18.96 -67 39 37.9 O9.7Ib 11.34 1
A0490402 Sk-68D03 LWRS 04 52 15.56 -68 24 26.9 O9I 13.13 2
E5111901 BI13 LWRS 04 53 06.48 -68 03 23.1 O6.5V 13.75 3
D0980801 Sk-67D18 MDRS 04 55 14.90 -67 11 24.5 O6-7n-nm+WN5-6A 11.95 1
P1174401 Sk-67D20 LWRS 04 55 31.50 -67 30 01.0 WN4b 13.86 4
B0100201 PGMW-3070 MDRS 04 56 43.25 -66 25 02.0 O6V 12.75 5
D0300302 LH103102 MDRS 04 56 45.40 -66 24 45.9 O7Vz 13.55 5
D0300101 LH91486 MDRS 04 56 55.58 -66 28 58.0 O6.5Vz 14.2 5
B0100701 PGMW-3223 MDRS 04 57 00.80 -66 24 25.3 O8.5IV 12.95 5
F9270604 HV2241 LWRS 04 57 15.83 -66 33 54.8 O7-III 13.5 5
P1174901 HD32402 LWRS 04 57 24.19 -68 23 57.2 WC 3
Z9050801 Sk-67D32 LWRS 04 59 52.30 -67 56 55.0 WN 14.48 3
P1030901 Sk-65D21 LWRS 05 01 22.33 -65 41 48.1 O9.7Iab 12.02 6
B0770201 HV2274 LWRS 05 02 40.96 -68 24 21.3 B0-B2III-I 14.2 5
P1174501 Sk-66D51 LWRS 05 03 10.20 -66 40 54.0 WN8h 12.71 4
D1380201 NGC1818-D1 LWRS 05 04 32.56 -66 24 51.0 B0-B2V-IV 14.93 5
P1172101 Sk-70D69 LWRS 05 05 18.73 -70 25 49.8 O5V 13.94 6
P1171703 Sk-67D69 LWRS 05 14 20.16 -67 08 03.5 O4III(f) 13.09 7
C1030101 MACHO78-6097 LWRS 05 18 04.70 -69 48 19.0 B0-B2V-IV 14.4 5
E5112902 BI130 LWRS 05 18 06.06 -69 14 34.5 O8.5V((f)) 12.53 3
Z9050201 Sk-69D94 LWRS 05 18 14.53 -69 15 01.0 B0-B2III-I 9.72 5
D9044701 SNR0519-697 LWRS 05 18 44.20 -69 39 12.4 Supernova-remnant
D0880104 BREY22 MDRS 05 19 16.40 -69 39 19.5 WC/O9.5Ib 12.3 1
B0270101 HD269445 LWRS 05 22 59.87 -68 01 46.6 WN 11.45 1
P1173602 Sk-69D124 LWRS 05 25 18.37 -69 03 11.1 O9Ib 12.81 2
D1530104 Sk-67D105 LWRS 05 26 06.37 -67 10 57.6 Of 12.42 5
A1110101 Sk-67D106 MDRS 05 26 15.20 -67 29 58.3 B0-B2III-I 11.78 8
A1110201 Sk-67D107 MDRS 05 26 20.67 -67 29 55.4 B0-B2III-I 12.5 8
C1510101 HD36521 LWRS 05 26 30.32 -68 50 25.4 WC 12.42 9
P1031402 Sk-68D80 LWRS 05 26 30.43 -68 50 26.6 WC4+OB 12.40 10
P2030104 Sk-68D82 LWRS 05 26 45.31 -68 49 52.8 WN5?b+(B3I) 9.86 5
P1173701 BI170 LWRS 05 26 47.79 -69 06 11.7 O9.5Ib 13.09 11
C1550201 Sk-67D111 LWRS 05 26 47.95 -67 29 29.9 O6:Iafpe 12.57 11
F9270701 HV2543 LWRS 05 27 27.40 -67 11 55.4 O8+O9 12.92 5
P1172501 Sk-70D91 LWRS 05 27 33.74 -70 36 48.3 O6.5V 12.78 11
P1172303 Sk-66D100 LWRS 05 27 45.59 -66 55 15.0 O6II(f) 13.26 6
E9570301 HDE269599 LWRS 05 28 22.68 -69 08 32.2 Be 10.18 5
M1142001 Sk-65D63 LWRS 05 28 39.50 -65 39 01.1 O9.7I 12.56 12
C1030201 HV982 LWRS 05 29 52.50 -69 09 22.0 B0-B2V-IV 14.6 5
E5113602 Sk-70D97 LWRS 05 30 11.35 -70 51 42.2 O9III 13.33 5
P1175001 Sk-67D144 LWRS 05 30 12.22 -67 26 08.4 WC4+OB 13.6 13
P2170301 BI184 LWRS 05 30 30.60 -71 02 31.3 B0-B2V-IV 13.84 3
D1380301 NGC2004-B15 MDRS 05 30 36.58 -67 17 42.3 B0-B2V-IV 14.18 5
Z9050601 Sk-71D38 LWRS 05 30 38.77 -71 01 47.9 WC 13.1 5
P1031502 Sk-71D45 LWRS 05 31 15.55 -71 04 08.9 O4-5III(f) 11.51 1
A1330123 Sk-67D166 LWRS 05 31 44.31 -67 38 00.6 O4If+ 12.27 1
B0860901 Sk-67D168 MDRS 05 31 52.10 -67 34 20.8 O8Iaf 12.08 12
D9042002 SNR0532-675 LWRS 05 32 23.00 -67 31 02.0 Supernova-remnant
P1173101 Sk-67D191 LWRS 05 33 34.12 -67 30 19.6 O8V 13.46 2
B0770302 HV5936 LWRS 05 33 39.00 -66 37 39.8 B0-B2V-IV 14.8 5
P1175101 Sk-69D191 LWRS 05 34 19.39 -69 45 10.0 WC4 13.35 13
F3210301 J053441-693139 LWRS 05 34 41.30 -69 31 39.0 O2-O3.5If* 13.7 14
P1171603 Sk-67D211 LWRS 05 35 13.92 -67 33 27.0 O2III(f)* 12.28 14
Z9051001 BREY64 LWRS 05 35 54.45 -68 59 07.4 WN9h 13.21 3
D9043101 SNR0536-692 LWRS 05 36 07.70 -69 11 52.6 Supernova-remnant
Z9050701 Sk-69D220 LWRS 05 36 43.83 -69 29 47.4 WNorOiafpe 10.58 1
P1172201 Sk-66D172 LWRS 05 37 05.56 -66 21 35.7 O2III(f)*+OB 13.13 14
C0020601 BI253 LWRS 05 37 34.49 -69 01 09.8 Of 13.76 3
E5114201 Sk-68D137 LWRS 05 38 24.77 -68 52 32.8 O3IIIf 13.29 3
P1171803 MK42 LWRS 05 38 42.10 -69 05 54.7 O3If/WN6-A 10.96 15
P1031706 Sk-69D243 LWRS 05 38 42.57 -69 06 03.2 WN5+OB 9.5 16
F9140101 30DOR-S-R136 LWRS 05 38 51.70 -69 06 00.0 HII-region
P1031802 Sk-69D246 LWRS 05 38 53.50 -69 02 00.7 WN 11.16 4
P1174601 HDE269927 LWRS 05 38 58.25 -69 29 19.1 WN 12.63 4
P2170101 Sk-69D257 LWRS 05 39 58.91 -69 44 03.2 O9II 12.53 5
D9042801 SNR0543-689 LWRS 05 43 07.20 -68 58 52.0 Supernova-remnant
D0981401 D301-1005 MDRS 05 43 08.30 -67 50 52.4 O9.5V 14.11 3
D0981201 Sk-67D250 MDRS 05 43 15.48 -67 51 09.6 O7.5II(f) 12.68 17
D0981501 D301-NW8 MDRS 05 43 15.96 -67 49 51.0 D301-NW8 14.37 3
I8120701 Sk-70D115 LWRS 05 48 49.76 -70 03 57.5 O6.5Iaf 12.24 5
Notes. Units of right ascension are hours, minutes, and seconds; units of declination are in degrees, arcminutes, and arcseconds.
References – (1) Walborn (1977); (2) Conti et al. (1986); (3) Massey (2002); (4) Smith et al. (1996); (5) Blair et al. (2009); (6) Walborn et al. (1995); (7)
Garmany & Walborn (1987) (8) Rousseau et al. (1978); (9) Moffat et al. (1990); (10) Smith et al. (1990); (11) Walborn et al. (2002b) (12) Fitzpatrick et al.
(1988); (13) Torres-Dodgen & Massey (1988); (14) Walborn et al. (2002a); (15) Walborn & Blades (1997); (16) Massey & Hunter (1998); (17) Massey et al.
(1995)

Survey of O VI in the LMC 23
Table 2: Equivalent widths and column densities with corresponding velocity limits for O
VI absorption in the LMC.
Target name Equivalent width log N(O VI) Integration limits
(mA) (dex) (km s−1)
Sk-67D05 73±6 13.72+0.10
−0.13175, 330
Sk-68D03 112±8 14.02+0.11
−0.15180, 330
BI13 88±4 13.94+0.08
−0.09175, 315
Sk-67D18 132±7 14.16+0.09
−0.13165, 330
Sk-67D20 147±8 14.08+0.11
−0.16175, 335
PGMW-3070 132±23 14.10+0.13
−0.18180, 345
LH103102 132±23 14.16+0.03
−0.04180, 330
LH91486 266±29 14.47+0.09
−0.11175, 385
PGMW-3223 129±15 14.10+0.06
−0.07175, 315
HV2241 271±18 14.50+0.04
−0.03165, 365
HD32402 271±8 14.48+0.02
−0.02160, 320
Sk-67D32 129±7 14.11+0.03
−0.04165, 360
Sk-65D21 94±23 13.94+0.11
−0.16225, 340
HV2274 160±11 14.14+0.10
−0.15165, 345
Sk-66D51 185±10 14.26+0.07
−0.09170, 370
NGC1818-D1 280±13 14.52+0.05
−0.05150, 340
Sk-70D69 182±12 14.18+0.07
−0.08150, 295
Sk-67D69 232±28 14.40+0.05
−0.06170, 340
MACHO78-6097 151±25 14.15+0.05
−0.05165, 320
BI130 94±7 13.89+0.07
−0.09165, 320
Sk-69D94 150±3 14.22+0.03
−0.03160, 340
SNR0519-697 97±4 13.97+0.07
−0.08160, 300
BREY22 126±24 14.07+0.06
−0.07160, 330
HD269445 200±10 14.29+0.04
−0.05175, 365
Sk-69D124 331±8 14.57+0.04
−0.05190, 430
Sk-67D105 110±8 13.92+0.14
−0.23180, 320
Sk-67D106 180±7 14.30+0.10
−0.13175, 345
Sk-67D107 254±10 14.45+0.04
−0.05160, 360
HD36521 126±9 14.07+0.09
−0.12175, 340
Sk-68D80 303±16 14.56+0.04
−0.03145, 335
Sk-68D82 141±10 14.17+0.04
−0.04165, 320
BI170 235±20 14.43+0.02
−0.03165, 365
Sk-67D111 214±19 14.34+0.05
−0.05175, 365
HV2543 156±42 14.23+0.04
−0.03160, 365
Sk-70D91 256±7 14.43+0.04
−0.03160, 365
Sk-66D100 214±21 14.34+0.03
−0.03160, 340
HDE269599 123±6 14.05+0.03
−0.03165, 320
Sk-65D63 184±8 14.21+0.04
−0.04180, 375
HV982 208±58 14.33+0.12
−0.17175, 360
Sk-70D97 226±4 14.39+0.03
−0.04175, 375
Sk-67D144 194±10 14.25+0.06
−0.07165, 335
BI184 118±10 14.04+0.08
−0.10165, 330
NGC2004-B15 92±7 13.86+0.05
−0.07175, 330
Sk-71D38 94±7 13.92+0.07
−0.08165, 315
Sk-71D45 194±9 14.26+0.06
−0.06160, 345
Sk-67D166 206±9 14.32+0.05
−0.05165, 390
Sk-67D168 186±12 14.26+0.05
−0.05165, 375
SNR0532-675 147±9 14.16+0.07
−0.08165, 345
Sk-67D191 229±16 14.42+0.02
−0.02165, 340
HV5936 174±8 14.18+0.07
−0.08175, 375
Sk-69D191 185±25 14.22+0.06
−0.07165, 340
J053441-693139 182±33 14.22+0.05
−0.05165, 330
Sk-67D211 144±8 14.11+0.10
−0.13160, 350
BREY64 139±8 14.20+0.16
−0.23180, 330
SNR0536-692 116±7 14.03+0.05
−0.07165, 320
Sk-69D220 128±9 14.09+0.08
−0.11160, 315
Sk-66D172 173±9 14.20+0.05
−0.05175, 360
BI253 259±46 14.46+0.04
−0.05160, 300
Sk-68D137 234±7 14.45+0.03
−0.02165, 330
MK42 228±24 14.41+0.07
−0.08160, 330
Sk-69D243 307±15 14.56+0.05
−0.06150, 345
30DOR-S-R136 185±25 14.25+0.05
−0.06165, 320
Sk-69D246 211±7 14.37+0.03
−0.03155, 325
Continued on Next Page. . .

24 A. Pathak et al.
Table 2 – Continued
Target name Equivalent width log N(O VI) Integration limits
(mA) (dex) (km s−1)
HDE269927 245±8 14.42+0.03
−0.04160, 320
Sk-69D257 171±8 14.20+0.07
−0.08160, 315
SNR0543-689 186±34 14.27+0.10
−0.12160, 360
D301-1005 284±57 14.53+0.02
−0.03165, 385
Sk-67D250 316±33 14.57+0.03
−0.03165, 375
D301-NW8 228±30 14.42+0.02
−0.03175, 365
Sk-70D115 186±11 14.23+0.03
−0.04165, 330
Notes. The errors in equivalent widths and column densities are 1σ error estimates.
Integration limits gives the velocity range over which the LMC O VI absorption profile was integrated.

Survey of O VI in the LMC 25
Table 3. O VI column densities in the superbubbles (SB) of the LMC.
Target name Superbubble Column density log N(O VI)(1014 atoms cm−2) (dex)
Sk-69D246 30Dor C 2.36+0.18−0.14 14.37+0.03
−0.03
MK42 30Dor C 2.60+0.46−0.45 14.41+0.07
−0.08
30DOR-S-R136 30Dor C 1.77+0.20−0.24 14.25+0.05
−0.06
Sk-69D243 30Dor C 3.63+0.40−0.45 14.56+0.05
−0.06
Sk-69D191 N154 1.65+0.26−0.23 14.22+0.06
−0.07
HDE269927 N158 2.62+0.16−0.21 14.42+0.03
−0.04
Sk-68D80 N144 3.61+0.30−0.26 14.56+0.04
−0.03
HD36521 N144 1.18+0.28−0.28 14.07+0.09
−0.11
BI184 N206 1.09+0.22−0.22 14.04+0.08
−0.10
Sk-71D45 N206 1.80+0.24−0.21 14.26+0.06
−0.06
Sk-70D91 N204 2.69+0.24−0.17 14.43+0.04
−0.03
PGMW-3223 N11 1.27+0.18−0.18 14.10+0.06
−0.07
LH103102 N11 1.46+0.10−0.13 14.16+0.03
−0.04
PGMW-3070 N11 1.27+0.43−0.43 14.10+0.13
−0.18
LH91486 N11 2.96+0.68−0.68 14.47+0.09
−0.11
Sk-67D111 N51 2.20+0.29−0.24 14.34+0.05
−0.05
Sk-67D107 N51 2.85+0.27−0.27 14.45+0.04
−0.05
Sk-67D106 N51 2.01+0.50−0.53 14.30+0.10
−0.13
Sk-67D166 N57 2.09+0.25−0.20 14.32+0.05
−0.05
Sk-67D250 N70 3.71+0.23−0.23 14.57+0.03
−0.03
D301-1005 N70 3.37+0.17−0.22 14.53+0.02
−0.03
D301-NW8 N70 2.60+0.09−0.13 14.42+0.02
−0.03
Total SB (this work) 2.31±0.12 14.35±0.18Total non-SB (this work) 1.68±0.12 14.19±0.23Total SB N701 3.04±0.45 14.48±0.06Total non-SB1 2.03±0.58 14.29±0.14Total SB2 3.07±0.62 14.48±0.09Total non-SB2 2.10±0.50 14.31±0.11
Notes. The superbubble lines of sight are shown in Fig. 1.
(1) Danforth & Blair (2006); (2) Combined data of Howk et al. (2002a) and Danforth & Blair (2006).


