Embed Size (px)
Citation preview
1 23
Natural HazardsJournal of the International Societyfor the Prevention and Mitigation ofNatural Hazards ISSN 0921-030XVolume 61Number 1 Nat Hazards (2012) 61:115-126DOI 10.1007/s11069-011-9790-z
Susceptibility regional zonation ofearthquake-induced landslides inCampania, Southern Italy
A. Rapolla, S. Di Nocera, F. Matano,V. Paoletti & D. Tarallo

1 23
Your article is protected by copyright and
all rights are held exclusively by Springer
Science+Business Media B.V.. This e-offprint
is for personal use only and shall not be self-
archived in electronic repositories. If you
wish to self-archive your work, please use the
accepted author’s version for posting to your
own website or your institution’s repository.
You may further deposit the accepted author’s
version on a funder’s repository at a funder’s
request, provided it is not made publicly
available until 12 months after publication.
ORI GIN AL PA PER
Susceptibility regional zonation of earthquake-inducedlandslides in Campania, Southern Italy
A. Rapolla • S. Di Nocera • F. Matano • V. Paoletti • D. Tarallo
Received: 12 February 2010 / Accepted: 15 March 2011 / Published online: 31 March 2011� Springer Science+Business Media B.V. 2011
Abstract In this paper, we present a GIS-based method for regional zoning of seismic-
induced landslide susceptibility and show its application to the territory of the Campania
region, Southern Italy. The method employs only three factors that we believe are most
significant in the susceptibility assessment: the type of outcropping rock/soil, the slope
angle, and the MCS intensity. Each of the three parameters is quantified in terms of relative
weight expressed as indices, and the resulting Seismic Landslide Susceptibility index of an
area is given by the average of the indices of the first two factors multiplied by the index of
the third factor. The result of this susceptibility zonation applied to Campania shows a
good agreement between the distribution of the historical earthquake-triggered landslides
and the highly susceptible zones.
Keywords Seismic-induced landslide � Landslide susceptibility � Campania �Southern Italy
1 Introduction
Landslides are one of the most damaging collateral hazards connected to earthquakes.
Several methods have been developed for the evaluation of the susceptibility related to
earthquake-triggered landslides (e.g., Keefer 1984; Mora and Vahrson 1994; Jibson et al.
2000; Parise and Jibson 2000). These methods can be framed into three zoning levels
A. Rapolla � S. Di Nocera � F. Matano (&) � V. Paoletti � D. TaralloDepartment of Earth Sciences, University of Naples ‘‘Federico II’’, Largo S. Marcellino 10,80138 Naples, Italye-mail: [email protected]
A. RapollaC.U.G.RI.—Centre for Research on Major Hazards, Universities of Naples and Salerno,Via Cinthia, Monte Sant’Angelo, 80126 Naples, Italy
Present Address:A. RapollaTerritorial Town Planning Research Center, L.U.P.T., Via Toledo 402, 80134 Naples, Italy
123
Nat Hazards (2012) 61:115–126DOI 10.1007/s11069-011-9790-z
Author's personal copy
depending on the scale of study, referred as zoning grade-1 to grade-3 in ISSMGE-TC4
(1999).
A threefold-level approach was also suggested, as guideline for seismic hazard evalu-
ation in the Campania region (Cascini et al. 2006), which is the study area of this paper.
Fell et al. (2008) recommended three levels of zoning for landslide susceptibility for
land use planning, as well. Level-1 is applicable to regional zoning (scale
1:250,000–1:25,000), level-2 to local zoning (scale 1:25,000–1:5,000), and level-3 to site-
specific zoning (scale 1:5,000–1:1,000).
Earthquake-induced landslide susceptibility is related to several, often interplaying,
factors (such as lithologic, tectonic, morphologic, hydrogeologic, and seismologic aspects)
that are normally accounted for in level-2 studies and are not usually represented at a
regional scale, even though they are also regional in nature.
In this paper, we describe the application of a level-1 method for evaluating the sus-
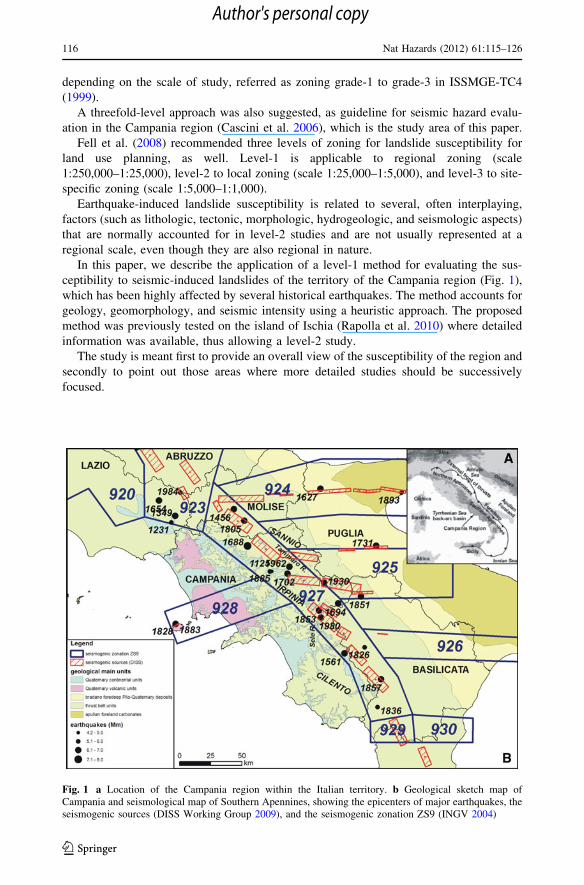
ceptibility to seismic-induced landslides of the territory of the Campania region (Fig. 1),
which has been highly affected by several historical earthquakes. The method accounts for
geology, geomorphology, and seismic intensity using a heuristic approach. The proposed
method was previously tested on the island of Ischia (Rapolla et al. 2010) where detailed
information was available, thus allowing a level-2 study.
The study is meant first to provide an overall view of the susceptibility of the region and
secondly to point out those areas where more detailed studies should be successively
focused.
Fig. 1 a Location of the Campania region within the Italian territory. b Geological sketch map ofCampania and seismological map of Southern Apennines, showing the epicenters of major earthquakes, theseismogenic sources (DISS Working Group 2009), and the seismogenic zonation ZS9 (INGV 2004)
116 Nat Hazards (2012) 61:115–126
123
Author's personal copy
2 Regional setting
2.1 Geology and seismicity framework
The Campania territory comprises a sector of the Southern Apennines mountain chain in
the eastern and southern portions (Fig. 1a). NW–SE and NE–SW striking faults edge
subsiding basins and volcanic complexes along the western portion. This sector of
Southern Italy is tectonically active and currently experiences extension in hinterland and
axial sectors, causing rifting in the Tyrrhenian Sea back-arc region and the opening of
fluvio-lacustrine intramontane basins.
Many regional tectonic units are recognized in the Apennines mountain chain.
The internal units are mainly formed by Late Jurassic to Early Miocene pelitic-cal-
careous complexes. The external units are represented by Triassic to Miocene carbonate
platform limestones and pelagic basin calcareous-pelitic units. These units are strongly
deformed and thrusted mainly eastward and are uncomfortably covered by Middle Mio-
cene to Pliocene thrust-top basin fillings formed by siliciclastic sequences (mainly sand-
stones and conglomerates with claystones) (Elter et al. 2003; Di Nocera et al. 2006).
The Quaternary extensional tectonic processes are testified by the presence of active
faults and seismogenic sources along the Apennine chain, which are the main cause of the
strong seismic activity (M B 7.0) in Campania (CPTI Working Group 2004).
The zone 927 (Sannio-Irpinia-Basilicata zone) (Fig. 2) of the ZS9 seismogenic classi-
fication (INGV 2004) includes the areas characterized by the maximum energy release
related to a generalized stretching. The seismogenic sources are mainly related to NW–SE
trending normal faults (Fig. 1b). Hypocentral depths are typically of about 10–12 km, and
focal mechanisms show an extensional kinematics (INGV 2004).
2.2 Seismic Landslides
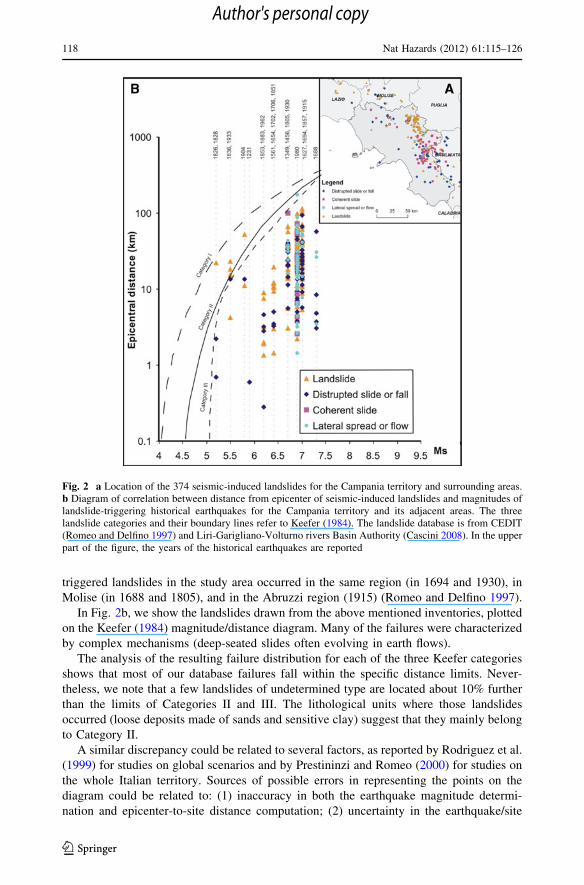
A database of 374 seismic-induced landslides for the Campania territory and surrounding
areas (Fig. 2a) has been derived from the inventories of the National Catalogue of seismic-
induced failures (CEDIT—Romeo and Delfino, 1997) and of the Liri-Garigliano-Volturno
rivers Basin Authority (AdB LGV—Autorita di Bacino Liri-Garigliano-Volturno) (Cascini
2008).
In the CEDIT and AdB LGV inventories, each landslide is spatially identified by a
generic point with geographic coordinates having an approximation of *100 m. In order
to reduce the degree of uncertainty in the landslide location connected to this approxi-
mation, we compared the position of those points with the perimeters of the landslides as
mapped at 1:25,000 scale in the IFFI Project landslide inventory (ISPRA—Servizio
Geologico d’Italia 2006). This allowed us to verify and validate the location of the
identification points of the seismic-induced landslides. We observed in fact some ambi-
guity in the location of those points with regard to the different zones of the IFFI land-
slides, as in some cases the identification points were located at the top of the failures and
in some other cases in the accumulation zone or at the foot of the landslides. So, in order to
give a homogeneous significance to all failures, the identification points of each seismic-
induced landslide were assigned at the top of the corresponding IFFI landslide. This
upgrading of the spatial location of the seismic landslide identification points seems to us
fully acceptable for a regional study with 1:250,000–1:25,000 scales.
Most of those seismic-induced landslides were mainly reactivated by the earthquake of
November 23, 1980, with epicenter in Irpinia (Fig. 1b). Other main earthquakes that
Nat Hazards (2012) 61:115–126 117
123
Author's personal copy
triggered landslides in the study area occurred in the same region (in 1694 and 1930), in
Molise (in 1688 and 1805), and in the Abruzzi region (1915) (Romeo and Delfino 1997).
In Fig. 2b, we show the landslides drawn from the above mentioned inventories, plotted
on the Keefer (1984) magnitude/distance diagram. Many of the failures were characterized
by complex mechanisms (deep-seated slides often evolving in earth flows).
The analysis of the resulting failure distribution for each of the three Keefer categories
shows that most of our database failures fall within the specific distance limits. Never-
theless, we note that a few landslides of undetermined type are located about 10% further
than the limits of Categories II and III. The lithological units where those landslides
occurred (loose deposits made of sands and sensitive clay) suggest that they mainly belong
to Category II.
A similar discrepancy could be related to several factors, as reported by Rodriguez et al.
(1999) for studies on global scenarios and by Prestininzi and Romeo (2000) for studies on
the whole Italian territory. Sources of possible errors in representing the points on the
diagram could be related to: (1) inaccuracy in both the earthquake magnitude determi-
nation and epicenter-to-site distance computation; (2) uncertainty in the earthquake/site
Fig. 2 a Location of the 374 seismic-induced landslides for the Campania territory and surrounding areas.b Diagram of correlation between distance from epicenter of seismic-induced landslides and magnitudes oflandslide-triggering historical earthquakes for the Campania territory and its adjacent areas. The threelandslide categories and their boundary lines refer to Keefer (1984). The landslide database is from CEDIT(Romeo and Delfino 1997) and Liri-Garigliano-Volturno rivers Basin Authority (Cascini 2008). In the upperpart of the figure, the years of the historical earthquakes are reported
118 Nat Hazards (2012) 61:115–126
123
Author's personal copy
location for the oldest events that could lead to errors as large as 50 km (cf. Postpischl,
1985); (3) occurrence of multiple seismic events; (4) special site conditions (e.g., the
presence of sensitive clay and/or saturated loose deposits and unstable stratigraphic con-
ditions); and (5) simultaneous arrive, from sources distant more than 50 km, of direct
seismic radiation and of shear waves reflected/refracted by interfaces in the lower crust.
3 Method description and application
The GIS-based method employs geo-lithologic, topographic, and regional seismicity data.
More specifically, the parameters we consider are as follows: (A) the type of out-
cropping rock/soil, (B) the slope angle, and (C) the seismic action in terms of MCS
(Mercalli-Cancani-Sieberg) intensity. The first two parameters represent the predisposing
factors, while the third parameter is the triggering force. We quantify these three param-
eters in terms of relative weight expressed as indices, varying from 0 to 1.
We assume that the first two parameters contribute to failure susceptibility in the same
manner, and therefore we consider their average as Predisposing Factor.
The seismic action (Triggering Factor) is instead regarded as the parameter that
modulates the predisposing factor.
Thus, the seismically induced landslide susceptibility level of an area is given by:
Sl ¼ SA þ SBð Þ2
� SC
where Sl is the Susceptibility Index, SA and SB are the Indices of the Predisposing Factors
and SC is the Index of the Seismic Action.
The rationale for this equation is derived from the following reasoning:
a. the simple summing of different indices (weights), as done in the method proposed by
the Kanagawa Prefecture (ISSMGE-TC4, 1999), entails that for aseismic areas the
seismically induced landslide susceptibility could not be zero and this appears as a
fundamental inconsistency;
b. the simple multiplication of decimal indices enhances the very high values of
susceptibility with respect to the medium and low ones, not giving a balanced
representation of the susceptibility.
Following Mora and Vahrson (1994), who propose the multiplication between the
predisposing and the triggering factors in order to evaluate the landslide susceptibility, we
suggest the same type of approach, even though we propose a different formulation for the
two factors.
We give the same weight to lithology (SA) and slope angle (SB), as is usually done when
a simple approach is used and no previous analytical study about weighting is available.
We then multiply the predisposing factor by SC, giving the same relevance to the two
terms, as done by Mora and Vahrson (1994). A first validation of the method was made in
the island of Ischia (Rapolla et al. 2010), where it resulted to be consistent with the
available seismic-induced landslide data.
The extension of a regional territory such as the Campania’s one (*13,500 km2) makes
the use of a 100 9 100 m mesh, a proper trade-off between the sought regional scale of
study and the meaningfulness of the input data. Therefore, the available geologic, seis-
mological, and topographic data have been implemented in a GIS, employing a
100 9 100 m mesh for the computation. Such a mesh was chosen referring to the scale
Nat Hazards (2012) 61:115–126 119
123
Author's personal copy
recommended by Fell et al. (2008) for regional landslide susceptibility zoning applied to an
area of ca. 10,000 km2 (that is the areal extension of Campania excluding flat areas).
3.1 Parameters A and B: lithology and slope angle
We consider two predisposing factors: A (lithology) and B (slope angle).
The type of rock/soil (parameter A) has been defined by the analysis of the geological
units cropping out in the Campania territory. The distribution and the features of the
geological units have been derived by several geological maps at different scales:
1:200,000 (Bonardi et al. 2009), 1:100,000, and 1:50,000 (ISPRA—Servizio Geologico
d’Italia 2010).
By referring to the prevailing lithology or the lithological assemblage forming each
geological unit, 24 lithological units were then differentiated in the study area (see, e.g.,
Matano 2009).
Following Eurocode 8 (2003), we regard the transversal wave velocity as the most
suitable parameter for evaluating the response of materials to the seismic action.
We defined the average transversal wave velocity value (Vs) for each lithological unit
with reference to the cropping out, locally weathered, portions of rocks and soils that are
usually involved in the landslide phenomena.
The Vs values were defined on the basis of the data reported in Nunziata et al. (2004)
and Rapolla (2008) for volcanics and of Caputo et al. (2004, 2006); Cherubini et al. (2008);
Di Giulio et al. (2008); D’Onofrio et al. (2005) for sedimentary units. The lithological units
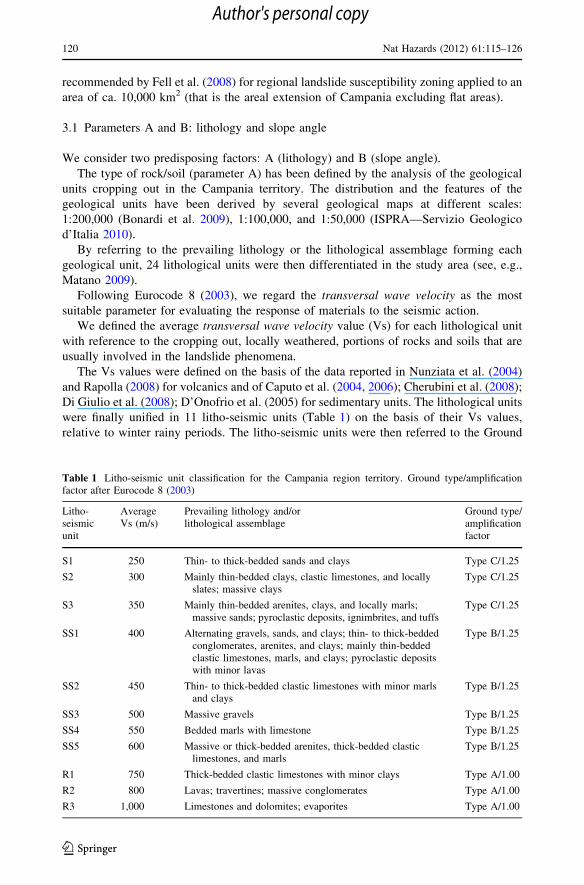
were finally unified in 11 litho-seismic units (Table 1) on the basis of their Vs values,
relative to winter rainy periods. The litho-seismic units were then referred to the Ground
Table 1 Litho-seismic unit classification for the Campania region territory. Ground type/amplificationfactor after Eurocode 8 (2003)
Litho-seismicunit
AverageVs (m/s)
Prevailing lithology and/orlithological assemblage
Ground type/amplificationfactor
S1 250 Thin- to thick-bedded sands and clays Type C/1.25
S2 300 Mainly thin-bedded clays, clastic limestones, and locallyslates; massive clays
Type C/1.25
S3 350 Mainly thin-bedded arenites, clays, and locally marls;massive sands; pyroclastic deposits, ignimbrites, and tuffs
Type C/1.25
SS1 400 Alternating gravels, sands, and clays; thin- to thick-beddedconglomerates, arenites, and clays; mainly thin-beddedclastic limestones, marls, and clays; pyroclastic depositswith minor lavas
Type B/1.25
SS2 450 Thin- to thick-bedded clastic limestones with minor marlsand clays
Type B/1.25
SS3 500 Massive gravels Type B/1.25
SS4 550 Bedded marls with limestone Type B/1.25
SS5 600 Massive or thick-bedded arenites, thick-bedded clasticlimestones, and marls
Type B/1.25
R1 750 Thick-bedded clastic limestones with minor clays Type A/1.00
R2 800 Lavas; travertines; massive conglomerates Type A/1.00
R3 1,000 Limestones and dolomites; evaporites Type A/1.00
120 Nat Hazards (2012) 61:115–126
123
Author's personal copy
Types of the Eurocode 8 (2003) classification in order to evaluate the amplification factors
that will be considered in the computation of parameter C (see next paragraph).
For the susceptibility assessment, we assume an inverse proportionality between Vs and
the Lithology Index. More specifically, the index is assumed to be zero for rocks having Vs
higher than 1.5 km/s, (i.e., hard, non-fractured rocks) and reaches a value of 1 for deposits
having Vs lower than 0.18 km/s (i.e., cohesionless soils or pseudo-coherent clayey
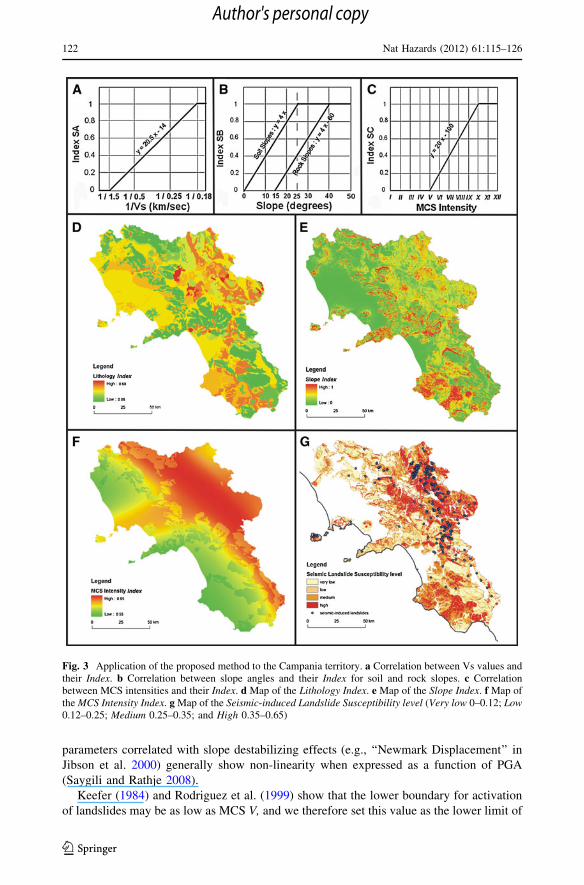
materials with high natural humidity). This proportionality is shown in Fig. 3a. In Fig. 3d,
we show the map of the Lithology Index of the Campania territory.
The slope angle (parameter B) has been computed by using the ‘‘Slope Tool’’ of
ARCGIS9.2� software, which calculates the maximum rate of elevation change between
adjacent cells. The input DTM with a 100 9 100 m mesh was obtained by gridding the
IGM-DTM, a 20 9 20 m mesh digital terrain model provided by the Italian Military
Geographical Institute (http://www.igmi.org/prodotti/dati_numerici/dati_matrix.php),
derived from 1:25,000 maps.
The transition from finer meshes (such as the ones used in the IGM-DTM data) to the
coarser ones used in this level-1 study (100 9 100 m) may lead to some smoothing of the
values, as also noted by Jibson et al. (2000).
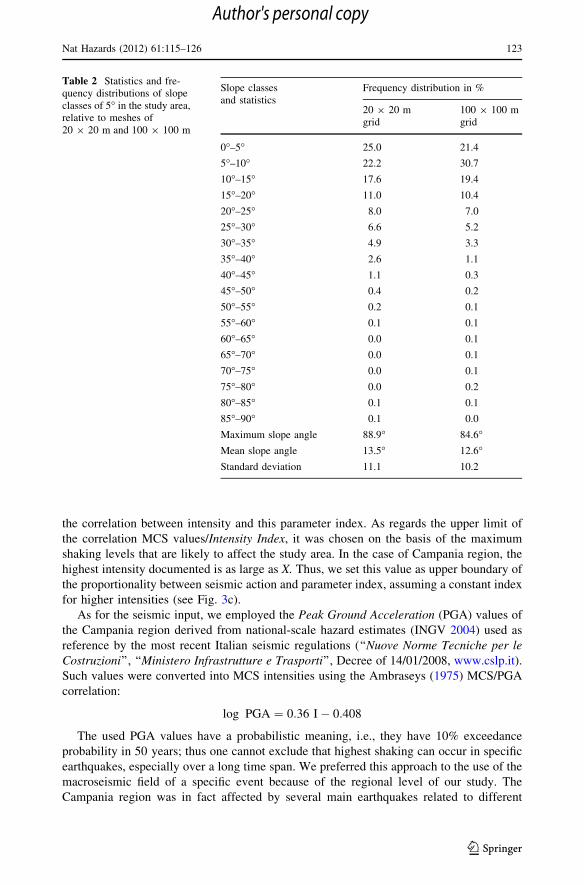
The comparison for the study area between the slope value data shows that the statistics
of slope do not change significantly when gridding the IGM-DTM data with a
100 9 100 m mesh (Table 2). The decreases are of about 4� for the maximum slope angle
and of less than 1� for the mean slope angle when passing from 20- to 100-m meshes. For
the larger slope angle classes, ranging from 45� to 90�, the differences between the classes
are less than 0.2%. For the 40�–45� slope angle class, the difference is 0.8%. For the other
slope angle classes, the differences are within 3%, with the only exception of the 5�–10�slope angle class characterized by a difference of 8.5%.
For the susceptibility assessment, we assume a direct proportionality between the slope
angle values and the Slope Index.Wasowski et al. (2002) show that a 20�–25� slope range provides a separation between
soil and rock failures, the latter generally occurring on slopes steeper than 35�. Therefore,
we assume different behaviors of the Slope Index in terms of instability depending on
whether we are dealing with loose/soil materials or coherent/rock materials.
That is, the index for soil slopes is directly proportional to the incline from 0� to 25� and
is kept constant over 25�, while the index for rock slopes is set to be zero for angles lower
than 15� and is proportional to the incline angles up to 40�, over which this index is kept
constant to the maximum (see Fig. 3b).
Those limits were chosen on the basis of the studies of Keefer (1984) and Rodriguez
et al. (1999) on historical seismic-induced landslides and, as far as the upper limits are
concerned, also considering the Mora and Vahrson method (ISSMGE-TC4 1999).
The use of those two relationships allowed us to compute the map of the Slope Index of
the area (Fig. 3e).
3.2 Parameter C: MCS intensity
To account for the potential triggering effect of earthquakes, we employ a seismic factor
based on MCS intensities. We assume linearity between MCS values and Intensity Index,
according to the Mora and Vahrson procedure which adopts a linearity between intensity
and the ‘‘seismicity’’ factor of the landslide hazard index. We note that the linearity would
be more difficult to justify if using maximum accelerations (PGA) instead of intensities. In
fact empirical equations proposed in literature to link ground motion measurement to
Nat Hazards (2012) 61:115–126 121
123
Author's personal copy
parameters correlated with slope destabilizing effects (e.g., ‘‘Newmark Displacement’’ in
Jibson et al. 2000) generally show non-linearity when expressed as a function of PGA
(Saygili and Rathje 2008).
Keefer (1984) and Rodriguez et al. (1999) show that the lower boundary for activation
of landslides may be as low as MCS V, and we therefore set this value as the lower limit of
Fig. 3 Application of the proposed method to the Campania territory. a Correlation between Vs values andtheir Index. b Correlation between slope angles and their Index for soil and rock slopes. c Correlationbetween MCS intensities and their Index. d Map of the Lithology Index. e Map of the Slope Index. f Map ofthe MCS Intensity Index. g Map of the Seismic-induced Landslide Susceptibility level (Very low 0–0.12; Low0.12–0.25; Medium 0.25–0.35; and High 0.35–0.65)
122 Nat Hazards (2012) 61:115–126
123
Author's personal copy
the correlation between intensity and this parameter index. As regards the upper limit of
the correlation MCS values/Intensity Index, it was chosen on the basis of the maximum
shaking levels that are likely to affect the study area. In the case of Campania region, the
highest intensity documented is as large as X. Thus, we set this value as upper boundary of
the proportionality between seismic action and parameter index, assuming a constant index
for higher intensities (see Fig. 3c).
As for the seismic input, we employed the Peak Ground Acceleration (PGA) values of
the Campania region derived from national-scale hazard estimates (INGV 2004) used as
reference by the most recent Italian seismic regulations (‘‘Nuove Norme Tecniche per leCostruzioni’’, ‘‘Ministero Infrastrutture e Trasporti’’, Decree of 14/01/2008, www.cslp.it).
Such values were converted into MCS intensities using the Ambraseys (1975) MCS/PGA
correlation:
log PGA ¼ 0:36 I� 0:408
The used PGA values have a probabilistic meaning, i.e., they have 10% exceedance
probability in 50 years; thus one cannot exclude that highest shaking can occur in specific
earthquakes, especially over a long time span. We preferred this approach to the use of the
macroseismic field of a specific event because of the regional level of our study. The
Campania region was in fact affected by several main earthquakes related to different
Table 2 Statistics and fre-quency distributions of slopeclasses of 5� in the study area,relative to meshes of20 9 20 m and 100 9 100 m
Slope classesand statistics
Frequency distribution in %
20 9 20 mgrid
100 9 100 mgrid
0�–5� 25.0 21.4
5�–10� 22.2 30.7
10�–15� 17.6 19.4
15�–20� 11.0 10.4
20�–25� 8.0 7.0
25�–30� 6.6 5.2
30�–35� 4.9 3.3
35�–40� 2.6 1.1
40�–45� 1.1 0.3
45�–50� 0.4 0.2
50�–55� 0.2 0.1
55�–60� 0.1 0.1
60�–65� 0.0 0.1
65�–70� 0.0 0.1
70�–75� 0.0 0.1
75�–80� 0.0 0.2
80�–85� 0.1 0.1
85�–90� 0.1 0.0
Maximum slope angle 88.9� 84.6�Mean slope angle 13.5� 12.6�Standard deviation 11.1 10.2
Nat Hazards (2012) 61:115–126 123
123
Author's personal copy
seismogenic sources (Fig. 1) whose concurrent influence on the whole territory is
accounted for by the above quoted national-scale hazard estimates.
As the acceleration values we used refer to stiff soils (Vs [ 800 m/s), they were
modulated on the basis of loose soil amplification factors (Eurocode 8 2003) according to
the values reported in Table 1. Figure 3f shows the map of the MCS Intensity Index so
obtained.
3.3 Regional seismic-induced landslide susceptibility map of Campania
As previously defined, the seismic-induced landslide susceptibility of an area is given by
the average of the indices of the two Predisposing Factors (parameters A and B) multiplied
by the index of the triggering factor (parameter C).
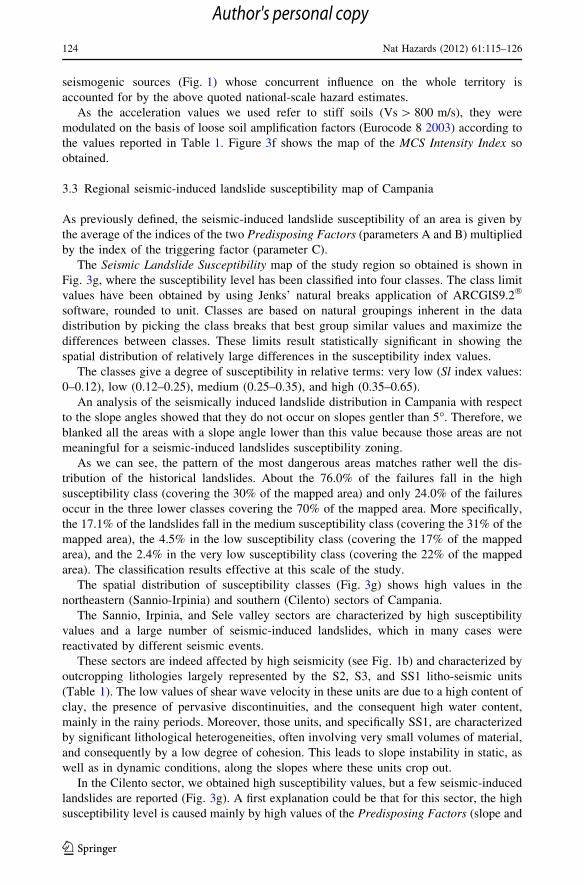
The Seismic Landslide Susceptibility map of the study region so obtained is shown in
Fig. 3g, where the susceptibility level has been classified into four classes. The class limit
values have been obtained by using Jenks’ natural breaks application of ARCGIS9.2�
software, rounded to unit. Classes are based on natural groupings inherent in the data
distribution by picking the class breaks that best group similar values and maximize the
differences between classes. These limits result statistically significant in showing the
spatial distribution of relatively large differences in the susceptibility index values.
The classes give a degree of susceptibility in relative terms: very low (Sl index values:
0–0.12), low (0.12–0.25), medium (0.25–0.35), and high (0.35–0.65).
An analysis of the seismically induced landslide distribution in Campania with respect
to the slope angles showed that they do not occur on slopes gentler than 5�. Therefore, we
blanked all the areas with a slope angle lower than this value because those areas are not
meaningful for a seismic-induced landslides susceptibility zoning.
As we can see, the pattern of the most dangerous areas matches rather well the dis-
tribution of the historical landslides. About the 76.0% of the failures fall in the high
susceptibility class (covering the 30% of the mapped area) and only 24.0% of the failures
occur in the three lower classes covering the 70% of the mapped area. More specifically,
the 17.1% of the landslides fall in the medium susceptibility class (covering the 31% of the
mapped area), the 4.5% in the low susceptibility class (covering the 17% of the mapped
area), and the 2.4% in the very low susceptibility class (covering the 22% of the mapped
area). The classification results effective at this scale of the study.
The spatial distribution of susceptibility classes (Fig. 3g) shows high values in the
northeastern (Sannio-Irpinia) and southern (Cilento) sectors of Campania.
The Sannio, Irpinia, and Sele valley sectors are characterized by high susceptibility
values and a large number of seismic-induced landslides, which in many cases were
reactivated by different seismic events.
These sectors are indeed affected by high seismicity (see Fig. 1b) and characterized by
outcropping lithologies largely represented by the S2, S3, and SS1 litho-seismic units
(Table 1). The low values of shear wave velocity in these units are due to a high content of
clay, the presence of pervasive discontinuities, and the consequent high water content,
mainly in the rainy periods. Moreover, those units, and specifically SS1, are characterized
by significant lithological heterogeneities, often involving very small volumes of material,
and consequently by a low degree of cohesion. This leads to slope instability in static, as
well as in dynamic conditions, along the slopes where these units crop out.
In the Cilento sector, we obtained high susceptibility values, but a few seismic-induced
landslides are reported (Fig. 3g). A first explanation could be that for this sector, the high
susceptibility level is caused mainly by high values of the Predisposing Factors (slope and
124 Nat Hazards (2012) 61:115–126
123
Author's personal copy
lithology) combined with low values of the Triggering Factor. Those high values of
Predisposing Factors cause a spread high slope instability that makes landslide mobili-
zation under meteoric events very likely, as testified by the very high density of landslides
in the Cilento area (ISPRA—SERVIZIO GEOLOGICO NAZIONALE 2006). Furthermore, most (i.e.,
the 74%) of the landslides included in our database are related to earthquakes occurred
during the twentieth century. Therefore, the absence of several documented cases of
seismic-induced landslides in Cilento could be partly due to the lack of earthquakes
affecting Cilento in the last 150 years, having the last one occurred in 1836 (Fig. 1). This
makes the record incompleteness of seismic-induced landslides a major issue for this
sector.
4 Conclusive remarks
We proposed a GIS-based method for regional zoning of seismic-induced landslide sus-
ceptibility and applied it to the territory of the Campania region, Southern Italy.
The outcome of zoning (Fig. 3g) results rather effective, being the 76.0% of the seis-
mic-induced failures included in the higher susceptibility class sector, which covers only
the 30% of the mapped area.
The Seismic-induced Landslide Susceptibility map obtained through the proposed
methodology has not a quantitative meaning but a qualitative one, as it provides a degree of
susceptibility in relative terms (Fell et al. 2008). This implies that the areas we define as
highly susceptible have a good chance to be characterized by seismic-induced failures, but
not necessarily they have been (or will be) affected by such instability.
We add that some sectors of the region may be characterized by a possible incom-
pleteness of the failure database. This could be an explanation for the presence of areas
classified as highly susceptible but lacking of documented landslides.
Acknowledgments The authors acknowledge support to A. Rapolla, Research Unit Responsible, by theItalian National Interest Research Project (PRIN) 2007, ‘‘Evaluation of geophysical and geological aspectsof landslide susceptibility to severe natural events and relative land zoning’’ (project 2007LE8ZC5_003,Nat. Resp. L. Cascini). They also acknowledge the support of the CUGRI GeoData Laboratory. The authorsare grateful to three anonymous reviewers for their constructive suggestions that were of great help inimproving our paper.
References
Ambraseys N (1975) The correlation of intensity with ground motion. In: proceedings of 14th Europeanconference. Seism. Comm. (ESC), Trieste, 16–22 September 1974. Bull Europ Comm Earthq Eng4:335–341
Bonardi G, Ciarcia S, Di Nocera S, Matano F, Sgrosso I, Torre M (2009) Carta delle principali unitacinematiche dell’Appennino meridionale. Boll Soc Geol It 128:47–60
Caputo R, Fiore A, Piedilato S, Sessa R (2004) Local seismic amplification analysis finalized to urbanplanification. Ginestra (PZ) case study (Southern Apennines). Geologia tecnica e ambientale 1:57–66
Caputo R, Fiore A, Sessa R (2006) Parametri geologici e territoriali per la pianificazione urbanistica in areasismica. Caso studio di Ripacandida (PZ) nell’Appennino meridionale. Giornale di Geologia Applicata4:189–194
Cascini L (2008) Applicability of landslide susceptibility and hazard zoning at different scales. Eng Geol102:164–177
Cascini L, Cosenza E, Gasparini P, Palazzo B, Rapolla A, Vinale F (2006) Linee Guida finalizzate allamitigazione del rischio sismico. Indagini ed analisi geologiche, geofisiche e geotecniche. BURC(Bollettino Ufficiale della Regione Campania) 53:1–61 (Napoli)
Nat Hazards (2012) 61:115–126 125
123
Author's personal copy
Cherubini C, Vessia G, Mannara G, Pingitore D (2008) Valutazione della risposta sismica locale a San-t’Angelo dei Lombardi: il caso dell’ex tribunale. Giornale di Geologia Applicata 8(2):177–191
CPTI Working Group (2004) Catalogo Parametrico dei Terremoti Italiani, versione 2004 (CPTI04). INGV,Bologna. http://emidius.mi.ingv.it/CPTI/
DISS Working Group (2009) Database of Individual Seismogenic Sources (DISS), Version 3.1.0: A com-pilation of potential sources for earthquakes larger than M 5.5 in Italy and surrounding areas.http://diss.rm.ingv.it/diss/, � INGV 2009—Istituto Nazionale di Geofisica e Vulcanologia
Di Giulio G, Improta L, Calderoni G, Rovelli A (2008) A study of the seismic response of the city ofBenevento (Southern Italy) through a combined analysis of seismological and geological data. EngGeol 97:146–170
Di Nocera S, Matano F, Pescatore T, Pinto F, Qurantiello R, Senatore MR, Torre M (2006) Schemageologico del transetto Monti Picentini orientali-Monti della Daunia meridionali: unita stratigrafiche edevoluzione tettonica del settore esterno dell’Appennino meridionale. Boll Soc Geol It 125:39–58
Elter P, Grasso M, Parotto M, Vezzani L (2003) Structural setting of the Apennine-Maghrebian thrust belt.Episodes 26:205–211
Eurocode 8 (2003) Design of structures for earthquake resistance. Part 1: General rules, seismic actions andrules for buildings. DRAFT No 6, Brussels, January 2003, European Committee for Standardization(C.E.N.), 208 pp
Fell R, Corominas J, Bonnard C, Cascini L, Leroi E, Savage WZ (2008) Guidelines for landslide suscep-tibility, hazard and risk zoning for land use planning. Eng Geol 102:85–98
INGV (2004) Redazione della mappa di pericolosita sismica. INGV, Rome, pp 65. http://zonesismiche.mi.ingv.it/
ISPRA—Servizio Geologico d’Italia (2006) Progetto IFFI (Inventario dei Fenomeni Franosi in Italia).Landslide Inventory Map of Italy at 1:25,000 scale. ISPRA—Dipartimento Difesa del Suolo-ServizioGeologico d’Italia—Regione Campania (www.sinanet.apat.it/progettoiffi)
ISPRA—Servizio Geologico d’Italia (2010) Progetto CARG (Cartografia Geologica). Geological Map ofItaly at 1:50,000 scale. ISPRA—Servizio Geologico d’Italia (http://www.isprambiente.it/Media/carg/index.html)
ISSMGE-TC4 (1999) Manual for zonation on seismic geotechnical hazards. The Japanese Society of SoilMechanics and Foundation Engineering, 210 pp
Jibson RW, Harp EL, Michael JA (2000) A method for producing digital probabilistic seismic landslidehazard maps. Eng Geol 58:271–289
Keefer DK (1984) Landslides caused by earthquakes. Geol Soc Am Bull 95:406–421Matano F (2009) Carta litologica della Regione Campania. In: Vilardo G, Bronzino G, Terranova C. Sistema
Informativo Sismotettonico della Regione Campania (SISCam 2.0). INGV, Osservatorio Vesuviano,http://ipf.ov.ingv.it/siscam.html
Mora S, Vahrson W (1994) Macrozonation methodology for landslide hazard zonation. Bull Int As EngGeol 31(1):49–58
Nunziata C, Natale M, Panza GF (2004) Seismic characterization of Neapolitan soils. Pure Appl Geophys161:1285–1300
Parise M, Jibson RW (2000) A seismic landslide susceptibility rating of geologic units based on analysis ofcharacteristics of landslides triggered by the 17 January, 1994 Northridge, California earthquake. EngGeol 58:251–270
Postpischl D (1985) Atlas of isoseismal maps of Italian Earthquakes. Quaderni de ‘‘La Ricerca Scientifica’’114, 2A. CNR–PFG, Bologna
Prestininzi A, Romeo R (2000) Earthquake-induced ground failures in Italy. Eng Geol 58:387–397Rapolla A (2008) La pericolosita sismica, Liguori Ed., Napoli, 278 pp, ISBN: 13 978-88-207-4092-4Rapolla A, Paoletti V, Secomandi M (2010) Seismically-induced landslide susceptibility evaluation:
application of a new procedure to the island of Ischia, Campania Region, Southern Italy. Eng Geol114:10–25
Rodriguez CE, Bommer JJ, Chandler RJ (1999) Earthquake-induced landslides: 1980–1997. Soil DynEarthq Eng 18:325–346
Romeo R, Delfino L (1997) CEDIT (release 1.1.), Catalogo Nazionale Effetti Deformativi del Suolo Indottida Forti Terremoti, Servizio Sismico Nazionale. Rapporto Tecnico SSN/RT/97/04, May 1997, 66 pp
Saygili G, Rathje EM (2008) Empirical predictive models for earthquake-induced sliding displacements ofslopes. J Geotech and Geoenviron Eng, ASCE 134(6):790–803
Wasowski J, Del Gaudio V, Pierri P, Capolongo D (2002) Factors controlling seismic susceptibility of theSele Valley slopes: the case of the 1980 Irpinia earthquake re-examined. Surv Geoph 23:563–593
126 Nat Hazards (2012) 61:115–126
123
Author's personal copy