Embed Size (px)
Citation preview
Sustainability of rice production systems: an empiricalevaluation to improve policy
Ranjan Roy • Ngai Weng Chan • Stefanos Xenarios
Received: 19 September 2014 / Accepted: 10 February 2015� Springer Science+Business Media Dordrecht 2015
Abstract An evaluation is needed to monitor the progress of sustainable development
(SD) in rice production systems. The purpose of this study is to provide policy inputs,
examine the sustainability of rice production, and determine major policy areas. A requisite
set of 12 indicators of three dimensions of SD, namely economic, was generated by
employing an assemblage of top–down and bottom–up approaches. The data were gathered
from farm households’ survey as well as in-depth discussion with stakeholders from the
regions that represent irrigated, rain-fed lowland, rain-fed upland, flood-prone, and saline-
prone rice-growing ecosystems in Bangladesh. By constructing composite indicators, the
results revealed that 44 % of rice growers were economically viable, environmentally
sound, and socially developed. The irrigated rice production system was found to be the
most sustainable. The path analysis measured the contribution of the indicators to the
index, and results highlighted that rice growers’ knowledge, skills, and social networks
development, improving land productivity, and integrated nutrient management were
essential for promoting sustainable rice production. However, the study findings suggest
that pluralistic (i.e., government and non-government) agricultural advisory services can
serve as an engine of transition to rice production sustainability in which a multi-year
planning and strategy formulation are crucial besides investing in the modernization of
extension services. Overall and ecosystem-specific policy implications that emerged from
the findings of this study are outlined.
R. Roy (&)Department of Agricultural Extension and Information System, Sher-e-Bangla Agricultural University,Sher-e-Bangla Nagar, Dhaka, Bangladeshe-mail: [email protected]
R. Roy � N. W. ChanGeography Section, School of Humanities, Universiti Sains Malaysia, Penang, Malaysia
S. XenariosNorwegian Institute for Agricultural and Environmental Research (Bioforsk), As, Norway
123
Environ Dev SustainDOI 10.1007/s10668-015-9638-x
Keywords Rice production � Bangladesh � Sustainability � Composite indicator � Policy �Evaluation
1 Introduction
Rice is the staple food of about half of the world’s population and a principal source of
livelihood of the majority of Asian people. Bangladesh is predominantly an agricultural-
based country, and rice is the main crop. Rice production occupies almost 77 % of the total
cropped area, employs about 50 % of the country’s labor force, and contributes to 10 %
GDP (BARC 2011). Bangladesh’s rice economy has made a notable progress; in particular,
the total amount of rice production and cultivating area have increased by 243 and 24 %,
respectively, in the last 40 years (BBS 2011). This progress is attributed to rapid expansion
of minor irrigation equipments,1 e.g., shallow tube-wells and introduction of many high-
yielding rice varieties (HYVs) (Hossain 2009).
Presently, sustainable rice production and agriculture are the major concerns of policy-
makers, and these concerns are reflected in several key documents of the government of
Bangladesh, such as National Agriculture Policy 2010 [Ministry of Agriculture (MoA)
2010] and Poverty Reduction Strategic Papers 2008 (Planning Commission 2008). The
probable reasons for this concern are as follows: (1) rice farming is highly vulnerable to
climate change (e.g., floods) (ActionAid 2011), (2) land is becoming an extremely scarce
commodity and declining by 1 % per annum (MoA 2010), (3) the price of fertilizers,
pesticides, and fuels for irrigation is gradually increasing (MoA 2006a), (4) irrigation water
crisis and groundwater arsenic contamination in the South Western part of the country
(Brammer 2009), and (5) rice-based monoculture pushing out the major non-cereal crops
such as oilseed and pulse (Hossain 2009).
Moreover, ever-increasing population pressure2 and soils with poor organic matter
content, i.e., most of the soils, have \1.5 % organic matter, whereas a good soil should
have at least 2.5 % organic matter (BARC 2011) in rice-producing areas that are the grave
threats for rice production sustainability. Based on literature review (e.g., Rasul and Thapa
2004; Gomez-Limon and Sanchez-Fernandez 2010), sustainability refers to preserving and
improving natural resources (fostering environmental soundness), enhancing farming
productivity and profitability (increasing economic viability), building human and social
capital, and provisioning of public goods and services to society (promoting social
development).
In Bangladesh, there are five rice-growing ecosystems (IRRI 2013), namely irrigated
land (dry ‘Boro’ season). Rice cultivation is characterized as irrigated and agrochemical
(mineral fertilizers and chemical synthesized pesticides)-intensive, and growers are
1 These equipments are not only dependent on ground water, but also on other numerous water sources.This country is known as ‘the land of rivers’, i.e., there are 310 rivers in Bangladesh, of these, 57 are trans-boundary rivers. Hence, the sustainability of rice production is not completely dependent on the sustain-ability of groundwater irrigation.2 Based on the data from 1971 to 2005, population increased at a rate of 2.042 million per year, whereas riceproduction increased at a rate of 0.4582 million tons per year. This figure indicates that if this rate continued,then about 10.50 million tons rice shortage is estimated for its total population demand in 2050 (Basak2010).
R. Roy et al.
123
overwhelmingly dominated (89 %) by small and marginal farmers (\1 ha land) (BBS
2013). Despite the fact that rice production has observed a high growth rate, it raises
environmental concerns such as soil compactness and acidity (Jahiruddin and Satter 2010).
Moreover, declination of agro-biodiversity, rural poverty, and food price speculation ex-
acerbate the growing concerns, indicating that the present rice production trends are not
environmentally sound, profitable, and socially responsible (ADB 2004a; Alauddin and
Quiggin 2008; Shahid and Behrawan 2008; Chowdhury 2009). Considering the present
state of declining land and water resources, as well as increasing rural poverty, addressing
the question of how to achieve sustainable rice production and country’s food security has
become a big challenge.
Considering these challenges, the government has taken initiatives to curb these
problems. Many completed and ongoing development projects have been implemented by
the Department of Agricultural Extension (DAE) to equip the extension agents and to
develop capacity of growers by providing training, logistic, and economic support.
However, the achievements obtained by these initiatives are inadequate due to resource
constraints, inefficient leadership, weak extension services, and lack of coordination
among agencies (MoA 2006b). Mandal (2006) reported that most of the policy documents
were prepared based on notional ideas and lack of empirical analysis, largely due to lack of
reliable data and ministerial inefficiencies (Roy et al. 2013a). Few years ago, the gov-
ernment had introduced fertilizers and irrigation subsidies, which are negligible, when
compared to those implemented in other countries such as India (MoA 2006a). Moreover,
studies showed that the subsidies are not so beneficial for marginal and small farmers, and
that rather a major share of subsidy benefits is grabbed by the fertilizer traders (Mandal
2006).
Literature on assessing rice production sustainability is not adequate to draw overar-
ching policy inputs. Based on historical data, Baffes and Gautam (2001) examined that the
current level of per capita rice production can be sustained by earning increased yields
from HYVs. Without taking flood- and saline-prone rice-growing ecosystems into account,
Roy et al. (2014) evaluated rice farming sustainability and found that ‘Boro’ rice is the
most sustainable. Developing composite indicators (CIs), Gowda and Jayaramaiah (1998)
compared sustainability of rice production systems in India and found that rain-fed lowland
rice is the most sustainable, followed by the irrigated system. However, the latter study
neither described the methodology in detail nor followed all the steps of CI development,
as suggested by the OECD (2008). In the present study, these research gaps have fulfilled
in the sense of considering five rice-growing ecosystems and conducting empirical
evaluations of rice production sustainability by using detailed CIs development method-
ologies of the OECD.
Broadly, sustainability evaluation is an approximate indication of the extent to which
the system is economically viable, environmentally sound, and socially acceptable. The
value of the CI, in particular, emerges from the score received by the indicator. A higher
index score of any production system commonly refers to the growers belonging to that
system presently facing fewer challenges than those with the lower index score. However,
this result does not necessarily indicate that the particular system’s current production
trajectory will be capable of maintaining its long-term ability and resilience of natural
resources. An empirical assessment of farming sustainability is a foundation for transition
to sustainability. By developing CIs, the present study first assessed the extent of rice
production sustainability at the farmer’s level. Second, the niche policy areas for pro-
moting it were determined. Finally, important policy implications were recommended.
Sustainability of rice production systems
123
2 Evaluation of sustainability using composite indicators
Although a common accepted set of indicators has not been identified and defined yet in
the literature, sustainability evaluation by using indicators is well established (Dahl 2012),
recognizing some operational problems (Gomez-Limon and Sanchez-Fernandez 2010).
Specifically, problems exist in interpretation of the whole set of indicators, which provides
superficial policy information. It lacks in assessing the trend of changes (e.g., environment)
and finding out causes, identifying best practices and optimizing the gains from govern-
ment investment. However, the life cycle thinking approach is a reliable tool for supporting
decision-making process in the assessment of sustainability performance of product
(Valdivia et al. 2013). In most cases, policy-makers are too busy to deal with detailed
information; they need packaged information to expedite decision-making. In this regard,
CIs are well suited in summarizing multidimensional issue to support policy-makers,
facilitate communication to the public, media, and other interested parties, and promote
accountability. CIs are an aggregated index, comprising the individual indicator based on
an underlying model.
Several tools, namely monetary (e.g., contingent valuation method), have been used for
sustainability evaluation in the diverse fields, and all approaches have advantages and
Ric
e P
rodu
ctio
n Su
stai
nabi
lity
Inde
x (R
PSI
)
Eco
nom
ic
Env
iron
men
tal
Soci
al
Production
Growers’ income
Non-farm employment
Supply of adequate input
Proper utilisation of natural resources
Balance of nutrients
Balance of major & minor crops
Emphasis on non- chemical measure
Serve society
Develop efficient manpower
Provide technological information
Develop farmers’ network
Land productivity
Benefit-cost-ratio
Pluriactivity
Input-self-sufficiency
Use of recourse conser- ving practs. & techs.
Nutrient management
Crop diversity
Pest, disease & weed management
Equity
Level of education
Information availabi- lity & accessibility
Social capital
Physical yield of per unit area1
Ratio of total revenue and cost2
Family income sources other than farming4
Ratio of local and external input3
No. of practices & technologies used that are assumed ecologically sound6
Extent of fertilisers use, quantity & preparation5
No. of crops & proportion of acreage of crop to total cropped area7
Extent of chemical & non-chemical methods application to manage pests, diseases & weeds8
Growers’ opinions on how to distribute goods & services to society12
No. of years of schooling of growers9
No. of sources of information and growers ability to access10
Extent of involvement, no. of contact & their confidence on the organisations11
Index Pillar Policy response* Indicator Measurement
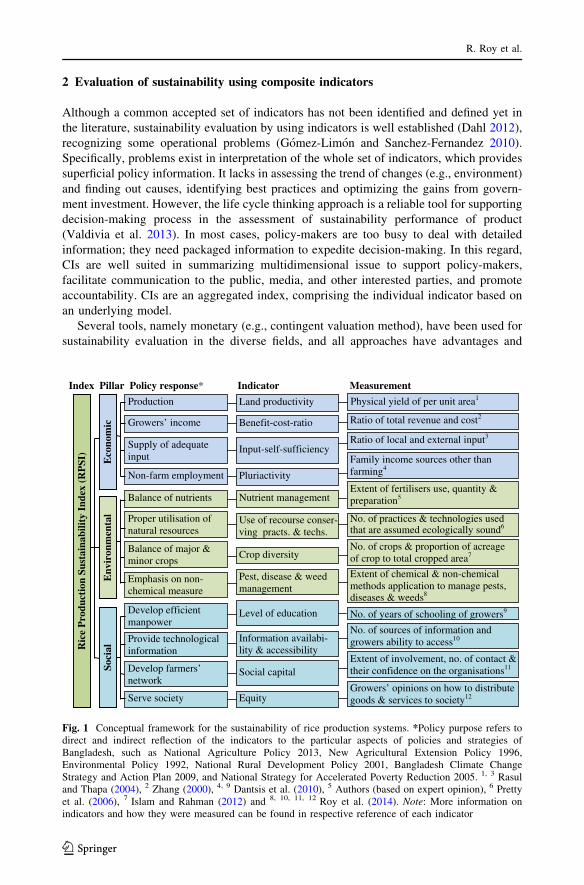
Fig. 1 Conceptual framework for the sustainability of rice production systems. *Policy purpose refers todirect and indirect reflection of the indicators to the particular aspects of policies and strategies ofBangladesh, such as National Agriculture Policy 2013, New Agricultural Extension Policy 1996,Environmental Policy 1992, National Rural Development Policy 2001, Bangladesh Climate ChangeStrategy and Action Plan 2009, and National Strategy for Accelerated Poverty Reduction 2005. 1, 3 Rasuland Thapa (2004), 2 Zhang (2000), 4, 9 Dantsis et al. (2010), 5 Authors (based on expert opinion), 6 Prettyet al. (2006), 7 Islam and Rahman (2012) and 8, 10, 11, 12 Roy et al. (2014). Note: More information onindicators and how they were measured can be found in respective reference of each indicator
R. Roy et al.
123
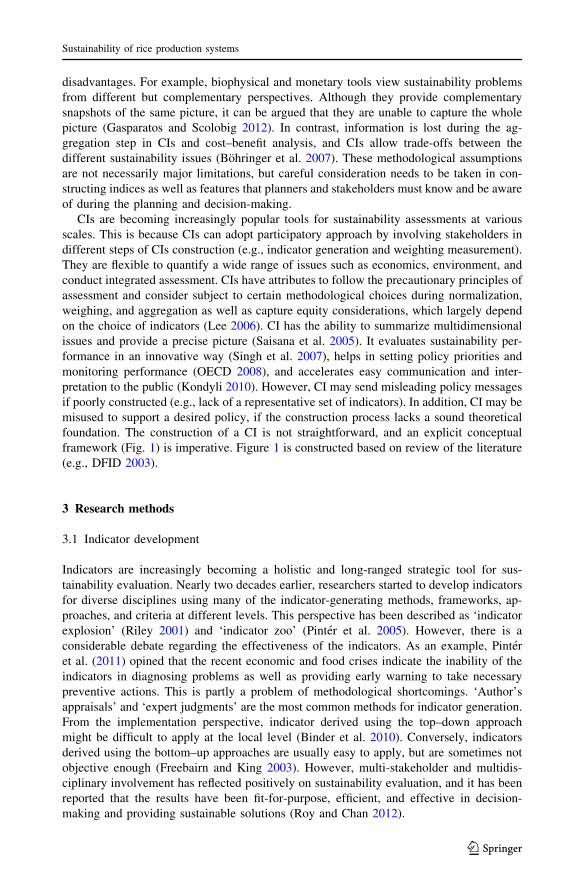
disadvantages. For example, biophysical and monetary tools view sustainability problems
from different but complementary perspectives. Although they provide complementary
snapshots of the same picture, it can be argued that they are unable to capture the whole
picture (Gasparatos and Scolobig 2012). In contrast, information is lost during the ag-
gregation step in CIs and cost–benefit analysis, and CIs allow trade-offs between the
different sustainability issues (Bohringer et al. 2007). These methodological assumptions
are not necessarily major limitations, but careful consideration needs to be taken in con-
structing indices as well as features that planners and stakeholders must know and be aware
of during the planning and decision-making.
CIs are becoming increasingly popular tools for sustainability assessments at various
scales. This is because CIs can adopt participatory approach by involving stakeholders in
different steps of CIs construction (e.g., indicator generation and weighting measurement).
They are flexible to quantify a wide range of issues such as economics, environment, and
conduct integrated assessment. CIs have attributes to follow the precautionary principles of
assessment and consider subject to certain methodological choices during normalization,
weighing, and aggregation as well as capture equity considerations, which largely depend
on the choice of indicators (Lee 2006). CI has the ability to summarize multidimensional
issues and provide a precise picture (Saisana et al. 2005). It evaluates sustainability per-
formance in an innovative way (Singh et al. 2007), helps in setting policy priorities and
monitoring performance (OECD 2008), and accelerates easy communication and inter-
pretation to the public (Kondyli 2010). However, CI may send misleading policy messages
if poorly constructed (e.g., lack of a representative set of indicators). In addition, CI may be
misused to support a desired policy, if the construction process lacks a sound theoretical
foundation. The construction of a CI is not straightforward, and an explicit conceptual
framework (Fig. 1) is imperative. Figure 1 is constructed based on review of the literature
(e.g., DFID 2003).
3 Research methods
3.1 Indicator development
Indicators are increasingly becoming a holistic and long-ranged strategic tool for sus-
tainability evaluation. Nearly two decades earlier, researchers started to develop indicators
for diverse disciplines using many of the indicator-generating methods, frameworks, ap-
proaches, and criteria at different levels. This perspective has been described as ‘indicator
explosion’ (Riley 2001) and ‘indicator zoo’ (Pinter et al. 2005). However, there is a
considerable debate regarding the effectiveness of the indicators. As an example, Pinter
et al. (2011) opined that the recent economic and food crises indicate the inability of the
indicators in diagnosing problems as well as providing early warning to take necessary
preventive actions. This is partly a problem of methodological shortcomings. ‘Author’s
appraisals’ and ‘expert judgments’ are the most common methods for indicator generation.
From the implementation perspective, indicator derived using the top–down approach
might be difficult to apply at the local level (Binder et al. 2010). Conversely, indicators
derived using the bottom–up approaches are usually easy to apply, but are sometimes not
objective enough (Freebairn and King 2003). However, multi-stakeholder and multidis-
ciplinary involvement has reflected positively on sustainability evaluation, and it has been
reported that the results have been fit-for-purpose, efficient, and effective in decision-
making and providing sustainable solutions (Roy and Chan 2012).
Sustainability of rice production systems
123
According to the above-mentioned understandings, the present study has adopted an
assemblage of top–down and bottom–up approaches comprising four episodes, namely
establishing the study context, information gathering and brainstorming, validation of the
indicator by farmer’s focus group discussion (FGD), and generation of the indicator.
Initially, a review of the literature was carried out to get potential indicators, and then
online surveys (Dillman 2006) employing the Delphi technique (Linstone and Turoff 2002)
were administered to capture expert’s opinions. Experts were selected based on distinct
criteria, e.g., having 20 years of professional expertise on that particular issue. Two rounds
of survey of experts were conducted, and questionnaires comprised of close- and open-
ended questions that provided freedom for proposing new indicator of the three dimensions
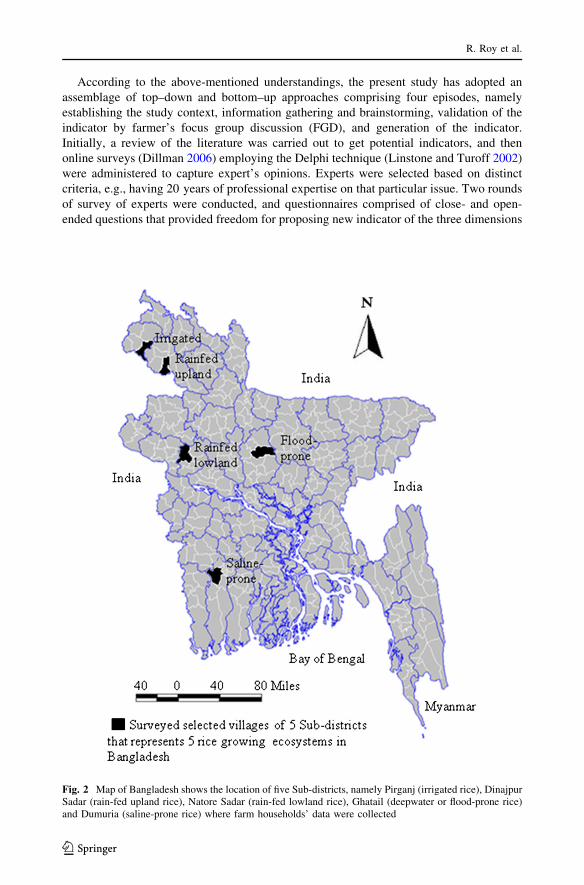
Fig. 2 Map of Bangladesh shows the location of five Sub-districts, namely Pirganj (irrigated rice), DinajpurSadar (rain-fed upland rice), Natore Sadar (rain-fed lowland rice), Ghatail (deepwater or flood-prone rice)and Dumuria (saline-prone rice) where farm households’ data were collected
R. Roy et al.
123
of sustainable rice farming. After achieving a satisfactory consensus of indicators, 10
FGDs (Bloor et al. 2001) were conducted with the growers of five rice-growing ecosys-
tems, e.g., irrigated. The purpose of the FGDs was to evaluate the indicator’s data avail-
ability, representative, and communicability. Finally, 12 indicators were derived for
assessment. Methodological explanations on how and why a set of indicators were de-
veloped can be found elsewhere (Roy et al. 2013b).
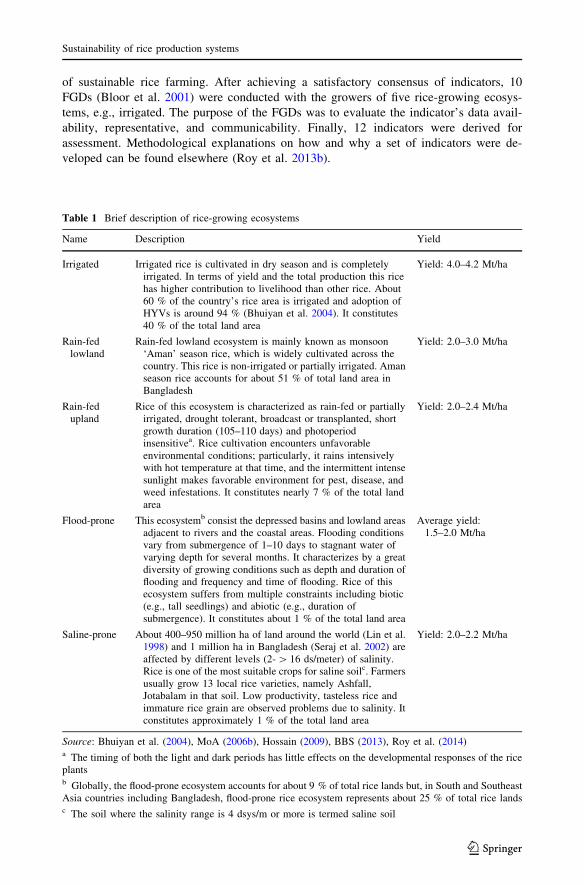
Table 1 Brief description of rice-growing ecosystems
Name Description Yield
Irrigated Irrigated rice is cultivated in dry season and is completelyirrigated. In terms of yield and the total production this ricehas higher contribution to livelihood than other rice. About60 % of the country’s rice area is irrigated and adoption ofHYVs is around 94 % (Bhuiyan et al. 2004). It constitutes40 % of the total land area
Yield: 4.0–4.2 Mt/ha
Rain-fedlowland
Rain-fed lowland ecosystem is mainly known as monsoon‘Aman’ season rice, which is widely cultivated across thecountry. This rice is non-irrigated or partially irrigated. Amanseason rice accounts for about 51 % of total land area inBangladesh
Yield: 2.0–3.0 Mt/ha
Rain-fedupland
Rice of this ecosystem is characterized as rain-fed or partiallyirrigated, drought tolerant, broadcast or transplanted, shortgrowth duration (105–110 days) and photoperiodinsensitivea. Rice cultivation encounters unfavorableenvironmental conditions; particularly, it rains intensivelywith hot temperature at that time, and the intermittent intensesunlight makes favorable environment for pest, disease, andweed infestations. It constitutes nearly 7 % of the total landarea
Yield: 2.0–2.4 Mt/ha
Flood-prone This ecosystemb consist the depressed basins and lowland areasadjacent to rivers and the coastal areas. Flooding conditionsvary from submergence of 1–10 days to stagnant water ofvarying depth for several months. It characterizes by a greatdiversity of growing conditions such as depth and duration offlooding and frequency and time of flooding. Rice of thisecosystem suffers from multiple constraints including biotic(e.g., tall seedlings) and abiotic (e.g., duration ofsubmergence). It constitutes about 1 % of the total land area
Average yield:1.5–2.0 Mt/ha
Saline-prone About 400–950 million ha of land around the world (Lin et al.1998) and 1 million ha in Bangladesh (Seraj et al. 2002) areaffected by different levels (2- [ 16 ds/meter) of salinity.Rice is one of the most suitable crops for saline soilc. Farmersusually grow 13 local rice varieties, namely Ashfall,Jotabalam in that soil. Low productivity, tasteless rice andimmature rice grain are observed problems due to salinity. Itconstitutes approximately 1 % of the total land area
Yield: 2.0–2.2 Mt/ha
Source: Bhuiyan et al. (2004), MoA (2006b), Hossain (2009), BBS (2013), Roy et al. (2014)a The timing of both the light and dark periods has little effects on the developmental responses of the riceplantsb Globally, the flood-prone ecosystem accounts for about 9 % of total rice lands but, in South and SoutheastAsia countries including Bangladesh, flood-prone rice ecosystem represents about 25 % of total rice landsc The soil where the salinity range is 4 dsys/m or more is termed saline soil
Sustainability of rice production systems
123
3.2 Study area and survey
This study was conducted in five Sub-districts, namely Pirganj, Natore Sadar, Dinajpur
Sadar, Ghatail, and Dumuria (Fig. 2), which represent irrigated, rain-fed lowland, rain-fed
upland, flood-prone and saline-prone rice-growing ecosystems (Table 1), respectively. The
selection of the study area was based on two criteria: (1) in terms of yield (i.e., crop per
unit area of land) and total production, the sub-districts are geographically recognized for
rice cultivation area and (2) in terms of socioeconomic and biophysical condition, the areas
exhibit general situation of the respective ecosystems (Agriculture Census 1996). Based on
the ecosystems, districts, sub-districts, and villages were selected by applying a multistage
random sampling technique. A total of 450 farm households were selected from 18 villages
for household survey, and this sample size represents about 26 % of rice growers. Con-
sidering the number of sub-districts with different rice-growing ecosystems, 6 (2 9 3)
villages were taken from flood- and saline-prone ecosystems and 12 (3 9 4) villages were
from other 3 ecosystems. Following a random sampling method, 25 households were
selected from each village by taking the proportional size of the farms into consideration,
i.e., large, medium, and small. Detailed information on rice yield of per unit area, fertilizer
use, agricultural information, cost and revenue of farming, and organization involvement
was collected through the farm households’ survey. The data were checked and cross-
checked by multiple sources to obtain a complete and good quality data set. It was done by
the following ways: Data collection was repeated when it seems that there were incon-
sistencies, and collected information was cross-checked by informal discussion with
stakeholders.
Moreover, supplementary information was collected through observations and in-depth
discussions with extension agents, input dealers, local leaders, NGO workers, and policy-
makers. Secondary data were provided by the concerned sub-districts Agricultural
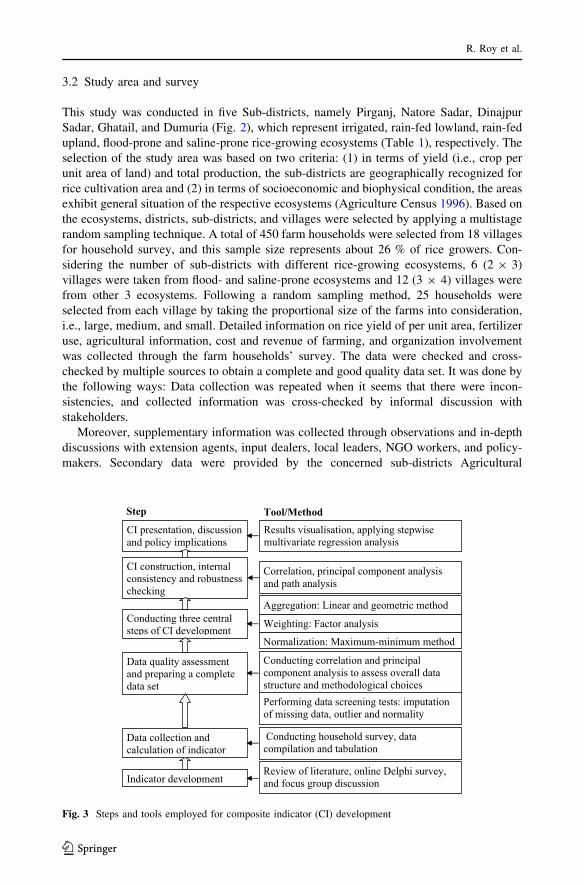
CI presentation, discussion and policy implications
Results visualisation, applying stepwise multivariate regression analysis
CI construction, internal consistency and robustness checking
Correlation, principal component analysis and path analysis
Conducting three central steps of CI development
Aggregation: Linear and geometric method
Weighting: Factor analysis
Normalization: Maximum-minimum method
Step Tool/Method
Data quality assessment and preparing a complete data set
Conducting correlation and principal component analysis to assess overall data structure and methodological choices Performing data screening tests: imputation of missing data, outlier and normality
Data collection and calculation of indicator
Indicator developmentReview of literature, online Delphi survey, and focus group discussion
Conducting household survey, data compilation and tabulation
Fig. 3 Steps and tools employed for composite indicator (CI) development
R. Roy et al.
123
Extension Office (AEO). Figure 1 presents the purpose of indicators and how they were
measured. The majority of the indicators were measured following previous study such as
following Rasul and Thapa (2004) where land productivity was measured by estimating the
physical yield of rice per unit area, and yield data (HYV and local rice) were collected by
survey as well as from the AEO. Expert opinion was taken to measure some of the
indicators, e.g., equity. Equity measures farmer’s opinion on how to distribute goods and
services across society, particularly thinking on gender issues (Roy et al. 2014).
Sustainability is a multi-scalar concept that has both temporal and spatial dimensions.
Spatial aspects were assessed by conducting a survey of on-farm rice-related information
in five rice-growing ecosystems. Temporal aspects of sustainability are addressed by (1)
utilizing ‘systems of indicator’ (Gomez-Limon and Sanchez-Fernandez 2010; Bell and
Morse 2008) that approaches particular indicators (e.g., use of resource-conserving prac-
tices and technologies), which deal with problems of protecting and enhancing the envi-
ronment at present and provide sustenance for future generations and (2) using time series
data of rice yields for measuring indicators.
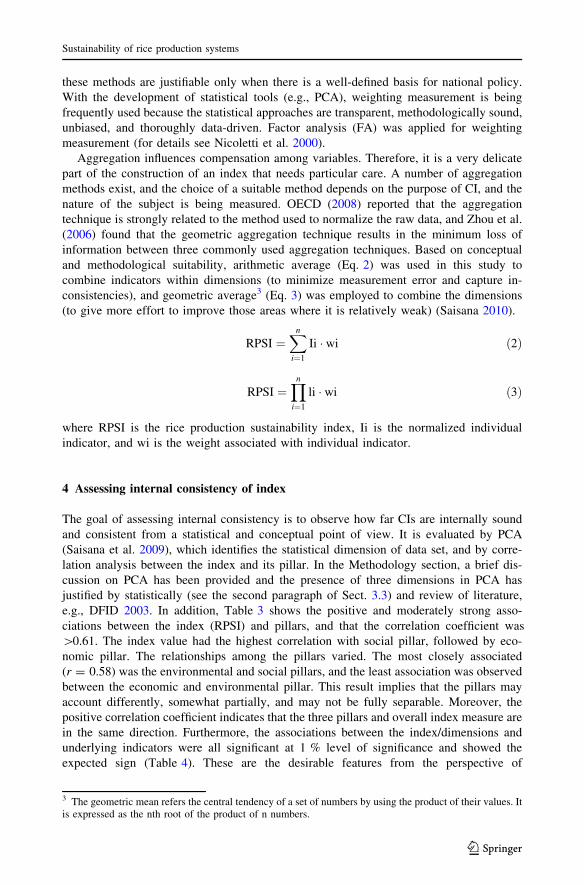
3.3 Data preparations
Figure 3 presents the construction process of CI. A good care was taken for maintaining
data quality, which was accomplished in two ways, namely applying data-screening tests
and bivariate and multivariate analysis to examine the overall structure and suitability of
the data set for subsequent methodological choices. Two data-screening tests, namely
outlier checking and normality of data set, were performed. The outliers were checked by
observing z-score and dealt by employing the next highest score plus one, and the mean
plus two standard deviations. The assumption of normality is important in research using
regression analysis (Field 2009), for which, skewness and kurtosis value was estimated
(Table 2).
Following data-screening tests, the correlation analysis was conducted to observe the
interrelationships of the indicators. This method is a widely used statistical tool for con-
firming the mathematical design of index. The index is overwhelmed, confused, and im-
plicit in communicating when there is a poor interrelationship among the indicators
(OECD 2008). Correlation analysis showed that about 85 % indicators had moderate to
high association between indicators. The results also indicated that multicollinearity was
not a problem among the indicators. Moreover, it fulfilled the major assumption of prin-
cipal component analysis (PCA), which is essential to investigate the multidimensionality
of the data set (Nardo et al. 2005). Another important condition of PCA is sample
adequacy, for which the Kaiser–Meyer–Olkin (KMO) statistic should be 0.60 or higher;
otherwise, the application of PCA is questionable (OECD 2008). In our case, the KMO
statistic was 0.68, and the other condition, namely the Bartlett’s test of Sphericity, was
satisfied. The PCA revealed that the indicators had five common components and ex-
plained 78 % variance of the entire data set. However, when we forced a desired structure
of three dimensions, it accounted for 71 % of the variance of the full data set by using
varimax rotation (see Saisana 2008 for details).
In fact, it is difficult to find acceptable explanations for the five components in sus-
tainability evaluation of rice production systems. The significance, balance, and com-
pactness of the three dimensions in sustainability assessment and management have been
established in the literature (e.g., DFID 2003), and the decision was corroborated by expert
opinions. Furthermore, pertinent measurement errors such as correlation (assumed not to
be spurious due to representative sample) were overcome, and data qualities were managed
Sustainability of rice production systems
123
by statistics. The observed features of PCA, such as indicators not being redundant, being
partially overlapping, and not being entirely separable in each component, further rein-
forced our justification of the presence of three dimensions in data set.
3.4 Normalization, weighting, and aggregation
In general, indicators have different measurement units, and prior to data aggregation, it is
required to remove the scale effects of units of measurement to render them comparable.
Several normalization methods have been described, and the selection of suitable method
depends on both data properties (e.g., the presence of extreme values) and theoretical
foundations (OECD 2008). Considering the pros (e.g., simplicity) and cons (e.g., presence
of outliers) of several normalization techniques, the ‘max–min’ normalization method was
used (Eq. 1).
Ii ¼ x�min ðxÞmax ðxÞ �min ðxÞ ð1Þ
where Ii is the normalized value of the individual indicator, x is the raw value of individual
indicator, and max (x) and min (x) are the maximum and minimum value of x.
There is no consensus for the appropriate weighting method (OECD 2008). A number of
subjective and objective weighting methods exist. However, each method has been re-
ported to have several merits and demerits. Equal weighting (EW) is the most widely used
method and has the risk of double counting (i.e., when two or more indicators partially
measure the same behavior) and ignores the statistical and empirical basis, implying a
judgment on the weights being equal (Nardo et al. 2005). From the policy perspective,
public opinion-based weighting has been established. Although it is a legitimate choice, it
is not unique and its arbitrary characteristic raises criticism. According to Munda (2007),
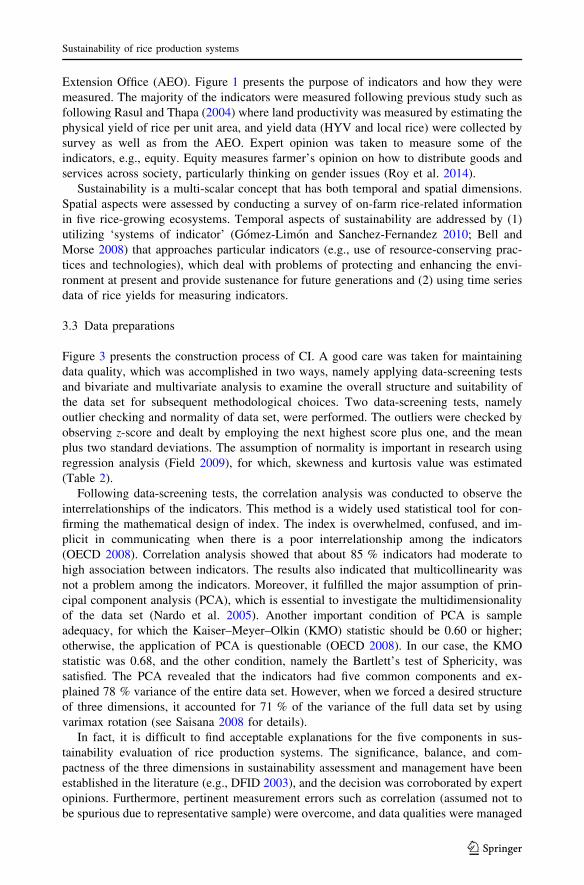
Table 2 Descriptive statistics of the indicators
Indicator Min.Score
Max.score
Mean SD Skewness Kurtosis
Land productivity (productivity) 2396.94 8297.10 4617.31 1617.38 0.787 -0.742
Benefit–cost ratio (BCR) 0.74 1.47 1.04 0.14 0.503 0.270
Input self-sufficiency (InputSufficiency) 0.37 0.70 0.54 0.07 0.023 -0.737
Pluriactivity 0.00 5.00 2.43 1.54 -0.479 -0.980
Integrated nutrient management(NutrientMgt)
6.00 26.00 13.56 3.31 0.365 0.188
Resource-conserving practice &technology (RCPracTech)
20.00 52.00 36.44 5.10 0.620 0.896
Cropping diversity (Cropdiversity) 0.20 0.89 0.62 0.13 -0.327 -0.395
Pest, disease, and weed management(PDWMgt)
7.00 18.00 12.01 2.49 0.060 -0.765
Education 2.00 16.00 9.50 3.65 -0.440 -0.502
Information availability and accessibility(InfoAvailAcess)
2.00 13.00 7.13 2.30 0.114 -0.437
Social capital (SCapital) 11.00 39.00 20.98 4.68 0.764 0.447
Equity 21.00 44.00 32.37 4.20 -0.361 -0.432
Abbreviated name of indicators name in the parentheses will be referred hereafter
R. Roy et al.
123
these methods are justifiable only when there is a well-defined basis for national policy.
With the development of statistical tools (e.g., PCA), weighting measurement is being
frequently used because the statistical approaches are transparent, methodologically sound,
unbiased, and thoroughly data-driven. Factor analysis (FA) was applied for weighting
measurement (for details see Nicoletti et al. 2000).
Aggregation influences compensation among variables. Therefore, it is a very delicate
part of the construction of an index that needs particular care. A number of aggregation
methods exist, and the choice of a suitable method depends on the purpose of CI, and the
nature of the subject is being measured. OECD (2008) reported that the aggregation
technique is strongly related to the method used to normalize the raw data, and Zhou et al.
(2006) found that the geometric aggregation technique results in the minimum loss of
information between three commonly used aggregation techniques. Based on conceptual
and methodological suitability, arithmetic average (Eq. 2) was used in this study to
combine indicators within dimensions (to minimize measurement error and capture in-
consistencies), and geometric average3 (Eq. 3) was employed to combine the dimensions
(to give more effort to improve those areas where it is relatively weak) (Saisana 2010).
RPSI ¼Xn
i¼1
Ii � wi ð2Þ
RPSI ¼Yn
i¼1
li � wi ð3Þ
where RPSI is the rice production sustainability index, Ii is the normalized individual
indicator, and wi is the weight associated with individual indicator.
4 Assessing internal consistency of index
The goal of assessing internal consistency is to observe how far CIs are internally sound
and consistent from a statistical and conceptual point of view. It is evaluated by PCA
(Saisana et al. 2009), which identifies the statistical dimension of data set, and by corre-
lation analysis between the index and its pillar. In the Methodology section, a brief dis-
cussion on PCA has been provided and the presence of three dimensions in PCA has
justified by statistically (see the second paragraph of Sect. 3.3) and review of literature,
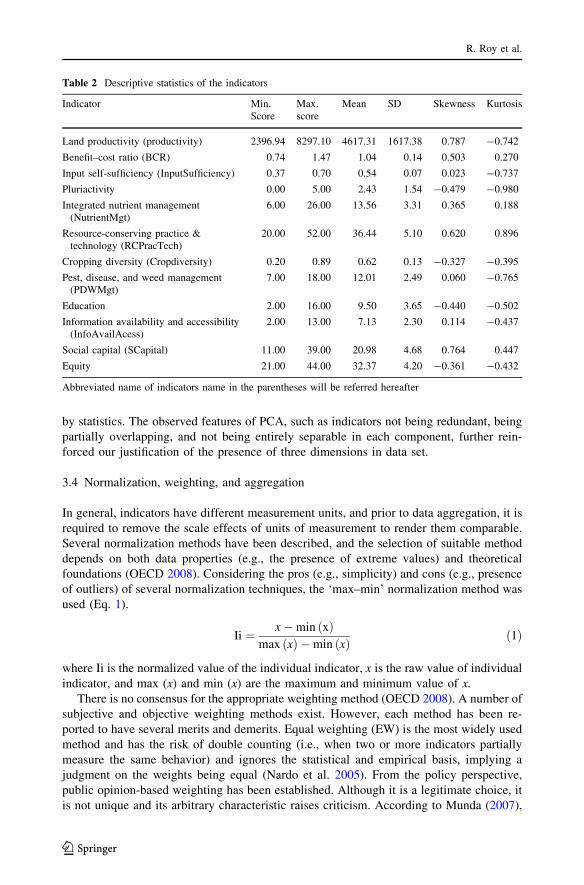
e.g., DFID 2003. In addition, Table 3 shows the positive and moderately strong asso-
ciations between the index (RPSI) and pillars, and that the correlation coefficient was
[0.61. The index value had the highest correlation with social pillar, followed by eco-
nomic pillar. The relationships among the pillars varied. The most closely associated
(r = 0.58) was the environmental and social pillars, and the least association was observed
between the economic and environmental pillar. This result implies that the pillars may
account differently, somewhat partially, and may not be fully separable. Moreover, the
positive correlation coefficient indicates that the three pillars and overall index measure are
in the same direction. Furthermore, the associations between the index/dimensions and
underlying indicators were all significant at 1 % level of significance and showed the
expected sign (Table 4). These are the desirable features from the perspective of
3 The geometric mean refers the central tendency of a set of numbers by using the product of their values. Itis expressed as the nth root of the product of n numbers.
Sustainability of rice production systems
123
theoretical justifications, and their absence indicates the existence of trade-offs between the
index and pillar.
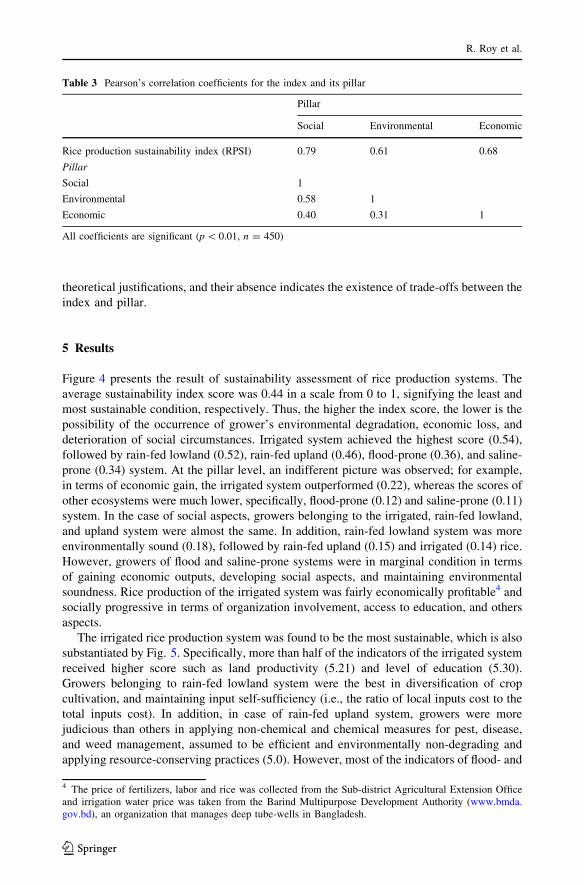
5 Results
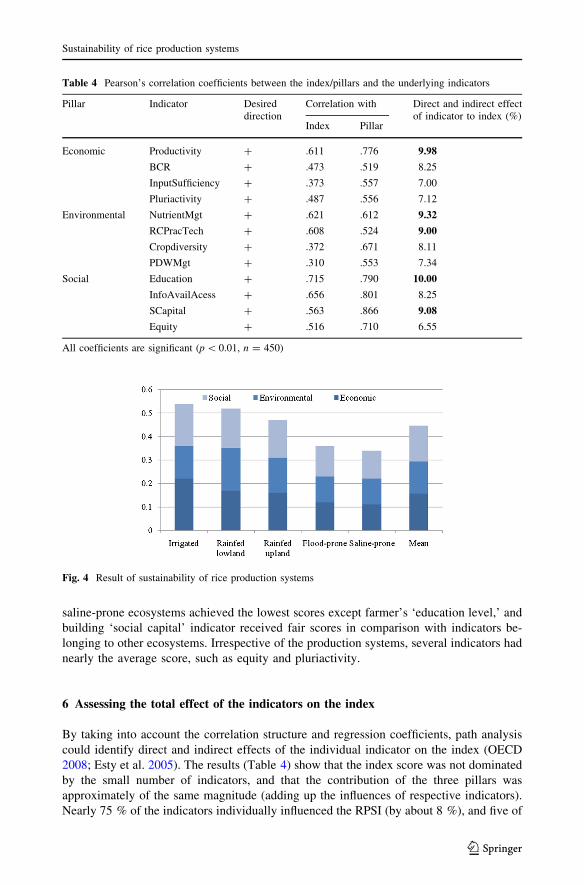
Figure 4 presents the result of sustainability assessment of rice production systems. The
average sustainability index score was 0.44 in a scale from 0 to 1, signifying the least and
most sustainable condition, respectively. Thus, the higher the index score, the lower is the
possibility of the occurrence of grower’s environmental degradation, economic loss, and
deterioration of social circumstances. Irrigated system achieved the highest score (0.54),
followed by rain-fed lowland (0.52), rain-fed upland (0.46), flood-prone (0.36), and saline-
prone (0.34) system. At the pillar level, an indifferent picture was observed; for example,
in terms of economic gain, the irrigated system outperformed (0.22), whereas the scores of
other ecosystems were much lower, specifically, flood-prone (0.12) and saline-prone (0.11)
system. In the case of social aspects, growers belonging to the irrigated, rain-fed lowland,
and upland system were almost the same. In addition, rain-fed lowland system was more
environmentally sound (0.18), followed by rain-fed upland (0.15) and irrigated (0.14) rice.
However, growers of flood and saline-prone systems were in marginal condition in terms
of gaining economic outputs, developing social aspects, and maintaining environmental
soundness. Rice production of the irrigated system was fairly economically profitable4 and
socially progressive in terms of organization involvement, access to education, and others
aspects.
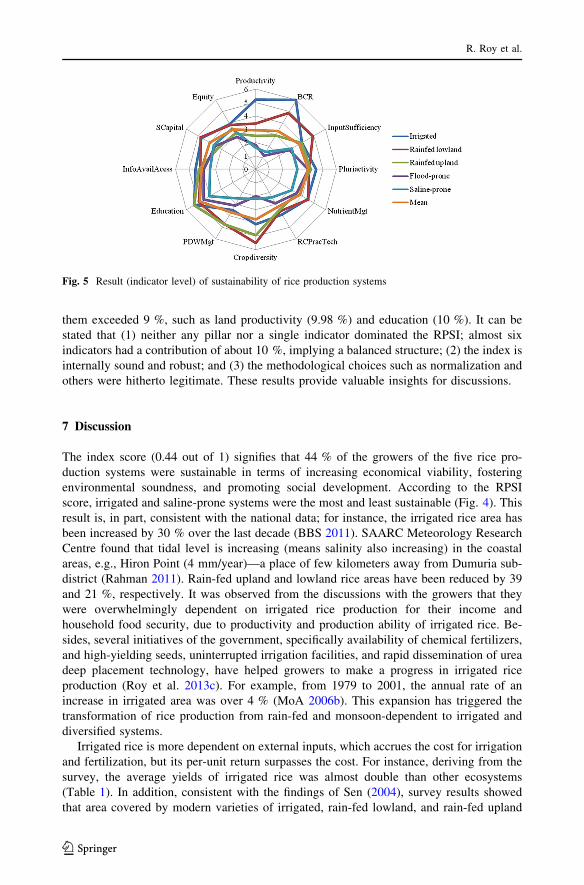
The irrigated rice production system was found to be the most sustainable, which is also
substantiated by Fig. 5. Specifically, more than half of the indicators of the irrigated system
received higher score such as land productivity (5.21) and level of education (5.30).
Growers belonging to rain-fed lowland system were the best in diversification of crop
cultivation, and maintaining input self-sufficiency (i.e., the ratio of local inputs cost to the
total inputs cost). In addition, in case of rain-fed upland system, growers were more
judicious than others in applying non-chemical and chemical measures for pest, disease,
and weed management, assumed to be efficient and environmentally non-degrading and
applying resource-conserving practices (5.0). However, most of the indicators of flood- and
Table 3 Pearson’s correlation coefficients for the index and its pillar
Pillar
Social Environmental Economic
Rice production sustainability index (RPSI) 0.79 0.61 0.68
Pillar
Social 1
Environmental 0.58 1
Economic 0.40 0.31 1
All coefficients are significant (p \ 0.01, n = 450)
4 The price of fertilizers, labor and rice was collected from the Sub-district Agricultural Extension Officeand irrigation water price was taken from the Barind Multipurpose Development Authority (www.bmda.gov.bd), an organization that manages deep tube-wells in Bangladesh.
R. Roy et al.
123
saline-prone ecosystems achieved the lowest scores except farmer’s ‘education level,’ and
building ‘social capital’ indicator received fair scores in comparison with indicators be-
longing to other ecosystems. Irrespective of the production systems, several indicators had
nearly the average score, such as equity and pluriactivity.
6 Assessing the total effect of the indicators on the index
By taking into account the correlation structure and regression coefficients, path analysis
could identify direct and indirect effects of the individual indicator on the index (OECD
2008; Esty et al. 2005). The results (Table 4) show that the index score was not dominated
by the small number of indicators, and that the contribution of the three pillars was
approximately of the same magnitude (adding up the influences of respective indicators).
Nearly 75 % of the indicators individually influenced the RPSI (by about 8 %), and five of
Table 4 Pearson’s correlation coefficients between the index/pillars and the underlying indicators
Pillar Indicator Desireddirection
Correlation with Direct and indirect effectof indicator to index (%)
Index Pillar
Economic Productivity ? .611 .776 9.98
BCR ? .473 .519 8.25
InputSufficiency ? .373 .557 7.00
Pluriactivity ? .487 .556 7.12
Environmental NutrientMgt ? .621 .612 9.32
RCPracTech ? .608 .524 9.00
Cropdiversity ? .372 .671 8.11
PDWMgt ? .310 .553 7.34
Social Education ? .715 .790 10.00
InfoAvailAcess ? .656 .801 8.25
SCapital ? .563 .866 9.08
Equity ? .516 .710 6.55
All coefficients are significant (p \ 0.01, n = 450)
Fig. 4 Result of sustainability of rice production systems
Sustainability of rice production systems
123
them exceeded 9 %, such as land productivity (9.98 %) and education (10 %). It can be
stated that (1) neither any pillar nor a single indicator dominated the RPSI; almost six
indicators had a contribution of about 10 %, implying a balanced structure; (2) the index is
internally sound and robust; and (3) the methodological choices such as normalization and
others were hitherto legitimate. These results provide valuable insights for discussions.
7 Discussion
The index score (0.44 out of 1) signifies that 44 % of the growers of the five rice pro-
duction systems were sustainable in terms of increasing economical viability, fostering
environmental soundness, and promoting social development. According to the RPSI
score, irrigated and saline-prone systems were the most and least sustainable (Fig. 4). This
result is, in part, consistent with the national data; for instance, the irrigated rice area has
been increased by 30 % over the last decade (BBS 2011). SAARC Meteorology Research
Centre found that tidal level is increasing (means salinity also increasing) in the coastal
areas, e.g., Hiron Point (4 mm/year)—a place of few kilometers away from Dumuria sub-
district (Rahman 2011). Rain-fed upland and lowland rice areas have been reduced by 39
and 21 %, respectively. It was observed from the discussions with the growers that they
were overwhelmingly dependent on irrigated rice production for their income and
household food security, due to productivity and production ability of irrigated rice. Be-
sides, several initiatives of the government, specifically availability of chemical fertilizers,
and high-yielding seeds, uninterrupted irrigation facilities, and rapid dissemination of urea
deep placement technology, have helped growers to make a progress in irrigated rice
production (Roy et al. 2013c). For example, from 1979 to 2001, the annual rate of an
increase in irrigated area was over 4 % (MoA 2006b). This expansion has triggered the
transformation of rice production from rain-fed and monsoon-dependent to irrigated and
diversified systems.
Irrigated rice is more dependent on external inputs, which accrues the cost for irrigation
and fertilization, but its per-unit return surpasses the cost. For instance, deriving from the
survey, the average yields of irrigated rice was almost double than other ecosystems
(Table 1). In addition, consistent with the findings of Sen (2004), survey results showed
that area covered by modern varieties of irrigated, rain-fed lowland, and rain-fed upland
Fig. 5 Result (indicator level) of sustainability of rice production systems
R. Roy et al.
123
were 96, 49, and 35 %, respectively. However, the figures for flood- and saline-prone
ecosystems were much lower. These were about 13 and 10 %, albeit Bangladesh Rice
Research Institute (BRRI) has developed 17 climate-resilient rice varieties such as sub-
mergence (e.g., BR52) and saline tolerant (e.g., BR47). These results fairly indicate the
weakness of DAE, which is mainly responsible for crop-related information and tech-
nology dissemination at the farmers’ level. This phenomenon was rather worse in the
coastal areas where no official awareness and capacity building program to promote saline
tolerant varieties were found (Sen 2004). In this case, the role of agricultural extension
services is very crucial for creating awareness, educating, and leading for the change in
resilient farming. Realizing the present context, overhaul of the extension system is not
enough, but fundamentally, the approach of extension services should be changed from the
agents/consultants to facilitators/supporters for farming sustainability transitions (Dogliotti
et al. 2014).
Despite the fact that the growers of the irrigated rice production system were eco-
nomically most viable, they were not environmentally sound in comparison with rain-fed
lowland and upland rice (Fig. 4). It can be justified that the high dependency of the
irrigated rice on external inputs negatively affects agro-environmental system such as
deterioration of soil fertility, water pollution, and erosion of biodiversity (MEA 2005). A
number of growers reported that a general conception regarding the irrigated rice pro-
duction is ‘more investment and more benefits.’ Here, investment refers to the use of an
increased amount of chemical fertilizers, pesticides, and herbicides. The environmental
condition of flood- and saline-prone ecosystems is in fragile state due to the flash and tidal
floods. Researchers (e.g., Mirza 2011) indicated that pluvial as well as fluvial flooding
could increase in Bangladesh with climate change, and flooding is one of the major
constraints to yield and crop production (Wassmann et al. 2009).
Salinity intrusion poses a serious threat to rice production in the coastal areas that
constitute nearly 30 % of the cultivable land in this country (Hossain 2010). The largely
harvested type rice ‘rain-fed lowland’ is commonly non-irrigated, when compared to ir-
rigated rice and is less dependent on agrochemicals. Discussion with stakeholders revealed
that: (1) this rice is less susceptible to pests, diseases, and weeds infestations; (2) it
produces average yield using a minimal amount of external inputs; and (3) higher pro-
duction of this rice is not strongly associated with increased amounts of external inputs
application. These characteristics seem suitable for environmentally sound production to a
partial extent. Rain-fed upland rice is almost dependent on natural spring and needs fewer
amounts of fertilizers because it receives nutrients from previous irrigated rice crop.
However, its cultivation period from April to August falls on adverse climatic conditions
(i.e., raining and hot temperature) (Table 1). Consequently, increased amount of pesticides
application hampers environmental qualities of farming systems and adds financial burden
to farmers.
A common scenario observed in social dimension was that growers of irrigated, rain-fed
lowland, and rain-fed upland ecosystems have near to average access to education, in-
formation, and social capital (Fig. 5), which indicates that a particular production system
does not contribute to the development of the grower’s communal issues to a large degree.
However, growers who belong to the irrigated system were found to be one step ahead;
their educational level was comparatively a little higher; they had access to agricultural
information sources and were involved with organizations. All these factors contribute to
increase in social development. Consistent with other research findings (World Bank
2008), it was found a greater association between education and sustainable rice production
and development (Table 4). The grower’s level of education is a highly influential
Sustainability of rice production systems
123
indicator to promote this association. This phenomenon can be explained by the three
present conditions: most of the farmers are less educated, public-funded agricultural ex-
tension service is ineffective, and very little opportunities exist for non-formal education.
To approach farming sustainability transition, grower’s literacy level, training, and em-
powerment are fundamental to develop their knowledge, skill, attitude, and decision-
making in the adoption of rice farming innovation.
Like economical and environmental dimension, farmers of flood- and saline-prone areas
were in marginal conditions owing to their poor socioeconomic background, least access to
public services, and markets (Fig. 4). This country ranks sixth among the most vulnerable
country to flood in the world (GoB 2010). About 20 % of the country’s areas are expe-
riencing flooding in every year due to its topography and position. It has been seen that the
flooding becomes severe in almost an interval to 4–5 years. The floods brought a severe
impact of different sectors and overall development, for instance, ADB (2004b) estimated
that the total loss for the floods in 2004 was $2.2 billion or 3.9 % of GDP. The coastal
districts encounter cyclones and salinity besides flooding; as a corollary, managing natural
resources, cultivating rice (main crops in the coastal area), and livelihoods of coastal
people are highly vulnerable to the confluence of these factors.
Consistent with the report by the MoA (2010), land productivity was found a vital issue
for sustainable rice production. Bangladesh is a densely populated country with a growth
rate of 1.59 % (2013 est.) per annum and has no scope for agricultural land expansion.
Besides, agrarian land is shrinking primarily due to two reasons: (1) increasingly, agri-
cultural land is being used for non-agricultural purposes such as urbanization and (2) land
declines by riverbank erosion of major rivers, namely the Padma, Meghna, and Jamuna,
and a large area is under water due to sea-level rise in the Southern part. Therefore,
increasing land productivity is an urgent need for agricultural development and food
security.
Nutrient management is found to be a contributing indicator of the sustainability of rice
production. It is increasingly a growing concern that intensified use of agrochemicals has
caused adverse impacts (e.g., eutrophication) on the quality of water (Mateo-Sagasta and
Burke 2012). In Bangladesh, farmers use hazardous pesticides, such as Bashudin 10 G,
which have already been banned in other countries (Parveen and Nakagoshi 2001). ADB
(2004a) found agrochemicals (mainly mineral fertilizers) are the second vital sources of
water pollution in Bangladesh, followed by industrial effluents. In this condition, integrated
or combined nutrient management is essential to curb pollution, which increases farming
productivity, enhances the biological, physical, and hydrological properties of soil, and
promotes sustainable production.
The first objective of ‘National Agricultural policy 2013’ was ‘to develop and harness
improved technologies.’ Undoubtedly, embracing technological advancement in this sector
is significant to feed a growing population and achieve food security. However, the chosen
technologies should be environmentally sound and socially feasible. Resource-conserving
practices (e.g., crop rotations) and technologies (e.g., deep urea placement) have negligible
adverse effects on environmental goods and services and lead to raise in the input use
efficiency, enhance productivity, provide environmental benefits, and improve poor
farmer’s livelihood (Pretty et al. 2006). These practices and technologies have observed
significant associations with rice production sustainability and hence are influential in
fostering it.
Pretty (2009) stated that SA is a social learning process rather than a precise set of
technologies. Findings reveal that effective involvement with local organizations serves
several purposes for farming development: (1) it enhances social bonds and norms that
R. Roy et al.
123
reinforce social cohesion, mental landscape, mutualism, and confidence; (2) it creates an
avenue for knowledge, idea, and technology generations, as well as stimulates members for
sharing, comparing, prioritizing, and debating on innovation from the localized perspective
to determine its relative importance, feasibility, compatibility, and applicability; and (3) it
develops a channel for linkage, cooperation, and collaboration with other stakeholders such
as NGO workers and civil societies.
A farm should be productive and profitable without the need for taking economic risk
to make it sustainable (Gafsi and Favreau 2010). Benefit–cost ratio is the financial term
that measures farming profitability, and in the present study, it was found to be a
contributing indicator to the sustainable rice production system (Table 4). Poverty is a
vital concern of farmers, and farming is a principal source of their income. It was
realized that due to lack of hard cash during the peak season, many growers could not
purchase quality seeds, adequate fertilizers, and irrigation, which hamper expected yield.
Adoption of innovation involves cost and risks, and grower’s financial conditions are
always a dominant determinant in the innovation decision process (Rogers 2003).
Therefore, non-farm income sources (i.e., pluriactivity) are an important impetus for
adopting various sustainable approaches of farming, namely crop diversification and
livestock integration into farming systems. The significances of non-agricultural income
sources are strongly reflected in the country’s Poverty Reduction Strategy Paper (Plan-
ning commission 2008) to accelerate growth and bring a pro-poor orientation in the
sustainable socioeconomic growth process.
Irrigated rice was observed to be less self-sufficient with respect to inputs than rain-
fed lowland, and this finding is consistent with that of Altieri (2000) who pointed out
that the dependency on external inputs in sustainable production should be minimum.
Indicators such as information availability and accessibility and equity were not sig-
nificantly different from one system to another (Fig. 5). Similarly, the available sources
of information and user access ability are a cornerstone for development because poor
information has become the resource of poor in the world. In addition, from the survey,
it was found that sustainability is possible if it addresses the core part of equality.
Growers voiced their concerns about the issue of equality. However, most of them
expressed their financial inability.
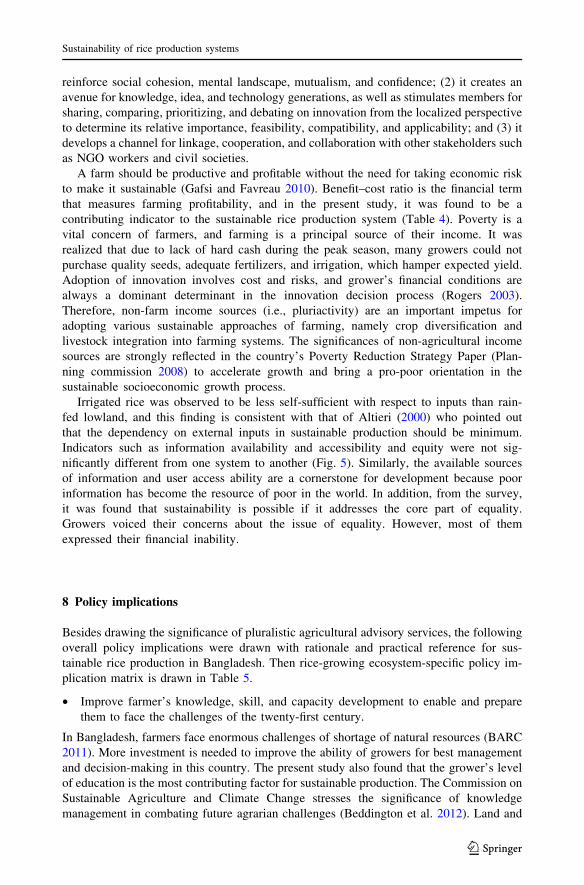
8 Policy implications
Besides drawing the significance of pluralistic agricultural advisory services, the following
overall policy implications were drawn with rationale and practical reference for sus-
tainable rice production in Bangladesh. Then rice-growing ecosystem-specific policy im-
plication matrix is drawn in Table 5.
• Improve farmer’s knowledge, skill, and capacity development to enable and prepare
them to face the challenges of the twenty-first century.
In Bangladesh, farmers face enormous challenges of shortage of natural resources (BARC
2011). More investment is needed to improve the ability of growers for best management
and decision-making in this country. The present study also found that the grower’s level
of education is the most contributing factor for sustainable production. The Commission on
Sustainable Agriculture and Climate Change stresses the significance of knowledge
management in combating future agrarian challenges (Beddington et al. 2012). Land and
Sustainability of rice production systems
123
water resource management-driven agricultural extension services and modern information
systems can play a central role in farmer’s capacity building.
• Increasing land productivity needs a multi-year planning and strategies.
In Bangladesh, land productivity is much lowered than other rice-cultivating countries,
with no scope for horizontal expansion of agricultural land. Hence, effective initiatives are
needed to increase productivity, such as increasing irrigation coverage, providing high-
quality hybrid seeds, improving irrigation efficiency, minimizing yield gaps, and devel-
oping flood and salinity resistance rice varieties. World Bank (2008) recognized that
increasing land productivity is one of the key strategies for improving the livelihoods of
subsistence farming communities.
• Establish and support a feasible integrated or combined nutrient management for
keeping the soil productive.
Nutrient management is a key issue for maintaining soil health. Most of the country’s soils
suffer from organic matter depletion (BARC 2011). Therefore, according to the findings of
the present study, policy should give importance to integrated and mixed nutrients man-
agement. Government should reduce subsidies on urea fertilizer and introduce economic
interventions on ideal form of balanced or mixed fertilizers, similar to that implemented in
Table 5 A policy implication matrix of sustainability of rice production systems
Ecosystems Policy areas
Economic Environmental Social
Irrigated Increasing non-farm incomes Promoting integrated nutrientmanagement
Diversifying crop production
Increasing growers’human capital
Promoting social capital
Rain-fedlowland
Improving local inputs(minimizing externalinputs cost)
Increasing land productivity
Disseminating resource-conserving practices andtechnologies
Promoting integrated nutrientmanagement
Increasing growers’human capital
Rain-fedupland
Increasing non-farm incomesIncreasing land productivity
Promoting integrated pest,disease, and weedsmanagement
Disseminating resource-conserving practices andtechnologies
Increasing informationavailability andaccessibility
Flood-prone
Increasing non-farm incomesIncreasing land productivity
Promoting integrated nutrientmanagement
Promoting social capitalIncreasing growers’
human capitalIncreasing information
availability andaccessibility
Saline-prone
Increasing land productivity Disseminating resource-conserving practices andtechnologies
Increasing growers’human capital
Increasing informationavailability andaccessibility
Improving farming equity
Ecosystem-specific policy implications are deduced following the same procedure (path analysis) of de-ducing the overall policy implications (see Table 4)
R. Roy et al.
123
West Bengal, India, where subsidies on a better mix of nutrients and cutting the old subsidy
provision on urea have already been adopted (Anand et al. 2010).
• Disseminate and utilize existing resource-conserving practices and technologies and
explore further environmental sustainability.
Achieving food security is a national mandate, and in the context of resource constraint,
intensification of sustainable farming would be a potential solution. Resource-conserving
practices and technologies not only increase production (NCB 2004), but also preserve and
enhance land, biodiversity, and water resources (Singh et al. 2011). Hence, policies should
pay attention to pervasive dissemination and utilization of resource-conserving practices
and technologies. In that situation, price support, financial incentive, or giving direct
subsidy to certain classes of farmers is a beneficial strategy. For instance, the Chinese
government provides incentive and subsidy to farmers to stimulate the technology choices
and adoption (IFAD 2010).
9 Conclusions
Sustainability evaluation is contested. However, an empirical evaluation is a better way to
examine the key component, drivers, and essential actions that accelerate sustainability
transition. Results of the study show 56 % of rice growers face several environmental,
social, and economic challenges of rice production, and these challenges will be reasonably
aggravated in the context of climate change. Presently, irrigated rice production is more
sustainable than rain-fed, flood-prone, and saline-prone rice ecosystems, and concerted
policy actions, as drawn above, can open more trajectories of sustainability of these
ecosystems. Thus, it can be concluded that (1) farmer’s knowledge, skills, and social
networks development are imperative for fostering sustainable rice production; (2) there is
still scopes for increasing land productivity; meticulous planning, strategies (e.g., nar-
rowing yield gaps), and investments are required; (3) government patronization is needed
for adopting site-specific, integrated, and mixed form of nutrient management that is key
for long-term productivity of land; and (4) proper adoption of existing resource-conserving
practices and technologies, and facilitating growers and local organizations to involve
‘agricultural innovation system’ are equally important.
Overall, demand-led, effective and efficient agricultural advisory services can play a
leading role in resolving the multitude of challenges of rice growers. This study is based on
a set of indicators, which were developed by employing participatory approaches. The
exclusion of indicators related to particular environmental issue such as salinity and
flooding is a limitation of this study, since indicators that represent five rice-growing
ecosystems were chosen. The determination of an essential set of indicators of climate-
smart farming and sustainability evaluation in the context of sustainable development and
poverty alleviation is a potential area for future research.
Acknowledgments We would like to extend our sincere gratitude to the respondents who spared us theirvaluable time. The authors are grateful to Universiti Sains Malaysia, Penang for the funding (Grant No.1001/PHUMANITI/346038) to perform this research. We are also grateful to the anonymous reviewers fortheir comments to improve the quality of the manuscript.
Sustainability of rice production systems
123
References
ActionAid. (2011). On the brink: Who’s best prepared for a climate and hunger crisis?. South Africa:Johannesburg.
ADB. (2004a). Country environmental analysis Bangladesh, 3rd draft. Dhaka: ADB.ADB. (2004b). http://www.adb.org/Documents/News/BRM/brm-200417.asp. Accessed May 2011.Agriculture Census. (1996). Bureau of statistics. Dhaka: Statistics Division, Ministry of planning,
Government of Bangladesh (GoB).Alauddin, M., & Quiggin, J. (2008). Agricultural intensification, irrigation and the environment in South
Asia: Issues and policy options. Ecological Economics, 65, 111–124.Altieri, M. A. (2000). Developing sustainable agricultural systems for small farmers in Latin America.
Natural Resources Forum, 24, 97–105.Anand, S. P., Segal, J. E., & Stiglitz, V. (2010). Debates on the measurement of global poverty. Oxford:
Oxford University Press.Baffes, J., & Gautam, M. (2001). Assessing the sustainability of rice production growth in Bangladesh. Food
Policy, 26, 515–542.Bangladesh Agricultural Research Council (BARC). (2011). Agricultural research vision 2030 and beyond:
Research priorities in Bangladesh agriculture, final draft. In G. Hussain, & A. Iqbal (Eds.), Dhaka:Government of Bangladesh (GoB).
Bangladesh Bureau of Statistics (BBS). (2011). Statistical yearbook of Bangladesh. Dhaka: BBS Division,Ministry of planning (MoP), GoB.
Basak, J. K. (2010). Effects of increasing temperature and population growth on rice production in Ban-gladesh: Implications for food security. Dhaka: Unnayan Onneshan-The Innovators.
BBS. (2013). Statistical yearbook of Bangladesh. Dhaka: BBS Division, MoP, GoB.Beddington, J., Asaduzzaman, M., et al. (2012). Achieving food security in the face of climate change: Final
report from the commission on sustainable agriculture and climate change. Copenhagen: CGIARResearch Program on CCAFS.
Bell, S., & Morse, S. (2008). Sustainability indicators. Measuring the incommensurable?. London:Earthscan.
Bhuiyan, S. I., Abedin, M. Z., Singh, V. P., & Hardy, B. (Eds). (2004). Rice research and development in theflood-prone ecosystem. In: Proceedings of the international workshop on flood-prone rice systems heldin Gazipur, Bangladesh, 9–11 January 2001. Los Banos: International Rice Research Institute.
Binder, C. R., Feola, G., & Steinberger, J. K. (2010). Considering the normative, systemic and proceduraldimensions in indicator-based sustainability assessments in agriculture. Environmental ImpactAssessment Review, 30, 71–81.
Bloor, M., Frankland, J., Thomas, M., & Robson, K. (2001). Focus groups in social research (1st ed.).London: SAGE Publications.
Bohringer, C., Patrick, E. P., & Jochem, P. E. P. (2007). Measuring the immeasurable: A survey ofsustainability indices. Ecological Economics, 63, 1–8.
Brammer, H. (2009). Mitigation of arsenic contamination in irrigated paddy soils in South and SoutheastAsia. Environment International, 35, 856–863.
Chowdhury, M. T. (2009). Sustainability of accelerated rice production in Bangladesh: Technological issuesand the environment. Bangladesh Journal of Agricultural Research, 34, 523–529.
Dahl, A. L. (2012). Achievements and gaps in indicators for sustainability. Ecological Indicators, 17, 14–19.Dantsis, T., Douma, C., et al. (2010). A methodological approach to assess and compare the sustainability
level of agricultural plant production systems. Ecological Indicators, 10, 256–263.DFID. (2003). Sustainable agriculture. Resource Management key sheet-10. DFID, UK.Dillman, D. A. (2006). Mail and internet surveys: The tailored design method (2nd ed.). New Jersey: Wiley.Dogliotti, S., Garcıa, M. C., Peluffo, S., Dieste, J. P., Pedemonte, A. J., Bacigalupe, G. F., et al. (2014). Co-
innovation of family farm systems: A systems approach to sustainable agriculture. Agricultural Sys-tems, 126, 76–86.
Esty, D. C., Levy, M., Srebotnjak, T., & de Sherbinin, A. (2005). Environmental Sustainability Index:Benchmarking national environmental stewardship. New Haven: Yale Center for Environmental Lawand Policy.
Field, A. (2009). Discovering statistics using SPSS (3rd ed.). London: SAGE Publications Ltd.Freebairn, D. M., & King, C. A. (2003). Reflections on collectively working toward sustainability: Indi-
cators for indicators! Australian Journal of Experimental Agriculture, 43, 223–238.Gafsi, M., & Favreau, J. L. (2010). Appropriate method to assess the sustainability of organic farming
systems. 9th European IFSA Symposium, 4–7 July 2010, Vienna, Austria.
R. Roy et al.
123
Gasparatos, A., & Scolobig, A. (2012). Choosing the most appropriate sustainability assessment tool.Ecological Economics, 80, 1–7.
GoB. (2010). Bangladesh: Strategic program for climate resilience. Prepared for the pilot program forclimate resilience. Dhaka: GoB.
Gomez-Limon, J. A., & Sanchez-Fernandez, G. (2010). Empirical evaluation of agricultural sustainabilityusing composite indicators. Ecological Economics, 69, 1062–1075.
Gowda, M. J. C., & Jayaramaiah, K. M. (1998). Comparative evaluation of rice production systems for theirsustainability. Agriculture, Ecosystems & Environment, 69, 1–9.
Hossain, M. (2009). The impact of shallow tubewells and boro rice on food security in Bangladesh. IFPRIDiscussion paper 00917, IFPRI.
Hossain, M. (2010). Global warming induced sea level rise on soil, land and crop production loss inBangladesh. In 19th world congress of soil science, 1–6 August, Brisbane, Australia, pp. 77–80.
International Fund for Agricultural Development (IFAD). (2010). Rural poverty report 2011, new realities,new challenges: New opportunities for tomorrow’s generation. Italy: IFAD.
IRRI (2013). http://irri.org/our-work/locations/bangladesh. Accessed July 2013.Islam, N., & Rahman, M. M. (2012). An assessment of crop diversification in Bangladesh: A spatial
analysis. Applied Economics Letters, 19, 29–33.Jahiruddin, M., & Satter, M. A. (2010). Agricultural research priority: Vision-2030 and beyond. Sub-sector:
Land and soil resource management. Final report, BARC, Dhaka.Kondyli, J. (2010). Measurement and evaluation of sustainable development a composite indicator for the
islands of the North Aegean region, Greece. Environmental Impact Assessment Review, 30, 347–356.Lee, N. (2006). Bridging the gap between theory and practice in integrated assessment. Environmental
Impact Assessment Review, 26, 57–78.Lin, H. X., Yanagihara, S., Zhuang, J. Y., Senboku, T., Zheng, K. L., & Yashima, S. (1998). Identification of
QTL for salt tolerance in rice via molecular markers. Chinese Journal of Rice Science, 12(2), 72–78.Linstone, H. A., & Turoff, M. (2002). The Delphi method: Techniques and applications. http://is.njit.edu/
pubs/delphibook/. Accessed December 2013.Mandal, M. A. S. (2006). A synthesis of agricultural policies in Bangladesh. Dhaka: Agriculture Sector
Review, MoA.Mateo-Sagasta, J., & Burke, J. (2012). Agriculture and water quality interactions: A global overview.
SOLAW Background Thematic Report—TR08. FAO, Italy.Millennium Ecosystem Assessment (MEA). (2005). Millennium ecosystem assessment ecosystems and
human well-being. Washington, DC: Island Press.Mirza, M. (2011). Climate change, flooding in South Asia and GoB implications. Regional Environmental
Change, 11, 95–107.MoA. (2006a). Actionable policy brief and resource implications (Vol. 1). Dhaka: MoA, GoB.MoA. (2006b). Transformation of agriculture for sustainable development and poverty alleviation in
Bangladesh: Actionable policies and programmes. Dhaka: GoB.MoA. (2010). National agricultural policy (final draft). Dhaka: MoA, GoB.Munda, G. (2007). Social multi-criteria evaluation. New York: Springer.Nardo, M., Saisana, M., Saltelli, A., & Tarantola, S. (2005). Tools for composite indicators building.
Institute for the Protection and Security of the Citizen Econometrics and Statistical Support to An-tifraud Unit, Italy.
Nicoletti, G., Scarpetta, S., & Boyland, O. (2000). Summary indicators of product market regulation withextension to employment protection legislation. Economic Department working paper no 226. ECO/WKP (99)18.
Nuffield Council on Bioethics (NCB). (2004). The use of genetically modified crops in developing countries.London: NCB.
OECD. (2008). Handbook on constructing composite indicators: Methodology and user guide. Paris:OECD.
Parveen, S., & Nakagoshi, N. (2001). An analysis of pesticide use for rice pest management in Bangladesh.Journal of International Development and Cooperation, 8, 107–126.
Pinter, L., Hardi, P., & Bartelmus, P. (2005). Sustainable development indicators: Proposals for a wayforward. New York: UN Division for Sustainable Development.
Pinter, L., Hardi, P., Martinuzzi, A., & Hall, J. (2011). Bellagio STAMP: Principles for sustainabilityassessment and measurement. Ecological Indicators, 17, 20–28.
Planning Commission (2008). Moving ahead: National strategy for accelerated poverty reduction II (FY2009 – 11). General Economics Division, Planning Commission. GoB.
Pretty, J. (2009). Can ecological agriculture feed nine billion people? Monthly Review, November.
Sustainability of rice production systems
123
Pretty, J., Noble, A., et al. (2006). Resource conserving agriculture increases yields in developing countries.Environmental Science and Technology, 40, 1114–1119.
Rahman, M. M. (2011). Country report: Bangladesh. ADBI-APO Workshop on Climate Change and itsImpact on Agriculture. Seoul, Republic of Korea, 13–16 December.
Rasul, G., & Thapa, G. B. (2004). Sustainability of ecological and conventional agricultural systems inBangladesh: An assessment based on environmental, economic and social perspectives. AgriculturalSystems, 79, 327–351.
Riley, J. (2001). The indicator explosion: Local needs and international challenges. Agriculture, Ecosystems& Environment, 87, 119–120.
Rogers, E. M. (2003). Diffusion of innovations (5th ed.). New York, NY: Free Press.Roy, R., & Chan, N. W. (2012). An assessment of agricultural sustainability indicators in Bangladesh:
Review and synthesis. Environmentalist, 32, 99–110.Roy, R., Chan, N. W., & Rainis, R. (2013a). Development of indicators for sustainable rice farming in
Bangladesh: A case study with participative multi-stakeholder involvement. World Applied ScienceJournal, 22, 672–682.
Roy, R., Chan, N. W., & Rainis, R. (2013b). Development of an empirical model of sustainable ricefarming: A case study from three rice-growing ecosystems in Bangladesh. American–Eurasian Journalof Agricultural and Environmental Sciences, 13, 449–460.
Roy, R., Chan, N. W., & Rainis, R. (2014). Rice farming sustainability assessment in Bangladesh. Sus-tainability Science, 9, 31–44.
Roy, R., Chan, N. W., Uemura, T., & Imura, H. (2013c). The vision of agri-environmental sustainability inBangladesh: How the policies, strategies and institutions delivered? Journal of Environmental Pro-tection, 4, 40–51.
Saisana, M. (2008). 2007 Composite learning index: Robustness issues and critical assessment. Italy: IPSC,Joint Research Centre.
Saisana, M. (2010). Tips and tricks. Constructing composite indicators: From theory to practice. IPSC, JointResearch Centre, Italy.
Saisana, M., Annoni, P., & Nardo, M. (2009). A robust model to measure governance in African countries.Italy: IPSC, Joint Research Centre.
Saisana, M., Tarantola, S., Schulze, N., Moese, W., & Puyenbroeck, T. V. (2005). State-of-the art report oncomposite indicators for the knowledge-based economy. Technical report, KEI, Knowledge EconomyIndicators project.
Sen, S. (2004). Cultivation of saline tolerant rice varieties in the coastal area to cope with salinity inProtapkathi, Paikgacha, Khulna, Bangladesh. Summary of the practice, Bangladesh Resource Centrefor Indigenous Knowledge, Dhaka.
Seraj, Z. I., Hossain, M. B., Rasul, N. M., Akhter, H., Khan, H., Hossain, S., Salam, M. A., & Gregorio, G.(2002). Agrobacterium-mediated transformation of Bangladesh indica for conferring salt tolerance. InR. Ahmad & K. A. Malik (Eds.). Prospects for saline agriculture. Kluwer Academic Publishers.
Shahid, S., & Behrawan, H. (2008). Drought risk assessment in the western part of Bangladesh. NaturalHazards, 46, 391–413.
Singh, R. K., Murty, H. R., Gupta, S. K., & Dikshit, A. K. (2007). Development of composite sustainabilityperformance index for steel industry. Ecological Indicators, 7, 565–588.
Singh, N. P., Singh, R. P., et al. (2011). Adoption of resource conservation technologies in Indo-GangeticPlains of India: Scouting for profitability and efficiency. Agricultural Economics Research Review, 24,15–24.
Valdivia, S., Ugaya, C. M. L., Hildenbrand, J., Traverso, M., Mazijn, B., & Sonnemann, G. (2013).A UNEP/SETAC approach towards a life cycle sustainability assessment - our contribution toRio ? 20. International Journal of Life Cycle Assessment, 18, 1673–1685.
Wassmann, R., Jagadish, S. V. K., Sumfleth, K., Pathak, H., Howell, G., Ismail, A., et al. (2009). Regionalvulnerability of climate change impacts on Asian rice production and scope for adaptation. Advances inAgronomy, 102, 91–133.
World Bank. (2008). World development report 2008: Agriculture for development. Washington: WorldBank.
Zhang, B. Z. (2000). Sustainable Agricultural Development in China. China: Shandong Press of Sciencesand Technology.
Zhou, P., Ang, B. W., & Poh, K. L. (2006). Comparing aggregating methods for constructing the compositeenvironmental index: An objective measure. Ecological Economics, 59, 305–311.
R. Roy et al.
123


