Embed Size (px)
Citation preview
George Perkins Marsh InstituteClark University • Worcester, MA 01610 • http://www.clarku.edu/departments/marsh
GPMI
GPMI Working Papers No. 2009-02April 2009
Sustainable Benchmarking of Food Supply ChainsNatalia YakovievaESRC Centre for Business Relationships, Accountability, Sustainability and Society Cardiff University; 55 Park Place; Cardiff, CF14 [email protected]+44 (0) 2920876562 tel+44 (0) 2920876061 fax
Joseph SarkisGraduate School of ManagementClark University; 950 Main Street; Worcester, MA [email protected]+01 508.793.7659 tel+01 508.793.8822 fax
Thomas W. SloanCollege of ManagementUniversity of Massachusetts Lowell Southwick Hall 201A; One University Avenue; Lowell, MA [email protected] +01 978.934.2857 tel+01 978.934.4034 fax
Sustainable Benchmarking of Food Supply Chains
Abstract
An organization’s long-term viability and competitiveness should not be evaluated solely in
terms of financial measures. Investors, policy makers, and other stakeholders increasingly seek
to evaluate performance with respect to sustainability — the environmental, social, and
economic performance of an organization. But measuring and improving the sustainability
performance of supply chains is challenging. We introduce a framework to help evaluate
sustainability performance of supply chains. We have collected sustainability data on food
supply chains within the United Kingdom. These data are then transformed into indicators. In
addition, as part of this benchmarking framework and to more accurately determine performance
of food supply chains, we have utilized food supply chain experts’ opinions about which factors
contribute the most to sustainability. Using the Analytic Hierarchy Process (AHP), these
opinions are translated into importance ratings. The indicators are weighted by these importance
ratings to generate an overall index of sustainability. Stakeholders can use the index to evaluate
supply chains, and supply chain members can use this approach to guide improvement efforts.
Strengths and opportunities, as well as limitations of the methodology are discussed, and
sensitivity analysis is performed.
Key words: Sustainability, Supply Chain Management, Performance Measurement, Analytic
Hierarchy Process, Food Supply Chain.
INTRODUCTION
Sustainability benchmarking is gaining importance within industry. Expanding the boundaries of
benchmarking for sustainability beyond the organization and across the supply chain is a
necessity, as stakeholders demand that organizations consider the broadened lifecycle influences
of products and processes. The process for internal organizational performance evaluation, which
includes internal sustainability benchmarking, has made some relatively well-established
headway. Yet the methodologies and frameworks for effective supply chain and sustainable
supply chain performance evaluation and benchmarking are not well advanced in the literature
(Hervani et al. 2005). To help address this gap we provide a framework and approach to help
organizations and policy makers benchmark the sustainability performance of a supply chain. In
this case we focus on a critical supply chain, the food supply chain (Marsden et al. 1999).
The concept of sustainability has become increasingly important in supply chain
management as companies respond to external pressure from policy makers and consumers as
well an internal pressure from their leaders’ values and sense of responsibility (Seuring and
Müeller 2008). In terms of practice, there is a significant and growing need to measure and
benchmark the overall sustainability of entire supply chains rather than single processes or firms.
Despite this increased interest and various efforts to measure sustainability within organizations
and across the supply chain, no method has yet emerged which can effectively incorporate three
dimensions of sustainability and measure and benchmark sustainability across all stages in the
supply chain. The absence of such a method has implications for practice. Specifically, how can
managers determine if their efforts to improve sustainability are effective — or even moving
things in the right direction? The lack of a measure also has implications for theory and research
development: how can researchers test hypotheses about the mechanisms of sustainability
WP 2009-02 2
without a method to measure it? This paper fills this void by developing a method to evaluate
and benchmark sustainability across the supply chain, and demonstrating how the method is used
by applying it to data from two food supply chains (chicken and potatoes) and utilising various
expert opinions.
This paper aims to make three contributions. First, the paper contributes to supply chain
theory by building towards a mechanism to test hypotheses regarding sustainability. Second, the
paper makes a strong empirical contribution by applying the proposed methodology to data from
actual food supply chains. This process also produces an implicit sustainability framework
(Kinra and Kotzab 2008), which can be compared to others (e.g., Carter and Rogers 2008).
Finally, the paper makes a contribution to supply chain management practice by developing and
demonstrating a method to measure sustainability. Such a measure is useful for managers, policy
makers, and citizens to assess the overall sustainability of a chain as well as the contributions of
individual links.
The paper starts with the review of literature on sustainability and supply chain
management; then it moves on to review of sustainability benchmarking and its application for
the supply chain. We explain our methodology for benchmarking sustainability in the supply
chain through detailed exposition of sustainability indicators development and scoring for the
food supply chain. The proposed framework is evaluated using 2002 statistical data for potato
and chicken supply chains in the United Kingdom (U.K.). Further we introduce weighting
schemes using the Analytic Hierarchy Process (AHP) and describe the results of a sensitivity
analysis. Finally, the discussion and conclusions section outlines the implications of the proposed
sustainability benchmarking framework.
WP 2009-02 3
SUSTAINABILITY AND SUPPLY CHAIN MANAGEMENT
Companies are experiencing growing pressure from various stakeholders such as governmental
agencies, communities, workers, advocacy groups and non-governmental organisations and some
customer segments to deal with social and environmental issues related to their supply chains
(Vachon and Klassen 2006; Welford and Frost 2006). Stakeholders demand corporate
responsibility to go beyond product quality and extend to areas of labour standards, health and
safety, environmental sustainability, non-financial accounting and reporting, procurement,
supplier relations, product lifecycles and environmental practices (Bakker and Nijhof 2002;
Waddock and Bodwell 2004; Teuscher et al. 2006). Companies are increasingly expected to
deliver with a focus on the triple bottom line, a simultaneous balance of economic,
environmental and social goals, which will positively affect the natural environment, society and
also result in long-term economic benefits and competitive advantage (Elkington 1997; Carter
and Rogers 2008).
Sustainable supply chain management expands the concept of sustainability from a
company to the supply chain level (Carter and Rogers 2008). Following Fritz and Schiefer
(2008), sustainable supply chain management should provide companies with tools for
improving their own and the sector’s competitiveness, sustainability and responsibility towards
stakeholder expectations. Sustainable supply chain management, however, presents greater
challenges for integration of actors along the supply chain to address impacts of production and
consumption within the wider sets of performance objectives that incorporate economic, social
and environmental dimensions of sustainability (Teuscher et al. 2006; Linton et al. 2007; Carter
and Rogers 2008; Seuring and Müller 2008).
WP 2009-02 4
Principles of accountability, transparency and stakeholder engagement are highly relevant
to sustainable supply chain management (Waddock and Bodwell 2004; Teuscher et al. 2006;
Carter and Rogers 2008). In response to stakeholder pressures for transparency and
accountability companies need to measure, benchmark, and report sustainability performance of
their supply chains, whilst policy makers need to measure the performance of sectors within the
supply chain context for effective target setting and decision-making. So far, environmental
dimensions have been successfully integrated in the supply chain management as green supply
chain management that covers areas such as green design, green operations, lifecycle assessment
and reverse logistics (Srivastava 2007).
Often it is the focal companies of supply chains, such as retailers and brand
manufacturers, that are held responsible, under growing stakeholder pressure, for environmental
and social performance of their suppliers and products and forced to restructure supply chain
performance in relation to sustainability concerns (Hughes 2001; Welford and Frost 2006;
Seuring and Müller 2008). If focal companies are to demonstrate accountability for sustainability
implications of their operations, then there is a need for companies to engage in measuring and
benchmarking sustainability performance of their supply chains. Stakeholder concerns should
influence performance measures (Manning et al. 2008), and it is the next step for companies to
expand the boundaries of benchmarking for sustainability to outside the organization across the
supply chain.
Apart from the lack of methodologies, there is also a significant gap in theoretical
development with respect to measuring and benchmarking sustainability (Hervani et al. 2005).
For example, stakeholder theory challenges the traditional concept of a firm’s responsibilities by
arguing that parties outside the firm and its shareholders — such as trade unions, communities,
WP 2009-02 5
and governmental bodies — should have their needs and wishes taken into consideration by the
firm (Freeman 1984). This theory, which has gained wide acceptance among researchers and
practitioners, has been discussed and extended in various ways (Donaldson and Preston 1995;
Mitchell et al. 1997; Friedman and Miles 2002), including the expansion of its scope beyond
single firms to supply chains (Post et al. 2002) and the examination of connection between
stakeholder relations and financial performance (Ruf et al. 2001, Scholtens and Zhou 2008).
Complexities of sustainability theory (Carter and Rogers 2008) argue that consideration
of sustainability factors can more effectively and transparently provide insights into supply chain
management and operations. As a result, it becomes more important to address supply chain
management design and benchmarking from a sustainability perspective. Stakeholder theory and
institutional theory helps to further evaluate sustainability and its implementation within the
supply chain (Zhu and Sarkis 2007). To test this type of relationship, one requires a measure of
sustainability. This observation is not unique to stakeholder theory. Carter and Rogers (2008)
develop a number of propositions about sustainable supply chain management, which are based
on a variety of theories such as population ecology and a resource-based view of the firm. The
question still remains about how does one evaluate changes in supply chain sustainability
without a way to measure it?
Evaluating overall supply chain performance requires that multiple sustainability
dimensions — economic, environmental and social factors — be included. The problem of
structuring these dimensions within a benchmarking perspective remains of great interest to both
practitioners and researchers as we still lack a unifying theory or literature stream which deals
exclusively with the issue of stakeholder involvement and balancing the triple bottom line
(sustainability) dimensions of supply chains (Hervani et al. 2005).
WP 2009-02 6
Thus, we seek to apply a triple bottom line approach to a benchmarking exercise for an
integrated food supply chain and propose a methodology to measure and benchmark
sustainability within the supply chain taking into account the opinion of experts. In addition we
provide practitioners with a useable and practical technique to help evaluate their own supply
chains.
The Food Supply Chain
Production and distribution of food could be viewed as a supply chain (Barrett et al. 1999;
Marsden et al. 1999), which is a system of stages that represent a sequence of economic
activities, through which resources, materials and information flow downstream and upstream
for production of goods and services for ultimate consumption by a consumer (Stevens 1989).
The food supply chain is also seen as a network of organisations that do not necessarily map
directly on to economic stages of the food supply chain as they often integrate several stages in
the food supply chain (Fine et al. 1996). This paper adopts a definition of the food supply chain
that comprises the following stages: agricultural production, food processing, food wholesaling,
food retailing and food catering, following the approach used by the United Kingdom
Department of Environment, Food and Rural Affairs (DEFRA 2006).
The food supply chain has significant implications for sustainability such as the
fulfilment of human needs, provision of employment and economic growth, and impacts on the
natural environment. Growing environmental, social and ethical concerns and increased
awareness of effects of food production and consumption on the natural environment and
developing world have led to increased pressure from consumer organisations, environmental
advocacy groups, policy makers and other stakeholders on food companies and food retailers to
assess and improve environmental and social performance within product lifecycles from ‘farm
WP 2009-02 7
to folk’ (Courville 2003; Weatherell et al. 2003; Ilbery and Maye 2005; Maloni and Brown,
2006; Matos and Hall 2007).
The food supply chain is pervasive and is one of the most globalized supply chains. In the
food supply chain, sustainability is clearly seen in terms of the wider production and
consumption system that has broad implications for the economy, health, development,
communities and the environment (Marsden et al. 1999; Hinrichs and Lyson 2008; Roth et al.
2008). Food supply chains are now making various claims on their sustainability with alternate
supply chain models being introduced that promote specific agricultural/craft products or
individual places/regions through product marketing, labeling and accreditation schemes (Ilbery
and Maye 2007; Holt and Watson 2008). For these labeling schemes to work, for organizations
to manage their food supply chains more sustainably, and for consumers to build trust in these
supply chains, tools to help in controlling and auditing food and agricultural supply chains are
needed. For these sustainable management reasons, benchmarking and managing the food supply
chain will be a critical necessity for government, organizations, and communities.
BENCHMARKING AND SUSTAINABILITY
Benchmarking is an evaluation process for organizational products, services, and processes in
relation to best practice (Camp 1995; McNair and Leibfried 1995). The term is often associated
with efforts by individual firms to identify and imitate best practices within their own industry.
Benchmarking is frequently cited as an important tool in continuous improvement of
organisational performance, total quality management programs and in gaining competitive
advantage (McNair and Leibfried 1995; Simatupang and Sridharan, 2004; Manning et al. 2008).
Benchmarking has gained considerable popularity in industry (Camp 1995; Zairi and Youssef
WP 2009-02 8
1995a; Wever et al. 2007) and has been well reviewed in practitioner-oriented literature (Zairi
and Youssef 1995b, 1996; Sarkis 2001a). Based on the types of benchmarking provided by
Ahmed and Rafiq (1998), for the purposes of this paper, we refer to benchmarking as the process
of defining operational measures of performance and appraising firms (supply chains) with
respect to these measures.
Tools for Competitive Analysis: Effective benchmarking relies heavily on data analysis. Dozens
of tools for benchmarking have been recommended and include flowcharts, cause-and-effect
diagrams, radar/spider charts, and Z charts (Camp 1995), the European Foundation for Quality
Management (EFQM) business excellence model, the balanced scorecard, service quality
(SERVQUAL) framework, gap analysis, AHP, scatter diagrams (Ahmed and Rafiq 1998),
computational geometry (Talluri and Sarkis 2001), data envelopment analysis (DEA) (Zhu
2002), and the Operational Competitiveness Ratings Analysis (OCRA) (Oral 1993; Parkan 1994;
Jayanthi et al. 1999). All of these techniques have their advantages and disadvantages. The
feature that makes them very similar is that they are all data driven. One of the characteristics
that makes AHP unique among these tools is that it can consider multiple attributes and factors
and that the data can be both qualitative and quantitative. We will utilize AHP in this study,
because these characteristics are evident in sustainability benchmarking.
Benchmarking typically focuses on a single link — or even a single process within a link
— rather than on the entire supply chain and there are challenges in measuring overall supply
chain performance. Gunasekaran et al. (2001) develop a framework for measuring the strategic,
tactical, and operational performance of a supply chain. They identify and discuss a variety of
financial and non-financial metrics that firms can use to evaluate different dimensions of
performance. Gunasekaran et al. (2004) build on this work by surveying U.K. firms on their
WP 2009-02 9
practices and perceptions about supply chain management performance. In short, the survey
indicates that managers care a great deal about performance measurement and believe that such
efforts pay dividends; however, the use of and beliefs about the importance of specific metrics
varies considerably. Some have recommended benchmarking supply chains using DEA and the
Supply Chain Operations Reference (SCOR) model (Reiner and Hofmann 2006). AHP has also
been recommended as a technique for benchmarking supply chains (Min and Galle 1996). The
extension of any tools to sustainability and supply chain benchmarking has yet to occur.
Sustainability Benchmarking
In addition to the evaluation of financial, inventory, and responsiveness performance, some
effort has been devoted to assessing the sustainability of supply chains and their subsystems.
Even though some early efforts of incorporating the three dimensions of sustainability
(economic, social and environmental) into supply chain analysis have occurred (New 1997;
Kärnä and Heiskanen 1998; Sarkis 2001b), frameworks for analysis of sustainability parameters
in a supply chain usually cover economic and environmental dimensions and to a much lesser
extent embrace all three dimensions of sustainability (Seuring and Müller 2008).
By examining the kinds of sustainability indicators currently being reported voluntarily
by the pharmaceutical industry, Veleva et al. (2003) demonstrate that firms use measures with
environmental and local (plant level) performance foci. There is a significant need to increase
awareness of and measures of supply-chain level performance.
Corporate environmental management systems (EMS) can be used as a tool for internal
benchmarking of environmental performance (Matthews 2003), however, EMS frameworks such
as ISO 14001 may need adjustment to enable effective benchmarking, and extending it beyond
the internal operations of an organization. Economic input-output life-cycle analysis (EIO-LCA)
WP 2009-02 10
to perform high-level benchmarking also shows promise (Matthews and Lave 2003). EIO-LCA
uses economic industry averages to estimate the impact with respect to energy usage, greenhouse
gases, toxic releases, etc. The data presented in our study fits within this broader economic data
development.
We propose to use data for general industrial level analysis (e.g., potatoes or flowers or
other general agricultural products) rather than for specific organizational product level (e.g.,
Schvaneveldt 2003). Although strategic information for product and process design practices can
be gleaned from product-level benchmarking for improved environmental performance (Boks
and Stevels 2003; Wever et al. 2007), we use a higher-level perspective for our analysis for
increased cooperation within the industry toward sustainability improvement.
In relation to the food supply chain, large supermarket retailers and branded food
manufacturers are often seen as focal companies within the food supply chain (Marsden et al.
1998; Hughes 2001). And it seems most appropriate for supermarkets and food manufacturers to
measure and report on sustainability performance of their supply chains and also for policy
makers to measure the performance of supply chains in relation to policy goals for reduction in
pollution, improvement of labour standards and achieving economic growth. It is not surprising
that the food sector was amongst the first to look into aspects of sustainability within the supply
chain. Indeed, Fritz and Schiefer (2008, p. 443) emphasize that “comparative benchmarking
studies within the food sector as well as across sectors are required to understand the complex
interdependencies between chain organization alternatives and their performance in economic
and noneconomic … aspects”.
Although sustainability assessments have traditionally focused on agriculture (McNeeley
and Scherr 2003; Filson 2004), recently researchers and policy makers have made attempts to
WP 2009-02 11
develop more holistic approaches by incorporating stages of food processing, food retailing and
specifically transportation in the assessment frameworks of food supply chains (Heller and
Keoleian 2003; Green and Foster, 2005). Various approaches have been developed to measure
sustainability of the food supply chains that identify effects at regional, industrial, and firm
levels. Some specific sustainability assessment frameworks developed for the food sector
include: lifecycle approach to sustainability impacts (Heller and Keoleian 2003); farm economic
costing (Pretty et al. 2005); food miles (Garnett 2003); energy accounting in product lifecycle
(Carlsson-Kanayama et al. 2003); ecological footprint (Gerbens-Leenes et al. 2002; Collins and
Fairchild 2007); mass balance of food sectors (Linstead and Ekins 2001; Biffaward 2005); and
farm sustainability indicators (OECD 2001). In the United Kingdom, public bodies produced
several sustainability measures and guidelines for the food supply chain (MAFF 1999; MAFF
2000; DEFRA 2002a; DEFRA 2002b; DEFRA 2005; DEFRA 2006), and the private sector has
also made attempts to measure its sustainability impacts (FDF 2002; J. Sainsbury Plc 2005;
Marks and Spencer 2005; Tesco 2005; Unilever 2005).
In summary, there has been an emergent set of investigations related to benchmarking
and performance measurement. Most of this research, however, is oriented toward improvement
of individual firms or processes rather than toward analysis of entire supply chains. Some efforts
have been made to measure supply chain performance, but the focus has primarily been on
efficiency and other economic-related performance. There have also been attempts to measure
sustainability; however, most of these efforts focus on firm- or product-level performance.
Furthermore, there is a strong emphasis on environmental performance. Thus, there is a
significant need to measure sustainability across the supply chain. Advancing these
measurements incorporating stakeholder aspects and additional sustainability dimensions is rare
WP 2009-02 12
or does not exist. Incorporating stakeholder and sustainability theoretic perspectives in
sustainable supply chain benchmarking activities encourages normative development and
advances theory development. In the next section, we describe a methodology to do complete
sustainability benchmarking in the context of a food supply chain.
A METHODOLOGY FOR BENCHMARKING SUSTAINABILITY
We propose a sustainability benchmarking methodological framework consisting of five major
stages:
1. Identifying sustainability indicators.
2. Raw data gathering.
3. Data transformation using performance rescaling.
4. Data gathering and adjustment using AHP.
5. Sensitivity analysis of results.
The first three stages will be briefly introduced in this section. The fourth stage will be covered
in detail in the next section. The final stage will be introduced after the AHP stage (stage 4) case
study example is presented.
Development of sustainability indicators
The first stage of the framework is determination of the sustainability indicators in order to set
the stage for benchmarking the food supply chain sustainability. For this paper, stages of the
food supply chain include agriculture (farming), food processing, food wholesale, food retail and
food catering. Our framework assesses the effects of the food supply chain on the three
dimensions of sustainability: economic, social and environmental. Firstly, objectives of
sustainable development applicable to the industry level and specifically for the food sector have
WP 2009-02 13
been selected from the objectives of sustainable development outlined for the industry by
UNCSD (1998) and those stated in Agenda 21 (UN 1992). Overall, the following important
objectives of sustainable development have been considered for the assessment: 1) within the
economic dimension: promotion of economic growth, encouragement of open and competitive
economy, and changing consumption patterns; 2) within the social dimension: creation of
productive employment, achieving equality; 3) within the environmental dimension: reduction of
resource use and protection of natural environment. Then, appropriate criteria for measuring the
progress towards an objective were selected and followed by the choice of a final indicator. An
attempt was made to select indicators that apply to all stages in the food supply chain in order to
be able to compare the sustainability performance between the stages. The indicators in this
study are purposefully fairly generic, which enables comparison between the stages and between
different food products.
For example, the sequence for selection of an indicator within the economic dimension
could be demonstrated as follows. Promotion of economic growth is an important objective of
sustainable development within the economic dimension. Within industry, it could be measured
by productivity. A specific indicator is selected to measure productivity, such as Gross Value
Added per workforce, data for which is ready available with statistical services. Potential users
of this framework may choose industry specific sustainability objectives and indicators that are
crucial for demonstrating progress towards sustainable development.
Initially, more than 50 indicators were drawn for five stages of the supply chain
(Yakovleva and Flynn 2004); however, due to data limitations and to help exemplify the
methodology proposed in this paper, a final set of nine indicators is selected for the framework,
three per dimension. Thus, we have a total of 45 indicators (nine sustainability indicators for
WP 2009-02 14
each of the five stages) for the framework, which are reported in Table 1. Data collection for the
sustainability indicators involved statistical data, data from trade associations and various market
data.
------------------------------------------------------------------------ Insert Table 1 Approximately Here
------------------------------------------------------------------------
The framework in this study will use data from potato and chicken food supply chains in
the U.K. Chickens and potatoes represent different production processes within the food supply
chain (chicken is the most popular meat category, and potato is the most popular vegetable).
Both products are important in relation to their domestic production and consumption in the U.K.
Chicken and potatoes penetrate various stages of the food supply chain and are important for
both fresh and processed food markets. These products are truly global products, produced,
traded and consumed in many countries around the world. The data for these supply chains were
collected for 2002 (see Table 2).
------------------------------------------------------------------------ Insert Table 2 Approximately Here
------------------------------------------------------------------------
Data Gathering: Since we are focusing on U.K. food supply chains, statistical information is
collected from two different organisations within the British Government: Department for
Environment, Food and Rural Affairs (DEFRA) collects information on the agricultural sector,
while the Office for National Statistics (ONS) collects information on the production industries
including the food sector.
Data Transformation using Performance Rescaling and Normalization: In order to analyse
and compare the data for various stages in the supply chain and between two products, the
indicators are normalized. U.K. economy average or food supply chain average values are used
WP 2009-02 15
as a benchmark for the development of normalized scores. Indicators are allocated scores on a
scale of 1 to 6. The 0 score stands for no available information, a score of 1 reflects a low benefit
to sustainability and a score of 6 a high level of sustainability benefit (the ranges could be
adjusted depending on what level of granularity is sought for comparison purposes; six levels
and a non-reporting/value level were seen as appropriate for discrimination in performance). The
scale for each indicator was developed based on general notions of maximum and minimum
desirable sustainability benefit or value and unacceptable or undesirable sustainability values.
Then there was a linear interpolation on the six levels based on maximum and minimum scores.
This is one example of linear normalization, additional assumptions or characterizations (e.g.
non-linearity along scales or expert evaluation of minimum and maximum scores) could be used.
The indicator scores are defined in Table 3. It must be noted that three indicators were chosen for
each dimension of sustainability (economic, social and environmental) in the final scoring
system (see Yakovleva 2007). The actual scores for each supply chain stage and food type are
reported in Table 4.
------------------------------------------------------------------------ Insert Table 3 Approximately Here
------------------------------------------------------------------------
------------------------------------------------------------------------ Insert Table 4 Approximately Here
------------------------------------------------------------------------
Adjusting the Benchmarked Scores Using AHP
This is the fourth and most intricate stage of our methodological framework and will have its
own section.
WP 2009-02 16
The values in Table 4 represent an adjusted score based on ranges as defined in Table 3.
But, this rough estimate may not be adequate since it does not take into consideration the relative
importance of each of these factors with respect to each other. To further this methodology we
introduce a weighting scheme based on expert opinion to more accurately represent the
performance of these actual supply chains. We complete this portion of the methodology by
introducing a multi-attribute rating scheme, AHP.
Saaty (1980) first introduced AHP for decision structuring and decision analysis. AHP
allows for a set of complex issues, factors and relationships, which have an impact on an overall
objective, to be compared with the importance of each issue relative to its impact on the solution
of the problem. Other approaches that can define the factor utilities and how well each of the
alternatives may rank on the various factors may also be used, but AHP is a robust and easy-to-
implement approach.
AHP utilizes a decision-making framework that assumes a unidirectional hierarchical
relationship among decision levels. Thus, the first major step in the AHP process is to define the
decision hierarchy. The top element of the hierarchy (objective) is the overall goal for the
decision model. The hierarchy decomposes to a more specific attribute until a level of
manageable decision criteria is met. The hierarchy is a type of system where one group of
entities influences another set of entities. The decision hierarchy may have had additional levels
and clusters, as well as added complexities of feedback mechanisms, but at this point, for the
sake of parsimony, those additional levels and variations in the relationships are not included.
The second major step in the AHP process is to elicit the preferences through pairwise
comparisons of the various factors. This step is completed by asking a series of questions that
compare the relative importance or influence of one factor (technique) when compared to
WP 2009-02 17
another factor (technique) on a “controlling” factor. Saaty (1980) suggests that the comparisons
of the factors be made in the range 1/9 to 9. A 9 indicates that one factor is extremely more
important than the other, a 1/9 indicates that one factor is extremely less important than the other,
and a 1 indicates equal importance. Also, if the importance of one factor with respect to a second
is given, then the importance of the second factor with respect to the first is the reciprocal. These
pairwise comparisons are summarized in a matrix, and one matrix is used for each controlling
variable. One pairwise comparison matrix will be formed for the comparisons of the categories
on each of the factors.
The third step in the AHP process is to complete the evaluations of the factors and
alternatives relative importance weights by determining a local priority vector is computed as the
unique solution to:
(1)
where λmax is the largest eigenvalue of A, the pairwise comparison matrix of the factors under
consideration. Saaty (1980) provides several algorithms for approximating w, the final relative
importance weights of the factors. We used Web HIPRE3+ (Mustajoki and Hämäläinen 1999),
an Internet, interactive software decision support tool available for decision analysis
(http://www.hipre.hut.fi/), to compute the eigenvalues and relative importance weights for our
study.
The final stage in the overall benchmarking methodology is the sensitivity analysis and
will be described fully at the end of the case example.
WP 2009-02 18
CASE STUDY: APPLYING THE METHODOLOGY TO THE FOOD SUPPLY CHAIN We now apply the AHP process described above to the food supply chain. The first step is to
define the hierarchy, illustrated for this study in Figure 1. The ultimate objective is to measure
supply chain sustainability, which is often defined in terms of the “triple bottom line” of planet,
people, and profit (Elkington 1997). The top level of our hierarchy consists of these three
corresponding dimensions: environmental, social, and economic dimensions. These are only
exemplary dimensions, other dimensions may be used to define sustainability; however, these
three are generally accepted as the primary factors. The hierarchy is further decomposed into
various sub-elements. The food supply chain itself, represented by five distinct stages, is the next
level. The stages include agriculture, processing, wholesale, retail, and catering. Again, one
could argue that there should be more stages or fewer stages. We feel that a five-stage model
captures the essence of the supply chain, including an appropriate level of detail. The third and
final level of the hierarchy is made up of the specific measures used to evaluate the sustainability
of the supply chain stages. These measures are the indicators summarized in Table 3, which
include labour productivity, number of employees, cost of waste disposal, and so on.
------------------------------------------------------------------------ Insert Figure 1 Approximately Here
------------------------------------------------------------------------
For this study, we chose to survey a small group of food supply chain experts to determine
relative importance weights. Several experts, who specialize in one type of food product
(chicken or potato) or have general food supply chain knowledge at a national level and have
significant work experience (13 or more years) at a specific supply chain level (agricultural
production, food manufacturing, food wholesale, food retail and industry association) have been
approached to participate in the study by filling in the questionnaire. All the experts were
WP 2009-02 19
previously interviewed on the subject of sustainability in the food supply chain. Out of eighteen
experts approached for the study, five responded by filling in the questionnaire; for this study we
selected four fully completed questionnaire responses from the actual respondents. Experts
whose responses were used for the AHP development include: a) a potato expert who is a senior
manager at a national industry association with marketing expertise and 30 years work
experience in food retailing; b) a chicken expert who is a senior manager within a national
industry association with expertise in food safety and food technology and 13 years work
experience in the food industry; c) retail expert 1 is a senior manager at a large supermarket
chain with expertise in product development and quality assurance and 15 years work experience
in food retail; d) retail expert 2 is a senior manager at a large supermarket chain with expertise on
technical development with 17 years work experience in the food industry.
As part of this weight elicitation process, a questionnaire was developed. The initial
portions of the questionnaire provided some definitions of the factors to be evaluated. These
definitions are important to help respondents be more consistent in their evaluations. An excerpt
from the full questionnaire is shown in Appendix A. All of the questions in the questionnaire are
formulated as pairwise comparisons and are used to construct the pairwise comparison matrices.
For this hierarchy we needed responses to 88 pairwise comparison questions. Respondents were
asked to make a series of pairwise comparisons for each level of the hierarchy discussed above.
For example, with respect to the top level, the following three questions were posed:
• How significant are environmental factors when compared to economic factors? • How significant are environmental factors when compared to social factors?
• How significant are social factors when compared to economic factors?
WP 2009-02 20
The responses were represented on a 1–9 Likert-type scale with a “1” response
representing the 1/9 value, meaning extremely less important, and a “9” response meaning
extremely more important. Table 5 reports the importance ratings derived from the responses of a
potato supply chain expert. The numbers listed in boxes reflect the responses to the three
groupings of questions above. The diagonal elements of the matrix are 1’s, by definition, since
they represent the comparison of an item with itself. As discussed above, once the importance of
one factor with respect to a second is given, then the importance of the second factor with respect
to the first is the reciprocal. This process is how the remaining elements of the matrix are
derived. In this way, the three questions completely characterize the nine pairwise comparisons
of the environmental, social, and economic factors. Using these numbers as inputs, AHP
determines the relative importance scores of each of the factors. These importance rating scores,
reported in the last column of Table 5, represent the relative weight that this expert places on
each top-level dimension (note that the values sum to 1). These results show that this expert felt
the environmental issues were of less significance than both social and economic issues in the
potato supply chain.
------------------------------------------------------------------------ Insert Table 5 Approximately Here
------------------------------------------------------------------------
Similarly, Table 6 reports the results of the pairwise comparisons based on the responses
of a chicken supply chain expert. As expected, different responses to the survey questions yield
different importance ratings. It is interesting to note, however, that although the ratings are
different, the rank orderings correlate perfectly, i.e., environmental has the lowest weight and
economic has the highest weight for both experts.
WP 2009-02 21
------------------------------------------------------------------------ Insert Table 6 Approximately Here
------------------------------------------------------------------------
This process of eliciting responses is repeated for each level of the hierarchy, comparing
each stage of the supply chain with respect to each dimension of sustainability and then
comparing each indicator (such as labour productivity) with respect to each stage of the supply
chain. A similar process was used to obtain ratings from the retail experts for each level of the
hierarchy (to conserve space, the ratings are not reported here).
Once the responses to all of the questions have been elicited, AHP is used to compute the
relative adjustment ratings. The final output is a set of importance ratings for each expert for all
of the indicators at the bottom of the hierarchy illustrated in Figure 1. The final AHP output for
one potato expert is displayed in Table 7. The relative importance weighting from Table 6 for the
potato expert’s environmental sustainability dimension (0.177), appear as “local” importance
ratings, the second column, for the environmental factor in Table 7. The relative importance
rating for the impact of each of the supply chain stages is shown in the fourth column of Table 7.
For example the agricultural stage of the potato supply chain has the highest (local) relative
importance rating (0.535) in its influence on the environmental sustainability dimension. The
(local) relative importance of each of the sustainability indicators for a given sustainability
dimension and supply chain stage appears in the sixth column of Table 7. The environmental
sustainability dimension at the agricultural stage has energy consumed as the most important of
the three sustainability indicators with a local score of 0.567 (when compared to water
consumed, 0.323, and waste generated, 0.110). The global importance rating is determined by
taking the product of each of the local scores for a given row. For example for the energy
WP 2009-02 22
consumed by the agriculture supply chain stage’s environmental sustainability dimension, the
global importance rating is the product of (0.567)*(0.535)*(0.177) = 0.05369. The mathematical
expression is simply:
GIRijk = SDi*SCSj*SIk (2)
Where: SDi= local relative importance rating for the Sustainability Dimension i
SCSj= local relative importance rating for the Supply Chain Stage j
SIk=local relative importance rating for the Sustainability Indicator k
GIRijk= global relative importance rating for Sustainability Indicator k of Supply
Chain Stage j, Sustainability Indicator i.
------------------------------------------------------------------------ Insert Table 7 Approximately Here
------------------------------------------------------------------------
An overall sustainability index is computed by weighting the indicator scores reported in
Table 4 by the global ratings of Table 7. The index is simply the sum of the indicator scores
multiplied by the global ratings. Table 8 shows the results for one potato expert. The overall
sustainability of the potato supply chain, based on the data in Table 4 and the opinions in Table
7, is 3.016. Each element of the table equals the indicator score times the global importance
rating. For example, the value for labour productivity (the first economic dimension) for the
retail link in the potato supply chain is computed as (0.166)*(2.06) = 0.341, where 0.166 is the
global relative importance rating for the labour productivity indicator (Table 7) and 2.06 is the
indicator score for the retail link of the potato supply chain (Table 4). Similar computations are
performed for each sustainability indicator and supply chain link combination; these products are
then summed to get the total index of 3.016.
WP 2009-02 23
An advantage of the scoring and the weighting scheme is that we can arrive at a single
sustainability index score for each stage and overall supply chain. We can also evaluate the
sustainability of each level within the supply chain. As shown in Table 8, the processing stage of
the potato supply chain has the largest influence on sustainability when aggregated and weighted,
although the data for the stage of agriculture for calculating the indicators were not complete.
Policy makers or supply chain managers seeking to improve performance should see what
aspects of this stage make it sustainable. The analysis could also focus on the various elements
and their scoring. Practically, policy makers or supply chain managers may seek to help improve
the relative performance of poorly performing stage members to help them achieve better overall
sustainability. Additionally, poorly performing members of a supply chain, after scoring and
identification, may be able to identify practices used by better performing members to improve
their own performance.
------------------------------------------------------------------------ Insert Table 8 Approximately Here
------------------------------------------------------------------------
This methodology was also applied to the chicken supply chain, using the data reported
in Table 2 and the evaluations of a chicken supply chain expert (see Table 6 for the top-level
ratings). Translating the opinions into numerical importance ratings and multiplying the indicator
scores by these ratings yields an overall sustainability index of 3.178, as reported in Table 9. The
overall score shows that based on the expert opinions of relative importance and the baseline
performance numbers we arrive at a higher overall rating for the chicken supply chain’s
sustainability index. Although data collected for calculation of indicators (especially at the stage
of agriculture) are not complete, this result would mean that in comparison with the potato
WP 2009-02 24
supply chain, the chicken supply chain is closer to achieving sustainability objectives within
three dimensions: economic, social and environmental.1
------------------------------------------------------------------------ Insert Table 9 Approximately Here
------------------------------------------------------------------------
The retail experts do not have in-depth knowledge of specific supply chains and were not
asked to evaluate the potato or chicken supply chains specifically; therefore, we use their
opinions to complement the area experts. Specifically, we first computed global importance
ratings for each retail expert for each supply chain using the same process described above. We
then computed an average global importance rating for the potato supply chain using the potato
expert and the two retail experts. The average was computed as a weighted geometric mean, as is
usual when combining separate ratings of individual experts (Forman and Peniwati 1998). Since
the potato supply chain expert has more detailed knowledge of this chain, we placed a weight of
0.5 on his/her ratings and placed a weight of 0.25 on the ratings of each of the retail experts (for
a total weight of 1.0). Various other weighting schemes were examined — including equal
weights for all experts — and each produced similar results. Combining the ratings in this way
recognizes the experts’ area knowledge while reducing the possibility of extreme bias. The
average global importance rating was then used to compute the overall sustainability index (as
described above), yielding an average overall result of 2.859 for the potato supply chain. Using
the same process for the chicken supply chain yields an average overall sustainability index of
3.004. To further understand the robustness of these results and to attain additional insights, we
perform a sensitivity analysis.
1 To ensure a fair comparison, when one supply chain is missing a value for an indicator (Table 4), the corresponding value for the other supply chain is also set to 0. This process only affects one indicator (Employees per enterprise in the Agriculture stage). Including the original, non-zero value for this indicator would make the overall sustainability index higher for the chicken supply chain.
WP 2009-02 25
Sensitivity Analysis
The final stage of our overall benchmarking methodology is the sensitivity analysis stage. We
seek to determine the overall robustness of the sustainability numbers to perturbations in the
data. That is, if other experts were asked to rate the importance of different supply chain
dimensions and indicators, how much would the final results change? The sensitivity analysis
also shows the tradeoffs that are implicitly assumed by the various experts. Some tradeoffs have
greater marginal implications for experts and supply chains. This type of tradeoff analysis is
critical to identify potential stakeholder responses to various valuations as well as implications to
performance of stages and overall supply chain sustainability. Sensitivity analysis is also useful
in providing insights due to the dynamics of sustainability perceptions and importance over time.
To demonstrate some of these issues, we perform sensitivity analysis on the economic dimension
of the top-level hierarchy for both the potato and chicken supply chains. We chose this
dimension because the area expert for each supply chain gave it the highest weight, but the
process discussed below could be used for any dimension or link. Based on the questionnaire
responses from the potato supply chain expert, the economic dimension has a weight of 0.519,
the social dimension has a weight of 0.304, and the environmental dimension has a weight of
0.177. To understand how sensitive the overall sustainability index is to changes in the weight on
the economic dimension, we vary this weight from 0 to 1, while keeping the ratio of the other
two dimensions the same. The ratio of social to environmental is currently 0.632 (= 0.304/[0.304
+ 0.177]), and the ratio of environmental to social is currently 0.368 (= 0.177/[0.304 + 0.177]).
Thus, if the economic dimension has a score of 0, then the social dimension will have a score of
0.632 and the environmental dimension will have a score of 0.368, maintaining the same ratios.
If the economic dimension has a score of 0.2, then social dimension will have a score of 0.506 (=
WP 2009-02 26
0.632*[1–0.2]) and the environmental dimension will have a score of 0.294 (= 0.368*[1–0.2]).
Changing the top-level weights will also change the global importance ratings and yield a
different overall sustainability index. Figure 2 illustrates how the overall sustainability index
changes as the weight on the economic dimension changes. The same process was used to
generate results for the chicken supply chain and for the average indices computed using the
retail experts’ opinions. All of the results are shown in Figure 2, along with the actual (original)
scores.
------------------------------------------------------------------------ Insert Figure 2 Approximately Here
------------------------------------------------------------------------
In Figure 2 there are four sensitivity ranges (lines) and four original points identified. The
four include: (1) The chicken supply chain sensitivity of the chicken expert only; (2) The average
chicken supply chain sensitivity that is the weighted average for the chicken expert and the two
retail experts; (3) The potato supply chain sensitivity of the potato expert only; and (4) The
average potato supply chain sensitivity that is the weighted average for the potato expert and the
two retail experts.
As the figure indicates, the sustainability index of potato supply chain is more sensitive
than that of the chicken supply chain to changes in the weight on the economic dimension (this
result is true for the basic potato supply chain and the averaged potato supply chain). While the
index for potato chain ranges from 2.3 to 3.7, the index for the chicken chain only ranges from
approximately 2.8 to 3.3. Similarly, the averaged sustainability index for the potato supply chain
ranges from approximately 2.4 to 3.8, and the averaged sustainability index for the chicken
supply chain ranges from approximately 2.7 to 3.4. The data in Table 4 suggest that the potato
supply chain performs better than the chicken supply chain in terms of the economic indicators.
WP 2009-02 27
It is likely that the improved performance in one area is coming at the expense (trading-off) of
other areas. The potato chain is less sustainable overall, according to the experts and the
proposed measures. In any case, this situation illustrates how focus on a single dimension may
miss the mark in terms of evaluating the overall health and sustainability of the supply chain and
the importance of the consideration of tradeoffs within and between factors. Another general
observation is that each of the overall sustainability scores tends to increase for each supply
chain based on the increasing importance of economic factors. Sensitivity analyses were carried
out for both of the other two factors (to conserve space, the details have been omitted), and their
overall sustainability scores decrease due to their lesser weighted importance than the economic
factor.
DISCUSSION AND CONCLUSIONS
One effective way for managers and policy makers to improve the sustainability of supply chains
is to complete a benchmarking exercise to determine how well specific supply chains perform. In
addition management and supply chain researchers may find approaches that can help develop
and integrate factors and scales for sustainable supply chains useful for theory testing and
development. Stakeholder theory and emergent sustainable supply chain management theory, can
both inform the development and application of a benchmarking tool for sustainable supply
chains. To complete this evaluation for sustainability performance evaluation we have introduced
a methodological framework that can help benchmark supply chains based on sustainability
factors. Using one of the world’s most critical supply chains, the food supply chain, we introduce
and apply a multi-stage procedure to help analytically evaluate a supply chain’s sustainability
WP 2009-02 28
performance. The method uses statistical data for two food supply chains in combination with
expert opinion to construct an overall index of sustainability.
The results show that the chicken supply chain performs better than the potato supply
chain. Given that we have missing data, especially for the part of agriculture, judging from the
results we can state that chicken supply chain (from agricultural production to catering) is closer
to achieving sustainability objectives within economic, social and environmental dimensions.
According to the experts, the economics dimension is the most significant contributor to
sustainability, although the supply chain that performed best on these factors (potato) was not the
one that as appears to be the most sustainable. But, this overarching economic stance by our two
area experts is realistic since most supply chains are primarily driven by economic factors. Also,
as is the problem with most sustainability discussions and evaluations, social and environmental
issues will tend to get lost amongst the economic discussion. Alternative weighting schemes and
a more comprehensive analysis by completing a ‘what-if’ analysis would see a shift in the
results. Also, the relative importance of sustainability factors will tend to shift over time. This
shift is becoming even more pronounced as governments and communities are seeking ways to
reduce environmental burdens while maintaining or improving social benefits. A benchmarking
methodology such as the one proposed here can help to more effectively manage these tradeoffs.
Social investors, consumers and environmental organisations, customers and policy
makers can use the developed framework of assessment to inform their decisions. The developed
framework can be useful for policy makers to measure sustainability performance across various
supply chains (major commodities and products). Focal companies within food supply chains
such as food manufacturers and supermarket retailers may adopt this framework to assess the
sustainability performance of their products and compare within the sector. Sustainability
WP 2009-02 29
scorecard development, becoming more common in commercial products, can be enhanced by
more effectively considering and integrating multiple dimensions and scores. The framework can
be used to make relative comparison between various commodities, but most importantly can be
applied for comparison of various methods of production (e.g. organic and conventional) for the
same product or products produced by different supply chains (companies or retailers). If applied
to a company level, the developed benchmarking framework could assist consumers to evaluate
sustainability performance of equivalent product lines and inform their purchasing behaviour.
Since we construct and range indicators between 1 and 6, where 6 is the desirable
sustainability performance or sustainability target, we can say that the closer the overall
sustainability score of the supply chain the closer the supply chain is conforming to sustainability
objectives or targets. Potential users of the framework (such as policy maker and individual
companies) can set the maximum score as a desired target for sustainability performance (either
policy target or individual corporate performance target) and using the framework can measure
how the supply chains are performing in accordance with set targets. The higher the score the
closer the supply chain overall in achieving sustainability targets within the three dimensions:
economic, social and environmental.
Involvement of independent third party in management of sustainable supply chain
(Teuscher et al. 2006) is considered an advantage. This assessment framework involves expert
opinion in assessing relative values of indicators in sustainability of the supply chain. Potential
users of the framework may wish to consult stakeholders during selection of sustainability
indicators to be included in the assessment as suggested by Courville (2003) and also consult
them on what would be those desirable sustainability performance targets before ranging the
indicators from 1 to 6. Even though not tested in this manuscript, researchers wishing to develop
WP 2009-02 30
multiple scoring levels (factors and/or stages within the supply chain) have a framework for
integrating and disaggregating scores. These type of alternative scoring and measurement
schemes will aid in further understanding and advancing sustainability and supporting theory.
There are clear limitations in our approach, which include the development and setting of
ranges, the selection and inclusion of experts, and the integration of actual data. Unfortunately,
we could not collect the complete data for the assessment of the case study supply chains;
however, we see that there should be no limitations for future use of the proposed methodology.
Although, this framework does not specifically address the element of food miles and impacts
associated with imported goods. This framework concentrates on food products produced within
boundaries of a state. However, food supply chains are becoming increasingly globalized, and
the reflection of the environmental and social burdens associated with importing products from
abroad could be incorporate through including specific indicators to reflect carbon emissions
associated with all stages of the supply chain (agricultural production, food manufacturing, food
wholesale (including food imported from abroad), food retail and food catering).
Rating of sustainability indicators on 1–9 scale requires detailed expert knowledge on
operations and impacts of specific supply chains. As different experts were used for two different
supply chains, experts may be biased and their opinion may affect the final scores. In this study
we decided to place more weight on the opinion of product specialists, but equal or other
combinations for distributing the weights of expert opinions may be utilized. Perhaps, in order
for companies to improve the sustainability performance, which is often interpreted by
organizational stakeholders, companies and policy makers need to incorporate stakeholders in
determining relative weights of indicators. Integrating more experts from various stakeholder
groups (not just industry) may provide more evidence of what types of tradeoffs are willing to be
WP 2009-02 31
made. Industry expert biases may focus on the importance of economic achievements,
government and communities may focus more on social issues, while NGO’s and environmental
groups may seek to put more emphasis on environmental issues. A broader perspective,
incorporating additional stakeholders can be completed using the geometric weighting scheme
proposed in this study. The relative importance of these various stakeholders will also need to be
established. Finding common footing may actually occur. Further negotiation on weighting
schemes with sensitivity analysis will allow for a more complete picture of supply chain
sustainability.
Broader application, studies, and developing better data acquisition systems and
performance measurement systems in the future may address these limitations. We provide one
of the few studies to actually benchmark entire supply chains, and the example we provide
represents a strong foundation upon which to build.
WP 2009-02 32
References: Ahmed, P.K. and M. Rafiq. “Integrated benchmarking: A holistic examination of select
techniques for benchmarking analysis,” Benchmarking for Quality Management and Technology, (5:3), 1998, pp. 225–242.
Bakker, F. de and A. Nijhof. “Responsible chain management: a capability assessment framework,” Business Strategy and the Environment, (11), 2002, pp. 63–75.
Barrett, H.R., Ilbery, B.W., Browne, A.W., and T. Binns. “Globalization and the changing networks of food supply: the importation of fresh horticultural produce from Kenya into the UK,” Transactions of the Institute of British Geographers, (24:2), 1999, pp. 159–174.
Biffaward. Poultry UK: Mass Balance of the UK Poultry Industry, Biffaward, 2005, http://www.massbalance.org/projects/?p=000292, Accessed November 14, 2006.
Boks, C. and A. Stevels. “Theory and practice of environmental benchmarking in a major consumer electronics company,” Benchmarking: An International Journal, (10:2), 2003, pp. 120–135.
Camp, R.C. Business Process Benchmarking, ASCQ Quality Press, Milwaukee, Wisconsin, USA, 1995.
Carlsson-Kanayama, A., Ekstrom, M. P., and H. Shanahan. “Food and life cycle energy inputs: Consequences of diet and ways to increase efficiency,” Ecological Economics, (44:2/3), 2003, pp. 293–307.
Carter, C.R. and D.S. Rogers. “A framework of sustainable supply chain management: moving towards new theory,” International Journal of Physical Distribution & Logistics Management, (38:5), 2008, pp. 360–387.
Collins, A. and R. Fairchild. “Sustainable food consumption at a sub-national level: an ecological footprint, nutritional and economic analysis,” Journal of Environmental Policy and Planning, (9:1), 2007, pp. 5–30.
Courville, S. “Use of indicators to compare supply chains in the coffee industry,” Greener Management International, (43), 2003, pp. 94–105.
DEFRA (Department for Environment, Food and Rural Affairs). Farming and Food’s Contribution to Sustainable Development: Economic and Statistical Analysis, DEFRA Publications, London, 2002a.
DEFRA (Department for Environment Food and Rural Affairs). The Strategy for Sustainable Farming and Food: Facing the Future, DEFRA Publications, London, 2002b.
DEFRA (Department for Environment, Food and Rural Affairs). Food Industry Sustainability Strategy, DEFRA Publication, London, 2006, http://www.defra.gov.uk/farm/policy/sustain/fiss/index.htm, Accessed November 23, 2006.
DEFRA (Department for Environment, Food and Rural Affairs). Securing the Future: UK Government Sustainable Development Strategy. Presented to Parliament by the Secretary of State for Environment, Food and Rural Affairs by Command of Her Majesty, March 2005, http://www.sustainable-development.gov.uk/publications/uk-strategy/index.htm, Accessed November 23, 2006.
WP 2009-02 33
Donaldson, T., and L.E. Preston. “The stakeholder theory of the corporation: concepts, evidence, and implications,” Academy of Management Review, (20:1), 1995, pp. 65–91.
Elkington, J. Cannibals with Forks: The Triple Bottom Line of 21st Century Business, Capstone, Oxford, 1997.
Faruk, A.C., Lamming, R.C., Cousins, P.D. and F.E. Bowen. “Analyzing, mapping, and managing environmental impacts along supply chains,” Journal of Industrial Ecology, (5:2), 2001, pp. 13–36.
Filson, G.C. (Ed). Intensive Agriculture and Sustainability: A Farming Systems Analysis, UBC Press, Vancouver, 2004.
Fine, B., Heasman, M. and J. Wright. Consumption in the age of affluence: the world of food, Routledge, London, 1996.
Food and Drink Federation (FDF). World Summit on Sustainable Development 2002: Contribution by the UK Food and Drink Manufacturing Industry, Food and Drink Federation, 2002, http://www.agrifood-forum.net/doc/UKFDF.pdf, Accessed February 5, 2005.
Forman, E., and K. Peniwati. “Aggregating individual judgements and priorities with the Analytic Hierarchy Process,” European Journal of Operational Research, (108:1), 1998, pp. 165–169.
Freeman, R.E. Strategic Management: A Stakeholder Approach, Pitman, Boston, MA, 1984. Friedman, A.L., and S. Miles. “Developing stakeholder theory,” Journal of Management Studies,
(39:1), 2002, pp. 1–21. Fritz, M. and G. Schiefer. “Food chain management for sustainable food system development: a
European research agenda,” Agribusiness, (24:4), 2008, pp. 440–452. Garnett, T. Wise Moves: Exploring the Relationships Between Food, Transport and Carbon
Dioxide, Transport 2000 Trust, London, 2003. Gerbens-Leenes, P. W., Nonhebel, S., and W. P. M. F. Ivens. “A method to determine land
requirements relating to food consumption patterns,” Agriculture, Ecosystems and Environment, (90:1), 2002, pp. 47–58.
Green, K. and C. Foster. “Give peas a chance: transformations in food consumption and production systems,” Technological Forecasting and Social Change, (72:6), 2005, pp. 663–679.
Gunasekaran, A., Patel, C. and E. Tirtiroglu. “Performance measures and metrics in a supply chain environment,” International Journal of Operations Production Management, (21:1/2), 2001, pp. 71–87.
Gunasekaran, A., Patel, C. and R.E. McGaughey. “A framework for supply chain performance measurement,” International Journal of Production Economics, (87:3), 2004, pp. 333–347.
Heller, M.C. and G.A. Keoleian. “Assessing the sustainability of the US food system: a life cycle perspective,” Agricultural Systems, (76:3), 2003, pp. 1007–1041.
Hervani, A.A., Helms, M.M. and J. Sarkis. “Performance measurement for green supply chain management,” Benchmarking: An International Journal, (12:4), 2005, pp. 330–353.
WP 2009-02 34
Hinrichs, C.C. and T.A. Lyson (Eds). Remaking the North American Food System: Strategies for Sustainability, University of Nebraska Press, Lincoln, Nebraska, 2008.
Holt, D. and A.Watson. “Exploring the dilemma of local sourcing versus international development – the case of the flower industry,” Business Strategy and the Environment, (17:5), 2008, 318–329.
Hughes, A. “Multi-stakeholder approaches to ethical trade: towards a reorganisation of UK retailers' global supply chains?” Journal of Economic Geography, (1), 2001, pp. 421–437.
Ilbery, B. and D. Maye. “Food supply chains and sustainability: evidence from specialist food producers in the Scottish/English borders,” Land Use Policy, (22:4), 2005, pp. 331–344.
Ilbery, B. and D. Maye. “Marketing sustainable food production in Europe: case study evident from two Dutch labelling schemes,” Tijdschrift voor Economische en Sociale Geografie, (98:4), 2007, pp. 507–518.
J. Sainsbury Plc. Corporate Social Responsibility Report 2005, 2005, http://www.j-sainsburys.co.uk/files/reports/cr2005/files/pdf/report.pdf, Accessed November 9, 2006.
Jayanthi, S., Kocha, B. and K.K. Sinha. “Competitive analysis of manufacturing plants: An application to the U.S. processed food industry,” European Journal of Operational Research, (118:2), 1999, pp. 217–234.
Kärnä, A. and E. Heiskanen. “The challenge of ‘product chain’ thinking for products development and design – the example for electrical and electronic products,” The Journal for Sustainable Product Design, (4), 1998, pp. 26–36.
Kinra, A. and Kotzab, H. “A macro-institutional perspective on supply chain environmental complexity,” International Journal of Production Economics, (115:2), 2008, pp. 283–295.
Linstead, O. and P. Ekins. Mass Balance UK: Mapping UK Resource and Material Flows. 2001, http://www.massbalance.org/files/uploaded/download.php?filename =mass%20 balance%20mapping%20report.pdf, Accessed November 14, 2006.
Linton, J.D., Klassen R. and V. Jayaraman. “Sustainable supply chains: an introduction,” Journal of Operations Management, (25:1), 2007, pp. 1075–1082.
MAFF (Ministry of Agriculture, Fisheries and Food). Towards Sustainable Agriculture: A Pilot Set of Indicators, MAFF Publications, London, 2000.
MAFF (Ministry of Agriculture, Fisheries and Food). Working Together for the Food Chain: Views from the Food Chain Group, Ministry of Agriculture, Fisheries and Food, London, 1999, http://www.maff.gov.uk, Accessed September 1, 2003.
Maloni, M.J. and M.E. Brown. “Corporate social responsibility in the supply chain: an application in the food industry,” Journal of Business Ethics, (68:1), 2006, pp. 35–52.
Manning, L., Baines, R. and S. Chadd. “Benchmarking the poultry meat supply chain,” Benchmarking: An International Journal, (15:2), 2008, pp. 148–165.
Marks and Spencer. Corporate Social Responsibility Report 2005, 2005, http://www.marksandspencer.com/gp/node/n/43850031?ie=UTF8&mnSBrand=core, Accessed November 9, 2006.
WP 2009-02 35
Marsden, T., Harrison, M. and A. Flynn. “Creating competitive space: exploring the social and political maintenance of retail power,” Environment and Planning A, (30), 1998, pp. 481–498.
Marsden, T., Murdoch, J., and K. Morgan. “Sustainable agriculture, food supply chains and regional development: editorial introduction,” International Planning Studies, (4), 1999, pp. 295–301.
Matos, S. and J. Hall. “Integrating sustainable development in the supply chain: the case of life cycle assessment in oil and gas and agricultural biotechnology,” Journal of Operations Management, (25), 2007, pp. 1083–1102.
Matthews, D.H. “Environmental management systems for internal corporate environmental benchmarking,” Benchmarking: An International Journal, (10:2), 2003, pp. 95–106.
Matthews, H.S. and L.B. Lave. “Using input-output analysis for corporate benchmarking,” Benchmarking: An International Journal, (10:2), 2003, pp. 152–167.
McNair, C.J. and K.H.J. Leibfried. Benchmarking: A Tool for Continuous Improvement, Wiley, New York, 1995.
McNeeley, J.A. and S.L. Scherr. Ecoagriculture: Strategies to Feed the World and Save Biodiversity, Covelo Island Press, London, 2003.
Min, H. and W.P. Galle. “Competitive benchmarking of fast-food restaurants using the Analytic Hierarchy Process and competitive gap analysis,” Operations Management Review, (11:2/3), 1996, pp. 57–72.
Mitchell, R.K, Agle, B.R., and D.J. Wood. “Toward a theory of stakeholder identification and salience: defining the principle of who and what really counts,” Academy of Management Review, (22:4), 1997, pp. 853–886.
New, S.J. “The scope of supply chain management research,” Supply Chain Management: An International Review, (2:1), 1997, pp. 15–22.
Oral, M. “A methodology for competitiveness analysis and strategy formulation in glass industry,” European Journal of Operational Research, (68:1), 1993, pp. 9–22.
Organisation of Economic Cooperation and Development (OECD). Environmental Indicators for Agriculture. Volume 3: Methods and Results, OECD, Paris, 2001, http://www.oecd.org/dataoecd/0/9/1916629.pdf, Accessed November 20, 2006.
Parkan, C. “Operational competitiveness ratings of production units,” Managerial and Decision Economics, (15:3), 1994, pp. 201–221.
Post, J.E., Preston, L.E., and S. Sachs. “Managing the extended enterprise: the new stakeholder view,” California Management Review, (45:1), 2002, pp. 6–28.
Prescott, J.E. and J.H. Grant. “A manager’s guide for evaluating competitive analysis techniques,” Interfaces, (18:3), 1988, pp. 10–22.
Pretty, J. N., Ball, A. S., Lang, T. and J. I. L. Morison. “Farm costs and food miles: an assessment of the full cost of the UK weekly food basket,” Food Policy, (30:6), 2005, pp. 1–19.
WP 2009-02 36
Reiner, G. and P. Hofmann. “Efficiency analysis of supply chain processes,” International Journal of Production Research, (44:23), 2006, pp. 5065–5087.
Roth, A.V., Tsay, A.A., Pullman, M.E. and J.V. Gray. “Unraveling the food supply chain: strategic insights from China and the 2007 recalls,” Journal of Supply Chain Management, (44:1), 2008, pp. 22–39.
Ruf, B.M., Muralidhar, K., Brown, R.M., Janney, J.J., and K. Paul. “An empirical investigation of the relationship between change in corporate social performance and financial performance: a stakeholder theory perspective,” Journal of Business Ethics, (32:2), 2001, pp. 143–156.
Saaty, T.L. The Analytic Hierarchy Process, McGraw-Hill, New York, NY, 1980.
Sarkis, J. “Benchmarking for agility,” Benchmarking: An International Journal, (8:2), 2001a, pp. 88–107.
Sarkis, J. “Manufacturing’s role in corporate environmental sustainability – concerns for the new millennium,” International Journal of Operations and Production Management, (21:5-6), 2001b, pp. 666–686.
Scholtens, B., and Y. Zhou. “Stakeholder relations and financial performance,” Sustainable Development, (16:3), 2008, pp. 213–232.
Schvaneveldt, S.J. “Environmental performance of products: Benchmarks and tools for measuring improvement,” Benchmarking: An International Journal, (10:2), 2003, pp. 136–151.
Seuring, S. and M. Müller. “From a literature review to a conceptual framework for sustainable supply chain management,” Journal of Cleaner Production, (16), 2008, pp. 1699–1710.
Simatupang, T.M. and R. Sridharan. “Benchmarking supply chain collaborations: an empirical study,” Benchmarking: An International Journal, (11:5), 2004, pp. 484–503.
Srivastava, S.K. “Green supply-chain management: a state-of-the-art literature review,” International Journal of Management Reviews, (9:1), 2007, pp. 53–80.
Stevens, J. “Integrating the supply chain,” International Journal of Physical Distribution and Materials Management, (19:8), 1989, pp. 3–8.
Talluri, S., and J. Sarkis. “A Computational Geometry Approach for Benchmarking,” International Journal of Operations and Production Management, (21:1-2), 2001, pp. 210–223.
Tesco. Corporate Social Responsibility Review 2005, 2005, http://www.tescocorporate.com/images/tesco_crr_2005_0.pdf, Accessed November 9, 2006.
Teuscher, P., Grüninger, B. and N. Ferdinand. “Risk management in sustainable supply chain management (SSCM): lessons learnt from the case of GMO-free soybeans,” Corporate Social Responsibility and Environmental Management, (13:1), 2006, pp. 1–10.
UN (United Nations). Agenda 21 — Global Programme of Action for Sustainable Development, adopted by United Nations Conference on Environment and Development (UNCED), Rio de Janeiro, Brazil, 3–14 June 1992, http://www.un.org/esa/sustdev/documents/agenda21/index.htm, Accessed May 5, 2008.
WP 2009-02 37
UNCSD (United Nations Commission on Sustainable Development). Report E/CN. 17/1998/4 Industry and Sustainable Development. 6Th session, New York, 13 April – 1 May 1998, http://www.un.org/esa/sustdev/sdissues/industry/industry.htm, Accessed November 11, 2006.
Unilever. Unilever Environmental and Social Report 2005. 2005, http://www.unilever.com/Images/Environmental_and_social_report_bkmks_tcm13-39279.pdf, Accessed November 14, 2006.
Vachon, S. and R.D. Klassen. “Extending green practices across the supply chain: the impact of upstream and downstream integration,” International Journal of Operations & Production Management, (26:7), 2006, pp. 795–821.
Veleva, V., Hart, M., Greiner, T. and C. Crumbley. “Indicators for measuring environmental sustainability: A case study of the pharmaceutical industry,” Benchmarking: An International Journal, (10:2), 2003, pp. 107–119.
Waddock, S. and C. Bodwell. “Managing responsibility: what can be learned from the quality movement?” California Management Review, (47:1), 2004, pp. 25–37.
Weatherell, A. Tregear and J. Allinson. “In search of the concerned consumer UK public perceptions of food, farming and buying local,” Journal of Rural Studies, (19), 2003, pp. 233–244.
Welford, R. and S.Frost. “Corporate social responsibility in Asian supply chains,” Corporate Social Responsibility and Environmental Management, (13:3), 2006, pp. 166–176.
Wever, R., Boks, C., Marinelli, T. and A. Stevels. “Increasing the benefits of product-level benchmarking for strategic eco-efficient decision making,” Benchmarking: An International Journal, (14:6), 2007, pp. 711–727.
Yakovleva, N. “Measuring the sustainability of the food supply chain: a case study of the UK,” Journal of Environmental Policy and Planning, (9:1), 2007, pp. 75–100.
Yakovleva, N. and A. Flynn. “Innovation and Sustainability in the Food System: A Case of Chicken Production and Consumption in the UK,” Journal of Environmental Policy and Planning, (6: 3/4), September/December 2004, pp. 227–250.
Zairi, M. and M.A. Youssef. “Benchmarking critical factors for TQM: Part I: Theory and foundations,” Benchmarking for Quality Management and Technology, (2:1), 1995a, pp. 5–20.
Zairi, M. and M.A. Youssef. “A review of key publications on benchmarking: Part I,” Benchmarking for Quality Management and Technology, (2:1), 1995b, pp. 65–72.
Zairi, M. and M.A. Youssef. “A review of key publications on benchmarking: Part II,” Benchmarking for Quality Management and Technology, (3:1), 1996, pp. 45–49.
Zhu, J. Quantitative Models for Performance Evaluation and Benchmarking, Springer, Berlin. 2002.
Zhu, Q. and J. Sarkis. “The moderating effects of institutional pressures on emergent green supply chain practices and performance,” International Journal of, Production Research (45:18/19), 2007, pp. 4333–4355.
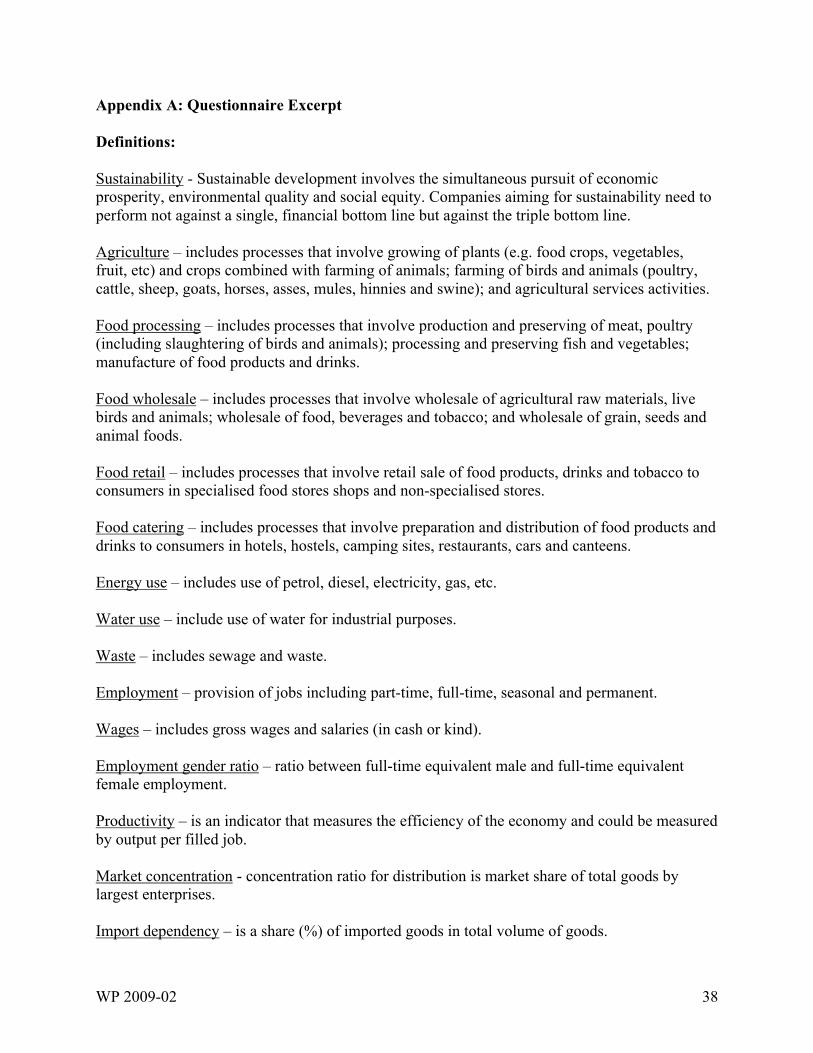
WP 2009-02 38
Appendix A: Questionnaire Excerpt Definitions: Sustainability - Sustainable development involves the simultaneous pursuit of economic prosperity, environmental quality and social equity. Companies aiming for sustainability need to perform not against a single, financial bottom line but against the triple bottom line. Agriculture – includes processes that involve growing of plants (e.g. food crops, vegetables, fruit, etc) and crops combined with farming of animals; farming of birds and animals (poultry, cattle, sheep, goats, horses, asses, mules, hinnies and swine); and agricultural services activities. Food processing – includes processes that involve production and preserving of meat, poultry (including slaughtering of birds and animals); processing and preserving fish and vegetables; manufacture of food products and drinks. Food wholesale – includes processes that involve wholesale of agricultural raw materials, live birds and animals; wholesale of food, beverages and tobacco; and wholesale of grain, seeds and animal foods. Food retail – includes processes that involve retail sale of food products, drinks and tobacco to consumers in specialised food stores shops and non-specialised stores. Food catering – includes processes that involve preparation and distribution of food products and drinks to consumers in hotels, hostels, camping sites, restaurants, cars and canteens. Energy use – includes use of petrol, diesel, electricity, gas, etc. Water use – include use of water for industrial purposes. Waste – includes sewage and waste. Employment – provision of jobs including part-time, full-time, seasonal and permanent. Wages – includes gross wages and salaries (in cash or kind). Employment gender ratio – ratio between full-time equivalent male and full-time equivalent female employment. Productivity – is an indicator that measures the efficiency of the economy and could be measured by output per filled job. Market concentration - concentration ratio for distribution is market share of total goods by largest enterprises. Import dependency – is a share (%) of imported goods in total volume of goods.
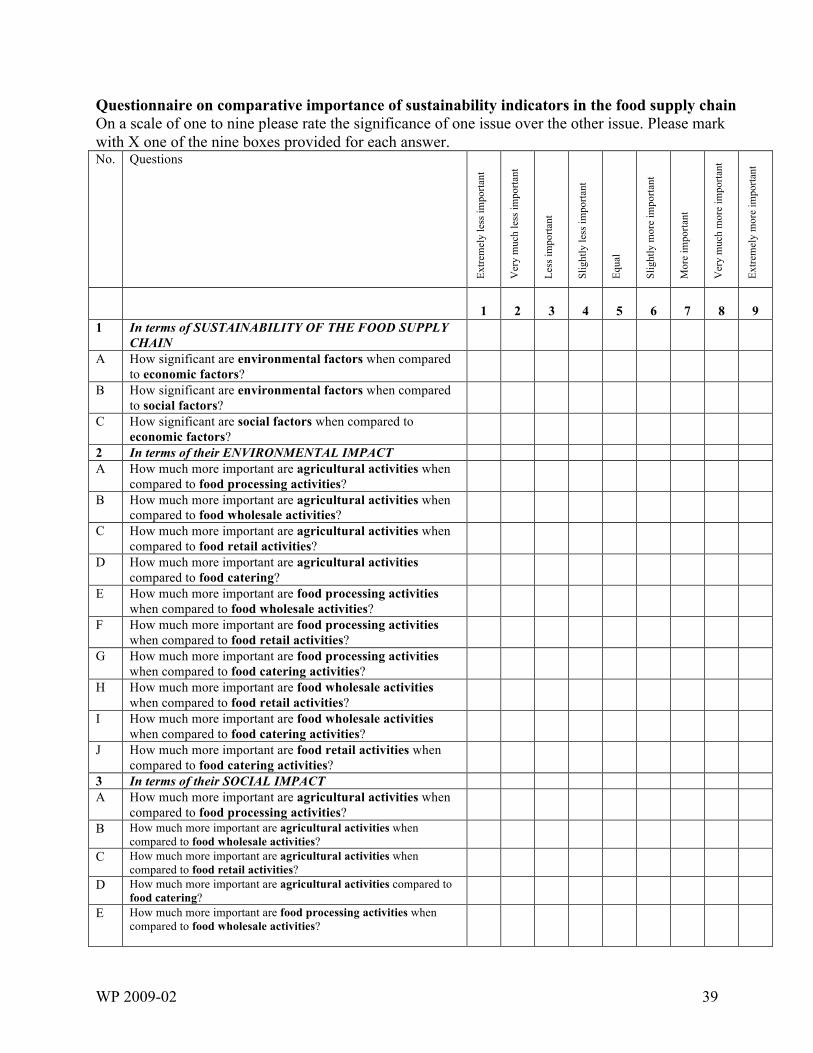
WP 2009-02 39
Questionnaire on comparative importance of sustainability indicators in the food supply chain On a scale of one to nine please rate the significance of one issue over the other issue. Please mark with X one of the nine boxes provided for each answer. No. Questions
Extre
mel
y le
ss im
porta
nt
Ver
y m
uch
less
impo
rtant
Less
impo
rtant
Slig
htly
less
impo
rtant
Equa
l
Slig
htly
mor
e im
porta
nt
Mor
e im
porta
nt
Ver
y m
uch
mor
e im
porta
nt
Extre
mel
y m
ore
impo
rtant
1
2
3
4
5
6
7
8
9
1 In terms of SUSTAINABILITY OF THE FOOD SUPPLY CHAIN
A How significant are environmental factors when compared to economic factors?
B How significant are environmental factors when compared to social factors?
C How significant are social factors when compared to economic factors?
2 In terms of their ENVIRONMENTAL IMPACT A How much more important are agricultural activities when
compared to food processing activities?
B How much more important are agricultural activities when compared to food wholesale activities?
C How much more important are agricultural activities when compared to food retail activities?
D How much more important are agricultural activities compared to food catering?
E How much more important are food processing activities when compared to food wholesale activities?
F How much more important are food processing activities when compared to food retail activities?
G How much more important are food processing activities when compared to food catering activities?
H How much more important are food wholesale activities when compared to food retail activities?
I How much more important are food wholesale activities when compared to food catering activities?
J How much more important are food retail activities when compared to food catering activities?
3 In terms of their SOCIAL IMPACT A How much more important are agricultural activities when
compared to food processing activities?
B How much more important are agricultural activities when compared to food wholesale activities?
C How much more important are agricultural activities when compared to food retail activities?
D How much more important are agricultural activities compared to food catering?
E How much more important are food processing activities when compared to food wholesale activities?
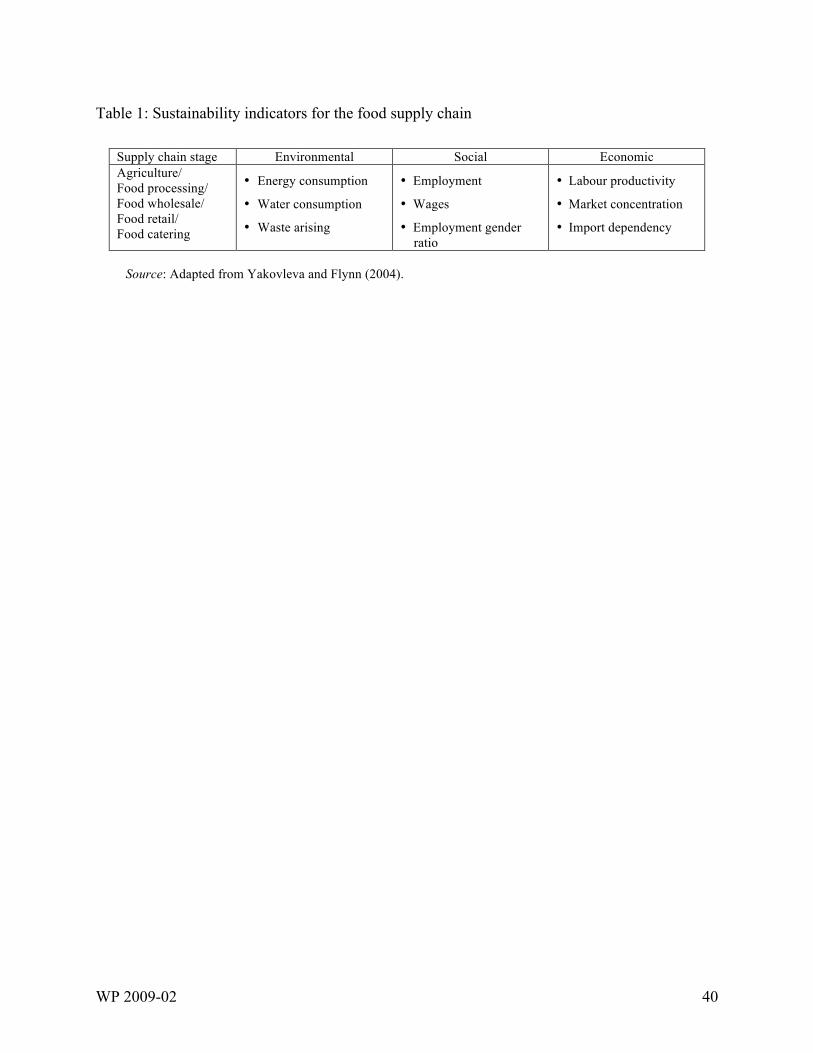
WP 2009-02 40
Table 1: Sustainability indicators for the food supply chain
Supply chain stage Environmental Social Economic Agriculture/ Food processing/ Food wholesale/ Food retail/ Food catering
• Energy consumption
• Water consumption
• Waste arising
• Employment
• Wages
• Employment gender ratio
• Labour productivity
• Market concentration
• Import dependency
Source: Adapted from Yakovleva and Flynn (2004).
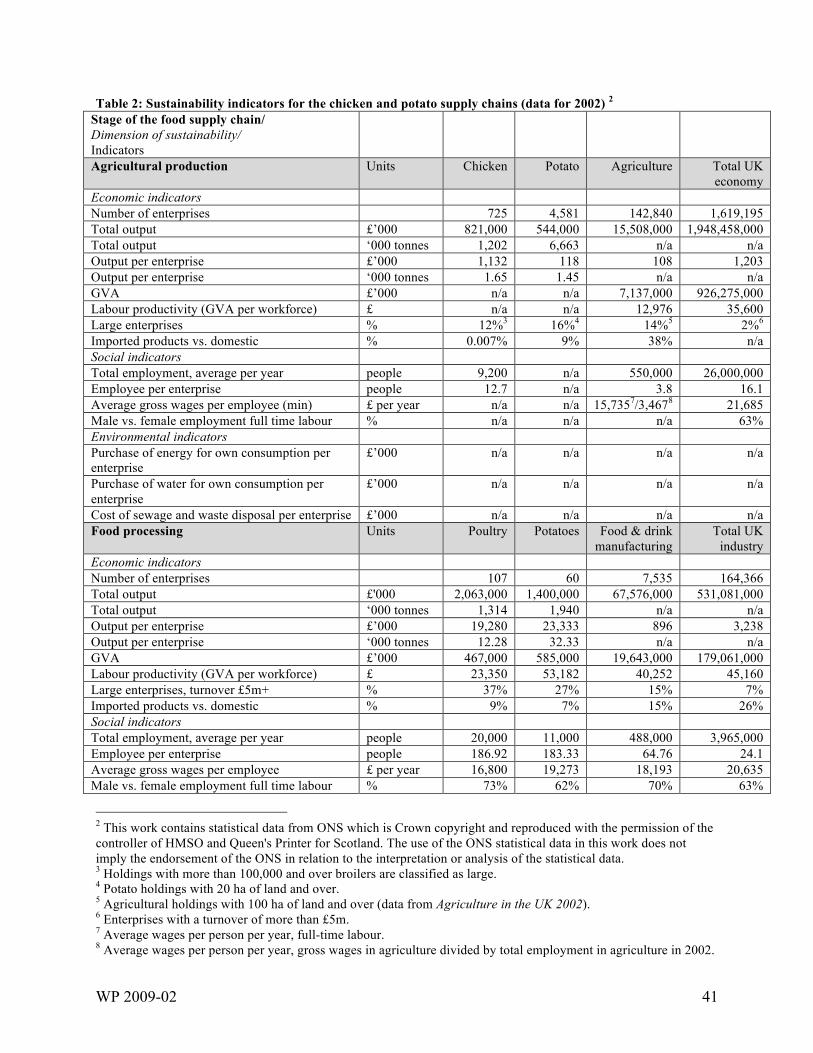
WP 2009-02 41
Table 2: Sustainability indicators for the chicken and potato supply chains (data for 2002) 2 Stage of the food supply chain/ Dimension of sustainability/ Indicators
Agricultural production Units Chicken Potato Agriculture Total UK economy
Economic indicators Number of enterprises 725 4,581 142,840 1,619,195 Total output £’000 821,000 544,000 15,508,000 1,948,458,000 Total output ‘000 tonnes 1,202 6,663 n/a n/a Output per enterprise £’000 1,132 118 108 1,203 Output per enterprise ‘000 tonnes 1.65 1.45 n/a n/a GVA £’000 n/a n/a 7,137,000 926,275,000 Labour productivity (GVA per workforce) £ n/a n/a 12,976 35,600 Large enterprises % 12%3 16%4 14%5 2%6 Imported products vs. domestic % 0.007% 9% 38% n/a Social indicators Total employment, average per year people 9,200 n/a 550,000 26,000,000 Employee per enterprise people 12.7 n/a 3.8 16.1 Average gross wages per employee (min) £ per year n/a n/a 15,7357/3,4678 21,685 Male vs. female employment full time labour % n/a n/a n/a 63% Environmental indicators Purchase of energy for own consumption per enterprise
£’000 n/a n/a n/a n/a
Purchase of water for own consumption per enterprise
£’000 n/a n/a n/a n/a
Cost of sewage and waste disposal per enterprise £’000 n/a n/a n/a n/a Food processing Units Poultry Potatoes Food & drink
manufacturing Total UK
industry Economic indicators Number of enterprises 107 60 7,535 164,366 Total output £'000 2,063,000 1,400,000 67,576,000 531,081,000 Total output ‘000 tonnes 1,314 1,940 n/a n/a Output per enterprise £’000 19,280 23,333 896 3,238 Output per enterprise ‘000 tonnes 12.28 32.33 n/a n/a GVA £’000 467,000 585,000 19,643,000 179,061,000 Labour productivity (GVA per workforce) £ 23,350 53,182 40,252 45,160 Large enterprises, turnover £5m+ % 37% 27% 15% 7% Imported products vs. domestic % 9% 7% 15% 26% Social indicators Total employment, average per year people 20,000 11,000 488,000 3,965,000 Employee per enterprise people 186.92 183.33 64.76 24.1 Average gross wages per employee £ per year 16,800 19,273 18,193 20,635 Male vs. female employment full time labour % 73% 62% 70% 63%
2 This work contains statistical data from ONS which is Crown copyright and reproduced with the permission of the controller of HMSO and Queen's Printer for Scotland. The use of the ONS statistical data in this work does not imply the endorsement of the ONS in relation to the interpretation or analysis of the statistical data. 3 Holdings with more than 100,000 and over broilers are classified as large. 4 Potato holdings with 20 ha of land and over. 5 Agricultural holdings with 100 ha of land and over (data from Agriculture in the UK 2002). 6 Enterprises with a turnover of more than £5m. 7 Average wages per person per year, full-time labour. 8 Average wages per person per year, gross wages in agriculture divided by total employment in agriculture in 2002.
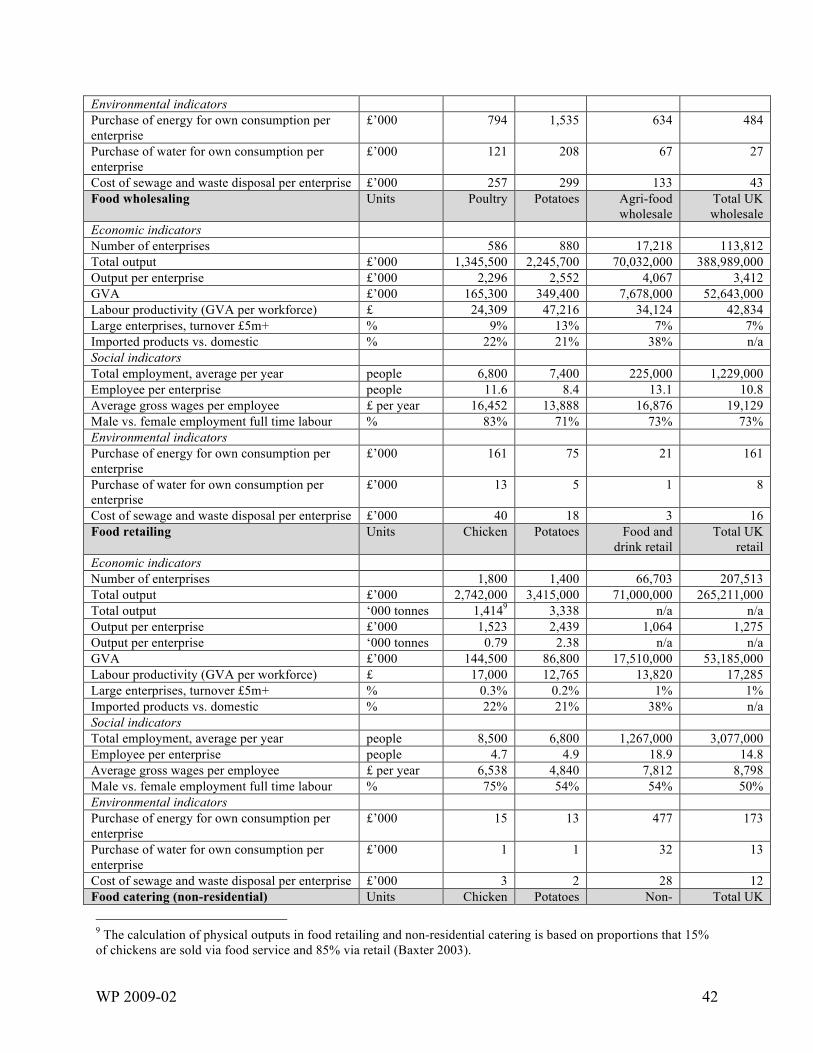
WP 2009-02 42
Environmental indicators Purchase of energy for own consumption per enterprise
£’000 794 1,535 634 484
Purchase of water for own consumption per enterprise
£’000 121 208 67 27
Cost of sewage and waste disposal per enterprise £’000 257 299 133 43 Food wholesaling Units Poultry Potatoes Agri-food
wholesale Total UK wholesale
Economic indicators Number of enterprises 586 880 17,218 113,812 Total output £’000 1,345,500 2,245,700 70,032,000 388,989,000 Output per enterprise £’000 2,296 2,552 4,067 3,412 GVA £’000 165,300 349,400 7,678,000 52,643,000 Labour productivity (GVA per workforce) £ 24,309 47,216 34,124 42,834 Large enterprises, turnover £5m+ % 9% 13% 7% 7% Imported products vs. domestic % 22% 21% 38% n/a Social indicators Total employment, average per year people 6,800 7,400 225,000 1,229,000 Employee per enterprise people 11.6 8.4 13.1 10.8 Average gross wages per employee £ per year 16,452 13,888 16,876 19,129 Male vs. female employment full time labour % 83% 71% 73% 73% Environmental indicators Purchase of energy for own consumption per enterprise
£’000 161 75 21 161
Purchase of water for own consumption per enterprise
£’000 13 5 1 8
Cost of sewage and waste disposal per enterprise £’000 40 18 3 16 Food retailing Units Chicken Potatoes Food and
drink retail Total UK
retail Economic indicators Number of enterprises 1,800 1,400 66,703 207,513 Total output £’000 2,742,000 3,415,000 71,000,000 265,211,000 Total output ‘000 tonnes 1,4149 3,338 n/a n/a Output per enterprise £’000 1,523 2,439 1,064 1,275 Output per enterprise ‘000 tonnes 0.79 2.38 n/a n/a GVA £’000 144,500 86,800 17,510,000 53,185,000 Labour productivity (GVA per workforce) £ 17,000 12,765 13,820 17,285 Large enterprises, turnover £5m+ % 0.3% 0.2% 1% 1% Imported products vs. domestic % 22% 21% 38% n/a Social indicators Total employment, average per year people 8,500 6,800 1,267,000 3,077,000 Employee per enterprise people 4.7 4.9 18.9 14.8 Average gross wages per employee £ per year 6,538 4,840 7,812 8,798 Male vs. female employment full time labour % 75% 54% 54% 50% Environmental indicators Purchase of energy for own consumption per enterprise
£’000 15 13 477 173
Purchase of water for own consumption per enterprise
£’000 1 1 32 13
Cost of sewage and waste disposal per enterprise £’000 3 2 28 12 Food catering (non-residential) Units Chicken Potatoes Non- Total UK
9 The calculation of physical outputs in food retailing and non-residential catering is based on proportions that 15% of chickens are sold via food service and 85% via retail (Baxter 2003).
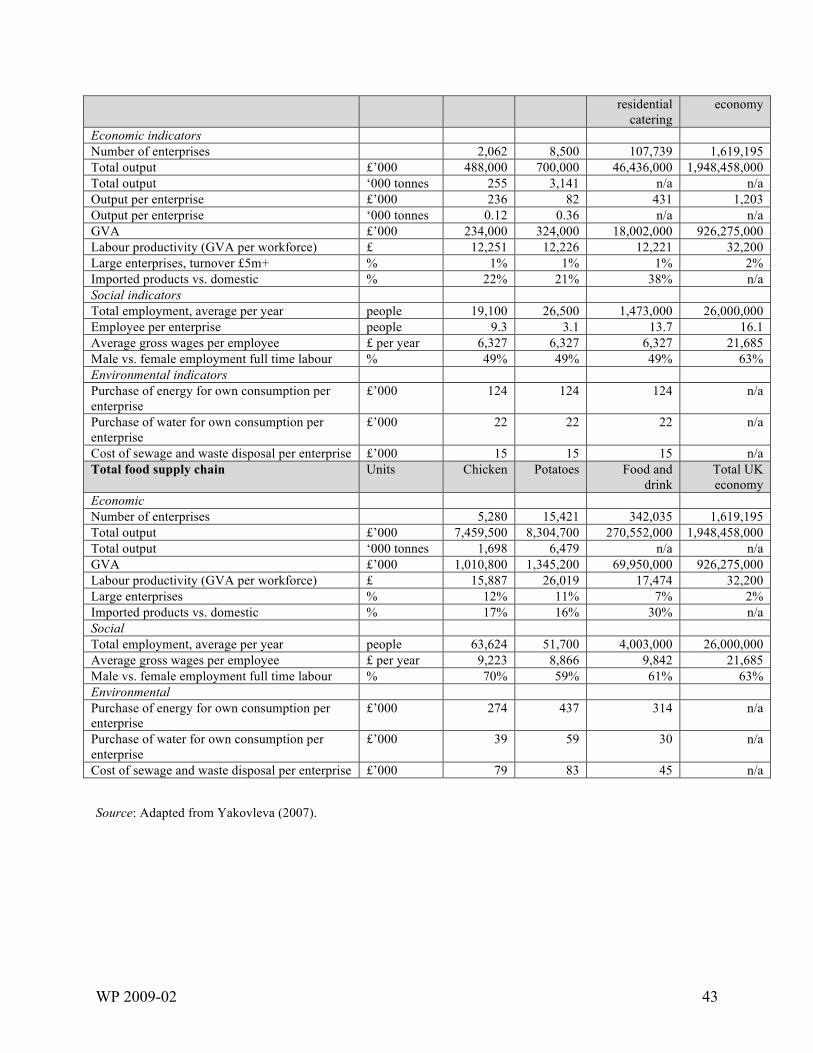
WP 2009-02 43
residential catering
economy
Economic indicators Number of enterprises 2,062 8,500 107,739 1,619,195 Total output £’000 488,000 700,000 46,436,000 1,948,458,000 Total output ‘000 tonnes 255 3,141 n/a n/a Output per enterprise £’000 236 82 431 1,203 Output per enterprise ‘000 tonnes 0.12 0.36 n/a n/a GVA £’000 234,000 324,000 18,002,000 926,275,000 Labour productivity (GVA per workforce) £ 12,251 12,226 12,221 32,200 Large enterprises, turnover £5m+ % 1% 1% 1% 2% Imported products vs. domestic % 22% 21% 38% n/a Social indicators Total employment, average per year people 19,100 26,500 1,473,000 26,000,000 Employee per enterprise people 9.3 3.1 13.7 16.1 Average gross wages per employee £ per year 6,327 6,327 6,327 21,685 Male vs. female employment full time labour % 49% 49% 49% 63% Environmental indicators Purchase of energy for own consumption per enterprise
£’000 124 124 124 n/a
Purchase of water for own consumption per enterprise
£’000 22 22 22 n/a
Cost of sewage and waste disposal per enterprise £’000 15 15 15 n/a Total food supply chain Units Chicken Potatoes Food and
drink Total UK economy
Economic Number of enterprises 5,280 15,421 342,035 1,619,195 Total output £’000 7,459,500 8,304,700 270,552,000 1,948,458,000 Total output ‘000 tonnes 1,698 6,479 n/a n/a GVA £’000 1,010,800 1,345,200 69,950,000 926,275,000 Labour productivity (GVA per workforce) £ 15,887 26,019 17,474 32,200 Large enterprises % 12% 11% 7% 2% Imported products vs. domestic % 17% 16% 30% n/a Social Total employment, average per year people 63,624 51,700 4,003,000 26,000,000 Average gross wages per employee £ per year 9,223 8,866 9,842 21,685 Male vs. female employment full time labour % 70% 59% 61% 63% Environmental Purchase of energy for own consumption per enterprise
£’000 274 437 314 n/a
Purchase of water for own consumption per enterprise
£’000 39 59 30 n/a
Cost of sewage and waste disposal per enterprise £’000 79 83 45 n/a Source: Adapted from Yakovleva (2007).
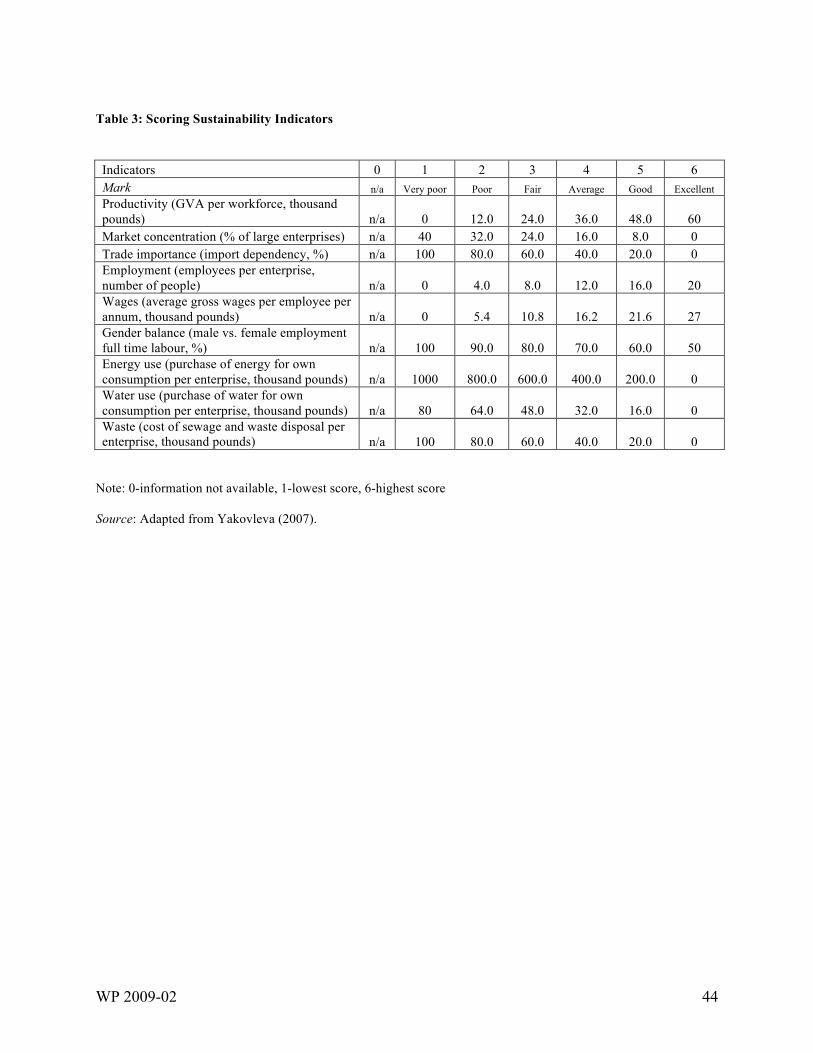
WP 2009-02 44
Table 3: Scoring Sustainability Indicators Indicators 0 1 2 3 4 5 6 Mark n/a Very poor Poor Fair Average Good Excellent Productivity (GVA per workforce, thousand pounds) n/a 0 12.0 24.0 36.0 48.0 60 Market concentration (% of large enterprises) n/a 40 32.0 24.0 16.0 8.0 0 Trade importance (import dependency, %) n/a 100 80.0 60.0 40.0 20.0 0 Employment (employees per enterprise, number of people) n/a 0 4.0 8.0 12.0 16.0 20 Wages (average gross wages per employee per annum, thousand pounds) n/a 0 5.4 10.8 16.2 21.6 27 Gender balance (male vs. female employment full time labour, %) n/a 100 90.0 80.0 70.0 60.0 50 Energy use (purchase of energy for own consumption per enterprise, thousand pounds) n/a 1000 800.0 600.0 400.0 200.0 0 Water use (purchase of water for own consumption per enterprise, thousand pounds) n/a 80 64.0 48.0 32.0 16.0 0 Waste (cost of sewage and waste disposal per enterprise, thousand pounds) n/a 100 80.0 60.0 40.0 20.0 0
Note: 0-information not available, 1-lowest score, 6-highest score
Source: Adapted from Yakovleva (2007).
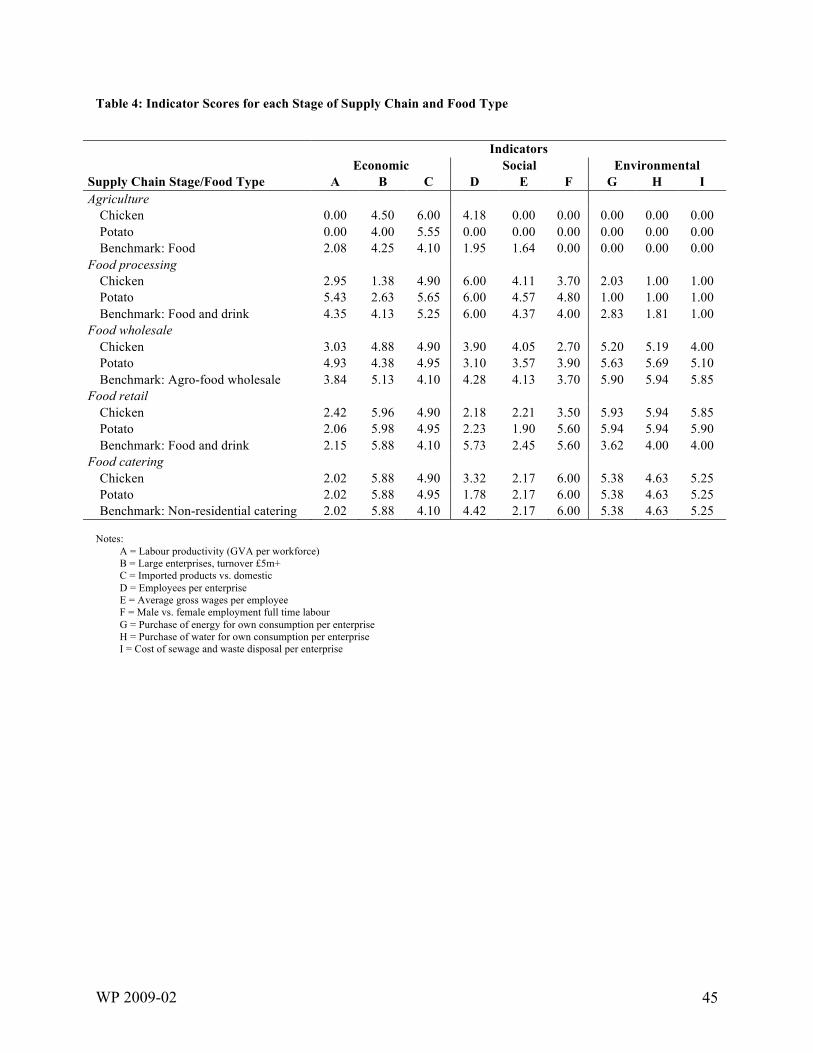
WP 2009-02 45
Table 4: Indicator Scores for each Stage of Supply Chain and Food Type
Notes:
A = Labour productivity (GVA per workforce) B = Large enterprises, turnover £5m+ C = Imported products vs. domestic D = Employees per enterprise E = Average gross wages per employee F = Male vs. female employment full time labour G = Purchase of energy for own consumption per enterprise H = Purchase of water for own consumption per enterprise I = Cost of sewage and waste disposal per enterprise
Indicators Economic Social Environmental Supply Chain Stage/Food Type A B C D E F G H I Agriculture Chicken 0.00 4.50 6.00 4.18 0.00 0.00 0.00 0.00 0.00 Potato 0.00 4.00 5.55 0.00 0.00 0.00 0.00 0.00 0.00 Benchmark: Food 2.08 4.25 4.10 1.95 1.64 0.00 0.00 0.00 0.00 Food processing Chicken 2.95 1.38 4.90 6.00 4.11 3.70 2.03 1.00 1.00 Potato 5.43 2.63 5.65 6.00 4.57 4.80 1.00 1.00 1.00 Benchmark: Food and drink 4.35 4.13 5.25 6.00 4.37 4.00 2.83 1.81 1.00 Food wholesale Chicken 3.03 4.88 4.90 3.90 4.05 2.70 5.20 5.19 4.00 Potato 4.93 4.38 4.95 3.10 3.57 3.90 5.63 5.69 5.10 Benchmark: Agro-food wholesale 3.84 5.13 4.10 4.28 4.13 3.70 5.90 5.94 5.85 Food retail Chicken 2.42 5.96 4.90 2.18 2.21 3.50 5.93 5.94 5.85 Potato 2.06 5.98 4.95 2.23 1.90 5.60 5.94 5.94 5.90 Benchmark: Food and drink 2.15 5.88 4.10 5.73 2.45 5.60 3.62 4.00 4.00 Food catering Chicken 2.02 5.88 4.90 3.32 2.17 6.00 5.38 4.63 5.25 Potato 2.02 5.88 4.95 1.78 2.17 6.00 5.38 4.63 5.25 Benchmark: Non-residential catering 2.02 5.88 4.10 4.42 2.17 6.00 5.38 4.63 5.25
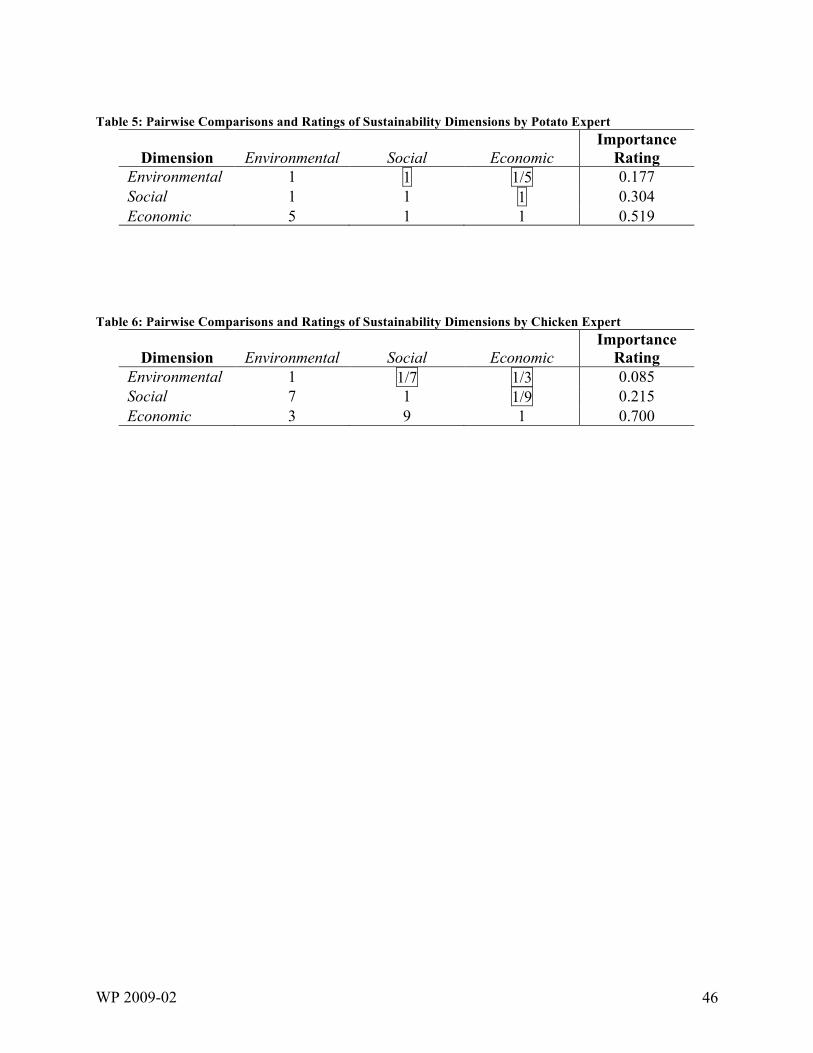
WP 2009-02 46
Table 5: Pairwise Comparisons and Ratings of Sustainability Dimensions by Potato Expert
Dimension
Environmental
Social
Economic
Importance Rating
Environmental 1 1 1/5 0.177 Social 1 1 1 0.304 Economic 5 1 1 0.519
Table 6: Pairwise Comparisons and Ratings of Sustainability Dimensions by Chicken Expert
Dimension
Environmental
Social
Economic Importance
Rating Environmental 1 1/7 1/3 0.085 Social 7 1 1/9 0.215 Economic 3 9 1 0.700
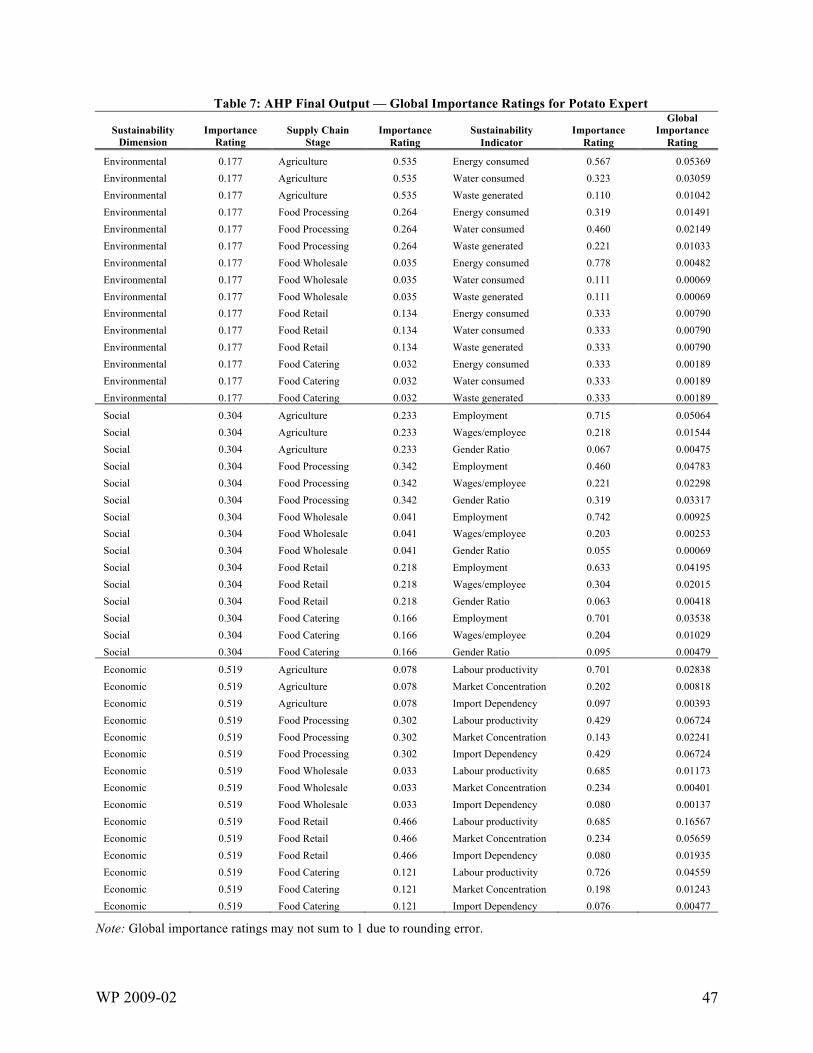
WP 2009-02 47
Table 7: AHP Final Output — Global Importance Ratings for Potato Expert Sustainability
Dimension Importance
Rating Supply Chain
Stage
Importance
Rating
Sustainability
Indicator
Importance
Rating
Global Importance Rating
Environmental 0.177 Agriculture 0.535 Energy consumed 0.567 0.05369 Environmental 0.177 Agriculture 0.535 Water consumed 0.323 0.03059 Environmental 0.177 Agriculture 0.535 Waste generated 0.110 0.01042 Environmental 0.177 Food Processing 0.264 Energy consumed 0.319 0.01491 Environmental 0.177 Food Processing 0.264 Water consumed 0.460 0.02149 Environmental 0.177 Food Processing 0.264 Waste generated 0.221 0.01033 Environmental 0.177 Food Wholesale 0.035 Energy consumed 0.778 0.00482 Environmental 0.177 Food Wholesale 0.035 Water consumed 0.111 0.00069 Environmental 0.177 Food Wholesale 0.035 Waste generated 0.111 0.00069 Environmental 0.177 Food Retail 0.134 Energy consumed 0.333 0.00790 Environmental 0.177 Food Retail 0.134 Water consumed 0.333 0.00790 Environmental 0.177 Food Retail 0.134 Waste generated 0.333 0.00790 Environmental 0.177 Food Catering 0.032 Energy consumed 0.333 0.00189 Environmental 0.177 Food Catering 0.032 Water consumed 0.333 0.00189 Environmental 0.177 Food Catering 0.032 Waste generated 0.333 0.00189
Social 0.304 Agriculture 0.233 Employment 0.715 0.05064 Social 0.304 Agriculture 0.233 Wages/employee 0.218 0.01544 Social 0.304 Agriculture 0.233 Gender Ratio 0.067 0.00475 Social 0.304 Food Processing 0.342 Employment 0.460 0.04783 Social 0.304 Food Processing 0.342 Wages/employee 0.221 0.02298 Social 0.304 Food Processing 0.342 Gender Ratio 0.319 0.03317 Social 0.304 Food Wholesale 0.041 Employment 0.742 0.00925 Social 0.304 Food Wholesale 0.041 Wages/employee 0.203 0.00253 Social 0.304 Food Wholesale 0.041 Gender Ratio 0.055 0.00069 Social 0.304 Food Retail 0.218 Employment 0.633 0.04195 Social 0.304 Food Retail 0.218 Wages/employee 0.304 0.02015 Social 0.304 Food Retail 0.218 Gender Ratio 0.063 0.00418 Social 0.304 Food Catering 0.166 Employment 0.701 0.03538 Social 0.304 Food Catering 0.166 Wages/employee 0.204 0.01029 Social 0.304 Food Catering 0.166 Gender Ratio 0.095 0.00479
Economic 0.519 Agriculture 0.078 Labour productivity 0.701 0.02838 Economic 0.519 Agriculture 0.078 Market Concentration 0.202 0.00818 Economic 0.519 Agriculture 0.078 Import Dependency 0.097 0.00393 Economic 0.519 Food Processing 0.302 Labour productivity 0.429 0.06724 Economic 0.519 Food Processing 0.302 Market Concentration 0.143 0.02241 Economic 0.519 Food Processing 0.302 Import Dependency 0.429 0.06724 Economic 0.519 Food Wholesale 0.033 Labour productivity 0.685 0.01173 Economic 0.519 Food Wholesale 0.033 Market Concentration 0.234 0.00401 Economic 0.519 Food Wholesale 0.033 Import Dependency 0.080 0.00137 Economic 0.519 Food Retail 0.466 Labour productivity 0.685 0.16567 Economic 0.519 Food Retail 0.466 Market Concentration 0.234 0.05659 Economic 0.519 Food Retail 0.466 Import Dependency 0.080 0.01935 Economic 0.519 Food Catering 0.121 Labour productivity 0.726 0.04559 Economic 0.519 Food Catering 0.121 Market Concentration 0.198 0.01243 Economic 0.519 Food Catering 0.121 Import Dependency 0.076 0.00477
Note: Global importance ratings may not sum to 1 due to rounding error.
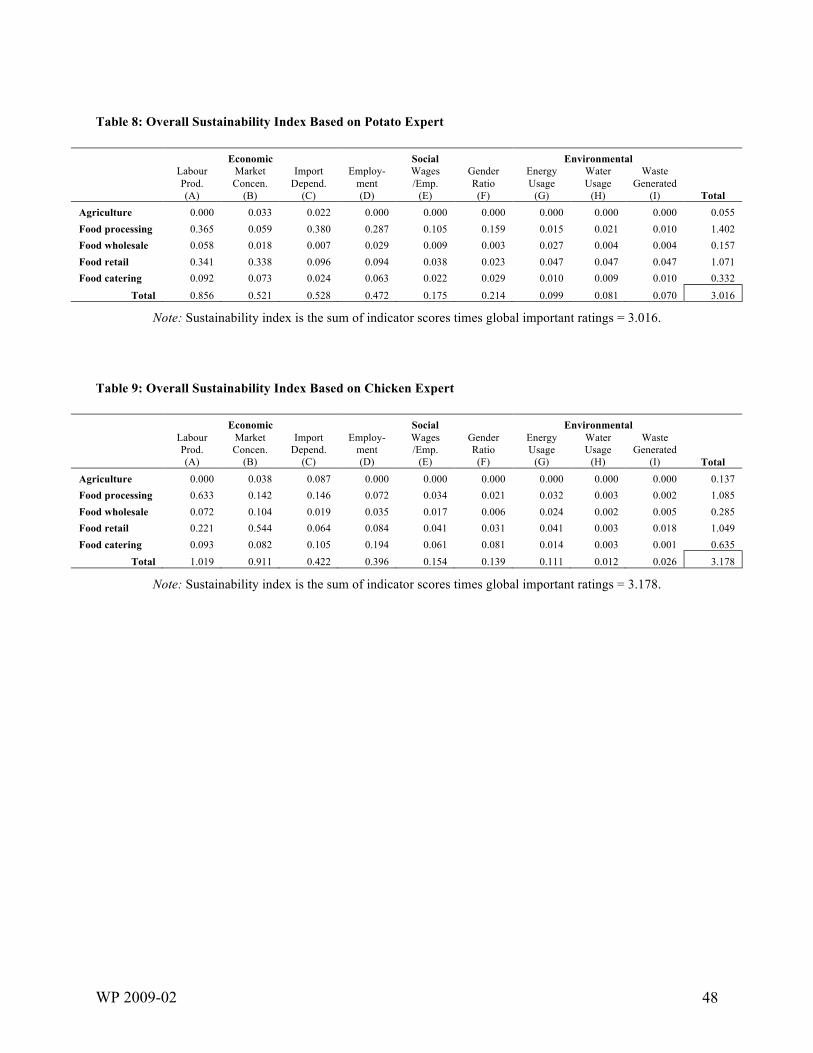
WP 2009-02 48
Table 8: Overall Sustainability Index Based on Potato Expert
Economic Social Environmental
Labour Prod. (A)
Market Concen.
(B)
Import Depend.
(C)
Employ-ment (D)
Wages /Emp.
(E)
Gender Ratio (F)
Energy Usage
(G)
Water Usage
(H)
Waste Generated
(I) Total Agriculture 0.000 0.033 0.022 0.000 0.000 0.000 0.000 0.000 0.000 0.055 Food processing 0.365 0.059 0.380 0.287 0.105 0.159 0.015 0.021 0.010 1.402 Food wholesale 0.058 0.018 0.007 0.029 0.009 0.003 0.027 0.004 0.004 0.157 Food retail 0.341 0.338 0.096 0.094 0.038 0.023 0.047 0.047 0.047 1.071 Food catering 0.092 0.073 0.024 0.063 0.022 0.029 0.010 0.009 0.010 0.332
Total 0.856 0.521 0.528 0.472 0.175 0.214 0.099 0.081 0.070 3.016
Note: Sustainability index is the sum of indicator scores times global important ratings = 3.016. Table 9: Overall Sustainability Index Based on Chicken Expert
Economic Social Environmental
Labour Prod. (A)
Market Concen.
(B)
Import Depend.
(C)
Employ-ment (D)
Wages /Emp.
(E)
Gender Ratio (F)
Energy Usage
(G)
Water Usage
(H)
Waste Generated
(I) Total Agriculture 0.000 0.038 0.087 0.000 0.000 0.000 0.000 0.000 0.000 0.137 Food processing 0.633 0.142 0.146 0.072 0.034 0.021 0.032 0.003 0.002 1.085 Food wholesale 0.072 0.104 0.019 0.035 0.017 0.006 0.024 0.002 0.005 0.285 Food retail 0.221 0.544 0.064 0.084 0.041 0.031 0.041 0.003 0.018 1.049 Food catering 0.093 0.082 0.105 0.194 0.061 0.081 0.014 0.003 0.001 0.635
Total 1.019 0.911 0.422 0.396 0.154 0.139 0.111 0.012 0.026 3.178
Note: Sustainability index is the sum of indicator scores times global important ratings = 3.178.
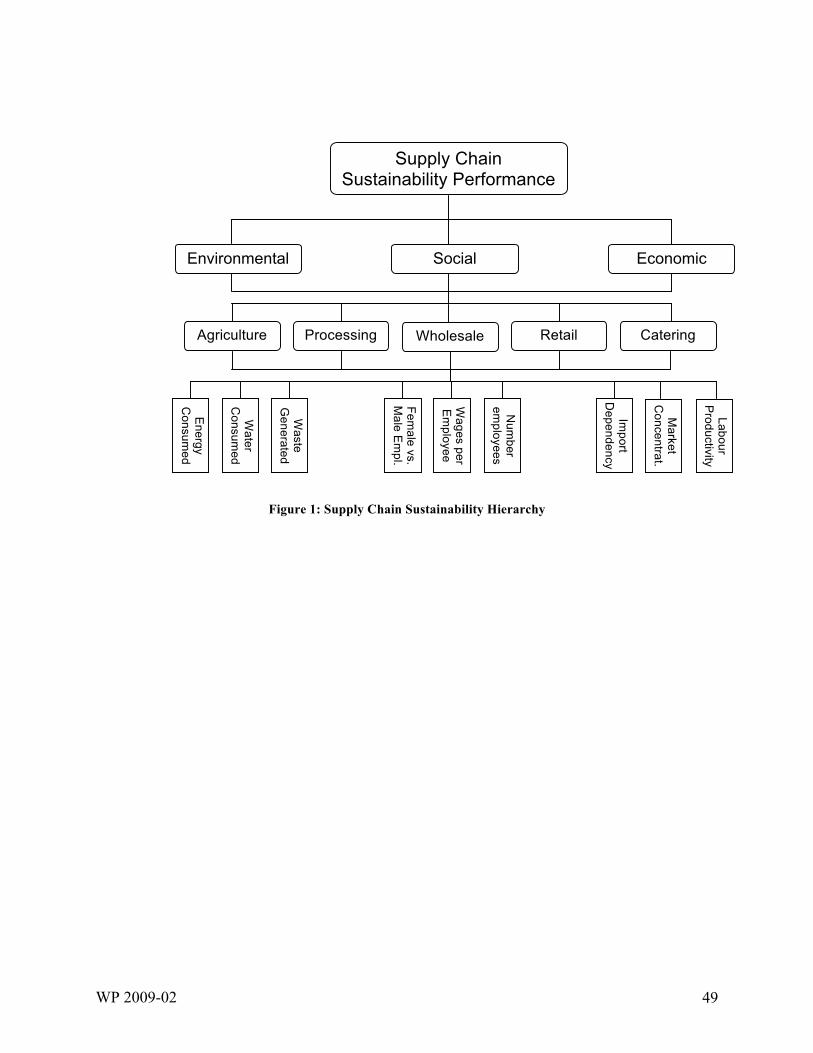
WP 2009-02 49
Figure 1: Supply Chain Sustainability Hierarchy
Supply Chain Sustainability Performance
Environmental
Social Economic
Agriculture Processing Retail Catering
Energy
Consum
ed
Water
Consum
ed
Waste
Generated
Female vs.
Male E
mpl.
Wages per
Em
ployee
Num
ber em
ployees
Import
Dependency
Market
Concentrat.
Labour P
roductivity
Wholesale
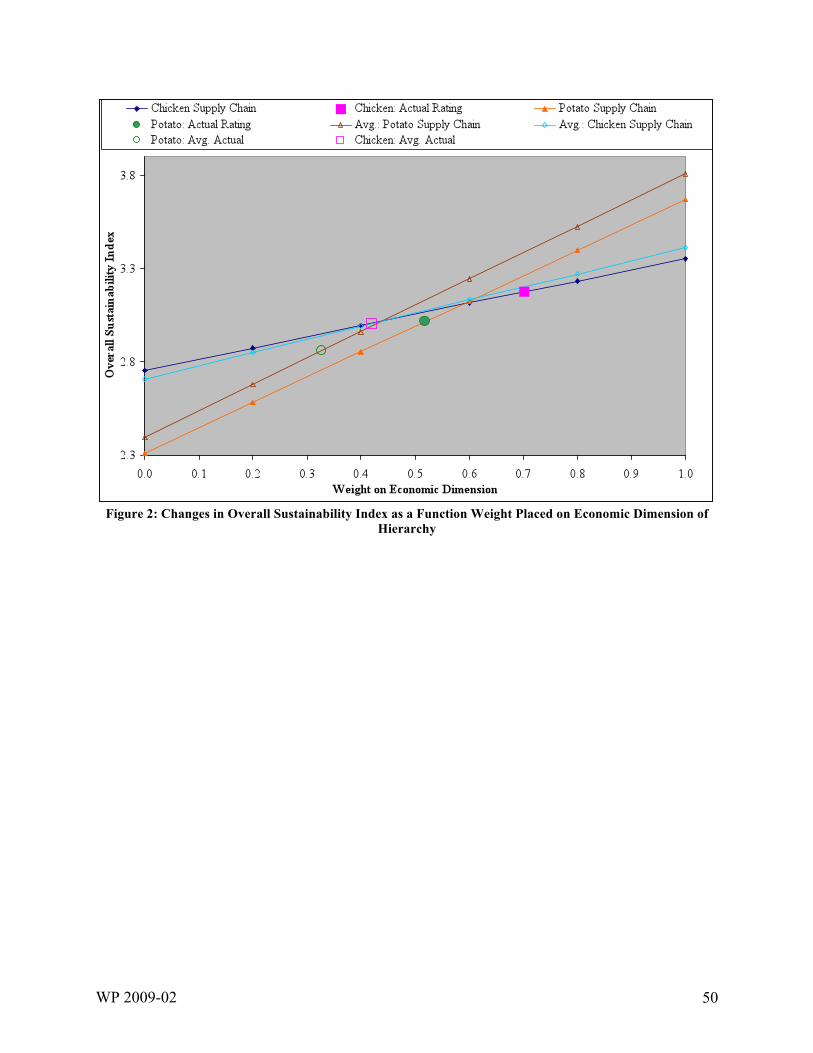
WP 2009-02 50
Figure 2: Changes in Overall Sustainability Index as a Function Weight Placed on Economic Dimension of
Hierarchy


