Embed Size (px)
Citation preview
Sustainable supply chain management towards disruption and organizational ambidexterity: A data driven analysis Bui, TD, Tsai, FM, Tseng, ML, Tan, RR, Yu, KDS & Lim, MK
Author post-print (accepted) deposited by Coventry University’s Repository Original citation & hyperlink:
Sustainable supply chain management towards disruption and organizational ambidexterity: A data driven analysis', Sustainable Production and Consumption, vol. 26, pp. 373-410. https://dx.doi.org/10.1016/j.spc.2020.09.017
DOI 10.1016/j.spc.2020.09.017 ISSN 2352-5509 Publisher: Elsevier NOTICE: this is the author’s version of a work that was accepted for publication in Sustainable Production and Consumption Changes resulting from the publishing process, such as peer review, editing, corrections, structural formatting, and other quality control mechanisms may not be reflected in this document. Changes may have been made to this work since it was submitted for publication. A definitive version was subsequently published in Sustainable Production and Consumption, [[26] (2021)] DOI: 10.1016/j.spc.2020.09.017 © 2021, Elsevier. Licensed under the Creative Commons Attribution-NonCommercial-NoDerivatives 4.0 International http://creativecommons.org/licenses/by-nc-nd/4.0/ Copyright © and Moral Rights are retained by the author(s) and/ or other copyright owners. A copy can be downloaded for personal non-commercial research or study, without prior permission or charge. This item cannot be reproduced or quoted extensively from without first obtaining permission in writing from the copyright holder(s). The content must not be changed in any way or sold commercially in any format or medium without the formal permission of the copyright holders. This document is the author’s post-print version, incorporating any revisions agreed during the peer-review process. Some differences between the published version and this version may remain and you are advised to consult the published version if you wish to cite from it.
1
Sustainable supply chain management towards disruption and organizational
ambidexterity: a data driven analysis
Tat-Dat Bui Department of Shipping and Transportation Management, National Taiwan Ocean
University, Taiwan E-mail: [email protected] Feng Ming Tsai Department of Shipping and Transportation Management, National Taiwan Ocean
University, Taiwan E-mail: [email protected] Ming-Lang Tseng* Chair Professor, Institute of Innovation and Circular Economy, Asia University Taiwan,
Taichung, Taiwan Department of Medical Research, China Medical University, Taichung, Taiwan Adjunct Distinguished Professor, Faculty of Economics and Management, Universiti
Kebangsaan Malaysia, Malaysia E-mail: [email protected] Raymond R. Tan Department of Chemical Engineering, De La Salle University, Manila, Philippines Email: [email protected] Krista Danielle S Yu School of Economics, De La Salle University, Manila, Philippines Email: [email protected] Ming K. Lim Centre for Business in Society, Faculty of Business and Law, Coventry University,
United Kingdom
2
Abstract:
Balancing sustainability and disruption of supply chains requires organizational
ambidexterity. Sustainable supply chains prioritize efficiency and economies of scale and
may not have sufficient redundancy to withstand disruptive events. There is a developing
body of literature that attempts to reconcile these two aspects. This study gives a data-
driven literature review of sustainable supply chain management trends toward
ambidexterity and disruption. The critical review reveals temporal trends and geographic
distribution of literature. A hybrid of data-driven analysis approach based on content and
bibliometric analyses, fuzzy Delphi method, entropy weight method, and fuzzy decision-
making trial and evaluation laboratory is used on 273 keywords and 22 indicators
obtained based on the experts’ evaluation. The most important indicators are identified
as supply chain agility, supply chain coordination, supply chain finance, supply chain
flexibility, supply chain resilience, and sustainability. The regions show different
tendencies compared with others. Asia and Oceania, Latin America and the Caribbean,
and Africa are the regions needs improvement, while Europe and North America show
distinct apprehensions on supply chain network design. The main contribution of this
review is the identification of the knowledge frontier, which then leads to a discussion of
prospects for future studies and practical industry implementation.
Keywords: Sustainable supply chain management, disruption, ambidexterity, data
driven, content analysis, fuzzy Delphi method, entropy weight method, fuzzy decision-
making trial and evaluation laboratory
3
Sustainable supply chain management towards disruption and organizational
ambidexterity: a data driven analysis
List of acronyms
Sustainable supply chain management SSCM Supply chain SC Triple bottom line TBL Fuzzy Delphi method FDM Entropy weight method EWM Decision-making trial and evaluation laboratory DEMATEL Triangular fuzzy numbers TFNs Supply chain network design SCND
1. Introduction
Sustainable supply chain management (SSCM) refers to manage the materials,
information and capital flow, as well as collaboration and cooperation among the supply
chain (SC) partners, deriving from stakeholders and customers, while implementing all
sustainable development goals imitative from the triple bottom line (TBL) as economic,
social, and environmental dimensions (Seuring and Muller, 2008). Over decades, the
exploratory evolution on sustainability has followed by an augmented understanding on
the wide-ranging and varied literature of the SSCM (Ansari and Kant, 2017; Rajeev et al.,
2017; Brandenburg et al., 2014). However, the complexity of the dynamic global business
environment has led to vulnerability to various SC risks (Munir et al, 2020). Significant
study effort has been put into planning integrated systems that are able to withstand,
respond to, recover from, and adapt to risks (Linkov et al., 2018).
SC disruptions are undesired and unexpected events; examples include natural
disasters, industrial accidents, technological shifts, and political events (Braunscheidel
and Suresh, 2009). Munir et al. (2020) stated that companies frequently encounter
disruptions, which cause distress in entire SCs. Gölgeci & Kuivalainen (2020) point out that
in the modern global market, disruptions are becoming an important priority due to their
role in threatening the long-term survival of firms; this trend is displacing conventional
firm-centric management predicated on a stable business environment. The
consequences of such disruptions can be grave if not addressed promptly (Pettit et al.,
2013; Pettit et al., 2019). As a result, how firms manage SC disruptions has become a
critical issue for both academics and practitioners (Azadegan et al., 2019; Nooraie et al.,
2019). The role of organizational ambidexterity has recently been recognized as very
important for enabling firms to balance disruption impacts with other factors (Ivanov et
al., 2014; Lee and Rha, 2016; Ojha et al., 2018). For example, the current COVID-19 crisis
4
has highlighted the need to reconfigure modern supply chains to survive (Ivanov et al.,
2020).
The concept of ambidexterity spans both exploration and exploitation to achieve long-
term SC sustainability (O'Reilly and Tushman, 2011; Yang et al., 2014). Previous studies
have recognized that SC ambidexterity should be included in operations management
(Blome et al., 2013; Aslam et al., 2018). Yet, the association between disruption and SSCM
ambidexterity has not been fully addressed. The current SC is insufficient to gain the
benefits from SC ambidexterity and the compromises of resolving these problems are rare
in the literature (Wamba et al, 2020). Studies on disruption and ambidexterity beyond the
SSCM is specifically limited consequences practically worse if disruptions are informed
(Lee and Rha,2016; Chowdhury & Quaddus, 2017). A comprehensive integrated
assessment is urgent to extant the literature, this study offers a data-driven literature
review that exemplifies a clear overall depiction of SSCM toward disruption and
ambidexterity so that reveals hindering enhancement attributes.
Chen et al. (2019) stated that the positive effects of the cluster function effectively in
the aftermath of disasters were able to address urgent orders rapidly and to minimize
loss based on geographical proximity explanation. Dixit et al. (2020) state the SSCM
network get influences by catastrophes arising due to the facilities location, scenery,
geographical region, climatic circumstances, political situations. With an extensive
geographic allocation of SC entities, an individual disruptive event may not eftect the
whole network at a time or with the same scale (Hu and Kostamis, 2015; Kamalahmadi
and Parast, 2016). However, the interlinked of SC partners is associated with the SC
disruption risk and consequence a series of disruptions, which are threatening the global
SSCM practices. For instance, the floods in Thailand, and earthquake and tsunami in Japan
in 2011 showed an aggravated of global SC disruption (Kauppi et al., 2016; Shekarian et
al., 2020). Recently, firms as Hyundai deferred its manufacture in South Korea; and Ford,
Nissan, and Tesla shut down their factories; a drop in Apple products demand as results
of the disruption caused by the Covid-19 outbreak in China are reported from February
2020 (Essuman et al,, 2020). Factory closures and drastic drops in product demand have
led to major SC problems for many firms throughout the world (Yu and Aviso, 2020).
SC disruptions have highlighted the importance of post-disruption management from
both research and practice standpoints. The identification of relevant factors for
mitigating risk and ensure the survivability is a priority area. Laine and Galkina (2017)
studied the effect of trade sanctions on the capability of import- or export-dependent
firms to respond to major disruptions. Jajja et al. (2018) and Weijiao et al. (2018)
investigated the effects of resource abundance, regulatory environment, and social
institutions on the ability to cope with disruptive periods. Shah et al. (2020) related SC
variables with research and development activities, manufacturing processes, and
business connections, and compared firms in North America and Europe with those in
5
South America and Asia. The importance of regional effects was found to be significant.
Thus, if firms intend to expand their SCs to other regions, they need to consider the
potential impacts of disruptions on their performance (Parast, 2020).
Global SCs are characterized by complexity due to the presence of different players operating under diverse conditions in different countries and regions; such complexity poses formidable challenges to SC sustainability (Koberg and Longoni, 2019). Therefore, it is essential to scrutinize the regional aspects, aside from an overall review of the global literature. A systematic review is needed to classify state-of-the-art SSCM work and identify new directions and potential opportunities. This paper has the following objectives:
To provide a survey the literature on SSCM trends towards disruption and ambidexterity
To determine based on the data-driven indicators for future research
To identify the challenges and knowledge gaps specific to geographic regions This study contributes the following: (1) identification of the fundamental SSCM
knowledge frontier, (2) provision of valuable future directions via data-driven analysis of the existing literature, and (3) assessment of global state and regional variations of SSCM literature. Since current SC are vulnerable to disruptions, there is a need to enhance sustainability to ensure future competitive advantage (Ivanov and Dolgui, 2019). This study covers both quantitative and qualitative approaches. A hybrid method based on content and bibliometric analyses, the fuzzy Delphi method (FDM), the entropy weight method (EWM) and fuzzy decision-making trial and evaluation laboratory (DEMATEL) is used. Content and bibliometric analyses is to identify the SSCM indicators based on publications data in the Scopus database (Gao et al., 2020; Shukla et al., 2019). FDM is applied to identify valid indicators from the experts’ linguistic perception (Bui et al., 2020). EWM is used to find the indicators’ weights to determine regional performance (Tseng, 2017). Fuzzy DEMATEL is used to identify the important indicators from human linguistic preferences for future study (Tseng et al., 2018).
The rest of this paper is organized as follows. The next section reviews the proposed methodology. The results of the analysis are presented in the third section. Then, the fourth section discusses the literature trends, and future challenges. Variations in regional trends are included. Then conclusions and suggestions for future work are given.
2. Literature review
The SC ambidexterity has attracted considerable interest in organizational theory (Turner et al., 2013; Stettner and Lavie, 2014; Wamba et al., 2020). The concept refers to firm's efforts to refine/extend its existing resources and to develop new SC competencies and yield performance benefits, especially for large manufacturing firms (Kristal et al., 2010; Aoki and Wilhelm, 2017; Partanen et al.,2020). Kristal et al. (2010) proposed that SC ambidexterity should be based on the implementation practices exploiting existing or new knowledge. Rojo et al. (2016) argued that the concept helps firms achieve flexibility, and enhanced performance. Aslam et al. (2018) stated that SC ambidexterity requires firms to be both agile in responding to short-term changes, as well as highly efficient in
6
the long term. Organizational ambidexterity uses existing capabilities and strategic information flow to discover new opportunities (Partanen et al.,2020). Thus, there is consensus among researchers that ambidexterity entails sustaining firm competitive advantage considering both present and future performance.
Studies have measured the ambidexterity (Junni et al., 2013; Salvador et al., 2014; Zhao et al., 2021; Syed et al., 2020). Chandrasekaran et al. (2012) reported that both decision risk and alignment capabilities imitate ambidexterity proficiency at the firm level. Salvador et al. (2014) found product configuration ambidexterity influences the industrial equipment manufacturing through sales responsiveness and operating cost. Venugopal et al. (2020) revealed organizational ambidexterity is considerably affected by the top management team behavioral integration and their innovation practical choices. Syed et el. (2020) resolved the information technology ambidexterity inconsistencies and proposed that firms control these inconsistencies to develop their ambidexterity capability. Zhao et al. (2021) based on social exchange theory and transaction cost to inspect the second-order social capital impacts on the green innovation, aside from the role of governance ambidexterity. However, empirical ambidexterity study is still scarce, especially at the SC level. The SC resources require better utilization, while studies on the necessary capabilities to develop competency ambidexterity is limited (Hodgkinson et al., 2014; Turner et al., 2013, 2015; Sahi et al., 2020).
2.1. Organizational ambidexterity exploration and exploitation
The literature conceptualizes the ambidexterity into two perspectives, combined and balanced of exploitation and exploration (Cao et al., 2009; He and Wong, 2004). Patel et al. (2012) defined organizational ambidexterity as an operational synchronized component pursuit by exploration and exploitation. Particularly, exploitation objectives to enhance the existing materials or technologies, while the exploration is to collect and diverse new information and knowledge to systematized organizations (Guan and Liu, 2016; Lavie et al., 2010; Phelps, 2010; Yan and Guan, 2018). The researchers have designedly preferred to assess the combined effect of exploration and exploitation on firm performance (Uotila et al., 2009; Gualandris et al., 2018; Bravo et al., 2018). Sahi et al. (2020) measure the strategic orientation effects, such as market and business tactical positionings, on operational exploitational and explorational ambidexterity for improving business performance. The study found that small and medium firms’ entrepreneurial and market orientations has greater prominence on explorative operational activities, and exploitative operational activities has high impacts on entrepreneurial orientation. Gomes et al. (2020) studied how ambidextrously exploitational and explorational quality management supports to production environmental sustainability development. The study offers evidence to quality management ambidexterity, the quality exploitation and exploration synchronized practices, is a vital environmentally sustainable production element to improve organizational ambidexterity capabilities and achieve sustainability goals.
In contrast, firms can develop the ambidexterity by attaining and sustaining a balance between (1) exploitation, such as exploit value from resources, existing markets, and competency, to guarantee contemporary practicality; and (2) exploration, such as explore new products, markets, and opportunities, to warrant future feasibility (Guan and Liu,
7
2016;Khan et al., 2019; Phelps, 2010; Sahi et al., 2020; Wang et al., 2014; Yan and Guan, 2018). Balanced ambidexterity is pursued in an impartial means. Kristal et al. (2010) measured the exploitation and exploration complementary and supported a balance between two with constructive possessions on business performance. However, it is argued there is pressure between exploitation and exploration valuable ground found in environmental sustainability since ambidextrous operations require cross-border decision strategies to deal with the external environment changes with the internal resources and capabilities supports. Gualandris et al. (2018) claimed small firms are better with enhanced exploration rather than balancing the two dimensions in rapidly changing SC environment with technologies, policies, and market requirements. Zhao et al. (2021) argued that exploratory innovation not only reserves and enriches the existing knowledge, but also generates new materials or technologies compared with the exploitative innovation. The resources switching from exploitation to exploration and reverse might threaten the firms’ operational functions (Sahi et al., 2020). It is critical for researchers to scrutinize the antecedent’s effects and of different ambidexterity outcomes. Understanding managerial perspective on how to control exploration and exploitation-based to optimize profitability is remained as an uncertain milieu and limiting resources utilization. The limited resources, skills and capabilities, the pressure that between exploration and exploitation has established a challenge to proper balance the two dimensions for better SSCM performance.
2.2. Supply chain disruption and organizational ambidexterity towards sustainability
Sustainable production and consumption complex transformations is requiring firms to instantaneously push them to change from traditional operation to incrementally increasing to a more disruptive adaptation approach (Gualandris et al., 2018). The organizational ambidexterity is argued to be capable for firms to efficiently control current business demands while fundamentally being adaptive to changes to develop the sustainable SC systems (Hajli et al., 2020; Gomes et al., 2020; Parast, 2020; Syed et al., 2020; Yu et al., 2019). Firms must decide interpreting with most beneficial relationships to recovery in the face of disruption and difficulty. Having strategic inter-sectional and inter-organizational bonds within supply chains is important (Capaldo, 2007; Gölgeci and Kuivalainen, 2020).
Prior studies have compared the ambidexterity effects on varied measures such as firm performance, supply chain competence, supplier product innovation, cooperative innovation, helping firms to create advantageous environments (Cao et al., 2009; Gualandris et al., 2018; Bravo et al., 2018; Wang et al., 2018; Crescenzi and Gagliardi, 2018). Ponis and Koronis (2012) examined the SC network proactive plan and design ability to predict unexpected disruptive events, and adaptively respond to, while preserving the SC structure and function, and exceeding to a post operations-robust stage. Alamerew and Brissaud (2020) explored the system dynamics using TBL aspects from a close-loop SC to grants a complex systemic model of reverse logistics to recover end-of-life products based on cost, revenue, regulatory, and strategic decisions; and proposed that researchers, practitioners, policy makers need to improve their knowledge sharing among the main CE pillars and the strengthen the interaction among numerous decision factors. Essuman et al. (2020) developed the operational resilience notion and
8
investigated its effects on operational efficiency under different operational disruptive situations and found both disruption absorption and recoverability have positive relationship to operational efficiency. Fattahi et al. (2020) provides a stochastic optimization of disruption drives on SC network design to measures the expected SC’s surplus cost with new resilience metric that quickly and effectively forms the SC back to its original or even more desirable state after the disruption and during its recovery phase. Shekarian et al. (2020) determined the flexibility and agility impacts on the relationship between three objective functions including risk, responsiveness, and cost of new and seasonal products on of disruptions mitigation.
Munir et al. (2020) built upon the information process and explored the association
between SC integration and risk management to improve operational performance during
unexpected disruptions and uncertain changing of business environments. The study
suggested the internal, SC integration positively effects the risk management, while the
internal integration impacts is moderately mediated by supplier and customer integration
and fully mediates the operational performance and SC association. Hajli et al. (2020)
explored the inter-relationships among data analysis instruments and its effectiveness to
customer agility and new product success. The study provided significant theoretical
contributions by demonstrating the role of big-data aggregation tools, big-data analytics,
organizational negligent, customer agility, and environmental instability in new product
success. Parast (2020) examined firm’s research-and-development investment effects on
easing SC disruptions using four disruption risks categories including process, supply,
demand, and environmental. The study found the investment possibly improves the
firm’s resilience capability and significantly reduce the process, supply, demand, and
environmental disruption effects on initial firm and SC performance.
Still, there are only few studies have explored the ambidexterity dimensions impact
on firm financial performance (Enke and Bausch, 2013; Kerry and DeSimone, 2019;
Venugopal et al., 2020). Researchers have scrutinized ventured ambidexterity measures
but ignores with the mutual reinforced indicators and fail to discover their influences on
financial performances (Kerry & DeSimone, 2019). Besides, inactive procedures, such as
overloaded with social capital burdens, can limit the information processing, and over-
commitment to conventional relationships resulting in structural modifications delay and
disrupt the social capital positive use that affected and harm disruptions resistant (Pillai
et al., 2017). Even though, the literature has revealed the mixed findings between firm
performance and different SC disruption scenarios and organizational ambidexterity
association (Devaraj et al., 2007; Koufteros et al., 2005); there are limited studies
investigated the role of ambidexterity in the sustainable production systems
development effects an organization's performance measurement, and also on the
circumstances that firms benefits from (Gualandris et al., 2018; Bravo et al., 2018).
Despite the prior studies has observed the detail ambidexterity concurrences and offered
substitute to the SC progressive clarifications, studies scrutinizing the firm’s balanced
ambidexterity performance are underdeveloped such as practicing SC management
9
required inputs to avoid redundancy in SC network structure. A systematic review is
needed to organize state-of-the-art SSCM work and detect new directions and potential
opportunities in the aforementioned studies. The SSCM towards disruption and
organizational ambidexterity main indicators are determine, their description and related
studies are addressed (as in Table 3).
3. Data collection and methodology
The proposed analysis steps are presented in this section, offering a clear explanation of the data collection process, content and bibliometric analyses, FDM, EWM, and FDEMATEL.
3.1. Proposed method and analysis steps
In the literature, Gómez-Luciano et al. (2018) used value chain methodology to review the theoretical foundation and literature of the supply markets and globalization linkages. Ciccullo et al. (2018) apply the meta-synthesis to summarize and cumulate the integration of agile, lean, and SSCM models toward the environmental and social sustainability for literature review. Bastas and Liyanage (2018) conducted a thematic analysis to study the sustainable SC quality management state-of-the-art by integrating intra-organizational emphasis inter-organizational assessment. However, those methods are lacking empirical evidence support making the result may become selective bias and the ambiguity from inferred literature and authors’ intention (Ciccullo et al., 2018; Gómez-Luciano et al., 2018). Considering the literature as a big-data source, there are lack of big-data assessment on multi-attribute decision making to enrich the SSCM (Tseng et al., 2019). an integral data-driven solution must be addressed to accomplish higher efficiency and effectiveness (Tseng et al., 2018b). Prior studies have discovered the of big data components for building the SSCM (Akter et al., 2016; Zhan and Tan, 2020). Maroufkhani et al., (2020) proposed a data-driven analysis to obtain the technological-organizational-environmental paradigm to implement the lessening resource utilization and emission reduction solutions in SSCM systems. Majeed et al. (2021) developed a modeling structure by uniting big data analytics to additive manufacturing, and sustainable smart manufacturing technologies which is advantageous to the additive manufacturing initiatives. Due to the uncertainty and complexity of SSCM, this study proposed a hybrid multi-
attribute decision making approach including data-driven analysis, the FDM, the EWM
and FDEMATEL. The data-driven analysis combines the content analysis and bibliometric
analysis to employing data and categorize the review process. The FDM is used to refine
and validate the indicators by computing their perception levels from the experts’
linguistic references (Tseng and Bui, 2017). The EWM is used to convert the indicator
occurrence information into comparable weights to determine the indicator’s
performance among regions (Tseng, 2017). The Fuzzy DEMATEL method is used to
identify human perceptions of linguistic preferences and the important indicators that
require urgent focus for further study to improve SSCM (Tseng et al., 2018a). This study
offers a literature review, identifies indicators for the improvement of future studies and
10
provides differences in state-of-the-art regional SSCM toward disruption and
ambidexterity. A committee of 30 experts was approached to guarantee the reliability of
the analytical procedures. The committee was gathered among scholars and
professionals with at least 8 years of experience and studying working in SSCM, including
12 experts from academia, 8 experts from government offices and non-government
organizations, and 10 experts from the practical field (show in Appendix A).
The analysis steps are proposed as follows: (1) A feasible search term is identified for deductive coding - content analysis to
collect the publication information from the Scopus database. (2) Bibliographic analysis is conducted by adopting VOSviewer software to identify
the SSCM indicators in disruption and ambidexterity, nations coupling and regional categorize are generated from the database.
(3) The experts’ evaluation on proposed indicators is conducted using the questionnaire. The FDM is used to screen out the invalid indicators.
(4) The indicators’ frequency is generated by conducting the inductive coding - content analysis, and the EWM is adopted to translate the indicators’ entropy into comparable scales to specify the regional comparison.
(5) The important indicators for each region and the overall scenario are identified using the fuzzy DEMATEL to scrutinize the future study gaps.
The analysis processes are presented in Figure 1. INSERT Figure 1 HERE - Analytical procedure
3.2. Data collection
Prior studies have approached a literature review on SSCM by employing data from Dialnet Plus, Arts and Humanities Citation Index, JSTOR Archival Journals, Proquest, PLoS, ScienceDirect, Business SourcePremier, Emerald Journals, Science Citation Index, and Social Sciences Citation Index (Koberg and Longoni, 2019; Rebs et al., 2019). However, these databases conceal a smaller group of publications. This study engages to the Scopus database due to its broader publication array and more related bibliometric outline (Jin et al., 2018). The database offers wide coverage of peer-reviewed academic literature, such as social sciences, engineering, and scientific journals, books and conference proceedings; including title, abstract, keywords, author, author affiliation, publication time, citation record, and country identifications.
3.3. Content analysis
Content analysis, as a tool to study documents and communication objects based on systematic reading or observation of texts or artifact (Hodder, 1994), is used to check for regional consistency of independent coding in counting indicator frequencies of each specific region by searching in the regional data generated from the Scopus database. The technique offers reproducible and laborious literature reviews to investigate the documents distribution (Seuring and Gold, 2012). The method is to intensely define the features of the full-text articles through compacting sizable of texts and words into
11
predefined and much smaller categories (Horne et al., 2020; Vaismoradi et al., 2013). Bhatt et al (2020) has apply bibliometrics and content analysis for developing the intellectual structure of sustainable manufacturing literature. Thomé et al. (2020) used the method to determine and illustrate the co-occurrence conceptual framework of food SCs and short food SCs, at odds with the current divergence of the literature approaches. Based on text mining to classify constructive information in textual data (Zanjirchi et al., 2019), content analysis is an essential step to assess a high volume of data in a structured and systematic approach by precisely capture relevant information to identify valuable topics, methods and themes with manual approaches(Gao et al., 2020; Kazemi et al., 2019).
There are two types of content analysis coding: inductive and deductive coding (Seuring and Gold, 2012). The deductive type conducts the coding before the data evaluation and determine the analytic categories centering on the study proposed. The inductive coding is naturally obtained the analytic categories from the data during the review process. This study first using the deductive method to predefined search terms used to drive SSCM literature on disruption and ambidexterity from Scopus databased. Since the great disruption in 2008 creates real challenges on focused execution, there has been growing body of SSCM literature on disruption and ambidexterity. The search boundary was established to publications within 11 years, from 2008 to 2020 (searching date is May 4th, 2020) and limited to English-language articles and reviews. The search terms used were “("supply chain") and ("ambidexterity" or "disrupt*" or "crisis" or "crises" or "chaos" or "interrupt*")” generating in titles, abstracts, or keywords. Following, the inductive type is applied by using bibliometric analysis to identify by code-wording from literature review.
3.4. Bibliometric analysis
The bibliometric analysis is a quantitative method to accomplish a visual illustration of accumulative literature by providing scientific mapping and other repetitions (Zupic and Cater, 2015). This study performs a bibliometric analysis using VOSviewer version 1.6.11, open source software to scientifically categorize documents with similar connotation into the same cluster to define their relationships (Eck and Waltman, 2018). In the SC context, Feng et al. (2017) used this software to acquire a bibliometric literature review of corporate social responsibility. Wang et al. (2019) used VOSviewer to reveal gaps and opportunities for future investigation in off-site construction. These papers illustrate the usefulness of VOSviewer and is the basis for its selection in this review.
.
3.5. Fuzzy Delphi method
This study combines the fuzzy set theory and the Delphi method to help address the lack of expert references and to improve questionnaire quality (Ishikawa et al. 1993). It is used to refine the valid indicators based on experts’ linguistic perceptions (Bui et al., 2020). The method can transform their fuzzy assessment into fuzzy numbers efficiently.
In the analytical process, assume that there are 𝑛 experts and 𝑚 indicators. Expert 𝑎 has to evaluate the prominence of indicator 𝑏 as 𝑗 = (𝑥𝑎𝑏; 𝑦𝑎𝑏; 𝑧𝑎𝑏), 𝑎 = 1,2,3, … , 𝑛 ; 𝑏 = 1,2,3, … , 𝑚 , where the 𝑗𝑏 weight of 𝑏 denotes as 𝑗𝑏 = (𝑥𝑏; 𝑦𝑏; 𝑧𝑏) with 𝑥𝑏 =
12
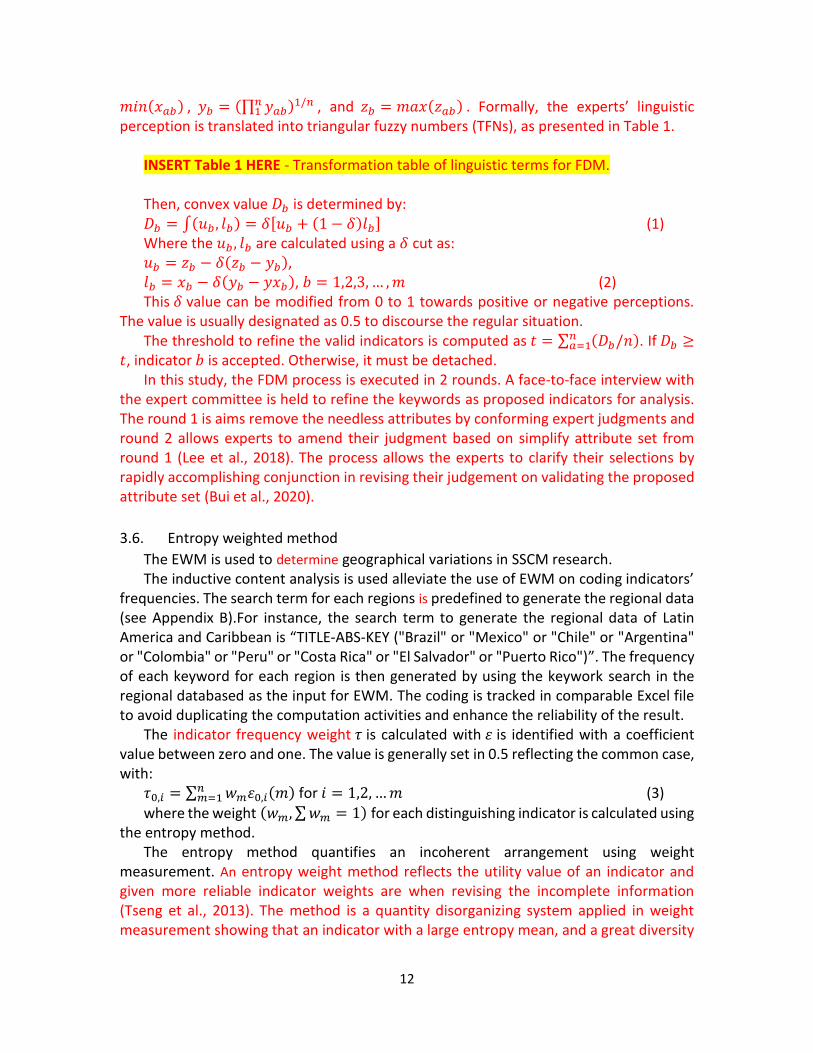
𝑚𝑖𝑛(𝑥𝑎𝑏) , 𝑦𝑏 = (∏ 𝑦𝑎𝑏𝑛1 )1/𝑛 , and 𝑧𝑏 = 𝑚𝑎𝑥(𝑧𝑎𝑏) . Formally, the experts’ linguistic
perception is translated into triangular fuzzy numbers (TFNs), as presented in Table 1.
INSERT Table 1 HERE - Transformation table of linguistic terms for FDM.
Then, convex value 𝐷𝑏 is determined by: 𝐷𝑏 = ∫(𝑢𝑏 , 𝑙𝑏) = 𝛿[𝑢𝑏 + (1 − 𝛿)𝑙𝑏] (1) Where the 𝑢𝑏 , 𝑙𝑏 are calculated using a 𝛿 cut as: 𝑢𝑏 = 𝑧𝑏 − 𝛿(𝑧𝑏 − 𝑦𝑏), 𝑙𝑏 = 𝑥𝑏 − 𝛿(𝑦𝑏 − 𝑦𝑥𝑏), 𝑏 = 1,2,3, … , 𝑚 (2) This 𝛿 value can be modified from 0 to 1 towards positive or negative perceptions.
The value is usually designated as 0.5 to discourse the regular situation. The threshold to refine the valid indicators is computed as 𝑡 = ∑ (𝐷𝑏/𝑛)𝑛
𝑎=1 . If 𝐷𝑏 ≥𝑡, indicator 𝑏 is accepted. Otherwise, it must be detached.
In this study, the FDM process is executed in 2 rounds. A face-to-face interview with the expert committee is held to refine the keywords as proposed indicators for analysis. The round 1 is aims remove the needless attributes by conforming expert judgments and round 2 allows experts to amend their judgment based on simplify attribute set from round 1 (Lee et al., 2018). The process allows the experts to clarify their selections by rapidly accomplishing conjunction in revising their judgement on validating the proposed attribute set (Bui et al., 2020).
3.6. Entropy weighted method
The EWM is used to determine geographical variations in SSCM research. The inductive content analysis is used alleviate the use of EWM on coding indicators’
frequencies. The search term for each regions is predefined to generate the regional data (see Appendix B).For instance, the search term to generate the regional data of Latin America and Caribbean is “TITLE-ABS-KEY ("Brazil" or "Mexico" or "Chile" or "Argentina" or "Colombia" or "Peru" or "Costa Rica" or "El Salvador" or "Puerto Rico")”. The frequency of each keyword for each region is then generated by using the keywork search in the regional databased as the input for EWM. The coding is tracked in comparable Excel file to avoid duplicating the computation activities and enhance the reliability of the result.
The indicator frequency weight 𝜏 is calculated with 휀 is identified with a coefficient value between zero and one. The value is generally set in 0.5 reflecting the common case, with:
𝜏0,𝑖 = ∑ 𝑤𝑚휀0,𝑖(𝑚)𝑛𝑚=1 for 𝑖 = 1,2, … 𝑚 (3)
where the weight (𝑤𝑚, ∑ 𝑤𝑚 = 1) for each distinguishing indicator is calculated using the entropy method.
The entropy method quantifies an incoherent arrangement using weight measurement. An entropy weight method reflects the utility value of an indicator and given more reliable indicator weights are when revising the incomplete information (Tseng et al., 2013). The method is a quantity disorganizing system applied in weight measurement showing that an indicator with a large entropy mean, and a great diversity
13
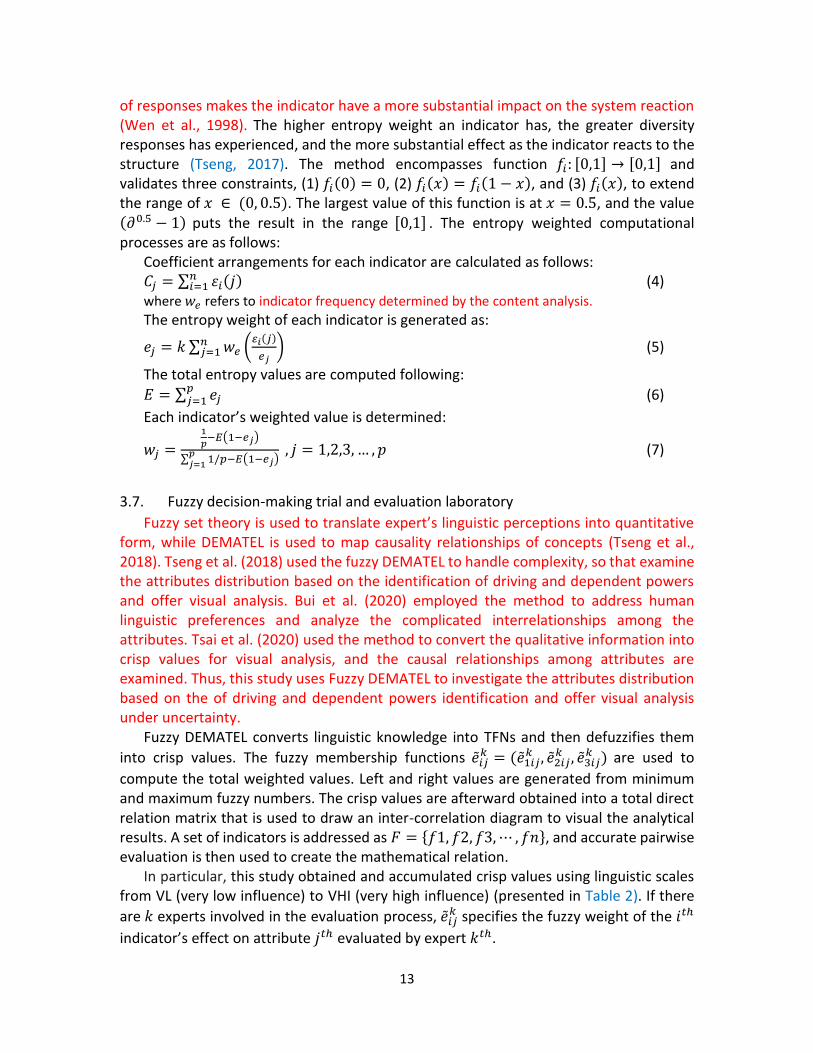
of responses makes the indicator have a more substantial impact on the system reaction (Wen et al., 1998). The higher entropy weight an indicator has, the greater diversity responses has experienced, and the more substantial effect as the indicator reacts to the structure (Tseng, 2017). The method encompasses function 𝑓𝑖: [0,1] → [0,1] and validates three constraints, (1) 𝑓𝑖(0) = 0, (2) 𝑓𝑖(𝑥) = 𝑓𝑖(1 − 𝑥), and (3) 𝑓𝑖(𝑥), to extend the range of 𝑥 ∈ (0, 0.5). The largest value of this function is at 𝑥 = 0.5, and the value (𝜕0.5 − 1) puts the result in the range [0,1] . The entropy weighted computational processes are as follows:
Coefficient arrangements for each indicator are calculated as follows: 𝐶𝑗 = ∑ 휀𝑖(𝑗)𝑛
𝑖=1 (4) where 𝑤𝑒 refers to indicator frequency determined by the content analysis. The entropy weight of each indicator is generated as:
𝑒𝑗 = 𝑘 ∑ 𝑤𝑒 (𝜀𝑖(𝑗)
𝑒𝑗)𝑛
𝑗=1 (5)
The total entropy values are computed following:
𝐸 = ∑ 𝑒𝑗𝑝𝑗=1 (6)
Each indicator’s weighted value is determined:
𝑤𝑗 =
1
𝑝−𝐸(1−𝑒𝑗)
∑ 1/𝑝𝑝𝑗=1
−𝐸(1−𝑒𝑗) , 𝑗 = 1,2,3, … , 𝑝 (7)
3.7. Fuzzy decision-making trial and evaluation laboratory
Fuzzy set theory is used to translate expert’s linguistic perceptions into quantitative form, while DEMATEL is used to map causality relationships of concepts (Tseng et al., 2018). Tseng et al. (2018) used the fuzzy DEMATEL to handle complexity, so that examine the attributes distribution based on the identification of driving and dependent powers and offer visual analysis. Bui et al. (2020) employed the method to address human linguistic preferences and analyze the complicated interrelationships among the attributes. Tsai et al. (2020) used the method to convert the qualitative information into crisp values for visual analysis, and the causal relationships among attributes are examined. Thus, this study uses Fuzzy DEMATEL to investigate the attributes distribution based on the of driving and dependent powers identification and offer visual analysis under uncertainty.
Fuzzy DEMATEL converts linguistic knowledge into TFNs and then defuzzifies them
into crisp values. The fuzzy membership functions �̃�𝑖𝑗𝑘 = (�̃�1𝑖𝑗
𝑘 , �̃�2𝑖𝑗𝑘 , �̃�3𝑖𝑗
𝑘 ) are used to
compute the total weighted values. Left and right values are generated from minimum and maximum fuzzy numbers. The crisp values are afterward obtained into a total direct relation matrix that is used to draw an inter-correlation diagram to visual the analytical results. A set of indicators is addressed as 𝐹 = {𝑓1, 𝑓2, 𝑓3, ⋯ , 𝑓𝑛}, and accurate pairwise evaluation is then used to create the mathematical relation.
In particular, this study obtained and accumulated crisp values using linguistic scales from VL (very low influence) to VHI (very high influence) (presented in Table 2). If there
are 𝑘 experts involved in the evaluation process, �̃�𝑖𝑗𝑘 specifies the fuzzy weight of the 𝑖𝑡ℎ
indicator’s effect on attribute 𝑗𝑡ℎ evaluated by expert 𝑘𝑡ℎ.
14
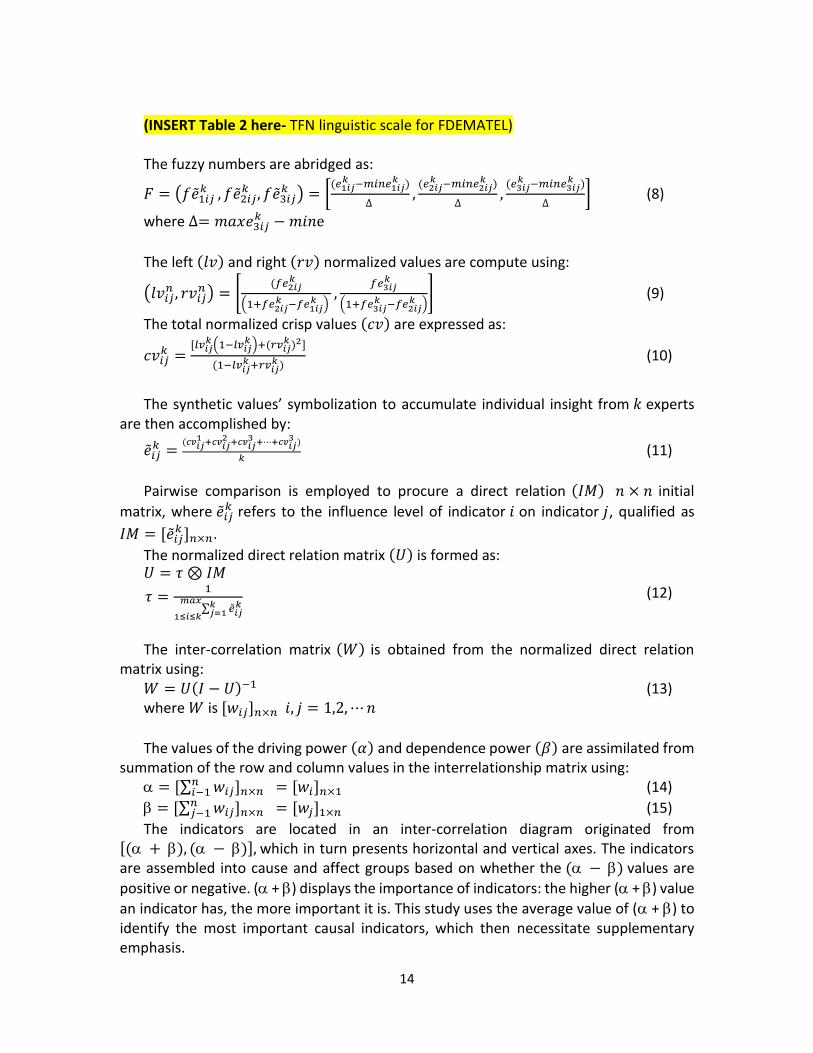
(INSERT Table 2 here- TFN linguistic scale for FDEMATEL) The fuzzy numbers are abridged as:
𝐹 = (𝑓�̃�1𝑖𝑗 𝑘 , 𝑓�̃�2𝑖𝑗
𝑘 , 𝑓�̃�3𝑖𝑗𝑘 ) = [
(𝑒1𝑖𝑗𝑘 −𝑚𝑖𝑛𝑒1𝑖𝑗
𝑘 )
∆ ,
(𝑒2𝑖𝑗𝑘 −𝑚𝑖𝑛𝑒2𝑖𝑗
𝑘 )
∆,
(𝑒3𝑖𝑗𝑘 −𝑚𝑖𝑛𝑒3𝑖𝑗
𝑘 )
∆] (8)
where ∆= 𝑚𝑎𝑥𝑒3𝑖𝑗𝑘 − 𝑚𝑖𝑛e
The left (𝑙𝑣) and right (𝑟𝑣) normalized values are compute using:
(𝑙𝑣𝑖𝑗𝑛 , 𝑟𝑣𝑖𝑗
𝑛 ) = [(𝑓𝑒2𝑖𝑗
𝑘
(1+𝑓𝑒2𝑖𝑗𝑘 −𝑓𝑒1𝑖𝑗
𝑘 ) ,
𝑓𝑒3𝑖𝑗𝑘
(1+𝑓𝑒3𝑖𝑗𝑘 −𝑓𝑒2𝑖𝑗
𝑘 )] (9)
The total normalized crisp values (𝑐𝑣) are expressed as:
𝑐𝑣𝑖𝑗𝑘 =
[𝑙𝑣𝑖𝑗𝑘 (1−𝑙𝑣𝑖𝑗
𝑘 )+(𝑟𝑣𝑖𝑗𝑘 )2]
(1−𝑙𝑣𝑖𝑗𝑘 +𝑟𝑣𝑖𝑗
𝑘 ) (10)
The synthetic values’ symbolization to accumulate individual insight from 𝑘 experts
are then accomplished by:
�̃�𝑖𝑗𝑘 =
(𝑐𝑣𝑖𝑗1 +𝑐𝑣𝑖𝑗
2 +𝑐𝑣𝑖𝑗3 +⋯+𝑐𝑣𝑖𝑗
3 )
𝑘 (11)
Pairwise comparison is employed to procure a direct relation (𝐼𝑀) 𝑛 × 𝑛 initial
matrix, where �̃�𝑖𝑗𝑘 refers to the influence level of indicator 𝑖 on indicator 𝑗, qualified as
𝐼𝑀 = [�̃�𝑖𝑗𝑘 ]𝑛×𝑛.
The normalized direct relation matrix (𝑈) is formed as: 𝑈 = 𝜏 ⊗ 𝐼𝑀
𝜏 =1
∑ �̃�𝑖𝑗𝑘𝑘
𝑗=11≤𝑖≤𝑘
𝑚𝑎𝑥 (12)
The inter-correlation matrix (𝑊) is obtained from the normalized direct relation
matrix using: 𝑊 = 𝑈(𝐼 − 𝑈)−1 (13) where 𝑊 is [𝑤𝑖𝑗]𝑛×𝑛 𝑖, 𝑗 = 1,2, ⋯ 𝑛
The values of the driving power (𝛼) and dependence power (𝛽) are assimilated from
summation of the row and column values in the interrelationship matrix using: = [∑ 𝑤𝑖𝑗
𝑛𝑖−1 ]𝑛×𝑛 = [𝑤𝑖]𝑛×1 (14)
= [∑ 𝑤𝑖𝑗𝑛𝑗−1 ]𝑛×𝑛 = [𝑤𝑗]1×𝑛 (15)
The indicators are located in an inter-correlation diagram originated from [( + ), ( − )], which in turn presents horizontal and vertical axes. The indicators are assembled into cause and affect groups based on whether the ( − ) values are
positive or negative. ( + ) displays the importance of indicators: the higher ( + ) value
an indicator has, the more important it is. This study uses the average value of ( + ) to identify the most important causal indicators, which then necessitate supplementary emphasis.
15
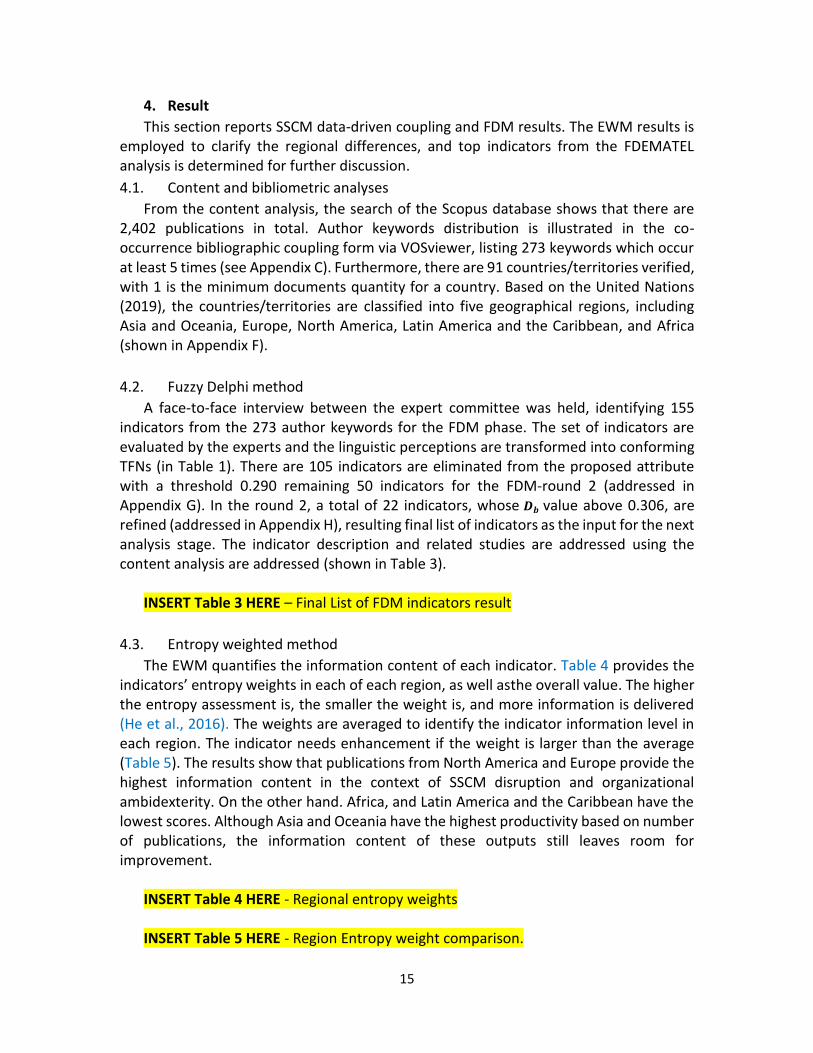
4. Result
This section reports SSCM data-driven coupling and FDM results. The EWM results is employed to clarify the regional differences, and top indicators from the FDEMATEL analysis is determined for further discussion.
4.1. Content and bibliometric analyses
From the content analysis, the search of the Scopus database shows that there are 2,402 publications in total. Author keywords distribution is illustrated in the co-occurrence bibliographic coupling form via VOSviewer, listing 273 keywords which occur at least 5 times (see Appendix C). Furthermore, there are 91 countries/territories verified, with 1 is the minimum documents quantity for a country. Based on the United Nations (2019), the countries/territories are classified into five geographical regions, including Asia and Oceania, Europe, North America, Latin America and the Caribbean, and Africa (shown in Appendix F).
4.2. Fuzzy Delphi method
A face-to-face interview between the expert committee was held, identifying 155 indicators from the 273 author keywords for the FDM phase. The set of indicators are evaluated by the experts and the linguistic perceptions are transformed into conforming TFNs (in Table 1). There are 105 indicators are eliminated from the proposed attribute with a threshold 0.290 remaining 50 indicators for the FDM-round 2 (addressed in Appendix G). In the round 2, a total of 22 indicators, whose 𝑫𝒃 value above 0.306, are refined (addressed in Appendix H), resulting final list of indicators as the input for the next analysis stage. The indicator description and related studies are addressed using the content analysis are addressed (shown in Table 3).
INSERT Table 3 HERE – Final List of FDM indicators result
4.3. Entropy weighted method
The EWM quantifies the information content of each indicator. Table 4 provides the indicators’ entropy weights in each of each region, as well asthe overall value. The higher the entropy assessment is, the smaller the weight is, and more information is delivered (He et al., 2016). The weights are averaged to identify the indicator information level in each region. The indicator needs enhancement if the weight is larger than the average (Table 5). The results show that publications from North America and Europe provide the highest information content in the context of SSCM disruption and organizational ambidexterity. On the other hand. Africa, and Latin America and the Caribbean have the lowest scores. Although Asia and Oceania have the highest productivity based on number of publications, the information content of these outputs still leaves room for improvement.
INSERT Table 4 HERE - Regional entropy weights INSERT Table 5 HERE - Region Entropy weight comparison.
16
4.4. Fuzzy decision-making trial and evaluation laboratory
From the FDM results, the committee evaluated the indicators’ inter-correlation using the provided linguistic scales as in Table 2. The fuzzy direct relation matrix and the defuzzification are converted into the crisp value to generate the initial direction matrix using average technique (see Table 6). The total inter-correlation matrix is created (see Table 7), representing the inter-correlation among the indicators (shown in Table 8). Figure 2 illustrates the inter-correlation diagram of the regions based on (𝛼 + 𝛽) and (𝛼 − 𝛽) cuts. The average value of ( + ) is used to classify the top important causing indicators that need to be concentrated.
The differences between regions are reported. Specifically, the important indicators for Asia and Oceania consist of SC agility (I8), SC coordination (I11), SC finance (I14), SC flexibility (I15), SC resilience (I18), uncertainty (I22). For European region, such important indicators are SC agility (I8), SC coordination (I11), SC finance (I14), SC flexibility (I15), supply chain network design (SCND) (I17), sustainability (I21). For North America regions, the important indicators SC agility (I8), SC coordination (I11), SC flexibility (I15), SCND (I17), SC resilience (I18), sustainability (I21). The Latin American and Caribbean focuses on SC agility (I8), SC finance (I14), SC flexibility (I15), sustainability (I21), uncertainty (I22). While SC coordination (I11), SC finance (I14), SC flexibility (I15), SC resilience (I18), sustainability (I22) are Africa regions’ important indicators.
Overall, the top important indicators in this study are SC agility (I8), SC coordination (I11), SC finance (I14), SC flexibility (I15), SC resilience (I18), sustainability (I21), venerating to continuous responses in the system, which are considered as critical study trends to approach SSCM toward disruption and ambidexterity.
INSERT Table 6 HERE – Overall initial direction matrix
INSERT Table 7 HERE – Overall total inter-correlation matrix) INSERT Table 8 HERE - Causal inter-correlation among indicators.) INSERT Figure 2 HERE - Causal inter-correlation of indicators among regions)
5. Discussions
Future study trends and challenges and the implications for regional state-of-the-art
SSCM in disruption and ambidexterity are discussed in this section.
5.1. Study trends and future challenges
This study has identified the top indicators of SSCM trends towards disruption
resilience and organizational ambidexterity as follows: SC agility, SC coordination, SC
finance, SC flexibility, SC resilience, sustainability. These indicators play an essential role
in identifying future priorities.
17
5.1.1. Supply chain agility
The concept of SC agility shows an emergent compromise of emphasizing on firms’
ability to quickly sense and respond to unplanned market fluctuations, such as reduce
production cycle or total lead time, growth of invention customization level or customer
service, changing in delivery, and responsiveness reliability toward market place (Alfalla-
Luque et al., 2018; Blome et al., 2013; Eckstein et al., 2015; Lim et al., 2017). The indicator
refers to the capability to deal with unexpected short-term, temporary changes as well as
to rapidly acclimatize to those changes in SC and market environment (Aslam et al., 2018;
Eckstein et al., 2015). It is essential to a firm’s survivability through the capability to find
opportunities in unforeseen circumstances (Kale et al., 2019). Agile firms can rapidly
reconfigure and respond to changes in market demand, and thus improve the
responsiveness of their SC (Shekarian et al, 2020).
SC agility has been expansively studied and allied to organizational performance, thus,
increase sustainability outcomes. Prior studies have recognized that agile ability have
positive effects on financial performance and operational measures (Eckstein et al., 2015;
Tse et al., 2016). Information technology can be utilized help to optimize firm agility and
profitability to establish sustainable SC practices (Yusuf et al., 2020). SC agility helps to
cope with demand in the absence of capability to reduce unsustainable initiatives (Wu et
al., 2016). However, the leading role of agility in promoting sustainability is not
comprehensively understood. The potential indicators of social and environmental
sustainability, as well as their interactive possessions have yet not been explored. Agility
metrics require future integration into sustainability aspects. Data mining and analytics
can be used to achieve competitive advantage through sustainable agility (Ciccullo et al.,
2018; Chen et al., 2017, Kitchens et al., 2018). Implementing sustainability is difficult
without knowledge of SC stakeholders’ perspectives (Gunasekaran et al., 2019).
Upstream and downstream collaboration is needed to ensure alignment of the goals of
SC players (Gligor, 2014; Wu et al., 2017). However, there is still lack of empirical study
examining the influence of SC agility on the sustainable performance of firms.
SSCM in the face of disruption risk has been the subject of growing research interest (Parast et al., 2019; Ho et al., 2015; Gligor et al., 2015). Interplay of the key factors to enhance agility performance within these disruption scenarios is still not fully understood. Firms depend on their SC to remain competitive and agile in a fluctuating environment (Battistella et al., 2017; Yang, 2014). Dynamic capabilities are needed to improve agility performance and reduce risk (Jajja et al., 2018). Use of facilities which can be put into use immediately after interruption is also important (Chen et al., 2019). Thus, executing agility into account of SC disruption and ambidexterity in crisis given the cross functions and decision makers to facilitate the entire itinerary of sustainable recovery. Considering SC agility as a firm's inter- and intra-ability for achieving timely response to market changes as well as to potential and actual disruptions is needed.
18
5.1.2. Supply chain coordination
Coordination and synchronization among SC partners is a significant issue in business
(Hitt et al., 2016). The SC literately declares the effects of collaboration and integration
between suppliers and customers as coordination for firms to improve the ability to
successfully occupy with SC partners (Zhao et al., 2011; Munir et al., 2020). SC function
braces up as operational processes requires coordination and cooperation within the
organization and with external entities, including the connection to the customer (Ojha
et al., 2018). Coordination facilitates and ensures the efficient and effective flow of
information, material, other resources, and decision for maximizing production value,
given that firms substantially enhance integrating performance and identify opportunities
to achieve higher benefits (Chen et al., 2020a). However, greater coordination intensifies
more complexity and negative impacts as unavoidable coincidences or even interrupt the
SC (Munir et al., 2020). As the upstream usually espouses a conventional building capacity
policy to circumvent the demand uncertainty risk, the downstream has to face a lack of
supplies to satisfy the market demand, thereby reducing the total benefits of both
manufacturer and buyers, consequently results in a poor performance (Li et al., 2020).
Disruption is caused by accidents such as organization breakdowns, natural disasters,
or pandemics that constrain standard processes in SC, and incapable of synthesize
internal and external coordination to support SC (Wong et al., 2019). SC risk arises from
the disruption of materials, products, information, and financial flows which can disrupt
firms’ normal operations (Snediker et al., 2008; Munir et al., 2020). This remains as
fundamental managerial challenge that affects the organizational performance (Gölgeci
& Kuivalainen, 2020, Shekarian et al., 2020). This remains as fundamental managerial
challenge that affects the organizations performance and implements appropriate
coordination and collaboration strategies to manage their interorganizational
relationships (Gölgeci & Kuivalainen, 2020, Shekarian et al., 2020). To maintain the SSCM,
several coordination mechanisms are proposed to motivate the SC members. In SSCM,
multiple coordination mechanisms have been proposed for SC players. Collaborative
recovery capability based on the SC coordination mechanism was developed for
disruption management by Matsuo (2015). The use of information processing for risk
management was proposed to improve SC operational performance (Munir et al., 2020).
The complications of transboundary linkages in global SC was analyzed by Velter et al.
(2020). SC ambidexterity can be used to improve coordination efforts among multiple
stakeholders.
However, the coordination itself requires extra efforts in sustainability innovation
compared to traditional business model as successful alignment on both strategic and
normative dimensions (Breuer and Lüdeke-Freund, 2017; Geissdoerfer et al., 2018).
Strategic alignment with key SC partners needs to be spent more attentions to provide
the insights of suppliers’ capabilities, restrictions, and processes for effective forecasting
and planning, designing products over operational management. While alignment
19
between focal companies and stakeholders is deemed critical to solve such
sustainablization difficulties. For instance, the misalignment in information system would
distress the sustainability practices progress (Goni et al., 2017; Bocken et al., 2019;
Freudenreich et al., 2019). The distinct motives of different firms can lead to tensions
within the SC (Gölgeci et al., 2019).
There are existing gaps between organizations sustainability and the firm's
cooperation strategies and capabilities between the external environment and
operational processes (Amui et al.,2017; Heracleous & Werres, 2015). Firms need to
remobilize and allocate their resources and capabilities to implement sustainability
strategies as stakeholder requirements (Chowdhury et al., 2019). Study on how to handle
obstacles of deficient information technology integration, inadequate collaboration,
insufficient alliance is crucial (MacDonald and She, 2015; Wu et al., 2017). Supporting the
social perceptions and behavioral intentions, trust, and communication protocols among
the alignment connections to provide the necessary structural climate of effective
coordination are required. Since prior studies have shown the complex relationship exists
within the SC, salient network capabilities, collaborative proficiencies, and absorptive
capacity are crucial to achieving competitive advantage (Adams et al., 2012; Kauppila,
2015; Partanen et al; 2020).
5.1.3. Supply chain finance
The SC finance toward the sustainability is described as financial mechanism offers
such business transactions to minimize negative effects and generate more
environmental, social, and economic values (triple bottom line - TBL) for the SC (Business
for Social Responsibility, 2018). This is an approach for both up-and-downstream players,
and those third-party financial service providers, to produce additional benefits through
cooperate in monitoring, and developing the flow of financial resources within the SC
(Hofmann, 2005). The indicator is recognized to reduce operational costs and create more
profit for the SC members by improving financial performance and promote sustainability
(Dye and Yang, 2015; Gong et al.,2018). In practices, adopting the SC finance is
demonstrated to encourage the market exploitation and enhance financial performance,
afterward improving competitive advantage (Li and Chen, 2019). Multiple organizational
structures of purchasers collaborating with financial services providers for reverse
factoring, inventory financing, dynamic discounting, and purchase order to provide
liquidity suppliers is proposed (Caniato et al., 2016; Gelsomino et al., 2019). A partial
credit guarantee assessment targeting in minimizing the risk from market failure by
reducing financial loss are developed (Lu et al., 2019). However, there is limited in scope
since the SCF is considered as a financing tool only (Liu et al., 2015a; Chakuu et al., 2019).
This finance-oriented approaches normally concentrate on a narrow perception, and
unable to deliver high quality solutions to SCF problems.
20
Disruptions can cause financial damage for related firms, leading to substantial
financial lost and operational changing consequences that cost reputation and businesses
status or even bankrupt (Bode and Wagner, 2015; Dabhilkar et al., 2016). These disastrous
events are basically unforecastable due to limited cautionary and its impacts are difficult
to predict until the events occur (Wong et al., 2019). Firms with higher market power
likely to adore unchallenged leases, and any disruptions within the SC might threaten its
maintenance ability. If suppliers involve financial suffering due to the credit crisis and
struggle in fulfill market demands, they could suspend manufacture toward the SC and
harm to downstream firms (Gonçalves et al., 2018). Therefore, a SC finance-oriented
thought is that maintaining systematic payment term extensions against suppliers would
result in upstream SC disruptions and causing negative prevarications (Wetzel & Hofmann,
2019). Investing limited resources into uncertain projects may intensify the costs, lowers
success rates, and subsequently decreases firm performance (Song and Di Benedetto,
2008). Moreover, a strong alliance management capability is harmful for firms as they
begin to favor interorganizational exploitation over the exploration, which leads to
increased short-term financial performance but also decreases a firm's long-term growth
(Kauppila, 2015; Partanen et al., 2020). Overall, the economic shocks are via financial
markets making the SC finance become part of the problem of sustainability decline. This
seriously hit on confidence of both suppliers, buyers, and intermediate financial
institutions.
In contrast, empirical evidence shows that greater levels of disruption absorption and
recoverability generate an enhanced competitive advantage and financial performance
(Kwak et al., 2018; Wong et al., 2019; Yu et al., 2019). Though disruptions are unavoidable,
firms that nurture a strong SC disruption positioning are able to accomplish higher
financial benefits by enhancing the resiliency (Blackhurst et al., 2011; Hohenstein et al.,
2015). The crisis is argued to provide an exclusive gap in the non-financial firms’ behavior
investigation, which mainly rely on the frame of financial sector (Garcia-Appendini and
Montoriol-Garriga, 2013). SC finance sustainability also associates with the SC networks
that the financial metrics have a close integration to technical operations, data and
information exchange, and liquidity injections (Tseng et al., 2019). This progresses
investors’ confidence in future businesses since positive returns growth over operational
risks such as logistics jeopardies and disruption capacity result in the stock market
response towards the service providers is favorable (Lam et al., 2019).
the relationship between SC finance on SSCM towards disruption and ambidexterity
in crisis is remain unclear and needs for wider and deeper investigation. The conflictions
have shown that there is limited of study, which explained by fact that is a relatively new
concept and has yet to attract more attention. The theories and practices of finance flow
management SSCM are lagging behind the goods and information flow management
studies (Wang et al, 2019). The goods flow along SC may be interrupted if the financial
flow is not properly managed along the SC (Wuttke et al., 2013). The collaboration and
21
coordination among SC partners in finance flows, such as advance payment financing, are
suggested to be examined in future studies. Change in technology to empower SC
integration and innovation is argued as new resolutions field to enhance the SC finance
as there are plentiful opportunities to improve revenues through developing financial
flows such as digital technologies, the Internet of Things, cloud computing and big data,
blockchain (Chen et al., 2020b). Dealing with sharing knowledge and information
problems can be effective tools to control cash flow, share the financial risk and lower
financing cost within SC to unravel material inequalities and strengthen the financial
operational system. Learning from bankruptcy factors to proposed financial preparedness,
financial resilient ability to disruption must be emphasized as an important aspect of
SCCM. How to assurethe cash flow quality to help consumers to increase and re-claim
their trust to suppliers since they are unaware in production chain, itineraries, and threat
in manufacturing, inventory, and transportation and delivery in essential.
5.1.4. Supply chain flexibility
Flexibility is the capability to react to long-term or essential SC fluctuations or market
environment such as technological, ecological, demand and supply changes by adjusting
the SC configuration (Eckstein et al., 2015; Blome et al., 2014). It involves changes in the
orders time and quantity to suppliers, deviations in production volume, and in production
mix (Esmaeilikia et al., 2014; Swafford et al., 2008). SC flexibility requires flexibility at the
level of individual firms in the system (Duclos et al., 2003, Ngai et al., 2011). The concept
has dual functions, involving both reactive response to present changes and proactive
anticipation of future ones (Rojo et al., 2016). The construct encompasses (1) sourcing
flexibility, as the ability to obtain available materials and service in the fluctuating
conditions midst; (2) operating system flexibility, to offer products/services that have
sufficiently extensive variety so that any customer specifications can be satisfied; (3) the
distribution flexibility, as the organizational capability to proficiently accomplish the
inventory, loading, and distribution system, and other facilities and information system
to react quickly to changing conditions, especially those unexpected errors (Moon et al.,
2012). This has risen an increased motivation on the SCs contribution to the total
organization competitiveness, referring as the essential restrictions in business to
consider flexibility as discrete individual, rather than the interdependencies among SC
partners (Delic & Eyers, 2020).
SC flexibility is a relevant study topic in SC management, having this as a critical
indicator to achieve and unsure a sustainable competitive advantage in the current
dynamic, uncertain, and unpredictable environment (Mota et al., 2015; Burin et al., 2020).
Firms can achieve higher competitive advantages when its mix resources functions are
varied, precise, difficult to duplicate, to create greater value for customers than its rivals.
Enabling capabilities as potential distinction source that directly allied with the SC
flexibilities could create more advanced competitive advantages (Gosling et al., 2010;
Scavarda et al., 2010). For instances, flexible information technology can instantaneously
22
provide speedy outcomes to support sustainable growth in an intensively dynamic
environment, avoid influences on organizational performance by immobilizing the
organizational behavior patterns and monitoring that determinedly refrain the disruption
(Biloslavo et al., 2013). Competitive advantages are ensured through the available
resources control and acquisition, thus creating long-term sustainable performance (Chan
et al., 2017).
However, studies on SC flexibility role in diminishing SC risk have empirically been
scarce, making manufacturers struggles in incessant improvements in SC to minimize the
negative effects of product variety and customization on the performance of the SC (Um,
2017, Sreedevi & Saranga, 2017). Particularly, it is argued that to remain competitive,
firms are increasingly adopting strategies of exploration to seek new opportunities and
exploitation to utilize prevailing capabilities and resources (Aslam et al., 2018). Still, the
correlation between exploration and exploitation has not been clearly discussed.
Academics claim decision-makers often face trade-offs between efficiency and flexibility
giving partiality to one over the other is prejudicial (Wamba et al., 2020). Firms are argued
to engage in flexibility strategies and competence to develop an ambidexterity capability
(Ojha et al., 2018). The lack of integrated framework that be identical to diverse processes
of SC management and explains how flexibility affects firms’ performance have not yet to
be fulfill.
The process integration apprehension requires information incorporation and
strategic alliances in SC eco-design to improve flexibility completeness (Wu et al, 2017).
In lieu of this, SC reconfiguration is proposed as strategic affiliation pushing firms to
facilitate the flexibility function during post-disruption procedure. An organizational
reconfiguration resources, capabilities and internal structures and a re-structure of
organizational goals, values and practices are necessary to pay more attentions (Kim and
Toya, 2019; Weijiao et al., 2018; Shah et al., 2020). The uncertainty and product
diversification are important to improve SC to respond demand variations. As a result,
production flexibility strategies and responsiveness has become potential topics for
investigation as the factors of SC flexibility (Gunasekaran et al., 2016). Learning from the
recovery stage in concerned with dynamic modifications and stabilization to the limited
resources allocation to ensure process continuity, flexibility and redundancy
development in building SSCM is needed (Gupta et al., 2015; Ivanov et al, 2017).
5.1.5. Supply chain resilience
SC resilience define as the SC adaptive ability to respond to disruptions, react to
unexpected occasions, and then recover by continuously maintaining operations at the
desired balanced of connectedness and control over the SC function and structure
(Ponomarov and Holcomb, 2009). The concept correspondingly measures the recovery
speed of the SC after corrupting by enduring interference preservation occupations, and
the multi-dimensional sub-system switching level (Sprecher et al., 2015).Different from
23
the concept of SC agility and flexibility, the resilience is desired for firms to survive despite
resisting a continuing and unembellished effects from the environment changes. While
some scholars have captured SC resilience as a multi-dimensional structure, which has
stronger relations with both risk and market performance at high levels of supply-side,
disastrous disruptions, infrastructure, and financial performance, which is highly
depending on disruptions forms (Kwak et al., 2018; Wong et al., 2019). The others are
conceptualized it by scope of SC network, as SC resilience a multi-layered paradigm that
involves upstream suppliers, focal internal firm, and downstream customer resilience
components (Pettit et al., 2019).
The resilience is used in material science and presently is widely used in
manufacturing, communication and information discipline, and energy (Gasser et al.,
2019; He et al., 2017). The concept is critical for firms to construct as a fundamental
capability to respond to uncertainties, challenges, and the absolute extent of disruptions
and harsh conditions to create sustainable value for the SC long-term survival and
performance (Gölgeci & Kuivalainen, 2020). The balanced resilience is essential to the
equilibrium between increasing firms’ capabilities and surplus costs in controlling
vulnerabilities (Pettit et al., 2013). Risk management and market performance as firms
face both internal and external effects, resilience capability helps them to ease the
pressure from the disruption and ambidexter to the original state (Wong et al., 2019).
Thus, SC resilience is also referred as dynamic capability enables the SC to adapt, respond
and recover effectively after disruptions and thereby increase the company's competitive
advantage (Yu et al., 2019). The concept needs an ingenious SC network with reactive and
proactive capabilities, allowing members to decrease the likelihood of disruption wave or
their impact to taking firms to a stronger sustainable performance (Chowdhury &
Quaddus, 2017).
Although the literature has been extant provided, there is still a lack of measurement
assess that can evaluate the SC resilience since most of the studies obtained are weak in
objective composition, which rarely be implemented in actual conditions (Chen et al.,
2020a). Resilience of a SC network from empirical viewpoint is important due to
operational risks such as financial constraints, material problems, non-cooperation from
suppliers, or lack of quality human resource (Dixit et al., 2020). Uncertainty and the lack
of information is threating a firm’s activities and sustainable existence, emphasize on the
collaboration, data sharing and knowledge creation are needed. Studies on adaptability
and absorptive capacity can help firms acquire and utilize knowledge to respond to
unexpected or sustained difficulties, and in recovery by providing resilience. Developing
new manufacturing paradigms, foster such industrial Internet and cyber-physical
technologies in the SC resilience can lead to more smart, personalized, and sustainable
mechanism (Biswas et al., 2019). Simultaneously, the non-existence or low disastrous
disruption utilize little capacity of SC resilience likely resulting in insignificant performance
improvement. there is little sympathetic on business and strategic values of possessing
24
SC resilience as a capacity to preserve and obtain resources and utilize them to alleviate
disruptions effects (Wong et al., 2019). The directions for resource specification, resource
mix, the principles of resource measurement utilization for SC resilience are still scarce in
both qualitative and quantitative approaches, especially in dealing with widespread
disruptions. Besides, the collaborative and technical integrated relationships keen on
positive outcomes are recommended for maintaining or securing competitive advantage.
As SC resilience measurement is important to reduce order losses, the composition of the
SC operating in the interrupted environment, measurement model of SC resilience is
needed. Compositing the models that measures SC resilience operation to sustain a high
level of performance in an interrupted environment is critical.
5.1.6. Sustainability
SSCM has grown significantly and has become a subject of increased concern due to
a global population explosion, resource limitations, logistics production and consumption
activities corruption, and waste and pollution increase (Rebs et al., 2019). As disruption
events such as economic crises, terrorist attacks, earthquakes, and pandemic occurred
more severity and frequency, the sustainability is becoming more crucial for SC due to
uncertainty created (Ivanov et al. 2016, Fattahi et al., 2020). Firms are now facing higher
levels of risk as disruptions considerably influence SC performance (Blackhurst et al., 2011;
Dubey et al., 2018). Therefore, the TBL must be further distinguished.
The economic sustainability is resolute by the SC interaction on an intra- and inter-
organizational, and extensive industrial aggregate level related to goods and financial
flows regenerating by natural, social and economic resource within organizational
boundaries (Fabbe-Costes et al., 2011; Brandenburg et al., 2014, Schaltegger et al., 2016).
However, the economic effects of disruptions have grown causing economic losses rapidly
increase and intensify among the global manufacturing and business connectivity (Hughes
et al., 2019; Senyo et al., 2019). Firms are argued to pursue an inter-organizational
orientation of processes to provide economic and competitive advantages to minimize
the disruption effects across SCs and integration (Revilla and Saenz, 2017; Munir et al.,
2020). Thus, develop new products design, innovating manufacturing model access to
capabilities in managing new technologies and process reconfiguration is potential to
invest on. Information technologies and technical architectural compositions to gain
economic benefits requires broad and deep understanding (Smeda, 2017, Hajli et al.,
2020). New business models, thus, need to be comprised to deliver more value creation
such as financial (cost and profit, macroeconomic variables, and non-financial attributes
such as product quality and quantity distance, routing transportation.
While there has been progresses the links between SSCM and economic sustainability,
there are only few studies have addressed the social and environmental sustainability
measures. Increasing social and environmental sustainability performance may become a
competitive advantage to achieve economic performance. Social systems and
25
environmental resources construct and control the intra- and inter-organizational SC as
essential parts of economic systems. Particularly, social sustainability performance has
been emphasized in the literature, which means achieving economic and environmental
sustainability objectives (Beske-Janssen et al., 2015; Walker et al., 2014). From the
internal approach, there is a lack of study on labor conditions and other social factors
often create stress as if the unequal distributional benefits are obvious, such as regulatory
changes, or technical interruptions issues (Hoffmann et al., 2020). As social context
acquires organizational supports, the employees’ behavior such as trust and willingness,
open-mindedness and advance assistance among staff, employees' reliance, and
commitment are required more attentions. The leadership transformation to provide the
organizational performance that enables SC partners to achieve ambidexterity are
suggested (Ojha et al., 2018).
On the other, the external factors of social SSCM has also been growing due to
environmental resources constrains and rising global population challenge production
and logistics activities consume available resources and increase waste and pollution. The
social network between SC partners acts as an asset protection against spur cooperative
action, adversities, and help firms to stopover sudden disruptions (Aldrich and Meyer,
2015). The relational aspect of trust and social capital are considered to motivate external
resources sharing and exchanging derived from social relationships under the alignment
contingency to help the firm to recover from the shock faster if there were unexpected
events or disruptions (Gölgeci & Kuivalainen, 2020). Still, studies on enablers of the
emergence of social formative capabilities in disaster survival and recovery are in weak
evidence. Highlighting on trust and shared cooperative mechanism among partners to
avoid conflict management and produce inconsistency have yet to be fully explored. Even
though there is suggested that extensive social networks could deliver knowledge
benefits conducive to ambidexterity, the role of knowledge creation aspect such as
strategic information flow, big data between SC ambidexterity and SSCM performance
have not been solve in the literature (Partanen et al., 2020). Overall, there is little known
about how to utilize social sustainability to face the harsh and turbulence conditions.
Pollution prevention practices results in better operational performance of cost,
quality, and reliability. The higher firm’s level of innovation is, the better cost saving it
gains from environmental sustainability practices (Yusuf et al., 2020). In particular, the
effective green and products development relates to difference strategies is suggested to
minimizing the environmental impacts of the SC while encompassing the triple-bottom
line objectives (Dües et al., 2013; Prajogo et al. 2014). This aims to reduce the ecological
effects as well as promoting the long-term financial benefits (Marshall et al., 2015). Yet,
there are absence of regulations and policies of wasteful materials, water, energy
utilization that are not only damaging the environment but changing climate, thus
exerting SCs vulnerability and compressions on manufacturers. the environmentally
friendly policy to shape business activities and wider sustainability issues must be
26
developed. Green SC design and optimization approach that involves multi-product, and
suppliers and buyer’s selection, quality control policies and a model to manage consign
inventory agreement should be considered as tools to rapid respond to the markets
changes. Additional, very few studies have looked at how firm recovers after the
disruption follows structural initiatives such as of human and technical lean practices
implementation (Shah et al., 2020). Therefore, lean innovation strategies accumulate
from integrating approaches is argued to substantially reducte pollution during
manufacturing process and improvement green process performance. Collaboration on
the environmental enhancement in terms of process integration, green raw materials,
eco-product design, and customer-based need to have further measures (Tseng et al.,
2015).
However, sustainability likewise has negative impact on firms’ profitability indicating
a need to find ways to maximize the performance advantage of implementation of
sustainability practices (Esfahbodi et al., 2017; Green et al., 2015). The challenge is how
to integrate those TBL to develop unique abilities to enhance sustainable competitive
advantage throughout the disruption and ambidexterity (Yusuf et al., 2020). While the
integration has been argued to provide economic and competitive advantages, yet, those
advantages come with abundance of unpredicted risks due to the alternating processes,
thus leading to inconsistent among SC performance (Munir et al., 2020). This rises
pressure to secure sustainability and creates opportunities for recovery. Focusing on
streams of studies of ambidextrous SC strategy, exploitation, exploration, customer
satisfaction; governance ambidexterity; financial ability, the integration between SC
agility; adaptability; resilience, as well as such dynamic strategy; the linkage of firm’s
knowledge to its operational process, and its partners to be its uniqueness to deal with
unexpected disruption or sustained adversity are urgently essential.
5.2. Regional discussions
The regions show different tendencies compared with others. It is reported that show
Asia and Oceania, Latin America and the Caribbean, and Africa are the regions that needs
to be improved. In particular, Latin America and the Caribbean, and Africa have fewer
publications in the field; while Asia and Oceania, which has the largest among regions,
also show much room for improvement due to its sensitive position in the global SC.
Despite Europe and North America are reported to have less demand for improvement,
still, these regions show distinct apprehensions on SCND beside the other common trends.
5.2.1. Asia and Oceania
Asia and Oceania are a dynamic region, which is known as the heart of global SC since
half of the global total industry value is produced from this region. As export-oriented
area, Asia and Oceania has extraordinary economic growth power thanks to its
multifaceted SCs network. The region is not only considered as a main manufacturer of
components and products but also plays as a major global consumer market. However,
27
the region’s SCs are integrally weak to interruption causing deleterious effects on
operational system, suspended exports, and facing various of vulnerable challenges. Such
uncertainty vulnerability as disaster risk, pandemic, high geo-political tensions, increasing
military maneuvering is potential to disrupt trade and business continuity, scattered
phases of panic buying, and threaten human and employee safety, making the SC more
sensitive and fragile, thus, reduces the entire global SC capacity.
Thus, post-disruption and ambidexterity actions with strong scientific consensus in
advance planning, clear disaster response responsibilities understanding, and strategic
coordination is possible to improve the situation. Building SC resilience, agility, flexibility;
investing on business continuity planning, and appropriate procedures to ensure the
sustainable operational steadiness can help firms successfully manage the SC disruptions
impact. Scenario planning involves key uncertainties, SC re-design from employment,
transportation and logistics availability to determine firm’s preparation for conceivable
upcoming events is recommended to strengthen their capability. Firms need quality and
trustworthy information to handle the complex and uncertain environment frequently
changing (Munir et al., 2020). Further studies on transparency to reflect on and
implement better policies and knowledge, improving collaboration and cooperation with
regional-international and local governments, and developing better communication
channels is argued to better manage risk and in-depth the relationships between
suppliers. To do so, the information technology concentrating on three stages of handling
the disruptions consisting disruption discovery, post occurrence, and disruption recovery
cannot be ignored (Chen et al., 2019). Blockchain technology, social media exploitation
can help firms to enhance the SCs and better position them to respond to crises.
Emphasizing on analytical strategic foresight, simulating the inherent unpredictability
events to build evaluation capability to potential risks so that can ensure improvements
and better prepare themselves for infrastructure-related disruptions is recommended.
5.2.2. Africa
Africa can be assumed to be less experiences SC disruptions due to less connecting to
global SCs. Yet, the region’s economy might receive hard stroke by its largest trade
partner as China are losing the fundamental place in global supply. Furthermore, the
manufacturing and transport equipment are largely imported making Africa have been
seriously obstructed by both key components supply decrease from Asia and other
regions and reduction in global products demand. SC disruptions with raw material
shortages, delays, fall of orders, costs increase, and other economic consequences
causing further vagueness contending with extensive of geopolitical instable are probably
to initiate SCs function reconsideration and strengthening regional operations. This
pushes the region must realign and devolve its SC to a boarder international cooperation
and stronger flexibility and resilience as the conceivable approaches.
28
The region has shown inimitable, wide-ranging, and incessant challenges to build its
SC abilities to adapt the post-disruption stage. Africa's economic conditions in recent
years and its extensive natural-resources abundance have stimulated SC finance
development with higher returns than other regions. However, the logistics infrastructure
quality and technological capabilities are heterogeneous across the region marking the
urgent of long-term structural shifts to synchronize with global SCs. Still, the studies on
this region are relatively less. Gaps in improving service reliability, synergies and
partnership opportunities to ensure the shared costs and benefits between SC channels
need to be accomplish. Strategies on controlling and managing the human resources,
skills and experiences to enhancing the technical processes and impose international
standards and ensure sustainability for business development are requiring further
examinations. How to adopt economic agreements advantages and trade corridors rising
for firms to achieve economies distribution must be approached.
5.2.3. Latin America and Caribbean
Latin American and Caribbean are in quest of SC improvements of demand,
operations planning, transportation, inventory replenishment, and sales since the region
faces operational risks due to SC disruptions issues like financial volatility, market, security
factors, quality diminish, infrastructural barriers, and transparency problems. A
systematic approach is needed for firms to respond to urgent process obtaining, adapt to
disruption scenarios, and obey with operational restrictions. However, the engagement
level with between firms and government has deteriorated with significant augmented of
risk compliance. Firms struggles to leverage out-of-date and encumbered resource
planning systems to tackle complexity making a slow advanced SC solutions adoption. The
emerging technologies has cause uncertainty, haziness, and inconsistency disrupt firms’
operational models and the dynamic business anxieties (Hoffmann et al., 2020). This
pressure on the region to adopt new SC practices and devices to collaborate with their
international partners, increasing competitive advantages in global markets and
profitability.
The Latin America and Caribbean are potential workshop to replace Asia for North
America and Europe. The certitude and operative constancy must be noticed when
building resilience and flexibility approaches, which positively improve operational
efficiency (Ivanov and Dolgui, 2019, Essuman et al., 2020). However, the lack of
information and uncertainty, and the absence of the external knowledge are navigating
their activities and unsustain their existence. This require is a clear direction on
sustainable competitive strategy and SC tactic. In practice, the international SC finance
variations become to price modification anticipations with potential of abrupt
depreciations. Studies on agility design, public policies operation, investment decisions,
reliable national establishment on cost evaluation, private sector strategic decision-
making process are an effective innovation to acquire and process the recovering of
external shudder against uncertainty and difficulty (Gölgeci & Kuivalainen, 2020). An
29
integrated effective solution is important to guarantee a proper level of SC when facing
unexpected events.
5.2.4. North America
The unforecastable feature of disruption impacts on the SC operations in North
America causing widespread apprehension and economic adversity such as steeply
increasing or losing demand, generating uncertainty, weakening delivery ability, absences
of logistics capability. In this region, raw materials and intermediate commodities are
outsourced and transferred around the world and then assembled in another place, the
final output is then re-exported to final consumers. Accordingly, SC activities are fronting
problems in dealing with interruptions as the immediate effects of using overseas
manufacturing making firms to restructure SC. In fact, the disruption may have two-site
effects to the SC as it helps to accelerate the jobs return to North America in long-term
due to global uncertainties, while in the short term, it’s contrarily cause reduce of
production due to deteriorating of components arrivals and manufacturing delays.
Therefore, reconfiguring the SC network design considering both short-term and long-
term accomplishments are required to recover the post-crisis SC performance. Develop
SC disruption administration plans, classify crisis strategies, implement new SC models
and assessing substitute outbound logistics possibilities must be focus on. Determining
factors impacting the international SCs dynamics can help to ensure supply continuity.
Qualitative and quantitative SC risk analysis approaches are important to sustain market
share, establishing demand-supply synchronization assessment. Evaluate the financial
health, creating agility to measure the potential SC, determinate, reorganized with
flexible SC networks might be potential study field. Investigate on technologies adoption
across SC and support ability to resist sudden shocks is proposed. Identify geologically
diverse for emergency considering should be given to both academia and practice.
Implementing optimization models, addressing new metric on ambidexterity, highlighting
design decisions, capabilities and infrastructure, as well as transportation link to create
reliable and sustain SC network is necessary (Govindan et al. 2017; Dolgui et al. 2018;
Fattahi et al, 2020).
5.2.5. Europe
Similar to North America, Europe is also critically suffered from supply-chain
disruptions due to the global crisis, production shutdown, and supply-demand shocks.
This essentially prompt a reconsideration of SCs function, emphasizing on implications of
resilience and agility to both up-and-downstream SC members. Thus, future studies may
focus on total employment assurance, experience firms growing constraints, just-in-time
delivery; the flexibility in evaluate and supervise the SC production quality. Implementing
digitization and cyberization within SC may help the region to utilize its global resources,
achieve greater transparency, stay close to the consumers and improve sustainability
during and after the disruption. However, instantaneous attempts to reposition the
30
network may interruption reinstating occupied production as the result of finding
alternative suppliers and redesigning deliveries system with long-lasting, overpriced and
spoiled uncertainty. The resilience cannot depend on self-sufficiency but supporting
regional integration.
Since the region is the main importer from both Asia and Africa, and buys almost
products from Latin America, the manufacturing activity collapses consequent in
economic corollaries such as reduced inputs demand, materials exports decrease. As a
domino effect, the global trade may decline due to the continuing SC disputes. The
recovery of production line requires re-establishing existing links, removing temporary
barriers put in place during the emergency, and ensuring an open and predictable world
trading system. Hence, SCND is argued to be important not only for the region of North
America or Europe but also all over the world to prepare for a high-tension disrupting
condition. New models to take decisions on facility location, production capacity, facilities’
changes and connection between echelons are crucial. Empirical studies on SC
integrations to meet actual problems of outsourcing movements and interior tasks, as
well as to ensure the SC efficiency in terms of production and information flows between
partners are significant (Leuschner et al., 2013, Chatzikontidou et al., 2017).
6. Conclusion remarks
The evolution on sustainability has followed by an augmented understanding on the
wide-ranging literature of the SSCM. However, the uncertain of global business fast-
changing and operational strategies complication has caused high intensity of SC risks and
vulnerability that leads to disrupting the whole SC. The importance of ambidexterity is
argued to ease the disruptions impact and enhance business performance as SC members
adapt to new customers demand and changing in business environment. Still, the
complexity of different SC players has cause various impartialities, which distinct between
different geographical regions, has posed great challenges to sustainability. It is essential
to emphasize on the regional phenomena exploration aside from an overall review of the
literature. A systematic review to classify state-of-the-art SSCM and release new
directions and potential opportunities is necessary to foster further studies.
Quantitative and qualitative approaches are proposed through a hybrid method of
content and bibliometric analyses , FDM, EWM, and fuzzy DEMATEL to (1) scanning the
SSCM literature towards disruption and ambidexterity, (2) to determine data-driven
indicators for future debates and study trends, (3) to identify the challenges and
knowledge gaps between geographical regions. The content analysis is used to criticize
the publication data driven from the Scopus database. The bibliometric analysis applied
the VOSviewer software to graph a bibliometric overview and identified the SSCM
indicators. The FDM is used to refine the valid indicators by computing their perception
levels from experts’ linguistic references. The EWM is applied to convert the indicator
occurrence information into comparable weights to determine the indicator performance
31
among regions. The fuzzy DEMATEL is used to obtain human linguistic perceptions and
identify the substantial indicators for further studies. This study contributes to a SSCM
review toward disruption and ambidexterity, distinguish the critical indicators as gaps to
offer supplemental knowledge that supports future studies and practical
implementations. In this study:
A data-driven analysis is delivered and determined the critical indicators as gaps
for future studies. There are 273 keywords listed and 22 indicators are obtained based
on the experts’ evaluation. The most important indicators are emphasized as essential
for future directions.
The prioritization for investigation occasions is proposed for future study to
investigate, the relationship between the trends and challenges are clear addressed in
this study. By ocusing on ambidextrous SC strategy, involving SC agility, SC coordination,
SC finance, SC flexibility, SC resilience, sustainability the knowledge linkages are
processed to deal with unexpected disruption or sustained adversity.
The identified gaps between geographical regions offer both to local viewpoints
and the comprehensive global state of the art of SSCM. There are 1 countries/territories
are accumulated to 5 regions, including Asia and Oceania, Europe, North America, Latin
America and Caribbean, and Africa. The results showed that Asia and Oceania have the
highest number of SSCM publications, followed by Europe and North America. Latin
America and the Caribbean and Africa displayed fewer publications compared with
others.
A studies trends comparison is emphasizing on the regional viewpoints. Latin
America and the Caribbean, and Africa are required for significant enhancement; while
Asia and Oceania also show gaps for improvement due to its sensitive position in the
global SC. The Europe and North America show fewer demand for improvement, still,
these regions show distinct apprehensions on SCND beside the other common trends.
The SSCM actors can refer to this study as a reference for decision making. Firms,
governments and professionals can esteem provided information from this study to
promote policy strategies, practical design and planning based on regional and overall
insights to foster innovative implementations.
Some limitations exist in this study. First, the authors. It is difficult to guarantee
adequate examination because this study was unable to inspect all 2402 publications
driven from the database. Second, the discussions may lack to initiate sufficiency
assessment because Scopus also contains low impact sources (Shukla et al., 2019). A
future study is recommended to engage a more condensed database for better results.
Third, there are only 30 members in expert committee, which may cause the analysis
favoritisms process due to their knowledge, experience, and familiarity to the study field.
Increasing the volume of respondents is proposed to avoid this problem. Both academic
32
and practical investigation is encouraged to exploit this study’s exhaustive method in
another field for data-driven analysis.
References
1. Adams, J. H., Khoja, F. M., & Kauffman, R. (2012). An empirical study of buyer–
supplier relationships within small business organizations. Journal of Small
Business Management, 50(1), 20-40.
2. Adem, S. A., Childerhouse, P., Egbelakin, T., & Wang, B. (2018). International and local NGO supply chain collaboration: an investigation of the Syrian refugee crises in Jordan. Journal of Humanitarian Logistics and Supply Chain Management, 8(3), 295-322.
3. Aggarwal, S., Srivastava, M. K., & Bharadwaj, S. S. (2020). Towards a Definition and Concept of Collaborative Resilience in Supply Chain: A Study of 5 Indian Supply Chain Cases. International Journal of Information Systems and Supply Chain Management (IJISSCM), 13(1), 98-117.
4. Akter, S., Wamba, S. F., Gunasekaran, A., Dubey, R., & Childe, S. J. (2016). How to
improve firm performance using big data analytics capability and business strategy
alignment?. International Journal of Production Economics, 182, 113-131.
5. Alamerew, Y. A., & Brissaud, D. (2020). Modelling reverse supply chain through
system dynamics for realizing the transition towards the circular economy: A case
study on electric vehicle batteries. Journal of Cleaner Production, 254, 120025.
6. Al-Doori, J. A. (2019). The impact of supply chain collaboration on performance in automotive industry: Empirical evidence. Journal of Industrial Engineering and Management, 12(2), 241-253.
7. Aldrich, D. P., & Meyer, M. A. (2015). Social capital and community
resilience. American Behavioral Scientist, 59(2), 254-269.
8. Alfalla-Luque, R., Machuca, J. A., & Marin-Garcia, J. A. (2018). Triple-A and
competitive advantage in supply chains: Empirical research in developed
countries. International Journal of Production Economics, 203, 48-61.
9. Ali, S. M., & Nakade, K. (2016). Coordinating a supply chain system for production, pricing and service strategies with disruptions. International Journal of Advanced Operations Management, 8(1), 17-37.
10. Alvarado-Vargas, M. J., & Kelley, K. J. (2019). Bullwhip severity in conditions of uncertainty: regional vs global supply chain strategies. International Journal of Emerging Markets, 15(1), 131-148.
11. Alzoubi, H., & Yanamandra, R. (2020). Investigating the mediating role of information sharing strategy on agile supply chain. Uncertain Supply Chain Management, 8(2), 273-284.
12. Amui, L. B. L., Jabbour, C. J. C., de Sousa Jabbour, A. B. L., & Kannan, D. (2017).
Sustainability as a dynamic organizational capability: a systematic review and a
future agenda toward a sustainable transition. Journal of Cleaner Production, 142,
308-322.
33
13. Ansari, Z. N., & Kant, R. (2017). A state-of-art literature review reflecting 15 years
of focus on sustainable supply chain management. Journal of Cleaner
Production, 142, 2524-2543.
14. Aoki, K., & Wilhelm, M. (2017). The role of ambidexterity in managing buyer–
supplier relationships: The Toyota case. Organization Science, 28(6), 1080-1097.
15. Ardakani, E. S., Seifbarghy, M., Tikani, H., & Daneshgar, S. (2020). Designing a multi-period production-distribution system considering social responsibility aspects and failure modes. Sustainable Production and Consumption, 22, 239-250.
16. Asamoah, D., Agyei-Owusu, B., & Ashun, E. (2020). Social network relationship, supply chain resilience and customer-oriented performance of small and medium enterprises in a developing economy. Benchmarking: An International Journal, 27(5), 1793-1813.
17. Aslam, H., Blome, C., Roscoe, S., & Azhar, T. M. (2018). Dynamic supply chain capabilities. International Journal of Operations & Production Management, 38(12), 2266-2285.
18. Aslam, H., Khan, A. Q., Rashid, K., & Rehman, S. U. (2020). Achieving supply chain resilience: the role of supply chain ambidexterity and supply chain agility. Journal of Manufacturing Technology Management.
19. Aslani, A., & Heydari, J. (2019). Transshipment contract for coordination of a green dual-channel supply chain under channel disruption. Journal of Cleaner Production, 223, 596-609.
20. Azad, N., Davoudpour, H., Saharidis, G. K., & Shiripour, M. (2014). A new model to mitigating random disruption risks of facility and transportation in supply chain network design. The International Journal of Advanced Manufacturing Technology, 70(9-12), 1757-1774.
21. Azadegan, A., Mellat Parast, M., Lucianetti, L., Nishant, R., & Blackhurst, J. (2020).
Supply chain disruptions and business continuity: an empirical
assessment. Decision Sciences, 51(1), 38-73.
22. Azadegan, A., Syed, T. A., Blome, C., & Tajeddini, K. (2020). Supply chain involvement in business continuity management: effects on reputational and operational damage containment from supply chain disruptions. Supply Chain Management: An International Journal, 25(6), 747-772.
23. Baghalian, A., Rezapour, S., & Farahani, R. Z. (2013). Robust supply chain network design with service level against disruptions and demand uncertainties: A real-life case. European Journal of Operational Research, 227(1), 199-215.
24. Baharmand, H., Comes, T., & Lauras, M. (2019). Defining and measuring the network flexibility of humanitarian supply chains: insights from the 2015 Nepal earthquake. Annals of Operations Research, 283(1), 961-1000.
25. Balaman, Ş. Y. (2016). Investment planning and strategic management of sustainable systems for clean power generation: An ε-constraint based multi objective modelling approach. Journal of Cleaner Production, 137, 1179-1190.
26. Barclay, K., & Miller, A. (2018). The sustainable seafood movement is a governance concert, with the audience playing a key role. Sustainability, 10(1), 180.
34
27. Baryannis, G., Dani, S., & Antoniou, G. (2019). Predicting supply chain risks using machine learning: The trade-off between performance and interpretability. Future Generation Computer Systems, 101, 993-1004.
28. Bastas, A., & Liyanage, K. (2018). Sustainable supply chain quality management: A
systematic review. Journal of cleaner production, 181, 726-744.
29. Battistella, C., De Toni, A. F., De Zan, G., & Pessot, E. (2017). Cultivating business
model agility through focused capabilities: A multiple case study. Journal of
Business Research, 73, 65-82.
30. Behzadi, G., O’Sullivan, M. J., & Olsen, T. L. (2020). On Metrics for Supply Chain Resilience. European Journal of Operational Research, 287(1), 145-158.
31. Benedito, E., Martínez-Costa, C., & Rubio, S. (2020). Introducing Risk Considerations into the Supply Chain Network Design. Processes, 8(6), 743.
32. Beske-Janssen, P., Johnson, M. P., & Schaltegger, S. (2015). 20 years of
performance measurement in sustainable supply chain management–what has
been achieved?. Supply Chain Management: An International Journal, 20(6), 664-
680.
33. Bevilacqua, M., Ciarapica, F. E., Marcucci, G., & Mazzuto, G. (2019). Fuzzy cognitive maps approach for analysing the domino effect of factors affecting supply chain resilience: A fashion industry case study. International Journal of Production Research, 1-29.
34. Bhatt, Y., Ghuman, K., & Dhir, A. (2020). Sustainable manufacturing. Bibliometrics
and content analysis. Journal of Cleaner Production, 120988.
35. Biloslavo, R., Bagnoli, C., & Figelj, R. R. (2013). Managing dualities for efficiency and
effectiveness of organisations. Industrial Management & Data Systems, 113(3),
423–442.
36. Birkel, H. S., & Hartmann, E. (2020). Internet of Things–the future of managing supply chain risks. Supply Chain Management: An International Journal, 25(5), 535-548.
37. Birkie, S. E. (2016). Operational resilience and lean: in search of synergies and trade-offs. Journal of Manufacturing Technology Management, 27(2), 185-207.
38. Biswas, P., Kumar, S., Jain, V., & Chandra, C. (2019). Measuring Supply Chain
Reconfigurability using Integrated and Deterministic Assessment Models. Journal
of Manufacturing Systems, 52, 172-183.
39. Blackhurst, J., Dunn, K. S., & Craighead, C. W. (2011). An empirically derived
framework of global supply resiliency. Journal of Business Logistics, 32(4), 374-391.
40. Blackhurst, J., Rungtusanatham, M. J., Scheibe, K., & Ambulkar, S. (2018). Supply chain vulnerability assessment: A network based visualization and clustering analysis approach. Journal of Purchasing and Supply Management, 24(1), 21-30.
41. Blome, C., Schoenherr, T., & Eckstein, D. (2014). The impact of knowledge transfer
and complexity on supply chain flexibility: A knowledge-based view. International
Journal of Production Economics, 147(B), 307-316.
35
42. Blome, C., Schoenherr, T., & Rexhausen, D. (2013). Antecedents and enablers of
supply chain agility and its effect on performance: a dynamic capabilities
perspective. International Journal of Production Research, 51(4), 1295-1318.
43. Bocken, N., Boons, F., & Baldassarre, B. (2019). Sustainable business model
experimentation by understanding ecologies of business models. Journal of
Cleaner Production, 208, 1498-1512.
44. Bode, C., & Wagner, S. M. (2015). Structural drivers of upstream supply chain
complexity and the frequency of supply chain disruptions. Journal of Operations
Management, 36, 215-228.
45. Brandenburg, M., Govindan, K., Sarkis, J., & Seuring, S. (2014). Quantitative models
for sustainable supply chain management: Developments and directions. European
Journal of Operational Research, 233(2), 299-312.
46. Braunscheidel, M. J., & Suresh, N. C. (2009). The organizational antecedents of a
firm’s supply chain agility for risk mitigation and response. Journal of Operations
Management, 27(2), 119-140.
47. Bravo, M. I. R., Ruiz-Moreno, A., & Montes, F. J. L. (2018). Examining desorptive
capacity in supply chains: the role of organizational ambidexterity. International
Journal of Operations & Production Management.
48. Breuer, H., & Lüdeke-Freund, F. (2017). Values-based network and business model
innovation. International Journal of Innovation Management, 21(03), 1750028.
49. Brown, K. A., Schmitt, T. G., & Schonberger, R. J. (2015). ASP, the Art and science of practice: three challenges for a lean enterprise in turbulent times. Interfaces, 45(3), 260-270.
50. Bugert, N., & Lasch, R. (2018). Effectiveness of responsive pricing in the face of supply chain disruptions. Computers & Industrial Engineering, 124, 304-315.
51. Bui, T. D., Tsai, F. M., Tseng, M. L., & Ali, M. H. (2020). Identifying sustainable solid
waste management barriers in practice using the fuzzy Delphi method. Resources,
Conservation and Recycling, 154, 104625.
52. Burin, A. R. G., Perez-Arostegui, M. N., & Llorens-Montes, J. (2020). Ambidexterity
and IT competence can improve supply chain flexibility? A resource orchestration
approach. Journal of Purchasing and Supply Management, 26(2), 100610.
53. Caniato, F., Gelsomino, L. M., Perego, A., & Ronchi, S. (2016). Does finance solve
the supply chain financing problem?. Supply Chain Management: An International
Journal, 21(5), 534–549.
54. Cao, Q., Gedajlovic, E., & Zhang, H. (2009). Unpacking organizational
ambidexterity: Dimensions, contingencies, and synergistic effects. Organization
Science, 20(4), 781-796.
55. Capaldo, A. (2007). Network structure and innovation: The leveraging of a dual
network as a distinctive relational capability. Strategic Management Journal, 28(6),
585-608.
36
56. Chakraborty, T., Chauhan, S. S., & Ouhimmou, M. (2020). Mitigating supply disruption with a backup supplier under uncertain demand: competition vs. cooperation. International Journal of Production Research, 58(12), 3618-3649.
57. Chakuu, S., Masi, D., & Godsell, J. (2019). Exploring the relationship between
mechanisms, actors and instruments in supply chain finance: A systematic
literature review. International Journal of Production Economics, 216, 35-53.
58. Chan, A. T., Ngai, E. W., & Moon, K. K. (2017). The effects of strategic and
manufacturing flexibilities and supply chain agility on firm performance in the
fashion industry. European Journal of Operational Research, 259(2), 486-499.
59. Chan, H. L., Wei, X., Guo, S., & Leung, W. H. (2020). Corporate social responsibility (CSR) in fashion supply chains: A multi-methodological study. Transportation Research Part E: Logistics and Transportation Review, 142, 102063.
60. Chandrasekaran, A., Linderman, K., & Schroeder, R. (2012). Antecedents to
ambidexterity competency in high technology organizations. Journal of Operations
Management, 30(1-2), 134-151.
61. Chatterjee, A., & Layton, A. (2020). Mimicking nature for resilient resource and infrastructure network design. Reliability Engineering & System Safety, 204, 107142.
62. Chatzikontidou, A., Longinidis, P., Tsiakis, P., & Georgiadis, M. C. (2017). Flexible
supply chain network design under uncertainty. Chemical Engineering Research
and Design, 128, 290-305.
63. CHEN, B., & MA, J. (2014). Complex Analysis and Chaos Control of a Closed-Loop Supply Chain Based on New and Old Products Price Difference. Complex Systems and Complexity Science, (3), 7.
64. Chen, F., Liu, S., & Appolloni, A. (2020). Horizontal Coordination of I-LNGOs in the Humanitarian Supply Chain: An Evolutionary Game Approach. Sustainability, 12(15), 5953.
65. Chen, H. Y., Das, A., & Ivanov, D. (2019). Building resilience and managing post-
disruption supply chain recovery: Lessons from the information and
communication technology industry. International Journal of Information
Management, 49, 330-342.
66. Chen, J., Cai, T., He, W., Chen, L., Zhao, G., Zou, W., & Guo, L. (2020). A Blockchain-Driven Supply Chain Finance Application for Auto Retail Industry. Entropy, 22(1), 95.
67. Chen, L. M., Liu, Y. E., & Yang, S. J. S. (2015). Robust supply chain strategies for recovering from unanticipated disasters. Transportation Research Part E: Logistics and Transportation Review, 77, 198-214.
68. Chen, L., Chan, H. K., & Zhao, X. (2020b). Supply Chain Finance: Latest Research
Topics and Research Opportunities. International Journal of Production
Economics (0925-5273), 229, 107766.
37
69. Chen, L., Dui, H., & Zhang, C. (2020a). A resilience measure for supply chain
systems considering the interruption with the cyber-physical systems. Reliability
Engineering & System Safety, 199, 106869.
70. Chen, L., Zhao, X., Tang, O., Price, L., Zhang, S., & Zhu, W. (2017). Supply chain
collaboration for sustainability: A literature review and future research
agenda. International Journal of Production Economics, 194, 73-87.
71. Chen, T., & Wang, D. (2020). Combined application of blockchain technology in fractional calculus model of supply chain financial system. Chaos, Solitons & Fractals, 131, 109461.
72. Chen, Y., Shu, T., Chen, S., Wang, S., Lai, K. K., & Gan, L. (2017). Strong–weak collaborative management in coping supply chain disruption risk transmission based on scale-free networks. Applied Economics, 49(39), 3943-3958.
73. Chowdhury, M. M. H., & Quaddus, M. (2016). Supply chain readiness, response and recovery for resilience. Supply Chain Management: An International Journal, 21(6), 709-731.
74. Chowdhury, M. M. H., & Quaddus, M. (2017). Supply chain resilience:
Conceptualization and scale development using dynamic capability
theory. International Journal of Production Economics, 188, 185-204.
75. Chowdhury, M. M. H., Agarwal, R., & Quaddus, M. (2019). Dynamic capabilities for
meeting stakeholders' sustainability requirements in supply chain. Journal of
Cleaner Production, 215, 34-45.
76. Chowdhury, N. A., Ali, S. M., Mahtab, Z., Rahman, T., Kabir, G., & Paul, S. K. (2019). A structural model for investigating the driving and dependence power of supply chain risks in the readymade garment industry. Journal of Retailing and Consumer Services, 51, 102-113.
77. Ciccullo, F., Pero, M., Caridi, M., Gosling, J., & Purvis, L. (2018). Integrating the
environmental and social sustainability pillars into the lean and agile supply chain
management paradigms: A literature review and future research
directions. Journal of Cleaner Production, 172, 2336-2350.
78. Comyns, B., & Franklin-Johnson, E. (2018). Corporate reputation and collective crises: A theoretical development using the case of Rana Plaza. Journal of Business Ethics, 150(1), 159-183.
79. Cordell, D., Turner, A., & Chong, J. (2015). The hidden cost of phosphate fertilizers: mapping multi-stakeholder supply chain risks and impacts from mine to fork. Global Change, Peace & Security, 27(3), 323-343.
80. Crescenzi, R., & Gagliardi, L. (2018). The innovative performance of firms in
heterogeneous environments: The interplay between external knowledge and
internal absorptive capacities. Research Policy, 47(4), 782-795.
81. da Silva Poberschnigg, T. F., Pimenta, M. L., & Hilletofth, P. (2020). How can cross-functional integration support the development of resilience capabilities? The case of collaboration in the automotive industry. Supply Chain Management: An International Journal, 25(6), 789-801.
38
82. Dabhilkar, M., Birkie, S. E., & Kaulio, M. (2016). Supply-side resilience as practice
bundles: a critical incident study. International Journal of Operations & Production
Management, 36(8), 948–970.
83. Danusantoso, J., & Moses, S. A. (2016). Disruption management in a two-period three-tier electronics supply chain. Cogent Business & Management, 3(1), 1137138.
84. Darby, J. L., Ketchen Jr, D. J., Williams, B. D., & Tokar, T. (2020). The implications of firm‐specific policy risk, policy uncertainty, and industry factors for inventory: A resource dependence perspective. Journal of Supply Chain Management.
85. de Freitas, M. R., Pimenta, M. L., Hilletofth, P., Jugend, D., & Oprime, P. C. (2019). Demand management: the role of cross-functional integration in a context of political turbulence. Asia Pacific Journal of Marketing and Logistics, 32(3), 817-839.
86. De Sanctis, I., Ordieres Meré, J., & Ciarapica, F. E. (2018). Resilience for lean organisational network. International Journal of Production Research, 56(21), 6917-6936.
87. Delic, M., & Eyers, D. R. (2020). The effect of additive manufacturing adoption on
supply chain flexibility and performance: An empirical analysis from the
automotive industry. International Journal of Production Economics, 228, 107689.
88. Devaraj, S., Krajewski, L., & Wei, J. C. (2007). Impact of eBusiness technologies on
operational performance: the role of production information integration in the
supply chain. Journal of Operations Management, 25(6), 1199-1216.
89. Diabat, A., Jabbarzadeh, A., & Khosrojerdi, A. (2019). A perishable product supply
chain network design problem with reliability and disruption
considerations. International Journal of Production Economics, 212, 125-138.
90. Divsalar, M., Ahmadi, M., & Nemati, Y. (2020). A SCOR-Based Model to Evaluate LARG Supply Chain Performance Using a Hybrid MADM Method. IEEE Transactions on Engineering Management.
91. Dixit, V., Verma, P., & Tiwari, M. K. (2020). Assessment of pre and post-disaster
supply chain resilience based on network structural parameters with CVaR as a risk
measure. International Journal of Production Economics, 227, 107655.
92. Doan, T., & Bui, T. (2020). Nonlinear impact of supply chain finance on the performance of seafood firms: A case study from Vietnam. Uncertain Supply Chain Management, 8(2), 267-272.
93. Dolgui, A., Ivanov, D., & Sokolov, B. (2018). Ripple effect in the supply chain: an
analysis and recent literature. International Journal of Production Research, 56(1-
2), 414-430.
94. Dolgui, A., Ivanov, D., Potryasaev, S., Sokolov, B., Ivanova, M., & Werner, F. (2020). Blockchain-oriented dynamic modelling of smart contract design and execution in the supply chain. International Journal of Production Research, 58(7), 2184-2199.
95. Dubey, R., Gunasekaran, A., & Childe, S. J. (2019). Big data analytics capability in
supply chain agility. Management Decision, 37(1), 10-36.
39
96. Dubey, R., Gunasekaran, A., Childe, S. J., Fosso Wamba, S., Roubaud, D., &
Foropon, C. (2019). Empirical investigation of data analytics capability and
organizational flexibility as complements to supply chain resilience. International
Journal of Production Research, 1-19
97. Duclos, L. K., Vokurka, R. J., & Lummus, R. R. (2003). A conceptual model of supply
chain flexibility. Industrial Management & Data Systems, 103(6), 446–456.
98. Dües, C. M., Tan, K. H., & Lim, M. (2013). Green as the new Lean: how to use Lean
practices as a catalyst to greening your supply chain. Journal of Cleaner
Production, 40, 93-100.
99. Durowoju, O., Chan, H. K., & Wang, X. (2020). Investigation of the Effect of e-Platform Information Security Breaches: A Small and Medium Enterprise Supply Chain Perspective. IEEE Transactions on Engineering Management.
100. Dutta, P., & Shrivastava, H. (2020). The design and planning of an integrated supply chain for perishable products under uncertainties. Journal of Modelling in Management.
101. Dwivedi, Y. K., Shareef, M. A., Mukerji, B., Rana, N. P., & Kapoor, K. K. (2018). Involvement in emergency supply chain for disaster management: a cognitive dissonance perspective. International Journal of Production Research, 56(21), 6758-6773.
102. Dye, C. Y., & Yang, C. T. (2015). Sustainable trade credit and replenishment
decisions with credit-linked demand under carbon emission constraints. European
Journal of Operational Research, 244(1), 187-200.
103. Eck, N. V., & Waltman, L. (2018). VOSviewer Manual: Manual for VOSviewer
Version 1.6.11.
104. Eckstein, D., Goellner, M., Blome, C., & Henke, M. (2015). The performance impact
of supply chain agility and supply chain adaptability: the moderating effect of
product complexity. International Journal of Production Research, 53(10), 3028-
3046.
105. Enke, A., & Bausch, A. (2013). A meta-analytic review of the ambidexterity-
performance relationship. European Journal of Management, 13(2), 23.
106. Esfahbodi, A., Zhang, Y., Watson, G., & Zhang, T. (2017). Governance pressures and
performance outcomes of sustainable supply chain management–An empirical
analysis of UK manufacturing industry. Journal of Cleaner Production, 155, 66-78.
107. Esmaeilikia, M., Fahimnia, B., Sarkis, J., Govindan, K., Kumar, A., & Mo, J. (2016).
Tactical supply chain planning models with inherent flexibility: definition and
review. Annals of Operations Research, 244(2), 407-427.
108. Esmaeili-Najafabadi, E., Nezhad, M. S. F., Pourmohammadi, H., Honarvar, M., & Vahdatzad, M. A. (2019). A joint supplier selection and order allocation model with disruption risks in centralized supply chain. Computers & Industrial Engineering, 127, 734-748.
40
109. Essuman, D., Boso, N., & Annan, J. (2020). Operational resilience, disruption, and
efficiency: Conceptual and empirical analyses. International Journal of Production
Economics, 229, 107762.
110. Ethirajan, M., Arasu M, T., Kandasamy, J., KEK, V., Nadeem, S. P., & Kumar, A.
(2020). Analysing the risks of adopting circular economy initiatives in
manufacturing supply chains. Business Strategy and the Environment.
111. Fattahi, M., & Govindan, K. (2020). Data‐Driven Rolling Horizon Approach for Dynamic Design of Supply Chain Distribution Networks under Disruption and Demand Uncertainty. Decision Sciences.
112. Fattahi, M., Govindan, K., & Keyvanshokooh, E. (2017). Responsive and resilient supply chain network design under operational and disruption risks with delivery lead-time sensitive customers. Transportation Research Part E: Logistics and Transportation Review, 101, 176-200.
113. Fattahi, M., Govindan, K., & Maihami, R. (2020). Stochastic optimization of
disruption-driven supply chain network design with a new resilience
metric. International Journal of Production Economics, 230, 107755.
114. Fazli-Khalaf, M., & Hamidieh, A. (2017). A robust reliable forward-reverse supply chain network design model under parameter and disruption uncertainties. International Journal of Engineering-Transactions B: Applications, 30(8), 1160-1169.
115. Fazli-Khalaf, M., Chaharsooghi, S. K., & Pishvaee, M. S. (2019). A new robust possibilistic programming model for reliable supply chain network design: A case study of lead-acid battery supply chain. RAIRO-Operations Research, 53(5), 1489-1512.
116. Fazli-Khalaf, M., Mirzazadeh, A., & Pishvaee, M. S. (2017). A robust fuzzy stochastic programming model for the design of a reliable green closed-loop supply chain network. Human and Ecological Risk Assessment: An International Journal, 23(8), 2119-2149.
117. Feng, Y., Zhu, Q., & Lai, K. H. (2017). Corporate social responsibility for supply chain
management: A literature review and bibliometric analysis. Journal of Cleaner
Production, 158, 296-307.
118. Filbeck, G., Kumar, S., Liu, J., Zhao, X., & Ellinger, A. (2016). Supply chain finance
and financial contagion from disruptions-evidence from the automobile
industry. International Journal of Physical Distribution & Logistics Management,
46(4).
119. Freudenreich, B., Lüdeke-Freund, F., & Schaltegger, S. (2019). A stakeholder theory
perspective on business models: Value creation for sustainability. Journal of
Business Ethics, 1-16.
120. Gabler, C. B., Richey Jr, R. G., & Stewart, G. T. (2017). Disaster resilience through public–private short‐term collaboration. Journal of Business Logistics, 38(2), 130-144.
41
121. Ganguly, K. K., Padhy, R. K., & Rai, S. S. (2017). Managing the humanitarian supply chain: a fuzzy logic approach. International Journal of Disaster Resilience in the Built Environment, 8(5), 521-536.
122. Gao, H., Ding, X., & Wu, S. (2020). Exploring the domain of open innovation:
bibliometric and content analyses. Journal of Cleaner Production, 122580.
123. Gao, S. Y., Simchi-Levi, D., Teo, C. P., & Yan, Z. (2019). Disruption risk mitigation in supply chains: The risk exposure index revisited. Operations Research, 67(3), 831-852.
124. Garcia-Appendini, E., & Montoriol-Garriga, J. (2013). Firms as liquidity providers:
Evidence from the 2007–2008 financial crisis. Journal of Financial
Economics, 109(1), 272-291.
125. Gasser, P., Lustenberger, P., Cinelli, M., Kim, W., Spada, M., Burgherr, P.,
Hischberg, S., Stojadinovic, B., & Sun, T. Y. (2019). A review on resilience
assessment of energy systems. Sustainable and Resilient Infrastructure, 1-27.
126. Geissdoerfer, M., Vladimirova, D., & Evans, S. (2018). Sustainable business model
innovation: A review. Journal of Cleaner Production, 198, 401-416.
127. Gelsomino, L. M., de Boer, R., Steeman, M., & Perego, A. (2019). An optimisation
strategy for concurrent Supply Chain Finance schemes. Journal of Purchasing and
Supply Management, 25(2), 185-196.
128. Ghorashi, S. B., Hamedi, M., & Sadeghian, R. (2019). Modeling and optimization of a reliable blood supply chain network in crisis considering blood compatibility using MOGWO. Neural Computing and Applications, 1-28.
129. Gligor, D. M., Esmark, C. L., & Holcomb, M. C. (2015). Performance outcomes of
supply chain agility: when should you be agile?. Journal of Operations
Management, 33, 71-82.
130. Gligor, D. M., Holcomb, M. C., & Feizabadi, J. (2016). An exploration of the
strategic antecedents of firm supply chain agility: The role of a firm's
orientations. International Journal of Production Economics, 179, 24-34.
131. Goh, S. H., & Eldridge, S. (2019). Sales and Operations Planning: The effect of coordination mechanisms on supply chain performance. International Journal of Production Economics, 214, 80-94.
132. Gölgeci, I., & Kuivalainen, O. (2020). Does social capital matter for supply chain
resilience? The role of absorptive capacity and marketing-supply chain
management alignment. Industrial Marketing Management, 84, 63-74.
133. Gölgeci, I., Karakas, F., & Tatoglu, E. (2019). Understanding demand and supply
paradoxes and their role in business-to-business firms. Industrial Marketing
Management, 76, 169-180.
134. Gomes, P. J., Silva, G. M., & Sarkis, J. (2020). Exploring the relationship between
quality ambidexterity and sustainable production. International Journal of
Production Economics, 224, 107560.
42
135. Gómez-Luciano, C. A., Domínguez, F. R. R., González-Andrés, F., & De Meneses, B.
U. L. (2018). Sustainable supply chain management: Contributions of supplies
markets. Journal of Cleaner Production, 184, 311-320.
136. Gonçalves, A. B., Schiozer, R. F., & Sheng, H. H. (2018). Trade credit and product
market power during a financial crisis. Journal of Corporate Finance, 49, 308-323.
137. Gong, Y., Jia, F., Brown, S., & Koh, L. (2018). Supply chain learning of sustainability
in multi-tier supply chains. International Journal of Operations & Production
Management, 38, 1061–1090.
138. Goni, F. A., Chofreh, A. G., Mukhtar, M., Sahran, S., Shukor, S. A., & Klemeš, J. J.
(2017). Strategic alignment between sustainability and information systems: A
case analysis in Malaysian public Higher Education Institutions. Journal of Cleaner
Production, 168, 263-270.
139. Goodarzian, F., Hosseini-Nasab, H., Muñuzuri, J., & Fakhrzad, M. B. (2020). A multi-objective pharmaceutical supply chain network based on a robust fuzzy model: A comparison of meta-heuristics. Applied Soft Computing, 106331.
140. Gosling, J., Purvis, L., & Naim, M. M. (2010). Supply chain flexibility as a
determinant of supplier selection. International Journal of Production
Economics, 128(1), 11-21.
141. Govindan, K., Fattahi, M., & Keyvanshokooh, E. (2017). Supply chain network
design under uncertainty: A comprehensive review and future research
directions. European Journal of Operational Research, 263(1), 108-141.
142. Govindan, K., Mina, H., & Alavi, B. (2020b). A decision support system for demand management in healthcare supply chains considering the epidemic outbreaks: A case study of coronavirus disease 2019 (COVID-19). Transportation Research Part E: Logistics and Transportation Review, 138, 101967.
143. Govindan, K., Shaw, M., & Majumdar, A. (2020a). Social Sustainability Tensions in
Multi-tier Supply Chain: A Systematic Literature Review towards Conceptual
Framework Development. Journal of Cleaner Production, 123075. (In press)
144. Green, K. W., Toms, L. C., & Clark, J. (2015). Impact of market orientation on
environmental sustainability strategy. Management Research Review, 38(2), 271-
238.
145. Gualandris, J., Legenvre, H., & Kalchschmidt, M. (2018). Exploration and
exploitation within supply networks. International Journal of Operations &
Production Management, 38(3), 667–689.
146. Guan, J., & Liu, N. (2016). Exploitative and exploratory innovations in knowledge
network and collaboration network: A patent analysis in the technological field of
nano-energy. Research Policy, 45(1), 97-112.
147. Güemes-Castorena, D., & Ruiz-Monroy, B. C. (2020). Ambidexterity in the supply chain: studying the apparel industry. International Journal of Agile Systems and Management, 13(2), 130-158.
43
148. Gunasekaran, A., Dubey, R., & Singh, S. P. (2016). Flexible sustainable supply chain
network design: Current trends, opportunities and future. Global Journal of
Flexible Systems Management, 17, 109-112.
149. Gunasekaran, A., Yusuf, Y. Y., Adeleye, E. O., Papadopoulos, T., Kovvuri, D., & Geyi,
D. A. G. (2019). Agile manufacturing: an evolutionary review of
practices. International Journal of Production Research, 57(15-16), 5154-5174.
150. Gupta, S., Starr, M. K., Zanjirani Farahani, R., & Ghodsi, M. M. (2020). Prevention of Terrorism–An Assessment of Prior POM Work and Future Potentials. Production and Operations Management, 29(7), 1789-1815.
151. Gupta, V., & Chutani, A. (2020). Supply chain financing with advance selling under disruption. International Transactions in Operational Research, 27(5), 2449-2468.
152. Gupta, V., He, B., & Sethi, S. P. (2015). Contingent sourcing under supply disruption
and competition. International Journal of Production Research, 53(10), 3006-3027.
153. Haddud, A., & Khare, A. (2020). Digitalizing supply chains potential benefits and impact on lean operations. International Journal of Lean Six Sigma, 11(4), 731-765.
154. Hajli, N., Tajvidi, M., Gbadamosi, A., & Nadeem, W. (2020). Understanding market
agility for new product success with big data analytics. Industrial Marketing
Management, 86, 135-143.
155. Hamdan, B., & Diabat, A. (2020). Robust design of blood supply chains under risk of disruptions using Lagrangian relaxation. Transportation Research Part E: Logistics and Transportation Review, 134, 101764.
156. Handfield, R., Sun, H., & Rothenberg, L. (2020). Assessing supply chain risk for apparel production in low cost countries using newsfeed analysis. Supply Chain Management: An International Journal, 25(6), 803-821.
157. Hasani, A., Mokhtari, H., & Fattahi, M. (2020). A multi-objective optimization approach for green and resilient supply chain network design: A real-life Case Study. Journal of Cleaner Production, 123199.
158. He, L., Wu, Z., Xiang, W., Goh, M., Xu, Z., Song, W., ... & Wu, X. (2020). A novel Kano-QFD-DEMATEL approach to optimise the risk resilience solution for sustainable supply chain. International Journal of Production Research, 1-22.
159. He, P., Ng, T. S., & Su, B. (2017). Energy-economic recovery resilience with Input-
Output linear programming models. Energy Economics, 68, 177-191.
160. He, Y., Guo, H., Jin, M., & Ren, P. (2016). A linguistic entropy weight method and its
application in linguistic multi-attribute group decision making. Nonlinear
Dynamics, 84(1), 399-404.
161. He, Z. L., & Wong, P. K. (2004). Exploration vs. exploitation: An empirical test of the
ambidexterity hypothesis. Organization Science, 15(4), 481-494.
162. Heracleous, L., & Werres, K. (2016). On the road to disaster: Strategic
misalignments and corporate failure. Long Range Planning, 49(4), 491-506.
163. Heydari, J., Aslani, A., & Sabbaghnia, A. (2019). A collaborative scenario-based decision model for a disrupted dual-channel supply chain. Benchmarking: An International Journal, 27(3), 933-957.
44
164. Hitt, M. A., Carnes, C. M., & Xu, K. (2016). A current view of resource based theory
in operations management: A response to Bromiley and Rau. Journal of Operations
Management, 41(10), 107-109.
165. Ho, W., Zheng, T., Yildiz, H., & Talluri, S. (2015). Supply chain risk management: a
literature review. International Journal of Production Research, 53(16), 5031-5069.
166. Hodder, I. (1994). The interpretation of documents and material culture. Sage
Biographical Research, 1.
167. Hodgkinson, I. R., Ravishankar, M. N., & Aitken-Fischer, M. (2014). A resource-
advantage perspective on the orchestration of ambidexterity. The Service
Industries Journal, 34(15), 1234-1252.
168. Hoffmann, D., Ahlemann, F., & Reining, S. (2020). Reconciling alignment, efficiency,
and agility in IT project portfolio management: Recommendations based on a
revelatory case study. International Journal of Project Management, 38(2), 124-
136.
169. Hofmann, E. (2005). Supply chain finance: some conceptual insights. Beiträge Zu
Beschaffung Und Logistik, 203-214.
170. Horne, J., Recker, M., Michelfelder, I., Jay, J., & Kratzer, J. (2020). Exploring
entrepreneurship related to the sustainable development goals-mapping new
venture activities with semi-automated content analysis. Journal of Cleaner
Production, 242, 118052.
171. Hosseini, S., & Ivanov, D. (2020). Bayesian networks for supply chain risk, resilience and ripple effect analysis: A literature review. Expert Systems with Applications, 161, 113649.
172. Hosseini, S., Ivanov, D., & Dolgui, A. (2020). Ripple effect modelling of supplier disruption: integrated Markov chain and dynamic Bayesian network approach. International Journal of Production Research, 58(11), 3284-3303.
173. Hosseini-Motlagh, S. M., Jazinaninejad, M., & Nami, N. (2020). Recall management in pharmaceutical industry through supply chain coordination. Annals of Operations Research, 1-39.
174. Hosseini-Motlagh, S. M., Nouri-Harzvili, M., Choi, T. M., & Ebrahimi, S. (2019). Reverse supply chain systems optimization with dual channel and demand disruptions: Sustainability, CSR investment and pricing coordination. Information Sciences, 503, 606-634.
175. Hu, B., & Kostamis, D. (2015). Managing supply disruptions when sourcing from
reliable and unreliable suppliers. Production and Operations Management, 24(5),
808-820.
176. Huang, Y. F., & Lu, L. H. (2020). The differentiated and ambidextrous influence of network flexibility on exploratory and exploitative partnership formations. International Journal of Physical Distribution & Logistics Management, 50(6), 577-599.
177. Hughes, L., Dwivedi, Y. K., Misra, S. K., Rana, N. P., Raghavan, V., & Akella, V.
(2019). Blockchain research, practice and policy: Applications, benefits, limitations,
45
emerging research themes and research agenda. International Journal of
Information Management, 49, 114-129.
178. Hwarng, H. B., & Yuan, X. (2014). Interpreting supply chain dynamics: A quasi-
chaos perspective. European Journal of Operational Research, 233(3), 566-579.
179. Im, G., Rai, A., & Lambert, L. S. (2019). Governance and resource‐sharing ambidexterity for generating relationship benefits in supply chain collaborations. Decision Sciences, 50(4), 656-693.
180. Ishikawa, A., Amagasa, M., Shiga, T., Tomizawa, G., Tatsuta, R., & Mieno, H. (1993).
The max-min Delphi method and fuzzy Delphi method via fuzzy integration. Fuzzy
Sets and Systems, 55(3), 241-253.
181. Ivanov, D. (2018). Revealing interfaces of supply chain resilience and sustainability: a simulation study. International Journal of Production Research, 56(10), 3507-3523.
182. Ivanov, D. (2020). Viable supply chain model: integrating agility, resilience and sustainability perspectives—lessons from and thinking beyond the COVID-19 pandemic. Annals of Operations Research, 1.
183. Ivanov, D., & Dolgui, A. (2019). Low-Certainty-Need (LCN) supply chains: a new
perspective in managing disruption risks and resilience. International Journal of
Production Research, 57(15-16), 5119-5136.
184. Ivanov, D., & Dolgui, A. (2020). Viability of intertwined supply networks: extending
the supply chain resilience angles towards survivability. A position paper
motivated by COVID-19 outbreak. International Journal of Production Research, 58,
2904-2015.
185. Ivanov, D., & Sokolov, B. (2019). Simultaneous structural–operational control of supply chain dynamics and resilience. Annals of Operations Research, 283(1-2), 1191-1210.
186. Ivanov, D., Dolgui, A., & Sokolov, B. (2018). Scheduling of recovery actions in the supply chain with resilience analysis considerations. International Journal of Production Research, 56(19), 6473-6490.
187. Ivanov, D., Dolgui, A., & Sokolov, B. (2019). The impact of digital technology and Industry 4.0 on the ripple effect and supply chain risk analytics. International Journal of Production Research, 57(3), 829-846.
188. Ivanov, D., Dolgui, A., Sokolov, B., & Ivanova, M. (2017). Literature review on
disruption recovery in the supply chain. International Journal of Production
Research, 55(20), 6158-6174.
189. Ivanov, D., Pavlov, A., Dolgui, A., Pavlov, D., & Sokolov, B. (2016). Disruption-driven
supply chain (re)-planning and performance impact assessment with consideration
of pro-active and recovery policies. Transportation Research Part E: Logistics and
Transportation Review, 90, 7-24.
190. Ivanov, D., Sokolov, B., Dolgui, A. (2014). The Ripple effect in supply chains: trade-
off ‘efficiency-flexibility-resilience’ in disruption management. International
Journal of Production Research, 52, 2154-2172.
46
191. Jabbarzadeh, A., Fahimnia, B., Sheu, J. B., & Moghadam, H. S. (2016). Designing a supply chain resilient to major disruptions and supply/demand interruptions. Transportation Research Part B: Methodological, 94, 121-149.
192. Jabbarzadeh, A., Haughton, M., & Khosrojerdi, A. (2018). Closed-loop supply chain network design under disruption risks: A robust approach with real world application. Computers & Industrial Engineering, 116, 178-191.
193. Jahani, H., Abbasi, B., Hosseinifard, Z., Fadaki, M., & Minas, J. P. (2020). Disruption risk management in service-level agreements. International Journal of Production Research, 1-19.
194. Jajja, M. S. S., Chatha, K. A., & Farooq, S. (2018). Impact of supply chain risk on
agility performance: Mediating role of supply chain integration. International
Journal of Production Economics, 205, 118-138.
195. Jajja, M. S. S., Kannan, V. R., Brah, S. A., & Hassan, S. Z. (2017). Linkages between
firm innovation strategy, suppliers, product innovation, and business
performance. International Journal of Operations & Production Management,
37(8), 1054–1075.
196. Jermsittiparsert, K., & Pithuk, L. (2019). Exploring the nexus between supply chain ambidexterity, supply chain agility, supply chain adaptability and the marketing sensing of manufacturing firms in Indonesia. Humanities & Social Sciences Reviews, 7(2), 555-562.
197. Jin, R., Gao, S., Cheshmehzangi, A., & Aboagye-Nimo, E. (2018). A holistic review of
off-site construction literature published between 2008 and 2018. Journal of
Cleaner Production, 202, 1202-1219.
198. Jonsson, P., Andersson, D., Fabbe‐Costes, N., Roussat, C., & Colin, J. (2011). Future
sustainable supply chains: what should companies scan?. International Journal of
Physical Distribution & Logistics Management, 41(3), 241.
199. Junni, P., Sarala, R. M., Taras, V., & Tarba, S. Y. (2013). Organizational
ambidexterity and performance: A meta-analysis. Academy of Management
Perspectives, 27(4), 299-312.
200. Kahiluoto, H., Mäkinen, H., & Kaseva, J. (2020). Supplying resilience through assessing diversity of responses to disruption. International Journal of Operations & Production Management, 40(3), 271-292.
201. Kale, E., Aknar, A., & Başar, Ö. (2019). Absorptive capacity and firm performance:
The mediating role of strategic agility. International Journal of Hospitality
Management, 78, 276-283.
202. Kamalahmadi, M., & Mellat-Parast, M. (2016). Developing a resilient supply chain
through supplier flexibility and reliability assessment. International Journal of
Production Research, 54(1), 302-321.
203. Kamble, S. S., Gunasekaran, A., & Sharma, R. (2020). Modeling the blockchain enabled traceability in agriculture supply chain. International Journal of Information Management, 52, 101967.
47
204. Kauppi, K., Longoni, A., Caniato, F., & Kuula, M. (2016). Managing country
disruption risks and improving operational performance: risk management along
integrated supply chains. International Journal of Production Economics, 182, 484-
495.
205. Kauppila, O. P. (2015). Alliance management capability and firm performance:
Using resource-based theory to look inside the process black box. Long Range
Planning, 48(3), 151-167.
206. Kazemi, N., Modak, N. M., & Govindan, K. (2019). A review of reverse logistics and
closed loop supply chain management studies published in IJPR: a bibliometric and
content analysis. International Journal of Production Research, 57(15-16), 4937-
4960.
207. Kbah, Z., Erdil, N. O., & Aqlan, F. (2020). RISK ASSESSMENT IN OIL AND GAS INDUSTRY USING SIMULATION AND BOW-TIE ANALYSIS. International Journal of Industrial Engineering, 27(1).
208. Kerry-Krause, M. J., & DeSimone, J. (2019). Learning organizational ambidexterity:
a joint-variance synthesis of exploration-exploitation modes on performance. The
Learning Organization, 4(1), 109-155.
209. Khalilpourazari, S., Soltanzadeh, S., Weber, G. W., & Roy, S. K. (2020). Designing an efficient blood supply chain network in crisis: neural learning, optimization and case study. Annals of Operations Research, 289(1), 123-152.
210. Khan, Z., Lew, Y. K., & Marinova, S. (2019). Exploitative and exploratory
innovations in emerging economies: The role of realized absorptive capacity and
learning intent. International Business Review, 28(3), 499-512.
211. Kim, M., & Chai, S. (2017). Implementing environmental practices for accomplishing sustainable green supply chain management. Sustainability, 9(7), 1192.
212. Kim, S., & Toya, K. (2019). Leadership style required for the transition to
servitization in Japan. Journal of Manufacturing Technology Management, 30 2),
335–352.
213. Kinra, A., Ivanov, D., Das, A., & Dolgui, A. (2020). Ripple effect quantification by supplier risk exposure assessment. International Journal of Production Research, 58(18), 5559-5578.
214. Kitchens, B., Dobolyi, D., Li, J., & Abbasi, A. (2018). Advanced customer analytics:
Strategic value through integration of relationship-oriented big data. Journal of
Management Information Systems, 35(2), 540-574.
215. Koberg, E., & Longoni, A. (2019). A systematic review of sustainable supply chain
management in global supply chains. Journal of cleaner production, 207, 1084-
1098
216. Kocamaz, U. E., Taşkın, H., Uyaroğlu, Y., & Göksu, A. (2016). Control and synchronization of chaotic supply chains using intelligent approaches. Computers & Industrial Engineering, 102, 476-487.
48
217. Konig, A., & Spinler, S. (2016). The effect of logistics outsourcing on the supply chain vulnerability of shippers: development of a conceptual risk management framework. International Journal of Logistics Management.
218. Koufteros, X., Vonderembse, M., & Jayaram, J. (2005). Internal and external
integration for product development: the contingency effects of uncertainty,
equivocality, and platform strategy. Decision Sciences, 36(1), 97-133.
219. Kristal, M. M., Huang, X., & Roth, A. V. (2010). The effect of an ambidextrous
supply chain strategy on combinative competitive capabilities and business
performance. Journal of Operations Management, 28(5), 415-429.
220. Kumar, M., Basu, P., & Avittathur, B. (2018). Pricing and sourcing strategies for competing retailers in supply chains under disruption risk. European Journal of Operational Research, 265(2), 533-543.
221. Kumar, P. S., & Anbanandam, R. (2020). Theory Building on Supply Chain Resilience: A SAP–LAP Analysis. Global Journal of Flexible Systems Management, 1-21.
222. Kumaran, M., Geetha, R., Antony, J., Vasagam, K. K., Anand, P. R., Ravisankar, T., ... & Vijayan, K. K. (2020). Prospective impact of Corona virus disease (COVID-19) related lockdown on shrimp aquaculture sector in India–a sectoral assessment. Aquaculture, 735922.
223. Kwak, D. W., Seo, Y. J., & Mason, R. (2018). Investigating the relationship between
supply chain innovation, risk management capabilities and competitive advantage
in global supply chains. International Journal of Operations & Production
Management, 38(1), 2–21.
224. Laine, I., & Galkina, T. (2017). The interplay of effectuation and causation in
decision making: Russian SMEs under institutional uncertainty. International
Entrepreneurship and Management Journal, 13(3), 905-941.
225. Lam, H. K., Zhan, Y., Zhang, M., Wang, Y., & Lyons, A. (2019). The effect of supply
chain finance initiatives on the market value of service providers. International
Journal of Production Economics, 216, 227-238.
226. Lavie, D., Stettner, U., & Tushman, M. L. (2010). Exploration and exploitation
within and across organizations. Academy of Management Annals, 4(1), 109-155.
227. Ledwoch, A., Yasarcan, H., & Brintrup, A. (2018). The moderating impact of supply network topology on the effectiveness of risk management. International Journal of Production Economics, 197, 13-26.
228. Lee, S. M., & Rha, J. S. (2016). Ambidextrous supply chain as a dynamic capability:
building a resilient supply chain. Management Decision, 54(1), 2–23.
229. Leuschner, R., Rogers, D. S., & Charvet, F. F. (2013). A meta‐analysis of supply chain
integration and firm performance. Journal of Supply Chain Management, 49(2), 34-
57.
230. Li, J., Luo, X., Wang, Q., & Zhou, W. (2020). Supply chain coordination through
capacity reservation contract and quantity flexibility contract. Omega, 102195. (In
press)
49
231. Li, S., & Chen, X. (2019). The role of supply chain finance in third-party logistics
industry: a case study from China. International Journal of Logistics Research and
Applications, 22(2), 154-171.
232. Li, X., & Zhang, K. (2018). A sample average approximation approach for supply chain network design with facility disruptions. Computers & Industrial Engineering, 126, 243-251.
233. Li, Y., & Zobel, C. W. (2020). Exploring supply chain network resilience in the
presence of the ripple effect. International Journal of Production Economics,
107693.
234. Li, Y., Xu, F., & Zhao, X. (2017). Governance mechanisms of dual-channel reverse supply chains with informal collection channel. Journal of Cleaner Production, 155, 125-140.
235. Lim, M. K., Mak, H. Y., & Shen, Z. J. M. (2017). Agility and proximity considerations
in supply chain design. Management Science, 63(4), 1026-1041.
236. Linkov, I., Trump, B.D., & Keisler, J. (2018). Risk and resilience must be
independently managed. Nature, 555,
237. Liu, J. G., Zhou, Y. X., Lu, B., & Zhao, J. L. (2015b). The reduction mechanism of supply chain vulnerability based on supply chain disruption risk. Systems Engineering-Theory & Practice, 3(003).
238. Liu, X., Li, J., Wu, J., & Zhang, G. (2017). Coordination of supply chain with a dominant retailer under government price regulation by revenue sharing contracts. Annals of Operations Research, 257(1-2), 587-612.
239. Liu, X., Zhou, L., & Wu, Y. C. J. (2015a). Supply chain finance in China: Business
innovation and theory development. Sustainability, 7(11), 14689-14709.
240. Lohmer, J., Bugert, N., & Lasch, R. (2020). Analysis of resilience strategies and ripple effect in blockchain-coordinated supply chains: An agent-based simulation study. International Journal of Production Economics, 228, 107882.
241. López, C., & Ishizaka, A. (2019). A hybrid FCM-AHP approach to predict impacts of offshore outsourcing location decisions on supply chain resilience. Journal of Business Research, 103, 495-507.
242. Lotfi, M., & Saghiri, S. (2018). Disentangling resilience, agility and leanness. Journal of Manufacturing Technology Management, 29(1), 168-197.
243. Lu, Q., Gu, J., & Huang, J. (2019). Supply chain finance with partial credit guarantee
provided by a third-party or a supplier. Computers & Industrial Engineering, 135,
440-455.
244. Ma, J., Ma, X., & Lou, W. (2016). Analysis of the Complexity Entropy and Chaos Control of the Bullwhip Effect Considering Price of Evolutionary Game between Two Retailers. Entropy, 18(11), 416.
245. Ma, Y., & Li, W. (2020). Application and research of fractional differential
equations in dynamic analysis of supply chain financial chaotic system. Chaos,
Solitons & Fractals, 130, 109417.
50
246. MacDonald, E. F., & She, J. (2015). Seven cognitive concepts for successful eco-
design. Journal of Cleaner Production, 92, 23-36.
247. Magill, L. J., Jafarifar, N., Watson, A., & Omotayo, T. (2020). 4D BIM integrated
construction supply chain logistics to optimise on-site production. International
Journal of Construction Management, 1-10.
248. Maiyar, L. M., & Thakkar, J. J. (2020). Robust optimisation of sustainable food grain
transportation with uncertain supply and intentional disruptions. International
Journal of Production Research, 58(18), 5651-5675.
249. Majeed, A., Zhang, Y., Ren, S., Lv, J., Peng, T., Waqar, S., & Yin, E. (2021). A big
data-driven framework for sustainable and smart additive manufacturing. Robotics
and Computer-Integrated Manufacturing, 67, 102026.
250. Makhashen, Y. B., Rafi-ul-Shan, P. M., Bashiri, M., Hasan, R., Amar, H., & Khan, M. N. (2020). Exploring the role of ambidexterity and coopetition in designing resilient fashion supply chains: a multi-evidence-based approach. Journal of Enterprise Information Management.
251. Mandal, S. (2015). Towards an empirical-relational model of supply chain flexibility. International Journal of Information Systems and Supply Chain Management (IJISSCM), 8(3), 67-86.
252. Mangla, S. K., Kumar, P., & Barua, M. K. (2015). Flexible decision modeling for evaluating the risks in green supply chain using fuzzy AHP and IRP methodologies. Global Journal of Flexible Systems Management, 16(1), 19-35.
253. Mari, S. I., Lee, Y. H., & Memon, M. S. (2014). Sustainable and resilient supply chain network design under disruption risks. Sustainability, 6(10), 6666-6686.
254. Maroufkhani, P., Tseng, M. L., Iranmanesh, M., Ismail, W. K. W., & Khalid, H.
(2020). Big data analytics adoption: Determinants and performances among small
to medium-sized enterprises. International Journal of Information
Management, 54, 102190.
255. Marshall, D., McCarthy, L., Heavey, C., & McGrath, P. (2015). Environmental and
social supply chain management sustainability practices: construct development
and measurement. Production Planning & Control, 26(8), 673-690.
256. Matsuo, H. (2015). Implications of the Tohoku earthquake for Toyota׳ s
coordination mechanism: Supply chain disruption of automotive
semiconductors. International Journal of Production Economics, 161, 217-227.
257. Messina, D., Barros, A. C., Soares, A. L., & Matopoulos, A. (2020). An information management approach for supply chain disruption recovery. The International Journal of Logistics Management, 31(3), 489-519.
258. Mikhail, M., El-Beheiry, M., & Afia, N. (2019). Incorporating resilience determinants in supply chain network design model. Journal of Modelling in Management, 14(3), 738-753.
259. Mogos, M. F., Fredriksson, A., & Alfnes, E. (2019). A production transfer procedure based on risk management principles. Journal of Global Operations and Strategic Sourcing, 12(1), 103-150.
51
260. Mohammed, A., Harris, I., Soroka, A., Naim, M., Ramjaun, T., & Yazdani, M. (2020). Gresilient supplier assessment and order allocation planning. Annals of Operations Research, 1-28.
261. Montshiwa, A. L., & Nagahira, A. (2015). Impacts of Business Continuity Management (BCM) on Automobile Parts Makers Against Natural Disaster Events. Journal of Disaster Research, 10(6), 1091-1098.
262. Moon, K. K. L., Yi, C. Y., & Ngai, E. W. T. (2012). An instrument for measuring supply
chain flexibility for the textile and clothing companies. European Journal of
Operational Research, 222(2), 191-203.
263. Morsing, M., & Spence, L. J. (2019). Corporate social responsibility (CSR) communication and small and medium sized enterprises: The governmentality dilemma of explicit and implicit CSR communication. Human Relations, 72(12), 1920-1947.
264. Mortazavi, A., Khamseh, A. A., & Naderi, B. (2015). A novel chaotic imperialist competitive algorithm for production and air transportation scheduling problems. Neural Computing and Applications, 26(7), 1709-1723.
265. Mota, B., Gomes, M. I., Carvalho, A., & Barbosa-Povoa, A. P. (2015). Towards
supply chain sustainability: economic, environmental and social design and
planning. Journal of Cleaner Production, 105, 14-27.
266. Muduli, K., & Barve, A. (2015). Analysis of critical activities for GSCM implementation in mining supply chains in India using fuzzy analytical hierarchy process. International Journal of Business Excellence, 8(6), 767-797.
267. Munir, M., Jajja, M. S. S., Chatha, K. A., & Farooq, S. (2020). Supply chain risk
management and operational performance: The enabling role of supply chain
integration. International Journal of Production Economics, 227, 107667.
268. Nakatani, J., Tahara, K., Nakajima, K., Daigo, I., Kurishima, H., Kudoh, Y., ... & Nishijima, A. (2018). A graph theory-based methodology for vulnerability assessment of supply chains using the life cycle inventory database. Omega, 75, 165-181.
269. Namdar, J., Li, X., Sawhney, R., & Pradhan, N. (2018). Supply chain resilience for single and multiple sourcing in the presence of disruption risks. International Journal of Production Research, 56(6), 2339-2360.
270. Nassar, S., Kandil, T., Kara, M. E., & Ghadge, A. (2019). Automotive recall risk:
impact of buyer‒supplier relationship on supply chain social
sustainability. International Journal of Productivity and Performance
Management,69(3), 467-487.
271. Nayak, G., & Dhaigude, A. S. (2019). A conceptual model of sustainable supply chain management in small and medium enterprises using blockchain technology. Cogent Economics & Finance, 7(1), 1667184.
272. Nezamoddini, N., Gholami, A., & Aqlan, F. (2020). A risk-based optimization framework for integrated supply chains using genetic algorithm and artificial neural networks. International Journal of Production Economics, 225, 107569.
52
273. Ngai, E. W., Chau, D. C., & Chan, T. L. A. (2011). Information technology,
operational, and management competencies for supply chain agility: Findings from
case studies. The Journal of Strategic Information Systems, 20(3), 232-249.
274. Nguyen, H., Sharkey, T. C., Mitchell, J. E., & Wallace, W. A. (2020). Optimizing the recovery of disrupted single-sourced multi-echelon assembly supply chain networks. IISE Transactions, 52(7), 703-720.
275. Ni, N., Little, R. G., Sharkey, T. C., & Wallace, W. (2019). Modelling the recovery of
critical commercial services and their interdependencies on civil
infrastructures. International Journal of Critical Infrastructures, 15(4), 355-382.
276. Nilakantan, K. (2019). Replenishment control systems for responsive supply chains under dynamic and sudden lead-time disturbances. International Journal of Systems Science: Operations & Logistics, 6(4), 320-345.
277. Niu, B., Xie, F., Mu, Z., & Ji, P. (2020). Multinational firms’ local sourcing strategies considering unreliable supply and environmental sustainability. Resources, Conservation and Recycling, 155, 104648.
278. Nooraie, V., Fathi, M., Narenji, M., Parast, M. M., Pardalos, P. M., & Stanfield, P. M.
(2020). A multi-objective model for risk mitigating in supply chain
design. International Journal of Production Research, 58(5), 1338-1361.
279. Ojha, D., Acharya, C., & Cooper, D. (2018). Transformational leadership and supply
chain ambidexterity: Mediating role of supply chain organizational learning and
moderating role of uncertainty. International Journal of Production
Economics, 197, 215-231.
280. Olivares-Aguila, J., & ElMaraghy, W. (2020). System dynamics modelling for supply chain disruptions. International Journal of Production Research, 1-19.
281. Oliveira, M. P. V. D., & Handfield, R. (2019). Analytical foundations for development of real-time supply chain capabilities. International Journal of Production Research, 57(5), 1571-1589.
282. O'Reilly III, C. A., & Tushman, M. L. (2013). Organizational ambidexterity: Past,
present, and future. Academy of Management Perspectives, 27(4), 324-338.
283. Ortas, E., Moneva, J. M., & Álvarez, I. (2014). Sustainable supply chain and
company performance: A global examination. Supply Chain Management: An
International Journal, 19(3), 332-350.
284. Palm, E., Bodin, U., & Schelén, O. (2020). Approaching Non-Disruptive Distributed Ledger Technologies via the Exchange Network Architecture. IEEE Access, 8, 12379-12393.
285. Palma, F., Saucedo, J. A., Marmolejo-Saucedo, J. A., & Rodriguez-Aguilar, R. (2019). The supply chain event management application: a case study. IFAC-PapersOnLine, 52(13), 2698-2703.
286. Parast, M. M. (2020). The impact of R&D investment on mitigating supply chain
disruptions: Empirical evidence from US firms. International Journal of Production
Economics, 227, 107671.
53
287. Parast, M. M., Sabahi, S., & Kamalahmadi, M. (2019). The Relationship Between
Firm Resilience to Supply Chain Disruptions and Firm Innovation. In Revisiting
Supply Chain Risk (pp. 279-298). Springer, Cham, Switzerland.
288. Partanen, J., Kohtamäki, M., Patel, P. C., & Parida, V. (2020). Supply chain
ambidexterity and manufacturing SME performance: The moderating roles of
network capability and strategic information flow. International Journal of
Production Economics, 221, 107470.
289. Pashapour, S., Bozorgi-Amiri, A., Azadeh, A., Ghaderi, S. F., & Keramati, A. (2019). Performance optimization of organizations considering economic resilience factors under uncertainty: A case study of a petrochemical plant. Journal of Cleaner Production, 231, 1526-1541.
290. Patel, P. C., Terjesen, S., & Li, D. (2012). Enhancing effects of manufacturing
flexibility through operational absorptive capacity and operational
ambidexterity. Journal of Operations Management, 30(3), 201-220.
291. Paul, S. K., & Chowdhury, P. (2020). Strategies for Managing the Impacts of Disruptions During COVID-19: An Example of Toilet Paper. Global Journal of Flexible Systems Management, 21(3), 283-293.
292. Paul, S., Kabir, G., Ali, S. M., & Zhang, G. (2020). Examining transportation disruption risk in supply chains: A case study from Bangladeshi pharmaceutical industry. Research in Transportation Business & Management, 100485.
293. Pettit, T. J., Croxton, K. L., & Fiksel, J. (2013). Ensuring supply chain resilience:
development and implementation of an assessment tool. Journal of Business
Logistics, 34(1), 46-76.
294. Pettit, T. J., Croxton, K. L., & Fiksel, J. (2019). The evolution of resilience in supply
chain management: a retrospective on ensuring supply chain resilience. Journal of
Business Logistics, 40(1), 56-65.
295. Phelps, C. C. (2010). A longitudinal study of the influence of alliance network
structure and composition on firm exploratory innovation. Academy of
Management Journal, 53(4), 890-913.
296. Pillai, K. G., Hodgkinson, G. P., Kalyanaram, G., & Nair, S. R. (2017). The negative
effects of social capital in organizations: A review and extension. International
Journal of Management Reviews, 19(1), 97-124.
297. Piprani, A. Z., Jaafar, N. I., & Ali, S. M. (2020). Prioritizing resilient capability factors of dealing with supply chain disruptions: an analytical hierarchy process (AHP) application in the textile industry. Benchmarking: An International Journal.
298. Piri, I. S., Das, O., Hedenqvist, M. S., Väisänen, T., Ikram, S., & Bhattacharyya, D. (2018). Imparting resiliency in biocomposite production systems: a system dynamics approach. Journal of Cleaner Production, 179, 450-459.
299. Polyviou, M., Croxton, K. L., & Knemeyer, A. M. (2019). Resilience of medium-sized firms to supply chain disruptions: the role of internal social capital. International Journal of Operations & Production Management, 40(1), 68-91.
54
300. Ponis, S. T., & Koronis, E. (2012). Supply Chain Resilience? Definition of concept
and its formative elements. The Journal of Applied Business Research, 28(5), 921-
935.
301. Ponomarov, S. Y., & Holcomb, M. C. (2009). Understanding the concept of supply
chain resilience. The International Journal of Logistics Management.
302. Princes, E. (2020). Integrating Ambidexterity into the Modern Manufacturing Era of Industry 4.0. International Journal of Supply Chain Management, 9(4), 58-64.
303. Pu, X., Wang, Z., & Chan, F. T. S. (2018). Leveraging Open E-Logistic Standards to Achieve Ambidexterity in Supply Chain. Journal of Computer Information Systems, 1-12.
304. Qamar, A., Gardner, E. C., Buckley, T., & Zhao, K. (2019). Home-owned versus
foreign-owned firms in the UK automotive industry: Exploring the
microfoundations of ambidextrous production and supply chain
positioning. International Business Review, 101657.
305. Quayson, M., Bai, C., & Osei, V. (2020). Digital Inclusion for Resilient Post-COVID-19 Supply Chains: Smallholder Farmer Perspectives. IEEE Engineering Management Review.
306. Queiroz, M. M., Pereira, S. C. F., Telles, R., & Machado, M. C. (2019). Industry 4.0 and digital supply chain capabilities. Benchmarking: An International Journal.
307. Rajeev, A., Pati, R. K., Padhi, S. S., & Govindan, K. (2017). Evolution of sustainability
in supply chain management: A literature review. Journal of Cleaner
Production, 162, 299-314.
308. Rajesh, R. (2016). Forecasting supply chain resilience performance using grey prediction. Electronic Commerce Research and Applications, 20, 42-58.
309. Rashad, W., & Nedelko, Z. (2020). Global Sourcing Strategies: A Framework for Lean, Agile, and Leagile. Sustainability, 12(17), 7199.
310. Rebs, T., Brandenburg, M., & Seuring, S. (2019). System dynamics modeling for
sustainable supply chain management: A literature review and systems thinking
approach. Journal of Cleaner Production, 208, 1265-1280.
311. Remko, V. H. (2020). Research opportunities for a more resilient post-COVID-19 supply chain–closing the gap between research findings and industry practice. International Journal of Operations & Production Management, 40(4), 341-355.
312. Revilla, E., & Saenz, M. J. (2017). The impact of risk management on the frequency
of supply chain disruptions. International Journal of Operations & Production
Management, 37(5), 557-576.
313. Rodríguez-Espíndola, O., Chowdhury, S., Beltagui, A., & Albores, P. (2020). The potential of emergent disruptive technologies for humanitarian supply chains: the integration of blockchain, Artificial Intelligence and 3D printing. International Journal of Production Research, 1-21.
55
314. Rojo, A., Llorens-Montes, J., & Perez-Arostegui, M. N. (2016). The impact of
ambidexterity on supply chain flexibility fit. Supply Chain Management: An
International Journal, 21(4), 433-452.
315. Rojo-Gallego-Burin, A., Llorens-Montes, F. J., Perez-Arostegui, M. N., & Stevenson, M. (2020). Ambidextrous supply chain strategy and supply chain flexibility: the contingent effect of ISO 9001. Industrial Management & Data Systems, 120(9), 1691-1714.
316. Roscoe, S., Skipworth, H., Aktas, E., & Habib, F. (2020). Managing supply chain uncertainty arising from geopolitical disruptions: evidence from the pharmaceutical industry and brexit. International Journal of Operations & Production Management.
317. Roy, M., & Roy, A. (2019). Nexus of Internet of Things (IoT) and Big Data: Roadmap for Smart Management Systems (SMgS). IEEE Engineering Management Review, 47(2), 53-65.
318. Saenz, M. J., Koufteros, X., Hohenstein, N. O., Feisel, E., Hartmann, E., & Giunipero,
L. (2015). Research on the phenomenon of supply chain resilience. International
Journal of Physical Distribution & Logistics Management.
319. Sahi, G. K., Gupta, M. C., & Cheng, T. C. E. (2020). The effects of strategic
orientation on operational ambidexterity: A study of indian SMEs in the industry
4.0 era. International Journal of Production Economics, 220, 107395.
320. Sahu, A. K., Sahu, S. K., Datta, S., & Mahapatra, S. S. (2015). Supply chain flexibility assessment and decision-making: a fuzzy intelligent approach. International Journal of Business Excellence, 8(6), 675-699.
321. Salehi, F., Mahootchi, M., & Husseini, S. M. M. (2019). Developing a robust stochastic model for designing a blood supply chain network in a crisis: a possible earthquake in Tehran. Annals of Operations Research, 283(1-2), 679-703.
322. Salmi, M., Akmal, J. S., Pei, E., Wolff, J., Jaribion, A., & Khajavi, S. H. (2020). 3D Printing in COVID-19: Productivity Estimation of the Most Promising Open Source Solutions in Emergency Situations. Applied Sciences, 10(11), 4004.
323. Salvador, F., Chandrasekaran, A., & Sohail, T. (2014). Product configuration,
ambidexterity and firm performance in the context of industrial equipment
manufacturing. Journal of Operations Management, 32(4), 138-153.
324. Samani, M. R. G., Hosseini-Motlagh, S. M., & Homaei, S. (2020). A reactive phase against disruptions for designing a proactive platelet supply network. Transportation Research Part E: Logistics and Transportation Review, 140, 102008.
325. Sarma, D., Das, A., & Bera, U. K. (2020). An optimal redistribution plan considering aftermath disruption in disaster management. Soft Computing, 24(1), 65-82.
326. Sato, Y., Tse, Y. K., & Tan, K. H. (2020). Managers' risk perception of supply chain uncertainties. Industrial Management & Data Systems, 120(9), 1617-1634.
327. Sawik, T. (2019a). A two-period model for selection of resilient multi-tier supply portfolio. International Journal of Production Research, 1-18.
56
328. Sawik, T. (2019b). Disruption mitigation and recovery in supply chains using portfolio approach. Omega, 84, 232-248.
329. Scavarda, L. F., Reichhart, A., Hamacher, S., & Holweg, M. (2010). Managing
product variety in emerging markets. International Journal of Operations &
Production Management, 30(2), 205–224.
330. Schaltegger, S., Hansen, E. G., & Lüdeke-Freund, F. (2016). Business models for
sustainability: Origins, present research, and future avenues. Organizations &
Environment, 29(1), 3-10.
331. Schätter, F., Hansen, O., Wiens, M., & Schultmann, F. (2019). A decision support
methodology for a disaster-caused business continuity management. Decision
Support Systems, 118, 10-20.
332. Scheper, C. (2017). Labour networks under supply chain capitalism: the politics of the Bangladesh Accord. Development and Change, 48(5), 1069-1088.
333. Scholten, K., & Schilder, S. (2015). The role of collaboration in supply chain resilience. Supply Chain Management: An International Journal, 20(4), 471-484.
334. Scholten, K., Scott, P. S., & Fynes, B. (2019). Building routines for non-routine events: supply chain resilience learning mechanisms and their antecedents. Supply Chain Management: An International Journal, 24(3), 430-442.
335. Scott, N. (2016). The impact of ambidexterity in supply chain capabilities on manufacturing performance: examples from the global semiconductor industry. International Journal of Logistics Systems and Management, 23(3), 394-417.
336. Senyo, P. K., Liu, K., & Effah, J. (2019). Digital business ecosystem: Literature
review and a framework for future research. International Journal of Information
Management, 47, 52-64.
337. Seuring, S., & Gold, S. (2012). Conducting content‐analysis based literature reviews
in supply chain management. Supply Chain Management: An International Journal.
338. Seuring, S., & Müller, M. (2008). From a literature review to a conceptual
framework for sustainable supply chain management. Journal of Cleaner
Production, 16(15), 1699-1710.
339. Shah, S. A. A., Jajja, M. S. S., Chatha, K. A., & Farooq, S. (2020). Servitization and
supply chain integration: An empirical analysis. International Journal of Production
Economics, 229, 107765.
340. Shahbaz, M. S., Othman, B. A., Salman, P. M., Memon, D. A., & Rasi, R. Z. B. R. M. (2020). A proposed conceptual action plan for identification, assessment and mitigation of supply chain risks. International Journal of Advanced Operations Management, 12(1), 65-80.
341. Shahbaz, M. S., Rasi, R. Z. R., & Ahmad, M. F. B. (2019). A novel classification of supply chain risks: Scale development and validation. Journal of Industrial Engineering and Management, 12(1), 201-218.
57
342. Shams, R., Vrontis, D., Belyaeva, Z., Ferraris, A., & Czinkota, M. R. (2020). Strategic agility in international business: A conceptual framework for “agile” multinationals. Journal of International Management, 100737.
343. Shareef, M. A., Dwivedi, Y. K., Kumar, V., Hughes, D. L., & Raman, R. (2020). Sustainable supply chain for disaster management: structural dynamics and disruptive risks. Annals of Operations Research, 1-25.
344. Sharifi, M., Hosseini-Motlagh, S. M., Samani, M. R. G., & Kalhor, T. (2020). Novel resilient-sustainable strategies for second-generation biofuel network design considering Neem and Eruca Sativa under hybrid stochastic fuzzy robust approach. Computers & Chemical Engineering, 107073.
345. Sharma, R., Kamble, S. S., Gunasekaran, A., Kumar, V., & Kumar, A. (2020). A systematic literature review on machine learning applications for sustainable agriculture supply chain performance. Computers & Operations Research, 104926.
346. Sheel, A., & Nath, V. (2019). Effect of blockchain technology adoption on supply chain adaptability, agility, alignment and performance. Management Research Review, 42(12), 1353-1347.
347. Shekarian, M., & Mellat Parast, M. (2020). An Integrative approach to supply chain disruption risk and resilience management: a literature review. International Journal of Logistics Research and Applications, 1-29.
348. Shekarian, M., Nooraie, S. V. R., & Parast, M. M. (2020). An examination of the
impact of flexibility and agility on mitigating supply chain disruptions. International
Journal of Production Economics, 220, 107438.
349. Shekarian, M., Nooraie, S. V. R., & Parast, M. M. (2020). An examination of the impact of flexibility and agility on mitigating supply chain disruptions. International Journal of Production Economics, 220, 107438.
350. Shen, H., Liang, Y., Shen, Z. J. M., & Teo, C. P. (2019). Reliable flexibility design of
supply chains via extended probabilistic expanders. Production and Operations
Management, 28(3), 700-720.
351. Sheu, J. B., & Kuo, H. T. (2020). Dual speculative hoarding: A wholesaler-retailer channel behavioral phenomenon behind potential natural hazard threats. International Journal of Disaster Risk Reduction, 44, 101430.
352. Shqairat, A., & Sundarakani, B. (2018). An empirical study of oil and gas value chain agility in the UAE. Benchmarking: An International Journal, 25(9), 3541-3569.
353. Shukla, A. K., Janmaijaya, M., Abraham, A., & Muhuri, P. K. (2019). Engineering
applications of artificial intelligence: A bibliometric analysis of 30 years (1988–
2018). Engineering Applications of Artificial Intelligence, 85, 517-532
354. Shukor, A. A. A., Newaz, M. S., Rahman, M. K., & Taha, A. Z. (2020). Supply chain integration and its impact on supply chain agility and organizational flexibility in manufacturing firms. International Journal of Emerging Markets.
355. Silvestre, B. S., Monteiro, M. S., Viana, F. L. E., & de Sousa-Filho, J. M. (2018). Challenges for sustainable supply chain management: When stakeholder collaboration becomes conducive to corruption. Journal of Cleaner Production, 194, 766-776.
58
356. Singh, N. P., & Singh, S. (2019). Building supply chain risk resilience. Benchmarking: An International Journal, 26(7), 2318-2342.
357. Singh, S., Ghosh, S., Jayaram, J., & Tiwari, M. K. (2019). Enhancing supply chain resilience using ontology-based decision support system. International Journal of Computer Integrated Manufacturing, 32(7), 642-657.
358. Smeda, J. (2017). Distinctive organisational business imperatives of Big Data: a
literature review. The Electronic Library, 35(6), 1087-1097.
359. Snediker, D. E., Murray, A. T., & Matisziw, T. C. (2008). Decision support for
network disruption mitigation. Decision Support Systems, 44(4), 954-969.
360. Snoeck, A., Udenio, M., & Fransoo, J. C. (2019). A stochastic program to evaluate disruption mitigation investments in the supply chain. European Journal of Operational Research, 274(2), 516-530.
361. Song, M., & Di Benedetto, C. A. (2008). Supplier's involvement and success of
radical new product development in new ventures. Journal of Operations
Management, 26(1), 1-22.
362. Soren, A., & Shastri, Y. (2019). Resilient design of biomass to energy system considering uncertainty in biomass supply. Computers & Chemical Engineering, 131, 106593.
363. Souza-Luz, A. R., & Gavronski, I. (2019). Ambidextrous supply chain managers in a slow clockspeed industry: evidence from a Brazilian adhesive manufacturer. Supply Chain Management: An International Journal, 25(1), 101-114.
364. Sprecher, B., Daigo, I., Murakami, S., Kleijn, R., Vos, M., & Kramer, G. J. (2015).
Framework for resilience in material supply chains, with a case study from the
2010 rare earth crisis. Environmental Science & Technology, 49(11), 6740-6750.
365. Sreedevi, R., & Saranga, H. (2017). Uncertainty and supply chain risk: The
moderating role of supply chain flexibility in risk mitigation. International Journal
of Production Economics, 193, 332-342.
366. Sreedevi, R., & Saranga, H. (2017). Uncertainty and supply chain risk: The
moderating role of supply chain flexibility in risk mitigation. International Journal
of Production Economics, 193, 332-342.
367. Stettner, U., & Lavie, D. (2014). Ambidexterity under scrutiny: Exploration and
exploitation via internal organization, alliances, and acquisitions. Strategic
Management Journal, 35(13), 1903-1929.
368. Stewart, M., & Ivanov, D. (2019). Design redundancy in agile and resilient humanitarian supply chains. Annals of Operations Research, 1-27.
369. Sureeyatanapas, P., Waleekhajornlert, N., Arunyanart, S., & Niyamosoth, T. (2020). Resilient Supplier Selection in Electronic Components Procurement: An Integration of Evidence Theory and Rule-Based Transformation into TOPSIS to Tackle Uncertain and Incomplete Information. Symmetry, 12(7), 1109.
370. Suresh, N., Sanders, G. L., & Braunscheidel, M. J. (2020). Business Continuity Management for Supply Chains Facing Catastrophic Events. IEEE Engineering Management Review.
59
371. Swafford, P. M., Ghosh, S., & Murthy, N. (2008). Achieving supply chain agility
through IT integration and flexibility. International Journal of Production
Economics, 116(2), 288-297.
372. Syed, M. W., Li, J. Z., Junaid, M., Ye, X., & Ziaullah, M. (2019). An empirical examination of sustainable supply chain risk and integration practices: a performance-based evidence from Pakistan. Sustainability, 11(19), 5334.
373. Syed, T. A., Blome, C., & Papadopoulos, T. (2020). Resolving paradoxes in IT
success through IT ambidexterity: The moderating role of uncertain
environments. Information & Management, 57(6), 103345.
374. Tan, W. J., Zhang, A. N., & Cai, W. (2019). A graph-based model to measure structural redundancy for supply chain resilience. International Journal of Production Research, 57(20), 6385-6404.
375. Thomas, A. V., & Mahanty, B. (2019). Interrelationship among resilience, robustness, and bullwhip effect in an inventory and order based production control system. Kybernetes, 49(3), 732-752.
376. Thomé, K. M., Cappellesso, G., Ramos, E. L. A., & de Lima Duarte, S. C. (2020). Food
Supply Chains and Short Food Supply Chains: Coexistence Conceptual
Framework. Journal of Cleaner Production, 123207.
377. Tian, Y., Ma, J., Xie, L., Koivumäki, T., & Seppänen, V. (2020). Coordination and control of multi-channel supply chain driven by consumers’ channel preference and sales effort. Chaos, Solitons & Fractals, 132, 109576.
378. Tong, X., Chen, J., Zhu, Q., & Cheng, T. C. E. (2018). Technical assistance, inspection regime, and corporate social responsibility performance: A behavioural perspective. International Journal of Production Economics, 206, 59-69.
379. Tse, Y. K., Zhang, M., Akhtar, P., & MacBryde, J. (2016). Embracing supply chain
agility: an investigation in the electronics industry. Supply Chain Management: An
International Journal, 21(1),140–156.
380. Tseng, M. L. (2017). Using social media and qualitative and quantitative
information scales to benchmark corporate sustainability. Journal of Cleaner
Production, 142, 727-738.
381. Tseng, M. L., Lim, M. K., & Wu, K. J. (2019). Improving the benefits and costs on
sustainable supply chain finance under uncertainty. International Journal of
Production Economics, 218, 308-321.
382. Tseng, M. L., Wu, K. J., Hu, J., & Wang, C. H. (2018b). Decision-making model for
sustainable supply chain finance under uncertainties. International Journal of
Production Economics, 205, 30-36.
383. Tseng, M. L., Wu, K. J., Lee, C. H., Lim, M. K., Bui, T. D., & Chen, C. C. (2018).
Assessing sustainable tourism in Vietnam: A hierarchical structure
approach. Journal of Cleaner Production, 195, 406-417.
384. Tseng, M., Lim, M., & Wong, W. P. (2015). Sustainable supply chain
management. Industrial Management & Data Systems, 115(3), 436-461.
60
385. Tuan, L. T. (2016). Organisational ambidexterity and supply chain agility: The mediating role of external knowledge sharing and moderating role of competitive intelligence. International Journal of Logistics Research and Applications, 19(6), 583-603.
386. Turner, N., Maylor, H., & Swart, J. (2015). Ambidexterity in projects: An intellectual
capital perspective. International Journal of Project Management, 33(1), 177-188.
387. Turner, N., Swart, J., & Maylor, H. (2013). Mechanisms for managing
ambidexterity: A review and research agenda. International Journal of
Management Reviews, 15(3), 317-332.
388. Uddin, M., & Huynh, N. (2019). Reliable routing of road-rail intermodal freight under uncertainty. Networks and Spatial Economics, 19(3), 929-952.
389. Udenio, M., Fransoo, J. C., & Peels, R. (2015). Destocking, the bullwhip effect, and the credit crisis: Empirical modeling of supply chain dynamics. International Journal of Production Economics, 160, 34-46.
390. Um, J. (2017). Improving supply chain flexibility and agility through variety
management. The International Journal of Logistics Management, 28(2), 464–487.
391. United Nations. (2019). World economic situation and prospects. Retrieved from
https://www.un.org/development/desa/dpad/wp-
content/uploads/sites/45/WESP2019_BOOK-ANNEX-en.pdf
392. Uotila, J., Maula, M., Keil, T., & Zahra, S. A. (2009). Exploration, exploitation, and
financial performance: analysis of S&P 500 corporations. Strategic Management
Journal, 30(2), 221-231.
393. Vaismoradi, M., Turunen, H., & Bondas, T. (2013). Content analysis and thematic
analysis: Implications for conducting a qualitative descriptive study. Nursing &
health sciences, 15(3), 398-405.
394. van Blokland, W. B., van de Koppel, S., Lodewijks, G., & Breen, W. (2019). Method
for performance measurement of car companies from a stability-value leverage
perspective. International Journal of Lean Six Sigma, 10(1), 411-434.
395. Velter, M. G. E., Bitzer, V., Bocken, N. M. P., & Kemp, R. (2020). Sustainable
business model innovation: The role of boundary work for multi-stakeholder
alignment. Journal of Cleaner Production, 247, 119497.
396. Venugopal, A., Krishnan, T. N., Upadhyayula, R. S., & Kumar, M. (2020). Finding the
microfoundations of organizational ambidexterity-Demystifying the role of top
management behavioural integration. Journal of Business Research, 106, 1-11.
397. Viljoen, N. M., & Joubert, J. W. (2018). The road most travelled: the impact of urban road infrastructure on supply chain network vulnerability. Networks and Spatial Economics, 18(1), 85-113.
398. Walker, H., Seuring, S., Sarkis, J., & Klassen, R. (2014). Sustainable operations
management: recent trends and future directions. International Journal of
Operations & Production Management, 34(5), 1-11.
61
399. Wamba, S. F., & Queiroz, M. M. (2020). Industry 4.0 and the supply chain digitalisation: a blockchain diffusion perspective. Production Planning & Control, 1-18.
400. Wamba, S. F., Dubey, R., Gunasekaran, A., & Akter, S. (2020). The performance
effects of big data analytics and supply chain ambidexterity: The moderating effect
of environmental dynamism. International Journal of Production Economics, 222,
107498.
401. Wang, C., Rodan, S., Fruin, M., & Xu, X. (2014). Knowledge networks, collaboration
networks, and exploratory innovation. Academy of Management Journal, 57(2),
484-514.
402. Wang, N., Fang, X., Gou, Q., & Liang, L. (2017). Supply chain performance under pull or push contracts in the presence of a market disruption. International Transactions in Operational Research, 24(4), 713-736.
403. Wang, W., Lai, K. H., & Shou, Y. (2018). The impact of servitization on firm
performance: a meta-analysis. International Journal of Operations & Production
Management, 38(7), 1562–1588.
404. Wang, Z., Hu, H., Gong, J., Ma, X., & Xiong, W. (2019). Precast supply chain
management in off-site construction: A critical literature review. Journal of Cleaner
Production, 232, 1204-1217.
405. Watanabe, N., & Kusukawa, E. (2015). Optimal ordering policy in dual-sourcing supply chain considering supply disruptions and demand information. Industrial Engineering & Management Systems, 14(2), 129-158.
406. Wei, Y., Wang, H., & Qi, C. (2013). The impact of stock-dependent demand on
supply chain dynamics. Applied Mathematical Modelling, 37(18-19), 8348-8362.
407. Wen, K. L., Chang, T. C., & You, M. L. (1998, October). The grey entropy and its
application in weighting analysis. In SMC'98 Conference Proceedings. 1998 IEEE
International Conference on Systems, Man, and Cybernetics (Cat. No.
98CH36218) (Vol. 2, pp. 1842-1844). IEEE.
408. Wetzel, P., & Hofmann, E. (2019). Supply chain finance, financial constraints and
corporate performance: An explorative network analysis and future research
agenda. International Journal of Production Economics, 216, 364-383.
409. Wong, C. W., Lirn, T. C., Yang, C. C., & Shang, K. C. (2019). Supply chain and
external conditions under which supply chain resilience pays: An organizational
information processing theorization. International Journal of Production
Economics, 107610. (In press)
410. Wu, K. J., Liao, C. J., Chen, C. C., Lin, Y., & Tsai, C. F. (2016). Exploring eco-
innovation in dynamic organizational capability under incomplete information in
the Taiwanese lighting industry. International Journal of Production
Economics, 181, 419-440.
411. Wu, K. J., Tseng, M. L., Chiu, A. S., & Lim, M. K. (2017). Achieving competitive
advantage through supply chain agility under uncertainty: A novel multi-criteria
62
decision-making structure. International Journal of Production Economics, 190, 96-
107.
412. Wuttke, D. A., Blome, C., & Henke, M. (2013). Focusing the financial flow of supply
chains: An empirical investigation of financial supply chain
management. International Journal of Production Economics, 145(2), 773-789.
413. Xia, W., Li, B., & Yin, S. (2020). A Prescription for Urban Sustainability Transitions in China: Innovative Partner Selection Management of Green Building Materials Industry in an Integrated Supply Chain. Sustainability, 12(7), 2581.
414. Xiao, C., Petkova, B., Molleman, E., & van der Vaart, T. (2019). Technology uncertainty in supply chains and supplier involvement: the role of resource dependence. Supply Chain Management: An International Journal, 24(6), 697-709.
415. XIAO, M., & CHEN, M. (2016). Coordination analysis on supply chain under disruption demand by revenue sharing-quantity discount combined contract. Computer Integrated Manufacturing Systems, (5), 22.
416. Xu, T., & Ma, J. (2020). Feed-in tariff or tax-rebate regulation? Dynamic decision model for the solar photovoltaic supply chain. Applied Mathematical Modelling, 89(2), 1106-1123.
417. Yalcin, M. G., Chakravorty, S. S., & Yun, G. (2019). Informing the balanced theory of port competitiveness using ambidextrous supply chain strategy. Transportation Journal, 58(1), 21-37.
418. Yan, N., Jin, X., Zhong, H., & Xu, X. (2020). Loss-averse retailers’ financial offerings to capital-constrained suppliers: Loan vs. investment. International Journal of Production Economics, 227, 107665.
419. Yan, Y., & Guan, J. (2018). Social capital, exploitative and exploratory innovations:
The mediating roles of ego-network dynamics. Technological Forecasting and
Social Change, 126, 244-258.
420. Yang, H., Zheng, Y., & Zhao, X. (2014). Exploration or exploitation? Small firms'
alliance strategies with large firms. Strategic Management Journal, 35(1), 146-157.
421. Yang, J. (2014). Supply chain agility: Securing performance for Chinese
manufacturers. International Journal of Production Economics, 150, 104-113.
422. Yang, Y., Antonio, K. W., Lee, L. P. K., & Cheng, T. C. E. (2020). The performance implication of corporate social responsibility in matched Chinese small and medium-sized buyers and suppliers. International Journal of Production Economics, 107796.
423. Yu, K. D. S. & Aviso K. B. (2020). Modelling the Economic Impact and Ripple Effects
of Disease Outbreaks. Process Integration and Optimization for Sustainability. (in
press)
424. Yu, W., Jacobs, M. A., Chavez, R., & Yang, J. (2019). Dynamism, disruption
orientation, and resilience in the supply chain and the impacts on financial
performance: A dynamic capabilities perspective. International Journal of
Production Economics, 218, 352-362.
63
425. Yusuf, Y., Menhat, M. S., Abubakar, T., & Ogbuke, N. J. (2019). Agile capabilities as
necessary conditions for maximising sustainable supply chain performance: An
empirical investigation. International Journal of Production Economics, 222,
107501.
426. Zanjirchi, S. M., Abrishami, M. R., & Jalilian, N. (2019). Four decades of fuzzy sets
theory in operations management: application of life-cycle, bibliometrics and
content analysis. Scientometrics, 119(3), 1289-1309.
427. Zhan, Y., & Tan, K. H. (2020). An analytic infrastructure for harvesting big data to
enhance supply chain performance. European Journal of Operational
Research, 281(3), 559-574.
428. Zhang, M., Tse, Y. K., Dai, J., & Chan, H. K. (2017). Examining green supply chain
management and financial performance: roles of social control and environmental
dynamism. IEEE Transactions on Engineering Management, 66(1), 20-34
429. Zhang, Y., Lara, J. M. G., & Tribó, J. A. (2020). Unpacking the black box of trade credit to socially responsible customers. Journal of Banking & Finance, 105908.
430. Zhao, T., Xu, X., Chen, Y., Liang, L., Yu, Y., & Wang, K. (2020). Coordination of a fashion supply chain with demand disruptions. Transportation Research Part E: Logistics and Transportation Review, 134, 101838.
431. Zhao, X., Huo, B., Selen, W., & Yeung, J. H. Y. (2011). The impact of internal
integration and relationship commitment on external integration. Journal of
operations management, 29(1-2), 17-32.
432. Zhao, Y., Zhang, X., Jiang, W., & Feng, T. (2021). Does second-order social capital
matter to green innovation? The moderating role of governance
ambidexterity. Sustainable Production and Consumption, 25, 271-284.
433. Zheng, Y., Shu, T., Wang, S., Chen, S., Lai, K. K., & Gan, L. (2015). Demand disruption and coordination of supply chain via effort and revenue sharing. Applied Economics, 47(54), 5886-5901.
434. Zhu, G., Chou, M. C., & Tsai, C. W. (2020). Lessons Learned from the COVID-19 Pandemic Exposing the Shortcomings of Current Supply Chain Operations: A Long-Term Prescriptive Offering. Sustainability, 12(14), 5858.
435. Zhu, Q., & Krikke, H. (2020). Managing a Sustainable and Resilient Perishable Food Supply Chain (PFSC) after an Outbreak. Sustainability, 12(12), 5004.
436. Zhu, Q., Krikke, H., Caniëls, M. C., & Wang, Y. (2017). Twin-objective supply chain collaboration to cope with rare but high impact disruptions whilst improving performance. The International Journal of Logistics Management, 28(2), 488-507.
437. Zupic, I., & Čater, T. (2015). Bibliometric methods in management and
organization. Organizational Research Methods, 18(3), 429-472.
438. Zuting, K. R., Mohapatra, P., Daultani, Y., & Tiwari, M. K. (2014). A synchronized strategy to minimize vehicle dispatching time: a real example of steel industry. Advances in Manufacturing, 2(4), 333-343.
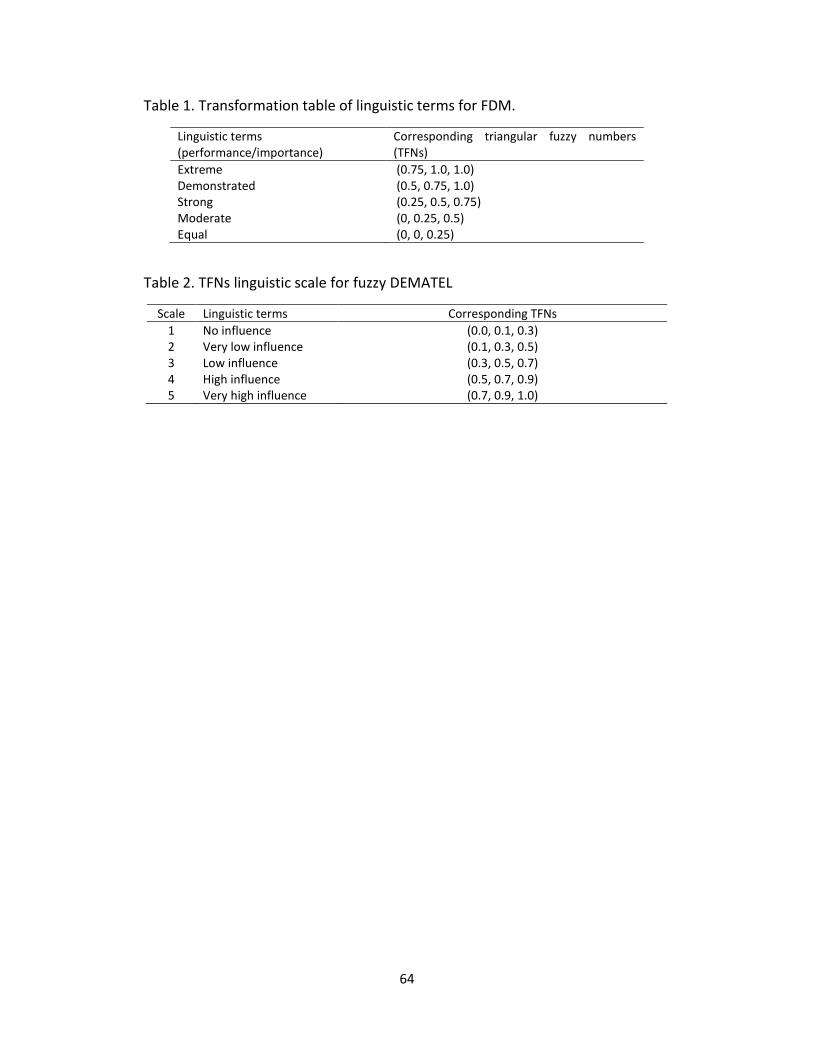
64
Table 1. Transformation table of linguistic terms for FDM.
Linguistic terms (performance/importance)
Corresponding triangular fuzzy numbers (TFNs)
Extreme (0.75, 1.0, 1.0) Demonstrated (0.5, 0.75, 1.0) Strong (0.25, 0.5, 0.75) Moderate (0, 0.25, 0.5) Equal (0, 0, 0.25)
Table 2. TFNs linguistic scale for fuzzy DEMATEL
Scale Linguistic terms Corresponding TFNs
1 No influence (0.0, 0.1, 0.3) 2 Very low influence (0.1, 0.3, 0.5) 3 Low influence (0.3, 0.5, 0.7) 4 High influence (0.5, 0.7, 0.9) 5 Very high influence (0.7, 0.9, 1.0)
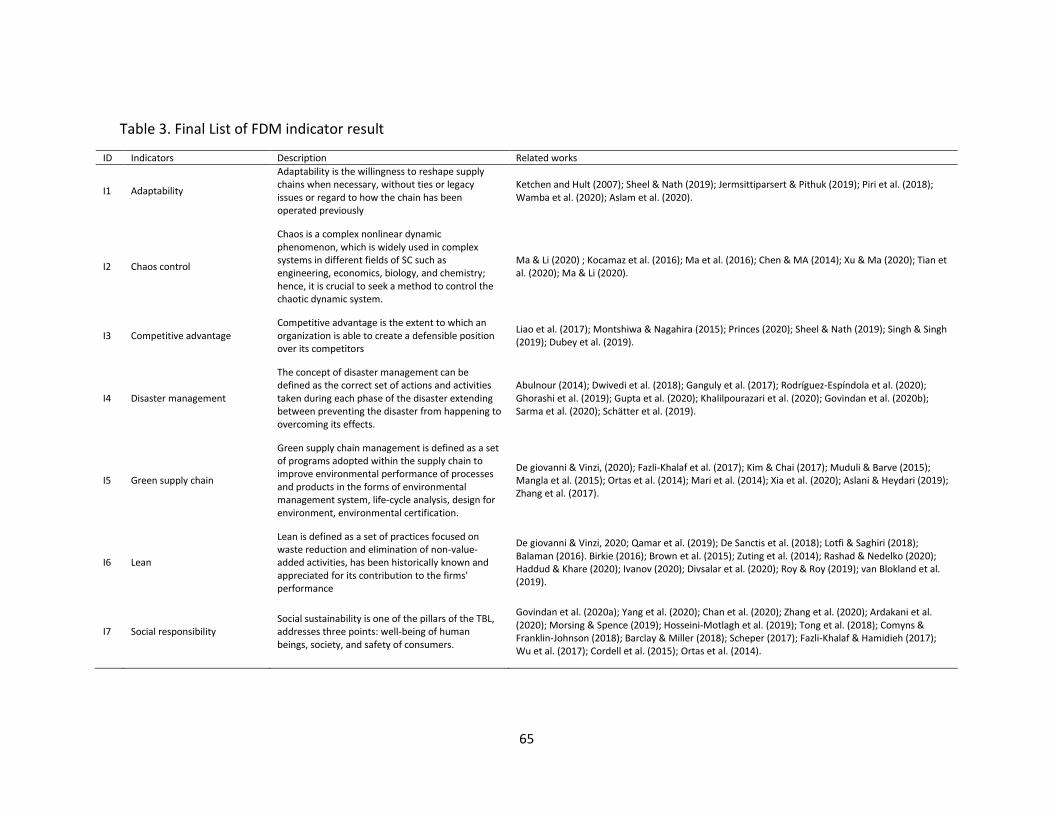
65
Table 3. Final List of FDM indicator result
ID Indicators Description Related works
I1 Adaptability
Adaptability is the willingness to reshape supply chains when necessary, without ties or legacy issues or regard to how the chain has been operated previously
Ketchen and Hult (2007); Sheel & Nath (2019); Jermsittiparsert & Pithuk (2019); Piri et al. (2018); Wamba et al. (2020); Aslam et al. (2020).
I2 Chaos control
Chaos is a complex nonlinear dynamic phenomenon, which is widely used in complex systems in different fields of SC such as engineering, economics, biology, and chemistry; hence, it is crucial to seek a method to control the chaotic dynamic system.
Ma & Li (2020) ; Kocamaz et al. (2016); Ma et al. (2016); Chen & MA (2014); Xu & Ma (2020); Tian et al. (2020); Ma & Li (2020).
I3 Competitive advantage Competitive advantage is the extent to which an organization is able to create a defensible position over its competitors
Liao et al. (2017); Montshiwa & Nagahira (2015); Princes (2020); Sheel & Nath (2019); Singh & Singh (2019); Dubey et al. (2019).
I4 Disaster management
The concept of disaster management can be defined as the correct set of actions and activities taken during each phase of the disaster extending between preventing the disaster from happening to overcoming its effects.
Abulnour (2014); Dwivedi et al. (2018); Ganguly et al. (2017); Rodríguez-Espíndola et al. (2020); Ghorashi et al. (2019); Gupta et al. (2020); Khalilpourazari et al. (2020); Govindan et al. (2020b); Sarma et al. (2020); Schätter et al. (2019).
I5 Green supply chain
Green supply chain management is defined as a set of programs adopted within the supply chain to improve environmental performance of processes and products in the forms of environmental management system, life-cycle analysis, design for environment, environmental certification.
De giovanni & Vinzi, (2020); Fazli-Khalaf et al. (2017); Kim & Chai (2017); Muduli & Barve (2015); Mangla et al. (2015); Ortas et al. (2014); Mari et al. (2014); Xia et al. (2020); Aslani & Heydari (2019); Zhang et al. (2017).
I6 Lean
Lean is defined as a set of practices focused on waste reduction and elimination of non-value-added activities, has been historically known and appreciated for its contribution to the firms' performance
De giovanni & Vinzi, 2020; Qamar et al. (2019); De Sanctis et al. (2018); Lotfi & Saghiri (2018); Balaman (2016). Birkie (2016); Brown et al. (2015); Zuting et al. (2014); Rashad & Nedelko (2020); Haddud & Khare (2020); Ivanov (2020); Divsalar et al. (2020); Roy & Roy (2019); van Blokland et al. (2019).
I7 Social responsibility Social sustainability is one of the pillars of the TBL, addresses three points: well-being of human beings, society, and safety of consumers.
Govindan et al. (2020a); Yang et al. (2020); Chan et al. (2020); Zhang et al. (2020); Ardakani et al. (2020); Morsing & Spence (2019); Hosseini-Motlagh et al. (2019); Tong et al. (2018); Comyns & Franklin-Johnson (2018); Barclay & Miller (2018); Scheper (2017); Fazli-Khalaf & Hamidieh (2017); Wu et al. (2017); Cordell et al. (2015); Ortas et al. (2014).
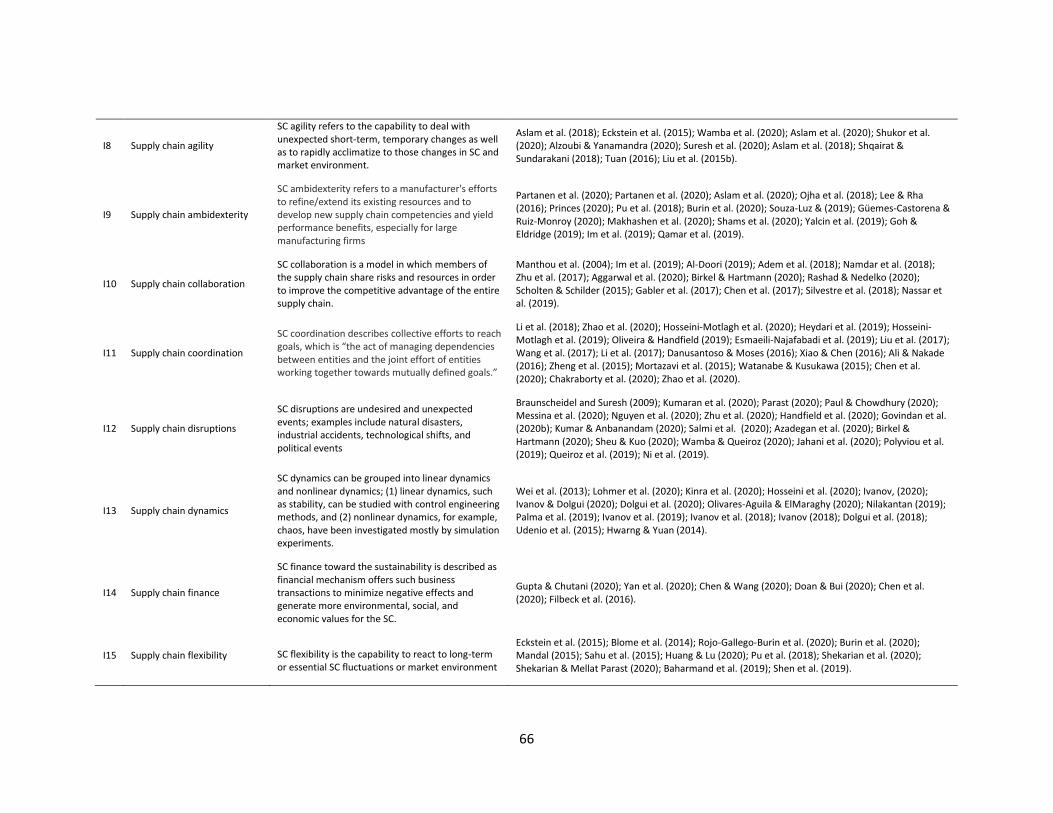
66
I8 Supply chain agility
SC agility refers to the capability to deal with unexpected short-term, temporary changes as well as to rapidly acclimatize to those changes in SC and market environment.
Aslam et al. (2018); Eckstein et al. (2015); Wamba et al. (2020); Aslam et al. (2020); Shukor et al. (2020); Alzoubi & Yanamandra (2020); Suresh et al. (2020); Aslam et al. (2018); Shqairat & Sundarakani (2018); Tuan (2016); Liu et al. (2015b).
I9 Supply chain ambidexterity
SC ambidexterity refers to a manufacturer's efforts to refine/extend its existing resources and to develop new supply chain competencies and yield performance benefits, especially for large manufacturing firms
Partanen et al. (2020); Partanen et al. (2020); Aslam et al. (2020); Ojha et al. (2018); Lee & Rha (2016); Princes (2020); Pu et al. (2018); Burin et al. (2020); Souza-Luz & (2019); Güemes-Castorena & Ruiz-Monroy (2020); Makhashen et al. (2020); Shams et al. (2020); Yalcin et al. (2019); Goh & Eldridge (2019); Im et al. (2019); Qamar et al. (2019).
I10 Supply chain collaboration
SC collaboration is a model in which members of the supply chain share risks and resources in order to improve the competitive advantage of the entire supply chain.
Manthou et al. (2004); Im et al. (2019); Al-Doori (2019); Adem et al. (2018); Namdar et al. (2018); Zhu et al. (2017); Aggarwal et al. (2020); Birkel & Hartmann (2020); Rashad & Nedelko (2020); Scholten & Schilder (2015); Gabler et al. (2017); Chen et al. (2017); Silvestre et al. (2018); Nassar et al. (2019).
I11 Supply chain coordination
SC coordination describes collective efforts to reach goals, which is “the act of managing dependencies between entities and the joint effort of entities working together towards mutually defined goals.”
Li et al. (2018); Zhao et al. (2020); Hosseini-Motlagh et al. (2020); Heydari et al. (2019); Hosseini-Motlagh et al. (2019); Oliveira & Handfield (2019); Esmaeili-Najafabadi et al. (2019); Liu et al. (2017); Wang et al. (2017); Li et al. (2017); Danusantoso & Moses (2016); Xiao & Chen (2016); Ali & Nakade (2016); Zheng et al. (2015); Mortazavi et al. (2015); Watanabe & Kusukawa (2015); Chen et al. (2020); Chakraborty et al. (2020); Zhao et al. (2020).
I12 Supply chain disruptions
SC disruptions are undesired and unexpected events; examples include natural disasters, industrial accidents, technological shifts, and political events
Braunscheidel and Suresh (2009); Kumaran et al. (2020); Parast (2020); Paul & Chowdhury (2020); Messina et al. (2020); Nguyen et al. (2020); Zhu et al. (2020); Handfield et al. (2020); Govindan et al. (2020b); Kumar & Anbanandam (2020); Salmi et al. (2020); Azadegan et al. (2020); Birkel & Hartmann (2020); Sheu & Kuo (2020); Wamba & Queiroz (2020); Jahani et al. (2020); Polyviou et al. (2019); Queiroz et al. (2019); Ni et al. (2019).
I13 Supply chain dynamics
SC dynamics can be grouped into linear dynamics and nonlinear dynamics; (1) linear dynamics, such as stability, can be studied with control engineering methods, and (2) nonlinear dynamics, for example, chaos, have been investigated mostly by simulation experiments.
Wei et al. (2013); Lohmer et al. (2020); Kinra et al. (2020); Hosseini et al. (2020); Ivanov, (2020); Ivanov & Dolgui (2020); Dolgui et al. (2020); Olivares-Aguila & ElMaraghy (2020); Nilakantan (2019); Palma et al. (2019); Ivanov et al. (2019); Ivanov et al. (2018); Ivanov (2018); Dolgui et al. (2018); Udenio et al. (2015); Hwarng & Yuan (2014).
I14 Supply chain finance
SC finance toward the sustainability is described as financial mechanism offers such business transactions to minimize negative effects and generate more environmental, social, and economic values for the SC.
Gupta & Chutani (2020); Yan et al. (2020); Chen & Wang (2020); Doan & Bui (2020); Chen et al. (2020); Filbeck et al. (2016).
I15 Supply chain flexibility SC flexibility is the capability to react to long-term or essential SC fluctuations or market environment
Eckstein et al. (2015); Blome et al. (2014); Rojo-Gallego-Burin et al. (2020); Burin et al. (2020); Mandal (2015); Sahu et al. (2015); Huang & Lu (2020); Pu et al. (2018); Shekarian et al. (2020); Shekarian & Mellat Parast (2020); Baharmand et al. (2019); Shen et al. (2019).
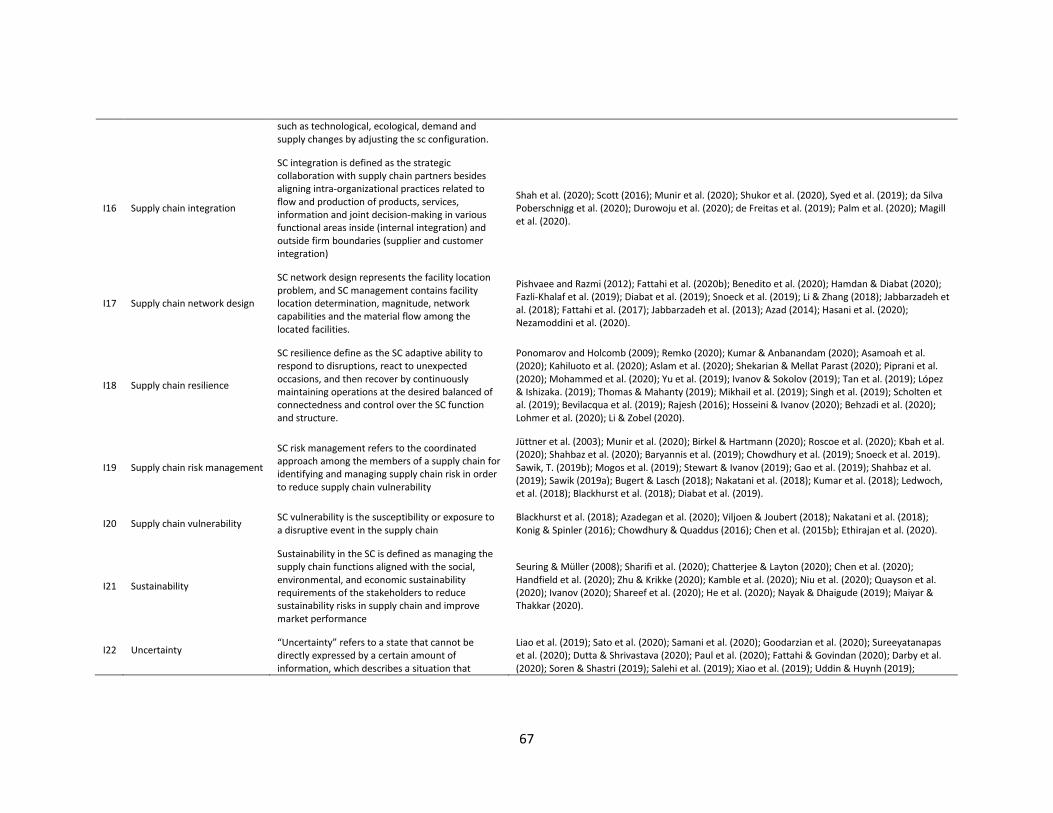
67
such as technological, ecological, demand and supply changes by adjusting the sc configuration.
I16 Supply chain integration
SC integration is defined as the strategic collaboration with supply chain partners besides aligning intra-organizational practices related to flow and production of products, services, information and joint decision-making in various functional areas inside (internal integration) and outside firm boundaries (supplier and customer integration)
Shah et al. (2020); Scott (2016); Munir et al. (2020); Shukor et al. (2020), Syed et al. (2019); da Silva Poberschnigg et al. (2020); Durowoju et al. (2020); de Freitas et al. (2019); Palm et al. (2020); Magill et al. (2020).
I17 Supply chain network design
SC network design represents the facility location problem, and SC management contains facility location determination, magnitude, network capabilities and the material flow among the located facilities.
Pishvaee and Razmi (2012); Fattahi et al. (2020b); Benedito et al. (2020); Hamdan & Diabat (2020); Fazli-Khalaf et al. (2019); Diabat et al. (2019); Snoeck et al. (2019); Li & Zhang (2018); Jabbarzadeh et al. (2018); Fattahi et al. (2017); Jabbarzadeh et al. (2013); Azad (2014); Hasani et al. (2020); Nezamoddini et al. (2020).
I18 Supply chain resilience
SC resilience define as the SC adaptive ability to respond to disruptions, react to unexpected occasions, and then recover by continuously maintaining operations at the desired balanced of connectedness and control over the SC function and structure.
Ponomarov and Holcomb (2009); Remko (2020); Kumar & Anbanandam (2020); Asamoah et al. (2020); Kahiluoto et al. (2020); Aslam et al. (2020); Shekarian & Mellat Parast (2020); Piprani et al. (2020); Mohammed et al. (2020); Yu et al. (2019); Ivanov & Sokolov (2019); Tan et al. (2019); López & Ishizaka. (2019); Thomas & Mahanty (2019); Mikhail et al. (2019); Singh et al. (2019); Scholten et al. (2019); Bevilacqua et al. (2019); Rajesh (2016); Hosseini & Ivanov (2020); Behzadi et al. (2020); Lohmer et al. (2020); Li & Zobel (2020).
I19 Supply chain risk management
SC risk management refers to the coordinated approach among the members of a supply chain for identifying and managing supply chain risk in order to reduce supply chain vulnerability
Jüttner et al. (2003); Munir et al. (2020); Birkel & Hartmann (2020); Roscoe et al. (2020); Kbah et al. (2020); Shahbaz et al. (2020); Baryannis et al. (2019); Chowdhury et al. (2019); Snoeck et al. 2019). Sawik, T. (2019b); Mogos et al. (2019); Stewart & Ivanov (2019); Gao et al. (2019); Shahbaz et al. (2019); Sawik (2019a); Bugert & Lasch (2018); Nakatani et al. (2018); Kumar et al. (2018); Ledwoch, et al. (2018); Blackhurst et al. (2018); Diabat et al. (2019).
I20 Supply chain vulnerability SC vulnerability is the susceptibility or exposure to a disruptive event in the supply chain
Blackhurst et al. (2018); Azadegan et al. (2020); Viljoen & Joubert (2018); Nakatani et al. (2018); Konig & Spinler (2016); Chowdhury & Quaddus (2016); Chen et al. (2015b); Ethirajan et al. (2020).
I21 Sustainability
Sustainability in the SC is defined as managing the supply chain functions aligned with the social, environmental, and economic sustainability requirements of the stakeholders to reduce sustainability risks in supply chain and improve market performance
Seuring & Müller (2008); Sharifi et al. (2020); Chatterjee & Layton (2020); Chen et al. (2020); Handfield et al. (2020); Zhu & Krikke (2020); Kamble et al. (2020); Niu et al. (2020); Quayson et al. (2020); Ivanov (2020); Shareef et al. (2020); He et al. (2020); Nayak & Dhaigude (2019); Maiyar & Thakkar (2020).
I22 Uncertainty “Uncertainty” refers to a state that cannot be directly expressed by a certain amount of information, which describes a situation that
Liao et al. (2019); Sato et al. (2020); Samani et al. (2020); Goodarzian et al. (2020); Sureeyatanapas et al. (2020); Dutta & Shrivastava (2020); Paul et al. (2020); Fattahi & Govindan (2020); Darby et al. (2020); Soren & Shastri (2019); Salehi et al. (2019); Xiao et al. (2019); Uddin & Huynh (2019);

68
cannot be ascertained, or where there are different possibilities.
Pashapour et al. (2019); Diabat et al. (2019); Alvarado-Vargas & Kelley (2019); Sreedevi & Saranga (2017).
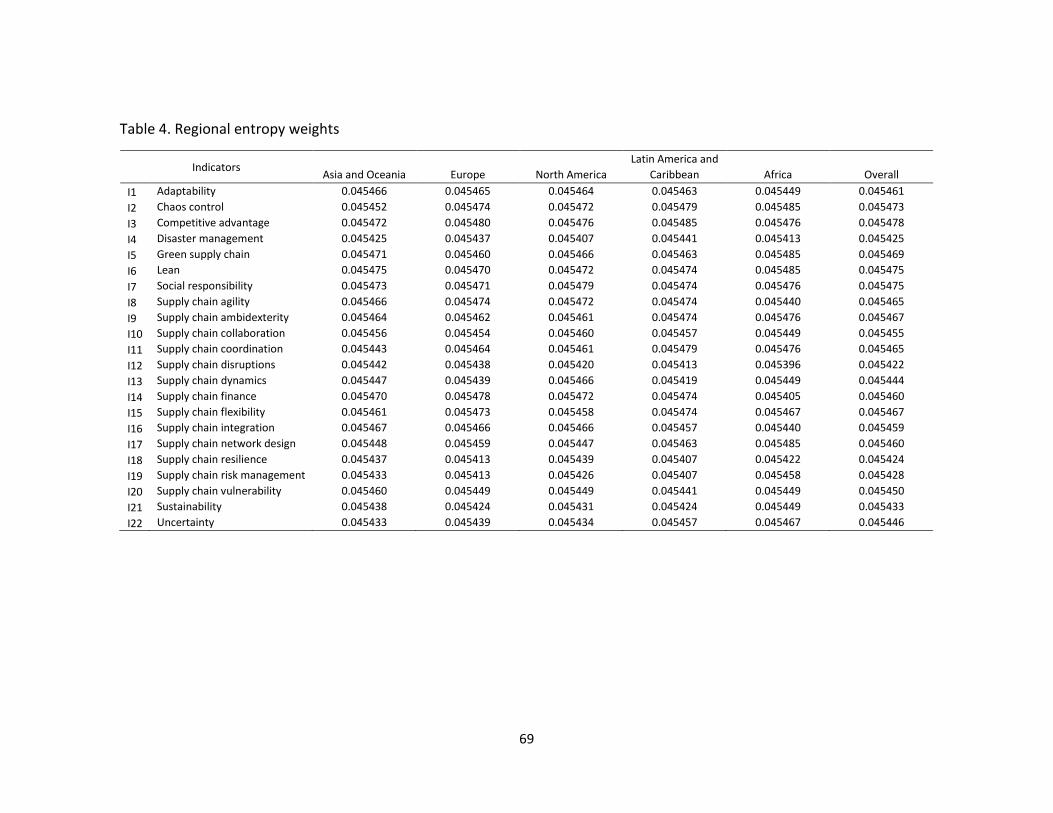
69
Table 4. Regional entropy weights
Indicators Asia and Oceania Europe North America
Latin America and
Caribbean Africa Overall
I1 Adaptability 0.045466 0.045465 0.045464 0.045463 0.045449 0.045461
I2 Chaos control 0.045452 0.045474 0.045472 0.045479 0.045485 0.045473
I3 Competitive advantage 0.045472 0.045480 0.045476 0.045485 0.045476 0.045478
I4 Disaster management 0.045425 0.045437 0.045407 0.045441 0.045413 0.045425
I5 Green supply chain 0.045471 0.045460 0.045466 0.045463 0.045485 0.045469
I6 Lean 0.045475 0.045470 0.045472 0.045474 0.045485 0.045475
I7 Social responsibility 0.045473 0.045471 0.045479 0.045474 0.045476 0.045475
I8 Supply chain agility 0.045466 0.045474 0.045472 0.045474 0.045440 0.045465
I9 Supply chain ambidexterity 0.045464 0.045462 0.045461 0.045474 0.045476 0.045467
I10 Supply chain collaboration 0.045456 0.045454 0.045460 0.045457 0.045449 0.045455
I11 Supply chain coordination 0.045443 0.045464 0.045461 0.045479 0.045476 0.045465
I12 Supply chain disruptions 0.045442 0.045438 0.045420 0.045413 0.045396 0.045422
I13 Supply chain dynamics 0.045447 0.045439 0.045466 0.045419 0.045449 0.045444
I14 Supply chain finance 0.045470 0.045478 0.045472 0.045474 0.045405 0.045460
I15 Supply chain flexibility 0.045461 0.045473 0.045458 0.045474 0.045467 0.045467
I16 Supply chain integration 0.045467 0.045466 0.045466 0.045457 0.045440 0.045459
I17 Supply chain network design 0.045448 0.045459 0.045447 0.045463 0.045485 0.045460
I18 Supply chain resilience 0.045437 0.045413 0.045439 0.045407 0.045422 0.045424
I19 Supply chain risk management 0.045433 0.045413 0.045426 0.045407 0.045458 0.045428
I20 Supply chain vulnerability 0.045460 0.045449 0.045449 0.045441 0.045449 0.045450
I21 Sustainability 0.045438 0.045424 0.045431 0.045424 0.045449 0.045433
I22 Uncertainty 0.045433 0.045439 0.045434 0.045457 0.045467 0.045446
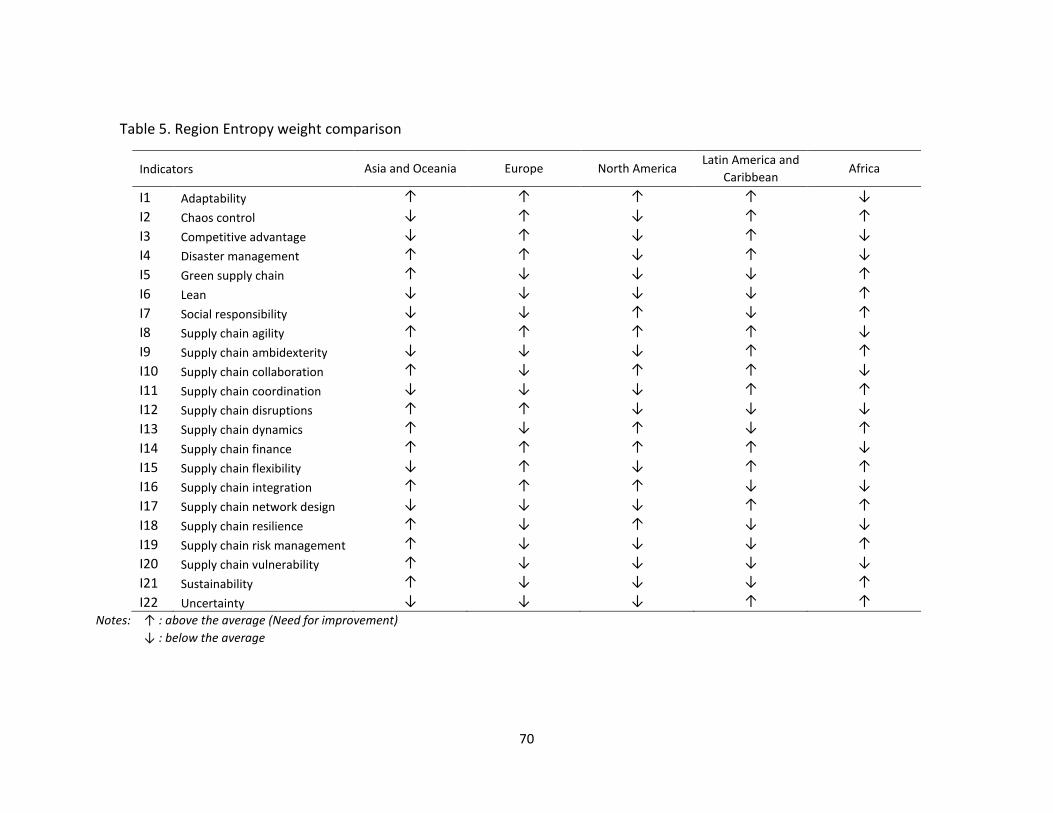
70
Table 5. Region Entropy weight comparison
Indicators Asia and Oceania Europe North America Latin America and
Caribbean Africa
I1 Adaptability ↑ ↑ ↑ ↑ ↓
I2 Chaos control ↓ ↑ ↓ ↑ ↑
I3 Competitive advantage ↓ ↑ ↓ ↑ ↓
I4 Disaster management ↑ ↑ ↓ ↑ ↓
I5 Green supply chain ↑ ↓ ↓ ↓ ↑
I6 Lean ↓ ↓ ↓ ↓ ↑
I7 Social responsibility ↓ ↓ ↑ ↓ ↑
I8 Supply chain agility ↑ ↑ ↑ ↑ ↓
I9 Supply chain ambidexterity ↓ ↓ ↓ ↑ ↑
I10 Supply chain collaboration ↑ ↓ ↑ ↑ ↓
I11 Supply chain coordination ↓ ↓ ↓ ↑ ↑
I12 Supply chain disruptions ↑ ↑ ↓ ↓ ↓
I13 Supply chain dynamics ↑ ↓ ↑ ↓ ↑
I14 Supply chain finance ↑ ↑ ↑ ↑ ↓
I15 Supply chain flexibility ↓ ↑ ↓ ↑ ↑
I16 Supply chain integration ↑ ↑ ↑ ↓ ↓
I17 Supply chain network design ↓ ↓ ↓ ↑ ↑
I18 Supply chain resilience ↑ ↓ ↑ ↓ ↓
I19 Supply chain risk management ↑ ↓ ↓ ↓ ↑
I20 Supply chain vulnerability ↑ ↓ ↓ ↓ ↓
I21 Sustainability ↑ ↓ ↓ ↓ ↑
I22 Uncertainty ↓ ↓ ↓ ↑ ↑
Notes: ↑ : above the average (Need for improvement)
↓ : below the average
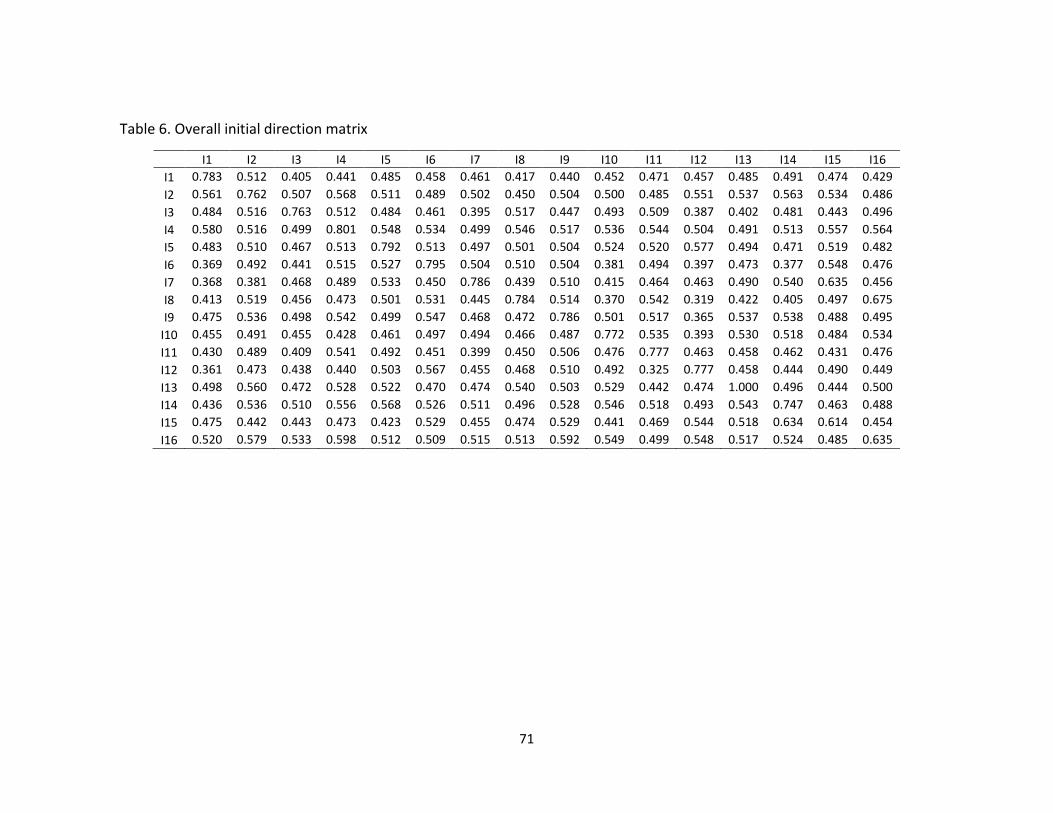
71
Table 6. Overall initial direction matrix
I1 I2 I3 I4 I5 I6 I7 I8 I9 I10 I11 I12 I13 I14 I15 I16
I1 0.783 0.512 0.405 0.441 0.485 0.458 0.461 0.417 0.440 0.452 0.471 0.457 0.485 0.491 0.474 0.429
I2 0.561 0.762 0.507 0.568 0.511 0.489 0.502 0.450 0.504 0.500 0.485 0.551 0.537 0.563 0.534 0.486
I3 0.484 0.516 0.763 0.512 0.484 0.461 0.395 0.517 0.447 0.493 0.509 0.387 0.402 0.481 0.443 0.496
I4 0.580 0.516 0.499 0.801 0.548 0.534 0.499 0.546 0.517 0.536 0.544 0.504 0.491 0.513 0.557 0.564
I5 0.483 0.510 0.467 0.513 0.792 0.513 0.497 0.501 0.504 0.524 0.520 0.577 0.494 0.471 0.519 0.482
I6 0.369 0.492 0.441 0.515 0.527 0.795 0.504 0.510 0.504 0.381 0.494 0.397 0.473 0.377 0.548 0.476
I7 0.368 0.381 0.468 0.489 0.533 0.450 0.786 0.439 0.510 0.415 0.464 0.463 0.490 0.540 0.635 0.456
I8 0.413 0.519 0.456 0.473 0.501 0.531 0.445 0.784 0.514 0.370 0.542 0.319 0.422 0.405 0.497 0.675
I9 0.475 0.536 0.498 0.542 0.499 0.547 0.468 0.472 0.786 0.501 0.517 0.365 0.537 0.538 0.488 0.495
I10 0.455 0.491 0.455 0.428 0.461 0.497 0.494 0.466 0.487 0.772 0.535 0.393 0.530 0.518 0.484 0.534
I11 0.430 0.489 0.409 0.541 0.492 0.451 0.399 0.450 0.506 0.476 0.777 0.463 0.458 0.462 0.431 0.476
I12 0.361 0.473 0.438 0.440 0.503 0.567 0.455 0.468 0.510 0.492 0.325 0.777 0.458 0.444 0.490 0.449
I13 0.498 0.560 0.472 0.528 0.522 0.470 0.474 0.540 0.503 0.529 0.442 0.474 1.000 0.496 0.444 0.500
I14 0.436 0.536 0.510 0.556 0.568 0.526 0.511 0.496 0.528 0.546 0.518 0.493 0.543 0.747 0.463 0.488
I15 0.475 0.442 0.443 0.473 0.423 0.529 0.455 0.474 0.529 0.441 0.469 0.544 0.518 0.634 0.614 0.454
I16 0.520 0.579 0.533 0.598 0.512 0.509 0.515 0.513 0.592 0.549 0.499 0.548 0.517 0.524 0.485 0.635
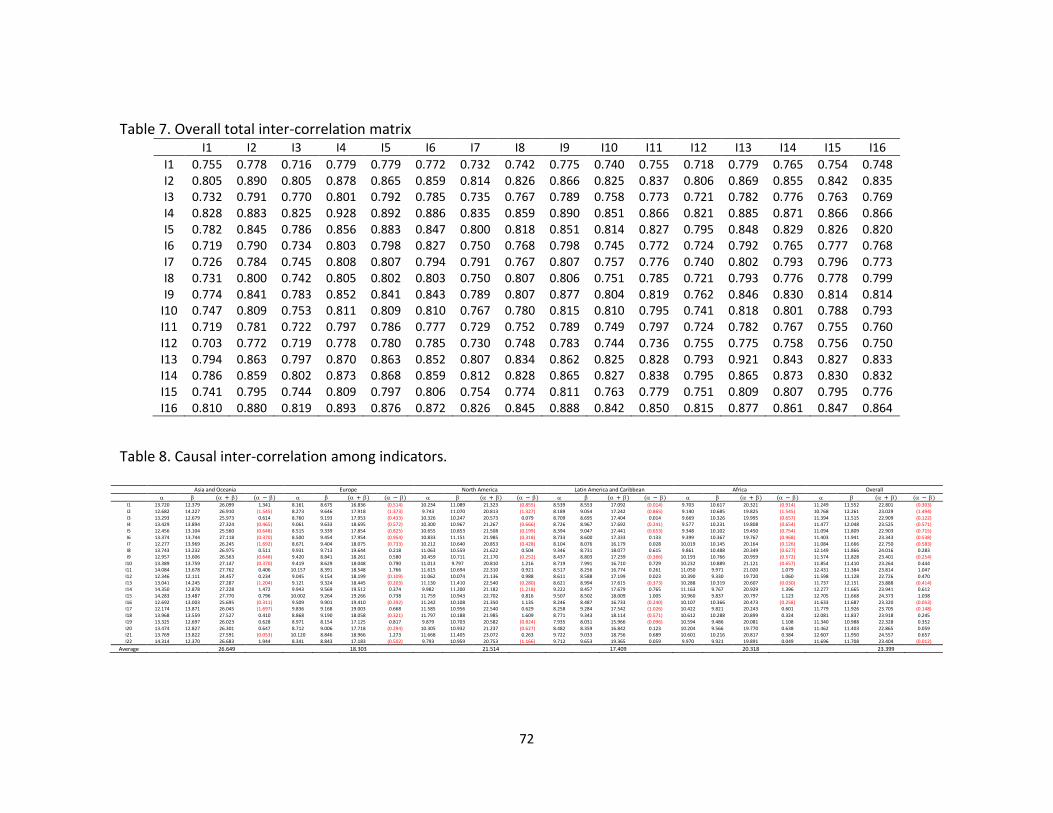
72
Table 7. Overall total inter-correlation matrix I1 I2 I3 I4 I5 I6 I7 I8 I9 I10 I11 I12 I13 I14 I15 I16
I1 0.755 0.778 0.716 0.779 0.779 0.772 0.732 0.742 0.775 0.740 0.755 0.718 0.779 0.765 0.754 0.748 I2 0.805 0.890 0.805 0.878 0.865 0.859 0.814 0.826 0.866 0.825 0.837 0.806 0.869 0.855 0.842 0.835 I3 0.732 0.791 0.770 0.801 0.792 0.785 0.735 0.767 0.789 0.758 0.773 0.721 0.782 0.776 0.763 0.769 I4 0.828 0.883 0.825 0.928 0.892 0.886 0.835 0.859 0.890 0.851 0.866 0.821 0.885 0.871 0.866 0.866 I5 0.782 0.845 0.786 0.856 0.883 0.847 0.800 0.818 0.851 0.814 0.827 0.795 0.848 0.829 0.826 0.820 I6 0.719 0.790 0.734 0.803 0.798 0.827 0.750 0.768 0.798 0.745 0.772 0.724 0.792 0.765 0.777 0.768 I7 0.726 0.784 0.745 0.808 0.807 0.794 0.791 0.767 0.807 0.757 0.776 0.740 0.802 0.793 0.796 0.773 I8 0.731 0.800 0.742 0.805 0.802 0.803 0.750 0.807 0.806 0.751 0.785 0.721 0.793 0.776 0.778 0.799 I9 0.774 0.841 0.783 0.852 0.841 0.843 0.789 0.807 0.877 0.804 0.819 0.762 0.846 0.830 0.814 0.814
I10 0.747 0.809 0.753 0.811 0.809 0.810 0.767 0.780 0.815 0.810 0.795 0.741 0.818 0.801 0.788 0.793 I11 0.719 0.781 0.722 0.797 0.786 0.777 0.729 0.752 0.789 0.749 0.797 0.724 0.782 0.767 0.755 0.760 I12 0.703 0.772 0.719 0.778 0.780 0.785 0.730 0.748 0.783 0.744 0.736 0.755 0.775 0.758 0.756 0.750 I13 0.794 0.863 0.797 0.870 0.863 0.852 0.807 0.834 0.862 0.825 0.828 0.793 0.921 0.843 0.827 0.833 I14 0.786 0.859 0.802 0.873 0.868 0.859 0.812 0.828 0.865 0.827 0.838 0.795 0.865 0.873 0.830 0.832 I15 0.741 0.795 0.744 0.809 0.797 0.806 0.754 0.774 0.811 0.763 0.779 0.751 0.809 0.807 0.795 0.776 I16 0.810 0.880 0.819 0.893 0.876 0.872 0.826 0.845 0.888 0.842 0.850 0.815 0.877 0.861 0.847 0.864
Table 8. Causal inter-correlation among indicators.
Asia and Oceania Europe North America Latin America and Caribbean Africa Overall ( + ) ( − ) ( + ) ( − ) ( + ) ( − ) ( + ) ( − ) ( + ) ( − ) ( + ) ( − )
I1 13.720 12.379 26.099 1.341 8.161 8.675 16.836 (0.514) 10.234 11.089 21.323 (0.855) 8.539 8.553 17.092 (0.014) 9.703 10.617 20.321 (0.914) 11.249 11.552 22.801 (0.303) I2 12.682 14.227 26.910 (1.545) 8.273 9.646 17.918 (1.373) 9.743 11.070 20.813 (1.327) 8.189 9.054 17.242 (0.865) 9.140 10.685 19.825 (1.545) 10.768 12.261 23.029 (1.494) I3 13.293 12.679 25.973 0.614 8.760 9.193 17.953 (0.433) 10.326 10.247 20.573 0.079 8.709 8.695 17.404 0.014 9.669 10.326 19.995 (0.657) 11.394 11.515 22.909 (0.122) I4 13.429 13.894 27.324 (0.465) 9.061 9.633 18.695 (0.572) 10.300 10.967 21.267 (0.666) 8.726 8.967 17.692 (0.241) 9.577 10.231 19.808 (0.654) 11.477 12.048 23.525 (0.571) I5 12.456 13.104 25.560 (0.648) 8.515 9.339 17.854 (0.825) 10.655 10.853 21.508 (0.199) 8.394 9.047 17.441 (0.653) 9.348 10.102 19.450 (0.754) 11.094 11.809 22.903 (0.715) I6 13.374 13.744 27.118 (0.370) 8.500 9.454 17.954 (0.954) 10.833 11.151 21.985 (0.318) 8.733 8.600 17.333 0.133 9.399 10.367 19.767 (0.968) 11.403 11.941 23.343 (0.538) I7 12.277 13.969 26.245 (1.692) 8.671 9.404 18.075 (0.733) 10.212 10.640 20.853 (0.428) 8.104 8.076 16.179 0.028 10.019 10.145 20.164 (0.126) 11.084 11.666 22.750 (0.583) I8 13.743 13.232 26.975 0.511 9.931 9.713 19.644 0.218 11.063 10.559 21.622 0.504 9.346 8.731 18.077 0.615 9.861 10.488 20.349 (0.627) 12.149 11.866 24.016 0.283 I9 12.957 13.606 26.563 (0.648) 9.420 8.841 18.261 0.580 10.459 10.711 21.170 (0.252) 8.437 8.803 17.239 (0.366) 10.193 10.766 20.959 (0.572) 11.574 11.828 23.401 (0.254)
I10 13.389 13.759 27.147 (0.370) 9.419 8.629 18.048 0.790 11.013 9.797 20.810 1.216 8.719 7.991 16.710 0.729 10.232 10.889 21.121 (0.657) 11.854 11.410 23.264 0.444 I11 14.084 13.678 27.762 0.406 10.157 8.391 18.548 1.766 11.615 10.694 22.310 0.921 8.517 8.256 16.774 0.261 11.050 9.971 21.020 1.079 12.431 11.384 23.814 1.047 I12 12.346 12.111 24.457 0.234 9.045 9.154 18.199 (0.109) 11.062 10.074 21.136 0.988 8.611 8.588 17.199 0.023 10.390 9.330 19.720 1.060 11.598 11.128 22.726 0.470 I13 13.041 14.245 27.287 (1.204) 9.121 9.324 18.445 (0.203) 11.130 11.410 22.540 (0.280) 8.621 8.994 17.615 (0.373) 10.288 10.319 20.607 (0.030) 11.737 12.151 23.888 (0.414) I14 14.350 12.878 27.228 1.472 9.943 9.569 19.512 0.374 9.982 11.200 21.182 (1.218) 9.222 8.457 17.679 0.765 11.163 9.767 20.929 1.396 12.277 11.665 23.941 0.612 I15 14.283 13.487 27.770 0.796 10.002 9.264 19.266 0.738 11.759 10.943 22.702 0.816 9.507 8.502 18.009 1.005 10.960 9.837 20.797 1.123 12.705 11.668 24.373 1.038 I16 12.692 13.003 25.695 (0.311) 9.509 9.901 19.410 (0.392) 11.242 10.108 21.350 1.135 8.246 8.487 16.733 (0.240) 10.107 10.366 20.473 (0.258) 11.633 11.687 23.320 (0.053) I17 12.174 13.871 26.045 (1.697) 9.836 9.168 19.003 0.668 11.585 10.956 22.540 0.629 8.258 9.284 17.542 (1.026) 10.422 9.821 20.243 0.601 11.779 11.926 23.705 (0.148)
I18 13.968 13.559 27.527 0.410 8.868 9.190 18.058 (0.321) 11.797 10.188 21.985 1.609 8.771 9.343 18.114 (0.571) 10.612 10.288 20.899 0.324 12.081 11.837 23.918 0.245 I19 13.325 12.697 26.023 0.628 8.971 8.154 17.125 0.817 9.879 10.703 20.582 (0.824) 7.935 8.031 15.966 (0.096) 10.594 9.486 20.081 1.108 11.340 10.988 22.328 0.352 I20 13.474 12.827 26.301 0.647 8.712 9.006 17.718 (0.294) 10.305 10.932 21.237 (0.627) 8.482 8.359 16.842 0.123 10.204 9.566 19.770 0.638 11.462 11.403 22.865 0.059 I21 13.769 13.822 27.591 (0.053) 10.120 8.846 18.966 1.273 11.668 11.405 23.072 0.263 9.722 9.033 18.756 0.689 10.601 10.216 20.817 0.384 12.607 11.950 24.557 0.657 I22 14.314 12.370 26.683 1.944 8.341 8.843 17.183 (0.502) 9.793 10.959 20.753 (1.166) 9.712 9.653 19.365 0.059 9.970 9.921 19.891 0.049 11.696 11.708 23.404 (0.012)
Average 26.649 18.303 21.514 17.409 20.318 23.399
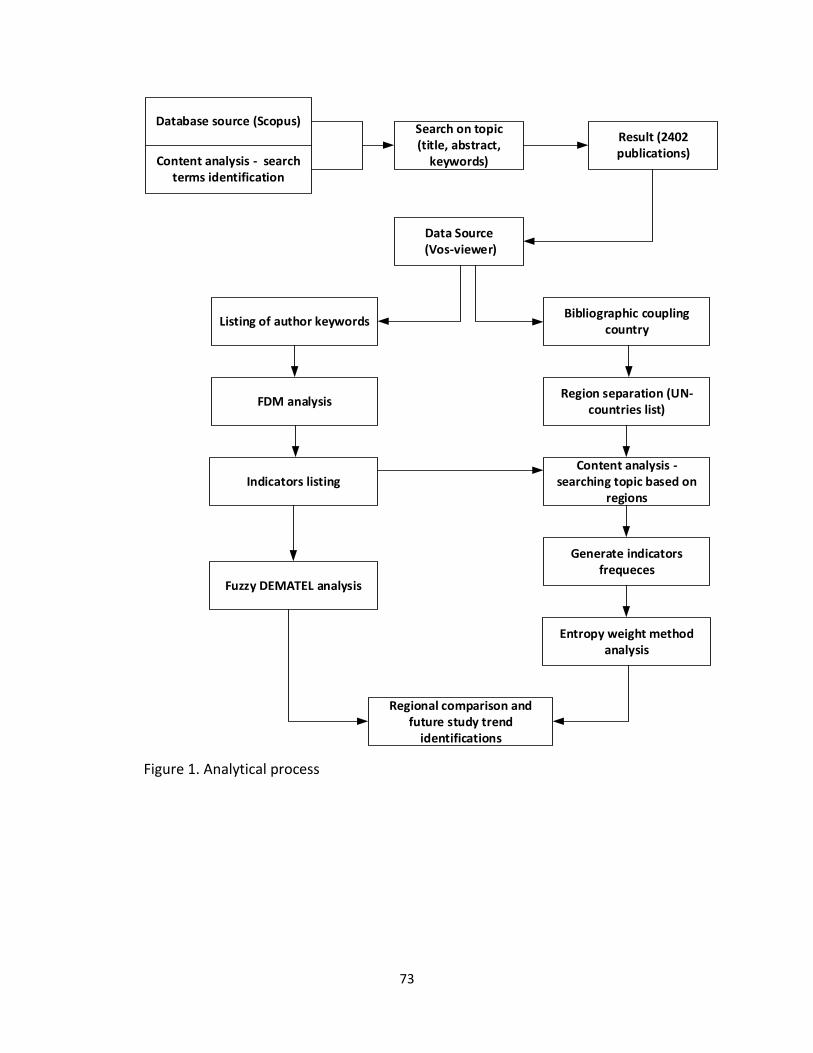
73
Database source (Scopus)
Content analysis - search terms identification
Search on topic (title, abstract,
keywords)
Result (2402 publications)
Data Source (Vos-viewer)
Listing of author keywordsBibliographic coupling
country
FDM analysisRegion separation (UN-
countries list)
Indicators listingContent analysis -
searching topic based on regions
Generate indicators frequeces
Fuzzy DEMATEL analysis
Regional comparison and future study trend
identifications
Entropy weight method analysis
Figure 1. Analytical process
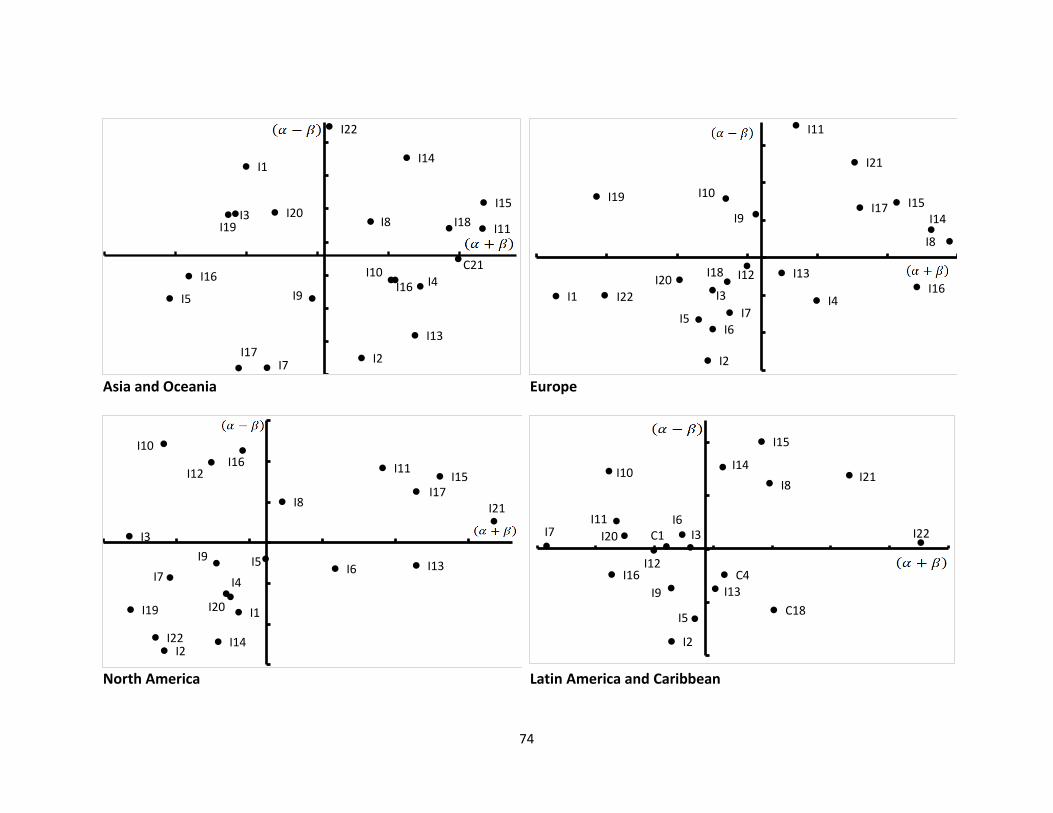
74
Asia and Oceania Europe
North America Latin America and Caribbean
I1
I2
I3
I4
I5I16
I7
I8
I9
I10
I11
I13
I14
I15
I16
I17
I18I19I20
C21
I22
I1
I2
I3 I4
I5I6
I7
I8
I9
I10
I11
I12 I13
I14I15
I16
I17
I18
I19
I20
I21
I22
I1
I2
I3
I4
I5I6
I7
I8
I9
I10
I11I12
I13
I14
I15I16
I17
I19 I20
I21
I22
C1
I2
I3
C4
I5
I6I7
I8
I9
I10
I11
I12
I13
I14
I15
I16
C18
I20
I21
I22
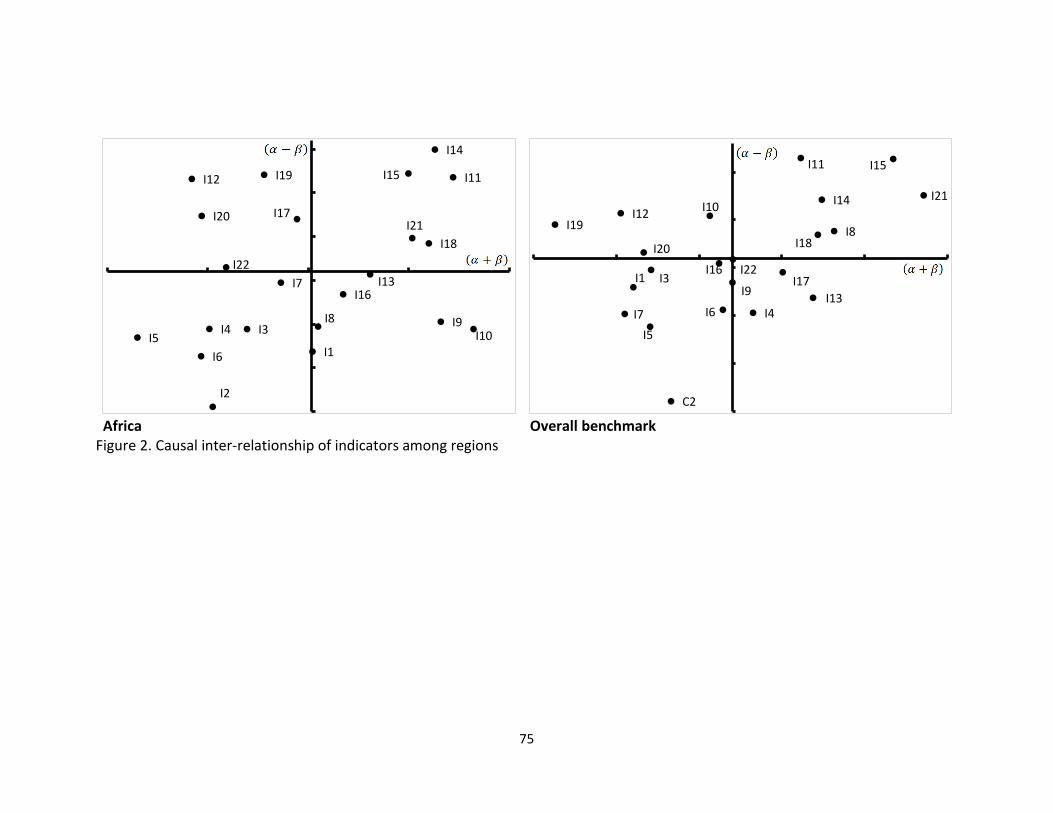
75
Africa Overall benchmark
Figure 2. Causal inter-relationship of indicators among regions
I1
I2
I3I4I5
I6
I7
I8 I9I10
I11I12
I13
I14
I15
I16
I17
I18
I19
I20I21
I22I1
C2
I3
I4
I5
I6I7
I8
I9
I10
I11
I12
I13
I14
I15
I16I17
I18
I19
I20
I21
I22
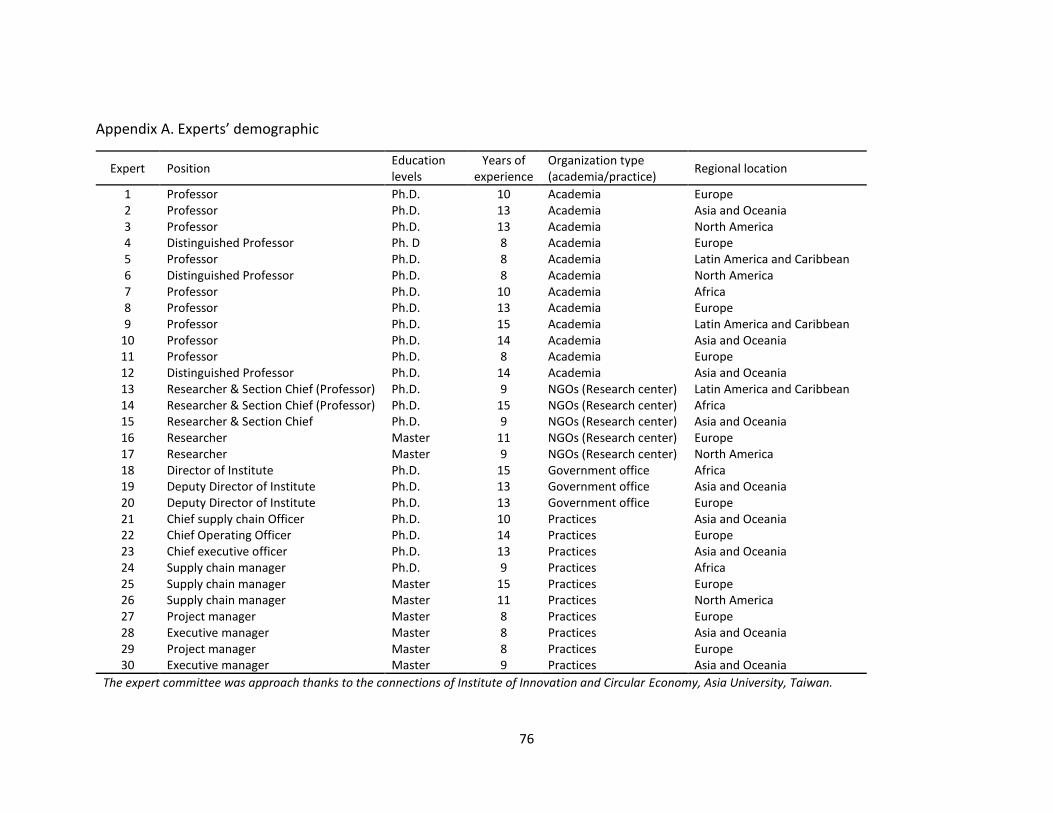
76
Appendix A. Experts’ demographic
Expert Position Education levels
Years of experience
Organization type (academia/practice)
Regional location
1 Professor Ph.D. 10 Academia Europe 2 Professor Ph.D. 13 Academia Asia and Oceania 3 Professor Ph.D. 13 Academia North America 4 Distinguished Professor Ph. D 8 Academia Europe 5 Professor Ph.D. 8 Academia Latin America and Caribbean 6 Distinguished Professor Ph.D. 8 Academia North America 7 Professor Ph.D. 10 Academia Africa 8 Professor Ph.D. 13 Academia Europe 9 Professor Ph.D. 15 Academia Latin America and Caribbean
10 Professor Ph.D. 14 Academia Asia and Oceania 11 Professor Ph.D. 8 Academia Europe 12 Distinguished Professor Ph.D. 14 Academia Asia and Oceania 13 Researcher & Section Chief (Professor) Ph.D. 9 NGOs (Research center) Latin America and Caribbean 14 Researcher & Section Chief (Professor) Ph.D. 15 NGOs (Research center) Africa 15 Researcher & Section Chief Ph.D. 9 NGOs (Research center) Asia and Oceania 16 Researcher Master 11 NGOs (Research center) Europe 17 Researcher Master 9 NGOs (Research center) North America 18 Director of Institute Ph.D. 15 Government office Africa 19 Deputy Director of Institute Ph.D. 13 Government office Asia and Oceania 20 Deputy Director of Institute Ph.D. 13 Government office Europe 21 Chief supply chain Officer Ph.D. 10 Practices Asia and Oceania 22 Chief Operating Officer Ph.D. 14 Practices Europe 23 Chief executive officer Ph.D. 13 Practices Asia and Oceania 24 Supply chain manager Ph.D. 9 Practices Africa 25 Supply chain manager Master 15 Practices Europe 26 Supply chain manager Master 11 Practices North America 27 Project manager Master 8 Practices Europe 28 Executive manager Master 8 Practices Asia and Oceania 29 Project manager Master 8 Practices Europe 30 Executive manager Master 9 Practices Asia and Oceania
The expert committee was approach thanks to the connections of Institute of Innovation and Circular Economy, Asia University, Taiwan.
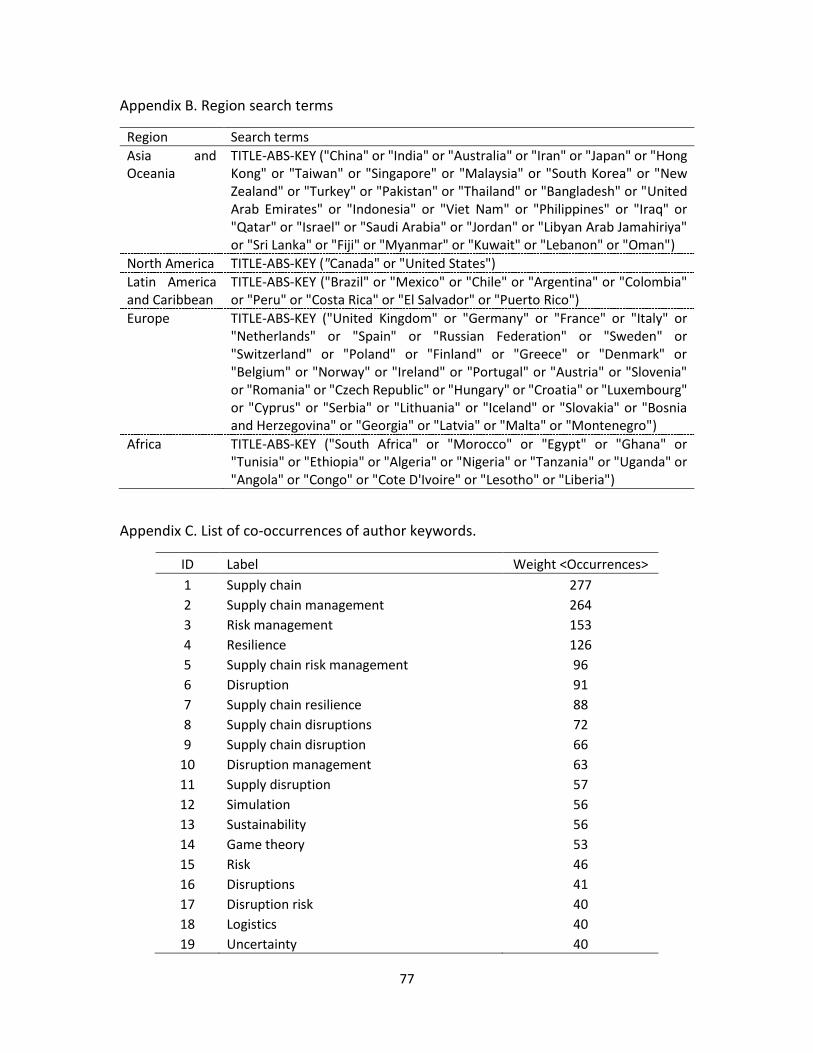
77
Appendix B. Region search terms
Region Search terms
Asia and Oceania
TITLE-ABS-KEY ("China" or "India" or "Australia" or "Iran" or "Japan" or "Hong Kong" or "Taiwan" or "Singapore" or "Malaysia" or "South Korea" or "New Zealand" or "Turkey" or "Pakistan" or "Thailand" or "Bangladesh" or "United Arab Emirates" or "Indonesia" or "Viet Nam" or "Philippines" or "Iraq" or "Qatar" or "Israel" or "Saudi Arabia" or "Jordan" or "Libyan Arab Jamahiriya" or "Sri Lanka" or "Fiji" or "Myanmar" or "Kuwait" or "Lebanon" or "Oman")
North America TITLE-ABS-KEY ("Canada" or "United States")
Latin America and Caribbean
TITLE-ABS-KEY ("Brazil" or "Mexico" or "Chile" or "Argentina" or "Colombia" or "Peru" or "Costa Rica" or "El Salvador" or "Puerto Rico")
Europe TITLE-ABS-KEY ("United Kingdom" or "Germany" or "France" or "Italy" or "Netherlands" or "Spain" or "Russian Federation" or "Sweden" or "Switzerland" or "Poland" or "Finland" or "Greece" or "Denmark" or "Belgium" or "Norway" or "Ireland" or "Portugal" or "Austria" or "Slovenia" or "Romania" or "Czech Republic" or "Hungary" or "Croatia" or "Luxembourg" or "Cyprus" or "Serbia" or "Lithuania" or "Iceland" or "Slovakia" or "Bosnia and Herzegovina" or "Georgia" or "Latvia" or "Malta" or "Montenegro")
Africa TITLE-ABS-KEY ("South Africa" or "Morocco" or "Egypt" or "Ghana" or "Tunisia" or "Ethiopia" or "Algeria" or "Nigeria" or "Tanzania" or "Uganda" or "Angola" or "Congo" or "Cote D'Ivoire" or "Lesotho" or "Liberia")
Appendix C. List of co-occurrences of author keywords.
ID Label Weight <Occurrences>
1 Supply chain 277
2 Supply chain management 264
3 Risk management 153
4 Resilience 126
5 Supply chain risk management 96
6 Disruption 91
7 Supply chain resilience 88
8 Supply chain disruptions 72
9 Supply chain disruption 66
10 Disruption management 63
11 Supply disruption 57
12 Simulation 56
13 Sustainability 56
14 Game theory 53
15 Risk 46
16 Disruptions 41
17 Disruption risk 40
18 Logistics 40
19 Uncertainty 40
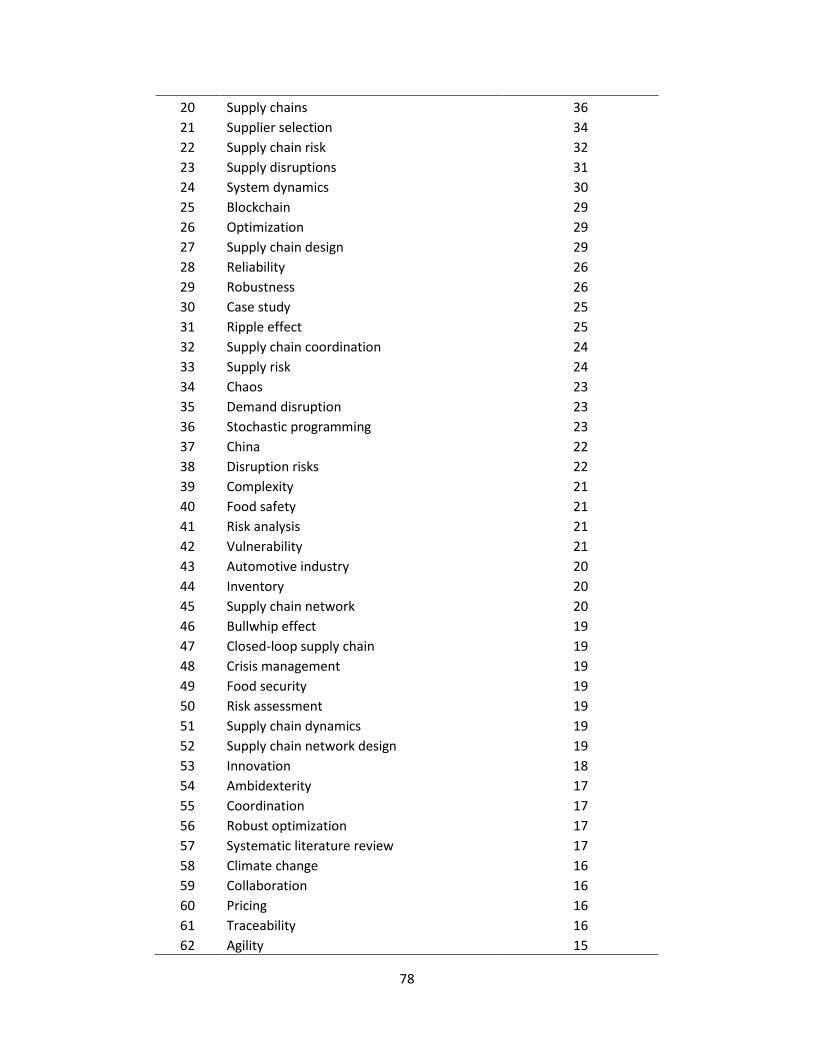
78
20 Supply chains 36
21 Supplier selection 34
22 Supply chain risk 32
23 Supply disruptions 31
24 System dynamics 30
25 Blockchain 29
26 Optimization 29
27 Supply chain design 29
28 Reliability 26
29 Robustness 26
30 Case study 25
31 Ripple effect 25
32 Supply chain coordination 24
33 Supply risk 24
34 Chaos 23
35 Demand disruption 23
36 Stochastic programming 23
37 China 22
38 Disruption risks 22
39 Complexity 21
40 Food safety 21
41 Risk analysis 21
42 Vulnerability 21
43 Automotive industry 20
44 Inventory 20
45 Supply chain network 20
46 Bullwhip effect 19
47 Closed-loop supply chain 19
48 Crisis management 19
49 Food security 19
50 Risk assessment 19
51 Supply chain dynamics 19
52 Supply chain network design 19
53 Innovation 18
54 Ambidexterity 17
55 Coordination 17
56 Robust optimization 17
57 Systematic literature review 17
58 Climate change 16
59 Collaboration 16
60 Pricing 16
61 Traceability 16
62 Agility 15
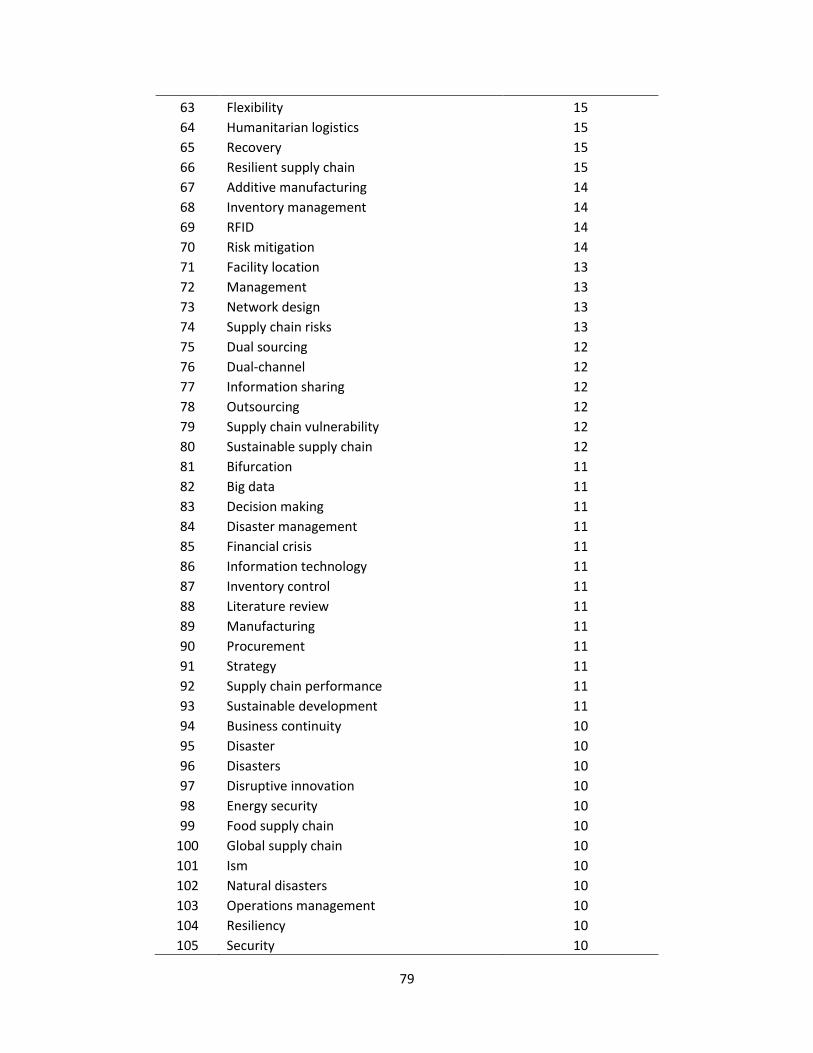
79
63 Flexibility 15
64 Humanitarian logistics 15
65 Recovery 15
66 Resilient supply chain 15
67 Additive manufacturing 14
68 Inventory management 14
69 RFID 14
70 Risk mitigation 14
71 Facility location 13
72 Management 13
73 Network design 13
74 Supply chain risks 13
75 Dual sourcing 12
76 Dual-channel 12
77 Information sharing 12
78 Outsourcing 12
79 Supply chain vulnerability 12
80 Sustainable supply chain 12
81 Bifurcation 11
82 Big data 11
83 Decision making 11
84 Disaster management 11
85 Financial crisis 11
86 Information technology 11
87 Inventory control 11
88 Literature review 11
89 Manufacturing 11
90 Procurement 11
91 Strategy 11
92 Supply chain performance 11
93 Sustainable development 11
94 Business continuity 10
95 Disaster 10
96 Disasters 10
97 Disruptive innovation 10
98 Energy security 10
99 Food supply chain 10
100 Global supply chain 10
101 Ism 10
102 Natural disasters 10
103 Operations management 10
104 Resiliency 10
105 Security 10
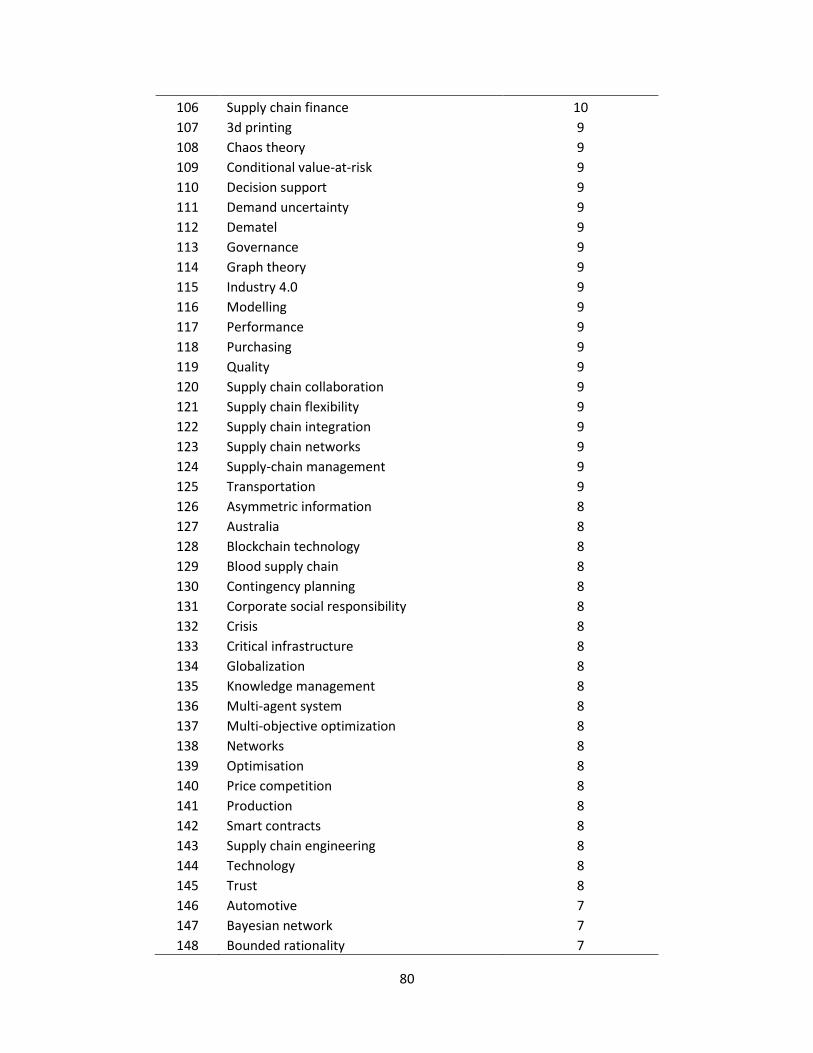
80
106 Supply chain finance 10
107 3d printing 9
108 Chaos theory 9
109 Conditional value-at-risk 9
110 Decision support 9
111 Demand uncertainty 9
112 Dematel 9
113 Governance 9
114 Graph theory 9
115 Industry 4.0 9
116 Modelling 9
117 Performance 9
118 Purchasing 9
119 Quality 9
120 Supply chain collaboration 9
121 Supply chain flexibility 9
122 Supply chain integration 9
123 Supply chain networks 9
124 Supply-chain management 9
125 Transportation 9
126 Asymmetric information 8
127 Australia 8
128 Blockchain technology 8
129 Blood supply chain 8
130 Contingency planning 8
131 Corporate social responsibility 8
132 Crisis 8
133 Critical infrastructure 8
134 Globalization 8
135 Knowledge management 8
136 Multi-agent system 8
137 Multi-objective optimization 8
138 Networks 8
139 Optimisation 8
140 Price competition 8
141 Production 8
142 Smart contracts 8
143 Supply chain engineering 8
144 Technology 8
145 Trust 8
146 Automotive 7
147 Bayesian network 7
148 Bounded rationality 7
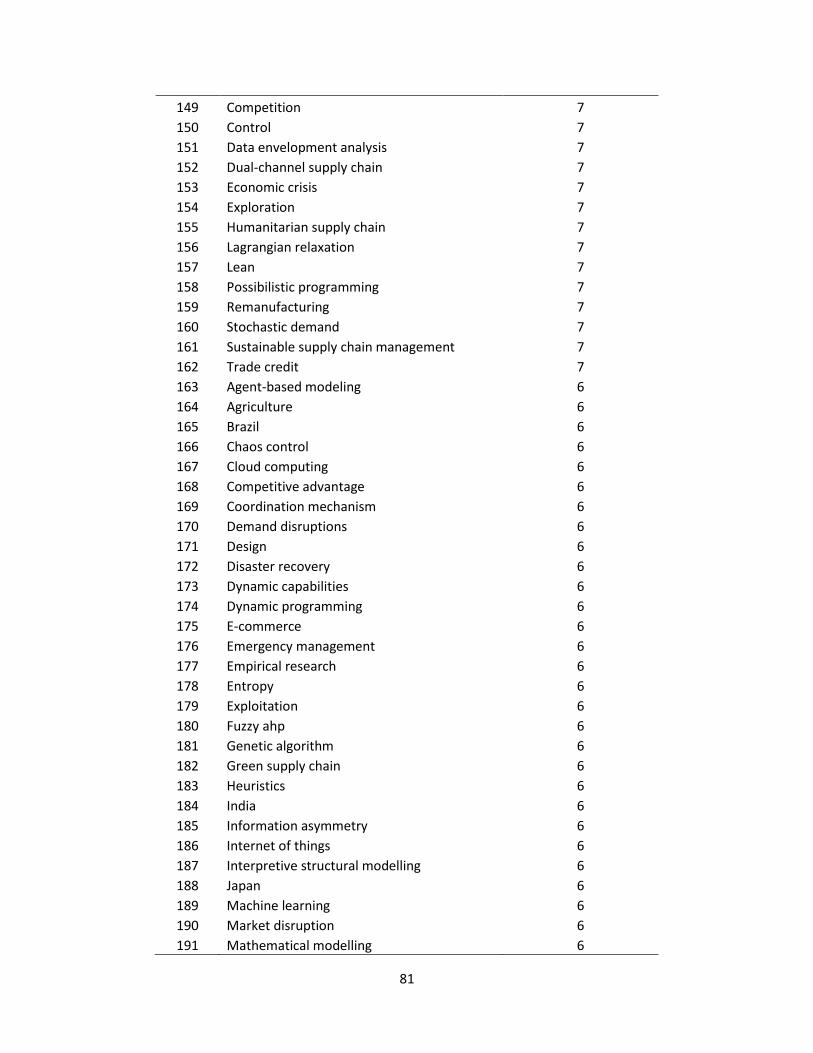
81
149 Competition 7
150 Control 7
151 Data envelopment analysis 7
152 Dual-channel supply chain 7
153 Economic crisis 7
154 Exploration 7
155 Humanitarian supply chain 7
156 Lagrangian relaxation 7
157 Lean 7
158 Possibilistic programming 7
159 Remanufacturing 7
160 Stochastic demand 7
161 Sustainable supply chain management 7
162 Trade credit 7
163 Agent-based modeling 6
164 Agriculture 6
165 Brazil 6
166 Chaos control 6
167 Cloud computing 6
168 Competitive advantage 6
169 Coordination mechanism 6
170 Demand disruptions 6
171 Design 6
172 Disaster recovery 6
173 Dynamic capabilities 6
174 Dynamic programming 6
175 E-commerce 6
176 Emergency management 6
177 Empirical research 6
178 Entropy 6
179 Exploitation 6
180 Fuzzy ahp 6
181 Genetic algorithm 6
182 Green supply chain 6
183 Heuristics 6
184 India 6
185 Information asymmetry 6
186 Internet of things 6
187 Interpretive structural modelling 6
188 Japan 6
189 Machine learning 6
190 Market disruption 6
191 Mathematical modelling 6
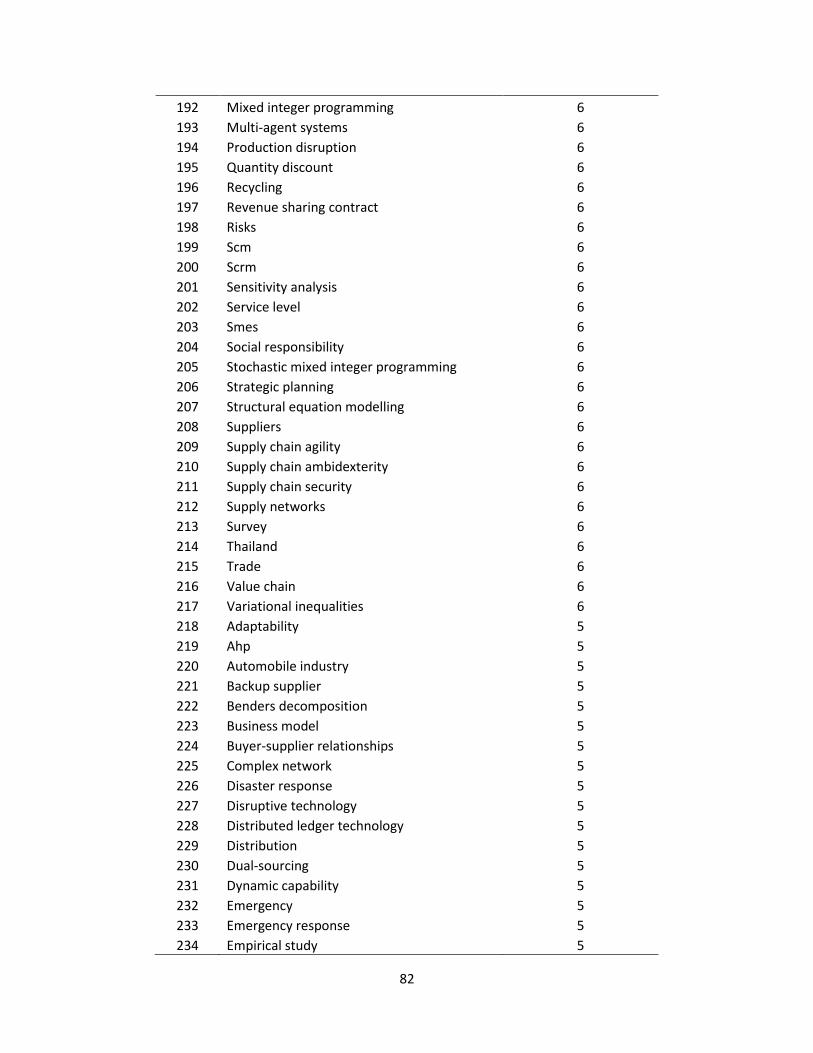
82
192 Mixed integer programming 6
193 Multi-agent systems 6
194 Production disruption 6
195 Quantity discount 6
196 Recycling 6
197 Revenue sharing contract 6
198 Risks 6
199 Scm 6
200 Scrm 6
201 Sensitivity analysis 6
202 Service level 6
203 Smes 6
204 Social responsibility 6
205 Stochastic mixed integer programming 6
206 Strategic planning 6
207 Structural equation modelling 6
208 Suppliers 6
209 Supply chain agility 6
210 Supply chain ambidexterity 6
211 Supply chain security 6
212 Supply networks 6
213 Survey 6
214 Thailand 6
215 Trade 6
216 Value chain 6
217 Variational inequalities 6
218 Adaptability 5
219 Ahp 5
220 Automobile industry 5
221 Backup supplier 5
222 Benders decomposition 5
223 Business model 5
224 Buyer-supplier relationships 5
225 Complex network 5
226 Disaster response 5
227 Disruptive technology 5
228 Distributed ledger technology 5
229 Distribution 5
230 Dual-sourcing 5
231 Dynamic capability 5
232 Emergency 5
233 Emergency response 5
234 Empirical study 5
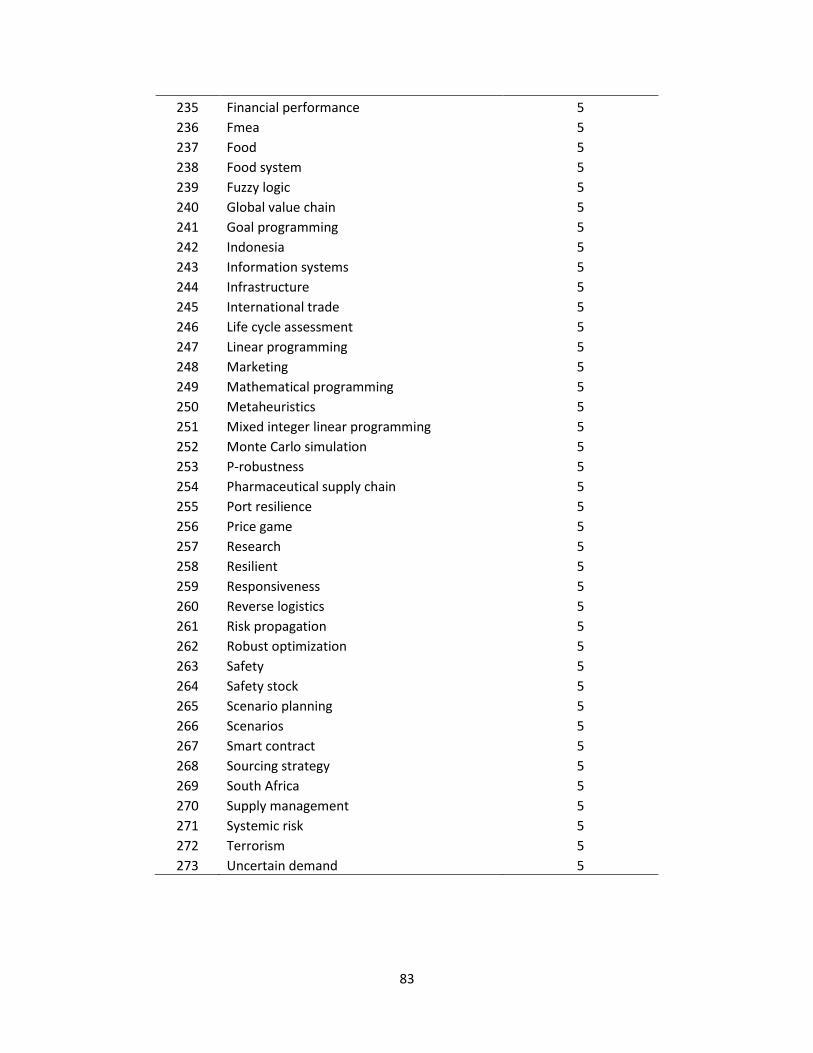
83
235 Financial performance 5
236 Fmea 5
237 Food 5
238 Food system 5
239 Fuzzy logic 5
240 Global value chain 5
241 Goal programming 5
242 Indonesia 5
243 Information systems 5
244 Infrastructure 5
245 International trade 5
246 Life cycle assessment 5
247 Linear programming 5
248 Marketing 5
249 Mathematical programming 5
250 Metaheuristics 5
251 Mixed integer linear programming 5
252 Monte Carlo simulation 5
253 P-robustness 5
254 Pharmaceutical supply chain 5
255 Port resilience 5
256 Price game 5
257 Research 5
258 Resilient 5
259 Responsiveness 5
260 Reverse logistics 5
261 Risk propagation 5
262 Robust optimization 5
263 Safety 5
264 Safety stock 5
265 Scenario planning 5
266 Scenarios 5
267 Smart contract 5
268 Sourcing strategy 5
269 South Africa 5
270 Supply management 5
271 Systemic risk 5
272 Terrorism 5
273 Uncertain demand 5
84
Appendix D. Co-occurrence of author keywords by publication year - In particular, the SC, SC management, risk management,
resilience, SC risk management, and disruption have the largest occurrences frequency and represented as the central keywords,
which then have interrelationship with the others. The yellow nodes represent the latest occurring keywords, such as the financial
performance, SC collaboration, industry 4.0, ripple effect, additive manufacturing, SC engineering, e-commerce, in recently explored
from year of 2018.
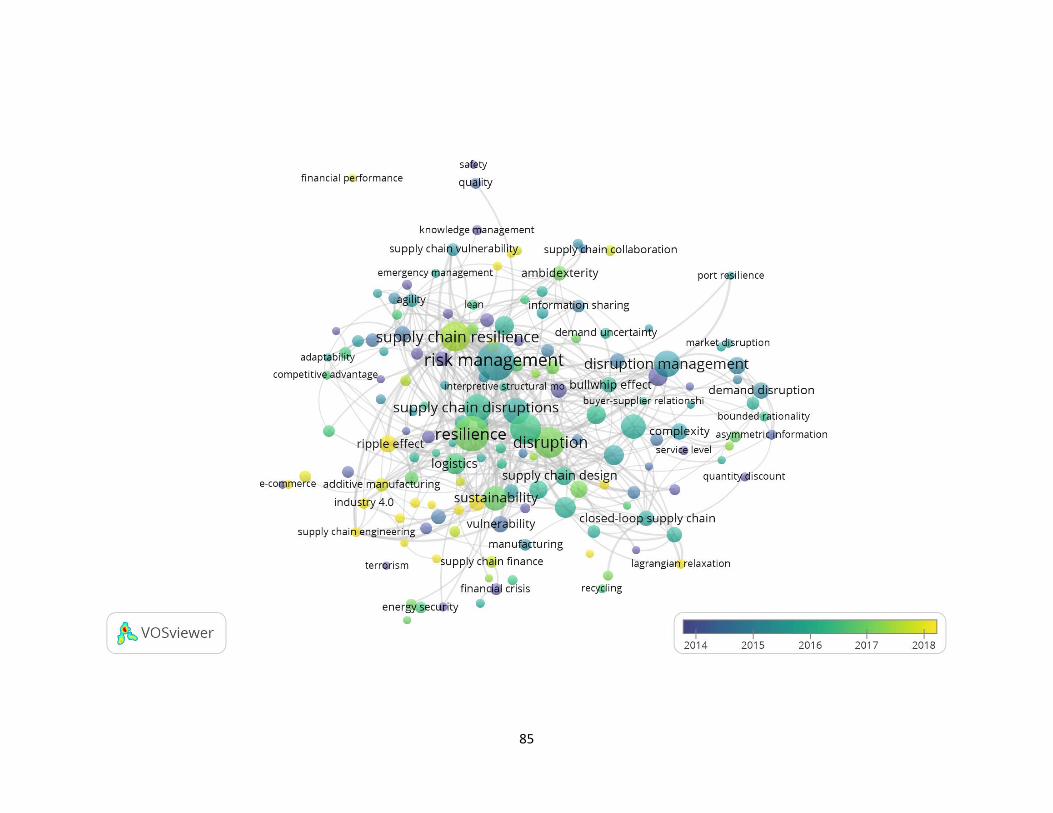
85

86
Appendix E. Bibliographic coupling of countries/territories by year - Bibliographic coupling by year is acquired reporting the most
productive countries/territories is United State followed by the China and United Kingdom. The latest countries/territories listed in
the field are Vietnam, United Arab Emirates, Bangladesh since 2018.
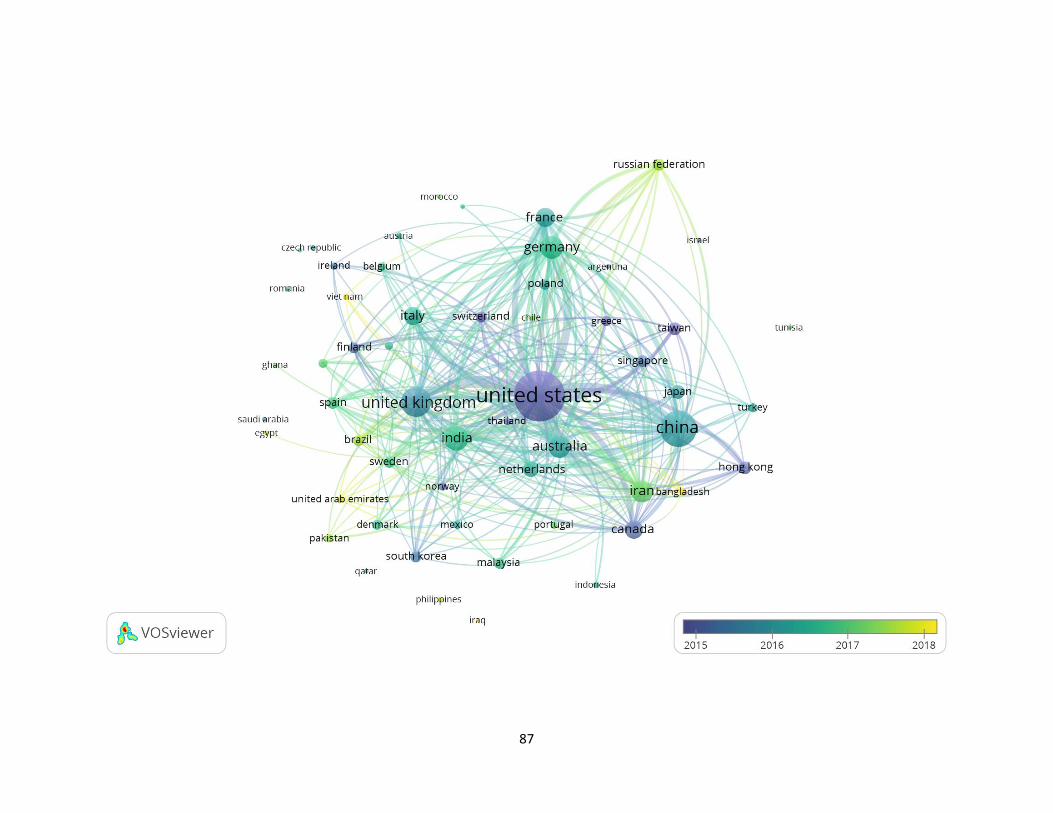
87
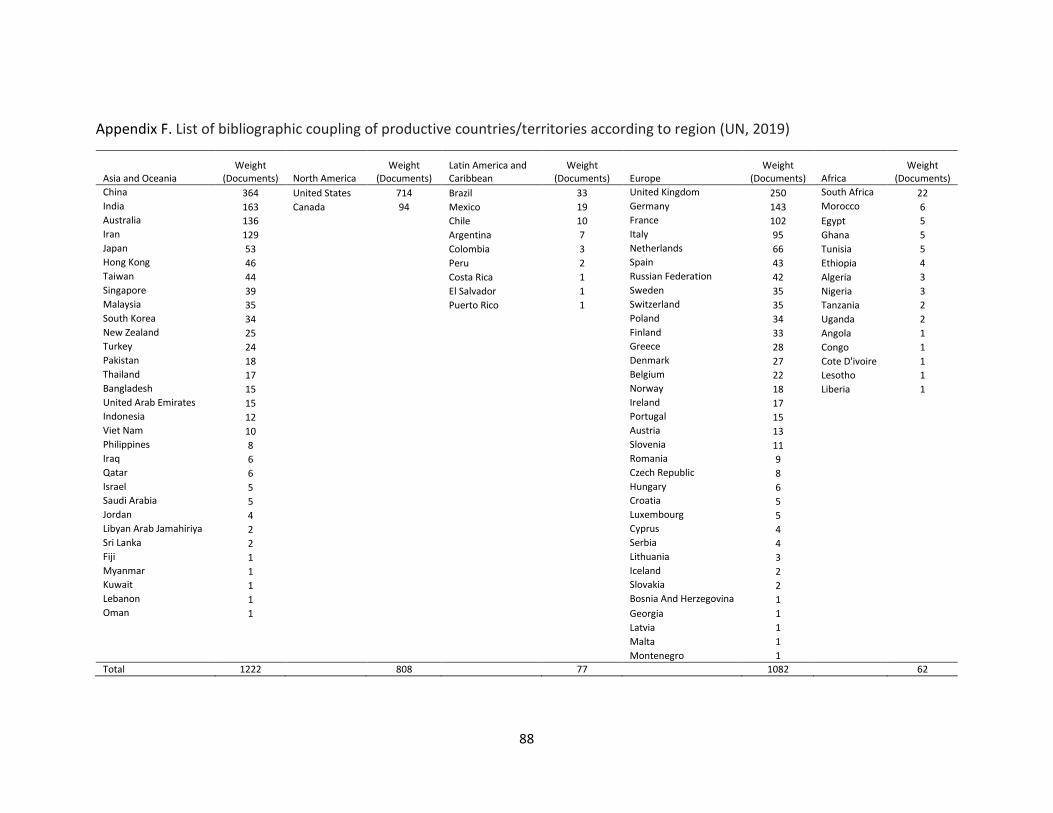
88
Appendix F. List of bibliographic coupling of productive countries/territories according to region (UN, 2019)
Asia and Oceania Weight
(Documents) North America Weight
(Documents) Latin America and Caribbean
Weight (Documents) Europe
Weight (Documents) Africa
Weight (Documents)
China 364 United States 714 Brazil 33 United Kingdom 250 South Africa 22 India 163 Canada 94 Mexico 19 Germany 143 Morocco 6 Australia 136 Chile 10 France 102 Egypt 5 Iran 129 Argentina 7 Italy 95 Ghana 5 Japan 53 Colombia 3 Netherlands 66 Tunisia 5 Hong Kong 46 Peru 2 Spain 43 Ethiopia 4 Taiwan 44 Costa Rica 1 Russian Federation 42 Algeria 3 Singapore 39 El Salvador 1 Sweden 35 Nigeria 3 Malaysia 35 Puerto Rico 1 Switzerland 35 Tanzania 2 South Korea 34 Poland 34 Uganda 2 New Zealand 25 Finland 33 Angola 1 Turkey 24 Greece 28 Congo 1 Pakistan 18 Denmark 27 Cote D'ivoire 1 Thailand 17 Belgium 22 Lesotho 1 Bangladesh 15 Norway 18 Liberia 1 United Arab Emirates 15 Ireland 17 Indonesia 12 Portugal 15 Viet Nam 10 Austria 13 Philippines 8 Slovenia 11 Iraq 6 Romania 9 Qatar 6 Czech Republic 8 Israel 5 Hungary 6 Saudi Arabia 5 Croatia 5 Jordan 4 Luxembourg 5 Libyan Arab Jamahiriya 2 Cyprus 4 Sri Lanka 2 Serbia 4 Fiji 1 Lithuania 3 Myanmar 1 Iceland 2 Kuwait 1 Slovakia 2 Lebanon 1 Bosnia And Herzegovina 1 Oman 1 Georgia 1 Latvia 1 Malta 1 Montenegro 1
Total 1222 808 77 1082 62
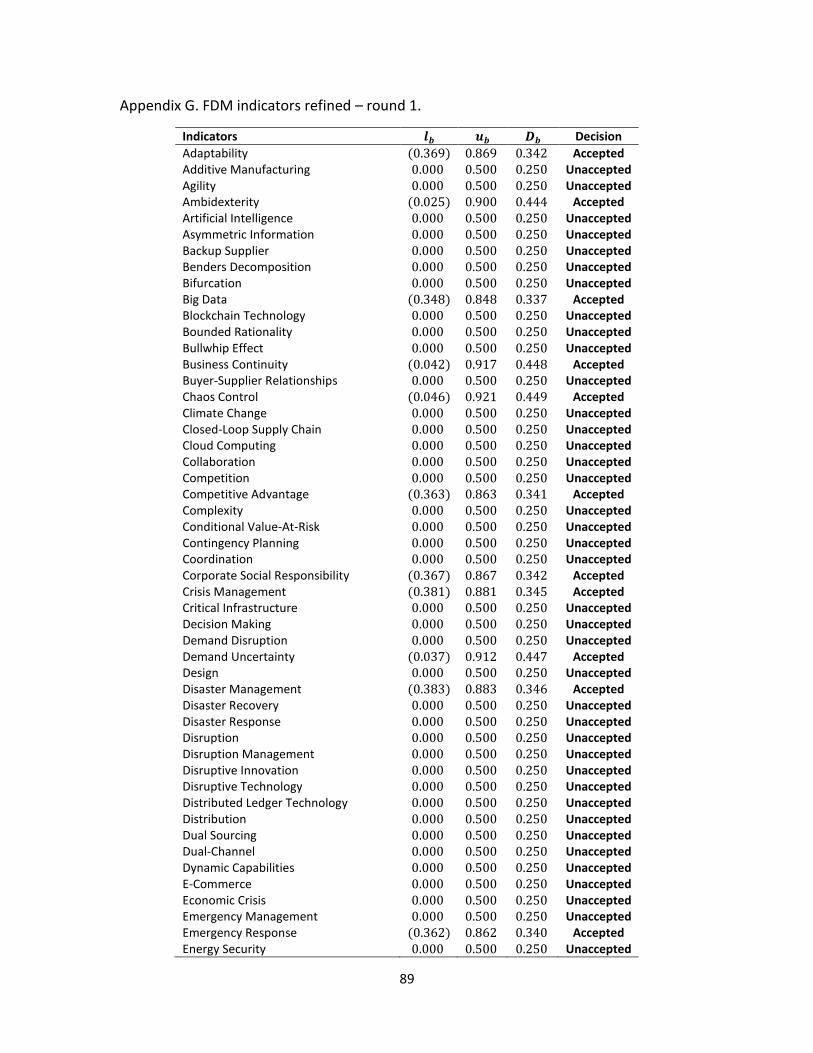
89
Appendix G. FDM indicators refined – round 1.
Indicators 𝒍𝒃 𝒖𝒃 𝑫𝒃 Decision
Adaptability (0.369) 0.869 0.342 Accepted Additive Manufacturing 0.000 0.500 0.250 Unaccepted Agility 0.000 0.500 0.250 Unaccepted Ambidexterity (0.025) 0.900 0.444 Accepted Artificial Intelligence 0.000 0.500 0.250 Unaccepted Asymmetric Information 0.000 0.500 0.250 Unaccepted Backup Supplier 0.000 0.500 0.250 Unaccepted Benders Decomposition 0.000 0.500 0.250 Unaccepted Bifurcation 0.000 0.500 0.250 Unaccepted Big Data (0.348) 0.848 0.337 Accepted Blockchain Technology 0.000 0.500 0.250 Unaccepted Bounded Rationality 0.000 0.500 0.250 Unaccepted Bullwhip Effect 0.000 0.500 0.250 Unaccepted Business Continuity (0.042) 0.917 0.448 Accepted Buyer-Supplier Relationships 0.000 0.500 0.250 Unaccepted Chaos Control (0.046) 0.921 0.449 Accepted Climate Change 0.000 0.500 0.250 Unaccepted Closed-Loop Supply Chain 0.000 0.500 0.250 Unaccepted Cloud Computing 0.000 0.500 0.250 Unaccepted Collaboration 0.000 0.500 0.250 Unaccepted Competition 0.000 0.500 0.250 Unaccepted Competitive Advantage (0.363) 0.863 0.341 Accepted Complexity 0.000 0.500 0.250 Unaccepted Conditional Value-At-Risk 0.000 0.500 0.250 Unaccepted Contingency Planning 0.000 0.500 0.250 Unaccepted Coordination 0.000 0.500 0.250 Unaccepted Corporate Social Responsibility (0.367) 0.867 0.342 Accepted Crisis Management (0.381) 0.881 0.345 Accepted Critical Infrastructure 0.000 0.500 0.250 Unaccepted Decision Making 0.000 0.500 0.250 Unaccepted Demand Disruption 0.000 0.500 0.250 Unaccepted Demand Uncertainty (0.037) 0.912 0.447 Accepted Design 0.000 0.500 0.250 Unaccepted Disaster Management (0.383) 0.883 0.346 Accepted Disaster Recovery 0.000 0.500 0.250 Unaccepted Disaster Response 0.000 0.500 0.250 Unaccepted Disruption 0.000 0.500 0.250 Unaccepted Disruption Management 0.000 0.500 0.250 Unaccepted Disruptive Innovation 0.000 0.500 0.250 Unaccepted Disruptive Technology 0.000 0.500 0.250 Unaccepted Distributed Ledger Technology 0.000 0.500 0.250 Unaccepted Distribution 0.000 0.500 0.250 Unaccepted Dual Sourcing 0.000 0.500 0.250 Unaccepted Dual-Channel 0.000 0.500 0.250 Unaccepted Dynamic Capabilities 0.000 0.500 0.250 Unaccepted E-Commerce 0.000 0.500 0.250 Unaccepted Economic Crisis 0.000 0.500 0.250 Unaccepted Emergency Management 0.000 0.500 0.250 Unaccepted Emergency Response (0.362) 0.862 0.340 Accepted Energy Security 0.000 0.500 0.250 Unaccepted
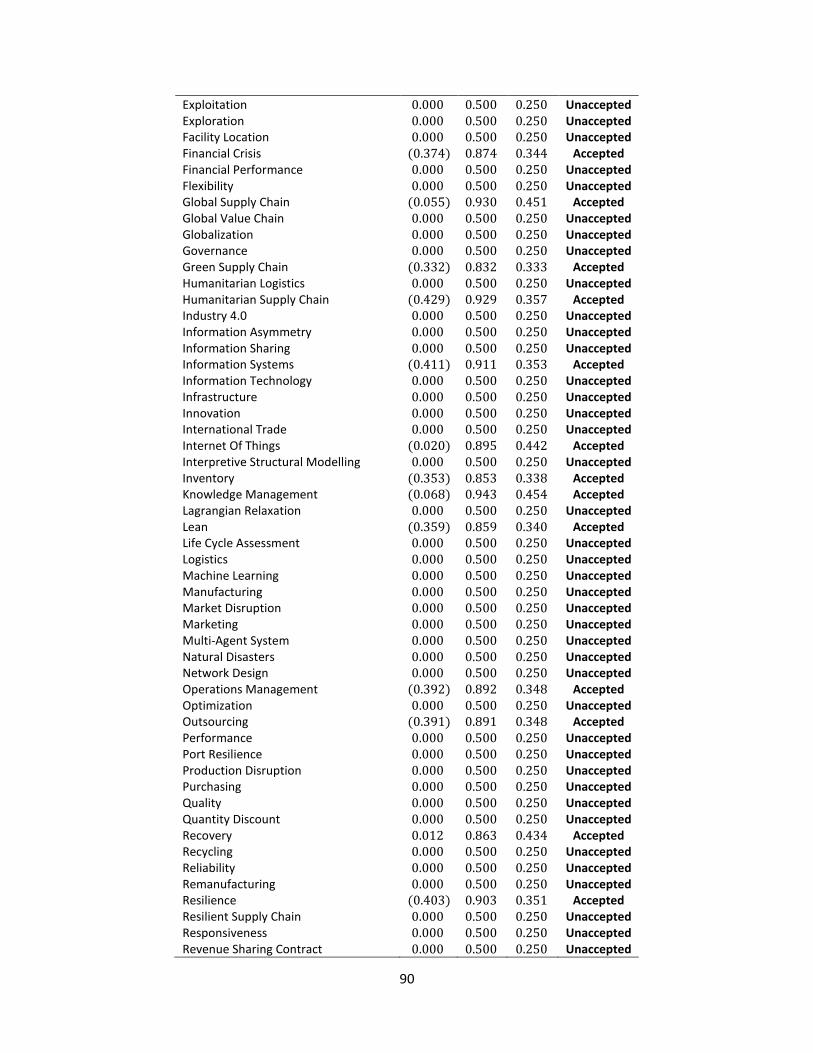
90
Exploitation 0.000 0.500 0.250 Unaccepted Exploration 0.000 0.500 0.250 Unaccepted Facility Location 0.000 0.500 0.250 Unaccepted Financial Crisis (0.374) 0.874 0.344 Accepted Financial Performance 0.000 0.500 0.250 Unaccepted Flexibility 0.000 0.500 0.250 Unaccepted Global Supply Chain (0.055) 0.930 0.451 Accepted Global Value Chain 0.000 0.500 0.250 Unaccepted Globalization 0.000 0.500 0.250 Unaccepted Governance 0.000 0.500 0.250 Unaccepted Green Supply Chain (0.332) 0.832 0.333 Accepted Humanitarian Logistics 0.000 0.500 0.250 Unaccepted Humanitarian Supply Chain (0.429) 0.929 0.357 Accepted Industry 4.0 0.000 0.500 0.250 Unaccepted Information Asymmetry 0.000 0.500 0.250 Unaccepted Information Sharing 0.000 0.500 0.250 Unaccepted Information Systems (0.411) 0.911 0.353 Accepted Information Technology 0.000 0.500 0.250 Unaccepted Infrastructure 0.000 0.500 0.250 Unaccepted Innovation 0.000 0.500 0.250 Unaccepted International Trade 0.000 0.500 0.250 Unaccepted Internet Of Things (0.020) 0.895 0.442 Accepted Interpretive Structural Modelling 0.000 0.500 0.250 Unaccepted Inventory (0.353) 0.853 0.338 Accepted Knowledge Management (0.068) 0.943 0.454 Accepted Lagrangian Relaxation 0.000 0.500 0.250 Unaccepted Lean (0.359) 0.859 0.340 Accepted Life Cycle Assessment 0.000 0.500 0.250 Unaccepted Logistics 0.000 0.500 0.250 Unaccepted Machine Learning 0.000 0.500 0.250 Unaccepted Manufacturing 0.000 0.500 0.250 Unaccepted Market Disruption 0.000 0.500 0.250 Unaccepted Marketing 0.000 0.500 0.250 Unaccepted Multi-Agent System 0.000 0.500 0.250 Unaccepted Natural Disasters 0.000 0.500 0.250 Unaccepted Network Design 0.000 0.500 0.250 Unaccepted Operations Management (0.392) 0.892 0.348 Accepted Optimization 0.000 0.500 0.250 Unaccepted Outsourcing (0.391) 0.891 0.348 Accepted Performance 0.000 0.500 0.250 Unaccepted Port Resilience 0.000 0.500 0.250 Unaccepted Production Disruption 0.000 0.500 0.250 Unaccepted Purchasing 0.000 0.500 0.250 Unaccepted Quality 0.000 0.500 0.250 Unaccepted Quantity Discount 0.000 0.500 0.250 Unaccepted Recovery 0.012 0.863 0.434 Accepted Recycling 0.000 0.500 0.250 Unaccepted Reliability 0.000 0.500 0.250 Unaccepted Remanufacturing 0.000 0.500 0.250 Unaccepted Resilience (0.403) 0.903 0.351 Accepted Resilient Supply Chain 0.000 0.500 0.250 Unaccepted Responsiveness 0.000 0.500 0.250 Unaccepted Revenue Sharing Contract 0.000 0.500 0.250 Unaccepted
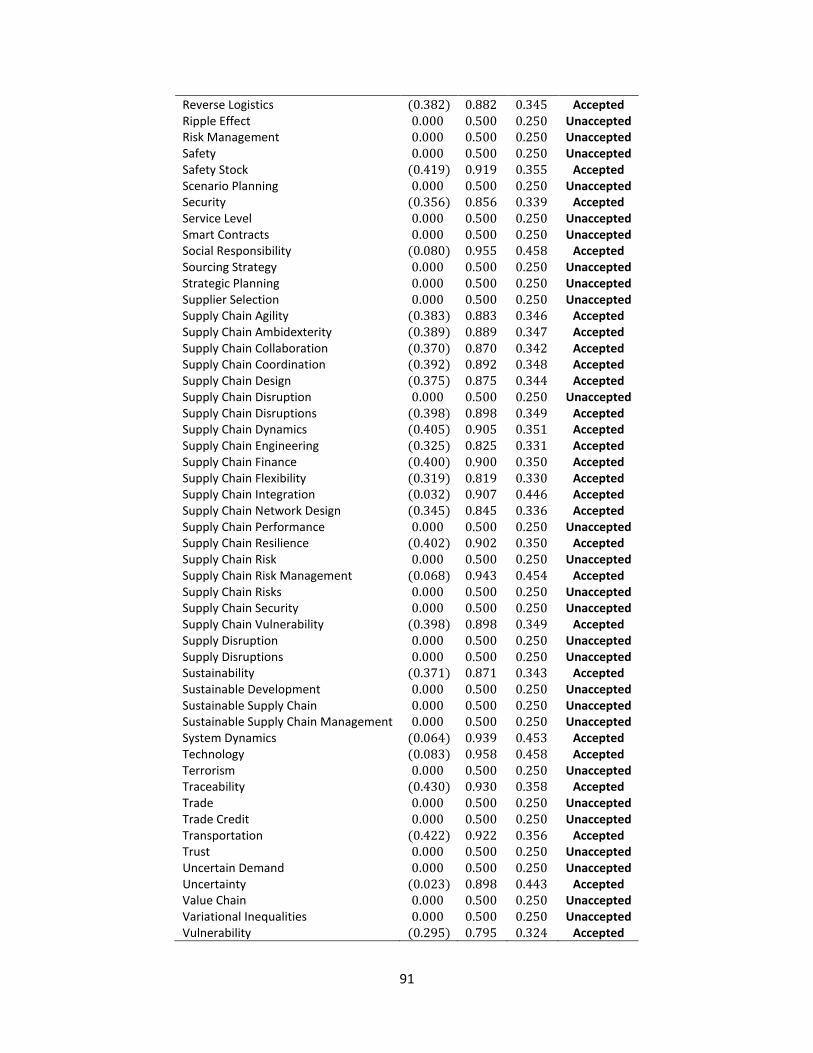
91
Reverse Logistics (0.382) 0.882 0.345 Accepted Ripple Effect 0.000 0.500 0.250 Unaccepted Risk Management 0.000 0.500 0.250 Unaccepted Safety 0.000 0.500 0.250 Unaccepted Safety Stock (0.419) 0.919 0.355 Accepted Scenario Planning 0.000 0.500 0.250 Unaccepted Security (0.356) 0.856 0.339 Accepted Service Level 0.000 0.500 0.250 Unaccepted Smart Contracts 0.000 0.500 0.250 Unaccepted Social Responsibility (0.080) 0.955 0.458 Accepted Sourcing Strategy 0.000 0.500 0.250 Unaccepted Strategic Planning 0.000 0.500 0.250 Unaccepted Supplier Selection 0.000 0.500 0.250 Unaccepted Supply Chain Agility (0.383) 0.883 0.346 Accepted Supply Chain Ambidexterity (0.389) 0.889 0.347 Accepted Supply Chain Collaboration (0.370) 0.870 0.342 Accepted Supply Chain Coordination (0.392) 0.892 0.348 Accepted Supply Chain Design (0.375) 0.875 0.344 Accepted Supply Chain Disruption 0.000 0.500 0.250 Unaccepted Supply Chain Disruptions (0.398) 0.898 0.349 Accepted Supply Chain Dynamics (0.405) 0.905 0.351 Accepted Supply Chain Engineering (0.325) 0.825 0.331 Accepted Supply Chain Finance (0.400) 0.900 0.350 Accepted Supply Chain Flexibility (0.319) 0.819 0.330 Accepted Supply Chain Integration (0.032) 0.907 0.446 Accepted Supply Chain Network Design (0.345) 0.845 0.336 Accepted Supply Chain Performance 0.000 0.500 0.250 Unaccepted Supply Chain Resilience (0.402) 0.902 0.350 Accepted Supply Chain Risk 0.000 0.500 0.250 Unaccepted Supply Chain Risk Management (0.068) 0.943 0.454 Accepted Supply Chain Risks 0.000 0.500 0.250 Unaccepted Supply Chain Security 0.000 0.500 0.250 Unaccepted Supply Chain Vulnerability (0.398) 0.898 0.349 Accepted Supply Disruption 0.000 0.500 0.250 Unaccepted Supply Disruptions 0.000 0.500 0.250 Unaccepted Sustainability (0.371) 0.871 0.343 Accepted Sustainable Development 0.000 0.500 0.250 Unaccepted Sustainable Supply Chain 0.000 0.500 0.250 Unaccepted Sustainable Supply Chain Management 0.000 0.500 0.250 Unaccepted System Dynamics (0.064) 0.939 0.453 Accepted Technology (0.083) 0.958 0.458 Accepted Terrorism 0.000 0.500 0.250 Unaccepted Traceability (0.430) 0.930 0.358 Accepted Trade 0.000 0.500 0.250 Unaccepted Trade Credit 0.000 0.500 0.250 Unaccepted Transportation (0.422) 0.922 0.356 Accepted Trust 0.000 0.500 0.250 Unaccepted Uncertain Demand 0.000 0.500 0.250 Unaccepted Uncertainty (0.023) 0.898 0.443 Accepted Value Chain 0.000 0.500 0.250 Unaccepted Variational Inequalities 0.000 0.500 0.250 Unaccepted Vulnerability (0.295) 0.795 0.324 Accepted
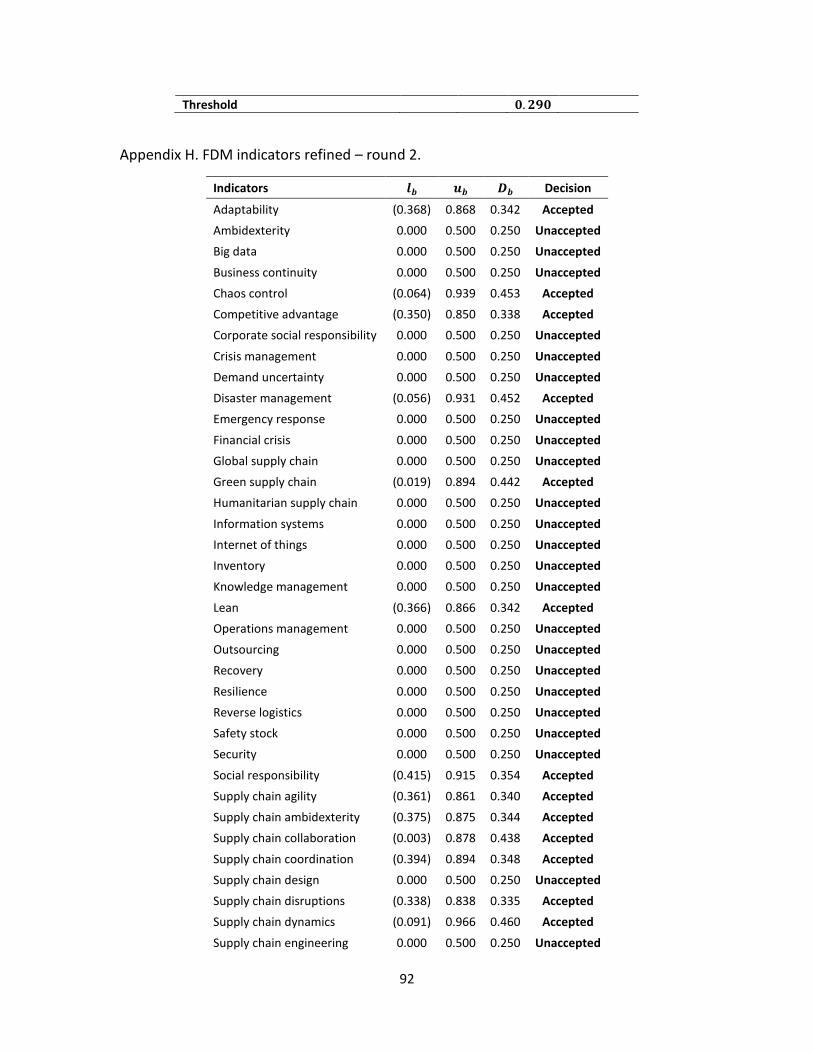
92
Threshold 𝟎. 𝟐𝟗𝟎
Appendix H. FDM indicators refined – round 2.
Indicators 𝒍𝒃 𝒖𝒃 𝑫𝒃 Decision
Adaptability (0.368) 0.868 0.342 Accepted
Ambidexterity 0.000 0.500 0.250 Unaccepted
Big data 0.000 0.500 0.250 Unaccepted
Business continuity 0.000 0.500 0.250 Unaccepted
Chaos control (0.064) 0.939 0.453 Accepted
Competitive advantage (0.350) 0.850 0.338 Accepted
Corporate social responsibility 0.000 0.500 0.250 Unaccepted
Crisis management 0.000 0.500 0.250 Unaccepted
Demand uncertainty 0.000 0.500 0.250 Unaccepted
Disaster management (0.056) 0.931 0.452 Accepted
Emergency response 0.000 0.500 0.250 Unaccepted
Financial crisis 0.000 0.500 0.250 Unaccepted
Global supply chain 0.000 0.500 0.250 Unaccepted
Green supply chain (0.019) 0.894 0.442 Accepted
Humanitarian supply chain 0.000 0.500 0.250 Unaccepted
Information systems 0.000 0.500 0.250 Unaccepted
Internet of things 0.000 0.500 0.250 Unaccepted
Inventory 0.000 0.500 0.250 Unaccepted
Knowledge management 0.000 0.500 0.250 Unaccepted
Lean (0.366) 0.866 0.342 Accepted
Operations management 0.000 0.500 0.250 Unaccepted
Outsourcing 0.000 0.500 0.250 Unaccepted
Recovery 0.000 0.500 0.250 Unaccepted
Resilience 0.000 0.500 0.250 Unaccepted
Reverse logistics 0.000 0.500 0.250 Unaccepted
Safety stock 0.000 0.500 0.250 Unaccepted
Security 0.000 0.500 0.250 Unaccepted
Social responsibility (0.415) 0.915 0.354 Accepted
Supply chain agility (0.361) 0.861 0.340 Accepted
Supply chain ambidexterity (0.375) 0.875 0.344 Accepted
Supply chain collaboration (0.003) 0.878 0.438 Accepted
Supply chain coordination (0.394) 0.894 0.348 Accepted
Supply chain design 0.000 0.500 0.250 Unaccepted
Supply chain disruptions (0.338) 0.838 0.335 Accepted
Supply chain dynamics (0.091) 0.966 0.460 Accepted
Supply chain engineering 0.000 0.500 0.250 Unaccepted
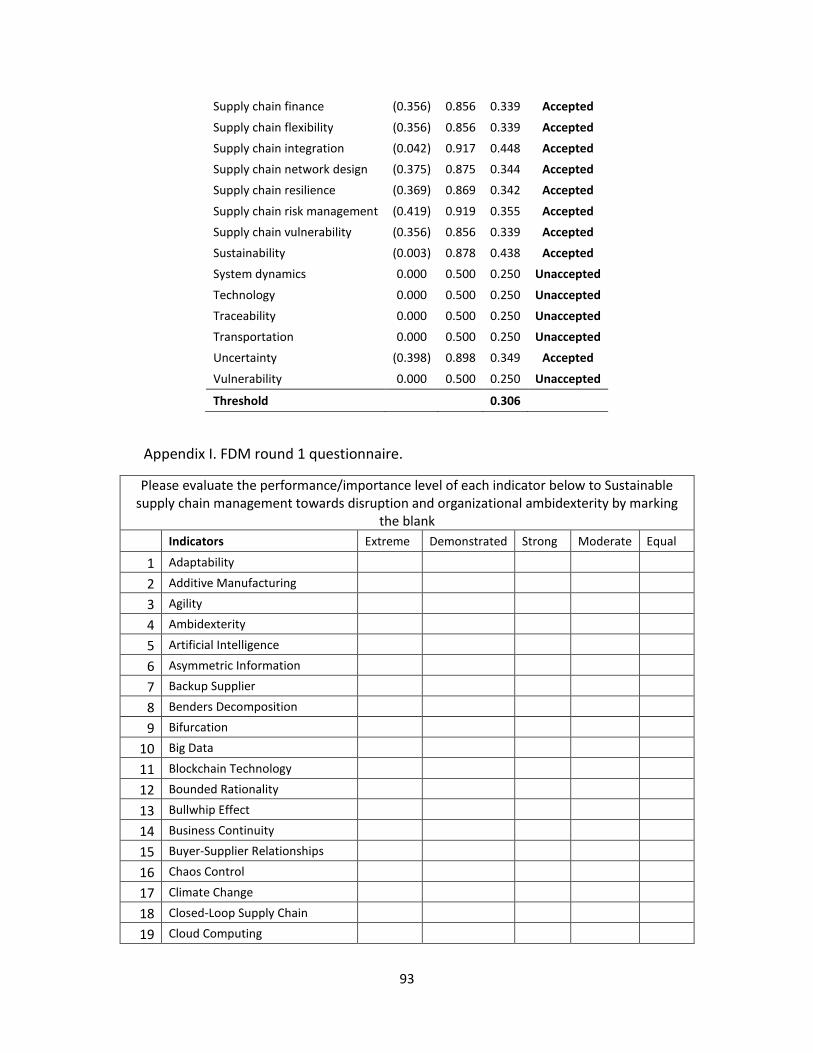
93
Supply chain finance (0.356) 0.856 0.339 Accepted
Supply chain flexibility (0.356) 0.856 0.339 Accepted
Supply chain integration (0.042) 0.917 0.448 Accepted
Supply chain network design (0.375) 0.875 0.344 Accepted
Supply chain resilience (0.369) 0.869 0.342 Accepted
Supply chain risk management (0.419) 0.919 0.355 Accepted
Supply chain vulnerability (0.356) 0.856 0.339 Accepted
Sustainability (0.003) 0.878 0.438 Accepted
System dynamics 0.000 0.500 0.250 Unaccepted
Technology 0.000 0.500 0.250 Unaccepted
Traceability 0.000 0.500 0.250 Unaccepted
Transportation 0.000 0.500 0.250 Unaccepted
Uncertainty (0.398) 0.898 0.349 Accepted
Vulnerability 0.000 0.500 0.250 Unaccepted
Threshold 0.306
Appendix I. FDM round 1 questionnaire.
Please evaluate the performance/importance level of each indicator below to Sustainable supply chain management towards disruption and organizational ambidexterity by marking
the blank
Indicators Extreme Demonstrated Strong Moderate Equal
1 Adaptability
2 Additive Manufacturing
3 Agility
4 Ambidexterity
5 Artificial Intelligence
6 Asymmetric Information
7 Backup Supplier
8 Benders Decomposition
9 Bifurcation
10 Big Data
11 Blockchain Technology
12 Bounded Rationality
13 Bullwhip Effect
14 Business Continuity
15 Buyer-Supplier Relationships
16 Chaos Control
17 Climate Change
18 Closed-Loop Supply Chain
19 Cloud Computing
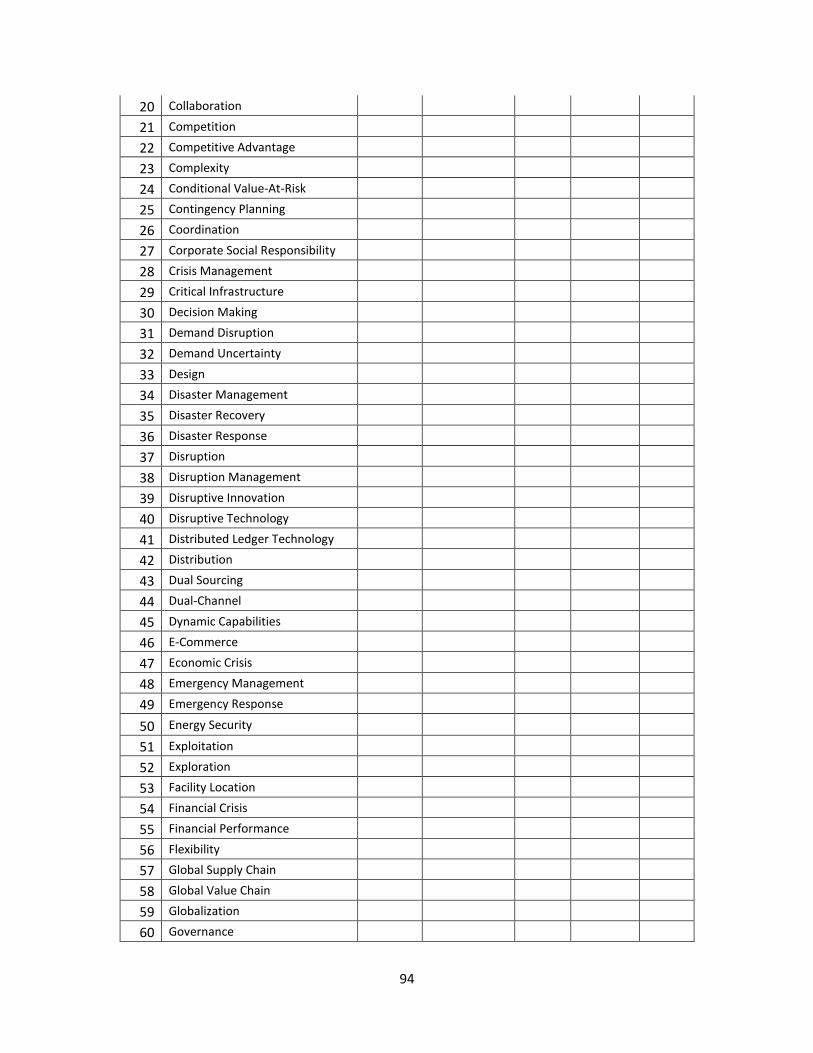
94
20 Collaboration
21 Competition
22 Competitive Advantage
23 Complexity
24 Conditional Value-At-Risk
25 Contingency Planning
26 Coordination
27 Corporate Social Responsibility
28 Crisis Management
29 Critical Infrastructure
30 Decision Making
31 Demand Disruption
32 Demand Uncertainty
33 Design
34 Disaster Management
35 Disaster Recovery
36 Disaster Response
37 Disruption
38 Disruption Management
39 Disruptive Innovation
40 Disruptive Technology
41 Distributed Ledger Technology
42 Distribution
43 Dual Sourcing
44 Dual-Channel
45 Dynamic Capabilities
46 E-Commerce
47 Economic Crisis
48 Emergency Management
49 Emergency Response
50 Energy Security
51 Exploitation
52 Exploration
53 Facility Location
54 Financial Crisis
55 Financial Performance
56 Flexibility
57 Global Supply Chain
58 Global Value Chain
59 Globalization
60 Governance
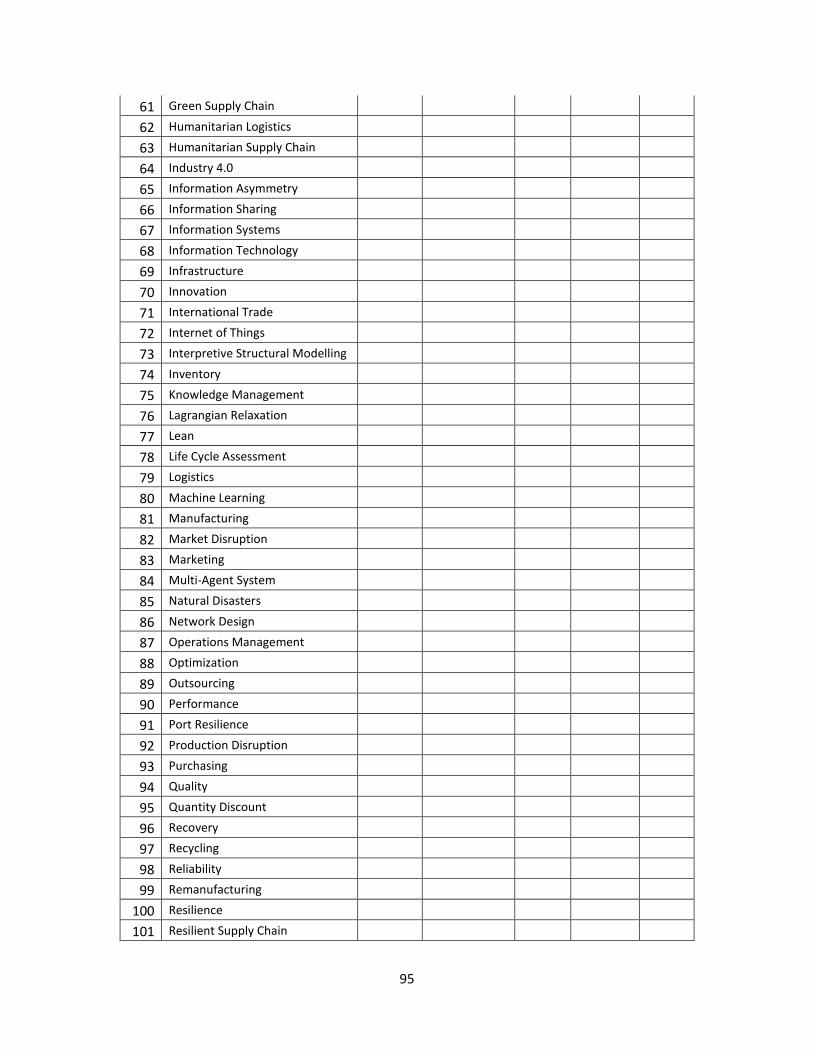
95
61 Green Supply Chain
62 Humanitarian Logistics
63 Humanitarian Supply Chain
64 Industry 4.0
65 Information Asymmetry
66 Information Sharing
67 Information Systems
68 Information Technology
69 Infrastructure
70 Innovation
71 International Trade
72 Internet of Things
73 Interpretive Structural Modelling
74 Inventory
75 Knowledge Management
76 Lagrangian Relaxation
77 Lean
78 Life Cycle Assessment
79 Logistics
80 Machine Learning
81 Manufacturing
82 Market Disruption
83 Marketing
84 Multi-Agent System
85 Natural Disasters
86 Network Design
87 Operations Management
88 Optimization
89 Outsourcing
90 Performance
91 Port Resilience
92 Production Disruption
93 Purchasing
94 Quality
95 Quantity Discount
96 Recovery
97 Recycling
98 Reliability
99 Remanufacturing
100 Resilience
101 Resilient Supply Chain
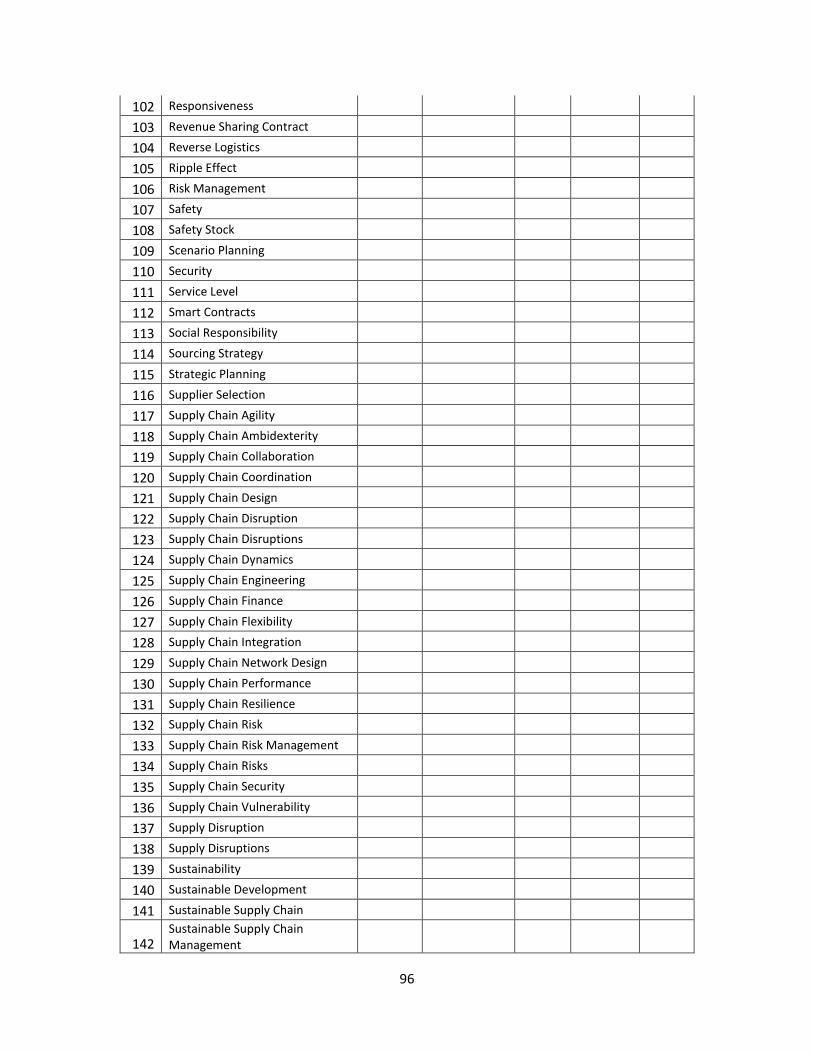
96
102 Responsiveness
103 Revenue Sharing Contract
104 Reverse Logistics
105 Ripple Effect
106 Risk Management
107 Safety
108 Safety Stock
109 Scenario Planning
110 Security
111 Service Level
112 Smart Contracts
113 Social Responsibility
114 Sourcing Strategy
115 Strategic Planning
116 Supplier Selection
117 Supply Chain Agility
118 Supply Chain Ambidexterity
119 Supply Chain Collaboration
120 Supply Chain Coordination
121 Supply Chain Design
122 Supply Chain Disruption
123 Supply Chain Disruptions
124 Supply Chain Dynamics
125 Supply Chain Engineering
126 Supply Chain Finance
127 Supply Chain Flexibility
128 Supply Chain Integration
129 Supply Chain Network Design
130 Supply Chain Performance
131 Supply Chain Resilience
132 Supply Chain Risk
133 Supply Chain Risk Management
134 Supply Chain Risks
135 Supply Chain Security
136 Supply Chain Vulnerability
137 Supply Disruption
138 Supply Disruptions
139 Sustainability
140 Sustainable Development
141 Sustainable Supply Chain
142 Sustainable Supply Chain Management
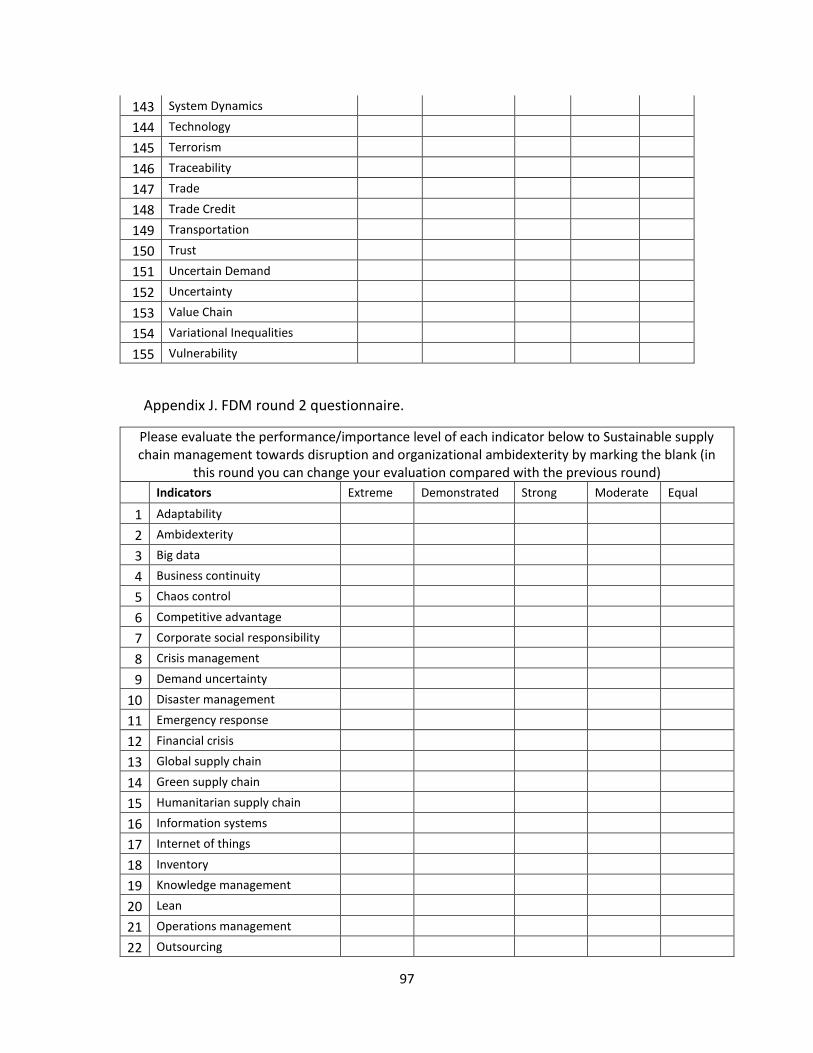
97
143 System Dynamics
144 Technology
145 Terrorism
146 Traceability
147 Trade
148 Trade Credit
149 Transportation
150 Trust
151 Uncertain Demand
152 Uncertainty
153 Value Chain
154 Variational Inequalities
155 Vulnerability
Appendix J. FDM round 2 questionnaire.
Please evaluate the performance/importance level of each indicator below to Sustainable supply chain management towards disruption and organizational ambidexterity by marking the blank (in
this round you can change your evaluation compared with the previous round)
Indicators Extreme Demonstrated Strong Moderate Equal
1 Adaptability
2 Ambidexterity
3 Big data
4 Business continuity
5 Chaos control
6 Competitive advantage
7 Corporate social responsibility
8 Crisis management
9 Demand uncertainty
10 Disaster management
11 Emergency response
12 Financial crisis
13 Global supply chain
14 Green supply chain
15 Humanitarian supply chain
16 Information systems
17 Internet of things
18 Inventory
19 Knowledge management
20 Lean
21 Operations management
22 Outsourcing
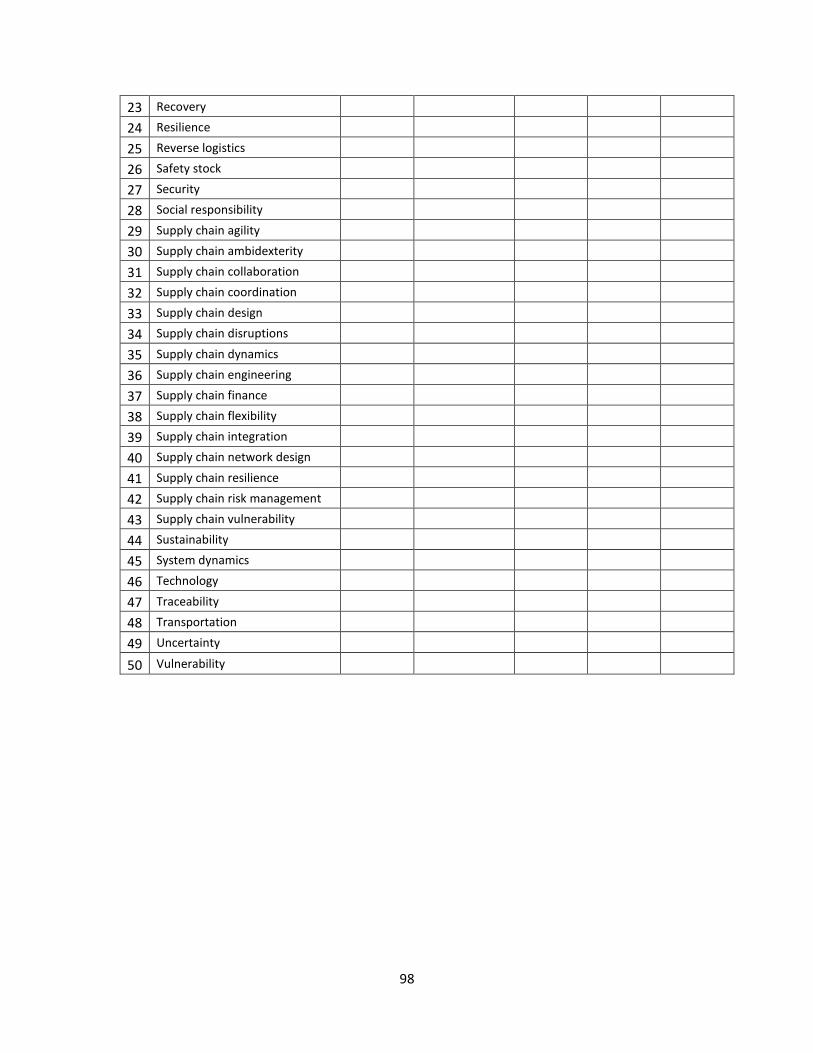
98
23 Recovery
24 Resilience
25 Reverse logistics
26 Safety stock
27 Security
28 Social responsibility
29 Supply chain agility
30 Supply chain ambidexterity
31 Supply chain collaboration
32 Supply chain coordination
33 Supply chain design
34 Supply chain disruptions
35 Supply chain dynamics
36 Supply chain engineering
37 Supply chain finance
38 Supply chain flexibility
39 Supply chain integration
40 Supply chain network design
41 Supply chain resilience
42 Supply chain risk management
43 Supply chain vulnerability
44 Sustainability
45 System dynamics
46 Technology
47 Traceability
48 Transportation
49 Uncertainty
50 Vulnerability
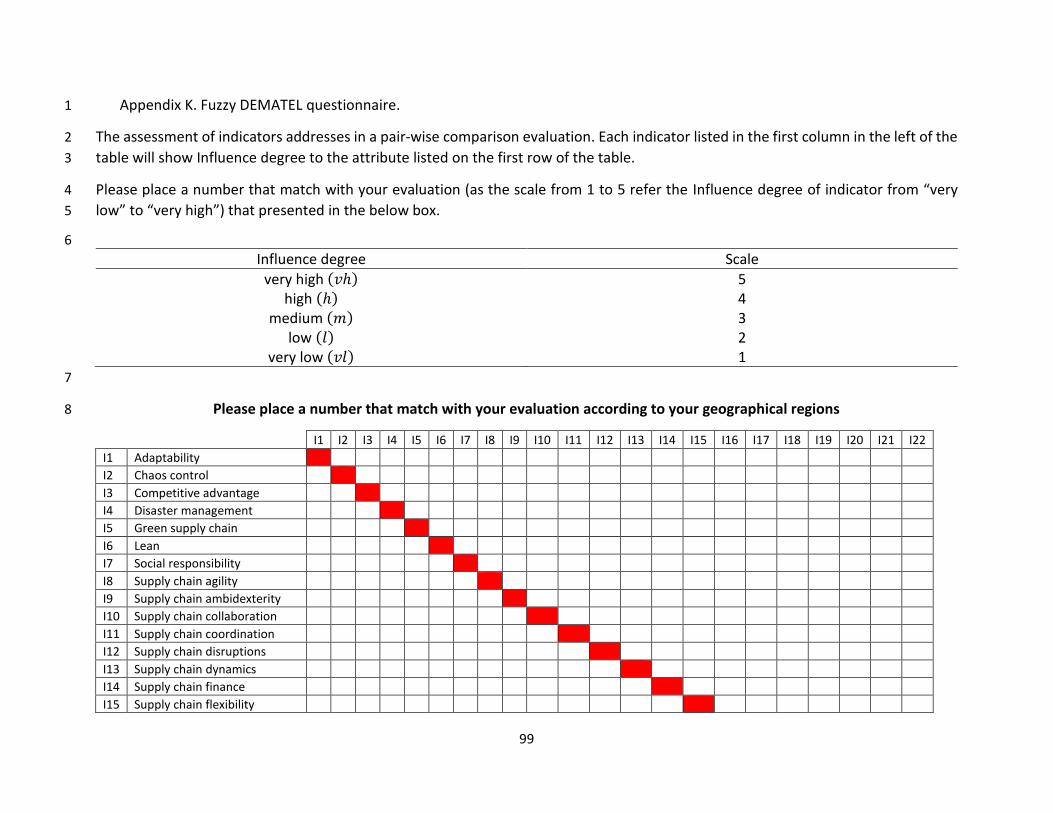
99
Appendix K. Fuzzy DEMATEL questionnaire. 1
The assessment of indicators addresses in a pair-wise comparison evaluation. Each indicator listed in the first column in the left of the 2
table will show Influence degree to the attribute listed on the first row of the table. 3
Please place a number that match with your evaluation (as the scale from 1 to 5 refer the Influence degree of indicator from “very 4
low” to “very high”) that presented in the below box. 5
6
Influence degree Scale
very high (𝑣ℎ) 5 high (ℎ) 4
medium (𝑚) 3 low (𝑙) 2
very low (𝑣𝑙) 1 7
Please place a number that match with your evaluation according to your geographical regions 8
I1 I2 I3 I4 I5 I6 I7 I8 I9 I10 I11 I12 I13 I14 I15 I16 I17 I18 I19 I20 I21 I22
I1 Adaptability
I2 Chaos control
I3 Competitive advantage
I4 Disaster management
I5 Green supply chain
I6 Lean
I7 Social responsibility
I8 Supply chain agility
I9 Supply chain ambidexterity
I10 Supply chain collaboration
I11 Supply chain coordination
I12 Supply chain disruptions
I13 Supply chain dynamics
I14 Supply chain finance
I15 Supply chain flexibility

100
I16 Supply chain integration
I17 Supply chain network design
I18 Supply chain resilience
I19 Supply chain risk management
I20 Supply chain vulnerability
I21 Sustainability
I22 Uncertainty
9
10


