Embed Size (px)
Citation preview
SUSTAINABLE TOURIST DEVELOPMENT IN ITALIAN HOLIDAY DESTINATIONS
M. Francesca Cracolicia,b,∗, Miranda Cuffaroa, Peter Nijkampb
a Facoltà di Economia, Dipartimento di Contabilità Nazionale e Analisi dei Processi Sociali Università degli Studi di Palermo, V.le delle Scienze Ed. 2, 90133 Palermo, Italy
bFaculty of Economics, Department of Spatial Economics, Free University Amsterdam, de Boelelaan 1105, 1081 HV Amsterdam, The Netherlands
Abstract This paper argues that tourism will become a major activity in a modern welfare state, which will have serious consequences for environmental sustainability. This issue calls for an assessment of the pros and cons of the ecological efficiency of tourism. We propose an overall efficiency indicator that comprises both a sustainable tourism index and an economic efficiency index. Based on a data set for Italian provinces and using Activity Analysis, a quantitative assessment of the relative position of Italian tourist destination areas is made from the perspective of sustainable tourism. Keywords: Activity Analysis, Data Envelopment Analysis, Sustainable Tourism Destination, Tourist Performance
Pn203fcfmnew
∗ Corresponding author , tel.: +39–091–6561516, fax: +39–091–6561501. E-mail: [email protected] and [email protected]
1
1. Introduction
In recent years the leisure industry, for its positive economic effects, has become a prominent economic sector resulting in increasing competition on tourism market. Such competition has to seek a balance between short-term revenues at the cost of long-term sustainable development and long-term balanced growth strategies seeking to reconcile local interests with tourism objectives. In practice, we observe that different tourist destinations try to exploit their indigenous potential. This requires a well tuned marketing strategy in order to get the ‘right tourist’ with the ‘right goals’ at the ‘right place’.
The aim of this paper is to propose a method to assess tourism sustainability using suitable measures of efficiency. At the moment there is no standard definition of sustainable tourist destination (STD) but, according to the Associazione Italiana Turismo Responsabile, we can refer to the generic concept of sustainable tourism (ST): every tourism activity that preserves for a long time the natural, cultural and social resources, contributing to the well-being of individuals living in those tourist areas. According to this point of view, the tourism sustainability, generally, is an aspiration or goal rather than a measurable objective (Middleton and Hawkins, 1998).
A recent study contains an operational concept of ST, by defining two systems – human and ecological – and several dimensions within these (economic and socio-cultural dimensions, environmental impacts; environmental policy and so on) and by choosing specific indicators in line with these dimensions to assess sustainability (see Ko, 2005).
Unfortunately, despite many methodological advances, several indicators defined in some conceptual models are generally unavailable, particularly at the local scale.
In this paper, using a simple theoretical background, we propose a suitable method to explore how well Italian provinces utilize their tourist resources. We consider here the destination like a company and evaluate its sustainability according to its economic and environmental performance. Specifically, we introduce the concept of the production process of a tourist destination (Cracolici and Nijkamp, 2006), and we refer to the eco-efficiency that emphasizes environmental, social and economic efficiency.
Generally, increasing eco-efficiency means reducing resources use per unit of product or service. Usually, this concept is used with reference to micro-level units (companies, public organizations etc.), but here we transfer it to the macro-level, applying it to Italian provinces. Using a new version of Activity Analysis (AA), we obtain – for each province – an eco-efficiency and an economic efficiency indicator (EE). The eco-efficiency indicator represents the ‘sustainable tourism efficiency’ (STE). The paper is organized as follows: Section 2 presents the model structure and the data base. In Section 3, the empirical findings are presented and discussed. Section 4 offers some concluding remarks.
2
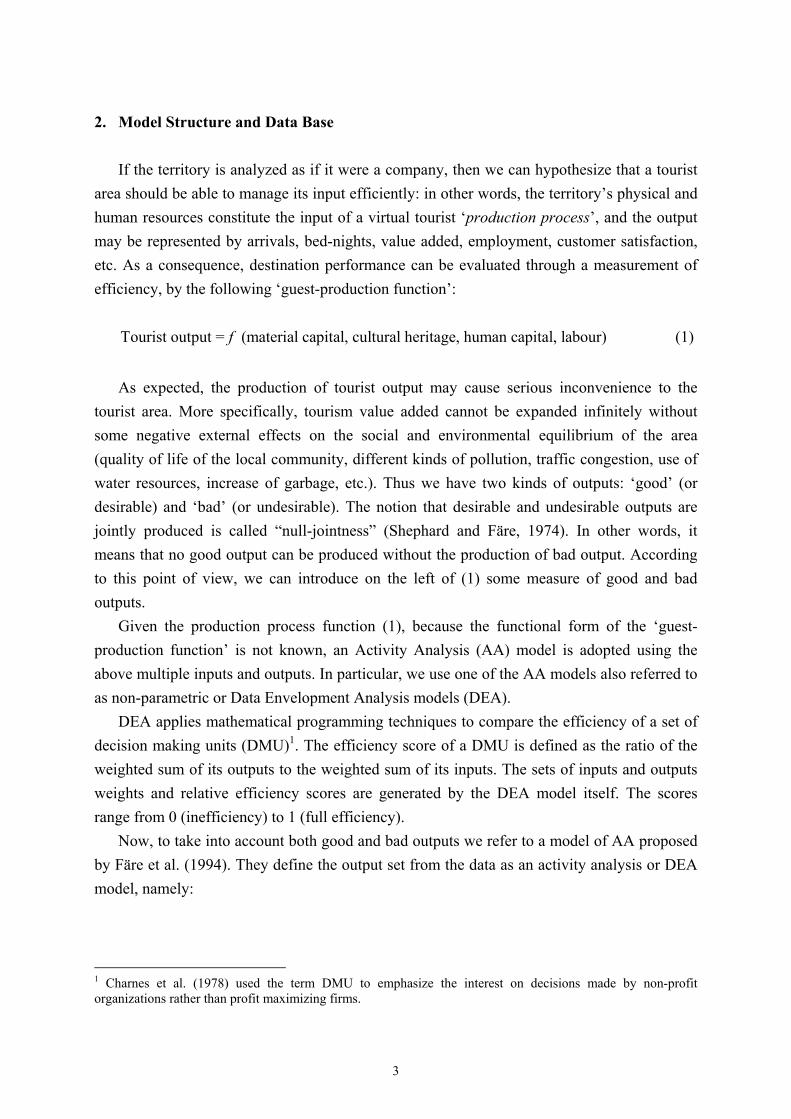
2. Model Structure and Data Base If the territory is analyzed as if it were a company, then we can hypothesize that a tourist
area should be able to manage its input efficiently: in other words, the territory’s physical and human resources constitute the input of a virtual tourist ‘production process’, and the output may be represented by arrivals, bed-nights, value added, employment, customer satisfaction, etc. As a consequence, destination performance can be evaluated through a measurement of efficiency, by the following ‘guest-production function’:
Tourist output = (material capital, cultural heritage, human capital, labour)f (1)
As expected, the production of tourist output may cause serious inconvenience to the
tourist area. More specifically, tourism value added cannot be expanded infinitely without some negative external effects on the social and environmental equilibrium of the area (quality of life of the local community, different kinds of pollution, traffic congestion, use of water resources, increase of garbage, etc.). Thus we have two kinds of outputs: ‘good’ (or desirable) and ‘bad’ (or undesirable). The notion that desirable and undesirable outputs are jointly produced is called “null-jointness” (Shephard and Färe, 1974). In other words, it means that no good output can be produced without the production of bad output. According to this point of view, we can introduce on the left of (1) some measure of good and bad outputs.
Given the production process function (1), because the functional form of the ‘guest-production function’ is not known, an Activity Analysis (AA) model is adopted using the above multiple inputs and outputs. In particular, we use one of the AA models also referred to as non-parametric or Data Envelopment Analysis models (DEA).
DEA applies mathematical programming techniques to compare the efficiency of a set of decision making units (DMU)1. The efficiency score of a DMU is defined as the ratio of the weighted sum of its outputs to the weighted sum of its inputs. The sets of inputs and outputs weights and relative efficiency scores are generated by the DEA model itself. The scores range from 0 (inefficiency) to 1 (full efficiency).
Now, to take into account both good and bad outputs we refer to a model of AA proposed by Färe et al. (1994). They define the output set from the data as an activity analysis or DEA model, namely:
1 Charnes et al. (1978) used the term DMU to emphasize the interest on decisions made by non-profit organizations rather than profit maximizing firms.
3
( ) ( , ): ; ;k km m k kn n k ki ik k k
P x y w z y y z x x z w w = ≥ ≤
∑ ∑ ∑ = (2)
with: k = 1…K observations (the Italian provinces in our analysis); m = 1…M good output; i = 1…I bad output; n = 1…N inputs and zk≥0, the intensity variables, which serve to form the frontier technology. We denote good outputs by y, bad outputs by w and inputs by x.
The model (2) satisfies the following conditions: (i) weak disposability of outputs – the reduction of bad outputs is feasible if good outputs are
also reduced, given fixed input levels; (ii) null-jointess – bad and good outputs are jointly produced; i.e., if no bad outputs are
produced, then there can be no production of good outputs (see Shepard and Färe, 1974); (iii) constant return to scale.
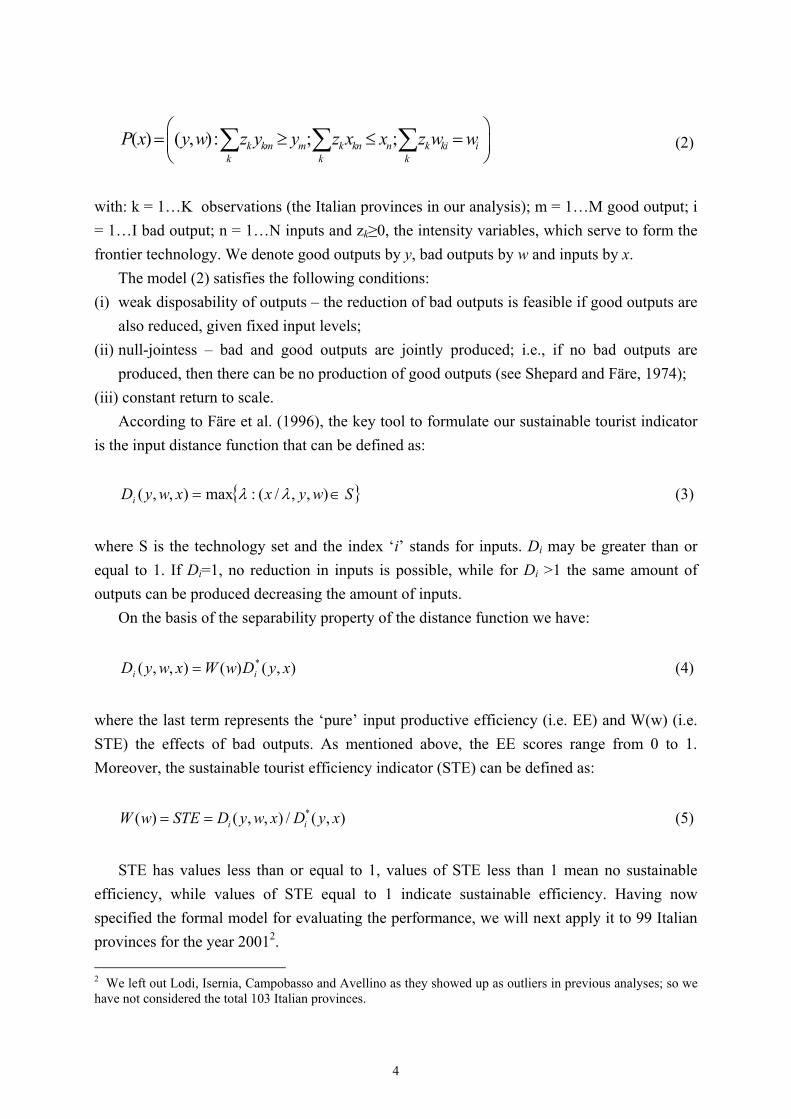
According to Färe et al. (1996), the key tool to formulate our sustainable tourist indicator is the input distance function that can be defined as:
{ }SwyxxwyDi ∈= ),,/(:max),,( λλ (3)
where S is the technology set and the index ‘i’ stands for inputs. Di may be greater than or equal to 1. If Di=1, no reduction in inputs is possible, while for Di >1 the same amount of outputs can be produced decreasing the amount of inputs.
On the basis of the separability property of the distance function we have:
),()(),,( * xyDwWxwyD ii = (4)
where the last term represents the ‘pure’ input productive efficiency (i.e. EE) and W(w) (i.e. STE) the effects of bad outputs. As mentioned above, the EE scores range from 0 to 1. Moreover, the sustainable tourist efficiency indicator (STE) can be defined as:
*( ) ( , , ) / ( , )i iW w STE D y w x D y x= = (5)
STE has values less than or equal to 1, values of STE less than 1 mean no sustainable
efficiency, while values of STE equal to 1 indicate sustainable efficiency. Having now specified the formal model for evaluating the performance, we will next apply it to 99 Italian provinces for the year 20012. 2 We left out Lodi, Isernia, Campobasso and Avellino as they showed up as outliers in previous analyses; so we have not considered the total 103 Italian provinces.
4
Unfortunately, it must be underlined that, with regard to bad outputs, the lack of information about the ‘pressure’ and the damage caused by tourism activity on the environment makes our analysis problematic. We avoid the obstacle by an indirect measure: very realistically, we know that the more tourists who stay in a city or in an area the greater is the exploitation of resources (water waste, direct destruction of flora or fauna, higher costs of disposing of waste). This obviously entails the problem of the ‘carrying capacity’ of tourist areas and related policy strategies. However, defining differentiated carrying capacities of tourist areas is a big problem and it is not the main object of our paper. Rather we need to measure the ‘effort’ sustained by the area and its infrastructures. The most common (and readily available) indicators of this effort are bed-nights per capita and the average stay. These variables constitute the proxies of ‘bad outputs’ whereas tourism value added per capita represents ‘good output’.
According to the destination concept (Davinson and Maitland, 1997; Buhalis, 2000) and the availability of data, the following proxies for material capital, cultural heritage, human capital and labour were chosen: number of beds in the hotels over population, number of beds in the complementary accommodation divided by population; the provincial state-owned artistic patrimony (number of museums, monuments and archaeological areas) divided by population; tourist school graduates divided by working age population; and the labour units (ULA) of the tourism sector divided by the total regional ULA.
Data on outputs has been obtained from ISTAT Tourist Statistics while the data on inputs has been obtained from different sources: number of beds in the hotels and complementary accommodation from ISTAT Tourist Statistics; provincial State-owned artistic heritage from the Ministry of Cultural Heritage; tourist school graduates from the Ministry of Education; and labour units (ULA) of the tourism sector from ISTAT. 3. Empirical Results
The above data base was used to estimate our DEA model. The results obtained by model
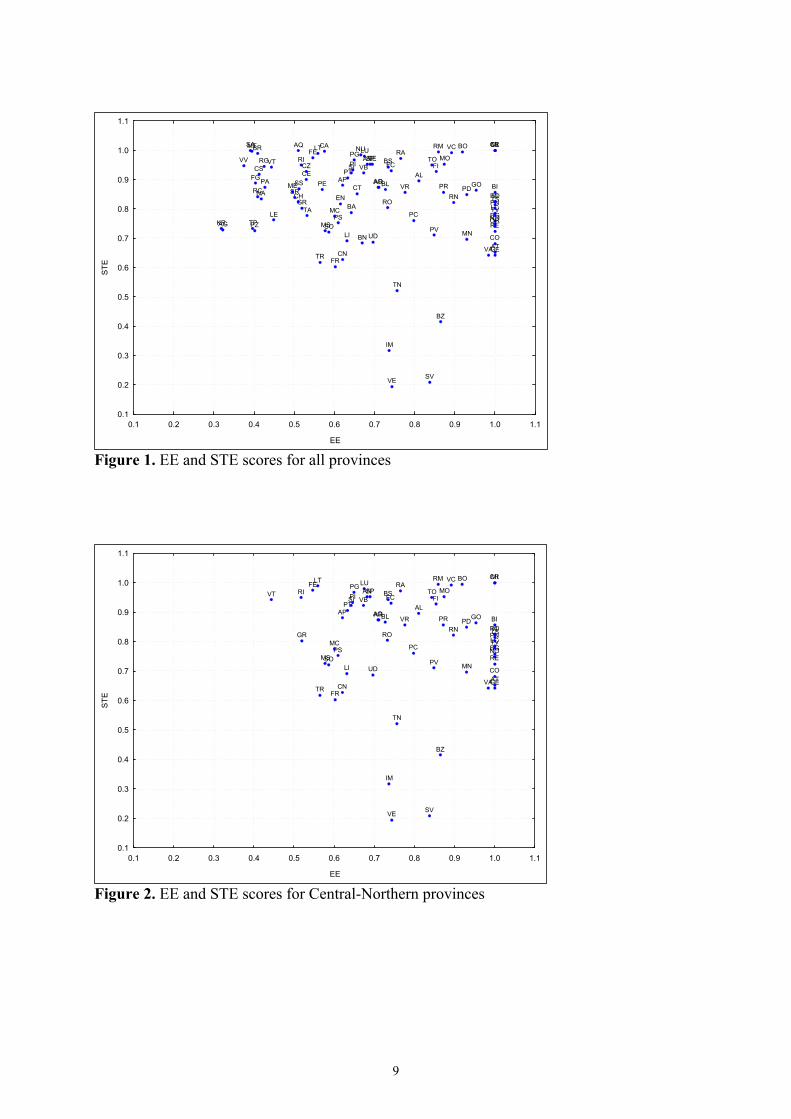
(2) are synthesized in Figure 1; where X- and Y-axis represent EE and STE scores, respectively.
All the provinces lie within an EE score range from 0.32 (i.e., Crotone (KR)) to 1 (e.g., Como (CO), Lecco (LC), etc.) and a STE score range between 0.19 (Venice (VE), for example) and 1 (e.g., Milan (MI), Caltanisetta (CL), etc.); the majority of provinces are concentrated in the second quadrant with high STE and low EE scores. As Figure 1 shows, only three destinations (Milan (MI), Cremona (CR) and Caltanisetta (CL)) reach full efficiency; i.e., they are able to produce high tourist flows (bed nights in our analysis) with a low effect on the environment in a broader sense.
5
<< Insert Figures 1 about here >>
Moreover, destinations with EE scores equal to 1 (e.g., Trieste, Como, Genova, etc.) show a narrow variability range of STE score, in contrast to destinations with STE scores equal to 1 which present a wider variability range of EE score.
The scatterplott graph of the STE and EE score allows subdividing the provinces into three clusters: the first at the top-right position, with high EE and STE; the second at the top-left position, with a very low EE, but high STE; the third at the bottom-right position, with high EE and low STE. In the first group we find the best practices characterized by many typically tourist destinations (Rome, Florence, Rimini, Ravenna, Verona, etc.): they reached a good economic performance, by preserving contemporaneously social and environmental aspects.
The second cluster contains both coastal and historical-cultural destinations (Naples, Salerno, Messina, Lecce, Agrigento, etc.) with very low economic performance, but good environmental efficiency.
Finally, the third group is composed of economically efficient provinces with serious problems in controlling the negative effects on the environment. It is not surprising to find among these, provinces like Venice, Bolzano, Trento. Venice for example, is one of the most attractive Italian provinces, with an high popularity and a positive image in the national and international mind, while Bolzano (BZ) and Trento (TN) are famous Italian mountain sites characterized by a large number of tourists not only from Italy but also from Germany and Austria because two languages (Italian and German) are spoken in these sites.
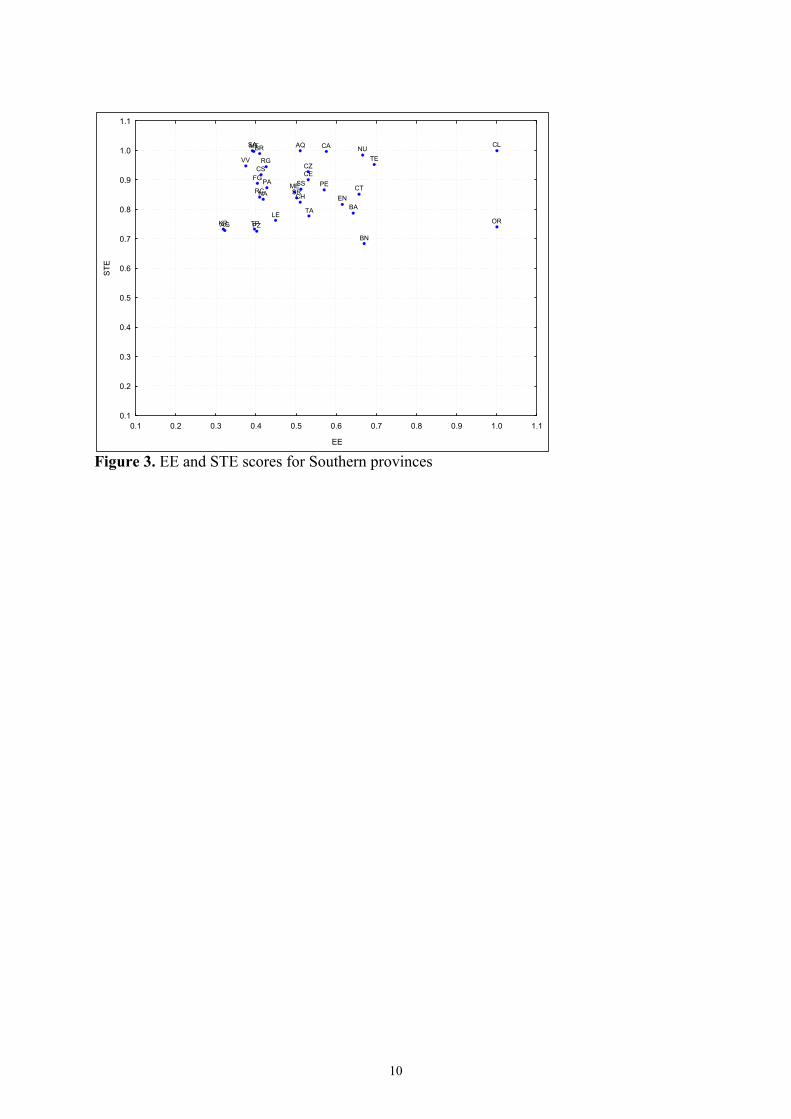
In order to offer a comparison between Central-Northern and Southern provinces, we grouped the scores into two figures (see Figures 2-3). The analysis of scores with respect to the mean value of EE and STE, shows that most Southern provinces have EE scores below the mean (0.70), but quite high STE scores (i.e. over the mean of 0.82), meanwhile most Central-Northern provinces are economically and environmentally efficient (i.e. with scores over the mean value).
<< Insert Figures 2 and 3 about here >>
In brief, the empirical findings show a balance between economic and sustainable efficiency; i.e., the majority of Italian provinces achieve good economic efficiency and good performance in terms of protection of the environment. In contrast to this general behaviour of Italian provinces, destinations with a prevalent tourist function show performance gaps between STE and EE. This is the case of Venice (VE), Savona (SV), Imperia (IM), Trento (TN) and Bolzano (BZ) which are artistic, coastal and mountain destinations, respectively.
6
They are characterized by EE scores over the average value (0.70) and STE scores lower than the mean value (0.82).
4. Conclusions
The aim of the paper has been to evaluate the tourist sustainability of 99 Italian provinces
using the tools of Activity Analysis. The novel aspect of this paper is the application of the above methodology – usually applied to micro units (i.e., manufacturing or service firms) – to macro units (regions, cities, etc.).
We proposed a measure of sustainable tourism in terms of efficiency considering the economic and environmental dimensions of the ‘production process’ of tourist destinations (i.e., Italian provinces in our application). Viewing a tourist site as a company, we assessed its sustainability by a tourist ‘production function’. In particular, Activity Analysis allowed us to obtain two indicators: eco-efficiency and economic efficiency. Clearly, the former is more interesting because it may represent a tourist sustainability indicator.
The results obtained may be helpful for policy-making purposes. In fact, the results highlight that the majority of provinces are characterized by high STE and low EE scores. Obviously, from the policy-makers’ view it would be desirable that tourist destinations achieve a good economic performance (high EE score). In fact, provinces with high STE and EE scores are an expression of a ‘good quality’ of tourism; i.e., a development of tourism that has an increasing positive economic effect on the territory (increasing employement, high value added, etc.), but not in conflict with the preservation of the environment in a broader sense (well-being of resident, water waste, etc.).
This goal imposes on destination management organizations the hard task of managing tourist resources by cutting down the negative social and environmental effects. Although many factors influence the ‘production’ of sustainable tourism, we have stressed some relevant dimensions of sustainable tourism. The analysis could be further improved if better and more accurate data were available.
Finally, though our main goal in this paper was to develop a measure of sustainable tourism, it could be useful to undertake a comparison across many other regions with sustainability studies based on proper and simple indicators.
7
References Buhalis, D. (2000), “Marketing the Competitive Destination of the Future”, Tourism Management, Vol. 21 No 1,
97–116. Charnes, A., Cooper, W.W. and Rhodes, E. (1978) “Measuring the Efficiency of Decision Making Units”,
European Journal of Operational Research, Vol. 2 No 6, pp. 429–44. Cracolici, M. F. and Nijkamp, P. (2006), “Competition among Tourist Destination. An Application of Data
Envelopment Analysis to Italian Provinces”, Tourism and Regional Development: New Pathways (M. Giaoutzi and P. Nijkamp, eds.), Ashgate, Aldershot, UK, forthcoming.
Davinson, R. and Maitland, R. (1997), Tourism Destination, Hodder & Stoughton, London. Färe, R., Grosskopf, S. and Roos, P. (1994), “Productivity and Quality Changes in Swedish Pharmacies”,
Discussion Paper, Southern Illinois University, Carbondale. IL. Färe, R., Grosskopf, S. and Tyteca, D. (1996), “An Activity Analysis Model of the Environmental Performance
of Firms-Application to Fossil-Fuel-Fired Electric Utilities”, Ecological Economics, Vol. 18, pp. 161-75. Ko, T. G. (2005), “Development of a Tourism Sustainability Assessment Procedure: a Conceptual Approach”,
Tourism Management, Vol. 26, pp. 431-45. Middleton, V. and Hawkins, R. (1998), Sustainable Tourism, Butterworth-Heinemann, Oxford. Shephard, R. and Fare, R. (1974), “The Law of Diminishing Returns”, Zeitschrift fur Nationalokonomie, Vol. 34,
pp. 69-90.
8
TO
VC
BI
VB
NO
CNAT
ALAO
VA
CO
LC
SO
MI
BG
BS
PV
CR
MN
BZ
TN
VRVI
BL
TV
VE
PD
RO PN
UD
GO
TS
IM
SV
GE
SP
PC
PR
RE
MO
BOFE RA
FC
RN
MS
LU
PTFI
PO
LI
PI
AR
SI
GR
PG
TR
PS
AN
MC
AP
VT RI
RMLT
FR
AQ
TE
PE
CH
CE
BN
NA
SA
FG
BATA
BR
LEPZ
MT
CS
KR
CZVV
RC
TP
PA ME
AG
CL
ENCT
RG
SRSS
NU
OR
CA
0.1 0.2 0.3 0.4 0.5 0.6 0.7 0.8 0.9 1.0 1.1
EE
0.1
0.2
0.3
0.4
0.5
0.6
0.7
0.8
0.9
1.0
1.1
STE
Figure 1. EE and STE scores for all provinces
Figure 2. EE and STE scores for Central-Northern provinces
TO
VC
BI
VB
NO
CNAT
ALAO
VA
CO
LC
SO
MI
BG
BS
PV
CR
MN
BZ
TN
VRVI
BL
TV
VE
PD
RO PN
UD
GO
TS
IM
SV
GE
SP
PC
PR
RE
MO
BOFE RA
FC
RN
MS
LU
PTFI
PO
LI
PI
AR
SI
GR
PG
TR
PS
AN
MC
AP
VT RI
RMLT
FR
0.1 0.2 0.3 0.4 0.5 0.6 0.7 0.8 0.9 1.0 1.1
EE
0.1
0.2
0.3
0.4
0.5
0.6
0.7
0.8
0.9
1.0
1.1
STE
9
10
Figure 3. EE and STE scores for Southern provinces
AQ
TE
PE
CH
CE
BN
NA
SA
FG
BATA
BR
LEPZ
MT
CS
KR
CZVV
RC
TP
PA ME
AG
CL
ENCT
RG
SRSS
NU
OR
CA
0.1 0.2 0.3 0.4 0.5 0.6 0.7 0.8 0.9 1.0 1.1
EE
0.1
0.2
0.3
0.4
0.5
0.6
0.7
0.8
0.9
1.0
1.1
STE