Embed Size (px)
Citation preview
NUTRIENT COMPOSITION AND CONSUMER ACCEPTABILITY OF SOYBEAN-
SWEET POTATO BASED COMPLEMENTARY FOOD FORTIFIED WITH
LONGHORN GRASSHOPPER (Ruspolia differens)
MMARI, MERCY WILFRED
AG322-3902/2015
A Thesis submitted in Partial Fulfilment of the requirements for the award of Degree of
Master of Science in Food Science and Nutrition
2017
i
DECLARATION
I hereby declare that this thesis is my original work and that it has not been presented to any
other university or institution for the award of a degree.
Mercy Wilfred Mmari
AG322-3902/2015
Sign…………………………………….Date…......................
This thesis has been submitted for examination with our approval as University supervisors:
SUPERVISORS
1. Dr. John. N. Kinyuru
Department of Food Science and Technology
Jomo Kenyatta University of Agriculture and Technology
Signature ……………………………. Date……………………………
2. Dr. Judith Okoth
Department of Food Science and Technology
Jomo Kenyatta University of Agriculture and Technology
Signature ……………………………. Date……………………………
3. Prof. Henry Laswai, PhD
Sokoine University of Agriculture (SUA)
Department of Food Science, Nutrition & Consumer Science
Signature ……………………………. Date……………………………

ii
DEDICATION
To my adored parents Agnes and Wilfred Mmari and my beloved brothers Matayo and Martin.
Thanks for your love and Support.
God bless you to excel higher!

iii
ACKNOWLEDGEMENT
My deepest thanks should goes to my almighty God who gave me life and grace to be what I am
today. Glory to his holy name.
Special gratitude and appreciation goes to my supervisors, Dr. John. N. Kinyuru, Dr. Judith
Okoth and Prof, H.S Laswai who believed in me and not only spent their valuable time,
tirelessly and wisely guiding and advising during research and writing but also became an
encouraging family to me; God will reward your good work.
Technicians Mr S. Mwanyika and Malogo (Food Sc. Lab), Mr Mohammed (Soil Sc. Lab), Mr
David (JKUAT Food Sc. Lab) and Dr Mongi (sensory and consumer science expert) I owe you
gratitude for guiding me through that long laboratory work and data analysis. I extend my
special thanks to the Department of Food Science, Nutrition and Consumer Science at Sokoine
University of Agriculture, Tanzania for allowing me to use their facility.
I humbly appreciate the funding support of iAGRI through RUFORUM for funding my two
years MSc studies. Deserving no less gratitude are the panelists who gave much of their time
and support.
Special thanks to my special friend Julius Joram, my dearest friends Dr. Joeline Ezekiel, Mary
Marcel, Ezekiel Temitope, Dr. Iraseny Swai and Angela Aluko with them tough times became
bearable. My lovely parents, the rest of the family and relatives; your encouragement and
prayers during the whole time of this study are unpayable.
Special thanks to Bukoba natives including Mr Karugaba Desdery and Mr Perfect Zangina,
Mafiga and Sabasaba clinic officers. I appreciate all those who helped me in one way or another
throughout the period of my study will never fail to remember them.
iv
TABLE OF CONTENTS
TABLE OF CONTENTS ............................................................................................................ iv
LIST OF TABLES ....................................................................................................................... vi
LIST OF FIGURES ................................................................................................................... vii
ACRONYMS ............................................................................................................................ viii
CHAPTER FOUR ........................................................................................................................ 41
4. RESULTS AND DISCUSSION ........................................................................................... 41
4.1 Survey on indigenous technologies, processing methods and traditions towards senene
consumption .............................................................................................................................. 41
4.1.1 Social-economic information of the respondents ......................................................... 41
4.1.2 Varieties and seasonality .............................................................................................. 42
4.1.3 Origin and availability ................................................................................................. 44
4.1.4 Traditions, consumer perception, custom and taboos .................................................. 44
4.1.5 Collection and harvesting ............................................................................................. 46
4.1.6 Processing methods ...................................................................................................... 48
4.1.7 Boiling .......................................................................................................................... 49
4.1.8 Preservation and shelf-life ........................................................................................... 52
4.1.9 Potential of senene in addressing child malnutrition ................................................... 53
4.1.10 Senene trade ............................................................................................................... 55
4.3 Proximate Composition ...................................................................................................... 58
4.4 Vitamins and Minerals Analysis ......................................................................................... 60
4.4.1 Vitamin A content ........................................................................................................ 60
4.4.2 Calcium, iron and zinc contents ................................................................................... 61
4.5 Microbial Counts ................................................................................................................ 62
4.6 Consumer Acceptability Results ......................................................................................... 65
4.6.1 Sensory evaluation for complementary flours ............................................................. 65
4.6.2 Sensory evaluation for porridges from formulated complementary flours .................. 67
4.6.3 Quantitative descriptive analysis of complementary flours ......................................... 68
4.6.4 Quantitative descriptive analysis of porridges made from complementary flours ...... 69
Preference Mapping .............................................................................................................. 70
4.6.5 Principal component analysis ....................................................................................... 70
4.6.6 Relationship between sensory data and consumer data by PLSR for students ............ 72
v
4.7 Shelf Life Stability Studies on Formulated Composite Flours ........................................... 74
4.7.1 Free fatty acids (FFA) .................................................................................................. 74
4.7.2 Peroxide value (PV) ..................................................................................................... 75
4.7.3 Moisture contents ......................................................................................................... 75
4.7.4 Sensory evaluation results of formulated flours stored at room conditions for six
months ................................................................................................................................... 76
4.7.5 Sensory evaluation results of porridges from formulated flours during storage .......... 79
5. CONCLUSION AND RECOMMENDATION ....................................................................... 81
5.1 Conclusion .......................................................................................................................... 81
5.2 Recommendation ................................................................................................................ 82
REFERENCES ........................................................................... Error! Bookmark not defined.
APPENDICES .............................................................................................................................. 97
vi
LIST OF TABLES
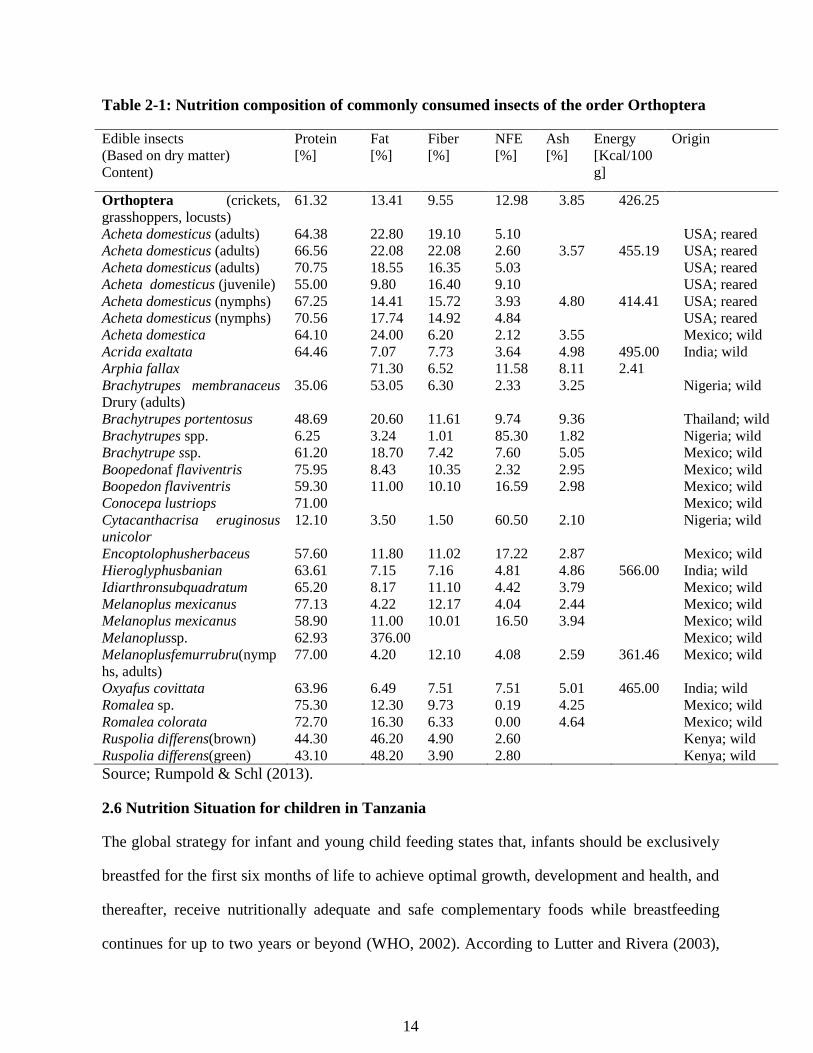
Table 2-1: Nutrition composition of commonly consumed insects of the order Orthoptera ....... 14
Table 3-1: Attributes, definition, references and anchors developed in quantitative descriptive
analysis panel training .................................................................................................................. 33
Table 3-2: Complementary flour formulation ratios……………………………………………34
Table 4-1: Responses on Feeding Children with Senene ............................................................ 54
Table 4-2 Phytic acid content of soybeans and formulated flour in mg/100g in DMB ............... 56
Table 4-3: Proximate composition (g/100) of senene and flour samples ..................................... 58
Table 4-4: Protein, fat, carbohydrate and Energy analysis of formulation ratios ........................ 59
Table 4-5: Vitamin A contents of senene and formulated flours ................................................. 60
Table 4-6: Mineral contents of flours and senene samples .......................................................... 61
Table 4-7: Microbial counts of Senene and flours ....................................................................... 62
Table 4-8 Effect of time (months) on sensory attributes .............................................................. 80
vii
LIST OF FIGURES
Figure 3- 1: Methodology overview ............................................................................................. 25
Figure 3- 2: Soybean germination using baskets, muslin cloth and black-dark cloth .................. 29
Figure 3- 3: Flow diagrams for senene, soybean, sweet potato and composite flour preparation29
Figure 3- 4: Formulated flours, market flour and porridges from the formulated flours ............. 31
Figure 4- 1: Senene varieties found in Kagera as identified by Haya ethnic group…..……….42
Figure 4- 2: Senene harvesting using traditionally made trap ..................................................... 46
Figure 4- 3: Senene harvesting trap during the night ................................................................... 47
Figure 4- 4: Town senene market and Cleaned senene ready for sale ......................................... 48
Figure 4- 5: Fresh senene processing with boiling stage flow diagram ....................................... 49
Figure 4- 6: Fresh raw senene processing flow diagram .............................................................. 51
Figure 4- 7: Processed senene and processing equipment ........................................................... 52
Figure 4- 8: Response on consumer preferences on named senene processing method .............. 52
Figure 4- 9: Response on consumer preferences on named senene preservation methods .......... 53
Figure 4- 10: Senene trade at Bukoba town senene market ......................................................... 56
Figure 4- 11: Microbial results 1000× magnified pictures .......................................................... 65
Figure 4- 12: Mean hedonic scores for flour samples by students ............................................... 66
Figure 4- 13: Mean hedonic scores for flour samples evaluated by mothers at Mafiga and
Sabasaba health centres. ............................................................................................ 67
Figure 4- 14: Mean overall acceptability values of porridge samples by consumers. ............... 680
Figure 4- 15: Mean intensity ratings of descriptive attributes of flour samples………………...71
Figure 4- 16: Spiderplot showing mean intensity values of sensory attributes…………………72
Figure 4- 17: Bi-plot from PCA of descriptive sensory data for flour samples………………...70
Figure 4- 18: Bi-plot from PCA of descriptive sensory data for porridge samples……………..70
Figure 4- 19: Correlation loadings from a partial least squares regression of flour samples for
descriptive data and hedonic rating by students ......................................................... 72
Figure 4- 20: Correlation loadings from partial least squares regression of flour samples with
descriptive data and hedonic rating by mothers. ........................................................ 73
Figure 4-21: Changes of FFA values of composite flour stored at room conditions for six
months ........................................................................................................................ 74
Figure 4-22: Changes of PV of composite flour stored at room conditions for six months ........ 75
Figure 4- 23: Changes of Moisture contents of composite flour stored at room conditions ........ 76
Figure 4- 24: Changes of colour liking of flour samples with storage time ................................. 77
Figure 4- 25: Changes of appearance liking of flour samples with storage time ........................ 77
Figure 4- 26: Changes of smell liking of flour samples with storage time .................................. 78
Figure 4- 27: Changes of texture liking of flour samples with storage time ................................ 78
Figure 4- 28: Changes of acceptability of flour samples with storage time ................................. 79
viii
ACRONYMS
CFU Colony Forming Units
FAO Food and Agricultural Organization
HPLC High Performance Liquid Chromatogram
JKUAT Jomo Kenyatta University of Agriculture and Technology
TPC Total plate count
GAM Global Acute Malnutrition
ICIPE International Centre of Insect Physiology and Ecology
OFSP Orange Fleshed Sweet Potatoes
SPSS Statistical Package for Social Sciences
RDA Recommended Daily Allowance
PER Protein Efficiency Ratio
SFA Saturated Fatty Acid
TFNC Tanzania Food and Nutrition Centre
THDS
PCA
Tanzania Health and Demographic Survey
Principle Component Analysis
ix
ABSTRACT
Traditional complementary foods in most sub-Saharan African countries are deficient in protein,
essential minerals and vitamins resulting to sub-optimal growth and increased premature deaths
among children below five years of age. This calls for action to develop home based enrichment
of traditional complementary foods through advances in available low cost animal protein like
edible insects. Longhorn grasshopper (Ruspolia differens) commonly known as senene in
Tanzania is among most consumed edible insects by societies around Lake Victoria crescent.
This study was was aimed at developing a nutritious, shelf stable and acceptable complementary
food from soybean, sweet potatoes and longhorn grasshoppers. Ethnography study was
conducted to understand indigenous technologies on processing methods, preservation, shelf-
life, nutritional knowledge and traditions towards senene consumption among the Haya tribe in
Kagera region of Tanzania. Senene-based complementary flour product was formulated from
germinated, dried, roasted soybeans flour mixed with toasted senene and sweet potatoes flour at
different ratios. The formulations were: CF1 (25% senene: 35% soybeans: 40% sweet potato),
CF2 (20% senene: 40% soybeans: 40% sweet potato) and CF3 (15% senene: 35% soybeans:
50% sweet potato). Proximate composition, minerals (calcium, iron and zinc), vitamin A, phytic
acid analyses and microbial analysis were done using standard methods. Consumer acceptability
and shelf life studies were also carried out on formulated flours. Data analysis was done using
SPSS for interviews and R for chemical, microbial and sensory data. The origin of senene
remained an unsolved puzzle among most of respondents. Five varieties of senene were
identified with harvesting for household consumption being done through wild collection.
Traditionally made traps were used for commercial harvesting. Deep frying was the most
preferred processing method while smoking was the most preferred preservation method, with
shelf-life of up to 12 months. Traditions and taboos associated with senene consumption were
identified, most of which favoured men while leaving out women and children. Chemical
analysis showed significant 24 fold reduction of phytic acid after 72 h germination of soybeans
x
(p<0.05). All three formulations had nutrients and energy levels superior to commonly used
flour from the market and contained ideal composition, meeting Codex standards and above
WHO recommendations for complementary foods (p<0.05). Toasted senene had the highest
retinol content of 390 µg /100g while fresh sweet potatoes had the highest βcarotene content of
182 RAE (p<0.05). Microbial counts were significantly higher for fresh senene with 6.5log
cfu/g. Processed senene and flour samples were free from E. coli and Salmonella spp
contamination as required by Codex and EAS standards. CF1 was most liked flour with
significantly highest score of 4.4 out of 5 on hedonic scale. Formulated products did not pose
strange sensory attributes (p<0.05). Quantitative descriptive analysis (QDA) showed that CF1
had higher intensity scores in aroma, colour and hands feel while CF3 in whiteness and
appearance. Principle Component Analysis (PCA) showed variation between products to be
mainly explained by aroma, hand feel and colour on one side and attributes appearance and
whiteness on the other side along PC1. Partial Least Square Regression showed that both
mothers and students preferred CF1 for its colour, hands feel and aroma also CF2 and CF3 for
their whiteness and appearance. All flours were shelf stable for five months. Indigenous
technologies for harvesting, processing and preserving senene exist and maybe improved to fit
current food processing standards hence promote commercialization of the edible insect for
food and nutrition security. Exploitation of senene as a source of nutrients for complementary
food formulation will be useful for the resource poor farmers.
Keywords; Senene, QDA, Edible insects, Tanzania, Food, Technology, Nutrients, Culture
1
CHAPTER ONE
1. INTRODUCTION
1.1 Background Information
Access to appropriate quality and quantity of foods are essential components of optimal
nutrition for infants and young children (Dewey, 2013). In Tanzania, stunting is reported to
affect 34% of children under five years of age, with 11.5 % severely stunted (TFNC, 2014;
THDS 2016). This is high rate according to WHO classification of stunting rates
(WHO/UNICEF, 2006). According to UNICEF (2009), Tanzania ranks third last on stunting in
sub-Saharan Africa, after Ethiopia and the Democratic Republic of Congo in which about one
third of children aged 6-59 months are iron deficient, 58 percent are anemic and 24% are
vitamin A deficient (THDS, 2016; UNICEF, 2009).
As it is with most Sub-Saharan African countries, complementary foods in Tanzania are grain-
based, of low nutritional quality and given in insufficient amounts (Anigo et al., 2010). This
contributes to premature deaths among children as reported by Twaweza (2010), that 43,000
children aged below 5 years died in 2010 due to malnutrition. Commercial complementary
foods are normally very expensive and not easily accessible in rural settings (Muhimbula and
Issa-zacharia, 2010). Widely distributed and accessible are complementary porridge flours,
which are normally made up of mixed grains like maize, sorghum, millet and wheat. Some are
enriched with soybean flour and groundnuts. Improving availability of adequate complementary
foods include the use of simple technologies that can be applied at home or community level;
like specific enrichment of home-prepared complementary foods with traditional nutrient dense
foods (Kinyuru et al., 2012).
Insects have been eaten for centuries in many parts of the world, particularly in the tropics (Uis,
2003). Western world people tend to associate insects eating (entomophagy) with primitive
2
attitudes and poverty (Defoliart, 2000). In this way, insects’ benefits maybe forgotten thus
neglected in ongoing food security programmes (Arnold van Huis, 2013).
Recent studies on edible insects have reported adequate amounts of energy and protein in most
insects, meeting the amino acid requirements for humans (Rumpold & Schl, 2013). Edible
insects are also reported to be high in unsaturated fatty acids, and essential micronutrients (
Kinyuru et al., 2012; 2015). Furthermore, studies confirm that insects can be utilized in
processing of affordable and safe complementary foods with adequate nutrient density (Belluco
et al., 2013; Kelemu, Niassy, Torto, Fiaboe, Affognon, Tonnang, Maniania, & Ekesi, 2015;
Skau et al., 2015).
Longhorn grasshopper (Ruspolia differens) belongs to the order Orthoptera. It is an edible insect
along Lake Victoria region commonly known as senene in local Haya language. In northwest
Tanzania longhorn grasshoppers are mainly harvested during the rainy season. They are
customarily processed then stored to be used as a snack until the next season. The culture of
senene eating was indigenous to the Haya tribe found in Lake Victoria Zone of Tanzania, where
it stood as important delicacy. Reports show that 100g of senene flour is capable of providing
the Required Daily Allowance (RDA) for protein, zinc, vitamin A and iron to children under 5
years of age ( Kinyuru, 2009). This delicacy is also consumed in different regions of Tanzania
including Mwanza, Mbeya, Morogoro and Manyara. In these regions, these longhorn
grasshoppers have been consumed by all age groups as toasted or deep fried refreshing snack.
Soybean products have been proven to be good substitutes for animal products as they offer a
"complete" protein profile (Lokuruka, 2010), containing almost all the essential amino acids
(except methionine) and a range of water-soluble and fat soluble vitamins (Paul et al., 2008).
Reasonable amounts of soybeans are grown in different parts of Tanzania including Iringa,
3
Mbeya, Arusha, Kilimanjaro, Morogoro and Kagera. Dried soybeans have a stable shelf life of
months to years under normal food warehouse storage conditions.
Soybean flour is among the products increasingly consumed in Tanzania in complementary
feeding, and has been reported to be good source of protein, lipid and other essential nutrients
(Mosha et al., 2000). They have been processed into a flour at the household level. However,
the home flour is challenged with presence of antinutrients like phytates and beany flavour
resulting from poor processing conditions. Germination of soybean is reported to significantly
reduce levels of antinutrients in soybeans hence improve bioavailability of minerals (Vernaza et
al., 2012). Therefore, soybean will be germinated to enhance bioavailability of essential
nutrients.
Sweet potatoes are among commonly consumed weather independent tubers, which are grown
in almost all parts of Tanzania. They have been used in different African communities as part of
complementary foods for their fine sensory attributes (Amagloh, 2012). These tubers are also
high in carbohydrates, and contains reasonable amounts of beta carotene (Rose &
Vasanthakaalam, 2011).
Enriching complementary foods with the nutritious edible insects as longhorn grasshoppers is a
way towards reducing the problem of protein energy malnutrition and micronutrient deficiency
among the Tanzanian children below 5 years of age. This study will focus on development of
nutritious complementary food from longhorn grasshopper’s flour, sweet potatoes and soybeans.
1.2 Problem Statement
Poor quality of complementary foods is a long term problem in Tanzania. Most children are
born at recommended weight, however, evidence shows that growth starts to retard after the
introduction of complementary foods, during which protein, energy and micronutrient needs are
4
high (Mosha et al., 2000). THDS (2010) reports that 92% of the complementary foods used in
Tanzania are porridges made from single or mixed cereal grains. Children from low wealth
quintile households are the victims of these cereal porridges as most of these households cannot
afford animal protein (Muhimbula et al., 2011).
Protein-rich insects like senene have been consumed for centuries among Tanzanian societies,
as a customary and refreshing snack. However, there is underutilization of senene in Tanzania as
it has never been exploited in complementary feeding despite the reported high nutrient protein
concentration. Nutritional benefits of these insects have not been tapped to be of use in fighting
stunting and micronutrients deficiency. Therefore, there is an urgent need for tapping nutrients
from these insects by composting them with common cereal based foods to avail nutrient dense
complementary foods for a promising achievement towards reduction of stunting and
micronutrients deficiency in households.
1.3 Justification
Initially, senene used to be a traditional snack for Haya tribe where they mounted a sign of
respect. The tradition of entomophagy is now growing in Tanzania, with commercialization and
consumption of deep fried senene increasing countrywide. There are few studies on senene from
East Africa, mainly Uganda and Kenya, reporting data on trade and its nutritional potential
(Agea et al., 2008; Kinyuru et al., 2010). Few studies from Tanzania have reported on biology
and phenology of senene. Studies on nutritional potential in this area have not been explored
(Matojo and Hosea, 2013). Studies on culture, beliefs and indigenous technology associated
with R. differens are rare despite the rising acceptance and prominence of this delicacy. It is
important to understand indigenous technologies, culture and beliefs associated with
consumption of R. diffrens. This understanding is crucial for scaling up innovations as well as
designing adaptation for ongoing scientific findings on entomophagy. Researching on senene
5
will therefore provide information on nutritional potential of these insects to be used by the
public, nutritionists and commercial food product developers. The findings will also stimulate
value addition, research in entomophagy and commercialization of senene leading to increased
household income, hence livelihood improvement.
Use of senene in enriching plant source complementary foods carries the potential to introduce
an animal protein and essential minerals, which has potential to reduce protein energy
malnutrition (PEM) and essential micronutrients deficiency at household level. WHO
recommends complementary feeding with animal source foods to fight and avoid micronutrients
deficiency and stunting (WHO, 2002). However, animal based foods are not readily accessible
in many parts especially to low income households, which characterize many households in
developing countries.
Development of composite flour formulated from soybean, sweet potatoes and senene flour is
expected to provide these micronutrients to meet RDA for children. It is also projected to attract
commercialization and application of senene in production of nutritious and affordable insect-
based complementary foods. The output of this study will be useful in improving feeding
practices to nutrition officers in insect consuming societies like Kagera.
1.4 Objectives
1.4.1 General objective
To develop and evaluate the nutrient composition, shelf life stability and consumer acceptability
of composite flours from soybean and sweet potato flour enriched with senene.
1.4.2 Specific objectives
i. To map indigenous technologies, processing methods and traditions towards senene
consumption at Kagera region.
6
ii. To analyze the chemical and microbial contents of developed flours from senene, sweet
potato and soybean.
iii. To conduct chemical and microbiological analysis of selected common composite flour
from Morogoro market.
iv. To conduct acceptability and shelf life stability studies on developed composite flours
and resulting porridges.
1.5 Hypothesis
i. Soybean-sweet potato-based flour fortified with senene flour is less nutritious and not
microbiologically safer than commonly consumed composite flours for children and
infants in Morogoro.
ii. Soybean germination has no effect on phytates reduction and acceptability of soybean
flour.
iii. Soybean-sweet potato based flour enriched with senene is not shelf stable under normal
storage conditions.
7
CHAPTER TWO
2. LITERATURE REVIEW
2.1 Entomophagy Culture
Entomophagy is the culture of eating insects common among humans and some other species
including birds, reptiles and amphibians; Anthropo-entomophagy is the insect eating by humans
(Ramos-elorduy, 2009). According to FAO (2013), entomophagy is considered safe as there are
no reported cases of transmission of diseases or parasitoids to humans from consumption of
insects.
More than 1000 species of insects edible at different stage of their life cycle have been identified
worldwide (Rumpold & Schl, 2013). Some of the most popular insects eaten around the world
are found in Orders Orthoptera; Crickets, Grasshoppers, e.g., Ruspolia differens (Kinyuru et al.,
2009), Locust, e.g., migratory locust, (Locusta migratoria migratoriodes) (Moreki, 2014), Red
locust, (Nomadacris septemfasciata) (Okore, Avaoja, & Nwana, 2014); Hymenoptera, e.g.,
(Apis mellifera) (Kelemu et al., 2015); Isoptera, e.g., Macrotermes bellicosus (Raubenheimer &
Rothman, 2013); Lepidoptera e.g. the mopane worm-caterpillar (Gonimbrasia belina) (Skau et
al., 2015) and many others as shown in table 1. The culture of insect farming is not widely
practiced and most edible insects are harvested from the wild. Jomo Kenyatta University of
Agriculture and Technology is among institutions practicing commercial edible insect farming
while some research institutes like International Centre of Insect Physiology and Ecology
(ICIPE) do insect rearing in small scale for research purposes.
The main problem with anthro-entomophagy as a source of animal-based protein and energy is
the fact that there is a major attitudinal barrier to the use of insects as food in Western societies
(Defoliart, 1999). This barrier is primarily caused by cultural and attitudinal factors (Yen, 2009).
Looy and colleagues (2013) mention that a view of insects as dirty, disgusting and dangerous is
8
deeply embedded in the Western psyche as insects are still viewed as pests by majority of
people, despite the increasing literature pointing to their valuable role in the diets (Huis et al.,
2013). However, anthropo-entomophagy is still largely practiced in some of the developed
countries like Japan where the most popular edible insect is a
grasshopper, Oxyayezoensis japonica (Lensvelt & Steenbekkers, 2015). Some cultures believe
in medicinal use of insects by humans, a fact partly supported by several studies (Chakravorty
et al., 2011; Benno Meyer-rochow and Jharna Chakravorty, 2013; Dzerefos et al., 2013; Ayieko
& Oriaro, 2008)
2.2 Economic Potential of Edible Insects
Insect commercialization has been going on for many years at different levels from local barter
trade to exports. Some insects like Mopane caterpillars are exported from Africa to Europe
(Chakravorty et al., 2011). It is reported by FAO (2004), that annually, Belgium imports 3
tonnes and France 5 tonnes of dried mopane caterpillar. Democratic Republic of Congo (DRC)
are the main exporters of mopane caterpillar (Tabuna et al., 2004). Insects’ commercialization in
most developing countries is locally practiced and the trade is growing following insects’ value
addition (Agea et al., 2008; Moreki, 2014). Consumers buy processed and unprocessed insects
at village markets, retail supermarkets and stations and from street vendors. Insects are also
consumed in restaurants, depending on the extent to which anthropo-entomophagy is recognized
in a given region (Caparros Megido et al., 2014). In southern Zimbabwe, mopane caterpillars are
sold at rural and urban markets (FAO, 2012). In Thailand, both fresh and cooked edible insects
are sold at local markets, wholesale supermarkets and minimarts; available either precooked or
uncooked in frozen packages in supermarkets (Hanboonsong et al., 2012). They are also
marketed in ready-to-eat and microwaveable packages (Belluco et al., 2013).
9
Active marketing of the fried grubs is reported to take place along major roads and markets in
Edo and Delta States of Nigeria (Okore et al., 2014). Siulapwa et al. (2014), reports caterpillars
as main economic activity to many Zambian traders who sustain their families including taking
their children to school from this source of income. In Uganda, grasshopper’s trade is dominated
by men and characterized by wholesalers who buy grasshoppers from collectors and in turn sell
to retailers, who subsequently sell to consumers along the roadside or highway vehicle-stopping
points in Kampala (Agea et al., 2008). In Tanzania, commercialization of senene is prominent in
Lake Victoria regions of Mwanza, Geita and Kagera, where fresh senene collectors sell to
retailers who eventually sell to producers who roast them and pack in small packages of 0.5 to
5kg. Roasted senene is traded in other regions across the country where it is found in different
stores, groceries and some supermarkets.
2.3 Consumption of Longhorn Grasshoppers (Senene)
Longhorn grasshopper (Ruspolia differens) belongs to the order Orthoptera and is common
edible insects along Lake Victoria regions and Zambia. They are referred to in different local
names within the societies where they are consumed. The common local names include
Senesene in Kenya (Kinyuru et al., 2009), Nsenene in Uganda, Senene in Tanzania (Bailey &
Mccrae, 1978) and Nshokonono in Zambia (Siulapwa et al., 2014). From northwest Tanzania,
they are mainly harvested during the rainy seasons. Some are eaten raw but the common
preparation method is deep frying and toasting (with or without wings) and stored for use as
snack until next season. The culture of eating senene was indigenous to the Haya tribe found in
Lake Zone of Tanzania where it mounted a symbol of respect to the person it is served to. This
culture has now spread throughout the country where senene is widely consumed by different
tribes and ethnic groups.
2.4 Nutrition Value of Edible Insects
10
2.4.1 Protein
Insects are reported to contain more protein, fats and carbohydrates than the equivalent of beef
or fish and higher value of energy than soybeans, maize, beef, fish, lentils and other beans
(Belluco et al., 2013). Protein from senene is animal protein with high bioavailability and good
ratios of amino acids compared to that of plant protein (Kinyuru et al., 2010). Crude protein
levels of different species of order Orthoptera are shown in Table 1. Crude protein level in
longhorn grasshopper is reported to be 44% (Kinyuru et al., 2009; Rumpold & Schl, 2013;
Siulapwa et al., 2014) with good ratios of essential amino acids; 4.98, 3.72, 3.16, 2.65, 1.98,
2.61 mg/100g of arginine, lysine, leucine, histidine, isoleucine and phenylalanine, respectively
(Siulapwa et al., 2014).
2.4.2 Lipids
Insects’ fat play an important role in the course of its evolution, where it can serve as a support,
reproduction, metamorphosis and other energy sources (Van Huis et al., 2015). Fat is very rich
in insects’ biomass which is accounted for about 26.77 % on average dried insect (Belluco et al.,
2013). Rumpold & Schl (2013), reports most insects to have higher levels of fat at pupa and
larvae stages. Insects such as R. phoenicis have fat contents of up to 66% at pupa stage.
Unsaturated fatty acids are abundant in insect fat; and the ratio of monounsaturated and
polyunsaturated fatty acids is close to the fatty acids ratio of human standards. In longhorn
grasshoppers crude fat content is reported to be about 48% (Kinyuru et al., 2010; Siulapwa et
al., 2014). Some studies report 67% fat with palmitoleic acid (28%), linoleic acid (46%) and
16% of αlinolenic acid (Arnold van Huis et al., 2013).
2.4.3 Vitamins and minerals
11
A United Nations FAO (2004) report stated that caterpillars of many species are rich in
potassium, calcium, magnesium, zinc and iron as well as B-vitamins. Nadeau et al. (2015)
reported that in some ethnic groups, insects provide 5 – 10 % of annual protein intake as well as
fats, calories, vitamins and minerals. Bukkens (2005), showed for a whole range of insects that
thiamine ranged from 0.1 mg to 4 mg per 100 g of dry matter. Riboflavin is reported to range
from 0.11 to 8.9 mg per 100g (Belluco et al., 2013; Kelemu et al., 2015; Kinyuru et al., 2009;
Rumpold & Schl, 2013). Low levels of retinol and β-carotene have been detected in most
insects, values ranging from 32 to 48 μg per 100 g and 6.8 to 8.2 μg per 100 g of dry matter for
retinol and β-carotene, respectively (Skau et al., 2015; Thein et al., 2012). The vitamin E
content is relatively high in ground and freeze-dried silkworm powder reported to be 9.65 mg
per 100 g. (Tong, Yiu and Liu, 2011). Kinyuru et al. (2010) reported high levels of vitamin A
(2.12 mg/g) and vitamin E (2.01 mg/g) in longhorn grasshopper from Siaya district in Kenya.
Water soluble vitamins were also found to be in satisfactory amounts of folate (0.99 mg/100g),
riboflavin (1.3 mg/100g), niacin (2.36 mg/10g) and vitamin C (0.44 mg/100g).
Longhorn grasshoppers are undeniably rich sources of such minerals as iron (16.6 mg/100g),
zinc (17.3 mg/100g), potassium (370 mg/100g), magnesium (33.9 mg/100g), phosphorus (140.9
mg/100g), sodium (358.7 mg/100g) and manganese (5.3 mg/100g), copper (0.6 mg/100g) as
reported by Kinyuru et al. (2009). Also 9mg/100g calcium and 0.5mg/100g lead has been
reported in dried senene (Siulapwa et al. 2014). Unlike plant mineral sources which have less
bioavailability of minerals as iron, zinc and phosphorus, due to presence of anti-nutrients,
minerals from insects are expected to be more bioavailable due to absence or low levels of such
anti-nutrients.
2.4.4 Crude fibre
12
Insects are reported to contain significant amounts of fibre as shown in Table 2-1. The most
common form of fibre in insects is chitin, an insoluble fibre derived from the exoskeleton.
(Muzzarelli et al., 2012), estimated the chitin content of fresh insect species raised commercially
as food for insectivores and found up to 49.8 mg per kg (fresh). Matojo & Njau (2010), reports
11.6 to 137.2 mg per kg (dry matter) of chitin, which is much like the polysaccharide cellulose
found in plants, largely believed to be indigestible by humans and associated with defense
against parasitic infections and some allergic conditions (Yen, 2009; Seyfarth at al., 2008).
Crude fibre in longhorn grasshopper is reported to range between 4.9 to 8.4% (Kinyuru et al.,
2009; Siulapwa et al., 2014).
2.5 Use of Insects in Complementary Feeding
It has been proposed that edible insects could make a significant contribution to global food
security in the future (Van Huis, 2013). Insects are thought to be more sustainable source of
protein compared to conventional livestock. Insects convert feed to edible food more efficiently
than chickens, pigs and cattle, while producing fewer greenhouse gas emissions and requiring
less land and water (Ramos-elorduy, 2009). To fight and avoid micronutrients deficiency and
stunting WHO recommends complementary feeding with animal source foods (WHO, 2002).
However, animal based foods are not readily accessible to low income households, which
characterize many households in developing countries. Insect-based foods are reported to be
shelf stable to more than 6 months of storage under normal room conditions (Bauserman et al.,
2015). Studies confirm storage stability with neither pathogenic microorganisms nor aflatoxins
(Lensvelt & Steenbekkers, 2015; Skau et al., 2015). Peroxide values of insect-based foods are
also reported to be below limits after 6 months of storage.
In a study conducted in DRC, complementary porridge made from caterpillars and other
available cereals’ flour was high in energy and all essential micronutrients. Moreover no adverse

13
reactions were reported among the children who consumed more than 75% of the served
porridge (Nadeau et al., 2014; Skau et al., 2014, 2015; Kinyuru et al., 2015)
14
Table 2-1: Nutrition composition of commonly consumed insects of the order Orthoptera
Edible insects
(Based on dry matter)
Content)
Protein
[%]
Fat
[%]
Fiber
[%]
NFE
[%]
Ash
[%]
Energy
[Kcal/100
g]
Origin
Orthoptera (crickets,
grasshoppers, locusts)
61.32 13.41 9.55 12.98 3.85 426.25
Acheta domesticus (adults) 64.38 22.80 19.10 5.10 USA; reared
Acheta domesticus (adults) 66.56 22.08 22.08 2.60 3.57 455.19 USA; reared
Acheta domesticus (adults) 70.75 18.55 16.35 5.03 USA; reared
Acheta domesticus (juvenile) 55.00 9.80 16.40 9.10 USA; reared
Acheta domesticus (nymphs) 67.25 14.41 15.72 3.93 4.80 414.41 USA; reared
Acheta domesticus (nymphs) 70.56 17.74 14.92 4.84 USA; reared
Acheta domestica 64.10 24.00 6.20 2.12 3.55 Mexico; wild
Acrida exaltata 64.46 7.07 7.73 3.64 4.98 495.00 India; wild
Arphia fallax 71.30 6.52 11.58 8.11 2.41
Brachytrupes membranaceus
Drury (adults)
35.06 53.05 6.30 2.33 3.25 Nigeria; wild
Brachytrupes portentosus 48.69 20.60 11.61 9.74 9.36 Thailand; wild
Brachytrupes spp. 6.25 3.24 1.01 85.30 1.82 Nigeria; wild
Brachytrupe ssp. 61.20 18.70 7.42 7.60 5.05 Mexico; wild
Boopedonaf flaviventris 75.95 8.43 10.35 2.32 2.95 Mexico; wild
Boopedon flaviventris 59.30 11.00 10.10 16.59 2.98 Mexico; wild
Conocepa lustriops 71.00 Mexico; wild
Cytacanthacrisa eruginosus
unicolor
12.10 3.50 1.50 60.50 2.10 Nigeria; wild
Encoptolophusherbaceus 57.60 11.80 11.02 17.22 2.87 Mexico; wild
Hieroglyphusbanian 63.61 7.15 7.16 4.81 4.86 566.00 India; wild
Idiarthronsubquadratum 65.20 8.17 11.10 4.42 3.79 Mexico; wild
Melanoplus mexicanus 77.13 4.22 12.17 4.04 2.44 Mexico; wild
Melanoplus mexicanus 58.90 11.00 10.01 16.50 3.94 Mexico; wild
Melanoplussp. 62.93 376.00 Mexico; wild
Melanoplusfemurrubru(nymp
hs, adults)
77.00 4.20 12.10 4.08 2.59 361.46 Mexico; wild
Oxyafus covittata 63.96 6.49 7.51 7.51 5.01 465.00 India; wild
Romalea sp. 75.30 12.30 9.73 0.19 4.25 Mexico; wild
Romalea colorata 72.70 16.30 6.33 0.00 4.64 Mexico; wild
Ruspolia differens(brown) 44.30 46.20 4.90 2.60 Kenya; wild
Ruspolia differens(green) 43.10 48.20 3.90 2.80 Kenya; wild
Source; Rumpold & Schl (2013).
2.6 Nutrition Situation for children in Tanzania
The global strategy for infant and young child feeding states that, infants should be exclusively
breastfed for the first six months of life to achieve optimal growth, development and health, and
thereafter, receive nutritionally adequate and safe complementary foods while breastfeeding
continues for up to two years or beyond (WHO, 2002). According to Lutter and Rivera (2003),
15
adoption of recommended breastfeeding and complementary feeding practices and access to the
appropriate quality and quantity of foods are essential components of optimal nutrition for
infants and young children.
In Tanzania, 59% of infants receive exclusive breastfeeding for six months, while 90% of 6-8
months and 97% of 9-11 months children receive timely complementary food. However, only
8% of these children receive the complementary food meeting the criteria for a minimum
acceptable diet (THDS, 2016). Chronic malnutrition (stunting) among children 0-59 months of
age is therefore reported to be 34% (THDS 2016;UNICEF 2009). This is a high rate according
to WHO classification. According to TFNC (2014), severe stunting affects 11.5 % of children
countrywide, this level of chronic malnutrition is considered “very high”. Dodoma, Ruvuma,
Rukwa, Kigoma, Katavi and Geita regions are reported to exceed the 40% threshold. Three
regions exceeding 50% threshold are Iringa (51.3%), Njombe (51.5%) and Kagera (51.9%). In
Zanzibar, stunting rates are ranging from 20.6% in Town West to 30.4% in Unguja North.
Global Acute Malnutrition (GAM) is reported to affect 3.8% of children aged 0 -59 months and
this is considered “acceptable” in all regions except for Dodoma with 5.2%. On the other hand
0.9% of these children are suffering from Severe Acute Malnutrition (TDHS, 2014). For
Zanzibar, wasting rates are ranging from 6.3 to 7.5%, where GAM is reported to be 7.2%
(TDHS, 2014). Vitamin A supplementation is also alarming as each year 28.0% of the children
in Tanzania mainland do not receive vitamin A supplement (TFNC, 2014).
Iron deficiency anemia is another important nutritional problem in Tanzania and is estimated to
affect 58% of the children below 5 years old. This is attributed to low bioavailability of dietary
iron from plant sources (Mosha et al., 2000). About 70.6% of children aged 12-59 months in
Tanzania mainland receive deworming in the 6 months’ time interval. Hand washing is reported
16
to be good as more than 95% regions soap is used for hand washing mainly before eating and
after visiting the toilets (TDHS, 2005).
Nutrition status of school children is dire as most of them are suffering from almost all forms of
malnutrition with anemia and protein energy malnutrition taking lead by 40% (TFNC, 2014).
According to Mamuya (2004), short term hunger is the main reason for poor school attendance
and school dropouts, in her survey it shows that 50-75% of pupils go to school without taking
breakfast.
2.7 Key Contributors of Poor Nutritional Status among Children
The problem of under nutrition is traced from early days of a child life and prevails as a result of
inadequate breastfeeding and poor complementary feeding (Paul, Dickin, Ali, Monterrosa &
Stoltzfus, 2008). Lack of maternal education is among the determinant factors of a child’s
nutritional status other factors being poverty, mothers’ education and literacy.
A number of studies report a significant association between low maternal literacy and poor
nutrition status of young children, aged 3–23 months old. It has further been observed that the
introduction of complementary foods for infants at an appropriate age (6 months) improved
when mothers were educated (UNICEF, 2009 and 2015). Poverty among mothers is another
contributor to poor nutrition status among children. Furthermore, animal protein and heme iron
sources are expensive for low income households to afford. Most therefore rely on plant
sources, which are known for less bioavailability (Muhimbula & Issa-zacharia, 2010).
2.8 Dietary Practices Leading to Inadequate Nutrition
According to TDHS (2016), TFNC (2014) and Twaweza (2010), in Tanzania, exclusive
breastfeeding for the first six months is not satisfactory as only 59% of infants below 6 months
17
of age are exclusively breastfed. Mothers from medium and high-income groups are reported to
introduce complementary foods to children at early age compared to those in lower income
groups. Among 90% of children from 6 to 8 months who are reported to have had a timely
introduction of complementary food only 24.5% received foods from 4 or more food groups and
20% received a minimum acceptable diet (TFNC, 2014).
2.9 Challenges with Dominant Complementary Foods
In most Sub Saharan African countries, dominant complementary foods are porridges based on
local staple foods including cereals and root crops (Dewey, 2013). Commercially formulated
complementary foods are often of high cost thus inaccessible to low-income households
(Muhimbula & Issa-zacharia, 2010). Tanzania is dependent on cereal and roots based traditional
weaning foods from maize, sorghum, millet, rice, cassava, potatoes and yams, which are known
for their high bulkiness and concentrations of fiber and inhibitors which reduce their nutritional
benefits (Mamiro et al., 2004; Mosha et al., 2000).
While assessing complementary feeding patterns among children aged 3 to 23 months in Kilosa
district of Morogoro region, Mamiro et al. (2004), reported plain maize porridge, finger millet,
rice and peanut composite flour porridge as main complementary foods given to children in the
district. Majority of locally formulated complementary foods, as well as some commercial
complementary foods in Tanzania markets does not meet the quality attributes especially in
terms of energy and micronutrient density as per Tanzania Bureau of Standard (TBS, 1984)
standard number TZS 180:2014.
Studies report low fat, iron, calcium, zinc and phosphorus levels with high crude fibre,
carbohydrate and magnesium in most complementary foods (De Pee & Bloem, 2009).
According to Onoja et al. (2014), calcium, iron and zinc are the most common deficient
18
micronutrients in the home made weaning foods. Mosha et al. (2000), reports concentrations of
iron (Fe) lower than 10.87 mg/100 g in most Tanzanian complementary foods.
2.10 Uses and Nutrition Value of Soybeans
Soybean (Glycine max.) is a protein rich legume with the highest amino acid score and closest to
the standard set by the Food and Agriculture Organization (FAO) and World Health
Organization (WHO). For thousands of years, soybean has been a staple of the Asian diet, but
over recent decades, consumption is quickly growing worldwide (Lokuruka, 2010).
Varieties of fermented and unfermented products are in different markets and are used in many
households worldwide. Unfermented soybean products include soy sprouts, immature green
soybeans, roasted soy beans, soy flour, soy milk and tofu while fermented soybean products
include miso, tempeh, tofu, and soy sauce (Abiose et al., 2015; Anigo et al., 2010; Arueya et al.,
2001). Common used soy product is soy flour and soy drink from roasted soy beans.
Consumption of soy milk is also gaining popularity in different parts of the Tanzania (Laswai et
al., 2009).
Crude protein content of soybean is reported to be up to 38% with satisfactory ratio of essential
amino acids which are necessary for human nutrition (Lokuruka, 2010). Sulphur containing
amino acids are the limiting amino acids with a chemical score of 47, compared to 100 for an
ideal protein (Karasulu, 2001; Quinhone et al., 2015; Shin et al., 2013). Lysine content is very
high and that makes soybean an excellent complement for cereals that are deficient in lysine but
excellent sources of sulphur containing amino acids (Lambein et al., 2005). Soybean is thus
reported to be the most nutritional legume with nearly double the amount of methionine and
cysteine.
19
Soybean has a unique carbohydrate profile which is different from other beans; it is low in high
molecular weight carbohydrates and has a total carbohydrate content of about 30% (Arueya &
Osundahunsi, 2015). Among these soluble carbohydrates; sucrose, fructose, and saccharose,
represents 10-12% and starch 1% (El-shemy, 2011). It also contains indigestible carbohydrates
like raffinose and stachyose that are tri and tetrasaccharide fermentable by the gut micro flora.
Soybean also contains 18% insoluble fibers, been a mixture of cellulosic and non-cellulosic
structural components (cellulose, hemicellulose and pectin substances) Muzzarelli et al. (2012).
Lipids (crude oil) content of soybeans is approximately 20% with triglycerides representing
about 96 %, phospholipids (2%), unsaponifiable lipids (1.6 %) mainly tocopherols (vitamin E)
and 0.5 % free fatty acids (Karasulu, 2001). Soybean is also high in mono and polyunsaturated
fatty acids with 80% of its total fatty acids in the form of linoleic acid essential for lowering
blood cholesterol levels. Furthermore, soybean is among plant sources with few amounts of a
noble essential fatty acid, alpha-linolenic acid and omega-3 fatty acid that are reported to have
independent coronary benefits (Bau et al., 2000; Karasulu, 2001; Quinhone et al., 2015).
Mineral content of soybean is reported to be about 5%, its major constituents been calcium,
potassium and magnesium (Thompson & Grundy, 2005). Studies of soy in children and
adolescents have shown that soy eases constipation Lambein et al. (2005),combats diarrhea (Shu
et al., 2001), lowers serum cholesterol (Ballmer-Weber et al., 2007) and may even decrease risk
of breast cancer later in life in girl children (Shu et al., 2001).
2.11 Challenges with Soybean Flour
As it is with other plant based protein foods, the beauty of soybean protein is challenged by anti-
nutrients mainly trypsin inhibitors and hemaglutinins (lectins) as well as carbohydrate–binding
proteins, which reduce the bioavailability of noble nutrients (Lynch et al., 1985; Natarajan,
2010). Soybeans contain two types of trypsin inhibitors, which are reported to be abundant anti-
20
nutritional proteins in soybean seeds and are characterized as a food allergen in humans (Quirce
et al., 2002; Ballmer-Weber et al., 2007). Different processing methods as cooking, soaking in
sodium bicarbonate and citric acid solution have been reported to reduce these nutrients at
greater extent (Laswai et al., 2009). Laswai et al. (2009), reported beany flavour as another
challenge associated with soybean consumption, found mainly in unfermented soybean products
like soy milk. Lipoxygenase is a technologically most important enzyme found in soybean
believed to catalyze oxidation of the polyunsaturated fatty acid by molecular oxygen, leading to
the development of rancidity and beany flavours (Kulwa et al., 2015). Development of this
beany flavour is believed to occur during the initial grinding step as enzyme reaction
environment is created. Fermentation of soybeans with Rhizopus oligosporous (culture used in
tempe production) for about 36 hours is reported to reduce reasonable amount of anti-nutrients
thus improving protein availability. However, most Tanzanian communities have not been able
to easily adopt and make use of this technology.
Phytic acid is found mainly in plant seeds, where it functions as a reserve material for
phosphorus. Soy meal is reported to contain about 1.5% phytic acid. It is known for forming
insoluble salts with different metal ions as can sequester several metals by chelate formation
(Vaintraub & Lapteva, 1988). There is strong experimental evidence that phytates may decrease
zinc availability in animals and in humans. Phytic acid is also reported to strongly decrease iron
bioavailability from potential iron plant foods (Vaintraub & Lapteva, 1988; Shin et al., 2013).
Phytic acid is hydrolyzed during germination, when the phytase activity increases very rapidly
(Mostafa et al., 1987). This forms a base for processing methods involving germination for
phytate level reductions. Recent animal-based trials, reports a remarkable increase in protein
efficiency ratio, biological values and true digestibility above 60% for germinated soy bean
products.
21
2.12 The Use of Soybeans in Complementary Feeding
Soybean has been widely used in complementary foods in different parts of the world because
of its availability, accessibility and good nutritional profile. It has been reported that Asian
mothers prefer the use of tofu during weaning for its availability, soft consistency and high
palatability (Chapman and Associates, 2004). Soy-based infant formulas (SBIs) are reported to
have been used from beginning of the 20th century for infants with eczema and later became a
commercial product available for any infant who had allergy or intolerance to cow’s milk
formula or breast milk (Arueya & Osundahunsi, 2015). These infant formulae have shown
clinically proven positive results in treating diarrhea (Badger et al., 2004).
Soybean is among commonly used ingredients in enriching African traditional complementary
foods (Anigo et al., 2010). Different methods of preparation ranging from soaking, dehulling to
fermentation have been employed in making African complementary foods like gruels and
porridge flours (Arueya & Osundahunsi, 2015; Bau et al., 2000; Kim et al., 2013; Shin et al.,
2013). Soybean composite crackers have also been developed as energy dense healthy snack for
school children (Mosha et al., 2010).
Evidence suggests that soy-based complementary foods have played a reputable role in reducing
protein energy malnutrition among African children (Muhimbula et al., 2011; Onoja et al.,
2014; Paul et al., 2008; Pee & Bloem, 2009). Soy-based composite flours are available in many
local markets (commonly known as unga wa lishe in Swahili). Soy flour is normally mixed with
such cereals as sorghum, finger millet, maize and wheat to make composite flour for porridge.
Soy milk is also increasingly gaining popularity as replacement of cow milk with added
nutritional benefits despite of the challenged acceptability caused by bean flavor (Laswai et al.,
2009). Commercially available soymilk, homemade soymilk, and soybeans have been shown to
decrease the severity and duration of diarrhea while stimulating weight gain in Nigerian children
22
with diarrhea and malnutrition (Anigo et al., 2010). Shelf life of soy based complementary
foods has been reported to vary from 3 to 9months depending on the moisture levels and
packaging material; storage in laminated sachets was shown to have most stable shelf life of up
to 9 months with no change in both nutritional and sensory attributes (Abiose et al., 2015).
2.13 Soybean Germination Effects
Soybean germination has been used in the production of functional foods mainly in such
products as soy sprouts, which have gained popularity over decades now as a functional food
owing to their high nutritional value(Vernaza et al.,2012). The use of germination process in
soybean flour making has not been widely reported. Studies on effect of soybean germination
report reduction in phytic acid levels up to 46–65 % as a result of phytase enzyme production,
leading to increased bioavailability of iron, zinc and calcium by 25–36 % (Bau et al., 2000;
Huang et al., 2014; Kim et al., 2013; Lynch et al., 1985). Total fatty acid content and trypsin
inhibitor activity are reported to decrease below 32% in 6 days of germination (Wang et al.,
2015). Sensory evaluation of germinated regular soybean is reported to show highest scores for
colour, taste, and overall acceptability against soybean seeds (Shin et al., 2013). In another
study, lipase and α-galactosidase activities are reported to increase with reduced lipoxygenase
activities after less than 72 hours of germination (Karasulu, 2001). Decrease in lipoxygenase
activity is expected to improve the substantial odour and flavour scores of germinated soybean
flour. In rat bioassay, one-day germination of soybeans is reported to induce a significant
increase of daily body weight gain, daily protein intake and protein efficiency ratio (PER) of
seed meal (Huang et al., 2014).
2.14 Uses and Nutritional Value of Sweet Potato
Sweet potato (Ipomoea batatas L) is a root tuber crop, which has been long used as staple food
crop in most parts of the world. It is less sensitive to drought, tolerant to heavy rains, needs low
inputs, and grows in a wide range of ecological zones with simple cooking methods (Rose and
23
Vasanthakaalam, 2011). The plant is of food and economic potential as both leaves and roots are
important and reliable foods to the consuming societies. These cream-yellowish roots have a
sweet appealing flavour with soft mouth fill thus usually preferred as breakfast snack in many
societies. In Tanzania, they are commonly grown in the backyard garden or along the river
valleys mainly for the local market and household consumption (Laswai, 2011). The most
consumed part is the root. Consumption of leaves as a vegetable is also a common practice to
most African countries including some regions of Tanzania mainland. Leaves are reported to
contain high potassium-sodium ratio among other nutrients (Laswai et al., 2011). Sun drying is
a common traditional processing method for both sweet potato roots and leaves.
Orange fleshed sweet potato (OFSP) is another cultivar of sweet potato, which has gained
nutritional popularity in bio fortification programs as cheap and reliable source of pro-vitamin
A. The use of orange-fleshed (β-carotene-rich) sweet potatoes has become effective entry point
for improving vitamin A and caloric intake in sub-Saharan Africa since are widely grown under
women's control (Rose & Vasanthakaalam, 2011). Pro-vitamin A content in home cooked OFSP
is reported to exceed that in commercial products for babies in both raw and cooked forms
(Amagloh, 2012). However, long boiling and frying of OFSP is generally expected to decrease
total beta carotene contents.
2.15 The Utilization of Sweet Potatoes in Complementary Feeding
Sweet potato-based complementary food formulated using both household and industrial level
processing methods like fermentation, blanching, sun drying, milling, blending, freeze drying
and drum drying has been reported (Amagloh, 2012; Laswai, 2011). Sweet potato-based
complementary foods are reported to meet the stipulated energy values specified in the Codex
Standards though deficient in protein and essential minerals (Lutter & Rivera, 2003).
24
For complementary food formulations, sweet potato has been blended with such staple foods as
sorghum, finger millet, maize, soybeans and cowpeas (Muhimbula et al., 2011). In some
Tanzanian societies, it is blended with meat soup and/or immature beans and vegetables for
child feeding. Sweet potato-based infant foods are shown to contain measurable levels of pro
vitamin A in form of β-carotene, also high in sugars like maltose, sucrose free glucose and
fructose contributing to higher viscosities, solubility and high consumer acceptance (Amagloh,
2012). Furthermore, sweet potato-based formulations have significant advantage of use in
complementary food due to the low level of phytic acid.
25
CHAPTER THREE
3. MATERIALS AND METHODS
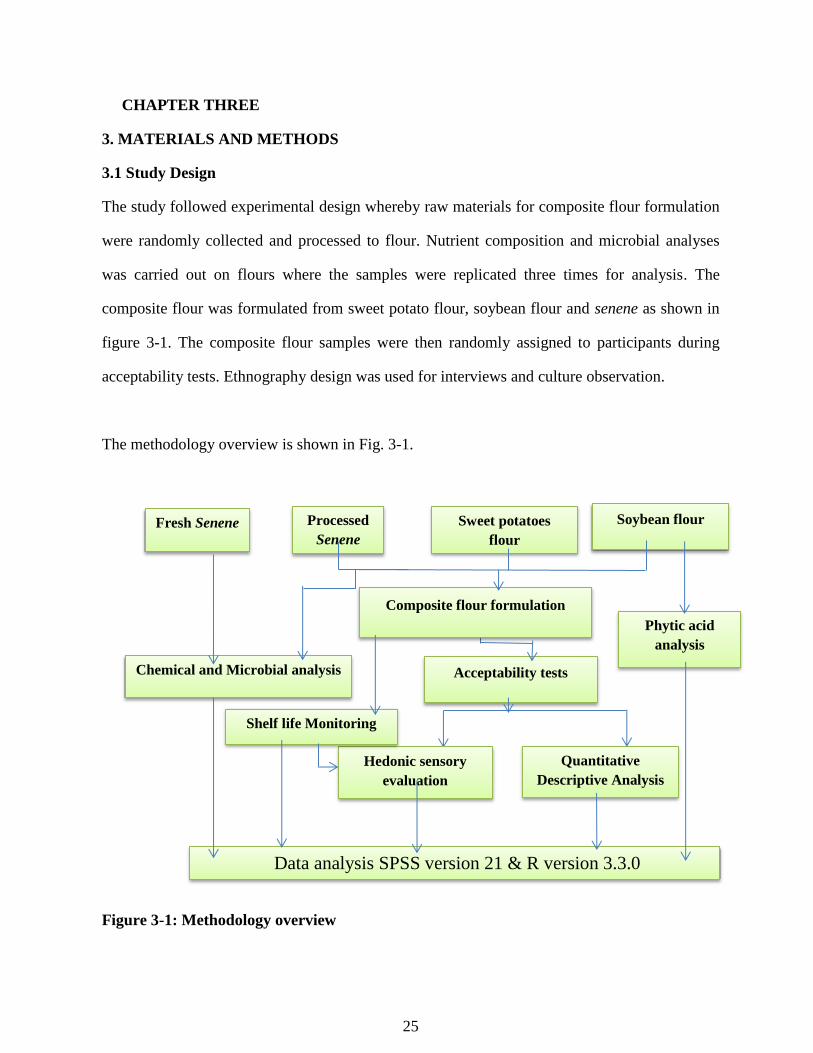
3.1 Study Design
The study followed experimental design whereby raw materials for composite flour formulation
were randomly collected and processed to flour. Nutrient composition and microbial analyses
was carried out on flours where the samples were replicated three times for analysis. The
composite flour was formulated from sweet potato flour, soybean flour and senene as shown in
figure 3-1. The composite flour samples were then randomly assigned to participants during
acceptability tests. Ethnography design was used for interviews and culture observation.
The methodology overview is shown in Fig. 3-1.
Figure 3-1: Methodology overview
Chemical and Microbial analysis
Acceptability tests
Quantitative
Descriptive Analysis
Hedonic sensory
evaluation
Shelf life Monitoring
Composite flour formulation
Processed
Senene
Sweet potatoes
flour
Soybean flour Fresh Senene
Phytic acid
analysis
Data analysis SPSS version 21 & R version 3.3.0
26
3.2 Study Area
The study was carried out in Kagera and Morogoro regions of Tanzania. Kagera is found in the
northwestern corner of Tanzania, lying between 1°00’ and 2°45’S of the Equator and 32°40’ E
of Greenwich. The capital town of Kagera is Bukoba, which is about 1,500 km from Dar es
Salaam by road. Kagera region shares borders with Uganda to the north, Rwanda and Burundi to
the west and Lake Victoria to the east. Main economic activities carried out in this area include
farming, fishing, livestock keeping and mining (URT, 2015). The natives of Kagera are mainly
the Haya tribe to whom senene is an esteemed delicacy. This hilly terrain region with thick
tropical vegetation including forests and wide-open grasslands, experiences two rain seasons.
The long rainy season is from March to May and short rainy season from October to December.
The region is also among the three regions reported to have stunting rates above 50% (TFNC
2014: URT 2015). The survey part focused on Muleba and Kagera urban districts, where senene
harvesting and enterprise is endemic, while laboratory analyses and consumer acceptability
studies were carried out in Morogoro region.
3.3 Survey and Interviews
3.3.1 Sampling frame, sampling and interviews
A total of 51 randomly selected adults of Haya ethnic group were interviewed from Muleba and
Kagera urban districts of Kagera region. Among these were 10 key informants mainly elders of
Haya tribe and senene collectors who were selected using purposive sampling due to their
distinct knowledge of local culture and senene. In this, former interviewees were asked to
pinpoint respected village elders and experienced senene collectors. Senene collectors who were
found at the collection points during the night hours were also interviewed. Key informants
interviews were mainly for confirmation and clarification of some beliefs and indigenous
technologies outlined by interviewees. Information was collected through face to face

27
interviews using questionnaires administered in local Swahili language. The questionnaire
covered questions regarding demographics, biology/identity, cultures, harvesting, indigenous
technologies in processing and preservation. The questionnaire started with a brief awareness
creating sentence about nutrition status of residents of Kagera region. The study was of
ethnography nature with interviews focused on perceptions, beliefs and traditions towards
senene consumption, storage and shelf-life. Senene prices and nutrition knowledge among
senene consumers were also collected using the questionnaires. Observations of harvesting,
cooking and traditional processing of senene was done in the homestead, farms and wild fields
and recorded. To document some of the traditional practices, photos of the insects, traditional
traps and senene markets were taken. Photos were taken using camera and a video was taken
where necessary. Samples of senene were collected from the fields and markets for
identification and inventorying.
3.4 Sample Collection for Product Development
Wild collection and trapping of fresh longhorn grasshoppers (senene) took place in Bukoba and
Muleba districts of Kagera region. Fresh samples were packed in polythene bags, preserved in a
-20°C freezer then transported in iced cool box to Sokoine University of Agriculture (SUA),
Morogoro for chemical and microbial analysis. Processing of the remaining senene was done in
Bukoba before transporting them to SUA for nutrients analysis and product development. Dried
soybean (Semeki variety, harvested October 2015) was obtained from Turiani district in
Morogoro whereas local variety of fresh sweet potatoes were obtained from Morogoro central
market and carried in polyethylene bags to SUA food laboratory for preparation and analysis.
3.5 Sample Preparation for Product Development
3.5.1 Senene preparation
Senene were sorted to remove contaminants before removal of wings and appendages (Fig.3-2).
Toasting on a hot frying pan was done for 10 minutes, the way Bukoba natives prepare senene
28
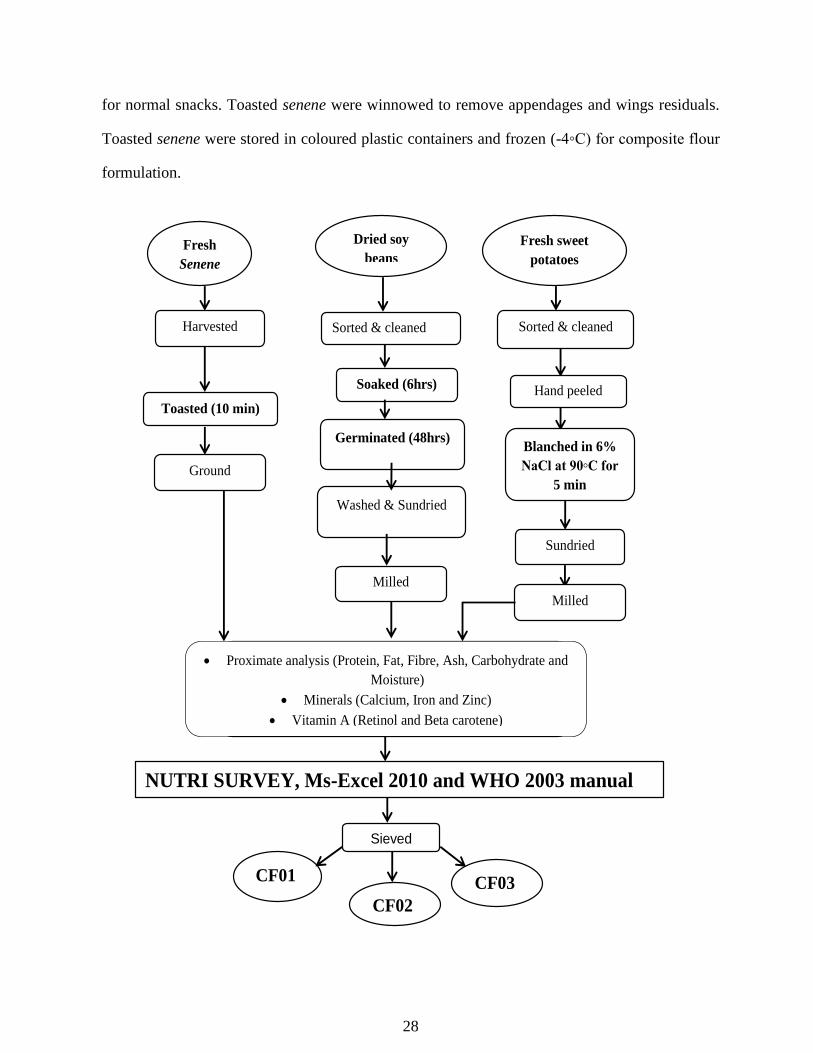
for normal snacks. Toasted senene were winnowed to remove appendages and wings residuals.
Toasted senene were stored in coloured plastic containers and frozen (-4◦C) for composite flour
formulation.
Fresh
Senene
Dried soy
beans
Fresh sweet
potatoes
Sorted & cleaned
Toasted (10 min)
Sorted & cleaned
Hand peeled
Blanched in 6%
NaCl at 90◦C for
5 min
Sundried
Soaked (6hrs)
Germinated (48hrs)
Washed & Sundried
Harvested
NUTRI SURVEY, Ms-Excel 2010 and WHO 2003 manual
Milled
Sieved
CF01
CF02
CF03
Milled
Ground
Proximate analysis (Protein, Fat, Fibre, Ash, Carbohydrate and
Moisture)
Minerals (Calcium, Iron and Zinc)
Vitamin A (Retinol and Beta carotene)
29
Figure 3-2: Flow diagrams for senene, soybean, sweet potato and composite flour
preparation
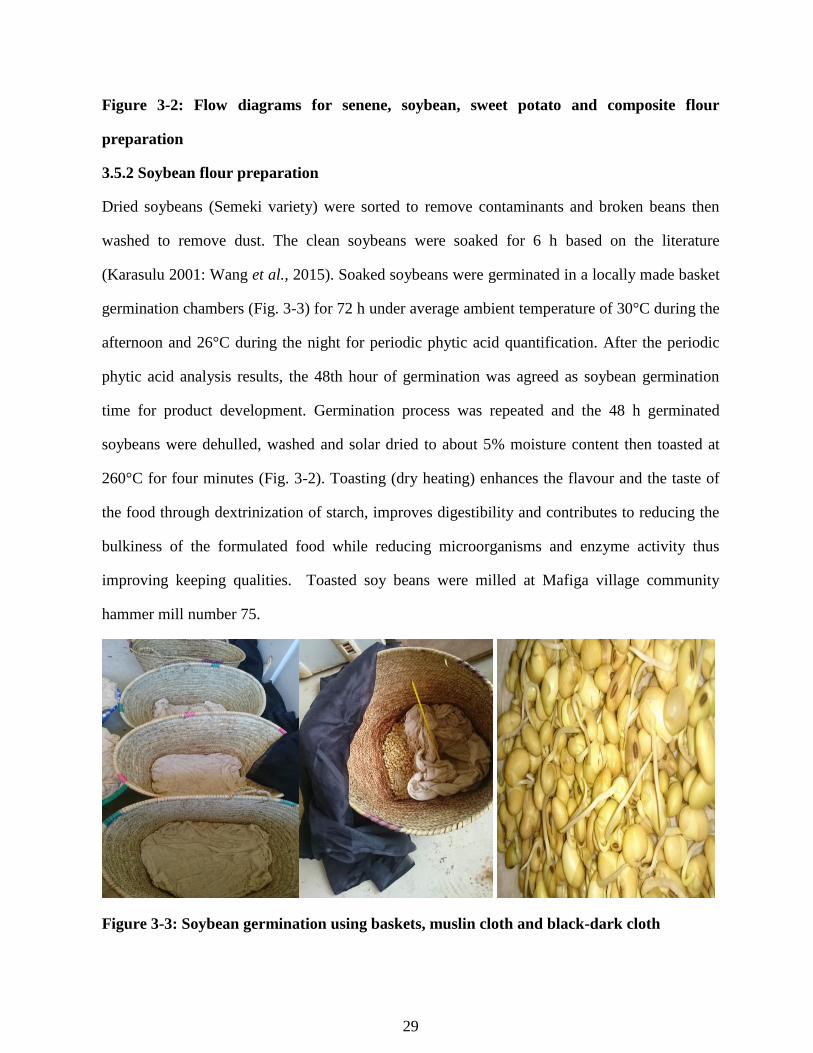
3.5.2 Soybean flour preparation
Dried soybeans (Semeki variety) were sorted to remove contaminants and broken beans then
washed to remove dust. The clean soybeans were soaked for 6 h based on the literature
(Karasulu 2001: Wang et al., 2015). Soaked soybeans were germinated in a locally made basket
germination chambers (Fig. 3-3) for 72 h under average ambient temperature of 30°C during the
afternoon and 26°C during the night for periodic phytic acid quantification. After the periodic
phytic acid analysis results, the 48th hour of germination was agreed as soybean germination
time for product development. Germination process was repeated and the 48 h germinated
soybeans were dehulled, washed and solar dried to about 5% moisture content then toasted at
260°C for four minutes (Fig. 3-2). Toasting (dry heating) enhances the flavour and the taste of
the food through dextrinization of starch, improves digestibility and contributes to reducing the
bulkiness of the formulated food while reducing microorganisms and enzyme activity thus
improving keeping qualities. Toasted soy beans were milled at Mafiga village community
hammer mill number 75.
Figure 3-3: Soybean germination using baskets, muslin cloth and black-dark cloth
30
3.4.3 Sweet potato flour preparation
Fresh sweet potatoes (cream-yellow local variety) were sorted and cleaned to remove soil
debris. They were then hand peeled, washed, equally sliced then dipped in 6% NaCl boiling
water for 5 min, sun dried to 5% moisture content and milled at Mafiga village community
hammer mill number 75 (Fig. 3-3).
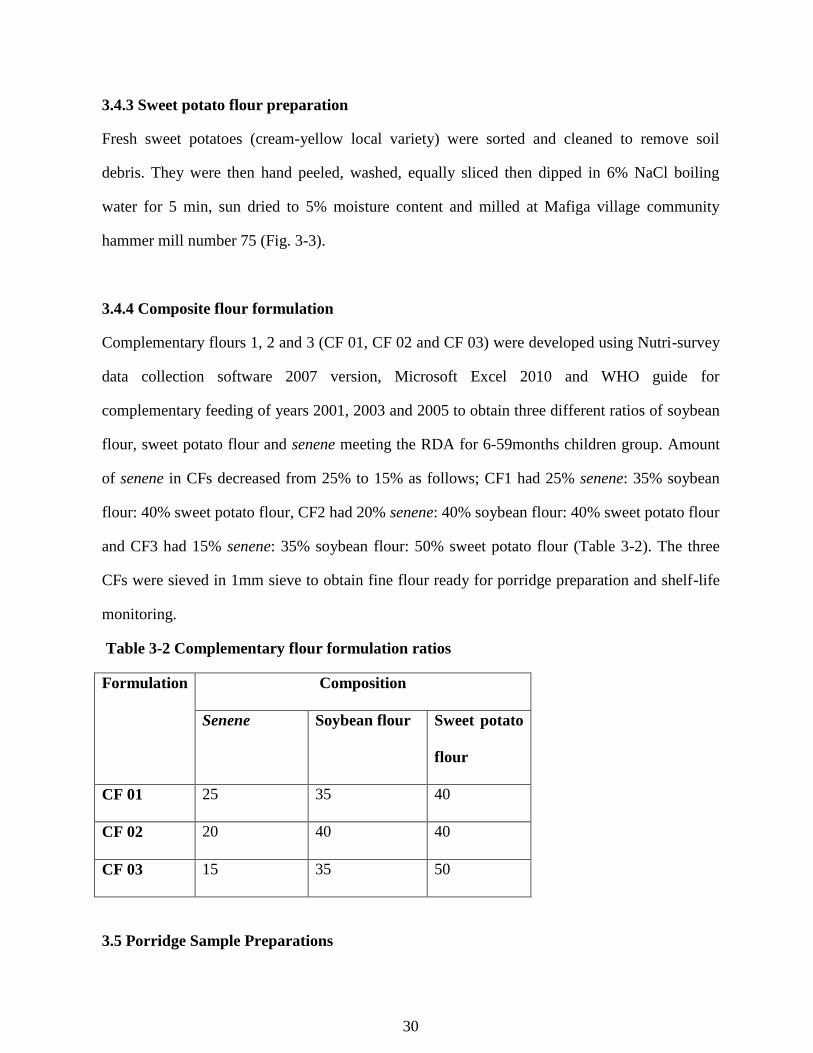
3.4.4 Composite flour formulation
Complementary flours 1, 2 and 3 (CF 01, CF 02 and CF 03) were developed using Nutri-survey
data collection software 2007 version, Microsoft Excel 2010 and WHO guide for
complementary feeding of years 2001, 2003 and 2005 to obtain three different ratios of soybean
flour, sweet potato flour and senene meeting the RDA for 6-59months children group. Amount
of senene in CFs decreased from 25% to 15% as follows; CF1 had 25% senene: 35% soybean
flour: 40% sweet potato flour, CF2 had 20% senene: 40% soybean flour: 40% sweet potato flour
and CF3 had 15% senene: 35% soybean flour: 50% sweet potato flour (Table 3-2). The three
CFs were sieved in 1mm sieve to obtain fine flour ready for porridge preparation and shelf-life
monitoring.
Table 3-2 Complementary flour formulation ratios
Formulation Composition
Senene Soybean flour Sweet potato
flour
CF 01 25 35 40
CF 02 20 40 40
CF 03 15 35 50
3.5 Porridge Sample Preparations
31
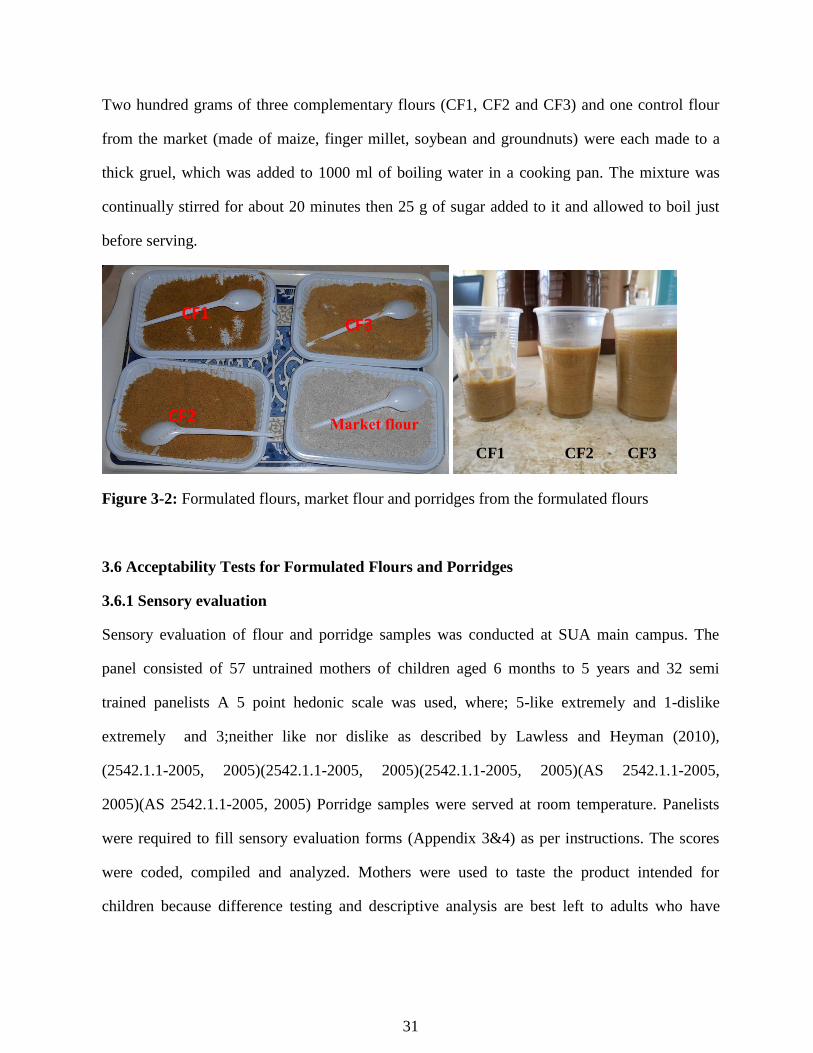
Two hundred grams of three complementary flours (CF1, CF2 and CF3) and one control flour
from the market (made of maize, finger millet, soybean and groundnuts) were each made to a
thick gruel, which was added to 1000 ml of boiling water in a cooking pan. The mixture was
continually stirred for about 20 minutes then 25 g of sugar added to it and allowed to boil just
before serving.
Figure 3-2: Formulated flours, market flour and porridges from the formulated flours
3.6 Acceptability Tests for Formulated Flours and Porridges
3.6.1 Sensory evaluation
Sensory evaluation of flour and porridge samples was conducted at SUA main campus. The
panel consisted of 57 untrained mothers of children aged 6 months to 5 years and 32 semi
trained panelists A 5 point hedonic scale was used, where; 5-like extremely and 1-dislike
extremely and 3;neither like nor dislike as described by Lawless and Heyman (2010),
(2542.1.1-2005, 2005)(2542.1.1-2005, 2005)(2542.1.1-2005, 2005)(AS 2542.1.1-2005,
2005)(AS 2542.1.1-2005, 2005) Porridge samples were served at room temperature. Panelists
were required to fill sensory evaluation forms (Appendix 3&4) as per instructions. The scores
were coded, compiled and analyzed. Mothers were used to taste the product intended for
children because difference testing and descriptive analysis are best left to adults who have
CF1
CF2
CF3
Market flour
CF1 CF2 CF3
32
similar perceptions to those of children, and yet greater cognitive abilities, as required to carry
out difference testing, scaling and descriptive analysis (Guinard, 2001).
3.6.2 Qualitative descriptive analysis (QDA)
QDA was used in this study to understand detailed qualitative and quantitative description of the
sensory attributes perceived in the developed flours. QDA is a useful and highly informative
class of sensory tests, which tries to answer the question of what is the nature and magnitude of
difference between products. QDA was conducted in the research laboratory at SUA using a
trained sensory panel of 10 assessors, aged 21-31 years according to method described in
Lawless and Heyman (2010). The assessors were selected then taken through training according
to ISO Standard (1993). In a pre-testing session the assessors were trained in developing sensory
descriptors and the definition of the sensory attributes. The assessors developed a test
vocabulary describing differences between samples, then agreed upon total number of attributes
on; whiteness, colour hue, appearance, hand-feel and aroma for flours and thickness, sweetness,
mouth-feel and oiliness for porridge. The assessors were subjected to duplicate pre-testing of the
samples just after the training before the actual testing to measure their reproducibility and
efficiency. A nine point line scale developed during training showing low intensity (value 1) to
the highest intensity (value 9) was used (Appendix 5&6). Panel check software was used to
generate turker and p*MSE correlation loadings plots for assessing panel performance. All
samples were coded in 3-digit random numbers and each panelist served in a randomized order.
Clean drinking water was provided for mouth rinsing.
33
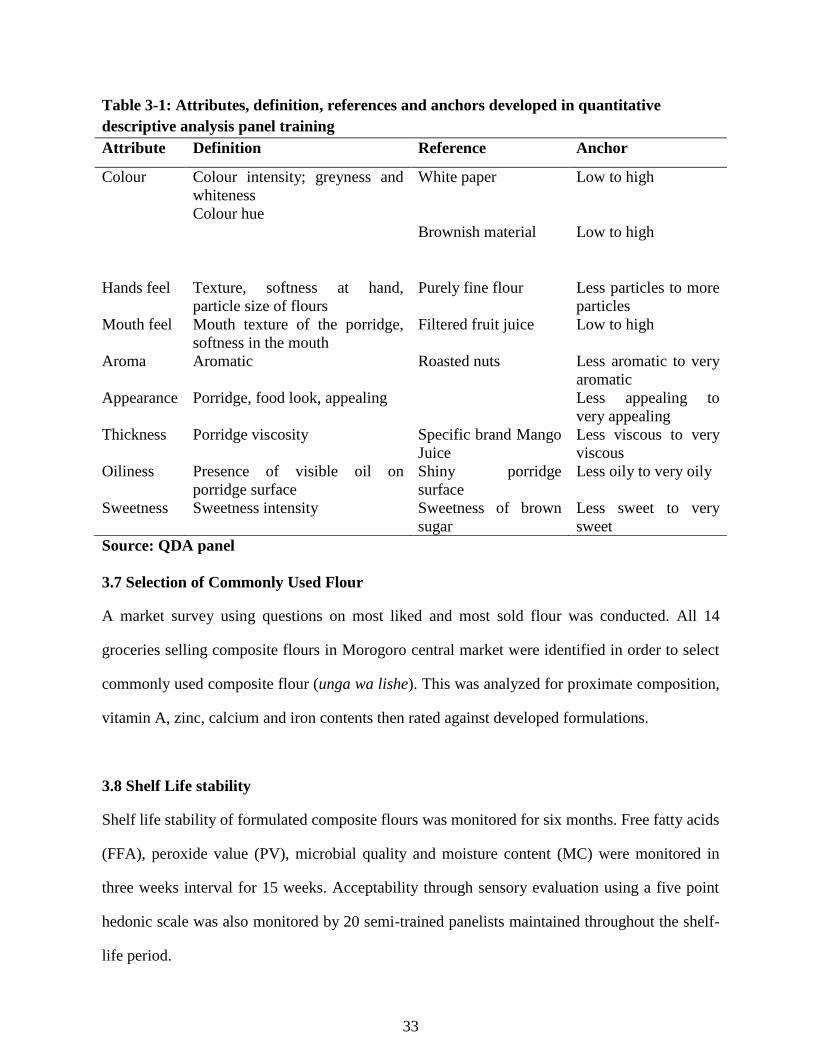
Table 3-1: Attributes, definition, references and anchors developed in quantitative
descriptive analysis panel training
Attribute Definition Reference Anchor
Colour Colour intensity; greyness and
whiteness
Colour hue
White paper
Brownish material
Low to high
Low to high
Hands feel Texture, softness at hand,
particle size of flours
Purely fine flour Less particles to more
particles
Mouth feel Mouth texture of the porridge,
softness in the mouth
Filtered fruit juice Low to high
Aroma Aromatic Roasted nuts Less aromatic to very
aromatic
Appearance Porridge, food look, appealing Less appealing to
very appealing
Thickness Porridge viscosity Specific brand Mango
Juice
Less viscous to very
viscous
Oiliness Presence of visible oil on
porridge surface
Shiny porridge
surface
Less oily to very oily
Sweetness Sweetness intensity Sweetness of brown
sugar
Less sweet to very
sweet
Source: QDA panel
3.7 Selection of Commonly Used Flour
A market survey using questions on most liked and most sold flour was conducted. All 14
groceries selling composite flours in Morogoro central market were identified in order to select
commonly used composite flour (unga wa lishe). This was analyzed for proximate composition,
vitamin A, zinc, calcium and iron contents then rated against developed formulations.
3.8 Shelf Life stability
Shelf life stability of formulated composite flours was monitored for six months. Free fatty acids
(FFA), peroxide value (PV), microbial quality and moisture content (MC) were monitored in
three weeks interval for 15 weeks. Acceptability through sensory evaluation using a five point
hedonic scale was also monitored by 20 semi-trained panelists maintained throughout the shelf-
life period.
34
3.9 Chemical Analysis
3.9.1 Proximate analysis
Proximate composition (moisture, protein, fat, ash, fibre and carbohydrates) for soybean flour,
sweet potato flour, selected market flour and senene (fresh, toasted and deep fried), were
determined by the methods of AOAC (2003).
Moisture content was determined according to standard oven drying method at 110°C overnight.
Crude protein was determined using block digestion and steam distillation (Kjeltec TM 8200
Auto distillation unit 2012). Crude fat content was determined by solvent extraction method
using SoxtecTM2055 while ash content was determined by sample heating in a muffle furnace
at 550°C for 4 hours. Crude fibre was determined using dilute acid and alkali hydrolysis using
Fibertec 2010 while carbohydrate content was determined by difference.
3.9.2 Determination of acid value
A 5g sample of the water bath warmed sample at 400C for 45 minutes in 20 ml of 5% diethyl
ether was dissolved in alcohol. The mixture was titrated against 0.1M sodium hydroxide using
phenolphthalein indicator until pink colour appeared. Acid value was calculated using the
formula:
Acid value in mg NaOH/g = (V1-V2) ×0.004g/ml × Extraction vol. (ml) ×1000
Sample weight (g)
Where V1and V2 are initial and final titre volumes respectively
3.9.3 Determination of peroxide value
A 5g sample was warmed in water bath at 40°C for 45 minutes. The sample was then mixed
with 25 ml of solvent mixture (acetic acid: chloroform) and 1g of solid potassium iodide then
35
heated in a boiling water bath for 30 seconds. The heated contents were poured into 100 ml
conical flask and titrated against standardized 0.002M sodium thiosulphate using starch solution
as an indicator until blue black colour disappeared. Peroxide value was calculated using the
formula;
Peroxide value (meq/kg) = (A-B) ×N ×1000
Sample weight (g)
where; A= Volume (ml) of Na2S2O3 used for sample
B= Volume (ml) of Na2S2O3 used for blank
N= Normality of Na2S2O3
3.10 Determination of Vitamin A Content
3.10.1 Retinol content
To a 10 ml glass stoppered centrifuge tube, about 1 g of sample (fresh, toasted and deep fried
senene, germinated soybean flour, sweet potato flour) was added followed by 2 ml of absolute
ethanol containing 0.1% (w/v) ascorbic acid and 1 ml of 50% (w/v) KOH. The tubes were
stoppered and agitated carefully before placing them in a water bath at 80°C for 20 min.
Complete digestion of fat was ensured by periodic agitation. A 2 ml sample of hexane
containing 0.01% (w/v) BHT was added and the tubes were stoppered again for vigorous mixing
using a vortex mixer for 1 min, then allowed standing for 2 min before it was vortexed again for
1 min. A 1 ml sample of cold water (1°C) was added to the tubes and inverted 10 times then
centrifuged at 3500 rpm for 10 min. Then, 2 ml of the upper organic layer was pipetted
accurately into a tube and solvent evaporated at 40°C using a rotary evaporator. The residue was
dissolved in 1 ml methanol.
For the standard solutions, the procedures were similar but with the following modifications; 1
ml of the standard solution was used and 0.1 ml peanut oil added before saponification to avoid
36
oxidation. A 5 ml sample of the upper phase was pipetted and residue dissolved in 5 ml
methanol. The absorbance was read using UV-Visible Spectrophotometer Wegtech, CECIL
2021 at 325 nm.
Sample concentration was calculated using the following equation (Neal Craft, 2008);
Rc = A×El×100000
E×S×Et
where;
Rc=Retinol concentration (mg/L)
A=Sample absorbance as read at 325 nm UV-Vis spectrophotometer
El=Elution
E=Extinction coefficient of retinol in ethanol (975)
S=Amount of sample taken for analysis
Et= Extraction volume
3.10.3 Determination of beta carotene
About 0.5 g of each of the samples was weighed, extracted with 50 ml of acetone (acetone
refrigerated at 40°C for 2 hours prior to use) using a homogenizer (Gaustin M3 Homogenizer
58789) placed under the fume. About 40 ml of petroleum ether were put in a separating funnel
(250 – 500 ml capacity) and acetone was added. Distilled water was added slowly along the
neck without shaking to avoid emulsion formation. The two phases were then left to separate
and the lower aqueous layer discarded, the sample was washed 3-4 times with distilled water
(approx. 200 ml) each time to remove residual acetone, in the last phase washing was done
ensuring no any amount of the upper phase was discarded. Then, the upper layer was collected
into 50 ml flask using anhydrous sodium sulphate filter arrangement to remove residual water
and the absorbance was determined by using a spectrophotometer (Rodriguez-Amaya,
37
2001).The absorbance was determined at a wavelength of 450 nm and beta carotene was
calculated using the equation of the standard curve.
3.10.4 Determination of mineral content
The analysis of minerals was done according to the AOAC (1995) procedures. The mineral
content was determined by the use of Unicam 919 Atomic Absorption Spectrophotometer
(AAS). Test portions were dried and then ashed at 4500°C under a gradual increase (about
500°C/h ) in temperature. The
residue was dissolved in 0.1 N HNO3 left to dissolve then filtered using a Whatman filter paper.
The analyses were analyzed by flame procedures. The set of instrument was as per the
guidelines given in the instruction manual. The absorbance of sample and standard solutions
was determined.
The standard conditions for Atomic Absorption Spectrophotometer (Element wavelength flame-
gases) were: zinc (Zn) 319.9 nm, iron (Fe) 248.8 nm and calcium (Ca) 422.7 nm. The Standard
curve plot of absorbance against the known concentration of standard solutions (0, 0.5, 1, 2, 4,
5, 10, 20 and 40 ppm) was used to determine the concentration of minerals in samples and the
results expressed as shown in the following formula.
(Mineral content (mg/100g) =(Reading value in ppm × dilution factor × 100 )
Sample weight (g)
3.10.5 Determination of phytates
Phytates composition determination was done by HPLC analysis method by Camire and
Clydesdale (1982). Fifty mg of germinated soybean flour was extracted with 10 ml of 3%
H2SO4. Contents were filtered and the filtrate transferred to a boiling water bath (BWB) for 5
38
min followed by addition of 3ml of FeCl3 solution (6mg ferric iron per ml in 3% H2SO4).
Contents were heated for 45 min to complete precipitation of the ferric phytate complex.
Contents were centrifuged at 2500 r.p.m. for 10 min and the supernatant discarded. Precipitate
was washed with 30 ml distilled water, centrifuged and the supernatant discarded. 3 ml of 1.5N
NaOH was added to the residues and the volume brought to 30ml with distilled water. Contents
were heated for 30 min in a BWB to precipitate the ferric hydroxide. Cooled samples were
centrifuged and the supernatant transferred into a 50ml volumetric flask. The precipitate rinsed
with 10 ml distilled water, centrifuged and the supernatant added to the contents of the
volumetric flask.
Then, 20 µl of the supernatant was injected into a HPLC fitted with a C-18 (5 µl) Chromosorb
column at 30°C and an RID detector. The mobile phase was 0.005N sodium acetate in distilled
water, flowing at 0.5 µl/min. A stock solution of the standard containing 10 mg/ml of sodium
phytate (Inositol hexaphosphoric acid C6H6 (OPO3Na2)6+H2O was used.
3.11 Microbial Analysis
3.11.1 Determination of total plate count
A 25g sample was aseptically weighed into sterile homogenizing container followed by
addition of 225 ml sterile buffered peptone water, the mixture was homogenized for 2 min
followed by three (3) serial dilutions made by mixing 1 ml of sample with 9ml of sterile peptone
water. Pre-prepared sterile plate count agar (PCA) made according manufacturer specification
was then used for culturing and enumerating bacterial colonies. Inoculation of the sample onto
the PCA plates was done aseptically by spreading 200 µl of the sample from each dilution onto
a separate sterile PCA, followed by incubation at 37°C for 24-72 hours. Plates with less than
300 colonies were counted and the rest were autoclaved. The number of bacterial colonies was
expressed as colony forming units per gram (CFU/g) of the sample using the formula from
International Dairy Federation method (IDF, 1996) as follows:
39
Log C=∑ x/n1+ (0.1n2)xd
where:
C= Count CFU/g
x= Total number of colonies in all plates
n1= Number of plates from initial dilution where counts were made
n2= Number of plates from second dilution from where counting was done
d= Initial dilution where counting started
3.11.2 Determination of total coliforms and Escherichia coli
A 25g sample was aseptically weighed into sterile homogenizing container followed by
addition of 225 ml sterile buffered peptone water, the mixture was homogenized for 2 min
followed by three (3) serial dilutions made by mixing 1ml of sample with 9 ml of sterile peptone
water. Pre-prepared sterile Tryptone, Bile salts, X-Glucuronide (TBX) agar made according
manufacturer specification was then used for culturing and enumerating E coli. Inoculation of
the sample onto the TBX agar plates was done aseptically by spreading 200 µl of the sample
from each dilution onto a separate sterile TBX media, followed by incubation at 37°C for 24-72
hours. Observed cream colonies were counted for coliforms and blue for E. coli (AOAC, 1995).
Identification of E. coli 0157:H7 was done using Dynabeads©2012 Life Technologies
Corporation (Invitrogen Grand Island New York). Dynabeads (50 µl) were added and used
according to the manufacturers’ instructions. Immunogenic separation was performed on the
samples that were positive for generic E. coli (blue colonies). Samples were streaked on Sorbitol
MacConkey with cefixine and tellurite (Neogen) followed by incubation at 37°C for 24 h.
MacConkey plates were then screened for 0157:H7 suspect (purple colonies). Suspect colonies
were confirmed by using Oxoid E .coli 0157:H7 Latex tests.
40
3.11.3 Determination of Salmonella typhi
A 25g of sample was aseptically weighed into sterile homogenizing container and 225 ml sterile
buffered peptone water added then blended for 2 min. The mixture was incubated at 37°C for
24h for pre-enrichment followed by second enrichment into pre-sterilized Rappaport Vassiliadis
R10 (RPV) Broth. Then, 1 ml of pre-enriched sample was taken to 9ml of RPV followed by
incubation at 37°C for 24 h, prepared Xylose Lysine Deoxycholate agar (XLD) with
manufacturer specification was made to solution, sterilized, poured in petri dishes and allowed
to cool at room temperature. Aseptic streaking of the sample from enriched RPV onto the XLD
agar plates was done before aerobic incubation at 37°C for 48 hours. Characteristic black
colonies of S. typhi were observed and enumerated (AOAC, 1995).
3.11.4 Total yeast and mold
A 25g sample was aseptically weighed into sterile homogenizing container followed by
addition of 225 ml sterile buffered peptone water, the mixture was homogenized for 2 min
followed by three (3) serial dilutions made by mixing 1 ml of sample with 9ml of sterile peptone
water. 200 µl of the inoculum from each of the dilutions was pipetted and spread gently onto
pre-prepared sterile Sabouraud Dextrose agar (SDA) plates. The inoculated plates were
incubated at 24°C for five days. The plates were then examined and counted for colonies
growing on the medium.
Identification of observed colonies was done by microscopy method, where a colony portion
was taken by using a sterile inoculating needle and mixed with lactophenol cotton blue stain on
a clean glass slide followed by covering of the specimen using a clean glass cover slip. Excess
stain –inoculum mixture was blotted by folding the slide in between the filter paper. The blotted
slide was placed on light microscope (Batch no. 25, 0825583 of Brunel Microscopes Ltd) stage
41
for observation and identification using the key by Naveen Kango (2010). Total magnification
used for observations and identification was 1000x.
3.12 Data Analysis
All chemical tests were conducted in duplicate and the mean values ± standard deviation (SD)
were reported. Mean comparison was done by analysis of variance (ANOVA) and least
significant difference (LSD) P≤ 0.05. Interview data analysis was carried out using (SPSS
version 21) while R software (version3.3.0) was applied in chemical and sensory data analysis.
CHAPTER FOUR
4. RESULTS AND DISCUSSION
4.1 Survey on indigenous technologies, processing methods and traditions towards senene
consumption
4.1.1 Social-economic information of the respondents
Socio-economic characteristics of respondents involved in the study collected included age,
gender, tribe and occupation. The age of the respondents ranged from 21 - 60 years old with a
majority (43%) being 21-30 years of age. Fifty one percent of respondents were female. These
were first hand informers as senene collection and processing is dominated by women. Edible
insects consumption is merely cultural and differs across different ethnic groups, 90%
respondents were Hayas, others being Sukuma, Nyambo, Bunganda and Kerewe. Interviewees’
occupations were mainly local government officials (39%) mostly from nature and forestry
department, self-employed in informal sector including senene traders (33%), peasants (15%)
and students (13%).
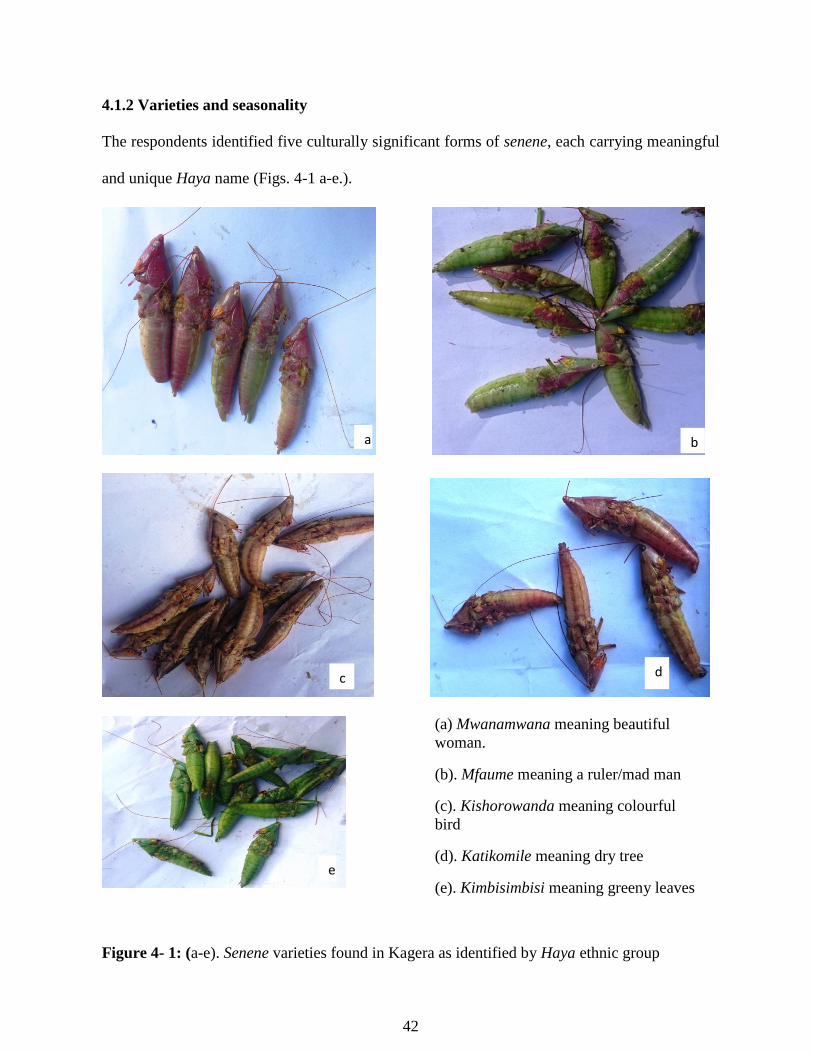
42
4.1.2 Varieties and seasonality
The respondents identified five culturally significant forms of senene, each carrying meaningful
and unique Haya name (Figs. 4-1 a-e.).
Figure 4- 1: (a-e). Senene varieties found in Kagera as identified by Haya ethnic group
a b
d c
e
(a) Mwanamwana meaning beautiful
woman.
(b). Mfaume meaning a ruler/mad man
(c). Kishorowanda meaning colourful
bird
(d). Katikomile meaning dry tree
(e). Kimbisimbisi meaning greeny leaves
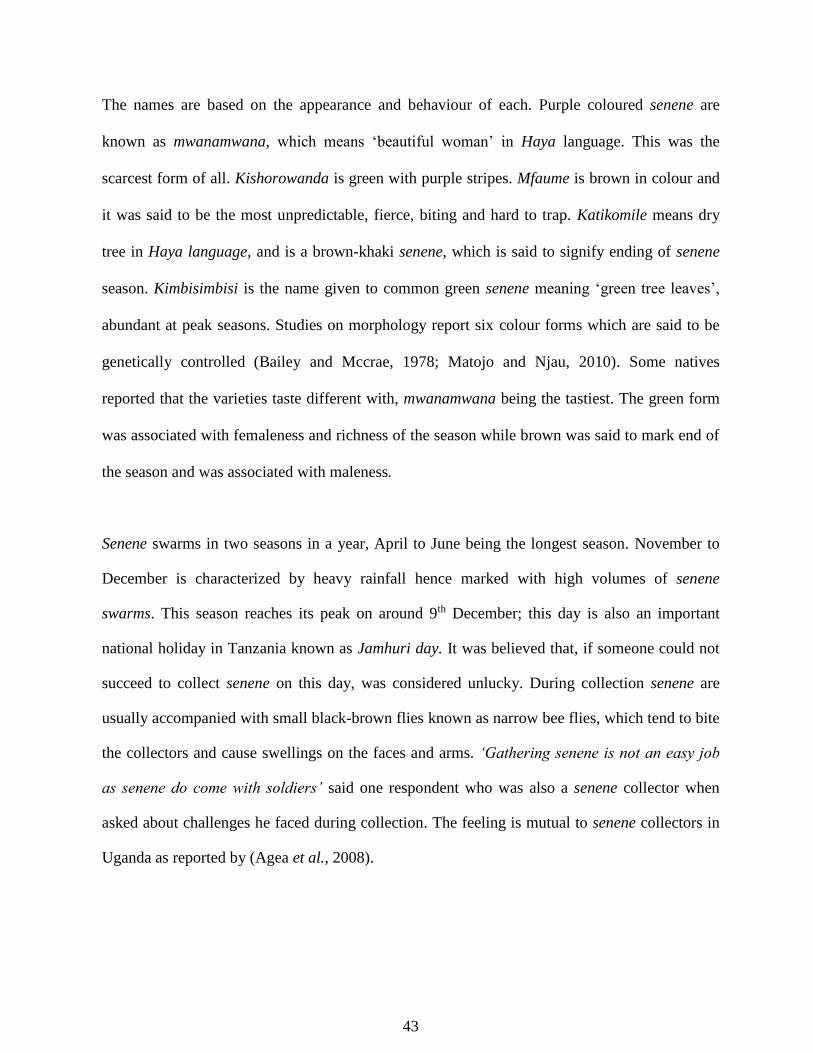
43
The names are based on the appearance and behaviour of each. Purple coloured senene are
known as mwanamwana, which means ‘beautiful woman’ in Haya language. This was the
scarcest form of all. Kishorowanda is green with purple stripes. Mfaume is brown in colour and
it was said to be the most unpredictable, fierce, biting and hard to trap. Katikomile means dry
tree in Haya language, and is a brown-khaki senene, which is said to signify ending of senene
season. Kimbisimbisi is the name given to common green senene meaning ‘green tree leaves’,
abundant at peak seasons. Studies on morphology report six colour forms which are said to be
genetically controlled (Bailey and Mccrae, 1978; Matojo and Njau, 2010). Some natives
reported that the varieties taste different with, mwanamwana being the tastiest. The green form
was associated with femaleness and richness of the season while brown was said to mark end of
the season and was associated with maleness.
Senene swarms in two seasons in a year, April to June being the longest season. November to
December is characterized by heavy rainfall hence marked with high volumes of senene
swarms. This season reaches its peak on around 9th December; this day is also an important
national holiday in Tanzania known as Jamhuri day. It was believed that, if someone could not
succeed to collect senene on this day, was considered unlucky. During collection senene are
usually accompanied with small black-brown flies known as narrow bee flies, which tend to bite
the collectors and cause swellings on the faces and arms. ‘Gathering senene is not an easy job
as senene do come with soldiers’ said one respondent who was also a senene collector when
asked about challenges he faced during collection. The feeling is mutual to senene collectors in
Uganda as reported by (Agea et al., 2008).
44
4.1.3 Origin and availability
When asked about the origin of senene, one old man aged 72 years explained that ‘it is just
God’s plan for Kagera, I don’t even understand because they just drop from heaven’. Most
natives also believe that senene came from heaven just like how Manna dropped to Israelites in
bible times according to the Holy Bible in Exodus 16:1-36. It was further suggested that senene
came from Lake Victoria; few believed that senene emerged from bushes and pine trees while
others said they came from dense-dark clouds. According to Matojo and Yarro (2010), bushes
are the breeding grounds for R. differens, where both swarming and non-swarming adults lay
eggs in ribbons cemented together. Time lapse between oviposition and maturity is reported to
take about 3 months (Bailey and Mccrae, 1978). Senene swarms were reported to decrease as
years went by with some key informers’ suggesting that climate change has significantly
affected the current volumes of senene.
4.1.4 Traditions, consumer perception, custom and taboos
‘Senene is an icon of Kagera, God’s gift from heaven for Haya’ reported one retired forest
officer from Bukoba Municipal Council. It is a delicacy normally reserved for men and in-laws.
Majority (98%) of all respondents liked to eat senene for different reasons. Reasons for
consumption included; respect to traditional delicious delicacy (44%), source of nutrients (41%)
and tasty nature of senene as multipurpose sauce (15%).
Senene is a delicacy exported to Haya relatives living in distant places like United Kingdom or
in wedding ceremonies held as far as Dar es Salaam located 1,500 km from Bukoba. ‘Haya
wedding ceremony will not be perfect until guests are welcomed by a pack of this delicacy at
the entrance’, remarked a respondent. According to Haya traditions, a reception with a plate of
45
senene is a symbol of respect and acceptance to that family. Senene remains a protected snack,
not to be offered to any person but few esteemed individuals.
Eating raw senene was reported to be a prohibited act, whereby 92% of respondents had never
eaten these raw senene. Eating them raw was regarded unethical by most respondents who
associated it with stomachache (52%) and diarrhoea (48%). There is scientific evidence that raw
insects contain high microbial counts, thus consuming them raw can bring such complications
(Ssepuya et al., 2010). The remaining 8% of these respondents had eaten fresh-raw senene out
of greed though others appreciate the raw senene. A young male respondent said ‘senene are
just so delicious even when freshly raw’.
Respondents reported that as it was with many African taboos, women and children had
limitations towards senene consumption. Pregnant women were prohibited from eating senene
or else they would give birth to children with coned-head like that of senene. It was further
believed that giving senene to infants and young children would make them unable to speak for
the rest of their lives. This taboo is similar to that of the grasshopper clan of the Baganda in
Uganda where women are prohibited from eating senene though allowed to catch and cook for
their husbands (Agea et al., 2008). However, key informants invalidated the taboo by clarified
that the taboo was due to men’s selfishness and desire to have all senene prepared for them.
There was a widespread belief that marriages became stronger and happier during senene season
as women proudly collected and prepared them for their husbands and in return they got
rewarded with gifts such as kitenge, an esteemed traditional piece of cloth. Senene appendages,
ovipositor and wings are not generally consumed and were discarded far from the main houses
across the road junction, as a show off to neighbours. Some key informants explained the basis
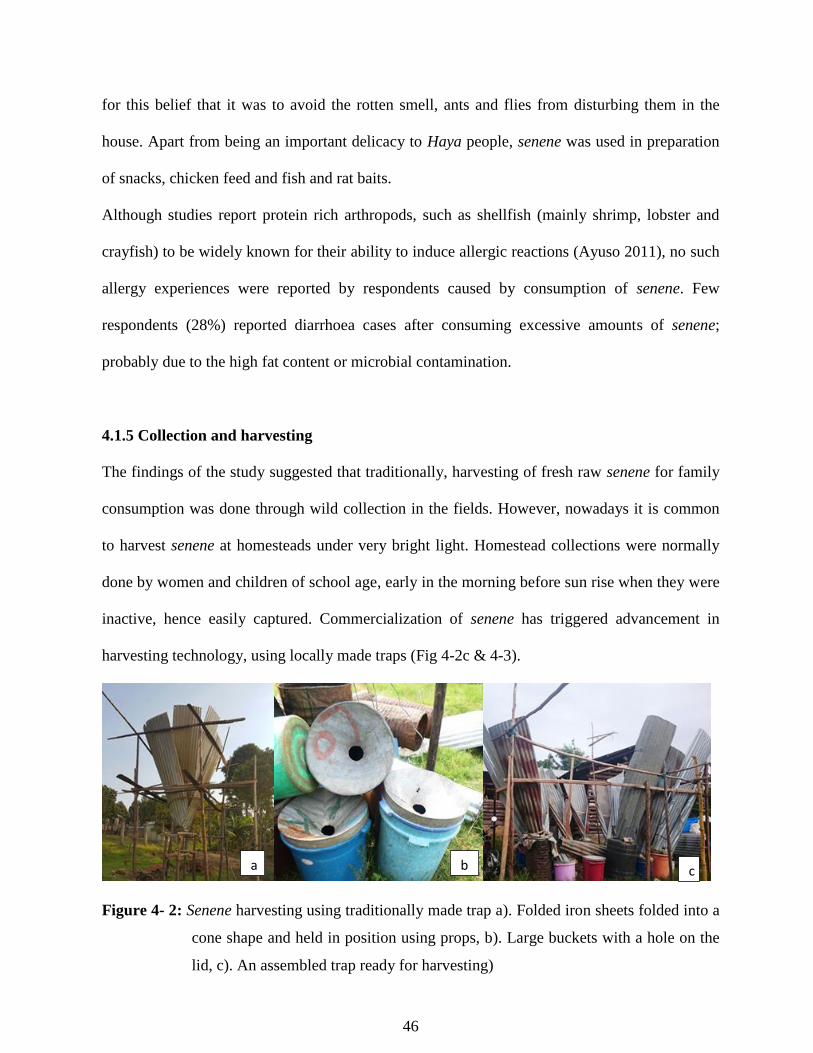
46
for this belief that it was to avoid the rotten smell, ants and flies from disturbing them in the
house. Apart from being an important delicacy to Haya people, senene was used in preparation
of snacks, chicken feed and fish and rat baits.
Although studies report protein rich arthropods, such as shellfish (mainly shrimp, lobster and
crayfish) to be widely known for their ability to induce allergic reactions (Ayuso 2011), no such
allergy experiences were reported by respondents caused by consumption of senene. Few
respondents (28%) reported diarrhoea cases after consuming excessive amounts of senene;
probably due to the high fat content or microbial contamination.
4.1.5 Collection and harvesting
The findings of the study suggested that traditionally, harvesting of fresh raw senene for family
consumption was done through wild collection in the fields. However, nowadays it is common
to harvest senene at homesteads under very bright light. Homestead collections were normally
done by women and children of school age, early in the morning before sun rise when they were
inactive, hence easily captured. Commercialization of senene has triggered advancement in
harvesting technology, using locally made traps (Fig 4-2c & 4-3).
Figure 4- 2: Senene harvesting using traditionally made trap a). Folded iron sheets folded into a
cone shape and held in position using props, b). Large buckets with a hole on the
lid, c). An assembled trap ready for harvesting)
a b c
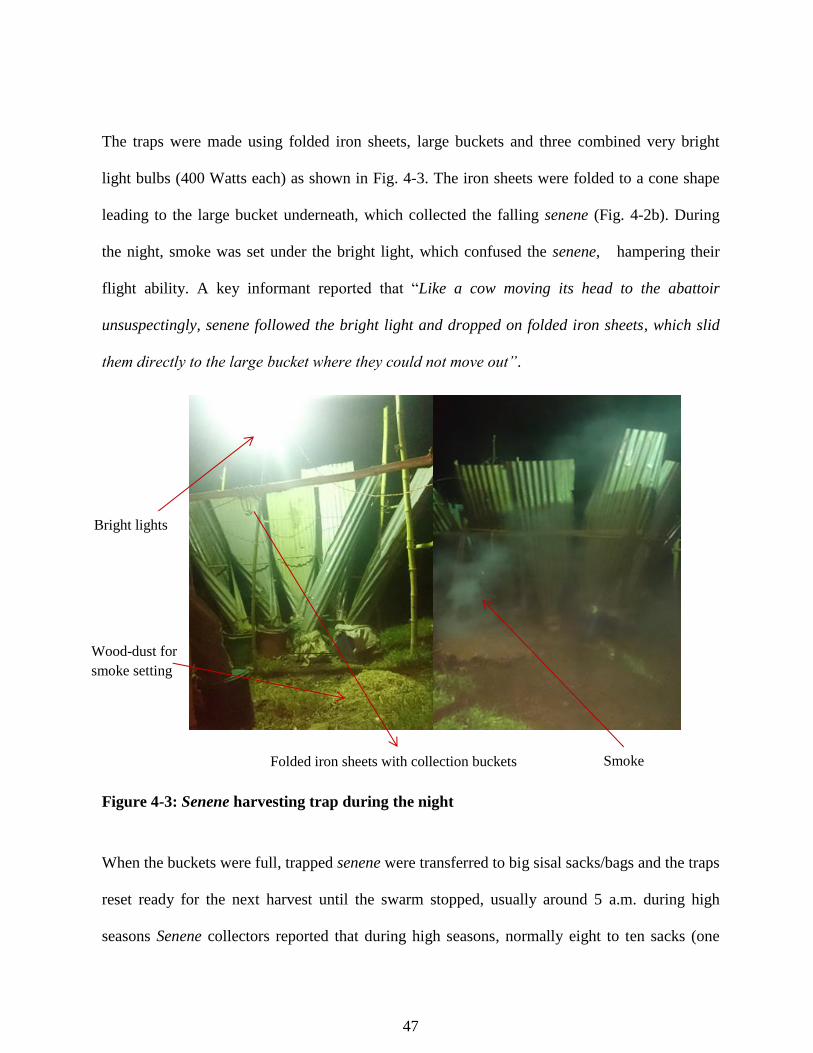
47
The traps were made using folded iron sheets, large buckets and three combined very bright
light bulbs (400 Watts each) as shown in Fig. 4-3. The iron sheets were folded to a cone shape
leading to the large bucket underneath, which collected the falling senene (Fig. 4-2b). During
the night, smoke was set under the bright light, which confused the senene, hampering their
flight ability. A key informant reported that “Like a cow moving its head to the abattoir
unsuspectingly, senene followed the bright light and dropped on folded iron sheets, which slid
them directly to the large bucket where they could not move out”.
Figure 4-3: Senene harvesting trap during the night
When the buckets were full, trapped senene were transferred to big sisal sacks/bags and the traps
reset ready for the next harvest until the swarm stopped, usually around 5 a.m. during high
seasons Senene collectors reported that during high seasons, normally eight to ten sacks (one
Bright lights
Folded iron sheets with collection buckets Smoke
Wood-dust for
smoke setting
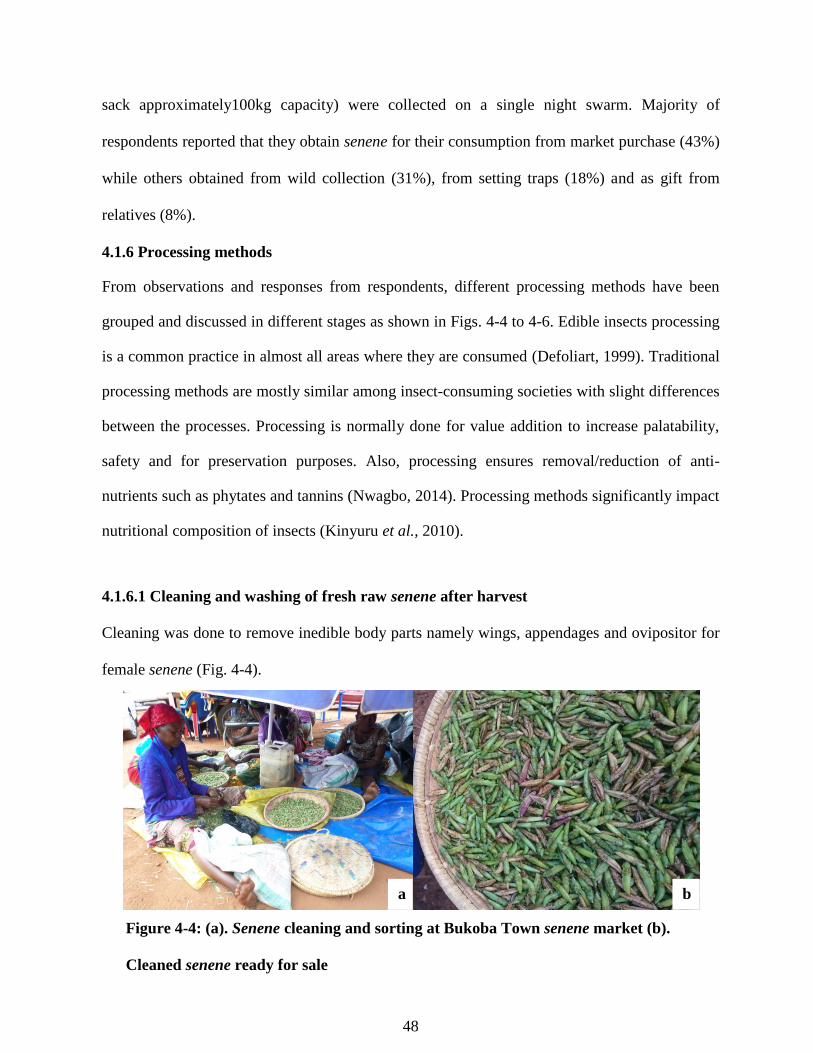
48
sack approximately100kg capacity) were collected on a single night swarm. Majority of
respondents reported that they obtain senene for their consumption from market purchase (43%)
while others obtained from wild collection (31%), from setting traps (18%) and as gift from
relatives (8%).
4.1.6 Processing methods
From observations and responses from respondents, different processing methods have been
grouped and discussed in different stages as shown in Figs. 4-4 to 4-6. Edible insects processing
is a common practice in almost all areas where they are consumed (Defoliart, 1999). Traditional
processing methods are mostly similar among insect-consuming societies with slight differences
between the processes. Processing is normally done for value addition to increase palatability,
safety and for preservation purposes. Also, processing ensures removal/reduction of anti-
nutrients such as phytates and tannins (Nwagbo, 2014). Processing methods significantly impact
nutritional composition of insects (Kinyuru et al., 2010).
4.1.6.1 Cleaning and washing of fresh raw senene after harvest
Cleaning was done to remove inedible body parts namely wings, appendages and ovipositor for
female senene (Fig. 4-4).
a.
b.
c.
Figure 4-4 Senene cleaning and sorting
Figure 4-4: (a). Senene cleaning and sorting at Bukoba Town senene market (b).
Cleaned senene ready for sale
a b
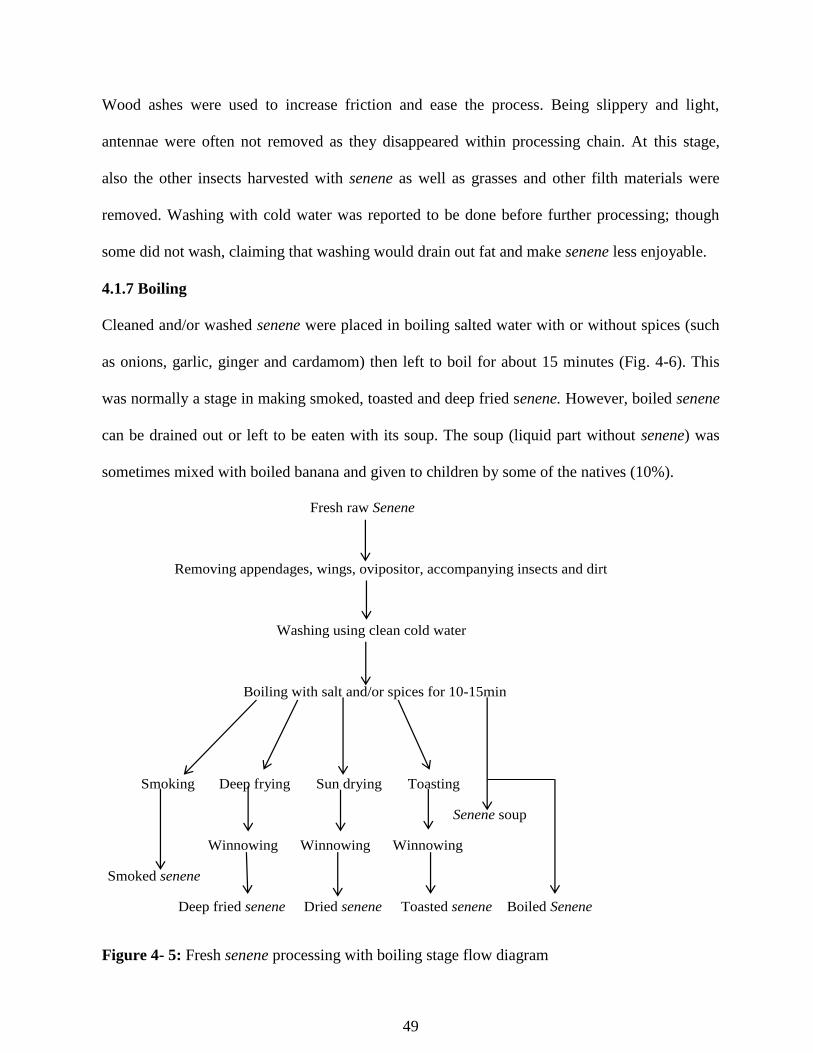
49
Wood ashes were used to increase friction and ease the process. Being slippery and light,
antennae were often not removed as they disappeared within processing chain. At this stage,
also the other insects harvested with senene as well as grasses and other filth materials were
removed. Washing with cold water was reported to be done before further processing; though
some did not wash, claiming that washing would drain out fat and make senene less enjoyable.
4.1.7 Boiling
Cleaned and/or washed senene were placed in boiling salted water with or without spices (such
as onions, garlic, ginger and cardamom) then left to boil for about 15 minutes (Fig. 4-6). This
was normally a stage in making smoked, toasted and deep fried senene. However, boiled senene
can be drained out or left to be eaten with its soup. The soup (liquid part without senene) was
sometimes mixed with boiled banana and given to children by some of the natives (10%).
Figure 4- 5: Fresh senene processing with boiling stage flow diagram
Fresh raw Senene
Removing appendages, wings, ovipositor, accompanying insects and dirt
Washing using clean cold water
Boiling with salt and/or spices for 10-15min
Smoking Deep frying Sun drying Toasting
Senene soup
Winnowing Winnowing Winnowing
Smoked senene
Deep fried senene Dried senene Toasted senene Boiled Senene
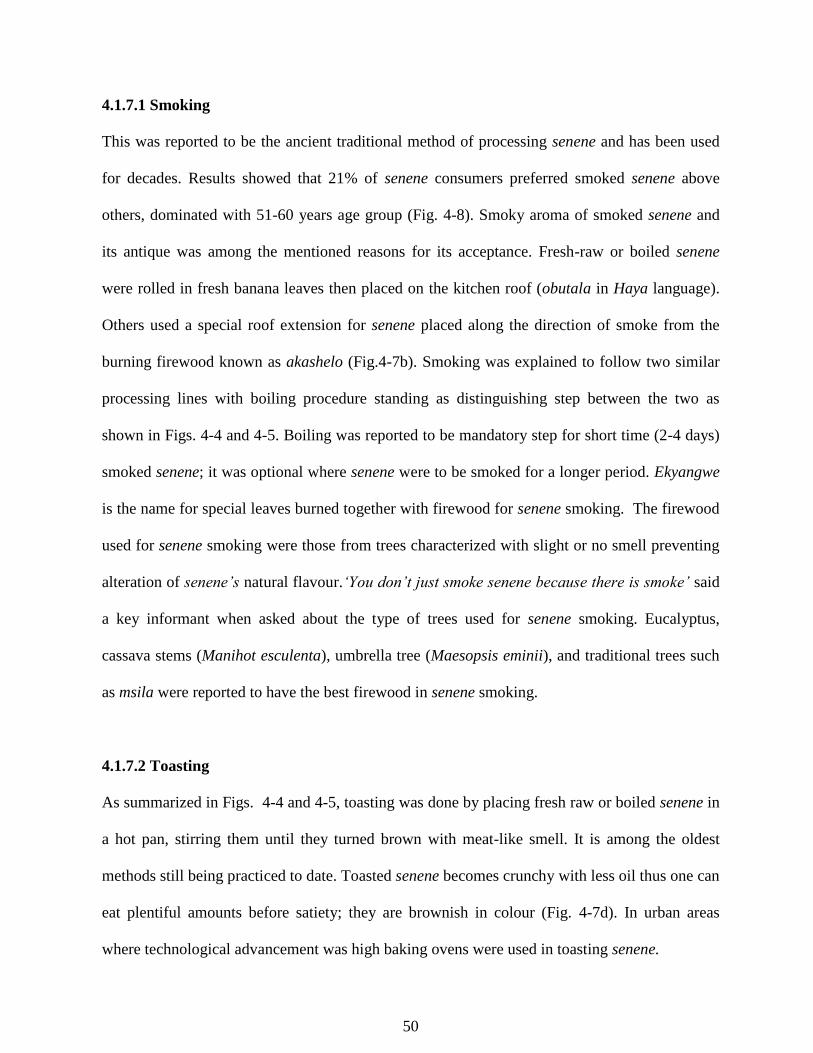
50
4.1.7.1 Smoking
This was reported to be the ancient traditional method of processing senene and has been used
for decades. Results showed that 21% of senene consumers preferred smoked senene above
others, dominated with 51-60 years age group (Fig. 4-8). Smoky aroma of smoked senene and
its antique was among the mentioned reasons for its acceptance. Fresh-raw or boiled senene
were rolled in fresh banana leaves then placed on the kitchen roof (obutala in Haya language).
Others used a special roof extension for senene placed along the direction of smoke from the
burning firewood known as akashelo (Fig.4-7b). Smoking was explained to follow two similar
processing lines with boiling procedure standing as distinguishing step between the two as
shown in Figs. 4-4 and 4-5. Boiling was reported to be mandatory step for short time (2-4 days)
smoked senene; it was optional where senene were to be smoked for a longer period. Ekyangwe
is the name for special leaves burned together with firewood for senene smoking. The firewood
used for senene smoking were those from trees characterized with slight or no smell preventing
alteration of senene’s natural flavour.‘You don’t just smoke senene because there is smoke’ said
a key informant when asked about the type of trees used for senene smoking. Eucalyptus,
cassava stems (Manihot esculenta), umbrella tree (Maesopsis eminii), and traditional trees such
as msila were reported to have the best firewood in senene smoking.
4.1.7.2 Toasting
As summarized in Figs. 4-4 and 4-5, toasting was done by placing fresh raw or boiled senene in
a hot pan, stirring them until they turned brown with meat-like smell. It is among the oldest
methods still being practiced to date. Toasted senene becomes crunchy with less oil thus one can
eat plentiful amounts before satiety; they are brownish in colour (Fig. 4-7d). In urban areas
where technological advancement was high baking ovens were used in toasting senene.
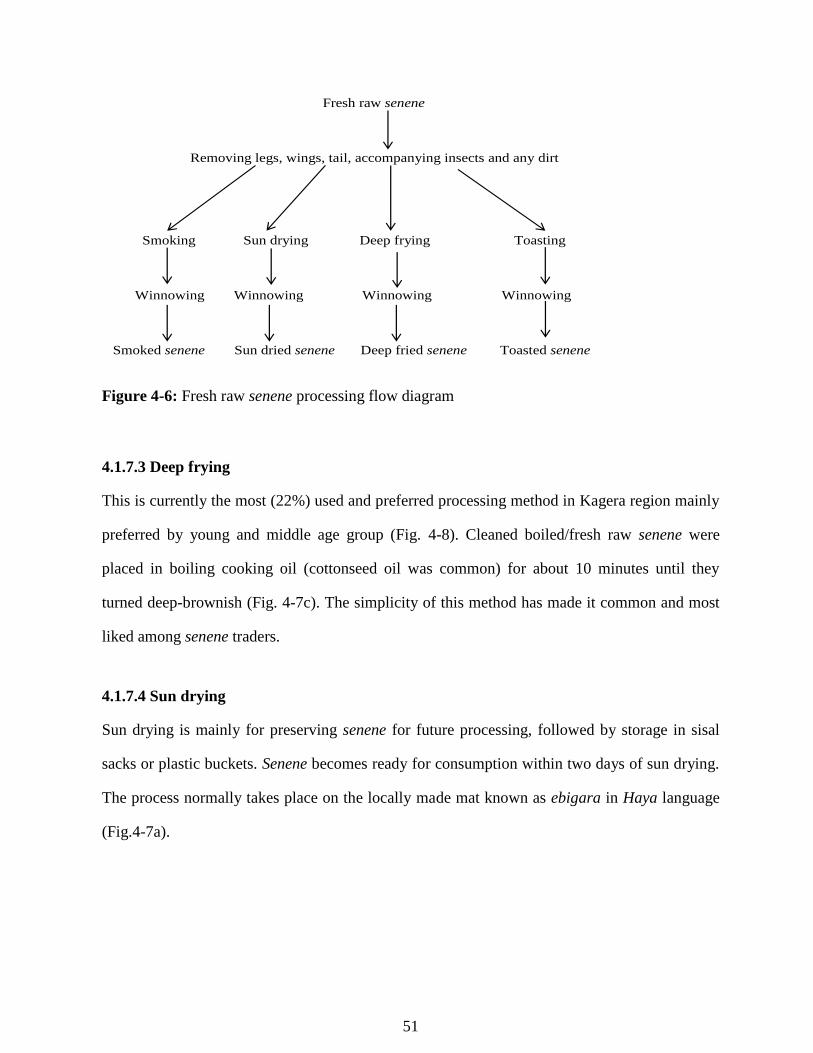
51
Figure 4-6: Fresh raw senene processing flow diagram
4.1.7.3 Deep frying
This is currently the most (22%) used and preferred processing method in Kagera region mainly
preferred by young and middle age group (Fig. 4-8). Cleaned boiled/fresh raw senene were
placed in boiling cooking oil (cottonseed oil was common) for about 10 minutes until they
turned deep-brownish (Fig. 4-7c). The simplicity of this method has made it common and most
liked among senene traders.
4.1.7.4 Sun drying
Sun drying is mainly for preserving senene for future processing, followed by storage in sisal
sacks or plastic buckets. Senene becomes ready for consumption within two days of sun drying.
The process normally takes place on the locally made mat known as ebigara in Haya language
(Fig.4-7a).
Fresh raw senene
Removing legs, wings, tail, accompanying insects and any dirt
Smoking Sun drying Deep frying Toasting
Winnowing Winnowing Winnowing Winnowing
Smoked senene Sun dried senene Deep fried senene Toasted senene
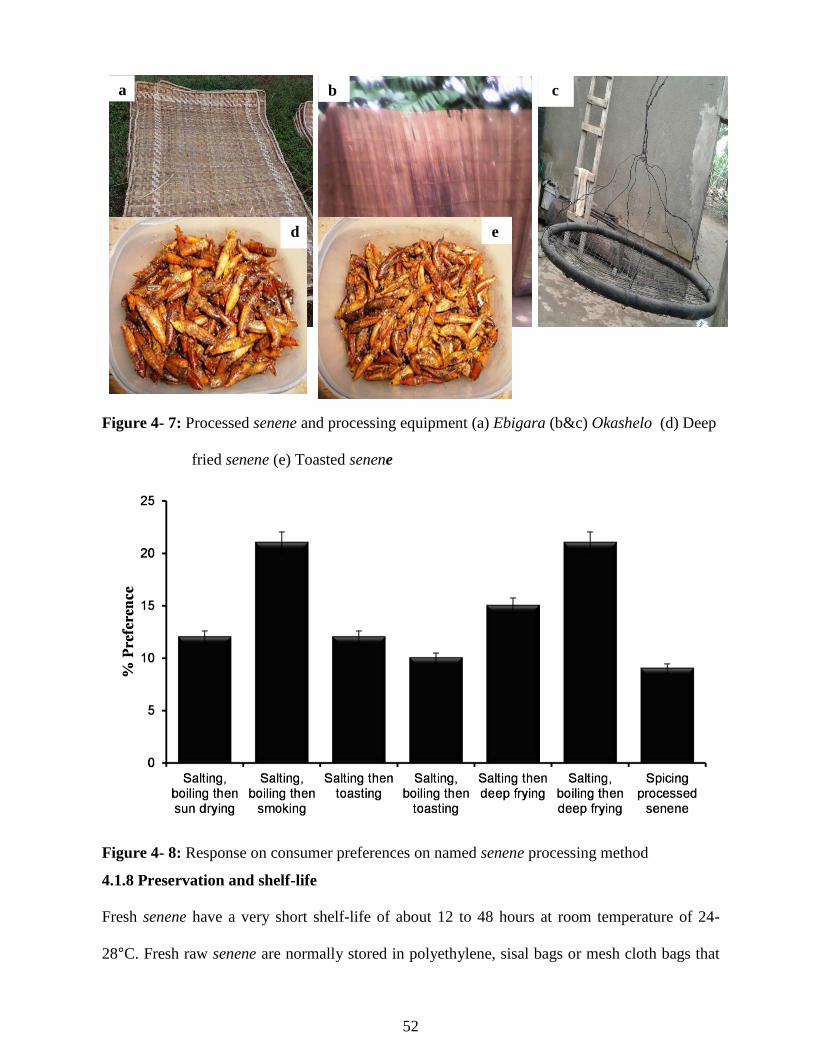
52
Figure 4- 7: Processed senene and processing equipment (a) Ebigara (b&c) Okashelo (d) Deep
fried senene (e) Toasted senene
Figure 4- 8: Response on consumer preferences on named senene processing method
4.1.8 Preservation and shelf-life
Fresh senene have a very short shelf-life of about 12 to 48 hours at room temperature of 24-
28°C. Fresh raw senene are normally stored in polyethylene, sisal bags or mesh cloth bags that
a b
d e
c
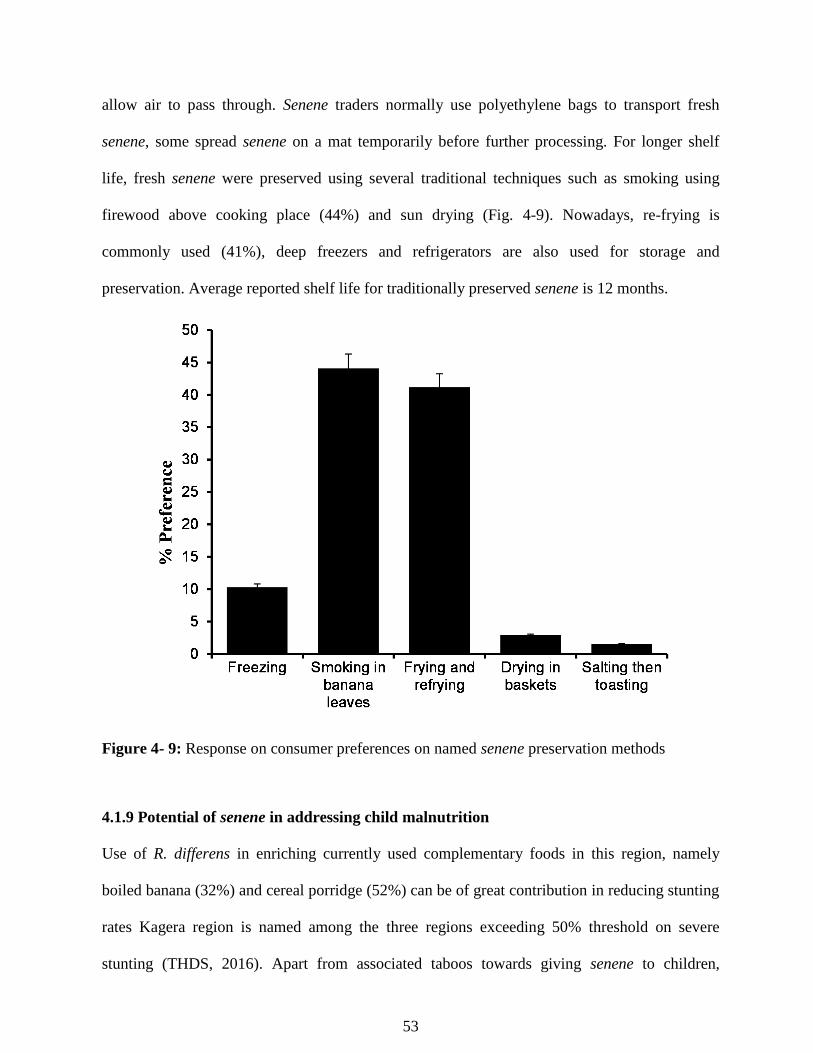
53
allow air to pass through. Senene traders normally use polyethylene bags to transport fresh
senene, some spread senene on a mat temporarily before further processing. For longer shelf
life, fresh senene were preserved using several traditional techniques such as smoking using
firewood above cooking place (44%) and sun drying (Fig. 4-9). Nowadays, re-frying is
commonly used (41%), deep freezers and refrigerators are also used for storage and
preservation. Average reported shelf life for traditionally preserved senene is 12 months.
Figure 4- 9: Response on consumer preferences on named senene preservation methods
4.1.9 Potential of senene in addressing child malnutrition
Use of R. differens in enriching currently used complementary foods in this region, namely
boiled banana (32%) and cereal porridge (52%) can be of great contribution in reducing stunting
rates Kagera region is named among the three regions exceeding 50% threshold on severe
stunting (THDS, 2016). Apart from associated taboos towards giving senene to children,
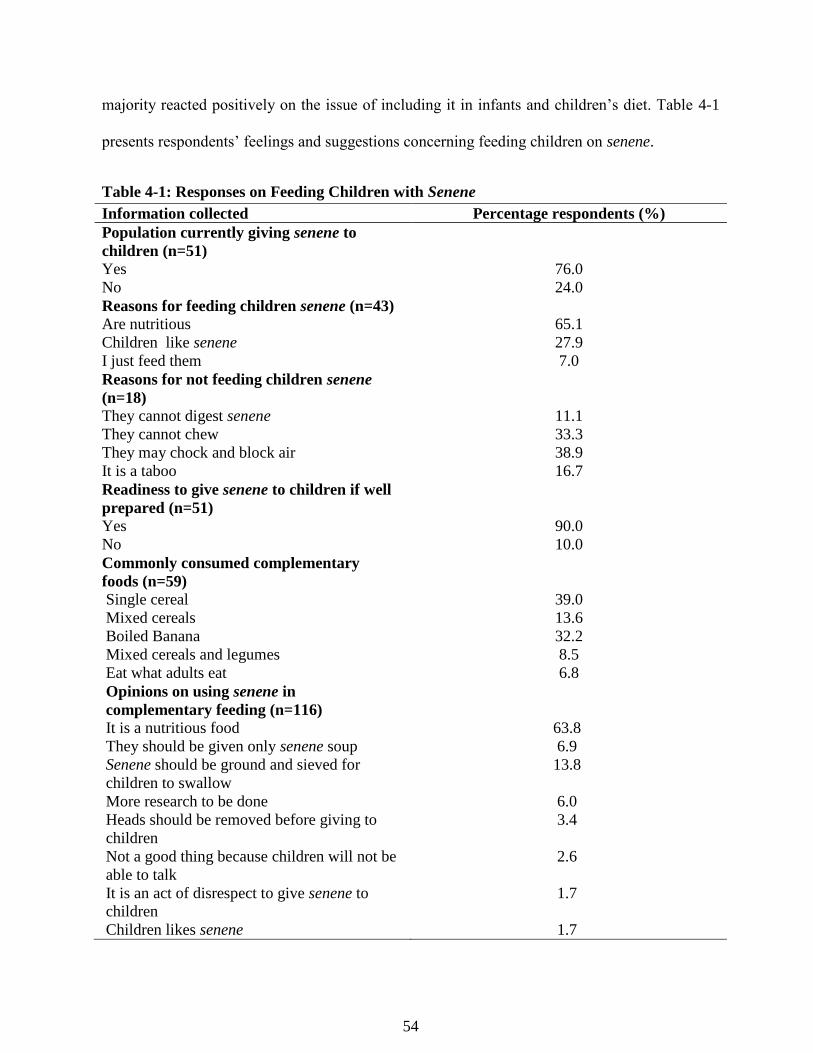
54
majority reacted positively on the issue of including it in infants and children’s diet. Table 4-1
presents respondents’ feelings and suggestions concerning feeding children on senene.
Table 4-1: Responses on Feeding Children with Senene
Information collected Percentage respondents (%)
Population currently giving senene to
children (n=51)
Yes 76.0
No 24.0
Reasons for feeding children senene (n=43)
Are nutritious
Children like senene
I just feed them
65.1
27.9
7.0
Reasons for not feeding children senene
(n=18)
They cannot digest senene
They cannot chew
They may chock and block air
It is a taboo
11.1
33.3
38.9
16.7
Readiness to give senene to children if well
prepared (n=51)
Yes
No
90.0
10.0
Commonly consumed complementary
foods (n=59)
Single cereal
Mixed cereals
Boiled Banana
Mixed cereals and legumes
Eat what adults eat
39.0
13.6
32.2
8.5
6.8
Opinions on using senene in
complementary feeding (n=116) It is a nutritious food
They should be given only senene soup
Senene should be ground and sieved for
children to swallow
More research to be done
Heads should be removed before giving to
children
Not a good thing because children will not be
able to talk
It is an act of disrespect to give senene to
children
Children likes senene
63.8
6.9
13.8
6.0
3.4
2.6
1.7
1.7
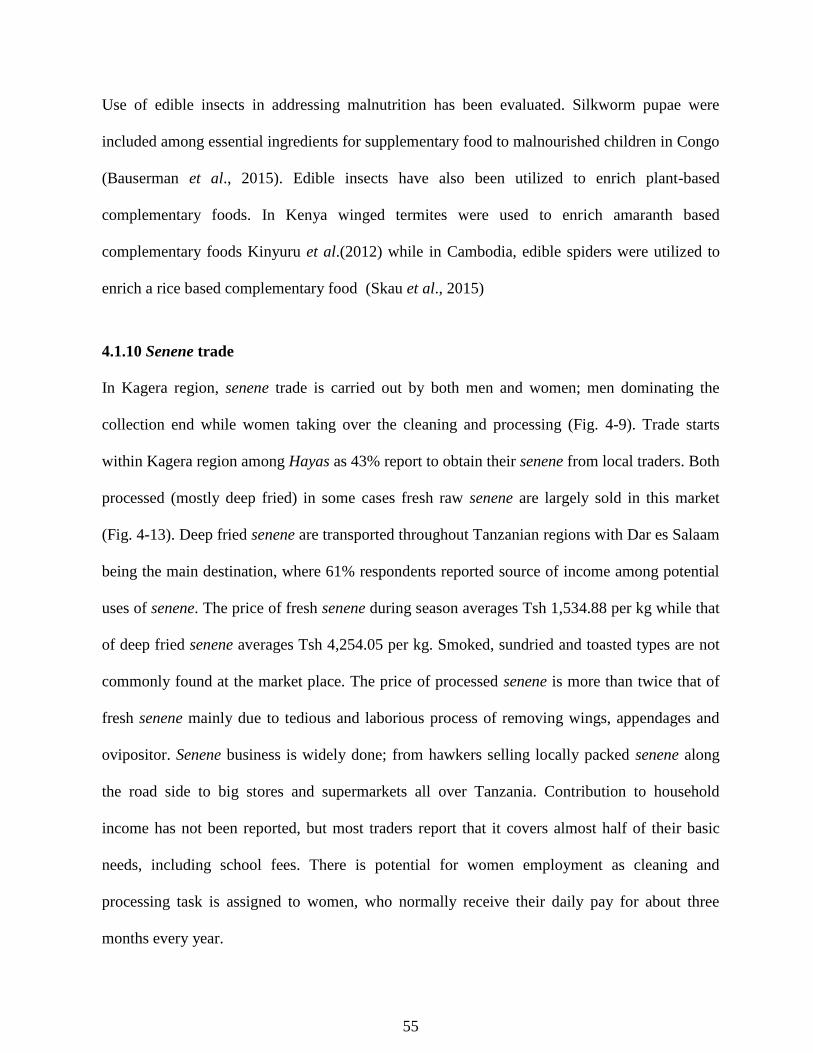
55
Use of edible insects in addressing malnutrition has been evaluated. Silkworm pupae were
included among essential ingredients for supplementary food to malnourished children in Congo
(Bauserman et al., 2015). Edible insects have also been utilized to enrich plant-based
complementary foods. In Kenya winged termites were used to enrich amaranth based
complementary foods Kinyuru et al.(2012) while in Cambodia, edible spiders were utilized to
enrich a rice based complementary food (Skau et al., 2015)
4.1.10 Senene trade
In Kagera region, senene trade is carried out by both men and women; men dominating the
collection end while women taking over the cleaning and processing (Fig. 4-9). Trade starts
within Kagera region among Hayas as 43% report to obtain their senene from local traders. Both
processed (mostly deep fried) in some cases fresh raw senene are largely sold in this market
(Fig. 4-13). Deep fried senene are transported throughout Tanzanian regions with Dar es Salaam
being the main destination, where 61% respondents reported source of income among potential
uses of senene. The price of fresh senene during season averages Tsh 1,534.88 per kg while that
of deep fried senene averages Tsh 4,254.05 per kg. Smoked, sundried and toasted types are not
commonly found at the market place. The price of processed senene is more than twice that of
fresh senene mainly due to tedious and laborious process of removing wings, appendages and
ovipositor. Senene business is widely done; from hawkers selling locally packed senene along
the road side to big stores and supermarkets all over Tanzania. Contribution to household
income has not been reported, but most traders report that it covers almost half of their basic
needs, including school fees. There is potential for women employment as cleaning and
processing task is assigned to women, who normally receive their daily pay for about three
months every year.
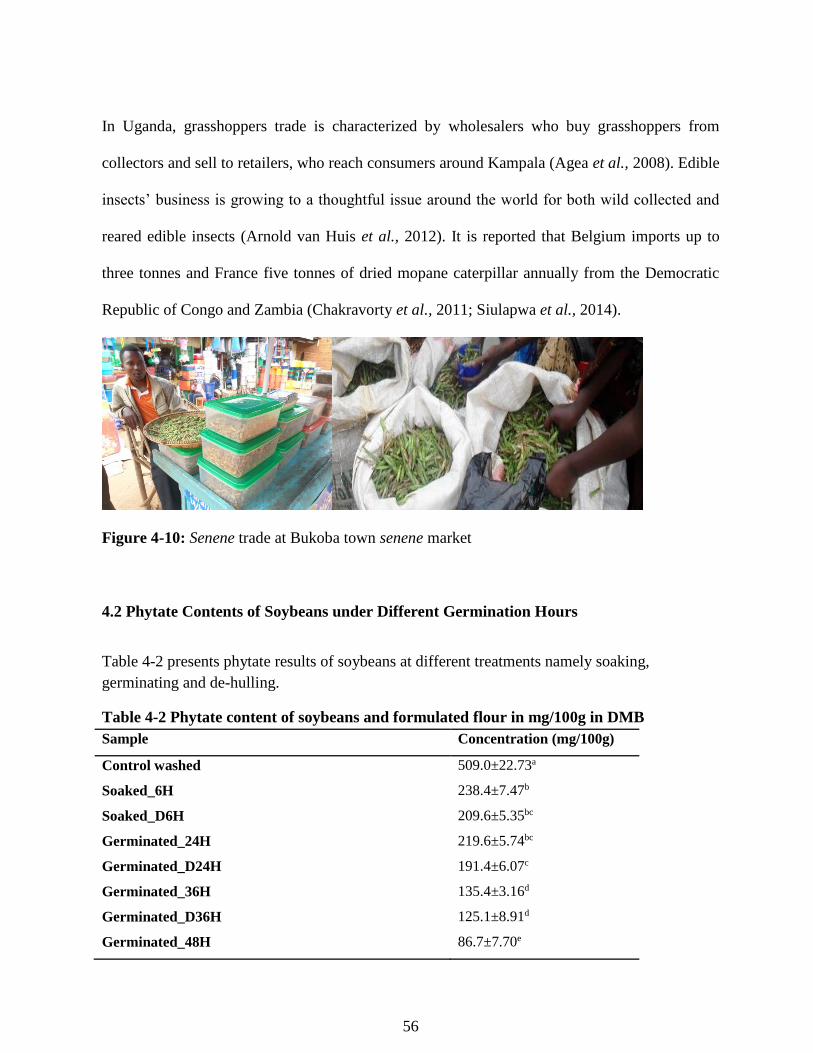
56
In Uganda, grasshoppers trade is characterized by wholesalers who buy grasshoppers from
collectors and sell to retailers, who reach consumers around Kampala (Agea et al., 2008). Edible
insects’ business is growing to a thoughtful issue around the world for both wild collected and
reared edible insects (Arnold van Huis et al., 2012). It is reported that Belgium imports up to
three tonnes and France five tonnes of dried mopane caterpillar annually from the Democratic
Republic of Congo and Zambia (Chakravorty et al., 2011; Siulapwa et al., 2014).
Figure 4-10: Senene trade at Bukoba town senene market
4.2 Phytate Contents of Soybeans under Different Germination Hours
Table 4-2 presents phytate results of soybeans at different treatments namely soaking,
germinating and de-hulling.
Table 4-2 Phytate content of soybeans and formulated flour in mg/100g in DMB
Sample Concentration (mg/100g)
Control washed 509.0±22.73a
Soaked_6H 238.4±7.47b
Soaked_D6H 209.6±5.35bc
Germinated_24H 219.6±5.74bc
Germinated_D24H 191.4±6.07c
Germinated_36H 135.4±3.16d
Germinated_D36H 125.1±8.91d
Germinated_48H 86.7±7.70e
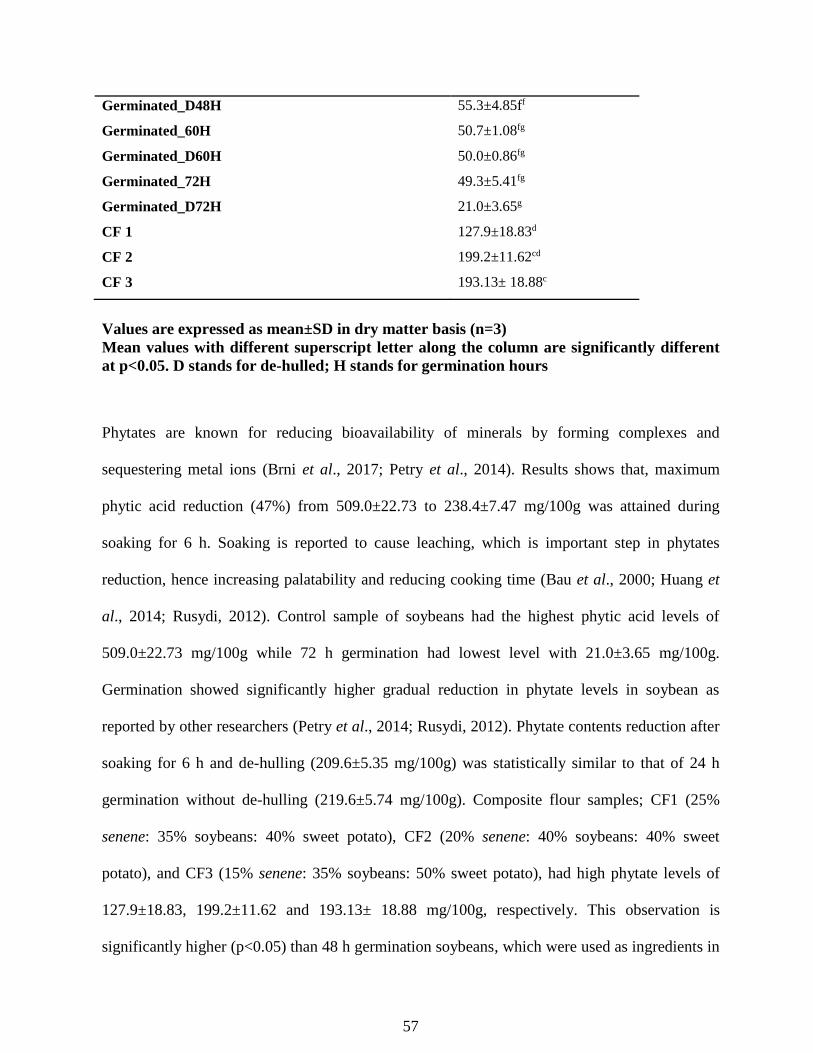
57
Germinated_D48H 55.3±4.85ff
Germinated_60H 50.7±1.08fg
Germinated_D60H 50.0±0.86fg
Germinated_72H 49.3±5.41fg
Germinated_D72H 21.0±3.65g
CF 1 127.9±18.83d
CF 2 199.2±11.62cd
CF 3 193.13± 18.88c
Values are expressed as mean±SD in dry matter basis (n=3)
Mean values with different superscript letter along the column are significantly different
at p<0.05. D stands for de-hulled; H stands for germination hours
Phytates are known for reducing bioavailability of minerals by forming complexes and
sequestering metal ions (Brni et al., 2017; Petry et al., 2014). Results shows that, maximum
phytic acid reduction (47%) from 509.0±22.73 to 238.4±7.47 mg/100g was attained during
soaking for 6 h. Soaking is reported to cause leaching, which is important step in phytates
reduction, hence increasing palatability and reducing cooking time (Bau et al., 2000; Huang et
al., 2014; Rusydi, 2012). Control sample of soybeans had the highest phytic acid levels of
509.0±22.73 mg/100g while 72 h germination had lowest level with 21.0±3.65 mg/100g.
Germination showed significantly higher gradual reduction in phytate levels in soybean as
reported by other researchers (Petry et al., 2014; Rusydi, 2012). Phytate contents reduction after
soaking for 6 h and de-hulling (209.6±5.35 mg/100g) was statistically similar to that of 24 h
germination without de-hulling (219.6±5.74 mg/100g). Composite flour samples; CF1 (25%
senene: 35% soybeans: 40% sweet potato), CF2 (20% senene: 40% soybeans: 40% sweet
potato), and CF3 (15% senene: 35% soybeans: 50% sweet potato), had high phytate levels of
127.9±18.83, 199.2±11.62 and 193.13± 18.88 mg/100g, respectively. This observation is
significantly higher (p<0.05) than 48 h germination soybeans, which were used as ingredients in
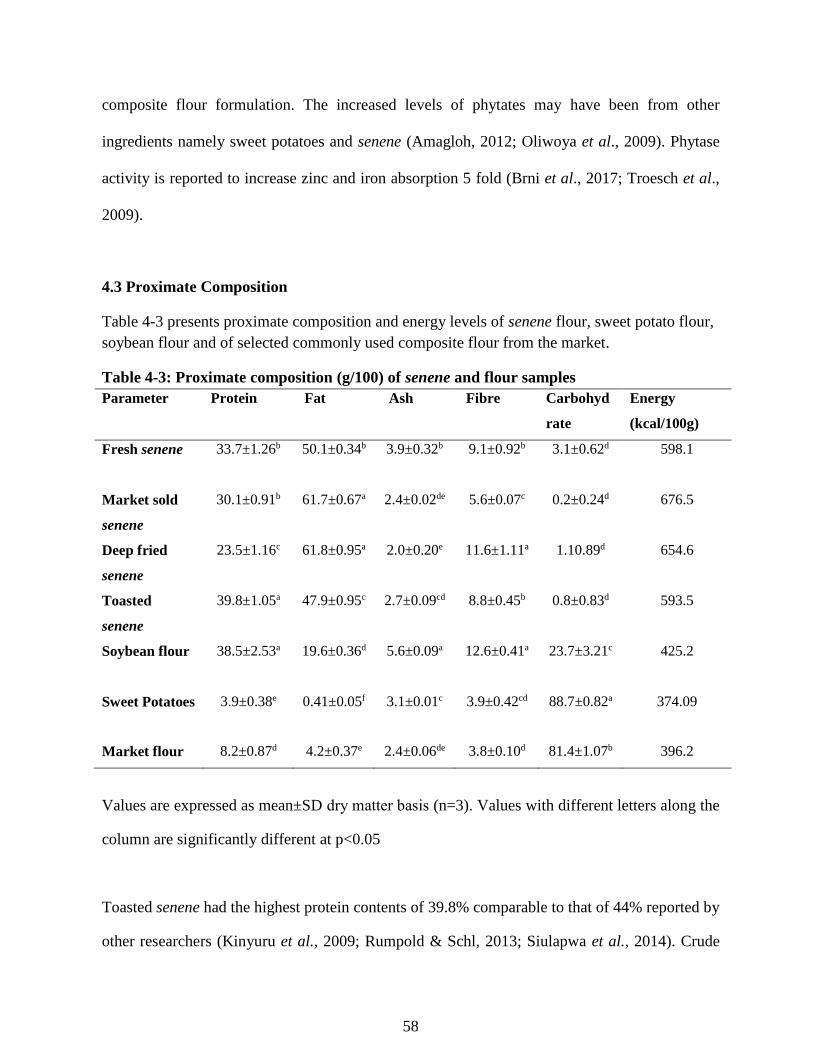
58
composite flour formulation. The increased levels of phytates may have been from other
ingredients namely sweet potatoes and senene (Amagloh, 2012; Oliwoya et al., 2009). Phytase
activity is reported to increase zinc and iron absorption 5 fold (Brni et al., 2017; Troesch et al.,
2009).
4.3 Proximate Composition
Table 4-3 presents proximate composition and energy levels of senene flour, sweet potato flour,
soybean flour and of selected commonly used composite flour from the market.
Table 4-3: Proximate composition (g/100) of senene and flour samples
Parameter Protein Fat Ash Fibre Carbohyd
rate
Energy
(kcal/100g)
Fresh senene 33.7±1.26b 50.1±0.34b 3.9±0.32b 9.1±0.92b 3.1±0.62d 598.1
Market sold
senene
30.1±0.91b 61.7±0.67a 2.4±0.02de 5.6±0.07c 0.2±0.24d 676.5
Deep fried
senene
23.5±1.16c 61.8±0.95a 2.0±0.20e 11.6±1.11a 1.10.89d 654.6
Toasted
senene
39.8±1.05a 47.9±0.95c 2.7±0.09cd 8.8±0.45b 0.8±0.83d 593.5
Soybean flour 38.5±2.53a 19.6±0.36d 5.6±0.09a 12.6±0.41a 23.7±3.21c 425.2
Sweet Potatoes 3.9±0.38e 0.41±0.05f 3.1±0.01c 3.9±0.42cd 88.7±0.82a 374.09
Market flour 8.2±0.87d 4.2±0.37e 2.4±0.06de 3.8±0.10d 81.4±1.07b 396.2
Values are expressed as mean±SD dry matter basis (n=3). Values with different letters along the
column are significantly different at p<0.05
Toasted senene had the highest protein contents of 39.8% comparable to that of 44% reported by
other researchers (Kinyuru et al., 2009; Rumpold & Schl, 2013; Siulapwa et al., 2014). Crude
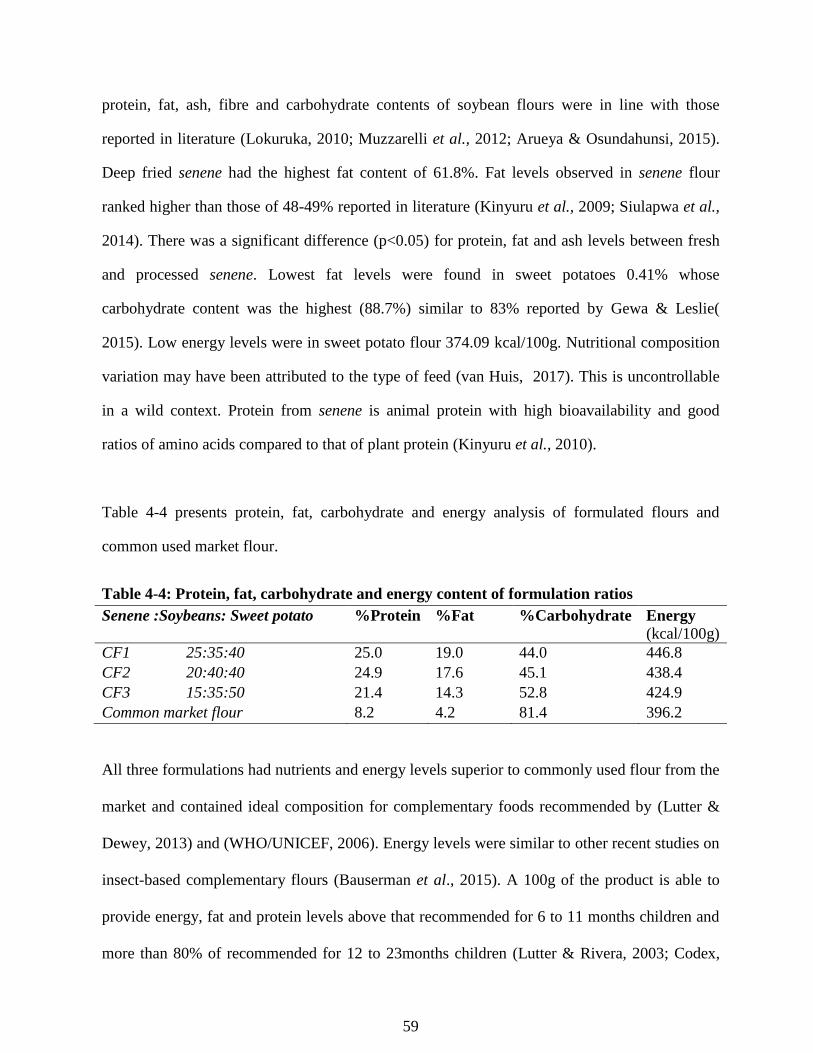
59
protein, fat, ash, fibre and carbohydrate contents of soybean flours were in line with those
reported in literature (Lokuruka, 2010; Muzzarelli et al., 2012; Arueya & Osundahunsi, 2015).
Deep fried senene had the highest fat content of 61.8%. Fat levels observed in senene flour
ranked higher than those of 48-49% reported in literature (Kinyuru et al., 2009; Siulapwa et al.,
2014). There was a significant difference (p<0.05) for protein, fat and ash levels between fresh
and processed senene. Lowest fat levels were found in sweet potatoes 0.41% whose
carbohydrate content was the highest (88.7%) similar to 83% reported by Gewa & Leslie(
2015). Low energy levels were in sweet potato flour 374.09 kcal/100g. Nutritional composition
variation may have been attributed to the type of feed (van Huis, 2017). This is uncontrollable
in a wild context. Protein from senene is animal protein with high bioavailability and good
ratios of amino acids compared to that of plant protein (Kinyuru et al., 2010).
Table 4-4 presents protein, fat, carbohydrate and energy analysis of formulated flours and
common used market flour.
Table 4-4: Protein, fat, carbohydrate and energy content of formulation ratios
Senene :Soybeans: Sweet potato %Protein %Fat %Carbohydrate Energy
(kcal/100g)
CF1 25:35:40 25.0 19.0 44.0 446.8
CF2 20:40:40 24.9 17.6 45.1 438.4
CF3 15:35:50 21.4 14.3 52.8 424.9
Common market flour 8.2 4.2 81.4 396.2
All three formulations had nutrients and energy levels superior to commonly used flour from the
market and contained ideal composition for complementary foods recommended by (Lutter &
Dewey, 2013) and (WHO/UNICEF, 2006). Energy levels were similar to other recent studies on
insect-based complementary flours (Bauserman et al., 2015). A 100g of the product is able to
provide energy, fat and protein levels above that recommended for 6 to 11 months children and
more than 80% of recommended for 12 to 23months children (Lutter & Rivera, 2003; Codex,
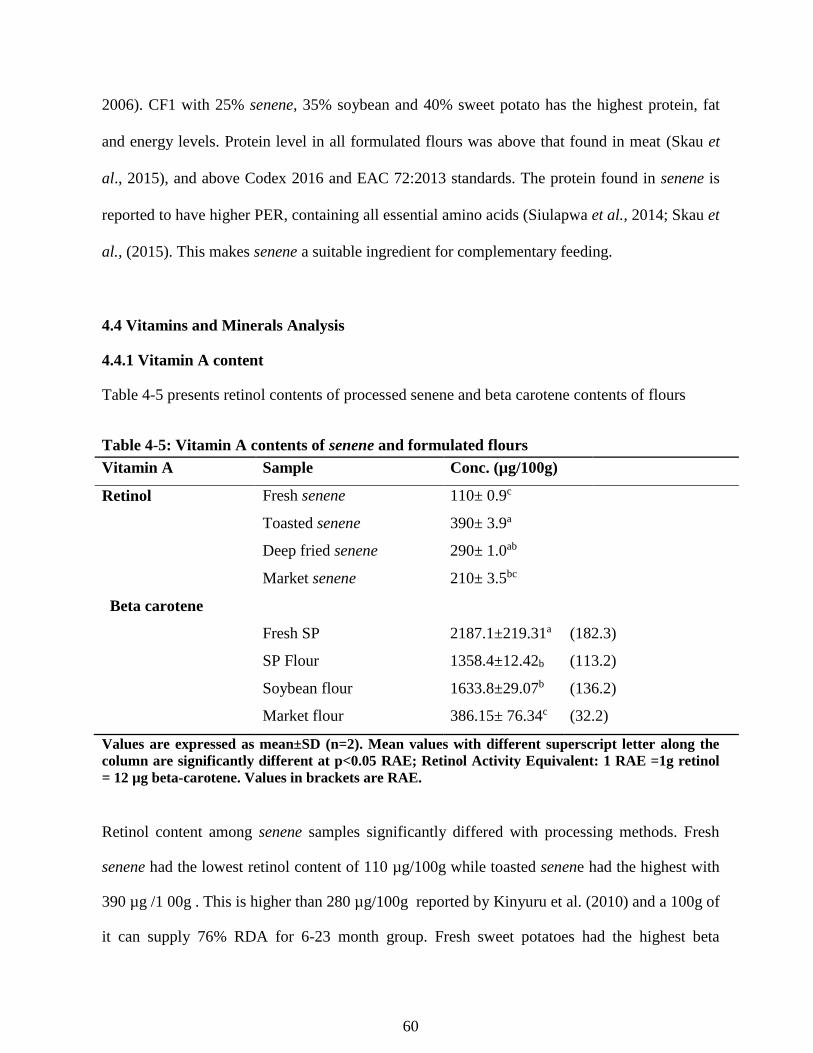
60
2006). CF1 with 25% senene, 35% soybean and 40% sweet potato has the highest protein, fat
and energy levels. Protein level in all formulated flours was above that found in meat (Skau et
al., 2015), and above Codex 2016 and EAC 72:2013 standards. The protein found in senene is
reported to have higher PER, containing all essential amino acids (Siulapwa et al., 2014; Skau et
al., (2015). This makes senene a suitable ingredient for complementary feeding.
4.4 Vitamins and Minerals Analysis
4.4.1 Vitamin A content
Table 4-5 presents retinol contents of processed senene and beta carotene contents of flours
Table 4-5: Vitamin A contents of senene and formulated flours
Vitamin A Sample Conc. (µg/100g)
Retinol Fresh senene 110± 0.9c
Toasted senene 390± 3.9a
Deep fried senene 290± 1.0ab
Market senene 210± 3.5bc
Beta carotene
Fresh SP 2187.1±219.31a (182.3)
SP Flour 1358.4±12.42b (113.2)
Soybean flour 1633.8±29.07b (136.2)
Market flour 386.15± 76.34c (32.2)
Values are expressed as mean±SD (n=2). Mean values with different superscript letter along the
column are significantly different at p<0.05 RAE; Retinol Activity Equivalent: 1 RAE =1g retinol
= 12 µg beta-carotene. Values in brackets are RAE.
Retinol content among senene samples significantly differed with processing methods. Fresh
senene had the lowest retinol content of 110 µg/100g while toasted senene had the highest with
390 µg /1 00g . This is higher than 280 µg/100g reported by Kinyuru et al. (2010) and a 100g of
it can supply 76% RDA for 6-23 month group. Fresh sweet potatoes had the highest beta
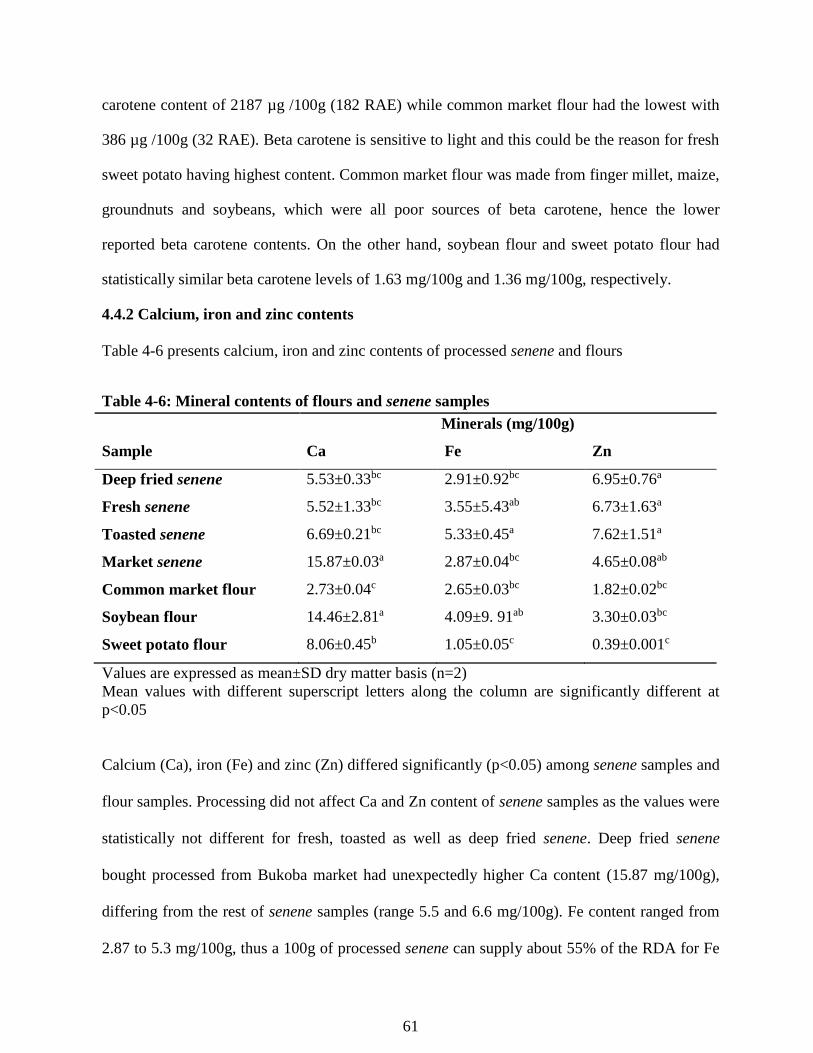
61
carotene content of 2187 µg /100g (182 RAE) while common market flour had the lowest with
386 µg /100g (32 RAE). Beta carotene is sensitive to light and this could be the reason for fresh
sweet potato having highest content. Common market flour was made from finger millet, maize,
groundnuts and soybeans, which were all poor sources of beta carotene, hence the lower
reported beta carotene contents. On the other hand, soybean flour and sweet potato flour had
statistically similar beta carotene levels of 1.63 mg/100g and 1.36 mg/100g, respectively.
4.4.2 Calcium, iron and zinc contents
Table 4-6 presents calcium, iron and zinc contents of processed senene and flours
Table 4-6: Mineral contents of flours and senene samples
Minerals (mg/100g)
Sample Ca Fe Zn
Deep fried senene 5.53±0.33bc 2.91±0.92bc 6.95±0.76a
Fresh senene 5.52±1.33bc 3.55±5.43ab 6.73±1.63a
Toasted senene 6.69±0.21bc 5.33±0.45a 7.62±1.51a
Market senene 15.87±0.03a 2.87±0.04bc 4.65±0.08ab
Common market flour 2.73±0.04c 2.65±0.03bc 1.82±0.02bc
Soybean flour 14.46±2.81a 4.09±9. 91ab 3.30±0.03bc
Sweet potato flour 8.06±0.45b 1.05±0.05c 0.39±0.001c
Values are expressed as mean±SD dry matter basis (n=2)
Mean values with different superscript letters along the column are significantly different at
p<0.05
Calcium (Ca), iron (Fe) and zinc (Zn) differed significantly (p<0.05) among senene samples and
flour samples. Processing did not affect Ca and Zn content of senene samples as the values were
statistically not different for fresh, toasted as well as deep fried senene. Deep fried senene
bought processed from Bukoba market had unexpectedly higher Ca content (15.87 mg/100g),
differing from the rest of senene samples (range 5.5 and 6.6 mg/100g). Fe content ranged from
2.87 to 5.3 mg/100g, thus a 100g of processed senene can supply about 55% of the RDA for Fe
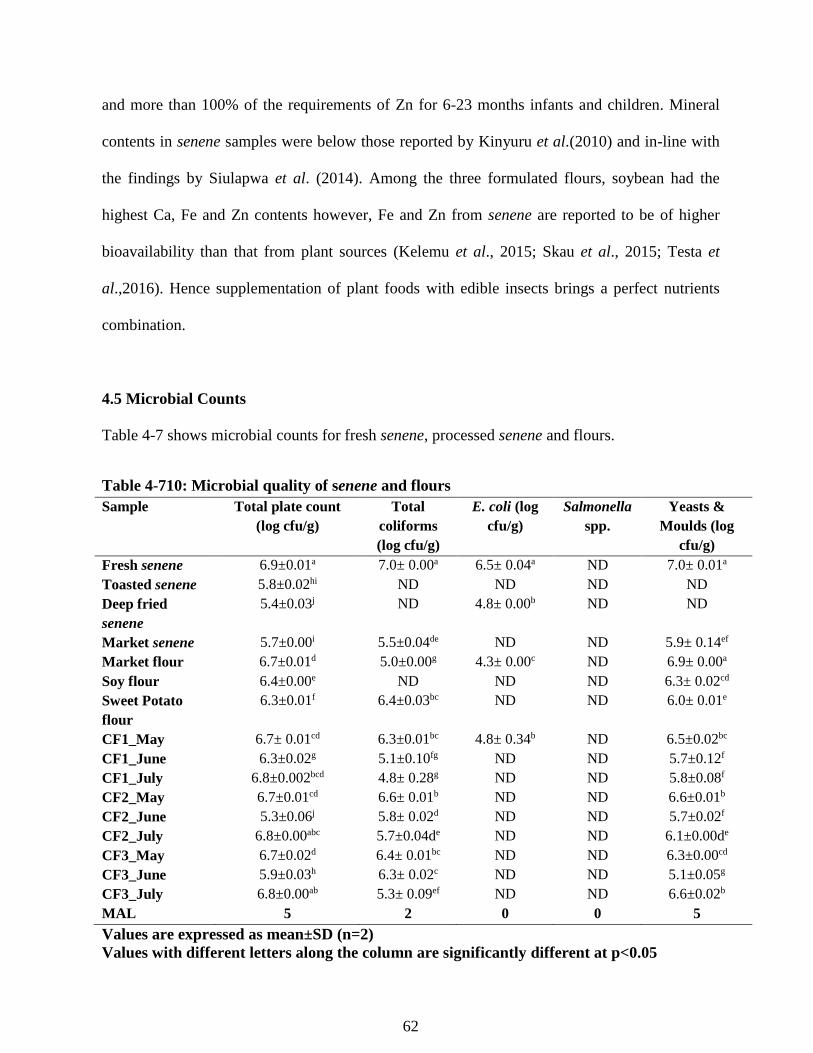
62
and more than 100% of the requirements of Zn for 6-23 months infants and children. Mineral
contents in senene samples were below those reported by Kinyuru et al.(2010) and in-line with
the findings by Siulapwa et al. (2014). Among the three formulated flours, soybean had the
highest Ca, Fe and Zn contents however, Fe and Zn from senene are reported to be of higher
bioavailability than that from plant sources (Kelemu et al., 2015; Skau et al., 2015; Testa et
al.,2016). Hence supplementation of plant foods with edible insects brings a perfect nutrients
combination.
4.5 Microbial Counts
Table 4-7 shows microbial counts for fresh senene, processed senene and flours.
Table 4-710: Microbial quality of senene and flours
Sample Total plate count
(log cfu/g)
Total
coliforms
(log cfu/g)
E. coli (log
cfu/g)
Salmonella
spp.
Yeasts &
Moulds (log
cfu/g)
Fresh senene 6.9±0.01a 7.0± 0.00a 6.5± 0.04a ND 7.0± 0.01a
Toasted senene 5.8±0.02hi ND ND ND ND
Deep fried
senene
5.4±0.03j
ND 4.8± 0.00b ND ND
Market senene 5.7±0.00i 5.5±0.04de ND ND 5.9± 0.14ef
Market flour 6.7±0.01d 5.0±0.00g 4.3± 0.00c ND 6.9± 0.00a
Soy flour 6.4±0.00e ND ND ND 6.3± 0.02cd
Sweet Potato
flour
6.3±0.01f 6.4±0.03bc ND ND 6.0± 0.01e
CF1_May 6.7± 0.01cd 6.3±0.01bc 4.8± 0.34b ND 6.5±0.02bc
CF1_June 6.3±0.02g 5.1±0.10fg ND ND 5.7±0.12f
CF1_July 6.8±0.002bcd 4.8± 0.28g ND ND 5.8±0.08f
CF2_May 6.7±0.01cd 6.6± 0.01b ND ND 6.6±0.01b
CF2_June 5.3±0.06j 5.8± 0.02d ND ND 5.7±0.02f
CF2_July 6.8±0.00abc 5.7±0.04de ND ND 6.1±0.00de
CF3_May 6.7±0.02d 6.4± 0.01bc ND ND 6.3±0.00cd
CF3_June 5.9±0.03h 6.3± 0.02c ND ND 5.1±0.05g
CF3_July 6.8±0.00ab 5.3± 0.09ef ND ND 6.6±0.02b
MAL 5 2 0 0 5
Values are expressed as mean±SD (n=2)
Values with different letters along the column are significantly different at p<0.05
63
ND means not detected. MAL means maximum allowable limit (Codex, 2006; KEBS, 2008;
EAS 72:2013).Months after formulations shows storage months during shelf life studies.
Microbial counts were significantly higher for fresh senene (6.5log cfu/g) than for processed
senene and formulated flours. The findings agree with other researchers explaining that raw
edible insects are known to have high microbial counts. Up to 8.6log cfu/g has been reported in
raw grasshopper (Klunder et al., 2012; Stoops, et al., 2016). Fresh senene had the highest
coliform count, which may have been caused by crushing during sample preparation that
allowed release of microbiota from intestine. Coliforms were not detected in toasted senene and
deep fried senene, showing that treatment with heat during their preparation had the ability to
eliminate a large number as also suggested by Grabowski and Klein (2017). Although currently,
specific microbiological criteria for edible insects are not settled, Belgium (FASFC, 2014), and
the Netherlands (Bureau Risicobeoordeling en Onderzoeksprogrammering, 2014) have
recommended microbiological criteria containing process hygiene and food safety criteria for
edible insects. In this concern, fresh senene counts met the <6.7 log cfu/g standard of the
Belgium’s food safety aspects of insects intended for human consumption (FASFC, 2014).
Sweet potato flour microbial counts of 6.45 log cfu/g may have been a result of contamination
during milling as community hammer mill was used. All formulated flour samples were within
maximum allowable limits for complementary foods. Preparation of porridges involves boiling
for up to 20 min., time, which a good number of detected coliforms is expected to have been
destroyed. E. coli (6.25 and 4.3log cfu/g) was detected in fresh senene and common market
flours, respectively, that was higher than the <1 requirement by Codex, (2006); Belgium
(FASFC, 2014) and Netherlands. Processed senene and flour samples were free from E. coli
contamination signifying no faecal contamination. Confirmation results showed that the E .coli
found in fresh senene was not the virulent type. All samples were free from Salmonella spp
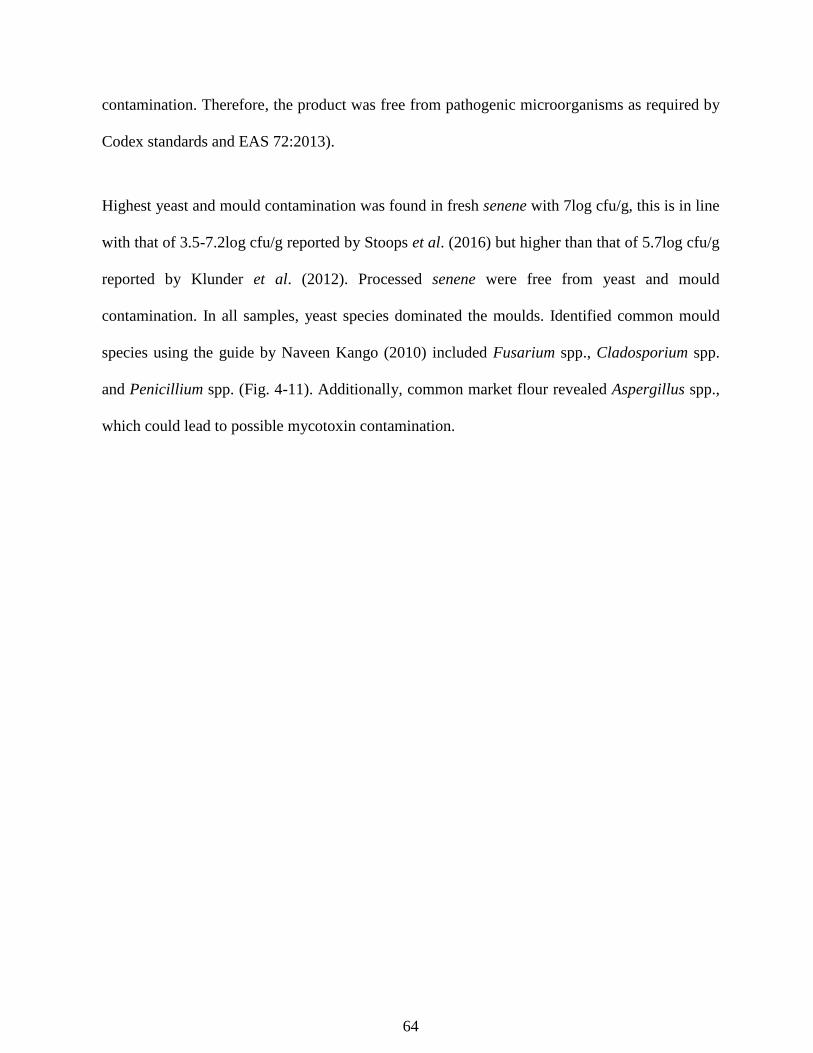
64
contamination. Therefore, the product was free from pathogenic microorganisms as required by
Codex standards and EAS 72:2013).
Highest yeast and mould contamination was found in fresh senene with 7log cfu/g, this is in line
with that of 3.5-7.2log cfu/g reported by Stoops et al. (2016) but higher than that of 5.7log cfu/g
reported by Klunder et al. (2012). Processed senene were free from yeast and mould
contamination. In all samples, yeast species dominated the moulds. Identified common mould
species using the guide by Naveen Kango (2010) included Fusarium spp., Cladosporium spp.
and Penicillium spp. (Fig. 4-11). Additionally, common market flour revealed Aspergillus spp.,
which could lead to possible mycotoxin contamination.
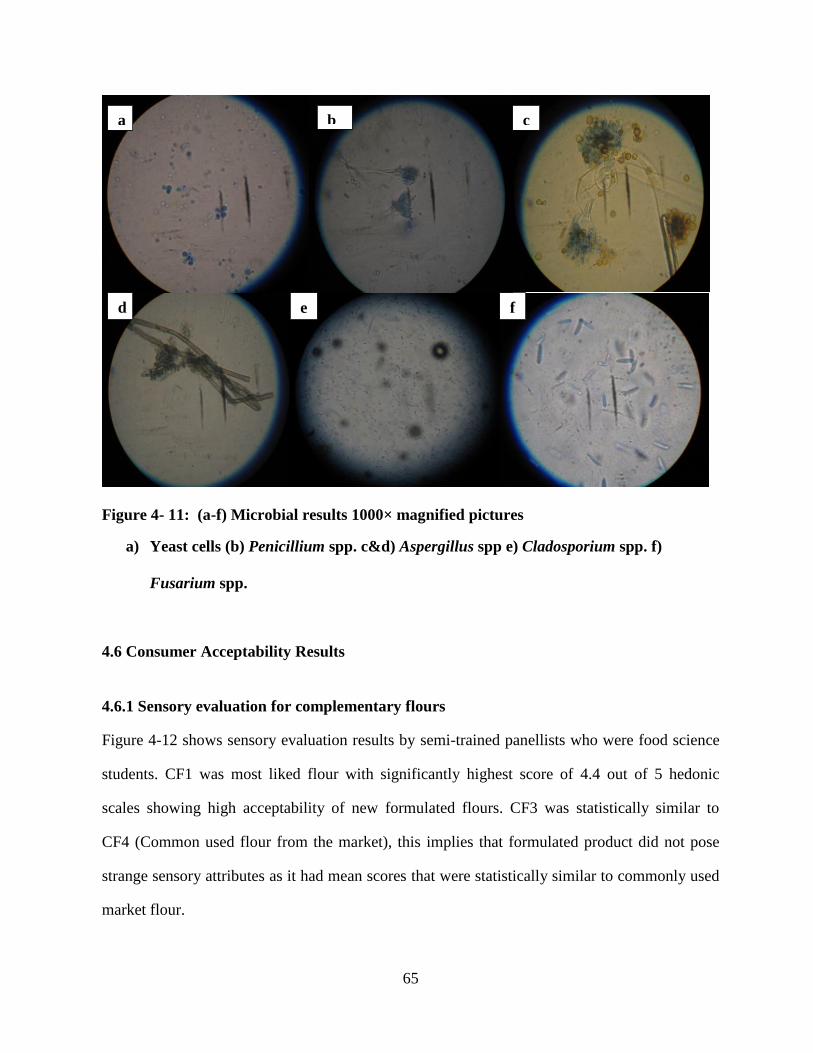
65
Figure 4- 11: (a-f) Microbial results 1000× magnified pictures
a) Yeast cells (b) Penicillium spp. c&d) Aspergillus spp e) Cladosporium spp. f)
Fusarium spp.
4.6 Consumer Acceptability Results
4.6.1 Sensory evaluation for complementary flours
Figure 4-12 shows sensory evaluation results by semi-trained panellists who were food science
students. CF1 was most liked flour with significantly highest score of 4.4 out of 5 hedonic
scales showing high acceptability of new formulated flours. CF3 was statistically similar to
CF4 (Common used flour from the market), this implies that formulated product did not pose
strange sensory attributes as it had mean scores that were statistically similar to commonly used
market flour.
b
a b c
d e f
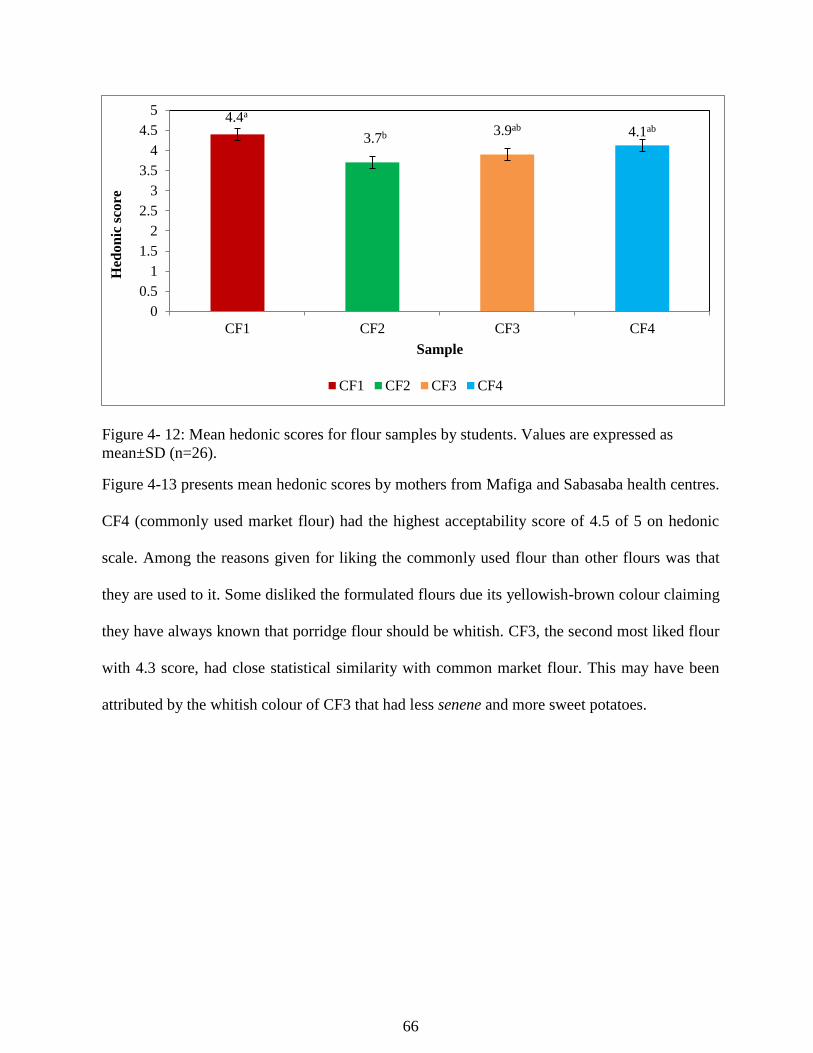
66
Figure 4- 12: Mean hedonic scores for flour samples by students. Values are expressed as
mean±SD (n=26).
Figure 4-13 presents mean hedonic scores by mothers from Mafiga and Sabasaba health centres.
CF4 (commonly used market flour) had the highest acceptability score of 4.5 of 5 on hedonic
scale. Among the reasons given for liking the commonly used flour than other flours was that
they are used to it. Some disliked the formulated flours due its yellowish-brown colour claiming
they have always known that porridge flour should be whitish. CF3, the second most liked flour
with 4.3 score, had close statistical similarity with common market flour. This may have been
attributed by the whitish colour of CF3 that had less senene and more sweet potatoes.
4.4a
3.7b 3.9ab 4.1ab
0
0.5
1
1.5
2
2.5
3
3.5
4
4.5
5
CF1 CF2 CF3 CF4
Hed
on
ic s
co
re
Sample
CF1 CF2 CF3 CF4
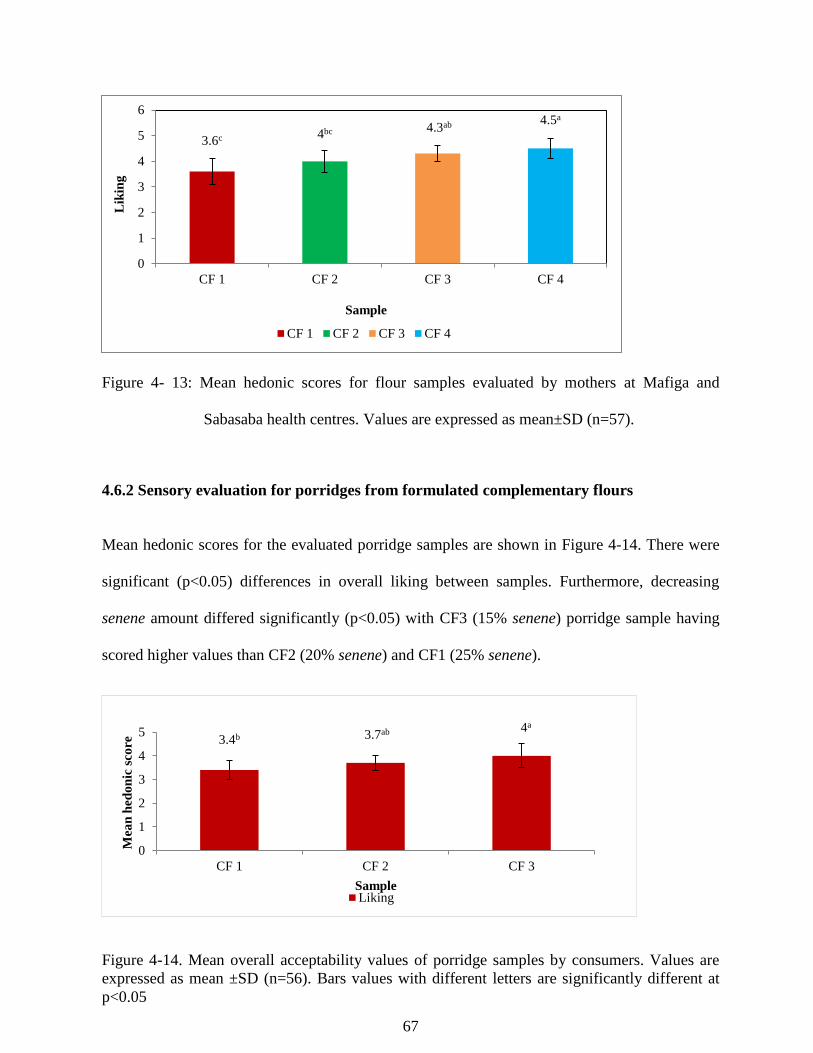
67
Figure 4- 13: Mean hedonic scores for flour samples evaluated by mothers at Mafiga and
Sabasaba health centres. Values are expressed as mean±SD (n=57).
4.6.2 Sensory evaluation for porridges from formulated complementary flours
Mean hedonic scores for the evaluated porridge samples are shown in Figure 4-14. There were
significant (p<0.05) differences in overall liking between samples. Furthermore, decreasing
senene amount differed significantly (p<0.05) with CF3 (15% senene) porridge sample having
scored higher values than CF2 (20% senene) and CF1 (25% senene).
Figure 4-14. Mean overall acceptability values of porridge samples by consumers. Values are
expressed as mean ±SD (n=56). Bars values with different letters are significantly different at
p<0.05
3.6c 4bc 4.3ab 4.5a
0
1
2
3
4
5
6
CF 1 CF 2 CF 3 CF 4
Lik
ing
Sample
CF 1 CF 2 CF 3 CF 4
3.4b 3.7ab 4a
0
1
2
3
4
5
CF 1 CF 2 CF 3
Mea
n h
edo
nic
sco
re
Sample Liking
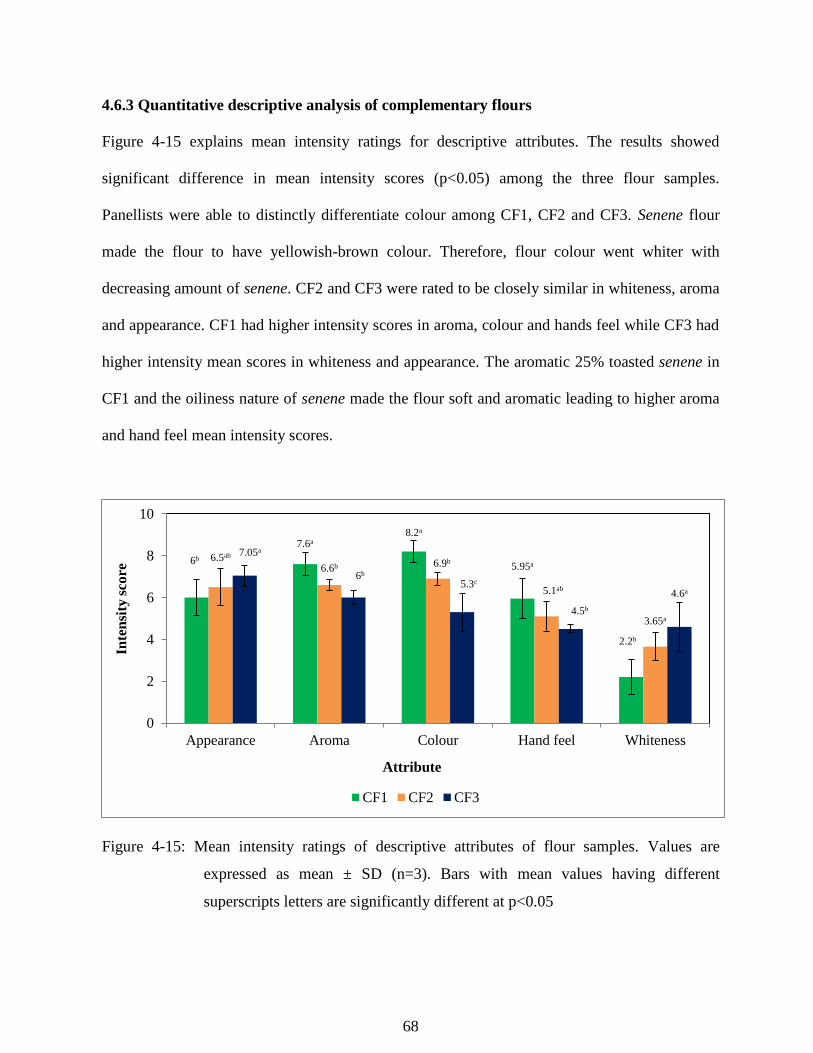
68
4.6.3 Quantitative descriptive analysis of complementary flours
Figure 4-15 explains mean intensity ratings for descriptive attributes. The results showed
significant difference in mean intensity scores (p<0.05) among the three flour samples.
Panellists were able to distinctly differentiate colour among CF1, CF2 and CF3. Senene flour
made the flour to have yellowish-brown colour. Therefore, flour colour went whiter with
decreasing amount of senene. CF2 and CF3 were rated to be closely similar in whiteness, aroma
and appearance. CF1 had higher intensity scores in aroma, colour and hands feel while CF3 had
higher intensity mean scores in whiteness and appearance. The aromatic 25% toasted senene in
CF1 and the oiliness nature of senene made the flour soft and aromatic leading to higher aroma
and hand feel mean intensity scores.
Figure 4-15: Mean intensity ratings of descriptive attributes of flour samples. Values are
expressed as mean ± SD (n=3). Bars with mean values having different
superscripts letters are significantly different at p<0.05
6b
7.6a8.2a
5.95a
2.2b
6.5ab
6.6b 6.9b
5.1ab
3.65a
7.05a
6b
5.3c
4.5b
4.6a
0
2
4
6
8
10
Appearance Aroma Colour Hand feel Whiteness
Inte
nsi
ty s
core
Attribute
CF1 CF2 CF3
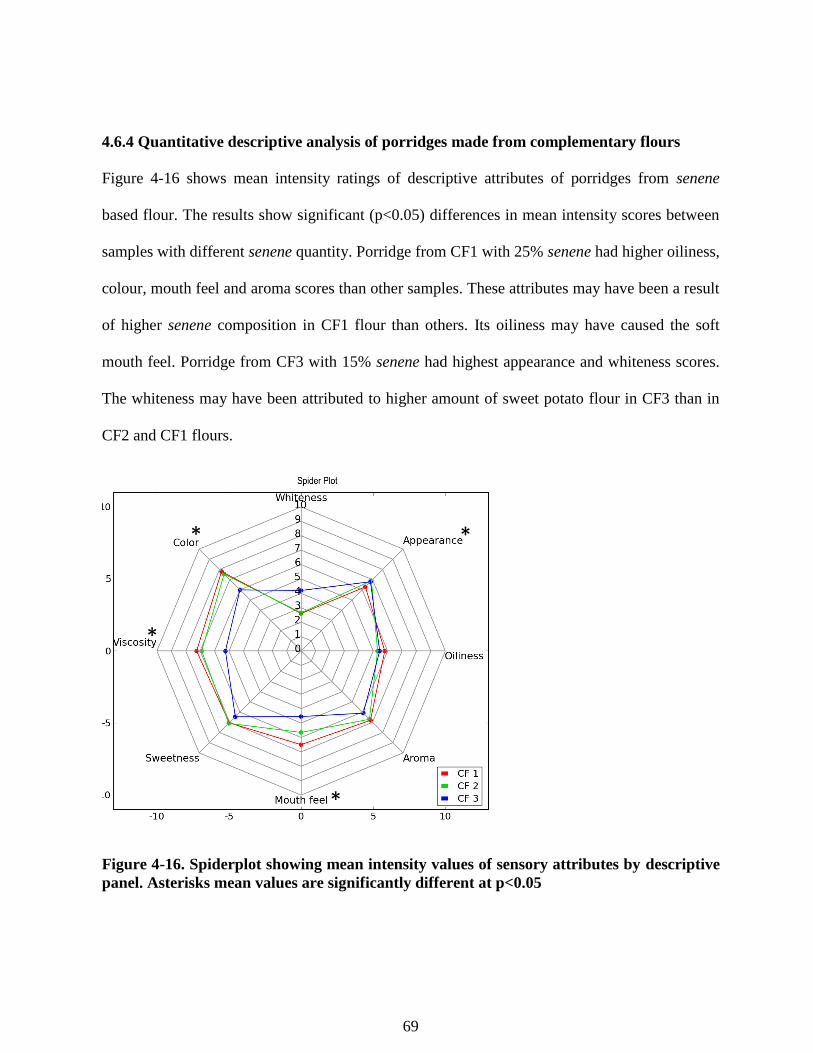
69
4.6.4 Quantitative descriptive analysis of porridges made from complementary flours
Figure 4-16 shows mean intensity ratings of descriptive attributes of porridges from senene
based flour. The results show significant (p<0.05) differences in mean intensity scores between
samples with different senene quantity. Porridge from CF1 with 25% senene had higher oiliness,
colour, mouth feel and aroma scores than other samples. These attributes may have been a result
of higher senene composition in CF1 flour than others. Its oiliness may have caused the soft
mouth feel. Porridge from CF3 with 15% senene had highest appearance and whiteness scores.
The whiteness may have been attributed to higher amount of sweet potato flour in CF3 than in
CF2 and CF1 flours.
Figure 4-16. Spiderplot showing mean intensity values of sensory attributes by descriptive
panel. Asterisks mean values are significantly different at p<0.05
*
*
*
*
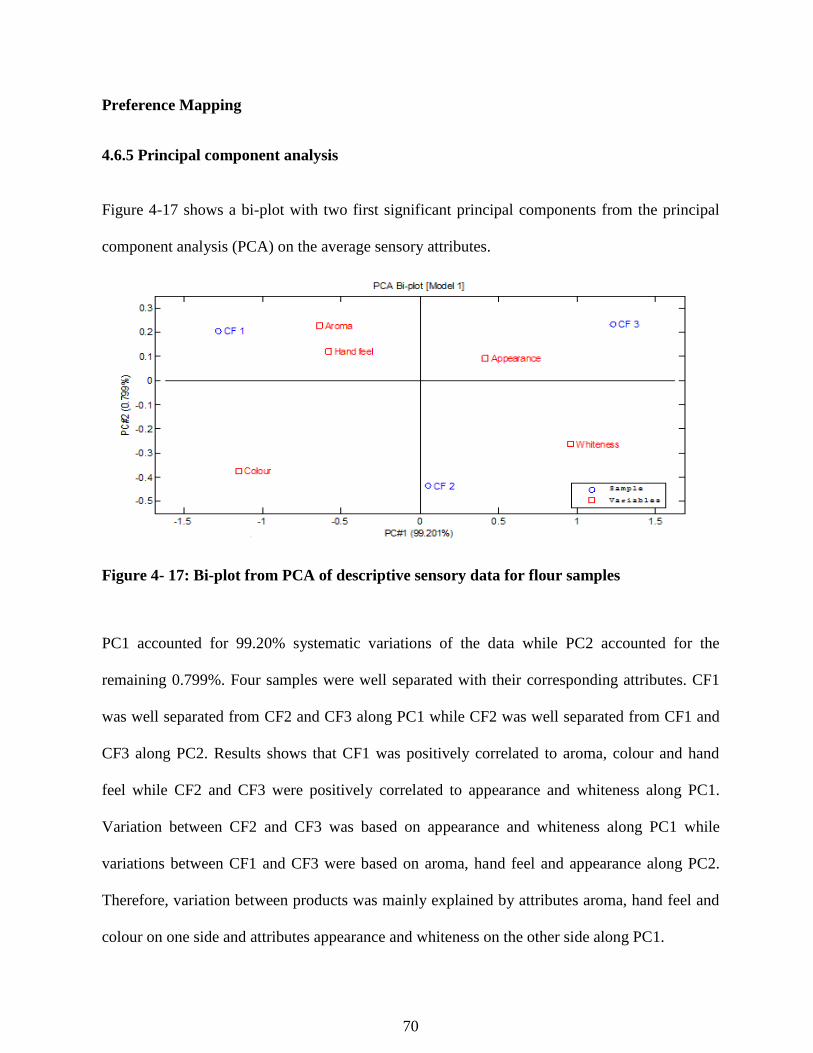
70
Preference Mapping
4.6.5 Principal component analysis
Figure 4-17 shows a bi-plot with two first significant principal components from the principal
component analysis (PCA) on the average sensory attributes.
Figure 4- 17: Bi-plot from PCA of descriptive sensory data for flour samples
PC1 accounted for 99.20% systematic variations of the data while PC2 accounted for the
remaining 0.799%. Four samples were well separated with their corresponding attributes. CF1
was well separated from CF2 and CF3 along PC1 while CF2 was well separated from CF1 and
CF3 along PC2. Results shows that CF1 was positively correlated to aroma, colour and hand
feel while CF2 and CF3 were positively correlated to appearance and whiteness along PC1.
Variation between CF2 and CF3 was based on appearance and whiteness along PC1 while
variations between CF1 and CF3 were based on aroma, hand feel and appearance along PC2.
Therefore, variation between products was mainly explained by attributes aroma, hand feel and
colour on one side and attributes appearance and whiteness on the other side along PC1.
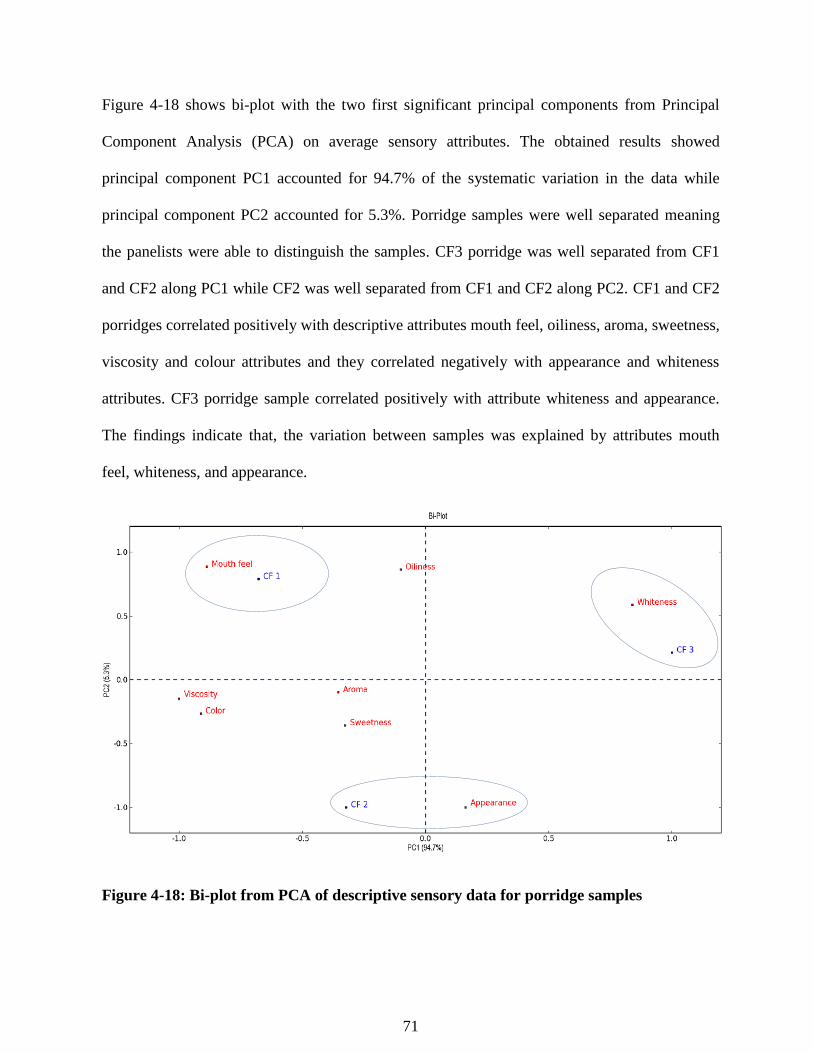
71
Figure 4-18 shows bi-plot with the two first significant principal components from Principal
Component Analysis (PCA) on average sensory attributes. The obtained results showed
principal component PC1 accounted for 94.7% of the systematic variation in the data while
principal component PC2 accounted for 5.3%. Porridge samples were well separated meaning
the panelists were able to distinguish the samples. CF3 porridge was well separated from CF1
and CF2 along PC1 while CF2 was well separated from CF1 and CF2 along PC2. CF1 and CF2
porridges correlated positively with descriptive attributes mouth feel, oiliness, aroma, sweetness,
viscosity and colour attributes and they correlated negatively with appearance and whiteness
attributes. CF3 porridge sample correlated positively with attribute whiteness and appearance.
The findings indicate that, the variation between samples was explained by attributes mouth
feel, whiteness, and appearance.
Figure 4-18: Bi-plot from PCA of descriptive sensory data for porridge samples
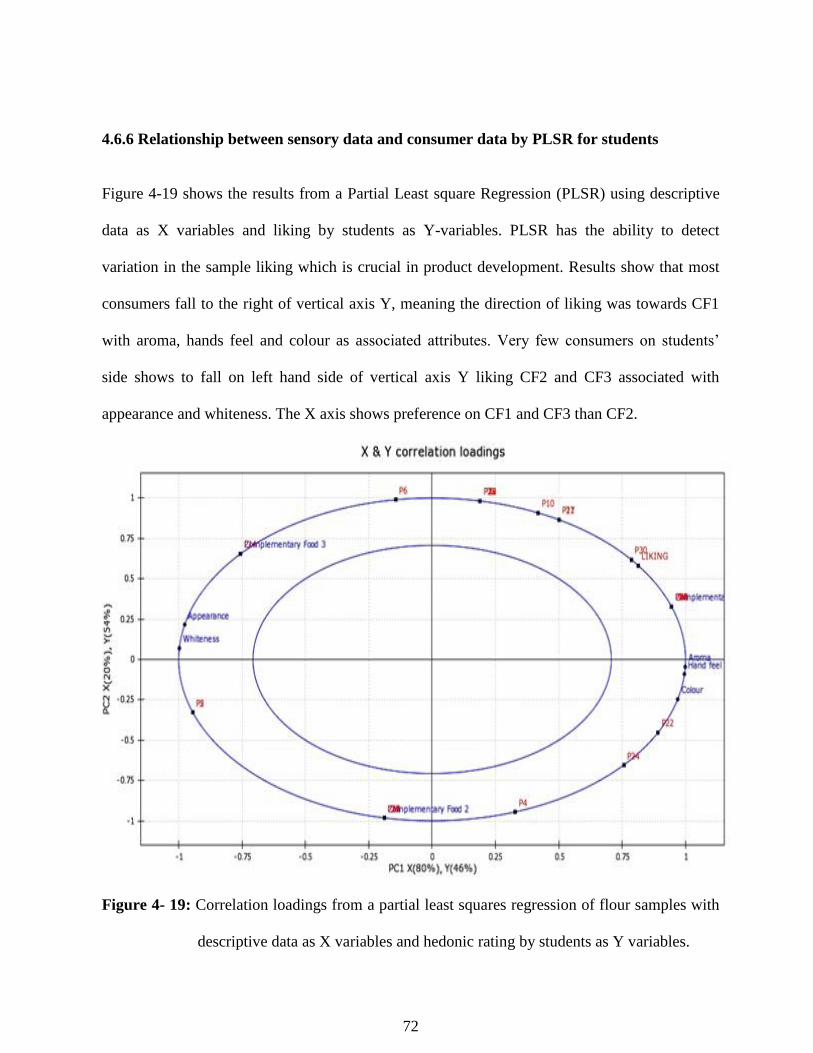
72
4.6.6 Relationship between sensory data and consumer data by PLSR for students
Figure 4-19 shows the results from a Partial Least square Regression (PLSR) using descriptive
data as X variables and liking by students as Y-variables. PLSR has the ability to detect
variation in the sample liking which is crucial in product development. Results show that most
consumers fall to the right of vertical axis Y, meaning the direction of liking was towards CF1
with aroma, hands feel and colour as associated attributes. Very few consumers on students’
side shows to fall on left hand side of vertical axis Y liking CF2 and CF3 associated with
appearance and whiteness. The X axis shows preference on CF1 and CF3 than CF2.
Figure 4- 19: Correlation loadings from a partial least squares regression of flour samples with
descriptive data as X variables and hedonic rating by students as Y variables.
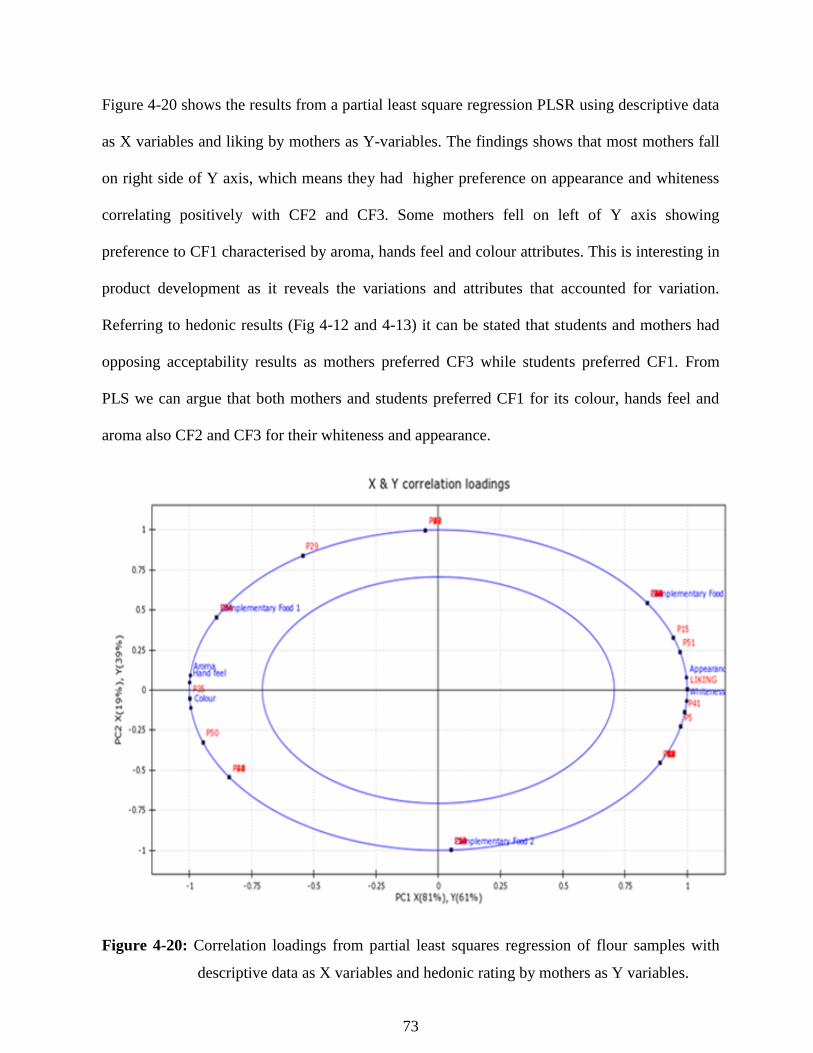
73
Figure 4-20 shows the results from a partial least square regression PLSR using descriptive data
as X variables and liking by mothers as Y-variables. The findings shows that most mothers fall
on right side of Y axis, which means they had higher preference on appearance and whiteness
correlating positively with CF2 and CF3. Some mothers fell on left of Y axis showing
preference to CF1 characterised by aroma, hands feel and colour attributes. This is interesting in
product development as it reveals the variations and attributes that accounted for variation.
Referring to hedonic results (Fig 4-12 and 4-13) it can be stated that students and mothers had
opposing acceptability results as mothers preferred CF3 while students preferred CF1. From
PLS we can argue that both mothers and students preferred CF1 for its colour, hands feel and
aroma also CF2 and CF3 for their whiteness and appearance.
Figure 4-20: Correlation loadings from partial least squares regression of flour samples with
descriptive data as X variables and hedonic rating by mothers as Y variables.
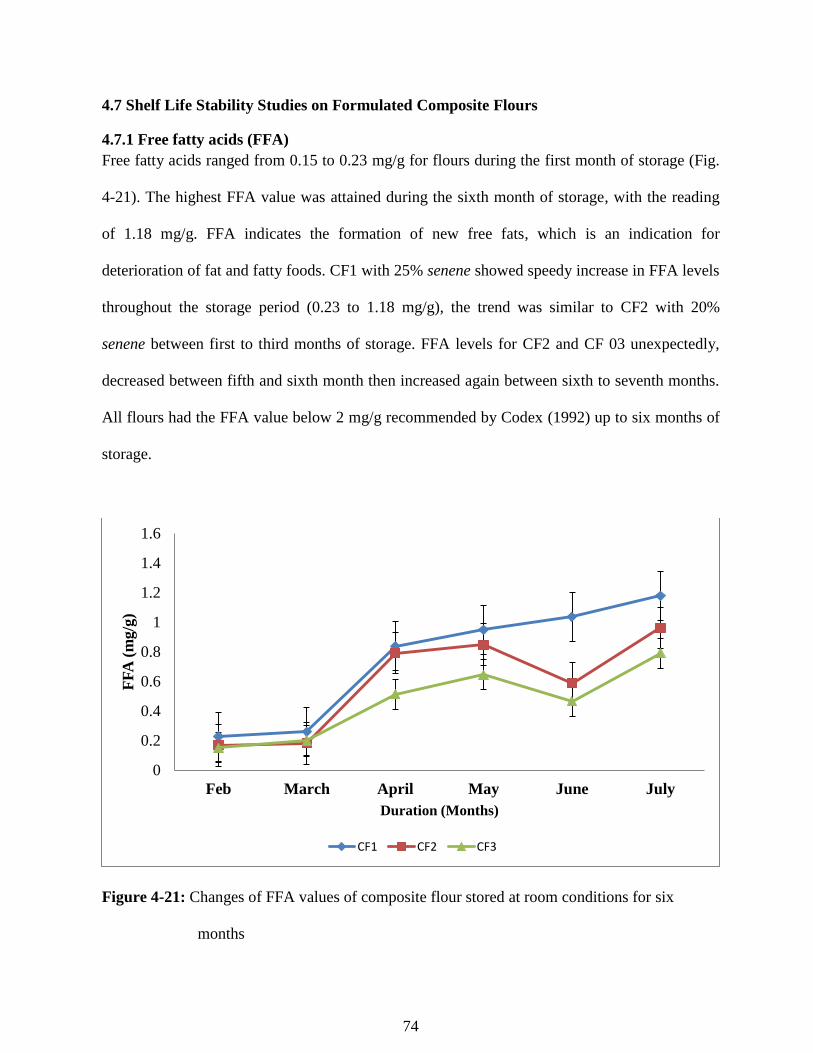
74
4.7 Shelf Life Stability Studies on Formulated Composite Flours
4.7.1 Free fatty acids (FFA)
Free fatty acids ranged from 0.15 to 0.23 mg/g for flours during the first month of storage (Fig.
4-21). The highest FFA value was attained during the sixth month of storage, with the reading
of 1.18 mg/g. FFA indicates the formation of new free fats, which is an indication for
deterioration of fat and fatty foods. CF1 with 25% senene showed speedy increase in FFA levels
throughout the storage period (0.23 to 1.18 mg/g), the trend was similar to CF2 with 20%
senene between first to third months of storage. FFA levels for CF2 and CF 03 unexpectedly,
decreased between fifth and sixth month then increased again between sixth to seventh months.
All flours had the FFA value below 2 mg/g recommended by Codex (1992) up to six months of
storage.
Figure 4-21: Changes of FFA values of composite flour stored at room conditions for six
months
0
0.2
0.4
0.6
0.8
1
1.2
1.4
1.6
Feb March April May June July
FF
A (
mg/g
)
Duration (Months)
CF1 CF2 CF3
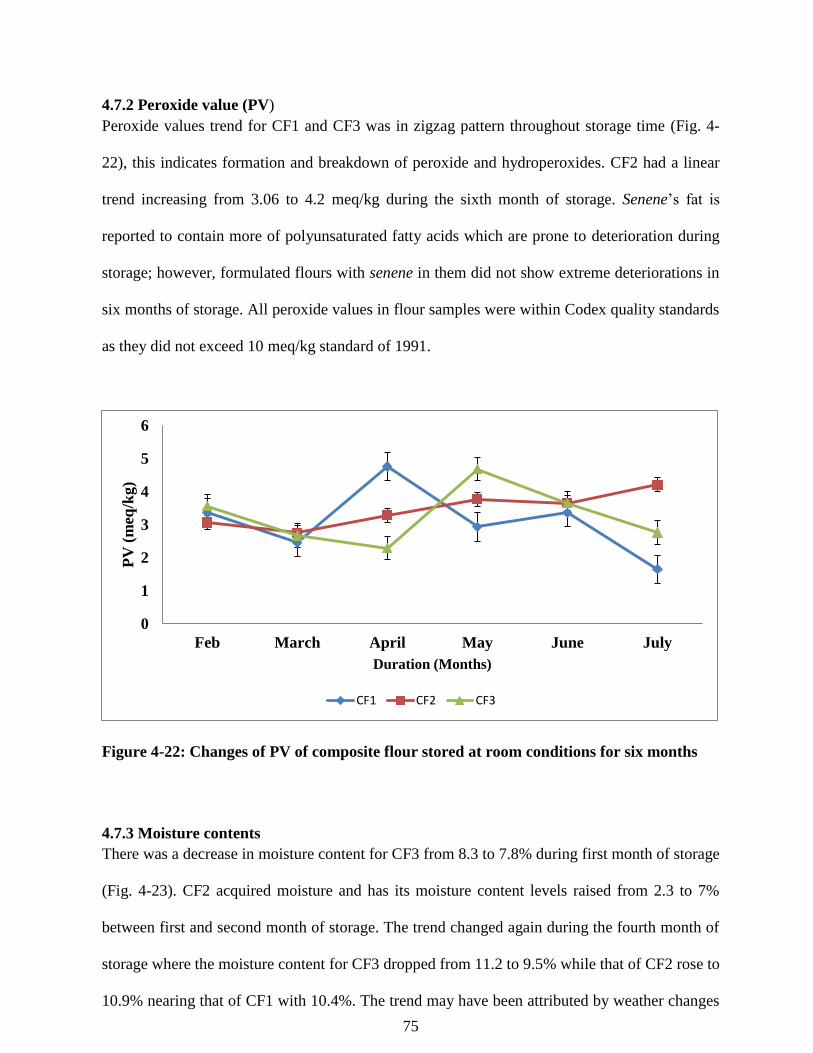
75
4.7.2 Peroxide value (PV)
Peroxide values trend for CF1 and CF3 was in zigzag pattern throughout storage time (Fig. 4-
22), this indicates formation and breakdown of peroxide and hydroperoxides. CF2 had a linear
trend increasing from 3.06 to 4.2 meq/kg during the sixth month of storage. Senene’s fat is
reported to contain more of polyunsaturated fatty acids which are prone to deterioration during
storage; however, formulated flours with senene in them did not show extreme deteriorations in
six months of storage. All peroxide values in flour samples were within Codex quality standards
as they did not exceed 10 meq/kg standard of 1991.
Figure 4-22: Changes of PV of composite flour stored at room conditions for six months
4.7.3 Moisture contents
There was a decrease in moisture content for CF3 from 8.3 to 7.8% during first month of storage
(Fig. 4-23). CF2 acquired moisture and has its moisture content levels raised from 2.3 to 7%
between first and second month of storage. The trend changed again during the fourth month of
storage where the moisture content for CF3 dropped from 11.2 to 9.5% while that of CF2 rose to
10.9% nearing that of CF1 with 10.4%. The trend may have been attributed by weather changes
0
1
2
3
4
5
6
Feb March April May June July
PV
(m
eq/k
g)
Duration (Months)
CF1 CF2 CF3
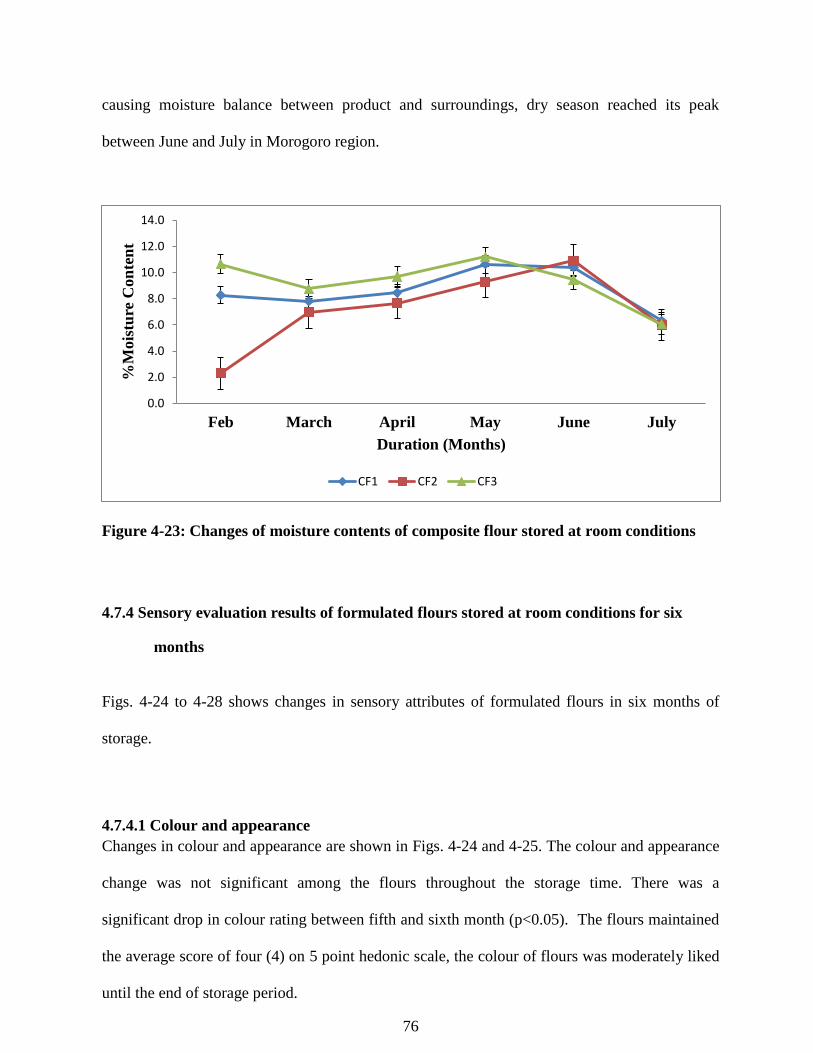
76
causing moisture balance between product and surroundings, dry season reached its peak
between June and July in Morogoro region.
Figure 4-23: Changes of moisture contents of composite flour stored at room conditions
4.7.4 Sensory evaluation results of formulated flours stored at room conditions for six
months
Figs. 4-24 to 4-28 shows changes in sensory attributes of formulated flours in six months of
storage.
4.7.4.1 Colour and appearance
Changes in colour and appearance are shown in Figs. 4-24 and 4-25. The colour and appearance
change was not significant among the flours throughout the storage time. There was a
significant drop in colour rating between fifth and sixth month (p<0.05). The flours maintained
the average score of four (4) on 5 point hedonic scale, the colour of flours was moderately liked
until the end of storage period.
0.0
2.0
4.0
6.0
8.0
10.0
12.0
14.0
Feb March April May June July
%M
ois
ture
Con
ten
t
Duration (Months)
CF1 CF2 CF3
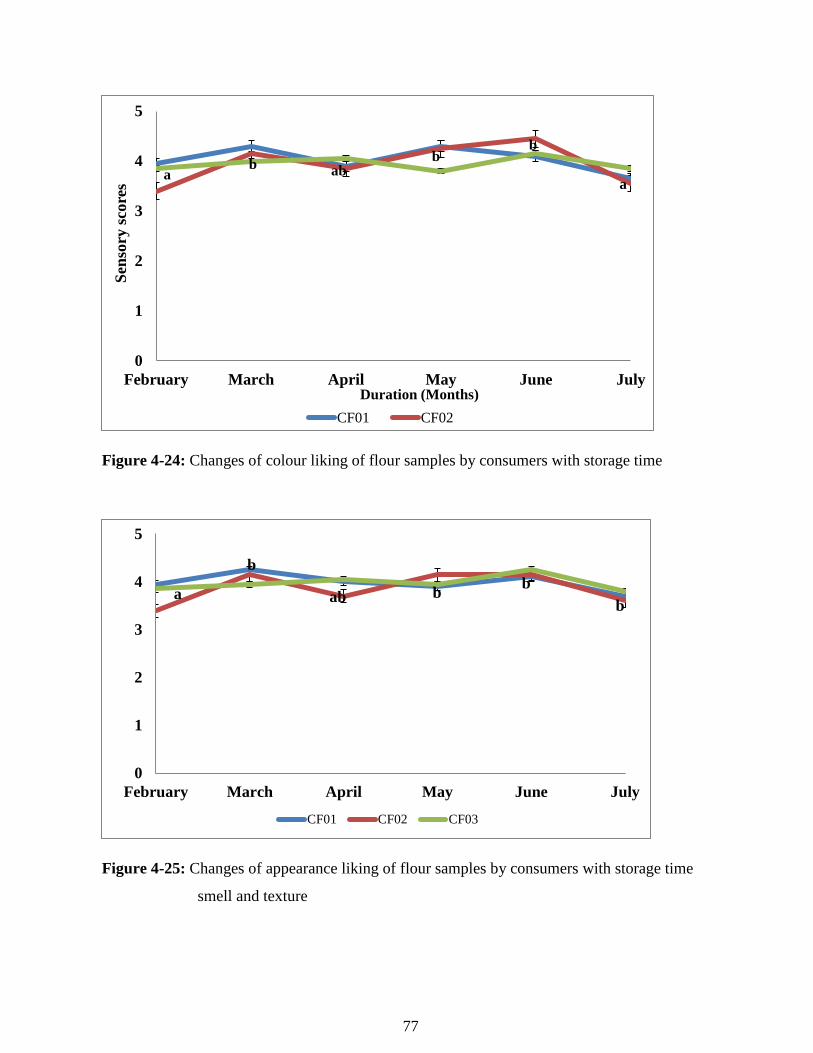
77
Figure 4-24: Changes of colour liking of flour samples by consumers with storage time
Figure 4-25: Changes of appearance liking of flour samples by consumers with storage time
smell and texture
ab ab
bb
a
0
1
2
3
4
5
February March April May June July
Sen
sory
sco
res
Duration (Months)
CF01 CF02
a
b
ab bb
b
0
1
2
3
4
5
February March April May June July
CF01 CF02 CF03
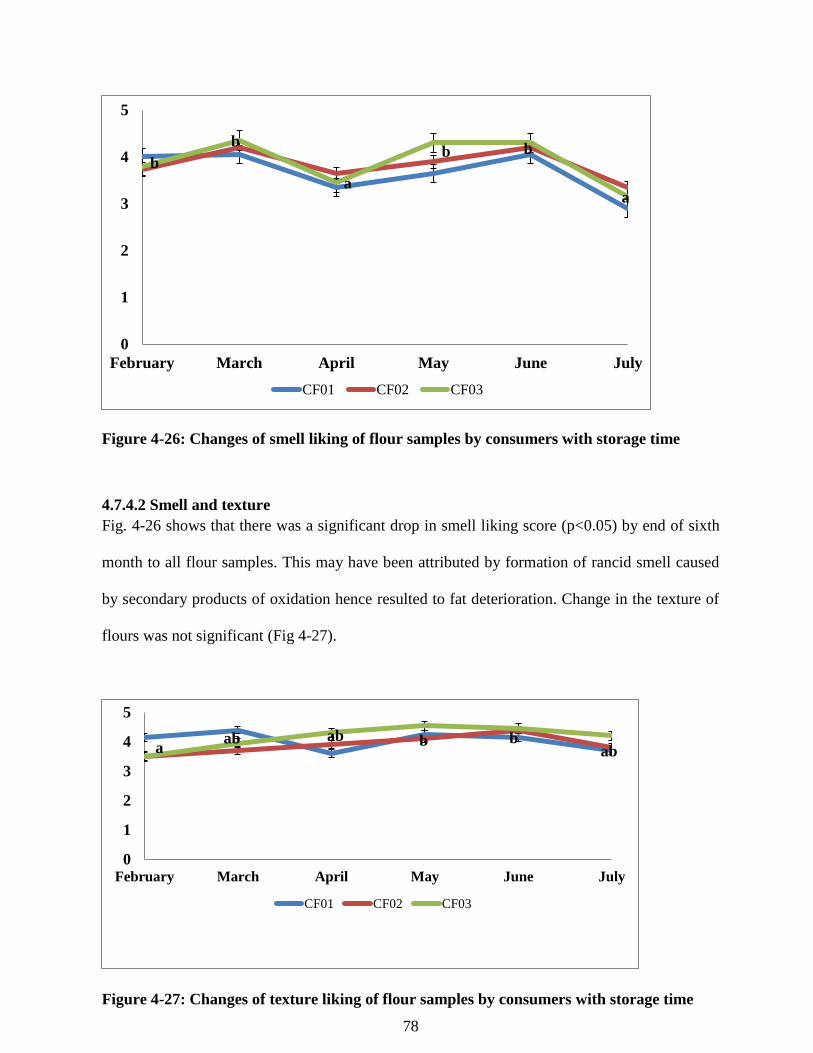
78
Figure 4-26: Changes of smell liking of flour samples by consumers with storage time
4.7.4.2 Smell and texture
Fig. 4-26 shows that there was a significant drop in smell liking score (p<0.05) by end of sixth
month to all flour samples. This may have been attributed by formation of rancid smell caused
by secondary products of oxidation hence resulted to fat deterioration. Change in the texture of
flours was not significant (Fig 4-27).
Figure 4-27: Changes of texture liking of flour samples by consumers with storage time
b
b
a
b b
a
0
1
2
3
4
5
February March April May June July
CF01 CF02 CF03
aab ab b b
ab
0
1
2
3
4
5
February March April May June July
CF01 CF02 CF03
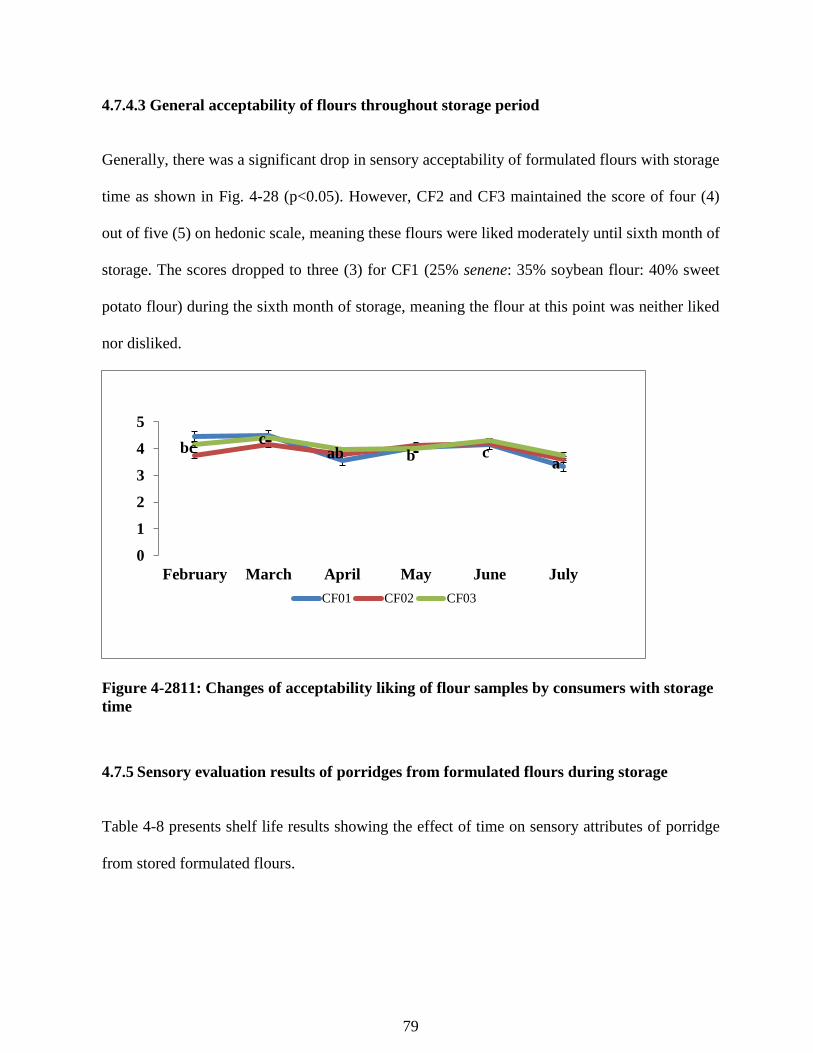
79
4.7.4.3 General acceptability of flours throughout storage period
Generally, there was a significant drop in sensory acceptability of formulated flours with storage
time as shown in Fig. 4-28 (p<0.05). However, CF2 and CF3 maintained the score of four (4)
out of five (5) on hedonic scale, meaning these flours were liked moderately until sixth month of
storage. The scores dropped to three (3) for CF1 (25% senene: 35% soybean flour: 40% sweet
potato flour) during the sixth month of storage, meaning the flour at this point was neither liked
nor disliked.
Figure 4-2811: Changes of acceptability liking of flour samples by consumers with storage
time
4.7.5 Sensory evaluation results of porridges from formulated flours during storage
Table 4-8 presents shelf life results showing the effect of time on sensory attributes of porridge
from stored formulated flours.
bcc
ab b ca
0
1
2
3
4
5
February March April May June July
CF01 CF02 CF03
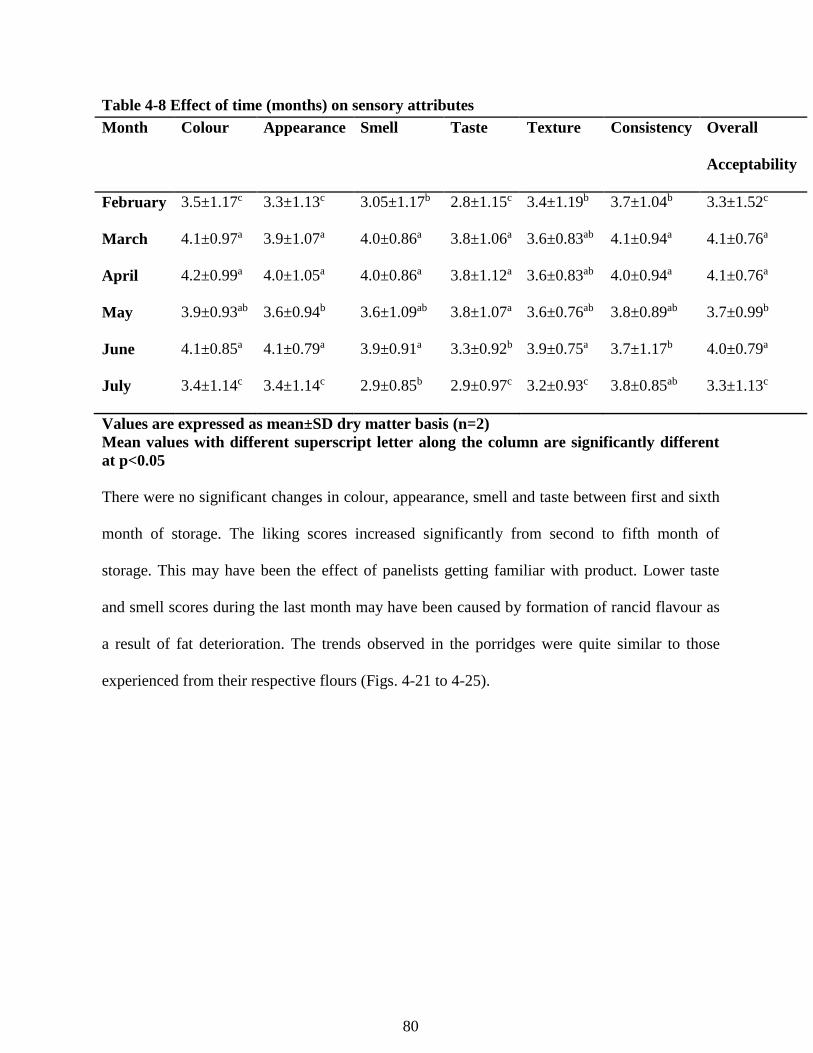
80
Table 4-8 Effect of time (months) on sensory attributes
Month Colour Appearance Smell Taste Texture Consistency Overall
Acceptability
February 3.5±1.17c 3.3±1.13c 3.05±1.17b 2.8±1.15c 3.4±1.19b 3.7±1.04b 3.3±1.52c
March 4.1±0.97a 3.9±1.07a 4.0±0.86a 3.8±1.06a 3.6±0.83ab 4.1±0.94a 4.1±0.76a
April 4.2±0.99a 4.0±1.05a 4.0±0.86a 3.8±1.12a 3.6±0.83ab 4.0±0.94a 4.1±0.76a
May 3.9±0.93ab 3.6±0.94b 3.6±1.09ab 3.8±1.07a 3.6±0.76ab 3.8±0.89ab 3.7±0.99b
June 4.1±0.85a 4.1±0.79a 3.9±0.91a 3.3±0.92b 3.9±0.75a 3.7±1.17b 4.0±0.79a
July 3.4±1.14c 3.4±1.14c 2.9±0.85b 2.9±0.97c 3.2±0.93c 3.8±0.85ab 3.3±1.13c
Values are expressed as mean±SD dry matter basis (n=2)
Mean values with different superscript letter along the column are significantly different
at p<0.05
There were no significant changes in colour, appearance, smell and taste between first and sixth
month of storage. The liking scores increased significantly from second to fifth month of
storage. This may have been the effect of panelists getting familiar with product. Lower taste
and smell scores during the last month may have been caused by formation of rancid flavour as
a result of fat deterioration. The trends observed in the porridges were quite similar to those
experienced from their respective flours (Figs. 4-21 to 4-25).
81
5. CONCLUSION AND RECOMMENDATION
5.1 Conclusion
Traditions, cultures and beliefs of different societies highly influence dietary choices and
adoption of any developed product. Understanding ancient processing methods and indigenous
technologies plays a crucial role in innovations across food industry. R. differens is an important
edible insect among East African societies around the lake zone, which has drawn the attention
of among others entomologists, botanists as well as food scientists and nutritionists. Wild fields
such as bushes and short grasses are important area for the life cycle of this seasonal delicacy.
Senene carries economic potentiality essential for improvement of women and smallholder
farmers’ income. Germination is a potential way of reducing anti-nutrients in soybean to
increase bioavailability. Senene is a nutritious ingredient useful in enriching plant-based
complementary foods, supplying such essential nutrients like heme iron and retinol. Although
high in microbial counts, fresh senene do not contain the virulent strains of E. coli. Edible
insects can be used to produce new healthy products acceptable to consumers with sensory
attributes similar to existing products. Formulated composite flours were nutritious and
microbiologically safe than common consumed composite flour in Morogoro. They can
therefore be recommended for adoption and commercialization to mothers and entrepreneurs,
respectively. Complementary flour from senene is shelf-stable under room conditions, with
good sensory attributes maintained for six months.
82
5.2 Recommendation
Studies on improvement of mentioned indigenous processing technology are highly required to
assure quality and safety of marketed senene. Promotion of senene as a delicious food among
all consumers should be encouraged in order to circumvent the challenges posed by culture.
Environmental conservation policies and regulations should be emphasized for the sustainability
of edible insects. Exploration of edible insects other than senene consumed by different societies
in Tanzania is required to increase rich protein sources. Studies on enriching other common
starch plant ingredients used in complementary feeding like maize cassava, millet and sorghum
flours with edible insects are needed. Shelf life studies under different keeping temperatures are
encouraged to evaluate keeping qualities of senene-based complementary flours.
83
REFERENCES
Abiose, S. H., Ikujenlola, A. V, & Abioderin, F. I. (2015). Nutritional Quality Assessment of
Complementary Foods Produced from Fermented and Malted Quality Protein Maize Fortifi
ed with Soybean Flour. Polish journal of food and nutrition science, 65(1), 49–56.
Agea, J. G., Biryomumaisho, M. Buyinza, and N. G. N. (2008). Commercialization of R.
nitidula (Nsenene Grasshoppers) in central Uganda. African Journal of Food Agriculture
Nutrition and Development, 8(3), 319–332.
Amagloh, F. K. (2012). Sweetpotato-based complementary food for infants in Ghana. Thesis
Submitted for Doctor of Phylosophy in Human Nutrition, Insitute of Food,nutrition and
Human Health University of New Zealand.
Anigo, K. M., Ameh, D. A., Ibrahim, S., & Danbauchi, S. S. (2010). Nutrient composition of
complementary food gruels formulated from malted cereals , soybeans and groundnut for
use in North-western Nigeria. African Journal of Food Science, 4(3), 65–72. Retrieved
from http://www.acadjourn.org/ajfs
Arnold van Huis, Itterbeeck, J. Van, Klunder, H., Mertens, E., Halloran, A., Muir, G., …
Vantomme. (2012). 12 . Economics : cash income , enterprise development , markets and
trade. In Edible insects:future prospects for food and feed security (pp. 131–139). Rome:
FAO.
Arueya, G. L., & Osundahunsi, O. F. (2015). Determination of the functional and keeping
qualities of extruded and corn starch based complementary food. Sky Journal of Food
Science 4 (5): 67 - 77.
Australian Standard TM (2005). General guide to methodology. Sensory analysis Part 1
12542.1.1-2005. Sydney. Australia.
84
Associates & Chapman. (2004). Current Knowledge on Soy and Children s Diets. United
soybean board report. Retrieved from www.nchapman.com
Bailey, W. J. & Mccrae, A. W. R. (1978). The general biology and phenology of swarming in
the East African tettigoniid Ruspolia differens ( Serville ) ( Orthoptera ). Journal of
Natural History, 12(3), 259–288. doi.org/10.1080/00222937800770151
Ballmer-Weber, B. K., Holzhauser, T., Scibilia, J., Mittag, D., Zisa, G., Ortolani, C., Bindslev-
Jensen, C. (2007). Clinical characteristics of soybean allergy in Europe: a double-blind,
placebo-controlled food challenge study. The Journal of Allergy and Clinical Immunology,
119(6), 1489–96. doi.org/10.1016/j.jaci.2007.01.049
Bau, H. M. Villaume, C. & Méjean, L. (2000). Effects of soybean (Glycine max) germination
on biologically active components, nutritional values of seeds, and biological
characteristics in rats. Die Nahrung, 44(1), 2–6.
Bauserman, M., Lokangaka, A., Kodondi, K., Gado, J., Viera, A. J., Bentley, M. E., Bose, C.
(2015). Original Article Caterpillar cereal as a potential complementary feeding product for
infants and young children : nutritional content and acceptability. Maternal and Child
Nutrition, 11, 214–220. doi.org/10.1111/mcn.12037.
Belluco, S. Losasso, C. Maggioletti, M., Alonzi, C. C., Paoletti, M. G., & Ricci, A. (2013).
Edible Insects in a Food Safety and Nutritional Perspective: A Critical Review.
Comprehensive Reviews in Food Science and Food Safety, 12(3), 296–313.
doi.org/10.1111/1541-4337.12014.
Brni, M., Hurrell, R. F., Songré-ouattara, L. T., Diawara, B., Tapsoba, C., Zeder, C., &
Wegmüller, R. (2017). Effect of phytase on zinc absorption from a millet-based porridge
fed to young Burkinabe children. European journal of clinical nutrition, 71, 137–141.
85
doi.org/10.1038/ejcn.2016.199
Bureau Risicobeoordeling en Onderzoeksprogrammering (2014). Advisory report on the risks
associated with the consumption of mass-reared insects. Bureau Risicobeoordeling en
Onderzoeksprogrammering, Utrecht, the Netherlands. Available at: http://
tinyurl.com/o3l38vy.
Chakravorty, J., Ghosh, S., & Meyer-rochow, V. B. (2011). Practices of entomophagy and
entomotherapy by members of the Nyishi and Galo tribes , two ethnic groups of the state of
Arunachal Pradesh. Journal of Ethnobiology and Ethnomedicine, 7(1), 5.
doi.org/10.1186/1746-4269-7-5
Defoliart, G. R. (1999). Insects as Food : Why the Western Attitude Is Important. The Annual
Review of Entomology, 44(80), 21–50. doi.org/10.1146/annurev.ento.44.1.21.
Dewey, K. G. (2013). The Challenge of Meeting Nutrient Needs of Infants and Young Children
during the Period of Complementary Feeding : An Evolutionary. American Journal of
Clinical Nutrition. doi.org/10.3945/jn.113.182527.
Dzerefos, C. M., Witkowski, E. T. F., & Toms, R. (2013). Comparative ethnoentomology of
edible stinkbugs in southern Africa and sustainable management considerations. Journal of
Ethnobiology and Ethnomedicine, 9(20), 1–11. doi.org/10.1186/1746-4269-9-20.
El-shemy, E. H. A. (2011). Soybean and nutrition. Intech open access publisher, Janeza Trdine
9, 51000 Rijeka, Crotia. Retrieved from www.intechopen.com.
Federal Agency for the Safety of the Food Chain-FASFC (2014). Circular concerning the
breeding and marketing of insects and insect-based food for human consumption. FASFC,
Brussels, Belgium. Available at: http://tinyurl.com/npaopwg.
86
Getahun, H., Lambein, F., Vanhoorne, M., & Stuyft, P. Van Der. (2005). Neurolathyrism risk
depends on type of grass pea preparation and on mixing with cereals and antioxidants.
Tropical Medical and International Health, 10(2), 169–178.
Gewa, C. A., & Leslie, T. F. (2015). Distribution and determinants of young child feeding
practices in the East African region : demographic health survey data analysis from 2008-
2011. Journal of Health, Population and Nutrition, 1–14. doi.org/10.1186/s41043-015-
0008-y.
Grabowski, N. T., & Klein, G. (2017). Microbiological analysis of raw edible insects. Journal of
Insects as Food and Feed, 3(1), 7–14. doi.org/10.3920/JIFF2016.0004.
Hoge Gezondheidsraad (2014). Common advice SciCom 14-2014 and SHC Nr. 9160 – subject:
food safety aspects of insects intended for human consumption. FASFC, Brussels,
Belgium. Available at: http://tinyurl.com/nqnzj68.
Huang, X., Cai, W., & Xu, B. (2014). Kinetic changes of nutrients and antioxidant capacities of
germinated soybean (Glycine max L.) and mung bean (Vigna radiata L.) with germination
time. Food Chemistry, 143, 268–76. doi.org/10.1016/j.foodchem.2013.07.080.
Huis, A. Van. (2013). Potential of Insects as Food and Feed in Assuring Food Security. The
Annual Review of Entomology, 58, 563–583. doi.org/10.1146/annurev-ento-120811-
153704.
Huis, A. Van, Dicke, M. & Loon, J. J. A. Van. (2015). Insects to feed the world. Journal of
Insects as Food and Feed, 1(1), 3–5. http://doi.org/10.3920/JIFF2015.x002.
Huis, A. van, Itterbeeck, J. Van, Klunder, H., Mertens, E., Halloran, A., Muir, G., Vantomme.
(2013). Nutritional value of insects for human consumption. In Edible insects:Future
Prospects for Food and Feed Security (pp. 67–80). Rome: FAO.
87
Karasulu, H. Y. (2001). Soybean oil : production process, benefits and uses in pharmaceutical
dosage form. Soybean and health, 13, 283-310.
Kelemu, S., Niassy, S., Torto, B., Fiaboe, K., Affognon, H., Tonnang, H., Ekesi, S. (2015).
African edible insects for food and feed : inventory, diversity, commonalities and
contribution to food security. Journal of Insects as Food and Feed, 1(2), 103–119.
doi.org/10.3920/JIFF2014.0016.
Kim, S.L., Lee, J.E., Kwon, Y.U., Kim, W.H., Jung, G.H., Kim, D.W., Chung, I.M. (2013).
Introduction and nutritional evaluation of germinated soy germ. Food Chemistry, 136(2),
491–500. doi.org/10.1016/j.foodchem.2012.08.022.
Kinyuru J., Kenji, G.M., Muhoho, M. A. (2015). Nutritional potential of longhorn grasshopper (
Ruspolia differens ) consumed in Siaya District, Kenya. Journal of Agriculture, Science
and Technology, 12, 32–46.
Kinyuru, J. N, Konyole, S.O, Kenji, G.M. (2012). Identification of traditional foods with public
health potential for complementary feeding in Western Kenya. Journal of Food Research,
1(2), 148–158. doi.org/10.5539/jfr.v1n2p148.
Kinyuru, J. N., Mogendi, J. B., Riwa, C. A., & Ndungu, N. W. (2015). Edible insects — a novel
source of essential nutrients for human diet : Learning from traditional knowledge. Animal
Frontiers, 5(2), 14–19. doi.org/10.2527/af.2015-0014.
Kinyuru, J. N., Kenji, G. M. & Simon Njoroge, M. A. (2010). Effect of processing methods on
the in vitro protein digestibility and vitamin content of edible winged termite (Macrotermes
subhylanus) and grasshopper (Ruspolia differens ). Jornal of Food Bioprocess Technology,
3, 778–782. doi.org/10.1007/s11947-009-0264-1
Klunder, H. C., Wolkers-rooijackers, J., Korpela, J. M., & Nout, M. J. R. (2012).
88
Microbiological aspects of processing and storage of edible insects. Food Control, 26(2),
628–631. doi.org/10.1016/j.foodcont.2012.02.013
Kulwa, K. B. M., Mamiro, P. S., Kimanya, M. E., Mziray, R., & Kolsteren, P. W. (2015).
Feeding practices and nutrient content of complementary meals in rural central Tanzania:
implications for dietary adequacy and nutritional status. BMC Pediatrics, 15(1), 171.
doi.org/10.1186/s12887-015-0489-2
Laswai, H. Mwanri, A.W. and Kogi-makau, W. H.S. (2011). Nutrients and antinutrients
composition of raw, cooked and dried sweet potato leaves. AJFAND 11(5): 1-15. (2011).
Improving Sweet potato processing and storage to perfoomance through slicing, drying and
packaging. African Journal of Agriculture.Food Nutrition and Development, 11(5), 5142–
5156.
Laswai, H.S., Martin, H. and K Kulwa. (2010). Nutrient content and acceptability of soybean
based complementary food. African Journal of Agriculture.food Nutrition and
Development, 10(1), 2040–2049.
Laswai H.S, Thonya, N, Y. D., & Silayo, V.C.K., Kulwa, K, M. J. and W. B. (2009). Use of
locally available flavouring materials in suppressing the beany taste in soymilk. African
Journal of Food Agriculture Nutrition and Development, 53(7), 1548-1560.
Laswai, H.S. Mwanri A.W., Silayo, V.C.K. and Makungu, P.J. (2003). Nutrients and
antinutrients composition of raw, cooked and sun- dried sweet potato leaves. African
Journal of Agriculture.Food Nutrition and Development, 6(1), 19–27.
Lensvelt, E. J. S., & Steenbekkers, L. P. A. (2015). Exploring consumer acceptance of
entomophagy : a survey and experiment in Australia and the Netherlands. Journal of
Ecology of Food and Nutrition, 244(53), 543–561. doi.org/10.1080/03670244.2013.879865
89
Lokuruka, M. (2010). Soya nutritional properties. African Journal of Food Agriculture Nutrition
and Development, 10(4),20-29.
Lutter, C. K., & Rivera, J. A. (2003). Nutrient composition for fortified complementary foods
nutritional status ofiInfants and young children and characteristics of their diets. American
Journal of Clinical Nutrition, (1), 2941–2949.
Lynch, R., Beard, L., Dassenko, Cook, D., & Morck H. (1992). Soy protein products in humans
and heme iron absorption. American journal of clinical nutrition. 56,573-578.
Mamiro, P. S., Kolsteren, P. W., Camp, J. H. Van, Roberfroid, D. A., Tatala, S., & Opsomer, A.
S. (2004). Community and international nutrition processed complementary food does not
improve growth or hemoglobin status of rural Tanzanian infants from 6 – 12 months of age
in Kilosa. American Journal of Clinical Nutrition, (October 2003), 1084–1090.
Matojo, N. D., & Hosea, K. M. (2013). Phylogenetic relationship of the longhorn grasshopper
Ruspolia differens Serville ( Orthoptera : Tettigoniidae ) from northwest Tanzania Based
on 18S Ribosomal Nuclear Sequences. Journal of Insects, 2013, 1–5.
doi.org/http://dx.doi.org/10.1155/2013/504285
Matojo, N. D., & Njau, M. A. (2010). Plasticity and biosystematics of swarming of the
conehead Ruspolia differens Serville ( Orthoptera : Conocephalidae ) study site.
International Journal of Intergrative Biology, 9(2), 97–103.
Matojo, N. D., & Yarro, J. G. (2010). Variability in polymorphism and sex ratio of the conehead
Ruspolia differens Serville ( Orthoptera : Conocephalidae ) in north-west Tanzania Colour
morphs Study site. International Journal of Intergrative Biology, 9(3), 131–136.
Megido, R. C., Sablon, L., Geuens, M., Brostaux, Y., Alabi, T., Blecker, C., Francis, F. (2014).
Edible insects acceptance by belgian consumers : promising attitude for entomophagy
90
development. Journal of Sensory Studies, 29, 14–20. doi.org/10.1111/joss.12077
Moreki, J. C. (2014). A Study of Entomophagy in Mogonono in Kweneng District , Botswana.
Online International Interdisciplinary Research Journal, IV(March), 70–79.
Mosha, T.C.E., Laswai, H. S., & Tetens, I. (2000). Nutritional composition and micronutrient
status of home made and commercial weaning foods consumed in Tanzania. Plant Foods
for Human Nutrition, 55, 186-203.
Mosha, T. C. E., Sadick, M. A., & Laswai, H. S. (2010). Development and evaluation of
organoleptic quality and acceptability of cassava-based composite crackers. Tanzania
Journal of Agricultural Sciences 10(1), 8–21.
Mostafa, M., Rahma, E., & Rady, (1987). Chemical and nutritional changes in soybean during
germination. Food Chemistry, 23(4), 257–275. doi.org/10.1016/0308-8146(87)90113-0
Muhimbula, H. S., & Issa-zacharia, A. (2010). Persistent child malnutrition in Tanzania : Risks
associated with traditional complementary foods ( a review ). African Journal of Food
Science, 4(11)(November), 679–692.
Muhimbula, H. S., Issa-zacharia, A., & Kinabo, J. (2011). Formulation and sensory evaluation
of complementary foods from local , cheap and readily available cereals and legumes in
Iringa , Tanzania. African Journal of Food Science, 5(1), 26–31.
Muzzarelli, R. A. A., Boudrant, J., Meyer, D., Manno, N., DeMarchis, M., & Paoletti, M. G.
(2012). Current views on fungal chitin/chitosan, human chitinases, food preservation,
glucans, pectins and inulin: A tribute to Henri Braconnot, precursor of the carbohydrate
polymers science, on the chitin bicentennial. Carbohydrate Polymers, 87(2), 995–1012.
doi.org/10.1016/j.carbpol.2011.09.063.
91
Nadeau, L., Nadeau, I., Franklin, F., & Dunkel, F. (2015). The Potential for entomophagy to
address undernutrition. Ecology of Food and Nutrition, 54(3), 200–208.
doi.org/10.1080/03670244.2014.930032
Naveen Kango (2010). A Textbook of Microbiology, I.K International Publishing HousePvt Ltd.
New delhi Bangalore.
Okore, O., Avaoja, D., & Nwana, I. (2014). Edible Insects of the Niger Delta area in Nigeria .
Journal of Natural Sciences Research, 4(5), 1–9. Retrieved from http://www.iiste.org/ISSN
225-0921.
Okoth, J. K., Ochola, S. A., Gikonyo, N. K., & Makokha, A. (2016). Development of a nutrient-
dense complementary food using amaranth-sorghum grains. Food Science & Nutrition, 1–
8. http://doi.org/10.1002/fsn3.367.
Oliwoya HN, Abubakar,adebayo, oladipo (2009). Study of sweet potato(Ipomea batatas Lam)
Foods for indigenous consumption through chemical and anti-nutritivr analysis in Kware
state, Nigeria. Pakistan Journal of Nutrition, 8(12), 1894–1897.
Onoja, Akubor, Gernar, & Chinmma. (2014). Evaluation of complementary food formulated
from local staples and fortified with calcium , iron and zinc. Journal of Nutrition and Food
Sciences, 4(6). doi.org/10.4172/2155-9600.1000326
Paul, K. H., Dickin, K. L., Ali, N. S., Monterrosa, E. C., & Stoltzfus, R. J. (2008). Soy- and rice-
based processed complementary food increases nutrient intakes in infants and is equally
acceptable with or without added. American Journal of Clinical Nutrition, 138(July),
1963–1968.
Pee, S. De, & Bloem, M. W. (2009). Current and potential role of specially formulated foods
and food supplements for preventing malnutrition among 6- to 23-month-old children and
92
for treating moderate malnutrition among 6- to 59-month-old children. Food and Nutrition
Bulletin, 30(3), 434–463.
Petry, N., Egli, I., Gahutu, J. B., Tugirimana, P. L., Boy, E., & Hurrell, R. (2014). Phytic acid
Concentration Influences Iron Bioavailability from Biofortified Beans in Rwandese
Women with Low Iron Status. The journal fo nutrition, 1681–1688.
doi.org/10.3945/jn.114.192989.1681
Quinhone Júnior, A., & Ida, E. I. (2015). Profile of the contents of different forms of soybean
isoflavones and the effect of germination time on these compounds and the physical
parameters in soybean sprouts. Food Chemistry, 166, 173–178.
doi.org/10.1016/j.foodchem.2014.06.012.
Quirce, S., Fernández-Nieto, M., Bartolomé, B., Bombín, C., Cuevas, M., & Sastre, J. (2002).
Glucoamylase: another fungal enzyme associated with baker’s asthma. Annals of Allergy,
Asthma & Immunology : Official Publication of the American College of Allergy, Asthma,
& Immunology, 89(2), 197–202. doi.org/10.1016/S1081-1206(10)61938-2
Ramos-elorduy, J. (2009). Anthropo-entomophagy : cultures , evolution and sustainability.
Entomological Research, 39, 271–288. http://doi.org/10.1111/j.1748-5967.2009.00238.x
Raubenheimer, D., & Rothman, J. M. (2013). Nutritional ecology of entomophagy in humans
and other primates. Annual Review of Entomology, 58, 141–160. doi.org/10.1146/annurev-
ento-120710-100713
Rose, I. M., & Vasanthakaalam, H. (2011). Comparison of the nutrient composition of four
sweet potato varieties cultivated in Rwanda. American Journal of Food and Nutrition,1(1),
34–38. doi.org/10.5251/ajfn.2011.1.1.34.38
Rumpold, B. A., & Schl, O. K. (2013). Nutritional composition and safety aspects.Molecular
93
Nutrition and Food Research, 57, 802–823. doi.org/10.1002/mnfr.201200735
Rusydi, M. (2012). Effect of germination on total phenolic , tannin and phytic acid contents in
soy bean and peanut. International food research journal, 19(2), 673–677.
Shin, D.-J., Kim, W., & Kim, Y. (2013). Physicochemical and sensory properties of soy bread
made with germinated, steamed, and roasted soy flour. Food Chemistry, 141(1), 517–23.
doi.org/10.1016/j.foodchem.2013.03.005
Shu, X. O., Jin, F., Dai, Q., Wen, W., Potter, J. D., Kushi, L. H., & Ruan, Z. (2001). Soyfood
intake during adolescence and subsequent risk of breast cancer among Chinese women.
Cancer Epidemiology, Biomakers & Prevention, 10(May), 483–488.
Siulapwa, N., Mwambungu, A., Lungu, E., & Sichilima, W. (2014). Nutritional value of four
common edible insects in Zambia. International Journal of Science and Research, 3(6),
876–884.
Skau, J. K. H., Touch, B., Chhoun, C., Chea, M., Unni, U. S., Makurat, J., Roos, N. (2015).
Effects of animal source food and micronutrient fortification in complementary food
products on body composition , iron status , and linear growth : a randomized trial in
Cambodia 1 – 4. The American Journal of Clinical Nutrition, 101(3), 742–751.
doi.org/10.3945/ajcn.114.084889.
Stan C. (2006). Codex Standard for Processed Cereal-Based Foods for Infants and Young
Children,. CODEX STAN 074-1981, REV. 1-2006; 1–9
Stoops, J., Crauwels, S., Waud, M., Claes, J., & Lievens, B. (2016). Microbial community
assessment of mealworm larvae ( Tenebrio molitor ) and grasshoppers (Locusta migratoria
migratorioides) sold for human consumption. Food Microbiology, 53, 122–127.
doi.org/10.1016/j.fm.2015.09.010
94
Tabuna, P., Göhler, D., & N’Deckere-Ziangba, F. (2004). Contribution of forest insects to food
security and forest conservation: the example of caterpillars in Central Africa. Wildlife
Policy Briefing, (3). Retrieved from http://www.odi.org.uk/sites/odi.org.uk/files/odi-
assets/publications-opinion-files/3306.pdf.
Tanzania Food and Nutrition Centre-TFNC (2014). Tanzania National Nutrition Survey 2014
final report. Ministry of Health and Social Welfare. 12015. Available from
http://www.unicef.org/esaro/Tanzania_National_Nutrition_Survey_2014_Final_Report_18
0,Accessed: 28 May 2016.
Tanzania (2015). Migration and Urbanisation Report;2012 Population and housing census.
(Vol. IV). Dar es Salaam.
Tanzania Health and Demographic Survey (2014). United Republic of Tanzania United
Republic of Tanzania. Nutrition country profile.
Testa, M., Stillo, M., Maffei, G., Andriolo, V., & Gardois, P. (2016). Ugly but tasty : a
systematic review of possible human and animal health risks related to entomophagy, 8398
(March). http://doi.org/10.1080/10408398.2016.1162766
THDS. (2016). Tanzania Demographic and Health Survey. National Bureau of Statistics Dar es
Salaam, Tanzania ICF Macro Calverton, Maryland, USA. Dar es Salaam. Retrieved from
http://www.measuredhs.com/pubs/pdf/FR243/FR243[24June2011].pdf.
Thein, M. M., Jamjanya, T., Kobori, Y., & Hanboonsong, Y. (2012). Dispersal of the
leafhoppers Matsumuratettix hiroglyphicus and Yamatotettix flavovittatus (Homoptera:
Cicadellidae), vectors of sugarcane white leaf disease. Applied Entomology and Zoology,
47(3), 255–262. doi.org/10.1007/s13355-012-0117-7.
Thompson, G. R., & Grundy, S. M. (2005). History and development of plant sterol and stanol
esters for cholesterol-lowering purposes. The American Journal of Cardiology, 96(1A),
95
3D–9D. doi.org/10.1016/j.amjcard.2005.03.013.
Troesch, B., Egli, I., Zeder, C., Hurrell, R. F., Pee, S. De, & Zimmermann, M. B. (2009).
Optimization of a phytase-containing micronutrient powder with low amounts of highly
bioavailable iron for in-home fortification of complementary foods 1 – 3, (2).
http://doi.org/10.3945/ajcn.2008.27026.
Twaweza. (2010). Malnutrition; Can Tanzania aff ord to ignore 43 , 000 dead children and
Tshs 700 billion in lost income every year ?
United Nations Children's Fund (UNICEF) 2009. Tracking Progress on Child and Maternal
Nutrition: a survival and development priority. Available from www.unicef-irc.org/.
Accessed: 20 May 2016.
UNICEF. (2015). UNICEF Annual Report 2015 Democratic Republic of Congo, 48. Retrieved
fromhttp://www.unicef.org/about/annualreport/files/Democratic_Republic_of_Congo_201
5_COAR.pdf
V. Benno Meyer-rochow and Jharna Chakravorty (2013). Notes on entomophagy and
entomotherapy generally and information on the situation in India in particular. Applied
Entomology and Zoology, 48(2), 105–112. http://doi.org/10.1007/s13355-013-0171-9.
Vaintraub, I. A., & Lapteva, N. A. (1988). Colorimetric determination of phytate in unpurified
extracts of seeds and the products of their processing. Analytical Biochemistry, 175(1),
227–230. http://doi.org/10.1016/0003-2697(88)90382-X.
van Huis, A. (2017). Edible insects and research needs. Journal of Insects as Food and Feed,
3(1), 3–5. http://doi.org/10.3920/JIFF2017.x002.
Vernaza, M. G., Dia, V. P., de Mejia, E. G., & Chang, Y. K. (2012). Antioxidant and
96
antiinflammatory properties of germinated and hydrolysed Brazilian soybean flours. Food
Chemistry, 134(4), 2217–25. http://doi.org/10.1016/j.foodchem.2012.04.037.
Wang, L., Wang, H., Lai, Q., Li, T., Fu, X., Guo, X., & Liu, R. H. (2015). The dynamic changes
of ascorbic acid, tocopherols and antioxidant activity during germination of soya bean (
Glycine max ). International Journal of Food Science & Technology, 50(11), 2367–2374.
doi.org/10.1111/ijfs.12902.
World Health Organisation (WHO) (2001). Complementary feeding: Report of the global
consultation, and summary of guiding principles for complementary feeding of the
breastfed child. Geneva. Switzerland. Available from, http://www.who.int/nut. Accessed:
12 April 2016.
Yen, A. L. (2009). Entomophagy and insect conservation: some thoughts for digestion. Journal
of Insect Conservation, 13(6), 667–670. http://doi.org/10.1007/s10841-008-9208-8
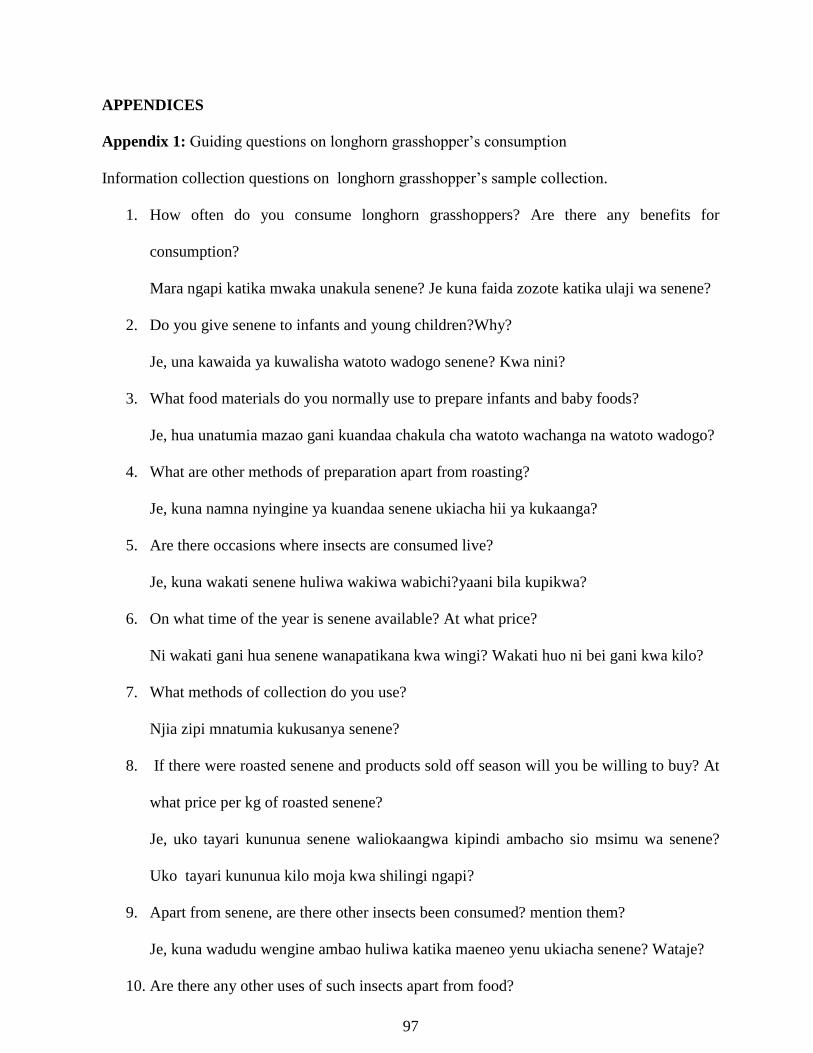
97
APPENDICES
Appendix 1: Guiding questions on longhorn grasshopper’s consumption
Information collection questions on longhorn grasshopper’s sample collection.
1. How often do you consume longhorn grasshoppers? Are there any benefits for
consumption?
Mara ngapi katika mwaka unakula senene? Je kuna faida zozote katika ulaji wa senene?
2. Do you give senene to infants and young children?Why?
Je, una kawaida ya kuwalisha watoto wadogo senene? Kwa nini?
3. What food materials do you normally use to prepare infants and baby foods?
Je, hua unatumia mazao gani kuandaa chakula cha watoto wachanga na watoto wadogo?
4. What are other methods of preparation apart from roasting?
Je, kuna namna nyingine ya kuandaa senene ukiacha hii ya kukaanga?
5. Are there occasions where insects are consumed live?
Je, kuna wakati senene huliwa wakiwa wabichi?yaani bila kupikwa?
6. On what time of the year is senene available? At what price?
Ni wakati gani hua senene wanapatikana kwa wingi? Wakati huo ni bei gani kwa kilo?
7. What methods of collection do you use?
Njia zipi mnatumia kukusanya senene?
8. If there were roasted senene and products sold off season will you be willing to buy? At
what price per kg of roasted senene?
Je, uko tayari kununua senene waliokaangwa kipindi ambacho sio msimu wa senene?
Uko tayari kununua kilo moja kwa shilingi ngapi?
9. Apart from senene, are there other insects been consumed? mention them?
Je, kuna wadudu wengine ambao huliwa katika maeneo yenu ukiacha senene? Wataje?
10. Are there any other uses of such insects apart from food?
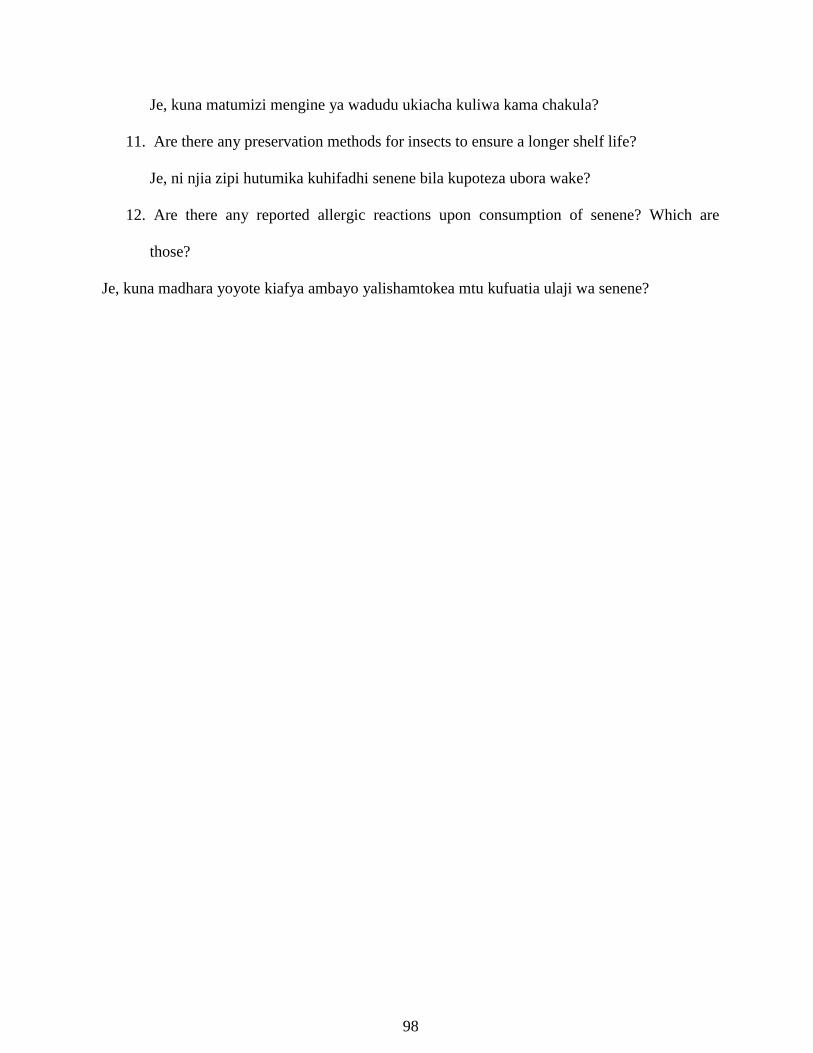
98
Je, kuna matumizi mengine ya wadudu ukiacha kuliwa kama chakula?
11. Are there any preservation methods for insects to ensure a longer shelf life?
Je, ni njia zipi hutumika kuhifadhi senene bila kupoteza ubora wake?
12. Are there any reported allergic reactions upon consumption of senene? Which are
those?
Je, kuna madhara yoyote kiafya ambayo yalishamtokea mtu kufuatia ulaji wa senene?
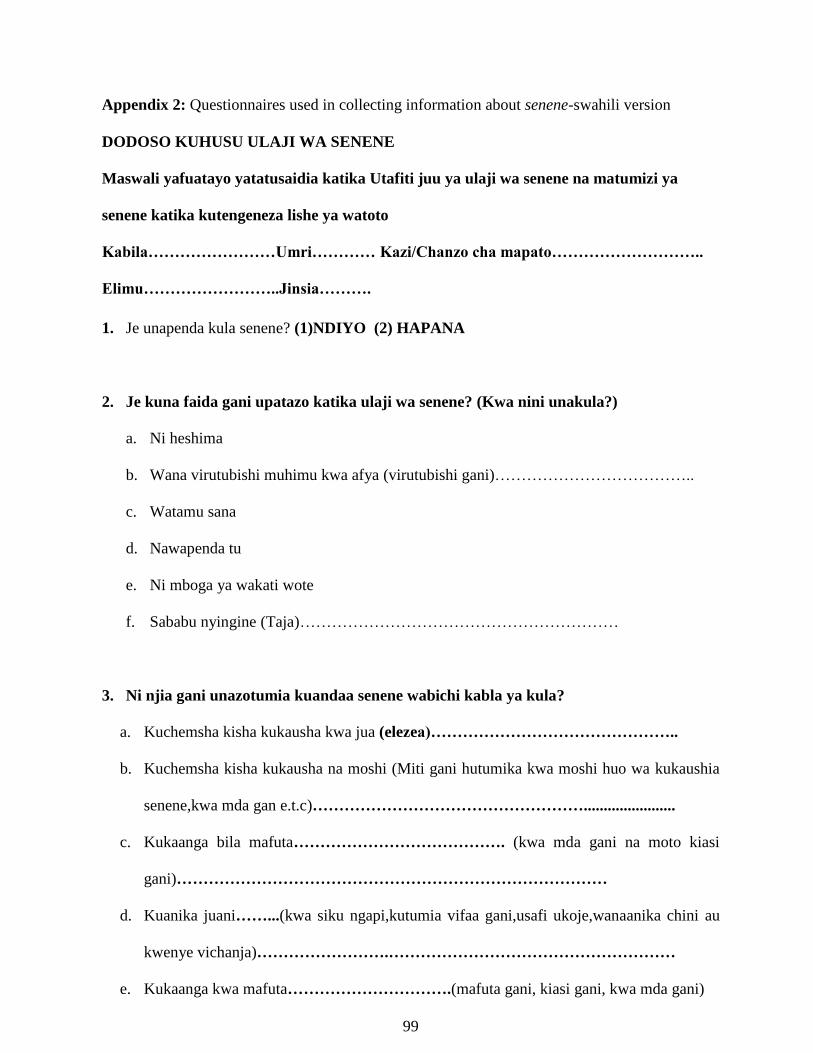
99
Appendix 2: Questionnaires used in collecting information about senene-swahili version
DODOSO KUHUSU ULAJI WA SENENE
Maswali yafuatayo yatatusaidia katika Utafiti juu ya ulaji wa senene na matumizi ya
senene katika kutengeneza lishe ya watoto
Kabila……………………Umri………… Kazi/Chanzo cha mapato………………………..
Elimu……………………..Jinsia……….
1. Je unapenda kula senene? (1)NDIYO (2) HAPANA
2. Je kuna faida gani upatazo katika ulaji wa senene? (Kwa nini unakula?)
a. Ni heshima
b. Wana virutubishi muhimu kwa afya (virutubishi gani)………………………………..
c. Watamu sana
d. Nawapenda tu
e. Ni mboga ya wakati wote
f. Sababu nyingine (Taja)……………………………………………………
3. Ni njia gani unazotumia kuandaa senene wabichi kabla ya kula?
a. Kuchemsha kisha kukausha kwa jua (elezea)………………………………………..
b. Kuchemsha kisha kukausha na moshi (Miti gani hutumika kwa moshi huo wa kukaushia
senene,kwa mda gan e.t.c)…………………………………………….......................
c. Kukaanga bila mafuta…………………………………. (kwa mda gani na moto kiasi
gani)………………………………………………………………………
d. Kuanika juani……...(kwa siku ngapi,kutumia vifaa gani,usafi ukoje,wanaanika chini au
kwenye vichanja)…………………….………………………………………………
e. Kukaanga kwa mafuta………………………….(mafuta gani, kiasi gani, kwa mda gani)
100
f. Kuchemsha na chumvi kisha kukaanga kwa mafuta
g. Kuchemsha kwa chumvi kasha kukaanga bila mafuta
h. Nyingine (TAJA)…………………………………………………………….
Unapendelea kula senene zilizoandaliwa kwa njia gani
…………………………………………………………….…………………
4. Je, una kawaida ya kuwalisha watoto wadogo (1-5years old) senene?
1) NDIYO
(a) wana virutubishi (b) watoto wanapenda (c) ni utamaduni
11) HAPANA
(a) hawawezi kumeza (b)wana vichwa vigumu (c) hawataongea (d) watakua na vichwa
kama vya senene
Kwa nini? TOA SABABU.................................................................................................
………………………………………………………………………………….
5. Senene wabichi huwa unawahifadhi kwa njia gani kabla ya kukaanga/ kuchemsha/
kukausha?
a. Mifuko ya salfet/plastic
b. Gunia
c. Ndoo ya plastic
d. Neti/chombo chenye matundu
e. Nyingine………………………….
6. Senene wabichi wanaweza kukaa mda gani bila kuharibika.
a. Masaa 6 hadi 10
b. Masaa 12 hadi 24
c. Siku 3 hadi 5

101
7. Je, kuna wakati huwa unakula senene wakiwa wabichi?yaani bila kupikwa?
1) NDIYO (a) ni watamu (b)wana virutubishi zaidi (c) sababu nyingine……..taja
11) HAPANA (a) utaumwa tumbo na kuhara (b) hawana ladha (c) wanakua na wadudu
8. Ni wakati gani hua senene wanapatikana kwa wingi?..
a. Mwezi wa 4 hadi 5
b. Mwezi wa 9 hadi 12
Wakati huo ni bei gani kwa ndoo ndogo?.............................................................................
9. Njia zipi unatumia kukusanya/kupata senene kwa ajili yako?
I. Kuokota chini asubuhi
II. Kutegesha mitego
III. Kuokota ziwani
IV. Kupewa na ndugu
V. Kununua kwa wakusanyaji/wauzaji
10. Je, Senene hupatikana wa kutosha wakati ambako sio msimu wa senene?
1) NDIYO 11) HAPANA
Kikombe kimoja huwa shilingi ngapi?.
a. 1,000-3,000 Tsh
b. 5,000-10,000Tsh
11. Je, kuna wadudu wengine ambao huliwa katika maeneo yenu ukiacha senene?
1) NDIYO 2) HAPANA…….. Wataje
…………………………………………………………………………………………
102
12. Je, kuna matumizi mengine ya wadudu ukiacha kuliwa kama chakula?
1) NDIYO 11 2)HAPANA
a. Mboga ya ugali
b. Chambo kwa samaki/panya
c. Kuandaa vitafunwa kama sambusa
d. Chanzo cha mapato
e. Kukamuliwa mafuta
f. Chakula cha kuku/samaki
g. Nyingine……..(taja)
13. Je, hua unatumia mazao gani kuandaa chakula cha watoto wachanga na watoto
wadogo (miaka 1 had5)?
a) Nafaka b) Ndizi c) Mikunde d) Anakula nachokula
Nyinginezo………………………………………….(TAJA)
14. Je, umewahi kufanya au unafanya biashara ya senene? 1) NDIYO 2) HAPANA
Kama jibu ni Ndiyo, Je, Inakupatia sehemu gani ya kipato chako?
(a) Chote kukidhi mahitaji yangu yote (c) Kukidhi robo ya mahitaji
(b) Kidogo kukidhi nusu ya mahitaji (d) Hakuna faida
15. Je, ni njia zipi unazotumia kuhifadhi senene bila kupoteza ubora wake?
1) kubanika kwenye majani ya migomba 11) kurudia kukaanga 111) Nyingine
(Taja)………………………………………………………………………..
Ipi ni bora zaidi na ambayo hata baada ya muda mrefu senene hua na ladha
ileile……………………………………………………………………..
Ipi ambayo senene hubadilika ladha haraka (zinabadilikaje?kukereketa kooni au
etc.)………………………………………..
103
16. Je, kuna madhara yoyote kiafya ambayo yalishakupata kufuatia ulaji wa senene?
1) NDIYO 11)HAPANA
kama jibu ni NDIYO madhara gani ulipata
1) Kuhara 11) Kuumwa tumbo 111) kutapika 1V) kichefuchefu
V) Mengine..(taja)……………………………………………………………..
17. Je, unatumia senene kutengeneza/kuandaa vyakula vingine? Mfano mchuzi wa mboga,
kwenye ndizi za kupika ,unga wa senene n.k…
(elezea)………………………………………………………………………………………...
……………………………………………………………………………………………………
18. Yapi maoni yako juu ya matumizi ya senene katika kuandaa chakula cha
watoto..............................................................................................................................................
“Ahsante kushiriki kwani lishe bora ya jamii yetu ni jukumu letu sote”
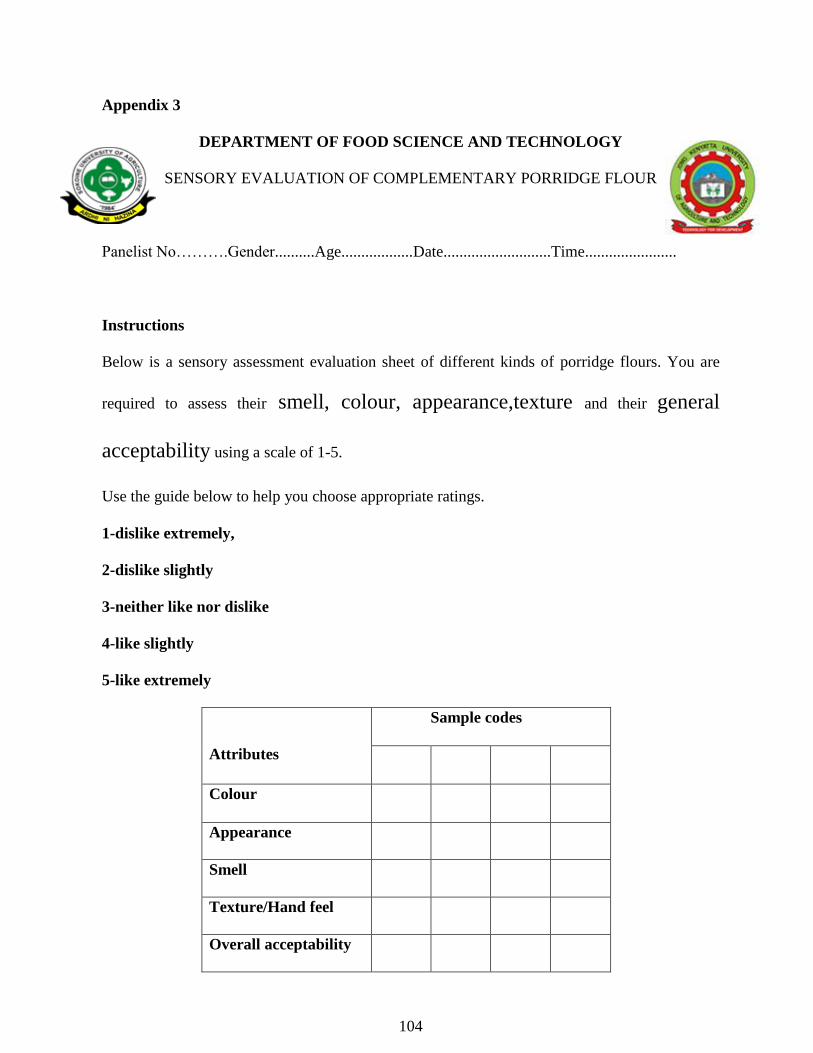
104
Appendix 3
DEPARTMENT OF FOOD SCIENCE AND TECHNOLOGY
SENSORY EVALUATION OF COMPLEMENTARY PORRIDGE FLOUR
Panelist No……….Gender..........Age..................Date...........................Time.......................
Instructions
Below is a sensory assessment evaluation sheet of different kinds of porridge flours. You are
required to assess their smell, colour, appearance,texture and their general
acceptability using a scale of 1-5.
Use the guide below to help you choose appropriate ratings.
1-dislike extremely,
2-dislike slightly
3-neither like nor dislike
4-like slightly
5-like extremely
Attributes
Sample codes
Colour
Appearance
Smell
Texture/Hand feel
Overall acceptability

105
Comments based on sample code(s)
..........................................................................................................................................................
...............................................................
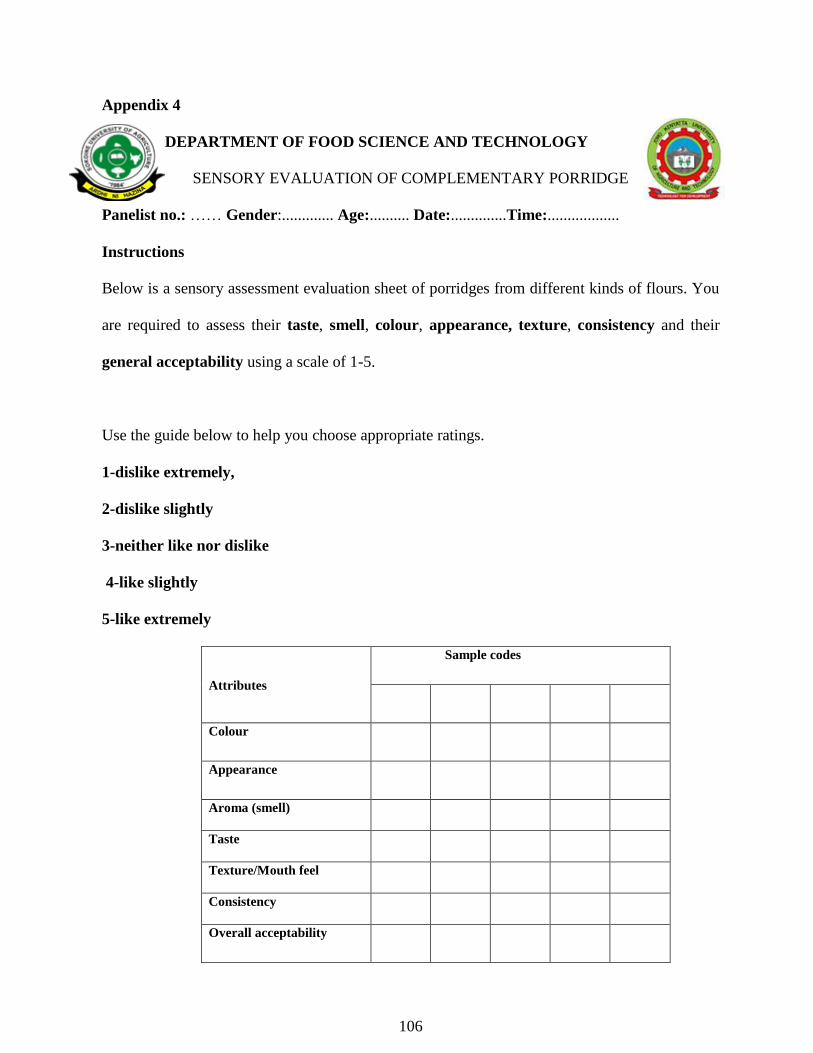
106
Appendix 4
DEPARTMENT OF FOOD SCIENCE AND TECHNOLOGY
SENSORY EVALUATION OF COMPLEMENTARY PORRIDGE
Panelist no.: …… Gender:............. Age:.......... Date:..............Time:..................
Instructions
Below is a sensory assessment evaluation sheet of porridges from different kinds of flours. You
are required to assess their taste, smell, colour, appearance, texture, consistency and their
general acceptability using a scale of 1-5.
Use the guide below to help you choose appropriate ratings.
1-dislike extremely,
2-dislike slightly
3-neither like nor dislike
4-like slightly
5-like extremely
Attributes
Sample codes
Colour
Appearance
Aroma (smell)
Taste
Texture/Mouth feel
Consistency
Overall acceptability

107
Comments based on sample code(s)
..........................................................................................................................................................
..............................................................

108
Appendix 5
DEPARTMENT OF FOOD SCIENCE AND TECHNOLOGY
Quantitative Descriptive Analysis form for complementary porridge flour
Name………………………Age……………………… Sex………...Time………………
Please evaluate each of the coded samples in the order they listed. Choose appropriate number in the
scale from 1 to 9, where 1 is low intensity and 9 is high intensity. How do you find the following
characteristics for the extruded snacks? Put the appropriate number against each characteristic.
Sample #..................................
Whiteness ________________________________________________________
Grey 1 2 3 4 5 6 7 8 9 very white
Colour (Brownish) ___________________________________________________________
Faint 1 2 3 4 5 6 7 8 9 very concentrated
Appearence_______________________________________________________________
Less appealing 1 2 3 4 5 6 7 8 9 very appealing
Hands feel (softness) _____________________________________________________________

109
Small size particles 1 2 3 4 5 6 7 8 9 larger particles
Aroma ____________________________________________________________
Not aromatic 1 2 3 4 5 6 7 8 9 very aromatic
Stickiness____________________________________________________________
Less sticky 1 2 3 4 5 6 7 8 9 very sticky
What is your total liking of the product?
________________________________________________________
Don’t like it 1 2 3 4 5 6 7 8 9 Like a lot

110
Appendix 6
DEPARTMENT OF FOOD SCIENCE AND TECHNOLOGY
Quantitative Descriptive Analysis form for complementary porridge
Name………………………Age……………………… Sex………...Time………………
Please evaluate each of the coded samples in the order they listed. Choose appropriate number in the
scale from 1 to 9, where 1 is low intensity and 9 is high intensity. How do you find the following
characteristics for the extruded snacks? Put the appropriate number against each characteristic.
Sample #..................................
Whiteness ________________________________________________________
Grey 1 2 3 4 5 6 7 8 9 very white
Colour ___________________________________________________________
Faint 1 2 3 4 5 6 7 8 9 very concentrated
Viscosity_______________________________________________________________
Less viscous 1 2 3 4 5 6 7 8 9 very
viscous
Sweetness______________________________________________________________

111
Less sweet 1 2 3 4 5 6 7 8 9 very sweet
Mouth feel __________________________________________________________
Poor feel 1 2 3 4 5 6 7 8 9 best feel
Aroma ____________________________________________________________
Not aromatic 1 2 3 4 5 6 7 8 9 very aromatic
Oiliness_______________________________________________________
Less oily 1 2 3 4 5 6 7 8 9 very oily
Appearance______________________________________________________
Less appealing 1 2 3 4 5 6 7 8 9 very appealing
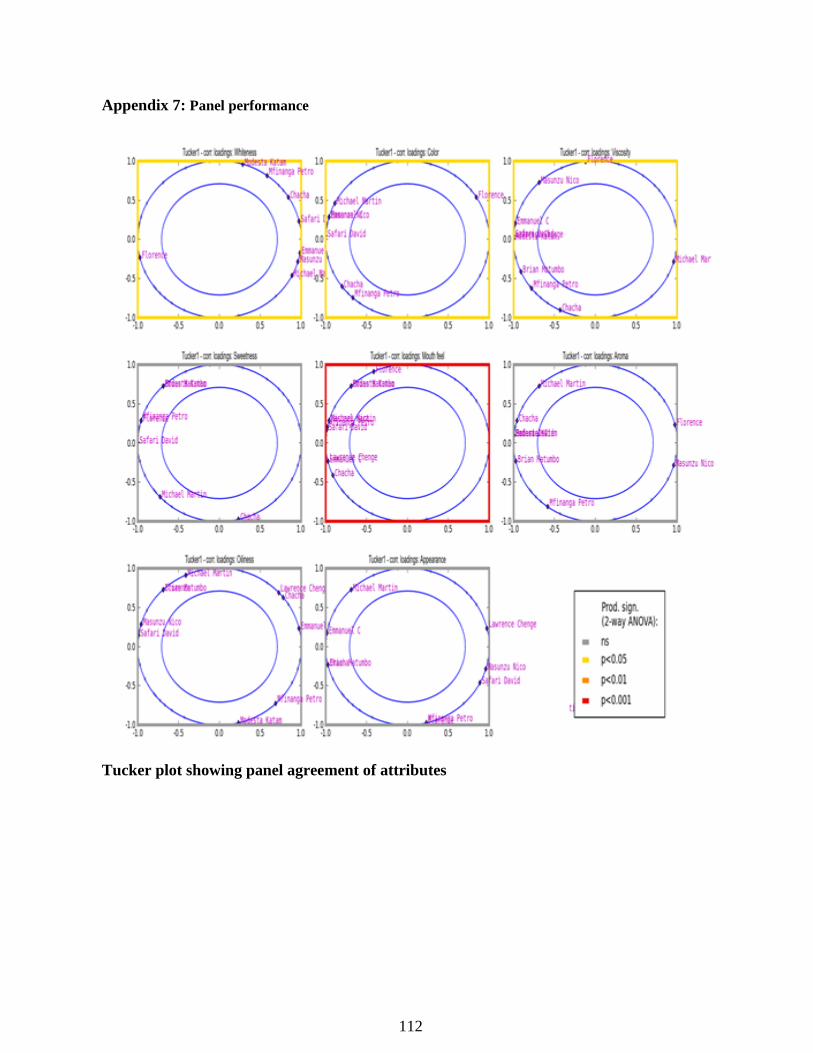
112
Appendix 7: Panel performance
Tucker plot showing panel agreement of attributes
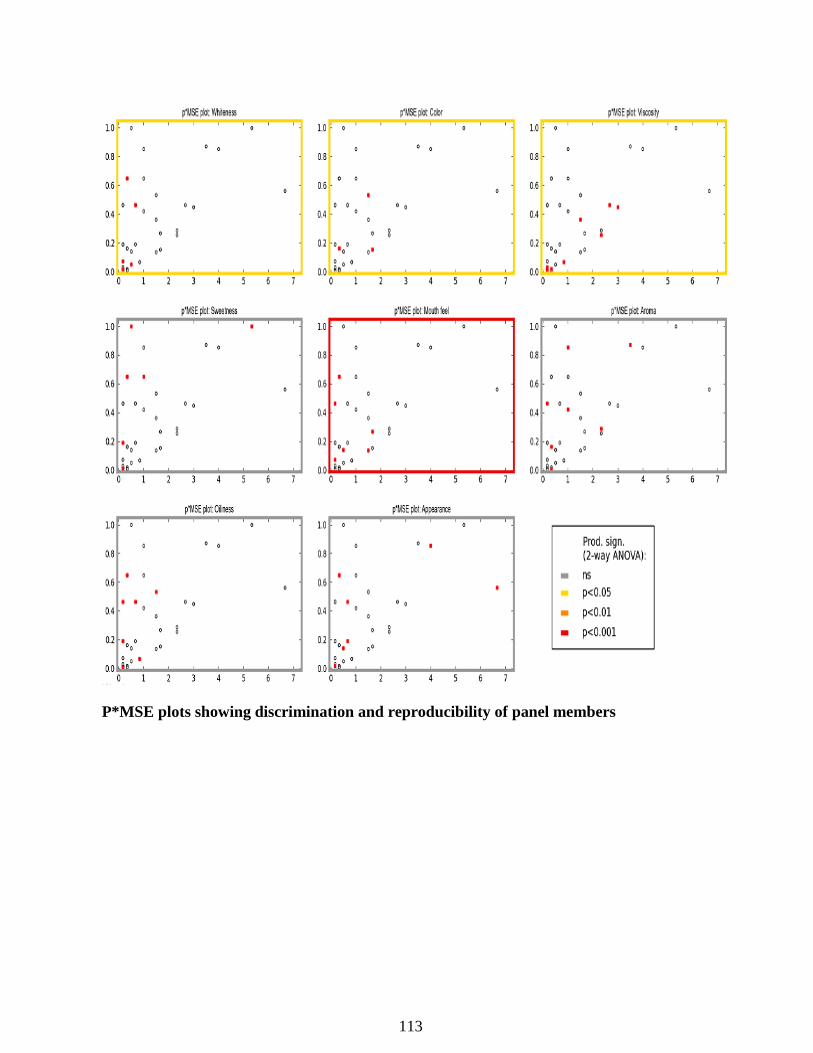
113
P*MSE plots showing discrimination and reproducibility of panel members
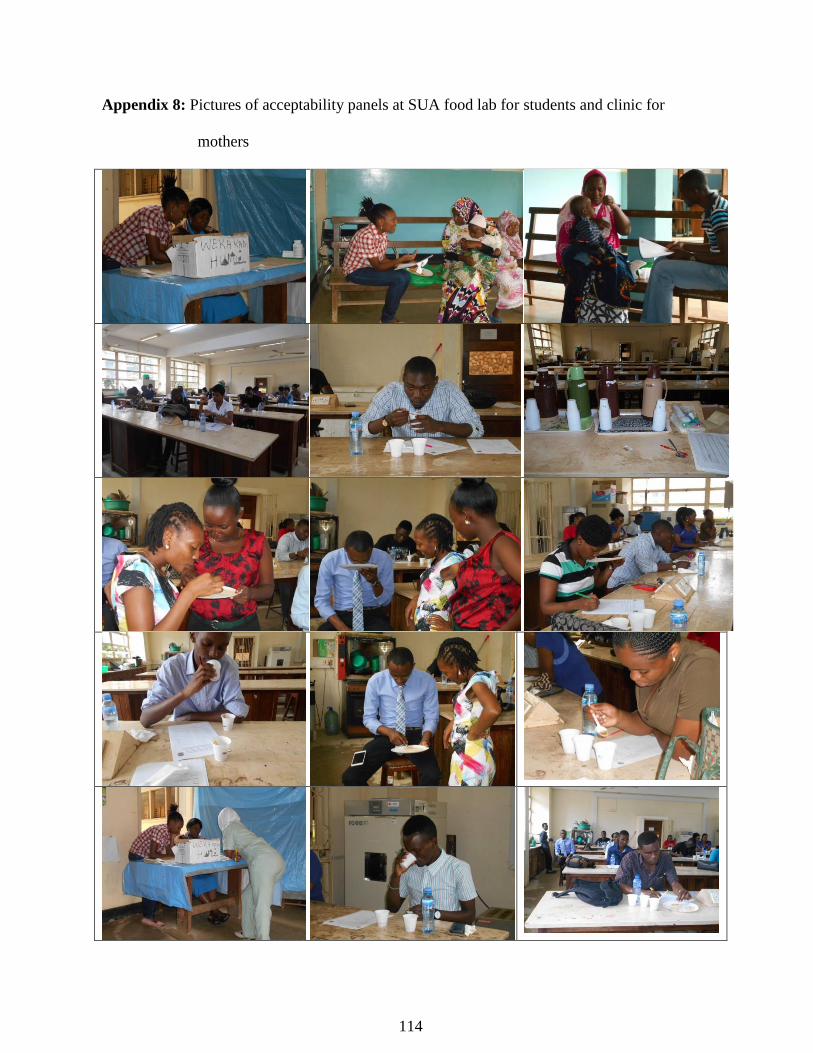
114
Appendix 8: Pictures of acceptability panels at SUA food lab for students and clinic for
mothers
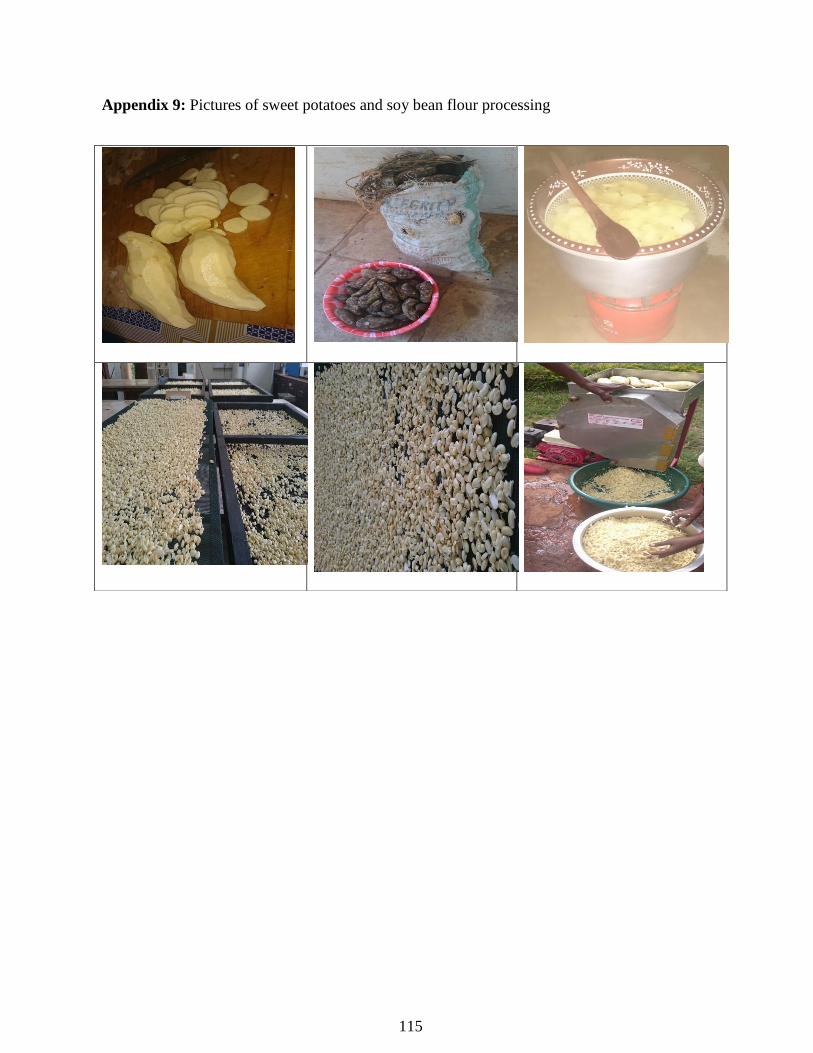
115
Appendix 9: Pictures of sweet potatoes and soy bean flour processing