Embed Size (px)
Citation preview

Synoptic observations of auroras along the postnoon oval:a survey with all-sky TV observations at Zhongshan,
Antarctica
H. Yanga,b,*, N. Satoa, K. Makitac, M. Kikuchia, A. Kadokuraa,M. Ayukawaa, H.Q. Hud, R.Y. Liub, I. HaÈ ggstroÈ me
aNational Institute of Polar Research, Tokyo 173-8515, JapanbPolar Research Institute of China, Shanghai 200129, People's Republic of China
cTakushoku University, Tokyo, JapandWuhan University, Wuhan 430072, People's Republic of China
eSwedish Institute of Space Physics, Kiruna, Sweden
Received 24 November 1999; received in revised form 7 February 2000; accepted 3 March 2000
Abstract
All-sky TV data obtained at Zhongshan, Antarctica, have been used to survey auroral displays along thepostnoon auroral oval. The auroral occurrence peak around 15 MLT, which was previously shown by satellite
observations, is con®rmed to exist in ground observations as well. The so called `midday gap' of discrete aurora,however, is not con®rmed by ground observations. This survey reveals that the noon region appears to involveanother auroral occurrence peak. The noon auroral peak observed from the ground is dominated by an aurora
termed as dayside corona in the present study. A dayside corona is usually weak and changing rapidly in itsappearance, luminosity and locale. The electron precipitation causing the dayside corona might be too soft, havereduced ¯ux and/or have too rapid a motion of its rayed structures which would result in less luminosity, all ofwhich could account for the `midday gap' in satellite observations. We thus argue for a new synoptic picture of
auroral displays along the postnoon oval, in which beside the 15 MLT peak, the noon region is ®lled with thedayside corona rather than a `gap' in discrete aurora. 7 2000 Elsevier Science Ltd. All rights reserved.
Keywords: Auroral display; Auroral oval; Postnoon sector; All-sky TV
1. Introduction
The auroral oval appears as a continuous ring of
emissions encircling the geomagnetic pole, in which
complex forms of discrete aurora (Akasofu, 1976;
Murphree et al., 1987; Rostoker et al., 1987; Evans,1985) are frequently found to be embedded in abroader, less structured di�use aurora (Lui and Anger,
1973). In its nightside part, phenomena such as auroralbulges, westward travelling surges, and omega bandsare repeatedly seen in the evening and morning sectors,
respectively (Akasofu, 1968), and have been long andextensively studied. In its dayside part, the polar cusp
Journal of Atmospheric and Solar-Terrestrial Physics 62 (2000) 787±797
1364-6826/00/$ - see front matter 7 2000 Elsevier Science Ltd. All rights reserved.
PII: S1364-6826(00 )00054-7
* Corresponding author. Tel.: +86-21-6861-0078; fax: +86-
21-5871-1663.
E-mail address: [email protected] (H. Yang).

is thought to be the region where the solar wind gains
direct entry to the magnetosphere, and for this magne-tospheric topology, midday aurorae have recently gen-erated great interest. However, the optical observations
of the dayside oval are rather di�cult to obtainbecause the sunlight interferes with optical measure-ments of aurorae in the visible range. In fact, midday
aurorae can only be observed in a very limited part ofthe polar region, where the geographic latitude is very
high and the magnetic latitude is 0758, and only in avery limited time near the local winter solstice.Meng and Lundin (1986) investigated the character-
istics of auroral displays in the noon sector by usinghundreds of defense meteorological satellite program
(DMSP) auroral images. They broke down the auroraldisplay/distribution in the midday part of the auroraloval into ®ve characteristic types, depending on the
geomagnetic activity and the Bz component of theinterplanetary magnetic ®eld (IMF). The occurrence ofdayside discrete aurorae is likely caused by the local
injection of magnetosheath plasma into the daysideboundary layer. An important characteristic found in
their type 2 and 3 auroral displays is the clear disconti-nuity between the dayside and nightside aurorae.On the other hand, based on the ground all-sky TV
observations at Godhavn, Greenland, Ayukawa et al.(1996) have studied two characteristic polar cap aur-
orae in the prenoon sector, the so-called polar arc andpolar corona. Using comparisons with the simultaneousDMSP particle data, they associated the polar arc with
<100 eV electron precipitation, suggesting that it orig-inates from a plasma mantle or low-latitude boundarylayer (LLBL) source, while the polar corona was re-
lated to electrons of a few hundred eV, attributed to aLLBL or boundary plasma sheet (BPS) origin. Using
ground observations, especially by the meridian scan-ning photometer observation at Ny AÊ lesund, Svalbard,a variety of auroral structures and activity in the 9±15
MLT sector has been documented, including the ``day-side breakup'' (Sandholt et al., 1993 and references
therein), and ``poleward moving auroral forms(PMAF)'' (Fasel et al., 1994 and Karlson et al., 1996).Several transient dayside auroral phenomena have
been tentatively discussed as possible signatures of var-ious plasma phenomena at the magnetopause and inthe adjacent boundary layers, such as Kelvin±Helm-
holtz instabilities, impulsive merging events, upstreampressure pulses and impulsive plasma penetration
across the magnetopause (Lundin and Evans, 1985;Fasel et al., 1992; Lee and Wei, 1993; Moen et al.,1994; Sandholt et al., 1994; Kan et al., 1996). How-
ever, to distinguish ionospheric signatures of the di�er-ent magnetospheric boundary layer processes remainsa problem, partly because these phenomena may not
be causally independent and some of the qualitativelydi�erent ionospheric footprints can be quite similar. In
fact, Lui and Sibeck (1991) showed that many pre-viously reported PMAFs, which were originally inter-
preted as ionospheric signatures of ¯ux transfer events(FTEs), could be associated with sudden increases inthe solar wind pressure. However, so far there has
been no systematic statistical study of dayside auroraldisplays carried out using all-sky TV observations.A well located all-sky TV camera can be very e�ec-
tive in inspecting the spatial distribution of auroralparticle precipitation along a particular part of theauroral oval and the temporal variations of such a dis-
tribution. The purpose of the present paper is to builda synoptic auroral display along the postnoon sectorof the auroral oval by statistically examining thecharacteristic auroras and their occurrence with the
all-sky TV data obtained at Zhongshan (69.378S,76.388E, geographic), Antarctica.
2. Methodology and data presentation
2.1. Observation
As mentioned above, a site for dayside aurora obser-
vations should meet certain requirements. ZhongshanStation's invariant magnetic latitude is 74.58, veryclose to the cusp latitude, and its MLT � UT� 1:3 h.
The earliest visible observations at Zhongshan are from01130 UT in the Austral winter season. The auroraloval might be quite dynamic, contracting poleward
during magnetically quiet periods and expanding equa-torward during disturbed periods. Nevertheless, a cal-culation based on the simpli®ed mathematical model
for the Feldstein statistical ovals by Holzworth andMeng (1975) reveals that an all-sky camera installed atZhongshan can cover the postnoon portion of the aur-oral oval under almost all conditions. Our aurora ob-
servations during 1997 were carried out using a newlydeveloped all-sky camera system which comprises aHARPICON (High-gain Avalanche Rushing Amor-
phous Photoconductor) TV camera ®tted with a ®sh-eye lens. A HARPICON tube utilizes an amorphousphotoconductive selenium target within which an ava-
lanche signal multiplication may be obtained under ahigh voltage. The signal multiplication within a photo-conductive ®lm is not accompanied by an increase indark current so that a HARPICON tube achieves a S/
N ratio as high as 57 dB. The lowest pickup light levelof this tube is 00.02 lx at a video rate of 30 frames,which is about one order of magnitude higher than
that of a SIT (Silicon Intensi®er Target) tube. In otherwords, HARPICON's sensitivity is about one order ofmagnitude worse than a SIT tube. In spite of that, its
low dark current allowed the exposure time for eachframe to be set to 2 s so that a sensitivity approxi-mately six times higher than that of a conventional
H. Yang et al. / Journal of Atmospheric and Solar-Terrestrial Physics 62 (2000) 787±797788
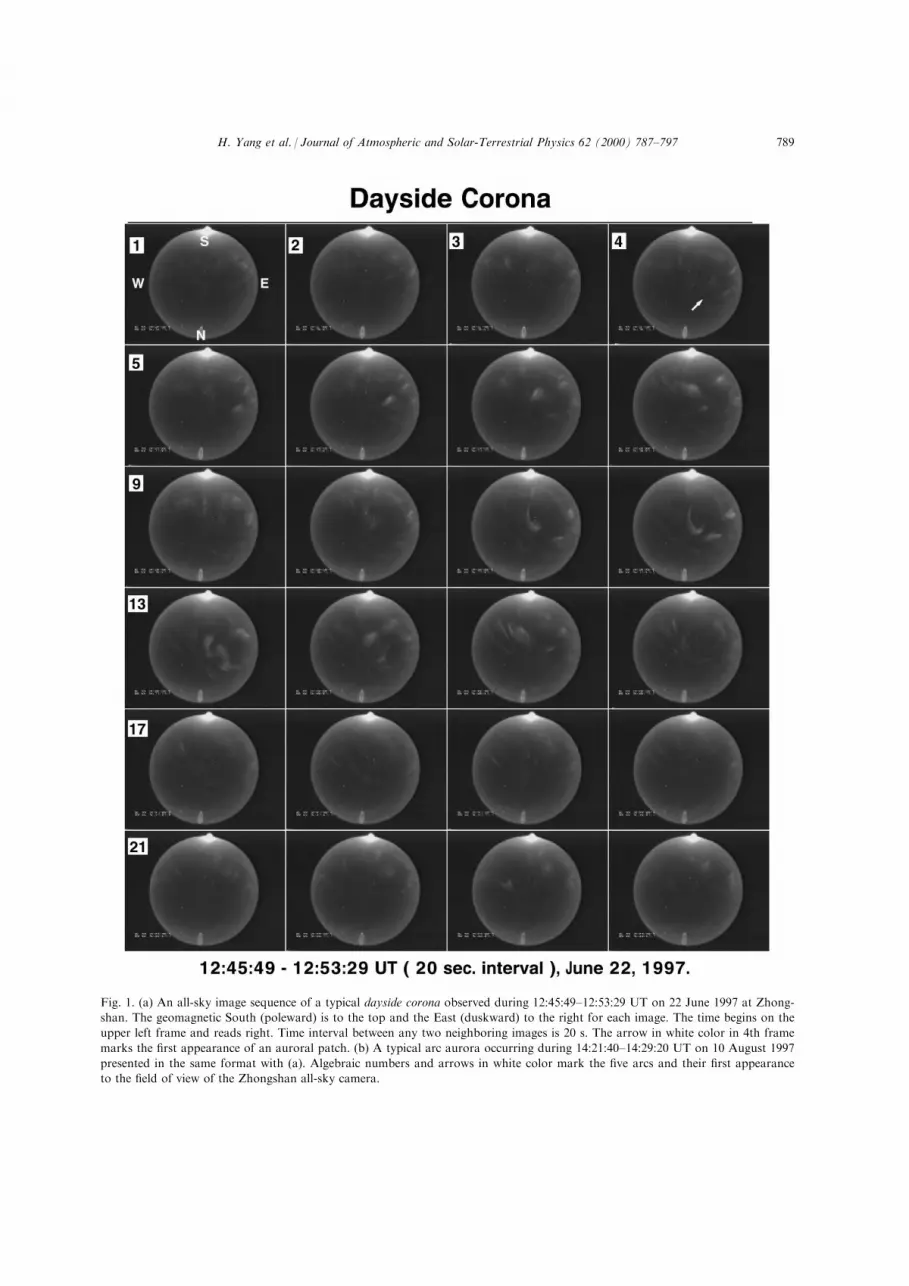
Fig. 1. (a) An all-sky image sequence of a typical dayside corona observed during 12:45:49±12:53:29 UT on 22 June 1997 at Zhong-
shan. The geomagnetic South (poleward) is to the top and the East (duskward) to the right for each image. The time begins on the
upper left frame and reads right. Time interval between any two neighboring images is 20 s. The arrow in white color in 4th frame
marks the ®rst appearance of an auroral patch. (b) A typical arc aurora occurring during 14:21:40±14:29:20 UT on 10 August 1997
presented in the same format with (a). Algebraic numbers and arrows in white color mark the ®ve arcs and their ®rst appearance
to the ®eld of view of the Zhongshan all-sky camera.
H. Yang et al. / Journal of Atmospheric and Solar-Terrestrial Physics 62 (2000) 787±797 789

SIT tube was achieved in observations. The spectro-
scopic response of the all-sky TV camera, however, is
such that sensitivity at wavelengths longer than 600.0
nm is so low that the recorded aurora is considered to
be mainly from N2+ 427.8 nm and OI 557.7 nm emis-
sions.
Fig. 1 (continued)
H. Yang et al. / Journal of Atmospheric and Solar-Terrestrial Physics 62 (2000) 787±797790

2.2. Auroral identi®cations
So far, many studies have been carried out on aur-
oral classi®cation. Based on auroral forms recorded onphotographs, for instance, StoÈ rmer (1955) de®ned 12elementary auroral forms under three divisions,
namely, (1) forms without ray structure, (2) forms withray structure, and (3) ¯aming aurora. StoÈ rmer'sscheme of classi®cation has been widely used and
accepted as a convenient basis for photographicallydistinguishing aurorae of di�erent types. Di�erentforms, however, were not sharply de®ned. Actually an
aurora tends to constantly change its form from onetype to another. An all-sky TV camera can be well
used in inspecting such displays of auroral develop-ment. Two typical auroral displays have been found inthe all-sky TV observations within the postnoon hours
at Zhongshan, which we name as dayside corona andarc aurora, respectively.A dayside corona is an auroral display in which
some discrete and small-scale auroral features sporadi-cally appear and disappear in the sky and rapidlychange in their forms, luminosity and locale. The aur-
oral features appearing in dayside coronas include theforms of rays, patches and drapery etc. as de®ned byStoÈ rmer (1955) and may merge one into another.
Fig. 1(a) illustrates a typical example for this categoryusing an all-sky image series starting from 12:45:49UT, June 22, 1997. The bright spot on the top and the
bright circle at the bottom in each frame are the moonand its re¯ection by the inner surface of the camera
dome. In the whole period of08 min, some bundles offaint rays are found here and there in the polewardsky of Zhongshan, changing their positions, appear-
ances and brightness with the time. In addition tothose rays, a weak patch appeared near the zenithfrom 12:46:29 UT (marked by a white arrow in the 4th
frame). The patch increased its brightness andexpanded with the time at ®rst, and started to rotateevolving into a brighter drapery from 12:49:09 UT
(11th frame). The drapery (11th to 15th frame) mani-fested the activity maximum of this dayside coronaand disappeared abruptly after the 16th frame. The 30
min average of the IMF BZ and the KP index coveringthe period of the event were 2.25 nT and 2, respect-ively.
An arc aurora is a process in which one or moreauroral features elongated in one direction appear sim-
ultaneously or one after another, changing in theirappearance, luminosity and locale. Fig. 1(b) shows all-sky images of a typical arc aurora occurring on August
10, 1997. As marked by arrows and algebraic numbersin white color in the ®gure, ®ve arcs in total are seento appear one by one in the 08 min interval starting
from 14:21:40 UT. Each arc came into sight faintly at®rst, increased gradually in its luminosity, and moved
bodily to a slightly higher latitude and faded there.The ®rst arc showed some folds during its lifetime. The
30 min average of the IMF BZ and the 3 h KP indexcovering the period of the event were ÿ0.97 nT and 1,respectively.
To investigate whether any aurora occurred during agiven period and, if it occurred, to judge its category,all auroral observations in the postnoon hours during
the year 1997 have been processed to produce mag-netic meridian scanning plots (keograms). A meridiankeogram is made by vertically cutting through the
zenith every 12 s on all-sky images in a basically 2-hvideo sequence obtained by the TV camera (Yang etal., 1997). Fig. 2 gives two sample keograms of theoccurrences of a corona aurora and of an arc aurora.
In contrasting the keogram of the corona aurora withthat of the arc aurora, one can easily see that the arcaurora is con®ned in a narrower latitudinal range and
changes more gradually than the corona aurora. Inthis study, the auroral type has been inferred usingkeograms based on these di�erences between them and
con®rmed by visual inspection with all-sky videoimages as well.It is worth pointing out that here the terminology,
Fig. 2. Geomagnetic meridian keograms for typical postnoon
aurorae observed at Zhongshan. The horizontal axis gives
time in UT, while the vertical axis re¯ects the zenith angles in
degrees; magnetic south is to the top. (a) A corona aurora
example during 1300±1500 UT, 22 June 1997; (b) an arc aur-
ora example during 1300±1500 UT, 27 May 1997.
H. Yang et al. / Journal of Atmospheric and Solar-Terrestrial Physics 62 (2000) 787±797 791

dayside corona, does not strictly adhere to the originalde®nition given to the nightside corona, for which
many rays appearing near the zenith is an essential fea-ture. Based on a meridian keogram, an aurora of widelatitudinal extent may be identi®ed as a corona.
Speci®cally, the attribute of a corona, `with ray struc-ture', is altered to `of wide latitudinal extent'. By thisde®nition an aurora showing any form of patch, drap-
ery, or rays away from the zenith, which may be listedas independent categories elsewhere, falls in the cat-egory of the corona aurora.
2.3. Data set and statistical method
Optical observations were as a rule unavailable in
cloudy or snowy weather, so that only the observationsin good weather were analyzed in this study. The post-noon interval from 1130 to 1730 UT (1245 to 1845 in
MLT) was divided into 12 bins of 30 min duration andone observation in each bin is called a statistic event.In 1997, in total 238 h of auroral TV observations
were obtained in the postnoon interval at Zhongshan.All the data were processed into meridian keogramsand 476 events were obtained for this survey. Among
these events some observations detected no aurora.They are called non-aurora events. Those in which theaurora was identi®ed are termed here auroral events.The auroral events were further divided into two cat-
egories according to keogram characteristics, namelythe dayside corona and the arc aurora, which have beendescribed above in detail.
Fig. 3 summarizes the distributions of the auroraand non-aurora events with event number scale on the
right axis. The non-aurora bars are stacked on the cor-responding aurora bars, so that one can easily ®nd outthe total event number (or observation days) for each
bin. The least total event-number is 12, which occursin the bin for 1130±1200 UT. This bin had the leastnumber of observation days because it is closest to
Zhongshan's local noon �LT � UT� 5:1 h) and thusgets the most interference by sunlight. After 1200 UT,the total event number increases and in the 1530±1600
UT bin reaches its maximum of 57. After 1600 UT thetotal event number decreases unexpectedly. In fact,even after 1730 UT, i.e. the last bin, one should expectan increase in total event number, since it is still before
Zhongshan's local midnight. We have examined thereason for this decline in event number and found thatit is arti®cial. During the operation period, some tapes
without aurora were overwritten by later observationsfor the purpose of saving tapes. Fortunately such over-writing was only done for the tapes recorded during
the interval 1600±1800 UT. The overwriting of non-aurora tapes caused the loss of the non-aurora events,hence the decline of total event numbers after 1600
UT. It may have resulted in overestimate of the aur-oral occurrence after 1600 UT; however, fortunately, itdoesn't a�ect our conclusions seriously because suchoverestimate is to some extent reducible (Concerning
this point, we will consider it in detail in the discussionof Fig. 3).
2.4. Auroral occurrence
Within each bin, the auroral occurrence rate was cal-culated as the auroral event number divided by thetotal event number obtained in 1997. The thick line inFig. 3 shows the auroral occurrence rates as a function
of MLT during the postnoon hours of Zhongshan. Toreduce the overestimate arising from the arti®cial dis-carding of non-aurora events, the aurora occurrence
rates after 1600 were also calculated by assuming thetotal event number of those bins to be 57, i.e. themaximum of this data set and delineated by a dashed
line. It is clear that after 1600 UT the corrected auroraoccurrence declines as the solid line does, but decaysmore steeply.From the occurrence curve in Fig. 3, the auroral
occurrence can be seen to generally decline from 1200to 1730 UT, but two local peaks can be seen. Onepeak arises around 1200±1230 UT (1315±1345 MLT).
A lower peak occurs about 1430±1500 UT (1545±1615MLT). Recently the global distribution of auroraloccurrence has been investigated via massive statistical
studies using satellite particle or imagery observations(e.g. Newell et al., 1996; Liou et al., 1997). Forinstance, from the Plate 1 by Liou et al. (1997), which
Fig. 3. Event and auroral occurrence distributions for the 12
time bins in the postnoon sector at Zhongshan. The left/right
vertical axis gives the occurrence rate/the event number scale,
while the horizontal axis shows time in UT. The number of
aurora/non-aurora event is represented by slashed/empty bars
while the aurora occurrence is shown by the thick line with
solid circles. The gray empty bars show the compensated
numbers for the arti®cial discarding of non-aurora events.
The dashed line with small circles shows the corrected occur-
rence rates.
H. Yang et al. / Journal of Atmospheric and Solar-Terrestrial Physics 62 (2000) 787±797792

shows the northern auroral occurrence distribution bythe average auroral UV emission (LBHL band,
l01700250 AÊ ) in a geomagnetic latitude Ð localtime coordinate system, three distinctly di�erent aur-oral regions can be found along the northern auroral
oval. The strongest emission is located in the pre-mid-night sector centered at 2230 MLT and 688 MLAT,where substorms are usually expected to appear. In the
postnoon sector, a weaker emission region can befound around 15 MLT and 758 MLAT which has beencalled the `15MLT hot spot'. A much weaker emission
may be seen in the prenoon sector centered about 09MLT. Taking into account the invariant latitude ofZhongshan, and comparing the occurrence curve inFig. 3 with the average UV emission map, it is evident
that the afternoon peak around 1430±1500 UT is tem-porally coinciding with the so-called `15MLT hotspot'. However, no counterpart can be found for the
noon peak of Zhongshan's auroral occurrence. In fact,from the results of satellite observations such asDMSP visible imagery and DMSP particles (Meng and
Lundin, 1986; Newell et al., 1996), this region alsoappeared to be the least likely local time for observingdiscrete aurora. It was thus called the `midday gap'.
Therefore, the noon auroral peak is a new featurefound in ground observations.
2.5. Occurrence of speci®c auroral types
As stated above, the postnoon aurorae can be classi-®ed into two distinct types according to their basicforms, i.e. the dayside corona and the arc aurora. In
order to look into the two-peak feature of the post-noon auroral occurrence, a statistical examination hasbeen undertaken. In each bin, the occurrence rate for
each aurora type was computed as the event numberof this aurora type divided by the total event numberobtained during 1997. If, within a given bin, two di�er-
ent auroras were recognized in one day's observation,both types of aurora were counted. Thus in some bins,the total aurora occurrence rate summed over the twoaurora types is slightly larger than the value given in
Fig. 3.Fig. 4 presents the auroral occurrence rates as a
function of MLT for the two distinct aurora types.
Strikingly, the occurrences of the two auroral typesshow distinctly di�erent MLT dependences. The occur-rence of the dayside corona declines monotonically
from the very beginning of 1130 UT (1245 MLT) ofthe interest period and decays abruptly after 1400 UT(1515 MLT), reaches zero after 1630 UT, while the arc
aurora appears after 1200 UT (1315 MLT) and showsa peak between 1430±1600 UT (1545±1715 MLT).Consequently, the noon peak of the auroral occurrenceis dominated by the dayside corona, while afternoon
peak is mainly contributed by the arc aurora.
3. Discussion and conclusion
The survey with one year's all-sky TV observationat Zhongshan revealed that in addition to the `15MLT hot spot' revealed by satellite observations, thereexists a new occurrence peak near noon, where it has
so far been thought to be a `midday gap' of discreteaurora on satellite observations. Morphologically, thepostnoon discrete aurorae can be divided into two cat-
egories, namely the dayside corona aurora and the arcaurora. The noon peak is dominated by the daysidecorona while the afternoon peak is mainly comprised
of the arc aurora.Dayside coronas usually appear at latitudes pole-
ward of Zhongshan and may move bodily equator-ward (see the upper panel of Fig. 2). Constituents
inside a dayside corona often show ray structureand are rapidly changing in their appearances, pos-itions and luminosity. A dayside corona can last for
well over 1 h but its luminosity is usually very low.The closer it is to the noon, the more likely a day-side corona is to be observed. The occurrence rate
of the corona aurora in the 1130±1200 UT bin isas high as 0.75. From the all-sky characteristics ofa dayside corona, i.e. showing ray structure and
Fig. 4. Occurrence rate versus MLT distributions of the two
typical postnoon aurorae. The thin line with concentric
squares represents the corona aurora, while the thick line with
solid circles stands for the arc aurora. The dashed line with
small circles gives the corrected arc occurrence.
H. Yang et al. / Journal of Atmospheric and Solar-Terrestrial Physics 62 (2000) 787±797 793

very low brightness, the particles responsible for the
dayside corona should be relatively softer and of
lower ¯ux. That the noon auroral peak of ground
observation is mainly composed of a rapidly-chan-
ging dayside corona, and that the particles causing
the corona are relatively softer and/or have reduced
¯ux, might account for the `midday gap' of discrete
aurora in satellite observations.
An arc aurora in postnoon sector may apparently
move poleward (see Fig. 1 (a)), in addition toward the
equator (see the lower panel of Fig. 2). In contrasting
a corona aurora, an arc aurora is con®ned in a nar-
rower latitudinal range. Whether an aurora observed
in daytime is of dayside or nightside magnetospheric
origin is debatable. Fig. 5 displays an arc aurora
occurring on June 2, 1997 which was ®rst detected by
the DMSP F13 satellite and 02 h later entered the
®eld of view of the Zhongshan all-sky TV camera.
Multiple arc structure is clearly seen on both of the
all-sky image of Fig. 5(a) and the DMSP F13 visible
image of Fig. 5(b). From the DMSP image, these arcs
apparently extend from the cusp region rather than
from the night side. Latitude pro®les of electron and
ion precipitation ¯uxes observed by the satellite are
shown in Fig. 5(c). The electron precipitation in these
arcs has an average energy ¯ux of 01010 eV cmÿ2 sÿ1
srÿ1 with a characteristic energy of 1 keV or less,
lower than the nightside arc precipitation (Newell et
al., 1996). Hence, this arc aurora may be identi®ed as
dayside origin. Many (but not all) observations of arc
aurora in the postnoon sector were in the form of mul-
tiple arcs. It is also noted that the afternoon arc aurora
peak coincides with the peak of region 1 upward ®eld
aligned currents (Iijima and Potemra, 1978).
In summary, we propose a synoptic picture of aur-
oral distribution along the postnoon southern oval in
Fig. 6, which is composed of the two basic auroral
types. For a typical auroral display along the postnoon
oval, dayside coronas (marked in stars) appear ®rst
shortly after the noon, lasting for 1±3 h, and are fol-
lowed by the activity of faint dayside arcs (slashed
traces), which may have greatly contributed to the aur-
oral peak around 15 MLT. Thereafter a short period
of low auroral activity follows, and ®nally some bright
arcs (solid traces) extending from the nightside oval
come into sight. We draw nightside arcs in this picture
to re¯ect the fact that arcs of both dayside and night-
side magnetospheric origin may coexist in the post-
noon sector (Meng and Lundin, 1986). An important
®nding of this study is that the noon region of the oval
does not feature a `gap' of discrete aurora; instead, it
is occupied by aurorae that we name dayside corona.
The dayside corona occurrence peak discovered in this
study is found in an area where the origin of precipi-
tation may come from a number of di�erent magneto-
spheric regions (Newell and Meng, 1992). Future
studies should include further subdividing the dayside
corona and associating them speci®cally with those
possible source regions.
It is worth to notice that the spectroscopic response
characteristic of the HARPICON tube adopted in our
observations excludes the OI 630.0 nm emission which
Fig. 5. An example of an arc aurora simultaneously observed by the Zhongshan all-sky TV camera and by the DMSP F13 satellite
on June 2, 1997. (a) An all-sky image of the arc aurora at 15:41:33 UT. (b) Visible image scanned along the DMSP F13 track,
where Zhongshan is marked by a red circle on the Antarctica coastline (in blue color) and the cusp marked by a green plus to the
upper left corner. The green line in the middle illustrates the trajectory of the DMSP. (c) The upper two panels show the electron
and ion ¯ux and averaged electron and ion energy in logarithmic scales, lower two panels display electron and ion energy spectra
versus latitude/time along the satellite track.
H. Yang et al. / Journal of Atmospheric and Solar-Terrestrial Physics 62 (2000) 787±797794

is frequently observed in cusp latitudes. Such an exclu-
sion of the OI 630.0 nm aurorae may have reduced the
values of auroral occurrence rates to some extent, but
in spite of that it couldn't a�ect the basic conclusion
of the two-peak feature in the postnoon auroral occur-
rence. When particles responsible for OI 630.0 nm
emission and those for OI 557.7 nm emission are preci-pitating from a common magnetospheric source, the
OI 630.0 nm aurora should basically appear in thesame form as the OI 557.7 nm aurora, although it maybe found in higher altitudes than the OI 557.7 nm aur-
ora. It is especially true when auroral forms being dis-
Fig. 5 (continued)
H. Yang et al. / Journal of Atmospheric and Solar-Terrestrial Physics 62 (2000) 787±797 795

cussed are de®ned in our classi®cation scheme. Par-ticles causing OI 630.0 nm aurorae, however, may
have di�erent magnetospheric sources from those forOI 557.7 nm aurorae. In such a case the inclusion ofOI 630.0 nm aurorae may involve some independentaurora categories beyond the present classi®cation
scheme for the postnoon auroras. Therefore, mono-chromatic all-sky TV observations on the OI 630.0 nmemission are indispensable in future all-sky TV obser-
vations and it could greatly contribute in spectroscopicclassi®cation of the postnoon aurorae and in inferringof the characteristics of the source particles.
Acknowledgements
This study has been supported by the NationalScience Foundation of China, Chinese Arctic and Ant-arctic Administration and by the Ministry of Edu-
cation, Science, Sports, and Culture, Japan. One of theauthors, HY, thanks the Japan Society for the Pro-motion of Science (JSPS) for o�ering him the opportu-
nity to carry out this study in Japan. It is a greatpleasure to thank Prof. S Okano for his valuable dis-cussions and Drs. T. Ono, M. Taguchi, Y. Sanoo, and
M. Nishino for their e�orts in installing the opticalsystem at Zhongshan. DMSP particle data wereobtained from the online site of P. Newell and col-
leagues at the Johns Hopkins University Applied Phy-sics Laboratory. The DMSP SSJ/4 particle detectors
were built and calibrated by D. Hardy and F. Rich ofthe Air Force Geophysical Laboratory.
References
Akasofu, S.-I., 1968. Polar and Magnetospheric Substorms.
Reidel, Norwell, MA.
Akasofu, S.-I., 1976. Recent progress in studies of DMSP
photographs. Space Science Review 19, 169±215.
Ayukawa, M., Makita, K., Yamagishi, H., Ejiri, M., Sakanoi,
T., 1996. Characteristics of polar cap aurora. Journal of
Atmospheric and Terrestrial Physics 58, 1885±1894.
Evans, D.S., 1985. The characteristics of a persistent auroral
arc at high latitude in the 1400 MLT sector. In: Holtet,
J.S., Egeland, A. (Eds.), Polar Cusp. Reidel, Norwell, MA.
Fasel, G.J., Minow, J.I., Lee, R.W., Smith, R.W., Deehr,
C.S., 1994. Poleward-moving auroral forms: what do we
really know about them. In: Holtet, J.A., Egeland, A.
(Eds.), Physical Signatures of Magnetospheric Boundary
Layer Processes. Kluwer Academic Publishers, Dordrecht,
pp. 211±226.
Fasel, G.J., Minow, J.I., Smith, R.W., Deehr, C.S., Lee, L.C.,
1992. Multiple brightenings of transient dayside auroral
forms during oval expansions. Geophysical Research
Letters 12, 2429±2432.
Holzworth, R.H., Meng, C.-I., 1975. Mathematical represen-
tation of the auroral oval. Geophysical Research Letters 2,
377±380.
Iijima, T., Potemra, T.A., 1978. Large-scale characteristics of
®eld-aligned currents associated with substorms. Journal
of Geophysical Research 94, 599±616.
Karlson, K.A., Oieroset, M., Moen, J., Sandholt, P.E., 1996.
A statistical study of ¯ux transfer event signatures in the
dayside aurora: the IMF By-related prenoon±postnoon
asymmetry. Journal of Geophysical Research 101, 59±68.
Kan, J.R., Deehr, C.S., Lyu, L.H., Newell, P.T., 1996.
Ionospheric signatures of patchy-intermittent reconnection
at dayside magnetopause. Journal of Geophysical
Research 101, 10939±10945.
Lee, L.C., Wei, C.Q., 1993. Interaction of solar wind with
magnetopause-boundary layer and generation of magnetic
impulse events. Journal of Atmospheric and Terrestrial
Physics 55, 967±978.
Liou, K., Newell, P.T., Meng, C.-I., Brittnacher, M., Parks,
G., 1997. Synoptic auroral distribution: a survey using
polar ultraviolet imagery. Journal of Geophysical
Research 102, 27197±27205.
Lui, A.T.Y., Anger, C.D., 1973. A uniform belt of di�use
auroral emission seen by the ISIS-2 scanning photometer.
Planetary and Space Science 21, 799±809.
Lui, A.T.Y., Sibeck, D.G., 1991. Dayside auroral activities
and their implications for impulsive entry processes in the
dayside magnetosphere. Journal of Atmospheric and
Terrestrial Physics 53, 219±229.
Lundin, R., Evans, D.S., 1985. Boundary layer plasmas as a
source for high latitude, early afternoon, auroral arcs.
Planetary and Space Science 32, 1389±1406.
Meng, C.-I., Lundin, R., 1986. Auroral morphology of the
Fig. 6. A schematic of auroral displays along the southern
postnoon oval. The postnoon auroral con®guration can be
broken down into two basic categories based on the de®ning
features of the auroral forms, namely, the dayside corona
(stars) and the arc aurora. The arc aurora is further subdi-
vided into dayside arc (dashed traces) and nightside arc (solid
traces) that may extend into the afternoon sector.
H. Yang et al. / Journal of Atmospheric and Solar-Terrestrial Physics 62 (2000) 787±797796

midday oval. Journal of Geophysical Research 91, 1572±
1584.
Moen, J., Sandholt, P.E., Lockwood, M., Egeland, A., Fukui,
K., 1994. Multiple, discrete arcs on sunward convecting
®eld lines in the 14±15 MLT region. Journal of
Geophysical Research 99, 6113±6123.
Murphree, J.S., Cogger, L.L., Anger, C.D., Wallis, D.D.,
Shepherd, G.G., 1987. Oval intensi®cations associated
with polar arcs. Geophysical Research Letters 14, 403±406.
Newell, P.T., Meng, C.-I., 1992. Mapping the dayside iono-
sphere to the magnetosphere according to particle precipi-
tation characteristics. Geophysical Research Letters 19,
609±612.
Newell, P.T., Lyons, K.M., Meng, C.-I., 1996. A large survey
of electron acceleration events. Journal of Geophysical
Research 101, 2599±2614.
Rostoker, G.A., Lui, A.T.Y, Anger, C.D., Murphree, J.S.,
1987. North±south structures in the midnight sector aur-
oras as viewed by the Viking imager. Geophysical
Research Letters 14, 407±410.
Sandholt, P.E., Moen, J., Rudland, A., Opsvik, D., Denig,
W.F., Hansen, T., 1993. Auroral event sequences at the
dayside polar cap boundary for positive and negative
interplanetary magnetic ®eld BY: Journal of Geophysical
Research 98, 7737±7755.
Sandholt, P.E., Moen, J., Rudland, A., Opsvik, D., Denig,
W.F., Hansen, T., 1994. Cusp/cleft auroral activity in re-
lation to solar wind dynamic pressure, IMF BZ and BY:Journal of Geophysical Research 99, 17323±17342.
StoÈ rmer, C., 1955. The Polar Aurora. Clarendon Press,
Oxford.
Yang, H., Liu, R., Huang, D., Kikuchi, M., Minatoya, H.,
Sato, N., Tian, W., 1997. An all-sky auroral video image
analyzing system. Acta Geophysica Sinica 40, 606±615.
H. Yang et al. / Journal of Atmospheric and Solar-Terrestrial Physics 62 (2000) 787±797 797


