Embed Size (px)
Citation preview

Journal of Molecular Structure 982 (2010) 33–44
Contents lists available at ScienceDirect
Journal of Molecular Structure
journal homepage: www.elsevier .com/ locate /molst ruc
Synthesis, spectroscopic and mesomorphic studies on heterocyclic liquidcrystals with 1,3-oxazepine-4,7-dione, 1,3-oxazepane-4,7-dioneand 1,3-oxazepine-1,5-dione cores
Guan-Yeow Yeap ⇑, AbdulKarim-Talaq Mohammad, Hasnah OsmanSchool of Chemical Sciences, Universiti Sains Malaysia, Minden 11800, Penang, Malaysia
a r t i c l e i n f o a b s t r a c t
Article history:Received 3 June 2010Received in revised form 21 July 2010Accepted 26 July 2010Available online 16 August 2010
Keywords:1,3-Oxazepine-4,7-diones1,3-Oxazepane-4,7-diones1,3-Oxazepine-1,5-dionesFT-IRNMRNematic phase
0022-2860/$ - see front matter � 2010 Elsevier B.V. Adoi:10.1016/j.molstruc.2010.07.043
⇑ Corresponding author. Fax: +60 (0) 4 6574854.E-mail addresses: [email protected], gyyeap_liqc
Yeap).
Three series of newly derived 3-substituted-phenyl-2-(4-(tetradecyloxy)phenyl)-2,3-dihydro-1,3-oxazepine-4,7-diones, 3-substituted-phenyl-2-(4-(tetradecyloxy)phenyl)-1,3-oxazepane-4,7-diones and4-substituted-phenyl-3-(4-(tetradecyloxy)phenyl)-3,4-dihydrobenzo[e][1,3]-oxazepine-1,5-diones havebeen synthesized from the reactions of 4-substituted-N-(4-(tetradecyloxy)benzylidene)aniline deriva-tives with maleic, succinic and phthalic anhydride. All structures were elucidated by physical measure-ments and the bonding characteristics of the resulting compounds were substantiated by FT-IRspectroscopy. Their molecular structures are supported by the 1H and 13C NMR spectra along withtwo-dimensional COSY, NOESY, HMQC and HMBC. The effect from different substituents upon thermaland mesomorphic behaviour has been investigated by differential scanning calorimetry and polarizingoptical microscopy, respectively. All compounds possess relatively high phase transition temperatureswith only 4-phenyl-3-(4-(tetradecyloxy)phenyl)-3,4-dihydrobenzo[e][1,3]oxazepine-1,5-dione exhibitedthe texture characteristics of the nematic phase.
� 2010 Elsevier B.V. All rights reserved.
1. Introduction
It has been documented that benzoxazepines are important inthe diverse fields of heteroatom chemistry and biochemistry owingto its wide range of biological activities [1–4]. One of the factors indetermining the nature of these compounds can be attributed tothe presence of the Schiff base or imine group. The advantage ofincorporating Schiff base into benzoxazepines can be ascribed tothe possibility of exhibiting liquid crystalline behaviour as thatshown by 4-methoxybenzyliden-40-butylaniline [5]. In relation tothis, the mesomorphic properties of aromatic Schiff base esters withsubstituents varying in their polarities have been reported [6–8].
A large number of these analogues containing heterocyclic unitshave hitherto been synthesized [9–17]. In principle, the heterocy-clic unit is of great importance as core particularly in the thermo-tropic liquid crystals and this can be due to their ability to impartlateral and/or longitudinal dipoles coupled with the changes inmolecular shape [18,19]. In this paper we reported the preparationof the new compounds derived from 3-substituted-phenyl-2-(4-(tetradecyloxy)phenyl)-2,3-dihydro-1,3-oxazepine-4,7-diones,3-substituted-phenyl-2-(4-(tetradecyloxy)phenyl)-1,3-oxazepane-4,
ll rights reserved.
[email protected] (G.-Y.
7-diones and 4-substituted-phenyl-3-(4-(tetradecyloxy)phenyl)-3,4-dihydro-benzo[e][1,3]-oxazepine-1,5-diones. The structures forall the title compounds were characterized by FT-IR and NMR (1H,13C, COSY, NOESY, HMQC and HMBC). The phase transition temper-atures and enthalpy values of the title compounds were measuredby differential scanning calorimetry (DSC) and the textures of themesophases were studied using polarizing optical microscope(POM).
2. Experimental
Whilst 4-hydroxybenzaldehyde, maleic anhydride, succinicanhydride and phthalic anhydride were obtained from Aldrichm,the aniline, 4-nitroaniline 4-phenylenediamine, 4-bromoanilineand 1-bromotetradecane were obtained from Merck. They wereused without further purification. Thin-layer chromatography(TLC) was performed on silica-gel plates. Benzene and THF weredried by standard method.
2.1. Synthesis
2.1.1. Synthesis of 4-(tetradecyloxy)benzaldehyde4-(Tetradecyloxy)benzaldehyde was prepared following the
method described by Catanescu [20]. p-Hydroxybenzaldehyde(0.1 mol, 12.2 g) in 25 ml of DMF was placed in a 250 ml two-necked

Table 1Physical and analytical data of compounds 2a–5a, 2b–5b and 2c–5c.
Compounds m.p. �C Yield% Molecular formula Elemental analysis %, found (calculated)
C H N
2a 131–132 47 C31H40BrNO4 65.85 (65.26) 7.76 (7.07) 2.07 (2.45)3a 74–75 40 C31H41NO4 75.10 (75.73) 8.04 (8.41) 2.93 (2.85)4a 104–105 52 C31H40N2O6 69.12 (69.38) 7.76 (7.51) 5.35 (5.22)5a 110–111 59 C31H42N2O4 73.06 (73.49) 8.25 (8.36) 5.67 (5.53)2b 156–157 61 C31H42BrNO4 65.38 (65.03) 7.60 (7.39) 2.13 (2.45)3b 123–124 59 C31H43NO4 75.11 (75.42) 8.93 (8.78) 2.14 (2.84)4b 82–83 58 C31H42N2O6 69.58 (69.12) 7.09 (7.86) 5.67 (5.20)5b 130–131 63 C31H44N2O4 73.62 (73.19) 8.37 (8.72) 5.19 (5.51)2c 105–106 61 C35H42BrNO4 67.13 (67.74) 6.17 (6.82) 2.47 (2.26)3c 98–99 60 C35H43NO4 77.16 (77.60) 8.21 (8.00) 2.09 (2.59)4c 128–129 40 C35H42N2O6 71.37 (71.65) 7.02 (7.22) 4.25 (4.77)5c 133–134 53 C35H44N2O4 75.11 (75.51) 7.68 (7.97) 5.21 (5.03)
1a-1d
2a-5a 2b-5b 2c-5c
R= Br, H, NO2 and NH2
HOO
H+ C14H29Br
i. DMF
ii. Na2CO3 anh.iii. rf
C14H29OO
HR NH2
i. Ethanol
ii. rf
+
R N CH
OC14H29
1 2
3
45
678
910
11
12 13
1´to 14´
i. Malic anhydride
ii. Dry benzene
iii. rf
i. Succinic anhydride
ii. Dry benzene
iii. rf
i. Phthalic anhydride
ii. Dry benzene
iii. rf
ONO
O
O
R
1 2
3
45
6
8
910
117
1213
51 41
16
17
1´
2´3´
4´
5´
6´7´
8´
9´
10´
11´
12´
13´
14´
ONO
O
O
R
1 2
3
45
6
8
910
117
1213
51 41
16
17
1´
2´3´
4´
5´
6´7-
8´9´
10´
11´
12´13´
14´
ONO
O
O
R
1 2
3
45
6
811
7
1617
1819
20
21
1´
2´3́
4´
5´
6´7´
8´9́
10´
11´
12´13´
14´
910
12
13
14
15
Scheme 1. General synthetic procedure for all compounds 1a–1d, 2a–5a, 2b–5b and 2c–5c with atom numbering scheme.
34 G.-Y. Yeap et al. / Journal of Molecular Structure 982 (2010) 33–44
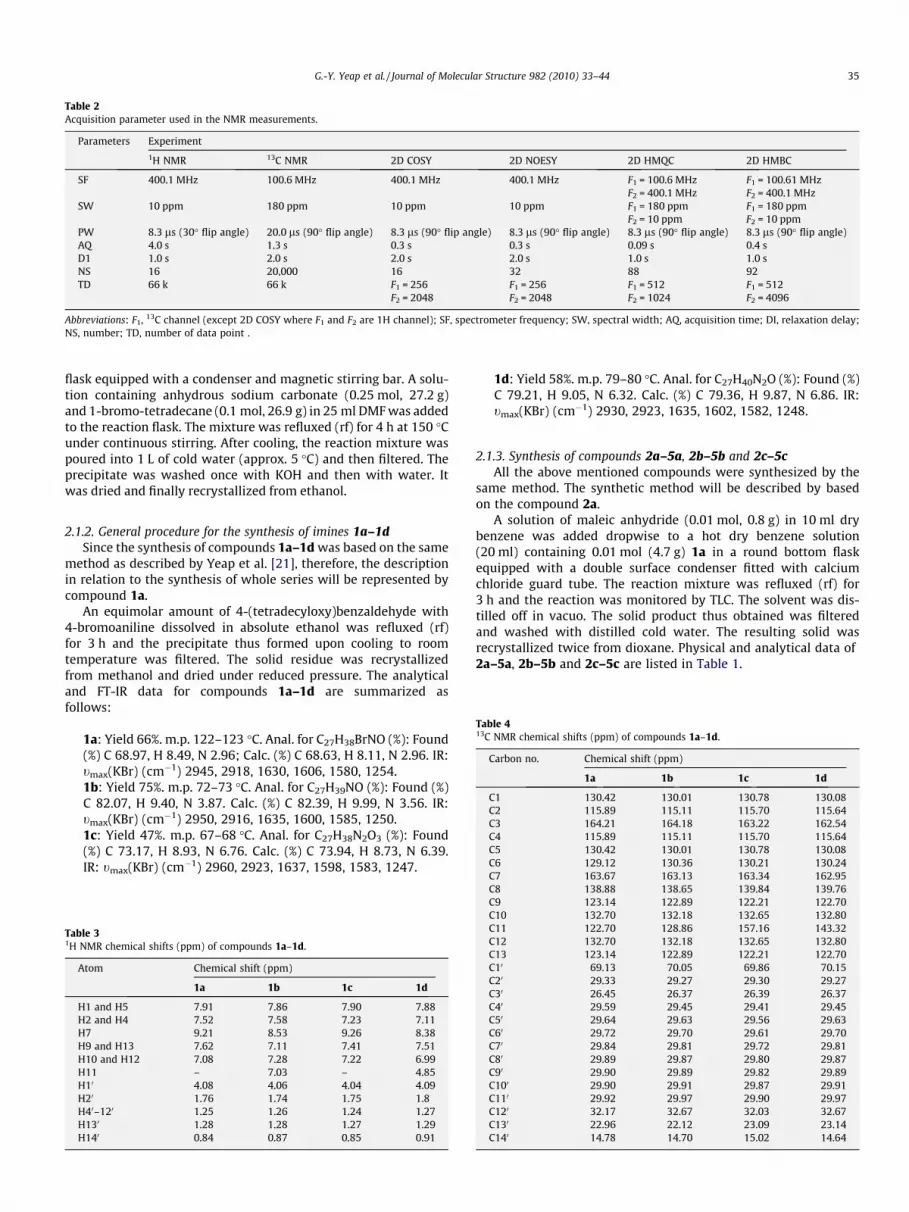
Table 2Acquisition parameter used in the NMR measurements.
Parameters Experiment
1H NMR 13C NMR 2D COSY 2D NOESY 2D HMQC 2D HMBC
SF 400.1 MHz 100.6 MHz 400.1 MHz 400.1 MHz F1 = 100.6 MHz F1 = 100.61 MHzF2 = 400.1 MHz F2 = 400.1 MHz
SW 10 ppm 180 ppm 10 ppm 10 ppm F1 = 180 ppm F1 = 180 ppmF2 = 10 ppm F2 = 10 ppm
PW 8.3 ls (30� flip angle) 20.0 ls (90� flip angle) 8.3 ls (90� flip angle) 8.3 ls (90� flip angle) 8.3 ls (90� flip angle) 8.3 ls (90� flip angle)AQ 4.0 s 1.3 s 0.3 s 0.3 s 0.09 s 0.4 sD1 1.0 s 2.0 s 2.0 s 2.0 s 1.0 s 1.0 sNS 16 20,000 16 32 88 92TD 66 k 66 k F1 = 256 F1 = 256 F1 = 512 F1 = 512
F2 = 2048 F2 = 2048 F2 = 1024 F2 = 4096
Abbreviations: F1, 13C channel (except 2D COSY where F1 and F2 are 1H channel); SF, spectrometer frequency; SW, spectral width; AQ, acquisition time; DI, relaxation delay;NS, number; TD, number of data point .
G.-Y. Yeap et al. / Journal of Molecular Structure 982 (2010) 33–44 35
flask equipped with a condenser and magnetic stirring bar. A solu-tion containing anhydrous sodium carbonate (0.25 mol, 27.2 g)and 1-bromo-tetradecane (0.1 mol, 26.9 g) in 25 ml DMF was addedto the reaction flask. The mixture was refluxed (rf) for 4 h at 150 �Cunder continuous stirring. After cooling, the reaction mixture waspoured into 1 L of cold water (approx. 5 �C) and then filtered. Theprecipitate was washed once with KOH and then with water. Itwas dried and finally recrystallized from ethanol.
Table 413C NMR chemical shifts (ppm) of compounds 1a–1d.
Carbon no. Chemical shift (ppm)
1a 1b 1c 1d
C1 130.42 130.01 130.78 130.08C2 115.89 115.11 115.70 115.64C3 164.21 164.18 163.22 162.54C4 115.89 115.11 115.70 115.64C5 130.42 130.01 130.78 130.08C6 129.12 130.36 130.21 130.24C7 163.67 163.13 163.34 162.95
2.1.2. General procedure for the synthesis of imines 1a–1dSince the synthesis of compounds 1a–1d was based on the same
method as described by Yeap et al. [21], therefore, the descriptionin relation to the synthesis of whole series will be represented bycompound 1a.
An equimolar amount of 4-(tetradecyloxy)benzaldehyde with4-bromoaniline dissolved in absolute ethanol was refluxed (rf)for 3 h and the precipitate thus formed upon cooling to roomtemperature was filtered. The solid residue was recrystallizedfrom methanol and dried under reduced pressure. The analyticaland FT-IR data for compounds 1a–1d are summarized asfollows:
1a: Yield 66%. m.p. 122–123 �C. Anal. for C27H38BrNO (%): Found(%) C 68.97, H 8.49, N 2.96; Calc. (%) C 68.63, H 8.11, N 2.96. IR:tmax(KBr) (cm�1) 2945, 2918, 1630, 1606, 1580, 1254.1b: Yield 75%. m.p. 72–73 �C. Anal. for C27H39NO (%): Found (%)C 82.07, H 9.40, N 3.87. Calc. (%) C 82.39, H 9.99, N 3.56. IR:tmax(KBr) (cm�1) 2950, 2916, 1635, 1600, 1585, 1250.1c: Yield 47%. m.p. 67–68 �C. Anal. for C27H38N2O3 (%): Found(%) C 73.17, H 8.93, N 6.76. Calc. (%) C 73.94, H 8.73, N 6.39.IR: tmax(KBr) (cm�1) 2960, 2923, 1637, 1598, 1583, 1247.
Table 31H NMR chemical shifts (ppm) of compounds 1a–1d.
Atom Chemical shift (ppm)
1a 1b 1c 1d
H1 and H5 7.91 7.86 7.90 7.88H2 and H4 7.52 7.58 7.23 7.11H7 9.21 8.53 9.26 8.38H9 and H13 7.62 7.11 7.41 7.51H10 and H12 7.08 7.28 7.22 6.99H11 – 7.03 – 4.85H10 4.08 4.06 4.04 4.09H20 1.76 1.74 1.75 1.8H40–120 1.25 1.26 1.24 1.27H130 1.28 1.28 1.27 1.29H140 0.84 0.87 0.85 0.91
1d: Yield 58%. m.p. 79–80 �C. Anal. for C27H40N2O (%): Found (%)C 79.21, H 9.05, N 6.32. Calc. (%) C 79.36, H 9.87, N 6.86. IR:tmax(KBr) (cm�1) 2930, 2923, 1635, 1602, 1582, 1248.
2.1.3. Synthesis of compounds 2a–5a, 2b–5b and 2c–5cAll the above mentioned compounds were synthesized by the
same method. The synthetic method will be described by basedon the compound 2a.
A solution of maleic anhydride (0.01 mol, 0.8 g) in 10 ml drybenzene was added dropwise to a hot dry benzene solution(20 ml) containing 0.01 mol (4.7 g) 1a in a round bottom flaskequipped with a double surface condenser fitted with calciumchloride guard tube. The reaction mixture was refluxed (rf) for3 h and the reaction was monitored by TLC. The solvent was dis-tilled off in vacuo. The solid product thus obtained was filteredand washed with distilled cold water. The resulting solid wasrecrystallized twice from dioxane. Physical and analytical data of2a–5a, 2b–5b and 2c–5c are listed in Table 1.
C8 138.88 138.65 139.84 139.76C9 123.14 122.89 122.21 122.70C10 132.70 132.18 132.65 132.80C11 122.70 128.86 157.16 143.32C12 132.70 132.18 132.65 132.80C13 123.14 122.89 122.21 122.70C10 69.13 70.05 69.86 70.15C20 29.33 29.27 29.30 29.27C30 26.45 26.37 26.39 26.37C40 29.59 29.45 29.41 29.45C50 29.64 29.63 29.56 29.63C60 29.72 29.70 29.61 29.70C70 29.84 29.81 29.72 29.81C80 29.89 29.87 29.80 29.87C90 29.90 29.89 29.82 29.89C100 29.90 29.91 29.87 29.91C110 29.92 29.97 29.90 29.97C120 32.17 32.67 32.03 32.67C130 22.96 22.12 23.09 23.14C140 14.78 14.70 15.02 14.64

Table 5Vibrational frequencies (cm�1) and their assignments for compounds 2a–5a, 2b–5b and 2c–5c.
Com. tCAH benzylic tCphAH tCH3 as tCH3 s tCH2 as tCH2 s tC@O tC@C tCAH dCAO lacton C4AO Others
2a 3273 3075 2953 2870 1707 1603 1488 1303 1257 611 CABr2918 2810 1572
2b 3298 3019 2953 2853 1723 1602 1488 1309 1263 652 CABr2940 2795 1569
2c 3270 3071 2931 2852 1719 1605 1489 1334 1246 645 CABr2914 2801 1588
3a 3211 3059 2949 2854 1701 1602 1445 1322 1257 –2925 2835 1577
3b 3218 3042 2940 2851 1697 1600 1448 1320 1250 –2921 2830 1570
3c 3235 3071 2936 2852 1719 1605 1489 1334 1246 –2918 2821 1588
4a 3221 3072 2954 2874 1677 1606 1463 1341 1254 1638 NO2
2918 2849 1581 12774b 3220 3068 2950 2869 1692 1600 1460 1340 1250 1630 NO2
2915 2838 1580 12904c 3217 3051 2955 2860 1701 1602 1461 1348 1252 1645 NO2
2918 2830 1583 12705a 3220 3050 2951 2864 1679 1602 1458 1344 1251 3304 NH2
2915 2833 1580 320605b 3219 3048 2955 2862 1690 1605 1462 1340 1253 3315 NH2
2918 2849 1584 32185c 3222 3053 2951 2861 1689 1601 1460 1339 1253 3312 NH2
2917 2841 1581 3211
t = Stretching, d = bending, c = out of plane, s = symmetric, as = symmetric.
36 G.-Y. Yeap et al. / Journal of Molecular Structure 982 (2010) 33–44
The synthetic route used to prepare all the intermediates and ti-tle compounds 1a–1d, 2a–5a, 2b–5b and 2c–5c with numberedatoms are shown in Scheme 1.
Table 6a1H NMR chemical shifts (ppm) of compounds 2a–5a and 2b–5b.
Atom Chemical shift (ppm)
2a 3a 4a 5a 2b 3b 4b 5b
H2 and H6 7.43 7.48 7.92 7.41 7.45 7.40 7.94 7.48H3 and H5 7.12 7.09 7.02 7.08 7.05 7.03 7.04 7.06H13 and H17 7.82 7.62 7.88 6.75 7.86 7.29 7.85 6.76H14 and H16 7.56 7.28 8.21 6.97 7.57 7.60 8.03 7.01H15 – 7.18 – 5.25 – 7.31 – 5.28H7 9.82 9.81 9.25 9.88 9.83 9.86 9.39 9.36H9 6.34 6.32 6.40 6.43 2.52 2.54 2.48 2.55H10 6.47 6.41 6.73 6.57 2.56 2.58 2.55 2.59H10 4.08 4.07 4.08 4.06 4.08 4.06 4.07 4.09H20 1.73 1.73 1.72 1.70 1.80 1.71 1.58 1.68H40–120 1.27 1.26 1.25 1.24 1.28 1.25 1.24 1.23H140 0.85 0.87 0.86 0.88 0.83 0.85 0.87 0.88
Table 6b1H NMR chemical shifts (ppm) of compounds 2c–5c.
Atom Chemical shift (ppm)
2c 3c 4c 5c
H2 and H6 7.23 7.32 7.43 7.25H3 and H5 6.51 7.03 6.75 6.64H7 9.82 9.81 9.91 9.21H12 7.82 8.02 7.75 8.06H13 7.52 7.50 7.97 7.50H14 7.63 7.59 7.71 7.58H15 7.49 7.47 7.48 7.46H19 – 7.07 – 5.09H17 and H21 7.94 7.48 7.35 6.98H18 and H20 7.75 7.70 8.18 6.42H10 4.09 4.07 4.04 4.08H20 1.73 1.70 1.64 1.71H40–120 1.29 1.26 1.22 1.28H140 0.85 0.87 0.82 0.89
2.2. Physical measurements
Melting points were recorded by Gallenkamp digital meltingpoint apparatus. The measurements were carried out by heatingup the sample from room temperature. The elemental (CHN)microanalyses were performed using a Perkin Elmer 2400 LS SeriesCHNS/O analyzer.
Table 71H–1H correlation from 2D COSY and NOESY for 2a–5a, 2b–5b and 2c–5c.
Compounds Atom H COSY NOESY
2a–5a H2 and H6 H3 or H5 H14 or H16H3 and H5 H2 or H6 H10 , H13 or H17H13 and H17 H14 or H16 H3 or H5H14 and H16 H13 or H17 H2 or H6H7 – –H9 H10 H10H10 H9 H9H10 H20 H20 , H3 or H5H20 H10 H10
H140 H130 H130
2b–5b H2 and H6 H3 or H5 H14 or H16H3 and H5 H2 or H6 H10 , H13 or H17H13 and H17 H14 or H16 H3 or H5H14 and H16 H13 or H17 H2 or H6H7 – –H9 H10 H10H10 H9 H9H10 H20 H20 , H3 or H5H20 H10 H10
H140 H130 H130
2c–5c H2 and H6 H3 or H5 H18 or H20H3 and H5 H2 or H6 H10 , H17 or H21H7 – –H12 H13 H13H13 H12, H14 H12, H14H14 H13, H15 H13, H15H15 H14 H14H17 and H21 H18 or H20 H3 or H5H18 and H20 H17 or H21 H2 or H6H10 H20 H20
H20 H10 H10
H140 H130 H130

G.-Y. Yeap et al. / Journal of Molecular Structure 982 (2010) 33–44 37
2.3. FT-IR measurements
The intermediates and title compounds were analyzed in the formof KBr pellets and the spectra were recorded in the range of4000–400 cm�1 using a Perkin Elmer 2000-FT-IR spectrophotometer.
2.4. NMR measurements
The 1H and 13C NMR spectra were recorded in deuterated chlo-roform (CDCl3-d6) for 1a–1d, and dimethylsulphoxide (DMSO-d6)for 2a–5a, 2b–5b and 2c–5c compounds at 298 K on a Bruker400 MHz Ultrashied™ FT-NMR spectrometer equipped with a5 mm BBI inverse gradient probe. Chemicals shift were referencedto internal tetramethylsilane (TMS). The concentration of solutemolecules was 50 mg in 1.0 ml DMSO. Standard Bruker pulse pro-grams [22] were used throughout the entire experiment. The spec-troscopic details of NMR are summarized in Table 2.
2.5. Phase transition temperatures and enthalpy values
The phase transition temperatures and enthalpy values weremeasured by Perkin Elmer Pyris 1 DSC at heating and cooling ratesof 5 �C min�1, respectively.
H9 H10
H3andH5
H2andH6
H14andH16
H13andH17
H1´
H2´
H10H9
Fig. 1. 1H–1H connectivities in the C
2.6. Liquid crystalline texture observation
The textural observation was carried out using a Carl Zeiss Axi-oskop 40 polarizing microscope equipped with a Mettler FP5 hotstage and TMS94 temperature controller. The samples studied byoptical microscopy were prepared in thin film sandwiched be-tween glass slide and cover.
3. Results and discussion
All the title compounds1a–1d, 2a–5a, 2b–5b and 2c–5c crystal-lized as stable solids with sharp melting points.
3.1. Physical characterization
3.1.1. 1H and 13C NMR spectral assignment for 1a–1dA complete assignment of the imines compounds 1a–1d can be
described by based on a representative compound 1c (Scheme 1)owing to all of these compounds exhibit similar characteristics asinferred from NMR spectra.
The 1H NMR data (Table 3) shows that the chemical shifts of thearomatic protons are observed at d = 7.22–7.90 ppm whilst the pro-ton pairs in both aromatic rings (H1 and H5, H2 and H4) and (H9 andH13, H10 and H12) are equivalent. A singlet is observed at
DMSO
H2´
H1´
OSY spectra for compound 2a.

38 G.-Y. Yeap et al. / Journal of Molecular Structure 982 (2010) 33–44
d = 9.26 ppm which corresponds to the azomethine proton (H7). Thetwo triplets at d = 4.04 ppm and d = 0.85 ppm can be ascribed to theproton H10 and the methyl proton H140, respectively. A quintet at d= 1.75 ppm attributed to the H20. The group of protons H40–H120 areconfirmed by the appearance of multipletes at d = 1.24 ppm.
The 13C NMR signals have been substantiated by DEPT135 ofwhich the assignment can be governed by the additive rules andsubstitution effect. The resonances due to the aromatic carbonsin both rings in 1a–1d can be located at the chemical shift rangeof d = 115.89–164.21 ppm, d = 115.11–164.18 ppm, d = 115.70–163.22 ppm and d = 115.64–162.54 ppm, respectively (Table 4).The presence of carbon C7 adjacent to nitrogen atom from iminegroup (C@N) can be observed at the range of d = 162.95–163.67 ppm. The chemical shift at d = 69.13–70.15 ppm rangeattributed to C10 while C140 assigned at the range of d = 14.64–15.02 ppm for the respective compounds 1a–1d.
3.2. Physical characterization of 2a–5a, 2b–5b and 2c–5c
3.2.1. FT-IR spectral dataIt is clearly shown from the FT-IR spectra of 2a–5a, 2b–5b and
2c–5c that they exhibit similar characteristics. The strong band ob-
H1´H3 and H5
H13 and H17
H2 and H6
H14 and H16
H1´
H14 and H17
H3 and H5
H2´
Fig. 2. 1H–1H connectivities in the N
servable at 1677–1723 cm�1 corresponds to the stretching of car-bonyl group (C@O). The other major band observed at 1303–1348 cm�1 can be assigned to bending of CAO mode. A weakabsorption band at 3019–3075 cm�1 can be assigned to thestretching vibration of aromatic CAH bond [23]. Two bands whichappear at respective frequency ranges of 1600–1606 cm�1 and1569–1588 cm�1 can be attributed to the C@C stretching in phenylring [21]. The band with weak intensity at the range of 3211–3298 cm�1 can be assigned to the benzylic CAH. The band withstrong intensity in the spectra of all compounds at the range of1246–1263 cm�1 can be ascribed to the ether group (tC4–O) [24].In addition to these bands, there is another band observed at therange of 1445–1489 cm�1 which can be ascribed to the bendingof CAH [25]. On the other hand, the infrared spectra exhibit differ-ent bands assignable to different substituents X (Br, NO2 and NH2)[26] in respective compounds 2, 4 and 5 (Table 5).
3.2.2. NMR spectroscopyIn order to substantiate the conformation of title compounds
2a–5a, 2b–5b and 2c–5c in the solution state, the conventional1H, 13C NMR and DEPT135 for all compounds along with COSY,NOESY, HMQC and HMBC were applied.
H9 and H10
H2´H14´
OESY spectra for compound 4b.

G.-Y. Yeap et al. / Journal of Molecular Structure 982 (2010) 33–44 39
3.2.2.1. 1D and 2D NMR study of2a–5a, 2b–5b and 2c–5c. The valuesof the 1H NMR chemical shifts for compounds 2a–5a, 2b–5b and2c–5c in DMSO solution are listed in Tables 6a and 6b, respectively.A complete assignment for the title compounds can be described
Table 813C NMR chemical shifts (ppm) of compounds 2a–5a, 2b–5b and 2c–5c.
Carbon no. Chemical shift (ppm)
2a 3a 4a 5a 2b 3b
C1 130.09 130.89 131.07 131.02 130.18 130C2 125.44 126.03 125.63 125.38 125.36 125C3 116.25 116.48 116.90 116.83 116.35 116C4 163.21 162.87 162.67 162.86 164.55 164C5 116.25 116.48 116.90 116.83 116.35 116C6 125.44 126.03 125.63 125.38 125.36 125C7 88.43 88.60 89.14 89.63 88.85 88C8 167.70 168.15 169.52 169.38 174.64 175C9 132.50 132.47 132.69 133.48 32.16 32C10 130.47 130.86 130.18 129.04 29.88 29C11 164.55 165.05 167.16 167.38 171.14 172C12 138.88 138.93 142.67 132.64 139.51 139C13 132.64 132.38 132.85 132.45 132.66 131C14 130.36 130.48 120.58 118.40 130.34 130C15 122.21 121.64 149.26 142.31 121.73 123C16 130.36 130.48 120.58 118.40 130.34 130C17 132.64 132.38 132.85 132.45 132.66 131C18 – – – – – –C19 – – – – – –C20 – – – – – –C21 – – – – – –C10 68.87 66.36 67.62 68.92 68.61 67C20 29.92 29.47 29.84 29.68 29.55 29C140 14.78 14.90 15.22 15.23 15.50 15
Table 92D 1H–13C HMQC and HMBC correlation for compounds 2a–5a, 2b–5b and 2c–5
Compounds Atom HMQC HMBC [J(C, H)]
1J 2J
2a–5a H2 and H6 C2 or C6 C1, C3 or C5H3 and H5 C3 or C5 C4, C2 or C6H13 and H17 C13 or C17 C12, C14 or C16H14 and H16 C14 or C16 C15, C2 or C6H7 C7 C1H9 C9 C8, C10H10 C10 C9, C11H10 C10 C10
H20 C20 C20
H140 C140 C140
2b–5b H2 and H6 C2 or C6 C1, C3 or C5H3 and H5 C3 or C5 C4, C2 or C6H13 and H17 C13 or C17 C12, C14 or C16H14 and H16 C14 or C16 C15, C13 or C17H7 C7 C1H9 C9 C8, C10H10 C10 C9,C11H10 C10 C10
H20 C20 C20
H140 C140 C140
2c–5c H2 and H6 C2 or C6 C1, C3 or C5H3 and H5 C3 or C5 C4, C2 or C6H7 C7 C1H12 C12 C9, C13H13 C13 C12H14 C14 C13, C15H15 C15 C10, C14H17 and H21 C17 or C21 C16, C18 or C20H18 and H20 C18 or C20 C17 or C21,C19H10 C10 C20
H20 C20 C10 , C30
H140 C140 C130
by based on a representative compounds as shown in Scheme 1in which three types of compounds have been differentiated bya, b and c. Inspection from the 1H NMR spectra for 2a–5acompounds shows two doublets in the down-field region
4b 5b 2c 3c 4c 5c
.06 129.94 130.05 130.25 129.58 128.94 130.55
.32 124.78 125.17 125.47 124.62 124.35 125.52
.46 115.15 115.21 116.54 116.32 115.71 116.28
.33 163.12 164.51 163.18 164.62 164.60 164.12
.46 115.15 115.21 116.54 116.32 115.71 116.28
.32 124.78 125.17 125.47 124.62 124.35 125.52
.62 88.41 88.89 88.54 89.07 88.40 88.85
.83 176.61 176.43 169.87 169.72 169.21 169.41
.28 31.95 31.84 132.25 130.80 132.65 132.34
.78 29.27 29.39 130.68 130.28 129.75 130.66
.01 173.71 173.61 167.31 167.87 167.91 167.23
.29 143.31 130.95 129.69 128.66 128.20 129.85
.76 132.27 132.63 131.54 132.83 132.36 132.65
.54 129.98 118.31 141.35 141.26 135.70 135.30
.43 148.31 142.52 121.57 121.41 121.40 121.36
.54 129.98 118.31 141.35 141.26 135.70 135.30
.76 132.27 132.63 131.54 132.83 132.36 132.65– – 130.87 130.52 126.32 118.23– – 120.45 120.72 140.56 142.65– – 130.87 130.52 126.32 118.23– – 138.73 135.71 130.46 132.57
.39 67.64 67.86 68.45 68.93 68.48 68.77
.88 29.73 29.85 29.16 29.43 29.83 29.59
.27 15.01 15.08 15.06 15.31 15.08 15.16
c.
3J 4J intraJ
C4, C7 – C1�, C9, C14 or C16C1 – C8, C13 or C17C15 – C10, C3 or C5C12 – C11, C2 or C6C2 or C6, C8 C9 C14 or C16C11 C7 C2 or C6C8 C12 C13 or C17C20 C30 C40
C10 , C30 C40 C50
C130 C120 C110
C4 – C10, C13 or C17C1 – C11, C14 or C16C15 C7 C8, C9, C3 or C5C12 – C9, C2 or C6C2 or C6, C11 C10 C3 or C5C11 – C13 or C17C8 – C2 or C6C20 C30 C40
C10 , C30 C40 C50
C130 C120 C110
C4 – C9, C12, C18 or C20C1 – C9, C12, C17 or C21C16 C9, C17 or C21 C13C14 C15 –C9 C10 –C12 C10 –C9, C11 C12 C17 or C21C19 C7 C3 or C5, C15C16 – C2 or C6C30 C40 C50
C40 C50 C60
C120 C110 C100

40 G.-Y. Yeap et al. / Journal of Molecular Structure 982 (2010) 33–44
(d = 6.32–6.43 ppm and d = 6.41–6.73 ppm) owing to protons H9and H10 in heterocyclic ring. However, two triplets at the rangeof d = 2.48–2.55 ppm and d = 2.55–2.59 ppm, respectively, can beassigned to the H9 and H10 in compounds 2b–5b. The 1H NMRdata for compounds 2a–5a and 2b–5b show that the signals ofthe aromatic protons (H2 and H6) can be observed at the rangeof d = 7.41–7.92 ppm and d = 7.40–7.94 ppm. The signals due toH13 and H17 are observed at d = 6.75–7.88 ppm and d = 6.76–7.86 ppm while the resonances for H14 and H16 occurred atd = 6.97–8.21 ppm and d = 7.01–8.03 ppm, respectively.
The 1H NMR spectrum of compound 3a shows a triplet atd = 7.18 due to H15 while the analogue H15 proton appears as asinglet at d = 5.25 in 5a. The similar explanation can be inferredfrom the 1H NMR spectra of 3b and 5b wherein a triplet and a sin-glet occurred at d = 7.31 ppm and 5.28 ppm, respectively.
The 1H NMR chemical shifts for compounds 2c–5c show thatthe resonances at d = 6.42–8.18 ppm (Table 6b) can be ascribedto the presence of aromatic protons (CAH). Whilst the proton pairs(H2 and H6, H3 and H5, H17 and H21, H18 and H20) are equiva-lent, the aromatic protons H12–H15 are found to be non-equiva-lent. The signal of H19 appears as a triplet at d = 7.07 for 3c andoccurred as a singlet at d = 5.09 for compound 5c.
All title compounds exhibit signal at the range of d = 9.21–9.91 ppm which can be ascribed to H7. The two triplets at therange of d = 0.82–0.89 ppm and d = 4.04–4.09 ppm can be assigned
H1´
H9H10
Fig. 3. One bond CAH correlations in th
to the methyl proton H140 and H10, respectively. A quintet atd = 1.58–1.80 ppm can be attributed to the H20. The presence of agroup of protons from H40 to H120 can be evidenced by the multi-pletes which occurred at the range of d = 1.22–1.29 ppm.
The COSY experiments have further substantiated that correla-tion between the equivalent proton pairs with the adjacent protonswherein the cross peaks resulting from these correlations appear atthe same region (Table 7). Inspection from Fig. 1 for compound 2aexhibits the correlation between H2 (or H6) with the respectiveprotons H3 (or H5) residing at the positions next to earlier atoms.A similar phenomenon can also be found on H13 (or H17) whichhas correlated with H14 (or H16). The H9 proton for seven-membered ring is correlated with H10. The correlation by COSYalso reveals that the H10 which is adjacent to O atom in ether groupcorrelated with H20. A similar correlation can also be observed incompounds 2b–5b. In the COSY spectra of compounds 2c–5c, itis apparent that more correlations are observed for aromatic pro-tons H12, H13, H14 and H15 (Table 7).
Further investigations on the protons of all compounds weresupported by the NOESY experiments (Table 7) of which the se-lected spectrum for compound 4b is shown in Fig. 2. Through thesetechniques, the H3 atom and its equivalent H5 atom are found tobe correlated with H13 (or H17). Similarly, the methylene protonsat C10 are correlated with H3 (or H5). A similar phenomenon canalso be found on H2 (or H6) which correlated with H14 (or H16).
C1 ´
C7
C3 and C
5
C14 and C
16C
10 C9
e HMQC spectra of compound 5a.

Fig. 4. Long range CAH correlations in the HMBC spectra of compound 4c.
Table 10Phase transition temperatures and enthalpy change for compounds 2a–5a, 2b–5b and2c–5c.
Compounds Phasetransition
Temperature/�C
Enthalpy change(KJ mol�1)
2a Cr–Iso 131.86 71.98Iso–Cr 105.85 �57.32
3a Cr–Iso 74.90 83.44Iso–Cr 45.55 �78.71
4a Cr–Iso 104.13 61.21Iso–Cr 79.61 �52.51
5a Cr–Iso 110.47 79.52Iso–Cr 89.48 �62.37
2b Cr–Iso 156.64 48.21Iso–Cr 114.31 �23.43
3b Cr1–Cr2 32.50 3.99Cr2–Iso 123.93 20.62Iso–Cr2 109.62 �0.047Cr2–Cr1 52.41 �0.32
4b Cr–Iso 82.98 68.41Iso–Cr 47.12 �51.28
5b Cr–Iso 130.33 88.16Iso–Cr 86.24 �38.45
2c Cr–Iso 105.63 4.22Iso–Cr2 74.82 �2.53Cr2–Cr1 67.12 �1.56
3c Cr–Iso 98.32 52.91Iso–N 94.53 �9.06N–Cr 77.39 �43.92
4c Cr–Iso 128.70 62.48Iso–Cr2 79.26 �25.61Cr2–Cr1 58.81 �33.17
5c Cr–Iso 133.72 81.23Iso–Cr2 92.61 �58.68Cr2–Cr1 61.95 �42.65
G.-Y. Yeap et al. / Journal of Molecular Structure 982 (2010) 33–44 41
The correlation by NOESY also reveals that H7 is not correlatedwith any other protons in all compounds. While the H9 protonscorrelated with H10.
The two signals observed at d = 167.70–176.61 ppm and164.55–173.71 ppm in the respective 13C NMR spectra of all titlecompounds can be attributed to the carbonyl C@O (C8 and C11)in heterocyclic ring. The signal of C7 appears at the range ofd = 88.40–89.63 ppm. The signal appears at high-field (d = 14.78–15.50 ppm) can be assigned to C140 of the methyl group in the alkylchain while a signal at d = 66.36–68.93 ppm and 29.16–29.92 ppmcan be attributed to the C10 and C20, respectively. The resonancesdue to the aromatic carbons in all title compounds (a, b and c)can be located at d = 116.25–162.87 ppm, 115.15–164.55 ppmand 115.71–164.62 ppm, respectively (Table 8). The resonancerecorded at d = 121.21–149.26 ppm can be assigned to respectivearomatic carbon atoms next to X substituent (Br, NO2 or NH2).The signals observed in the spectra of compounds 2a–5a and2c–5c at d = 132.25–133.48 ppm and d = 129.04–130.86 ppm canbe assigned to the respective C9 and C10 in heterocyclic ring.However, the signals at the range of d = 31.84–32.28 ppm and29.27–29.88 ppm are due to C9 and C10 in compounds 2b–5b.
The HMQC spectra of compounds 2a–5a, 2b–5b and 2c–5c (Table9) provide information on the interaction between the protons andthe carbon atoms which are directly attached to each other. As a rep-resentative, the discussion will be based on the spectrum for 5a(Fig. 3). It can be deduced from this figure that the H2 (or H6), H3(or H5), H13 (or H17) and H14 (or H16) in aromatic ring of com-pounds 2a–5a and 2b–5b correlated with C2 (or C6), C3 (or C5),C13 (or C17) and C14 (or C16), respectively. Moreover, the one-bond13C–1H can also indicate the correlations between H10, H20 and H140

42 G.-Y. Yeap et al. / Journal of Molecular Structure 982 (2010) 33–44
with C10, C20 and C140, respectively. The 2c–5c are different from2a–5a and 2b–5b because they possess additional aromatic ring(C9–C10–C12–C13–C14–C15) adjacent to seven-membered ring.The presence of this additional ring can be substantiated by thecorrelation rule via the one-bond 13C–1H connectivity betweenH12, H13, H14 and H15 with respective C12, C13, C14 and C15.
The aromatic quaternary carbons for all compounds were estab-lished via the connectivities between the carbon and its neighbor-ing proton by HMBC correlation spectra (Table 9). The spectra ofeach series (a, b and c) have similar correlation depending on theposition of heterocyclic ring. However, the aliphatic protons forall title compounds exhibit no correlation with any aromatic andheterocyclic ring carbons. However, the HMBC spectra of com-pound 4c (Fig. 4), for example, has shown that the H2 (or H6)was correlated with the carbons C1 and C3 (or C5) with 2J, C4 with3J, C9, C12 and C18 (or C20) with intraJ, respectively. The H3 (or H5)
Iso
IsoCr
Cr
3a
3b
Cr1
Cr1
a
b
Fig. 5. DSC plot on heating and cooling for selected
is also correlated with carbons C4, C2 (or C6) with 2J and C1 with3J on the basis of this analysis. The long range connectivitiesthrough intramolecular interaction (intraJ) among C9, C12, C17 (orC21) and H3 (or H5) proton can be established even though theseatoms are far away from H3 (or H5). In the same way, the H17 (orH21) located at the phenyl ring adjacent to nitrogen atom in het-erocyclic ring is correlated with C16, C18 (or C20) with 2J, C19 with3J and C7 with 4J while the intraJ long range connectivities for bothC3 (or C 5) and C15 with H17 (or H21) have been observed. A sim-ilar phenomenon can also be observed wherein the H18 (or H20) iscorrelated with C17 (or C21), C19 with 2J, C16 with 3J, and C2 (orC6) with intraJ. The long rang connectivities for each H12, H13,H14 and H15 with C8 and C11 are also detectable. The emergenceof the cross peaks associated with the correlations of C20, C30, andC130 with respective H10, H20 and H140 has confirmed the presenceof carbon nuclei from the aliphatic chain.
Iso Cr2
Cr2 Iso
compounds: (a) 3a, (b) 3b, (c) 2c and (d) 3c.

CrIso
IsoCr2Cr1
2c
Cr IsoN
Cr Iso
3c
c
d
Fig. 5 (continued)
G.-Y. Yeap et al. / Journal of Molecular Structure 982 (2010) 33–44 43
3.3. Mesomorphic behaviour
The textures observed under the polarized light are comparedwith those photomicrographs reported in the literatures [27,28].The sequence of phase and related transition temperatures uponheating and cooling runs for all final compounds are listed in Table10. The DSC thermograms of 3a, 3b, 2c and 3c during the heatingand cooling scans are depicted in Fig. 5. Fig. 5a reveals that 3a isa non-mesogenic compound as only one transition temperatureassociated with the crystal-isotropic (Cr–Iso) was observed at74.9 �C upon heating. The same phenomenon was observed whenthis compound was cooled down wherein the Iso–Cr transitionoccurred at 45.6 �C. Similarly, the compounds 2a, 4a, 5a, 2b, 4band 5b possess the same characteristics as shown by 3a(Table 10).
However, the thermogram for compound 3b (Fig. 5b) showsmore than one peak. The peak which appears at 32.5 �C with en-thalpy value (DH) of 3.99 kJ mol�1 during the heating run is char-acteristic to Cr1–Cr2. Subsequently, the isotropization occurred at123.9 �C (DH = 20.62 kJ mol�1). Similar phenomenon is observed
when the same compound is cooled down wherein the Iso–Cr1
and Cr2–Cr1 transitiions are observed at 109.6 �C and 52.4 �C,respectively.
As for compound 2c, it is very clear that upon heating the isot-ropization has taken place at 105.6 �C (Fig. 5c). However, uponcooling two peaks are observed at 74.8 �C and 67.1 �C, respectively.The peak at 67.12 �C can be ascribed to Cr2–Cr1 within crystalphase as the phenomenon reported for unsymmetric pyrazoles[29]. The compounds 4c and 5c exhibit the same behaviour as thatobserved in 2c.
Only one compound 3c (Fig. 5d), in which R@H and the hetero-cyclic ring fused with benzene ring, shows the liquid crystallinebehaviour upon the cooling run. A relatively large temperaturerange of mesomorphic region (17.1 �C) in compound 3c is observedwithin this series which suggests that this compound possessesremarkable phase stability [30,31]. The optical photomicrographof 3c is shown in Fig. 6 in which the compound exhibits nematicphase at 77.4 �C.
Further investigation upon the mesomorphic properties of thesecompounds is underway and will be reported elsewhere.

Fig. 6. Optical photomicrograph of compound 3c displaying nematic schlierentexture.
44 G.-Y. Yeap et al. / Journal of Molecular Structure 982 (2010) 33–44
4. Conclusion
Some new heterocyclic compounds with oxazepine and oxaze-pane cores have been synthesized and characterized. The com-pound with RC6H4-group (where R@Br, H, NO2 and NH2) attachedto the endocyclic –N in the respective 1,3-oxazepine-4,7-dione,1,3-oxazepane-4,7-dione and 1,3-oxazepine-1,5-dione cores havebeen investigated ranging from the elucidation of molecular struc-tures to the studies on their thermal and optical behaviours. Exceptcompound with C5H4– as substituent in the third series of 1,3-oxazepine-1,5-diones exhibits the nematic phase, all the othercompounds with oxazepine and oxazepane cores reported in thispaper are non-mesogenic.
Acknowledgements
Authors thank the University Sains Malaysia and the MalaysianGovernment for financing this project through RU Grant (AccountNo. 1001/PKIMIA/842022) and partial support from RU Grant (Ac-count No. 1001/PKIMIA/811127).
References
[1] K. Bajaj, Archana, A. Kumar, Eur. J. Med. Chem. 39 (2004) 369.[2] K. Audouze, E.Q. Nielsen, D. Peters, J. Med. Chem. 47 (2004) 3089.[3] C.L. Allaway, M. Daly, M. Nieuwenhuyzen, G.C. Sauders, Fluorine Chem. 115
(2002) 91.[4] I. Ott, B. Kircher, G. Heinisch, B. Matuszczak, J. Med. Chem. 47 (2004) 4627.[5] H. Kelker, B. Scheurle, Angew. Chem. Int. Ed. 81 (1996) 903.[6] G.Y. Yeap, S.T. Ha, P.L. Lim, P.L. Boey, W.A.K. Mahmmod, M.M. Ito, S. Sanehisa,
Mol. Cryst. Liq. Cryst. 423 (2004) 73.[7] G.Y. Yeap, S.T. Ha, P.L. Lim, P.L. Boey, M.M. Ito, S. Sanehisa, V. Vill, Mol. Cryst.
Liq. Cryst. 452 (2006) 63.[8] G.Y. Yeap, S.T. Ha, P.L. Lim, P.L. Boey, M.M. Ito, S. Sanehisa, Y. Youhei, Liq. Cryst.
33 (2006) 205.[9] A.A. Vieira, F.R. Bryk, G. Conte, A.J. Bortoluzzi, H. Gallardo, Tetrahedron Lett. 50
(2009) 905.[10] W.L. Chia, S.W. Shen, H.C. Lin, Tetrahedron Lett. 42 (2001) 2177.[11] R. Cristiano, D. Santos, H. Gallardo, Liq. Cryst. 32 (2005) 7.[12] (a) D. Demus, J. W. Goodby, G.W. Gray, H.W. Spiess, L. Vill. Handbook of Liquid
Crystals, vol. 2. Wiley VCH, Weinheim, 1998.;(b) T. Haino, M. Tanaka, K. Ideta, K. Kubo, A. Mori, Y. Fukazawa, TetrahedronLett. 45 (2004) 2277.
[13] S.T. Ha, T.M. Koh, H.C. Lin, G.Y. Yeap, Y.F. Win, S.T. Ong, Y. Sivasothy, L.K. Ong,Liq. Cryst. 36 (2009) 917.
[14] S. Kotha, D. Kashinath, S. Kumar, Tatrehadron Lett. 49 (2008) 5419.[15] S.K. Pal, S. Kumar, Tatrehadron Lett. 47 (2006) 8993.[16] H. Lee, D. Kim, H.K. Lee, W. Qiu, N.K. Oh, W.C. Zin, K. Kim, Tetrahedron Lett. 45
(2004) 1019.[17] C.H. Lee, T. Yamamoto, Tetrahedron Lett. 42 (2001) 3993.[18] A.S. Matharu, D.C. Asman, Liq. Cryst. 34 (2007) 1317.[19] C.S. Wang, I.W. Wang, K.L. Cheng, C.K. Lai, Tetrahedron 62 (2006) 9383.[20] O. Catanescu, M. Grigoras, G. Colotin, A. Dobreanu, N. Hurduc, C.I. Simionescu,
Eur. Polymer. J. 37 (2001) 2213.[21] G.Y. Yeap, S.T. Ha, N. Ishizawa, K. Suda, P.L. Boey, W.A.K. Mahmmod, J. Mol.
Struct. 658 (2003) 87.[22] Bruker Program 1D WIN-NMR (release 6.0) and 2D WIN-NMR (release 6.0).[23] O. Stamatoiu, A. Bubnov, I. Tarcomnicu, M. Iovu, J. Mol. Struct. 886 (2008) 187.[24] G.Y. Yeap, W.S. Yam, L. Dobrzyscky, E. Gorecka, D. Takeuchi, P.L. Poey, W.A.K.
Mahmood, M.M. Ito, J. Mol. Struct. 937 (2009) 16.[25] G.Y. Yeap, S.T. Ha, M.M. Ito, P.L. Boey, W.A.K. Mahmood, J. Mol. Struct. 687
(2004) 57.[26] R.M. Silverstein, F.X. Webster, seventh ed., John Willy & Sons. Inc., 2005, p. 71.[27] D. Demus, L. Richter, Texture of liquid Crystals, Verlag Chemie, New Yourk,
1978.[28] I. Dierking, Textures of Liquid Crystals, Wiley-VCH, Weinheim, 2003.[29] M.C. Chen, S.C. Lee, C.C. Ho, T.S. Hu, G.H. Lee, C.K. Lai, Tetrahedron 65 (2009)
9460.[30] D. Srividhya, S. Manjunathan, S. Thirumaran, C. Saravanan, S. Senthil, J. Mol.
Struct. 927 (2009) 7.[31] W.C. Shen, Y.J. Wang, K.L. Cheng, G.H. Lee, C.K. Lai, Tetrahedron 62 (2006)
8035.

![Montmorillonite K-10 clay catalyzed solvent-free synthesis of bis-indolylindane-1,3-dione, 2-(1′,3′-dihydro-1 H-[2,3′]biindolyl-2′-ylidene)-indan-1,3-dione and bisindolylindeno[1,2-](https://img.pdfslide.net/doc/110x75/631b317fd5372c006e03d515/montmorillonite-k-10-clay-catalyzed-solvent-free-synthesis-of-bis-indolylindane-13-dione.jpg)

![(4 E )-4-[(2-Hydroxyanilino)methylidene]-1-phenylpyrazolidine-3,5-dione dimethyl sulfoxide hemisolvate](https://img.pdfslide.net/doc/110x75/6357f2b9debc1859f6040d9e/4-e-4-2-hydroxyanilinomethylidene-1-phenylpyrazolidine-35-dione-dimethyl.jpg)
![QSAR studies of antimicrobial activity of 1,3-disubstituted-1H-naphtho[1,2-e][1,3]oxazines using topological descriptors](https://img.pdfslide.net/doc/110x75/6360f47b40b666b8ec0db708/qsar-studies-of-antimicrobial-activity-of-13-disubstituted-1h-naphtho12-e13oxazines.jpg)


![1,3-Bis[2-hydroxy-2-(6-methoxy-2,2-dimethyl-3a,5,6,6a-tetrahydro-2 H -furo[2,3- d ][1,3]dioxol-5-yl)ethyl]-2,3-dihydro-1 H -1,3-benzodiazol-2-one](https://img.pdfslide.net/doc/110x75/63583d88debc1859f6043116/13-bis2-hydroxy-2-6-methoxy-22-dimethyl-3a566a-tetrahydro-2-h-furo23-.jpg)


![1,3-Bis[4-(dimethylamino)benzyl]-4,5,6,7-tetrahydro-1 H -1,3-diazepan-2-ium chloride](https://img.pdfslide.net/doc/110x75/634fb5b80ca35926a7093000/13-bis4-dimethylaminobenzyl-4567-tetrahydro-1-h-13-diazepan-2-ium-chloride.jpg)


![2-[2-(1,3-Dioxoisoindolin-2-yl)acetamido]acetic acid](https://img.pdfslide.net/doc/110x75/63239cbb03238a9ff60a82a2/2-2-13-dioxoisoindolin-2-ylacetamidoacetic-acid.jpg)


![1Benzyl3-(2-furylmethyl)-1,2,3,4,5,6-hexahydrospiro[benzo[ h ]quinazoline-5,1′-cyclohexane]-2,4-dione](https://img.pdfslide.net/doc/110x75/631ec5370ff042c6110c8548/1benzyl3-2-furylmethyl-123456-hexahydrospirobenzo-h-quinazoline-51-cyclohexane-24-dione.jpg)