Embed Size (px)
Citation preview

Systematic comparison of the human saliva and plasmaproteomes
Weihong Yan1, Rolf Apweiler2, Brian M. Balgley3, Pinmanee Boontheung1, Jonathan L.Bundy4, Benjamin J. Cargile4, Steve Cole5, Xueping Fang6, Mireya Gonzalez-Begne7,Timothy J. Griffin8, Fred Hagen7, Shen Hu5, Lawrence E. Wolinsky5, Cheng S. Lee6, DanielMalamud9, James E. Melvin7, Rajasree Menon10, Michael Mueller2, Renli Qiao11, Nelson L.Rhodus12, Joel R. Sevinsky4, David States10, James L. Stephenson Jr.4, Shawn Than5, JohnR. Yates III13, Weixia Yu5, Hongwei Xie8, Yongming Xie1, Gilbert S. Omenn10, Joseph A.Loo1,14,*, and David T. Wong51Department of Chemistry and Biochemistry, University of California-Los Angeles, Los Angeles, CA,USA2EMBL Outstation, Wellcome Trust Genome Campus, Hinxton, Cambridge, UK3Calibrant Biosystems, Gaithersburg, MD, USA4Biomarkers and Systems Biology Center, Research Triangle Institute, Research Triangle, NC, USA5UCLA School of Dentistry and UCLA Dental Research Institute, University of California-LosAngeles, Los Angeles, CA, USA6Department of Chemistry and Biochemistry, University of Maryland, College Park, MD, USA7Center for Oral Biology, University of Rochester Medical Center, Rochester, NY, USA8Department of Biochemistry, Molecular Biology, and Biophysics, University of Minnesota,Minneapolis, MN, USA9College of Dentistry, New York University, New York, NY, USA10Departments of Medicine and Genetics and Center for Computational Medicine and Biology,University of Michigan, Ann Arbor, MI, USA11Division of Pulmonary and Critical Care Medicine, University of Southern California, Los Angeles,CA, USA12Department of Oral Medicine, Diagnosis, and Radiology, School of Dentistry, University ofMinnesota, Minneapolis, MN, USA13Scripps Research Institute, La Jolla, CA, USA14Department of Biological Chemistry, David Geffen School of Medicine, University of California-Los Angeles, Los Angeles, CA, USA
Abstract
© 2009 WILEY-VCH Verlag GmbH & Co. KGaA, Weinheim*Additional corresponding author: Dr. Joseph A. Loo, E-mail: [email protected]. Correspondence: Dr. David T. Wong, Universityof California-Los Angeles, School of Dentistry, 73-017 CHS, 10833 Le Conte Avenue, Los Angeles, CA 90095, USA E-mail:[email protected] Fax: 310-825-7609.The authors have declared no conflict of interest.
NIH Public AccessAuthor ManuscriptProteomics Clin Appl. Author manuscript; available in PMC 2009 November 5.
Published in final edited form as:Proteomics Clin Appl. 2009 January 1; 3(1): 116–134. doi:10.1002/prca.200800140.
NIH
-PA Author Manuscript
NIH
-PA Author Manuscript
NIH
-PA Author Manuscript

The proteome of human salivary fluid has the potential to open new doors for disease biomarkerdiscovery. A recent study to comprehensively identify and catalog the human ductal salivaryproteome led to the compilation of 1166 proteins. The protein complexity of both saliva and plasmais large, suggesting that a comparison of these two proteomes will provide valuable insight into theirphysiological significance and an understanding of the unique and overlapping disease diagnosticpotential that each fluid provides. To create a more comprehensive catalog of human salivaryproteins, we have first compiled an extensive list of proteins from whole saliva (WS) identifiedthrough MS experiments. The WS list is thereafter combined with the proteins identified from theductal parotid, and submandibular and sublingual (parotid/SMSL) salivas. In parallel, a core datasetof the human plasma proteome with 3020 protein identifications was recently released. A total of1939 nonredundant salivary proteins were compiled from a total of 19 474 unique peptide sequencesidentified from whole and ductal salivas; 740 out of the total 1939 salivary proteins were identifiedin both whole and ductal saliva. A total of 597 of the salivary proteins have been observed in plasma.Gene ontology (GO) analysis showed similarities in the distributions of the saliva and plasmaproteomes with regard to cellular localization, biological processes, and molecular function, butrevealed differences which may be related to the different physiological functions of saliva andplasma. The comprehensive catalog of the salivary proteome and its comparison to the plasmaproteome provides insights useful for future study, such as exploration of potential biomarkers fordisease diagnostics.
KeywordsBiomarkers; Body fluid; MS; Plasma; Saliva
1 IntroductionSaliva is produced by the three major paired salivary glands (parotid, submandibular (SM),and sublingual (SL)) as well as by numerous minor salivary glands. Besides water, salivaryfluid contains proteins, post-translationally modified proteins (e.g., glycoproteins,phosphoproteins), peptides, lipids, minerals, and other small compounds [1,2]. Upon releaseof glandular secretions into the oral cavity, the fluid is mixed with a variety of exocrine,nonexocrine, cellular, and exogeneous components to ultimately form whole saliva (WS).Through its various components, saliva participates in maintenance of homeostasis in the oralcavity, lubrication of oral tissues, and facilitation of chewing, speaking, and swallowing.Furthermore, saliva protects the oral cavity from foreign invaders, such as bacteria and viruses,by digestion and inhibition of their growth [3].
Qualitative and quantitative salivary alterations in secretion or composition, induced by eithersystemic or oral conditions, can cause functional deficiency of the saliva [4–6]. Sjögren’ssyndrome, an autoimmune disease, causes reduction in saliva volume, which leads to drymouth, difficulties in swallowing and speaking, increased caries and periodontal diseases, andinfection of the salivary gland. Saliva from Sjögren’s syndrome subjects contains increasedlevels of a few major salivary proteins [7–9]. We recently found 42 proteins to be significantlyelevated in saliva from primary Sjögren’s syndrome subjects [8]. Oral cancers are alsoassociated with significant changes of the salivary proteins. Using LC-MS/MS, we found fivesalivary proteins to be significantly elevated in oral cancer patients [10]. Also, changes in thesalivary protein composition have been observed in systemic diseases. Alterations inglycosylation of salivary mucins have been associated with cystic fibrosis [11]. Increased levelsof amylase and IgA are observed in diabetic patients [12,13]. A number of salivary components,including cortisol, amylase, and lysozyme, are altered under stress conditions. These alterationssuggest that analysis of saliva, especially its protein components and carbohydrate PTMs[14], may have potential for disease diagnosis and health monitoring. The relatively simple,
Yan et al. Page 2
Proteomics Clin Appl. Author manuscript; available in PMC 2009 November 5.
NIH
-PA Author Manuscript
NIH
-PA Author Manuscript
NIH
-PA Author Manuscript

noninvasive collection procedures and its constant availability make saliva an attractivebiofluid for disease detection.
A key initial step for saliva to be of practical use for disease diagnosis and health monitoringis the cataloging of its protein components. However, because of its complexity, variation inprotein abundance and PTMs, a comprehensive characterization of the protein composition ofsalivary fluid could not be achieved through traditional biochemical approaches until theintroduction of MS-based, high-throughput proteomics technologies. Recently, several reportswith the goal to comprehensive catalog the salivary proteome have been published [8,10,15–21], with numbers of proteins identified ranging from hundreds to over 1000. A project tocatalog the proteomes from salivary gland fluids of parotid and SM/SL glands identified 1166proteins, with 914 identified in parotid and 917 in SM/SL fluids, and 665 in common(www.hspp.ucla.edu) [22].
To appreciate the unique utility of the salivary proteome in the context of its function andpotential diagnostic value, it is important to compare the saliva protein composition with otherestablished proteomes, such as plasma. Overlap in protein content between saliva and plasmamay indicate that saliva could be used as a diagnostic alternative to blood tests. Over manydecades, numerous studies have uncovered how changes in the concentrations of specificplasma proteins have been associated with disease processes, leading to well-accepted clinicalapplications [23]. Moreover, the plasma proteome is perhaps the most extensively studiedhuman proteome to date. The international HUPO Human Plasma Proteome Project, acollaboration of many laboratories using MS technology, compiled a core dataset of 3020distinct proteins (with a minimum of two unique peptides per protein) [24–26]; 889 proteinswere confirmed as high-confidence identifications through a rigorous statistical approachadjusting for protein length and multiple comparisons testing [27].
In this present study, we have attempted to construct a comprehensive catalog of the humansalivary proteome by integrating protein identifications from both whole and ductal salivaryfluids. The salivary proteome was analyzed and compared among whole and ductal saliva aswell as to the human plasma proteome. These analyses should greatly facilitate thecharacterization of these two human body fluid proteomes and should facilitate the discoveryand development of diagnostic disease biomarkers.
2 Materials and methodsThe proteome of WS was contributed by datasets from four research groups: the University ofMinnesota (UMN), Research Triangle Institute (RTI), Calibrant Biosystems/University ofMaryland (CB/UM), and the University of California-Los Angeles (UCLA). The datasetsinclude newly acquired data from WS as well as previously published data [17–20,28]. Theexperimental methods described below are primarily for the new experiments performed tosupplement the list of WS proteins. The lists of salivary protein identifications from ductalsaliva, i.e., parotid and SMSL, are the result of a consortium effort by three National Instituteof Dental and Craniofacial Research (NIDCR)-supported research groups (Scripps ResearchInstitute, UCLA, and University of California-San Francisco); the methods used by each ofthe three groups have been described [22]. For the comparison of the salivary proteome to theplasma proteome, the published HUPO plasma proteome dataset was used [26]. The 3020plasma protein identifications with two or more peptides were obtained fromhttp://www.bioinformatics.med.umich.edu/hupo/ppp. The dataset is available also at theEuropean Bioinformatics Institute (http://www.ebi.ac.uk/pride), and it has been incorporatedinto the Peptide Atlas at the Institute for Systems Biology (http://www.peptideatlas.org).
Yan et al. Page 3
Proteomics Clin Appl. Author manuscript; available in PMC 2009 November 5.
NIH
-PA Author Manuscript
NIH
-PA Author Manuscript
NIH
-PA Author Manuscript

2.1 Saliva collection, protein fractionation, and protein identification2.1.1 University of Minnesota (UMN)2.1.1.1 Sample collection and processing: Whole, unstimulated saliva was collected fromfour healthy individuals using a previously described protocol [29]. WS (1 mL) was removedand centrifuged at 25 000 × g at 4°C for 30 min. The supernatant was collected and quantifiedby using the BCA protein assay with BSA as a standard control (Pierce), giving 1.05 mg oftotal soluble protein per mL. Equal amounts of soluble saliva (200 µL) were combined fromthe four individuals. The combined saliva was brought to 100 mM with HEPES, pH 8.0 and 5mM with Tris-(2-carboxyethyl)- phosphine (TCEP) and incubated overnight with 20 µg oftrypsin (Promega, Madison, WI) at 37°C. The resulting peptides were concentrated anddesalted using an RP Sep-Pak cartridge (Waters, Milford, MA) and dried by vacuumcentrifugation.
2.1.1.2 Protein/peptide fractionation: Preparative IEF of the tryptic peptide mixture wasperformed using a commercially available ProTeam free-flow electrophoresis (FFE) system(BD Biosciences, Franklin, NJ), as described previously [18]. Approximately 50% of each FFEfraction was taken from each of the microtiter plate wells containing peptides and processedas described [17], and a second step of fractionation was performed using aPolySULFOETHYL strong cation exchange (SCX) guard column (Javelin guard column, 1.0mm id × 10 mm, 5 µm, 300 Å, PolyLC) using an automated syringe pump capable of highlyaccurate sub-microliter per minute flow rates (Harvard Apparatus). Each peptide fraction wasre-dissolved in 200 µL of SCX loading buffer (10 mM KH2PO3 containing 20% ACN, pH 3.0)and loaded onto a preconditioned SCX column at a flow rate of 50 µL/min. Peptides wereeluted with step-gradient chromatography, using steps with increasing KCl concentration, ata flow rate of 50 µL/min. Eluted fractions from salt steps of 20, 25, 50, and 200 mM KCl inloading buffer were collected (200 µL total volume); each collected fraction was concentratedby vacuum centrifugation, and reconstituted in 30 µL of HPLC loading buffer.
2.1.1.3 Protein identification: All online µLC separations were done on an automatedParadigm MS4 system (Michrom Bioresources, Auburn, CA), coupled with an LTQ linear ITmass spectrometer (ThermoFisher Scientific, San Jose, CA) as described previously [17,18].Acquired MS/MS spectra were searched using SEQUEST [30] (Bioworks version 3.2, ThermoFinnigan, San Jose, CA) against a nonredundant human protein sequence database from theEuropean Bioinformatics Institute (ipi.HUMAN.v3.18.fasta, containing 62 000 entries). Areversed-sequence version of the same database was appended to the end of the forward versionfor the purpose of false positive rate estimation [31]. Differential amino acid mass shifts foroxidized methionine ( Da) were also included. Precursor peptide mass tolerance was ±2.0 Dawith no tryptic specificity. Fragment ion tolerance was set to ±1.0 Da. To each matched peptidesequence a predicted pI using the Shimura algorithm [32] was automatically assigned using anin-house developed script developed. The search results were validated using the peptidevalidation program PeptideProphet [33]. The peptide sequence match results were organizedand interpreted using the software tool Interact [34]. Peptide matches (regardless of assignedP score) were kept for further consideration only if their predicted pI was within ±0.5 U of theaverage pI value for the FFE fraction from which they were identified, and the peptide sequencewas at least partially tryptic to maximize the high confidence matches [35]. The estimated falsepositive rate for our protein catalog was 1%.
2.1.2 Research Triangle Institute (RTI)2.1.2.1 Sample collection and processing: Whole, unstimulated saliva was collected from ahealthy individual into a 50 mL conical centrifuge tube and stored at −80°C until use. Prior totrypsin digestion, the saliva was centrifuged at 5000 × g for 5 min to remove debris. Total
Yan et al. Page 4
Proteomics Clin Appl. Author manuscript; available in PMC 2009 November 5.
NIH
-PA Author Manuscript
NIH
-PA Author Manuscript
NIH
-PA Author Manuscript

protein content of the supernatant was quantified using a Bradford protein assay, with BSA asa reference standard (Pierce), and a total of 1 mg of protein was digested with modified trypsin(Promega) at a ratio of 50:1 (sample/protease) at 37°C for overnight. Digests were desaltedusing a C18-“light” Sep-Pak (Waters).
2.1.2.2 Protein/peptide fractionation: Salivary peptides were focused on IPG-IEF strips, aspreviously reported [36–38]. Briefly, a 24 cm pH 3.5–4.5 IPG strip (GE Healthcare) wasrehydrated overnight with 1 mg of peptides re-suspended in 8 M urea, 0.5% carrier ampholytes.The strip was subsequently focused using an IPGPhor II (GE Healthcare) according to themanufacturer’s provided protocol. The strip was manually cut into 60 fractions of ~4 mm width.Each fraction was sequentially extracted with 200 µL of 0.1% TFA, 200 µL of 0.1% TFA/50%ACN, and 200 µL of 0.1% TFA/100% ACN. The pooled peptide extracts were dried,resuspended in 0.1% TFA, and then further purified using an Oasis HLB SPE (Waters) resinin a 96-well plate format. Vacuum-dried (Speed-Vac) peptide extracts were subsequentlyresuspended in 40 µL of 0.1% TFA.
2.1.2.3 Protein identification: Extracted peptide fractions were subjected to LC-MS/MSanalysis on a ThermoFisher Scientific LTQ Classic quadrupole IT equipped with a NewObjective (Woburn, MA) Picoview nanospray source coupled to an Eksigent (Dublin, CA)Nano-2-D LC System equipped with an integrated Valco 10-port switching valve and peltier-cooled micoautosampler. The column, which was integral with the nanospray tip, consisted ofa 100 µm id × 360 µm od × 10 cm piece of fused silica packed with a monodisperse 5 µmpolymeric packing material (5RPC, gift from GE Healthcare, Piscataway, NJ). Three microliterof each dried peptide fraction was loaded onto a capillary sample trap (packed with the samematerial as the column) and washed briefly with 0.1% aqueous formic acid (FA) (5 min) beforeswitching in-line with the analytical column. The HPLC gradient was 80 min in length andprogressed from 15 to 50% B (A: aqueous 0.1% FA, B: 70% ACN with 0.1% FA) at a flowrate of 250 nL/min.
The mass spectrometer was programmed to take sequential scans of the following mass ranges(400–600, 600–700, 700–800, 800–900, and 900–1300 m/z) followed by data-dependent MS/MS of the three most intense ions in each mass range, except in the case of 400–600 m/z whereonly the two most intense ions were analyzed. Dynamic exclusion was enabled with a repeatcount of 2, repeat duration of 60 s, and an exclusion duration of 120 s.
The database employed was the International Protein Index (IPI), human version 3.19. Areversed version of the same database was indexed for tryptic peptides and searched againstMS/MS spectra using TurboSEQUEST (ThermoFisher Scientific). Data were subjected toreverse database [31] and pI-filtering using in-house developed software (IDSieve) aspreviously reported [39]. Actual SEQUEST crosscorrelation score (Xcorr) cutoffs weredetermined for each fraction based on the Xcorr of the highest scoring reverse database hit asa function of charge state for an empirical peptide false discovery rate of ~1%.
2.1.3 Calibrant Biosystems/University of Maryland (CB/UM)2.1.3.1 Sample collection and processing: Whole, unstimulated saliva was collected from ahealthy male volunteer. One milliliter of saliva was placed in a tube containing a mixture ofprotease inhibitors (1 µg aprotinin, 1 µg pepstatin A, and 1 µg leupeptin) and centrifuged at20 000 × g for 30 min. The supernatant was collected and placed in a dialysis cup (Pierce,Rockford, IL) and dialyzed overnight at 4°C against 100 mM Tris, pH 8.2. Urea and DTT wereadded to the sample with final concentrations of 8 M and 1 mg/mL, respectively, and incubatedat 37°C for 2 h under nitrogen. Iodoacetamide was added to a concentration of 2 mg/mL andkept at room temperature for 1 h in the dark. Trypsin was added at a 1:20 w/w enzyme-to-
Yan et al. Page 5
Proteomics Clin Appl. Author manuscript; available in PMC 2009 November 5.
NIH
-PA Author Manuscript
NIH
-PA Author Manuscript
NIH
-PA Author Manuscript

substrate ratio and incubated overnight at 37°C. The protein digest was desalted using an RPtrap column (Michrom Bioresources), eluted with a peptide concentration of 2.0 µg/µL, andlyophilized to dryness using a Speed-Vac (ThermoSavant, San Jose, CA), and then stored at−80°C.
2.1.3.2 Protein/peptide fractionation: Transient capillary isotachophoresis/CZE (CITP/CZE) was the basis of the multidimensional separations strategy employed. The CITPapparatus was constructed in-house using a CZE 1000R high-voltage power supply (SpellmanHigh-Voltage Electronics, Plainview, NY). A 80 cm long CITP capillary was initially filled abackground electrophoresis buffer of 0.1 M acetic acid at pH 2.8. The sample containing salivaprotein digests was prepared in a 2% pharmalyte solution and was hydrodynamically injectedinto the capillary. A positive electric voltage of 24 kV was then applied to the inlet reservoir,which was filled with a 0.1 M acetic acid solution. The cathodic end of the capillary was housedinside a stainless steel needle using a coaxial liquid sheath flow configuration. A sheath liquidcomposed of 0.1 M acetic acid was delivered at a flow rate of 1 µL/min using a syringe pump(Harvard Apparatus 22, South Natick, MA). The stacked and resolved peptides in the CITP/CZE capillary were sequentially fractionated and loaded into individual wells on a movingmicrotiter plate.
2.1.3.3 Protein identification: Each peptide fraction was analyzed by nano-RP LC equippedwith an Ultimate dual-quaternary pump (Dionex, Sunnyvale, CA) and a dual nano-flow splitterconnected to two pulled-tip fused-silica capillaries. These two 15 cm long capillaries werepacked with 3 µm Zorbax Stable Bond (Agilent, Palo Alto, CA) C18 particles. Nano-LCseparations were performed in parallel in which a dual-quaternary pump delivered two identical2 h organic solvent gradients with an offset of 1 h. Peptides were eluted at a flow rate of 200nL/min using a 5–45% linear ACN gradient over 100 min with the remaining 20 min for columnregeneration and equilibration. The peptide eluents were monitored using a linear IT massspectrometer (LTQ, ThermoFisher Scientific) operated in a data-dependent mode.
Raw LTQ data were converted to peak list files by msn_extract.exe (Thermo Fisher Scientific).The program OMSSA was used [40] to search the peak list files against a decoyed Swiss-Prothuman protein sequence database. This database was constructed by reversing all 12 484 realsequences and appending them to the end of the sequence library. Searches were performedwith the following parameters: fully tryptic, 1.5 Da precursor ion mass tolerance, 0.4 Dafragment ion mass tolerance, one missed cleavage, alkylated cysteine as a fixed modification,and variable modification of Met oxidation. The false positive rate for peptide identificationswas determined as 1%.
2.1.4 University of California-Los Angeles (UCLA)2.1.4.1 Sample collection and processing: WS was obtained from healthy nonsmokingsubjects in the morning prior to eating and after rinsing the mouth with water. To minimizeprotein degradation, protease inhibitor cocktail (Sigma Chemical, 1 µL/mL of WS) and 1 mMof sodium orthovanadate were added immediately to the saliva after sample collection. Allsamples were kept on ice during the entire process. Roughly 5 mL of clear WS was obtainedfrom pooled individuals after centrifuging at 1300 × g for 5 min. A further centrifugation at14 000 × g at 37°C for 15 min was performed to remove debris. Protein concentration wasdetermined to be 0.4–1.0 mg/mL (BioRad Protein Assay). The samples were divided into 1mL aliquots and stored at −80°C.
2.1.4.2 Protein/peptide fractionation: Ultracentrifugation filters (Microcon YM-10K andYM-3K, Millipore, Billerica, MA, USA) were used to prefractionate the WS into three fractions
Yan et al. Page 6
Proteomics Clin Appl. Author manuscript; available in PMC 2009 November 5.
NIH
-PA Author Manuscript
NIH
-PA Author Manuscript
NIH
-PA Author Manuscript

according to molecular weight: less than 3 kDa, 3–10 kDa, and greater than 10 kDa. Sampleprocessing and trypsin digestion followed protocols described previously [16].
Additional saliva samples were prefractionated by solution IEF [22,41,42]. Proteins in WSwere precipitated by mixing with four times the volume of 100% cold ethanol and thenincubated overnight at −20°C. The mixture was centrifuged at 13 000 rpm for 15 min at 4°C.The pellet was resuspended in lysis buffer (Zoom 2D protein solubilizer, Invitrogen, Carlsbad,CA) containing Complete Protease Inhibitor (Roche Diagnostic, Indianapolis, IN), Tris base,DTT, and water and sonicated on ice. The pH of the lysate was adjusted to pH 8.5–8.7 with 1M Tris base and then incubated for 15 min at room temperature with shaking. Sample lysatewas reduced for 30 min with 99% dimethylacrylamide (DMA) at room temperature. To quenchany excess of DMA, DTT was added and incubated for 5 min at room temperature. Aftercentrifuging the sample for 30 min at 13 400 rpm at 4°C, the supernatant was collected. Theprotein concentration was determined by the Non-Interfering Protein Assay (GenoTechnology, St. Louis, MO) to be approximately 1.5 mg/mL.
Protein lysate (1.5 mg/mL, 400 µL) was diluted to a final concentration of 0.6 mg/mL in dilutionbuffer consisting of Zoom IEF denaturant, Zoom focusing buffer pH 3–7 (Invitrogen), Zoomfocusing buffer, pH 7–12, and 5 µL 2 M DTT. Solution IEF separation with a Zoom IEFFractionator (Invitrogen) was performed in the standard format (pH 3.0–10). Diluted samplewas loaded into each of the five chambers of the fractionator. Five fractions (pI 3–4.6, 4.6–5.4, 5.4–6.2, 6.2–7.0, and 7.0–10.0) were obtained after fractionation. Proteins from eachfraction were precipitated by mixing with 70% acetone, incubating at −20°C for 3–4 h andcentrifuging at 13 000 rpm for 30 min.
2.1.4.3 Protein identification: LC-MS/MS was performed on an Applied Biosystems (FosterCity, CA) QSTAR Pulsar XL (QqTOF) mass spectrometer equipped with a nanoelectrosprayinterface (Protana, Odense, Denmark) and an LC Packings (Sunnyvale, CA) nano-LC system.The nano-LC was equipped with a homemade precolumn (75 µm × 10 mm) and an analyticalcolumn (75 µm × 150 mm) packed with Jupiter Proteo C12 resin (particle size 4 µm,Phenomenex, Torrance, CA). The released peptides were dried and dissolved in 0.1% FAsolution. For each LC-MS/MS run, typically 6 µL of sample solution was loaded to theprecolumn. The precolumn was washed with the loading solvent (0.1% FA) for 4 min beforethe sample was injected onto the LC column. The eluents used for the LC were 0.1% FA(solvent A) and 95% ACN containing 0.1% FA (solvent B). The flow was 200 nL/min, andthe following gradient was used: 3% B to 35% B in 72 min, 35% B to 80% B in 18 min, andmaintained at 80% B for the final 9 min. The column was equilibrated with 3% B for 15 minprior to the next run.
For online LC-MS/MS analyses, a Proxeon (Odense, Denmark) nanobore stainless steel onlineemitter (30 µm id) was used for spraying with the voltage set at 1900 V. Peptide product ionspectra were recorded automatically during the LC-MS/MS runs by information-dependentanalysis (IDA) on the mass spectrometer. Argon was employed as the collision gas. Collisionenergies for maximum fragmentation efficiencies were calculated using empirical parametersbased on the charge and m/z of the peptide precursor ion.
Proteins were identified by using the Mascot database search engine (Matrix Science, London,UK). All searches were performed against the EBI human IPI database (version 3.03; releasedate February 5, 2005). For saliva samples prefractionated by in-solution IEF, DMAmodification of cysteines was added to the variable modification list. In all searches, one missedtryptic cleavage was allowed, and a mass tolerance of 0.3 Da was set for the precursor andproduct ions. A MASCOT score of >25 with a p-value of <0.05 was considered a significant
Yan et al. Page 7
Proteomics Clin Appl. Author manuscript; available in PMC 2009 November 5.
NIH
-PA Author Manuscript
NIH
-PA Author Manuscript
NIH
-PA Author Manuscript

match. False-positive rates were determined to be ~2% by using the method described byMatrix Science (www.matrixscience.com).
2.2 Data integration and reassembly of protein identifications from peptide sequencesProtein and peptide identifications collected from WS, parotid, SMSL, and plasma by theparticipating groups were imported into a relational database designed specially for storage ofproteomics experimental data generated by the NIDCR-supported salivary proteomeconsortium project.
The list of protein and peptide identifications from WS was derived from several proteindatabase sources. To create a consensus list of protein identifications for each biological samplesource (i.e., WS, parotid, SM/SL, or plasma) and to make an effective comparison among thesample sources, the mandatory first step is to standardize the protein identifications in referenceto the same protein database through a reproducible algorithm. Therefore, we reassembled theprotein identifications based on peptide sequences and chose protein database IPI v3.32(released in August 2007) as the reference database. The strategy of reassembly (inference) ofprotein identifications from the peptide level was used previously in both plasma and brainproteome studies [26,43] and also in the integration of the human peptide sequences with thehuman genome [44]. The algorithm we used seeks to find the minimum protein identificationin a given sample source by the following steps:
i. Construct a unique protein list that includes all proteins from which each peptideidentified from a sample source might be derived. The unique peptide sequence listfor each sample source was extracted from the database. Each unique peptide in thelist was subsequently searched against the reference protein database IPI v3.32. Allprotein entries containing exact matches to the peptide sequence were recorded intothe database. The unique peptide sequences that could not find an exact match in IPIv3.32, which is usually caused by protein sequence changes during the periodicdatabase updates or sequence differences between protein databases, were discardedfrom further analysis. During this step, all proteins from which each unique peptidecould be derived were identified. The unique protein list with all these potentialprotein candidates involved represents the maximum number of detected proteins forthat sample source.
ii. Construct a unique peptide list for each protein inferred from step (i). During this step,peptides that matched to the same protein are combined. In some cases, a peptide canbe combined with other peptides and matched to more than one protein.
iii. Cluster proteins that were identified by the same set of peptides. The proteins inferredby the same set of peptides were defined as equivalent protein identifications and wereclustered together. These equivalent proteins are usually paralogs, isoforms, orproteins sharing the same functional domains. In some cases, the peptide list used forprotein identifications can be the subset of the peptide list for other proteinidentifications. These proteins were also clustered together. A minimum protein listfor a sample source was created after a representative protein was chosen from eachcluster. The representative protein was chosen by applying the following proceduressequentially: (i) Select the protein that contains the highest number of peptides. (ii)Select the protein that is crossreferenced to the UniProt/Swiss-Prot database. (iii)Select the protein with detailed descriptions rather than proteins described as“hypothetical,” “putative,” “fragment,” “similar to,” or “cDNA.” (iv) Select theprotein that has the lowest IPI number.
Yan et al. Page 8
Proteomics Clin Appl. Author manuscript; available in PMC 2009 November 5.
NIH
-PA Author Manuscript
NIH
-PA Author Manuscript
NIH
-PA Author Manuscript

2.3 Sequence feature predictionProtein identifications were classified based on whether they contained sequence features ofsecreted signal sequence, transit sequence, or transmembrane domain. The sequence featuresof the protein identifications were either extracted from the protein annotation file obtainedfrom UniProt/Swiss-Prot database or predicted using the sequence feature prediction programs,SignalP for secretion signal sequences [45], TargetP for organelle presequences [46], andTMHMM for transmembrane helix sequences [47]. These programs were obtained from theCenter for Biological Sequence Analysis, Technical University of Denmark DTU(http://www.cbs.dtu.dk/services).
2.4 Data sources for protein annotation, gene ontology (GO) analysis, and diseaseassociation
IPI protein sequence database and its crossreferences file released in August, 2007 wereobtained from ftp://ftp.ebi.ac.uk/pub/databases/IPI/. A flat file format of GO for biologicalprocess, molecular function, and cellular component were obtained from the GO databasewebsite http://www.geneontology.org/Go.downloads.shtml. A gene map of the onlineMendelian inheritance in man (OMIM) was obtained fromftp://ftp.ncbi.nih.gov/repository/OMIM/genemap. Biological pathway information wasobtained from the KEGG database (http://www.genome.jp/kegg/).
2.5 Statistical analysisThe significance of comparisons of GO distributions was estimated using the χ2 test. The χ2
test was performed using the statistical package SAS. The adjustments for protein length andmultiple comparisons testing reported for the Plasma Proteome Project [24] were not appliedto the salivary proteome results.
2.6 Web interface and databaseThe WS peptide and protein identifications and its comparison to the human plasma proteomewere stored in a relational database. The details of the relational database can be accessedthrough the http://www.hspp.ucla.edu/. Briefly, the database was implemented using the opensource relational database package MySQL. The database has web interface features that allowusers to search and query the database through a variety of parameters including saliva source,protein accession numbers, and keywords.
3 Results3.1 Human whole saliva proteome
In parallel to the analysis of ductal salivary proteomes recently reported [22], the present studyreports the characterization of the human WS proteome. The WS protein and peptideidentifications include those derived from the high-throughput MS-based experimentsperformed independently by four research groups reported here, as well as results from previousefforts [16,18–20,28]. In total, the four groups submitted 12 679 distinct peptide identificationswith a false positive rate of less than 2% and 3196 distinct protein identifications. The fourgroups implemented diversified protocols for protein fractionation, peptide separation, MS,and database searching algorithms and databases (Table 1).
To create a consensus comprehensive list of WS protein components, we integrated andstandardized the heterogeneous protein identifications to the IPI database (IPI v3.32, August2007 release). The integration process started at the peptide level and resolved a nonredundantminimal set of protein identifications, defined such that within a group of proteins that containthe sequences with 100% identity to a set of peptides, one of them was selected to represent
Yan et al. Page 9
Proteomics Clin Appl. Author manuscript; available in PMC 2009 November 5.
NIH
-PA Author Manuscript
NIH
-PA Author Manuscript
NIH
-PA Author Manuscript

the group of proteins and reported. The computational approach for the integration andstandardization was similar to the method introduced previously [48], and the selection of arepresentative protein from a group of proteins was similar to that used for the HUPO PlasmaProteome Project [26]. A total of 12 602 of the 12 679 original submitted peptides were foundto exactly match that found in IPI v3.32; these peptides were used to infer 2158 distinct proteins.Within the 2158 WS proteins, 702 resulted from single-peptide-based identifications, whichwere subsequently excluded. We utilized the remaining 1456 identifications, derived from 2or more peptides, as high confidence identifications for further analyses and comparisons.
Besides proteins from human sources, proteins derived from bacterial sources found in the oralcavity were observed within WS. To exclude these bacterial contaminant proteins, the peptidesused to derive the 1456 WS identifications were searched against bacterial protein databases.Only 12 out of the 1456 WS identifications contained peptides that matched also to bacterialproteins; these proteins were excluded from the WS identifications, reducing the number ofWS protein identifications to 1444.
A total of 233 out of the 1444 WS proteins were confirmed by all four collaborating laboratoriesand approximately one half of the proteins (756) were supported by at least two laboratories(Fig. 1A). An approximate relative abundance of the WS proteins was estimated by the numberof unique peptides used to derive the identifications and by sequence coverage (Fig. 1). Theconcordance among the groups increased with proteins having increased number of uniquepeptides per protein identification (Fig. 1B). Similarly, protein identifications by multiplegroups were related to the sequence coverage of the protein (Fig. 1C). The number ofidentifications confirmed by any two groups reached a maximum when the coverage was 40–50%, while three and four group matches dominated at higher sequence coverage (Fig. 1C).
3.2 Comparison of proteomes from WS, ductal saliva,and plasmaTo study the origin of the salivary proteins, we compared the WS proteome to the ductal parotid/SMSL saliva proteome [22]. Similarly, to examine the common nature of saliva and blood, wecompared the saliva proteins to the plasma proteome. To make the comparison effective, theparotid/SMSL proteomes derived from IPI v3.24, and the plasma proteome from IPI v2.23were integrated and standardized to the reference database IPI v3.32 following the sameprocedures as implemented for WS. As shown in Fig. 2, 34 and 10% of the distinct peptidesidentified in WS overlap with the peptides identified in the parotid/SMSL proteome and plasmaproteome, respectively. At the protein level, 51% of the 1444 WS proteins overlap with the1235 parotid/SMSL proteins and 33% overlap with the plasma proteins. The higher overlapobserved at the protein level indicates that the same proteins found in the two proteomes donot necessarily depend on the same overlapped peptides. A similar phenomenon was noted ina comparison of brain, plasma, and platelet proteomes [43].
To create a comprehensive catalog of the human salivary proteome, the proteins found in WSand ductal saliva were combined, resulting in a total of 1939 proteins. This combined WS/ductal salivary proteome was compared to the plasma proteome with regard to their theoreticalmolecular weight and pI (Fig. 3). The salivary proteome contains a large proportion (20%) oflow molecular weight proteins (<20 kDa) in contrast to only 7% for the plasma proteome. Intotal, 68% of the saliva proteins have molecular weight less than 60 kDa compared to the 37%of the plasma proteins.With regard to the proteins found in common between saliva and plasma,the molecular weight distributions show similarity to the distributions of the salivary proteomewith a tendency toward the low molecular weight end, except in the highest MW range (≥200kDa). A pI comparison of the saliva and plasma proteomes revealed that saliva contains moreproteins in the lower and (≤5) higher end (≥11) of the pI scale (Fig. 3B), with an average proteinpI of 7.03 and 7.13 for saliva and plasma, respectively. The trend toward a higher proportionof proteins with MW less than 20 kDa observed in the saliva proteome is further manifested
Yan et al. Page 10
Proteomics Clin Appl. Author manuscript; available in PMC 2009 November 5.
NIH
-PA Author Manuscript
NIH
-PA Author Manuscript
NIH
-PA Author Manuscript

in the ductal parotid/SMSL proteome. Compared to 17% in WS, 26% of the parotid/SMSLproteins are less than 20 kDa in size (Fig. 3C). In contrast to the difference in the pI distributionof saliva and plasma, parotid/SMSL, and WS proteomes show very similar pI distributions(Fig. 3D).
The salivary and plasma proteomes were further compared based on their annotation in GOterms of cellular component, molecular process, and biological function (Fig. 4). As expected,compared to the total human proteome, the salivary and plasma proteomes are over-representedin the extracellular component, an indication of secretion (p<0.001). The level of over-representation in the extra-cellular component is further enhanced in the proteins that coexistin saliva and plasma. The salivary and plasma proteins are also over-represented in thecytoplasmic and cytoskeleton components (p<0.001). In contrast, intracellular components areunder-represented in saliva and plasma. With regard to biological processes (Fig. 4B),compared to the human proteome, saliva, and plasma are over-represented in the categories ofresponse-to-stimulus, responseto- stress, and cell organization and biogenesis, but areunderrepresented in cell communication and other primarily metabolic processes.Interestingly, the distributions of the salivary proteins are significantly enhanced in proteinmetabolic and catabolic processes compared to plasma (p<0.001). In the GO molecularfunctional categories, the salivary and plasma proteomes are significantly over-represented inprotein binding but are under-represented in nucleic acid binding, transporter activity, andsignal transducer activity (p<0.001) (Fig. 4C). In general, the salivary and plasma proteomesshowed similar distributions in the GO molecular functional categories. However, exceptionswere found in the structural, transcription regulator, and antioxidant functions. Compared toplasma, saliva is significantly over-represented in structural molecule and antioxidant functionsbut under-represented in the transcription regulator function (p<0.001). The proteins commonto saliva and plasma generally show an enhanced tendency in the over-represented and under-represented categories of the salivary and plasma proteins. The distributions of the overlappingproteins are significantly enhanced in the extracellular and cytoplasm of the cellularcomponent, response-to-stimulus, response-to-stress, protein metabolic and catabolicprocesses, and protein binding, motor, structural molecule, antioxidant, and enzyme regulatorof molecular function, but are under-represented in organelle and intracellular of the cellularcomponent, cell communication, and other primary metabolic of the biological process, andnucleic binding, signal transducer, catalytic, and transcription regulator of molecular function.
To test our hypothesis that the body fluids are enriched with proteins that contain secretionsequence signals, we examined the sequence features present in the salivary and plasmaproteomes, based on the sequence categories of signal sequence (prepeptide), transit peptide,glycosylation site, and transmembrane region. The sequence annotations were obtained eitherfrom the UniProt/Swiss-Prot protein knowledgebase or through the sequence feature predictionprograms, signalp, targetp, and TMHMM. As shown in Table 2, 1436 out of 1939 salivaryproteins and 1966 out of 2720 plasma proteins have their corresponding entries in the UniProt/Swiss-Prot database. A large portion of the salivary proteins (27%) and plasma proteins (23%)are annotated with a signal sequence at the N-terminus. Consistent with the observations thatmany salivary and plasma proteins can be glycosylated [49], the sequence feature annotationshows that 24% of the salivary proteins and 26% of the plasma proteins contain N-linkedglycosylation site(s). Both saliva and plasma contain putative transmembrane proteins (11%in saliva and 18% in plasma). In contrast to the high percentage of proteins with a signalsequence, the proportion of proteins with a transit peptide sequence required for proteintransport across organelle membranes are low in both saliva and plasma (3.3% in WS and 1.3%in plasma). Considering that the part of WS is from the secretion of the ductal fluids, we alsocompared the sequence feature of WS to parotid/SMSL saliva. The result shows that the ductalsaliva proteome contains 37% proteins with secreted signal peptide in contrast to 21% in WS.
Yan et al. Page 11
Proteomics Clin Appl. Author manuscript; available in PMC 2009 November 5.
NIH
-PA Author Manuscript
NIH
-PA Author Manuscript
NIH
-PA Author Manuscript

We examined the distinct salivary proteins that are observed in saliva but not in plasma.Because it can be expected that some of the plasma proteins can be present in very lowabundance in saliva, we compared the salivary proteome composed from WS, parotid, andSMSL to the plasma protein list including one peptide-based identifications (9555 totalproteins). The proteins unique to saliva include those with well known salivary functions, suchas proline-rich protein isoforms, amylase, cystatin isoforms, lactoperoxidase, and statherin.Antioxidant proteins, peroxiredoxin-4 and 6, proteinase kallikrein-1, and myeloperoxidase arealso identified as unique proteins to saliva (Table 3). The abundance of these distinct salivaryproteins are ranked based on the number of unique peptides used to derive their identificationsfrom WS (Table 3).
To further examine the biological roles of the salivary and plasma proteins, we examined andclassified the proteins based on their biological pathways extracted from the KEGG pathwaydatabase (Table 4). Saliva and plasma proteins contain highest pathway activities in cellcommunication, carbohydrate and amino acid metabolism, immune system, and signaltransduction. Exceptions were found in the signaling molecule and interaction pathway, towhich the 108 out of 1415 total entries of the plasma proteins in KEGG were matched, incontrast to only 47 of 1527 total entries for the saliva proteins.
3.3 Enrichment of Igs in salivary and plasma proteomesBesides the KEGG pathways shared by many salivary and plasma proteins, a detailedexamination revealed that these two proteomes are enriched with Igs. Consistent with theprevious report that Igs make up about 5–15% of the total number of salivary proteins [50],the saliva proteome from the integrated results of WS and parotid/SMSL show that 219 (11.3%)of the 1939 salivary protein components are Igs. Interestingly, a majority of these Igs (141 outof 219) were shown to overlap with the plasma Igs, even though the specimens of saliva andplasma are not from the same individuals (Fig. 5). We also compared the salivary and plasmaproteins participating in the KEGG carbohydrate metabolism, immune system, and cellcommunication pathways. In contrast to the striking high overlap (61%, 141 out of 230) of Igsfound in saliva and plasma, only 18% (24 out of 132) overlap was found in the carbohydratemetabolism pathway, 22% (42 out of 188) in immune system, and 27% (65 out of 239) in cellcommunication. When the comparisons are performed between WS and ductal parotid/SMSLproteomes, the higher overlaps are observed in these KEGG pathways with 57% incarbohydrate metabolism, 46% in immune system, and 43% in cell communication (Fig. 5).This higher overlap between WS and ductal parotid/SMSL is consistent with the closerbiological and physiological similarity of these two fluids than between saliva and plasma.
The relative abundance of these Igs varied greatly. The Igs in saliva are identified with 2 to171 unique peptides and with sequence coverages from below 0.1% to as high as 91%. Inplasma, the Igs are derived from 2 to 137 unique peptides. Figure 6 demonstrates that linearcorrelation of the number of unique peptides observed for the Igs exists between WS andplasma, parotid and plasma, and SMSL and plasma.
4 Discussion4.1 WS and ductal saliva proteomes
To achieve a comprehensive human salivary proteome, we began with construction of the WSproteome. Similar to other large-scale proteome projects such as the HUPO Plasma and BrainProteome Projects and most recent ductal parotid and SMSL proteome, the intrinsic complexityof the WS proteome made its characterization challenging and is influenced by sample sourceand collection process, sample preparation, and the protein identification process. The powerof combining the datasets from different experimental approaches results in a more
Yan et al. Page 12
Proteomics Clin Appl. Author manuscript; available in PMC 2009 November 5.
NIH
-PA Author Manuscript
NIH
-PA Author Manuscript
NIH
-PA Author Manuscript

comprehensive proteome than any single approach can achieve. A core dataset with 1444 WSproteins was assembled from the integration process. Similar to the reports from the plasmaproteome, brain proteome, and parotid/SMSL proteome studies, a large portion (52%) of theWS proteins are identifications measured by only one laboratory. Besides the various samplepreparation and experimental measurement approaches employed, variations in saliva samplesource and protein concentration also may induce differences in protein identification. The WSproteins confirmed by the four groups (233 proteins) should represent the essential salivarycomponents that are least susceptible to differences in methodology and sample source. Theseprotein identifications include such wellknown salivary proteins as Igs, amylases, cystatins (D,S, C, SA, and SN), proline-rich protein 3, keratins, and mucin-5B.
With our previous characterization of the ductal parotid and SMSL proteomes, our presentstudy showed that the salivary protein components vary with the source and origin of the fluid,i.e., WS or ductal salivas. Although 740 out of 1939 salivary proteins coexist in WS and ductalsaliva, 563 are specific to WS and 369 specific to parotid/SMSL. It is known that proteins inWS originate from not only the secretion of salivary glands (i.e., SM, SL, parotid, and minorglands) but also from leakage of plasma, secretion of bronchial and nasal sources, gingivalcrevicular fluid, bacteria, food debris, and epithelial or other cell debris.
The functions of saliva include lubrication, antimicrobial, protection of mucosal integrity, anddigestion. Proteins that participate in one or more of these salivary functions include mucins,amylases, defensins, cystatins, histatins, proline-rich proteins, statherin, lactoperoxidase,lysozyme, lactoferrin, and Igs. The functions of these proteins can be redundant andoverlapping. Our study indicates that all of these protein family/isoforms were shared betweenWS and parotid and SM/SL fluids, although one or more proteins in the family can be specificto the WS, parotid or SM/SL proteome. These observations support the previous hypothesisthat a specific protein may not be critical for a specific salivary function because other proteinfamilies can maintain its function [50,51].
4.2 Similarities and differences between saliva and plasma proteomesExcept for Igs, proteins with known salivary functions were commonly, but not always, absentin the plasma proteome. For example, statherin and histatin protein families are specific tosaliva. The number of isoforms and abundance of mucin, cystatin, and proline-rich proteinfamilies in plasma were significantly lower in plasma than in the WS and parotid/SMSLproteomes.
Similarity and distinction of the salivary and plasma proteomes were revealed also throughanalysis of their cellular components, molecular functions, biological processes, sequencefeatures, and biological pathways. As expected for body fluids, the GO study of cellularcomponents displayed that both saliva and plasma are over-represented with extra-cellularproteins when compared with the overall human proteome. Surprisingly, saliva and plasma arealso enriched with the cytoplasmic proteins, which could result from cell death.However,specific transport pathways may also exist. A recent study of the tear proteome revealed thatcytoplasmic proteins are enriched [52]; a few intracellular proteins were demonstrated asoriginating from cellular shedding of the epithelium [53]. Tears are produced from the lacrimalgland with a structure similar to serous acini of the salivary gland. Whether the cytoplasmicproteins in saliva and plasma also originate from cellular shedding of the epithelium, as in tearfluid, remains to be determined. The GO analysis demonstrated that saliva and plasma are over-represented in response-to-stimulus and response-to-stress processes, presumably reflectingthe functions of these two body fluids in the body’s defense system. Saliva is over-representedin catabolic and protein metabolic processes, which may reflect its major physiologic functionin food digestion. As expected, the sequence feature analysis indicated that saliva and plasma
Yan et al. Page 13
Proteomics Clin Appl. Author manuscript; available in PMC 2009 November 5.
NIH
-PA Author Manuscript
NIH
-PA Author Manuscript
NIH
-PA Author Manuscript

contain high proportions of proteins with a signal peptide sequence required for targetingproteins to the ER for subsequent transport through the secretory pathway.
Glycosylation of salivary proteins is believed to play a role in the salivary protective functions.Characterizations of the glycosylated proteins in saliva and plasma have reported 45 proteinsin saliva and 303 in plasma as glycosylated proteins [20,49]. The result of the annotationinformation extracted from the UniProt knowledge indicates that potentially more glycosylatedproteins exist in saliva and plasma.
Several sources can contribute to the overlap of protein identifications of saliva and plasma:(i) leakage of plasma into saliva through intracellular or extracellular routes, including outflowof gingival crevicular fluid; (ii) plasma and saliva may share essential proteins needed tomaintain their physiological functions as body fluids; (iii) proteins derived from cell debrismay be in close contact with either fluid. We expected that the overlapping proteins fromdifferent sources would show different abundance patterns. Classification of the salivary andplasma proteins based on their function in the KEGG pathways revealed that the abundancecorrelations of the overlapping proteins of saliva and plasma vary with their biologicalfunctions. Previous estimates established that Igs contribute 5–15% of total salivary proteins.In the present study, 11% of total salivary proteins identified were Igs, and 64% of these werefound in plasma. The source of the Igs in saliva was previously proposed as either from salivarygland secretions or from crevicular fluid [50,54]. Our study reveals that there is a highcorrelation between the abundance of the overlapping Igs in saliva and plasma, suggesting thatthese overlapping Igs could result from leakage from plasma.
4.3 Clinical value of saliva and plasmaThe ultimate goal of cataloging the proteins found in body fluids is to use the information forhealth screening and disease detection. To that end, plasma proteins have proved their valueas clinical analytes. Saliva has attracted increased attention in that it provides advantages overother body fluids in its noninvasive collection, constant availability, little need for specialequipment, and cost-effectiveness. Diseases such as Sjögren’s syndrome, bacterial and viralinfectious diseases, and oral cancer cause alterations of salivary protein expression.Comparison of the salivary proteome with the plasma proteome helps to identify the salivaryspecific biomarkers as well as plasma-derived biomarkers that have been used in thediagnostics of a variety of human diseases.
Our search of the OMIM database indicated that salivary and plasma proteomes contain a largenumber of proteins associated with genetic disorders, some of which have known phenotypes.Table 5 shows the gene entries of the salivary and plasma proteomes in OMIM. The salivaproteins were matched to 1183 entries in OMIM; 1089 are disease genes with known sequencesand 91 are related with diseases with known phenotypes. Similar distributions are observedfor plasma proteins. Proteins present in both saliva and plasma were matched to 310 entries inthe diseases with known gene sequence and 47 entries in the diseases with phenotype.Interestingly, a few plasma proteins that are used in clinical diagnostics [55,56] are alsoidentified in the saliva, including creatine kinase B-type, fibrinogen, hemoglobin, rheumatoidfactor, and Igs. These results enhance the potential value of salivary proteins as biomarkers fordiagnostics. However, it remains to be determined qualitatively and quantitatively whetherthese proteins carrying genetic disorders or in combination with the diagnostic plasma proteinscan be used as disease biomarkers.
AbbreviationsCITP, Transient capillary isotachophoresisDMS, dimethylacrylamide
Yan et al. Page 14
Proteomics Clin Appl. Author manuscript; available in PMC 2009 November 5.
NIH
-PA Author Manuscript
NIH
-PA Author Manuscript
NIH
-PA Author Manuscript

FA, formic acidFFE, free-flow electrophoresisGO, gene ontologyIPI, International Protein IndexOMIM, online Mendelian inheritance in manSCX, strong cation exchangeSL, sublingualSM, submandibularWS, whole saliva
AcknowledgmentsThis work was supported by the National Institutes of Health (U01 DE16275 to D.T.W. and J.A.L., U01DE016267to J.R.Y. and J.E.M., U54DA021519 to G.O., RO1DE17734 to T.J.G.), MEDC grant GR687 (to G.O.), and SAIC/NCI contract SAIC/ NCI 23X110A. J.L.B., J.R.S., B.J.C. and J.L.S. acknowledge funding from the National Instituteof Allergy and Infectious Disease, National Institutes of Health under contract No. HHSN266200400067C. J.A.L.acknowledges also support from the W. M. Keck Foundation for the establishment of the UCLA Functional ProteomicsCenter.
References1. Humphrey SP, Williamson RT. A review of saliva: Normal composition, flow, and function. J. Prosthet.
Dent 2001;85:162–169. [PubMed: 11208206]2. Turner RJ, Sugiya H. Understanding salivary fluid and protein secretion. Oral Dis 2002;8:3–11.
[PubMed: 11936453]3. Defabianis P, Re F. The role of saliva in maintaining oral health. Minerva Stomatol 2003;52:301–308.
[PubMed: 12874534]4. Streckfus CF, Bigler LR. Saliva as a diagnostic fluid. Oral Dis 2002;8:69–76. [PubMed: 11991307]5. Drake RR, Cazare LH, Semmes OJ, Wadsworth JT. Serum, salivary and tissue proteomics for discovery
of biomarkers for head and neck cancers. Expert Rev. Mol. Diagn 2005;5:93–100. [PubMed:15723595]
6. Amado FM, Vitorino RM, Domingues PM, Lobo MJ, et al. Analysis of the human saliva proteome.Expert Rev.Proteomics 2005;2:521–539. [PubMed: 16097886]
7. Rujner J, Socha J, Barra E, Gregorek H, et al. Serum and salivary antigliadin antibodies and serumIgA anti-endomysium antibodies as a screening test for coeliac disease. Acta Paediatr 1996;85:814–817. [PubMed: 8819547]
8. Hu S, Wang J, Meijer J, Ieong S, et al. Salivary proteomic and genomic biomarkers for primarySjogren’s syndrome. Arthritis Rheum 2007;56:3588–3600. [PubMed: 17968930]
9. Pedersen AM, Reibel J, Nordgarden H, Bergem HO, et al. Primary Sjogren’s syndrome: Salivary glandfunction and clinical oral findings. Oral Dis 1999;5:128–138. [PubMed: 10522209]
10. Hu S, Yu T, Xie Y, Yang Y, et al. Discovery of oral fluid biomarkers for human oral cancer by massspectrometry. Cancer Genomics Proteomics 2007;4:55–64. [PubMed: 17804867]
11. Shori DK, Kariyawasam HH, Knight RA, Hodson ME, et al. Sulphation of the salivary mucin MG1(MUC-5B) is not correlated to the degree of its sialylation and is unaffected by cystic fibrosis. PflugersArch 2001;443:S50–S54. [PubMed: 11845303]
12. Aydin S. A comparison of ghrelin, glucose, alpha-amylase and protein levels in saliva from diabetics.J. Biochem. Mol.Biol 2007;40:29–35. [PubMed: 17244479]
13. Hagewald SJ, Fishel DL, Christan CE, Bernimoulin JP, et al. Salivary IgA in response to periodontaltreatment. Eur. J. Oral Sci 2003;111:203–208. [PubMed: 12786950]
14. Chen S, LaRoche T, Hamelinck D, Bergsma D, et al. Multiplexed analysis of glycan variation onnative proteins captured by antibody microarrays. Nat. Methods 2007;4:437–444. [PubMed:17417647]
15. Hu S, Loo JA, Wong DT. Human body fluid proteome analysis. Proteomics 2006;6:6326–6353.[PubMed: 17083142]
Yan et al. Page 15
Proteomics Clin Appl. Author manuscript; available in PMC 2009 November 5.
NIH
-PA Author Manuscript
NIH
-PA Author Manuscript
NIH
-PA Author Manuscript

16. Hu S, Xie Y, Ramachandran P, Ogorzalek Loo RR, et al. Large-scale identification of proteins inhuman salivary pro-teome by liquid chromatography/mass spectrometry and two-dimensional gelelectrophoresis-mass spectrometry. Proteomics 2005;5:1714–1728. [PubMed: 15800970]
17. Xie H, Bandhakavi S, Griffin TJ. Evaluating preparative isoelectric focusing of complex peptidemixtures for tandem mass spectrometry-based proteomics: A case study in profiling chromatin-enriched subcellular fractions in Saccharomyces cerevisiae. Anal. Chem 2005;77:3198–3207.[PubMed: 15889909]
18. Xie H, Rhodus NL, Griffin RJ, Carlis JV, et al. A catalogue of human saliva proteins identified byfree flow electrophoresis-based peptide separation and tandem mass spectrometry. Mol. Cell.Proteomics 2005;4:1826–1830. [PubMed: 16103422]
19. Guo T, Rudnick PA, Wang W, Lee CS, et al. Characterization of the human salivary proteome bycapillary isoelectric focusing/nanoreversed-phase liquid chromatography coupled with ESI-tandemMS. J. Proteome Res 2006;5:1469–1478. [PubMed: 16739998]
20. Ramachandran P, Boontheung P, Xie Y, Sondej M, et al. Identification of N-linked glycoproteins inhuman saliva by glycoprotein capture and mass spectrometry. J. Proteome Res 2006;5:1493–1503.[PubMed: 16740002]
21. Wilmarth PA, Riviere MA, Rustvold DL, Lauten JD, et al. Two-dimensional liquid chromatographystudy of the human whole saliva proteome. J. Proteome Res 2004;3:1017–1023. [PubMed: 15473691]
22. Denny P, Hagen FK, Hardt M, Liao L, et al. The proteomes of human parotid and submandibular/sublingual gland salivas collected as the ductal secretions. J. Proteome Res 2008;7:1994–2006.[PubMed: 18361515]
23. Kasper, DL.; Braunwald, E.; Hauser, S.; Longo, D., et al. Harrison’s Principles of Internal Medicine.New York: McGraw-Hill; 2004.
24. Omenn GS. Exploring the human plasma proteome. Proteomics 2005;5:3223–3225. [PubMed:16104055]
25. Omenn GS, States DJ, Adamski M, Blackwell TW, et al. Overview of the HUPO Plasma ProteomeProject Results from the pilot phase with 35 collaborating laboratories and multiple analytical groups,generating a core dataset of 3020 proteins and a publicly-available database. Proteomics2005;5:3226–3245. [PubMed: 16104056]
26. Adamski M, Blackwell T, Menon R, Martens L, et al. Data management and preliminary data analysisin the pilot phase of the HUPO Plasma Proteome Project. Proteomics 2005;5:3246–3261. [PubMed:16104057]
27. States DJ, Omenn GS, Blackwell TW, Fermin D, et al. Challenges in deriving high-confidence proteinidentifications from data gathered by a HUPO plasma proteome collaborative study. Nat. Biotechnol2006;24:333–338. [PubMed: 16525410]
28. Fang X, Yang L, Wang W, Song T, et al. Comparison of electrokinetics-based multidimensionalseparations coupled with electrospray ionization-tandem mass spectrometry for characterization ofhuman salivary proteins. Anal.Chem 2007;79:5785–5792. [PubMed: 17614365]
29. Rhodus NL, Cheng B, Myersq S, Bowles W, et al. A comparison of the pro-inflammatory, NF-kappaB-dependent cytokines: TNF-alpha, IL-1-alpha, IL-6, and IL-8 in different oral fluids fromoral lichen planus patients. Clin. Immunol 2005;114:278–283. [PubMed: 15721838]
30. Eng J, McCormack AL, Yates JR III. An approach to correlate tandem mass spectral data of peptideswith amino acid sequences in a protein database. J. Am. Soc. Mass Spectrom 1994;5:976–989.
31. Peng J, Elias JE, Thoreen CC, Licklider LJ, et al. Evaluation of multidimensional chromatographycoupled with tandem mass spectrometry (LC/LC-MS/MS) for large-scale protein analysis: the yeastproteome. J. Proteome Res 2003;2:43–50. [PubMed: 12643542]
32. Shimura K, Kamiya K, Matsumoto H, Kasai K. Fluorescence-labeled peptide pI markers for capillaryisoelectric focusing. Anal. Chem 2002;74:1046–1053. [PubMed: 11924962]
33. Keller A, Nesvizhskii AI, Kolker E, Aebersold R. Empirical statistical model to estimate the accuracyof peptide identifications made by MS/MS and database search. Anal.Chem 2002;74:5383–5392.[PubMed: 12403597]
34. Han DK, Eng J, Zhou H, Aebersold R. Quantitative profiling of differentiation-induced microsomalproteins using isotope-coded affinity tags and mass spectrometry. Nat. Biotechnol 2001;19:946–951.[PubMed: 11581660]
Yan et al. Page 16
Proteomics Clin Appl. Author manuscript; available in PMC 2009 November 5.
NIH
-PA Author Manuscript
NIH
-PA Author Manuscript
NIH
-PA Author Manuscript

35. Xie H, Griffin TJ. Trade-off between high sensitivity and increased potential for false positive peptidesequence matches using a two-dimensional linear ion trap for tandem mass spectrometry-basedproteomics. J. Proteome Res 2006;5:1003–1009. [PubMed: 16602709]
36. Cargile BJ, Bundy JL, Freeman TW, Stephenson JL Jr. Gel based isoelectric focusing of peptidesand the utility of isoelectric point in protein identification. J. Proteome Res 2004;3:112–119.[PubMed: 14998171]
37. Cargile BJ, Stephenson JL Jr. An alternative to tandem mass spectrometry: Isoelectric point andaccurate mass for the identification of peptides. Anal. Chem 2004;76:267–275. [PubMed: 14719870]
38. Cargile BJ, Talley DL, Stephenson JL Jr. Immobilized pH gradients as a first dimension in shotgunproteomics and analysis of the accuracy of pI predictability of peptides. Electrophoresis2004;25:936–945. [PubMed: 15004858]
39. Essader AS, Cargile BJ, Bundy JL, Stephenson JL Jr. A comparison of immobilized pH gradientisoelectric focusing and strong-cation-exchange chromatography as a first dimension in shotgunproteomics. Proteomics 2005;5:24–34. [PubMed: 15672457]
40. Geer LY, Markey SP, Kowalak JA, Wagner L, et al. Open mass spectrometry search algorithm. J.Proteome Res 2004;3:958–964. [PubMed: 15473683]
41. Zuo X, Speicher DW. Comprehensive analysis of complex proteomes using microscale solutionisoelectrofocusing prior to narrow pH range two-dimensional electrophoresis. Proteomics2002;2:58–68. [PubMed: 11788992]
42. Ramachandran P, Boontheung P, Xie Y, Sondej M, et al. Identification of N-linked glycoproteins inhuman saliva by glycoprotein capture and mass spectrometry. J. Proteome Res 2006;5:1493–1503.[PubMed: 16740002]
43. Martens L, Muller M, Stephan C, Hamacher M, et al. A comparison of the HUPO Brain ProteomeProject pilot with other proteomics studies. Proteomics 2006;6:5076–5086. [PubMed: 16912975]
44. Desiere F, Deutsch EW, Nesvizhskii AI, Mallick P, et al. Integration with the human genome ofpeptide sequences obtained by high-throughput mass spectrometry. Genome Biol 2005;6:R9.[PubMed: 15642101]
45. Bendtsen JD, Nielsen H, Brunak S. Improved prediction of signal peptides: SignalP 3.0. J. Mol.Biol2004;340:783–795. [PubMed: 15223320]
46. Emanuelsson O, Nielsen H, Brunak S, von Heijne G. Predicting subcellular localization of proteinsbased on their N-terminal amino acid sequence. J. Mol. Biol 2000;300:1005–1016. [PubMed:10891285]
47. Krogh A, Larsson B, von Heijne G, Sonnhammer EL. Predicting transmembrane protein topologywith a hidden Markov model: Application to complete genomes. J. Mol.Biol 2001;305:567–580.[PubMed: 11152613]
48. Nesvizhskii AI, Aebersold R. Interpretation of shotgun proteomic data: the protein inference problem.Mol. Cell. Proteomics 2005;4:1419–1440. [PubMed: 16009968]
49. Liu T, Qian WJ, Gritsenko MA, Camp DG II, et al. Human plasma N-glycoproteome analysis byimmunoaffinity subtraction, hydrazide chemistry, and mass spectrometry. J. Proteome Res2005;4:2070–2080. [PubMed: 16335952]
50. van Nieuw Amerongen A, Bolscher JGM, Veerman ECI. Salivary proteins: Protective and diagnosticvalue in cariology . Caries Res 2004;38:247–253. [PubMed: 15153696]
51. Rudney JD, Hickey KL, Ji Z. Cumulative correlations of lysozyme, lactoferrin, peroxidase, S-IgA,amylase, and total protein concentrations with adherence of oral viridans streptococci to microplatescoated with human saliva. J.Dent. Res 1999;78:759–768. [PubMed: 10096451]
52. de Souza GA, Godoy LM, Mann M. Identification of 491 proteins in the tear fluid proteome revealsa large number of proteases and protease inhibitors. Genome Biol 2006;7:R72. [PubMed: 16901338]
53. van Haeringen NJ, Glasius E. Enzymes of energy-producing metabolism in human tear fluid. Exp.Eye Res 1974;18:407–409. [PubMed: 4834047]
54. Huq NL, Cross KJ, Ung M, Myroforidis H, et al. A review of the salivary proteome and peptidomeand saliva-derived peptide therapeutics. Int. J. Pept. Res. Ther 2007;13:547–564.
55. Burtis, CA.; Ashwood, EA., editors. Tietz Fundamentals of Clinical Chemistry. Vol. 5th Edn..Philadelphia, PA: W. B. Saunders; 2001.
Yan et al. Page 17
Proteomics Clin Appl. Author manuscript; available in PMC 2009 November 5.
NIH
-PA Author Manuscript
NIH
-PA Author Manuscript
NIH
-PA Author Manuscript

56. Wallach, JB., editor. Interpretation of Diagnostic Tests. Philadelphia PA: Lippincott Williams &Wilkins; 2006.
Yan et al. Page 18
Proteomics Clin Appl. Author manuscript; available in PMC 2009 November 5.
NIH
-PA Author Manuscript
NIH
-PA Author Manuscript
NIH
-PA Author Manuscript

Figure 1.WS protein identifications based on the overlap of the identifications, unique peptide number,and sequence coverage. (A) Venn diagram showing the overlap of the WS proteins betweenlaboratories with total identifications from each group as 1222 CB/UM (CB/UM), 337 RTI(Research Triangle Institute), 447 UCLA, 862 UMN. (B) Number of WS proteins identifiedas a function of number of unique peptide detected; each bar is demarcated by the number oflabs making the identifications. (C) WS protein identifications classified based on proteinsequence coverage. The number in parentheses represents the total number of proteins withinthe sequence coverage range.
Yan et al. Page 19
Proteomics Clin Appl. Author manuscript; available in PMC 2009 November 5.
NIH
-PA Author Manuscript
NIH
-PA Author Manuscript
NIH
-PA Author Manuscript

Figure 2.Venn diagrams showing the overlapping peptide and protein identifications between WS,parotid/SMSL, and plasma. (A) Peptide identifications; (B) protein identifications.
Yan et al. Page 20
Proteomics Clin Appl. Author manuscript; available in PMC 2009 November 5.
NIH
-PA Author Manuscript
NIH
-PA Author Manuscript
NIH
-PA Author Manuscript

Figure 3.Comparison of molecular weight and isoelectric point of saliva proteome to plasma proteomeand ductal parotid/SMSL saliva proteome to WS proteome.
Yan et al. Page 21
Proteomics Clin Appl. Author manuscript; available in PMC 2009 November 5.
NIH
-PA Author Manuscript
NIH
-PA Author Manuscript
NIH
-PA Author Manuscript

Figure 4.GO SLIM distributions of saliva proteome, plasma proteome, overlapping proteins of salivaand plasma, and IPI human proteins. (A) Cellular component; (B) biologic process; (C)molecular function.
Yan et al. Page 22
Proteomics Clin Appl. Author manuscript; available in PMC 2009 November 5.
NIH
-PA Author Manuscript
NIH
-PA Author Manuscript
NIH
-PA Author Manuscript
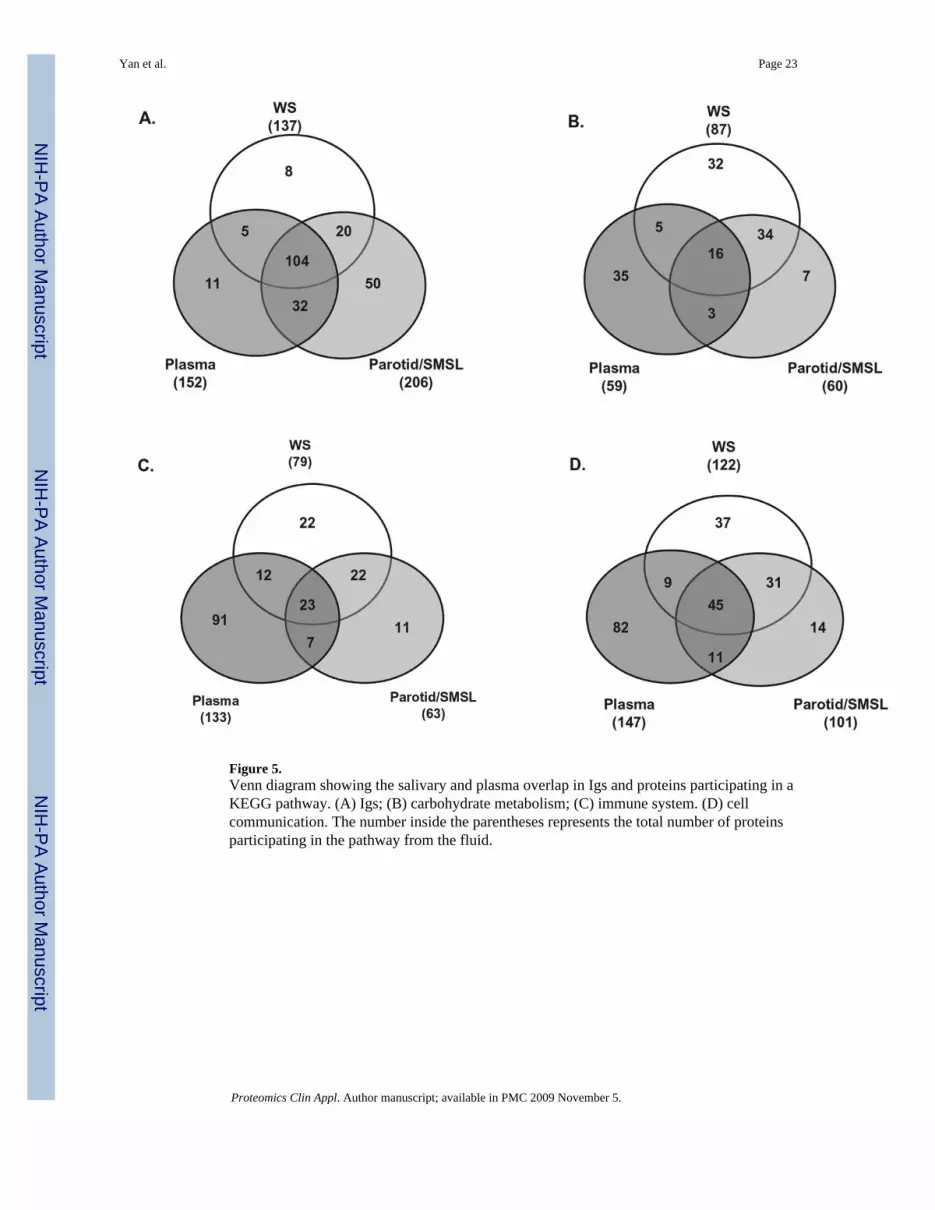
Figure 5.Venn diagram showing the salivary and plasma overlap in Igs and proteins participating in aKEGG pathway. (A) Igs; (B) carbohydrate metabolism; (C) immune system. (D) cellcommunication. The number inside the parentheses represents the total number of proteinsparticipating in the pathway from the fluid.
Yan et al. Page 23
Proteomics Clin Appl. Author manuscript; available in PMC 2009 November 5.
NIH
-PA Author Manuscript
NIH
-PA Author Manuscript
NIH
-PA Author Manuscript
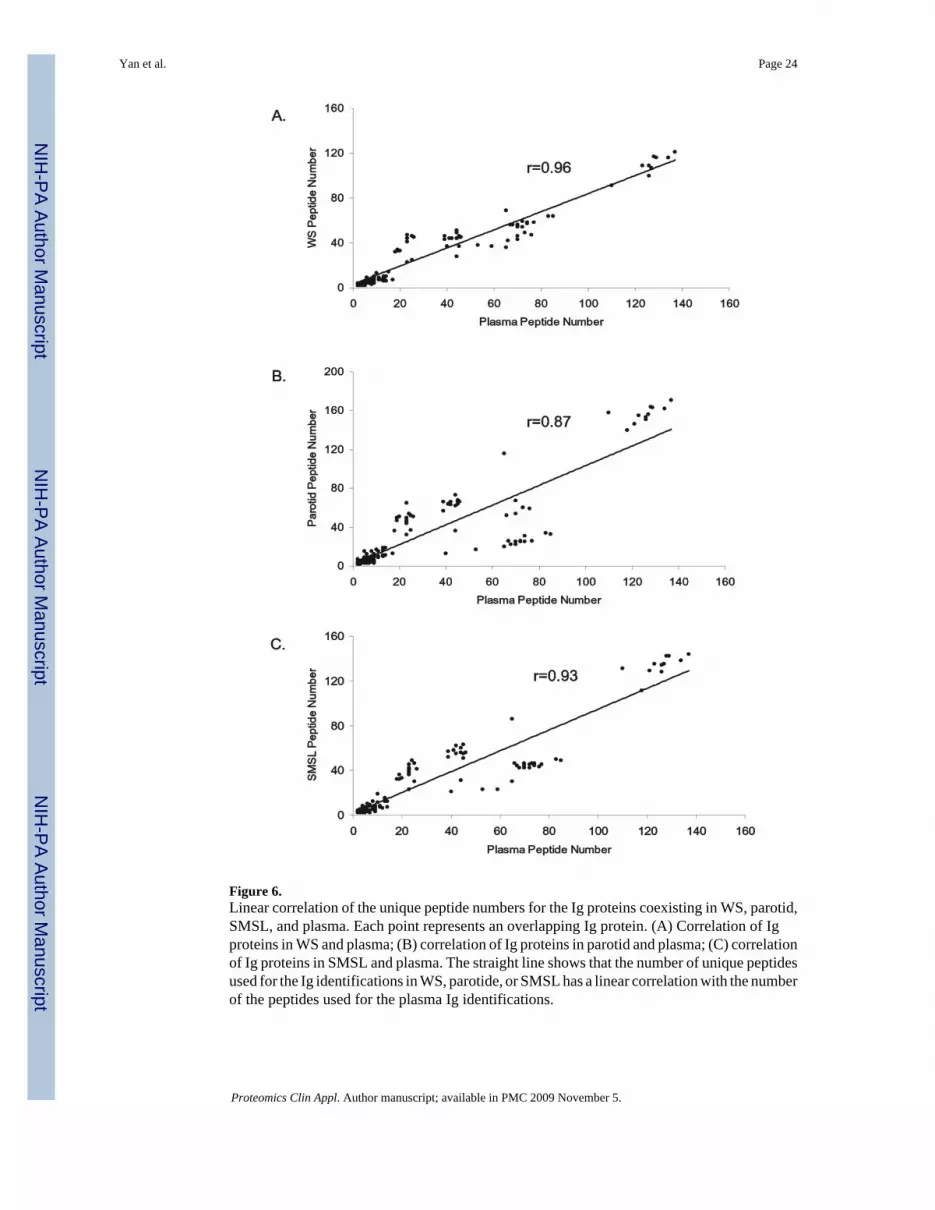
Figure 6.Linear correlation of the unique peptide numbers for the Ig proteins coexisting in WS, parotid,SMSL, and plasma. Each point represents an overlapping Ig protein. (A) Correlation of Igproteins in WS and plasma; (B) correlation of Ig proteins in parotid and plasma; (C) correlationof Ig proteins in SMSL and plasma. The straight line shows that the number of unique peptidesused for the Ig identifications in WS, parotide, or SMSL has a linear correlation with the numberof the peptides used for the plasma Ig identifications.
Yan et al. Page 24
Proteomics Clin Appl. Author manuscript; available in PMC 2009 November 5.
NIH
-PA Author Manuscript
NIH
-PA Author Manuscript
NIH
-PA Author Manuscript

NIH
-PA Author Manuscript
NIH
-PA Author Manuscript
NIH
-PA Author Manuscript
Yan et al. Page 25Ta
ble
1
Sum
mar
y of
exp
erim
enta
l app
roac
hes f
or W
S pr
otei
n id
entif
icat
ions
Lab
orat
ory
Pref
ract
iona
tion
Pept
ide
Sepa
ratio
nM
SSe
arch
Pro
gram
Sequ
ence
Dat
abas
eFP
Ra)
No.
of p
eptid
es
CB
/UM
Non
eC
IEF
LTQ
OM
SSA
Swis
s-Pr
ot≤1
%75
82C
ITP/
CZE
UM
NN
one
FFE-
SCX
-cap
LCLT
QSE
QU
EST
IPI v
3.18
≤1%
5468
RTI
Non
eIP
G-I
EFLT
QSE
QU
EST/
IdSi
eve
IPI v
3.19
≤1%
537
UC
LAZo
om-I
EF U
ltrac
entri
fuge
RPL
CQ
STA
RM
ASC
OT
IPI v
3.03
≤2%
1571
a)FP
R (p
eptid
e fa
lse
posi
tive
rate
).
Proteomics Clin Appl. Author manuscript; available in PMC 2009 November 5.

NIH
-PA Author Manuscript
NIH
-PA Author Manuscript
NIH
-PA Author Manuscript
Yan et al. Page 26Ta
ble
2
Sequ
ence
feat
ures
of s
aliv
a an
d pl
asm
a pr
oteo
mes
and
ove
rlapp
ing
prot
eins
bet
wee
n sa
liva
and
plas
ma
Sour
ceSw
iss_
Prot
_Ann
otat
iona)
(sal
iva:
143
6; p
lasm
a: 1
966;
ove
rlap
ped:
395
)Se
quen
ce fe
atur
e pr
edic
atio
nb) (s
aliv
a: 1
939;
pla
sma:
272
0; o
verl
appe
d: 5
97)
Sign
alT
arge
tGly
cSite
Tra
nsm
emSi
gnal
pT
arge
tp R
C ≤
2T
MH
MM
p ≥0
.99
p ≥0
.75
Saliv
a38
0 (2
7%)
47 (3
.3%
)348
(24%
)15
3 (1
0.7%
)55
3 (2
9%)
667
(34%
)21
1 (1
1%)
260
(13%
)Pl
asm
a45
7 (2
3%)
25 (1
.3%
)513
(26%
)35
0 (1
8%)
530
(20%
)70
2 (2
6%)
291
(115
%)
457
(17%
)O
verla
p13
5 (3
4%)
4 (1
.0%
)129
(33%
)38
(9.6
%)
233
(39%
)25
9 (4
3%)
73 (1
2%)
58 (9
.7%
)
a)Se
quen
ce fe
atur
e in
form
atio
n ex
tract
ed fr
om th
e U
niPr
ot k
now
ledg
ebas
e. T
he n
umbe
r rep
rese
nts t
he p
rote
ins w
ith th
e en
try in
the
Uni
Prot
. Sig
nal:
prot
ein
with
a si
gnal
sequ
ence
(pre
pept
ide)
; Tar
get:
prot
ein
with
a tr
ansi
t pep
tide
(mito
chon
drio
n, c
hlor
opla
st, t
hyla
koid
,cya
nelle
, or m
icro
body
); Tr
ansm
em: p
rote
in w
ith tr
ansm
embr
ane
dom
ain;
Gly
cSite
: pro
tein
with
gly
cosy
latio
n si
te.
b)Se
quen
ce fe
atur
e in
form
atio
n ob
tain
ed fr
om si
gnal
p, ta
rget
p, a
nd T
MH
MM
sequ
ence
feat
ure
pred
ictio
n pr
ogra
ms.
The
num
ber r
epre
sent
s the
tota
l pro
tein
s use
d fo
r the
pre
dict
ions
. p: H
MM
sign
alpe
ptid
e pr
obab
ility
; RC
: rel
iabi
lity
clas
ses.
Proteomics Clin Appl. Author manuscript; available in PMC 2009 November 5.

NIH
-PA Author Manuscript
NIH
-PA Author Manuscript
NIH
-PA Author Manuscript
Yan et al. Page 27
Table 3
Distinct human salivary proteins
AC_V332 Description Num_PepNum_Group
IPI00745705 LOC730924 similar to pancreatic α-amylase 894IPI00374315 C6orf58 uncharacterized protein C6orf58 683IPI00032294 CST4 cystatin-S 674IPI00305477 CST1 cystatin-SN 594IPI00013382 CST2 Cystatin-SA 584IPI00304557 C20orf70 short palate, lung and nasal epithelium carcinoma-
associated protein 2494
IPI00007244 MPO isoform H17 of myeloperoxidase 453IPI00060800 LOC124220 protein UNQ773/PRO1567 424IPI00009650 LCN1 lipocalin-1 394IPI00291410 C20orf114 isoform 1 of long palate, lung and nasal epithelium
carcinoma-associated protein 1393
IPI00025023 LPO lactoperoxidase 384IPI00010796 P4HB protein disulfide-isomerase 383IPI00026256 FLG filaggrin 373IPI00031547 DSG3 desmoglein-3 354IPI00002851 CST5 cystatin-D 344IPI00025846 DSC2 isoform 2A of desmocollin-2 343IPI00219525 PGD 6-phosphogluconate dehydrogenase, decarboxylating 323IPI00186290 EEF2 elongation factor 2 322IPI00008274 CAP1 adenylyl cyclase-associated protein 1 314IPI00386755 ERO1L ERO1-like protein alpha 313IPI00305622 TGM1 protein-glutamine γ-glutamyltransferase K 292IPI00784295 HSP90AA1 isoform 1 of heat shock protein HSP 90-α 292IPI00297056 CRNN cornulin 283IPI00082931 SPRR3 small proline-rich protein 3 264IPI00011285 CAPN1 calpain-1 catalytic subunit 262IPI00027444 SERPINB1 leukocyte elastase inhibitor 254IPI00291006 MDH2 malate dehydrogenase, mitochondrial 253IPI00169383 PGK1 phosphoglycerate kinase 1 234IPI00219077 LTA4H isoform 1 of leukotriene A-4 hydrolase 233IPI00744692 TALDO1 transaldolase 233IPI00031461 GDI2 Rab GDP dissociation inhibitor β 214IPI00299729 TCN1 transcobalamin-1 213IPI00303476 ATP5B ATP synthase subunitβ, mitochondrial 212IPI00006560 SERPINB13 isoform 1 of serpin B13 193IPI00007797 FABP5;LOC728641 fatty acid-binding protein, epidermal 193IPI00025512 HSPB1 heat shock protein β-1 193IPI00003817 ARHGDIB Rho GDP-dissociation inhibitor 2 184IPI00453476 Uncharacterized protein ENSP00000348237 183IPI00010133 CORO1A coronin-1A 164IPI00012503 PSAP isoform Sap-mu-0 of proactivator polypeptide 163IPI00550363 TAGLN2 transgelin-2 162IPI00295741 CTSB cathepsin B 154IPI00152154 MUC7 mucin-7 153IPI00103242 POF1B isoform 1 of protein POF1B 151IPI00004656 B2M β-2-microglobulin 144IPI00220301 PRDX6 peroxiredoxin-6 143IPI00000875 EEF1G elongation factor 1-γ 142IPI00440493 ATP5A1 ATP synthase subunitα, mitochondrial 141IPI00019038 LYZ lysozyme C 134IPI00304808 KLK1 kallikrein-1 134IPI00646304 PPIB peptidylprolyl isomerase B 134IPI00291175 VCL isoform 1 of vinculin 133IPI00296777 SPARCL1 SPARC-like protein 1 133IPI00216984 CALML3 calmodulin-like protein 3 123IPI00219446 PEBP1 phosphatidylethanolamine-binding protein 1 123IPI00414320 ANXA11 annexin A11 121IPI00013895 S100A11 protein S100-A11 114IPI00009123 NUCB2 nucleobindin-2 113IPI00335168 MYL6 isoform nonmuscle of myosin light polypeptide 6 112IPI00010896 CLIC1;DDAH2 chloride intracellular channel protein 1 111IPI00011937 PRDX4 peroxiredoxin-4 103IPI00026185 CAPZB isoform 1 of F-actin-capping protein subunit β 103IPI00060143 FAM3D protein FAM3D 103IPI00006995 P11 placental protein 11 102IPI00024145 VDAC2 isoform 1 of voltage-dependent anion-selective channel
protein 2101
IPI00296526 NAGK N-acetylglucosamine kinase 93IPI00296713 GRN isoform 1 of granulins 93IPI00008580 SLPI antileukoproteinase 92IPI00026260 NME1;NME2 nucleoside diphosphate kinase B 92
Proteomics Clin Appl. Author manuscript; available in PMC 2009 November 5.

NIH
-PA Author Manuscript
NIH
-PA Author Manuscript
NIH
-PA Author Manuscript
Yan et al. Page 28
AC_V332 Description Num_PepNum_Group
IPI00299571 PDIA6 isoform 2 of protein disulfide-isomerase A6 92IPI00332828 CES2 carboxylesterase 2 isoform 1 92IPI00377025 PRH1; PRH2 PRH1 protein (fragment) 91IPI00220828 TMSB4X thymosin β-4 84IPI00012011 CFL1 cofilin-1 83IPI00827847 BPI bactericidal permeability-increasing protein 83IPI00008529 RPLP2 60S acidic ribosomal protein P2 82IPI00009856 PLUNC protein Plunc 82IPI00024915 PRDX5 isoform mitochondrial of peroxiredoxin-5, mitochondrial 82IPI00304171 H2AFY isoform 2 of core histone macro-H2A.1 82IPI00216308 VDAC1 voltage-dependent anion-selective channel protein 1 81IPI00023011 SMR3B submaxillary gland androgen-regulated protein 3 homolog
B74
IPI00027463 S100A6 protein S100-A6 73IPI00216088 CRABP2 cellular retinoic acid-binding protein 2 73IPI00002818 KLK11 isoform 1 of kallikrein-11 72IPI00010270 RAC2 Ras-related C3 botulinum toxin substrate 2 72IPI00017987 SPRR1A cornifin-A 72IPI00465431 LGALS3 galectin-3 72IPI00010214 S100A14 Protein S100-A14 71IPI00019533 CHI3L2 chitinase-3-like protein 2 71IPI00028064 CTSG cathepsin G 71IPI00299078 PRH1; PRH2 salivary acidic proline-rich phosphoprotein 1/2 71IPI00075248 CALM3; CALM1; CALM2 calmodulin 63IPI00456429 UBA52 ubiquitin and ribosomal protein L40 63IPI00017992 SPRR2B small proline-rich protein 2B 62IPI00022810 CTSC dipeptidyl-peptidase 1 62IPI00025366 CS citrate synthase, mitochondrial 62IPI00298237 TPP1 isoform 1 of tripeptidyl-peptidase 1 62IPI00304903 SPRR1B cornifin-B 62IPI00783680 SOD1 superoxide dismutase 62IPI00062120 S100A16 protein S100-A16 61IPI00295542 NUCB1 nucleobindin-1 53IPI00414896 RNASET2 isoform 1 of ribonuclease T2 52IPI00441498 FOLR1 folate receptor alpha 52IPI00013881 HNRPH1 heterogeneous nuclear ribonucleoprotein H 51IPI00478198 PRB1 proline-rich protein BstNI subfamily 1 isoform 1 51IPI00034319 CUTA isoform A of protein CutA 43IPI00003919 QPCT glutaminyl-peptide cyclotransferase 42IPI00011302 CD59 CD59 glycoprotein 42IPI00016513 RAB10 Ras-related protein Rab-10 42IPI00329538 PRSS8 prostasin 42IPI00786921 SPRR1B similar to cornifin B 42IPI00023038 PRB1 basic salivary proline-rich protein 1 41IPI00028066 ADH7 class IV alcohol dehydrogenase 7 mu or sigma subunit 41IPI00029699 RNASE4 ribonuclease 4 41IPI00177543 PAM uncharacterized protein PAM 41IPI00219029 GOT1 aspartate aminotransferase, cytoplasmic 41IPI00301579 NPC2 epididymal secretory protein E1 41IPI00376005 EIF5A isoform 2 of eukaryotic translation initiation factor 5A-1 41IPI00382404 PRB4 PRB4 protein 41IPI00010182 DBI isoform a 1 of acyl-CoA-binding protein 33IPI00012024 HTN1 histatin-1 33IPI00329801 ANXA5 annexin A5 33IPI00215997 CD9 CD9 antigen 32IPI00291488 WFDC2 isoform 1 of WAP four-disulfide core domain protein 2 32IPI00000877 HYOU1 hypoxia upregulated protein 1 31IPI00003881 HNRPF heterogeneous nuclear ribonucleoprotein F 31IPI00012585 HEXB β-hexosaminidase beta chain 31IPI00299086 SDCBP syntenin-1 31IPI00465315 CYCS cytochrome c 31IPI00022990 STATH statherin 23IPI00027019 PRR4; PRH1; PRH2 proline-rich protein 4 22IPI00027851 HEXA β-hexosaminidase alpha chain 22IPI00028714 MGP matrix Gla protein 22IPI00067738 FAM3B isoform B of protein FAM3B 22IPI00293276 MIF macrophage migration inhibitory factor 22IPI00328960 LOC147645 similar to carcinoembryonic antigen-related cell
adhesion molecule 122
IPI00003176 HTRA1 serine protease HTRA1 21IPI00003802 MAN2A1 α-mannosidase 2 21IPI00006713 DNAJC3 isoform 1 of DnaJ homolog subfamily C member 3 21IPI00012540 PROM1 prominin-1 21IPI00018236 GM2A ganglioside GM2 activator 21IPI00018387 FURIN furin 21
Proteomics Clin Appl. Author manuscript; available in PMC 2009 November 5.

NIH
-PA Author Manuscript
NIH
-PA Author Manuscript
NIH
-PA Author Manuscript
Yan et al. Page 29
AC_V332 Description Num_PepNum_Group
IPI00168884 ATP6AP2 renin receptor 21IPI00183695 S100A10 protein S100-A10 21IPI00329482 LAMA4 isoform 1 of laminin subunit α-4 21IPI00333140 DNER delta and Notch-like epidermal growth factor-related receptor 21
The list contains the proteins that are not found in plasma but found in Whole, Parotid, and SMSL salivas. The numbers for the Num_Pep and Num_Groupcolumns are represented by the data from WS dataset.
Proteomics Clin Appl. Author manuscript; available in PMC 2009 November 5.

NIH
-PA Author Manuscript
NIH
-PA Author Manuscript
NIH
-PA Author Manuscript
Yan et al. Page 30
Table 4
Involvement of salivary and plasma proteomes in KEGG biological pathways
KEGG pathways Saliva (entries = 1527) Plasma (entries = 1415) Overlap (entries = 368)
Cell communication 205 195 85Carbohydrate metabolism 160 89 40Amino acid metabolism 164 95 35Immune system 127 180 44Signal transduction 99 167 20Lipid metabolism 67 42 9Energy metabolism 63 18 11Translation/transcription 57 17 2Endocrine system 58 62 12Cell motility 50 53 18Nucleotide metabolism 51 34 7Infectious diseases 52 25 12Xenobiotics biodegradation and metabolism 38 33 6Neurodegenerative disorders 38 37 16Others 52 38 8Folding, sorting, and degradation 27 20 6Metabolism of cofactors and vitamins 28 28 6Nervous system 27 28 4Signaling molecules and interaction 47 108 16Cancers 21 25 0Development 23 35 1Glycan biosynthesis and metabolism 47 25 5Cell growth and death 13 40 4Metabolic disorder 14 21 1
The number of entries represents the total pathways containing saliva proteins, plasma proteins, or the overlapping proteins of saliva and plasma. A proteincan be involved in multiple pathways.
Proteomics Clin Appl. Author manuscript; available in PMC 2009 November 5.

NIH
-PA Author Manuscript
NIH
-PA Author Manuscript
NIH
-PA Author Manuscript
Yan et al. Page 31
Table 5
Entries of the salivary and plasma proteins in OMIM
OMIM category Saliva Plasma Overlap
Genes with known sequence 1089 1288 310Genes of known sequence and a phenotype 91 115 47Confirmed phenotype with molecular basisunknown
2 0 0
Descriptive entry 1 2 1
Proteomics Clin Appl. Author manuscript; available in PMC 2009 November 5.


