Embed Size (px)
Citation preview

10.1101/gr.7080508Access the most recent version at doi: 2008 18: 393-403Genome Res.
David S. Johnson, Wei Li, D. Benjamin Gordon, et al. predefined DNA targetsSystematic evaluation of variability in ChIP-chip experiments using
MaterialSupplemental http://genome.cshlp.org/content/suppl/2008/02/08/gr.7080508.DC1.html
References
http://genome.cshlp.org/content/18/3/393.full.html#related-urlsArticle cited in:
http://genome.cshlp.org/content/18/3/393.full.html#ref-list-1This article cites 32 articles, 9 of which can be accessed free at:
serviceEmail alerting
click heretop right corner of the article orReceive free email alerts when new articles cite this article - sign up in the box at the
http://genome.cshlp.org/subscriptions go to: Genome ResearchTo subscribe to
Copyright © 2008, Cold Spring Harbor Laboratory Press
Cold Spring Harbor Laboratory Press on October 29, 2010 - Published by genome.cshlp.orgDownloaded from
Systematic evaluation of variability in ChIP-chipexperiments using predefined DNA targetsDavid S. Johnson,1,24 Wei Li,2,24,25 D. Benjamin Gordon,3 Arindam Bhattacharjee,3
Bo Curry,3 Jayati Ghosh,3 Leonardo Brizuela,3 Jason S. Carroll,4 Myles Brown,5
Paul Flicek,6 Christoph M. Koch,7 Ian Dunham,7 Mark Bieda,8 Xiaoqin Xu,8
Peggy J. Farnham,8 Philipp Kapranov,9 David A. Nix,10 Thomas R. Gingeras,9
Xinmin Zhang,11 Heather Holster,11 Nan Jiang,11 Roland D. Green,11 Jun S. Song,2
Scott A. McCuine,12 Elizabeth Anton,1 Loan Nguyen,1 Nathan D. Trinklein,13
Zhen Ye,14 Keith Ching,14 David Hawkins,14 Bing Ren,14 Peter C. Scacheri,15
Joel Rozowsky,16 Alexander Karpikov,16 Ghia Euskirchen,17 Sherman Weissman,18
Mark Gerstein,16 Michael Snyder,16,17 Annie Yang,19 Zarmik Moqtaderi,20
Heather Hirsch,20 Hennady P. Shulha,21 Yutao Fu,22 Zhiping Weng,21,22
Kevin Struhl,20,26 Richard M. Myers,1,26 Jason D. Lieb,23,26 and X. Shirley Liu2,26
1–23[See full list of author affiliations at the end of the paper, just before the Acknowledgments section.]
The most widely used method for detecting genome-wide protein–DNA interactions is chromatinimmunoprecipitation on tiling microarrays, commonly known as ChIP-chip. Here, we conducted the first objectiveanalysis of tiling array platforms, amplification procedures, and signal detection algorithms in a simulated ChIP-chipexperiment. Mixtures of human genomic DNA and “spike-ins” comprised of nearly 100 human sequences at variousconcentrations were hybridized to four tiling array platforms by eight independent groups. Blind to the number ofspike-ins, their locations, and the range of concentrations, each group made predictions of the spike-in locations. Wefound that microarray platform choice is not the primary determinant of overall performance. In fact, variation inperformance between labs, protocols, and algorithms within the same array platform was greater than the variationin performance between array platforms. However, each array platform had unique performance characteristics thatvaried with tiling resolution and the number of replicates, which have implications for cost versus detection power.Long oligonucleotide arrays were slightly more sensitive at detecting very low enrichment. On all platforms, simplesequence repeats and genome redundancy tended to result in false positives. LM-PCR and WGA, the most popularsample amplification techniques, reproduced relative enrichment levels with high fidelity. Performance among signaldetection algorithms was heavily dependent on array platform. The spike-in DNA samples and the data presentedhere provide a stable benchmark against which future ChIP platforms, protocol improvements, and analysis methodscan be evaluated.
[Supplemental material is available online at www.genome.org. The microarray data from this study have beensubmitted to Gene Expression Omnibus under accession no. GSE10114.]
With the availability of sequenced genomes and whole-genometiling microarrays, many researchers have conducted experi-ments using ChIP-chip and related methods to study genome-wide protein–DNA interactions (Cawley et al. 2004; Hanlon andLieb 2004; Kim et al. 2005; Carroll et al. 2006; Hudson andSnyder 2006; Kim and Ren 2006; Lee et al. 2006; Yang et al. 2006;
O’Geen et al. 2007). These are powerful yet challenging tech-niques, which are comprised of many steps that can introducevariability in the final results. One potentially important factor isthe relative performance of different types of tiling arrays. Cur-rently the most popular platforms for performing ChIP-chip ex-periments are commercial oligonucleotide-based tiling arraysfrom Affymetrix, NimbleGen, and Agilent. A second factorknown to introduce variation is the DNA amplification protocol,which is often required because the low DNA yield from a ChIPexperiment prevents direct detection on microarrays. A third fac-tor is the algorithm used for detecting regions of enrichmentfrom the tiling array data. Several algorithms have been devel-oped, but until this report there was no benchmark data set tosystematically evaluate them. In this study, we used a spike-inexperiment to systematically evaluate the effects of tiling micro-arrays, amplification protocols, and data analysis algorithms on
24These authors contributed equally to this work.25Present address: Division of Biostatistics, Dan L. Duncan CancerCenter, Department of Molecular and Cellular Biology, Baylor Col-lege of Medicine, Houston, TX 77030, USA.26Corresponding authors.E-mail [email protected]; fax (617) 632-2444.E-mail [email protected]; fax (617) 432-2529.E-mail [email protected]; fax (650) 725-9687.E-mail [email protected]; fax (919) 962-1625.Article published online before print. Article and publication date are at http://www.genome.org/cgi/doi/10.1101/gr.7080508.
Letter
18:393–403 ©2008 by Cold Spring Harbor Laboratory Press; ISSN 1088-9051/08; www.genome.org Genome Research 393www.genome.org
Cold Spring Harbor Laboratory Press on October 29, 2010 - Published by genome.cshlp.orgDownloaded from

ChIP-chip results. There are other potentially important factorsthat are not assessed here, and that from a practical standpointare more difficult to systematically control and evaluate. Theseinclude the skill of the experimenter, the amount of startingmaterial (chromatin, DNA, and antibody) used, the size of DNAfragments after shearing, the DNA labeling method, and the hy-bridization conditions.
There have been several studies evaluating the performanceof gene expression microarrays and analysis algorithms (Choe etal. 2005; Irizarry et al. 2005; MAQC Consortium 2006; Pattersonet al. 2006). However, tiling arrays present distinct informaticsand experimental challenges because large contiguous genomicregions are covered with high probe densities. Thus the resultsfrom the expression array spike-in experiments are not necessar-ily directly relevant to tiling-array experiments. One recent studycompared the performance of array-based (ChIP-chip) and se-quence-based (ChIP-PET) technologies on a real ChIP experiment(Euskirchen et al. 2007). However, because this was an explor-atory experiment, the list of absolute “true-positive” targets wasand remains unknown. Since the experiment (Euskirchen et al.2007) was performed without a key, the sensitivity and specific-ity of each technology had to be estimated retrospectively byqPCR validation of targets predicted from each platform.
In our experiment, eight independent research groups atlocations worldwide each hybridized two different mixtures ofDNA to one of four tiling-array platforms and predicted genomelocation and concentration of the spike-in sequences using a to-tal of 13 different algorithms. Throughout the process, the re-search groups were entirely blind to the contents of the spike-inmixtures. Using the spike-in key, we analyzed several perfor-mance parameters for each platform, algorithm, and amplifica-tion method. While all commercial platforms performed well, wefound that each had unique performance characteristics. We ex-amined the implications of these results in planning human ge-nome-wide experiments, in which trade-offs between probe den-sity and cost are important.
Results
Creation of the simulated ChIP sample
To create our simulated ChIP spike-in mixture, we first randomlyselected 100 cloned genomic DNA sequences (average length 497bp) corresponding to predicted promoters in the human genome(Cooper et al. 2006), individually purified them, and normalizedthe concentrations of each preparation to 500 pg/µL (Fig. 1). Tocreate enrichment levels that ranged from 1.25-fold to 196-foldrelative to genomic DNA (Supplemental Tables 1 and 2), weadded the appropriate volume of these stock solutions to a com-mercial human genomic DNA preparation (Methods; Supple-mental Tables 1 and 2). The clones were validated by sequencingand PCR both before and after dilution (Supplemental Methods).We prepared one clone mixture to be directly labeled and hy-bridized to arrays at the given concentration (“undiluted,” 77ng/µL), and a different clone mixture that was diluted such thatamplification would be necessary before labeling and hybridiza-tion (“diluted,” 3 ng/µL). The diluted mixture was created be-cause all of the array platforms require microgram quantities ofDNA, and a typical ChIP experiment produces ∼50 ng of DNA,making amplification essential for most ChIP-chip experiments.Each amplification method is known to cause under- and over-representation of certain sequences (Liu et al. 2003), which weaimed to assess in this context.
After the mixtures were prepared, the clones and their rela-tive concentrations were again validated by sequencing andquantitative PCR (qPCR). Note that while the same spike-inclones were present in the diluted and undiluted mixtures, theywere used at different enrichment levels in the two samples. Ineach mixture, most of the selected enrichment levels were rep-resented by 10 distinct clones. To challenge the sensitivity of thearray technologies, spike-in enrichment levels were biased to-ward enrichment levels less than 10-fold. We also prepared twosamples containing genomic DNA at 77 ng/µL and 3 ng/µL, re-spectively, without any spike-ins to serve as controls. We shearedthe DNA mixtures with a standard chromatin sonication proce-dure (Johnson et al. 2007).
Amplification, labeling, and DNA microarray hybridizationof the simulated ChIP
We sent aliquots of the control DNA and the two mixtures toparticipating groups, who labeled, amplified (the dilutedsamples), and hybridized the mixtures to DNA microarrays cov-ering the ENCODE regions (The ENCODE Project Consortium2007) using their standard procedures (Fig. 1; SupplementalMethods). None of the individuals involved in hybridizations orpredictions described below was aware of the identity of any ofthe clones in the spike-in mixtures, the number of spike-inclones, or the range of fold-enrichment values. For the samplesrequiring amplification, we tested the effect of three differentamplification procedures: ligation-mediated PCR (LM-PCR), ran-dom-priming PCR (RP), and whole-genome amplification (WGA)(O’Geen et al. 2006; Supplemental Methods).
The groups labeled and hybridized the mixtures to one ofthree different types of tiling arrays (NimbleGen, Affymetrix, orAgilent). Each of the tiling array technologies covers the 1% ofthe human genome selected for study by the ENCODE Consor-
Figure 1. Workflow for the multi-laboratory tiling array spike-in experi-ment.
Johnson et al.
394 Genome Researchwww.genome.org
Cold Spring Harbor Laboratory Press on October 29, 2010 - Published by genome.cshlp.orgDownloaded from

tium (The ENCODE Project Consortium 2007). Because each ar-ray technology is unique, the total number of nucleotides andpercentage of the ENCODE regions covered varies among theplatforms. However, we ensured that all of the regions corre-sponding to the spike-in clones were well represented on all ofthe platforms. Affymetrix ENCODE arrays contained short 25-mer probes at a start-to-start tiling resolution of 22 bp (1.0R ar-rays) or 7 bp (2.0R arrays) (http://www.affymetrix.com). Theprobes were chosen from RepeatMasked (Jurka 2000) sequencesand synthesized on the arrays in situ using photolithographictechnology. Agilent ENCODE arrays consisted of isothermal 44–60-mer probes that are unique in the human genome printed at100-bp resolution using inkjet technology (http://www.agilent.com). NimbleGen ENCODE arrays were comprised of unique50-mers at 38-bp resolution, with the probes being synthesized insitu using maskless array synthesizer technology (http://www.nimblegen.com). We performed all hybridizations in at least du-plicate, with a matched comparative hybridization using geno-mic DNA where appropriate. Affymetrix does not use two-channel comparative hybridization, thus spike-in and controlswere hybridized on separate arrays.
This study also initially included a PCR tiling-array platformconsisting of 22,180 consecutive ∼980-bp PCR products cover-ing the ENCODE regions spotted on glass slides. However, thePCR arrays performed poorly according to our choice of evalua-tion metrics, apparently because of the low resolution of thePCR array platform relative to the oligonucleotide platforms.This prevented an equitable comparison of the results, and there-fore the PCR array results are presented separately (SupplementalFig. 1).
Analysis algorithms
We used 13 different algorithms (Supplemental Methods) tomake predictions of enriched regions from the array measure-ments. While most of the algorithms function only on a singleplatform, we used two algorithms, MA2C (Song et al. 2007) andSplitter (H. Shulha, Y. Fu, and Z. Weng; http://zlab.bu.edu/splitter), for multiple platforms. To standardize the results acrossalgorithms, we required that each prediction consist of a rank-ordered list of predicted spike-in regions, with each region rep-resented by a single chromosome coordinate and a quantitativevalue that corresponded to a predicted enrichment level. Weconsidered a region to be predicted correctly if the single pre-dicted coordinate was within the spike-in region. Because thetotal number of spike-ins was unknown to the predictors, eachpredictor was also asked to estimate a cutoff score above whichthe selected predictions were considered significant. We thenused the spike-in key to assess the performance of each microar-ray platform, amplification method, and analysis algorithm(Fig. 2).
Assessment of sensitivity and specificity using ROC-like curves
We used an ROC (receiver operating characteristic)-like curveanalysis to assess the sensitivity and specificity of the predictionsfrom the array measurements across all spike-in concentrations(Fig. 2). All spike-in regions were considered true positives regard-less of the degree of enrichment. All remaining regions repre-sented on the array were considered true negatives. StandardROC curves are created by plotting the sensitivity (true-positiverate; Y-axis) against 1-specificity (false-positive rate; X-axis) ob-tained at every rank value of predicted sites. In our simulated
ChIP experiment and in many actual ChIP-chip experiments,true negatives are represented by >99% of the arrayed probes.This results in a large absolute number of false positives even atextremely low false-positive rates (false positives/true negatives).Therefore, to represent the performance of each experiment, onthe X-axis we plotted the (number of true positives)/(number ofspike-in clones), and on the Y-axis we plotted the (number offalse positives)/(number of spike-in clones). Presented in thisway, the value on either axis represents the same absolute num-ber of true positives (Y-axis) or false positives (X-axis). Underthis framework, the best possible array prediction would yielda graph that has a point in the upper left corner of the plot,which would represent a case with correct prediction of alltrue positives (100% sensitivity) without any false positives(100% specificity). Our benchmark for this analysis is the areaunder this ROC-like curve (AUC), which conceptually repre-sents the average sensitivity over a range of specificities. We stan-dardized the AUC values so that randomly selected sites wouldhave an AUC of nearly zero, and a perfect performance wouldhave an AUC of 1.
Microarray platform choice is not the primary determinantof overall performance
For all three microarray platforms, the best combination of dataand analysis algorithm in the unamplified spike-in experimentsgenerally detected ∼50% of the spike-in clones at a 5% false dis-covery ratio (number of false positives/total number of spike-inclones; this corresponds to about a 10% false discovery rate) (Fig.2). Most of the missed calls were for spike-ins at very low enrich-ment values (see below) (Fig. 3). However, the AUC valuesspanned a wide range, from 0.31 (NimbleGen data from Lab 4,Tilescope algorithm) to 0.71 (NimbleGen data from Lab 2, TA-MALg algorithm) (Fig. 2A). Among the platforms, the Splitteralgorithm was the best on Agilent tiling arrays (AUC = 0.64),while MAT (Johnson et al. 2006) was best for Affymetrix(AUC = 0.59). For the amplified spike-in experiments, the AUCvalues also spanned a wide range, from 0.12 (RP amplifica-tion method, Affymetrix arrays, TiMAT [David Nix; http://sourceforge.net/projects/timat2] algorithm) to 0.57 (WGA ampli-fication method, NimbleGen arrays, and TAMALg [Bieda et al.2006] algorithm) (Fig. 2B). Through bootstrapping, we found theconfidence interval of AUC within each array/lab/algorithmcombination around �0.07 (Supplemental Methods), thus smallAUC differences may not reflect significant performance differ-ences.
The wide range of AUC values was not limited to compari-sons across microarray platforms. In fact, the variance of AUCvalues between experiments performed within the same platformis similar to, if not greater than, the variance observed betweenthe different platforms (Fig. 2C,D). This indicates that amongcommonly used experimental and analysis procedures, microar-ray platform choice is not the primary determinant of overallperformance. Differences within a platform could arise from avariety of factors, most prominently by between-lab variability inexperimental procedures and differences in the analysis algo-rithm used. For example, the hybridizations done in Lab 3 had alower AUC than the hybridizations done in Lab 7 using the sameAgilent microarray platform (Fig. 2A). There was at least one ma-jor difference in the experimental protocol between these labs:Lab 3 used Alexa dyes, whereas Lab 7 used Cyanine dyes for DNAlabeling and detection.
Systematic evaluation of variability in ChIP-chip
Genome Research 395www.genome.org
Cold Spring Harbor Laboratory Press on October 29, 2010 - Published by genome.cshlp.orgDownloaded from

All platforms were very sensitive at high enrichment levels;at extremely low enrichment levels, long oligonucleotideplatforms are more sensitive
The enrichment levels produced by a typical ChIP experimentvary, from less than twofold to several thousandfold. Therefore,of particular interest is the sensitivity of arrays, amplification
methods, and analysis methods acrossvarious ranges of fold enrichment. Foreach array, amplification method, andanalysis algorithm combination, we cal-culated the sensitivity at high (64–192-fold), medium (sixfold to 10-fold), low(threefold to fourfold), and ultra-low(1.25–2-fold) enrichment ranges (Fig. 3).Generally, as expected, sensitivity de-creases with decreasing fold enrich-ment. All technologies show a steep de-crease in sensitivity at absolute enrich-ments (as opposed to measuredenrichments) below threefold. Ouranalysis demonstrated that at a false dis-covery ratio of 5%, the NimbleGen plat-form (with four replicates) is the mostsensitive platform at lower levels of en-richment (less than threefold), followedclosely by Agilent (with two replicates).The differences in sensitivity among theplatforms are not significant at levels ofenrichment higher than threefold.These data are consistent with previousstudies that showed that longer oligonu-cleotides are more sensitive than shorterprobes (Hughes et al. 2001).
Sensitivities were lower for ampli-fied samples than for unamplifiedsamples regardless of the amplificationmethod across all spike-in enrichmentlevels. Again, at lower-fold enrichments,lower sensitivity was observed. Holdingthe analysis method constant, LigationMediated-PCR (LM-PCR) afforded theleast reduction in AUC from unampli-fied to amplified sample on Agilent ar-rays. On Affymetrix arrays, LM-PCR per-formed significantly better than RP am-plification. The WGA method was usedonly on the NimbleGen platform, butalso produced results with very little re-duction in AUC.
The simulated ChIP-chip samplecan be used to objectively assess cutoffselection
When making predictions of enrichedregions based on ChIP-chip measure-ments, the ideal significance thresholdor “cutoff” for selecting targets is gener-ally unknown. This is because manyChIP-chip experiments are discovery ef-forts in which very few true bindingsites are known. Therefore, it is impos-
sible to calibrate the cutoff based on a truth model. Specificitycan be improved at the cost of sensitivity, and vice versa, but inmost cases a cutoff that optimally balances sensitivity and speci-ficity produces the most useful outcome. In the context of ChIP-chip experiments, false-positive and false-negative calls areequally problematic. Because our simulated experiments have atruth model, we can calibrate the optimal threshold for each of
Figure 2. Summary performance statistics for spike-in predictions. (A) Undiluted and Unamplifiedsamples. Raw data were provided by seven different labs, which are designated as follows: (1) M.Brown; (2) P. Farnham and R. Green; (3) R. Myers; (4) B. Ren; (5) M. Snyder; (6) K. Struhl and T.Gingeras; (7) S. McCuine. AUC (Area Under ROC-like Curve) values were calculated based on theranked list of spike-in calls provided by each group. The references for the algorithms are: (8) Johnsonet al. 2006; (9) D. Nix, http://sourceforge.net/projects/timat2; (10) Cawley et al. 2004; (11) H. Shulha,Y. Fu, and Z. Weng, http://zlab.bu.edu/splitter; (12) Song et al. 2007; (13) Bieda et al. 2005; (14) Lucaset al. 2007; (15) Zhang et al. 2007; (16) Scacheri et al. 2006; (17) Kim et al. 2005; (18) A. Karpikov andM. Gerstein, unpubl. (B) The same as A, for Diluted and Amplified samples. (C) ROC-like plots forUnamplified spike-in predictions. As an aid in interpretation, the dashed vertical line represents thepoint at which a group’s number of false-positive predictions equal 5% of the total number of true-positive spike-ins. At this point, all platforms correctly identified ∼50% of the true-positive spike-ins.Error bars represent the two-sided 95% confidence interval of the average sensitivity at each false-positive ratio (X-axis). (D) The same as C, for Amplified samples.
Johnson et al.
396 Genome Researchwww.genome.org
Cold Spring Harbor Laboratory Press on October 29, 2010 - Published by genome.cshlp.orgDownloaded from

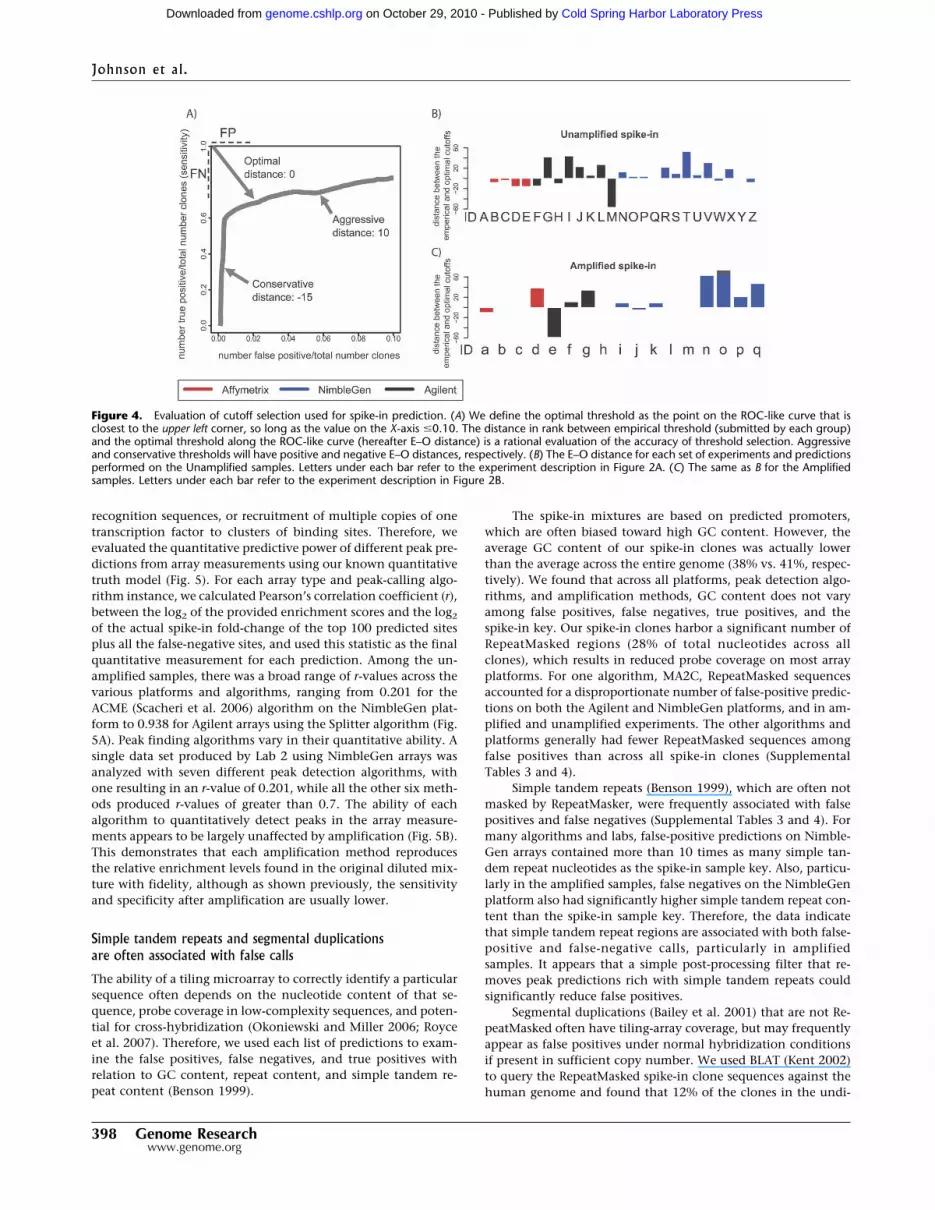
the array experiments and peak-calling algorithms. We definethe optimal threshold as the point on the ROC-like curve that isclosest to the upper left corner, so long as the value on the X-axisis �10%. This point equally penalizes false positives and falsenegatives, and therefore minimizes false positives and false nega-tives simultaneously. The distance in rank between empiricalthreshold (submitted by each group) and the optimal thresholdalong the ROC-like curve (hereafter called the E-O distance) is arational evaluation of the accuracy of threshold selection (Fig.4A).
Estimates of the significance threshold are often too aggressiveor conservative, but do not vary with enrichment level
Overly aggressive threshold selection will produce a larger num-ber of predicted peaks and many false positives, resulting in apositive E–O distance. Conservative threshold selection will iden-tify fewer false positives at the cost of more false negatives thanthe optimal, resulting in a negative E–O distance. In the optimalsituation, the empirical threshold is exactly the same as the op-timal threshold, so that the E–O distance will be 0. In our simu-lated ChIP experiments, we found a broad range of E–O values,from �59 (very conservative, Agilent arrays, LM-PCR amplified,
ADM-1 algorithm) to 74 (very aggressive, NimbleGen arrays,LM-PCR amplified, Splitter algorithm) (Fig. 4B). However, severalanalysis methods produced a cutoff very near the ideal threshold.In particular, MAT always produced calls with a near-optimalcutoff. We also examined the E–O distance metrics at variousspike-in enrichment levels (Supplemental Fig. 2). Across allarray platforms and peak prediction algorithms, E–O distances donot generally vary significantly among known spike-in enrich-ment levels. This suggests that it may not be necessary tocalibrate prediction thresholds based on presumed enrichmentlevels in a ChIP experiment. Proper determination of E–O dis-tance requires perfect knowledge of a truth model, thus spike-inexperiments such as ours will remain important for labs inter-ested in calibrating E–O distance on their particular analysis al-gorithm.
All platforms and most analysis methods accurately estimatedactual enrichment values
In ChIP-chip experiments, investigators are often interested inthe magnitude of the relative enrichment value for any particularlocus. These enrichment values may reflect an important aspectof biology such as the affinity of a transcription factor to its
Figure 3. Enrichment-specific sensitivity. (A) Enrichment-specific sensitivity for Unamplified spike-in mixtures. The spike-in clones were divided intofour levels of enrichment: High fold-change (64–192); Medium fold-change (6–10); Low fold-change (3–4); and Ultra Low fold-change (1.25–2).Enrichment-specific array prediction sensitivity (Y-axis) is defined as the percentage of correctly predicted enrichment-specific clones, with the totalnumber of false positives equal to 5% of the total number of spike-in clones. Letters under each bar refer to the experiment description in Figure 2A.(B) The same as A, but for Amplified samples. Letters under each bar refer to the experiment description in Figure 2B.
Systematic evaluation of variability in ChIP-chip
Genome Research 397www.genome.org
Cold Spring Harbor Laboratory Press on October 29, 2010 - Published by genome.cshlp.orgDownloaded from
recognition sequences, or recruitment of multiple copies of onetranscription factor to clusters of binding sites. Therefore, weevaluated the quantitative predictive power of different peak pre-dictions from array measurements using our known quantitativetruth model (Fig. 5). For each array type and peak-calling algo-rithm instance, we calculated Pearson’s correlation coefficient (r),between the log2 of the provided enrichment scores and the log2
of the actual spike-in fold-change of the top 100 predicted sitesplus all the false-negative sites, and used this statistic as the finalquantitative measurement for each prediction. Among the un-amplified samples, there was a broad range of r-values across thevarious platforms and algorithms, ranging from 0.201 for theACME (Scacheri et al. 2006) algorithm on the NimbleGen plat-form to 0.938 for Agilent arrays using the Splitter algorithm (Fig.5A). Peak finding algorithms vary in their quantitative ability. Asingle data set produced by Lab 2 using NimbleGen arrays wasanalyzed with seven different peak detection algorithms, withone resulting in an r-value of 0.201, while all the other six meth-ods produced r-values of greater than 0.7. The ability of eachalgorithm to quantitatively detect peaks in the array measure-ments appears to be largely unaffected by amplification (Fig. 5B).This demonstrates that each amplification method reproducesthe relative enrichment levels found in the original diluted mix-ture with fidelity, although as shown previously, the sensitivityand specificity after amplification are usually lower.
Simple tandem repeats and segmental duplicationsare often associated with false calls
The ability of a tiling microarray to correctly identify a particularsequence often depends on the nucleotide content of that se-quence, probe coverage in low-complexity sequences, and poten-tial for cross-hybridization (Okoniewski and Miller 2006; Royceet al. 2007). Therefore, we used each list of predictions to exam-ine the false positives, false negatives, and true positives withrelation to GC content, repeat content, and simple tandem re-peat content (Benson 1999).
The spike-in mixtures are based on predicted promoters,which are often biased toward high GC content. However, theaverage GC content of our spike-in clones was actually lowerthan the average across the entire genome (38% vs. 41%, respec-tively). We found that across all platforms, peak detection algo-rithms, and amplification methods, GC content does not varyamong false positives, false negatives, true positives, and thespike-in key. Our spike-in clones harbor a significant number ofRepeatMasked regions (28% of total nucleotides across allclones), which results in reduced probe coverage on most arrayplatforms. For one algorithm, MA2C, RepeatMasked sequencesaccounted for a disproportionate number of false-positive predic-tions on both the Agilent and NimbleGen platforms, and in am-plified and unamplified experiments. The other algorithms andplatforms generally had fewer RepeatMasked sequences amongfalse positives than across all spike-in clones (SupplementalTables 3 and 4).
Simple tandem repeats (Benson 1999), which are often notmasked by RepeatMasker, were frequently associated with falsepositives and false negatives (Supplemental Tables 3 and 4). Formany algorithms and labs, false-positive predictions on Nimble-Gen arrays contained more than 10 times as many simple tan-dem repeat nucleotides as the spike-in sample key. Also, particu-larly in the amplified samples, false negatives on the NimbleGenplatform also had significantly higher simple tandem repeat con-tent than the spike-in sample key. Therefore, the data indicatethat simple tandem repeat regions are associated with both false-positive and false-negative calls, particularly in amplifiedsamples. It appears that a simple post-processing filter that re-moves peak predictions rich with simple tandem repeats couldsignificantly reduce false positives.
Segmental duplications (Bailey et al. 2001) that are not Re-peatMasked often have tiling-array coverage, but may frequentlyappear as false positives under normal hybridization conditionsif present in sufficient copy number. We used BLAT (Kent 2002)to query the RepeatMasked spike-in clone sequences against thehuman genome and found that 12% of the clones in the undi-
Figure 4. Evaluation of cutoff selection used for spike-in prediction. (A) We define the optimal threshold as the point on the ROC-like curve that isclosest to the upper left corner, so long as the value on the X-axis �0.10. The distance in rank between empirical threshold (submitted by each group)and the optimal threshold along the ROC-like curve (hereafter E–O distance) is a rational evaluation of the accuracy of threshold selection. Aggressiveand conservative thresholds will have positive and negative E–O distances, respectively. (B) The E–O distance for each set of experiments and predictionsperformed on the Unamplified samples. Letters under each bar refer to the experiment description in Figure 2A. (C) The same as B for the Amplifiedsamples. Letters under each bar refer to the experiment description in Figure 2B.
Johnson et al.
398 Genome Researchwww.genome.org
Cold Spring Harbor Laboratory Press on October 29, 2010 - Published by genome.cshlp.orgDownloaded from

luted and diluted spike-in samples had more than one significantBLAT match in the genome (Supplemental Tables 3 and 4). Thesame analysis on the false-positive predictions for each array andalgorithm combination found that predictions on Agilent arraysconsistently contain fewer regions with multiple BLAT hits ge-nome-wide than those on other platforms. Regardless of thepeak-calling algorithm or whether the samples were amplified,false positives on the NimbleGen platform had consistently moreacross-genome redundancy as indicated by BLAT than was pres-ent in the spike-in mixtures. In one experiment, nearly 80% of
the false positives matched at least one other region in the ge-nome (Supplemental Tables 3 and 4). The absolute number offalse positives in this experiment is small, thus eliminating se-quences with this simple analysis could greatly improve the over-all predictions.
Cost versus detection power
As ChIP-chip efforts scale to the full genome, the considerationsof sensitivity and specificity are complicated by the fact thatfor many laboratories, oligonucleotide densities practical for
Figure 5. Analysis of quantitative predictive power. (A) Unamplified samples. Bar plots represent the Pearson’s correlation coefficient r, between thelog2 predicted score and the log2 actual spike-in fold-change of the top 100 predicted sites. Arrows below each bar graph point to scatterplotsrepresentative of data from each microarray platform. In the scatterplots, true positives are shown as black dots, with the number of true positivesindicated above the dots in black type at each fold-change level. The number of false negatives is indicated in purple type below the points at eachfold-change level. The solid line represents the LOWESS smoothed curve for all true positives. False positives are shown as green triangles, and are onthe far left of the graph because of their actual log2 fold-change values of 0. (B) The same as A, but for Amplified samples.
Systematic evaluation of variability in ChIP-chip
Genome Research 399www.genome.org
Cold Spring Harbor Laboratory Press on October 29, 2010 - Published by genome.cshlp.orgDownloaded from

ENCODE-scale (∼30 Mb) arrays are not currently practical forgenome-wide (∼3 Gb) arrays. Different platforms offer variousdepths of coverage of the genome, and often the coverage isflexible even within a platform type. The cost of performing suchexperiments varies widely (Fig. 6A). Given the variety of options,we used our simulated ChIP-chip measurements to model theprospective performance of arrays with lower probe densities(Fig. 6B).
Our spike-in clones covered only ∼500 bp, but in a typicalChIP experiment ∼1 kb of DNA surrounding a site of protein–DNA interaction is enriched. To account for this in our estima-tion of array performance with respect to probe density, weevenly deleted probes in silico so that the absolute number ofprobes covering the 500-bp spike-in region would be equivalentto the number covering a 1-kb region normally enriched in aChIP experiment. For example, an ∼1-kb region enriched in ahypothetical ChIP-chip experiment might span 10 NimbleGenprobes at the 100-bp whole-genome tiling resolution, whereas an∼500-bp spike-in clone is covered by 13 NimbleGen probes onthe 38-bp resolution ENCODE array. In this scenario, to simulatewhole-genome tiling array performance, we deleted NimbleGenprobes (Methods) such that 10 probes would be left to cover each500-bp region (∼50-bp resolution). For each platform, we usedthe same probe deletion approach, and the best and the mostpragmatic current estimate for probe densities of whole-genometiling arrays available (Fig. 6A). Since some platforms allow cus-tom designs that make any density and number of probes theo-retically possible, we extended our analysis by gradually deletingan increasing percentage of probes on the arrays so as to provideperformance estimates over a wide range of potential probe den-sities (Fig. 6B). Lower-resolution arrays generally have a lowerAUC than their denser counterparts. Furthermore, replicates areessential to increase the AUC for experiments with lower probedensities, especially for Affymetrix, which requires at the veryleast three replicates to generate an AUC greater than 0.4 at theprojected genome-wide tiling resolution. Researchers must cali-brate their desired AUC values based on the number of arrays andprobe densities that are practical (Fig. 6B).
Next, we examined sensitivity at different probe densities asa function of the true enrichment values (Fig. 6C). We again findthat arrays perform significantly better at higher enrichment lev-els, but at lower probe densities, none of the platforms were ableto detect ultra-low enrichment. Particularly for the Low (three-fold to fourfold) enrichment values, higher probe densities arecritical for acceptable levels of sensitivity. For example, on Af-fymetrix arrays at the 0.5 AUC level, one would detect 100% ofthe High (64–192-fold), 80% of the Medium (sixfold to 10-fold),45% of the Low (threefold to fourfold), and almost no Ultra Low(1.25–2-fold-change) targets. Therefore, investigators may wishto characterize levels of enrichment in their ChIP samples todetermine the best array platforms to use and to calibrate theoptimal probe density and number of replicates to perform with-out incurring unnecessary expenditure.
Finally, we examined the number of probes and cost re-quired to achieve various AUC values across the three platforms.Affymetrix offers the greatest probe density of any platform, al-though it also requires far more probes than Agilent and Nimble-Gen platforms to achieve similar AUC values (Fig. 6D). However,the much lower cost per probe afforded by Affymetrix makes thecost to achieve less than 0.5 AUC values lower overall, relative toother platforms (Fig. 6E). If AUC levels greater than 0.5 are de-sired, the cost of the three platforms becomes virtually identical.
Discussion
We have conducted the most comprehensive study to date oftiling microarray platforms, DNA amplification protocols, anddata analysis algorithms, with respect to their effect on the re-sults of ChIP-chip experiments.
Tiling arrays from all commercial companies tested workedwell at the 5% false discovery ratio (∼10% FDR) level, especiallyusing the optimal experimental protocol with the best analysisalgorithm. NimbleGen and Agilent arrays are more sensitive atdetecting regions with very low enrichment (1.25- to twofold),likely owing to longer oligonucleotide probes and probe se-quence optimization. The results of Affymetrix experiments ben-efit more from replicates than other platforms. The variation be-tween laboratories, protocols, and analysis methods within thesame platform is similar to, if not greater than, the variationbetween the best results from different platforms. Clearly, eveninvestigators using the same platform must work toward betterstandard operating procedures and develop quality control met-rics to monitor quality of reagents and arrays.
We found that both the WGA and LM-PCR protocols pro-duce results comparable to corresponding undiluted samples andare very effective at detecting low-enrichment regions. Differentanalysis algorithms are appropriate for different tiling-array plat-forms. MAT seems to work best on Affymetrix tiling arrays. Split-ter and Agilent’s internal WA or ADM-1 algorithms are the bestfor Agilent tiling arrays. For NimbleGen tiling arrays, TAMALg,Splitter, and NimbleGen’s internal permutation algorithms workbetter for the unamplified samples, and TAMALg, MA2C, andTilescope (Zhang et al. 2007) work better for the amplifiedsamples.
We note that the conclusions we report are supported bymany aspects of the data in aggregate, rather than being depen-dent on a specific property of any individual experiment. There-fore, although factors such as the inclusion or exclusion of indi-vidual investigators, the particular batches of reagents or arraysused, or sets of algorithm parameters might have slightlychanged the results of individual experiments reported here, theoverall conclusion of the evaluation is robust with respect tothese variables. Nonetheless, as with any study, there are short-comings here. For example, NimbleGen seems to be the relativelymore successful commercial platform in this study, but it is pos-sible that this is a result of more experiments and analyses beingperformed with this platform. In the same way that between twopeople randomly drawing numbers from the same normal distri-bution N(µ, �2), a person drawing 10 numbers is more likely toget the highest number than a person drawing only five, theplatform with the most replicates, laboratories, and algorithmstested has an advantage among closely matched competitors.Another note of caution concerns our analysis of whole-genomearray performance. All commercial tiling-array companies haveproprietary algorithms for probe selection based on the hybrid-ization quality of oligonucleotide probes. However, the effective-ness of these algorithms diminishes when probes are tiled at veryhigh resolution, since there are simply not enough biochemicallyoptimal probes to choose from at such resolution. Therefore,probes on the ENCODE arrays might be less optimal than thosein the whole-genome arrays (which are at a lower tiling resolu-tion) from the same platform. As a result, our simulated probedeletion analysis might underestimate the actual whole-genomearray performance, especially for Affymetrix tiling arrays. Finally,the spike-in DNA used in this study has a different fragment
Johnson et al.
400 Genome Researchwww.genome.org
Cold Spring Harbor Laboratory Press on October 29, 2010 - Published by genome.cshlp.orgDownloaded from

Figure 6. Cost versus detection power: simulation of whole-genome experiments. (A) Summary statistics for the simulation of commercial whole-genome tiling array experiments. (B) Array performance as a function of replicate number and tiling resolution (see Methods). AUC values are indicatedby color (key at bottom). Black numbers on the top indicate the percentage of probes remaining on the ENCODE array in the simulation. The redcoordinates at the bottom indicate the corresponding array resolution, assuming a 1-kb region of ChIP enrichment. The currently available (August 2007)commercial whole-genome tiling array resolution is underlined. (C) Array sensitivity according to enrichment level. As in Figure 3, the spike-in cloneswere divided into four levels of enrichment: High (64–192 fold); Medium (6–10 fold); Low (3–4 fold); and Ultra Low (1.25–2 fold). Sensitivity at eachenrichment level is defined as the percentage of correctly predicted clones, with the total number of false positives equal to 5% of the total number ofspike-in clones (color key at bottom). The array platforms are indicated along the X-axis. (D). Using our deletion analysis and current (August 2007) listprices for each commercial array technology, we calculated the number of probes and dollar amount required to produce a given AUC value (left panel).The minimum number of probes required to achieve a given AUC was determined by using the information in panel B for each platform, assuming a1.5-Gb nonrepetitive genome. For Affymetrix, a single-channel platform, the need to perform separate ChIP and control/input hybridizations wasaccounted for in calculating probe number. In the righthand panel, the minimum cost required to achieve a given AUC value is plotted.
Systematic evaluation of variability in ChIP-chip
Genome Research 401www.genome.org
Cold Spring Harbor Laboratory Press on October 29, 2010 - Published by genome.cshlp.orgDownloaded from

length distribution than a real ChIP-chip sample. Real ChIP-enriched regions often have peak-shaped profiles instead of uni-form enrichment across the entire region, thus algorithms mod-eling peak shapes may perform better with real ChIP-chip datathan the spike-in signal. Nonetheless, the spike-in strategy weused provides the most feasible benchmark for the factors we areevaluating.
In this simulated ChIP-chip experiment, we have found thatcommercial tiling arrays perform remarkably well even at rela-tively low levels of enrichment. We also found that the cost toachieve similar sensitivity between the commercial tiling-arrayplatforms is comparable. Tiling microarrays from all commercialcompanies continue to get less expensive and to deliver continu-ally higher probe densities. Simultaneously, new detection tech-nologies such as high-throughput sequencing are emerging(Johnson et al. 2007). To date, there has been no systematic com-parison of ChIP-chip and ChIP-seq, or ChIP-seq performed ondifferent sequencing platforms. Our spike-in library and data setmight be used for such a purpose, and we hope that this studyand our spike-in library will encourage continued rigorous com-petition and comparison between all of the genomic detectionplatforms.
Methods
Validation of the simulated ChIP sampleThe simulated ChIP sample was validated in three ways: (1) se-quencing of the original clone preps before dilution, (2) sequenc-ing of the diluted clones with PCR preamplification using uni-versal primers, and (3) inserting specific PCR of the dilutedclones, followed by agarose gel electrophoresis. Our experimentalvalidation revealed no anomalies in the spike-in mixtures, andour analysis of the array predictions adds extra evidence that thelibraries were mixed at the proper stoichiometries and that theclone identities were correct.
Simulated ChIP amplification, array hybridization, and dataanalysisDetailed descriptions of each experimental procedure and analy-sis algorithm are described in the Supplemental material.
Probe and replicate deletion simulationWe evenly and gradually deleted probes in silico at 2% intervals,such that at each step there are 100%, 98%, 96%, . . . , 2% ofprobes left on the arrays. At each step, we repeated this probedeletion five times with randomly selected starting positions toform five different array designs. Shown in this study is the av-erage area under the ROC curve of all replicate combinations onall five array designs. For example, the Affymetrix analysis wasgenerated from 15,750 different array predictions, based on 63possible replicate combinations derived from the six availableexperiments (from one to six replicates: 6 + 15 + 20 + 15 + 6 + 1 = 63),five different array designs, and 50 different probe deletionsteps.
Sequence analysis of array predictionsFor each group of array predictions, we binned the predictedregions into false negatives, false positives, and true positives. Forfalse positives, 200 bp of reference human sequence was added 5�
and 3� of the predicted location. We then calculated the percentGC, the percent RepeatMasked, and the percent simple tandemrepeats across the sequences in each group based on UCSC ge-
nome annotations (http://genome.ucsc.edu). For the BLAT (Kent2002) analysis, we used a cutoff score >30 to find similar se-quences in the genome for each clone.
Complete list of author affiliations1Department of Genetics, Stanford University Medical Center,Stanford, California 94305, USA; 2Department of Biostatisticsand Computational Biology, Dana-Farber Cancer Institute, Har-vard School of Public Health, Boston, Massachusetts 02115, USA;3Agilent Technologies, Inc., Santa Clara, California 95051, USA;4Cancer Research UK, Cambridge Research Institute, Cambridge,CB2 0RE, United Kingdom; 5Department of Medical Oncology,Dana-Farber Cancer Institute, Harvard Medical School, Boston,Massachusetts 02115, USA; 6EMBL-European Bioinformatics In-stitute, Wellcome Trust Genome Campus, Hinxton, CambridgeCB10 1SD, United Kingdom; 7European Bioinformatics Institute,Wellcome Trust Genome Campus, Hinxton, Cambridge CB101SD, United Kingdom; 8Department of Pharmacology and theGenome Center, University of California–Davis, Davis, Califor-nia 95616, USA; 9Affymetrix, Inc., Santa Clara, California 95051,USA; 10HCI Bio Informatics, Huntsman Cancer Institute, SaltLake City, Utah 84112, USA; 11Roche NimbleGen, Inc., Madison,Wisconsin 53719, USA; 12Whitehead Institute, Cambridge, Mas-sachusetts 02142, USA; 13SwitchGear Genomics, Menlo Park,California 94025, USA; 14Ludwig Institute for Cancer Research,Department of Cellular and Molecular Medicine, University ofCalifornia, San Diego School of Medicine, La Jolla, California92093-0653, USA; 15Department of Genetics, Case Western Re-serve University, Cleveland, Ohio 44106, USA; 16Department ofMolecular Biophysics and Biochemistry, Yale University, NewHaven, Connecticut 06520, USA; 17Department of Molecular,Cellular and Developmental Biology, Yale University, New Ha-ven, Connecticut 06520, USA; 18Department of Genetics, YaleUniversity, New Haven, Connecticut 06520, USA; 19GenentechInc., South San Francisco, California 94080-4990, USA; 20Depart-ment of Biological Chemistry & Molecular Pharmacology, Har-vard Medical School, Boston, Massachusetts 02115-5730, USA;21Biomedical Engineering Department, Boston University, Bos-ton, Massachusetts 02215, USA; 22Bioinformatics Program, Bos-ton University, Boston, Massachusetts 02215, USA; 23Depart-ment of Biology and Carolina Center for Genome Sciences, Uni-versity of North Carolina at Chapel Hill, Chapel Hill, NorthCarolina 27599-3280, USA
AcknowledgmentsWe thank NimbleGen, Affymetrix, and Agilent for arrays andtechnical support, and the NHGRI ENCODE project and all of theENCODE PIs for funding and logistical support. We thank MarcHalfon for advice. Additional funding support for the project wasprovided by NIH grant 1R01 HG004069-01. Affymetrix, Agilent,and NimbleGen Systems (now Roche NimbleGen) contributedreagents and expertise for the experiments presented in this pa-per. These companies may stand to benefit financially from pub-lication of the results.
References
Bailey, J.A., Yavor, A.M., Massa, H.F., Trask, B.J., and Eichler, E.E. 2001.Segmental duplications: Organization and impact within the currenthuman genome project assembly. Genome Res. 11: 1005–1017.
Benson, G. 1999. Tandem repeats finder: A program to analyze DNAsequences. Nucleic Acids Res. 27: 573–580.
Bieda, M., Xu, X., Singer, M.A., Green, R., and Farnham, P.J. 2006.
Johnson et al.
402 Genome Researchwww.genome.org
Cold Spring Harbor Laboratory Press on October 29, 2010 - Published by genome.cshlp.orgDownloaded from

Unbiased location analysis of E2F1-binding sites suggests awidespread role for E2F1 in the human genome. Genome Res.16: 595–605.
Carroll, J.S., Meyer, C.A., Song, J., Li, W., Geistlinger, T.R., Eeckhoute, J.,Brodsky, A.S., Keeton, E.K., Fertuck, K.C., Hall, G.F., et al. 2006.Genome-wide analysis of estrogen receptor binding sites. Nat. Genet.38: 1289–1297.
Cawley, S., Bekiranov, S., Ng, H.H., Kapranov, P., Sekinger, E.A., Kampa,D., Piccolboni, A., Sementchenko, V., Cheng, J., Williams, A.J., et al.2004. Unbiased mapping of transcription factor binding sites alonghuman chromosomes 21 and 22 points to widespread regulation ofnoncoding RNAs. Cell 116: 499–509.
Choe, S.E., Boutros, M., Michelson, A.M., Church, G.M., and Halfon,M.S. 2005. Preferred analysis methods for Affymetrix GeneChipsrevealed by a wholly defined control dataset. Genome Biol. 6: R16.doi: 10.1186/gb-2005-6-2-r16.
Cooper, S.J., Trinklein, N.D., Anton, E.D., Nguyen, L., and Myers, R.M.2006. Comprehensive analysis of transcriptional promoter structureand function in 1% of the human genome. Genome Res. 16: 1–10.
The ENCODE Project Consortium. 2007. Identification and analysis offunctional elements in 1% of the human genome by the ENCODEpilot project. Nature 447: 799–816.
Euskirchen, G.M., Rozowsky, J.S., Wei, C.L., Lee, W.H., Zhang, Z.D.,Hartman, S., Emanuelsson, O., Stolc, V., Weissman, S., Gerstein,M.B., et al. 2007. Mapping of transcription factor binding regions inmammalian cells by ChIP: Comparison of array- andsequencing-based technologies. Genome Res. 17: 898–909.
Hanlon, S.E. and Lieb, J.D. 2004. Progress and challenges in profilingthe dynamics of chromatin and transcription factor binding withDNA microarrays. Curr. Opin. Genet. Dev. 14: 697–705.
Hudson, M.E. and Snyder, M. 2006. High-throughput methods ofregulatory element discovery. Biotechniques 41: 673–681.
Hughes, T.R., Mao, M., Jones, A.R., Burchard, J., Marton, M.J., Shannon,K.W., Lefkowitz, S.M., Ziman, M., Schelter, J.M., Meyer, M.R., et al.2001. Expression profiling using microarrays fabricated by an ink-jetoligonucleotide synthesizer. Nat. Biotechnol. 19: 342–347.
Irizarry, R.A., Warren, D., Spencer, F., Kim, I.F., Biswal, S., Frank, B.C.,Gabrielson, E., Garcia, J.G., Geoghegan, J., Germino, G., et al. 2005.Multiple-laboratory comparison of microarray platforms. Nat.Methods 2: 345–350.
Johnson, W.E., Li, W., Meyer, C.A., Gottardo, R., Carroll, J.S., Brown,M., and Liu, X.S. 2006. Model-based analysis of tiling-arrays forChIP-chip. Proc. Natl. Acad. Sci. 103: 12457–12462.
Johnson, D.S., Mortazavi, A., Myers, R.M., and Wold, B. 2007.Genome-wide mapping of in vivo protein–DNA interactions. Science316: 1497–1502.
Jurka, J. 2000. Repbase update: A database and an electronic journal ofrepetitive elements. Trends Genet. 16: 418–420.
Kent, W.J. 2002. BLAT—The BLAST-like alignment tool. Genome Res.12: 656–664.
Kim, T.H. and Ren, B. 2006. Genome-wide analysis of protein–DNAinteractions. Annu. Rev. Genomics Hum. Genet. 7: 81–102.
Kim, T.H., Barrera, L.O., Zheng, M., Qu, C., Singer, M.A., Richmond,T.A., Wu, Y., Green, R.D., and Ren, B. 2005. A high-resolution mapof active promoters in the human genome. Nature 436: 876–880.
Lee, T.I., Jenner, R.G., Boyer, L.A., Guenther, M.G., Levine, S.S., Kumar,R.M., Chevalier, B., Johnstone, S.E., Cole, M.F., Isono, K., et al. 2006.Control of developmental regulators by Polycomb in humanembryonic stem cells. Cell 125: 301–313.
Liu, C.L., Schreiber, S.L., and Bernstein, B.E. 2003. Development andvalidation of a T7 based linear amplification for genomic DNA. BMCGenomics 4: 19. doi: 10.1186/1471-2164-4-19.
Lucas, I., Palakodeti, A., Jiang, Y., Young, D.J., Jiang, N., Fernald, A.A.,and Le Beau, M.M. 2007. High-throughput mapping of origins ofreplication in human cells. EMBO Rep. 8: 770–777.
MAQC Consortium. 2006. The MicroArray Quality Control (MAQC)project shows inter- and intraplatform reproducibility of geneexpression measurements. Nat. Biotechnol. 24: 1151–1161.
O’Geen, H., Nicolet, C.M., Blahnik, K., Green, R., and Farnham, P.J.2006. Comparison of sample preparation methods for ChIP-chipassays. Biotechniques 41: 577–580.
O’Geen, H., Squazzo, S.L., Iyengar, S., Blahnik, K., Rinn, J.L., Chang,H.Y., Green, R., and Farnham, P.J. 2007. Genome-wide analysis ofKAP1 binding suggests autoregulation of KRAB-ZNFs. PLoS Genet.3: e89. doi: 10.1371/journal.pgen.0030089.
Okoniewski, M.J. and Miller, C.J. 2006. Hybridization interactionsbetween probesets in short oligo microarrays lead to spuriouscorrelations. BMC Bioinformatics 7: 276. doi:10.1186/1471-2105-7-276.
Patterson, T.A., Lobenhofer, E.K., Fulmer-Smentek, S.B., Collins, P.J.,Chu, T.M., Bao, W., Fang, H., Kawasaki, E.S., Hager, J., Tikhonova,I.R., et al. 2006. Performance comparison of one-color and two-colorplatforms within the MicroArray Quality Control (MAQC) project.Nat. Biotechnol. 24: 1140–1150.
Royce, T.E., Rozowsky, J.S., and Gerstein, M.B. 2007. Assessing the needfor sequence-based normalization in tiling microarray experiments.Bioinformatics 23: 988–997.
Scacheri, P.C., Crawford, G.E., and Davis, S. 2006. Statistics forChIP-chip and DNase hypersensitivity experiments on NimbleGenarrays. Methods Enzymol. 411: 270–282.
Song, J.S., Johnson, W.E., Zhu, X., Zhang, X., Li, W., Manrai, A.K., Liu,J.S., Chen, R., and Liu, X.S. 2007. Model-based analysis of 2-colorarrays (MA2C). Genome Biol. 8: R178. doi: 10.1186/gb-2007-8-8-r178.
Yang, A., Zhu, Z., Kapranov, P., McKeon, F., Church, G.M., Gingeras,T.R., and Struhl, K. 2006. Relationships between p63 binding, DNAsequence, transcription activity, and biological function in humancells. Mol. Cell 24: 593–602.
Zhang, Z.D., Rozowsky, J., Lam, H.Y., Du, J., Snyder, M., and Gerstein,M. 2007. Tilescope: Online analysis pipeline for high-density tilingmicroarray data. Genome Biol. 8: R81. doi: 10.1186/gb-2007-8-5-r81.
Received August 27, 2007; accepted in revised form December 12, 2007.
Systematic evaluation of variability in ChIP-chip
Genome Research 403www.genome.org
Cold Spring Harbor Laboratory Press on October 29, 2010 - Published by genome.cshlp.orgDownloaded from


