Embed Size (px)
Citation preview
Systematic review and meta-analysis of the baseline concentrationsand physiologic responses of gut hormones to food ineating disorders1,2
Alexis C Prince, Samantha J Brooks, Daniel Stahl, and Janet Treasure
ABSTRACTBackground: Disturbances in gastrointestinal hormones have beenwidely identified in persons with eating disorders (EDs) and havebeen implicated in their clinical pathologies.Objective: The objective was to identify, critically examine, andsummarize studies investigating the short-term response of gastro-intestinal hormones to food in persons with an ED, including thesubtypes anorexia nervosa and bulimia nervosa.Design: A priori inclusion and exclusion criteria were set and in-cluded a procedure in which a test meal or glucose load was givenand blood hormone concentrations measured. All studies includeda healthy control group for comparison. The outcome variable wasdefined as the mean difference between fasting plasma hormoneconcentrations and the maximum postprandial peak or nadir. Thedifference in baseline values between groups was also examined.Pooled standardized mean differences were calculated and analyzedwhere possible.Results: A total of 28 studies were identified, including sufficientstudies to perform a meta-analysis for ghrelin, peptide YY, chole-cystokinin, insulin, and pancreatic polypeptide. Persons with an EDhad higher baseline concentrations of ghrelin (large effect), peptideYY (medium effect), and cholecystokinin (medium effect for ED,large effect for anorexia nervosa). The response of insulin to foodwas decreased in persons with an ED (medium effect). No furtherdifferences were found in the release of gut peptides to a standard-ized test meal.Conclusions: All of the studies had low power for the differentsubtypes of EDs. High heterogeneity among the studies was ob-served, and limitations are discussed. The findings suggest thatthe physiologic changes observed in patients with EDs are highlyvariable and subject to multiple confounding factors. Am J ClinNutr 2009;89:755–65.
INTRODUCTION
The study of biological factors involved in the pathophysi-ology of eating disorders (EDs), such as neurotransmitters andgastrointestinal (GI) peptides, is an area of active interest. It hasbeen widely hypothesized that disturbances in one or more ofthese agents could, in part, contribute to the development of EDand be implicated in their clinical pathologies (1). Previous re-views of the data on the neurobiological disturbances associatedwith ED have, in the main, concluded that there is little evi-
dence to suggest that these abnormalities are primary and traitrelated (2–4). However, there is increasing evidence, althoughnot conclusive, that some of these changes may contribute to themaintenance of some symptomatic aspects of EDs, even whensecondary to malnutrition and/or aberrant eating behaviors (3).
It is therefore of great interest to examine the differentialrelease of GI hormones in the spectrum of EDs, including an-orexia nervosa (AN) and bulimia nervosa (BN), because theirdysregulation may act to initiate, maintain, or exacerbate cyclesof food restriction or binge-purge behaviors observed in thesedisorders. The brain regulates energy homeostasis and appetitevia central signaling pathways in the hypothalamus and brain-stem in response to peripheral signals released from adiposetissue and the GI tract (5, 6). The focus of the current review isspecific GI hormones involved in this process and their distur-bance in EDs. To our knowledge, no meta-analyses of the lit-erature concerning this topic have been conducted. Therefore,our aim was to identify, critically examine, and summarize suchstudies investigating the short-term physiologic response of GIhormones in persons with an ED and to examine whether they,and the AN or BN subtypes with extremes of eating behavior,would show contrasting and discordant blood hormone con-centrations before and after a test meal. Where possible, meta-analyses of the data were undertaken.
Specifically, our first hypothesis was that fasting hormoneconcentrations would be abnormal in the subgroup with re-stricting AN, as a secondary result of the disturbance in weighthomeostasis, and hormones that stimulate eating (eg, ghrelin) andhormones associated with satiation [eg, peptide YY (PYY) andcholecystokinin (CCK)] would be elevated. A second hypothesiswas that persons exhibiting binge-eating behaviors would also
1 From King’s College London, Nutritional Sciences Division, Franklin-
Wilkins Building, London, United Kingdom (ACP); the Division of Psycho-
logical Medicine, Eating Disorders Research Unit, Institute of Psychiatry,
King’s College, London, United Kingdom (SJB and DS); and the Depart-
ment of Psychiatry, Thomas Guy House, Guy’s Hospital, London, United
Kingdom (JT).2 Reprints not available. Address correspondence to AC Prince, King’s
College London, Nutritional Sciences Division, Franklin-Wilkins Building,
150 Stamford Street, London SE1 9NH, United Kingdom. E-mail: alexis.
Received October 3, 2008. Accepted for publication December 17, 2008.
First published online January 28, 2009; doi: 10.3945/ajcn.2008.27056.
Am J Clin Nutr 2009;89:755–65. Printed in USA. � 2009 American Society for Nutrition 755
by guest on May 11, 2011
ww
w.ajcn.org
Dow
nloaded from
show an increase in ghrelin and PYY at baseline. However, theexpected outcome for CCK was less clear in the binge-eatinggroups. The third hypothesis was that persons with AN wouldhave a normal or increased release of hormones associated withsatiation after a test meal, but that persons with binge-eatingwould have a reduced response and that these changes mightexplain their abnormal pattern of eating at normal weight.
METHODS
The aim of this study was to summarize the research that hasexamined the release of GI hormones in patients with EDs as com-pared with healthy control (HC) subjects within a test meal paradigm.The QUOROM (Quality of Reporting Meta-Analyses) statement formeta-analyses was followed.
Literature search
The literature search was conducted by using the electronicdatabases PubMed, Ovid, Embase, and Google Scholar and byadditional hand searches through the reference lists obtained fromthe articles found. Journals were searched up to January 2008. Thesearch included combinations of the following keywords andphrases: anorexia nervosa, bulimia nervosa, eating disorder, ap-petite, control, regulation, gastrointestinal, hormone, pancreaticpeptides, cholecystokinin, CCK, ghrelin, gastric inhibitory pep-tide, GIP, glucagon-like peptide-1, GLP-1, insulin, peptide YY,PYY, postprandial, preprandial, test meal, and food. Studies in-vestigating hormonal responses to a test meal in patients with anED, specifically the AN and BN subtypes, as compared with HCsubjects were eligible for inclusion. Eleven factors implicated inshort-term response to food were identified during the search thathad been studied in EDs: ghrelin, PYY, CCK, insulin, gastricinhibitory peptide (GIP), glucagon-like peptide-1 (GLP-1), so-matostatin, glucagon, pancreatic polypeptide (PP), gastrin, andvasoactive intestinal peptide (VIP). However, only ghrelin, PYY,CCK, insulin, and PP had been investigated in a sufficient numberof studies to be suitable for a meta-analysis.
Paper retrieval
The search was conducted on the basis of the following in-clusion criteria:
1) Population: subjects suffering from an ED (inpatients and out-patients) and an HC group
2) Sample size: studies with .5 subjects in the test group3) Publication date: articles from 1988 to January 20084) Language: English-language articles only5) Study designs: test meal (solid or liquid) or glucose load pro-
tocol with pre- and postprandial analysis of gastrointestinalhormone concentrations
6) Measures: baseline hormone concentrations and short-termplasma hormone response to a test meal or glucose load
7) Outcome variable: baseline hormone concentrations and meanmaximal changes in hormone concentrations after consump-tion of a test meal or glucose load
Selection
A total of 28 studies were found during the search phase; 24studies were selected following the search criteria and 4 studieswere excluded. In the first of the excluded studies, the test group
consisted of recovered AN subjects (7). Data from the secondexcluded study could not be obtained in full (8). Two additionalstudies were excluded on the basis of insufficient test groupsample sizes (9, 10). One study included in the review examinedmultiple gut hormones, but was excluded from all but one meta-analysis for PP because of a lack of raw data (11). Three studieswere included in the review but were excluded from all meta-analyses because of an insufficient number of studies examiningthe same outcome measures, specifically GIP, GLP-1, somato-statin, glucagons, and gastrin (12–14). All included studies con-tained age- and sex-matched HC groups. In summary, this reviewexamined a total of 24 studies, 21 of which were included in themeta-analyses.
Data abstraction
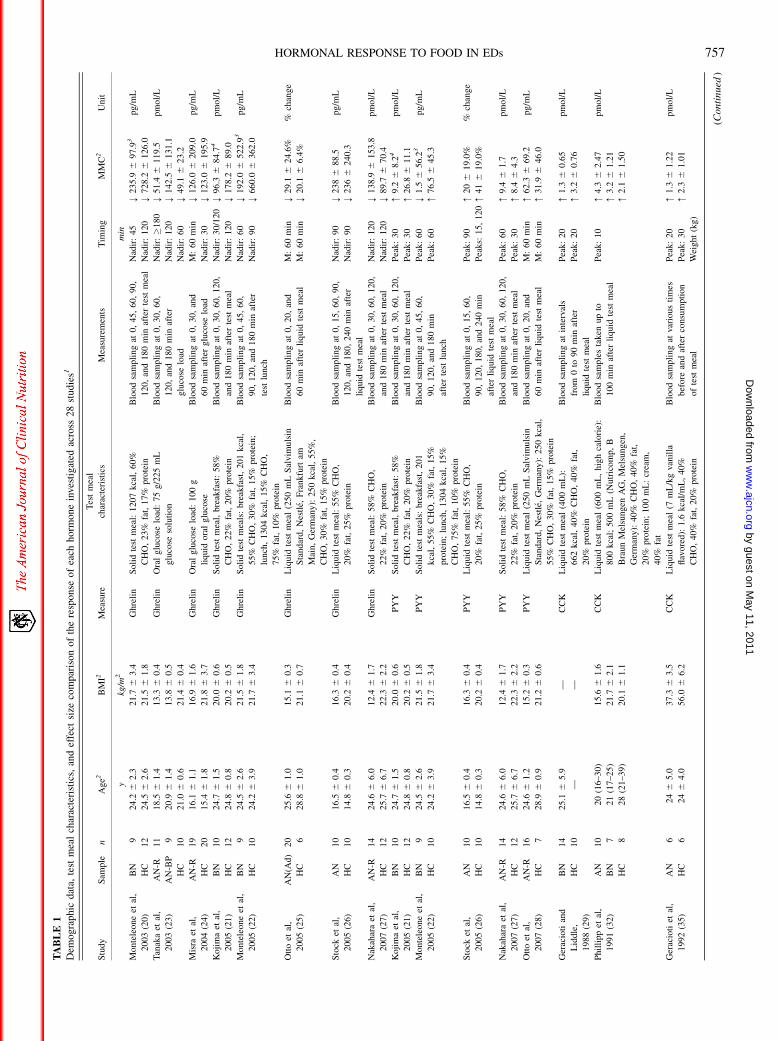
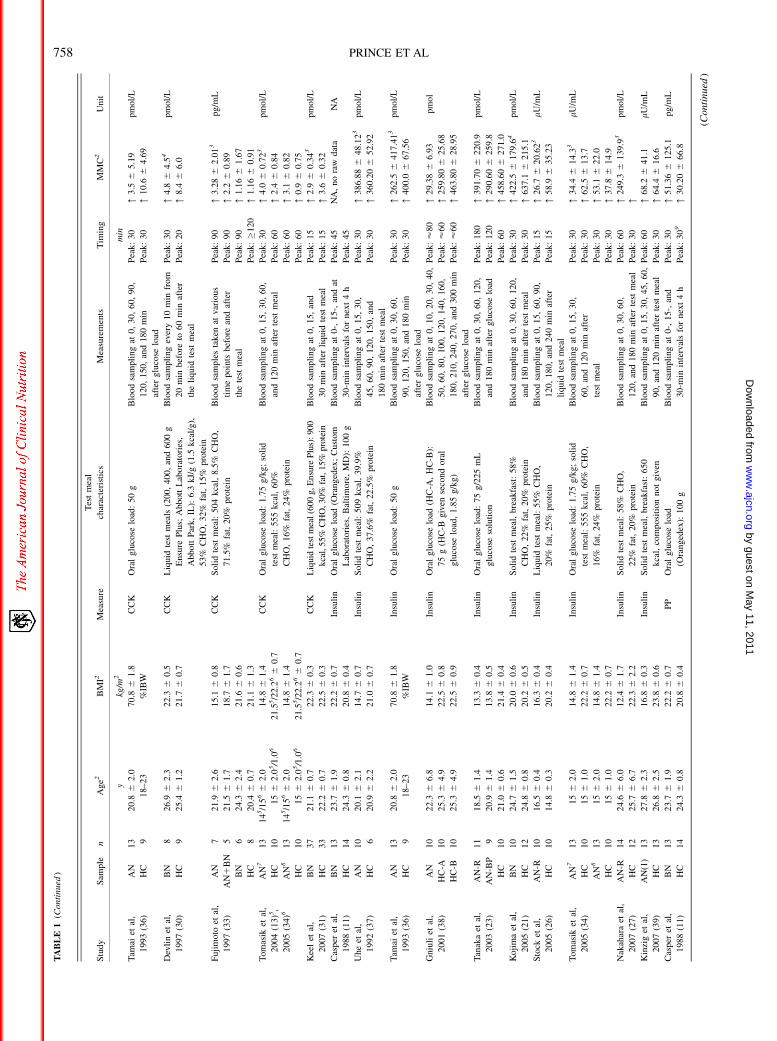
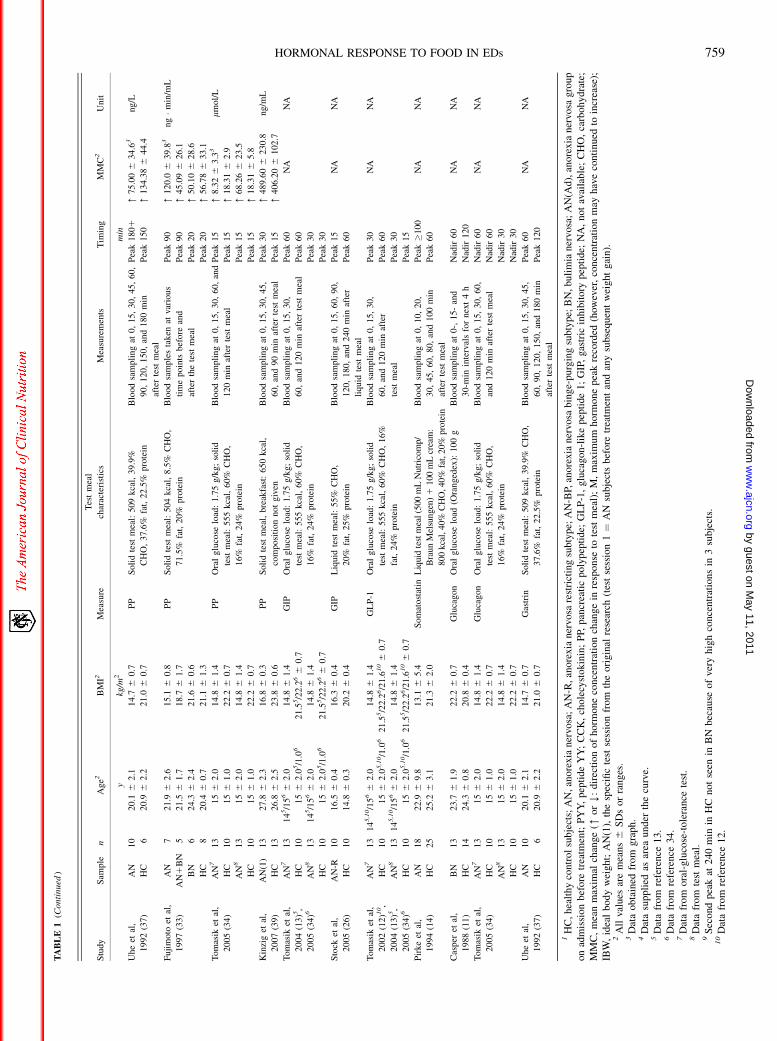
Descriptive statistics (mean, SD, sample size, and subtype ofED sample) for the ED and HC groups were extracted from allarticles. The primary measure for hormone response was themean maximal change (MMC) in plasma hormone concentrationfrom baseline before consumption of the test meal to the max-imum reported postprandial peak or nadir, regardless of when thisoccurred. The MMC was selected as the sole criterion for thepurposes and ease of standardizing the data across studies forstatistical analysis of the findings. The pattern of hormone releasewas also considered of interest, and the timing of the maximumhormone response is shown in Table 1. Some of the originalpublications omitted the raw data; therefore, attempts weremade to contact the corresponding authors for these data. If noresponse was received, the appropriate published graphs wereused, when possible, to extract the data and provide an ap-proximation of the results.
Study characteristics
Most of the studies included in this review adopted an ex-perimental cross-sectional design with measures taken before andafter intervention. The measures are blood plasma concentrationsof the hormones under investigation analyzed using radioim-munoassay commercial kits and the interventions were stan-dardized test meals of known composition and energy content orglucose loads of known glucose concentration. The HC groupswere selected on the basis of at least one or more of the followingcriteria: within 10–15% of ideal body weight or normal bodymass index (BMI); normal eating behavior; no history of EDs,other psychiatric disorders, mental illness, alcohol abuse, ormajor affective disorders or in first-degree relatives; mentally andphysically healthy; no history of metabolic diseases, obesity,hypertension, gastrointestinal disease, or surgery; no use of medi-cations known to affect gastric motility; and regular menstruationor premenarcheal.
Description of the study protocols
Of the studies included in the review, 7 used a solid test mealprotocol, 9 used a liquid test meal protocol, 5 used an oral-glucose-load protocol, and 3 used both a solid test meal anda glucose-load protocol. Details of the study samples, test meal,and oral-glucose-load characteristics, timing of the blood sam-pling for each study, and timing of the hormonal peak or nadir areshown in Table 1.
756 PRINCE ET AL
by guest on May 11, 2011
ww
w.ajcn.org
Dow
nloaded from
TA
BL
E1
Dem
ogra
ph
icd
ata,
test
mea
lch
arac
teri
stic
s,an
def
fect
size
com
par
iso
no
fth
ere
spo
nse
of
each
ho
rmo
ne
inve
stig
ated
acro
ss2
8st
ud
ies1
Stu
dy
Sam
ple
nA
ge2
BM
I2M
easu
re
Tes
tm
eal
char
acte
rist
ics
Mea
sure
men
tsT
imin
gM
MC
2U
nit
ykg
/m2
min
Monte
leone
etal
,
2003
(20)
BN
924
.26
2.3
21.7
63.4
Ghre
lin
Soli
dte
stm
eal:
1207
kca
l,60%
CH
O,
23%
fat,
17%
pro
tein
Blo
od
sam
pli
ng
at0,
45,
60,
90,
120,
and
180
min
afte
rte
stm
eal
Nad
ir:
45
Y235.9
697.9
3p
g/m
L
HC
12
24.5
62.6
21.5
61.8
Nad
ir:
120
Y728.2
61
26
.0
Tan
aka
etal
,
2003
(23)
AN
-R11
18
.56
1.4
13.3
60.4
Ghre
lin
Ora
lglu
cose
load
:75
g/2
25
mL
glu
cose
solu
tion
Blo
od
sam
pli
ng
at0,
30,
60,
12
0,
and
18
0m
inaf
ter
glu
cose
load
Nad
ir:�
18
0Y
51.4
6119.5
pm
ol/
L
AN
-BP
920
.96
1.4
13.8
60.5
Nad
ir:
120
Y142.5
61
31
.1
HC
10
21.0
60.6
21.4
60.4
Nad
ir:
60
Y49.1
623.2
Mis
raet
al,
2004
(24)
AN
-R19
16
.16
1.1
16.9
61.6
Ghre
lin
Ora
lglu
cose
load
:100
g
liquid
ora
lglu
cose
Blo
od
sam
pli
ng
at0,
30,
and
60
min
afte
rglu
cose
load
M:
60
min
Y126.0
6209.0
pg/m
L
HC
20
15.4
61.8
21.8
63.7
Nad
ir:
30
Y123.0
61
95
.9
Ko
jim
aet
al,
2005
(21)
BN
10
24.7
61.5
20.0
60.6
Ghre
lin
Soli
dte
stm
eal,
bre
akfa
st:
58%
CH
O,
22%
fat,
20%
pro
tein
Blo
od
sam
pli
ng
at0,
30
,6
0,
12
0,
and
180
min
afte
rte
stm
eal
Nad
ir:
30/1
20
Y96.3
684.7
4pm
ol/
L
HC
12
24.8
60.8
20.2
60.5
Nad
ir:
120
Y178.2
689.0
Monte
leone
etal
,
2005
(22)
BN
924
.56
2.6
21.5
61.8
Ghre
lin
Soli
dte
stm
eals
:bre
akfa
st,
201
kca
l,
55%
CH
O,
30%
fat,
15%
pro
tein
;
lunch
,1304
kca
l,15%
CH
O,
75%
fat,
10%
pro
tein
Blo
od
sam
pli
ng
at0,
45,
60,
90,
120,
and
180
min
afte
r
test
lunch
Nad
ir:
60
Y192.0
65
22
.93
pg
/mL
HC
10
24.2
63.9
21.7
63.4
Nad
ir:
90
Y660.0
63
62
.0
Ott
oet
al,
2005
(25)
AN
(Ad
)2
02
5.6
61.0
15.1
60.3
Ghre
lin
Liq
uid
test
mea
l(2
50
mL
Sal
vim
uls
in
Sta
ndar
d,
Nes
tle,
Fra
nkfu
rtam
Mai
n,
Ger
man
y):
250
kca
l,55%
,
CH
O,
30%
fat,
15%
pro
tein
Blo
od
sam
pli
ng
at0,
20,
and
60
min
afte
rli
quid
test
mea
l
M:
60
min
Y29.1
624.6
%%
chan
ge
HC
628
.86
1.0
21.1
60.7
M:
60
min
Y20.1
66.4
%
Sto
cket
al,
2005
(26)
AN
10
16.5
60.4
16.3
60.4
Ghre
lin
Liq
uid
test
mea
l:55%
CH
O,
20%
fat,
25%
pro
tein
Blo
od
sam
pli
ng
at0,
15,
60,
90,
12
0,
and
18
0,
24
0m
inaf
ter
liquid
test
mea
l
Nad
ir:
90
Y2
38
688.5
pg/m
L
HC
10
14.8
60.3
20.2
60.4
Nad
ir:
90
Y2
36
62
40
.3
Nak
ahar
aet
al,
2007
(27)
AN
-R14
24
.66
6.0
12.4
61.7
Ghre
lin
Soli
dte
stm
eal:
58%
CH
O,
22%
fat,
20%
pro
tein
Blo
od
sam
pli
ng
at0,
30
,6
0,
12
0,
and
180
min
afte
rte
stm
eal
Nad
ir:
120
Y138.9
6153.8
pm
ol/
L
HC
12
25.7
66.7
22.3
62.2
Nad
ir:
120
Y89.7
670.4
Ko
jim
aet
al,
2005
(21)
BN
10
24.7
61.5
20.0
60.6
PY
YS
oli
dte
stm
eal,
bre
akfa
st:
58%
CH
O,
22%
fat,
20%
pro
tein
Blo
od
sam
pli
ng
at0,
30
,6
0,
12
0,
and
180
min
afte
rte
stm
eal
Pea
k:
30
[9
.26
8.2
4pm
ol/
L
HC
12
24.8
60.8
20.2
60.5
Pea
k:
30
[26.8
611.1
Monte
leone
etal
,
2005
(22)
BN
924
.56
2.6
21.5
61.8
PY
YS
oli
dte
stm
eals
:bre
akfa
st,
201
kca
l,55%
CH
O,
30%
fat,
15%
pro
tein
;lu
nch
,1304
kca
l,15%
CH
O,
75%
fat,
10%
pro
tein
Blo
od
sam
pli
ng
at0,
45,
60,
90
,1
20
,an
d1
80
min
afte
rte
stlu
nch
Pea
k:
60
Y1
.56
56.2
3p
g/m
L
HC
10
24.2
63.9
21.7
63.4
Pea
k:
60
[76.5
645.3
Sto
cket
al,
2005
(26)
AN
10
16.5
60.4
16.3
60.4
PY
YL
iquid
test
mea
l:55%
CH
O,
20%
fat,
25%
pro
tein
Blo
od
sam
pli
ng
at0,
15,
60,
90,
120,
180,
and
240
min
afte
rli
quid
test
mea
l
Pea
k:
90
Pea
ks:
15
,12
0
[2
06
19.0
%%
chan
ge
HC
10
14.8
60.3
20.2
60.4
[4
16
19.0
%
Nak
ahar
aet
al,
2007
(27)
AN
-R14
24
.66
6.0
12.4
61.7
PY
YS
oli
dte
stm
eal:
58%
CH
O,
22%
fat,
20%
pro
tein
Blo
od
sam
pli
ng
at0,
30
,6
0,
12
0,
and
180
min
afte
rte
stm
eal
Pea
k:
60
[9
.46
1.7
pm
ol/
L
HC
12
25.7
66.7
22.3
62.2
Pea
k:
30
[8
.46
4.3
Ott
oet
al,
2007
(28)
AN
-R16
24
.66
1.2
15.2
60.3
PY
YL
iquid
test
mea
l(2
50
mL
Sal
vim
uls
in
Sta
ndar
d,
Nes
tle,
Ger
man
y):
250
kca
l,
55%
CH
O,
30%
fat,
15%
pro
tein
Blo
od
sam
pli
ng
at0,
20,
and
60
min
afte
rli
quid
test
mea
l
M:
60
min
[62.3
669.2
pg/m
L
HC
728
.96
0.9
21.2
60.6
M:
60
min
[31.9
646.0
Ger
acio
tian
d
Lid
dle
,
1988
(29)
BN
14
25.1
65.9
—C
CK
Liq
uid
test
mea
l(4
00
mL
):
662
kca
l,40%
CH
O,
40%
fat,
20%
pro
tein
Blo
od
sam
pli
ng
atin
terv
als
from
0to
90
min
afte
r
liquid
test
mea
l
Pea
k:
20
[1
.36
0.6
5pm
ol/
L
HC
10
——
Pea
k:
20
[3
.26
0.7
6
Phil
lipp
etal
,
1991
(32)
AN
10
20
(16–30)
15.6
61.6
CC
KL
iquid
test
mea
l(6
00
mL
,hig
hca
lori
e):
800
kca
l;500
mL
(Nutr
icom
p,
B
Bra
un
Mel
sungen
AG
,M
elsu
ngen
,
Ger
man
y):
40%
CH
O,
40%
fat,
20%
pro
tein
;100
mL
:cr
eam
,
40%
fat
Blo
od
sam
ple
sta
ken
up
to
100
min
afte
rli
quid
test
mea
l
Pea
k:
10
[4
.36
2.4
7pm
ol/
L
BN
721
(17–25)
21.7
62.1
[3
.26
1.2
1
HC
828
(21–39)
20.1
61.1
[2
.16
1.5
0
Ger
acio
tiet
al,
1992
(35)
AN
624
65.0
37.3
63.5
CC
KL
iquid
test
mea
l(7
mL
/kg
vanil
la
flav
ore
d):
1.6
kca
l/m
L,
40%
CH
O,
40%
fat,
20%
pro
tein
Blo
od
sam
pli
ng
atva
rious
tim
es
bef
ore
and
afte
rco
nsu
mpti
on
of
test
mea
l
Pea
k:
20
[1
.36
1.2
2pm
ol/
L
HC
624
64.0
56.0
66.2
Pea
k:
30
[2
.36
1.0
1
Wei
ght
(kg)
(Con
tin
ued
)
HORMONAL RESPONSE TO FOOD IN EDs 757
by guest on May 11, 2011
ww
w.ajcn.org
Dow
nloaded from
TA
BL
E1
(Conti
nued
)
Stu
dy
Sam
ple
nA
ge2
BM
I2M
easu
re
Tes
tm
eal
char
acte
rist
ics
Mea
sure
men
tsT
imin
gM
MC
2U
nit
ykg
/m2
min
Tam
aiet
al,
1993
(36)
AN
13
20.8
62.0
70.8
61.8
CC
KO
ral
glu
cose
load
:50
gB
lood
sam
pli
ng
at0,
30,
60,
90,
120,
150,
and
180
min
afte
rglu
cose
load
Pea
k:
30
[3
.56
5.1
9pm
ol/
L
HC
918
–2
3%
IBW
Pea
k:
30
[10.6
64.6
9
Dev
lin
etal
,
1997
(30)
BN
82
6.9
62.3
22.3
60.5
CC
KL
iquid
test
mea
ls(2
00,
400,
and
600
g
Ensu
reP
lus;
Abbott
Lab
ora
tori
es,
Abbott
Par
k,
IL):
6.3
kJ/
g(1
.5kca
l/g),
53%
CH
O,
32%
fat,
15%
pro
tein
Blo
od
sam
pli
ng
ever
y10
min
from
20
min
bef
ore
to60
min
afte
r
the
liquid
test
mea
l
Pea
k:
30
[4
.86
4.5
4pm
ol/
L
HC
92
5.4
61.2
21.7
60.7
Pea
k:
20
[8
.46
6.0
Fuji
moto
etal
,
1997
(33)
AN
72
1.9
62.6
15.1
60.8
CC
KS
oli
dte
stm
eal:
504
kca
l,8.5
%C
HO
,
71.5
%fa
t,20%
pro
tein
Blo
od
sam
ple
sta
ken
atva
rious
tim
ep
oin
tsbef
ore
and
afte
r
the
test
mea
l
Pea
k:
90
[3
.28
62.0
13
pg
/mL
AN
1B
N5
21.5
61.7
18.7
61.7
Pea
k:
90
[2
.26
0.8
9
BN
62
4.3
62.4
21.6
60.6
Pea
k:
90
[1
.16
61.6
7
HC
82
0.4
60.7
21.1
61.3
Pea
k:�
12
0[
1.1
66
0.9
1
Tom
asik
etal
,
2004
(13)5
,
2005
(34)6
AN
713
14
5/1
56
62.0
14.8
61.4
CC
KO
ral
glu
cose
load
:1.7
5g/k
g;
soli
d
test
mea
l:555
kca
l,60%
CH
O,
16%
fat,
24%
pro
tein
Blo
od
sam
pli
ng
at0,
15,
30,
60,
and
120
min
afte
rte
stm
eal
Pea
k:
30
[4
.06
0.7
23
pm
ol/
L
HC
10
15
62.0
5/1
.06
21.5
5/2
2.2
66
0.7
Pea
k:
60
[2
.46
0.8
4
AN
813
14
5/1
56
62.0
14.8
61.4
Pea
k:
60
[3
.16
0.8
2
HC
10
15
62.0
5/1
.06
21.5
5/2
2.2
66
0.7
Pea
k:
60
[0
.96
0.7
5
Kee
let
al,
2007
(31)
BN
37
21.1
60.7
22.3
60
.3C
CK
Liq
uid
test
mea
l(6
00g,
Ensu
reP
lus)
:90
0
kca
l,5
5%C
HO
,30%
fat,
15%
prot
ein
Blo
od
sam
pli
ng
at0,
15,
and
30
min
afte
rli
quid
test
mea
l
Pea
k:
15
[2
.96
0.3
43
pm
ol/
L
HC
33
22.2
60.7
22.5
60.3
Pea
k:
15
[3
.66
0.3
2
Cas
per
etal
,
1988
(11)
BN
13
23.7
61.9
22.2
60.7
Insu
lin
Ora
lglu
cose
load
(Ora
nged
ex;
Cust
om
Lab
ora
tori
es,
Bal
tim
ore
,M
D):
100
g
Blo
od
sam
pli
ng
at0-,
15-,
and
at
30-m
inin
terv
als
for
nex
t4
h
Pea
k:
45
NA
,no
raw
dat
aN
A
HC
14
24.3
60.8
20.8
60.4
Pea
k:
45
Uhe
etal
,
1992
(37)
AN
10
20.1
62.1
14.7
60.7
Insu
lin
Soli
dte
stm
eal:
509
kca
l,39.9
%
CH
O,
37.6
%fa
t,22.5
%pro
tein
Blo
od
sam
pli
ng
at0,
15,
30,
45
,6
0,
90
,12
0,
15
0,
and
180
min
afte
rte
stm
eal
Pea
k:
30
[3
86
.88
648.1
23
pm
ol/
L
HC
62
0.9
62.2
21.0
60.7
Pea
k:
30
[3
60
.20
652.9
2
Tam
aiet
al,
1993
(36)
AN
13
20.8
62.0
70.8
61.8
Insu
lin
Ora
lglu
cose
load
:50
gB
lood
sam
pli
ng
at0,
30,
60,
90,
120,
150,
and
180
min
afte
rglu
cose
load
Pea
k:
30
[2
62
.56
41
7.4
13
pm
ol/
L
HC
918
–2
3%
IBW
Pea
k:
30
[4
00
.06
67.5
6
Gniu
liet
al,
2001
(38)
AN
10
22.3
66.8
14.1
61.0
Insu
lin
Ora
lglu
cose
load
(HC
-A,
HC
-B):
75
g(H
C-B
giv
ense
cond
ora
l
glu
cose
load
,1.8
5g/k
g)
Blo
od
sam
pli
ng
at0,
10,
20,
30,
40,
50,
60,
80,
100,
120,
140,
160,
18
0,
21
0,
24
0,
27
0,
and
30
0m
in
afte
rglu
cose
load
Pea
k:
’8
0[
29.3
86
6.9
3p
mo
l
HC
-A10
25.3
64.9
22.5
60.8
Pea
k:
’6
0[
25
9.8
06
25.6
8
HC
-B10
25.3
64.9
22.5
60.9
Pea
k:
’6
0[
46
3.8
06
28.9
5
Tan
aka
etal
,
2003
(23)
AN
-R11
18.5
61.4
13.3
60.4
Insu
lin
Ora
lglu
cose
load
:75
g/2
25
mL
glu
cose
solu
tion
Blo
od
sam
pli
ng
at0,
30,
60,
120,
and
180
min
afte
rglu
cose
load
Pea
k:
18
0[
39
1.7
06
220.9
pm
ol/
L
AN
-BP
92
0.9
61.4
13.8
60.5
Pea
k:
12
0[
29
0.6
06
259.8
HC
10
21.0
60.6
21.4
60.4
Pea
k:
60
[4
58
.60
6271.0
Koji
ma
etal
,
2005
(21)
BN
10
24.7
61.5
20.0
60.6
Insu
lin
Soli
dte
stm
eal,
bre
akfa
st:
58%
CH
O,
22%
fat,
20%
pro
tein
Blo
od
sam
pli
ng
at0,
30,
60,
120,
and
180
min
afte
rte
stm
eal
Pea
k:
30
[4
22
.56
17
9.6
4pm
ol/
L
HC
12
24.8
60.8
20.2
60.5
Pea
k:
30
[6
37
.16
21
5.1
Sto
cket
al,
2005
(26)
AN
-R10
16.5
60.4
16.3
60.4
Insu
lin
Liq
uid
test
mea
l:55%
CH
O,
20%
fat,
25%
pro
tein
Blo
od
sam
pli
ng
at0,
15,
60,
90,
120,
180,
and
240
min
afte
r
liquid
test
mea
l
Pea
k:
15
[26.7
620.6
23
lU
/mL
HC
10
14.8
60.3
20.2
60.4
Pea
k:
15
[58.9
635.2
3
Tom
asik
etal
,
2005
(34)
AN
713
15
62.0
14.8
61.4
Insu
lin
Ora
lglu
cose
load
:1.7
5g/k
g;
soli
d
test
mea
l:555
kca
l,60%
CH
O,
16%
fat,
24%
pro
tein
Blo
od
sam
pli
ng
at0,
15,
30,
60,
and
120
min
afte
r
test
mea
l
Pea
k:
30
[34.4
614.3
3l
U/m
L
HC
10
15
61.0
22.2
60.7
Pea
k:
30
[62.5
613.7
AN
813
15
62.0
14.8
61.4
Pea
k:
30
[53.1
622.0
HC
10
15
61.0
22.2
60.7
Pea
k:
30
[37.8
614.9
Nak
ahar
aet
al,
2007
(27)
AN
-R14
24.6
66.0
12.4
61.7
Insu
lin
Soli
dte
stm
eal:
58%
CH
O,
22%
fat,
20%
pro
tein
Blo
od
sam
pli
ng
at0,
30,
60,
120,
and
180
min
afte
rte
stm
eal
Pea
k:
60
[2
49
.36
13
9.9
3pm
ol/
L
HC
12
25.7
66.7
22.3
62.2
Pea
k:
30
[
Kin
zig
etal
,
2007
(39)
AN
(1)
13
27.8
62.3
16.8
60.3
Insu
lin
Soli
dte
stm
eal,
bre
akfa
st:
650
kca
l,co
mposi
tion
not
giv
en
Blo
od
sam
pli
ng
at0,
15,
30,
45,
60,
90,
and
120
min
afte
rte
stm
eal
Pea
k:
60
[68.2
641.1
lU
/mL
HC
13
26.8
62.5
23.8
60.6
Pea
k:
30
[64.4
616.6
Cas
per
etal
,
1988
(11)
BN
13
23.7
61.9
22.2
60.7
PP
Ora
lglu
cose
load
(Ora
nged
ex):
100
g
Blo
od
sam
pli
ng
at0-,
15-,
and
30-m
inin
terv
als
for
nex
t4
h
Pea
k:
30
[51.3
66
12
5.1
pg
/mL
HC
14
24.3
60.8
20.8
60.4
Pea
k:
30
9[
30.2
06
66.8
(Con
tin
ued
)
758 PRINCE ET AL
by guest on May 11, 2011
ww
w.ajcn.org
Dow
nloaded from
TA
BL
E1
(Conti
nued
)
Stu
dy
Sam
ple
nA
ge2
BM
I2M
easu
re
Tes
tm
eal
char
acte
rist
ics
Mea
sure
men
tsT
imin
gM
MC
2U
nit
ykg
/m2
min
Uhe
etal
,
1992
(37)
AN
10
20.1
62.1
14.7
60.7
PP
Soli
dte
stm
eal:
509
kca
l,39.9
%
CH
O,
37.6
%fa
t,22.5
%pro
tein
Blo
od
sam
pli
ng
at0
,15,
30,
45,
60,
90
,12
0,
15
0,
and
18
0m
in
afte
rte
stm
eal
Pea
k1
801
[7
5.0
06
34.6
3ng/L
HC
620
.96
2.2
21.0
60.7
Pea
k1
50
[134.3
86
44.4
Fuji
moto
etal
,
1997
(33)
AN
721
.96
2.6
15.1
60.8
PP
Soli
dte
stm
eal:
504
kca
l,8.5
%C
HO
,
71.5
%fa
t,20%
pro
tein
Blo
od
sam
ple
sta
ken
atva
rious
tim
ep
oin
tsbef
ore
and
afte
rth
ete
stm
eal
Pea
k9
0[
120.0
639.8
3ng�m
in/m
L
AN
1B
N5
21
.56
1.7
18.7
61.7
Pea
k9
0[
45
.09
626.1
BN
624
.36
2.4
21.6
60.6
Pea
k2
0[
50
.10
628.6
HC
820
.46
0.7
21.1
61.3
Pea
k2
0[
56
.78
633.1
Tom
asik
etal
,
2005
(34)
AN
713
15
62.0
14.8
61.4
PP
Ora
lglu
cose
load
:1.7
5g/k
g;
soli
d
test
mea
l:555
kca
l,60%
CH
O,
16%
fat,
24%
pro
tein
Blo
od
sam
pli
ng
at0
,15,
30,
60,
and
120
min
afte
rte
stm
eal
Pea
k1
5[
8.3
26
3.3
3l
mol/
L
HC
10
15
61.0
22.2
60.7
Pea
k1
5[
18
.31
62
.9
AN
813
15
62.0
14.8
61.4
Pea
k1
5[
68
.26
623.5
HC
10
15
61.0
22.2
60.7
Pea
k1
5[
18
.31
65
.8
Kin
zig
etal
,
2007
(39)
AN
(1)
13
27.8
62.3
16.8
60.3
PP
Soli
dte
stm
eal,
bre
akfa
st:
650
kca
l,
com
posi
tion
not
giv
en
Blo
od
sam
pli
ng
at0
,15,
30,
45,
60,
and
90
min
afte
rte
stm
eal
Pea
k3
0[
489.6
06
230.8
ng/m
L
HC
13
26.8
62.5
23.8
60.6
Pea
k1
5[
406.2
06
102.7
Tom
asik
etal
,
2004
(13)5
,
2005
(34)6
AN
713
14
5/1
56
62.0
14.8
61.4
GIP
Ora
lglu
cose
load
:1.7
5g/k
g;
soli
d
test
mea
l:555
kca
l,60%
CH
O,
16%
fat,
24%
pro
tein
Blo
od
sam
pli
ng
at0
,15,
30,
60,
and
120
min
afte
rte
stm
eal
Pea
k6
0N
AN
A
HC
10
15
62
.05/1
.06
21.5
5/2
2.2
66
0.7
Pea
k6
0
AN
813
14
5/1
56
62.0
14.8
61.4
Pea
k3
0
HC
10
15
62
.05/1
.06
21.5
5/2
2.2
66
0.7
Pea
k3
0
Sto
cket
al,
2005
(26)
AN
-R10
16
.56
0.4
16.3
60.4
GIP
Liq
uid
test
mea
l:55%
CH
O,
20%
fat,
25%
pro
tein
Blo
od
sam
pli
ng
at0
,15,
60,
90,
120,
180,
and
240
min
afte
r
liquid
test
mea
l
Pea
k1
5N
AN
A
HC
10
14.8
60.3
20.2
60.4
Pea
k6
0
Tom
asik
etal
,
2002
(12)1
0,
2004
(13)5
,
2005
(34)6
AN
713
14
5,1
0/1
56
62.0
14.8
61.4
GL
P-1
Ora
lglu
cose
load
:1.7
5g/k
g;
soli
d
test
mea
l:555
kca
l,60%
CH
O,
16%
fat,
24%
pro
tein
Blo
od
sam
pli
ng
at0
,15,
30,
60,
and
120
min
afte
r
test
mea
l
Pea
k3
0N
AN
A
HC
10
15
62
.05,1
0/1
.06
21.5
5/2
2.2
6/2
1.6
10
60.7
Pea
k6
0
AN
813
14
5,1
0/1
56
62.0
14.8
61.4
Pea
k3
0
HC
10
15
62
.05,1
0/1
.06
21.5
5/2
2.2
6/2
1.6
10
60.7
Pea
k1
5
Pir
ke
etal
,
1994
(14)
AN
18
22.9
69.8
13.1
65.4
Som
atost
atin
Liq
uid
test
mea
l(5
00m
LN
utri
com
p/
Bra
unM
elsu
nge
n)1
100
mL
crea
m:
800
kca
l,40%
CH
O,4
0%
fat,
20%
pro
tein
Blo
od
sam
pli
ng
at0
,10,
20,
30
,45
,6
0,
80
,an
d10
0m
in
afte
rte
stm
eal
Pea
k�
10
0N
AN
A
HC
25
25.2
63.1
21.3
62.0
Pea
k6
0
Cas
per
etal
,
1988
(11)
BN
13
23.7
61.9
22.2
60.7
Glu
cagon
Ora
lglu
cose
load
(Ora
nged
ex):
100
gB
lood
sam
pli
ng
at0
-,15-
and
30-m
inin
terv
als
for
nex
t4
h
Nad
ir60
NA
NA
HC
14
24.3
60.8
20.8
60.4
Nad
ir120
Tom
asik
etal
,
2005
(34)
AN
713
15
62.0
14.8
61.4
Glu
cagon
Ora
lglu
cose
load
:1.7
5g/k
g;
soli
d
test
mea
l:555
kca
l,60%
CH
O,
16%
fat,
24%
pro
tein
Blo
od
sam
pli
ng
at0
,15,
30,
60,
and
120
min
afte
rte
stm
eal
Nad
ir60
NA
NA
HC
10
15
61.0
22.2
60.7
Nad
ir60
AN
813
15
62.0
14.8
61.4
Nad
ir30
HC
10
15
61.0
22.2
60.7
Nad
ir30
Uhe
etal
,
1992
(37)
AN
10
20.1
62.1
14.7
60.7
Gas
trin
Soli
dte
stm
eal:
509
kca
l,39.9
%C
HO
,
37.6
%fa
t,22.5
%pro
tein
Blo
od
sam
pli
ng
at0
,15,
30,
45,
60
,90
,1
20
,15
0,
and
18
0m
in
afte
rte
stm
eal
Pea
k6
0N
AN
A
HC
620
.96
2.2
21.0
60.7
Pea
k1
20
1H
C,
hea
lth
yco
ntr
ol
sub
ject
s;A
N,
ano
rex
ian
ervo
sa;
AN
-R,
ano
rex
ian
ervo
sare
stri
ctin
gsu
bty
pe;
AN
-BP,
ano
rex
ian
ervo
sab
ing
e-p
urg
ing
sub
typ
e;B
N,
buli
mia
ner
vosa
;A
N(A
d),
ano
rex
ian
ervo
sag
rou
po
nad
mis
sio
nb
efo
retr
eatm
ent;
PY
Y,
pep
tid
eY
Y;
CC
K,
cho
lecy
sto
kin
in;
PP,
pan
crea
tic
po
lyp
epti
de;
GL
P-1
,g
luca
go
n-l
ike
pep
tid
e1
;G
IP,
gas
tric
inh
ibit
ory
pep
tid
e;N
A,
no
tav
aila
ble
;C
HO
,ca
rbo
hy
drat
e;M
MC
,m
ean
max
imal
chan
ge
([o
rY
:d
irec
tio
no
fh
orm
on
eco
nce
ntr
atio
nch
ang
ein
resp
on
seto
test
mea
l);
M,
max
imu
mh
orm
on
ep
eak
reco
rded
(how
ever
,co
nce
ntr
atio
nm
ayh
ave
con
tin
ued
toin
crea
se);
IBW
,id
eal
bo
dy
wei
gh
t;A
N(1
),th
esp
ecifi
cte
stse
ssio
nfr
om
the
ori
gin
alre
sear
ch(t
est
sess
ion
1¼
AN
sub
ject
sb
efo
retr
eatm
ent
and
any
sub
sequ
ent
wei
ght
gai
n).
2A
llva
lues
are
mea
ns
6S
Ds
or
ran
ges
.3
Dat
ao
bta
ined
fro
mg
rap
h.
4D
ata
sup
pli
edas
area
un
der
the
curv
e.5
Dat
afr
om
refe
ren
ce1
3.
6D
ata
fro
mre
fere
nce
34
.7
Dat
afr
om
ora
l-g
luco
se-t
ole
ran
cete
st.
8D
ata
fro
mte
stm
eal.
9S
eco
ndp
eak
at2
40
min
inH
Cn
ot
seen
inB
Nb
ecau
seo
fve
ryh
igh
con
cen
trat
ion
sin
3su
bje
cts.
10
Dat
afr
om
refe
ren
ce1
2.
HORMONAL RESPONSE TO FOOD IN EDs 759
by guest on May 11, 2011
ww
w.ajcn.org
Dow
nloaded from
Quantitative data synthesis
Outcomes clustered by hormone response were summarizedby a meta-analysis if the number of studies available was �5.This applied to studies investigating ghrelin, PYY, CCK, insulin,and PP response. Analyses were carried out by using STATA 10.0(StataCorp, College Station, TX) using the user-contributedcommand for meta-analyses METAN (15). Forest plots are usedto show the meta-analyses with all the independent data avail-able for each measure.
The MMC in hormone concentration for each participant groupin each study was calculated by subtracting the basal or preprandialconcentration from the maximum postprandial concentration. Themean difference in response between the ED and HC groups wasstandardized by calculating Cohen’s d, which is the differencebetween the 2 raw means divided by the pooled SD (16). Cohen’sd is understood as negligible (�0 and ,0.15), small (�0.15 and,0.40), medium (�0.40 and ,0.75), large (�0.75 and ,1.10),very large (�1.10 and ,1.45), and huge (�1.45).
The standardized effect sizes were subsequently analyzed byusing METAN. The SE of each study’s standardized effect sizewas calculated from the estimated effect and the group sizes of the2 groups (ie, AN or BN group compared with HC group) by usingthe method of Cooper and Hedges (17), which is implemented inMETAN. These were then pooled by using a random-effectsmodel that allowed for between-study variation of effect sizes(18). Homogeneity between the studies was analyzed by usingCochran’s Q test. Because of the relatively small sample sizes, anadditional measure of heterogeneity or inconsistency, I2 [(Q – df)/Q], was calculated (19). I2 ranges between 0% (low heterogeneity)and 100% (high heterogeneity).
Seventeen meta-analyses were conducted for ghrelin, PYY,CCK, insulin, and PP, including basal concentrations and com-parisons of the response to test meals between the ED and HCgroups and, where possible, between the AN or BN group andthe HC group separately. Insufficient studies were available toconduct a meta-analysis comparing PYY between the AN andHC groups or to conduct meta-analyses comparing all variablesexcept CCK, for which there were sufficient studies, between theBN and HC groups.
RESULTS
Descriptive data for each study are shown in Table 1, includingsample type, sample size, age, BMI, and test meal or glucoseload characteristics. Quantitative data for the studies includedin the meta-analyses are in the form of MMC in hormoneconcentrations from baseline preprandial concentrations to themaximum postprandial peak or nadir. These data were used tocalculate the standardized effect sizes and CIs. Across the 28included studies, the mean BMI of the AN group was signifi-cantly lower than that of the HC groups. In the BN groups, themean BMI was not significantly different from that of the HCgroups.
Ghrelin
Eight studies investigated the ghrelin response; 3 included BNand HC groups (20–22) and 5 included AN and HC groups (23–27), of which 4 identified AN subtypes, either restrictive type(AN-R), binge-purging type (AN-BP), or both (23, 24, 26, 27).
All subjects were female, with an age range of 14 to 28 y. AllED patients were diagnosed according to the Diagnostic Sta-tistical Manual IV (DSM-IV) criteria. Sample sizes varied be-tween 9 and 20 subjects in the ED groups, with a mean of 12subjects. Of these studies, 3 reported using total acetylated orbioactive ghrelin and non- or de-acetylated ghrelin in the bio-chemical assays (23, 26, 27), 1 reported using I-labeled totalplasma ghrelin only (25), and 4 did not identify ghrelin type(20–22, 24).
All 8 studies were included in the meta-analysis. One study didnot contain raw data for the baseline hormone concentrations andthus could only be included in the meta-analysis of the MMC inhormone concentration (25), and one study included data for bothAN-R and AN-BP subjects (23). These data were subsequentlytreated as 2 separate studies for the purposes of the analysis.
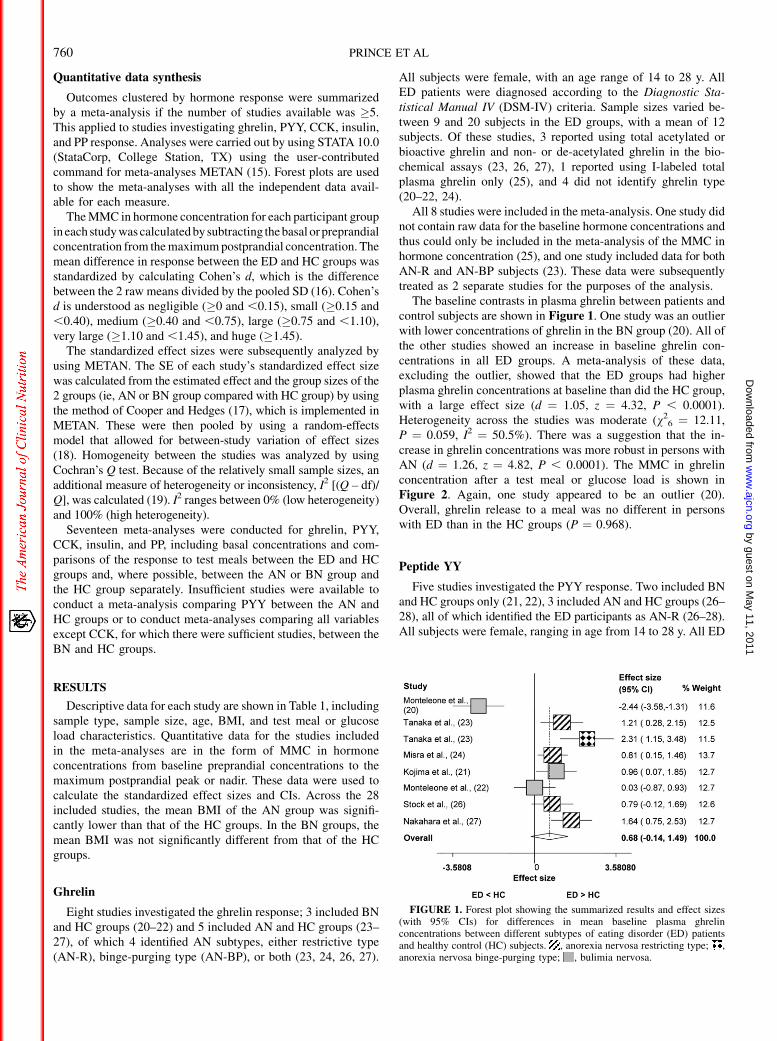
The baseline contrasts in plasma ghrelin between patients andcontrol subjects are shown in Figure 1. One study was an outlierwith lower concentrations of ghrelin in the BN group (20). All ofthe other studies showed an increase in baseline ghrelin con-centrations in all ED groups. A meta-analysis of these data,excluding the outlier, showed that the ED groups had higherplasma ghrelin concentrations at baseline than did the HC group,with a large effect size (d ¼ 1.05, z ¼ 4.32, P , 0.0001).Heterogeneity across the studies was moderate (v2
6 ¼ 12.11,P ¼ 0.059, I2 ¼ 50.5%). There was a suggestion that the in-crease in ghrelin concentrations was more robust in persons withAN (d ¼ 1.26, z ¼ 4.82, P , 0.0001). The MMC in ghrelinconcentration after a test meal or glucose load is shown inFigure 2. Again, one study appeared to be an outlier (20).Overall, ghrelin release to a meal was no different in personswith ED than in the HC groups (P ¼ 0.968).
Peptide YY
Five studies investigated the PYY response. Two included BNand HC groups only (21, 22), 3 included AN and HC groups (26–28), all of which identified the ED participants as AN-R (26–28).All subjects were female, ranging in age from 14 to 28 y. All ED
FIGURE 1. Forest plot showing the summarized results and effect sizes(with 95% CIs) for differences in mean baseline plasma ghrelinconcentrations between different subtypes of eating disorder (ED) patientsand healthy control (HC) subjects. , anorexia nervosa restricting type; ,anorexia nervosa binge-purging type; , bulimia nervosa.
760 PRINCE ET AL
by guest on May 11, 2011
ww
w.ajcn.org
Dow
nloaded from
patients were diagnosed according to the DSM-IV criteria.Sample sizes varied between 9 and 16 subjects in the ED groups,with a mean of 12 subjects.
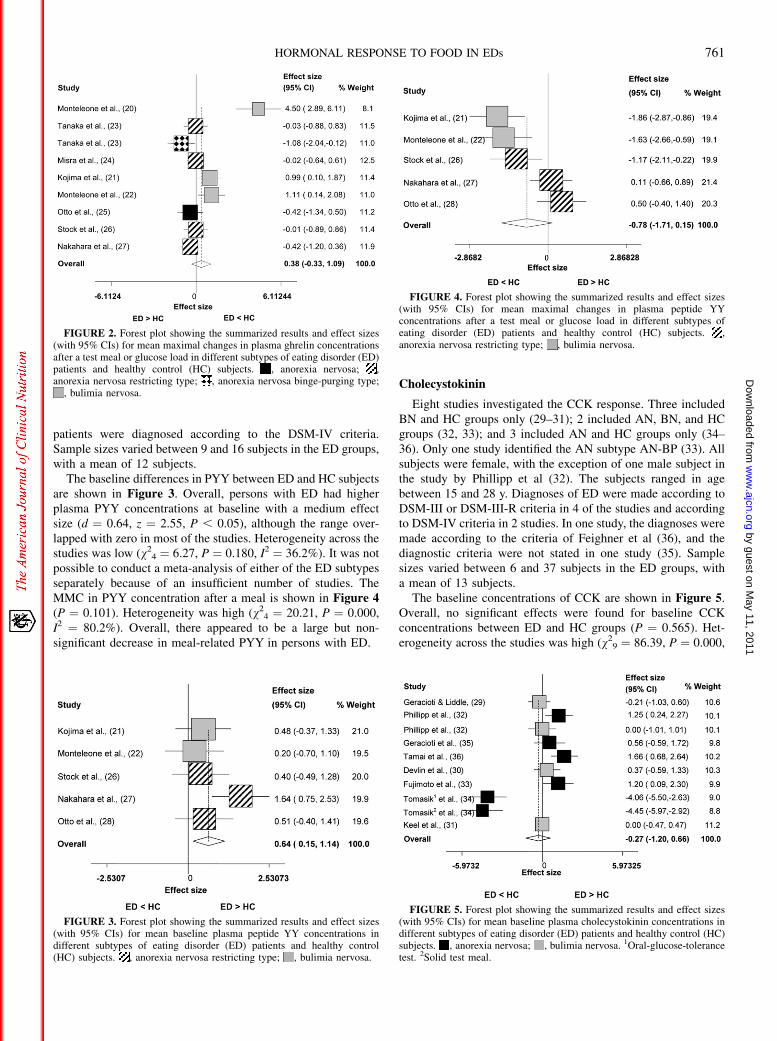
The baseline differences in PYY between ED and HC subjectsare shown in Figure 3. Overall, persons with ED had higherplasma PYY concentrations at baseline with a medium effectsize (d ¼ 0.64, z ¼ 2.55, P , 0.05), although the range over-lapped with zero in most of the studies. Heterogeneity across thestudies was low (v2
4 ¼ 6.27, P ¼ 0.180, I2 ¼ 36.2%). It was notpossible to conduct a meta-analysis of either of the ED subtypesseparately because of an insufficient number of studies. TheMMC in PYY concentration after a meal is shown in Figure 4(P ¼ 0.101). Heterogeneity was high (v2
4 ¼ 20.21, P ¼ 0.000,I2 ¼ 80.2%). Overall, there appeared to be a large but non-significant decrease in meal-related PYY in persons with ED.
Cholecystokinin
Eight studies investigated the CCK response. Three includedBN and HC groups only (29–31); 2 included AN, BN, and HCgroups (32, 33); and 3 included AN and HC groups only (34–36). Only one study identified the AN subtype AN-BP (33). Allsubjects were female, with the exception of one male subject inthe study by Phillipp et al (32). The subjects ranged in agebetween 15 and 28 y. Diagnoses of ED were made according toDSM-III or DSM-III-R criteria in 4 of the studies and accordingto DSM-IV criteria in 2 studies. In one study, the diagnoses weremade according to the criteria of Feighner et al (36), and thediagnostic criteria were not stated in one study (35). Samplesizes varied between 6 and 37 subjects in the ED groups, witha mean of 13 subjects.
The baseline concentrations of CCK are shown in Figure 5.Overall, no significant effects were found for baseline CCKconcentrations between ED and HC groups (P ¼ 0.565). Het-erogeneity across the studies was high (v2
9 ¼ 86.39, P ¼ 0.000,
FIGURE 2. Forest plot showing the summarized results and effect sizes(with 95% CIs) for mean maximal changes in plasma ghrelin concentrationsafter a test meal or glucose load in different subtypes of eating disorder (ED)patients and healthy control (HC) subjects. , anorexia nervosa; ,anorexia nervosa restricting type; , anorexia nervosa binge-purging type;
, bulimia nervosa.
FIGURE 3. Forest plot showing the summarized results and effect sizes(with 95% CIs) for mean baseline plasma peptide YY concentrations indifferent subtypes of eating disorder (ED) patients and healthy control(HC) subjects. , anorexia nervosa restricting type; , bulimia nervosa.
FIGURE 4. Forest plot showing the summarized results and effect sizes(with 95% CIs) for mean maximal changes in plasma peptide YYconcentrations after a test meal or glucose load in different subtypes ofeating disorder (ED) patients and healthy control (HC) subjects. ,anorexia nervosa restricting type; , bulimia nervosa.
FIGURE 5. Forest plot showing the summarized results and effect sizes(with 95% CIs) for mean baseline plasma cholecystokinin concentrations indifferent subtypes of eating disorder (ED) patients and healthy control (HC)subjects. , anorexia nervosa; , bulimia nervosa. 1Oral-glucose-tolerancetest. 2Solid test meal.
HORMONAL RESPONSE TO FOOD IN EDs 761
by guest on May 11, 2011
ww
w.ajcn.org
Dow
nloaded from
I2 ¼ 89.6%), with the study of Tomasik appearing to be anoutlier (34). This study was scrutinized to find a reason forthe atypical result, but no unusual factors could be identified.Nevertheless, on removal of this study, the meta-analysis sug-gested that baseline CCK concentrations were increased in theED group with a moderate effect size (d ¼ 0.54, z ¼ 2.16, P ,
0.04). Heterogeneity was also reduced (v27 ¼ 16.65, P ¼ 0.020,
I2 ¼ 58.0%). The increase in baseline CCK was stronger instudies of persons with AN (d ¼ 1.21, z ¼ 4.50, P , 0.0001).
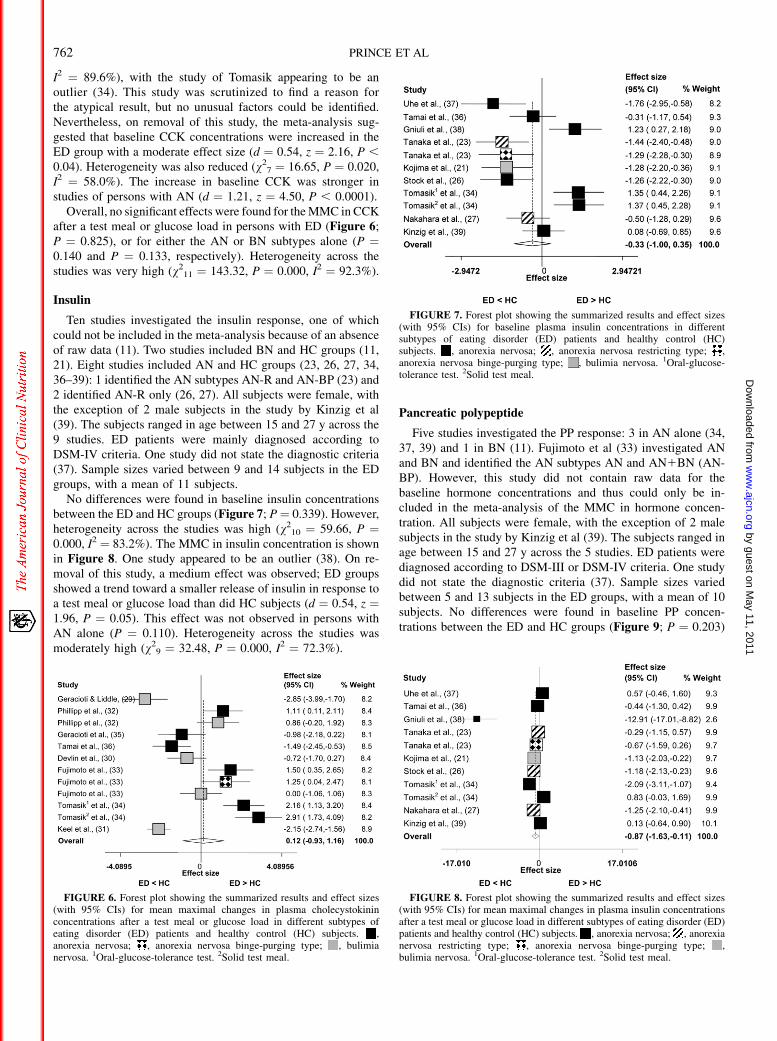
Overall, no significant effects were found for the MMC in CCKafter a test meal or glucose load in persons with ED (Figure 6;P ¼ 0.825), or for either the AN or BN subtypes alone (P ¼0.140 and P ¼ 0.133, respectively). Heterogeneity across thestudies was very high (v2
11 ¼ 143.32, P ¼ 0.000, I2 ¼ 92.3%).
Insulin
Ten studies investigated the insulin response, one of whichcould not be included in the meta-analysis because of an absenceof raw data (11). Two studies included BN and HC groups (11,21). Eight studies included AN and HC groups (23, 26, 27, 34,36–39): 1 identified the AN subtypes AN-R and AN-BP (23) and2 identified AN-R only (26, 27). All subjects were female, withthe exception of 2 male subjects in the study by Kinzig et al(39). The subjects ranged in age between 15 and 27 y across the9 studies. ED patients were mainly diagnosed according toDSM-IV criteria. One study did not state the diagnostic criteria(37). Sample sizes varied between 9 and 14 subjects in the EDgroups, with a mean of 11 subjects.
No differences were found in baseline insulin concentrationsbetween the ED and HC groups (Figure 7; P¼ 0.339). However,heterogeneity across the studies was high (v2
10 ¼ 59.66, P ¼0.000, I2 ¼ 83.2%). The MMC in insulin concentration is shownin Figure 8. One study appeared to be an outlier (38). On re-moval of this study, a medium effect was observed; ED groupsshowed a trend toward a smaller release of insulin in response toa test meal or glucose load than did HC subjects (d ¼ 0.54, z ¼1.96, P ¼ 0.05). This effect was not observed in persons withAN alone (P ¼ 0.110). Heterogeneity across the studies wasmoderately high (v2
9 ¼ 32.48, P ¼ 0.000, I2 ¼ 72.3%).
Pancreatic polypeptide
Five studies investigated the PP response: 3 in AN alone (34,37, 39) and 1 in BN (11). Fujimoto et al (33) investigated ANand BN and identified the AN subtypes AN and AN1BN (AN-BP). However, this study did not contain raw data for thebaseline hormone concentrations and thus could only be in-cluded in the meta-analysis of the MMC in hormone concen-tration. All subjects were female, with the exception of 2 malesubjects in the study by Kinzig et al (39). The subjects ranged inage between 15 and 27 y across the 5 studies. ED patients werediagnosed according to DSM-III or DSM-IV criteria. One studydid not state the diagnostic criteria (37). Sample sizes variedbetween 5 and 13 subjects in the ED groups, with a mean of 10subjects. No differences were found in baseline PP concen-trations between the ED and HC groups (Figure 9; P ¼ 0.203)
FIGURE 6. Forest plot showing the summarized results and effect sizes(with 95% CIs) for mean maximal changes in plasma cholecystokininconcentrations after a test meal or glucose load in different subtypes ofeating disorder (ED) patients and healthy control (HC) subjects. ,anorexia nervosa; , anorexia nervosa binge-purging type; , bulimianervosa. 1Oral-glucose-tolerance test. 2Solid test meal.
FIGURE 7. Forest plot showing the summarized results and effect sizes(with 95% CIs) for baseline plasma insulin concentrations in differentsubtypes of eating disorder (ED) patients and healthy control (HC)subjects. , anorexia nervosa; , anorexia nervosa restricting type; ,anorexia nervosa binge-purging type; , bulimia nervosa. 1Oral-glucose-tolerance test. 2Solid test meal.
FIGURE 8. Forest plot showing the summarized results and effect sizes(with 95% CIs) for mean maximal changes in plasma insulin concentrationsafter a test meal or glucose load in different subtypes of eating disorder (ED)patients and healthy control (HC) subjects. , anorexia nervosa; , anorexianervosa restricting type; , anorexia nervosa binge-purging type; ,bulimia nervosa. 1Oral-glucose-tolerance test. 2Solid test meal.
762 PRINCE ET AL
by guest on May 11, 2011
ww
w.ajcn.org
Dow
nloaded from
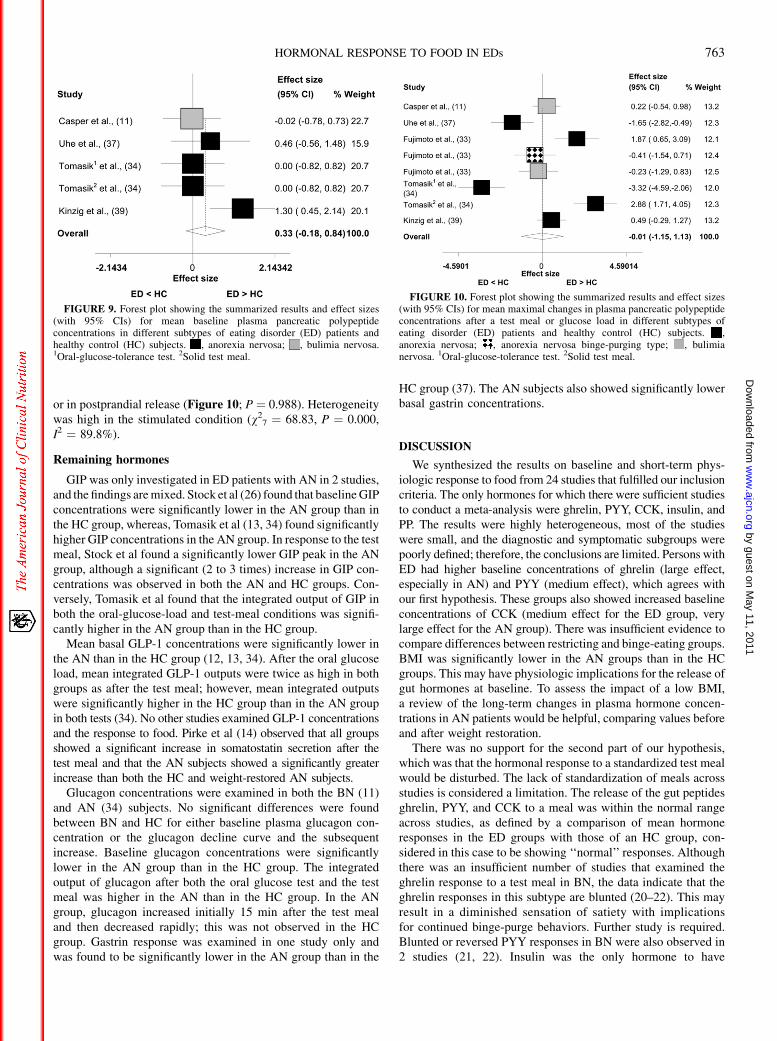
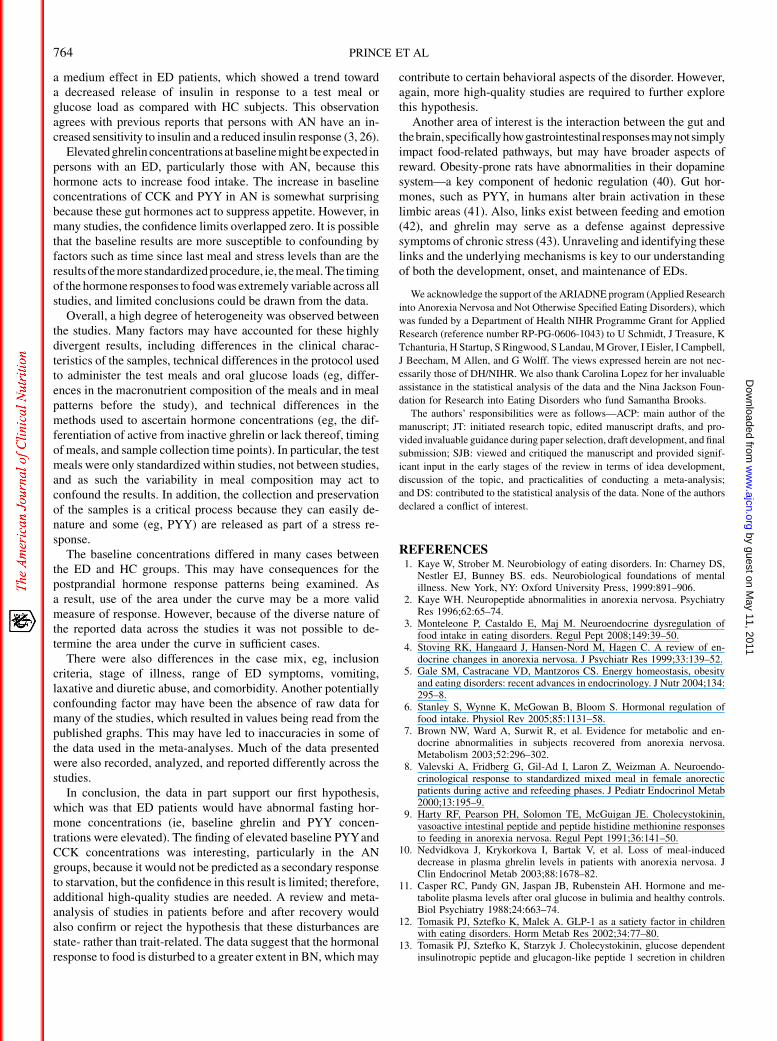
or in postprandial release (Figure 10; P ¼ 0.988). Heterogeneitywas high in the stimulated condition (v2
7 ¼ 68.83, P ¼ 0.000,I2 ¼ 89.8%).
Remaining hormones
GIP was only investigated in ED patients with AN in 2 studies,and the findings are mixed. Stock et al (26) found that baseline GIPconcentrations were significantly lower in the AN group than inthe HC group, whereas, Tomasik et al (13, 34) found significantlyhigher GIP concentrations in the AN group. In response to the testmeal, Stock et al found a significantly lower GIP peak in the ANgroup, although a significant (2 to 3 times) increase in GIP con-centrations was observed in both the AN and HC groups. Con-versely, Tomasik et al found that the integrated output of GIP inboth the oral-glucose-load and test-meal conditions was signifi-cantly higher in the AN group than in the HC group.
Mean basal GLP-1 concentrations were significantly lower inthe AN than in the HC group (12, 13, 34). After the oral glucoseload, mean integrated GLP-1 outputs were twice as high in bothgroups as after the test meal; however, mean integrated outputswere significantly higher in the HC group than in the AN groupin both tests (34). No other studies examined GLP-1 concentrationsand the response to food. Pirke et al (14) observed that all groupsshowed a significant increase in somatostatin secretion after thetest meal and that the AN subjects showed a significantly greaterincrease than both the HC and weight-restored AN subjects.
Glucagon concentrations were examined in both the BN (11)and AN (34) subjects. No significant differences were foundbetween BN and HC for either baseline plasma glucagon con-centration or the glucagon decline curve and the subsequentincrease. Baseline glucagon concentrations were significantlylower in the AN group than in the HC group. The integratedoutput of glucagon after both the oral glucose test and the testmeal was higher in the AN than in the HC group. In the ANgroup, glucagon increased initially 15 min after the test mealand then decreased rapidly; this was not observed in the HCgroup. Gastrin response was examined in one study only andwas found to be significantly lower in the AN group than in the
HC group (37). The AN subjects also showed significantly lowerbasal gastrin concentrations.
DISCUSSION
We synthesized the results on baseline and short-term phys-iologic response to food from 24 studies that fulfilled our inclusioncriteria. The only hormones for which there were sufficient studiesto conduct a meta-analysis were ghrelin, PYY, CCK, insulin, andPP. The results were highly heterogeneous, most of the studieswere small, and the diagnostic and symptomatic subgroups werepoorly defined; therefore, the conclusions are limited. Persons withED had higher baseline concentrations of ghrelin (large effect,especially in AN) and PYY (medium effect), which agrees withour first hypothesis. These groups also showed increased baselineconcentrations of CCK (medium effect for the ED group, verylarge effect for the AN group). There was insufficient evidence tocompare differences between restricting and binge-eating groups.BMI was significantly lower in the AN groups than in the HCgroups. This may have physiologic implications for the release ofgut hormones at baseline. To assess the impact of a low BMI,a review of the long-term changes in plasma hormone concen-trations in AN patients would be helpful, comparing values beforeand after weight restoration.
There was no support for the second part of our hypothesis,which was that the hormonal response to a standardized test mealwould be disturbed. The lack of standardization of meals acrossstudies is considered a limitation. The release of the gut peptidesghrelin, PYY, and CCK to a meal was within the normal rangeacross studies, as defined by a comparison of mean hormoneresponses in the ED groups with those of an HC group, con-sidered in this case to be showing ‘‘normal’’ responses. Althoughthere was an insufficient number of studies that examined theghrelin response to a test meal in BN, the data indicate that theghrelin responses in this subtype are blunted (20–22). This mayresult in a diminished sensation of satiety with implicationsfor continued binge-purge behaviors. Further study is required.Blunted or reversed PYY responses in BN were also observed in2 studies (21, 22). Insulin was the only hormone to have
FIGURE 9. Forest plot showing the summarized results and effect sizes(with 95% CIs) for mean baseline plasma pancreatic polypeptideconcentrations in different subtypes of eating disorder (ED) patients andhealthy control (HC) subjects. , anorexia nervosa; , bulimia nervosa.1Oral-glucose-tolerance test. 2Solid test meal.
FIGURE 10. Forest plot showing the summarized results and effect sizes(with 95% CIs) for mean maximal changes in plasma pancreatic polypeptideconcentrations after a test meal or glucose load in different subtypes ofeating disorder (ED) patients and healthy control (HC) subjects. ,anorexia nervosa; , anorexia nervosa binge-purging type; , bulimianervosa. 1Oral-glucose-tolerance test. 2Solid test meal.
HORMONAL RESPONSE TO FOOD IN EDs 763
by guest on May 11, 2011
ww
w.ajcn.org
Dow
nloaded from
a medium effect in ED patients, which showed a trend towarda decreased release of insulin in response to a test meal orglucose load as compared with HC subjects. This observationagrees with previous reports that persons with AN have an in-creased sensitivity to insulin and a reduced insulin response (3, 26).
Elevated ghrelin concentrations at baseline mightbe expected inpersons with an ED, particularly those with AN, because thishormone acts to increase food intake. The increase in baselineconcentrations of CCK and PYY in AN is somewhat surprisingbecause these gut hormones act to suppress appetite. However, inmany studies, the confidence limits overlapped zero. It is possiblethat the baseline results are more susceptible to confounding byfactors such as time since last meal and stress levels than are theresultsof the morestandardized procedure, ie, themeal.The timingof the hormone responses to food was extremely variable across allstudies, and limited conclusions could be drawn from the data.
Overall, a high degree of heterogeneity was observed betweenthe studies. Many factors may have accounted for these highlydivergent results, including differences in the clinical charac-teristics of the samples, technical differences in the protocol usedto administer the test meals and oral glucose loads (eg, differ-ences in the macronutrient composition of the meals and in mealpatterns before the study), and technical differences in themethods used to ascertain hormone concentrations (eg, the dif-ferentiation of active from inactive ghrelin or lack thereof, timingof meals, and sample collection time points). In particular, the testmeals were only standardized within studies, not between studies,and as such the variability in meal composition may act toconfound the results. In addition, the collection and preservationof the samples is a critical process because they can easily de-nature and some (eg, PYY) are released as part of a stress re-sponse.
The baseline concentrations differed in many cases betweenthe ED and HC groups. This may have consequences for thepostprandial hormone response patterns being examined. Asa result, use of the area under the curve may be a more validmeasure of response. However, because of the diverse nature ofthe reported data across the studies it was not possible to de-termine the area under the curve in sufficient cases.
There were also differences in the case mix, eg, inclusioncriteria, stage of illness, range of ED symptoms, vomiting,laxative and diuretic abuse, and comorbidity. Another potentiallyconfounding factor may have been the absence of raw data formany of the studies, which resulted in values being read from thepublished graphs. This may have led to inaccuracies in some ofthe data used in the meta-analyses. Much of the data presentedwere also recorded, analyzed, and reported differently across thestudies.
In conclusion, the data in part support our first hypothesis,which was that ED patients would have abnormal fasting hor-mone concentrations (ie, baseline ghrelin and PYY concen-trations were elevated). The finding of elevated baseline PYYandCCK concentrations was interesting, particularly in the ANgroups, because it would not be predicted as a secondary responseto starvation, but the confidence in this result is limited; therefore,additional high-quality studies are needed. A review and meta-analysis of studies in patients before and after recovery wouldalso confirm or reject the hypothesis that these disturbances arestate- rather than trait-related. The data suggest that the hormonalresponse to food is disturbed to a greater extent in BN, which may
contribute to certain behavioral aspects of the disorder. However,again, more high-quality studies are required to further explorethis hypothesis.
Another area of interest is the interaction between the gut andthebrain,specificallyhowgastrointestinalresponsesmaynotsimplyimpact food-related pathways, but may have broader aspects ofreward. Obesity-prone rats have abnormalities in their dopaminesystem—a key component of hedonic regulation (40). Gut hor-mones, such as PYY, in humans alter brain activation in theselimbic areas (41). Also, links exist between feeding and emotion(42), and ghrelin may serve as a defense against depressivesymptoms of chronic stress (43). Unraveling and identifying theselinks and the underlying mechanisms is key to our understandingof both the development, onset, and maintenance of EDs.
We acknowledge the support of the ARIADNE program (Applied Research
into Anorexia Nervosa and Not Otherwise Specified Eating Disorders), which
was funded by a Department of Health NIHR Programme Grant for Applied
Research (reference number RP-PG-0606-1043) to U Schmidt, J Treasure, K
Tchanturia, H Startup, S Ringwood, S Landau, M Grover, I Eisler, I Campbell,
J Beecham, M Allen, and G Wolff. The views expressed herein are not nec-
essarily those of DH/NIHR. We also thank Carolina Lopez for her invaluable
assistance in the statistical analysis of the data and the Nina Jackson Foun-
dation for Research into Eating Disorders who fund Samantha Brooks.
The authors’ responsibilities were as follows—ACP: main author of the
manuscript; JT: initiated research topic, edited manuscript drafts, and pro-
vided invaluable guidance during paper selection, draft development, and final
submission; SJB: viewed and critiqued the manuscript and provided signif-
icant input in the early stages of the review in terms of idea development,
discussion of the topic, and practicalities of conducting a meta-analysis;
and DS: contributed to the statistical analysis of the data. None of the authors
declared a conflict of interest.
REFERENCES1. Kaye W, Strober M. Neurobiology of eating disorders. In: Charney DS,
Nestler EJ, Bunney BS. eds. Neurobiological foundations of mentalillness. New York, NY: Oxford University Press, 1999:891–906.
2. Kaye WH. Neuropeptide abnormalities in anorexia nervosa. PsychiatryRes 1996;62:65–74.
3. Monteleone P, Castaldo E, Maj M. Neuroendocrine dysregulation offood intake in eating disorders. Regul Pept 2008;149:39–50.
4. Stoving RK, Hangaard J, Hansen-Nord M, Hagen C. A review of en-docrine changes in anorexia nervosa. J Psychiatr Res 1999;33:139–52.
5. Gale SM, Castracane VD, Mantzoros CS. Energy homeostasis, obesityand eating disorders: recent advances in endocrinology. J Nutr 2004;134:295–8.
6. Stanley S, Wynne K, McGowan B, Bloom S. Hormonal regulation offood intake. Physiol Rev 2005;85:1131–58.
7. Brown NW, Ward A, Surwit R, et al. Evidence for metabolic and en-docrine abnormalities in subjects recovered from anorexia nervosa.Metabolism 2003;52:296–302.
8. Valevski A, Fridberg G, Gil-Ad I, Laron Z, Weizman A. Neuroendo-crinological response to standardized mixed meal in female anorecticpatients during active and refeeding phases. J Pediatr Endocrinol Metab2000;13:195–9.
9. Harty RF, Pearson PH, Solomon TE, McGuigan JE. Cholecystokinin,vasoactive intestinal peptide and peptide histidine methionine responsesto feeding in anorexia nervosa. Regul Pept 1991;36:141–50.
10. Nedvidkova J, Krykorkova I, Bartak V, et al. Loss of meal-induceddecrease in plasma ghrelin levels in patients with anorexia nervosa. JClin Endocrinol Metab 2003;88:1678–82.
11. Casper RC, Pandy GN, Jaspan JB, Rubenstein AH. Hormone and me-tabolite plasma levels after oral glucose in bulimia and healthy controls.Biol Psychiatry 1988;24:663–74.
12. Tomasik PJ, Sztefko K, Malek A. GLP-1 as a satiety factor in childrenwith eating disorders. Horm Metab Res 2002;34:77–80.
13. Tomasik PJ, Sztefko K, Starzyk J. Cholecystokinin, glucose dependentinsulinotropic peptide and glucagon-like peptide 1 secretion in children
764 PRINCE ET AL
by guest on May 11, 2011
ww
w.ajcn.org
Dow
nloaded from
with anorexia nervosa and simple obesity. J Pediatr Endocrinol Metab2004;17:1623–31.
14. Pirke KM, Friess E, Kellner MB, Krieg JC, Fichter MM. Somatostatin ineating disorders. Int J Eat Disord 1994;15:99–102.
15. Bradburn MJ, Deeks JJ, Altman DG. sbe24: METAN—an alternativemeta-analysis command. Stata Tech Bull 1998;44:1–15.
16. Wilson DB. Effect size determination program. College Park, MD:University of Maryland, 2001.
17. Cooper HM, Hedges LV. The handbook of research synthesis. NewYork, NY: Russell Sage Foundation, 1994.
18. Everitt B. Modern medical statistics: a practical guide. London, UnitedKingdom: Arnold, 2003.
19. Higgins JP, Thompson SG, Deeks JJ, Altman DG. Measuring in-consistency in meta-analyses. BMJ 2003;327:557–60.
20. Monteleone P, Martiadis V, Fabrazzo M, Serritella C, Maj M. Ghrelinand leptin responses to food ingestion in bulimia nervosa: implicationsfor binge-eating and compensatory behaviours. Psychol Med 2003;33:1387–94.
21. Kojima S, Nakahara T, Nagai N, et al. Altered ghrelin and peptide YY re-sponses to meals in bulimia nervosa. Clin Endocrinol (Oxf) 2005;62:74–8.
22. Monteleone P, Martiadis V, Rigamonti AE, et al. Investigation of peptideYY and ghrelin responses to a test meal in bulimia nervosa. Biol Psy-chiatry 2005;57:926–31.
23. Tanaka M, Tatebe Y, Nakahara T, et al. Eating pattern and the effect oforal glucose on ghrelin and insulin secretion in patients with anorexianervosa. Clin Endocrinol (Oxf) 2003;59:574–9.
24. Misra M, Miller KK, Herzog DB, et al. Growth hormone and ghrelinresponses to an oral glucose load in adolescent girls with anorexianervosa and controls. J Clin Endocrinol Metab 2004;89:1605–12.
25. Otto B, Tschop M, Fruhauf E, et al. Postprandial ghrelin release inanorectic patients before and after weight gain. Psychoneur-oendocrinology 2005;30:577–81.
26. Stock S, Leichner P, Wong AC, et al. Ghrelin, peptide YY, glucose-dependent insulinotropic polypeptide, and hunger responses to a mixedmeal in anorexic, obese, and control female adolescents. J Clin EndocrinolMetab 2005;90:2161–8.
27. Nakahara T, Kojima S, Tanaka M, et al. Incomplete restoration of thesecretion of ghrelin and PYY compared to insulin after food ingestionfollowing weight gain in anorexia nervosa. J Psychiatr Res 2007;41:814–20.
28. Otto B, Cuntz U, Otto C, Heldwein W, Riepl RL, Tschop MH. PeptideYY release in anorectic patients after liquid meal. Appetite 2007;48:301–4.
29. Geracioti TD Jr, Liddle RA. Impaired cholecystokinin secretion in bu-limia nervosa. N Engl J Med 1988;319:683–8.
30. Devlin MJ, Walsh BT, Guss JL, Kissileff HR, Liddle RA, Petkova E.Postprandial cholecystokinin release and gastric emptying in patientswith bulimia nervosa. Am J Clin Nutr 1997;65:114–20.
31. Keel PK, Wolfe BE, Liddle RA, De Young KP, Jimerson DC. Clinicalfeatures and physiological response to a test meal in purging disorderand bulimia nervosa. Arch Gen Psychiatry 2007;64:1058–66.
32. Phillipp E, Pirke KM, Kellner MB, Krieg JC. Disturbed cholecystokininsecretion in patients with eating disorders. Life Sci 1991;48:2443–50.
33. Fujimoto S, Inui A, Kiyota N, et al. Increased cholecystokinin andpancreatic polypeptide responses to a fat-rich meal in patients with re-strictive but not bulimic anorexia nervosa. Biol Psychiatry 1997;41:1068–70.
34. Tomasik PJ, Sztefko K, Starzyk J, Rogatko I, Szafran Z. Entero-insularaxis in children with anorexia nervosa. Psychoneuroendocrinology2005;30:364–72.
35. Geracioti TD Jr, Liddle RA, Altemus M, Demitrack MA, Gold PW.Regulation of appetite and cholecystokinin secretion in anorexia nerv-osa. Am J Psychiatry 1992;149:958–61.
36. Tamai H, Takemura J, Kobayashi N, Matsubayashi S, Matsukura S,Nakagawa T. Changes in plasma cholecystokinin concentrations afteroral glucose tolerance test in anorexia nervosa before and after therapy.Metabolism 1993;42:581–4.
37. Uhe AM, Szmukler GI, Collier GR, Hansky J, O’Dea K, Young GP.Potential regulators of feeding behavior in anorexia nervosa. Am J ClinNutr 1992;55:28–32.
38. Gniuli D, Liverani E, Capristo E, Greco AV, Mingrone G. Bluntedglucose metabolism in anorexia nervosa. Metabolism 2001;50:876–81.
39. Kinzig KP, Coughlin JW, Redgrave GW, Moran TH, Guarda AS. Insulin,glucose, and pancreatic polypeptide responses to a test meal in re-stricting type anorexia nervosa before and after weight restoration. Am JPhysiol Endocrinol Metab 2007;292:E1441–6.
40. Geiger BM, Behr GG, Frank LE, et al. Evidence for defective mesolimbicdopamine exocytosis in obesity-prone rats. FASEB J 2008;22:2740–6.
41. Batterham RL, Ffytche DH, Rosenthal JM, et al. PYY modulation ofcortical and hypothalamic brain areas predicts feeding behaviour inhumans. Nature 2007;450:106–9.
42. Kishi T, Elmquist JK. Body weight is regulated by the brain: a linkbetween feeding and emotion. Mol Psychiatry 2005;10:132–46.
43. Lutter M, Sakata I, Osborne-Lawrence S, et al. The orexigenic hormoneghrelin defends against depressive symptoms of chronic stress. NatNeurosci 2008;11:752–3.
HORMONAL RESPONSE TO FOOD IN EDs 765
by guest on May 11, 2011
ww
w.ajcn.org
Dow
nloaded from


