Embed Size (px)
Citation preview
Systolic Blood Pressure, Diastolic Blood Pressure, and PulsePressure: An Evaluation of Their Joint Effect on MortalityRoberto Pastor-Barriuso, PhD; Jose R. Banegas, MD, PhD; Javier Damian, MD, PhD; Lawrence J. Appel, MD, MPH;and Eliseo Guallar, MD, DrPH
Background: The relative importance of blood pressure compo-nents (systolic blood pressure, diastolic blood pressure, and pulsepressure) on cardiovascular risk is currently being debated. Manystudies, however, are limited by inadequate statistical methods toseparate these effects.
Objective: To evaluate the joint effect of blood pressure com-ponents on all-cause and cardiovascular mortality by using non-parametric and change point models.
Design: Prospective cohort study.
Setting: 15-year mortality follow-up of participants in the SecondNational Health and Nutrition Examination Survey.
Participants: 7830 white and African-American men and women30 to 74 years of age, apparently free of cardiovascular disease atbaseline.
Measurements: Baseline blood pressure, corrected for measure-ment error.
Results: Of the 1588 patients who died, 582 died of cardiovas-cular disease. Systolic blood pressure was linearly related to all-cause and cardiovascular mortality in younger and elderly partic-ipants. The association of diastolic blood pressure with all-causeand cardiovascular mortality was hockey stick–shaped (flat thenincreasing) in younger participants and J-shaped in elderly partic-ipants. Increased pulse pressure was associated with increasedrisk, decreased risk, or no change in risk depending on age andsystolic and diastolic blood pressure.
Conclusions: On the basis of these and previous data, theevidence for a monotonic association of systolic blood pressurewith all-cause and cardiovascular mortality is compelling, but aJ-shaped association for diastolic blood pressure may develop atolder age. The complexity of the association of pulse pressurewith mortality discourages its use for prognostic or therapeuticdecisions.
Ann Intern Med. 2003;139:731-739. www.annals.orgFor author affiliations, see end of text.
Two aspects of the effect of blood pressure on mortalityhave been controversial. The first is the relative impor-
tance of blood pressure components (systolic blood pres-sure, diastolic blood pressure, and pulse pressure) as deter-minants of risk (1–5), and it has been suggested thatbeyond middle age, pulse pressure is a more importantdeterminant of risk than systolic or diastolic blood pressure(2). The second is the possibility of a J-shaped relationshipbetween blood pressure and mortality (4, 6, 7), with theconcern that lowering blood pressure below a threshold oflowest risk would not be justified and could even be harmful.
Evaluating these 2 issues, however, is methodologicallycomplex. First, systolic blood pressure, diastolic bloodpressure, and pulse pressure are linearly dependent, that is,knowledge of any 2 of them determines the third. Second,because of the high correlation between systolic and dia-stolic blood pressures, interpreting the effect of blood pres-sure components is difficult. For instance, if only 1 com-ponent (such as diastolic blood pressure) is used to modelrisk, it is unclear what part of the effect is due to its cor-relation with systolic blood pressure (4). However, if sys-tolic and diastolic blood pressure are introduced in a re-gression model, the interpretation of both coefficients isuncertain because the coefficients partly reflect the effect ofpulse pressure. Third, most studies addressing the J-shapephenomenon have used analysis strategies that did not ac-count for the complex relationships between blood pres-sure components and mortality.
We examined the relationship of blood pressure com-ponents with all-cause and cardiovascular disease (CVD)
mortality in a representative population–based prospectivestudy. We used generalized additive models to estimate theeffect of the joint distribution of blood pressure compo-nents, avoiding model assumptions about the underlyingdose–response relationship (8, 9). These methods take ad-vantage of the high correlation between systolic and dia-stolic blood pressures to estimate the risk surface for com-binations of blood pressure measures. We also discuss howto interpret the relative importance of each blood pressurecomponent based partly on graphical presentation of re-sults.
METHODS
Study SampleThe study sample consisted of 9250 participants in the
Second National Health and Nutrition Examination Sur-vey (NHANES II) Mortality Study (10), a prospective co-hort study that followed participants 30 to 74 years of age.The complex survey, conducted by the National Center forHealth Statistics between 1976 and 1980, used a stratified,multistage sampling design to obtain a representative sam-ple of the noninstitutionalized U.S. population (11). Theresponse rate among persons selected for the examinationwas 73%.
Baseline AssessmentDuring the NHANES II baseline examination (1976
to 1980), a trained physician took 3 blood pressure mea-surements by using a calibrated mercury sphygmomanom-eter on the right arm, according to the American Heart
Article
© 2003 American College of Physicians 731

Association guidelines. One measurement was taken at thebeginning of the physical examination with the participantin the sitting position, and 2 more measurements weretaken at the end of the physical examination, 1 with theparticipant in the supine position and the other with theparticipant in the sitting position (11). We used these 3measurements to estimate each participant’s underlyingsystolic and diastolic blood pressure (see Statistical Analysis).
Participants’ age, sex, race or ethnicity, smoking status,and years of education were obtained by interview. Weightand height were measured to calculate the body mass in-dex. Total serum cholesterol levels were obtained fromstandard blood assays. Use of antihypertensive medicationand previous diagnosis of diabetes were identified throughthe medical history questionnaire. Evidence of CVD atbaseline was defined as a positive response on a modifiedRose angina questionnaire or a medical history of heartattack or stroke (11).
Mortality Ascertainment during Follow-upMortality status was ascertained from 1976 to 1992 by
searching the National Death Index and the Social SecurityAdministration Death Master File (10). Participants notfound to be deceased by 31 December 1992 were assumedto be alive. The causes of death were coded by nosologistsaccording to the International Classification of Diseases,Ninth Revision (ICD-9). Deaths were ascribed to CVD ifany of the following conditions were coded as the under-lying cause of death: hypertensive heart disease (402.0 to402.9); ischemic heart disease (410.0 to 414.9); cardiac arrest(427.5); unspecified heart failure (428.9); unspecified CVD(429.2); cerebrovascular disease (430.0 to 438.9); or dis-eases of the arteries, arterioles, and capillaries (440.0 to444.9).
Statistical AnalysisOur main objective was to estimate the joint effect of
systolic and diastolic blood pressure on all-cause and CVDmortality, that is, the risk for death for each combinationof systolic and diastolic blood pressure. This is in contrastto usual analyses, which estimate the marginal rather thanthe joint effects. The marginal effect of diastolic bloodpressure, for instance, is the effect at each level of diastolicblood pressure “averaged” across all values of systolic bloodpressure. To estimate the joint effect of systolic and dia-stolic blood pressure, we simultaneously fitted 2 nonpara-metric terms (locally weighted smoothers with 40% to50% bandwidth) for each blood pressure component in ageneralized additive logistic model (8). This technique es-timates the smooth surface of the relative risk for death asa function of both systolic and diastolic blood pressure. Itdoes not make assumptions about the shape of the associ-ation, and it takes advantage of the correlation betweensystolic and diastolic blood pressure to obtain more preciseestimates of risk over the joint distribution of observedvalues.
To compare our results with previous analyses, we alsoestimated the marginal effect of blood pressure compo-nents by using Cox proportional hazards models and non-parametric logistic regression to explore the continuousrisk trend without imposing any assumption on the shapeof the association (8). In addition, we performed statisticaltests for detecting the existence of threshold effects orpoints of abrupt risk change (12). When a change pointwas detected, transition logistic models were fitted to esti-mate its location (12). Transition models are similar tospline models (13), but in the former the change point isestimated from the data rather than fixed in advance. Incontrast to standard analysis of the J-shape phenomenonbased on log-linear or categorical models with limited abil-ity to detect threshold effects, nonparametric regressionand change point models correctly identify nonlinear ef-fects and threshold levels (12–15).
Since we detected that the proportional hazards as-sumption was applicable only after the initial 2-yearfollow-up, and because of the few deaths and the possibil-ity that early deaths at low blood pressure reflect underly-ing disease or frailty conditions (reverse causation bias), thefirst 2 years of follow-up (122 all-cause deaths, 44 of whichwere CVD deaths) were analyzed separately from thedeaths after 2 years of follow-up (1466 all-cause deaths,538 of which were CVD deaths).
To correct for regression dilution bias due to randomwithin-participant variability in blood pressure (16–18),each participant’s underlying blood pressure was estimatedfrom the observed measurements by using a random-effectsmodel for each sex (17). These underlying blood pressurevalues were used subsequently in all analyses. Since therelationship of blood pressure with CVD risk may changewith age (2), we conducted all analyses separately for 2 agestrata (�65 and �65 years). All models presented were
Context
Researchers often debate relationships between variousblood pressure components and risk for death.
Contribution
This careful analysis from a large cohort study confirmedlinear relationships between increasing systolic blood pres-sure and increasing risk for death and, depending on age,either hockey stick–shaped or J-shaped relationships be-tween diastolic blood pressure and mortality. Relationshipsbetween pulse pressure and mortality depended onwhether increased pulse pressure was due to increasedsystolic or decreased diastolic blood pressure.
Implications
Pulse pressure alone, without appropriate attention to sys-tolic and diastolic blood pressure components, is an inade-quate indicator of mortality risk.
–The Editors
Article Blood Pressure and Mortality
732 4 November 2003 Annals of Internal Medicine Volume 139 • Number 9 www.annals.org
adjusted for age, sex, race or ethnicity, smoking status, totalserum cholesterol level, body mass index, education, anti-hypertensive treatment, and history of diabetes mellitus.Statistical analyses were performed by using S-plus 2000(Mathsoft, Seattle, Washington) (19).
Role of the Funding SourceThe funding source had no role in the choice of topic;
design, analysis, or interpretation of the data; or the deci-sion to submit the manuscript for publication.
RESULTS
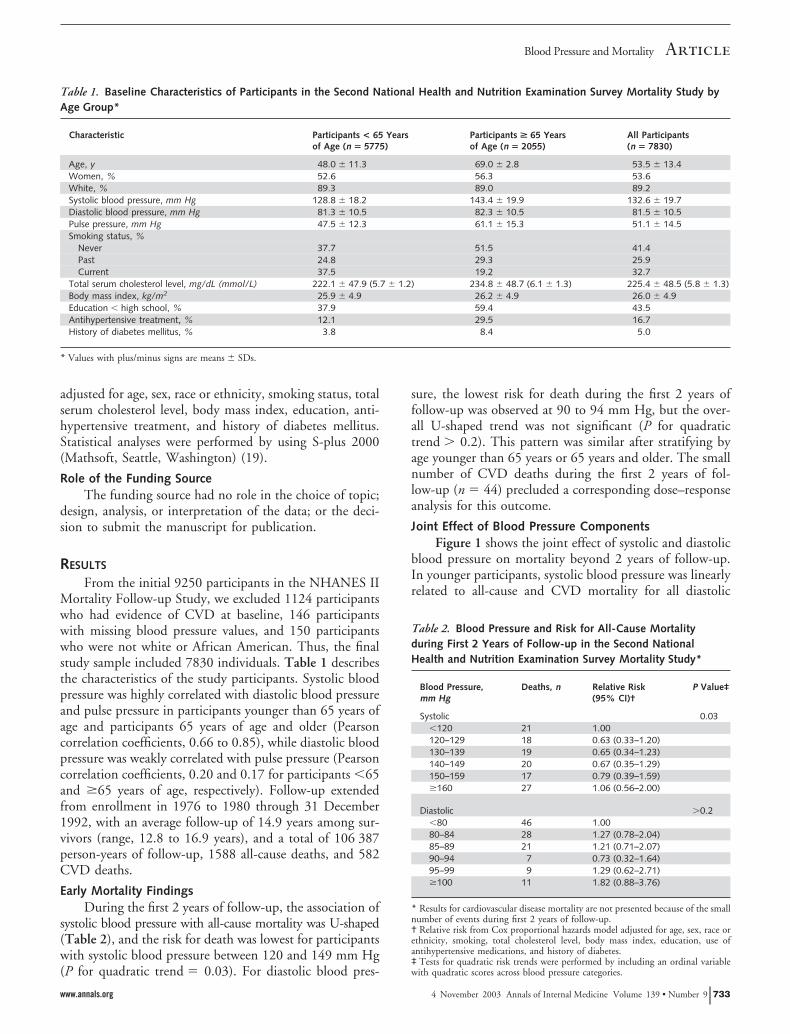
From the initial 9250 participants in the NHANES IIMortality Follow-up Study, we excluded 1124 participantswho had evidence of CVD at baseline, 146 participantswith missing blood pressure values, and 150 participantswho were not white or African American. Thus, the finalstudy sample included 7830 individuals. Table 1 describesthe characteristics of the study participants. Systolic bloodpressure was highly correlated with diastolic blood pressureand pulse pressure in participants younger than 65 years ofage and participants 65 years of age and older (Pearsoncorrelation coefficients, 0.66 to 0.85), while diastolic bloodpressure was weakly correlated with pulse pressure (Pearsoncorrelation coefficients, 0.20 and 0.17 for participants �65and �65 years of age, respectively). Follow-up extendedfrom enrollment in 1976 to 1980 through 31 December1992, with an average follow-up of 14.9 years among sur-vivors (range, 12.8 to 16.9 years), and a total of 106 387person-years of follow-up, 1588 all-cause deaths, and 582CVD deaths.
Early Mortality FindingsDuring the first 2 years of follow-up, the association of
systolic blood pressure with all-cause mortality was U-shaped(Table 2), and the risk for death was lowest for participantswith systolic blood pressure between 120 and 149 mm Hg(P for quadratic trend � 0.03). For diastolic blood pres-
sure, the lowest risk for death during the first 2 years offollow-up was observed at 90 to 94 mm Hg, but the over-all U-shaped trend was not significant (P for quadratictrend � 0.2). This pattern was similar after stratifying byage younger than 65 years or 65 years and older. The smallnumber of CVD deaths during the first 2 years of fol-low-up (n � 44) precluded a corresponding dose–responseanalysis for this outcome.
Joint Effect of Blood Pressure ComponentsFigure 1 shows the joint effect of systolic and diastolic
blood pressure on mortality beyond 2 years of follow-up.In younger participants, systolic blood pressure was linearlyrelated to all-cause and CVD mortality for all diastolic
Table 1. Baseline Characteristics of Participants in the Second National Health and Nutrition Examination Survey Mortality Study byAge Group*
Characteristic Participants < 65 Yearsof Age (n � 5775)
Participants > 65 Yearsof Age (n � 2055)
All Participants(n � 7830)
Age, y 48.0 � 11.3 69.0 � 2.8 53.5 � 13.4Women, % 52.6 56.3 53.6White, % 89.3 89.0 89.2Systolic blood pressure, mm Hg 128.8 � 18.2 143.4 � 19.9 132.6 � 19.7Diastolic blood pressure, mm Hg 81.3 � 10.5 82.3 � 10.5 81.5 � 10.5Pulse pressure, mm Hg 47.5 � 12.3 61.1 � 15.3 51.1 � 14.5Smoking status, %
Never 37.7 51.5 41.4Past 24.8 29.3 25.9Current 37.5 19.2 32.7
Total serum cholesterol level, mg/dL (mmol/L) 222.1 � 47.9 (5.7 � 1.2) 234.8 � 48.7 (6.1 � 1.3) 225.4 � 48.5 (5.8 � 1.3)Body mass index, kg/m2 25.9 � 4.9 26.2 � 4.9 26.0 � 4.9Education � high school, % 37.9 59.4 43.5Antihypertensive treatment, % 12.1 29.5 16.7History of diabetes mellitus, % 3.8 8.4 5.0
* Values with plus/minus signs are means � SDs.
Table 2. Blood Pressure and Risk for All-Cause Mortalityduring First 2 Years of Follow-up in the Second NationalHealth and Nutrition Examination Survey Mortality Study*
Blood Pressure,mm Hg
Deaths, n Relative Risk(95% CI)†
P Value‡
Systolic 0.03�120 21 1.00120–129 18 0.63 (0.33–1.20)130–139 19 0.65 (0.34–1.23)140–149 20 0.67 (0.35–1.29)150–159 17 0.79 (0.39–1.59)�160 27 1.06 (0.56–2.00)
Diastolic �0.2�80 46 1.0080–84 28 1.27 (0.78–2.04)85–89 21 1.21 (0.71–2.07)90–94 7 0.73 (0.32–1.64)95–99 9 1.29 (0.62–2.71)�100 11 1.82 (0.88–3.76)
* Results for cardiovascular disease mortality are not presented because of the smallnumber of events during first 2 years of follow-up.† Relative risk from Cox proportional hazards model adjusted for age, sex, race orethnicity, smoking, total cholesterol level, body mass index, education, use ofantihypertensive medications, and history of diabetes.‡ Tests for quadratic risk trends were performed by including an ordinal variablewith quadratic scores across blood pressure categories.
ArticleBlood Pressure and Mortality
www.annals.org 4 November 2003 Annals of Internal Medicine Volume 139 • Number 9 733

blood pressure levels. This can be appreciated by notingthe increasing slope of the risk surface with increasing sys-tolic blood pressure when the surface is followed alonglines parallel to the systolic blood pressure axis. Along theselines, the surface represents the effect of increasing systolicblood pressure for each fixed value of diastolic blood pres-sure, also known as the conditional effect of systolic bloodpressure. This effect can be interpreted as the effect ofincreasing pulse pressure by increasing systolic blood pres-
sure and holding each value of diastolic blood pressureconstant.
The relationship of diastolic blood pressure and mor-tality in younger participants was hockey stick–shaped,with a flat region below 80 mm Hg and then a sharpincrease in risk. The effect of diastolic blood pressure for afixed systolic blood pressure can be evaluated by followingthe risk surface along lines parallel to the diastolic bloodpressure axis. The flat surface below 80 mm Hg of diastolic
Figure 1. Risk surfaces for all-cause and cardiovascular mortality as a function of systolic and diastolic blood pressure by age group.
Surfaces were obtained by fitting simultaneous nonparametric terms for systolic and diastolic blood pressure in generalized additive logistic models.Breaks in gray scale are determined by the risk levels labeled in each vertical axis. Adjusted for age, sex, race or ethnicity, smoking, total cholesterol level,body mass index, education, use of antihypertensive medications, and history of diabetes. The surfaces represent the relative risk for all-cause andcardiovascular mortality for each combination of systolic and diastolic blood pressure. For a fixed diastolic blood pressure, the effect of systolic bloodpressure can be evaluated by following the risk surface along lines parallel to the systolic blood pressure axis. This effect, known as the conditional effectof systolic blood pressure, can also be interpreted as the effect of increasing pulse pressure by increasing systolic blood pressure and holding diastolic bloodpressure constant. Similarly, for a fixed systolic blood pressure, the conditional effect of diastolic blood pressure can be evaluated by following the risksurface along lines parallel to the diastolic blood pressure axis. This effect corresponds to the effect of decreasing pulse pressure by increasing diastolicblood pressure and holding systolic blood pressure constant.
Article Blood Pressure and Mortality
734 4 November 2003 Annals of Internal Medicine Volume 139 • Number 9 www.annals.org

blood pressure implies that increasing pulse pressure bydecreasing diastolic blood pressure below 80 mm Hg doesnot increase risk, while decreasing pulse pressure by in-creasing diastolic blood pressure above 80 mm Hg in-creases risk for death.
In elderly participants, systolic blood pressure alsoshowed essentially a linear increase in risk, while diastolicblood pressure showed a J-shaped relationship for all-causeand CVD mortality (Figure 1). For a fixed diastolic bloodpressure, increasing systolic blood pressure (and thus pulsepressure) was associated with increased risk, while for afixed systolic blood pressure, increasing diastolic bloodpressure (and thus decreasing pulse pressure) was associatedwith decreased risk for diastolic blood pressure below 80 to90 mm Hg and with increased risk for diastolic bloodpressure above 80 to 90 mm Hg.
Marginal Effects of Blood Pressure Components andThreshold Detection
In marginal analysis, participants younger than 65years of age showed increasing risk for all-cause mortalitywith increasing systolic, diastolic, and pulse pressure (Fig-ure 2), with no evidence of threshold effects for any of
these blood pressure measures (P � 0.2 for the existence ofchange points). The risk trends for CVD and all-causemortality were similar (Figure 2), also without evidence ofchange points (P � 0.2 for the existence of change points).
The marginal relationship of blood pressure with all-cause mortality differed in participants 65 years of age andolder. Although the trend was also linear for systolic bloodpressure (P � 0.21 for the existence of a change point),there was a J-shaped pattern for diastolic blood pressureand pulse pressure (Figure 3). The existence of a changepoint was marginally significant for diastolic blood pressure(P � 0.09) and highly significant for pulse pressure(P � 0.003). The change point estimate for diastolic bloodpressure was 79.0 mm Hg (95% CI, 68.6 to 88.7 mm Hg).For pulse pressure, the change point estimate was 41.8 mmHg (CI, 34.3 to 48.5 mm Hg). There was no evidence ofchange points for the association of systolic or diastolicblood pressure and CVD mortality (P � 0.2 for both com-parisons). However, for diastolic blood pressure, the non-parametric analysis suggested a flat association below 80 to90 mm Hg. The relationship of pulse pressure with CVDmortality found a significant change point (P � 0.03), but
Figure 2. Blood pressure and relative risk for all-cause and cardiovascular mortality among participants younger than 65 years of age.
Risk trends were estimated from linear (solid lines) and nonparametric logistic models (dashed lines) adjusted for age, sex, race or ethnicity, smoking, totalcholesterol level, body mass index, education, use of antihypertensive medications, and history of diabetes. The bars represent the frequency distributionof systolic, diastolic, and pulse pressure among study participants younger than 65 years of age.
ArticleBlood Pressure and Mortality
www.annals.org 4 November 2003 Annals of Internal Medicine Volume 139 • Number 9 735

it was estimated at a very low level (35.5 mm Hg, corre-sponding to the 2.3rd percentile of the pulse pressure dis-tribution).
DISCUSSION
Table 3 summarizes the association of blood pressurecomponents with mortality for the different analyticalmodels. Systolic blood pressure showed a consistent linearincrease in long-term all-cause and CVD mortality inyounger and elderly participants in all analyses. The rela-tionship of diastolic blood pressure with mortality washockey stick–shaped in younger participants but was J-shaped in elderly participants. This dose–response relation-ship was evident when both systolic and diastolic bloodpressures were modeled simultaneously, but it was unclearin marginal analyses of diastolic blood pressure. The asso-ciation of pulse pressure with mortality was complex. Injoint analyses, increasing pulse pressure by increasing sys-tolic blood pressure was consistently associated with in-creased risk, while increasing pulse pressure by decreasingdiastolic blood pressure could be associated with increasedrisk, decreased risk, or no change in risk depending on ageand blood pressure level. In our view, this result does not
support using pulse pressure as a single risk indicator forprognostic and therapeutic decisions.
Our study has several limitations. Blood pressure wasbased on 3 measurements taken on a single day. Eventhough we tried to control for short-term variability byestimating each participant’s underlying blood pressure,more measurements taken over a longer period probablywould have provided more precise estimates. The effect ofthese measurement errors on complex risk surfaces is un-known, although there is evidence that measurement errorlimits detecting threshold effects and biases their location(20). Estimating change points is also limited by the size ofthe study and the location of the change point, particularlyif change points are close to the extremes of the data dis-tribution. We identified a significant change point in therelationship of pulse pressure with CVD mortality at a verylow pulse pressure (35.5 mm Hg, the 2.3rd percentile ofthe pulse pressure distribution), but its clinical implicationsare uncertain because there are not enough observationswith which to reliably estimate the risk trend below thechange point. In addition, we did not have follow-up dataon blood pressure and medication patterns or data on morenewly identified risk factors, which may modify the effect
Figure 3. Blood pressure and relative risk for all-cause and cardiovascular mortality among participants 65 years of age or older.
Risk trends were estimated from linear or transition logistic models (solid lines) and nonparametric logistic models (dashed lines) adjusted for age, sex, raceor ethnicity, smoking, total cholesterol level, body mass index, education, use of antihypertensive medications, and history of diabetes. The bars representthe frequency distribution of systolic, diastolic, and pulse pressure among study participants 65 years of age or older.
Article Blood Pressure and Mortality
736 4 November 2003 Annals of Internal Medicine Volume 139 • Number 9 www.annals.org

of blood pressure on mortality. Finally, we also did not havedata on nonfatal events, which may show a different rela-tion to blood pressure components than mortality end points.
Evaluating the joint effect of correlated continuousvariables is sometimes based on estimating the risk for eachcombination of prespecified categories of the variables andpresenting the results in 3-dimensional bar plots (3). Thisapproach is useful if there are enough cases to define nar-row categories, and it assumes that the cutoffs for the cat-egories correctly identify points of risk change. For com-plex dose–response relationships, such as blood pressureand mortality, smooth surfaces are a flexible alternativethat avoid categorization and make no assumption aboutthe shape of the association (8, 9). However, modelingsmooth surfaces is a complex process, with several method-ologic alternatives that may affect the results. Furthermore,the risk surface may be difficult to interpret quantitatively(8). In this paper, we used additive surfaces, obtained byfitting simultaneous nonparametric terms for systolic anddiastolic blood pressure and adding them to form thesmooth surface. Although we did not include an interac-tion term in the model, additive surfaces adequately esti-mated the joint effect of blood pressure components be-cause of their high correlation (8, 9). To avoid overfitting,we restricted the estimation of smooth surfaces to 8 to9 degrees of freedom, which, in terms of the effectivenumber of parameters, corresponds approximately to a 3-dimensional bar plot with 3 categories for systolic anddiastolic blood pressure.
A linear, monotonically increasing association of sys-tolic blood pressure to mortality has been identified in apooled data analysis of 61 prospective observational studies
totaling 12.7 million person-years at risk (4) and in the22-year follow-up of 342 815 participants of the MultipleRisk Factor Intervention Trial (3). These results are com-patible with our analysis of the marginal effect of systolicblood pressure in NHANES II and are supported by ouranalyses of the joint effect of systolic and diastolic bloodpressure. In contrast, Port and colleagues (6) reassessed theFramingham data and, contrary to the graded increase inrisk obtained from previous analyses of this cohort (2, 21,22), found no increased risk for death for systolic bloodpressure below certain prespecified age- and sex-dependentthresholds. Unfortunately, they used strong model assump-tions (linear–linear splines with the left slope constrainedto be 0) with apparently arbitrary location of the points ofrisk change.
A J-shaped relationship between diastolic blood pres-sure and CVD risk or mortality is evident in some (7, 23)but not all prospective studies in the elderly. Several stud-ies, however, show a flat association with low diastolicblood pressure that may extend up to a diastolic bloodpressure of 80 to 85 mm Hg (24, 25). In fact, although thepooled analysis of 61 prospective studies described themarginal association of diastolic blood pressure with coro-nary and stroke mortality as linear (4), their graphs of themarginal effect of diastolic blood pressure are similar to ourmarginal analysis of diastolic blood pressure in NHANESII—that is, the association of diastolic blood pressure andmortality for low diastolic blood pressure became flat withadvancing age. As we have shown in this paper, this flatmarginal association may be reflecting a J-shaped relation-ship for diastolic blood pressure once its correlation withsystolic blood pressure is accounted for. In addition, a
Table 3. Conclusions of the Association of Blood Pressure Components with Long-Term Mortality for the DifferentAnalytical Models*
Blood Pressure Joint Analysis Marginal Analysis
Parametric Nonparametric
Age � 65 ySystolic blood pressure Linear Linear LinearDiastolic blood pressure Hockey stick–shaped Linear Hockey stick–shaped for all-cause
mortality and linear forcardiovascular mortality
Pulse pressure Increased risk for increasing pulse pressure byincreasing systolic blood pressure;decreased risk or no change in risk forincreasing pulse pressure by decreasingdiastolic blood pressure
Linear Linear
Age � 65 ySystolic blood pressure Linear Linear LinearDiastolic blood pressure J-shaped J-shaped for all-cause mortality
and linear for cardiovascularmortality
J-shaped for all-cause mortalityand hockey stick–shaped forcardiovascular mortality
Pulse pressure Increased risk for increasing pulse pressure byincreasing systolic blood pressure; increasedrisk, decreased risk, or no change in risk forincreasing pulse pressure by decreasingdiastolic blood pressure
J-shaped J-shaped
* The conclusions apply both to all-cause and cardiovascular mortality, unless explicitly stated.
ArticleBlood Pressure and Mortality
www.annals.org 4 November 2003 Annals of Internal Medicine Volume 139 • Number 9 737

meta-analysis of 8 trials reported that diastolic blood pres-sure in elderly control patients with isolated systolic hyper-tension was inversely correlated with mortality (26), a find-ing compatible with the J-shape hypothesis. In this agegroup, the J-shape phenomenon for diastolic blood pres-sure may be related to the progressive stiffening of theelastic arteries, which reduces subepicardial coronary flow,particularly in the presence of coronary atherosclerosis. Inthese patients, low diastolic blood pressure may precipitatecoronary events and increase mortality.
The short-term, U-shaped association of blood pres-sure with mortality in our data is consistent with previousstudies that observe either the same pattern (27) or thedisappearance of the increased mortality in the low bloodpressure groups after controlling for concurrent illnesses(28). This is also evident in studies that update blood pres-sure measurements periodically instead of using baselinemeasurements for risk analysis (29, 30). Despite the exclu-sion of participants with self-reported CVD at baseline,our short-term results might be affected by other condi-tions (such as noncardiovascular diseases and frailty) oroccult CVD. This short-term, U-shaped relationship isprobably another source of variability in the association ofblood pressure with mortality across studies.
Our findings may have important clinical conse-quences for risk stratification (Table 4). Several studieshave focused on identifying the main predictor of riskamong systolic blood pressure, diastolic blood pressure, orpulse pressure. However, both systolic and diastolic bloodpressures (and implicitly pulse pressure) must be accountedfor to correctly identify the risk surface (3). Moreover, in-terpreting pulse pressure as a standalone measurement iscomplex: Although reducing pulse pressure by decreasingsystolic blood pressure is consistently associated with de-creased risk, the overall effect of pulse pressure will dependon both systolic and diastolic blood pressures. Clinical de-cision making should then be based on combinations ofsystolic and diastolic blood pressures rather than systolic,diastolic, or pulse pressure alone. With current technology,it is feasible to incorporate these complex risk surfaces into
Framingham-type risk scores to obtain a more accurate riskprofile.
The evidence for a monotonic association of systolicblood pressure with mortality is compelling, but thechanges in the risk shape and the J-shaped curve for dia-stolic blood pressure with advancing age are still open todebate. We also show that the effect of pulse pressure iscomplex, and we do not recommend using this measurealone for prognostic or therapeutic decisions. The shape ofthe association between blood pressure and mortality iscritical for individual treatment and public policy strate-gies. Our results indicate that a simultaneous, rather thanmarginal, analysis of systolic and diastolic blood pressure isneeded to properly assess blood pressure–related risk.
From National Center for Epidemiology, Instituto de Salud Carlos III,Madrid, Spain; Universidad Autonoma de Madrid, Madrid, Spain; andJohns Hopkins Medical Institutions, Baltimore, Maryland.
Grant Support: By a grant from the Instituto de Salud Carlos III (EPY1261/02) (R. Pastor-Barriuso).
Potential Financial Conflicts of Interest: None disclosed.
Requests for Single Reprints: Eliseo Guallar, MD, DrPH, Departmentof Epidemiology and Welch Center for Prevention, Epidemiology andClinical Research, Johns Hopkins Medical Institutions, 2024 EastMonument Street, Room 2-639, Baltimore, MD 21205; e-mail, [email protected].
Current author addresses and author contributions are available at www.annals.org.
References1. Dart AM, Kingwell BA. Pulse pressure—a review of mechanisms and clinicalrelevance. J Am Coll Cardiol. 2001;37:975-84. [PMID: 11263624]2. Franklin SS, Larson MG, Khan SA, Wong ND, Leip EP, Kannel WB, et al.Does the relation of blood pressure to coronary heart disease risk change withaging? The Framingham Heart Study. Circulation. 2001;103:1245-9. [PMID:11238268]3. Domanski M, Mitchell G, Pfeffer M, Neaton JD, Norman J, Svendsen K, etal. Pulse pressure and cardiovascular disease-related mortality: follow-up study ofthe Multiple Risk Factor Intervention Trial (MRFIT). JAMA. 2002;287:2677-83. [PMID: 12020303]4. Lewington S, Clarke R, Qizilbash N, Peto R, Collins R. Age-specific rele-vance of usual blood pressure to vascular mortality: a meta-analysis of individualdata for one million adults in 61 prospective studies. Lancet. 2002;360:1903-13.[PMID: 12493255]5. White WB. The systolic blood pressure versus pulse pressure controversy[Editorial]. Am J Cardiol. 2001;87:1278-81. [PMID: 11377354]6. Port S, Demer L, Jennrich R, Walter D, Garfinkel A. Systolic blood pressureand mortality. Lancet. 2000;355:175-80. [PMID: 10675116]7. Benetos A, Thomas F, Safar ME, Bean KE, Guize L. Should diastolic andsystolic blood pressure be considered for cardiovascular risk evaluation: a study inmiddle-aged men and women. J Am Coll Cardiol. 2001;37:163-8. [PMID:11153732]8. Hastie TJ, Tibshirani RJ. Generalized Additive Models. London: Chapmanand Hall; 1990.9. Harrell FE Jr. Regression Modeling Strategies. New York: Springer-Verlag;2001.10. Loria CM, Sempos CT, Vuong C. Plan and operation of the NHANES II
Table 4. Key Summary Points
Systolic blood pressure, diastolic blood pressure, and pulse pressure arehighly correlated blood pressure components.
Rather than assessing the effects of each blood pressure componentseparately, it is more effective and appropriate to evaluate the joint effectof all components on clinical outcomes.
In joint analysis: 1) systolic blood pressure is linearly related to all-cause andcardiovascular mortality at all ages; 2) diastolic blood pressure shows a“flat then increasing” risk trend in younger participants and a J-shapedtrend in elderly participants; and 3) increased pulse pressure is associatedwith increased risk, decreased risk, or no change in risk depending on ageand systolic and diastolic blood pressure levels.
The complexity of the association of pulse pressure with mortality limits itsuse for prognostic or therapeutic decisions.
Article Blood Pressure and Mortality
738 4 November 2003 Annals of Internal Medicine Volume 139 • Number 9 www.annals.org

Mortality Study, 1992. Vital Health Stat 1. 1999;38:1-16. [PMID: 10464470]11. McDowell A, Engel A, Massey JT, Maurer K. Plan and operation of theSecond National Health and Nutrition Examination Survey, 1976-1980. VitalHealth Stat 1. 1981;Series 1:1-144. [PMID: 7344293]12. Pastor-Barriuso R, Guallar E, Coresh J. Transition models for change-pointestimation in logistic regression. Stat Med. 2003;22:1141-62. [PMID:12652559]13. Greenland S. Dose-response and trend analysis in epidemiology: alternativesto categorical analysis. Epidemiology. 1995;6:356-65. [PMID: 7548341]14. Goetghebeur E, Pocock SJ. Detection and estimation of J-shaped risk-re-sponse relationships. Journal of the Royal Statistical Society A. 1995;158:107-21.15. Pastor R, Guallar E. Use of two-segmented logistic regression to estimatechange-points in epidemiologic studies. Am J Epidemiol. 1998;148:631-42.[PMID: 9778169]16. MacMahon S, Peto R, Cutler J, Collins R, Sorlie P, Neaton J, et al. Bloodpressure, stroke, and coronary heart disease. Part 1, Prolonged differences inblood pressure: prospective observational studies corrected for the regression di-lution bias. Lancet. 1990;335:765-74. [PMID: 1969518]17. Hughes MD, Pocock SJ. Within-subject diastolic blood pressure variability:implications for risk assessment and screening. J Clin Epidemiol. 1992;45:985-98. [PMID: 1432027]18. Clarke R, Shipley M, Lewington S, Youngman L, Collins R, Marmot M, etal. Underestimation of risk associations due to regression dilution in long-termfollow-up of prospective studies. Am J Epidemiol. 1999;150:341-53. [PMID:10453810]19. Mathsoft. S-Plus 2000 User’s Guide. Seattle: Mathsoft; 1999.20. Kuchenhoff H, Carroll RJ. Segmented regression with errors in predictors:semi-parametric and parametric methods. Stat Med. 1997;16:169-88. [PMID:9004390]21. Kannel WB, Gordon T, Schwartz MJ. Systolic versus diastolic blood pres-sure and risk of coronary heart disease. The Framingham study. Am J Cardiol.
1971;27:335-46. [PMID: 5572576]
22. Kannel WB. Blood pressure as a cardiovascular risk factor: prevention andtreatment. JAMA. 1996;275:1571-6. [PMID: 8622248]
23. Taylor JO, Cornoni-Huntley J, Curb JD, Manton KG, Ostfeld AM, ScherrP, et al. Blood pressure and mortality risk in the elderly. Am J Epidemiol. 1991;134:489-501. [PMID: 1897505]
24. Kannel WB, D’Agostino RB, Silbershatz H. Blood pressure and cardiovas-cular morbidity and mortality rates in the elderly. Am Heart J. 1997;134:758-63.[PMID: 9351745]
25. Psaty BM, Furberg CD, Kuller LH, Cushman M, Savage PJ, Levine D, etal. Association between blood pressure level and the risk of myocardial infarction,stroke, and total mortality: the cardiovascular health study. Arch Intern Med.2001;161:1183-92. [PMID: 11343441]
26. Staessen JA, Gasowski J, Wang JG, Thijs L, Den Hond E, Boissel JP, et al.Risks of untreated and treated isolated systolic hypertension in the elderly: meta-analysis of outcome trials. Lancet. 2000;355:865-72. [PMID: 10752701]
27. Vatten LJ, Holmen J, Kruger O, Forsen L, Tverdal A. Low blood pressureand mortality in the elderly: a 6-year follow-up of 18,022 Norwegian men andwomen age 65 years and older. Epidemiology. 1995;6:70-3. [PMID: 7888450]
28. Guo Z, Viitanen M, Winblad B. Low blood pressure and five-year mortalityin a Stockholm cohort of the very old: possible confounding by cognitive impair-ment and other factors. Am J Public Health. 1997;87:623-8. [PMID: 9146442]
29. Hansson L, Zanchetti A, Carruthers SG, Dahlof B, Elmfeldt D, Julius S, etal. Effects of intensive blood-pressure lowering and low-dose aspirin in patientswith hypertension: principal results of the Hypertension Optimal Treatment(HOT) randomised trial. HOT Study Group. Lancet. 1998;351:1755-62.[PMID: 9635947]
30. Boutitie F, Gueyffier F, Pocock S, Fagard R, Boissel JP. J-shaped relation-ship between blood pressure and mortality in hypertensive patients: new insightsfrom a meta-analysis of individual-patient data. Ann Intern Med. 2002;136:438-48. [PMID: 11900496]
ArticleBlood Pressure and Mortality
www.annals.org 4 November 2003 Annals of Internal Medicine Volume 139 • Number 9 739

Current Author Addresses: Drs. Pastor-Barriuso and Damian: Epide-miology and Biostatistics Section, National Center for Epidemiology,Instituto de Salud Carlos III, Sinesio Delgado 6, 28029 Madrid, Spain.Dr. Banegas: Department of Preventive Medicine and Public Health,Universidad Autonoma de Madrid, 28029 Madrid, Spain.Dr. Appel: Welch Center for Prevention, Epidemiology and ClinicalResearch, Johns Hopkins Medical Institutions, 2024 East MonumentStreet, Room 2-630, Baltimore, MD 21205.Dr. Guallar: Welch Center for Prevention, Epidemiology and ClinicalResearch, Johns Hopkins Medical Institutions. 2024 East MonumentStreet, Room 2-639, Baltimore, MD 21205.
Author Contributions: Conception and design: R. Pastor-Barriuso, J.R.Banegas, J. Damian, E. Guallar.Analysis and interpretation of the data: R. Pastor-Barriuso, J.R. Banegas,J. Damian, L.J. Appel, E. Guallar.Drafting of the article: R. Pastor-Barriuso, J.R. Banegas, J. Damian,L.J. Appel, E. Guallar.Critical revision of the article for important intellectual content: R. Pas-tor-Barriuso, J.R. Banegas, J. Damian, L.J. Appel, E. Guallar.Final approval of the article: R. Pastor-Barriuso, J.R. Banegas, J. Damian,L.J. Appel, E. Guallar.Statistical expertise: R. Pastor-Barriuso, E. Guallar.Obtaining of funding: R. Pastor-Barriuso.Administrative, technical, or logistic support: E. Guallar.
E-740 Annals of Internal Medicine Volume • Number www.annals.org


