Embed Size (px)
Citation preview

Tabletop Molecular Communication: Text Messagesthrough Chemical SignalsNariman Farsad1*, Weisi Guo2, Andrew W. Eckford1
1 Department of Electrical Engineering and Computer Science, York University, Toronto, Ontario, Canada, 2 School of Engineering, University of Warwick, Coventry, United
Kingdom
Abstract
In this work, we describe the first modular, and programmable platform capable of transmitting a text message usingchemical signalling – a method also known as molecular communication. This form of communication is attractive forapplications where conventional wireless systems perform poorly, from nanotechnology to urban health monitoring. Usingexamples, we demonstrate the use of our platform as a testbed for molecular communication, and illustrate the features ofthese communication systems using experiments. By providing a simple and inexpensive means of performing experiments,our system fills an important gap in the molecular communication literature, where much current work is done in simulationwith simplified system models. A key finding in this paper is that these systems are often nonlinear in practice, whereascurrent simulations and analysis often assume that the system is linear. However, as we show in this work, despite thenonlinearity, reliable communication is still possible. Furthermore, this work motivates future studies on more realisticmodelling, analysis, and design of theoretical models and algorithms for these systems.
Citation: Farsad N, Guo W, Eckford AW (2013) Tabletop Molecular Communication: Text Messages through Chemical Signals. PLoS ONE 8(12): e82935.doi:10.1371/journal.pone.0082935
Editor: Richard C. Willson, University of Houston, United States of America
Received June 7, 2013; Accepted October 29, 2013; Published December 18, 2013
Copyright: � 2013 Farsad et al. This is an open-access article distributed under the terms of the Creative Commons Attribution License, which permitsunrestricted use, distribution, and reproduction in any medium, provided the original author and source are credited.
Funding: This work was funded by a Discovery grant from the Natural Sciences and Engineering Research Council (NSERC) in Canada (http://www.nserc-crsng.gc.ca/professors-professeurs/grants-subs/dgigp-psigp_eng.asp). The funders had no role in study design, data collection and analysis, decision to publish, orpreparation of the manuscript.
Competing Interests: The authors have declared that no competing interests exist.
* E-mail: [email protected]
Introduction
The need to convey information over a distance has always
been an important part of human society. Many techniques have
been used throughout history, such as semaphores, fire beacons,
smoke signals, carrier birds, electrical signals, and electromagnetic
waves. Although modern telecommunication systems rely almost
entirely on electrical or electromagnetic signals, there are still
many applications were these technologies are not convenient or
appropriate. For example, use of electromagnetic wireless com-
munication inside networks of tunnels, pipelines, or unpredictable
underwater environments, can be very inefficient. As another
example, at extremely small dimensions, such as between micro-
or nano-scaled devices [1], electromagnetic communication is
challenging because of constraints such as the ratio of the antenna
size to the wavelength of the electromagnetic signal.
Inspired by nature, one possible solution to these problems is to
use chemical signals as carriers of information, which is called
molecular communication. For example, chemical signals are used for
inter-cellular and intra-cellular communication at micro- and
nano-scales [2], and pheromones are used for long range
communication between members of the same species such as
social insects [3]. Therefore, chemical signals can be used for
communication at both macroscopic and microscopic scales.
Moreover, molecular communication signals are biocompatible,
and require very little energy to generate and propagate. These
properties makes chemical signals ideal for many niche applica-
tions, where the use of electromagnetic signals are not possible or
not desirable.
At microscopic scales, chemical signalling has been proposed as
an effective solution for communication between engineered
micro- or nano-scaled devices [4–7] such as lab-on-a-chip devices
[8] and body area sensor networks [9]. At macroscopic scales, use
of very primitive molecular communication has been proposed in
robotics for distress signalling by defective robots [10], estimating
the size of a swarm of robots (quorum sensing) [11], and as
chemical trails for robot guidance [12,13]. There has also been
efforts on mimicking insects’ pheromonal communication [14].
Despite all this recent work, there have been few practical
demonstrations of molecular communication systems that can be
used to transfer data and messages, at either the macroscopic or
microscopic scales. For example, at microscopic scales, one of the
major obstacles in implementing molecular communication is the
tedious, laborious and expensive nature of wet lab experimenta-
tion. As a result, a large body of work on the theoretical aspects of
microscopic molecular communication systems has been devel-
oped [15–25], without any physical implementation of a fully
functional communication device. Similarly at macroscopic scales,
the potential for data communication has not been explored: the
systems we cited above use chemical markers for localization or
navigation only.
In this work, we implement a macroscopic molecular commu-
nication system for transmitting a brief text message using
chemical signals. To our knowledge, this is the first implementa-
tion of a macroscopic data communication system using chemical
signals, and it is one of very few implementations of molecular
communication at any dimension. Our system is an ideal
experimental platform for interdisciplinary researchers to gain
PLOS ONE | www.plosone.org 1 December 2013 | Volume 8 | Issue 12 | e82935

experience in the growing field of molecular communication: it is
relatively inexpensive (in the hundreds of US dollars), and compact
(fitting literally on a ‘‘tabletop’’), requiring no supporting hardware
or surrounding laboratory infrastructure. Moreover, our system
provides a demonstration platform for molecular communication
at macroscopic scales: in this form, our system could be used to
evaluate data transfer between robots, and in environments that
electromagnetic communication is not possible or desirable. Whilst
the test-bed itself is a macroscopic scale demonstration of
molecular communication, the off-the-shelf equipment can be
miniaturized easily in future generation platforms until molecular
communication at microscopic scales is achieved.
In designing this simple and robust experimental apparatus, our
vision is to provide a bridge from the rapidly growing body of
modelling and theoretical work in molecular communication, to
the practical applications that will demonstrate the transformative
power of the concept: microscopically, in medical diagnostics and
targeted drug delivery; and macroscopically, in sewer systems,
pipelines, smart cities, and disaster search and rescue operations.
This is our first contribution.
As the second contribution, we study the effects of flow on
transporting chemical signals within our platform. We generate
different types of flow using bladed and bladeless fans at different
speeds. We then analyse and report the effects of different types of
flow on overall impulse response of the system.
Materials and Methods
In this work we implement a simple, robust, cost-effective
communication system that uses chemical signals for carrying
information from a transmitter to a receiver. To test this system,
we use it to send a short text message: this is a familiar application,
as billions of Short Message Service (SMS) text messages are sent
daily by mobile users [26]. To design and develop our system, we
use the following criteria:
N The end product must be inexpensive to build. This would
make the platform readily available for many different
research and development projects with limited amount of
founding.
N The designed system must be simple and robust, much the
same as the telegraph, the ancestor of modern telecommuni-
cation systems. While we are proposing a first-generation
device, the simple and robust design would help in the
adoption of the platform in different applications.
N The developed system must be easily modifiable and
programmable. Again this is an important criterion for future
expansions and adoption to different applications.
Any communication system can be broken down into three
major parts: the transmitter, the receiver, and the channel. Figure 1
shows the block diagram representation of these three modules
and their submodules. The transmitter has some information that
it wants to transmit to a receiver. Any discrete message can be
represented with a string of binary numbers, so the transmitter
uses a source encoder to encode the information message as a
binary sequence. The transmitter can also add error-correcting
codes using the channel encoder block, which essentially
introduces redundancy by adding extra bits. The receiver can
use the added redundancy to mitigate the errors that may be
introduced by the channel. Finally, the transmitter must modulate
the channel symbols (i.e. the output of the channel encoder) onto a
carrier signal and release the signal for propagation in the channel.
The channel is the environment in which the transmitted signal
propagates from the sender to the receiver. For example, a
channel could be a wire where electrical signals propagate or air
where electromagnetic signals propagate. The channel may
introduce noise into the system, where the noise is any distortion
that results in degradation of the signal at the receiver. For
example, the noise can result from the signal fading as the it
propagates, or interference from other signals. Noise can also be
introduced by the transmitter and the receiver themselves (e.g.
thermal noise in the electronic components). When the transmitted
signal arrives at the receiver, the receiver must first demodulate
and detect the channel symbols. The estimated channel symbols
are then decoded using a channel decoder, where some of the
errors introduced by the transmitter, the channel and the receiver
may be corrected. The output of the channel decoder goes
through source decoder, where the receiver estimates what
information the transmitter has sent. If this estimation is correct,
then the communication session has been successful.
Based on these criteria, we present our design for the
transmitter, the receiver, and channel propagation in the next
couple of subsections.
Transmitter DesignThe transmitter takes an input text message from a user. It then
converts the text message into a sequence of binary bits and
modulates them on a chemical signal for propagation in the
channel. To control all transmission operations, we use the
Arduino Uno open-source electronics prototyping platform, which
is an ATmega328 based microcontroller board. For text entry, we
use the 1662 character LCD Shield Kit from Adafruit. The LCD
is an add-on module for the Arduino microcontroller board, which
also has six push buttons. We wrote a program for the Arduino
microcontroller which employs the LCD and its buttons for text
entry by the user.
To convert the text message to a binary sequence, we use the
International Telegraph Alphabet No. 2 (ITA2) standard [27],
where every letter is represented using five bits. For example, the
letter ‘‘E’’ is represented by a five bit sequence ‘‘10000’’. For
simplicity, in this work we do not use any error-correcting code.
Therefore, the five bit encoded letters are passed to the modulator
block of the transmitter for modulation and transmission to the
channel.
To modulate the channel symbols into chemical signals, we use
an electronic spray called DuroBlast made by Durotech Industries.
The DuroBlast electronic spray has a battery operated electrical
pump that can spray a wide variety of liquid chemicals that can be
stored inside its container. We designed a custom electrical switch
board that can be used to control the spray from the Arduino
Figure 1. Block diagram of a typical communication system.doi:10.1371/journal.pone.0082935.g001
Tabletop Molecular Communication
PLOS ONE | www.plosone.org 2 December 2013 | Volume 8 | Issue 12 | e82935
microcontroller board. By programming the Arduino microcon-
troller board, any type of modulation can be implemented through
controlled set of sprays. Figure 2 shows our transmitter setup with
all of its subcomponents.
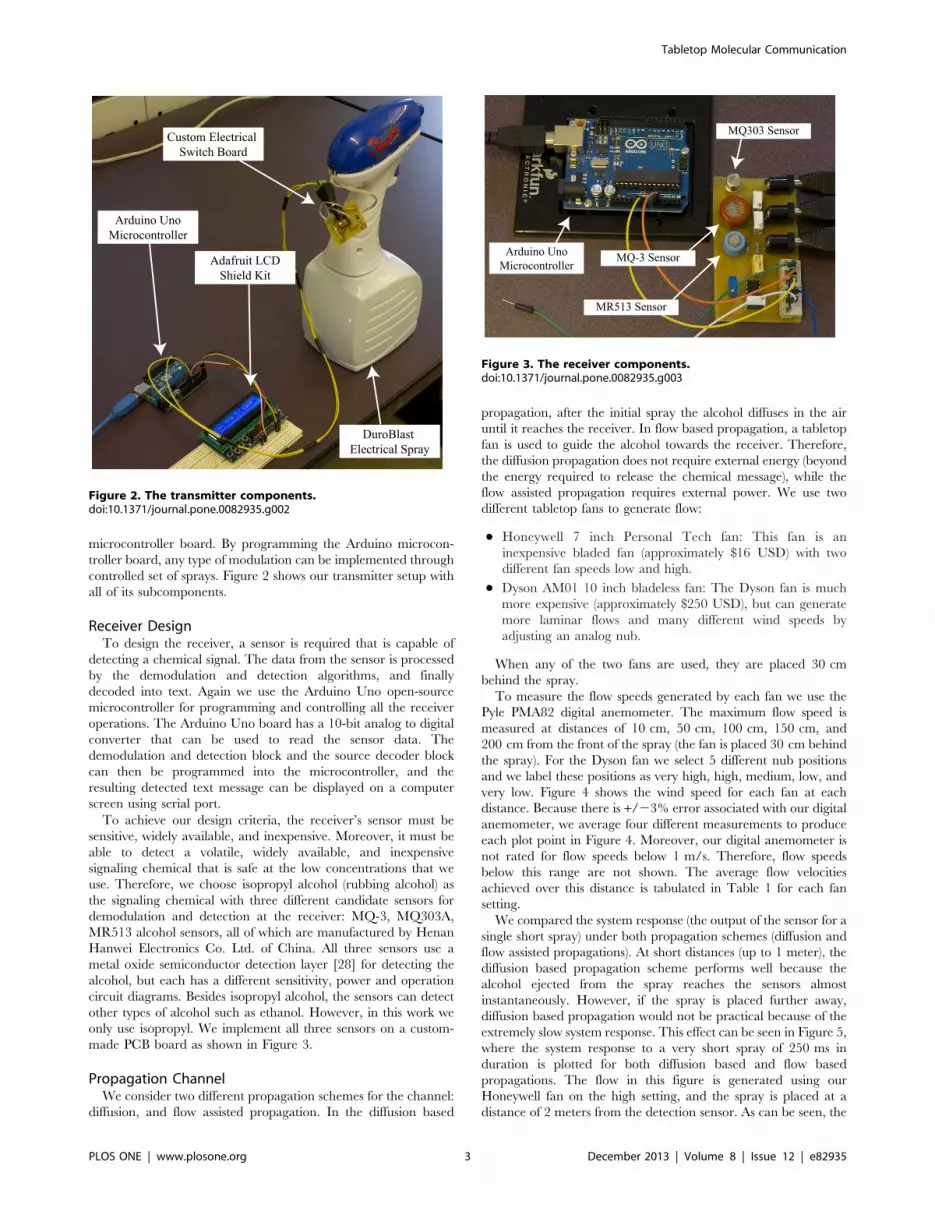
Receiver DesignTo design the receiver, a sensor is required that is capable of
detecting a chemical signal. The data from the sensor is processed
by the demodulation and detection algorithms, and finally
decoded into text. Again we use the Arduino Uno open-source
microcontroller for programming and controlling all the receiver
operations. The Arduino Uno board has a 10-bit analog to digital
converter that can be used to read the sensor data. The
demodulation and detection block and the source decoder block
can then be programmed into the microcontroller, and the
resulting detected text message can be displayed on a computer
screen using serial port.
To achieve our design criteria, the receiver’s sensor must be
sensitive, widely available, and inexpensive. Moreover, it must be
able to detect a volatile, widely available, and inexpensive
signaling chemical that is safe at the low concentrations that we
use. Therefore, we choose isopropyl alcohol (rubbing alcohol) as
the signaling chemical with three different candidate sensors for
demodulation and detection at the receiver: MQ-3, MQ303A,
MR513 alcohol sensors, all of which are manufactured by Henan
Hanwei Electronics Co. Ltd. of China. All three sensors use a
metal oxide semiconductor detection layer [28] for detecting the
alcohol, but each has a different sensitivity, power and operation
circuit diagrams. Besides isopropyl alcohol, the sensors can detect
other types of alcohol such as ethanol. However, in this work we
only use isopropyl. We implement all three sensors on a custom-
made PCB board as shown in Figure 3.
Propagation ChannelWe consider two different propagation schemes for the channel:
diffusion, and flow assisted propagation. In the diffusion based
propagation, after the initial spray the alcohol diffuses in the air
until it reaches the receiver. In flow based propagation, a tabletop
fan is used to guide the alcohol towards the receiver. Therefore,
the diffusion propagation does not require external energy (beyond
the energy required to release the chemical message), while the
flow assisted propagation requires external power. We use two
different tabletop fans to generate flow:
N Honeywell 7 inch Personal Tech fan: This fan is an
inexpensive bladed fan (approximately $16 USD) with two
different fan speeds low and high.
N Dyson AM01 10 inch bladeless fan: The Dyson fan is much
more expensive (approximately $250 USD), but can generate
more laminar flows and many different wind speeds by
adjusting an analog nub.
When any of the two fans are used, they are placed 30 cm
behind the spray.
To measure the flow speeds generated by each fan we use the
Pyle PMA82 digital anemometer. The maximum flow speed is
measured at distances of 10 cm, 50 cm, 100 cm, 150 cm, and
200 cm from the front of the spray (the fan is placed 30 cm behind
the spray). For the Dyson fan we select 5 different nub positions
and we label these positions as very high, high, medium, low, and
very low. Figure 4 shows the wind speed for each fan at each
distance. Because there is +/23% error associated with our digital
anemometer, we average four different measurements to produce
each plot point in Figure 4. Moreover, our digital anemometer is
not rated for flow speeds below 1 m/s. Therefore, flow speeds
below this range are not shown. The average flow velocities
achieved over this distance is tabulated in Table 1 for each fan
setting.
We compared the system response (the output of the sensor for a
single short spray) under both propagation schemes (diffusion and
flow assisted propagations). At short distances (up to 1 meter), the
diffusion based propagation scheme performs well because the
alcohol ejected from the spray reaches the sensors almost
instantaneously. However, if the spray is placed further away,
diffusion based propagation would not be practical because of the
extremely slow system response. This effect can be seen in Figure 5,
where the system response to a very short spray of 250 ms in
duration is plotted for both diffusion based and flow based
propagations. The flow in this figure is generated using our
Honeywell fan on the high setting, and the spray is placed at a
distance of 2 meters from the detection sensor. As can be seen, the
Figure 2. The transmitter components.doi:10.1371/journal.pone.0082935.g002
Figure 3. The receiver components.doi:10.1371/journal.pone.0082935.g003
Tabletop Molecular Communication
PLOS ONE | www.plosone.org 3 December 2013 | Volume 8 | Issue 12 | e82935

system has a quick and distinct response when flow based
propagation is employed. Although we plot the response for only
one of the sensors (MQ-3 sensor), the same effect was observed for
all the other sensors, as well as when the Dyson fan is used in place
of the Honeywell fan. Therefore, for our molecular communica-
tion setup we use flow based propagation.
Signal Modulation and DemodulationBecause communication is performed through chemical signals,
and a limited amount of signaling chemical can be stored in a
container at the receiver, the modulation and demodulation
scheme selected should minimize the amount of chemical used.
The source coding scheme for encoding text messages, presented
in previous sections, uses the least amount of ones in the 5 bit
sequence for characters that have a higher rate of occurrence in
the English text. For example, letters ‘‘E’’ and ‘‘T’’ both have a
single one in their 5 bit sequences. Therefore, we modulate the bit
1 with a single spray and we modulate the bit 0 with no spray. This
modulation scheme, which is called on-off keying, effectively
minimizes the amount of chemical used for communicating
English text.
At the receiver the demodulation is performed by measuring the
rate of change in concentration. If during a single bit’s
communication session the voltage reading from one of the
sensors is increasing (i.e. the concentration of the chemical signal is
increasing), then the signal is demodulated as the bit 1. Similarly, if
the voltage reading from one of the sensors is decreasing (i.e. the
concentration of the chemical signal is decreasing) the signal is
demodulated as the bit 0. More details regarding the detection and
demodulation process is provided later in the paper.
Communication Protocol DesignIn this section, we discuss the communication protocol between
the transmitter and the receiver, and its implementation. In
designing the protocol we use the criteria that the protocol must be
simple, asynchronous (i.e. no synchronization is required between
the transmitter and the receiver), and should work independent of
the separation distance between the transmitter and the receiver
(i.e. it should not only work for a predefined fixed distance
between the transmitter and the receiver).
Figure 4. Wind speeds generated by each fan. The Dyson fan plots are in blue, and Honeywell plots are in red.doi:10.1371/journal.pone.0082935.g004
Table 1. Average flow velocities.
Flow Generated By Average Flow Speed (m/s)
Dyson on very high 1.99
Dyson on high 1.80
Dyson on medium 1.72
Dyson on low 1.46
Dyson on very low 1.37
Honeywell on high 1.92
Honeywell on low 1.48
The average flow velocities over the distance of 200 centimeters generatedusing the Dyson and Honeywell fans.doi:10.1371/journal.pone.0082935.t001
Tabletop Molecular Communication
PLOS ONE | www.plosone.org 4 December 2013 | Volume 8 | Issue 12 | e82935

At the transmitter, the output of the source encoder (i.e. the bit
sequence representing the text message) is concatenated with a two
bit sequence ‘‘10’’ at the beginning and the null character
represented by ‘‘00000’’ at the end. The initial ‘‘10’’ indicates start
of a text message and the null character indicates the end of the
text message. For example, if the text message that is being
transmitted is the letter ‘‘A’’, the output of the source encoder is
the five bit sequence ‘‘11000’’ (where the left most bit position is
the first bit position), and transmission bit sequence is
‘‘101100000000’’. The transmission bit sequence is then modu-
lated using the scheme discussed in the previous section, where 1 is
modulated with a spray and 0 with no spray. Figure 6 represents
the flowchart of the algorithm that runs at the transmitter, and
summarizes this process.
At the receiver, there are two states: the wait state, and the
reception state. In the wait state the receiver uses its sensor to
continuously monitor the concentration of alcohol. If there is a
sudden increase in the concentration of alcohol (i.e. sudden
increase in the sensor’s voltage output), the receiver switches to the
reception state. This sudden change is caused by the initial ‘‘10’’
bit sequence concatenated to the beginning of every text message
sent by the transmitter. This sudden change can also be used as the
reference time for synchronizing each bit interval for all the bits
that would follow. Therefore, no synchronization is required
between the transmitter and the receiver in advance. Another
factor that is taken into account in this scheme is the propagation
delay. Because the receiver is triggered into reception state as soon
as the leading bit 1 is detected, the time delay caused by signal’s
propagation over the separation distance from the transmitter to
the receiver is incorporated in the reference time. Therefore, the
communication protocol is independent of the distance between
the transmitter and the receiver, and it would work even when the
distance is changed between communication sessions.
After the receiver enters the reception state, it waits for two bit
intervals until the reception of the initial ‘‘10’’ bit sequence is
finished. The receiver then demodulates and decodes the received
signal 5 bits at a time. During each 5 bit interval, the source
decoded character is displayed to the computer screen using serial
port connection. This process continues until the null character
represented by all zero sequence ‘‘00000’’ is detected. Because the
null character indicates the end of the text message, the receiver
will go back to the wait state until another text message is sent by
the transmitter. Figure 7 summarizes the algorithm that is
implemented at the receiver.
Results and Discussion
In this section we first present and discuss the impulse response
of the overall system, and present the effects of different types of
flow on the overall response. Based on these results, we choose the
most suitable sensor to be used for our communication system. We
then fine tune different system parameters such as transmission
rate, and the demodulation/detection algorithm. Finally, some of
the obtained results are presented and discussed.
Figure 5. Diffusion based propagation versus flow based propagation. The system response to a 250 ms spray 2 meters away for diffusionbased propagation (blue), and flow based propagation (red).doi:10.1371/journal.pone.0082935.g005
Tabletop Molecular Communication
PLOS ONE | www.plosone.org 5 December 2013 | Volume 8 | Issue 12 | e82935

Overall System ResponseThe overall system’s impulse response is measured by using a
very short spray that resembles the delta function from signal
processing. In the rest of the manuscript we use the terms system
response and system’s impulse response interchangeably. Many
parameters can effect the overall system impulse response. The
most notable factors that have a major effect are:
N The sensor: Each sensor has its own response to a changing
concentration. We use three different sensors and choose the
one that has the best overall response.
N The fan (flow type): Each fan has its own flow signature. We
use both an inexpensive bladed fan and a bladeless fan to
generate different types of flow at different flow velocities. The
Dyson fan can produce a more laminar flow at various
velocities.
N The spray: Although we electronically control our spray with
precise electrical signals, there are differences in the amount of
particles that are released during each trial, and the size of the
droplets in each spray stream. It is very difficult to precisely
control these parameters within an inexpensive apparatus.
Therefore, instead of precisely controlling the amount of
chemical released by the spray, we simply measure the overall
response of the system using a very short spray burst. By using
similar burst durations, we loosely control the amount of
chemicals released across different experimental trials.
There are other factors that could potentially effect the overall
system response slightly such as other flow patterns within the
room, room temperature, and humidity. To lessen the effects of
these parameters, all the experiments are performed in a closed
room with loosely regulated temperature and humidity. We
believe these precautions are enough, because other factors have a
much greater effect on the overall response.
The Effects of the Sensor. To study the effects of the sensor
on the overall response, the spray duration is set at 100 ms (i.e. the
spray is switched on for 100 ms), and the system response is
measured using each of the three sensors at various separation
distances between the transmitter and the receiver. We use this
scheme as it would be difficult to control and measure the actual
volume of alcohol released during each burst. Figure 8 shows the
system response for 2 meter separation distance (8a), and 4 meter
separation distance (8b) for all three sensors. The Honeywell fan
on the high setting is used to produce the flows for all these plots.
As expected the amplitude of the peak decreases and the delay
before the peak increases as the separation distance is doubled.
The peaks’ full-width at half max also increases as the separation
distance increases. Similar effects are also observed when the
Dyson fan is used to generate the flow.
Figure 6. Flowchart representation of the algorithm thatcontrols the transmitter.doi:10.1371/journal.pone.0082935.g006
Figure 7. Flowchart representation of the algorithm thatcontrols the receiver.doi:10.1371/journal.pone.0082935.g007
Tabletop Molecular Communication
PLOS ONE | www.plosone.org 6 December 2013 | Volume 8 | Issue 12 | e82935

From the overall system response, it is evident that there is a
large amount of noise in the MR513’s signal because of the
operational amplifier used as part of its circuitry. Although the
MQ303 has a high peak at 2 meters, the peak’s full width at half
max is much larger than the other two sensors. Ideally, this width
must be as small as possible. Moreover, the height of the MQ303’s
peak drops significantly at 4 meters. The MQ-3 sensor has low
noise and better system response over wider range of separation
distances. Moreover, the MQ-3 has the simplest circuitry and can
draw power directly from the Arduino microcontroller board.
Therefore, we select the MQ-3 sensor for our final implementa-
tion.
One of the major caveats of metal oxide gas sensors, including
all three sensors we consider in this paper, is the delays in
responding to a changing concentration [28]. These delays core
categorized as:
N The sensor’s response time, i.e., the time it takes for the sensor to
respond to a change in concentration; and
N The sensor’s resume time, i.e., the time it takes for the sensor to
be used reliably again after a change in concentration.
The change in system response based on the initial voltage
reading (i.e., initial concentration at the sensor) is another factor
affecting these sensors. This effect can be seen in Figure 9, where
the system response to a single short spray of 100 ms at the
distance of 4 meters away with different initial voltage readings
(i.e. different initial concentrations) at the sensor is plotted. The
flow in this figure is generated using the Honeywell fan on high
setting (similar results are also observed when the Dyson fan is
used for flow generation). This figure shows that the system
response changes for different initial concentration levels at the
sensor. To make sure that the sensor resume time is not effecting
the readings, we bring up the sensor to a voltage level (i.e.
concentration level) higher than the target initial voltage. We then
wait long enough for the voltage reading to drop to the target
initial voltage level, which is also long enough to abolish the effects
of sensor resume time. We then initiate the impulse spray and
measure the system response.The Effects of Flow. Flow is an important part of our setup,
because it carries the alcohol droplets from the transmitter to the
receiver. Therefore, it has a significant effect on the overall system
response. However, isolating the effects of flow can be very
challenging. For example, the spray itself cannot release very
precise amounts of alcohol with uniform droplet sizes between
different experimental trials. Another factor that could potentially
effect the results is random flows within the room. As a result, the
overall impulse response of the system changes between different
trials. This effect can be seen Figure 10, where the system response
to a 100 ms spray 2 meters away is plotted for 5 different
experimental trials. The initial voltage for each trial is kept
constant at 1.02 volts, and the Dyson fan on the very low setting is
used to generate the flow. Moreover, the sensor, the spray and the
fans are kept at the same height. From the plot it is evident that
there is some difference across the trials.
To mitigate this problem, and further isolate the effects of flow,
we perform multiple trials and average the results. We use two
performance metrics for comparing the system response generated
using different fans and flow speeds: the peak’s max to full-width at
half max (PMFWHM), and delay to peak’s max (DPM). The
PMFWHM is the ratio of the peak’s maximum voltage to the full
width of the peak at half max. The larger this ratio the taller and
narrower the peak shape will be. Ideally the peak must be as tall
and as narrow as possible. Therefore, larger ratios are desirable.
The DPM, is the time from the start of the spray to the time where
the peak’s maximum point is achieved. The smaller this time
duration, the faster the peak’s maximum is reached. It is desirable
for this delay be as small as possible.
Figure 8. Comparing the three sensors. The system response to a short spray of 100 ms for all three sensors at (a) 2 m separation, and (b) 4 mseparation between the transmitter and the receiver.doi:10.1371/journal.pone.0082935.g008
Tabletop Molecular Communication
PLOS ONE | www.plosone.org 7 December 2013 | Volume 8 | Issue 12 | e82935

As explained earlier we use two different table fans made by
Dyson and Honeywell. The Dyson fan is bladeless, more
expensive, and can create more laminar flows. The Honeywell
fan is inexpensive but it is a bladed fan and it creates more
turbulent flows. Five different fan settings are considered for the
Dyson fan, while the Honeywell fan has only two possible settings
as explained in previous sections. The average flow velocities over
a 2 meter distance are tabulated in Table 1. For each fan and each
corresponding fan setting, the overall system response to a short
spray of 100 ms, 2 meters away, is measured for 10 experimental
trials. The initial sensor voltage reading for each trial is kept
constant at about 1.02 volts (i.e. there is enough delay between
trials such that the sensor voltage falls back to 1.02 volts).
To compare the fans and their corresponding fan settings,
performance metrics, PMFWHM and DPM, are calculated for
each of the 10 trial. The results are then averaged and presented in
Figure 11. In Figure 11a the DPM is plotted for different flow
speeds generated by each fan and its corresponding fan setting. As
can be seen, the Dyson fan has a shorter DPM for the same
average flow speed because the flow generated by this fan is more
laminar compared to the Honeywell fan. Moreover, the flow speed
also decreases the delay. Finally, from the Dyson plot we can see
that this delay decreases almost linearly with increasing flow speed.
The PMFWHM is shown in Figure 11b for different fans and
setting. From the plots we can see that the PMFWHM ratio
increases as the fan speed increases. Therefore, the impulse
response becomes narrower and taller as the fan speed increases.
The Dyson fan also achieves higher ratios compared to the
Honeywell fan. Therefore, the more laminar flows that the Dyson
fan generates can create taller and narrower system response.
From these results, we conclude that the Dyson fan is a better
choice for generating flows. However, because it is more than 10
times expensive compared to the Honeywell fan, and one of our
goals is to create a cost effective demonstration of macroscale
molecular communication, for our final communication system we
use the Honeywell fan. Therefore, in our final system the
achievable transmission rates can be considered as a ‘‘lower
bound’’, and they can potentially be improved by simply using the
Dyson fan in place of the Honeywell fan.
System Nonlinearity. In this section we show that the
overall system response of our setup is nonlinear. Although finding
the exact cause of the nonlinearity is not possible, and more
extensive research is required, this result by itself is very
interesting. To show that the system is nonlinear, we consider a
set of periodic sprays, of 100 ms with a period of 2 seconds. The
output sensor voltage is then measured and recorded as the system
response. Figure 12 shows the results for both the Dyson fan on the
very high setting and the Honeywell fan on the high setting.
As can be seen in Figure 12, the output does not follow that of a
linear system. For example, between the 13 and 15 seconds mark
(the arrows in the plot point to this time duration), where there
should be another increase in concentration because of the seventh
periodic spray, there is a sudden drop in voltage. This effect is
observed for both the case where the Dyson fan is used and the
case where the Honeywell fan is used. However, there are more
clear peaks when the Dyson fan is used because of the narrower
and taller system response explained in the previous section.
Figure 9. System response for different initial voltages. The system response changes based on the initial voltage.doi:10.1371/journal.pone.0082935.g009
Tabletop Molecular Communication
PLOS ONE | www.plosone.org 8 December 2013 | Volume 8 | Issue 12 | e82935

Figure 10. The system response for different experimental trials. The flow in these trials is generated using the Dyson fan on very lowsetting. The spray duration is 100 ms, and the separation distance is 2 m.doi:10.1371/journal.pone.0082935.g010
Figure 11. Analysis of the system response for different flows. The delay to peak’s maximum is used as one performance metric (a), and thepeak’s maximum to full width at half max is used as a second performance metric (b). The results from 10 different trials are averaged to create eachpoint. The spray duration is 100 ms, and the separation distance is 2 m.doi:10.1371/journal.pone.0082935.g011
Tabletop Molecular Communication
PLOS ONE | www.plosone.org 9 December 2013 | Volume 8 | Issue 12 | e82935

The nonlinear responses observed in our experiments are
surprising, because most molecular communication systems are
normally assumed to be linear in the literature. Many of the
mathematical tools used in the literature at microscales require the
system to be linear, and these tools cannot be directly applied to a
nonlinear communication system. Although the source of nonlin-
earity is not known, some likely candidates are: the sensor with its
response and resume times, the flow generated by our fans which
may be turbulent, the spray which is not precise enough to create
uniform streams, and other environmental factors such as other
flows within the room. It may be possible for the system response
to become linear with the use of more expensive and sensitive
hardware, and within a precisely controlled environment. None-
theless, the potential nonlinearity of our system is an issue which
merits further investigation.
Final Implementation and DiscussionThe final steps of implementation are discussed in this section.
To make our system more cost effective, in our platform we use
the Honeywell fan for demonstration despite the fact that the
Dyson fan can create better system response. We also use the MQ-
3 sensor because it provides the best system response and it has the
simplest circuitry between all three sensors.
First, we address the issue of noise. Although the MQ-3 sensor
response is less corrupted by noise compared to the other two
sensors, there is still some noise present in the signal. To further
reduce this noise, 20 ms of sensor data is averaged to generate a
single sensor reading. Because the Arduino sampling rate is
observed to be about 8.33 kHz, 20 ms of sensor data contains 167
different readings which are then averaged. Therefore, in the wait
state the receiver checks consecutive 20 ms of averaged sensor
readings, and triggers a change to the reception state if the
difference between the current reading and the previous reading is
greater than 0.5 levels (because Arduino has a 10 bit analog to
digital converter the sensor reading would be an integer between 0
and 1023 representing 1024 different voltage levels, where 0
represents 0 volts and 1023 represents 5 volts).
An important communication parameter is the transmission
rate. One of the major factors that affects reliable communication
at a given transmission rate is the DPM. The DPM is in turn
affected by the flow type and the flow speed. Therefore, for our
platform the fan speed is always set to high. Another factor that
effect the transmission rate is the sensor response and resume times
discussed in the previous section. Finally, many other factors such
as the environmental noise (e.g. random flow patterns in the room)
can also effect the transmission rate.
We tried various transmission rates from one bit per 5 seconds
(a character per 25 seconds) to one bit per 2 seconds (a character
per 10 seconds). To measure the reliability at each rate, we
performed multiple experiments at different separation distances
between the transmitter and the receiver. We then classified each
transmission rate at each separation distance according to the
following ranking: very reliable (bit error rates of less than 0.01),
reliable (bit error rates of 0.01 to 0.03), unreliable (bit error rates
greater than 0.03). Table 2 summarizes the results.
Figure 12. System response to a periodic spray. The dashed lines are 2 seconds apart and show each period. The arrows show the locationwhere the sensor voltage decreases instead of increasing. The spray duration is 100 ms, and the separation distance is 2 m.doi:10.1371/journal.pone.0082935.g012
Tabletop Molecular Communication
PLOS ONE | www.plosone.org 10 December 2013 | Volume 8 | Issue 12 | e82935

At one bit per 2 seconds the transmission is unreliable at small
distances of up to 2 meters, because of the sensor’s resume time at
higher concentrations is longer. Moreover, at larger distances
(greater than 2 meters) successful communication is not possible at
the rate of one bit per 2 seconds. At the rate of one bit per 5
seconds, the transmission is very reliable over various separation
distances from 4 meters to 1 meters. Based on experiments, the
smallest transmission rate that is reliable at distances up to 4
meters is one bit per 3 seconds. At this rate over the separation
distance of 4 meters the communication session is reliable, over the
separation distance of 3 meters the communication session is very
reliable, and over the separation distance of 2 meters the
communication session is reliable. The reason that the commu-
nication channel degrades slightly as the separation distance is
decreased from 3 meters to 2 meters is because of the higher
concentration levels at the sensor, and hence longer sensor resume
times.
In the rest of this section we focus on this transmission rate (one
bit per 3 seconds), and describe in details the demodulation and
detection algorithm for this rate. Although this algorithm is slightly
different for each transmission rate, the same underlying
principal is used for detection and demodulation at all rates: the
rate of change in the concentration at the sensor. To fine tune
this algorithm a 26 bit test sequence ‘‘10101100111000
101011110110’’ is transmitted at the distance of 4 meters away,
and the sensor reading is recorded. Figure 13 plots the sensor
voltage reading during this transmission session. Dashed red lines
are used to represent the start and the end of each bit. From this
plot we devise a simple detection and demodulation scheme. The
difference between the voltage level (there are 1024 levels in the
Arduino’s 10 bit analog to digital converter) at the end of a bit
interval and the middle of a bit interval is measured. If the
difference is greater than 2.2 levels (this threshold is derived
through experimentation), the bit is detected as 1; otherwise the bit
is detected as 0.
Using this scheme, we are able to successfully transfer the test
phrase ‘‘O CANADA’’ (the name of the national anthem of
Canada) from the transmitter to the receiver. Figure 14 shows this
test phrase at the transmitter and received at the receiver. There
are a number of multimedia files accompanying this paper that
show the text entry process at the transmitter (Video S1), and
Table 2. Different transmission rates and their reliability.
Distance
Transmission Rate (bits/s) 2 m 3 m 4 m
0.2 Very Reliable Very Reliable Very Reliable
0.33 Reliable Very Reliable Reliable
0.5 Unreliable Unreliable Unreliable
doi:10.1371/journal.pone.0082935.t002
Figure 13. Received signal when a 26 bit test sequence is transmitted. Sensor reading for the 26 bit test sequence‘‘10101100111000101011110110’’ transmitted 4 meters away at the rate of one bit per 3 seconds. The dashed red lines represent the start andthe end of each bit. Honeywell fan is used to create the flow for this figure.doi:10.1371/journal.pone.0082935.g013
Tabletop Molecular Communication
PLOS ONE | www.plosone.org 11 December 2013 | Volume 8 | Issue 12 | e82935

multiple communication sessions at this transmission rate over
different separation distances (Videos S2, S3, and S4).
Conclusions and Future Work
In this work we developed the first known platform capable of
transmitting short text messages using chemical signals. Our goal
was to keep the communication protocol and algorithms simple
such that other researchers from a wide variety of different fields of
science could replicate these results. Moreover, the sensors and
equipment were chosen to be inexpensive and widely available.
Therefore, our first major contribution was the development of the
platform itself, which demonstrated the feasibility of molecular
communication at macroscales. Another purpose of this platform
was to motivate future research and bridge the gap between theory
and practice.
After carefully selecting the necessary materials for our
platform, we analysed the overall system response of our setup.
We showed that there is a linear relationship between flow speed
and the delay to system response peak’s maximum. We showed
that there is also a linear relationship between the flow speed and
the peak’s maximum to full-width at half max. Moreover, we
demonstrated that more laminar flows have narrower system
response, which is desirable.
Another major finding was the nonlinearity of our platform.
This finding is very important because most of current commu-
nication theory is based on linear systems. Although we were
unable to find the exact reason for nonlinearity, we provided some
guide posts. This motivates further study on the exact cause of the
nonlinearity in future works. If it is shown that the nonlinearity is
part of practical molecular communication systems (i.e. the
nonlinearity cannot be resolved using better equipment), new
communication theoretic work may be necessary on this topic.
In the final part of the paper, we demonstrated a practical
molecular communication system capable of transmitting short
text messages. Although high transmission rates were not achieved
in this work, the transmission rates can be significantly improved
by using better fans, more sophisticated protocols and detection
algorithms, use of multiple chemicals, use of multiple-input and
multiple-output (MIMO) communication, designing better sen-
sors, and using sensor arrays. We leave these for future study.
Supporting Information
Video S1 Text entry at the transmitter. The phrase ‘‘O
CANADA’’ is entered at the transmitter.
(MP4)
Video S2 A transmission session at 2 meter separation.The phrase ‘‘O CANADA’’ is successfully transmitted over a 2
meter separation distance, with a transmission rate of 1/3 bits per
seconds.
(MP4)
Video S3 A transmission session at 3 meter separation.The phrase ‘‘O CANADA’’ is successfully transmitted over a 3
meter separation distance, with a transmission rate of 1/3 bits per
seconds.
(MP4)
Video S4 A transmission session at 4 meter separation.The phrase ‘‘O CANADA’’ is successfully transmitted over a 4
meter separation distance, with a transmission rate of 1/3 bits per
seconds.
(MP4)
Author Contributions
Conceived and designed the experiments: NF WG AWE. Performed the
experiments: NF. Analyzed the data: NF. Contributed reagents/materials/
analysis tools: NF. Wrote the paper: NF WG AWE.
References
1. Akyildiz IF, Brunetti F, Blazquez C (2008) Nanonetworks: A new communi-
cation paradigm. Computer Networks 52: 2260–2279.
2. Alberts B, Johnson A, Lewis J, Raff M, Roberts K, et al. (2007) Molecular
Biology of the Cell. Garland Science, 5 edition.
3. Agosta WC (1992) Chemical Communication: The Language of Pheromones.
W H Freeman & Co, first edition edition.
4. Hiyama S, Moritani Y, Suda T, Egashira R, Enomoto A, et al. (2005) Molecular
communication. In: Proc. of 2005 NSTI Nanotechnology Conference. pp. 391–
394.
5. Eckford AW (2007) Nanoscale communication with brownian motion. In: Proc.
of 41st Annual Conference on Information Sciences and Systems. Baltimore,
MD, pp. 160–165.
Figure 14. Transmitted and received text message. Pictures from a communication session: (a) the text entered at the transmitter (b) the textreceived at the receiver.doi:10.1371/journal.pone.0082935.g014
Tabletop Molecular Communication
PLOS ONE | www.plosone.org 12 December 2013 | Volume 8 | Issue 12 | e82935

6. Hiyama S, Moritani Y (2010) Molecular communication: harnessing biochem-
ical materials to engineer biomimetic communication systems. Nano Commu-nication Networks 1: 20–30.
7. Nakano T, Moore M,Wei F, Vasilakos A, Shuai J (2012)Molecular communi-
cation and networking: Opportunities and challenges. IEEE Transactions onNanoBioscience 11: 135–148.
8. Farsad N, Eckford A, Hiyama S, Moritani Y (2012) On-Chip MolecularCommunication: Analysis and Design. IEEE Transactions on NanoBioscience
11: 304–314.
9. Atakan B, Akan O, Balasubramaniam S (2012) Body area nanonetworks withmolecular communications in nanomedicine. IEEE Communications Magazine
50: 28–34.10. Purnamadjaja AH, Russell RA (2005) Pheromone communication in a robot
swarm: necrophoric bee behaviour and its replication. Robotica 23: 731–742.11. Purnamadjaja AH, Russell RA (2010) Bi-directional pheromone communication
between robots. Robotica 28: 69–79.
12. Pedro Sousa ATdA Lino Marques (2008) Volatile marks for robotics guidance.In: Proceedings of the EURON/IARP International Workshop on Robotics for
Risky Interventions and Surveillance of the Environment. Benicassim, Spain.13. Sousa P, Marques L, De Almeida A (2008) Toward chemical-trail following
robots. In: Seventh International Conference on Machine Learning and
Applications (ICMLA08). pp. 489–494. doi: 10.1109/ICMLA.2008.133.14. Munoz L, Dimov N, Carot-Sans G, Bula WP, Guerrero A, et al. (2012)
Mimicking insect communication: Release and detection of pheromone,biosynthesized by an alcohol acetyl transferase immobilized in a microreactor.
PLoS ONE 7: e47751.15. MooreMJ, Suda T, Oiwa K (2009)Molecular communication: modeling noise
effects on information rate. IEEE Transactions on NanoBioscience 8: 169–180.
16. Eckford AW, Farsad N, Hiyama S, Moritani Y (2010) Microchannel molecularcommunication with nanoscale carriers: Brownian motion versus active
transport. In: Proc. of 2010 IEEE International Conference on Nanotechnology.Seoul, South Korea, pp. 854–858.
17. Nakano T, Liu JQ (2010) Design and analysis of molecular relay channels: an
information theoretic approach. IEEE Transactions on NanoBioscience 9: 213–221.
18. Mahfuz MU, Makrakis D, Mouftah HT (2010) On the characterization of
binary concentrationencoded molecular communication in nanonetworks. Nano
Communication Networks 1: 289–300.
19. Pierobon M, Akyildiz IF (2010) A physical end-to-end model for molecular
communication in nanonetworks. IEEE Journal on Selected Areas in
Communications 28: 602–611.
20. Farsad N, Eckford AW, Hiyama S, Moritani Y (2011) Quick system design of
vesicle-based active transport molecular communication by using a simple
transport model. Nano Communication Networks 2: 175–188.
21. Guney A, Atakan B, Akan OB (2011) Mobile Ad Hoc Nanonetworks with
Collision-BasedMolecular Communication. IEEE Transactions on Mobile
Computing 11: 353–366.
22. Srinivas KV, Eckford A, Adve R (2012) Molecular communication in fluid
media: The additive inverse gaussian noise channel. IEEE Transactions on
Information Theory 58: 4678–4692.
23. Farsad N, Eckford A, Hiyama S (2012) Modelling and design of polygon-shaped
kinesin substrates for molecular communication. In: Proc. of 12th IEEE
Conference on Nanotechnology (IEEE- NANO). Birmingham, UK, pp. 1–5.
doi:10.1109/NANO.2012.6322018.
24. Kim NR, Chae CB (2012) Novel modulation techniques using isomers as
messenger molecules for molecular communication via diffusion. In: Proc. of
2012 IEEE International Conference on Communications (ICC). Ottawa,
Canada, pp. 6146–6150. doi:10.1109/ICC.2012.6364816.
25. Pierobon M, Akyildiz I (2013) Capacity of a diffusion-based molecular
communication system with channel memory and molecular noise. IEEE
Transactions on Information Theory 59: 942–954.
26. O’Grady M (2012) Sms usage remains strong in the us: 6 billion sms messages
are sent each day. Forrester Blogs.
27. The International Telegraph and Telephone Consultative Comittee (CCITT)
(1988) International Telegraph Alphabet No. 2. Blue Book, Fascicle 7–1.
28. Bochenkov V, Sergee VG (2010) Sensitivity, selectivity, and stability of gas-
sensitive metal-oxide nanostructures. Metal Oxide Nanostructures and Their
Applications: 31–52.
Tabletop Molecular Communication
PLOS ONE | www.plosone.org 13 December 2013 | Volume 8 | Issue 12 | e82935


