Embed Size (px)
Citation preview

Targeting Bene®ts for Electoral Gain:Constituency Marginality and theDistribution of Grants to English
Local Authorities
HUGH WARD
University of Essex
AND PETER JOHN*
University of Southampton
We model the spatial allocation of resources over constituencies as an optimization
problem in which governing parties face uncertainty about voter preferences, but seek
to increase their chances of getting re-elected. We show that a rational government
should allocate extra resources to marginal constituencies and especially favour
opposition-held marginals. We test this hypothesis on data about central government
grants to larger English local authorities. We consider whether Conservative con-
trolled and `¯agship' local authorities also bene®t. Our empirical results suggest that
the government allocated around £500 million more to local authorities containing
marginal constituencies and around £155 million more to `¯agship' local authorities
than they could have been expected to get on the criteria of social need and
population.
The idea that politicians design policies to win votes is central to contemporarypolitical science. The consequence of this simple idea is the profusion of theor-etical and cross national empirical work on spatial models of party competitionand political business-cycles. It is also possible, however, that politicianscompete for votes in ways which are not so readily observable, but are no lessimportant. When a party can gain power by winning a small number ofmarginal seats and where a small swing of the vote can change the outcome,political leaders may try to allocate bene®ts towards electorally vulnerable orwinnable areas. Indeed, the use of distributive politics for political ends may bemore advantageous than manipulating the economy. Governments risk their
#Political Studies Association 1999. Published by Blackwell Publishers, 108 Cowley Road, Oxford OX4 1JF, UK and 350 MainStreet, Malden, MA 02148, USA.
Political Studies (1999), XLVII, 32±52
* We thank Rita Hale of Rita Hale Associates, London and the Association for MetropolitanAuthorities (now Association for Local Government) for supplying the data. We are grateful toGeorge Boyne, John Gibson, David Halpern and David Sanders for written comments. We thankJohn Preater for ideas on the modelling and Sue High for advice on the statistical tests. We alsothank participants both of the Department of Political Science and International Studies seminar,Birmingham University, who heard the paper on 16 November 1995, and of the Political StudiesAssociation Rational Choice Group meeting, 23 January 1996 for their reactions. We are alsograteful to Carol Ward for help in the preparation of the data.

reputation for good economic management when they in¯uence the macro-economic aggregates to maximize short-run electoral gain. The executive'sfuture freedom of decision in economic policy may be curtailed if a re¯ationarypolicy triggers a price-wage cycle which has to be damped down in later years.1
While room for manoeuvre on the macro economy has always been limited byinternational economic competition,2 the globalization of ®nancial marketsduring the 1980s further limits the possibilities for creating a pre-election boomby a tax cut and the reduction of interest rates. Instead, governments may preferpolicy instruments that do not disturb macro-economic aggregates but winelections by redistributing bene®ts.3 The tactic may also avoid the need to adoptpolicies which are widely supported among the electorate as a whole but areinconsistent with the policy preferences of the party elite.
Empirical studies of the political determinants of grant distribution generallyassume rather than demonstrate that it is rational to direct resources towardsmarginal constituencies.4 Johnston, for example, argues that the incentive forcompetitive parties to please the median voter is stronger in marginal con-stituencies,5 but he fails to model the constraints on the total resources that canbe distributed.6 There is no study which shows that distributing resources tomarginals is a solution to a well-de®ned problem of constrained vote maxim-ization.7 Yet we demonstrate below that such a distribution is rational within astylized model of Westminster-style political systems. In contrast to the assump-tion in the empirical literature that the relationships between marginality andbene®ts are continuous and linear, we predict a discontinuous relationshipbetween seat marginality and bene®ts. Counter-intuitively, we show that thegovernment favours marginals held by the opposition parties.
We test our model with data on central government grants to UK localauthorities. The key feature of the system is the centralization of power inWhitehall in the hands of government ministers, such as the Secretary of Statefor the Environment and the Ministers of State for Wales, Scotland and
1 K. Shultz, `The politics of the political business cycle', British Journal of Political Science, 25(1995), 85±7.
2 J. Alt, `Political parties, world demand and unemployment: domestic and international sourcesof economic activity', American Political Science Review, 79 (1985), 1016±40; R. C. Bryant, Moneyand Monetary Policy in Interdependent Nations (Washington DC, Brookings, 1980).
3 See the critique of business cycle models by M. S. Weatherford, `An Agenda Paper. Politicalbusiness cycles and the process of economic policymaking', American Politics Quarterly, 16 (1988),99±136 and the review A. Alesina, D. Cohen and N. Roubini, Macroeconomic Policy and Electionsin OECD Countries, NBER Working Paper no. 3830 (Cambridge MA, National Bureau ofEconomic Research, 1991). The more precise modeling of the business cycle of Schulz is consistentwith the line of argument presented here.
4 R. J. Johnston, `The aggregation of federal money in the United States: aggregate analysis bycorrelation', Policy and Politics, 6 (1978), 279±97; J. N. Reid, `Politics, Program Administration,and the Distribution of Grants-in-aid: a Theory and a Test', in B. S. Runquist (ed.), PoliticalBene®ts (Lexington MA, Lexington, 1980); H. Raimond, `The political economy of state inter-governmental grants', Growth and Change, 14 (1983), 17±23.
5 R. J. Johnston, Political, Electoral and Spatial Systems: an Essay in Political Geography(Oxford, Oxford University Press, 1979), pp. 86±7.
6 A. Downs, An Economic Theory of Democracy (New York, Harper-Row, 1957), p. 52.7 The closest is G. Wright, `The political economy of New Deal spending: an econometric
analysis', Review of Economics and Statistics, 56 (1974), 30±8 who models the distribution ofresources to US states. He uses, though does not solve, a constrained maximation model to createan index of the vote `productivity' of a given amount of public spending in a state. We solve theconstrained maximization problem Wright considers prohibitive.
HUGH WARD AND PETER JOHN 33
#Political Studies Association, 1999

Northern Ireland. Local authorities do raise some revenue through local taxa-tion. However, about 80 per cent of local authority expenditure is now fundedfrom national government, most of which is determined by a centrally decidedformula which distributes the revenue support grant. Although there is stillsome local ®nancial discretion, central government has the power to limit thetotal amount local authorities spend and, to a large extent, to determine howthe money is spent. Grants to local authorities are about a quarter of totalpublic expenditure, so they are big enough to ensure that small adjustments totheir distribution create large di�erences in the spending opportunities oflocal authorities and thus to the services delivered to citizens or to the level oflocal taxation. Other forms of government expenditure, for example transferpayments made under national welfare programmes, are governed by uniformeligibility criteria which are di�cult to adjust to favour marginal constituencies.It is thus plausible to suggest that the UK national government adjusts its®nancial allocations to local authorities for electoral advantage.8
There already exists some support for the hypothesis. Despite the conventionthat the determination of central government decisions follows publicly agreedde®nitions of the need for local services generated through a process of debatebetween central and local government and interest group consultation,9 there issome limited evidence that political variables enter into central grant alloca-tions.10 Moving beyond central allocation of grants to local authorities, govern-ments target economic resources and avoid policies which have adverseeconomic ± particularly employment ± impacts in electorally vulnerableseats.11 Other political factors may also enter the geographical distribution ofresources. `Flagships' ± local authorities which are exemplars of the Toryphilosophy of e�ciency and the application of market forces at local level ± areimportant for the Conservatives to win. They also in¯uence national elections asvoters in constituencies with ¯agship local authorities have electorally rewardedthe government.12 The ¯agship London municipality Wandsworth received afavourable grant allocation so it could deliver a low local tax in 1990 and insubsequent years.13 There is also a folk wisdom in local government that centralgovernment favours councils of its own party.14 US evidence suggests that, as
8 R. J. Johnston, Political, Electoral and Spatial Systems, p. 116.9 T. Travers, The Politics of Local Government Finance (London, Allen and Unwin, 1986), pp. 42±
50.10 R. Bennett, Central Grants to Local Government (Cambridge, Cambridge University Press,
1982); R. Bennett, `The ®nancial health of local authorities in England and Wales 1974/5±1980/1',Environment and Planning A, 14 (1982); Audit Commission, Passing the Bucks: the Impact ofStanding Spending Assessments on Economy, E�ciency and E�ectiveness (London, Audit Commis-sion, 1993), Vol. 2, Appendix 4.
11 R. J. Johnston, Political, Electoral and Spatial Systems, ch. 6, especially pp. 109±21. The classicexample is the announcement of Mrs Castle, Minister of Transport, shortly before the Hull Northby-election, that constituents `could have a Humber Bridge', The Times, 19 January 1966, p. 8. Theconstituency swung 4.5 percentage points to the Labour government.
12 J. Curtice and M. Steed, `Appendix 2: the results analysed', in D. Butler and D. Kavanagh(eds), The British General Election of 1992 (Basingstoke, Macmillan, 1992), p. 331.
13 K. Dowding, P. Dunleavy, D. King and H. Margetts, `Rational choice and community powerstructures', Political Studies, 43 (1995), p. 268.
14 For example, it was rumoured that, when the leader of the Labour group on Brent Londonborough council inherited the leader of the Conservative group's computer, he discovered the old®les contained letters of thanks to Conservative ministers for rigging the grant system in Brent'sfavour to win the 1994 local elections (The Guardian, 24 July 1995).
34 Targeting Bene®ts for Electoral Gain
#Political Studies Association, 1999

well as the `pork barrel' e�ect, various forms of geographic manipulation ofresources also occur, both at federal and at state levels.15
The Model
The model is a probabilistic one in which the government faces uncertaintyabout voter intentions but seeks to improve its chances of re-election.16 Theunderlying assumptions are:
(i) governments are interested in national-level electoral success, not insuccess in local elections;
(ii) by targeting grant allocations to local authorities, the government cansteer resources to the constituencies in which parliamentary legislatorsare elected;
(iii) governments seek to distribute grants to maximize the number of seatsthey expect to win in national-level elections in which two partiescompete under simple majority rule at constituency level.
Discretionary resources are those that can be allocated at will by centralgovernment by ®ne-tuning the grant allocation formula. A constituency mayalso get a non-discretionary allocation of resources that the government cannotre-distribute at will. It is further assumed that:
(iv) there is an upper limit on the amount of resources that government canallocate to local authorities in a discretionary way, based on the increas-ing probability the media would detect manipulation, thus creating adamaging political reaction;
(v) local authorities translate extra discretionary grants into extra expendi-ture or lower local taxation;
(vi) the electorate is aware of this extra expenditure or lower taxation andrewards the government at the next general election.
Let the number of constituencies be N and assume each constituency has thesame number of voters n. Let pi be the probability that a randomly chosenvoter in constituency i votes for the opposition and �1 ÿ pi� the probability thatshe votes for the government, 05 pi 5 1. Then suppose that the maximumresources that central government can allocate in a discretionary way is C anddenote the discretionary allocation to the i-th constituency by ci. Assume pi �pi;0 ÿ kci where: pi;0 is the prior probability that a voter in constituency i votesfor the opposition if no discretionary resources are allocated to constituency i;pi is the posterior probability after any discretionary resources have beenallocated; k4 0, so that posterior probabilities are a linear decreasing functionof discretionary resources assigned; and k is su�ciently small to ensurethat pi ÿ kC4 0, so that even if all the available discretionary funds are
15 R. J. Johnston, `The aggregation of federal money in the United States: aggregate analysis bycorrelation'; J. N. Reid, `Politics, program administration, and the distribution of grants-in-aid: atheory and a test'; H. Raimond, `The political economy of state intergovernmental grants';R. Sylves, `Objective Need Versus Political Interference: the Administration of the New York StatePure Waters Program', in B. S. Runquist (ed.), Political Bene®ts (Lexington MA, Lexington, 1980);G. Wright, `The political economy of New Deal spending: an econometric analysis'.
16 P. J. Coughlin, Probabilistic Voting Models (Cambridge, Cambridge University Press, 1992).
HUGH WARD AND PETER JOHN 35
#Political Studies Association, 1999

allocated to the i-th constituency, it is not certain that voters will vote for thegovernment.17
The government wins the constituency if the number of voters voting for theopposition is less than or equal to w, where w is the next integer below n/2. Theprobability that the government wins the i-th constituency is the probability thatthe number voting for the opposition is less than or equal to w. Assuming thatthe voters' behaviour can be treated as statistically independent, this is given bythe cumulative distribution function for the binomial distribution:Xw
r�0
nr
� �pri �1 ÿ pi�nÿr
where the terms being summed are the probability that r out of the n voters votefor the opposition. The expected number of constituencies the government willwin ± which forms the objective function that the government is trying tomaximize ± is: XN
i�1
Xwr�0
nr
� �pri �1 ÿ pi�nÿr
The constraints facing central government are:
C ÿXNi�1
ci 5 0
and:ci 5 0 for all i:
It is extremely di�cult to work directly with this objective function, but by usingthe normal approximation to the binomial distribution, most of the problemscan be avoided. Where n is large (as is the case for constituencies averaging65,000 voters in the UK) and pi is not near one or zero, as is plausibleempirically, the normal approximation to the binomial is excellent.
Predictions from the Model
The prior marginality of constituency i is higher the lower the value of j pi;0 ÿ1=2j i.e. the closer the expected outcome before any allocation of discretionaryresources is to a ®fty-®fty split of the vote between the two parties. Similarly, theposterior marginality of a constituency is higher the lower the value ofjpi ÿ 1=2j. We call i an opposition constituency if pi;0 5 1=2 and a governmentconstituency if pi;0 4 1=2.
We show in an appendix available as hypertext that if at least threeconstituencies get a non-zero amount of discretionary resources, necessaryconditions for an allocation to maximize the expected number of seats won bythe government are:
(i) all of the discretionary resources are distributed;
17 Assuming that pi is linear in ci is mathematically convenient and a reasonable approximationto the more plausible assumption that there are diminishing returns to increased discretionaryspending, so long as ci is relatively small and the e�ect of such spending is not that great.
36 Targeting Bene®ts for Electoral Gain
#Political Studies Association, 1999

(ii) if i and j are any pair of constituencies getting non-zero discretionaryresources, then pi � pj ± that is the constituencies end up with the sameposterior probabilities of government success (Theorem 1);
(iii) if an opposition constituency i gets no discretionary resources, neitherwill any opposition constituency j such that pi;0 4 pj;0 ± that is j's priormarginality is lower than i's (Theorem 2);
(iv) if a government constituency i gets no discretionary resources, neitherwill any government constituency j such that pj;0 4 pi;0 ± that is j's priormarginality is lower than i's (Theorem 3);
(v) if i is one of the government constituencies with the lowest priormarginality among those that receive discretionary resources and j is oneof the opposition constituencies with the lowest prior marginality amongthose that receive discretionary resources, any constituency k such thatpi;0 4 pk;0 4 pj;0 will also receive discretionary resources (Theorems 2and 3);
(vi) if a government constituency gets discretionary resources, so does anyopposition constituency of equal prior marginality (Theorem 4).
The predictions are represented in Figure 1. There will be a linear increasingrelation between pi;0 and ci for all constituencies getting discretionary resources;but no other constituency will get anything. Marginal opposition constituencieswill tend to be favoured.
Figure 2 shows the probability that the government wins the i-th seat as afunction of pi.
18 As ci increases, pi falls. If pi;0 is near 1, the government gainslittle advantage from a given small increment to ci. However, for pi;0 near to 1/2,that increment yields a much bigger advantage. Finally, as pi;0 gets smaller still,the additional advantage from that increment diminishes once again. Thusbigger gains are made by spending a unit of resource when pi;0 is near 1/2, thatis in marginal constituencies. Now compare government marginal i andopposition marginal j with equal prior marginalities. The advantage of spend-ing a unit of resource in j is greater than it is in i because for small shifts in pthere are increasing returns to investing in j but decreasing returns to investing ini, given the shape of the function. It might seem most plausible that thegovernment would preferentially allocate resources to its own marginals as theseare more likely to be won, but the model shows that this is not rational as greaterinitial gains in terms of expected numbers of seats won can be made by spendingunits of resource on opposition marginals.
The Applicability of the Model
The underlying assumptions of the model can be questioned. For instance,many political scientists ®nd the Downsian assumption of pure o�ce seekingimplausible.19 UK governments may give some weight to local elections (though
18 For clarity the graph is plotted for n � 25. With the values of n observed empirically therelationship has the same general sort of shape but is very close to the discontinuous function whichtakes on the value of 1 for pi 5 1=2 and zero for pi 4 1=2: by the strong law of large numbers, as ngoes to in®nity the proportion of voters voting for the opposition will go to pi , so that within®nitely large constituencies, the government can expect to win with certainty if pi 5 1=2.
19 L. Lewin, Self-Interest and Public Interest in Western Politics (Oxford, Oxford University Press,1991); L. Witman, `Candidate motivation: a synthesis of alternative theories', American PoliticalScience Review, 77 (1991), 142±57.
HUGH WARD AND PETER JOHN 37
#Political Studies Association, 1999

ci
Pi, 0 Piand
posterior marginalityof all constituenciesgetting resources
1/2
most marginal governmentconstituency to get noresources
most marginal oppositionconstituency to get noresources
government constituencies opposition constituencies
Figure 1. Prior Marginality and the Distribution of Resources if the Necessary Conditions for an Optima are Met
38
Targetin
gBene®ts
forElecto
ralGain
#Politica
lStudies
Asso
ciation,1999

these are mainly determined by national factors). Because of imperfect overlapbetween constituencies and local authority boundaries, ministers' ability to steermoney to constituencies by allocating it to local authorities may be imperfect(though they may follow simple standard operating procedures, subject tobounded rationality).
We assume that the government does not take account of the possibleresponses of the opposition when making decisions so that the problem is notmodelled as a game. In the UK ®nancial control of local authorities is in thegovernment's hands. The opposition party cannot counter central governmentgrant allocations by steering grants itself as it has no control over the nationalbudget in a parliamentary system. While both the government and the opposi-tion have other resources which they can bring to bear to mobilize votes atconstituency level,20 decisions over grant allocation are made in the institu-tionally distinct forum of Whitehall. We assume that this is insulated enoughfrom bureaucracies controlling other relevant resources, such as party head-quarters, to sanction treating the grant allocation problem as one of parametricoptimization.
In the UK the number of voters and turnout varies between constituencies,whereas we have assumed that all constituencies are of size n. This means that
1
1/2
1/2Pi,0 Pj,0 1p
0
The probability that the voter will vote for the opposition
The
prob
abil
ity
that
the
gove
rnm
ent
win
sth
eco
nsti
tuen
cy
Figure 2. The Probability of Winning a Constituency as a Function of theProbability that a Voter Votes for the Opposition
20 P. Whiteley, P. Seyd and J. Richardson, True Blues (Oxford, Oxford University Press, 1994),pp. 189±218; E. A. Fieldhouse, C. J. Pattie and R. J. Johnston, `Tactical voting and party con-stituency campaigning at the 1992 general election', British Journal of Political Science, 26 (1996),403±39.
HUGH WARD AND PETER JOHN 39
#Political Studies Association, 1999

central government can obtain a bigger return by reducing pi;0 by a givenamount when ni is lower. However, although constituencies range in size fromaround 40,000 to around 80,000, most are quite close to the mean size. Localvariation in turnout is low, although some small inner-city seats stand out. It iseasily shown that the relationship shown in Figure 2 is not very responsive to niexcept for values of pi close to zero and 1. Prior probabilities of voting for thegovernment's major challenger in a seat are seldom anywhere near 1 or 0; and itis implausible that enough resources could be used to shift the posterior valueinto the regions where changes in ni have a big e�ect. Thus the relationship inFigure 2 does not di�er dramatically because of di�erences in ni.
A second assumption is that it costs the same for a given reduction in p in allconstituencies ± that is k is the same in all constituencies. If this were not true,the e�ects on the predictions would be the same as for the variation in n acrossconstituencies. There is known to be variation in the cost of provision of localauthority services due to factors like higher labour costs in London and sparseor dispersed population. However, such variations cancel each other out asmany services are impure public goods subject to crowding which ensurebene®ts per voter di�er. In any case, the non-discretionary aspect of the needsgrants is designed to wipe out these e�ects.
The high third-party vote in some seats appears to violate the formal conditionthat the model works only in two-horse races. However, the model applies to thetwo main contenders in a seat so long as: one of them is the government; the voteshares of third-party and other candidates are una�ected by the way grants aredistributed and turnout is una�ected by the way grants are distributed. Then thetwo main contenders compete for a ®xed vote-total. Whichever party gets amajority of the total obtains a plurality of the overall vote.
Operationalization and Testing
The data set concerns the 108 larger English local authorities in England forthe ®nancial year 1994/95.21 We focus on London boroughs, metropolitandistricts and shire counties because much larger sums of money are allocatedto them than to lower-tier authorities and because they control politicallysensitive functions, such as education and social services. We justify the Englishfocus because the basis of calculating central government grants is di�erentin Scotland, Wales and Northern Ireland which would require multilevelmodelling. The ®nancial year is the point in the electoral cycle when thegovernment has the opportunity to seek to in¯uence the marginals. Govern-ments would ®nd it hard to target spending fully to the newmarginals in the yearjust after a general election, the ®nancial year 1993/94, but would be ablefor 1994/95, which would permit the targeted spending to accumulate over1995/1996 and 1996/1997 and would allow the resulting local spending/taxdecisions to be perceived by the electorate.
Central funding comes under two major headings, although there are alsosmaller speci®c grants.22 First, there is the authority's share of the national nondomestic rate, NNDR. The national non-domestic rate is a property tax onbusiness which is levied locally but redistributed by central government on the
21 The dataset is available from either of the authors.22 Passing the Bucks, Vol. 1, p. 5.
40 Targeting Bene®ts for Electoral Gain
#Political Studies Association, 1999

basis of the authority's resident population in the 1991 census, POP, thenadjusted according to the functions di�erent types of local authorities perform.Second, there is the authority's revenue support grant, RSG. Since the reformsof 1990, the accounting identity used by central government to calculate theRSG for the i-th local authority is:
RSGi � NNDRi � SSAi ÿ k*TAXBASEi
SSA is the authority's standard spending assessment, a ®gure calculatedaccording to a known formula aggregating measures of spending need, which issaid to ensure that each local authority can tax at the same level and provide astandard level of service. TAXBASE is a measure of the authority's taxbase forthe locally levied council tax. k is a constant balancing the two sides of theidentity. The lower an authority's TAXBASE the higher its RSG. There is nopolitical incentive to raise NNDR because when NNDR goes up by a pound,RSG goes down by the same amount. Political in¯uences might increase SSA orlower TAXBASE, each of which implies a higher RSG.
The RSG is heavily in¯uenced by POP because expenditure in relation tomost local authority functions goes up with population. It is also important tocontrol for POP because there is a positive association between the variables weuse to capture the marginality e�ect and population. Failure to control for POPmight lead to spurious ®ndings about political e�ects, as has been suggested isthe case in relation to other research on the impact of political variables on localgovernment ®nances.23 To allow for possible economies of scale in providingpopulation-related services we also control for the square of the population,POPSQ, in the basic model.
The second set of variables we control for are the services the authority carriesout. London boroughs and metropolitan districts are unitary authoritiesresponsible for the whole range of functions carried out by local government.In contrast, shire counties are not responsible for services such as rubbishcollection and the control of public housing for rent. These functions are carriedout by second-tier district authorities. In order to capture functional di�er-ences and geographical cost di�erentials we created the following dummies:UNITARY � 1 for unitary authorities and 0 otherwise; LONDON � 1 forLondon boroughs and 0 otherwise; SHIRE � 1 for shire counties and 0 other-wise.
The third set of variables we control for are measures of the need for theservices. For example, the higher the level of deprivation locally, the larger theneed for locally provided social services; and the younger the local population,the greater the need for educational provision. A battery of such variables areknown to enter the calculation of the SSA.
As the variables that enter the formula for the calculation of the SSA areknown, the way to proceed might seem to be to include all of them in aregression with the political variables added in afterwards to test for signi®cante�ects. This method, however, would inevitably ®nd that political factors haveno in¯uence. The reason is that it reproduces the formula for the SSA. Wecontend that if political factors are at work, it is through their in¯uence on
23 J. Gibson, `Bureaucratic power and public policies: a critique of a test of the rational sta�maximisation hypothesis', Political Studies, 38 (1990), 330±4; J. Gibson, `Bureaucratic power andpublic policies: a rejoinder to Boyne', Political Studies, 39 (1991), 558±9.
HUGH WARD AND PETER JOHN 41
#Political Studies Association, 1999

variables included (and excluded) from this formula and/or the coe�cientswhich weight the various factors. Where the formula is open to public scrutinyand the constitutional norm is that grants should not be a�ected by politicalfactors, it is inevitable that if the formula is being rigged, it is through ®ne-tuning of the functional form and/or coe�cients, not simply through visiblehandouts to politically important authorities. Thus, if we followed the obviousprocedure, political factors could remain hidden either in the coe�cients of thevariables or in the set of variables entering the equation.
It is possible, however, to build a robust statistical model of the SSA withoutreproducing the formula. Local authorities provide or enable other organiza-tions to provide, services including education, social welfare, housing andtransport. There are underlying needs for these services that enter the calculationof the SSA through a political `®lter'. First, some needs are ®ltered out, becausecentral government does not wish to see them catered for by local authorities.Second, the measures of needs are subject to amendment before they enter thecalculation of the SSA. We use factor analysis to obtain scores on underlyingneed variables for all the cases, deriving from a number of possible indicators,many of which are highly correlated. The details of the procedure adopted aregiven in the appendix. FAC1 gives the factor scores for the cases on the ®rstfactor which re¯ect the age-structure of the population, low scores indicating anaged population. We expect this variable to have a U-shaped, quadraticrelationship with SSA: low-scoring local authorities with a large aged populationwould have greater social-services needs; high scoring authorities with a youngpopulation would need to spend more on education; authorities in the middle ofthe scale would spend less under both these headings. To model this relation wealso included the square of FAC1, FAC1SQ. FAC2 gives the factor scores for thecases on the second factor which re¯ects deprivation. FAC3 gives the factorscores for the cases on the third factor which re¯ects inner-city deprivation.
Operationalizing the political variables presents problems. The formal modelsuggests a discontinuous `triangular' relationship between seat marginality andthe distribution of discretionary resources, as shown in Figure 1. The modeldoes not suggest where the cut-o� points ± between which constituencies getdiscretionary resources ± lie. Although it is possible to make predictions aboutthis by developing the model further than we have done in this paper, there islittle point in doing so since the expressions derived depend on the total level ofdiscretionary resources, and we have no means of measuring or even proxyingfor this. We assume that the government uses its vote share and that of its largestrival in the last election to estimate pi;0 by p̂i;0, where p̂i;0 is the vote share of therival divided by the sum of its vote share plus that of the Conservatives.24
24 Governments could calculate p̂i;0 by adjusting the marginality score in the last electionaccording to current opinion polls. However, it is unlikely that the government would pay as muchattention to current opinion polls when making these decisions. First, they would re¯ect the mid-term unpopularity su�ered by most governments, which could be expected to have worn o� by thedate of the next election. Second, it is di�cult to re-calculate marginality given the current tendencytowards non-uniform swings. The Boundary Commission which was due to report in Englandin December 1994, did not actually report on time. Nevertheless, it is possible that the governmentgot wind of the e�ects of the boundary changes on the list of 10 per cent marginals in time to e�ectthe grant allocation. Using C. Rallings and M. Thrasher, The Media Guide to the New Parliament-ary Constituencies (London, Local Government Communications, 1995) which calculates margin-ality after the boundary changes, based on ward-level data from the 1992 elections, we found thatthe overall e�ects were not consequential for this study. If there is a relevant boundary change, say a
42 Targeting Bene®ts for Electoral Gain
#Political Studies Association, 1999

Conventionally a marginal is a seat which would change hands with a 10 percent or less swing from the last election in 1992.25 The `10 per cent marginals' wefocus on thus have values of p̂i;0 between 0.45 and 0.55.
A second problem is that these local authorities contain several constituenciesand often more than one 10 per cent marginal. There is nothing to guaranteethat a discretionary pound steered towards a particular authority is certain to bespent in a way that only bene®ts voters in marginal constituency it encloses thatthe government wants to target. For one thing many services are public goodsthe bene®ts of which inevitably spillover from one area to another. Faced withthis problem it is only possible for the government to approximate the sort ofideal distribution of discretionary resources over constituencies predicted by ourmodel. We assume that the way that this is done is by making the total amountof discretionary resources that the government allocates to a local authority thesum of the discretionary resources it wishes to allocate to each constituencycontained within the local authority boundary.26 We calculate the averagemarginality score of a local authority, MARG, in the following way: count thenumber of 10 per cent marginal constituencies within the local authority'sboundary; multiply this number by the average value of � p̂i;0 ÿ 0.45� for these10 per cent marginals to get MARG. The discretionary resources allocated to alocal authority should then be a linear increasing function of MARG, such thatits value is zero when MARG is zero.27 So the hypotheses are that the SSAvaluefor an authority should be linearly increasing with MARG and/or itsTAXBASE should be linearly decreasing with MARG.
There are two other political factors that might lead to an authority beingfavoured, as mentioned above: whether or not the government controls the localauthority and whether or not the local authority is a government ¯agship. Wecode each local authority 1 on the variable LOCCON if Conservative coun-cillors had a majority in 1994/5, 0 if no party or other group had a majority; and
new constituency is a successor to an old one if more than 50% of its electorate comes from the oldone. Of the 114 10% marginals we identify, in only 14 cases was there no identi®able successor suchthat it was also a 10% marginal on Rallings and Thrasher's ®gures. Excluding these cases, thechange was under 20% on Rallings and Thrasher's index for around 3/4 of our 10% marginals. Wecould only identify three `new' 10% marginals, with less than 50% of the electorate coming fromany one old constituency.
25 As de®ned by The Times Guide to the House of Commons (London, The Times, 1992) p. 279.26 Six constituencies straddled the boundaries of relevant local authorities. However, as none of
these were 10% marginals, the calculation is una�ected. Although the suggested distribution acrosslocal authorities is not mathematically ideal, it is not arbitrary. Suppose that the probability that adiscretionary pound allocated to a local authority will be spent in a way that bene®ts a certainconstituency is equal to the proportion of the total population of the authority living in thatconstituency. Then the statistically expected amount going to constituency I will be a linearlyincreasing function of ci. The mean number of 10% marginals located within the local authoritieswe are dealing with is one, 36 of the 65 authorities containing one or more 10% marginal havingthis number. In such cases: the expected amount going to the single 10% marginal is directlyproportional to ci ; across such local authorities the ratio of the expected distribution to marginalscorresponds to the theoretical ideal. Out of the 65 authorities containing 10% marginals, 16 wereTory controlled and 39 hung. In the ®rst group it is possible that discretionary resources could betargeted to favour the appropriate constituencies; and Tory councillors might exert some in¯uenceof this sort even in hung local authorities.
27 For the 10% marginals ci is linearly increasing in p̂i;0; so the amount allocated to the localauthority should be a function of the number of 10% marginals and the average level of� p̂i;0 ÿ 0.45�.
HUGH WARD AND PETER JOHN 43
#Political Studies Association, 1999

ÿ1 if some party or group other than the Conservatives had a majority. Thelocal political control hypothesis suggests that high scores on LOCCON shouldassociate with higher SSAs and/or lower TAXBASE values. FLAG is a dummyvariable coded 1 for the following Tory ¯agship local authorities: the Londonboroughs of Wandsworth and Westminster; the county councils of Kent andLincolnshire; and the metropolitcan districts of Solihull and Tra�ord. We codeall other authorities 0.28
We argue that functional di�erences between unitary authorities and shiresand cost di�erentials between di�erent types of authority a�ect the waypopulation and need variables impact on the SSA. Similarly political factorsalter the way that need factors and population enter the formula. This suggeststhe statistical model should include interactions to capture these e�ects. Table 1lists the interactions that turn out to be relevant.29
First, we carry out ordinary least squares regressions of SSA on POP,POPSQ, FAC1, FAC1SQ, FAC2 and FAC3. All these variables prove signi®-cant with the theoretically-expected signs. The second stage of model buildingchecks for the signi®cance of interactions between these variables and for thedummies of local authority type. UNITARY4 and SHIRE1 are signi®cant andhave substantive interpretations. The third stage adds political interactionterms. Because of high inter-correlations between some interactions and thelarge number of possible political interactions, this has to be done carefully.There are four criteria: high correlations between an interaction and theresiduals from the second-stage model; theoretical interpretability and plausi-bility; lack of problems with multicollinearity in the ®nal model; statisticalsigni®cance of all the interactions included in the ®nal model. We then introduceMARG2 and FLAG4 in the third-stage model. The third-stage model su�ersfrom heteroscedasticity, the absolute value of the residuals signi®cantly correl-ate with POP. The residuals of the model identify Essex as a large outlier and thepossible cause of the problem. We re-estimate the third-stage model with adummy variable ESSEX which takes on the value 1 for Essex and is zero for allother authorities. The ®nal model, shown in Regression 1, passes the standardGoldfeld-Quandt tests for heteroscedasticity with respect to population andother possible variables in the model. It has no other estimation problems.
TABLE 1. List of Interaction Terms Used inthe Final SSA Model
SHIRE1 � SHIRE*FAC1FLAG4 � FLAG*POP
MARG2 � MARG*FAC2UNITARY4 � UNITARY*POP
28 This coding was arrived at after consultation with specialists in the ®eld of local government inBritain. The ¯agship hypothesis is that the SSA should be higher for cases where FLAG � 1.
29 A larger range of interactions was used in initial modelling, but most of these were nottheoretically construable and signi®cant on the set of criteria we used for inclusion in the ®nalmodel.
44 Targeting Bene®ts for Electoral Gain
#Political Studies Association, 1999

The groups of variables in regression 1 below represent the three stages ofestimation.
Regression 1: dependent variable SSA
R Square 0.99368Adjusted R Square 0.99296F � 1372.26518Signif F � 0.0000n � 108
Variable B Beta T Sig T
Stage 1(Constant) ÿ30.499567 ± ÿ4.849 0.0000POP 6.70323E-04 1.138481 34.016 0.0000POPSQ ÿ3.36245E-11 ÿ0.083868 ÿ2.432 0.0169FAC1 6.453503 0.034291 2.417 0.0175FAC1SQ 2.979773 0.052848 4.706 0.0000FAC2 14.612742 0.083038 7.287 0.0000FAC3 19.258696 0.148160 15.174 0.0000
Stage 2UNITARY4 1.04327E-04 0.087913 8.828 0.0000SHIRE1 11.272262 0.024547 2.381 0.0192
Stage 3MARG2 123.597535 0.042164 4.484 0.0000FLAG4 5.14745E-05 0.042318 4.569 0.0000
Additional variableESSEX 67.991733 0.033050 3.383 0.0010
The model explains around 99 per cent of the variance in SSA and allvariables included are signi®cant at the 95 per cent level or beyond. The high R2
results from the fact that: POP is an extremely strong correlate of SSA, as is itst-value and standardized regression coe�cient, beta, suggest; the ®rst groupof variables, including POP, POPSQ, FAC1, FAC1SQ, FAC2 and FAC3collectively constitute a powerful group of predictors of SSA. POPSQ's negativesigni®cant coe�cient indicates economies of scale on population-relatedservices. As we expected, both FAC1 and FAC1SQ are signi®cant and indicatethe expected quadratic relationship. The positive coe�cients on FAC2 andFAC3 indicate, as expected, that local authorities get increased SSA when thereis more need for social services.
The second group of variables in regression 1 comprises UNITARY4 andSHIRE1. The positive coe�cient on UNITARY4 indicates that shire countiesreceive less than unitaries with respect to population-related services, presum-ably because the district authorities carry out some of these services. Thepositive coe�cient on SHIRE1 indicates that shire counties obtain more thanunitary authorities for education provision, possibly because they have to runsmall, expensive schools in rural areas.
HUGH WARD AND PETER JOHN 45
#Political Studies Association, 1999

The third group of variables in regression 1 comprise the political interactionsMARG2 and FLAG4. The ®rst point is that the interactions we tried betweenthe ®rst group of variables with LOCCON were all insigni®cant when includedin the third-stage model. That is to say there is no evidence that the governmentfavoured Conservative authorities, as the pork barrel hypothesis suggests.MARG2 has a positive coe�cient, so that there is an interaction e�ect wherebyauthorities got more, other things being equal, to provide social serviceswhen there is greater need and they have higher scores on MARG. So there isevidence that local authorities sensitive in terms of Westminster elections werefavoured, so long as they were also areas of deprivation. The positive coe�cienton FLAG4 indicates that Tory local authority ¯agships get a larger SSA,other things being equal, because they get more to provide population-relatedservices.
The ®nal variable in regression 1 is ESSEX. Its inclusion can be regarded as a`technical ®x' to cure the heteroskedasticity problem, although its inclusionactually makes very little di�erence to the estimated coe�cients and t-values ofthe other variables in the model.30 In contrast, it could be argued that Essex wasa politically signi®cant authority for the Tories, because of the symbolicimportance of `Essex Man' to the 1987 and 1992 elections and in Tory folklore,and the associated priority of maintaining Tory control in key Essex con-stituencies, particularly in the context of the downturn of the economy in themid 1990s which hurt the south-east and Essex in particular. The high level ofgrant could have been the legacy of a prior attempt to reward the prominentConservative authority threatened with electoral defeat in the 1993 countycouncil elections or an alarmist reaction to the loss of 25 Conservative councilseats and overall control. If the political interpretation is valid, Essex got£67 million out of total SSA of £987.6 million more than predicted by spendingneed.
We proceeded in a similar way when building our model of TAXBASE to thatdescribed for building our model of SSA. We ®rst construct a model excludingpolitical variables and then look for signi®cant political interactions.TAXBASE is a function of the number of notional domestic dwellings fallinginto a particular property price band. It should be a function of POP and thesocio-economic structure of the local authority, which ought to in¯uence theprice structure of housing. The ®rst-stage model includes POP and POPSQ tocapture non-linearities. We ®nd that SCONE, the proportion of the populationbelonging to the Registrar General's social class one was a strong correlate ofTAXBASE, and we include this variable and the square of SCONE,SCONESQ, in the ®rst-stage model. We use interactions with local authoritydummies to investigate whether there were di�erences in property values acrossLondon, other large cities, and the shire counties.
LONDON4 � LONDON*POP is the only interaction that merited inclusionon the criteria of statistical signi®cance and theoretical justi®cation. In the thirdstage we add political interactions, using the same selection criteria as weemployed in building the model of SSA. Two political interactions merited
30 The Glejser test still indicated heteroskedasticity with respect to FAC2, although the Goldfeld-Quandt test suggested no such problem. This can be solved by the technical ®x of including adummy for the outlier Knowlsey, but this makes hardly any di�erence to estimates of thecoe�cients of other variables and we can see no substantive interpretation of the dummy.
46 Targeting Bene®ts for Electoral Gain
#Political Studies Association, 1999
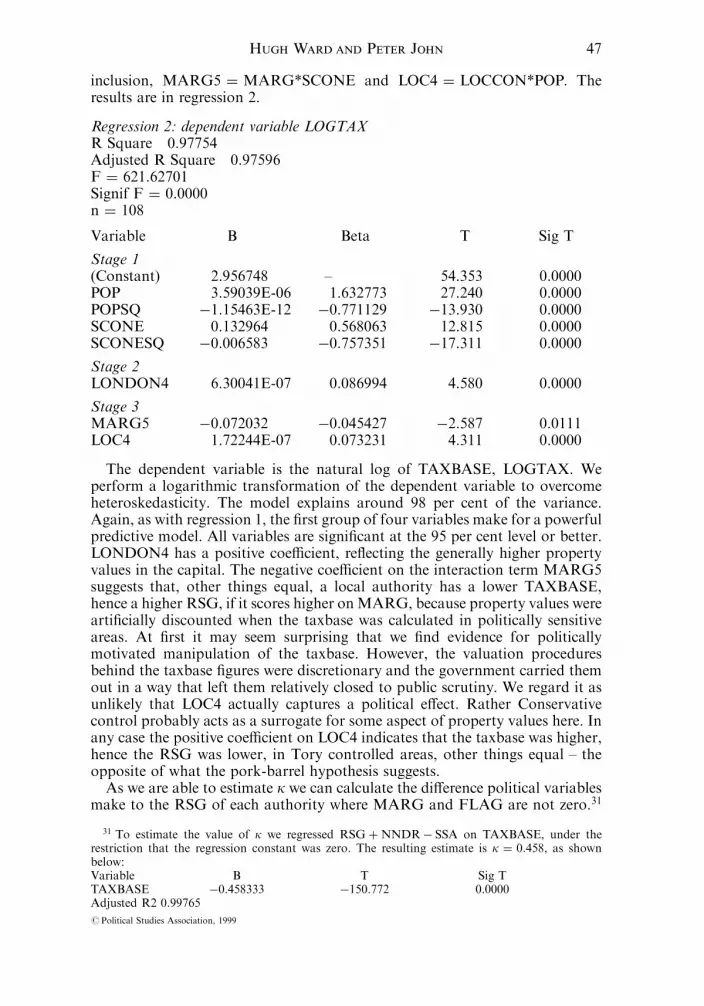
inclusion, MARG5 � MARG*SCONE and LOC4 � LOCCON*POP. Theresults are in regression 2.
Regression 2: dependent variable LOGTAXR Square 0.97754Adjusted R Square 0.97596F � 621.62701Signif F � 0.0000n � 108
Variable B Beta T Sig T
Stage 1(Constant) 2.956748 ± 54.353 0.0000POP 3.59039E-06 1.632773 27.240 0.0000POPSQ ÿ1.15463E-12 ÿ0.771129 ÿ13.930 0.0000SCONE 0.132964 0.568063 12.815 0.0000SCONESQ ÿ0.006583 ÿ0.757351 ÿ17.311 0.0000
Stage 2LONDON4 6.30041E-07 0.086994 4.580 0.0000
Stage 3MARG5 ÿ0.072032 ÿ0.045427 ÿ2.587 0.0111LOC4 1.72244E-07 0.073231 4.311 0.0000
The dependent variable is the natural log of TAXBASE, LOGTAX. Weperform a logarithmic transformation of the dependent variable to overcomeheteroskedasticity. The model explains around 98 per cent of the variance.Again, as with regression 1, the ®rst group of four variables make for a powerfulpredictive model. All variables are signi®cant at the 95 per cent level or better.LONDON4 has a positive coe�cient, re¯ecting the generally higher propertyvalues in the capital. The negative coe�cient on the interaction term MARG5suggests that, other things equal, a local authority has a lower TAXBASE,hence a higher RSG, if it scores higher onMARG, because property values werearti®cially discounted when the taxbase was calculated in politically sensitiveareas. At ®rst it may seem surprising that we ®nd evidence for politicallymotivated manipulation of the taxbase. However, the valuation proceduresbehind the taxbase ®gures were discretionary and the government carried themout in a way that left them relatively closed to public scrutiny. We regard it asunlikely that LOC4 actually captures a political e�ect. Rather Conservativecontrol probably acts as a surrogate for some aspect of property values here. Inany case the positive coe�cient on LOC4 indicates that the taxbase was higher,hence the RSG was lower, in Tory controlled areas, other things equal ± theopposite of what the pork-barrel hypothesis suggests.
As we are able to estimate k we can calculate the di�erence political variablesmake to the RSG of each authority where MARG and FLAG are not zero.31
31 To estimate the value of k we regressed RSG � NNDRÿ SSA on TAXBASE, under therestriction that the regression constant was zero. The resulting estimate is k � 0.458, as shownbelow:Variable B T Sig TTAXBASE ÿ0.458333 ÿ150.772 0.0000Adjusted R2 0.99765
HUGH WARD AND PETER JOHN 47
#Political Studies Association, 1999

Figure 3 is a histogram of MARGTOT, the increase in RSG we calculate wasobtained for the sixty local authorities with positive scores on MARG.
Looking at scores on MARGTOT in Figure 3 shows that some authoritiesreceived very substantial extra sums of money. Birmingham was the largestbene®ciary of all, getting £56 million extra, largely because it received more forsocial services. Of the shire counties Lancashire bene®ted most, getting£55 million extra, partly through extra money for social services but alsobecause of the undervaluing of local property. Of the London boroughs,Southwark was the biggest bene®ciary with £21 million. The mean ofMARGTOT across the 60 authorities with positive values of MARG was£8.6 million.32 To put things into context, we calculate that the governmentdivered around £515 million, or 3% of the total RSG, to local authoritiescontaining Westminster marginals.
Because of the interaction terms and non-linearities of the statistical models itis an open question whether the predicted linear relationship between MARGand the total extra RSG for cases with positive scores on MARG holds. In fact,the correlation between these variables is 0.69 with a t-value of 7.274. Aspredicted, the regression constant obtained when MARGTOT is regressed onMARG is statistically insigni®cant and has the relatively small magnitude ofÿ2.6. So the government distributes discretionary resources broadly as wepredict. Larger sums go to authorities with higher scores on MARG, indicating
0.4
MARG
MA
RG
TO
T
0.30.20.10.0–0.1
60
50
40
30
20
10
0
–10
Figure 3. The Relationship Between the Extra Resources Received by anAuthority Due to the Marginality E�ect and its Marginality Score
32 As Figure 3 suggests 15 of these authorities are calculated actually to have negative values ofMARGTOT. This is a result of their having negative scores on FAC2, indicating a lack of socialdeprivation, and the positive coe�cient on the interaction term MARG2. However, most of thesenegative scores were less than £2 million, and the mean was £ÿ 1.98 million. They could be theresult of the fact that it is di�cult to ®ne-tune the system to deliver small positive amounts of bene®tperfectly, as most of the cases concerned had low scores on MARG.
48 Targeting Bene®ts for Electoral Gain
#Political Studies Association, 1999

a bias in favour of politically sensitive authorities, especially those containingnumbers of opposition marginals.33
According to our calculations, Tory ¯agship local authorities alsobene®ted. Kent obtained around £72 million extra grant. From among theLondon Boroughs, Wandsworth was the biggest bene®ciary, getting around£13.7 million extra, while Westminster got around £9.7 million. From themetropolitan districts, Tra�ord was the largest bene®ciary with around£11.2 million. It is interesting that these ®gures are of the same order as thosewe calculated ¯owed from the marginality e�ect, yet the local authority ¯agshipe�ect has received far greater media attention.
Conclusions
The results show that the UK government targeted bene®ts for party politicaladvantage. In England in 1994/95, the Conservatives directed public resourcesto marginal constituencies and supported their ¯agship local authorities,though we ®nd they did not reward authorities simply because they were Torycontrolled. The amounts are far from trivial. Although we only carried out theanalysis for one year, the e�ects cumulate ± both SSAs and the areas whichhave marginal seats do not shift very rapidly. Thus there have been e�ects for atleast two years, and probably more. Variations in the distribution from thediscretion in the formula are likely to have signi®cant e�ects on the conditionsof life for voters in marginal constituencies in relation to the range of strategicservices that large authorities control ± education, roads, social services,planning, and transport and/or in local tax levels. Our data suggest that thegovernment places a special emphasis on social services.
Of course, our results do not show that extra resources translate into votes.Although local spending and taxation a�ects local voting behaviour,34 there isonly scanty knowledge of their impact on Westminster elections. But, as wasshown in the 1992 general election, marginal seats behave di�erently to the restof the country suggesting that the party in government manipulates prefer-ences.35 Also, parties' deployment of campaign resources a�ects tactical votingin England.36
There are normative implications for our ®ndings. For party political gain,the Conservative governments misused public resources intended to compensate
33 Assume that the expected fraction of an extra discretionary pound spent in a local authoritygoing to a constituency it contains is equal to the constituency's share of the total number of voterswho live in the local authority. Given our estimates of how much each local authority got from themarginality e�ect, we can then calculate the expected value of the extra funds going to eachconstituency. According to our model, there should be a positive, signi®cant relationship betweenthis ®gure and a variable that takes on the value 0 if p̂i;0 is outside the interval (0.45, 0.55) and (p̂i;0)otherwise. Across 520 constituencies in England contained wholly within local authority bound-aries, the correlation was 0.35 with a t-value of 8.65. The constant in the regression of these twovariables was signi®cant but, at 0.72, was close to the expected value of 0.
34 J. Gibson, `Rate increases and local elections: a di�erent approach and a di�erent conclusion',Policy and Politics, 16 (1988), 197±208; J. Gibson, `Voter reaction to tax changes: the case of thepoll tax', Applied Economics, 26 (1994), 877±84; J. Gibson and J. Stewart, `Poll tax, rates and localelections', Political Studies, 40 (1992), 516±31.
35 In the 1992 general election, Labour/Conservative marginals swung away from the Conserva-tives by about two percentage points above the national swing, though the swing was higher inmuch less marginal seats. See J. Curtice and M. Steed, `The results analysed'.
36 E. A. Fieldhouse, C. J. Pattie and R. J. Johnston, `Tactical voting and party constituencycampaigning at the 1992 general election'.
HUGH WARD AND PETER JOHN 49
#Political Studies Association, 1999

for di�erences in spending need. Such an abuse of public power may be a featureof the decay of the principles of the governing party after its long years of o�ce.But it may also be a consequence of the British governing system as any party ino�ce may be tempted to use its executive freedom and the secrecy of govern-ment to subvert public purpose for political gain. At minimum the ®ndingssuggest that parliament should rigorously scrutinize decisions a�ecting thespatial distribution of resources. Alternatively, it may be possible to transferdistributional decisions to an independent body once the government has set thetotal level of resources for local authorities. Our ®ndings might also supportmore wide ranging reforms. Given that the ®rst-past-the-post electoral systemampli®es the e�ect on Westminster seats of the manipulation of the vote,alternative electoral arrangements, such as proportional representation, reducethe incentive of governments to target resources to the marginals.
The results suggest avenues for future research. First, researchers need to besensitive to how relationships vary over time. In the British context, the nationalelectoral cycle is important. Electoral considerations are more likely to leadWestminster politicians to override policy goals for local authorities nearnational elections. It is plausible that the government's manipulation of grantsto favour marginal areas would be low just after an election and then becomeactive near elections from the mid-term. This suggests the possible use of apooled cross-section/time series analysis combining information stored in thevariation across cases and across time in order to estimate models. Second, it islikely that governments face a varying set of constraints depending on the pastelection result as a government defending a majority of 20 may have di�erentincentives from one defending a majority of 179, an insight also generated byrecent models of political business cycles. This suggests further formal model-ling. Third, it is likely that discretion is likely to enter into a wide range ofgovernment programmes, which have spatial e�ects, such as road building,prestige projects, urban funding and defence contracts. In particular, the more adecision is discretionary and discrete the more likely political variables enterinto the calculation. This suggests that project based decisions rather thanformula led ones are ripe for manipulation. Indeed, our next project is under-way ± an examination of the determinants of urban funding in the UK.37
Finally, comparative research would seek to ®nd out how varying institutionalframeworks and party systems confer di�erent incentives for the targeting ofresources.
The results have wider implications for the way in which political scientistsunderstand vote maximization. Instead of a costly manipulation of the macro-economy where it is di�cult to achieve desired ends, politicians have moresubtle understandings of the mechanisms needed to get elected. Rather thanseeking to in¯uence large policy choices, they focus their attention on thediscretionary areas of policy they do control. In contrast to the macro-economy,where policy is increasingly constrained by the international economy and maybe further limited by the stringencies of European Monetary Union, politicianscan avoid charges of cynicism and loss of governing competence by using thesecrecy of government to reward valuable voters. Not that political scientists
37 `The competitive city and national urban policy: modelling discretionary grant allocation in theUK', ESRC grant L130251038.
50 Targeting Bene®ts for Electoral Gain
#Political Studies Association, 1999

should abandon Downsian models of party competition and political businesscycles, but that these models themselves could be improved by directing moreattention on how governments target policies to voters. Thus parties would seekto compete for policies in marginal seats. So, for example, policies on tax andspending could be adjusted to the income and social pro®le of these con-stituencies. Governments could manipulate business cycles in a more preciseway if voters in the marginals preferred di�erent macro-economic variables tothe rest of the voting population. Marginality, thus, is a powerful variable whichshould not be neglected by political scientists who wish to investigate thedeterminants of public policies.
Appendix: Factor Analysis
We factor analysed a number of variables drawn from the UK 1991 Census.Initial extraction was by the principle components technique and a varimaxrotation was then carried out. Three factors had eigenvalues greater than 1. Theloadings on the rotated factors are shown below. Three orthogonal factors werederived after rotation. Looking at the loadings, the ®rst clearly re¯ects the agestructure, measures of old-age loading negatively and measures of school-agechildren loading positively. The second factor re¯ects deprivation, all theindicators of deprivation loading heavily upon it. It is more di�cult to interpretthe third factor. Some measures likely to be associated with inner-citydeprivation, such as poor housing and large numbers of ethnic minorityhouseholds, do load heavily on it.
Rotated Factor Matrix:
Factor 1 Factor 2 Factor 3BETSIXSE 0.70367 ÿ0.19266 ÿ0.52645DEPCHILD 0.95552 ÿ0.10801 ÿ0.17997FEMUN 0.16771 0.74491 0.56387FOVER ÿ0.77428 0.29797 ÿ0.43105ILL ÿ0.16464 0.90405 ÿ0.14021LONEPAR 0.18669 0.66469 0.64193MALEUN 0.16007 0.85388 0.39754MOVER ÿ0.77808 0.25739 ÿ0.42274NOBATH ÿ0.39422 0.21606 0.67890NOCAR 0.00688 0.80240 0.49114NOCENT ÿ0.14318 0.56952 0.09448NONWHITE 0.12426 0.13116 0.87222PRESCH 0.79822 0.25698 0.37204ROOM 0.13955 0.35617 0.84318SCHOOL 0.94638 0.09656 ÿ0.14984UFIFTEEN 0.95709 0.16954 0.05260
The variables used were:
BETSIXSE ± percentage residents children between sixteen and seventeenDEPCHILD ± percentage households with dependent childrenFEMUN ± percentage female unemployed
HUGH WARD AND PETER JOHN 51
#Political Studies Association, 1999

FOVER ± percentage females over sixtyILL ± percentage residents long-term illLONEPAR ± percentage families headed by lone parentsMALEUN ± percentage male unemployedMOVER ± percentage males over 65NOBATH ± percentage households no bathNOCENT ± percentage households no central heatingNOCAR ± percentage households with no carNONWHITE ± percentage households headed by non whitePRESCH ± percentage of population pre-school ageROOM ± percentage households more than one person per roomSCHOOL ± percentage 5±15 years oldUFIFTEEN ± percentage under 15 years old
(Accepted: 14 December 1997)
52 Targeting Bene®ts for Electoral Gain
#Political Studies Association, 1999


