Embed Size (px)
Citation preview

Taste Changes in Vitamin A Deficiency
R U D Y A. B E R N A R D and B R U C E P. H A L P E R N
From The Rockefeller University, New York 10021, and the Department of Psychology and Section of Neurobiology and Behavior, Cornell University, Ithaca, New York 14850
ABSTRACT Taste preferences were studied in two groups of rats depleted of vitamin A by. dietary restriction. One group received sufficient vitamin A acid supplement to maintain normal growth. The other group was repleted with vitamin A alcohol after the classical deficiency symptoms had appeared; this group gradually lost normal preferences for NaC1 and aversion to quinine solu- tions during depletion. Vitamin A alcohol repletion tended to restore taste preferences to normal. In contrast, the group receiving vitamin A acid showed normal taste preferences throughout the depletion period. When the vitamin A acid supplement was removed taste preferences became abnormal and returned to normal when vitamin A acid was restored. Peripheral gustatory neural activ- ity of depleted rats without any form of vitamin A was less than normal both at rest and when the tongue was stimulated with NaC1 solutions. Histological examination showed keratin infiltrating the pores of the taste buds. Accessory glandular tissues were atrophied and debris filled the trenches of the papillae. It is concluded that vitamin A acid can provide the vitamin A required for nor- real taste, as contrasted with its inability to maintain visual function. It is sug- gested that the effect of vitamin A is exerted at the receptor level, as a result of its role in the biosynthesis of mucopolysaccharides, which have been recendy identified in the pore area of taste buds, as well as being present in the various secretions of the oral cavity.
I N T R O D U C T I O N
Vi tamin A depletion, in addi t ion to the classically described symptoms, is accompanied by a gradual loss of normal taste preferences in rats . Reple t ion with v i tamin A tends to restore normal taste preferences. T h e tongue shows increased kerat inizat ion of the l ingual papillae including the pore area of the taste buds, adjacent epithelial and g landu la r tissues (Bernard, Halpern , and~Kare, 1961, 1962).
Vi tamin A acid can main ta in normal growth and survival in v i tamin A- deficient rats, bu t does not prevent the night blindness characteristic of v i tamin A deficiency (Dowling and Wald , 1960). T h e visual effects, preceded by the deplet ion of liver and blood stores of v i tamin A (alcohol and esters),
444
The Journal of General Physiology
on Novem
ber 24, 2015jgp.rupress.org
Dow
nloaded from
Published September 1, 1968

R. A. BERNARD AND B. P. HALPERN Taste Changes in Vitamin A Deficiency 445
are accompanied by a decrease of the rhodopsin and finally of the opsin content of the retina. These biochemical changes are similar to those of classical vitamin A deficiency (Dowling and Wald, 1958). Histological study of the retina, however, showed that the structural changes were restricted to the visual cells. Vitamin A acid is not stored and its removal from the diet leads to an immediate interruption of growth and rapid appearance of the classical epithelial symptoms. The role of vitamin A in vision, filled by the alcohol form of vitamin A, can thus be dissociated from its more widespread role in other bodily tissues, which could be filled by vitamin A acid or alcohol.
The experiments reported here were undertaken to discover whether taste was comparable to vision in the requirement for vitamin A alcohol. Duncan (1964) reported that vitamin A acid maintained normal taste preferences in rats, and suggested that the taste loss in vitamin A deficiency was probably of central origin, associated with general debility. He made no direct test of the locus of the deficit.
The present study employed electrophysiologieal recordings of chorda tympani nerve activity and histological examination of the tongue in addition to preference tests of gustatory function, to assess the involvement of peripheral taste mechanisms in the behavioral deficits. Since vitamin A acid is not stored, it was possible to examine rapid onset of vitamin A deficiency in rats raised to adults on vitamin A acid.
METHODS AND PROCEDURE
Male CFN albino rats were started on the experiments as weanlings, with an average weight of 46 g. Standard vitamin A test diet (General Biochemicals, Chagrin Falls, Ohio), supplied with 100 mg chlortetracycline (Aureomycin)/kg, was fed to all the rats. Two experimental groups were employed, consisting of (a) a vitamin A-deficient group, which received only the test diet, unless otherwise noted, and (b) a vitamin A acid group, which received the test diet supplemented with 5 mg vitamin A acid/kg (Eastman Organic Chemicals, Rochester, N. Y.), unless otherwise noted. The controls were (a) a normal taste control group, which received the various solutions tested in the experiment, and (b) a H20-H20 control group. Both control groups received the test diet supplemented with 2000 IU vitamin A/kg, unless otherwise noted. The diets were available ad libitum. Distilled water was used at all times. Reagent grade NaC1, usP quinine sulfate (QSO4), sodium saccharin (Na sacch), and technical grade sucrose octa acetate (SOA) were used. The animals were weighed individually at regular intervals.
Preference Tests
The rats were housed in individual cages, fitted with two glass graduated drinking tubes. One contained water, the other, the solution being tested. The intake from each tube was measured once a day to the nearest milliliter and the tubes were washed
on Novem
ber 24, 2015jgp.rupress.org
Dow
nloaded from
Published September 1, 1968

446 THE JOURNAL OF GENERAL PHYSIOLOGY • VOLUME 5 3 • 1968
and filled with fresh solution every day. The amount of test solution drunk, expressed as a percentage of the total liquid consumed during 24 hr, is referred to as the per cent preference for that solution. In order to minimize the effect of reading error, prefer- ence was not calculated unless total intake exceeded 5 ml. The right-left position of the tubes was varied once a day according to a restricted random schedule. The re- striction ensured that test solutions would not appear more than twice in succession in the same position and that they would appear equally often in each position during a test period. Test period durations were 8 days in experiment I, 2 days in experiment II , and 4 days in experiment I I I .
PRELIMINARY TESTING During a single 13 day period, 52 rats were presented with 0.05 M and 0.02 M NaCI, and 20 p~ and 10 #M QSO~, each on 2 consecutive days in that order. Only those rats which showed greater than 50 % preference for 0.02 ta NaC1 and less than 25 % preference for 10 #M Q S O , over the 2 days were randomly assigned to the three groups receiving taste solutions. Of the 52 rats tested, 40 met the criterion. 23 rats were assigned to the vitamin A-deficient group, 9 to the vitamin A acid group, and 8 to the normal, taste control group. 8 of the 12 rats that failed to meet the criterion were assigned to the fourth group, which received water in both tubes. This was the H 2 0 - H 2 0 control. The remaining four rats were not used. All four groups were tested in experiment I. The H20-H~O control group was eliminated after experiment I. The vitamin A-deficient group was not tested after experiment II . Only the vitamin A acid group and the normal, taste control group were tested in experiment I I I .
EXPERIMENT I NaCI and Q S O , solutions were offered during each of 20 con- secutive 8 day periods, except for a water-water trial by all groups during the nine- teenth period. The first period began at the end of the preliminary test. Each of the two solutions was offered four times per period, twice on each side. The reported preferences are the group means for the 4 days of each 8 day period. For the first four periods, 0.02 M NaCI and 10/z~t Q SO, were offered. During the fifth period the con- centration was adjusted to 0.01 M NaCI and 30 #lVi QSO4. From the sixth period to the end of the experiment concentration remained unchanged. During period 19 all groups were on a H , O - H 2 0 choice.
At the beginning of period 15, seven rats of the vitamin A-deficient group were given orally 5,000-10,000 IU vitamin A alcohol in 0.5-1.0 ml of corn oil, thus forming a vitamin A repletion subgroup. This subgroup thereafter received the same diet as the two control groups. Vitamin A repletion continued through period 20, thus forming phase 2 of experiment I. Periods 1 through 14 form phase 1.
EXPERIMENT II This experiment expressly tested the recovery of the previously vitamin A-deficient rats (experiment I) by exposing them to new taste stimuli. The vitamin A repletion subgroup was continued on repletion throughout this experiment. An ascending and then a descending series of concentrations of Na sacch and of SOA were presented for 8 and 10 consecutive 2 day periods, respectively. Each concentra- tion was presented on 2 consecutive days and the preference values are the group means for each 2 day period. Concentrations ranged from 0.1 to 2.0 mM Na sacch
on Novem
ber 24, 2015jgp.rupress.org
Dow
nloaded from
Published September 1, 1968

R. A. BERNARD AND B. P. HALPERN Taste Changes in Vitamin A Defidency 447
and from 0.01 to 1.0 m_u SOA (Fig. 4). Between the Na sacch and the SOA series, all groups were on a H 2 0 - H 2 0 choice for 12 days.
EXPERImeNT m This experiment tested the effect of removing and subsequently restoring vitamin A acid to the diet. Because of the expected rapidity of body weight changes, QSO4 and NaC1 solutions were studied in two separate phases, in 4 rather than 8 day periods.
Phase 1 Seven of the nine vitamin A acid animals were the experimental group. The other two members of the vitamin A acid group were maintained on vitamin A acid throughout phase 1. The test solution was 5 /zM QSO4. Vitamin A acid was withdrawn at the beginning of period 6, after preferences had stabilized. I t was restored at the beginning of period 10, after statistically significant preference changes had occurred. Water was offered on a no choice basis during periods 14 and 15, and the QSO4 solution was tested again in period 16, which concluded phase 1.
Phase 2 Water was offered on a no choice basis during period 17 and beginning with period 18 the test solution was 0.01 M NaC1. Vitamin A acid was withdrawn during period 24 when preferences were stable and not significantly different from the control. After significant changes had occurred, the rats were studied electro- physiologically and histologically. The two vitamin A acid rats that were not deprived in phase 1 were added to the three survivors of phase 1 to make up the experimental group of phase 2. The preference values are the group means for each 4 day period.
STATISTICAL ANALYSIS The Mann-Whitney U test, single-tailed, was applied to each period of experiments I and I I I . For experiment II , a two-tailed Mann-Whitney U test was applied to each concentration, while a x 2 test was used on each full series (Siegel, 1956).
ELECTROPHYSIOLOGY Four vitamin A acid-deprived and three control rats were studied. The fifth deprived rat died upon being anesthetized. The exposure of the chorda tympani nerve and the recording electrodes (Halpern, Bernard, and Kare, 1962) as well as the electrical recording methods (Halpern, 1963) were previously described. At the time of electrophysiological study the four deficient rats had been deprived of vitamin A acid for from 18-24 days.
HISTOLOGY Six rats from the vitamin A-deficient group were taken for histo- logical study, four at the end of period 14 and two at the end of period 17 of experi- ment I. One rat from the H20 control group was also taken at the end of period 17 for the same purpose. Five deprived rats of the vitamin A acid group and three rats from the normal group were taken for histological study upon completion of the electrophysiological procedures that followed experiment I I I .
The animals were sacrificed, and the tongues were immediately removed and fixed in Bouin's fluid or in neutral, buffered formalin. The tongues were embedded in paratfin and serially sectioned at 5/z in sagittal and coronal planes. Alternate sections were stained with hematoxylin and eosin and with Ladewig stain, which colors keratin a brownish red.
on Novem
ber 24, 2015jgp.rupress.org
Dow
nloaded from
Published September 1, 1968

448 T H E J O U R N A L O F G E N E R A L P H Y S I O L O G Y • V O L U M E 5 2 " 1968
RESULTS
Preference Tests
EXPERIMENT I
Phase 1 Vitamin A depletion
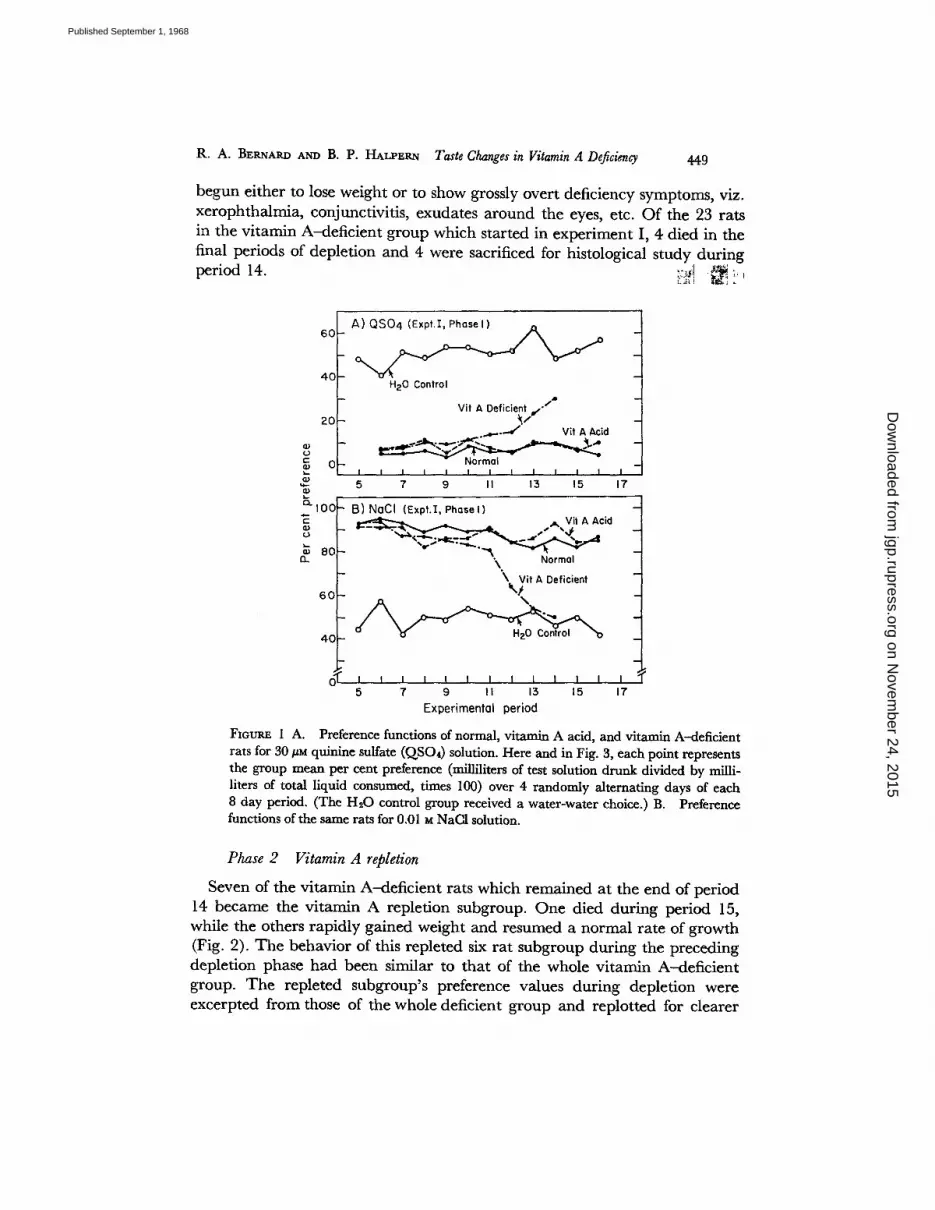
The normal group consistently rejected 30/~M QSO4, with preference values below 10%. The vitamin A acid group did not differ significantly from the normal group. (See Table I for these and subsequent P values.) The vitamin A-deficient group initially rejected the QSO, at the normal level, but gradu- ally decreased its rejection until it reached a 31% preference level during
T A B L E I
P VALUES OF E X P E R I M E N T I, PHASE 1
Vitamin A deficiency Vitamin A deficiency Vitamin A acid vs vs. v$,
taste control H 2 0 control taste control
Test period QSO4 NaCI QSO* NaCl QSO4 NaCI
5 through 10" >0.055 >0.05 <0.00005 <0.00007 >>0.05 >>0.05 11 0.088 0.021 <0.0003 <0.0005 >>0.05 >>0.05 12 0.187 0.003 <0.0002 0.038 >>0.05 >>0.05 13 0.018 <0.0003 <0.0001 0.443 >>0.05 >>0.05 14 <(0.004 0.0003 >>0.05 0.415 >>0.05 >>0.05
* For QSO,, period 5 not included. :~ For period 9, P = 0.043.
period 14 (Fig. 1 A). Preference values were significantly different from normal group values during periods 13 and 14 and not significantly different from H~O control group values during period 14.
A similar but mirror-image effect occurred with the NaC1 solution (Fig. 1 B). The normal group consistently selected 0.01 M NaCI, with preferences above 820-/0 . The vitamin A acid group did not differ significantly from the normal group. The vitamin A-deficient group initially selected the NaC1 at the normal level, but gradually decreased its selection until a 50% level of intake was reached during period 14. Preference values differed significantly from those of the normal group for periods 11 through 14 and did not differ significantly from those of the H20 control group during periods 13 and 14. The H~O control group did not deviate significantly from an ideal 50% preference level during the entire experiment (0.70 < P < 0.80).
The changes in preference values began while the vitamin A-deficient group was in a plateau of its growth curve (Fig. 2). The first statistically significant preference change occurred during period 11, before the rats had
on Novem
ber 24, 2015jgp.rupress.org
Dow
nloaded from
Published September 1, 1968
R. A. BERNAI~U AND B. P. I-L~T.p~.~ Taste Changes in Vitamin A Deficiency 449
begun either to lose weight or to show grossly overt deficiency symptoms, viz. xerophthalmia, conjunctivitis, exudates around the eyes, etc. Of the 23 rats in the vitamin A-deficient group which started in experiment I, 4 died in the final periods of depletion and 4 were sacrificed for histological study during period 14. ~::~'I ~'~ !~!
4C H20 Control
Vit A Deficient " /* 20 ~.,'J
,=....--¢" Vit A Acid
~ - I I I I I I I I [ I I l I
5 7 9 II 13 15 17 == CLlOC 13) NoCI (Expl, I, Phosel)
"E ~ ~ _ , . ,=, ,Vi i A Acid -
80 Q- \. Normol
\ Vit A Deficient 6o \ t
4C ~ -
I I I I I I I , I [ I I I I 5 7 9 II 13 15 17
Experimental period
FIoum~ I A. Preference functions of normal, vitamin A acid, and vitamin A--deficient rats for 30 #M quinine sulfate (QSO4) solution. Here and in Fig. 3, each point represents the group mean per cent preference (milliliters of test solution drunk divided by milli- liters of total liquid consumed, times 100) over 4 randomly alternating days of each 8 day period. (The H20 control group received a water-water choice.) B. Preference functions of the same rats for 0.01 M NaCI solution.
Phase 2 Vitamin A repletion
Seven of the vitamin A-deficient rats which remained at the end of period 14 became the vitamin A repletion subgroup. One died during period 15, while the others rapidly gained weight and resumed a normal rate of growth (Fig. 2). The behavior of this repleted six rat subgroup during the preceding depletion phase had been similar to that of the whole vitamin A-deficient group. The repleted subgroup's preference values during depletion were excerpted from those of the whole deficient group and replotted for clearer
on Novem
ber 24, 2015jgp.rupress.org
Dow
nloaded from
Published September 1, 1968

45 ° T H E J O U R N A L O F G E N E R A L P H Y S I O L O G Y • V O L U M E 5 2 • i968
comparison (Fig. 3 A, B). During the first period of vitamin A repletion (period 15) rejection of the 30 #M QSO4 solution by the vitamin A repletion subgroup abruptly shifted toward normal levels. Rejection continued to move closer toward normal in subsequent periods (Fig. 3 A). The QSO4 preference values of the vitamin A-repleted subgroup did not significantly differ from those of the normal group from the first period of repletion onward (Table II).
The preference for 0.01 M NaC1 reversed its downward trend in the first period of vitamin A repletion, but never fully returned to the normal level
Rat Growth I
44C
400
560
520
o c~ 280 .c
240
2OO
Normol .';'~.~..,,~- V'it A Acid
A Deficient
160
12C
80 - L
June
Fmu~ 2.
Periods of experiment I Experiment II
July Aug. Sept. Oct. Nov. Dec. don.
Growth curve of normal, vitamin A acid, and vitamin A-deficient rats.
(Fig. 3 B). The repleted subgroup's preference for NaCI was significantly different from the H~O control levels, except during period 15. The vitamin A acid group remained indistinguishable from the normal group throughout the repletion phase of the experiment.
EXPERIMENT II. The vitamin A-repleted group did not differ signifi- cantly from the normal group at any of the concentrations of Na sacch which were tested, nor for the series as a whole (Table III). Preference values ranged from indifference at the lower concentrations to strong selection at the higher (Fig. 4 A). The vitamin A acid rats did not differ from the normal group for the concentration sequence as a whole, but showed a preference for 1.0 mM
on Novem
ber 24, 2015jgp.rupress.org
Dow
nloaded from
Published September 1, 1968

R. A. BERNARD AND B. P. HALPERN Taste Changes in Vitamin A Deficiency 451
60
4 0
2O
~- 0
"E
~. I 0 0 Q) (3-
8 0
60
4(3
A) QSO 4 (Expt I): P h a s e I Phase 2
- V i t A - G i v e n
l n
J" ~ . . j J '~4~..--~..~
I I I I I I I I I I I I0 12 14 16 18 2 0
B) NoCI (Expt.I} Phase I Phase 2
k Vit A . , (o / • G i v e n j . /
D e f i c i e n l . . . . Vit A Ac id . . . . Normal
I I ! I I I 1 I I I I I 0 12 14 16 18 20
Exper imen to l per iod
FIOURE 3 A. Preference
functions of normal, vi tamin A acid, and repleted vitamin A rats, before and after vi tamin A
repletion, for 30 ~u QSO4 solution. B. Preference func-
tions of the same rats for 0.01 M
NaC1.
Na sacch in the ascending concentration sequence that was statistically different from normal•
In the SOA series the vitamin A-repleted group differed significantly from the normal group for the series as a whole and at 0.1 rnM in the descending concentration sequence• The preference values for the normal group ranged from weak selection (68%) to moderate rejection (23%) (Fig. 4 B). The repleted group showed no selection (56%) and much stronger rejection. The
T A B L E I I
P VALUES OF E X P E R I M E N T I, PHASE 2
Repleted vitamin A Repleted vitamin A Vitamin A acid vs. vs. vs.
taste control H~O control taste control
Test period QSO4 NaC1 QSO4 NaCI QSO4 NaCl
15 0.17 0.002 0.004 0.33 >>0.05 >>0.05 16 0.33 0.006 0.001 0.015 >0.05 >>0.05 17 0.50 0.03 0.001 0.001 >>0.05 >>0.05 18 0.48 0.23 0.004 0.004 >>0.05 >>0.05 20 0.31 0.02 - - - - >>0.05 >>0.05
on Novem
ber 24, 2015jgp.rupress.org
Dow
nloaded from
Published September 1, 1968

452 T H E J O U R N A L O F G E N E R A L P H Y S I O L O G Y • V O L U M E 5 2 • 1968
vitamin A acid group showed stronger selection (83%) than the normal group but similar rejection (25%). The vitamin A acid group did not differ signifi- cantly from the normal one at any one concentration but did differ signifi- cantly for the SOA series as a whole. The preference values of the vitamin A acid group were almost always higher than those of the normal group. During this SOA series the growth rate of the vitamin A acid group began to taper off (Figs. 2 and 5).
T A B L E I I I
P V A L U E S O F E X P E R I M E N T I I
Na saeeh, ram
Entire 0. l 0.2 0.5 1.0 2.0 1.0 0.5 0.2 series
R e p l e t e d v i t a m i n A 0 . 3 4 0 . 7 5 0 . 7 0 1 . 0 0 . 9 5 0 . 9 5 0 . 3 4 0 . 6 6 > 0 . 8 0
vs. t a s t e c o n t r o l
V i t a m i n A a c i d > 0 . 1 0 > 0 . 1 0 > 0 . 1 0 > 0 . 0 5 > 0 . 0 7 > 0 . 1 0 > 0 . 1 0 > 0 . 1 0 > 0 . 1 0
vs . t a s t e c o n t r o l
SOA, mM
Entire 0.I 0.2 0.5 1.0 0.5 0.2 0.I 0.05 0.02 0.01 series
Rcplctcd vitamin A 0.57 0.28 0.66 0.09 0.12 0.23 0.01 0.08 0.66 0.20 <0.01
vs. taste control
Vitamin Aacid 0.07 >0.10 >0.10 >0.10 >0.10 >0.10 >0.10 >0.52 >0.I0 >0.I0 <0.02 vs. taste control
EXPERIMENT III. A 3-month period elapsed between the end of experi- ment II and the beginning of experiment III . During this time the growth rate of the vitamin A acid group markedly decreased. Increased amounts of vitamin A acid supplement did not have any effect. The rats began to lose weight slowly at first and then more rapidly. The downward trend was finally reversed with a fresh supply of vitamin A acid (Fig. 5). After 6 wk of growth at a restored normal rate experiment I I I was begun.
Phase 1 The vitamin A acid group did not differ significantly from the normal group in rejection of 5 /~M QSO4 solution for any of the first five periods (Table IV, Fig. 6 A). At the beginning of period 6 all but two of the original vitamin A acid group were completely deprived of the vitamin A acid supplement, thus forming a phase 1 vitamin A acid-depleted subgroup.
on Novem
ber 24, 2015jgp.rupress.org
Dow
nloaded from
Published September 1, 1968

R. A. BERNARD AND B. P. t{ALPERN Taste Changes in Vitamin A Deficiency 453
The depleted subgroup's rejection of QS04 gradually decreased and became significantly less than normal during period 9. Restoration of vitamin A acid at the beginning of period 10, forming the phase 1 vitamin A acid-repleted group, did not immediately restore rejection of QSO4 to normal group levels, although the difference from normal was no longer statistically significant. In subsequent periods the rejection values returned to close to normal levels.
100
80
60
40
2O c Q) (1)
0
£3.
I00 o ~
~_ 8o
A) Na Sacch (Expt. ll)r~..*.,....,,.___..,
Vit A Acid . . . . Normal
I I I I I I I I 0.1 0.2 0.5 1.0 2.0 1.0 0.5 0.2
_ B) SOA (Expt.II)
t
40 - \ ~ ~ - - / -
2 o - " ' " ~ " / ' x.. ~ . . ~ ./#"
OT I I I I I I I I - -
O.l 0.2 0.5 1.0 0.5 0.2 0.1 0.05 0.02 0.01
mM concen t ra t i on
FmURE 4 A. Preference functions of normal, vitamin A acid, and repleted vitamin A rats for an ascending and descending concentration series of Na saccharin solutions. Each point represents the group mean per cent preference over 2 consecutive days at each concentration. B. Preference functions of the same rats for an ascending and
descending concentration series of sucrose octa acetate (SOA) solutions.
The phase 1 vitamin A acid-depleted group began to lose weight within 4 days of the removal of vitamin A acid. The weight loss was slow at first and then became very rapid (Fig. 5). Restoration of vitamin A acid did not immediately reverse the weight loss, which continued through periods 10 and 11. Four of the seven vitamin A acid-repleted rats did not recover, dying at various times after the restoration of vitamin A acid.
on Novem
ber 24, 2015jgp.rupress.org
Dow
nloaded from
Published September 1, 1968

454
620
T H E J O U R N A L O F G E N E R A L P H Y S I O L O G Y • V O L U M E 52 • ~ 9 6 8
Rot G r o w t h II
580
540
5OO oo
E o
~:~ 4 6 0
E
.4-- _c 420 E~ 133
380
34C
50C
I I
Jan.
F I G U R E 5.
__ ~--4" A
,.., Vit A Acid . . . . -" Removed Vit A Acid Normal -~,- -.- "" " "" " " ~' Removed
~ ~ ' / ~ " ~""*'" VitAcidNeWt A f 1
Restored I 4 7 I 0 1 5 I 6 1 9 2 2 2 5
I i i i i i i i i i i i i i i i K i I i I i i i i i i I
Periods of experiment I I I I I I I I I [ I I I I I I I
May June July Aug. I J [ I I I I [ I
Feb, March Apri l
Continuation growth curve of normal and vitamin A acid rats.
Phase 2. This sequence was begun with the three surviving members of the phase 1 vitamin A acid-repleted subgroup. Vitamin A acid was with- drawn at the beginning of period 21. Because of the small number of rats it was decided to enlarge the phase 2 depleted subgroup by adding the two vitamin A acid group rats that had not been deprived of vitamin A acid in
T A B L E I V
P V A L U E S O F E X P E R I M E N T I I I
Period No., Phase 1 (QSO4)
1 5 6 7 8 9 1 0 ]1 12 13 14-15 16
V i t a m i n A a c i d 0 . 2 1 0 . 3 6 0 . 3 6 0 . 1 8 0 . 0 0 4 0 . 4 6 0 . 2 1 0 . 4 6 0 . 2 1 - - 0 . 0 7
vs°
t a s t e c o n t r o l
Period No,, Phase 2 (NaCI)
17 18 19 20 21 22-24 25 26
V i t a m i n A a c i d - - 0 . 1 2 0 . 1 4 0 . 5 0 0 . 4 6 - - 0 . 2 7 0 . 0 4
v s .
t a s t e c o n t r o l
on Novem
ber 24, 2015jgp.rupress.org
Dow
nloaded from
Published September 1, 1968

R. A. BERNARD AND B. P. HALPERN Taste Changes in Vitamin A Deficiency' 455
phase 1 of experiment III . In order to have all members of the subgroup start from the same base line, testing was interrupted during period 22, before the phase 2 depleted rats had shown any preference changes. All five rats were now given the vitamin A acid diet for 1 wk, during which they were exposed to a 0.01 ~ NaC1-H20 choice, but no records of consumption were taken.
In calculating the results of phase 2, the data of the three survivors of the phase 1 depletion were pooled with those of the two rats that had not been
60
40
2O
o E (1> 0
ca
E Ioo o ~ ~_ 8o
6 0
4 0
A) QSO 4 (Expt.llI, Phasel) V i t A
Vil A Acid A c i d Restored
Removed ,, ~ . s - ~ . o . - - ~.
" L ~ . L . o ~ Normal • . . 1 - - - r - " r - " ' . K
% . . . . . . . . •
I I [ I I I 1 I I ] I I I I 2 4 6 8 I0 12 14 16
_ B) NaCI (Expt.III, Phase 2) Normal -
V i t A ~ ¢ Acid I,
R e m o v e d
I I I I I I 1 I I I 18 2O 22 24 26
Expe r imeNa l period
FmURE 6 A. Preference functions of normal and v i tamin A acid rats, before and after the wi thdrawal and restoration of v i tamin A acid, for 5 #M QSO4 solution. Each point represents the group mean per cent preference over 4 consecutive days of each 4 day period. B. Preference functions of the same rats, before and after a second with- drawal of v i tamin A acid, for 0.01 u NaC1 solution.
previously deprived of vitamin A acid, forming the phase 2 vitamin A acid group. Two periods were required before the phase 2 vitamin A acid group's preference for 0.01 U NaC1 reached the normal group's level (Fig. 6 B), although the difference from normal was not statistically significant (Table IV). The low means of periods 18 and 19 were due primarily to the louer scores of the phase 1 survivors.
Deprivation of vitamin A acid began for all five rats during period 24, thus forming the phase 2 vitamin A acid-depleted group. Preference values uere still at the normal level (80%) in period 25, but fell precipitously in period 26 (58~o) when the difference from normal was statistically significant.
on Novem
ber 24, 2015jgp.rupress.org
Dow
nloaded from
Published September 1, 1968

456 T H E j O U R N A L O F G E N E R A L P H Y S I O L O G Y • V O L U M E 5 ° • 1968
FABLE V
AMPLITUDE OF ELECTRICAL ACTIVITY OF RAT CHORDA TYM- PANI UPON STIMULATION OF THE TONGUE WITH 0.1 ~ NaCI
V i t a m i n A statu~ I n i t i a l bu r s t E n d of f low
Normal 49 43 Deficient 24* 17"
* P <0.004, 1-tail (Mann-Whitney U test).
FIGURE 7 A. Oscilloscope records of the electrical activity in the chorda tympani nerve of a normal rat. The spikelike traces are the direct neural responses, the solid traces are the same responses after passing th rough an electronic summator. Top records, H=O flow started at the onset of the trace. A slight decrease in resting activity is seen. Bot tom records, 0.1 M NaC1 flow started at the onset of the trace. Response occurred as a sudden burst of neural activity. B. Similar records from a v i tamin A-defic ient ra t after wi thdrawal of v i tamin A acid for 23 days. Note tha t the amplification of the action potentials is two times greater than in A. Top records, H 2 0 flow started at the onset of the trace. A small decrease in resting activity occurred. Bottom records, 0.1 M NaC1 flow started at the onset of the trace. Response ampli tude is approximate ly half tha t of the control rat.
on Novem
ber 24, 2015jgp.rupress.org
Dow
nloaded from
Published September 1, 1968

R. A. BSRNARD AND B. P. HALPERN Taste Changes in Vitamin A Deficiency 457
We i gh t losses of the phase 2 v i t a m i n A a c i d - d e p l e t e d g r o u p increased r ap id ly
du r i ng this per iod (Fig. 5). T h e preference tests were t e r m i n a t e d a t the end of per iod 26 a n d fol lowed b y e lect rophysiological recordings.
El ec tr op hy si ol ogy
T h e a p p a r e n t absolute m a g n i t u d e of the electr ical ac t iv i ty of the c h o r d a t y m p a n i nerve of the deficient ra ts was consistent ly less t h a n tha t of the
A. Normal
20 s e c
.A'-'I_E--L , __r"L_~-I .r--L-r--T C-Lf--I ~ , r--l_C-I
H20 O.O01M H20 O.O02M HzO O.O05M H20 O.OIM HzO O.05M H20 O. IM NoCI NoCl NoCl NoCI NoCI NoCl
Rat Chorda tympani
B. V i tamin A Def ic ient
20 s e c
HzO O.OOZM HzO 0.005 M H20 O.OIM Hz 0 0.05M H20 0.1 M NoCI NQCI NoCI NoCI NoC!
Rat Chorda tympani F m u ~ 8. Surnmated chorda tympani responses to a series of NaC1 solutions, obtained from the same rats as in Fig. 7. Records read from right to left. Solutions were presented in ascending order of concentration. A. Records from a normal rat. Responses can be seen starting at 0.001 ~ NaCI. B. Records from a deficient rat. Responses are smaller and become apparent only at 0.005 M NaCI.
on Novem
ber 24, 2015jgp.rupress.org
Dow
nloaded from
Published September 1, 1968

458 T H E J O U R N A L O F G E N E R A L P H Y S I O L O G Y • V O L U M E 5 2 • I 9 6 8
controls. The response of the deficient rats to 0.1 M NaC1, which was used as the reference standard for all stimuli, was less than half of normal at both the onset and cessation of stimulus flow (Table V). A typical record of a whole nerve discharge from a deficient rat (Fig. 7) showed diminished amplitude for the tongue at rest and during water flow and diminished amplitude and a smaller number of action potentials in response to 0.1 M NaCI stimulation. Records of summated responses of a deficient rat (Fig. 8) also showed dimin- ished amplitude throughout a concentration series of NaCI solutions. In the normal rat responses were obtained from 0.001 M NaCI to 0.1 M NaCI, whereas
lOOm DEFICIENT m,,,,.H =e
~" 801= CONTROL ~ /
6 0 m
- , 4 0 - .
Z o Q. 2 0 m
| | II
N 0.01 M 0.001 M COLD
0.001 0.0[ 0.1 QHCL OSO 4 H20 MOLAR CONCENTRATION OF NACL
FIOUR~ 9. Median summated chorda tympani response magnitudes following stimula- tion of the anterior tongue of four vitamin A-deficient and three normal rats with NaCI, quinine hydrochloride (QHCI), and quinine sulfate (QSO4) solutions and cold (4-14°C) distilled water. Ordinate represents magnitude of response in arbitrary units, adjusted to 100 units for the response to 0.1 M NaC1. Abscissa represents molar concentration, plotted logarithmically for NaC1.
responses from the deficient rats were perceptible only at 0.005 M NaCI. The stimulus-response relationships of the deficient rats were altered within the NaC1 concentration series as well (Fig. 9). The response to 0.01 M NaCI by the deficient rats was a smaller fraction of the response to 0. I M NaG1 than in the normal rats. However, the relationship between 0.1 ~ NaC1 and 0.01 M QHC1 was altered in the direction of greater than normal sensitivity to the quinine. In relation to 0.1 M NaCI, the deficient rats were less sensitive to cold (4-14°C) water than the normal ones.
Histology
There were no apparent differences in deficiency symptoms between the rats of the vitamin A-deficient group (experiment I, phase 1) and the rats of the vitamin A acid group after the final withdrawal of vitamin A acid (experiment I I I , phase 2). All showed the classical gross symptoms of conjunctivitis,
on Novem
ber 24, 2015jgp.rupress.org
Dow
nloaded from
Published September 1, 1968

R. A. BERNARD AND B. P. HALPERN Taste Changes in Vitamin A Deficiency 459
xerophtha lmia , exudate a round the eyes, u e i g h t loss, etc. Histologically,
there was increased kerat inizat ion of the dorsal surface of the tongue. T h e
usual thin layer of kerat in on the dorsal surface of the fungiform papil lae
(Figs. 10 A, 12), which in the rat conta in a single taste bud, was thicker than
normal and kerat in was found to extend into the pore area of the taste buds
FIOURE 10 A. Section through the longitudinal axis of a normal rat fungiform papilla. B. Same as in A, but from vitamin A-deficient rat. Dark-staining keratin infiltrates taste bud pore. C. Section perpendicular to the longitudinal axis of a vitamin A-defi- cient rat fungiform papilla. In upper half of photo the taste bud appears as a series of concentric rings surrounding dark-staining keratin in the pore. The smaller whorl-like structures are filiform papillae. In the lower left half of the photo is another taste bud at a level below the pore. Ladewig stain. X 953. Color excerpts in Fig. 12.
(Figs. l0 B, C, 12). Similar effects were found in the foliate and c i rcumval la te
papillae, where the taste buds lie along a groove-like depression (Figs. 11 A, 12). The re was increased kerat inizat ion of the epithelial surface as well as kerat in filling up the pore of the taste buds and a piling up of kerat in and other debris in the groove (Figs. 11 B, 12). A l t h o u g h not visible in the photo-
on Novem
ber 24, 2015jgp.rupress.org
Dow
nloaded from
Published September 1, 1968

46o T H E J O U R N A L O F G E N E R A L P H Y S I O L O G Y - V O L U M E 5 3 - i958
graphs, the mucous and serous glands of the tongue were atrophied and the ducts leading into the foliate and circumvallate grooves were distended and filled with debris. There were also numerous abscesses at the base of the tongue. The taste buds did not appear atrophied or greatly diminished in number. The five deficient rats had an average of 143 (range: 51-201) taste buds in the circumvallate papilla while the one normal one in which the count was made had 181.
FIGURE 11 A. Section th rough normal ra t c i rcumvallate papiIla. In the lower r ight q u a d r a n t are two taste buds whose pores are visible at the surface of the groove. The upper of the two pores is seen as an in terrupt ion in the th in kerat in layer covering the groove at tha t point. Ladewig stain. X 450. B. Section th rough vi tamin A-defic ient ra t c i rcumvallate papilla. In the left half of the photo are three taste buds whose pores reach the surface of the groove. The pores are filled wi th tuftlike accumulat ions of kerat in and the groove is filled with debris. At the top of the photo is the debris-filled duct of one of the accessory glands. Ladewig stain. X 249. Color excerpts in Fig. 12.
D I S C U S S I O N
Taste preference changes clearly occurred in conjunction with depletion of vitamin A reserves (experiment I, phase 1 ). These changes were in the direc- tion of loss of discrimination. Both the normally selected and the normally rejected stimuli were brought close to a neutral level, not significantly differ- ent from that of water. It is hypothesized that these changes in preference behavior resulted from disruption of the receptors and were not due to general debility. The early appearance of a statistically significant change in NaC1
on Novem
ber 24, 2015jgp.rupress.org
Dow
nloaded from
Published September 1, 1968

R. A. BERNARD AND B. P. HALPERN Taste Changes in Vitamin A Deficiency 461
preference, which preceded weight loss or other deficiency symptoms, tends to rule out debility as an important factor in the observed behavioral changes.
The lack of complete recovery of NaCI preference may have been due to irreversible tissue damage. The return of normal levels of QSO4 rejection but not of NaC1 selection (experiment I, phase 2) may have resulted from
FIGURE 12. Top row, sections through normal and vitamin A-deficient rat fungiform papilla corresponding to Fig. 10 A, B, and C. Bottom row, sections through normal and vitamin A-deficient rat circumvallate papilla corresponding to Fig. l 1 A and B. Mag- nifications (left toright): top row, × 253, X 450, X 253; bottom row, X 692, X 369.
0.01 M NaC1 being closer to preference threshold than 30 ~M QSO4 (Pfaff- mann, 1957). However, the recovered rats (vitamin A - r e p l e t e d ) r e a c t e d normally to a wide range of Na sacch concentrations but showed supranormal rejection of SOA (experiment II). The reason for this is unclear.
Although the vitamin A acid group did not differ from the normal group in its preference behavior towards NaC1 and QSO4 (experiment I), this experiment did not prove conclusively that vitamin A acid could maintain
on Novem
ber 24, 2015jgp.rupress.org
Dow
nloaded from
Published September 1, 1968

462 T H E J O U R N A L O F G E N E R A L P H Y S I O L O G Y • V O L U M E 5 ° • i968
normal taste preferences in the absence of vitamin A alcohol, since there was yet no direct evidence that the vitamin A acid group was actually depleted of vitamin A, as was the vitamin A-deficient group. The accidental and unknown ingestion of the wrong diet on just one occasion would be enough to provide sufficient vitamin A for several weeks. This lack of direct evidence also seems to be true of Duncan's (1964) experiment.
The decreased aversion to SOA shown by the vitamin A acid rats in experi- ment II was unexpected. An explanation of this behavior was obtained when the same rats began to slow down in their growth toward the end of the experiment. As they continued to lose weight in spite of increased supple- mentation with vitamin A acid, it became clear that they were indeed depleted of vitamin A stores. The reversal of the weight loss by a fresh supply of vitamin A acid also showed that the original vitamin A acid had somehow lost its potency. Therefore, the decreased aversion to SOA could be explained both by the absence of vitamin A and an insufficient amount of vitamin A acid. Clarification of the role of vitamin A acid was obtained only in experiment III .
In experiment I I I the sudden weight loss following the complete with- drawal of vitamin A acid provided direct evidence that the experimental rats were now completely depleted of vitamin A alcohol. The normal taste preferences for quinine and NaC1 in the periods immediately preceding the deprivation clearly demonstrated that vitamin A acid could maintain normal taste preferences in rats totally depleted of vitamin A alcohol. The reversible production of a taste deficit in the rats provided further evidence that the role of vitamin A in taste could be adequately filled by vitamin A acid. The role of vitamin A in taste is thus quite unlike its role in the visual system.
The delayed recovery of growth when vitamin A acid was restored to the diet indicated that this substance may not be as efficient as vitamin A alcohol in promoting growth. The return to normal quinine preference before growth was restored also suggests that vitamin A acid may have a more direct role in taste than in growth and /or that taste may have a greater priority in the utilization of available vitamin A. The restoration of normal preference while weight losses continued also tends to rule out debility or weight loss as the explanation for the taste deficits.
The electrophysiological and histological evidence clearly demonstrates that pronounced structural and functional changes at the periphery were involved in the behavioral taste deficits. The histological changes did not reveal atrophy and disappearance of the receptor cells, such as follow transec- tion of the taste nerves of the rat (Guth, 1957). The persistence of the taste cells as well as the fact that the rats were fully grown when they developed the taste deficit in the last experiment tends to rule out constriction of the taste nerves by diminished bone growth as the cause. The reversibility of the taste changes in the earlier experiments also tends to rule out that explanation.
on Novem
ber 24, 2015jgp.rupress.org
Dow
nloaded from
Published September 1, 1968

R. A. BERNARD AND B. P. HALPERN Taste Changes in Vitamin A Deficiency 463
The diminished electrical activity of the chorda tympani nerve and the impaired behavior were most probably due to diminished activity of the receptors.
In addition to the taste buds, the adjacent epithelial and glandular tissues were also severely affected. The debris in the trenches of both the vallate and foliate papillae was probably due to the atrophy of the mucous and serous glands that normally irrigate these channels. The role of these glandular secretions in taste function is not known. It may be inferred that they at least keep the vallate and foliate grooves free and clear. How important this may be in taste reception is not clear but the malfunction of these glands undoubt- edly contributed to the taste deficit. The massive infiltration of the taste bud pores by keratin, resulting in disruption of normal receptor stimulation, would seem to be the major factor responsible for the taste impairment.
The effects of keratinization lead to the conclusion that the role of vitamin A in taste is derived from its more general role of maintaining epithelial cell integrity. The ability of vitamin A acid to maintain normal taste clearly shows that vitamin A is not a specific requirement for taste as it is in vision, where the alcohol form alone can be utilized in a known biochemical reaction.
A biochemical basis for the epithelial role of vitamin A has been described by Wolf and Johnson (1960). They found that the vitamin was involved in the biosynthesis of mucopolysaccharides and postulated that in the presence of vitamin A epithelial cells were stimulated to produce mucus, and in the absence of the vitamin they formed keratin instead. This is of interest because histological and electron microscopic evidence indicates the presence of a mucoid substance in the pore of the taste bud (Farbman, 1965; Gray and Watkins, 1965; Scalzi, 1967). The histology of the deficient foliate and vallate taste bud (Figs. 11 B, 12) shows the keratin seemingly growing out of the taste bud. The keratin in the taste pore would not be due to excess production by adjacent epithelial ceils but rather it would be the degenerative product of normal taste cell secretion, resulting from the absence of vitamin A. This suggests the hypothesis that the taste receptor cell secretes a mucoid substance that is involved in the chemoreceptive process. Scalzi (1967) identified this substance as a neutral mucopolysaccharide and suggests that it may act as an ion exchange resin. If this be so, it raises the possibility that the general epithelial role of vitamin A can take a very specialized form depending on the epithelial tissue involved.
Portions of this investigation were carried out at the College of Veterinary Medicine, Corneil Uni- versity, and at the Upstate Medical Center, State University of New York, Syracuse. We thank Dr. M. R. Kate for his support and encouragement. The histology was performed under the direction of Dr. L. P. Krook at Cornell University. This work was supported in part by the National Institutes of Health Grants NB-07143, NB-06945, NB-3896 and SO4-FR06002.
Received.for publication 1 February 1968.
on Novem
ber 24, 2015jgp.rupress.org
Dow
nloaded from
Published September 1, 1968

464 T H E J O U R N A L O F G E N E R A L P H Y S I O L O G Y • V O L U M E 5 o • ~968
R E F E R E N C E S
I . B E R N A R D , R. A., B. P. H A L P E R N , and M. R. KARE. 1961. Effect of vitamin A deficiency on taste. Proc. Soc. Exptl. Biol. Med. 108:784.
2. BERNARD, R. A., B. P. HALPE~'~, and M. R. K A y . 1962. The reversible effect of vitamin A deficiency on taste. Federation Proc. 21:362.
3. DOWLI~G, J. E., and G. WALD. 1958. Vitamin A deficiency and night blindness. Proc. Natl. Acad. Sci. U.S. 44:648.
4. DOW~NO, J. E. and G. WALD. 1960. The biological function of vitamin A acid. Proc. Natl. Acad. Sci. U.S. 46:587.
5. DLU~CAN, C.J . 1964. The taste bud membrane and the role of vitamin A. Inter. Z. Vitamin- f orsch. 34:410.
6. FARBMAN, A. I. 1965. Fine structure of the taste bud. J. Ultrastruct. Res. 12:328. 7. GRAY, E. G., and K. C. WATI~INS. 1965. Electron microscopy of taste buds of the rat.
Z. ZeUforsch. Mikroskop. 66:583. 8. GuTn, L. 1957. The effects of glossopharyngeal nerve transection on the cireumvallate
papilla of the rat. Anat. Rec. 128:715. 9. HALPE~, B. P. 1963. Chemical coding in taste-temporal patterns. In Olfaction and Taste.
Y. Zotterman, editor. Pergamon Press, New York. 1:275. 10. HALPEm~, B. P., R. A. BE~ARD, and M. R. KARE. 1962. Amino acids as gustatory stimuli
in the rat. J. Gen. Physiol. 45:681. 11. PFAPFMANN, C. 1957. Taste mechanisms in preference behavior. Am. J. Clin. Nutr. 5:142. 12. SCALZI, H. A. 1967. The cytoarchitecture of gustatory receptors from the rabbit foliate
papillae. Z. Zellforsch. Mikroskop. 80:413. 13. SIEGEL, S. 1956. Nonparametric Statistics. McGraw-Hill Book Company, Inc., New York. 14. WOLF, G., and B. C. JO,NSON. 1960. Vitamin A and mueopolysaceharide biosynthesis.
Vitamins Hormones. 18:439.
on Novem
ber 24, 2015jgp.rupress.org
Dow
nloaded from
Published September 1, 1968


