Embed Size (px)
Citation preview
TAX PLANNING FOR THE LOBBY
TAX
Mary Ann Hofmann
ABSTRACT
In 1993, Congress eliminated the business deduction for lobbying. The
disallowance extends to dues paid to tax-exempt trade and labor asso-
ciations when those organizations conduct lobbying activities. Associa-
tions are required to notify members regarding the portion of their dues
that is non-deductible or pay a flat 35% tax on their lobbying expendi-
tures. This study examines the factors considered by associations in
making the pay-or-notify decision, looking for evidence that associations
consider the marginal tax rates of their members to insure that the party
with the lowest marginal rate pays the tax. Data are obtained from the
IRS and is supplemented by data collected in a mail survey. The evidence
suggests that associations do not necessarily attempt to minimize the total
tax cost to all parties. This study identifies a situation where non-profit
firms might fail to implement an optimal tax planning strategy, and where
the absence of a competitive market allows this inefficiency to persist.
INTRODUCTION
The IRC Section 6033 proxy tax, commonly known as the lobby tax, sets upa unique situation in which a tax-exempt association that engages in
1
3
5
7
9
11
13
15
17
19
21
23
25
27
29
31
33
35
37
39
3B2v8:07fXML:ver:5:0:1 AT� V017 : 17002 Prod:Type:
pp:37264ðcol:fig::NILÞED:
PAGN: SCAN:17/8/06 12:14
Advances in Taxation, Volume 17, 37–64
Copyright r 2007 by Elsevier Ltd.
All rights of reproduction in any form reserved
ISSN: 1058-7497/doi:10.1016/S1058-7497(06)17002-7
37
1
3
5
7
9
11
13
15
17
19
21
23
25
27
29
31
33
35
37
39
lobbying activities can choose whether to pay a tax on those activities or topass the incidence of the tax on to its members by making their dues a non-deductible expense. Even if one argues that the incidence of the tax ulti-mately falls on the members either way, the organization’s choice influencesthe rate at which the tax is paid – 35% if paid by the association, andanywhere from 0% to 50%, depending on the marginal tax bracket, ifpassed along to the members in the form of a disallowed deduction.1 Thisarticle explores the factors that influence the association’s choice of whetherto notify members as to the non-deductibility of their dues or to pay thelobby tax. Specifically, it looks for evidence that trade, labor, and agricul-tural associations (heretofore referred to simply as associations) consider themarginal tax rates of their members to insure that the party with the lowestmarginal rate pays the lobby tax. This is the first research study to examineempirically the lobby tax issue.
The pay-or-notify decision is modeled using a binomial logistic regression.Data are obtained from the IRS Statistics of Income (SOI) Division and issupplemented by a mail survey of associations with lobbying activity. Theevidence suggests that associations do not necessarily seek to minimize thetotal tax cost associated with the lobby tax. Non-tax considerations seem todrive the decision, but it is not clear that associations always make theoptimal choice for their members. This study identifies a situation wherenon-profit firms might ignore the ‘‘all parties, all taxes, all costs’’ tax-plan-ning approach (Scholes et al., 2005) and where the absence of a competitivemarket allows this inefficiency to persist. The paper proceeds as follows. Thenext section describes the lobby tax and develops the primary researchproposition. The third and fourth sections discuss the research method andthe data, while the final sections present the results and conclusions.
BACKGROUND AND HYPOTHESIS DEVELOPMENT
The Taxation of Lobbying
In the United States, lobbying has become an accepted and ever-present partof the political system. Many large corporations, labor unions, professionalassociations, educational groups, medical interests, farm alliances, and var-ious public interest and social issue groups maintain permanent lobbies inWashington, DC and in state capitals to promote and protect their interests(‘‘Lobbying,’’ 2001–2004; see also http://www.opensecrets.org). Trade andprofessional associations, labor unions, agricultural associations, and other
MARY ANN HOFMANN38
alliances provide an important means of pooling resources to make lobbyingmore effective and efficient. One of the major functions of many such tax-exempt membership organizations is to advance their interests in the po-litical arena (Hudson Institute, 1990). The potential for corruption, espe-cially bribery of public officials, has given lobbying an unfavorableconnotation and the federal government has made many attempts to reg-ulate lobbying.2 The Internal Revenue Code also contains several disincen-tives for lobbying.
While amounts spent on political campaigns or for ‘‘grass roots’’ lobbyinggenerally have not been deductible for tax purposes, the Revenue Act of1962 allowed a business deduction for expenses that are directly attributableto appearances before committees or individual members of federal, state, orlocal legislative bodies in connection with existing or proposed legislationthat will, or may reasonably be expected to, affect such trade or business(P.L. 87–834 Sec. 3(a)). This Act also allowed a deduction for amountsexpended in communicating information on legislative matters to trade orprofessional organizations of which the taxpayer was a member, as well asfor dues paid to such an organization to conduct the actual lobbying.
The Section 6033 Proxy Tax
The Omnibus Budget Reconciliation Act of 1993 brought an end to gov-ernment subsidy of lobbying by eliminating the business tax deductibility oflobbying expenditures. Furthermore, it prevents taxpayers from obtainingan indirect deduction for the lobbying carried out through tax-exempt tradeassociations. Individuals or corporations paying dues to a non-profit or-ganization, such as a trade association, that engages in lobbying activitiesare disallowed from deducting the portion of those dues allocable to lob-bying activities, and lobbying expenses are presumed to be paid first fromdues. If a non-profit membership organization fails to notify its membersregarding the amount of their non-deductible dues, the organization itselfmust pay a flat 35% tax on its lobbying expenditures. This payment is theproxy tax, more commonly known as the lobby tax. In tax year 1998, 612associations reported and paid a total of $10.8 million of lobby tax (Riley,2002).
Section 6033(e) of the Internal Revenue Code outlines the requirementsfor associations to report their lobbying activities or pay the lobby tax, andit created a fair amount of controversy when first enacted. The AmericanSociety of Association Executives (ASAE) predicted that the denial of a
1
3
5
7
9
11
13
15
17
19
21
23
25
27
29
31
33
35
37
39
Tax Planning for the Lobby Tax 39
business deduction for lobbying expenditures would dramatically reducelobbying activities by associations and thus severely limit the voice of theirconstituencies in government. In the words of ASAE’s government affairsissues analyst, ‘‘This curtailment of legislative speech not only threatens thelegitimate interests of the association community, but it is a clear indicatorof the lobby tax’s unconstitutionality’’ (Tenenbaum, 1994b, p. 55; Smith,1995).3 A large part of the association community’s objection to this law isthat it places an undue record-keeping burden on associations that lobby(Weiland, 1993; Tenenbaum, 1994a; Smith, 1995).
A Tax-Planning Model for the Lobby Tax
Tax planning in the corporate world is best described by Scholes et al.(2005). Their book, Taxes and Business Strategy: A Planning Approach,presents a global framework for business decisions involving taxes. In es-sence, this approach involves maximizing the after-tax net cash flows to allparties to a business transaction. This framework, first published in 1992,has been widely adopted, and academic researchers have found evidence ofits validity in a variety of empirical studies.4 For securities trading in publicmarkets, and for publicly traded firms operating in competitive markets, theopportunities for arbitrage seem to ensure that the optimal tax-planningapproach is followed, but the question remains: does optimal tax planningapply to non-profit firms operating in a non-competitive environment? Thelobby tax, therefore, provides an opportunity to examine tax planning in thenon-profit sector.
Several recent studies have examined taxes in the non-profit setting –specifically the Unrelated Business Income Tax (UBIT). Sansing (1998) ex-plores analytically the impact of the UBIT in inducing productive efficiencyamong nonprofits. Yetman (2001) finds evidence that charitable non-profitsshift expenses from exempt activities to taxable activities to minimize theUBIT (see also Omer & Yetman, 2003). Hofmann (2004 QA :1) finds similar ev-idence using a sample of non-charitable nonprofits. These studies suggestaggressive tax planning (or perhaps even tax evasion) on the part of exemptorganizations subject to the UBIT. The lobby tax could be susceptible to asimilar type of cost allocation bias. When an association engages in in-houselobbying activities, a portion of administrative overhead costs must be al-located to lobbying expense, and thus be subject to the lobby tax. Clearly, acarefully designed cost system could minimize such allocations. The focus ofthis article, however, is not on the allocation of expenses to lobbying.
1
3
5
7
9
11
13
15
17
19
21
23
25
27
29
31
33
35
37
39
MARY ANN HOFMANN40
Rather, taking the lobbying expenses reported as given, this study exploresthe association’s choice of whether to pay the lobby tax or shift it to mem-bers as a disallowed deduction.
If the corporate model applies to the non-profit world, the goal of taxplanning for the lobby tax should be to maximize net after-tax cash flows toall parties. Since the pay-or-notify decision primarily involves cash outflows,the objective would be to minimize the total tax and non-tax costs to theassociation and its members. Consider, for example, an association whosemembership consists of self-employed professionals, each of whom is in the25% marginal federal income tax bracket and is subject to the 15.3% self-employment tax. If this association collects dues of $100,000 per year andspends $50,000 on lobbying, it would have to either notify the members that50% of their dues are not deductible or pay $17,500 (35%� $50,000) inlobby tax (which it possibly could re-coup through higher dues assessments).Fig. 1 illustrates three available alternatives. The decision to notify themembers has a zero tax cost to the association but a cost of $18,682 inadditional taxes paid by the members. In Alternative B, the association paysthe tax. Consequently, the services the members receive are reduced by$17,500, but they avoid $18,682 in taxes. Alternative C, where the associ-ation pays the tax and increases dues by an offsetting amount, has the samenet result for the association as Alternative A but at a much lower cost tothe members, since the dues are tax-deductible. Before one can choose theoptimal alternative, one must compare the $17,500 reduction in services tothe $18,682 increase in taxes or the $10,961 after-tax increase in dues. Forlack of evidence to the contrary, the initial assumption is that membersvalue the services provided by the association on a dollar-for-dollar basis(this assumption is revisited in the Sensitivity Analysis section of the paper).Thus, members should prefer the $17,500 reduction in services (AlternativeB) to the $18,682 increase in taxes (Alternative A). Likewise, they shouldprefer the $10,961 after-tax increase in dues (Alternative C) to the $17,500reduction in services (Alternative B). Therefore, Alternative C is the optimalchoice.
Some general propositions emerge from an examination of Fig. 1. Alter-native B will be preferable to Alternative A whenever the members’ com-bined marginal tax rate (CMTR) with respect to the dues deduction isgreater than 35%. The CMTR equals the change in total tax liability (self-employment taxes plus income tax) resulting from the deduction of $1 ofassociation dues; Appendix A shows the derivation of the formula. Alter-native C will be preferable to Alternative B if members can take advantageof an increased tax deduction for the increased dues, but will be preferable
1
3
5
7
9
11
13
15
17
19
21
23
25
27
29
31
33
35
37
39
Tax Planning for the Lobby Tax 41
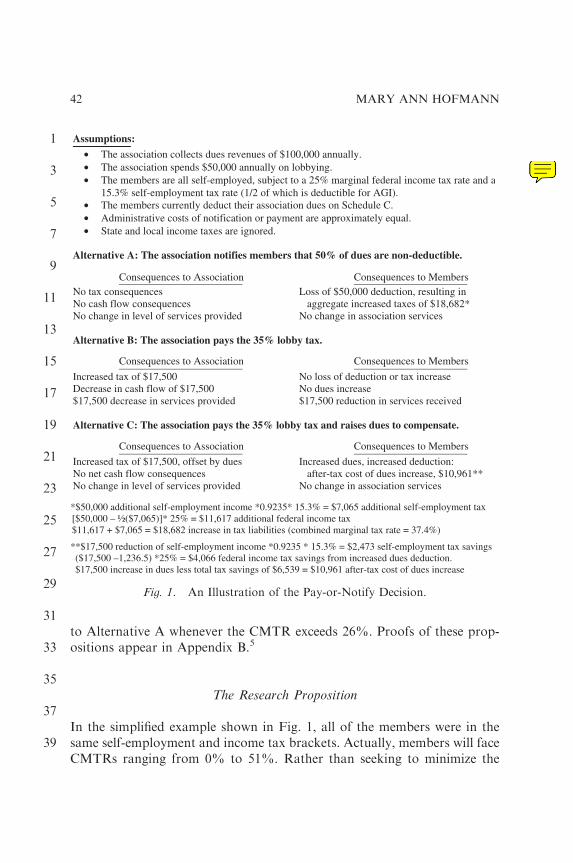
to Alternative A whenever the CMTR exceeds 26%. Proofs of these prop-ositions appear in Appendix B.5
The Research Proposition
In the simplified example shown in Fig. 1, all of the members were in thesame self-employment and income tax brackets. Actually, members will faceCMTRs ranging from 0% to 51%. Rather than seeking to minimize the
1
3
5
7
9
11
13
15
17
19
21
23
25
27
29
31
33
35
37
39
Assumptions:
• The association collects dues revenues of $100,000 annually.• The association spends $50,000 annually on lobbying.• The members are all self-employed, subject to a 25% marginal federal income tax rate and a
15.3% self-employment tax rate (1/2 of which is deductible for AGI).• The members currently deduct their association dues on Schedule C.• Administrative costs of notification or payment are approximately equal.• State and local income taxes are ignored.
Alternative A: The association notifies members that 50% of dues are non-deductible.
Consequences to Association Consequences to MembersNo tax consequences No cash flow consequences No change in level of services provided
Loss of $50,000 deduction, resulting inaggregate increased taxes of $18,682*
No change in association services
Alternative B: The association pays the 35% lobby tax.
Consequences to Association Consequences to Members
Increased tax of $17,500Decrease in cash flow of $17,500$17,500 decrease in services provided
No loss of deduction or tax increaseNo dues increase$17,500 reduction in services received
Alternative C: The association pays the 35% lobby tax and raises dues to compensate.
Consequences to Association Consequences to Members
Increased tax of $17,500, offset by duesNo net cash flow consequencesNo change in level of services provided
Increased dues, increased deduction:after-tax cost of dues increase, $10,961**
No change in association services
*$50,000 additional self-employment income *0.9235* 15.3% = $7,065 additional self-employment tax[$50,000 – ½($7,065)]* 25% = $11,617 additional federal income tax$11,617 + $7,065 = $18,682 increase in tax liabilities (combined marginal tax rate = 37.4%)
**$17,500 reduction of self-employment income *0.9235 * 15.3% = $2,473 self-employment tax savings($17,500 –1,236.5) *25% = $4,066 federal income tax savings from increased dues deduction.$17,500 increase in dues less total tax savings of $6,539 = $10,961 after-tax cost of dues increase
Fig. 1. An Illustration of the Pay-or-Notify Decision.
MARY ANN HOFMANN42
total taxes paid by all parties, the association is more likely to attempt toplease the greatest number of members. Members in a marginal tax bracketat or below 26% or those who do not or cannot deduct the dues as abusiness expense or employment-related expense will be best served by beingdisallowed the deduction for the dues (rather than having to pay higher duesor receive diminished services). On the other hand, members in a combinedmarginal tax bracket (with respect to the dues deduction) above 26% willprefer that the association pay the lobby tax. Thus, the research propositionis:
The probability that an association pays the lobby tax is positively associated with the
proportion of its membership that is in a combined marginal tax bracket (with respect to
the dues deduction) exceeding 26%.
Non-tax costs also need to be considered, such as record-keeping and ad-ministrative costs that might vary between the two alternatives and acrossfirms. The lobbying expenditures must be tracked whether for disclosure orfor lobby tax computation, so basic record-keeping costs should not differbetween the two options (Tenenbaum, 1994b). Disclosure of lobbying ac-tivity usually takes place on the dues assessment notice, so no additionalmailings are required for firms choosing to notify. Associations that pay thelobby tax must file Form 990-T; thus, associations that do not have Un-related Business Income to report incur an incremental filing cost.6 In ad-dition to administrative costs, the political costs of the choice must beconsidered. To implicitly pass the incidence of the tax to the membership,the association must disclose the extent of its lobbying activities. An articlein Association Management suggested that some associations might be re-luctant to disclose lobbying expenses to members because they fear thatmembers may disapprove of how much (or how little) of their dues are beingspent on political activities (Hopkins & Tesdahl, 1995).7 Finally, associa-tions also likely vary as to budgetary and cash flow constraints. These non-tax costs and constraints must be included in the decision model.
RESEARCH METHOD
The Logit Regression Model
The choice of whether to disclose the lobbying expenditures or pay the lobbytax can be analyzed using a binomial logistic (logit) regression model.8 Thegeneral form of this model is
1
3
5
7
9
11
13
15
17
19
21
23
25
27
29
31
33
35
37
39
Tax Planning for the Lobby Tax 43
PAY ¼ f fCMTR; non� tax factors and control variablesg
where the dependent variable PAY takes on the value of one if the asso-ciation elects to pay the lobby tax and zero otherwise, and CMTR measuresthe proportion of the membership with a CMTR above the specified cut-off.Non-tax factors and control variables include the size of the association, theproportion of revenue derived from dues, the proportion of total expensesdevoted to lobbying, the proportion of dues spent for lobbying, adminis-trative costs of notification versus paying the lobby tax, cash flow con-straints, etc. See Table 3, which appears later in this article, for a completedescription of the model and definitions of the variables.
The Marginal Tax Rate Variable
It is not possible to determine the marginal tax rates of the members of eachassociation, but demographic information about each organization’s mem-bership is used to estimate the proportion of members in a marginal taxbracket above 26%. Basically, members fall into one of four possible tax-status categories: employed individuals (wage-earners), self-employed indi-viduals (including sole proprietors and partners), corporations, or tax-ex-empt organizations. Each category faces a different marginal tax rate withrespect to the deduction for association dues. Obviously, tax-exempt mem-bers derive no benefit from the deduction of membership dues and thus facea marginal tax rate of zero. Corporate tax rates range from 15% to 35%.Corporations with taxable income below $75,000 face a marginal tax rate of25% or less. The remainder falls into the 34% or 35% marginal income taxbrackets. For corporations making the ‘‘S’’ election, income and deductionsflow through to the shareholders and are taxed at their personal rates. In1997, the lowest individual tax bracket is 15%; the next one is 28%. Detaileddata regarding specific members are unavailable; it seems reasonable toassume that the majority of corporate members have sufficient income to bein a marginal tax bracket above 26%.
Members who are wage earners may deduct dues paid to an association asan unreimbursed employee expense, reported on Schedule A of the Form1040. Individuals in the highest marginal tax bracket who are able to takeadvantage of such a deduction could save up to 39.6% (in 1997). However,unreimbursed employment-related expenses can be deducted only to theextent they exceed 2% of adjusted gross income (AGI); and the taxpayergains no tax benefit unless total itemized deductions exceed the standard
1
3
5
7
9
11
13
15
17
19
21
23
25
27
29
31
33
35
37
39
MARY ANN HOFMANN44
deduction. Furthermore, itemized deductions are subject to phase-out forhigh-AGI taxpayers. Owing to these significant limitations, the actual taxsavings from deducting association dues is likely to be zero for a substantialproportion of wage-earner members. Employees who are reimbursed bytheir employers under an accountable plan report no income or deductionrelating to the dues, and thus face a marginal tax rate of zero. Therefore, theassumption is that the majority of employed members face a CMTR of zerowith respect to the dues deduction.9
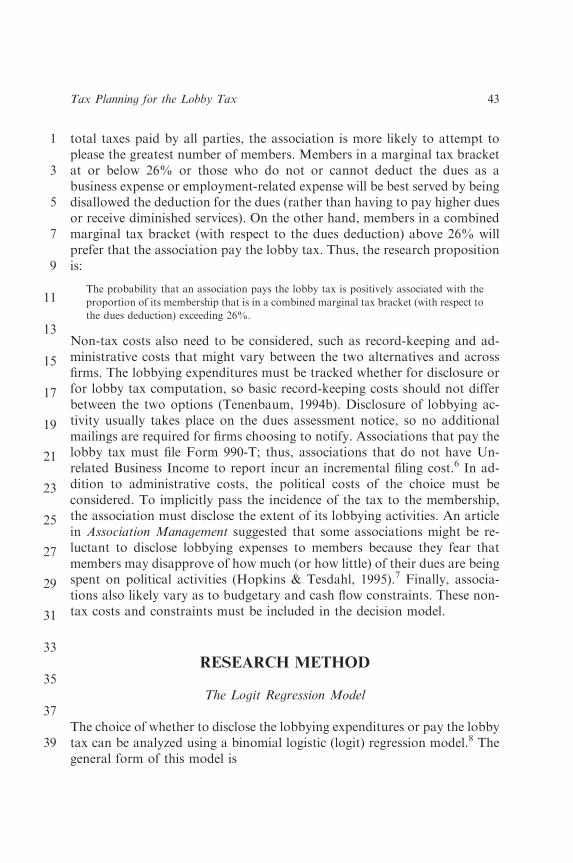
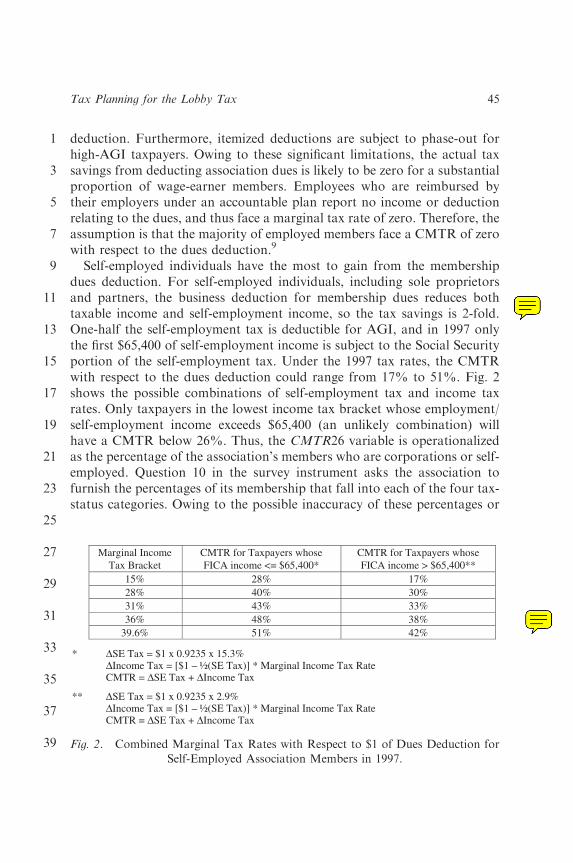
Self-employed individuals have the most to gain from the membershipdues deduction. For self-employed individuals, including sole proprietorsand partners, the business deduction for membership dues reduces bothtaxable income and self-employment income, so the tax savings is 2-fold.One-half the self-employment tax is deductible for AGI, and in 1997 onlythe first $65,400 of self-employment income is subject to the Social Securityportion of the self-employment tax. Under the 1997 tax rates, the CMTRwith respect to the dues deduction could range from 17% to 51%. Fig. 2shows the possible combinations of self-employment tax and income taxrates. Only taxpayers in the lowest income tax bracket whose employment/self-employment income exceeds $65,400 (an unlikely combination) willhave a CMTR below 26%. Thus, the CMTR26 variable is operationalizedas the percentage of the association’s members who are corporations or self-employed. Question 10 in the survey instrument asks the association tofurnish the percentages of its membership that fall into each of the four tax-status categories. Owing to the possible inaccuracy of these percentages or
1
3
5
7
9
11
13
15
17
19
21
23
25
27
29
31
33
35
37
39
Marginal IncomeTax Bracket
CMTR for Taxpayers whoseFICA income <= $65,400*
CMTR for Taxpayers whoseFICA income > $65,400**
15% 17%28% 30%31% 33%36% 38%
39.6%
28%40%43%48%51% 42%
* ∆SE Tax = $1 x 0.9235 x 15.3%∆Income Tax = [$1 – ½(SE Tax)] * Marginal Income Tax RateCMTR = ∆SE Tax + ∆Income Tax
** ∆SE Tax = $1 x 0.9235 x 2.9%∆Income Tax = [$1 – ½(SE Tax)] * Marginal Income Tax RateCMTR = ∆SE Tax + ∆Income Tax
Fig. 2. Combined Marginal Tax Rates with Respect to $1 of Dues Deduction for
Self-Employed Association Members in 1997.
Tax Planning for the Lobby Tax 45
the assumptions regarding the marginal tax brackets of members in eachcategory, the CMTR26 variable is subject to measurement error.
Non-Tax and Control Variables
A variety of variables are used to control for the non-tax costs that mightdiffer between the pay and notify alternatives. The size of the associationserves to control for budgetary constraints. Smaller firms may be less pre-pared to notify members as to the non-deductibility of dues but also may beless likely to have sufficient cash flow to pay the lobby tax. Thus, it isimpossible to predict the sign of the relationship between size and the choiceto pay the lobby tax. The SIZE variable is measured as the natural log oftotal assets at the end of the year. The ratio of current assets to total assets,CURRENT, is a measure of liquidity.10 Firms with greater liquidity shouldbe better able to pay the lobby tax, so a positive association is predicted forCURRENT. The administrative costs of filing Form 990-T to report andpay the lobby tax are not measurable, but the SOI data does include anindicator for firms filing Form 990-T due to having Unrelated BusinessIncome exceeding $1,000. For these firms, the decision to pay the lobby taxwill not result in additional filing costs. The 990-T variable, therefore, ispredicted to have a positive coefficient. Other factors that might influencethe pay-or-notify decision relate to the significance of dues as a source ofrevenue, DUES%REV; the relative proportion of total expenses representedby lobbying, LOB%EXP; and the relative proportion of dues spent forlobbying, LOB%DUES. The larger the proportion of an association’s totalrevenues derived from dues, the more sensitive it should be to the prefer-ences of its members, suggesting a positive relationship with the choice topay. The larger the proportion of an association’s total expenditures de-voted to lobbying, however, the more significant the lobby tax cost will be tothe association, suggesting a negative relationship. The larger the propor-tion of dues spent for lobbying, the greater will be the loss of the duesdeduction for the members, suggesting a positive impact on the association’sdecision to pay the lobby tax.
1
3
5
7
9
11
13
15
17
19
21
23
25
27
29
31
33
35
37
39
MARY ANN HOFMANN46
THE DATA
Statistics of Income Data
The IRS’s SOI Division’s 1994–1997 Exempt Organization Microdatarecords are the primary source of data. The SOI collects this data from astratified random sample of all Forms 990 filed in each year. Sampling ratesvary from 100% for the largest firms (total assets>$10 million) to 2% forthe smallest firms. The data include most of the line items on Form 990 andits supporting schedules. SOI compiles the returns of 501(c)(4), (5), and (6)organizations – trade, labor, and agricultural associations – separately fromthose of 501(c)(3) charities. Besides revenue and expense numbers and be-ginning and ending balance sheets, Forms 990 filed by associations containinformation regarding membership dues, lobbying expenses, notification tomembers of non-deductibility, and the election to pay the lobby tax.
Although the lobby tax law became effective in 1994, data from the firstfew years of its existence may not fully reflect informed tax planning, forreasons that follow. The law requires associations not wishing to pay thelobby tax to estimate their lobbying expenses for the coming year and notifymembers in advance. Organizations unprepared for this law were forced topay the lobby tax for the first year or two (Riley, 2000). Furthermore, thefinal Treasury regulations, which provide guidelines for the allocation ofcosts to lobbying, were not issued until 1995. Until then, there was someconfusion as to how to implement the new law (Tenenbaum, 1995). Thus, toavoid including observations where the choice was not a deliberate one, thisstudy examines only data from 1997. By then, associations should have hadtime to absorb the implications of the new law and to choose purposefullyhow best to handle the lobby tax.
Fig. 3 reproduces the section of Form 990 dealing with the lobby taxprovisions. Questions 85a and 85b seek to eliminate organizations not sub-ject to the Sec. 6033(e) provisions – organizations whose members are un-able to deduct their dues, and organizations with lobbying expenses belowthe $2,000 de minimis threshold. Associations answering ‘‘Yes’’ to eitherquestion are directed not to complete parts 85c through 85h. In the 1997SOI data set, 784 of the 4,446 Section 501(c)(4), (5), and (6) associationsresponded ‘‘Yes’’ to the first question. These associations would be oneswhose members are either non-profit organizations or employed individualswho probably cannot take advantage of the deduction for unreimbursedemployee expenses. Another 1,625 answered ‘‘Yes’’ to the second question,
1
3
5
7
9
11
13
15
17
19
21
23
25
27
29
31
33
35
37
39
Tax Planning for the Lobby Tax 47
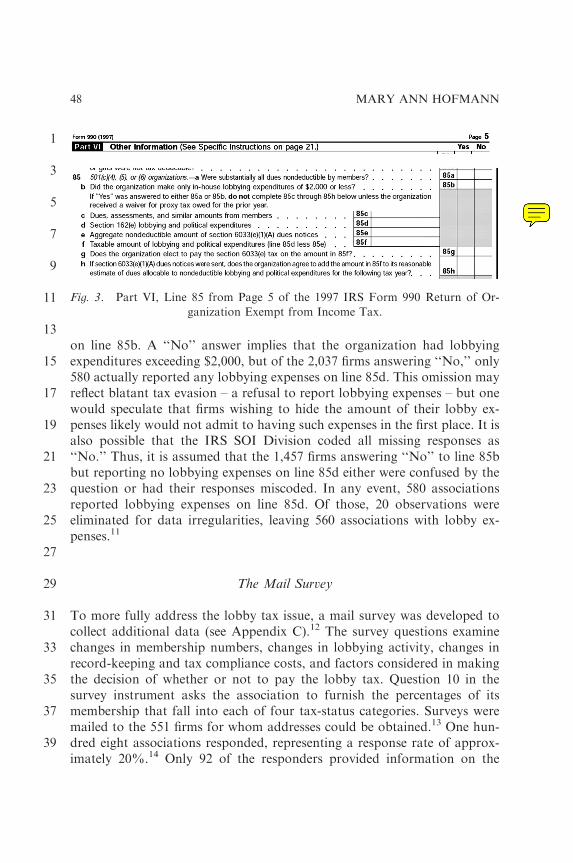
on line 85b. A ‘‘No’’ answer implies that the organization had lobbyingexpenditures exceeding $2,000, but of the 2,037 firms answering ‘‘No,’’ only580 actually reported any lobbying expenses on line 85d. This omission mayreflect blatant tax evasion – a refusal to report lobbying expenses – but onewould speculate that firms wishing to hide the amount of their lobby ex-penses likely would not admit to having such expenses in the first place. It isalso possible that the IRS SOI Division coded all missing responses as‘‘No.’’ Thus, it is assumed that the 1,457 firms answering ‘‘No’’ to line 85bbut reporting no lobbying expenses on line 85d either were confused by thequestion or had their responses miscoded. In any event, 580 associationsreported lobbying expenses on line 85d. Of those, 20 observations wereeliminated for data irregularities, leaving 560 associations with lobby ex-penses.11
The Mail Survey
To more fully address the lobby tax issue, a mail survey was developed tocollect additional data (see Appendix C).12 The survey questions examinechanges in membership numbers, changes in lobbying activity, changes inrecord-keeping and tax compliance costs, and factors considered in makingthe decision of whether or not to pay the lobby tax. Question 10 in thesurvey instrument asks the association to furnish the percentages of itsmembership that fall into each of four tax-status categories. Surveys weremailed to the 551 firms for whom addresses could be obtained.13 One hun-dred eight associations responded, representing a response rate of approx-imately 20%.14 Only 92 of the responders provided information on the
1
3
5
7
9
11
13
15
17
19
21
23
25
27
29
31
33
35
37
39
Fig. 3. Part VI, Line 85 from Page 5 of the 1997 IRS Form 990 Return of Or-
ganization Exempt from Income Tax.
MARY ANN HOFMANN48
demographics of their memberships, which is necessary to estimate themarginal tax rate.
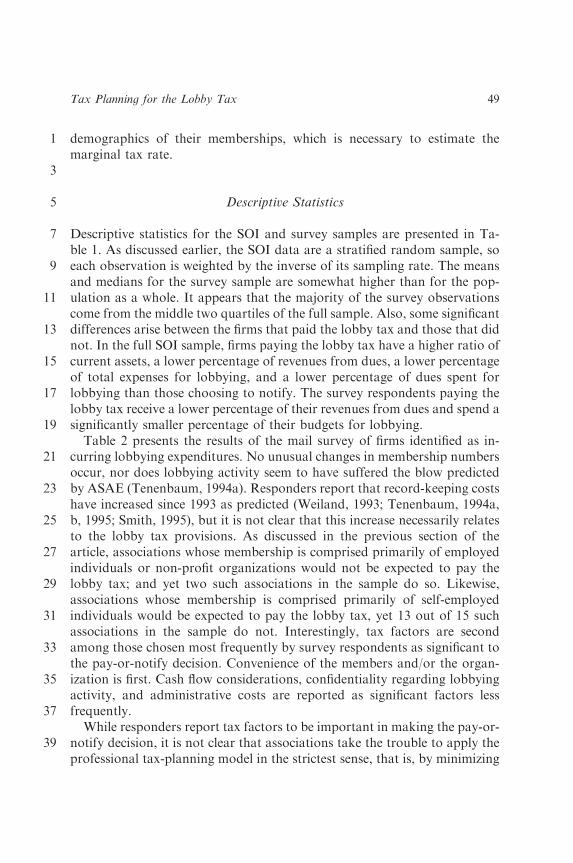
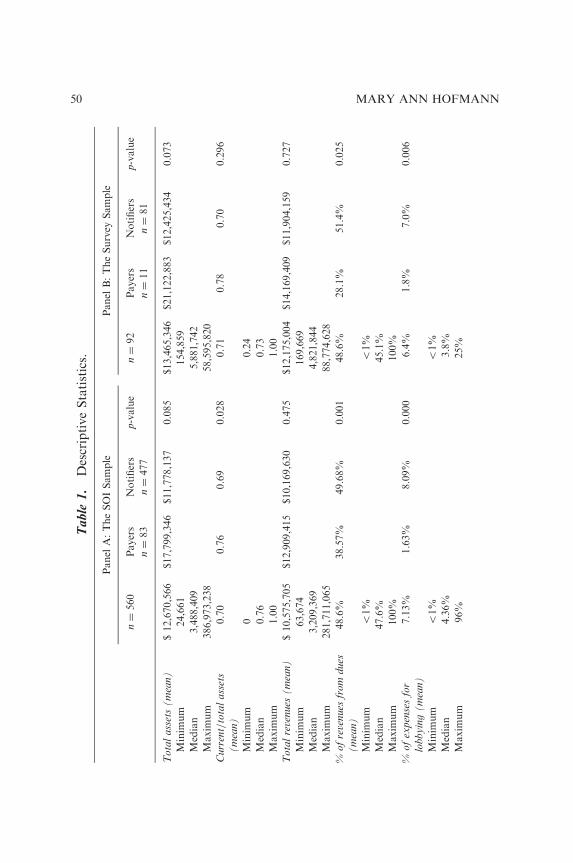
Descriptive Statistics
Descriptive statistics for the SOI and survey samples are presented in Ta-ble 1. As discussed earlier, the SOI data are a stratified random sample, soeach observation is weighted by the inverse of its sampling rate. The meansand medians for the survey sample are somewhat higher than for the pop-ulation as a whole. It appears that the majority of the survey observationscome from the middle two quartiles of the full sample. Also, some significantdifferences arise between the firms that paid the lobby tax and those that didnot. In the full SOI sample, firms paying the lobby tax have a higher ratio ofcurrent assets, a lower percentage of revenues from dues, a lower percentageof total expenses for lobbying, and a lower percentage of dues spent forlobbying than those choosing to notify. The survey respondents paying thelobby tax receive a lower percentage of their revenues from dues and spend asignificantly smaller percentage of their budgets for lobbying.
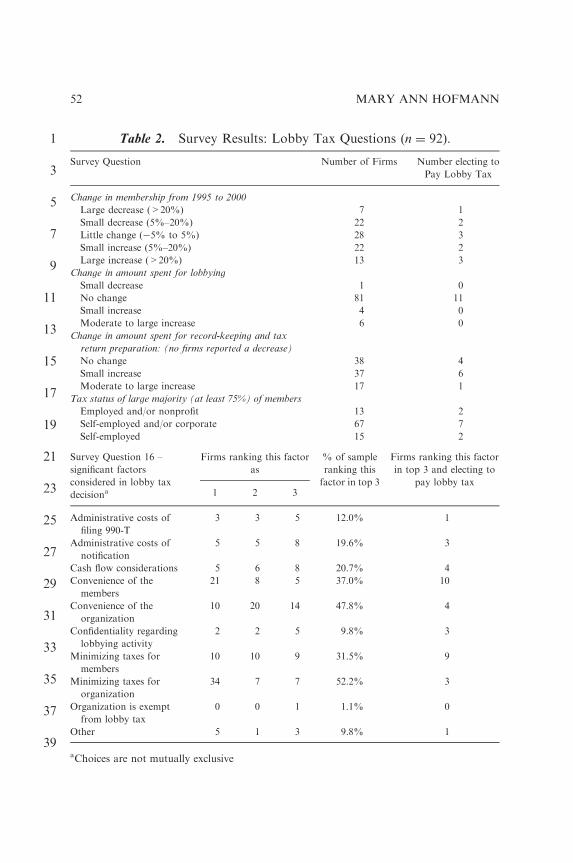
Table 2 presents the results of the mail survey of firms identified as in-curring lobbying expenditures. No unusual changes in membership numbersoccur, nor does lobbying activity seem to have suffered the blow predictedby ASAE (Tenenbaum, 1994a). Responders report that record-keeping costshave increased since 1993 as predicted (Weiland, 1993; Tenenbaum, 1994a,b, 1995; Smith, 1995), but it is not clear that this increase necessarily relatesto the lobby tax provisions. As discussed in the previous section of thearticle, associations whose membership is comprised primarily of employedindividuals or non-profit organizations would not be expected to pay thelobby tax; and yet two such associations in the sample do so. Likewise,associations whose membership is comprised primarily of self-employedindividuals would be expected to pay the lobby tax, yet 13 out of 15 suchassociations in the sample do not. Interestingly, tax factors are secondamong those chosen most frequently by survey respondents as significant tothe pay-or-notify decision. Convenience of the members and/or the organ-ization is first. Cash flow considerations, confidentiality regarding lobbyingactivity, and administrative costs are reported as significant factors lessfrequently.
While responders report tax factors to be important in making the pay-or-notify decision, it is not clear that associations take the trouble to apply theprofessional tax-planning model in the strictest sense, that is, by minimizing
1
3
5
7
9
11
13
15
17
19
21
23
25
27
29
31
33
35
37
39
Tax Planning for the Lobby Tax 49
Ta
ble
1.
DescriptiveStatistics.
Panel
A:TheSOISample
Panel
B:TheSurvey
Sample
n¼
560
Payers
n¼
83
Notifiers
n¼
477
p-value
n¼
92
Payers
n¼
11
Notifiers
n¼
81
p-value
To
tal
ass
ets
(m
ean
)$12,670,566
$17,799,346
$11,778,137
0.085
$13,465,346
$21,122,883
$12,425,434
0.073
Minim
um
24,661
154,859
Median
3,488,409
5,881,742
Maxim
um
386,973,238
58,595,820
Cu
rren
t/to
tal
ass
ets
(m
ean
)
0.70
0.76
0.69
0.028
0.71
0.78
0.70
0.296
Minim
um
00.24
Median
0.76
0.73
Maxim
um
1.00
1.00
To
tal
reve
nues
(m
ean
)$10,575,705
$12,909,415
$10,169,630
0.475
$12,175,004
$14,169,409
$11,904,159
0.727
Minim
um
63,674
169,669
Median
3,209,369
4,821,844
Maxim
um
281,711,065
88,774,628
%o
fre
ven
ues
fro
md
ues
(m
ean
)
48.6%
38.57%
49.68%
0.001
48.6%
28.1%
51.4%
0.025
Minim
um
o1%
o1%
Median
47.6%
45.1%
Maxim
um
100%
100%
%o
fex
pen
ses
for
lob
byin
g(
mea
n)
7.13%
1.63%
8.09%
0.000
6.4%
1.8%
7.0%
0.006
Minim
um
o1%
o1%
Median
4.36%
3.8%
Maxim
um
96%
25%
MARY ANN HOFMANN50
1
3
5
7
9
11
13
15
17
19
21
23
25
27
29
31
33
35
37
39
%o
fd
ues
spen
tfo
r
lob
byin
g(
mea
n)
14.52%
7.73%
15.7%
0.000
13.3%
18.5%
12.6%
0.153
Minim
um
o1%
o1%
Median
9.61%
8.3%
Maxim
um
241%
63%
Number
(%)offirm
s
required
tofile
a
Form
990-T
dueto
UBI>
$1,000
354(63.21%
)43
(51.81%
)
311
(65.2%
)
0.020
68(74%)
60(74%
)8(73%)
0.929
No
tes:
Payersare
firm
schoosingto
paythelobbytax;notifiersare
firm
schoosingto
notify
mem
bersasto
thenon-deductibilityofdues.
P-
valuemeasuresthesignificance
levelforthetestofdifferencesin
means.
So
urc
e:Thedata
comefrom
theIR
SStatisticsofIncome1997Exem
pt
OrganizationMicrodata
records.TheSOIsampleconsistsofthose
associationsidentified
ashavinglobbyingexpensesexceedingthe$2,000de
minim
is.Surveysweremailed
tothe551firm
sforwhom
addresses
could
beobtained;108responseswerereceived,92with
complete
inform
ation.
Tax Planning for the Lobby Tax 51
1
3
5
7
9
11
13
15
17
19
21
23
25
27
29
31
33
35
37
39
Table 2. Survey Results: Lobby Tax Questions (n ¼ 92).
Survey Question Number of Firms Number electing to
Pay Lobby Tax
Change in membership from 1995 to 2000
Large decrease (>20%) 7 1
Small decrease (5%–20%) 22 2
Little change (�5% to 5%) 28 3
Small increase (5%–20%) 22 2
Large increase (>20%) 13 3
Change in amount spent for lobbying
Small decrease 1 0
No change 81 11
Small increase 4 0
Moderate to large increase 6 0
Change in amount spent for record-keeping and tax
return preparation: (no firms reported a decrease)
No change 38 4
Small increase 37 6
Moderate to large increase 17 1
Tax status of large majority (at least 75%) of members
Employed and/or nonprofit 13 2
Self-employed and/or corporate 67 7
Self-employed 15 2
Survey Question 16 –
significant factors
considered in lobby tax
decisiona
Firms ranking this factor
as
% of sample
ranking this
factor in top 3
Firms ranking this factor
in top 3 and electing to
pay lobby tax1 2 3
Administrative costs of
filing 990-T
3 3 5 12.0% 1
Administrative costs of
notification
5 5 8 19.6% 3
Cash flow considerations 5 6 8 20.7% 4
Convenience of the
members
21 8 5 37.0% 10
Convenience of the
organization
10 20 14 47.8% 4
Confidentiality regarding
lobbying activity
2 2 5 9.8% 3
Minimizing taxes for
members
10 10 9 31.5% 9
Minimizing taxes for
organization
34 7 7 52.2% 3
Organization is exempt
from lobby tax
0 0 1 1.1% 0
Other 5 1 3 9.8% 1
aChoices are not mutually exclusive
MARY ANN HOFMANN52
the combined tax liability of both the organization and the members byallowing the party with the lowest marginal tax rate to bear the incidence ofthe lobby tax. Since one cannot be certain whether the surveys were com-pleted by the individuals responsible for making the pay-or-notify decision,one cannot place too much reliance on the subjective survey questions. It isalso not clear what the impact of non-tax factors might be; therefore, thequestion needs to be examined in a multivariate framework. Accordingly, abinomial logistic (logit) regression is used to test the research proposition.
RESULTS
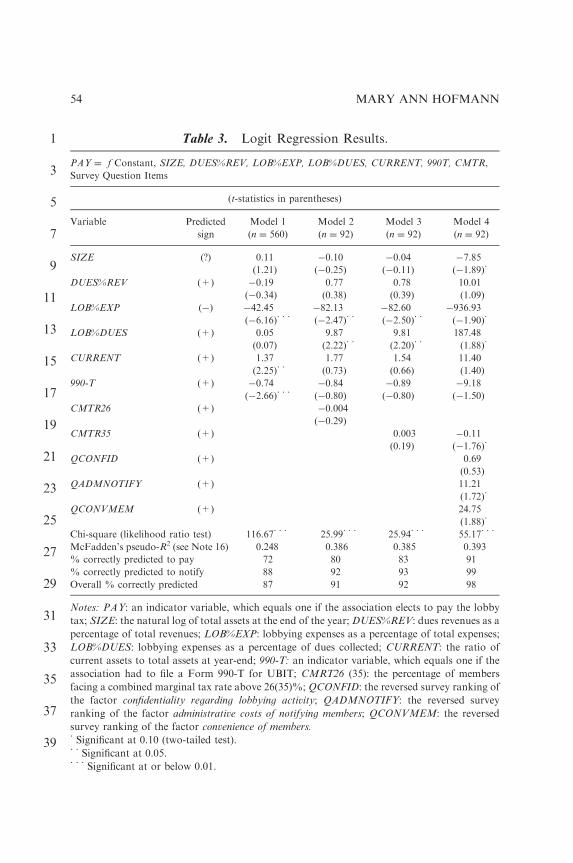
Several specifications of the logit model were run, with results reported inTable 3.15 Model One employs the entire SOI sample of associations withlobbying expenses, and includes only those variables available from the SOIdata. The results imply that firms with higher ratios of current assets aremore likely to pay the lobby tax, as predicted. LOB%EXP is negative andsignificant, implying that when lobbying expenses are large in relation tototal expenses, the association is less likely to pay the lobby tax. Unexpect-edly, firms already filing a Form 990-T appear less likely to pay the lobbytax (perhaps because they are already paying the UBIT). None of the othervariables is statistically significant. A naive model would predict that nofirms choose to pay and would be correct 85% of the time; it would correctlypredict 0% of the payers and 100% of the notifiers for an overall accuracyrate of 85%. Model One correctly predicts 72% of the payers and 88% ofthe notifiers for an overall accuracy rate of 87% of the observations.
Model Two incorporates the CMTR26 variable, which measures the per-centage of association members facing a CMTR exceeding 26% (corpora-tions and self-employed individuals). Since demographic data about theassociations’ members are required to estimate CMTR26, this model isconfined to the 92 firms providing that information in the survey. It appearsthat the probability of an association choosing to pay the lobby tax is notpositively related to the percentage of members with a CMTR greater than26%. The coefficient for CMRT26 is negative, though not statistically sig-nificant. The coefficient for LOB%EXP is negative and significant as before.For LOB%DUES, the coefficient is positive and significant, suggesting thatwhen lobbying expenses are large in relation to total dues collected, theassociation is more likely to pay the lobby tax. This model correctly predicts80% of the payers and 92% of the notifiers, for a 91% overall accuracy rate.Few good ‘‘goodness-of-fit’’ measures exist for logit regression models. The
1
3
5
7
9
11
13
15
17
19
21
23
25
27
29
31
33
35
37
39
Tax Planning for the Lobby Tax 53
1
3
5
7
9
11
13
15
17
19
21
23
25
27
29
31
33
35
37
39
Table 3. Logit Regression Results.
PAY ¼ f Constant, SIZE, DUES%REV, LOB%EXP, LOB%DUES, CURRENT, 990T, CMTR,
Survey Question Items
(t-statistics in parentheses)
Variable Predicted
sign
Model 1
(n ¼ 560)
Model 2
(n ¼ 92)
Model 3
(n ¼ 92)
Model 4
(n ¼ 92)
SIZE (?) 0.11 �0.10 �0.04 �7.85
(1.21) (�0.25) (�0.11) (�1.89)�
DUES%REV (+) �0.19 0.77 0.78 10.01
(�0.34) (0.38) (0.39) (1.09)
LOB%EXP (�) �42.45 �82.13 �82.60 �936.93
(�6.16)��� (�2.47)�� (�2.50)�� (�1.90)�
LOB%DUES (+) 0.05 9.87 9.81 187.48
(0.07) (2.22)�� (2.20)�� (1.88)�
CURRENT (+) 1.37 1.77 1.54 11.40
(2.25)�� (0.73) (0.66) (1.40)
990-T (+) �0.74 �0.84 �0.89 �9.18
(�2.66)��� (�0.80) (�0.80) (�1.50)
CMTR26 (+) �0.004
(�0.29)
CMTR35 (+) 0.003 �0.11
(0.19) (�1.76)�
QCONFID (+) 0.69
(0.53)
QADMNOTIFY (+) 11.21
(1.72)�
QCONVMEM (+) 24.75
(1.88)�
Chi-square (likelihood ratio test) 116.67��� 25.99��� 25.94��� 55.17���
McFadden’s pseudo-R2 (see Note 16) 0.248 0.386 0.385 0.393
% correctly predicted to pay 72 80 83 91
% correctly predicted to notify 88 92 93 99
Overall % correctly predicted 87 91 92 98
Notes: PAY: an indicator variable, which equals one if the association elects to pay the lobby
tax; SIZE: the natural log of total assets at the end of the year; DUES%REV: dues revenues as a
percentage of total revenues; LOB%EXP: lobbying expenses as a percentage of total expenses;
LOB%DUES: lobbying expenses as a percentage of dues collected; CURRENT: the ratio of
current assets to total assets at year-end; 990-T: an indicator variable, which equals one if the
association had to file a Form 990-T for UBIT; CMRT26 (35): the percentage of members
facing a combined marginal tax rate above 26(35)%; QCONFID: the reversed survey ranking of
the factor confidentiality regarding lobbying activity; QADMNOTIFY: the reversed survey
ranking of the factor administrative costs of notifying members; QCONVMEM: the reversed
survey ranking of the factor convenience of members.�Significant at 0.10 (two-tailed test).��Significant at 0.05.���Significant at or below 0.01.
MARY ANN HOFMANN54
w2 statistics from the Log Likelihood Ratio test gives some assurance thatthe models are reasonably specified. In each case, the p-value for the w2 teststatistic is below 0.01. McFadden’s pseudo-R2 gives some indication of theproportion of the variance explained by the model.16 The pseudo-R2 is 0.248for Model One and 0.386 for Model Two; clearly neither model explainsfully the pay-or-notify decision.
Sensitivity Analysis
One of the primary assumptions underlying the research proposition is thatmembers value the services received from the association dollar-for-dollar.If this assumption is not true, members may prefer a reduction in services toan increase in dues. Furthermore, the association may be unwilling or un-able to increase the charge for dues (Weiland, 1993). Unfortunately, it wasnot possible to compile usable data regarding changes in membership fees.17
Where it is not feasible to offset the lobby tax payment with an increase indues (in other words, when Alternative C in Fig. 1 is not an option), theassociation should pay the lobby tax only when the majority of the mem-bership is in a tax bracket above 35%. To test this alternative scenario,CMTR26 is replaced with CMTR35, which measures the proportion ofmembers with a CMTR above 35% – basically, only self-employed mem-bers.18 Model Three uses the CMTR35 variable. The results of this regres-sion do not differ qualitatively from those for Model Two except that thecoefficient for the tax variable is positive, though still not statistically sig-nificant. The predictive ability of Model Three is slightly better than that ofModel Two, although the pseudo-R2 is virtually unchanged.
Clearly, factors other than tax minimization dominate the pay-or-notifydecision for the firms in this sample. Model Four incorporates the reversedrankings from some of the factors listed in Survey Question 16 (which asksassociations to rank the factors affecting their decision in order of impor-tance). Concerns about confidentiality, about the administrative costs ofnotification, or concern for the convenience of the members should lead afirm to choose to pay the lobby tax. Indeed, the coefficients for all threefactors are positive, and the latter two are marginally significant. ModelFour has the highest percentage of correct predictions for both payers(91%) and notifiers (99%), with an overall accuracy rate of 98%, and apseudo-R2 slightly higher than Models Two or Three. However, one is un-certain whether the factors listed by the survey respondents are actuallythose considered before making the pay-or-notify decision or are simply
1
3
5
7
9
11
13
15
17
19
21
23
25
27
29
31
33
35
37
39
Tax Planning for the Lobby Tax 55
after-the-fact justification for the decision. Thus, the predictive ability ofModel Four may be overstated.
CONCLUSIONS
These results fail to find evidence that associations apply optimal tax-min-imizing strategies when dealing with the Section 6033 lobby tax. If thisfailure accurately reflects the population, associations and particularly theirmembers may be paying more taxes than necessary. Alternatively, the fail-ure to find support for the research proposition could be the result of severalother factors. The low survey response rate may have produced a samplethat is not representative of the larger population. The many assumptionsmade in developing the constructs may not have produced a model capableof detecting the tax effect, especially in a small sample. The CMTR variable,in particular, is subject to measurement error, and this is likely to bias thestatistical tests toward zero. The typical rationalization for failure to findfirms minimizing all taxes for all parties (as in the Scholes et al., 2005framework) is that non-tax costs dominate the decision. As mentioned ear-lier, lobbying expenditures must be identified and tracked under either al-ternative; notification requires only a short statement on the dues noticewhile payment requires the filing of Form 990-T and available cash. It isdifficult to envision that any of these non-tax costs could be significantenough to drive the decision, but perhaps other costs are associated withnotification or payment of the lobby tax that have not been identified.
Of the two ‘‘errors’’ an association might make in regard to the lobby tax– paying the tax unnecessarily or failing to pay the tax when members wouldbenefit – the first is understandably less common. In the response sample,only two of 16 firms with more than 50% of the members being employed ornonprofit (and thus unlikely to benefit from the dues deduction) chose topay the lobby tax. In both cases, the dollar amounts involved appear to beimmaterial; the tax on the lobby expenses is less than 1% of the association’send-of-year assets and less than 5% of its end-of-year cash balance. On theother hand, 21 of 24 associations with greater than 50% of the membersbeing self-employed (and 13 out of 15 associations with at least 75% of themembers self-employed) did not pay the lobby tax, thereby depriving theirmembers of tax savings exceeding the cost of the lobby tax.
Several reasons may explain why an association might choose not to paythe lobby tax even though a majority of members are in a high tax bracketand thus would derive a benefit from the dues deduction. First, such
1
3
5
7
9
11
13
15
17
19
21
23
25
27
29
31
33
35
37
39
MARY ANN HOFMANN56
decisions may be made by uninformed administrators. Most of the asso-ciations subject to the lobby tax are not subject to other forms of federaltaxation (see Note 6), so their management may not be as knowledgeable oras sophisticated as corporate management when dealing with tax issues.Second, although the tax consequences are large in the aggregate, the dis-allowed dues deductions might be immaterial to individual members whopay modest annual dues. Nevertheless, the most compelling potential reasonis that associations may face an inelastic demand curve. Since the servicesand benefits they provide have no ready substitutes, many associations donot operate in a perfectly competitive market. Members who are dissatisfiedwith losing the tax deduction for their dues cannot shop around for a bettertrade association or labor union.19 In other words, no opportunities areavailable for ‘‘arbitrage’’ or ‘‘clientele’’ effects to efficiently allocate thelobby tax to the appropriate parties as Scholes et al. (2005) describe in thecorporate setting (pp. 118–145). Thus, little incentive exists for managementto seek the optimal tax strategy for the lobby tax, and the lack of marketforces allows this inefficiency to persist.
This is the first research study to empirically examine the lobby tax issue,and as such the analysis is preliminary at best. The results (or lack thereof)seem to support a conclusion that nonprofits are not necessarily efficient taxplanners when it comes to the lobby tax; however, this conclusion is subjectto the limitations discussed above. The lack of a positive finding for the taxvariable and the speculation concerning the possible reason(s) may be asdissatisfying to the reader as to the author. Unfortunately, it seems impos-sible to resolve this issue with currently available data. The research ques-tion requires a more detailed survey or field study of the tax-planningattitudes and behaviors of exempt organizations subject to the lobby tax.The researcher would need to be able to identify the person in each organ-ization (or the external tax preparer/advisor) who is responsible for the pay-or-notify decision. It would be important to determine how much associ-ations know about the potential tax-status of their members, as well aswhether and how that information is used in making the lobby tax decision.A truly comprehensive study would include a survey of association membersto determine their attitudes about the goods and services they receive fromthe association (including its lobbying activities) as well as the value theyplace on the dues deduction.
1
3
5
7
9
11
13
15
17
19
21
23
25
27
29
31
33
35
37
39
Tax Planning for the Lobby Tax 57
UNCITED REFERENCES
Hofmann (2006).
NOTES
1. When Congress passed the lobby tax law, the top marginal tax rate for indi-viduals was 39.6%. Add the self-employment tax (and adjust for the fact that one-half is deductible for adjusted gross income), and the change in total tax liabilityfrom deducting $100 of trade association dues could approach $50. (Keep in mindthat an individual would have to have significant non-employment-related income orincome from a spouse in order to be in the top marginal bracket and still be subjectto the Social Security portion of the self-employment tax). Recently, the top mar-ginal rate for individuals has been reduced, and is currently 35%. In 2005, for self-employed individuals, the loss of a $100 deduction for trade association dues couldincrease final tax liability by as much as $40.2. The federal Regulation of Lobbying Act of 1946 required registration of and
regular financial reports from all individuals and agents seeking to influence legis-lation. In 1995, Congress passed a new bill intended to strengthen registration anddisclosure requirements.3. ASAE brought suit (and lost) in U.S. District Court for the District of Co-
lumbia in an effort to prevent the IRS from enforcing the association-related pro-visions of the lobby tax law. They have since appealed to the Supreme Court. Theirapplication for certiorari can be seen at http://www.asaenet.org/policy.4. See Matsunaga, Shevlin, and Shores (1992) for an example of a test of the ‘‘all
parties, all taxes, all costs’’ framework in the corporate setting. See Shackelford andShevlin (2001) for a comprehensive review of empirical research in taxation, much ofwhich is based on the Scholes and Wolfson (now Scholes et al., 2005) framework.5. An interesting corollary to these propositions is that whenever it is preferable
for the association to pay the lobby tax, it will also be more efficient to pass along thecost to the members by increasing the dues. The after-tax cost of the dues increasewill always be less than the reduction in services that would otherwise occur. Ofcourse, this result makes sense only if members value the services received at morethan the after-tax cost of the dues increase.6. In 1996, 65% of Forms 990-T reporting lobby tax were filed solely for that
purpose (Riley, 2000).7. The amount of lobbying expenditures is always disclosed on Form 990, which is
subject to public disclosure, and thereby available to anyone who requests it. Po-litical contributions and lobbying expenditures are also tracked by organizationssuch as the Center for Responsive Politics, and this information is made available tothe public. See their website at http://www.opensecrets.org.8. When the dependent variable is limited to two discrete choices, pay (Y ¼ 1) or
notify (Y ¼ 0), ordinary least squares regression is inefficient (Greene, 1997, pp. 873–874). An alternative approach is to use a probit or logit model. These binary choicemodels assume an unobservable underlying response variably, y*, which is
1
3
5
7
9
11
13
15
17
19
21
23
25
27
29
31
33
35
37
39
MARY ANN HOFMANN58
continuous, and for which y* ¼ b0x + u, where b is the set of parameters that reflectthe impact of changes in the independent variables (x). When y* exceeds somethreshold, Y ¼ 1. The probability that Y ¼ 1 is equal to the cumulative distributionfunction of (b0x) (Maddala, 1983, pp. 22–27). The probit model uses the standardnormal distribution function while the logit model uses the logistic cumulative dis-tribution function. Maximum likelihood estimation produces coefficient estimatesthat are unbiased and consistent (Greene, 1997, p. 871). In situations like the lobbytax decision, where there is a small proportion of Y ¼ 1 responses, logit seems toresult in a better fitting model (Greene, 1997, p. 875).9. In fact, organizations that can provide evidence that at least 90% of their
membership is unable to deduct dues as a business/employment expense are exemptfrom the Section 6033 reporting requirements and/or lobby tax.10. A large number of firms had zero current liabilities, so the traditional current
ratio was unworkable. The ratio of cash to total assets and the ratio of currentliabilities to current assets both gave results similar to those using CURRENT.11. Twelve firms reported zero dues revenue, and thus would face no lobby tax
consequences. Three firms answered ‘‘Yes’’ to both questions on lines 85g and 85h(see Fig. 3), and another five firms answered ‘‘No’’ to both questions. These choices,to pay the lobby tax on taxable lobby expenditures or to add such expenditures tonext year’s dues notices, are mutually exclusive; thus, it is not clear what the firms’choices are.12. The lobby tax issue was part of a larger study of taxation issues affecting
trade, labor, and agricultural associations.13. Because Form 990 is subject to public disclosure, the names and partial ad-
dresses of the firms are included in the SOI microdata records.14. Yetman (2001) had a 30% response rate when requesting copies of Form 990T
from charitable nonprofits.15. Results for probit specifications (not shown) were qualitatively similar but had
reduced predictive ability.16. McFadden’s Pseudo R2 is computed as 1 – L1/L0, where L1 is the log like-
lihood of the full model, and L0 is the log likelihood of an alternative model, whichcontains only a constant.17. Many associations have a range of dues charges for various levels of mem-
bership, and some actually charge dues on a sliding scale based on the member’sgross receipts; thus it was impossible to determine whether a change in total duesrevenues was a result of increased charges per member or changes in the distribution(or income) of members.18. As shown in Fig. 2, six out of 10 possible combinations of income tax bracket
and FICA tax bracket result in a CMTR greater than 35%. Granted, some of thesecombinations are more likely than others, but considering filing status, other sourcesof income/loss (including a spouse’s income/loss), itemized deductions, etc., are wellwithin the realm of possibility.19. It would be interesting to explore this issue further, but the current data do not
provide any basis for estimating demand elasticity for individual associations. Theaverage change in membership numbers from 1995 to 2000 does not differ signifi-cantly between firms who paid the lobby tax and those who passed it along to theirmembers.
1
3
5
7
9
11
13
15
17
19
21
23
25
27
29
31
33
35
37
39
Tax Planning for the Lobby Tax 59
REFERENCES
Greene, W. (1997). Econometric analysis (3rd ed.). Upper Saddle River, NJ: Prentice-Hall.
Hofmann, M. (2006). Tax-motivated earnings management by associations. Unpublished work-
ing paper, Andrews University.
Hopkins, B., & Tesdahl, D. (1995). Legal affairs. Association Management, 47(2), 27.
Hudson Institute. (1990). The value of associations to American society. Washington, DC: The
American Society of Association Executives.
Lobbying. (2001–2004). The Columbia encyclopedia (6th ed.). New York: Columbia University
Press. Retrieved October 27, 2005 from http://www.bartleby.com/65/.
Maddala, G. (1983). Limited-dependent and qualitative variables in econometrics. Cambridge,
UK: The Cambridge University Press.
Matsunaga, S., Shevlin, T., & Shores, D. (1992). Disqualifying dispositions of incentive stock
options: Tax benefits versus financial reporting costs. Journal of Accounting Research,
30(Supplement), 37–68.
Omer, T., & Yetman, R. (2003). Near zero taxable income reporting by non-profit organiza-
tions. Journal of the American Taxation Association, 25(2), 19–34.
Riley, M. (2000). Unrelated business income of non-profit organizations, 1996. Statistics of
Income Bulletin, 19(4), 123–146.
Riley, M. (2002). Unrelated business income tax returns, 1998. Statistics of Income Bulletin,
21(4), 187–215.
Sansing, R. (1998). The unrelated business income tax, cost allocation, and productive effi-
ciency. National Tax Journal, 51(2), 291–302.
Scholes, M., Wolfson, M., Erickson, M., Maydew, E., & Shevlin, T. (2005). Taxes and business
strategy: A planning approach (3rd ed.). Englewood Cliffs, NJ: Prentice-Hall.
Shackelford, D., & Shevlin, T. (2001). Empirical tax research in accounting. Journal of Ac-
counting and Economics, 31(1–3), 321–388.
Smith, S. (1995). Associations at risk. Association Management, 47(1), 33.
Tenenbaum, J. (1994a). Fighting the new lobby tax law. Association Management, 46(2), 36–42.
Tenenbaum, J. (1994b). Lobby tax Q & A. Association Management, 46(5), 52–57.
Tenenbaum, J. (1995). The new lobby tax rules. Association Management, 47(9), 77–82.
Yetman, R. (2001). Tax-motivated expense allocations by non-profit organizations. The Ac-
counting Review, 76(3), 297–311.
Weiland, R. (1993). President’s corner. Tax Executive, 45(5), 356–358.
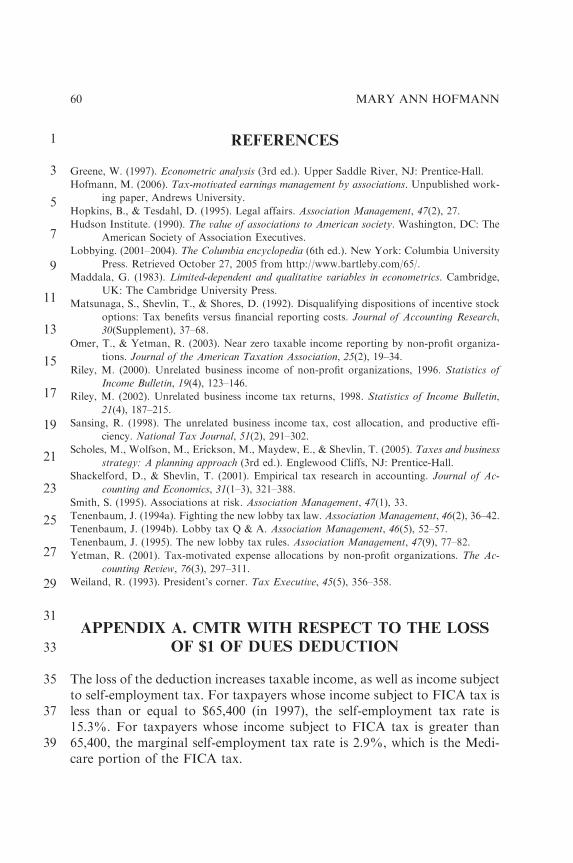
APPENDIX A. CMTR WITH RESPECT TO THE LOSS
OF $1 OF DUES DEDUCTION
The loss of the deduction increases taxable income, as well as income subjectto self-employment tax. For taxpayers whose income subject to FICA tax isless than or equal to $65,400 (in 1997), the self-employment tax rate is15.3%. For taxpayers whose income subject to FICA tax is greater than65,400, the marginal self-employment tax rate is 2.9%, which is the Medi-care portion of the FICA tax.
1
3
5
7
9
11
13
15
17
19
21
23
25
27
29
31
33
35
37
39
MARY ANN HOFMANN60
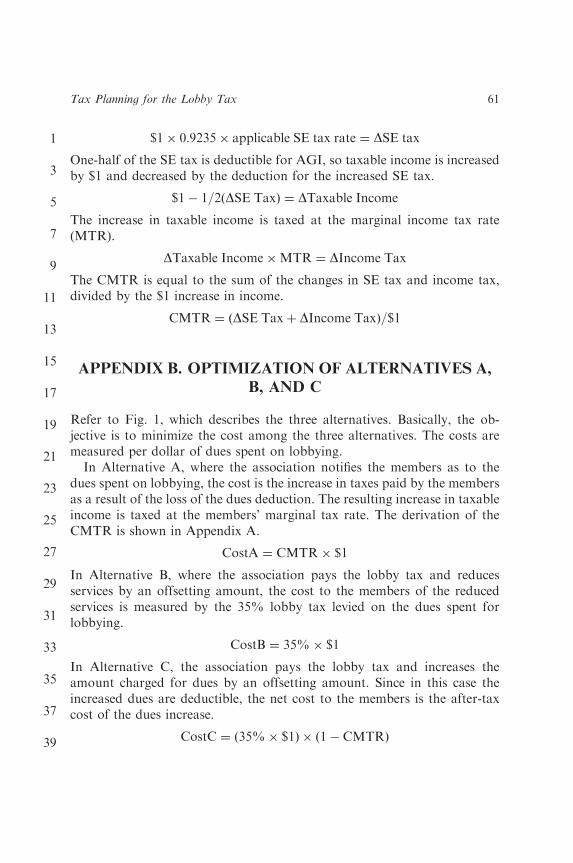
$1� 0:9235� applicable SE tax rate ¼ DSE tax
One-half of the SE tax is deductible for AGI, so taxable income is increasedby $1 and decreased by the deduction for the increased SE tax.
$1� 1=2ðDSE TaxÞ ¼ DTaxable Income
The increase in taxable income is taxed at the marginal income tax rate(MTR).
DTaxable Income�MTR ¼ DIncome Tax
The CMTR is equal to the sum of the changes in SE tax and income tax,divided by the $1 increase in income.
CMTR ¼ ðDSE Taxþ DIncome TaxÞ=$1
APPENDIX B. OPTIMIZATION OF ALTERNATIVES A,
B, AND C
Refer to Fig. 1, which describes the three alternatives. Basically, the ob-jective is to minimize the cost among the three alternatives. The costs aremeasured per dollar of dues spent on lobbying.
In Alternative A, where the association notifies the members as to thedues spent on lobbying, the cost is the increase in taxes paid by the membersas a result of the loss of the dues deduction. The resulting increase in taxableincome is taxed at the members’ marginal tax rate. The derivation of theCMTR is shown in Appendix A.
CostA ¼ CMTR� $1
In Alternative B, where the association pays the lobby tax and reducesservices by an offsetting amount, the cost to the members of the reducedservices is measured by the 35% lobby tax levied on the dues spent forlobbying.
CostB ¼ 35%� $1
In Alternative C, the association pays the lobby tax and increases theamount charged for dues by an offsetting amount. Since in this case theincreased dues are deductible, the net cost to the members is the after-taxcost of the dues increase.
CostC ¼ ð35%� $1Þ � ð1� CMTRÞ
1
3
5
7
9
11
13
15
17
19
21
23
25
27
29
31
33
35
37
39
Tax Planning for the Lobby Tax 61
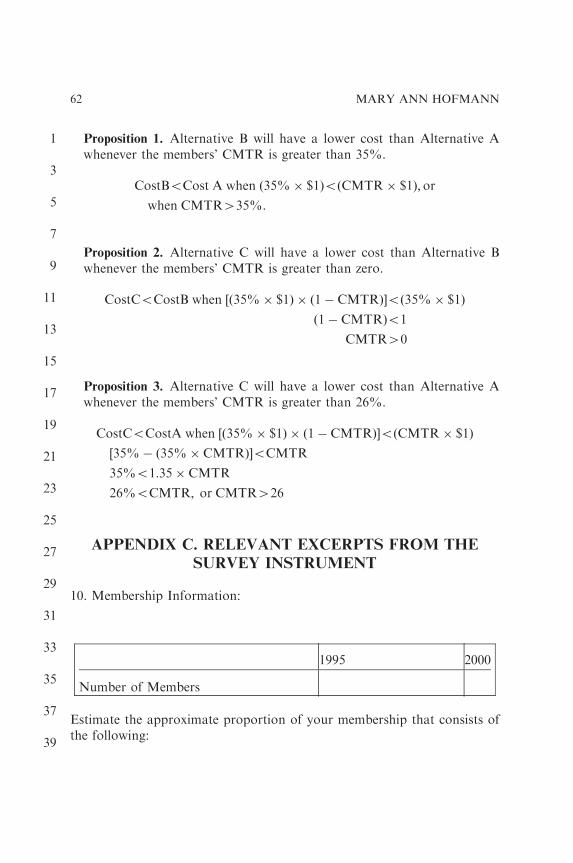
Proposition 1. Alternative B will have a lower cost than Alternative Awhenever the members’ CMTR is greater than 35%.
CostBoCost A when ð35%� $1ÞoðCMTR� $1Þ; or
when CMTR435%.
Proposition 2. Alternative C will have a lower cost than Alternative Bwhenever the members’ CMTR is greater than zero.
CostCoCostB when ½ð35%� $1Þ � ð1� CMTRÞ�oð35%� $1Þð1� CMTRÞo1
CMTR40
Proposition 3. Alternative C will have a lower cost than Alternative Awhenever the members’ CMTR is greater than 26%.
CostCoCostA when ½ð35%� $1Þ � ð1� CMTRÞ�oðCMTR� $1Þ
½35%� ð35%� CMTRÞ�oCMTR
35%o1:35� CMTR
26%oCMTR; or CMTR426
APPENDIX C. RELEVANT EXCERPTS FROM THE
SURVEY INSTRUMENT
10. Membership Information:
1995 2000
Number of Members
Estimate the approximate proportion of your membership that consists ofthe following:
1
3
5
7
9
11
13
15
17
19
21
23
25
27
29
31
33
35
37
39
MARY ANN HOFMANN62
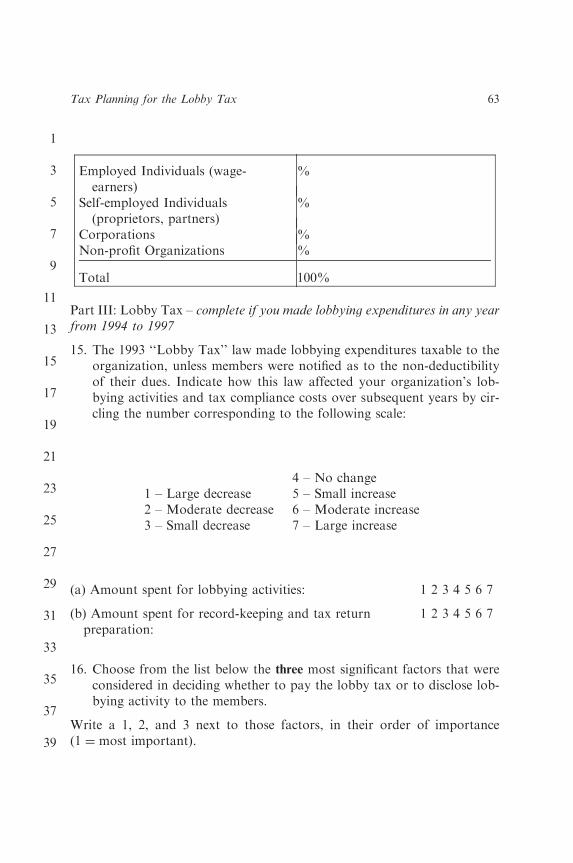
Employed Individuals (wage-earners)
%
Self-employed Individuals(proprietors, partners)
%
Corporations %Non-profit Organizations %
Total 100%
Part III: Lobby Tax – complete if you made lobbying expenditures in any year
from 1994 to 1997
15. The 1993 ‘‘Lobby Tax’’ law made lobbying expenditures taxable to theorganization, unless members were notified as to the non-deductibilityof their dues. Indicate how this law affected your organization’s lob-bying activities and tax compliance costs over subsequent years by cir-cling the number corresponding to the following scale:
4 – No change1 – Large decrease 5 – Small increase2 – Moderate decrease 6 – Moderate increase3 – Small decrease 7 – Large increase
(a) Amount spent for lobbying activities: 1 2 3 4 5 6 7
(b) Amount spent for record-keeping and tax returnpreparation:
1 2 3 4 5 6 7
16. Choose from the list below the three most significant factors that wereconsidered in deciding whether to pay the lobby tax or to disclose lob-bying activity to the members.
Write a 1, 2, and 3 next to those factors, in their order of importance(1 ¼ most important).
1
3
5
7
9
11
13
15
17
19
21
23
25
27
29
31
33
35
37
39
Tax Planning for the Lobby Tax 63
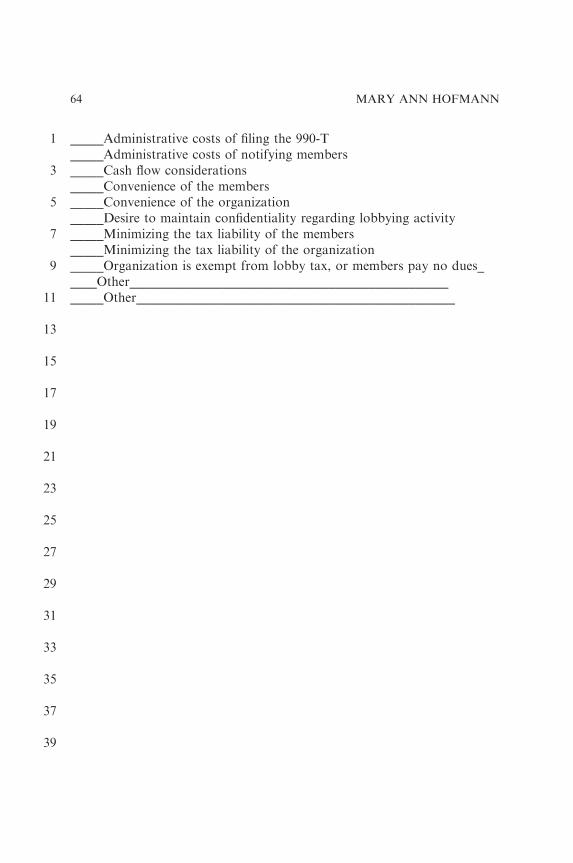
_____Administrative costs of filing the 990-T_____Administrative costs of notifying members_____Cash flow considerations_____Convenience of the members_____Convenience of the organization_____Desire to maintain confidentiality regarding lobbying activity_____Minimizing the tax liability of the members_____Minimizing the tax liability of the organization_____Organization is exempt from lobby tax, or members pay no dues_____Other_____________________________________________________Other________________________________________________
1
3
5
7
9
11
13
15
17
19
21
23
25
27
29
31
33
35
37
39
MARY ANN HOFMANN64
Dear Author,
During the preparation of your manuscript for typesetting, some questions may have arisen. These are listed below. Please check your typeset proof carefully and mark any corrections in the margin of the proof or compile them as a separate list*.
Disk use Sometimes we are unable to process the electronic file of your article and/or artwork. If this is the case, we have proceeded by:
Scanning (parts of) your article Rekeying (parts of) your article Scanning the artwork
Uncited references: This section comprises references that occur in the reference list but not in the body of the text. Please position each reference in the text or delete it. Any reference not dealt with will be retained in this section.
Queries and / or remarks
Thank you for your assistance
Our reference: AT-V017 17002 P-authorquery-v3
AUTHOR QUERY FORM
Book : AT-V017
Chapter : 17002
Please e-mail or fax your responses and any corrections to:
E-mail:
Fax:
gfedc gfedc gfedcb
gfedcb
Location in Article Query / remark Response
AQ1Hofmann (2004) is not listed in the reference list.
*In case artwork needs revision, please consult http://authors.elsevier.com/artwork Page 1 of 1