Embed Size (px)
Citation preview

Running Head: TWCT 1
Teamwork Competency Test (TWCT): a Step Forward on Measuring Teamwork
Competencies
David Aguado
Autonomous University of Madrid
Ramón Rico
Autonomous University of Madrid
Miriam Sánchez-Manzanares
Carlos III University of Madrid
Eduardo Salas
University of Central Florida
This research was partially supported by the Office of Naval Research (ONR) Collaboration and
Knowledge Interoperability Program and Office of Naval Research Multidisciplinary University
Research Initiative (ONR MURI). Grant No. N000140610446.
TWCT 2
Abstract
The Teamwork KSA Test (TWKSAT), designed to assess teamwork competencies, has
been widely used both in applied and academic contexts. However, studies have
brought to light a number of reliability problems in the test. In this paper we describe
three studies which 1) examine the functioning of the TWKSAT (N = 135), 2) propose a
new measure, TWCT, including an investigation of metric properties (N = 120), and 3)
analyze the convergent and predictive validity of the TWCT in comparison with the
TWKSAT (N = 91). Based on our results, we conclude that the TWKSAT does not
adequately reflect the initial substantive model and has limitations with regard to
reliability. The TWCT improves the TWKSAT by enhancing reliability, content
validity, and substantiating the dimensional structure of the test.
Keywords: Teamwork test, teamwork competencies

TWCT 3
Teamwork Competency Test (TWCT): a Step Forward on Measuring Teamwork
Competencies
Work teams have responded effectively to the global challenges of our times,
providing organizations with the benefits of adaptability, productivity and creativity
above and beyond the contributions individuals can make on their own (Kozlowski &
Ilgen, 2006; Salas, Sims & Burke, 2005). However, teamworking requires several
competencies to allow its members to effectively integrate their contributions, function
as a unified whole and make an “expert team” out of a mere “group of experts” (Lawler
& Worley, 2006).
Work teams bring to their mission much more than just the behaviors directly
related to the task in hand. Their members need to interact and cooperate if they are to
synchronize effectively (Salas, et al., 2005; Salas, Sims & Klein, 2004), which requires
a specific set of behaviors that further the attainment of team goals. Empirical evidence
shows that measures of knowledge and skills related both to a specific task and to
teamwork predict individual performance in work contexts (e.g., McClough &
Rogelberg, 2003; Schmidt & Hunter, 1983). At the same time, teams formed by people
with strong teamwork competencies display a specific range of behaviors, including the
use of integrative (win-win) as opposed to distributive (win-lose) negotiating strategies.
These findings are relevant as teams are often affected by interpersonal conflicts and
faulty cooperation, which hinder optimum performance (Hackman, 2002). The
availability of an appropriate measure of teamwork competencies may help minimize
these problems (Stevens & Campion, 1994, 1999).
Increasingly, scholars have underlined the importance of teamwork
competencies for the effectiveness of groups and work teams over recent decades (e.g.,

TWCT 4
Cannon-Bowers & Bowers, 2011; Cannon-Bowers, Tannenbaum, Salas & Volpe, 1995;
Chen, Donahue & Klimoski, 2004; Leach, Wall, Rogelberg & Jackson, 2005; Peeters,
van Tuijl, Rutte, & Reymen, 2006). In particular, Stevens and Campion (1994, 1999)
proposed the Teamwork KSA Test (TWKSAT), which identifies and measures five
transportable teamwork competencies that are common to different types of teams
(please see Figure 1) and have been related to different performance criteria (McClough
& Rogelberg, 2003; Stevens & Campion, 1999).
----------------------------------
Insert Figure 1 about here
----------------------------------
However, studies employing the TWKSAT report low levels of reliability
(Athanasaw, 2003; Chen et al., 2004; McClough & Rogelberg, 2003). Despite the
TWKSAT’s capacity to predict individual performance in team tasks, there are no
studies addressing the causes of the test’s low reliability or explaining its dimensional
structure to identify the scoring types that may be thrown up by the individual item
scores. To resolve the problems affecting the assessment of teamwork competencies,
this paper (a) examines the metric properties of the TWKSAT items, as well as their
content validity and dimensional structure, and (b) proposes a new measure based on
Stevens and Campion’s model, analyzing its reliability and validity as a measure of
teamwork competencies. Although recently some tests have been proposed to capture
knowledge on teamwork (e.g., boundary spanning activities, Marrone et al., 2007; team
roles, Mumford et al., 2008), it is still necessary to develop tests capable of assessing
teamwork competencies to predict employees’ performance in teams and thus design
and develop high-performance teams. Our study aims to improve the assessment of
TWCT 5
teamwork-related competencies in work settings, beyond the TWKSAT, one of the most
popular measures in the field.
The TWKSAT as a Measure of Teamwork Competency
Competencies are defined as the underlying characteristics integrated with an
individual’s knowledge, skills and abilities that are causally related to a referential
criterion of effective and/or superior action in a specific job or situation (Spencer &
Spencer, 1993). In particular, researchers have stressed the key role of teamwork
competencies for the effectiveness of work teams (e.g., Cannon-Bowers et al., 1995;
Chen et al., 2004).
Cannon-Bowers et al. (1995) identified eight central teamwork competencies,
namely adaptability, shared understanding of the situation, performance monitoring and
feedback, leadership, interpersonal relations, coordination, communication, and
decisionmaking. These scholars also make a key contribution by defining competencies
on the basis of two dimensions: task competencies vs. team competencies, and specific
competencies vs. general competencies. Given their relationship with performance in
different teamwork situations, general team competencies (i.e., transportable
competencies) are of particular interest to organizations. With this in mind, Stevens and
Campion (1994, 1999) identified five transportable teamwork competencies that are
common to different types of teams: 1) conflict resolution, 2) collaborative problem
solving, 3) communication, 4) goal setting and performance management, and 5)
planning and task coordination. These competencies are grouped in two more general
dimensions termed “interpersonal competencies” (defined by the first three items in the
above list) and “self-management competencies” (represented by the last two items).
This distinction is based on the idea that team effectiveness depends on its members’

TWCT 6
ability both to manage their relations appropriately and to direct their actions to carry
out the tasks assigned by the organization.
Perhaps the most important contribution made by Stevens and Campion (1999)
is the construction of the TWKSAT, which provides both practitioners and academics
with an instrument to measure key teamwork competencies. The available evidence
suggests that the TWKSAT has considerable predictive validity. Thus, the TWKSAT
measure of employees in real work teams correlated with their performance in the team
as evaluated both by supervisors (correlations of between .23 and .52) and by colleagues
(correlations of between .21 and .34) (McClough & Rogelberg, 2003; Stevens &
Campion, 1999). Furthermore, Chen et al. (2004) found that the TWKSAT was
sensitive to changes in the individual competency of university students after
participation in a training program designed to develop their teamwork competencies.
However, other studies in which the TWKSAT was used have also consistently
reported low reliability of the measure. Stevens and Campion (1999) originally found
reliability of .80 (internal consistency), but this would appear to be an overestimate
(McClough & Rogelberg, 2003). In fact, the alpha coefficients in studies employing
TWKSAT are consistently lower. For example, McClough and Rogelberg (2003) found
an alpha coefficient of .59, and Chen et al. (2004) found a coefficient of .64 before
training in teamwork skills and .82 after training. Athanasaw (2003) obtained a
coefficient of .66 for the complete scale and between .25 and .48 for each of the five
factors, and Leach et al. (2005) found a coefficient of .70. As McClough and Rogelberg
(2003) point out, however, the TWKSAT was designed from a multidimensional
standpoint and other situational judgment tests share the low alpha coefficients found to
date. In this type of test, internal consistency-based reliability measures should be

TWCT 7
complemented with test-retest estimations (Clevenger, Pereira, Wiechmann, Schmitt &
Harvey, 2001; McDaniel, Morgeson, Finnegan, Campion & Braverman, 2001).
However, Chen et al. (2004) reported a test-retest correlation of .60 in the control group
for their study. Overall, the available evidence suggests that the reliability of the
TWKSAT could be improved, despite the test’s predictive capacity.
No studies have been carried out to date to identify the reasons for the
TWKSAT’s low reliability, either by examining the metric characteristics of the items
or the degree to which the different contents proposed by Stevens and Campion (1994)
are actually present in the TWKSAT. Nor has any attempt been made to explain the
dimensional structure of the TWKSAT, though this is crucial to identifying the scoring
obtained from the test items scores.
Overall, our main objective is to present a new measure of the teamwork-related
competencies based on Stevens and Campion’s (1994) original model. To this end, we
conducted three empirical studies. The first one is devoted to analyzing the metric
properties of the items, content validity, and the dimensionality of the TWKSAT. In the
second study we proposed a new measure, testing the improvements made on reliability
and dimensionality in a sample of university students. Finally, in the third study we
tested the validity of the new measure in a sample of professional employees.
Study 1
The aim of this first study is to analyze the items comprising the TWKSAT,
examining their content and dimensionality. To begin with, we present the results of
the descriptive analysis based on the impact of each item on reliability. Following the
strategy employed by Rovinelli and Hambleton (1977), we then go on to analyze the

TWCT 8
test items in terms of content validity. Next, the dimensionality of the test is examined
using factorial analysis.
Method
TWKSAT translation. The TWKSAT1 comprises 35 multiple-response items,
which describe different situations that may arise within a work team. Respondents
answer the items by indicating how they would act in each situation. The questionnaire
evaluates the five teamwork competencies identified by Stevens and Campion (1994).
An example item is the following (Stevens & Campion, 1999): “Your team wants to
improve the quality and flow of the conversations among its members. Your team
should: (A) use comments that build upon and connect to what others have already
said; (B) set up a specific order for everyone to speak and then follow it; (C) let team
members with more to say determine the direction and topic of conversation; (D) do all
of the above.”
The original version of the TWKSAT is written in English. We therefore applied
the back-translation procedure (Brislin, 1970) in order to use the scale in Spanish and
ensure the equivalence of items (Gibson, 1999). Three certified translators and a group
of specialists from bilingual teams in the United States and Spain were involved in this
process. The materials forming the test were first translated into Spanish by the three
translators. The Spanish version of the test was then translated back into English by the
bilingual specialists. Finally, the back-translation was reviewed by the research team to
ensure that the meaning of the items was consistent in the different translations. As a
final result, we obtained a scale in Spanish equivalent to the English language original.
Participants and procedure. The participants in the study comprised 135 students
from different disciplines (78% IT Engineering and 22% Psychology) at a public

TWCT 9
university in Madrid. Men made up 71% of the total sample, and the average age was
23 years (SD = .93). All of the participants were from Spain and had Spanish as their
mother tongue.
Participation in the study was mandatory for the students, being part of a
program of practices in different subjects. Participants signed a consent form regarding
their participation in the study. They could voluntarily decline to be enrolled on the
research simply by not providing their records to be included in the research, without
any adverse effect on their class grades. At the beginning of the academic semester the
researchers applied the TWKSAT to the students as a part of their class requirements.
The objectives and reasoning behind the study were explained by the professors at the
end of the course. Each participant was also given a brief report with the scores obtained
in the test and the meaning of each of the teamwork competencies.
The validity of the TWKSAT content was analyzed by three experts in the field
of teamworking. All raters had over ten years’ experience in conducting team-based
research and consulting. The experts analyzed the TWKSAT items as described in the
results section.
Results
Description of items. Table 1 shows the mean (difficulty index), standard
deviation, asymmetry, kurtosis, and discrimination index for each item on the scale, as
well as the Cronbach’s alpha estimated for all 35 items together. As may be observed,
the range of difficulty varies between .08 (item 26) and .93 (item 6). With regard to the
discrimination index, four items (7, 12, 27 and 35) were negatively correlated with the
scale and another series of items (2, 4, 10, 11, 15, 17, 24 and 25) display a positive but
very low adjusted correlation (< .15). The total alpha for the scale is .60. However, if

TWCT 10
the negatively correlated items and those with a correlation of less than .15 are
discarded, the alpha scale rises to .71.
----------------------------------
Insert Table 1 about here
----------------------------------
Content analysis. To examine the validity of the test content, we employed the
strategy proposed by Rovinelli and Hambleton (1977), in which a group of experts
express the degree to which each item measures each of the previously defined
evaluation objectives. Accordingly, three experts separately analyzed the 35 items
comprising the test, indicating the extent to which each item was representative of each
of the teamwork sub-competencies defined by Stevens and Campion (1994) and
relevant to the measurement of the target. A score of 1 was assigned if the item was
considered appropriate, -1 if not, and 0 if the expert in question was unsure. The
resulting index will be 1 where all of the experts concur that an item is appropriate in
view of the target measured. The experts were also asked to make any general
comments on the measurement items included.
Table 2 summarizes the results obtained. A number of items display a high level
of item-target congruence (> .80), other items show a congruence index of less than .50
for all of the measurement targets (27, 29 and 33), and item 31 falls short of the
threshold value of .30 for inclusion in the table (Thorn & Deitz, 1989). Table 2 also
provides valuable information related to the degree to which the test items meet the
proposed measurement objectives. There are no items associated with the sub-
competencies A2 (“Recognize the type and source of conflict”), C1 (“Understand and
use communication networks”) and D2 (“Monitor, assess and provide feedback on

TWCT 11
individual and group performance”). Moreover, the number of items that are congruent
with the different measurement targets varies between a single highly congruent item
(23) for A3 (“Use win-win strategies”) and four items (1, 4, 11 and 19) for D1 (“Help
set specific, challenging and accepted objectives).
Finally, all of the experts remarked in their comments that the test items only
allow assessment of respondents’ knowledge, although the original Stevens and
Campion (1994) model refers to “teamwork knowledge, skills and abilities”.
----------------------------------
Insert Table 2 about here
----------------------------------
Dimensionality analysis. A confirmatory factor analysis (N =135) was carried out
on the correlation matrix to examine the dimensionality of the test. As these are
dichotomous (right/wrong) items, the tetrachoric correlation matrix was analyzed using
Mplus (Muthén & Muthén, 2006). Following the substantive model proposed by
Stevens and Campion (1994, 1999), we tested 5 models: (a) 5-factor orthogonal model,
(b) 2-factor orthogonal model, (c) 5-factor correlated model, (d) 2-factor correlated
model, and (e) 1-factor model.
Table 3 presents the fit indices established for the different estimated models.
The orthogonal solutions of 5-factor and 2-factor do not fit the data. Values in each
index are substantially below the usual standards. However, when correlation between
factors is allowed, the model fits the data better. Even so the only adjustment index for
which a good fit is obtained is RMSEA (<.05). A similar effect is observed with a single
factor model.

TWCT 12
Additionally, in order to deeply explore the dimensionality of the items
proposed, an exhaustive exploratory factorial analysis of the different factorial solutions
from one to seven factors was carried on, including a review of both orthogonal and
oblique rotations. The results do not allow us to clearly label the factors according to
Stevens and Campion’s model (1994).
----------------------------------
Insert Table 3 about here
----------------------------------
Criterion validity analysis. To provide further evidence of the criterion-related
validity of the TWKSAT, we correlated the scores in the TWKSAT against the criterion
for individual performance in a team task. A sub-sample of the study (N = 30; 56%
women; average age 23 years) formed by the participants in an undergraduate teamwork
course was observed during the resolution of a group decision-making task. The
participants were randomly assigned to five-member teams. The task2 set required the
teams to generate effective measures to resolve traffic problems caused by improper
parking on a university campus. The teams were allowed 30 minutes to complete the
task and were video-recorded for subsequent analysis. Both team tasks and video
recording were standard features of the course, and the participants were therefore
familiar with these procedures. An ad hoc code (Appendix A) was designed for
behavioral observation. The code categories describe specific behaviors associated with
the five teamwork competencies identified by Stevens and Campion (1994, 1999) (e.g.,
“Request additional information from team members”). Two groups of five judges each
independently analyzed the recordings, noting the frequency of teamwork behaviors
associated with a particular competency displayed by each of the team members. All of

TWCT 13
the judges were postgraduate students who were blind to the objectives of the study and
independent of the research group. They were trained in the use of the code and
underwent a trial period to align criteria and discuss inconsistencies. The mean inter-
judge reliability for the different competencies was acceptable (Kappa = .87), and we
therefore computed the mean of their assessments to obtain a single score for each
competency. Finally, we computed the mean of the scores for each individual and the
five competencies, as in the case of the questionnaire, to obtain a total teamwork
competency score. As expected, the TWKSAT score was positively correlated with the
observed measure of teamwork skills (r = .43; p < .05).
Discussion
The first study revealed certain weaknesses in the TWKSAT (Stevens &
Campion, 1999) which affect its use in academic and professional contexts.
Specifically, the following deficiencies were observed in three different facets: a) some
items show very low reliability indices affecting the general reliability of the scale, b)
the contents of the original model proposed by Stevens and Campion (1994) are not
fully represented in the test, and c) the dimensional structure obtained from the factorial
analysis is not well aligned with the substantive model.
With regard to the first weakness, the results of the study show that certain items
should be eliminated from the scale, as their adjusted correlations with the total for the
scale are less than the generally accepted standards.
Turning to the second weakness, the content analysis indicates that certain
teamwork sub-competencies identified in the general model are not picked up by the
test items. Thus, no items exist associated with the sub-competencies A2 (“Recognize
the type and source of conflict”), C1 (“Understand and use communication networks”)

TWCT 14
and D2 (“Monitor, assess and provide feedback on individual and group performance”).
The content analysis also revealed that certain items are not associated with any of the
proposed measurement targets (items 27, 29, 31 and 33). In addition, the format of the
items is designed to measure “knowledge”, but not skills or aptitudes.
Finally, Stevens and Campion (1994) established 14 teamwork sub-
competencies in their model, grouped into five competencies which are, in turn,
integrated in two dimensions. However, our results indicate a structure that tends
towards unidimensionality.
To sum up, the results of this study provide an explanation of the low reliability
indices reported in previous research, and suggest how a more reliable measurement
could be obtained from TWKSAT without affecting its predictive capacity. In line with
prior studies using the original English version of the TWKSAT (Chen et al.,2004;
McClough & Rogelberg, 2003; Stevens & Campion, 1999), the Spanish adaptation of
the test used in our study reveals similar correlation indices (r = .43; p < .05).
It is necessary to recognize that our results may be influenced by cultural
differences between USA-based samples used by the Stevens & Campion (1999) to
develop and validate the TWKSAT and our Spain-based sample . Cross-cultural studies
(e.g., Earley, 1997; Hoftstede 1980, 1983a, 1983b) show that cultural differences may
affect the processes and outcomes of individuals and groups in organizations (Cox,
Lobel & McLeod, 1991; Gibson, 1999). Thus, in contrast to the North-Americans,
Spaniards tend to be: (a) higher in collectivism, so they tend to put the group interests
first (Triandis, 1995) and look more actively for social acceptance, strong group identity
and the development of personal relationships (Grimm, Church, Katigbak, & Reyes,
1999); (b) higher in power distance, leading them to behave more submissively with

TWCT 15
managers and avoid disagreements and feeling more comfortable working in teams with
strong directivity (Earley & Erez, 1997); (c) lower in action-oriented (Maznevski,
DiStefano, Gomez, Noorderhaven, & Wu, 1997), which would take them to work less
hard (Hampden-Turner & Trompenaars, 1993), and be more resistant to work by
objectives (Kluckhohn and Strodtbeck, 1961); and (d) are more likely to believe that
external forces determine their successes and failures (Trompenaars, 1993). According
to these cultural differences between Spanish and North-American populations, the way
employees approach their professional performance in teams and therefore, the way
employees respond to TWKSAT may be different. Thus, generalization of our findings
to the context of teamwork in North-American cultures should be done with caution.
To conclude, our findings suggest the need to improve the measurement of
teamwork competencies. TWKSAT only allows measurement of the general teamwork
competency, which constricts examination of the conceptual richness expressed in
Stevens and Campion’s (1994) original model. Consequently, it is desirable to develop
new items capable of capturing the different sub-competencies, as well as obtaining
more reliable scores in the five competencies addressed.
Study 2
The second study analyzes a new measure of the teamwork KSAs based on
Stevens and Campion’s (1994) model which is called the TWCT. For this purpose, we
developed and adapted new items in light of the findings from study 1. The new test
comprises 36 items, which were applied to a sample of 120 university students to
analyze the functioning of the items, and to test the TWCT’s reliability, content validity
and dimensionality.
Method
TWCT 16
Item development for TWCT. Based on results from study 1, we developed new
items in order to represent the 14 sub-competencies established by Stevens and
Campion (1994). The items were worded in the observable behavior format. An initial
set of 83 items was constructed, which was progressively refined down to the final 36
items. Based on interviews with three experts in the fields of teamwork and
organizational behavior, several items were rephrased (7 items) or left out (31 items).
The remaining 52 items were applied to different samples and, taking into account the
item statistics (corrected item-total correlation and factor loadings), 16 items were
deleted. Using the selected 36 items, a pilot study was conducted on 26 members of
four software development programmers’ teams from a small IT company. All team
members responded to the questionnaire and provided feedback on the items. Most
items were understood, and perceived as unambiguous. Some minor changes were made
based on their comments, but all the items were retained. As a result, the new measure
contains 36 items drafted in Spanish (see the complete scale in Appendix B) and uses a
4-point response scale of frequency (1 = Never/Almost never and 4 = Always/Almost
always).
Participants and procedure. The sample comprised 120 final year psychology
students at a large Spanish public university, 68.7% of whom were women. The average
age was 23 years (SD = .96). The procedure was identical to that employed in study 1.
The assistance of the same experts was used to analyze the validity of the test contents
as in study 1.
Results
Description of items and scales. Table 4 summarizes the main descriptive
statistics for the questionnaire items. The mean scores for all items were above 2.5 (the

TWCT 17
theoretical midpoint on the response scale), except those related with the Collaborative
Problem Solving dimension, where the averages were somewhat lower (between 1.94
and 2.28). The reliability indices for both the scales and the full questionnaire (.89) were
satisfactory.
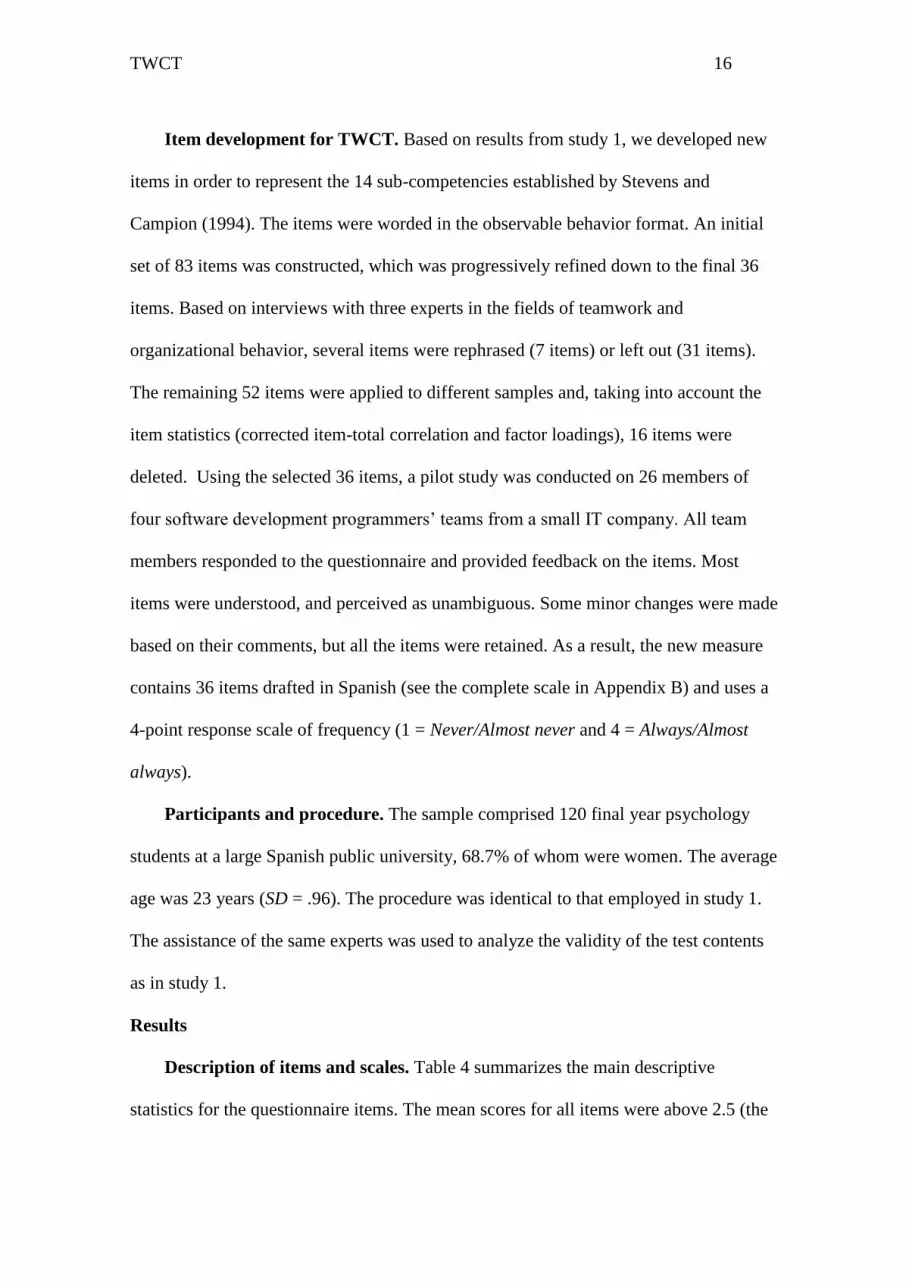
Content analysis. Table 4 presents the congruence indices (Rovinelli &
Hambleton, 1977) for each item based on the sub-competencies proposed by Stevens
and Campion (1994). The congruence indices for all of the items were satisfactory
(minimum .56 and maximum 1). Finally, the whole content domain established in the
model was represented by the items developed.
----------------------------------
Insert Table 4 about here
----------------------------------
Dimensionality analysis. We carried out various factorial analyses to explore
the dimensionality of the questionnaire, above and beyond the adequacy and relevance
of the items. Given the high means for the items and the deviation of distributions away
from normal, we used the minimum unweighted least squares (ULS) method for factor
extraction, employing the FACTOR program (Lorenzo-Seva & Ferrando, 2006).
Bartlett’s sphericity test (2 = 5557.6, d.f. = 703, p < .001), and the KMO index (.66)
confirmed that the item correlation matrix could be factorized. The factorial solution
extracted was obliquely rotated. Eleven factors were found to have an eigenvalue of
more than one after extraction. The parallel analysis retained only the first eight factors
extracted. In line with this analysis, the eight-factor model was the one that best
reflected the initial substantive model, explaining 56% of the total variance, with only
18% residual errors of more than .05. The eight-factor solution was compared with five

TWCT 18
factors, as proposed in the substantive model. The percentage variance explained was
found to be lower (43%), as was the percentage of residual errors greater than .05
(33%). In addition, the residual mean squares error average (RMSEA) showed a
marginally acceptable value (.085) in the eight-factor model, but a clearly unacceptable
value in the five-factor model (.11). Therefore, it appears that the eight-factor model
better reproduces the analyzed data matrix compared with the five-factor model.
Table 5 presents the results obtained in the configuration matrix after oblique
rotation. Although this matrix does not exactly reproduce the expected structure of 14
sub-competencies, a detailed analysis indicates that it reflects the substantive model –
with some variations – on which the development of the items was based. The first
factor extracted represents the Conflict Resolution competency. The items developed in
relation to this competency (especially those referring to the recognition of conflict:
items 1, 10, 15, 16, 19 and 21) are associated with this factor, as are the Communication
competency items related to open communication and support. They are joined by item
18 (designed for the Planning and Coordination competency). The second factor
extracted reflects the Planning and Coordination competency (items 4, 13, 23, 33 and
34). This factor also includes item 8 (designed for the Communication competency).
The items for the Goal Setting and Performance Management competency appear in
factors 3 and 6. Items related to “monitoring, assessing and providing feedback on
individual and group performance” (items 6, 22, 31 and 35) are associated with factor 6,
and those referring to “offering teammates feedback on their results” (items 20, 32 and
32) are associated with factor 6. Factors 4 and 5 reflect the Collaborative Problem
Solving competency. Factor 4 is associated with items referring to “recognizing
obstacles to participative problem solving” (items 14, 24 and 26), and factor 5 with

TWCT 19
items referring to “identifying situations that require participation in decision making”
(items 11 and 25). Finally, factors 7 and 8 reflect the Communication competency. The
items related with “active listening, non-verbal communication and recognition of
communication networks” (items 2, 3, 5, 7, 9 and 27) are associated with factor 7, while
those related with “informal communication acts with other team members” (items 12
and 30) are associated with factor 8.
----------------------------------
Insert Table 5 about here
----------------------------------
Finally, we performed a confirmatory factorial analysis (N = 120) on the scores
obtained for the eight factors to verify whether the eight factors extracted are associated
with two general dimensions, as proposed in the substantive model, or with a single
dimension as study 1 suggests. The following factors were assigned to the interpersonal
competencies dimension in the two-dimensional model (see Figure 1): 1 (conflict
resolution), 4 (collaborative problem solving: group), 5 (collaborative problem solving:
individual), 7 (communication: active listening) and 8 (communication: informal). The
following were assigned to the self-management dimension: 2 (planning), 3
(performance objective management: monitoring), and 7 (performance objective
management: feedback).
----------------------------------
Insert Figure 2 about here
----------------------------------
In view of the weightings assigned to the different variables, all of the
parameters estimated in the two-factor model are significant (p < .001), except for the

TWCT 20
relationship between F4 and F5 and the interpersonal relations dimension (p = .001 and
p = .040, respectively). All of the parameters estimated are again significant (p < .001)
for a one-factor model, except for the relationship between F4 and F5 and the general
teamwork factor (p = .002 and p = .042, respectively). None of the standardized
residuals attains a value of |res_z| > 2 for the one-factor model. However, a high value,
|res_z| > 2, appears in the two-factor model for the relationship between F1 and F7,
although this is not an especially large deviation.
The values obtained for the goodness-of-fit estimators for both models indicate a
good fit in both models. For 1-Factor Model and 2-Factor Model the values were
respectively: Chi Square .181 and .242, SMRM .048 and .047, RMSEA .037 and .031,
CFI .976 and .983, TLI .966 and .975.
Discussion
Overall, the results of the second study show that the TWCT reasonably covers
the whole content domain proposed by Stevens and Campion (1994), is reliable, and
that its dimensional structure adequately reflects the original substantive model
(although it does not do so exactly). With regard to the first point, the inter-judge
analysis indicates that the TWCT items are representative of the 14 sub-competencies
defined by the authors. In terms of reliability, the five scales present adequate Cronbach
alphas of more than .80, except the Conflict Resolution scale, which has an alpha of .71.
The alpha for the total scale is also adequate (.89). Finally, the dimensionality analysis
reveals a latent structure for TWCT that is substantially associated with Stevens and
Campion’s (1994) model. However, the structure observed does not exactly reproduce
either the structure of the 14 sub-competencies or the structure of the five competencies.

TWCT 21
Our results suggest the need to reconfigure the scales originally designed. This
is particularly important regarding the Conflict Resolution competency. The analyses of
both dimensionality and congruence reveal a strong association between the Conflict
Resolution items and the Communication items (related to open communication and
support). It seems reasonable to integrate the items in the Communication sub-
competency into the Conflict Resolution competency, as the factorial analysis indicates.
This is also true with regard to item 18, which both the judges and the factorial analysis
associate with that competency. The Conflict Resolution scale with an alpha of .84
would thus be established with the same items as originally designed. The Collaborative
Problem Solving scale is also maintained intact, integrating the factor 4 and 5 items with
an alpha of .83. The Communication scale contains the factor 7 and 8 items associated
with communication items, except for open communication and support, obtaining an
alpha of .72. The Objective Management and Performance competency would be
formed by all of the items from factors 3 and 6 with an alpha of .82. Finally, the
Planning and Coordination competency integrates all of the items associated with
factor 2 (alpha = .88), except 18 which is moved to Conflict Resolution.
Study 3
The third study has a dual objective: 1) to obtain initial evidence for the
convergent validity of the new measure of teamwork competency developed in study 2,
and 2) to compare the new measure with the original test proposed by Stevens and
Campion (1999). A sample of employees was used to analyze the relationship between
TWCT and: a) the original TWKSAT, b) supervisor assessments of employees’
teamwork competencies, and c) self-assessments of competency by employees
themselves.

TWCT 22
Method
Sample. A total of 91 employees working in a major Spanish power utility took
part in the study. Men made up 81% of the total sample, and the average age was 29.6
years (SD = 3.38). The measurements were made as part of the activities undertaken by
the employees within the framework of a mandatory skills development program set up
by the company. Participants signed a consent form regarding their participation in the
study. They could decline to be enrolled in the research by not providing their records,
without any adverse effect on their participation in the skills development program. We
also obtained the company consent to use the data in the research.
Measures. TWKSAT. We applied the original version of the Stevens and Campion
(1999) test used in study 1.
TWCT. The version of the test designed in study 2 was applied. Six different
measures were established for each participant, consisting of a total score and a score
for each of the five competencies.
Team Performance: Supervisor Assessment. The assessments of each
employee’s immediate superior were obtained specifically for the purposes of the study
and did not form part of the company’s usual performance management process. The
information gathered on the employees was strictly training-related. The supervisor
questionnaire contained eight items describing different teamwork behaviors, to which
they were asked to respond on a four-point scale (1 = completely disagree, 4 =
completely agree). An example item is “He/she (the employee) participates actively in
work meetings (giving his/her opinion, asking questions, etc.).” The items were drawn
from a competency model used in the company.

TWCT 23
Team Performance: Self-Assessment. The same eight-item questionnaire
expressed in the first person was also answered by each employee to assess their usual
behavior in work team situations.
Procedure. The supervisors’ assessments (measure 3) and the self-assessments of
the employees (measure 4) were obtained concurrently at the beginning of the course.
The supervisors gave their responses online via a user/key connection to a page
containing the questionnaire and instructions for completion. The TWKSAT and TWCT
measures (respectively, measures 1 and 2) were collected at a first training session one
week later. Both questionnaires were administered in a paper and pencil format,
counterbalanced to avoid effects associated with the order of presentation.
Results
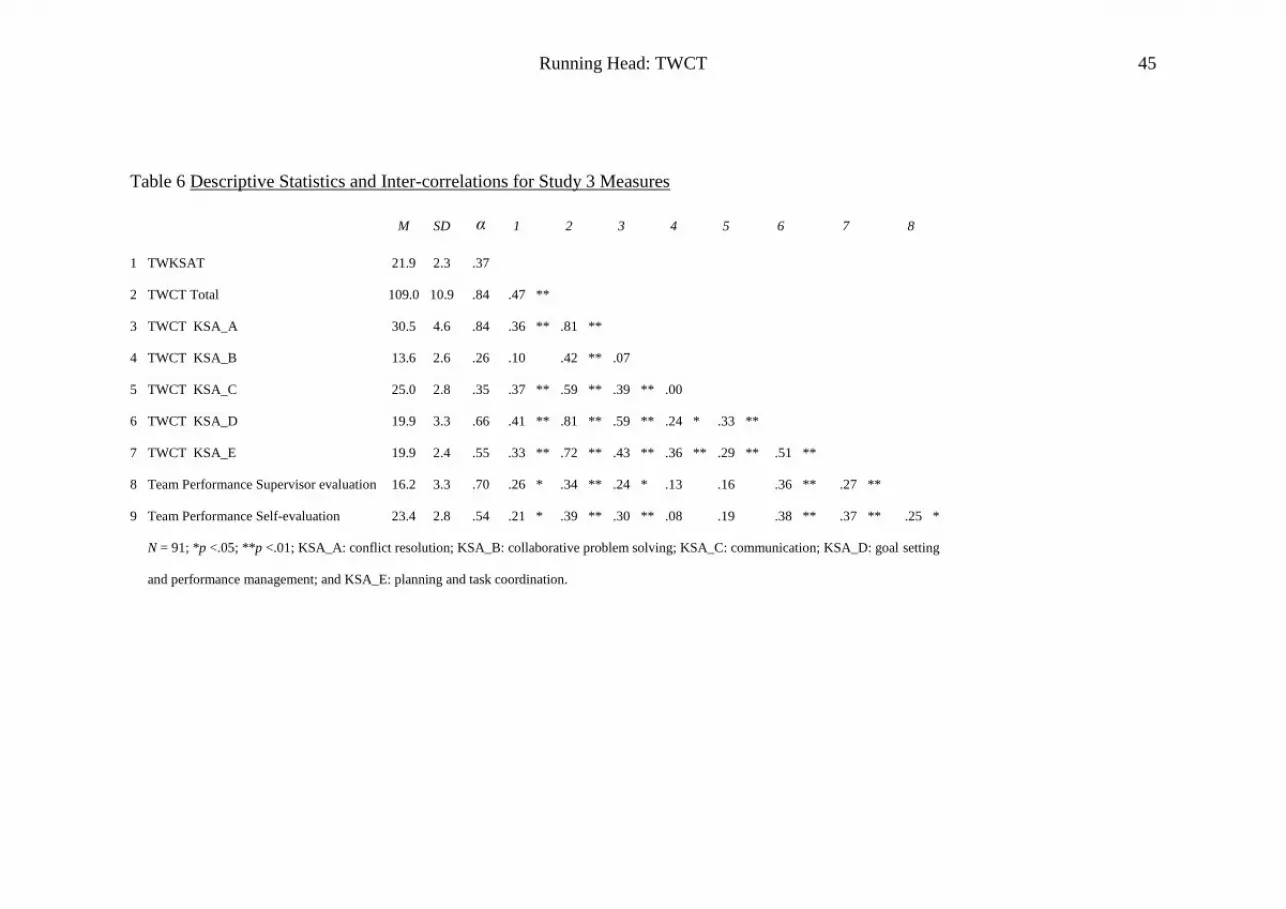
Table 6 summarizes the descriptive statistics and intercorrelations for all of the
variables in the study. The reliability of the two criteria measures used was .70 for team
performance supervisor evaluation and .54 for team performance self-evaluation. The
two versions of the TWKSAT were positively correlated (r = .47; p < .01), as were the
assessments made by the supervisors and the employees (r = .25; p < .05). As in study
2, the competencies evaluated in the TWCT were positively correlated (except B:
Collaborative Problem Solving). Also, the competencies as captured by the TWCT were
positively correlated with the original TWKSAT, except competency B.
The supervisor assessment correlation with the TWCT was .34 (p < .01)
compared to a correlation of .26 (p < .05) with the TWKSAT. These correlations are not
statistically different (T = - 0.76, p < .05). A similar effect was observed in the employee
self-assessments, which showed a correlation of .39 (p < .01) with the TWCT and .21
(p < .05) with the TWKSAT. These correlations are statistically different (T = -1.78, p <

TWCT 24
.05). Analysis of the TWCT competencies shows that competencies A (Conflict
Resolution), D (Goal Setting and Performance Management) and E (Planning and
Coordination) are positively correlated both with the supervisor’s assessment (r = .24, p
< .05; r = .36, p < .01; r = .27, p < .01, respectively) and with employees’ self-
assessments (r = .30, p < .01; r = .38, p < .01; r = .37, p < .01, respectively).
----------------------------------
Insert Table 6 about here
----------------------------------
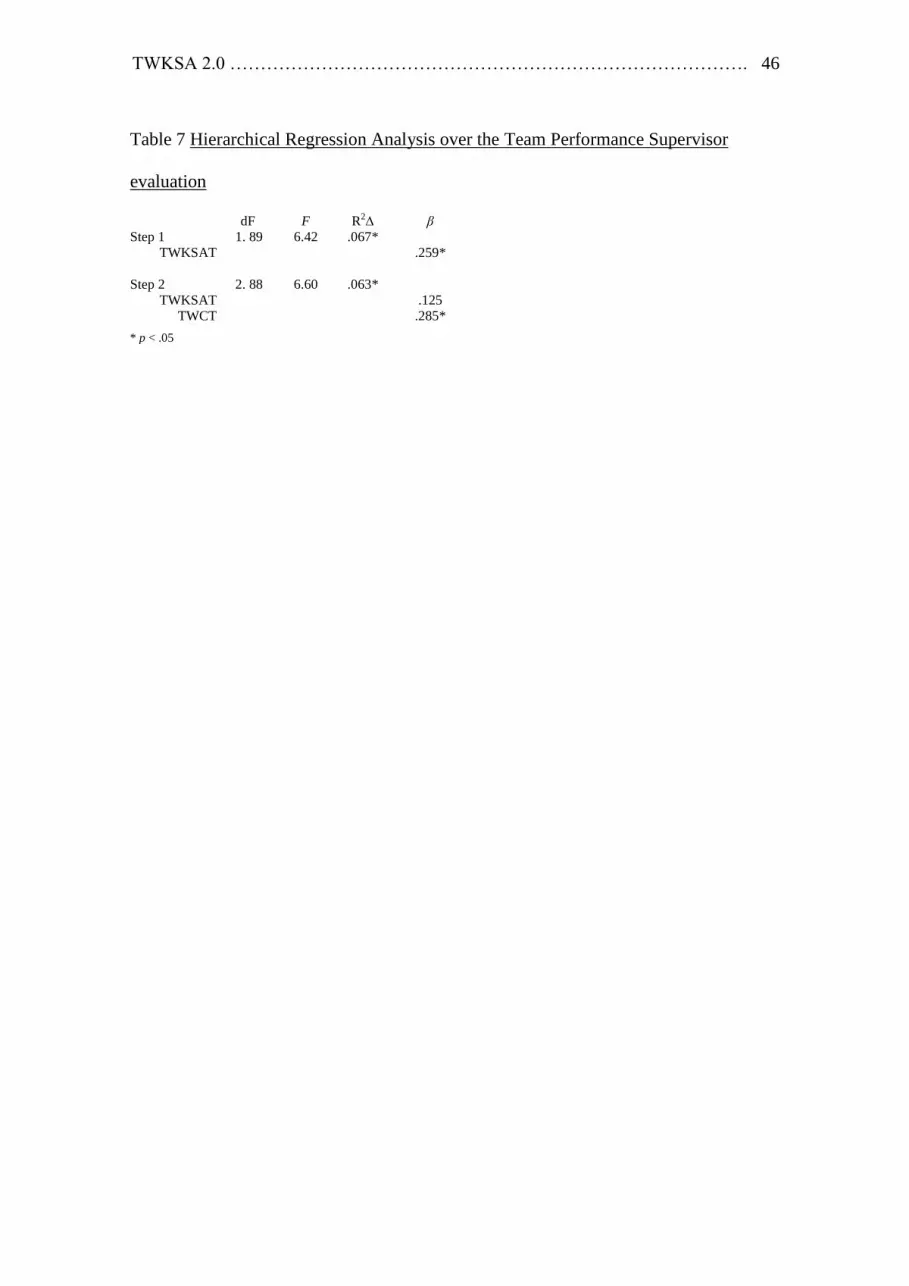
Finally, we performed a hierarchical regression analysis examining the
proportion of the variance in the scores obtained from the supervisors’ assessments due
to TWKSAT and TWCT, respectively. In the first step, TWKSAT was introduced,
while the TWCT score was introduced in a second step. Table 7 indicates that the
percentage of explained variance increases significantly at 6.3% (ΔR2 = .063, p < .05; F
= 6.60; β = .285, p < .05) when TWCT is introduced.
----------------------------------
Insert Table 7 about here
----------------------------------
Discussion
The results of the third study provide favorable empirical evidence for the
convergent validity of TWCT. The total score in this new version of the test is
positively correlated with the other measures in the study, namely a) the score in the
original Stevens and Campion test (1999), b) the supervisors’ assessments of the
teamwork behavior of employees in their routine work, and c) the self-assessments
made by the employees themselves. Furthermore, the results indicate that Conflict

TWCT 25
Resolution, Goal Setting and Performance Management, and Planning and
Coordination are the only competencies of the five contained in TWCT that correlate
independently with the criterion variables.
Contrary to our expectations, however, the correlations between the different
sub-scales in the test were not all either significant or positive. Specifically,
Collaborative Problem Solving is weakly related to the other dimensions except Goal
Setting and Performance Management and Planning and Coordination.
Another interesting feature is the significant, positive correlation found between
the original TWKSAT and the supervisors’ assessments. This is in line with the original
study carried out by Stevens and Campion (1999). Finally, comparison of the predictive
capacity of the two versions of the TWKSAT suggests that the TWCT is a better
predictor of the self-assessment of teamwork – but not of the supervisors’ assessments –
than the original test.
General Discussion
Overall, the three studies highlight certain significant limitations in the original
TWKSAT designed by Stevens and Campion (1999), improving the metric
characteristics of the test and developing a new version. Available research shows that
the TWKSAT offers good predictive validity (McClough & Rogelberg, 2003), but it
may be improved in terms of reliability (e.g., Athanasaw, 2003; Chen et al., 2004).
Despite the TWKSAT’s relevance as an appropriate measure of essential teamwork
competencies, the absence of studies examining the causes of these reliability problems
is surprising.
Based on the results of study 1: a) the reliability problems in the TWKSAT are
due to the poor functioning of certain items, b) the domain contents proposed by the

TWCT 26
authors are not satisfactorily represented by the test items, and c) the dimensionality of
the test does not reflect the original substantive model.
Study 2 presents the TWCT, which is a new development focused on the
Stevens & Campion’s model. The TWCT includes 36 items in a four-point frequency
scale format and drafted in “observable behaviors” statements. The dimensionality of
the TWCT reproduces the original substantive model better than its predecessor,
reflecting the assessment contents domain included in the model and offering reliable
scores both in the test total and in each of the model’s five dimensions.
Finally, study 3 provides initial evidence for the criterion validity of the TWCT
compared to the original test in a sample of professionals. The total TWCT score is
positively correlated with the teamwork assessments made both by supervisors and by
the employees themselves. Moreover the TWCT predicts the supervisor assessment
better than the TWKSAT.
Overall, our research provides empirical evidence concerning the method for
valid, reliable teamwork competency assessments. The TWCT offers a more accurate
measure of teamwork competency in terms of reliability than the original measure
proposed by Stevens and Campion (1994), as well as greater conceptual richness in
terms of independent scores for the five competencies identified by the authors. This
importantly allows differential analysis of the effects of specific competencies on the
performance of different types of teams. In addition, it makes possible the examination
of whether improving the skills associated with a specific teamwork competency
benefits the others. Our findings also help both academics and practitioners to better
understand the low reliability indicators for the TWKSAT, and provide a new test

TWCT 27
(TWCT) which improves reliability and offers an independent measure for each of the
dimensions proposed by Stevens and Campion (1999).
Considering the competencies measured by TWCT from the standpoint of the
five major teamwork dimensions proposed by Salas et al. (2005), the competencies
measured at the individual level are found to be associated with two of the core
dimensions these authors describe, namely follow-up and monitoring of team
performance, and team orientation. However, other core dimensions of the model, like
team leadership, replacement behaviors and adaptability, do not appear in the TWCT. In
addition, recent studies show the capacity of knowledge tests on team roles related to
the task, team and boundary spanning activities to accurately predict performance in
teams (Marrone et al., 2007; Mumford et al., 2008). Future research should consider this
issue as the TWCT would gain in both quality and utility if it included the mentioned
dimensions.
Despite the above-mentioned contributions, our research is not without
limitations. First, the samples analyzed in the first two studies are of a reasonable size
but were provided by university students. If our results are to be generalized, the studies
would need to be replicated in larger samples of employees. In particular, the factorial
analysis conducted on the TWKSAT should be replicated both in larger samples, since
our sample was smaller than the criterion of 10 participants per item, and in American
samples to solve the potential effects of cultural differences. As proposed by Ryan,
Chan, Ployhart and Slade (1999), beyond the translation of the TWKSAT, it is
necessary to adapt the test considering the equivalence of the measurements obtained in
culturally diverse populations. Secondly, the factorial analyses carried out on the TWCT
reveal a dimensional structure that is similar to the substantive model employed but

TWCT 28
does not reflect it perfectly. Further studies should look into the reasons for this,
particularly with regard to the functioning of the Collaborative Problem Solving scale.
In line with the underlying theoretical model, it was expected that this competency
would correlate with Conflict Management and Communication, but only a weak
association was found. Moreover, Collaborative Problem Solving correlates more
closely with other competencies related with team self-management. Analysis of the
content of items (e.g., item 11 “In addressing minor aspects of tasks, I do not need to
consult with the majority of the team members to reach a consensus decision”) indicates
that behaviors of this kind are related to effective coordination.
The number and type of competencies selected is a critical issue. The
competencies originally proposed by Stevens and Campion (1994) do not exhaust the
set of skills that could be considered to explain what people actually do in effective
teamwork. For example, the skills to develop shared mental models (Cannon-Bowers et
al., 1995; Zaccaro, Rittman & Marks, 2001), mutual trust (Bandow, 2001; Webber,
2002) and team leadership (Cannon-Bowers et al., 1995; Marks, Mathieu & Zaccaro,
2000) may also be critical in explaining team performance. As mentioned above, the
development of measures that integrate these aspects would improve our ability to
diagnose and predict teams’ performance based on the personal abilities of the
individuals who form them. Moreover, the use of advanced psychometric models like
those based on item response theory (Hambleton & Swaminathan, 1985) would allow
the design of computerized adaptive tests able to optimize the administration of a wide-
ranging measure (Lord, 1970; Owen, 1975).
Finally, let us consider the practical implications of this research. The
information provided by the new TWCT is of great interest for people management in

TWCT 29
organizations, as it shows managers, team leaders and human resources professionals
which employees’ competencies are critical to select, train and develop in order to
improve team performance.
By throwing light on candidates’ skills, the test would facilitate selection and
team composition decisions. The access to information on five different competencies
means the configuration of teams can be supported by a richer information base than
would be possible using only a single general estimate. In addition, the differential
diagnosis provided by the TWCT on the stronger and weaker competencies of each
employee will allow teams to customize training and development interventions. This is
particularly valuable in view of the increasing demand for training programs to improve
teamwork competencies (Chen et al., 2004). Finally, the behaviors made explicit by the
TWCT could be used as a guide to determine the behavioral anchors and sample
behaviors used in the design of performance assessment and management tools.

TWCT 30
References
Athanasaw, Y. A. (2003). Team characteristics and team member knowledge, skills, and
ability relationships to the effectiveness of cross-functional teams in the public
sector. International Journal of Public Administration, 26, 1167-1205.
Brislin, R. W. (1970). Back-translation for cross-cultural research. Journal of Cross-
cultural Psychology, 1, 185-216.
Cannon-Bowers, J. A., & Bowers, C. A. (2011). Team development and functioning. In
S. Zedeck (Ed.), APA handbook of industrial and organizational psychology
(Vol. 1, pp. 597-650). Washington, DC: American Psychological Association.
Cannon-Bowers, J. A., Tannenbaum, S. I., Salas, E., & Volpe, C. E. (1995). Defining
competencies and establishing team training requirements. In R. A. Guzzo, & E.
Salas (Eds.), Team effectiveness and decision making in organizations (pp. 333-
380). San Francisco, CA: Jossey-Bass.
Chen, G., Donahue, L. M., & Klimoski R. J. (2004). Training undergraduates to work in
organizational teams. Academy of Management Learning and Education, 3, 27-
40.
Clevenger, J., Pereira, G. M., Wiechmann, D., Schmitt, N., & Harvey, V.S. (2001).
Incremental validity of situational judgment tests. Journal of Applied
Psychology, 86, 410-417.
Cox, T., Lobel, S.,&McLeod, P. (1991). Effects of ethnic group cultural differences on
cooperative and competitive behavior on a group task. Academy of Management
Journal, 34, 827-847.
Earley, P. C., & Erez, M. (1997). The transplanted executive. New York: Oxford
University Press.

TWCT 31
Gibson, C.B. (1999). Do they do what they believe they can? Group efficacy and group
effectiveness across tasks and cultures. Academy of Management Journal, 42,
138-152.
Grimm, S. D., Church, A. T., Katigbak, M. S., Reyes, J.A.S. (1999). Self-described
traits, values, and moods associated with individualism and collectivism.
Journal of Cross-Cultural Psychology, 30, 466-500.
Hackman, J. R. (2002). Leading teams: Setting the stage for great performances.
Boston, MA: Harvard Business School Press.
Hambleton, R.K., & Swaminathan, J. (1985). Item response theory: Principles and
Applications. Boston, M.A: Kluwer.
Hampden-Turner, C., & Trompenaars, F. (1993). The seven cultures of capitalism:
Value systems for creating wealth in the United States, Japan, Germany, France,
Sweden, and the Netherlands. Garden City, NY: Doubleday.
Hofstede, G. (1980). Culture’s consequences: International differences in work related
values. Beverly Hills, CA: Sage.
Hofstede, G. (1983a). The cultural relativity of organizational practices and theories.
Journal of international business studies,14 (2), 75-89.
Hofstede, G. (1983b). Dimensions of national cultures in fifty countries and three
regions. Expiscations in cross-cultural psychology, 335-355.
Kluckhohn, F., & Strodtbeck, F. L. (1961). Variations in value orientations. Evanston,
IL: Row.
Kozlowski, S. W. J., & Ilgen, D. R. (2006). Enhancing the effectiveness of work groups
and teams. Psychological Science in the Public Interest, 7, 77-124.

TWCT 32
Lawler, E. E. III, & Worley, C. G. (2006). Built to change. How to achieve sustained
organizational effectiveness. San Francisco, CA: Jossey-Bass.
Leach, D. J., Wall, T. D., Rogelberg, S. G., & Jackson, P.R. (2005). Team autonomy,
performance, and member job strain: Uncovering the Teamwork KSA link.
Applied Psychology: An International Review, 54, 1-24.
Lord, F.M. (1970). Some test theory for tailored testing. In W.H. Holtzman (Ed.),
Computer assisted instruction, testing and guidance 139-183. New York: Harper
& Row.
Lorenzo-Seva, U., & Ferrando, P.J. (2006). FACTOR: A computer program to fit the
exploratory factor analysis model. Behavioral Research Methods, Instruments
and Computers, 38, 88-91.
Marks, M.A., Mathieu, J.E., & Zaccaro, S.J. (2001). A temporally based framework and
taxonomy of team processes. Academy of Management Review, 26, 356-376.
Marrone, J.A., Tesluk, P.E., & Carson, J.B. (2007). A multi-level investigation of
antecedents and consequences of team member boundary spanning behavior.
Academy of Management Journal, 50, 1423-1439.
Maznevski, M. L., DiStefano, J. J., Gomez, C.B., Noorderhaven, N. G., &Wu, P.
(1997). The cultural orientations framework and international management
research. Paper presented at the Academy of International Business annual
meeting, Guadalajara, Mexico.
McClough A. C., & Rogelberg, S. G. (2003). Selection in teams: An exploration of the
teamwork knowledge, skills and ability test. International Journal of Selection
and Assessment, 11, 56-66.

TWCT 33
McDaniel, M.A., Morgeson, F.P., Finnegan, E.B., Campion, M.A., & Braverman, E.P.
(2001). Use of situational judgement tests to predict job performance: A
clarification of the literature. Journal of Applied Psychology, 86, 730-740.
Mumford, T.V., Van Iddekinge, C.H., Morgeson, F.P., & Campion, M.A. (2008). The
team role test: Development and validation of a team role knowledge situational
judgment test. Journal of Applied Psychology, 93, 250-267.
Muthén, B., & Muthén, L.K. (2006). Mplus. L.A.: Muthén & Muthén.
Owen, R.J. (1975). A Bayesian sequential procedure for quantal response in the context
of adaptive mental testing. Journal of the American Statistical Association, 70,
351-356.
Peeters, M. A. G., van Tuijl, H. F. J. M., Rutte, C. G., & Reymen, I. M. M. J. (2006).
Personality and team performance: A meta-analysis. European Journal of
Personality, 20, 377-396.
Rovinelli, R. J., & Hambleton, R. K. (1977). On the use of content specialists in the
assessment of criterion-referenced test item validity. Dutch Journal of
Educational Research, 2, 49-60.
Ryan, A. M., Chan, D., Ployhart, R. E.,&Slade, L. A. (1999). Employee attitude surveys
in a multinational organization: Considering language and culture in assessing
measurement equivalence. Personnel Psychology, 52, 37- 58.
Salas, E., Sims, D. E., & Klein, C. (2004). Cooperation at work. In C. D. Spielberger
(Ed.), Encyclopedia of Applied Psychology (Vol. 1, pp. 497–505). Boston, MA:
Elsevier Academic Press.
Salas, E., Sims, D.E., & Burke, C.S. (2005). Is there a “big five” in teamwork? Small
Group Research, 36, 555-599.

TWCT 34
Schmidt, F.L., & Hunter, J.E. (1983). Individual differences in productivity: An
empirical test of estimates derived from studies of selection procedure utility.
Journal of Applied Psychology, 68, 407-415.
Spencer, L.M., & Spencer, S.M. (1993). Competence at work: Models for superior
performance. New York: John Wiley & Sons.
Stevens, M. A., & Campion, M. J. (1994). The knowledge, skill, and ability
requirements for teamwork: Implications for human resource management.
Journal of Management, 20, 503-530.
Stevens, M. A., & Campion, M. J. (1999). Staffing work teams: Development and
validation of a selection test for teamwork settings. Journal of Management, 25,
207-228.
Thorn, D. W., & Deitz, J. C. (1989). Examining content validity through the use of
content experts. Occupational Therapy Journal of Research, 9, 334-346.
Triandis, H. C. (1995). Individualism and collectivism. Boulder, CO: Westview.
Trompenaars, F. (1993). Riding the waves of culture: Understanding cultural diversity
in business. Burr Ridge, IL: Irwin.
Webber, S.S. (2002). Leadership and trust facilitating cross-functional team success.
Journal of Management Development, 21, 201-214.
Zaccaro, S.J., Rittman, A.L., & Marks, M.A. (2001). Team leadership. Leadership
Quarterly, 12, 451-483.

TWCT 35
FOOTNOTES
1.
TWKSAT is a commercial test and we therefore do not provide the content of
the items included in the test so as to protect the intellectual property rights of its
authors. The test can be acquired at (http://www.vangent-
hcm.com/Solutions/SelectionAssessments/SkillsAbilitiesAssessments/). We use the
original numbering of the items in our presentation of results to facilitate understanding.
2.
The task materials are available under request.

TWCT 36
Table 1 Descriptive Statistics for Study 1 TWKSAT Original Items
Mean
Standard
Deviation
Discrimination Index
(corrected item-total
correlation)
Skewness Kurtosis
Item01 .59 0.49 .22 -0.80 -1.34
Item02 .39 0.49 .03 0.68 -1.53
Item03 .79 0.41 .18 -1.62 0.63
Item04 .68 0.47 .01 -1.44 0.08
Item05 .53 0.50 .17 -0.23 -1.94
Item06 .93 0.25 .35 -5.39 27.02
Item07 .49 0.50 -.07 0.02 -1.99
Item08 .91 0.29 .37 -4.08 14.60
Item09 .34 0.47 .19 0.25 -1.93
Item10 .72 0.45 .13 -1.26 -0.40
Item11 .50 0.50 .14 -0.46 -1.78
Item12 .29 0.45 -.01 0.70 -1.49
Item13 .71 0.46 .15 -1.01 -0.96
Item14 .29 0.45 .22 0.69 -1.51
Item15 .70 0.46 .10 -0.88 -1.22
Item16 .11 0.32 .30 0.60 -1.63
Item17 .69 0.46 .02 -0.79 -1.37
Item18 .16 0.37 .31 0.15 -1.97
Item19 .70 0.46 .30 -0.86 -1.25
Item20 .76 0.43 .35 -1.62 0.63
Item21 .56 0.50 .21 -1.06 -0.85
Item22 .61 0.49 .29 -0.60 -1.63
Item23 .50 0.50 .27 -0.33 -1.88
Item24 .40 0.49 .01 -0.02 -1.99
Item25 .32 0.47 .02 0.43 -1.80

TWCT 37
Item26 .08 0.28 .24 0.92 -1.14
Item27 .38 0.49 -.06 0.01 -1.99
Item28 .68 0.47 .36 -1.18 -0.58
Item29 .22 0.41 .15 1.15 -0.67
Item30 .15 0.36 .41 0.13 -1.98
Item31 .64 0.48 .15 -1.00 -0.99
Item32 .09 0.29 .34 0.31 -1.89
Item33 .61 0.49 .12 -0.40 -1.83
Item34 .23 0.42 .10 0.76 -1.41
Item35 .50 0.50 -.05 0.02 -1.99
α = .60
N = 135

TWCT 38
Table 2 TWKSAT Congruence Indexes
Item/Content A1 A2 A3 B1 B2 C1 C2 C3 C4 C5 D1 D2 E1 E2
Item06 .88 .35
Item07 .65 .47
Item23 .92
Item10 .55 .37
Item12 .64
Item26 .65
Item22 .97
Item27 .31
Item28 .92
Item29 .31
Item15 .96
Item32 .79
Item33 .45
Item34 .64
Item09 .58
Item16 .94 .76
Item30 .60
Item14 .58 .94
Item24 .40 .94
Item35 .59 .95
Item02 .79
Item17 .99
Item01 .95
Item04 .92
Item11 .97
Item19 1
Item18 .62
TWCT 39
Item08 .88 .71
Item13 .62
Item20 .78
Item21 .95 .41
Item25 .55 .37
Item05 .59
Item03 .71 .88
Item31
A1: The KSA to recognize and encourage desirable, but discourage undesirable, team conflict; A2: The
KSA to recognize the type and source of conflict confronting the team and to implement an appropriate
conflict resolution strategy; A3: The KSA to employ an integrative negotiation strategy rather than the
traditional distributive strategy; B1: The KSA to identify situations requiring participative group problem
solving and to utilize the proper degree and type of participation; B2: The KSA to recognize the obstacles
to collaborative group problem solving and implement appropriate corrective actions; C1: The KSA to
understand communication networks and to utilize decentralized networks to enhance the communication
where possible; C2: The KSA to communicate openly and supportively; C3: The KSA to listen non-
evaluatively and appropriately use active listening techniques; C4: The KSA to maximize consonance
between non-verbal and verbal messages, and to recognize and interpret the non-verbal messages of
others; C5: The KSA to engage in ritual greetings and small talk, and a recognition of their importance;
D1: The KSA to help establish specific, challenging, and accepted team goals; D2: The KSA to monitor,
evaluate, and provide feedback on both overall team performance and individual team member
performance; E1: The KSA to coordinate and synchronize activities, information, and task
interdependencies between members; E2: The KSA to help establish task and role expectations of
individual team members and to ensure proper balancing of workload in the team.
To facilitate indexes reading, <.30 have been eliminated; indexes >.80 appear in cursive; and the greater
index obtained for each item appears in boldface.

TWCT 40
Table 3 Model Fit Indexes
RMSEA CFI TLI
5-Factor Model (Ortogonal) 0,082 0,067 0,008
2-Factor Model (Ortogonal) 0,07 0,324 0,282
5-Factor Model (Correlated) 0,04 0,776 0,762
2-Factor Model (Correlated) 0,038 0,807 0,792
1-Factor Model 0,041 0,774 0,76
N= 135; RMSEA: Root Mean Square Error Of Approximation; CFI:
Confirmatory fit index; TLI: Tucker-Lewis fit index

TWCT 41
Table 4 TWCT Item Statistics, Congruence Indexes, and Scale Reliabilities
Item M SD A1 A2 A3 B1 B2 C1 C2 C3 C4 C5 D1 D2 E1 E2
1 3.34 0.67 1
16 3.00 0.75 1
19 2.91 0.74 .56
.83
21 3.12 0.75 .77
.63
.5
7 3.41 0.60
.69
.83
10 2.47 0.89
.64
3 2.88 0.79
.94
15 3.27 0.68
.81
.81
11 3.00 0.86
.81
25 3.04 0.84
1
14 2.71 0.74
.70
24 2.51 0.81
.83
26 2.61 0.76
1
5 2.83 0.70
0.95
17 3.27 0.70
.95
28 3.28 0.69
1
29 3.31 0.68
.69
2 3.43 0.61
.78
27 3.37 0.63
1
8 3.57 0.61
0.89
9 3.13 0.75
0.83
12 3.25 0.79
1
30 3.23 0.78
1
35 2.70 0.75
1
6 2.99 0.76
.87
20 3.03 0.81
.95
22 2.91 0.83
.95
31 3.00 0.77
1
32 3.06 0.78
1
36 2.86 0.80
.95

TWCT 42
4 3.06 0.72
.87
23 3.33 0.75
1
33 3.11 0.68
.87
34 3.07 0.68
.87
13 3.65 0.60
.89
18 3.05 0.73
1
Total 112.9 12
N = 120

TWCT 43
Table 5 Exploratory Factor Analysis for TWCT Items Configuration Matrix
Item/factor 1 2 3 4 5 6 7 8
Item28 .93 -.09 -.05 -.02 -.10 -.02 -.03 .05
Item17 .92 -.12 -.02 -.05 -.07 -.02 -.04 .08
Item29 .90 -.11 -.03 -.05 -.10 -.06 -.06 .12
Item15 .47 .08 .05 .04 .16 .07 .02 -.04
Item19 .35 .03 .05 .06 .09 .16 .19 -.03
Item18 .29 .00 .25 .09 .03 .06 .17 .03
Item01 .24 .07 .12 .10 .24 .14 .16 -.02
Item10 .23 -.02 .15 .08 .09 .06 .14 -.05
Item21 .21 -.05 .06 .13 .04 .29 -.03 -.08
Item16 .18 .13 .20 -.01 .13 .15 .09 .05
Item34 .05 -.94 -.02 .01 -.03 .10 -.06 -.03
Item33 .02 -.91 -.04 -.03 -.04 .06 -.03 -.01
Item04 .05 -.84 .03 .02 .01 .09 -.07 -.05
Item23 .01 -.55 .13 -.05 .05 .06 .12 -.02
Item08 .04 -.22 .01 .01 .05 -.07 .11 .08
Item13 .00 -.19 .13 -.02 .05 -.02 .18 .06
Item31 -.06 -.05 .93 -.03 -.02 .01 -.06 .03
Item06 -.06 .01 .91 .00 -.02 .02 -.05 .01
Item22 .00 -.05 .87 .02 -.01 -.01 -.03 -.07
Item35 .12 -.01 .11 .10 .03 .05 -.01 .08
Item26 -.02 -.01 -.01 .95 -.06 .03 -.07 .00
Item14 -.02 .01 -.09 .89 -.07 -.02 -.06 .01
Item24 -.12 .03 .08 .80 .05 -.02 .03 .01
Item11 -.08 -.02 -.03 -.02 .98 -.03 -.08 .02
Item25 -.07 -.02 -.03 -.05 .93 -.03 -.10 .03
Item20 -.06 -.10 -.02 -.01 -.04 .89 .03 .02
Item32 -.09 -.14 -.02 -.05 -.01 .85 .03 .08

TWCT 44
Item36 .11 .06 .13 .04 .00 .53 .08 .09
Item27 -.08 -.06 -.01 -.04 -.07 .09 .90 -.08
Item02 -.10 -.05 -.02 -.06 -.10 .05 .79 -.03
Item03 .16 .04 -.08 .00 .03 .13 .39 .03
Item07 .03 .03 .03 .09 .10 .02 .36 .15
Item05 .09 -.03 .14 .01 -.07 -.08 .25 .09
Item09 .08 -.16 -.03 .17 .11 -.11 .25 .00
Item30 -.02 .01 -.05 .01 .03 .03 -.03 1
Item12 .02 .04 -.01 .01 .00 .07 -.06 .90
N = 120; Extraction: Unweighted Least Squares (ULS); Rotation: Oblimin-Kaiser; Convergence: 12
iterations.
Running Head: TWCT 45
Table 6 Descriptive Statistics and Inter-correlations for Study 3 Measures
M SD α 1 2 3 4 5 6 7 8
1 TWKSAT 21.9 2.3 .37
2 TWCT Total 109.0 10.9 .84 .47 **
3 TWCT KSA_A 30.5 4.6 .84 .36 ** .81 **
4 TWCT KSA_B 13.6 2.6 .26 .10
.42 ** .07
5 TWCT KSA_C 25.0 2.8 .35 .37 ** .59 ** .39 ** .00
6 TWCT KSA_D 19.9 3.3 .66 .41 ** .81 ** .59 ** .24 * .33 **
7 TWCT KSA_E 19.9 2.4 .55 .33 ** .72 ** .43 ** .36 ** .29 ** .51 **
8 Team Performance Supervisor evaluation 16.2 3.3 .70 .26 * .34 ** .24 * .13
.16
.36 ** .27 **
9 Team Performance Self-evaluation 23.4 2.8 .54 .21 * .39 ** .30 ** .08
.19
.38 ** .37 ** .25 *
N = 91; *p <.05; **p <.01; KSA_A: conflict resolution; KSA_B: collaborative problem solving; KSA_C: communication; KSA_D: goal setting
and performance management; and KSA_E: planning and task coordination.
TWKSA 2.0 …………………………………………………………………………. 46
Table 7 Hierarchical Regression Analysis over the Team Performance Supervisor
evaluation
dF F R2∆ β
Step 1 1. 89 6.42 .067*
TWKSAT .259*
Step 2 2. 88 6.60 .063*
TWKSAT .125
TWCT .285*
* p < .05

TWKSA 2.0 …………………………………………………………………………. 47
Figure 1. Stevens & Campion Model
I. Interpersonal KSAs
1. Conflict Resolution
Recognize team conflict.
Recognize type and source of conflict and implement conflict resolution strategies.
Employ integrative (win-win) negotiation strategies.
2. Collaborative Problem Solving
Identify situations requiring participative group problem solving.
Recognize the obstacles to collaborative group problem solving and implement corrective actions.
3. Communication
Understand communication networks and utilize decentralized networks to enhance communication.
Communicate open and supportively.
Listen in a non-evaluative way and use active listening techniques.
Maximize consonance between non-verbal and verbal messages, and recognize and interpret the non-verbal messages of
others.
Engage in ritual greetings and small talk.
II. Self-management KSAs
4. Goal Setting and Performance Management
Establish specific, challenging and accepted team goals.
Monitor, evaluate, and provide feedback on both overall team performance and individual performance.
5. Planning and Task Coordination
Coordinate and synchronize activities, information, and task interdependences.
Establish task and role expectations of individual team members, and ensure proper balancing of workload in the team.

TWKSA 2.0 …………………………………………………………………………. 48
Figure 2. Confirmatory Factor Analysis Solutions for 1-Factor and 2-Factor Models
1,00
Interpersonal
1,00
Self-management
SUM1_F1
SUM1_F4
SUM1_F5
SUM1_F7
SUM1_F8
SUM1_F2
SUM1_F3
SUM1_F6
1,00
e1
1,00
e4
1,00
e5
1,00
e7
1,00
e8
1,00
e2
1,00
e3
1,00
e6
3,65
,52
,25
,53
1,31
1,52
1,49
1,40
-2,17
2,05
1,60
2,13
1,40
2,61
1,96
1,91
,88
SUM1_F1
SUM1_F4
SUM1_F5
SUM1_F7
SUM1_F8
SUM1_F2
SUM1_F3
SUM1_F6
1,00
e1
1,00
e4
1,00
e5
1,00
e7
1,00
e8
1,00
e2
1,00
e3
1,00
e6
2,43
2,05
1,60
2,10
1,41
2,63
2,02
1,98
1,00
Teamwork
3,48
,50
,25
1,44
,52
1,28
1,44
1,40


![[BIM IMPLEMENATION AND TEAMWORK]](https://img.pdfslide.net/doc/110x75/6312f8f5c32ab5e46f0c350a/bim-implemenation-and-teamwork.jpg)


