Embed Size (px)
Citation preview

This material is presented to ensure timely dissemination of scholarly and technical work. Copyright and all rights therein are retained by authors or by other copyright holders. All persons copying this information are expected to adhere to the terms and constraints invoked by each author's copyright. In most cases, these works may not be reposted without the explicit permission of the copyright holder.
This version of the referenced work is the post-print version of the article—it is NOT the final published version nor the corrected proofs. If you would like to receive the final published version please send a request to [email protected], and I will be happy to send you the latest version. Moreover, you can contact the publisher’s website and order the final version there, as well.
The current reference for this work is as follows:
Dean,&D.L.,&J.D.&Lee,&R.E.&Orwig,&and&D.R.&Vogel,&(1994).&“Technological&support&for&group&process&modeling,”&Journal(of(Management(Information(Systems,&11:3&(winter):&pp.&43G64.&&
My vita can be found at http://marriottschool.byu.edu/directory/details?id=5305
Technological Support for Group Process Modeling DOUGLAS L. DEAN, JAMES D. LEE, RICHARD E. ORWIG, AND DOUGLAS R. VOGEL DOUGLAS L. DEAN is a doctoral candidate in Management Information Systems at the University of Arizona. He received a B.S. in accounting from the University of Utah in 1987 and a Master of Accountancy with an emphasis in Information System Consulting from Brigham Young University in 1989. He facilitates group modeling and business process re-engineering sessions. His research interests include electronic meeting support of business modeling, re-engineering, systems analysis and design, group elicitation of information systems requirements, activity-based costing, and software estimation. JAMES D. LEE is a doctoral candidate in Management Information Systems at the University of Arizona. He received a B.S. in accounting from Brigham Young University in 1985 and a Master of Accountancy with an emphasis in Information System Consulting from Brigham Young University in 1989. His research interests include systems analysis and design, database management, electronic meeting support for data modeling in support of business process re-engineering activities, software engineering, and activity-based costing. He has developed software to support process modeling and data modeling in a group environment. RICHARD E. ORWIG is a doctoral candidate in Management Information Systems at the University of Arizona. He received a B.S. in Mathematics and a B.A. in Philosophy from the University of Illinois at Champaign/Urbana in 1975. He received an MBA in Entrepreneurship and Management Information Systems from the University of Arizona in 1990. His research interests include artificial intelligence approaches to indexing information for organizational memory and the collaborative approaches to building and using project memory. His facilitation experience includes hundreds of hours in electronic meeting support of modeling, strategic planning, and other group problem solving. DOUGLAS R. VOGEL is an Associate Professor of Management Information Systems at the University of Arizona. He has been involved with computers and computer systems in various capacities for over 25 years. He received his M.S. in Computer Science from U.C.L.A. in 1972 and his Ph.D. in MIS from the University of Minnesota in 1986. Professor Vogel's current research interests bridge the business and academic communities in addressing questions of the impact of management information systems on aspects of business process re-engineering, group problem solving, cooperative learning, and organizational productivity. ABSTRACT: During business analysis, business activities are modeled and analyzed. Redefined models become the blueprints for improved business activities. The cost to produce models of the organization is high and model accuracy is important. Involvement from knowledgeable participants and stakeholders is desirable during business modeling and analysis. Traditional modeling approaches limit direct participation to a small handful of participants. This paper will discuss the development and evaluation of an electronic meeting system (EMS)-based activity modeling tool. Modeling efforts supported by this new approach are compared with modeling efforts supported by analysts with a single user tool. The results of this comparison reveal that the EMS-based modeling tool allows a greater number of individuals to participate efficiently in model development. Models are developed between 175% and 251% faster with the new approach than with the traditional approach. Specific features are discussed that help relatively novice modelers work with analysts to develop models of reasonable quality. Measures are set forth that can be used to assess modeling efficiency and quality. KEY WORDS AND PHRASES: electronic meeting systems, business process modeling, group modeling, IDEF modeling, business process improvement. Acknowledgement: An earlier version of this paper appeared in the Proceedings of the 27th Annual HICSS, January 1994, pp. 214-223. This research was conducted under contract with the Waterways Experimental Station and was sponsored by the Army Environmental Center. We gratefully acknowledge help from Lynne Mikulich and Bob Rariden from the Army Corps of Engineers Research Lab, and Jonathan S. Stapley who provided input into the methods and tool design. We also acknowledge Boris Nevstrujev and Nina Katic who developed the graphical IDEF0 viewer and Mark Pendergast who has largely developed the latest version of the model editing portion of the tool.
2 DEAN, LEE, ORWIG, AND VOGEL 1. Introduction Current business processes are often artifacts of past events and happenstance rather than careful design and alignment with current business objectives [Hammer, 1990 #36][Hammer, 1993 #37] . Business improvement through business analysis and redesign is not necessarily new [Davenport, 1994 #83], although awareness of the need for significant improvements appears to be growing. In a recent survey of 782 senior information system executives in North America and Europe, "Re-engineering processes through information technology" was ranked as the top information systems priority [Sager, 1994 #97]. Models support conceptualization, communication, analysis, and design for development and improvement of business processes and information systems. Models facilitate understanding of the many steps and relationships of business processes. They help business personnel understand the work domain and identify improvement opportunities. Involvement during model development and analysis is important for model accuracy as well as for the political ramifications of involvement. Nevertheless, models have traditionally been developed by individuals and small groups because of the complexity and difficulties involved when larger groups participate in the modeling process. Through proper tools and methods, more participants can be both directly and productively involved during model development and analysis than in the past. Rapid development of models can ease the substantial burden of model development and analysis. Models can be developed and analyzed more quickly, allowing attention and resources to be directed toward the realization of organizational change. This paper discusses the evolutionary development and use of group-enabled modeling tools for support of business process modeling, along with methods for use of these tools. Next, a comparison of modeling efforts supported by these tools and modeling efforts supported by traditional approaches is made. Comparisons of participation, model development speed and efficiency, and model quality are presented. The paper concludes with a discussion of the new tool development based on the empirical research findings reported herein. 2. Models and Modeling Methods Curtis, Kellner, and Over [Curtis, 1992 #9] provided a useful definition of a model:
A model is an abstract representation of reality that excludes much of the world's infinite detail. The purpose of a model is to reduce the complexity of understanding or interacting with a phenomenon by eliminating the detail that does not include its relevant behavior. Therefore, a model reveals what its creator believes is important in understanding or predicting the phenomena modeled.
There are a variety of methods for modeling business processes. Standard semantics and symbology of these methods allow a user to separate an understanding of the semantics of the modeling method from the understanding of the substantive domain that is modeled [Whitehead, 1958 #95]. The usefulness of a modeling tool is somewhat dependent on how well it provides views and embodies the semantic relationships of the method. For example, CASE tools mirror the semantic meaning of dataflow diagraming or another method. The tool embodies the semantic relationships between objects and supports capture of information about those objects in a unified repository. These features are also very important in a group modeling environment. In addition, a simple user interface is essential since business experts are seldom modeling experts. To enable non-modeling experts to contribute to structured models requires tools carefully engineered for that purpose [Dean, 1994 #7]. 2.1. Business Process Models Davenport and Short [Davenport, 1990 #10] define a business process as a "set of logically related tasks performed to achieve a defined business outcome." The exact scope of what to include when modeling and analyzing a particular business process is a matter of judgment, but the scope should be comprehensive enough to allow a macro perspective of the work and to allow for significant restructuring [Davenport, 1990 #10]. Appropriately developed process models structure the domain and represent the parts that make up the whole. Relationships between the parts can be defined and analyzed. Many traditional organizations have divided work along traditional business function lines such as purchasing or accounts payable. Line authority and incentive structures are often aligned with these departments. Business processes often span these departments, however, and real improvements may often be realized by managing business processes at the process level rather than in the fragmented fashion associated with traditional departments [Schnitt, 1993
3 DEAN, LEE, ORWIG, AND VOGEL #47][Harrington, 1991 #38]. Viewed from a broader perspective, work steps can often be integrated, simplified, and streamlined. A few of the many examples of successful and significant improvements available are found in the literature [Hammer, 1990 #36][Schnitt, 1993 #47][Hall, 1993 #64] [Tomasko, 1993 #52]. 2.2. The IDEF0 Modeling Method The IDEF0 definition method is one of a number of methods commonly used to develop business process models. The term "IDEF" comes from ICAM (Integrated Computer-Aided Manufacturing) DEFinition language [UM, 1981 #66]. The IDEF0 method, which grew out of the Air Force Integrated Computer Aided Manufacturing project, is one of a family of IDEF methods [Mayer, 1994 #90], and has been chosen by the Department of Defense (DoD) as the process modeling method for its functional process improvement initiative [DoD 8020.1-M, 1992 #86]. IDEF0 provides a number of benefits. IDEF0 is based largely on a well-established graphical language known as SADT (Structured Analysis and Design Technique)[Ross, 1977 #68][Marca, 1988 #43][Mayer, 1994 #90]. The basic concepts of IDEF0 are simple enough to be grasped by non-modeling experts. The method purposely abstracts away from organizational structure, actors, sequence, and geographical location of work in order to focus on what is done without bogging the modeler down in excessive detail--a trap to be avoided during process analysis [Davenport, 1993 #65]. IDEF0 embodies a hierarchical structure so that content may be modeled at various and increasing levels of detail. The ability to view different levels of detail is important because of human cognitive limits to deal with complexity [Miller, 1956 #77]. The IDEF0 activity modeling method is designed to model the actions and activities of the organization or system. Business processes are decomposed into their components. Each activity and its associated inputs, controls, outputs and mechanisms (ICOMs) are specified. Each activity and ICOM is described in a glossary. Arrows for inputs, controls, and mechanisms point into the activity and output arrows point away from the activity. A parent's input, control, or mechanism may split (decompose) into separate inputs, controls, or mechanisms for different child processes. The outputs of two or more child processes may join to form one output that is reflected as such in relation to the parent activity. Development of an IDEF0 model is an iterative task [IDEF Users Group Standards and Specification Committee, 1993 #2]. All activities are not identified at first. Rather, new activities may be identified at any time as a result of defining other activities or while identifying or defining ICOMs. Activities must be seen in relation to the ICOMs to determine that they fit together appropriately. Specifying the interrelationships of activities through their ICOMs is one of the most difficult tasks during IDEF0 modeling. It is this task that best tests the appropriateness of the abstractions and ICOM and activity definitions. A modeler may find that the same or similar objects (ICOMs) may be named differently in different parts of the model, and have somewhat different definitions. Such problems can be especially challenging when parts of the model are developed in parallel by different individuals or subgroups. The task of establishing consistent labels and definitions for all activities and ICOMs throughout the model is what we call "reconciliation." If appropriate methods are not used to keep the models reconciled, redundant modeling takes place and ICOM homonyms and synonyms appear throughout the models. 3. Participation, Representation, and Meeting Support Davenport and Stoddard [Davenport, 1994 #83] note that involvement from two types of people is important during process analysis and redesign. First, high-level process designers are needed to analyze across specific functional areas, "because only those in positions overlooking multiple functions may be able to see opportunities for innovation [across related functional areas]." Significant improvement often requires restructuring a broad scope--what Hall, Rosenthal, and Wade [Hall, 1993 #64] refer to as "breadth." Second, involvement is also required from people closest to the work who know the details of process steps, flow, and constraints. Perspectives of both groups must be considered to obtain the best results [Davenport, 1994 #83]. In addition to gaining the expertise possessed by various individuals, obtaining involvement is also important from a buy-in standpoint. Improvements must be moved from the conceptual to the implementation stage, and it is commonly held that individuals not participating in or represented during analysis and design are less likely to cooperate during implementation. Davenport and Stoddard note that they, "... have observed several post-re-engineering work execution teams that paid little attention to the prescribed process design, at least partly because they had no hand in its creation. (p. 125)." Thus, it is important to involve individuals and representatives from various constituencies during process modeling and design. 3.1. Limitations of Traditional Structured Design Meetings
4 DEAN, LEE, ORWIG, AND VOGEL Traditionally, IDEF0 modeling meetings have been conducted with a small group of five to nine people because it is difficult to keep a larger group productive. Traditional tool support has not allowed large numbers of individuals to conveniently contribute to a model. Small-group IDEF modeling is usually conducted in a chauffeured manner [Nunamaker, 1991 #44][Dean, 1994 #7]--that is, a facilitator or group leader elicits input from participants. A scribe enters the information into a commercially available, single-workstation, IDEF0 tool. As the group uses flip charts, white boards, or pencil and paper to define the objects and descriptions, the modeler (or scribe) transcribes this information in the IDEF tool to make an electronic copy of the model. These tools act as model repositories, as well as semantic checking devices. The group reviews the model via printouts or directly on the computer screen as the facilitator leads the group through model development. Since a handful of individuals describe the entire work activity, it is common for an IDEF0 modeling session to last from three to five weeks, sometimes longer depending on the scope and complexity of the domain being modeled [Dennis, 1994 #3]. Because traditional tools and meeting methods have limited direct involvement in the modeling process to a relative handful of people, there are sometimes too few to really address the problem at hand, from either a content or political perspective. Typically, a small group has participated directly in the modeling with only secondary involvement from other stakeholders, and secondary involvement may take a variety of forms. Models and proposals are sometimes circulated to various individuals and verbal briefings are sometimes provided. In the worse case, there is no secondary involvement. 3.2. Technological Support for Business Modeling Electronic Meeting Systems (EMS) have shown promise in helping large groups of individuals contribute directly and productively during meetings [Nunamaker, 1991 #98]. Parallel communication is one of the hallmarks of EMS [Nunamaker, 1991 #44]. Individuals contribute through networked computers instead of, and in addition to, verbal communication. EMS consists of three components. The first is a meeting room equipped with networked computer workstations for all participants, and a large-screen video projection system upon which information can be displayed (an electronic blackboard). The second EMS component is group support software that enables participants to contribute ideas, analyze options, vote on alternatives, and so forth. The third component is a facilitator, who may assist in developing the agenda, chairing the meeting, and helping participants use the technology. The goal of the Enterprise Analysis project at the University of Arizona has been to develop facilitation techniques and software tools that will allow a larger number of individuals to contribute directly and productively during business modeling. This may improve the speed and quality of business and information system modeling and analysis. The University of Arizona's enterprise analysis approach has been used in several re-engineering sessions by current and past researchers at Arizona [Dean, 1994 #7][Dennis, 1993 #70]. Tools such as electronic brainstorming, idea categorization, and group vote have proven extremely useful in supporting business modeling and analysis teams [Vogel, 1993 #49][Dennis, 1993 #70]. Over time, other specialized modeling and analysis tools have been developed to support business modeling and analysis. Recently the University of Arizona has focused on developing an EMS tool to support large-group IDEF0 activity modeling. A form driven modeling tool with a link to a graphical viewer has been developed to support the capture and reconciliation of integrated IDEF0 models. This tool embodies the IDEF0 method. The tool supports direct entry of activity models by subject matter experts (SMEs) who have very little IDEF0 expertise. Participants can work on different parts of the model in parallel. The tool provides concurrency control and allows participants to view the other parts of the model. Syntactic and semantic checking for IDEF0 model correctness are also built into the tool. This paper discusses the evolution of this tool and methods for its use as well as findings regarding its evaluation in relation to traditional modeling approaches. 4. Research Questions and Approach The following three research questions are addressed in this paper: First, what features of a group modeling tool are important to effectively support group modeling meetings? Second, can EMS modeling tools and methods allow a larger number of participants to contribute directly to a model than traditionally supported modeling approaches, resulting in faster, more efficient model development? Third, how does the quality of structured models developed with the new approach compare with that of models produced by traditional meeting support methods? In order to obtain insight into tool features and meeting methods, we used an evolutionary prototype and evaluation approach. The following sections describe the tools and the three-step evolutionary path that was followed during their
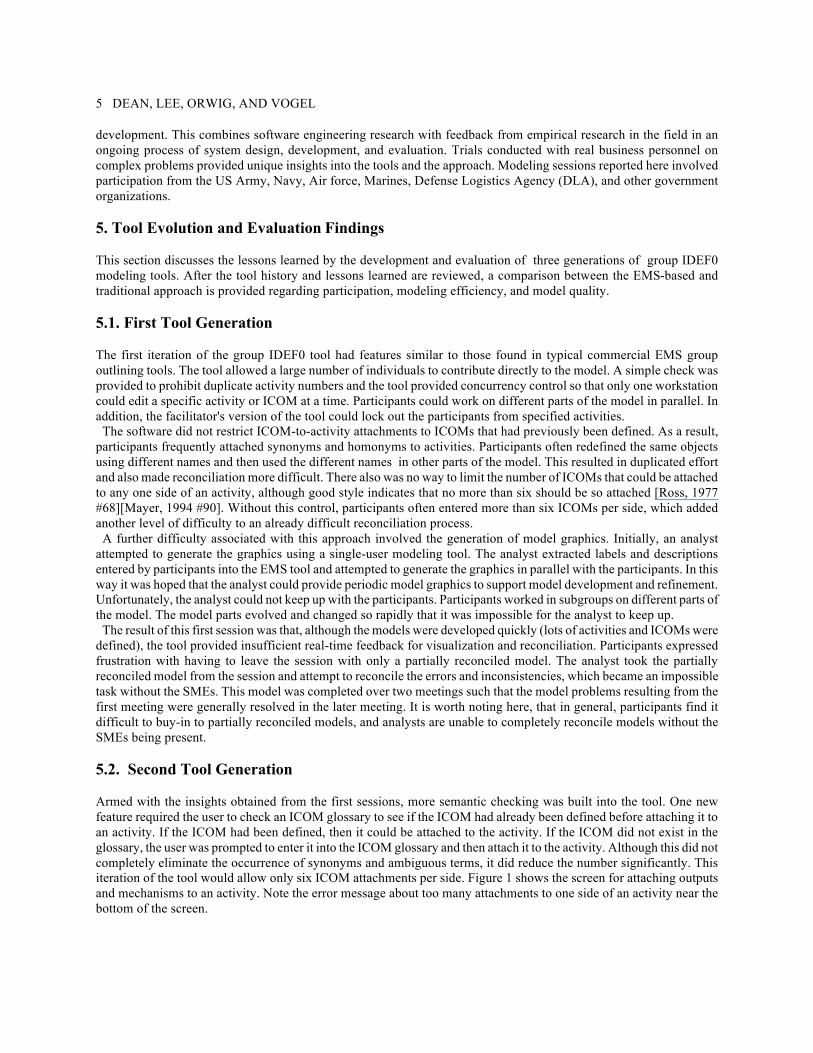
5 DEAN, LEE, ORWIG, AND VOGEL development. This combines software engineering research with feedback from empirical research in the field in an ongoing process of system design, development, and evaluation. Trials conducted with real business personnel on complex problems provided unique insights into the tools and the approach. Modeling sessions reported here involved participation from the US Army, Navy, Air force, Marines, Defense Logistics Agency (DLA), and other government organizations. 5. Tool Evolution and Evaluation Findings This section discusses the lessons learned by the development and evaluation of three generations of group IDEF0 modeling tools. After the tool history and lessons learned are reviewed, a comparison between the EMS-based and traditional approach is provided regarding participation, modeling efficiency, and model quality. 5.1. First Tool Generation The first iteration of the group IDEF0 tool had features similar to those found in typical commercial EMS group outlining tools. The tool allowed a large number of individuals to contribute directly to the model. A simple check was provided to prohibit duplicate activity numbers and the tool provided concurrency control so that only one workstation could edit a specific activity or ICOM at a time. Participants could work on different parts of the model in parallel. In addition, the facilitator's version of the tool could lock out the participants from specified activities. The software did not restrict ICOM-to-activity attachments to ICOMs that had previously been defined. As a result, participants frequently attached synonyms and homonyms to activities. Participants often redefined the same objects using different names and then used the different names in other parts of the model. This resulted in duplicated effort and also made reconciliation more difficult. There also was no way to limit the number of ICOMs that could be attached to any one side of an activity, although good style indicates that no more than six should be so attached [Ross, 1977 #68][Mayer, 1994 #90]. Without this control, participants often entered more than six ICOMs per side, which added another level of difficulty to an already difficult reconciliation process. A further difficulty associated with this approach involved the generation of model graphics. Initially, an analyst attempted to generate the graphics using a single-user modeling tool. The analyst extracted labels and descriptions entered by participants into the EMS tool and attempted to generate the graphics in parallel with the participants. In this way it was hoped that the analyst could provide periodic model graphics to support model development and refinement. Unfortunately, the analyst could not keep up with the participants. Participants worked in subgroups on different parts of the model. The model parts evolved and changed so rapidly that it was impossible for the analyst to keep up. The result of this first session was that, although the models were developed quickly (lots of activities and ICOMs were defined), the tool provided insufficient real-time feedback for visualization and reconciliation. Participants expressed frustration with having to leave the session with only a partially reconciled model. The analyst took the partially reconciled model from the session and attempt to reconcile the errors and inconsistencies, which became an impossible task without the SMEs. This model was completed over two meetings such that the model problems resulting from the first meeting were generally resolved in the later meeting. It is worth noting here, that in general, participants find it difficult to buy-in to partially reconciled models, and analysts are unable to completely reconcile models without the SMEs being present. 5.2. Second Tool Generation Armed with the insights obtained from the first sessions, more semantic checking was built into the tool. One new feature required the user to check an ICOM glossary to see if the ICOM had already been defined before attaching it to an activity. If the ICOM had been defined, then it could be attached to the activity. If the ICOM did not exist in the glossary, the user was prompted to enter it into the ICOM glossary and then attach it to the activity. Although this did not completely eliminate the occurrence of synonyms and ambiguous terms, it did reduce the number significantly. This iteration of the tool would allow only six ICOM attachments per side. Figure 1 shows the screen for attaching outputs and mechanisms to an activity. Note the error message about too many attachments to one side of an activity near the bottom of the screen.
6 DEAN, LEE, ORWIG, AND VOGEL
Our experience from the first sessions also indicated that a more efficient way of generating model graphics was needed to complement the rapid textual capture of the models. In the process of reviewing the various IDEF modeling packages, it was discovered that a commercially available modeling tool [Knowledge Based Systems Incorporated, 1992 #99] had a meta-data import utility. The capability to export data from the EMS IDEF0 tool in a format compatible with the commercial tool was developed. This provided the capability to quickly export the EMS data to the commercial IDEF0 tool. Use of this tool allowed facilitators to periodically produce printouts of graphical views of the model. These new features were tested in the next IDEF0 modeling session. As the participants entered and defined activities and ICOMs in the tool, the model information could be exported to the graphical engine, printed, and then distributed to the participants. This helped the session progress in several ways. No longer did an analyst need to try to keep up with the parallel work of all of the subgroups or work into the night to generate model graphics only to have them change dramatically the next day. The elapsed time from the EMS IDEF0 tool to the commercial tool to hard copies of the models was only about five to ten minutes (depending on the overall size of the models). These model graphics proved very valuable to the session participants. The participants could view and annotate the diagrams and could then update and correct the model information in the EMS tool. Then, a new version of the graphics could quickly be generated. The models evolved through repeated iterations until participants were satisfied that the domain was covered. Participants left the session with a reconciled model and the analyst left not nearly as tired or frustrated. The result was that the business experts retained more ownership of the model. Analysts helped the SMEs reconcile the models during the session so that SMEs had direct input to all model changes. Models were reviewed and refined by 20 SMEs right in the session so that problems could be addressed and resolved during that session rather than during a laborious after-session review process. Though this method of graphics generation was a dramatic improvement over previous efforts, it was not without some problems. The main problem was that the commercial tool used to display and print graphics represented only the portion of the data that was semantically correct, and although there was some semantic checking in the EMS tool, it did not check for all semantic rules. When data containing errors were exported to the commercial IDEF0 tool, it screened out errors and displayed and printed only ICOMs that did not violate any semantic IDEF0 rules. Since the commercial tool was not designed to flag errors in imported data, there was no indication of where the semantic violations were located in the imported data. Thus, participants who were very familiar with the model complained occasionally when ICOMs attached in the EMS tool did not show up in the model graphics because of these errors. Some of the common semantic errors were as follows:
· The same ICOM entered and left an activity (the ICOM should be transformed within the activity). · An ICOM at the parent-level existed as a different type at the child-level, e.g., a control at the parent-level and
an input at the child-level. · Incomplete and mismatched splits and joins. If the commercial tool could not find all of the components of
arrow splits and joins in semantically acceptable structures, it would not recognize the split or join. Because these errors were quite common, the analyst would have to debug the errant splits and joins. This would take from 30-90 minutes.
To trap these errors it was obvious that more comprehensive semantic checking was required. Further, we wanted to overcome the five to ten minute delay required to produce the graphics--to make the graphics available upon demand rather than at occasional intervals. Finally, we wanted to allow participants, rather than the facilitator, to invoke the graphical views. 5.3. Third Tool Generation Given the previously noted limitations, we developed a graphics modeling tool that would provide immediate graphical views to participants as well as timely feedback regarding potential semantic errors. We also wanted the tool to act as a
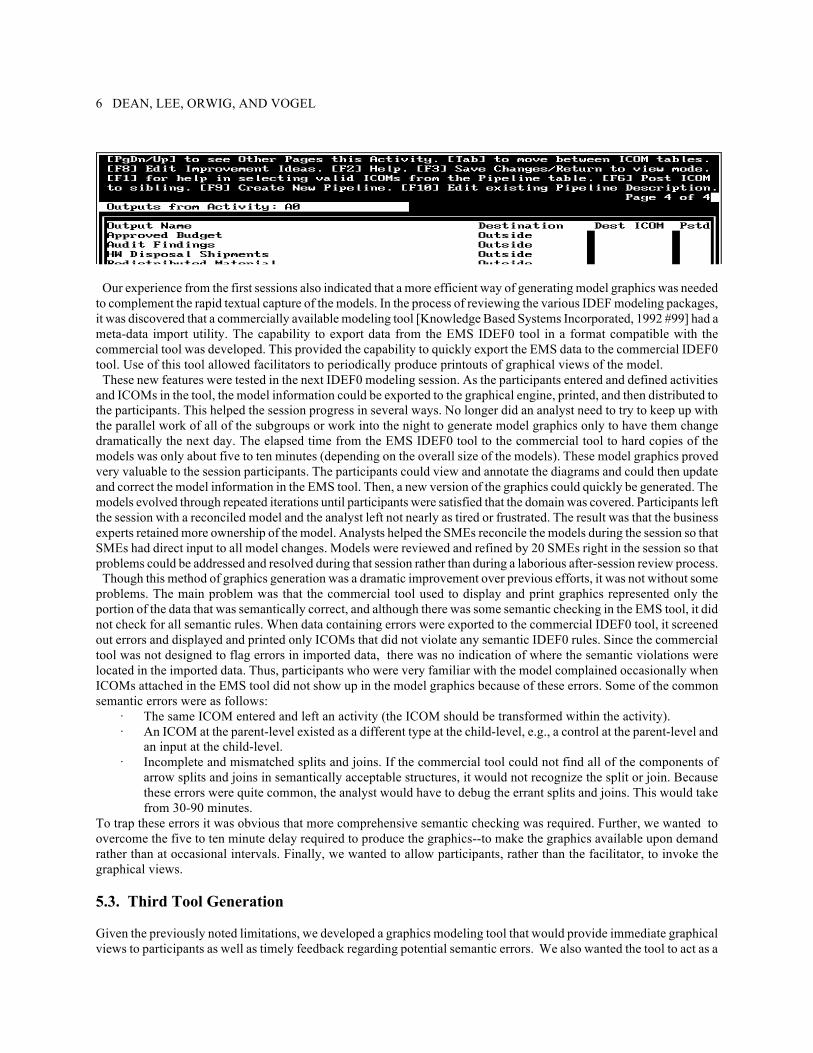
7 DEAN, LEE, ORWIG, AND VOGEL point of departure for integrating various model portions and interfacing to more traditional CASE tools. In the IDEF tool development community there are two common ways to store model data, 1) as graphical objects (storing such things as the coordinates of the boxes and lines, the bend angles, etc.), and 2) as data corresponding to the semantic structure of the models. The advantages of semantic over graphical representations of the models include more flexible model revision, improved access to semantic information, simpler data structures, and smaller storage requirements. However, to get graphical views from semantic data requires an intelligent graphical engine to build the correct graphical representations. With this in mind, a viewer was developed that could read the semantic data and generate model graphics that could be viewed at any workstation. Both the model editor and the viewer worked on the same data structures. Although the viewer could run on any station it was not possible to toggle directly between the model editor and the viewer. Thus, it was typical to have the viewer working on one workstation next to a different workstation running the model editor. The graphical component was known as the Enterprise Analyzer (EA) Viewer. Development of a graphical engine was a difficult task because there are so many different ways arrows can be bundled into aggregate classes (splits and joins). The developers were careful to build into the viewer several semantic checks that would clearly flag the various errors. Figure 2 shows a graphical view of an activity decomposition with a semantic warning regarding the control "P2 Policy." In this instance P2 Policy was attached both as a control and as an output to the "Prevent Pollution" activity--an obvious semantic error. See Figure on next page.
Some of the features/benefits of the viewer include: · Changes to the models can be represented in real-time with the tool and the viewer running concurrently, e.g.,
participants can enter a change into the tool and then have the viewer regenerate the graphics. · The viewer works directly with the EMS modeling tool data structures so that no export is required to generate
the graphics. · It is very easy for participants to invoke and use. · It supports faster navigation to objects and object descriptions. · Parts of the model that violate semantic conventions are quickly and easily identified.
The findings of this evolutionary development and testing research indicated a number of specific features critical to providing elegant group tool support to a large group of participants. One is a simple interface that allows novices easily to learn and use the tool. The tool should support concurrency control while still allowing participants to see all parts of the model. Another important feature is the ability for participants to invoke graphical views of the model easily. It is best if these views are generated from semantic data rather than data stored as graphical objects. In addition, graphical views should be rich enough to support all important graphical constructs such as arrow splits and joins as well as representing tunneled arrow (arrows not balancing explicitly with arrows on the parent or child diagrams). Graphical representations of these constructs helps reduce cognitive complexity and shows where problems exist in the model.
8 DEAN, LEE, ORWIG, AND VOGEL Two levels of semantic checking support are important. First, at the point of data entry, ICOM attachment should be restricted by a lookup to the ICOM glossary. Otherwise participants tend to proliferate ICOM homonyms and synonyms. Restricting ICOM attachments to six or fewer also helps participants think about pushing detail downward into further decomposition, where it belongs. A secondary level of semantic checking should also be invocable on demand. A group modeling environment is processing-intensive because of many individuals entering data. If all levels of semantic checking were to be enforced with each entry, performance would suffer considerably. It is preferable for participants to check periodically for semantic violations. These checks include semantic errors that tend to occur at the model or decomposition level, such as an input at the parent diagram being mismatched with its use at the child diagram. Two levels of semantic checking provide some initial control, but at the same time allow individuals to represent information without being overly restricted at first. Periodically invoking diagram-level and across-diagram semantic checks provide insights into problems allowing participants to refine the model in order to reflect more appropriate semantics and abstractions. If semantic violations are not corrected by those initially developing the model, it becomes extremely difficult for analysts to resolve these problems without input from SMEs because analysts generally lack the content knowledge to restructure the model appropriately. Moreover, if a model has been developed with limited attention to semantic guidelines, a significant effort is required to repackage the model for semantic compliance. It is much more efficient to keep the model "clean" during model development. When this is done, SMEs retain ownership of the models with guidance from facilitators and do not have to depend on an outside analyst to repackage the final abstractions, which may violate the SMEs sense of model ownership. 6. Comparison Between EMS and Non-EMS Supported Group Modeling Meetings The three substantial modeling efforts discussed above each lasted between one and two weeks. A comparison will be made between these sessions and five traditionally supported sessions. The five traditionally supported sessions were chosen because of the availability of reliable data regarding time spent on model development. These projects were supported by consultants who conduct many modeling sessions each year and who have demonstrated considerable ability in producing consistently high quality models. Ratings of model quality will be based on objective evaluation of the models for style and adherence to modeling rules as well as participant perceptions. The following table reflects a comparison between three EMS-supported activity modeling sessions and the five modeling efforts supported by the traditional, chauffeured approach. See table on next page.
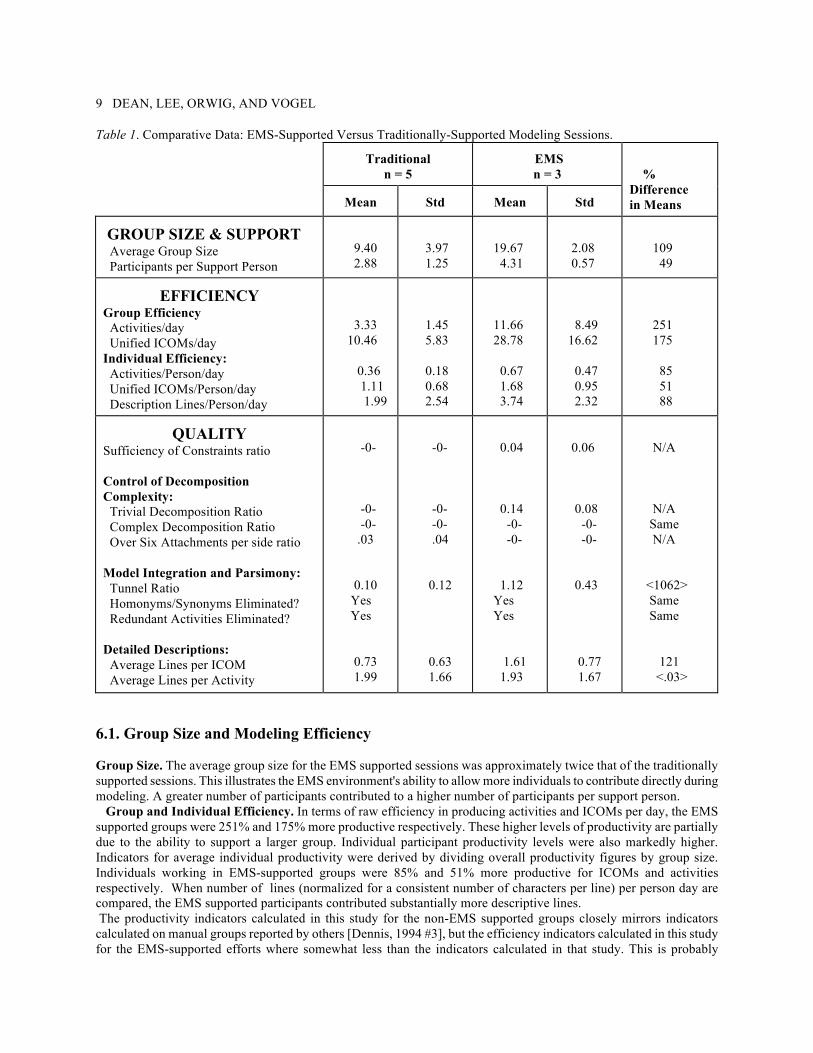
9 DEAN, LEE, ORWIG, AND VOGEL Table 1. Comparative Data: EMS-Supported Versus Traditionally-Supported Modeling Sessions.
Traditional
n = 5
EMS n = 3
% Difference in Means
Mean
Std
Mean
Std
GROUP SIZE & SUPPORT Average Group Size Participants per Support Person
9.40 2.88
3.97 1.25
19.67 4.31
2.08 0.57
109 49
EFFICIENCY
Group Efficiency Activities/day Unified ICOMs/day Individual Efficiency: Activities/Person/day Unified ICOMs/Person/day Description Lines/Person/day
3.33 10.46 0.36 1.11 1.99
1.45 5.83 0.18 0.68 2.54
11.66 28.78 0.67 1.68 3.74
8.49 16.62 0.47 0.95 2.32
251 175 85 51 88
QUALITY Sufficiency of Constraints ratio Control of Decomposition Complexity: Trivial Decomposition Ratio Complex Decomposition Ratio Over Six Attachments per side ratio Model Integration and Parsimony: Tunnel Ratio Homonyms/Synonyms Eliminated? Redundant Activities Eliminated? Detailed Descriptions: Average Lines per ICOM Average Lines per Activity
-0- -0- -0- .03 0.10 Yes Yes 0.73 1.99
-0- -0- -0- .04 0.12 0.63 1.66
0.04 0.14 -0- -0- 1.12 Yes Yes 1.61 1.93
0.06 0.08 -0- -0- 0.43 0.77 1.67
N/A N/A Same N/A <1062> Same Same 121 <.03>
6.1. Group Size and Modeling Efficiency Group Size. The average group size for the EMS supported sessions was approximately twice that of the traditionally supported sessions. This illustrates the EMS environment's ability to allow more individuals to contribute directly during modeling. A greater number of participants contributed to a higher number of participants per support person. Group and Individual Efficiency. In terms of raw efficiency in producing activities and ICOMs per day, the EMS supported groups were 251% and 175% more productive respectively. These higher levels of productivity are partially due to the ability to support a larger group. Individual participant productivity levels were also markedly higher. Indicators for average individual productivity were derived by dividing overall productivity figures by group size. Individuals working in EMS-supported groups were 85% and 51% more productive for ICOMs and activities respectively. When number of lines (normalized for a consistent number of characters per line) per person day are compared, the EMS supported participants contributed substantially more descriptive lines. The productivity indicators calculated in this study for the non-EMS supported groups closely mirrors indicators calculated on manual groups reported by others [Dennis, 1994 #3], but the efficiency indicators calculated in this study for the EMS-supported efforts where somewhat less than the indicators calculated in that study. This is probably
10 DEAN, LEE, ORWIG, AND VOGEL attributable to the greater adherence in the current study to IDEF0 rules, model parsimony, and semantic style. It is probably also indicative of the fact that larger subgroups were used in this study because of the need for each constituency to be directly represented during the development of each part of the model. This was done to enlist buy-in from and to enable the model to be representative of the broad, diverse constituencies. 6.2. Model Style Quality This section focuses on a number of key model quality indicators, but these are not meant to be all inclusive. There are many quality metrics that could be applied. Our emphasis is on some of the central modeling quality principles that are easily understandable by managers and non-modeling experts--and that are objectively measurable. This paper also includes an emphasis on metrics related to modeling with a group since EMS increases the number of people who may participate at once in model construction and validation. A contribution of this research is the formulation of several metrics that allow quality to be assessed across models of a different size. This paper includes specific style quality comparisons between EMS-supported and traditionally-supported models that have not been made in past research [Dean, 1994 #7][Dennis, 1994 #3]. The reader is directed to Williamson [Williamson, 1991 #1], the FIPS IDEF0 standard [IDEF Users Group Standards and Specification Committee, 1993 #2], and the original IDEF0 User's Manual [UM, 1981 #66] for more extensive treatment of IDEF0 model quality issues. The management of complexity, model integration, and parsimony are important dimensions of IDEF0 and other structured techniques. In the next two sections, measures of these constructs are defined and applied to support comparison of the EMS-supported and traditionally supported models. 6.2.1. Control of Decomposition Complexity Sufficiency of Constraint Ratio. This ratio measures the number of activities that did not have at least one output and one control. The FIPS IDEF0 standards require that each activity have both an output and a control. The 4% ratio obtained for the EMS supported models was largely attributable to one model in which a part of the model was not fully completed. The other two EMS supported models averaged only one percent on this measure. Decomposition Complexity. The FIPS standard requires that each decomposition of an activity contain between three and six activities. More than six result in too much complexity per decomposition. Decompositions with one child node offer no real advantage and two children may represent insufficient communicative value to warrant a decomposition. Six nodes in a single decomposition is a more serious quality problem than having two nodes in a decomposition since more than six overload the reader with complexity. Conversely, two nodes provide information that is simple to understand. Trivial and Complex Decomposition Ratios. The trivial decomposition ratio is calculated by dividing the number of decompositions with fewer than three nodes by the total number of decompositions. The complex decomposition ratio is calculated by dividing the number of decompositions with more than six nodes by the total number of decompositions. Traditionally supported models contained no violations of these rules. Also, because EMS-supported participants were also encouraged to adhere to six or fewer nodes per decomposition, there were no overloaded decompositions. However, 14% of the decompositions resulting from the EMS approach were two-node decompositions. Over Six Attachments Per Side Ratio. This ratio divides the aggregation of attachments to boxes that exceed six attachments per side by the total number or ICOM attachments throughout the model. Thus, each side of every activity is examined. A count is made of all ICOM attachments in excess of six for each side of each box. These are summed and divided by the total number of ICOM attachments throughout the model. Restricting boxes to six attachments per side reduces the cognitive overload that results when more than six attachments are made [Ross, 1977 #68]. Here again, the EMS tool was designed to limit attachments to six per side so no violations occurred. Note, however, that as discussed above, before including this check in the tool, SMEs tended to violate this rule. In the traditionally supported session, about 3% of the attachments violated the six attachments per side rule, with three of the five traditionally-supported models violating this rule rarely and two models violating it frequently. 6.2.2. Model Integration and Parsimony IDEF0 models should be well integrated. The greater the number of participants working in parallel, the greater the
11 DEAN, LEE, ORWIG, AND VOGEL potential for redundant object definition. Overcoming this problem requires that decomposition and reconciliation methods be used during modeling. Otherwise, ICOM synonyms and homonyms tend to proliferate. The following indicators can help assess the degree of integration achieved in specific models. Tunnel Ratio and Homonym/Synonym Elimination. Tunneling is an IDEF0 modeling technique that "hides" ICOMS that are not explicitly attached to more than one activity. A tunneled ICOM appears when an arrow is relevant in the current decomposition but is not shown explicitly in the parent or child decomposition. A tunnel appears when an arrow leaves one sibling decomposition and enters a sister decomposition, but does not link the parent's activities in the parent decomposition. Tunneled ICOMs may appear in the graphical representation of the model by design or might appear as a result of homonyms and synonyms. Another source of tunnels is having a model that is not extremely cohesive--that is, a smaller proportion of the constraints within the model are linked from one activity to other activities in the model. The tunnel ratio is calculated by dividing the total number of tunnels found in the model by the total number of activities in the model. In comparison to traditionally-supported models, EMS-supported models had significantly more tunnels. This is probably attributable to two things. First, the EMS-supported sessions evaluated in this study were based on activities performed in more diverse installations than the traditionally-supported sessions. Thus, there was a tendency to include more steps that were less tightly integrated. Second, the facilitators of the EMS sessions were less expert and restrictive regarding ICOM balancing than the non-EMS facilitators. Clearly, this is an area where significant improvement could be made. The tunnels in the EMS-supported models did not occur from homonym/synonym problems because these were carefully eliminated by SME representatives. Redundant Activity Elimination. Redundant activities were eliminated in both the EMS-supported and traditionally supported models. 6.3. Model Validity and Model Content Subject matter appraisal of model validity was not available for the non-EMS supported sessions, but was captured for two of the three EMS supported sessions. The following question was asked: "I believe that the activity model represents the functions that need to be performed in the work activity." Response options ranged from 1, Disagree strongly! to 5, Agree strongly! The resulting mean scores were 4.1 and 4.2 for the two sessions, with standard deviations of 0.5 and 1.0 respectively. Thus, participants seemed to agree as to the content validity of the models, at least as estimated by this simple measure. As mentioned above in the discussion on efficiency, the EMS supported groups generated more lines of descriptive text per person than the traditionally supported groups. This may be a result of participant ability to describe objects without going through a scribe. It is interesting to note that the EMS supported groups entered 2.21 times the number of descriptive lines for ICOMs than the non-EMS supported group. These more detailed descriptions suggest more complete ICOM descriptions. When comparing activity descriptions, the EMS-supported models were almost identical to traditionally-supported models. 6.4. The Need to Balance Efficiency and Quality When developing models, a reasonable balance of efficiency and quality (including parsimony) needs to be achieved. Efficiency measures increase when production volume is high. On the other hand, part of the reason for developing a model is to get parsimonious representations of the domain. Indeed, to some degree, small and concise is better than large and ranging. Obtaining speed and volume with poor quality is analogous to getting to market quickly with a poor product. EMS-based modeling environments provide powerful description capture capabilities. Used appropriately, these capabilities can help speed model development and produce quality models. Without the appropriate methods and control, however, SMEs can specify a great deal of content but sacrifice significant model clarity and parsimony. Although SMEs can assess model content validity, they are usually ill equipped to assess details of IDEF0 style. Quality metrics are important for judging when the efficiency-to-quality balance is acceptable. The level of quality achieved in this study was obtained because a balance of quality and efficiency was actively sought. 7. New Tool Generation The lessons learned from this research have been used as the basis for a new generation of group IDEF0 modeling tools. This tool generation has integrated model editing forms and graphics available at the same workstation, whereas the
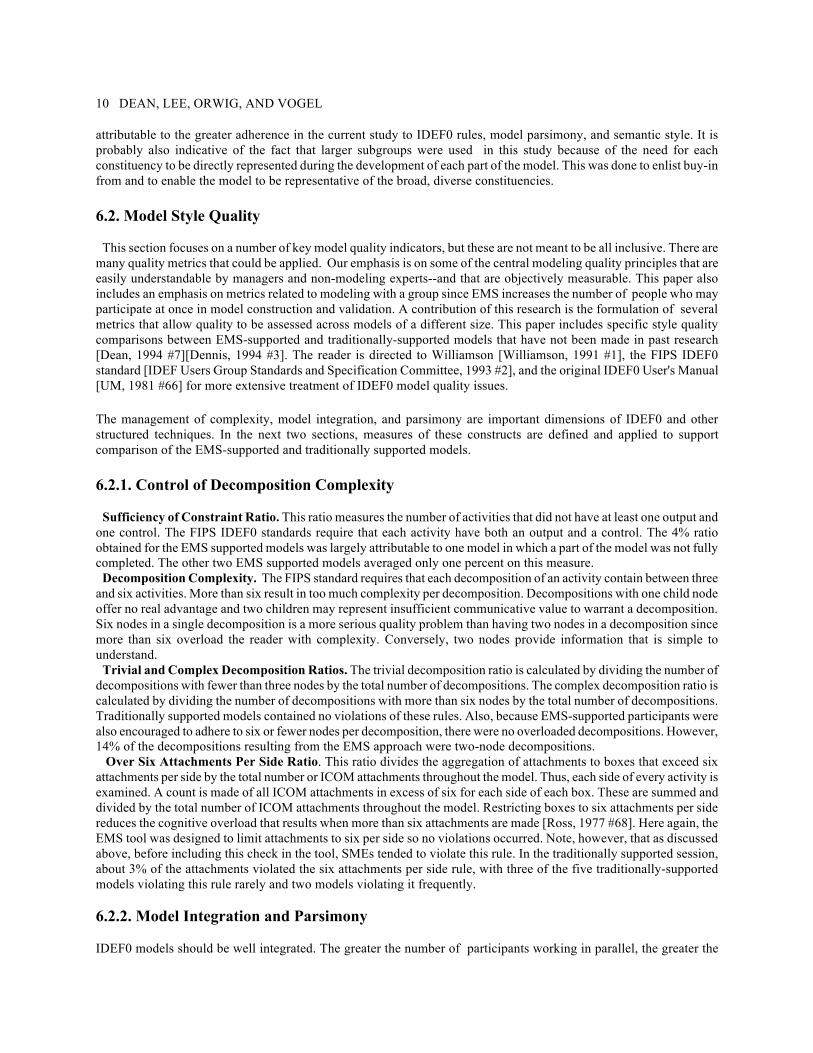
12 DEAN, LEE, ORWIG, AND VOGEL earlier evolution required two workstations, one running the form tool and the other running the graphical viewer. The new tool allows for easy toggling between the two views on the same workstation and also supports more graphical views of the model. Figure 3 shows the three main graphical representations of the model. Note that, in addition to the view of an entire decomposition, it is possible to represent the child nodes of an activity as well as all ICOMs attached to one activity. It is easy to toggle among each of these views and to expand any one window to the entire screen.
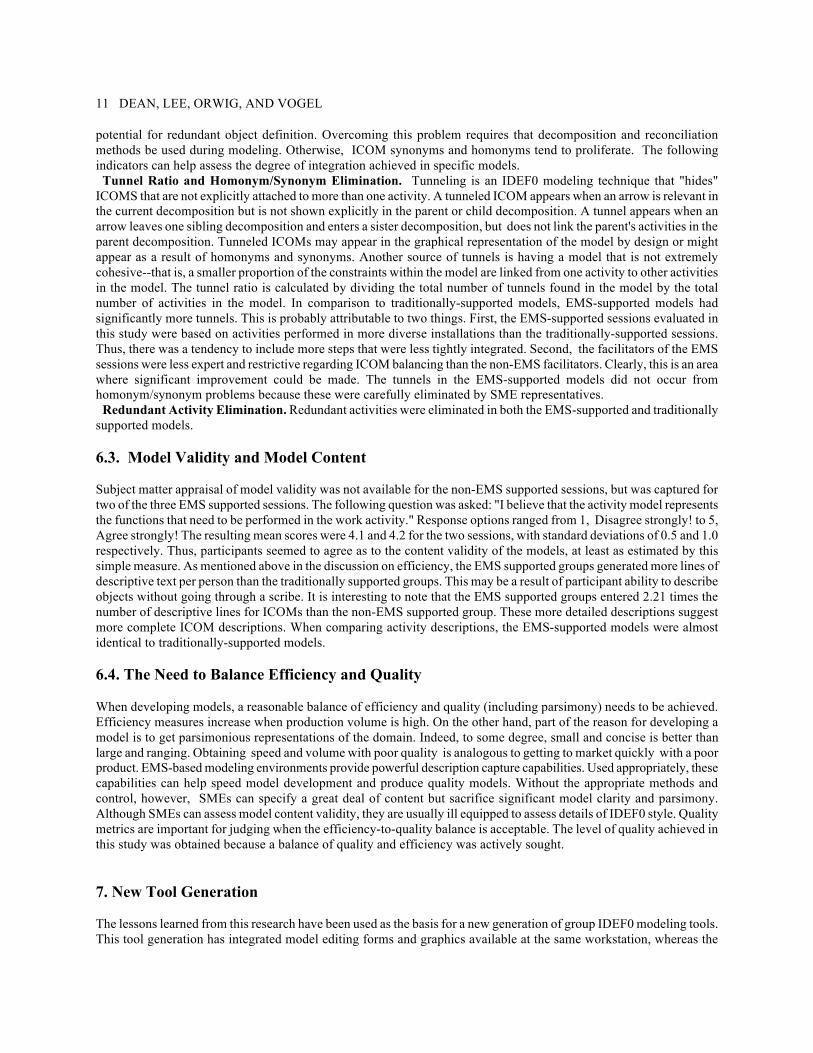
The tool also has more sophisticated semantic checking--more semantic rules are monitored. More specific suggestions are provided regarding how to remedy semantic violations. As well as showing violations on the screen, a list of violations for the entire model may be printed out as a report. The software has been performance-engineered so that it runs much more quickly than the earlier tool generations. The facilitator has greater control over granting of editing access rights to different parts of the model so that subgroups may edit only assigned portions of the model. The interface has been refined to make it easier to navigate through the model. For example, Figure 4 shows the interface for attaching ICOMs to an activity. Note that this visual metaphor places inputs, controls, outputs, and mechanisms at the appropriate locations around an activity.
The new tool also intelligently lists ICOM candidates for bundling at each decomposition of the model. The interface allows for easier object navigation and selection as well as for easier editing of descriptions. 8. Implications and Limitations of the Current Study
13 DEAN, LEE, ORWIG, AND VOGEL Appropriately applied, use of these tools overcomes some of the bottlenecks inherent to the chauffeured modeling approach. The number of participants who can be effectively supported appears to be significantly increased with the EMS-supported approach. In addition, the new approach allows models to be built significantly faster because more SMEs can contribute in parallel during model development and because individuals are more productive. Interviews with project managers involved with traditional meetings indicated that is was sometimes impossible to obtain attendance of key individuals for the 3-5 week duration of model development and analysis because it meant being away from other duties. The ability to build and analyze models more quickly should help secure involvement from these individuals. With the EMS-supported approach, SMEs have greater direct input to models. Evidence reported in this paper suggests that this results in more extensive and complete model descriptions. This research extends earlier research[Dennis, 1994 #3] on group activity modeling by demonstrating that style quality can be achieved with EMS modeling tools that help participants identify model problems. However, both tool support and an emphasis on style and semantic quality are required to produce good models. Quality comparisons between models developed with the EMS-based approach and the traditional approach indicate that, on a number of style indicators, EMS-based models are comparable. However, there are a few areas where manually supported models fared better, specifically in the model integration indicator. This finding probably results from two factors. First, the EMS-supported models in this study were developed to cover more diverse constituencies than the models developed with the manual approach. Second, although EMS allow more individuals to contribute directly to the model, it requires more effort to coordinate and integrate models. Methods for helping larger groups keep their models more tightly integrated are being explored. The new approach does not eliminate the need for expert modelers and facilitators. Novice modelers lack modeling expertise, and while the tool can help considerably in guiding novices, knowledgeable facilitators and analysts will continue to be required to produce models of high quality. The baseline data resulting from this study will be available for comparison with future modeling efforts. Although the tools evaluated here can be used without more traditional EMS capabilities such as electronic brainstorming, idea categorization, and group vote, our experience suggests that these capabilities are extremely useful during model development and analysis [Dennis, 1994 #72]. Finally, the results reflected here were achieved from EMS tools and methods that evolved over the course of this study. The new tool and insights achieved should better support EMS-supported modeling efforts in the future. 9. Conclusion EMS-based modeling efforts can significantly reduce the time, and therefore the cost required to develop business models. Reducing the time required to produce models makes it easier to get the "right" people to contribute to the modeling effort because their time away from other duties is significantly reduced. Since this approach allows more individuals to contribute directly to the modeling effort, richer models may result and the time required for outside review of the models is substantially shortened. SMEs feel greater ownership of a model they have helped develop with the help of analysts rather than one developed by analysts with the help of SMEs. Models sanctioned by a larger number of SMEs signal higher model legitimacy. Quality [Dean, 1994 #7], buy-in, and legitimacy [Wood, 1989 #50] have important implications for the use of models as vehicles for implementing improvements. REFERENCES 1. Curtis, B.; Kellner, M.I.; and Over, J. Process modelling. Communications of the ACM, 35, 9 (September 1992), 75-90. 2. Davenport, T. and Short, J. The new industrial engineering: information technology and business process redesign. Sloan Management Review, (Summer 1990), 11-27. 3. Davenport, T.H. Process Innovation: Reengineering Work Through Information Technology. Boston, MA: Harvard Business School Press, 1993. 4. Davenport, T.H. and Stoddard, D.B. Reengineering: business change of mythical proportions? Management Information Systems Quarterly, (June 1994), 121-127. 5. Dean, D.L.; Orwig, R.; Lee, J.D.; and Vogel, D.R. Modeling with a group modeling tool: group support, model quality, and validation. Proceedings of the 27th Annual Hawaii International Conference on System Sciences, (1994), 214-224. 6. Dennis, A.R.; Daniels, R.M., Jr.; Hayes, G.; and Nunamaker, J.F., Jr. Methodology-driven use of automated support
14 DEAN, LEE, ORWIG, AND VOGEL in business process re-engineering. Journal of Management Information Systems, 10, 3 (Winter 1993), 117-38. 7. Dennis, A.R.; Hayes, G.S.; and Daniels, R.M. Re-engineering business process modeling. Proceedings of the 27th Annual Hawaii International Conference on System Sciences, (1994), 244-254. 8. Dennis, A.R.; Kelly, G.; Hayes, G.; Daniels, R.M., Jr.; Orwig, R.; and Dean, D.L. Business process re-engineering with IDEF and electronic meeting systems. Proceedings of the May 1994 IDEF Users Group Conference, (1994), 99-110. 9. DoD_8020.1-M. Director of Defense Information, Office of the Secretary of Defense. Functional Process Improvement: Functional Management Process for Implementing the Information Management Program of the Department of Defense, (1992). 10. Hall, G.; Rosenthal, J.; and Wade, J. How to make reengineering really work. Harvard Business Review, (November-December 1993), 119-131. 11. Hammer, M. Re-engineering work: don't automate, obliterate. Harvard Business Review, (July-August 1990), 104-112. 12. Hammer, M. and Champy, J. Reengineering the Corporation: A Manifesto for Business Revolution. New York, NY: Harper Business, 1993. 13. Harrington, H.J. Business Process Improvement: The Breakthrough Strategy for Total Quality, Productivity, and Competitiveness. New York, NY: McGraw-Hill, Inc., 1991. 14. IDEF Users Group Standards and Specification Committee. IDEF0 FIPS Comment Document. (5 March, 1993). 15. Knowledge Based Systems Incorporated. AI0. (1992): College Station, TX. 16. Marca, D.A. and McGowan, C.L. SADT: Structured Analysis and Design Techniques. New York, NY: McGraw Hill, Inc., 1988. 17. Mayer, R.J.; Painter, M.K.; and deWitte, P.S. IDEF Family of Methods for Concurrent Engineering and Business Re-engineering applications. (1994). College Station, TX: Knowledge Based Systems, Inc. 18. Miller, G.A. The magical number seven, plus or minus two: some limits on our capacity for processing information. The Psychological Review, 63, 2 (1956), 81-97. 19. Nunamaker, J.F., Jr.; Dennis, A.R.; Valacich, J.S.; and Vogel, D.R. Information technology for negotiating groups: generating options for mutual gain. Management Science, 37, 10 (October 1991), 1325-1346. 20. Nunamaker, J.F.; Dennis, A.R.; Valacich, J.S.; Vogel, D.R.; and George, J.F. Electronic meeting systems to support group work. Communications of the ACM, 34, 7 (July 1991), 40-61. 21. Ross, D.T. Structured Analysis (SA). A language for communicating ideas. IEEE Transactions on Software Engineering, SE-3, No. 1 (January 1977), 16-34. 22. Sager, I. The great equalizer. Business Week. (6 June 1994), 100-107. 23. Schnitt, D.L. Re-engineering the organization using information technology. Journal of Systems Management, (January 1993), 14-20, 41-42. 24. Tomasko, R.M. Rethinking the Corporation: The architecture of change. New York, NY: American Management Association, 1993. 25. Report developed for Materials Laboratory, Air Force Wright Aeronautical Laboratories, Air Force Systems Command. Integrated computer-aided manufacturing (ICAM) function modeling manual (IDEF0). Dayton, OH: Wright-Patterson Air Force Base, 1981. 26. Vogel, D.R.; Orwig, R.; Dean, D.L.; Lee, J.D.; and Arthur, C. Re-engineering with enterprise analyzer. Proceedings of the 26th Annual Hawaii International Conference on System Sciences, (1993), 127-135. 27. Whitehead, A. An Introduction to Mathematics. New York, NY: Oxford University Press, 1958. 28. Williamson, W.R., Report developed for Advanced System Analysis DCS, Development Planning Aeronautical Systems Division. Systems Analysis Quality Metrics. Dayton, OH: Wright-Patterson Air Force Base, 1991. 29. Wood, J. and Silver, D. Joint Application Design: How to Design Quality Systems in 40% Less Time. New York, NY: John Wiley & Sons, Inc., 1989.


