Embed Size (px)
Citation preview
UNIVERSIDADE DO ALGARVE
FACULDADE DE CIÊNCIAS DO MAR E AMBIENTE
Tectono-Magmatic Processes At The
Azores Triple Junction
(Tese provisória para a obtenção do grau de doutor no ramo de Ciências do Mar, especialidade de Geologia Marinha)
João Nuno Vilhena de Sousa Lourenço
FARO (2007)


UNIVERSIDADE DO ALGARVE
FACULDADE DE CIÊNCIAS DO MAR E AMBIENTE
Tectono-Magmatic Processes At The
Azores Triple Junction
(Tese provisória para a obtenção do grau de doutor no ramo de Ciências do Mar, especialidade de Geologia Marinha)
João Nuno Vilhena de Sousa Lourenço
FARO (2007)

Tectono-Magmatic Processes in the Azores Triple Junction
Prologue
During the last decade a large effort has been developed by the scientific community to map, study and understand tectonic and magmatic processes taking place in the Azores Triple Junction Area. The move between small and localized observations centred on a few Islands to a general plan to study the whole triple junction area required a multitude of means, a multidisciplinary approach and a significant level of logistics.
One piece of the global effort was organized in Portugal through the research project STAMINA. Even if the two cruises planned in the scoope of this project, were never completed, it gathered a variety of geophysical, geochemical, geodetic and tectonic teams that organized their effort in the same scientific problem. It also allowed the means to coordinate the national participation in a series of research operations led by the international community where we had the opportunity to act as active partners and benefit from their much better technical means.
In what concerns this work, those cruise limitations were important in the amount of new swath bathymetry data acquired (6.5 hours of high quality EM300 swath bathymetry data collected as piggy back to the main SIRENA I cruise; PI J. Jean Goslin); several hours more of magnetic data collected over the Serreta eruption site west of Terceira Island again marginally to the SIRENA II cruise. Such a data scarcity led to the broadening of the thesis objectives thematically although centred in the Azores, still the core of this work. The scientific objectives remained under the umbrella of “the volcano-tectonic interactions” but with a broader spatial and temporal scale to allow integration of other research topics
To improve efficiency of research and overcome data availability limitations, we developed a set of collaborations with foreign partners in complementary lines of research, (Peter Cobbold; Jean Goslin) and a stronger focus on the cooperation with the remaining STAMINA colleagues: Fernando Ornelas Marques (Tectonics, University of Lisbon); Rui Fernandes (Geodesy, University of Beira Interior), João Catalão (Geodesy, University of Lisbon), All these collaborations resulted in a number of publications, currently in preparation, submitted or already published. The current manuscript is constructed with a large amount of this material collated into a single volume. Some original texts have been enhanced whereas others have been edited, reduced or focused on specific topics related with the manuscript theme.
i

Tectono-Magmatic Processes in the Azores Triple Junction
NOME: João Nuno Vilhena de Sousa Lourenço FACULDADE: Faculdade de Ciências do Mar e Ambiente ORIENTADORES: Jorge Miguel Alberto Miranda
António Augusto Ramos Ribeiro DATA: 22 de Janeiro de 2007 TÍTULO DA TESE: Processos tectono-magmáticos na Junção Tripla dos Açores
Resumo
Apresentam-se resultados de estudos multi-disciplinares, centrados na interacção espacio-temporal entre o Ponto Quente dos Açores (PQA) e a Junção Tripla dos Açores (JTA) no decurso da evolução geodinâmica da plataforma vulcânica dos Açores e sintetiza-se um modelo tectono-magmático para a JTA na actualidade.
Desde os 33.4 Ma o regime tectónico prevalecente é trans-tractivo com rotação progressiva das direcções de abertura Eurásia-Africa de ca. N-S para ca. ENE-WSW. Desde aquela idade os Açores apresentam um comportamento cinemático independente e possivelmente dominado por deformação distribuída.
A máxima interacção entre o PQA e a JTA ocorre entre os 20 Ma e os 10 Ma. Consequentemente entre os 33.4 e os 20Ma os Açores terão resultado de um controlo tectónico proeminente e reduzida influência do PQA.
O desenvolvimento das cristas vulcânicas lineares (CVL) é associado à progressiva migração para NW do JTA de um contexto intra-transformante desde os ca. 15 Ma. No presente considera-se que persiste a propagação das CVL para WNW.
A modelação de dados GPS, permite definir na actualidade a fronteira de placas Euro-asiatica e Núbia no Eixo da Terceira e no alinhamento Faial-Pico. Propõe-se que a zona inter-placa entre estes dois eixos principais activos corresponde a um domínio de deformação distribuída não coaxial em regime de trans-tracção. Nesta zona ocorre partição entre processos de rifting (dominados por magmatismo) em tracção pura normal às CVL, processos de cisalhamento com desligamentos esquerdos (NNW-SSE) e zonas de acomodação (WSW-ENE). Contrastando, o padrão de falhamento no sector imediatamente a Leste da ilha Terceira, é interpretado como resultado de um regime de alastramento oblíquo focalizado no eixo da terceira, com deformação co-axial, e um campo de tensões com compressão máxima vertical e compressão mínima sub-paralela às direcções de abertura previstas pelos modelos cinemáticos NUVEL-1A ou baseados em GPS (e.g. REVEL ou DEOS2K).
Palavras Chave: Ponto Triplo Açores; Ponto quente Açores; cristas vulcânicas; sismo-tectónica;
modelação elástica; deformação distribuida.
iii

Tectono-Magmatic Processes in the Azores Triple Junction
Tectono-magmatic processes in the Azores Triple Junction
Abstract
Multi-disciplinary results on the spatio-temporal interaction between the Azores hot-spot (AHS) and the Azores Triple Junction (ATJ) during the Azores plateau evolution, are presented. In addition a tectono-magmatic model of the ATJ for the present day is summarized.
Since 33.4 Ma, the dominant tectonic regime is transtensional with progressive rotation of the Eurasia-Africa opening directions from ca. N-S to ca. ENE-WSW. Since that early age, the Azores present a kinematic behavior which is independent from that of the larger plates and possibly dominated by distributed deformation.
The maximum interaction between the AHS and the ATJ occurs between the 20 and 10 Ma. Consequently, between 33.4 and 20 Ma the evolution of the Azores has been prominently a result of tectonic controls and had little influence of the AHS.
The growth of the linear volcanic ridges (LVR) is interpreted as the result of the progressive migration of the ATJ, since ca. 15 Ma, from an intra-transform context, towards NW. Their propagation subsists in the present day, now towards WNW.
The modeling of GPS data has allowed to constrain in the present day, the Eurasia-Nubia plate boundary along the Terceira axis and in the Pico-Faial alignment. It is suggested that the inter-plate zone adjoining this two active axis, corresponds to a domain of non-coaxial distributed deformation dominated by transtension. In this zone there is a partition between rifting processes (dominated by magmatism) in pure tension, normal to the LVR axis, and shear processes characterized by left lateral strike slips (along NNW-SSE) and relay zones (along WSW-ENE). Contrastingly, the faulting pattern, east of Terceira Island suggests prevalence of co-axial oblique extension, focalized within the Terceira axis, and a stress field with maximum compressive axis vertical, and minimum compressive axis sub-parallel to the opening directions predicted by NUVEL-1A or GPS based (e.g REVEL, DEOS2K) kinematic models.
Keywords: Azores Triple Junction; Azores Hot-Spot; Sismo-tectonics; elastic modeling; linear volcanic
ridges; distributed deformation.
v

Tectono-Magmatic Processes in the Azores Triple Junction
Acknowledgments
Miguel Miranda was my compellingly enthusiastic supervisor and PI of STAMINA, under which most of the recent data sets used in this PhD project, were acquired. Miguel has always stroke me with his capacity of finding some shed of bright light in a sometimes all black scenario, for example, when all the cruises scheduled for the Azores “sank”. I acknowledge him, the countless discussions we had about different Azores and other topics, his critical review of this manuscript, and above all for making me face new challenges and pushing me forward in what concerns scientific research. STAMINA project from FCT sponsored all the Azores field work and my visits to Rennes University.
António Ribeiro was my co-supervisor on this thesis from the beginning. I thank him the thoughtful review of this manuscript and his sharing of views and opinions both in the field when discussing Terceira Island tectonics in the Azores and at the office, in a great variety of issues His constant availability during this work is greatly appreciated by me.
The work with Fernando Ornelas Marques, within STAMINA project, particularly during several field campaigns in the Azores for tectonic mapping and field observations, gave me the opportunity to have new insights in the analysis of geological processes. I am also indebt to Fernando for his availability and for introducing me to analogue modelling techniques. Although some of the work of this manuscript is the direct result of this collaboration, it does not make justice to the overall benefices of my learning process from Fernando.
I thank Joaquim Luís, for continuously providing me copies of his software, which I used intensively during the course of this work. Additionally, Joaquim has always been a source of fruitful discussions on the many different questions regarding the Azores and Geophysics.
João Alveirinho Dias, was my coordinator at the University Algarve and gave me the opportunity to realize this extensive research program. These acknowledgments are extensible to my collegues in the Algarve University: Oscar Ferreira, Ana Barbosa, Cristina Pires, Delminda Moura and Tomasz Boski, for their friendship and support.
vii
Acknoledgments
During this work time span I had the privilege to meet Jean Goslin, a skilled senior researcher from UBO (Université de Bretagne Occidental) which became a very good friend. With Jean Goslin, we sailed two missions (SIRENA I and II). The SIRENA I with heavy roll and pitch during most of the sailing will never be forgotten.
I benefited also from a 3 month scholarship sponsored by IFREMER-ICCTI protocol in the framework of French-Portuguese bilateral agreements, which enabled me to participate in the SIRENA data processing and analysis at IUEM – Brest, along with Dr. Robert Dziak from NOAA, which provided numerous and valuable insights on the strategy for the data processing and analysis. This stay was the natural prolongation of the good time spent at sea. I am indebt to Jean Goslin and his family, Julie Perrot, Christophe Martin, J. Y. Royer from the SIRENA team and remaining staff of IUEM with whom I contacted during my stay, for this profitable and enjoyable visit. “Merci a tous pour votre super accueil à Brest”.
I thank Peter Cobbold for sharing with me new ideas on the role of fluids in deformation and for the level of exigence and rigor he imposes in the research work. This led to the improvement in the quality of my own work. I acknowledge also the help of my colleagues particularly: Nuno Rodrigues, Regis Morgues, J J Kemarrec and Xavier Le Fort during my stay in Geoscience Rennes in the Analogue modeling lab.
I thank the researchers of CGUL with whom I worked for a long time: Maria Ana Baptista, Luis Matias, Fernando Santos and Pedro Soares. Pedro Silva has been my close “compagnon de route” for most of this work and helped forming a united front to survive Miguel’s barbarian provocations when our soccer club was in disgrace! Nuno Dias, also a PhD student in seismology of the Azores assured a fruitful cooperation and information exchange which benefited this (and hopefully his) work.
Pedro Madureira (from U. Évora) also a PhD student in geochemistry and petrology of the Azores, is first of all a very close friend, and secondly a colleague with whom I had enormous discussions about the Azores and the interpretation of our data. Pedro has showed me quite clearly that I ceased to be a full bodied geologist, but I am still not a geophysicist. Thank you Pedro for the proof of my precarious position!
A large amount of this manuscript was written while I was at the EMEPC. I am deeply thankful to the head of this organization, Manuel Pinto de Abreu, its Technical Coordinator, Fernando Maia Pimentel and remaining EMEPC colleagues for their support.
viii
Tectono-Magmatic Processes in the Azores Triple Junction
My Family is grand. Mother: thank you for having revised the manuscript. Father: thanks for pointing me, at times, the north, and remembering me (in those times) that serenity is not just a word.
To my wife Raquel, no written acknowledgement makes justice to what she had to put up with me. I guess a thank you with the size of the Azores Plateau, for your patience, support and help is in order and says it all. This manuscript final stages (or at least my strength to accomplish it) also largely benefited from the smiles and laughs of my daughters Rita and Maria.
While the work benefited from many discussions and collaborations with the above stated colleagues, all misconceptions or errors present in this manuscript are my full responsibility.
ix

Tectono-Magmatic Processes in the Azores Triple Junction
Contents
Prologue.................................................................................................................................................... i Resumo................................................................................................................................................... iii Abstract.....................................................................................................................................................v Acknowledgments ................................................................................................................................. v i i
i
r
Contents.................................................................................................................................................. xi List of Figures.........................................................................................................................................xv List of Tables ...................................................................................................................................... xx ii Chapter I - Int oduction...........................................................................................................................1 Chapter II - Review of the kinematic Models for the ATJ and AHS .................................................... 11
II.1 Overview......................................................................................................................................... 11 II.2 ATJ Models based on plate kinematic reconstructions ................................................................... 12
II.2.1 The ATJ prior to 20 Ma: from Kings through to Gloria Fault ....................................................................... 12 II.2.2 The ATJ prior to 20 Ma: from Gloria fault to Terceira axis or to EAFZ? ................................................... 15 II.2.3 The ATJ in the last 10 Ma: fine scale evolution of Triple Junction .................................................................. 18
II.3 Testing two kinematic models for the evolution of the ATJ ........................................................... 20 II.3.1 Constraints provided by stage pole rotations..................................................................................................... 25 II.3.2 Is the Pico FZ the structural homologue of the EAFZ? .................................................................................. 30
II.4 The Azores Hotspot ........................................................................................................................ 37 II.4.1 Nature of the Azores Hot-Spot (AHS)......................................................................................................... 38 II.4.2 Spatial location of the hot spot ........................................................................................................................ 40 II.4.3 Dynamics of the Azores Hot Spot.................................................................................................................. 41
II.5 Discussion ....................................................................................................................................... 44 II.5.1 Interaction between the Azores Hot Spot and the Azores Triple Junction ........................................................ 44 II.5.2 Onset of SATJ northwards Migration ............................................................................................................ 48
II.6 Conclusions..................................................................................................................................... 50 Chapter III – Azores Hotspot Influence on MAR Seismicity ...............................................................53
III.1 Hydrophone Arrays ....................................................................................................................... 53 III.2. The SOFAR channel..................................................................................................................... 55 III.3 T phases ......................................................................................................................................... 57 III.4 Data Analysis Interface.................................................................................................................. 57 III.5 The SIRENA experiment............................................................................................................... 59
xi
Contents
III.6 SIRENA data processing ............................................................................................................... 61 III.7 Comparison between hydro-acoustic and global seismological network data............................... 65 III.8 Large wavelength variation in seismicity patterns with latitude.................................................... 65 III.9 Time-wise seismicity distributions along the MAR....................................................................... 67 III.10 Discussion and Conclusions ........................................................................................................ 69
Chapter IV - Defining the present day EU-NUB plate boundary ........................................................73 IV.1 Introduction ................................................................................................................................... 73 IV.2 Models based on morpho-tectonic and seismo-tectonic analysis .................................................. 74 IV.3 Earthquake data ............................................................................................................................. 79
IV.3.1 Epicenter spatial distributions ...................................................................................................................... 79 IV.3.2 Focal Mechanisms at the Azores.................................................................................................................. 80
IV.4 The Faial 1998 earthquake ............................................................................................................ 81 IV.5 Geodetic Data ................................................................................................................................ 84
IV.5.1 The TANGO experiment........................................................................................................................... 84 IV.5.2 GPS Results ............................................................................................................................................... 85 IV.5.3 Half space Elastic dislocation modeling......................................................................................................... 88
IV.6 Azores plate boundary configuration by geodesical constraints.................................................... 95 IV.7 Conclusions ................................................................................................................................... 96
Chapter V - LVR as active tectono-magmatic features o the EU-NUB plate boundaryf .................. 101 V.1 Introduction................................................................................................................................... 101 V.2 Data............................................................................................................................................... 104
V.2.1. Marine Magnetic data................................................................................................................................ 104 V.2.2 - The AZZORRE 99 TOBI Cruise ......................................................................................................... 105
V.3 Magnetic anomalies and Acoustic Facies interpretation............................................................... 108 V.3.1 LVR Sector 1 ............................................................................................................................................ 108 V.3.2 LVR Sector 2 ............................................................................................................................................ 116
V.4 Conclusions................................................................................................................................... 123 Chapter VI - Tectonics on the Terceira Island and neighbouring basins.......................................... 125
VI.1 Introduction ................................................................................................................................. 125 VI.2 Data and strategy ......................................................................................................................... 128 VI.3 Terceira Tectonics ....................................................................................................................... 129
VI.3.1 Geological setting ....................................................................................................................................... 129 VI.3.2 Volcano-tectonic lineations in Terceira Island from DTM and ortophoto maps interpretation ....................... 132 VI.3.3 Meso-scale observations ............................................................................................................................. 136
xii
Tectono-Magmatic Processes in the Azores Triple Junction
VI.4 Tectonic interpretations from the adjacent basins ....................................................................... 149 VI.4.1 West of Terceira: The Serreta Ridge structure ............................................................................................. 149 VI.4.2 East of Terceira: Geological inferences from a transect across the Terceira axis. ........................................... 155 VI.4.3 The SouthEast Terceira Ridge (SETVR) ................................................................................................. 158
VI.5 Discussion and conclusions ......................................................................................................... 164 Chapter VII - Geodynamic inferences of 1957-58 Capelinhos Eruption (Faial)................................. 169
VII.1 Introduction................................................................................................................................ 169 VII.2 The eruption and associated earthquake activity........................................................................ 170 VII.3 Geodetic Data............................................................................................................................. 171 VII.4 Elastic modelling........................................................................................................................ 177
Chapter VIII - Physical models of rifting and transform faulting in a wedge-shape lithosphere...... 183 VIII.1 Introduction............................................................................................................................... 183 VIII.2 Background on physical models of ridges and transform faults ............................................... 185 VIII.3 Dynamics of a spreading oceanic lithosphere ........................................................................... 187 VIII.4 Model configurations and scaling ............................................................................................. 191
VIII.4.1 Models of straight ridges .......................................................................................................................... 194 VIII.4.2 Models of offset ridges.............................................................................................................................. 196
VIII.5 Experimental results.................................................................................................................. 198 VIII.5.1 Model A. Half-ridge, unconfined gliding, sidewall friction (Figure VIII.5). .............................................. 198 VIII.5.2 Model B. Unconfined gliding, no sidewall friction. .................................................................................... 199 VIII.5.3 Models C and D. Straight ridges, confined gliding, limited sidewall friction ............................................... 199 VIII.5.4 Model E. Offset ridge, no embedded fault................................................................................................. 202 VIII.5.5 Model F. Offset ridge, rigid planar embedded fault (Figure VIII.10). ...................................................... 203 VIII.5.6 Model G. Transform with long flexible embedded fault............................................................................. 203
VIII.6 Discussion................................................................................................................................. 205 VIII.6.1 Straight ridges......................................................................................................................................... 205 VIII.6.2 Offset ridges............................................................................................................................................ 206
Chapter IX – Discussion and main conclusions ................................................................................. 211 IX.1 ATJ Evolution ............................................................................................................................. 212 IX.2 ATJ Present day Structure .......................................................................................................... 216 IX.3 Future Research ........................................................................................................................... 223
XI - Cited References ...........................................................................................................................225
xiii

Tectono-Magmatic Processes in the Azores Triple Junction
List of Figures
Chapter I
Figure I.1 - Regional bathymetry of the Azores Plateau with main morphological features discussed in the
text (Gente et al., 2003)
Figure I.2 - Detailed bathymetry of The Azores plateau from a bathymetric compilation presented by
Lourenço et al., (1998).
Chapter II
Figure II.1 - Evolution of the Iberian Microplate since anomaly M25 to anomaly C6 according to
Srivastava et al., (1990a).
Figure II.2 - Sketch depicting the evolution of the Azores Triple Junction proposed by Krause and
Watkins (1970).
Figure II.3 - Evolution of the Azores Triple Junction according to Mckenzie (1972) and Searle (1980).
Figure II.4 - Kinematic model of the ATJ evolution according to Searle (1980).
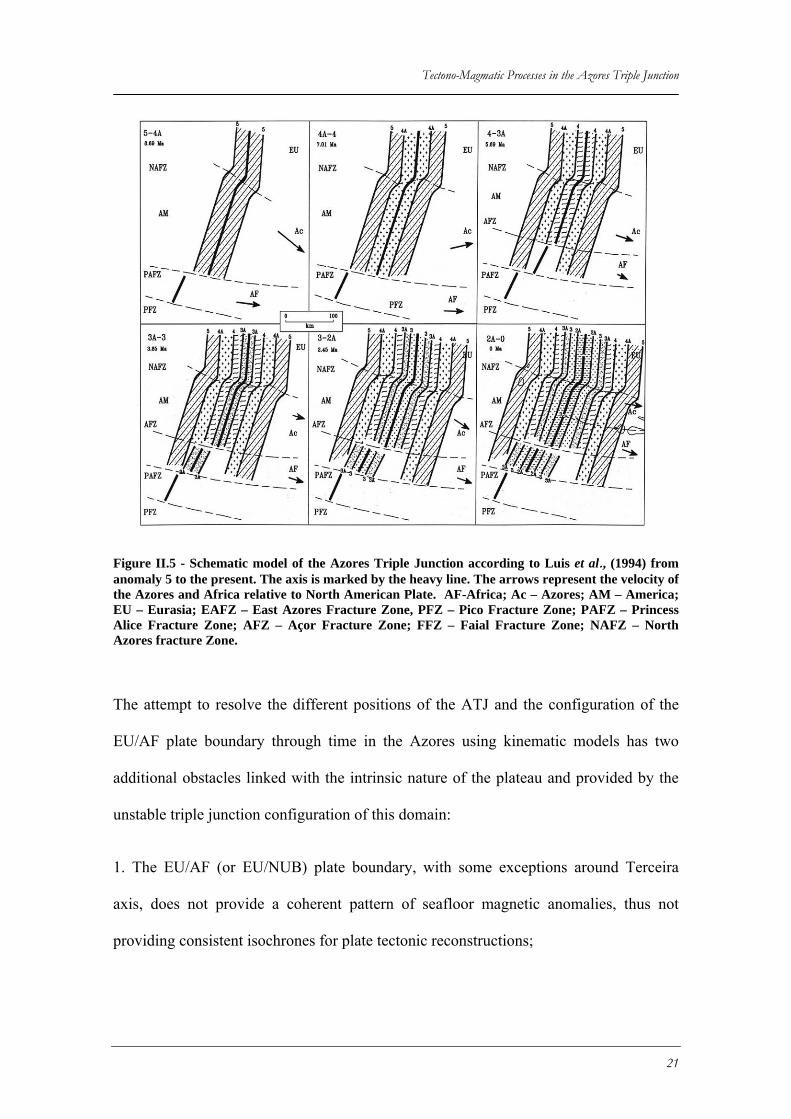
Figure II.5 - Schematic model of the Azores Triple Junction according to Luis et al., (1994) from
anomaly 5 to the present.
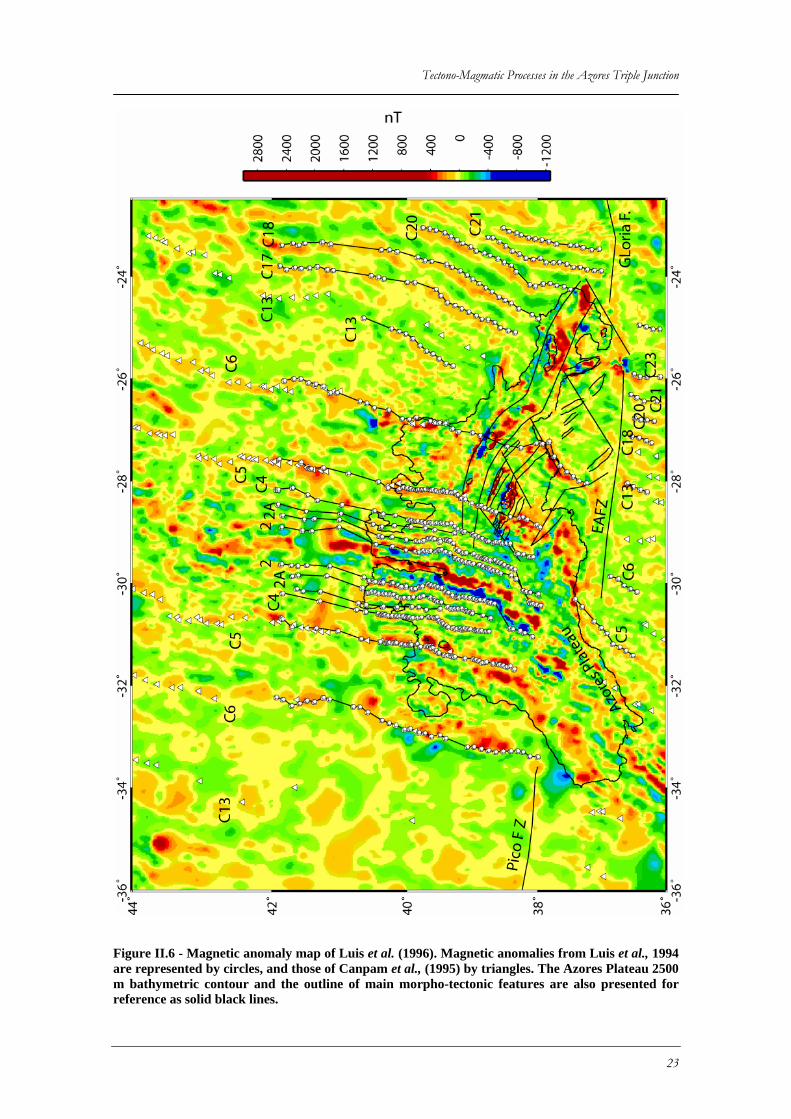
Figure II.6 - Magnetic anomaly map resultant from the merging of Luis et al., (1994) aeromagnetic grid
with a regional magnetic anomaly grid from the North Atlantic compilation of Verhoef et al. (1996).
Figure II.7 - Rotation of point elements using stage poles calculated in Table II.2. Points are considered to
be in Eurasia plate at an initial C13 time and rotated afterwards considering a fixed AF plate.
Figure II.8 - Schematic representation of Pico Fz rotations using Pole series 1 as kinematical constraint.
Figure II.9 - Schematic representation of Pico Fz rotations using Pole series 2 as kinematical constraint.
Figure II.10 - Topographical profiles across the East Azores Fracture Zone (EAFZ).
xv
List of figures
Figure II.11 - Shaded relief perspective view (facing NNW) of the EAFZ termination south of the Açor
Bank.
Figure II.12 - Cross-section of the S-wave velocity perturbation along the longitude 24ºW passing
through the Azores (Silveira and Sutzmann, 2002).
Figure II.13 - Illustration displaying the location of bathymetric and gravity features from anomaly 4
(7.01 Ma) to the present. over the two edges of the West Jussieu Plateau (Flores ridge) and East Jussieu
Plateau (Faial Ridge) from Cannat et al., (1999).
Figure II.14 - Schematic reconstructions of the relative movement between the Mid-Atlantic Ridge
(MAR) and a hot spot supposed to be located under the Azores Archipelago and centred under Terceira
Island (Gente et al., 2003).
Chapter III
Figure III.1 - Illustration and photographs of autonomous hydrophone components
Figure III.2 - Diagram of hydrophone mooring configuration.
Figure III.3 - Diagram depicting SOFAR channel axis configuration and T-phase paths within it. (Dziak
et al., 2004).
Figure III.4 - Screen capture of the software Seasick interface developed at NOAA for hydrophone data
processing
Figure III.5 - Ship tracks during the SIRENA1 (black) and SIRENA2/D274 (white) cruises. Indexed stars
indicate the positions of the SIRENA hydrophone mooring sites.
Figure III.6 - Example of hydrophone spectrograms displaying P phase arrivals from a large magnitude
earthquake (Ms = 7.6)
Figure III.7 - Spectrograms of the four hydrophones illustrating Pn and (Sn) arrivals from a clear tectonic
event located in the Oceanographer Fracture Zone.
Figure III.8 - Map of Earthquake epicentres from hydro-acoustic events from June 1st to feb. 28th 2003.
Figures III.9 – Plot comparing observables and their variation along the Mid-Altantic ridge axis (Goslin et
al. 2004)
Figure III.10 - Time-wise distribution of the number of events in two MAR sections (3º long) north and
south of the Azores, as documented by the SIRENA and NSF hydrophone networks.
xvi
Tectono-Magmatic Processes in the Azores Triple Junction
Chapter IV
Figure IV.1 - Terceira axis segmentation pattern according to Searle (1980).
Figure IV.2 - Stress Pattern and tentative plate boundary location along a Leaky Transform fault at the S.
Jorge Channel according to Madeira and Ribeiro (1990)
Figure IV.3 - Plate boundary configuration according to Lourenço et al., (1998)
Figure IV.4 - Tectonic block model sketched by Miranda et al (1998).
Figure IV.5 - Recent Earthquake Epicenter distribution across the Azores plateau from years 1994 to
2004 taken form the ISC catalogue, NEIC focal mechanisms and predicted transform directions from
NUVEL1A for Nub/Eu plate boundary.
Figure IV.6 - Re-location of the events registered in July 1998 following the Faial earthquake. (Dias,
2006).
Figure IV.7 - GPS sites in the Azores Archipelago observed since 1988.
Figure IV.8 - Predicted motions (with 95% confidence ellipses) according with the DEOS2k (star),
NUVEL-1A (triangle), and REVEL of stable Eurasia and stable Nubia compared with the elastic
dislocation model .
Figure IV.9 - Elastic dislocations considering an homogeneous elastic half space, a fixed Eurasian plate
and Deos2K kinematic model as the plate boundary displacement constraint below the locking depth
considering one and two segment configurations.
Figure IV.10 - Elastic dislocations considering an homogeneous elastic half space, a fixed Eurasian plate
and Nuvel 1A kinematic model as the plate boundary displacement constraint below the locking depth
considering one and two segment configurations.
Fig. IV.11 - Relative motions with respect to stable Eurasia (as predicted by DEOS2k) and predicted
relative motions for points located in stable Nubia (purple) plotted over the bathymetry from Lourenço et
al. (1998).
Chapter V
Figure V.1 – Shaded bathymetric map of LVR sectors 1 and 2.
Figure V.2 - Topographic profiles of LVR sectors.
xvii
List of figures
Figure V.3 - Plot of Magnetic and TOBI survey ship track.
Figure V.4 - Magnetic anomaly map reduced to the pole, covering the LVR area.
Figure V.5 - TOBI Mosaics surveyed during the Azzorre 99 cruise. Bathymetric contours each 500 m are
overlain for bathymetrical reference.
Figure V.6 - TOBI image of west seaward prolongation of the Faial Island.
Figure V.7 - TOBI image of the Condor West ridge (South of Faial).
Figure V.8 - TOBI image of S. Jorge Island seaward prolongation. And perspective view facing ESE of
the same structure, bathymetric mesh is overlain over the sonar image to allow spatial referencing.
Figure V.9 - TOBI image in plan view displaying a tectonised area north of the Faial Island and
perspective view image of TOBI sonar draped over the bathymetry.
Figure V.10 - Topographical and magnetic anomaly profiles along the (East Pico Volcanic Ridge
(EPVR).
Figure V.11 - Section of the magnetic anomaly map reproduced in Figure V.III, overlain over the TOBI
sonar image. Numerous volcanic cones align along the EPVR axis, on negative magnetic anomaly
basement.
Figure V.12 - Acoustic facies and tectonic interpretation of EPVR south-eastern termination.
Figure V.13 - TOBI image in plan view and perspective view of the South Terceira Volcanic Ridge
(STVR).
Chapter VI
Figure VI.1 - Basemap of the study area. Baseline data consists on the magnetic anomaly map, earthquake
epicenter locations from ISC and gathered swath bathymetry envelopes from different cruises.
Figure VI.2 - Shaded relief bathymetric and topographical map of the study area compiled in this study.
Figure VI.3 - Terceira Geological map (from Nunes, 2000).
Figure VI.4 - Terceira shaded relief and tectono-volcanic lineation map with field station locations.
Figure VI.5 - Stereographic plots of azimuths from all elements retrieved from the Terceira Island
lineation map along with field measurements of faults and dikes.
xviii
Tectono-Magmatic Processes in the Azores Triple Junction
Figure VI.6 - Ortophoto map image and resulting tectonic interpretation of the fissural system east of Stª
Barbara volcano. Main volcanic cones and trachytic domes are labeled.
Figure VI.7 - Contour map of the Lajes Graben. Contours interval 10 m. Major identified (continuous
lines) or interpreted (stippled lines) fault traces are plotted.
Figure VI.8 - Photographs of the NELF damage zone and hanging wall deformation.
Figure VI.9 - Photographs of Praia da Victoria geological cross section displaying faults belonging to the
Southwest Lages fault (SWELF) system.
Figure VI.10 - Photographs of East Angra Fault traces exposed on the the Terceira southern coastal cliffs.
Figure VI.11 - Side view photograph of the Ponta da Serreta Spur, displaying main volcano-tectonic
features.
Figure VI.12 - Ortophotomap of the Ponta da Serreta Spur and corresponding structural map.
Figure VI.13 - Series of photographs from the Ponta da Serreta structures.
Figure VI.14 - Stereographic plots of Serreta fault planes and slip lines. Stress axes are retrieved from
stress inversion using dihedral computations (Ortner et al., 2002)
Figure VI.15 - Model depicting possible tectonic interpretation overlaying the Serreta sumarine ridge
shaded relief.
Figure VI.16 - Map od the Serreta ridge historical submarine eruption sites.
Figure VI.17 - Photographs of lava ballons occuring at the sea surface during the Serreta ridge intermitent
submarine eruption of 1998-2001
Figure VI.18 - Qualitative study with bathymetric data of changes in bathymetry due to the Serreta ridge
eruption.
Figure VI.19 - Identified tectono-volcanic domains east of Terceira Island, based on a single passage of
swath bathymetry transverse to the Terceira axis and corresponding magnetic anomalies and
magnetizations profiles.
Figure VI.20 - GLORIA sonar image over the SETVR (Searle, 1980)
Figure VI.21 - TOBI mosaic of the SouthEast Terceira Volcanic Ridge (SETVR) with Accoustic facies
interpretation.
xix
List of figures
Figure VI.22 - Examples of TOBI acoustic facies in the SETVR and corresponding swath bathymetry
shaded reliefs from the EM300 system.
Figure VI.23 - Summary of main tectonic observations in the study area and model of possible tectono-
magmatic evolution of the Terceira axis in the same area.
Chapter VII
Figure VII.1 - Geodetic network on Faial and Pico (triangles), directions and azimuth between Faial and
Pico measured in 1937 and EDM measurements made in 1967. (Catalão et al., 2006)
Figure VII.2 - Line length less a constant nominal length plotted as a function of time. The line length
was measured with AGA-6A in 1967 and was computed from site positions for the 1937, 1995 and 1997
campaigns (Catalão et al., 2006)
Figure VII.3 - Vertical deformation obtained from 1937 and 1987 epochs (Catalão et al, 2006)
Figure VII.4 - Displacements obtained from simultaneous adjustment of the 1937 and 1987 geodetic
networks. Error ellipses are computed with a 95% confidence interval. (Catalão et al, 2006)
Figure VII.5 - Map of the displacements obtained from the measured geodetic network and the half space
elastic dislocation modeling.
Chapter VIII
Figure VIII.1 - Thickness of oceanic lithosphere in nature and experiment.
Figure VIII.2 - Theoretical subsidence and ridge push in nature and experiment.
Figure VIII.3 - Experimental configuration (in schematic oblique view).
Figure VIII.4 - Three initial kinds of transform fault in models (top views and side views).
Figure VIII.5 - Unconstrained gliding and effect of sidewall friction formModel A.
Figure VIII.6 - Illustration of the use of Mylar sheets to reduce sidewall friction (schematic oblique
view)..
Figure VIII.7 - Displacement versus time for unconfined gliding, Model B.
Figure VIII.8 - Progressive development of ridge, models C and D (no offset).
Figure VIII.9 - Progressive development of transform zone, Model E (offset ridge, no embedded fault).
xx
Tectono-Magmatic Processes in the Azores Triple Junction
Figure VIII.10 - Progressive development of a transform zone, Model F (offset ridge, planar rigid
embedded fault).
Figure VIII.11 - Progressive development of transform zone, Model G (offset ridge, flexible embedded
fault).
Chapter IX
Figure IX.1 - Three possible mechanisms for the generation of the LVR: 1. As leaky transforms. 2. As a
result of AHS northeastwards migration. 3. As a result of south triple junction northwestwards migration.
Figure IX.2 - Schematic Illustration representing the main tectono-magmatic orientations identified in this
study and its kinematic behavior across the studied sectors and as a function of dominant ruling processes.
Figure IX.3 - Cartoon depicting a tectono-magmatic model for the present day in the Azores Triple
Junction area a summary of all observations.
xxi

Tectono-Magmatic Processes in the Azores Triple Junction
List of Tables
Chapter II
Table II.1 - Finite poles describing the relative motion between Eurasia (EU) - North America (NAM)
and NAM –African (AF) for Chrons: 13, 6 and 5.
Table II.2 - List of stage poles between EU (IB) - AF used in this study
Table II.3 - Numerical results from the stage pole rotations presented in Figure II.7.
Chapter IV
Table IV.1 - r.m.s. of the residuals on the mapping for each campaign
Table IV.2 - Plate boundary segments characteristics used in the modeling procedure. ID corresponds to
segment labels used in Figure V.1.
Table IV.3 - Listing of the modeling results, Tango observations and residuals (Observed – Modeled) for
the TANGO stations considering a fixed Eurasian plate. Results from Nuvel 1A and Deos2K.
Chapter VII
Table VII.1 - Comparison between the averaged horizontal motion (in mm/yr) computed using the new
stations observed since 1999 (first two columns) and the TANGO station (two last columns) in each
Island of Central Group (Catalão et al., 2006)
Table VII.2 - Observation epochs and number of geodetic observations
Table VII.3 - Elastic model fault parameters.
Chapter IX
Table IX.1 - Model configuration.
Table IX.2 - Parameters and scaling.
xxiii

Tectono-Magmatic Processes in the Azores Triple Junction
Chapter I - Introduction
The Azores Archipelago consists of nine Islands. The Western group (two Islands) is
located in the stable North America plate, whilst the Central (five Islands) and the
Eastern (two Islands) groups lie in the Eurasian (EU)-Nubian (NUB) plate boundary
area. The Azores Islands, themselves, represent a small emerged area of a vast
submarine volcanic platform. This platform, roughly defined by the 2000 m isobath, is
relatable to an excess in volcanism/magmatism. It presents a triangular shape, whose
western side is located west of the Mid-Atlantic Ridge. It is limited to the south by the
East Azores Fracture Zone and to the northwest by the Terceira axis (Machado, 1957).
Within the Azores plateau a large V-shaped volcanic feature roughly bisected by the
MAR, designated hereafter as Faial ridge and Flores ridge (after Vogt 1976) is probably
a result of a major thermal or magmatic event under the Mid-Atlantic Ridge at 10 Ma,
reflecting the interaction between the so-called Azores hot spot and the Mid-Atlantic
ridge (Cannat et al., 1999; Escartin et al., 2001, Gente et al., 2003).
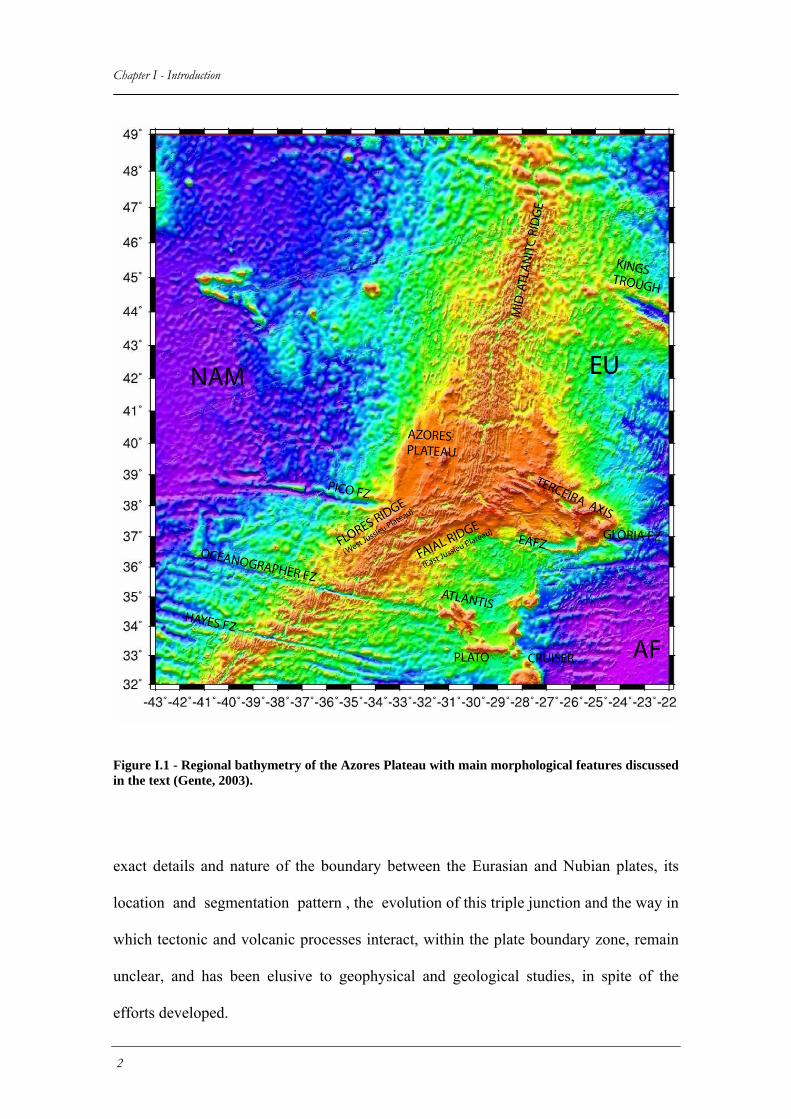
The precise location of the MAR (Figure I.1), which forms the boundary between the
North American and Eurasian/Nubian plates is well known, particular after the efforts
developed in recent years to map the ridge system in the Azores area; in contrast, the
1
Chapter I - Introduction
Figure I.1 - Regional bathymetry of the Azores Plateau with main morphological features discussed in the text (Gente, 2003).
exact details and nature of the boundary between the Eurasian and Nubian plates, its
location and segmentation pattern , the evolution of this triple junction and the way in
which tectonic and volcanic processes interact, within the plate boundary zone, remain
unclear, and has been elusive to geophysical and geological studies, in spite of the
efforts developed.
2
Tectono-Magmatic Processes in the Azores Triple Junction
The plate boundary between Eurasia and Africa is generally characterized in its
westernmost part by transtension in a complex area striking WNW-ESE, the Terceira
Axis, linking the Mid-Atlantic Ridge to the Gloria fault. The spreading rates across the
plate boundary in the Terceira axis, between Eurasia and African plates amount to 4
mm/yr in an average N75°E direction (Euler rotation pole located at 19.5°N, 23.7°W,
Demets et al., 1994). The direction of motion predicted by the global kinematic model
does not account for all structure orientations and their variations from south to north
(Lourenço et al., 1998).
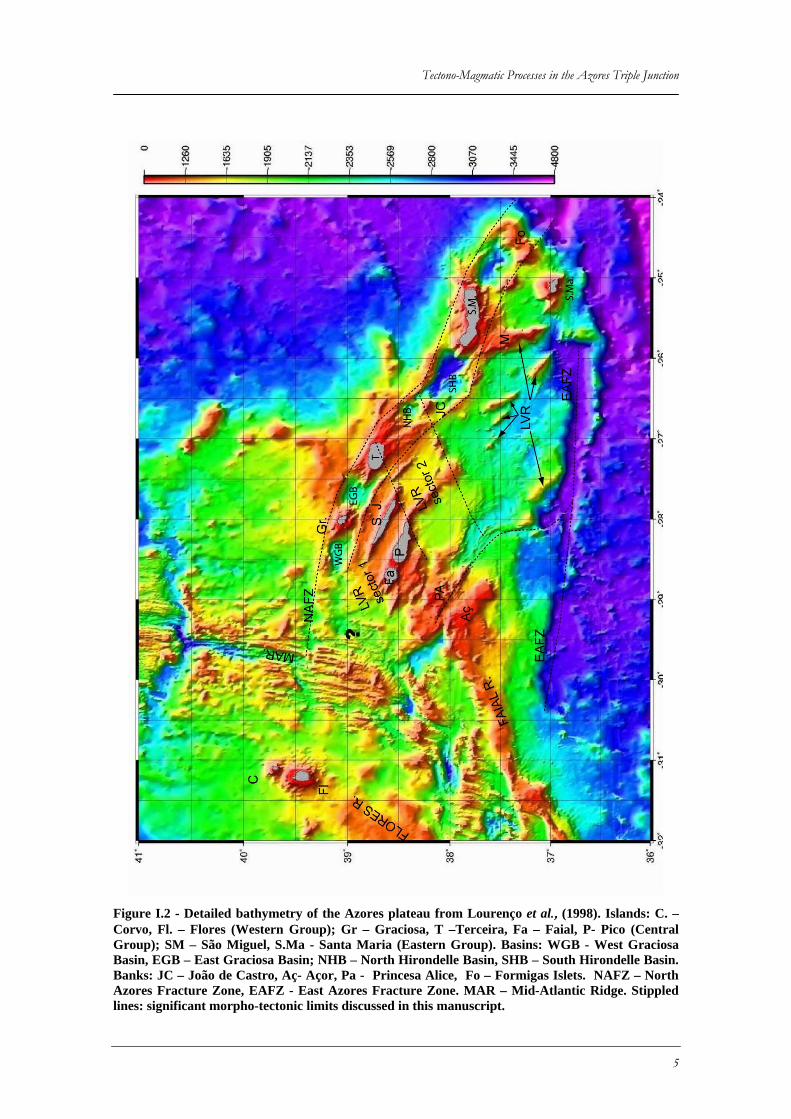
The internal structure of the plateau (Figure I.2) displays a coherent structure of linear
volcanic ridges developed along fissure systems roughly aligned sub-parallel to the
Terceira Axis (Lourenço et al., 1998). This axis presents a marked clockwise rotation
from N110-120º near its intersection with the MAR and which mostly characterizes the
central Islands (Pico, São Jorge, Terceira); to directions closer to N140º-150º at its
intersection with the GLORIA fault. These directions appear to characterize the tectonic
pattern on the Islands and in the extensional basins between them, as well as some
elongated, volcanic ridges. Guest et al. (1999) suggested that the conical volcanic
edifices are emplaced at the intersection of tectonic structures with both directions. In
particular, the Furnas volcano on São Miguel Island, displays such a tectonic setting.
The seismic activity that constitutes the best tool to trace plate boundaries and interplate
deformation processes, is characterized by earthquakes with focal mechanisms
compatible with right-lateral strike-slip faults or normal faults, oriented N120°E to
N150°E (Grimison and Chen, 1986; Buforn et al., 1988). A strong earthquake (M=7.2),
however, occurred in 1980, probably on a left-lateral strike-slip fault oriented N150°E,
according to its focal mechanism and the aftershock distribution (Hirn et al., 1980),
3
Chapter I - Introduction implying that the kinematics is not simple in the area. The focal mechanism for the 1998
Faial earthquake showed also a complex fracture pattern (Fernandes et al., 2002).
The volcanic activity is distributed over all the Central and Eastern Azores Islands, and
all record historical activity. The most recent volcanic activity occurred on the Serreta
ridge (Luis et al., 1999), northwest of Terceira Island. The WNW-ESE-trending zone of
volcanic and tectonic activity, which also marks the northeast boundary of the Azores
plateau, is a rift zone, with a significant part of transtensional motion (leaky transform).
The ages of the Azores Plateau, the Terceira axis, and the linear volcanic ridge
structures within the plateau are still unclear. Little constraint is provided by magnetic
anomalies in what concerns islands evolution, and isotopic age determinations only
provide an upper bound for the age of these structures. Little is also known about the
thermal structure (or lithospheric structure) of the Terceira axis and the partition, style
and dynamics between magmatic and tectonic processes which have shaped the plate
boundary and the Azores plateau.
An analysis based on an aeromagnetic survey and the compilation of ship born magnetic
data of the plateau showed that only the Brunhes and possibly Matuyama magnetic
epochs can be identified in the rift area, even though the magnetic anomalies generated
along the mid-Atlantic ridge are disrupted on the plateau (Miranda et al., 1991, Luis et
al., 1994). The lack of older magnetic lineations on either side of the Terceira
rift suggests that the relative motion between Africa and Eurasia in the westernmost part
of the plate boundary was accommodated by extension distributed across the plateau
rather than by accretion focused along the rift. Major questions on the kinematics and
the dynamics of the area are therefore still unresolved:
4
Tectono-Magmatic Processes in the Azores Triple Junction
Figure I.2 - Detailed bathymetry of the Azores plateau from Lourenço et al., (1998). Islands: C. – Corvo, Fl. – Flores (Western Group); Gr – Graciosa, T –Terceira, Fa – Faial, P- Pico (Central Group); SM – São Miguel, S.Ma - Santa Maria (Eastern Group). Basins: WGB - West Graciosa Basin, EGB – East Graciosa Basin; NHB – North Hirondelle Basin, SHB – South Hirondelle Basin. Banks: JC – João de Castro, Aç- Açor, Pa - Princesa Alice, Fo – Formigas Islets. NAFZ – North Azores Fracture Zone, EAFZ - East Azores Fracture Zone. MAR – Mid-Atlantic Ridge. Stippled lines: significant morpho-tectonic limits discussed in this manuscript.
5
Chapter I - Introduction Has the kinematic setting of the plate boundary and of the triple junction changed with
time, and how?
Is the North America-Africa-Eurasia Triple junction clearly a ridge-ridge-ridge
junction? Can we describe the area bounded by two branches of the Eurasia-Africa plate
boundary as a microplate? Is the triple junction a discrete feature or a complex zone?
How is the relative motion between Africa and Eurasia accommodated in the
westernmost part of the plate boundary? Is the motion distributed across the Azores
plateau? Or does the Terceira rift account for all the relative motion?
In the following chapters, we will address some of this questions and present results
from studies in which the author has been involved between 1999 and 2006. The Azores
plateau is a particularly suitable area to study tectono-magmatic interactions in space
and time and at different scales. It comprises the existence of a disputed plume or at
least a significant upper mantle anomaly, hereafter refered as the Azores Hot-Spot
(AHS) which is considered the main intervining factor for the formation of the Azores
volcanic plateau. The internal structure of this plateau can be explained by interaction
along time of the AHS with both the Mid-Atlantic Ridge (MAR) and the Azores Triple
Junction (ATJ. Significant consequences of this interaction are: the position, kinematic
and related tectonic response of the ATJ, the distribution of magmatic contribution for
lithospheric structure and thermal structure of the Azores plateau and on the
geophysical, geological and biological segmentation pattern of the MAR through time.
To understand the plateau inner structure and the consequences of AHS-ATJ-MAR
interaction it is crucial that plate kinematic constraints are provided. Several kinematic
interpretations have been provided in the past, but all of them fail to integrate a
6
Tectono-Magmatic Processes in the Azores Triple Junction
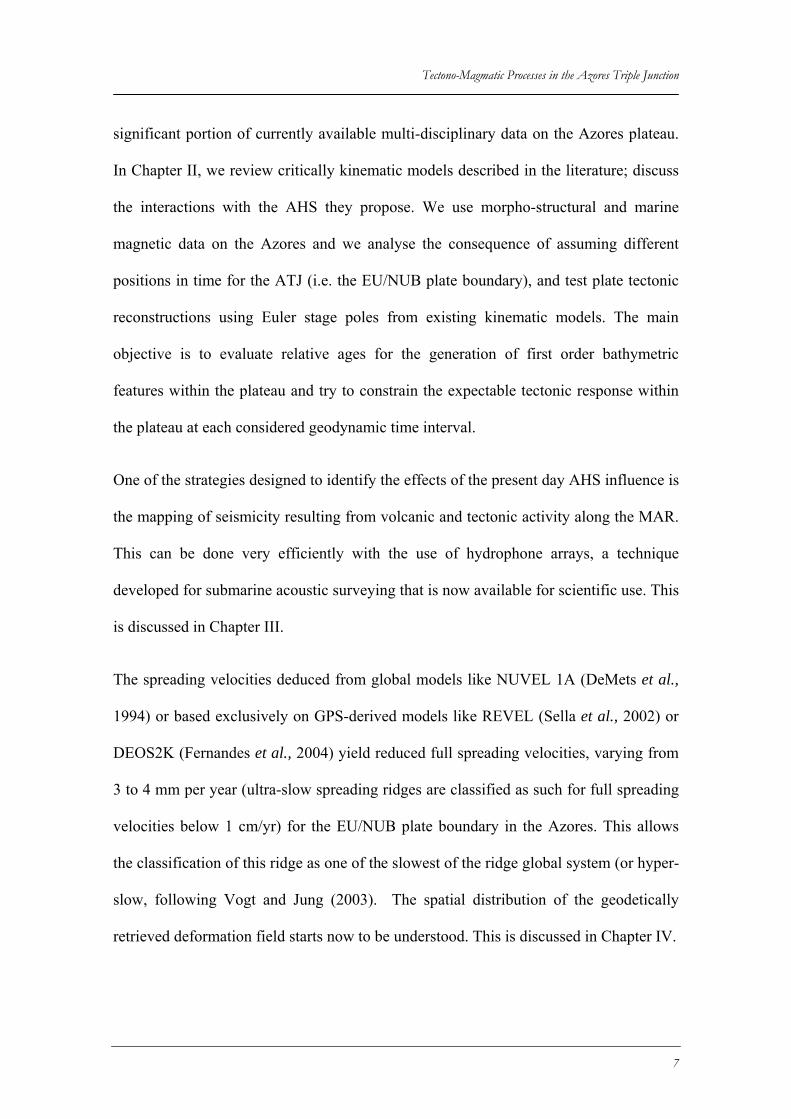
significant portion of currently available multi-disciplinary data on the Azores plateau.
In Chapter II, we review critically kinematic models described in the literature; discuss
the interactions with the AHS they propose. We use morpho-structural and marine
magnetic data on the Azores and we analyse the consequence of assuming different
positions in time for the ATJ (i.e. the EU/NUB plate boundary), and test plate tectonic
reconstructions using Euler stage poles from existing kinematic models. The main
objective is to evaluate relative ages for the generation of first order bathymetric
features within the plateau and try to constrain the expectable tectonic response within
the plateau at each considered geodynamic time interval.
One of the strategies designed to identify the effects of the present day AHS influence is
the mapping of seismicity resulting from volcanic and tectonic activity along the MAR.
This can be done very efficiently with the use of hydrophone arrays, a technique
developed for submarine acoustic surveying that is now available for scientific use. This
is discussed in Chapter III.
The spreading velocities deduced from global models like NUVEL 1A (DeMets et al.,
1994) or based exclusively on GPS-derived models like REVEL (Sella et al., 2002) or
DEOS2K (Fernandes et al., 2004) yield reduced full spreading velocities, varying from
3 to 4 mm per year (ultra-slow spreading ridges are classified as such for full spreading
velocities below 1 cm/yr) for the EU/NUB plate boundary in the Azores. This allows
the classification of this ridge as one of the slowest of the ridge global system (or hyper-
slow, following Vogt and Jung (2003). The spatial distribution of the geodetically
retrieved deformation field starts now to be understood. This is discussed in Chapter IV.
7
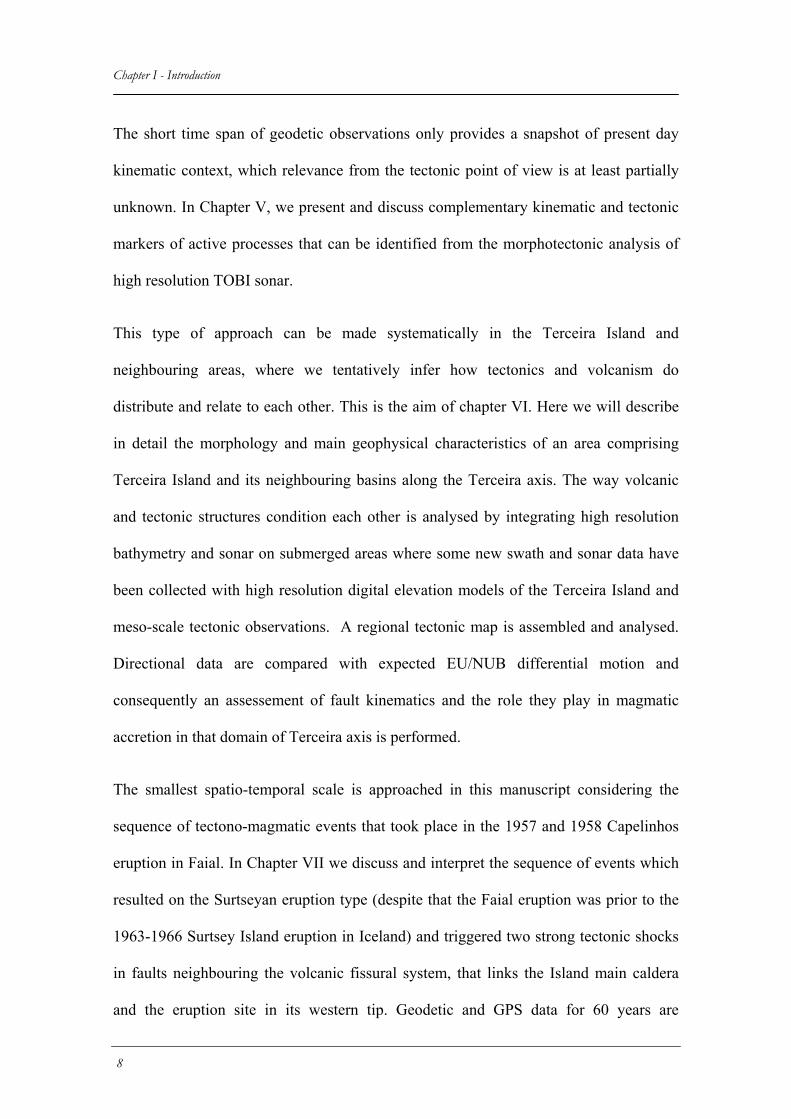
Chapter I - Introduction The short time span of geodetic observations only provides a snapshot of present day
kinematic context, which relevance from the tectonic point of view is at least partially
unknown. In Chapter V, we present and discuss complementary kinematic and tectonic
markers of active processes that can be identified from the morphotectonic analysis of
high resolution TOBI sonar.
This type of approach can be made systematically in the Terceira Island and
neighbouring areas, where we tentatively infer how tectonics and volcanism do
distribute and relate to each other. This is the aim of chapter VI. Here we will describe
in detail the morphology and main geophysical characteristics of an area comprising
Terceira Island and its neighbouring basins along the Terceira axis. The way volcanic
and tectonic structures condition each other is analysed by integrating high resolution
bathymetry and sonar on submerged areas where some new swath and sonar data have
been collected with high resolution digital elevation models of the Terceira Island and
meso-scale tectonic observations. A regional tectonic map is assembled and analysed.
Directional data are compared with expected EU/NUB differential motion and
consequently an assessement of fault kinematics and the role they play in magmatic
accretion in that domain of Terceira axis is performed.
The smallest spatio-temporal scale is approached in this manuscript considering the
sequence of tectono-magmatic events that took place in the 1957 and 1958 Capelinhos
eruption in Faial. In Chapter VII we discuss and interpret the sequence of events which
resulted on the Surtseyan eruption type (despite that the Faial eruption was prior to the
1963-1966 Surtsey Island eruption in Iceland) and triggered two strong tectonic shocks
in faults neighbouring the volcanic fissural system, that links the Island main caldera
and the eruption site in its western tip. Geodetic and GPS data for 60 years are
8
Tectono-Magmatic Processes in the Azores Triple Junction
compared with 2D crustal dislocations models, resultant from fault slip data inversion.
A geological interpretation is then performed, about the eruption driving mechanism,
the earthquakes triggering mechanism and the style of accretion in this linear volcanic
systems which constitute a significant part of the Azores plateau.
In Chapter VIII we use analogue modelling techniques to analyse the effect of ridge
push in ridge extension and transform fault generation, and in particular the case for
active transform faults which, contrary to what is expectable from fault mechanics, lie
normal to the ridge axis. Despite approaching normal seafloor spreading ridge sections,
this topic is relevant within the context of the EU-NUB plate boundary, as in the later
there are evidences from earthquake activity and fault mapping that similar orthogonal
geometries exist within the Azores.
Finally Chapter IX we perform the discussion of the data presented in this manuscript
and integrate them into a coherent tectonic model for the ruling kinematics conditions at
the EU-NUB plate boundary and ATJ at the present day. Topics for future researches in
this complex geodynamical framework are also underlined.
9

Tectono-Magmatic Processes in the Azores Triple Junction
Chapter II - Review of the kinematic Models for the ATJ and AHS
II.1 Overview
The evolution and shaping of the Azores Plateau is usually considered as the result of
the interaction between two key processes: the ATJ instability and the Azores Hot Spot
(AHS) position in the course of time. Past interpretative models, addressing their roles,
put little emphasis on their interactions and consequent implications to the birth and
evolution of the Azores plateau, and thus tend to treat each process as acting stand
alone.
Two types of interpretative models have been presented: those which are based on
constraints provided by kinematic models thus providing plate tectonic reconstructions
of the previous geometries of the triple junction (Krause and Watkins, 1970;
McKenzie, 1972; Searle, 1980; Luis et al., 1994) and those that address particular
aspects of the Azores tectonics, based on morpho-tectonic analysis (Machado et al.,
1957; Madeira and Ribeiro, 1990; Lourenço et al., 1998; Vogt and Jung, 2003), isotopic
dating (Féraud, 1980), focal mechanisms and earthquake epicenter distributions
(Miranda et al., 1998) and GPS observations (Fernandes et al., 2004, 2006). Analyses of
the present-day context of the ATJ will be dealt with later on.
Here, we present a summary of presented models which are sustained by kinematic
interpretations; we test their underlying assumptions in respect of available geo-
11
Chapter II –Review of the kinematic models for the ATJ and AHS information. Kinematic models are also confronted with models for the evolution of the
AHS, notably those of Cannat et al., (1999) and Gente et al., (2003) to try to identify the
strong links and/or contradictions between both geodynamic histories across time.
II.2 ATJ Models based on plate kinematic reconstructions
II.2.1 The ATJ prior to 20 Ma: from Kings through to Gloria Fault
Regional studies comprising the kinematic evolution of the Atlantic basin, namely the
evolution of the Gloria fault, always met problems when incorporating the complex
behaviour of the Iberian microplate, described at times as attached to the Eurasian plate,
or others attached to the African plate (Bonnin, 1978, Olivet, 1984; Klitgord and
Schouten, 1986). Some models also consider that during different time intervals, Iberia
has moved independently from the two larger plates (Galdeano et al., 1989, Srivastava
et al., 1990a, 1990b and Roest and Srivastava, 1991).
The analysis of the kinematic behaviour of the Iberian micro-plate is limited by the lack
of prevalent magnetic lineations, and the difficulties in tracing the homologues of
Fracture Zone’s traces between the North American Plate (NAM) and Iberian (Canpam,
1995). A thorough analysis of the evolution of the Iberian micro-plate during the
opening of the Northern Atlantic basin is out of scope of this work.
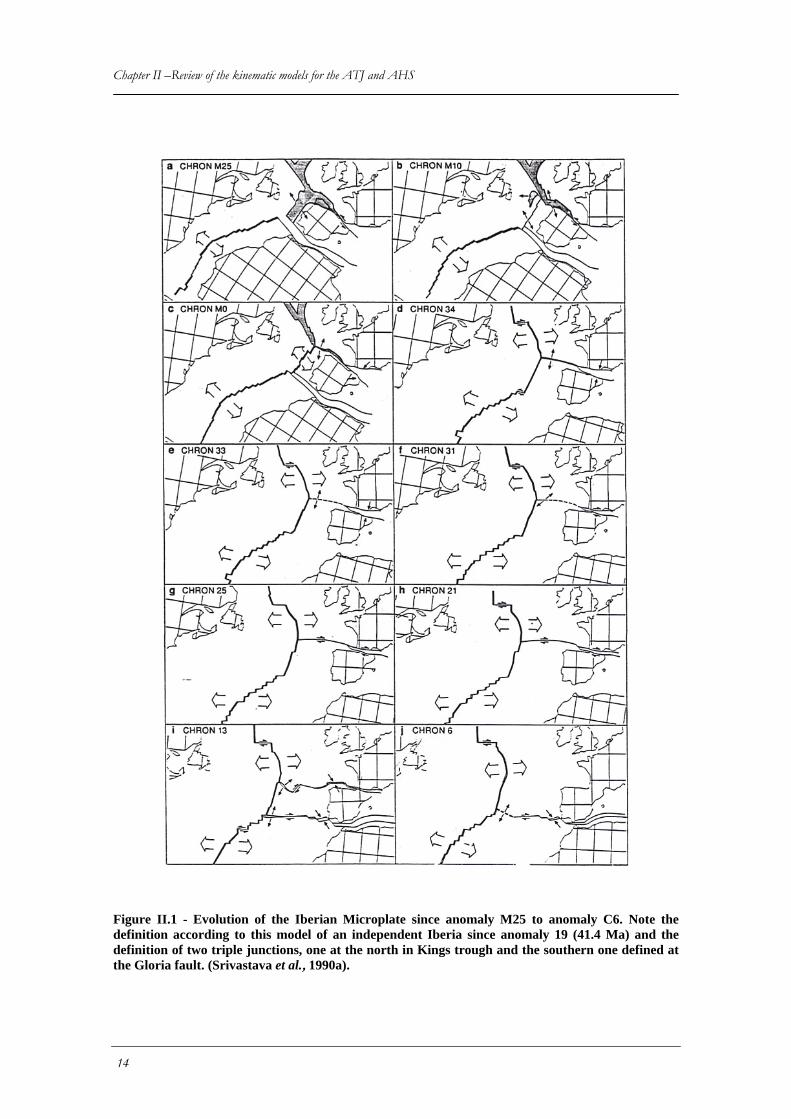
Here we consider just a short summary of the main kinematic events and onset of
resulting morpho-tectonic features during the course of this evolution since anomaly
M0, as proposed by Srivastava et al. (1990a) and depicted in Figure II.1.
After mid-Cretaceous (since anomaly M0, 118 Ma), a triple junction developed at the
Gulf of Biscay while Iberia is supposed to have shared a common kinematic history
with Africa. This Triple junction will constitute the main plate boundary during most of
12
Tectono-Magmatic Processes in the Azores Triple Junction
the Atlantic evolution and its trace is defined along the Gulf of Biscay towards a region
north of the Kings trough. Its behaviour is mainly extensional between anomalies 33
and 31, and becomes dominantly right lateral strike slip until anomaly 21 times.
The unstable configuration of the triple junction led to its southward migration and the
opening of the Kings trough at anomaly 17 times (ca. 37 Ma). The plate boundary then
becomes defined by the Kings Trough, Azores-Biscay ridge and the Pyrenees chain.
After anomaly 19 (41.4 Ma) Iberia detached progressively from the African plate, with
the development of a southern Iberian plate boundary defined by the Gloria fault. The
northern boundary gradually losses significance and differential motion between
Eurasia and Iberia plate nearly cease at anomaly 10.
At anomaly 6c (23.4 Ma) activity on the Kings trough ceases completely and Iberia
becomes attached to the Eurasian plate. Only one triple junction becomes active at the
Azores level and the plate boundary is solely located along the Gloria fault.
This model is disputed as it presents several inconsistencies with inland geology,
namely with regard to the Pyrenees tectonic history, where major wrench events are
documented prior to 37.5 Ma. Other difficulties result from the assumption of coupled
movement between Iberia and Northern Africa as both Atlas, the Rif and the Betics
were onset prior to anomaly 17 (Canpam, 1995 and references therein).
13
Chapter II –Review of the kinematic models for the ATJ and AHS
Figure II.1 - Evolution of the Iberian Microplate since anomaly M25 to anomaly C6. Note the definition according to this model of an independent Iberia since anomaly 19 (41.4 Ma) and the definition of two triple junctions, one at the north in Kings trough and the southern one defined at the Gloria fault. (Srivastava et al., 1990a).
14
Tectono-Magmatic Processes in the Azores Triple Junction
Other authors simplify this history and only consider one triple junction active at each
time thus precluding an independent Iberia. The transfer of Iberia Lithosphere from
African plate to the Eurasian plate is signed at anomaly 13 (33.4 Ma) by Ollivet (1984),
during anomaly 10 (28.3 Ma) by Klitgord and Schouten (1986) or at 25 Ma following
collision between EU and AF in southern Iberia (Silver et al., 1998).
As we shall see below, regardless of the preferred model, when one considers plate
reconstructions confined to a more local scale (the scale of the Azores) it will cause
significant difficulties and caveats. Moreover, the Azores block presents the same
degree of obscurity in kinematic terms as the Iberian plate. Its evolution seems to have
been marked by transference from African to Eurasian megaplates behaving sometimes
as an independent block. Understanding the behaviour of its northern (Terceira axis)
and southern (EAFZ) limits is therefore crucial for tracing its evolution. Below, we
review critically the attempts performed by different authors to constrain it
II.2.2 The ATJ prior to 20 Ma: from Gloria fault to Terceira axis or to EAFZ?
Early studies, centred on the characterization of the Azores Triple Junction and the EU-
AF plate boundary, were based on sparse ship-borne bathymetric and magnetic profiles.
Calculated global or regional Euler poles suffered from similar limitations.
A first attempt was made by Krause and Watkins (1970) based on the first surface
magnetic compilation. They considered a RRR (Ridge-Ridge-Ridge) triple junction
type, with oblique spreading on the Eurasia-African plate boundary. According to these
authors, such a configuration would have evolved from a RFF triple junction with
migration of the MAR westwards, south of the EAFZ and change in the spreading
direction from E-W to ESE-WNW. This re-orientation of the spreading direction would
15
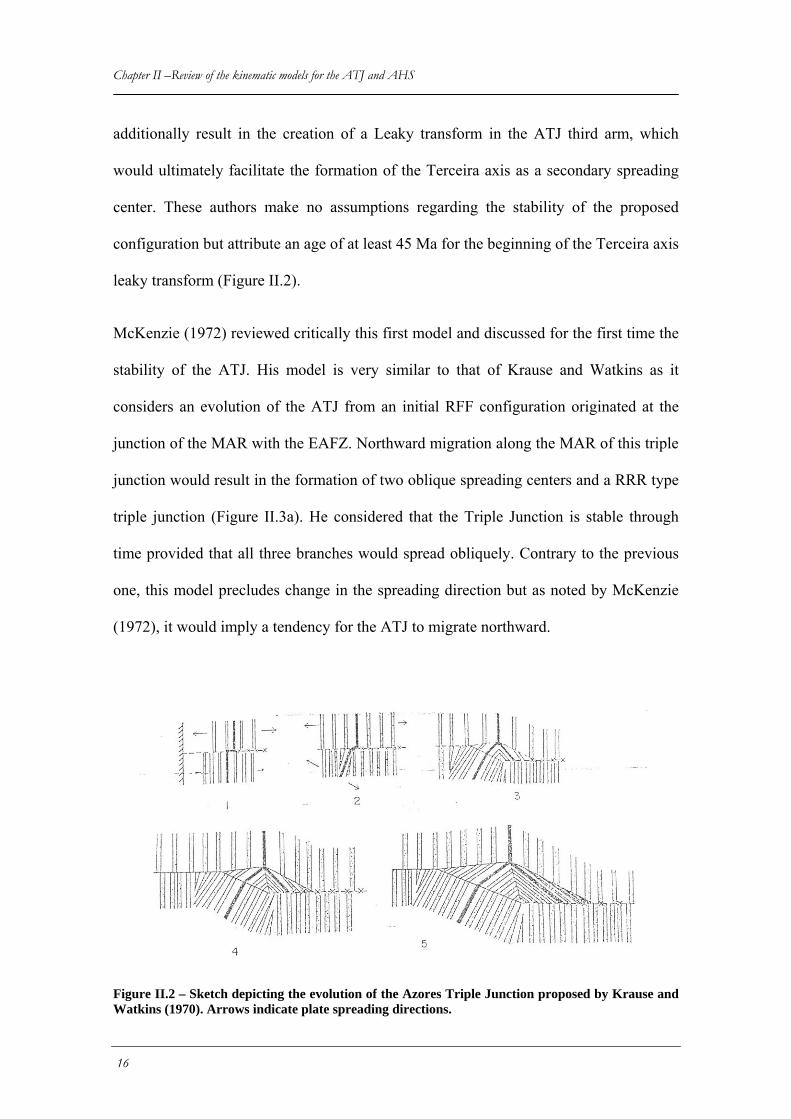
Chapter II –Review of the kinematic models for the ATJ and AHS additionally result in the creation of a Leaky transform in the ATJ third arm, which
would ultimately facilitate the formation of the Terceira axis as a secondary spreading
center. These authors make no assumptions regarding the stability of the proposed
configuration but attribute an age of at least 45 Ma for the beginning of the Terceira axis
leaky transform (Figure II.2).
McKenzie (1972) reviewed critically this first model and discussed for the first time the
stability of the ATJ. His model is very similar to that of Krause and Watkins as it
considers an evolution of the ATJ from an initial RFF configuration originated at the
junction of the MAR with the EAFZ. Northward migration along the MAR of this triple
junction would result in the formation of two oblique spreading centers and a RRR type
triple junction (Figure II.3a). He considered that the Triple Junction is stable through
time provided that all three branches would spread obliquely. Contrary to the previous
one, this model precludes change in the spreading direction but as noted by McKenzie
(1972), it would imply a tendency for the ATJ to migrate northward.
Figure II.2 – Sketch depicting the evolution of the Azores Triple Junction proposed by Krause and Watkins (1970). Arrows indicate plate spreading directions.
16
Tectono-Magmatic Processes in the Azores Triple Junction
Both models imply the existence of a triangular domain of Azores topography with apex
on the triple Junction, bisected by the Terceira axis. The present knowledge of the
Azores plateau as we shall discuss in up-coming sections, its morpho-structural and the
magnetic anomalies patterns and the kinematic conditions which subsisted through time
allow us to refute this models as un-realistic
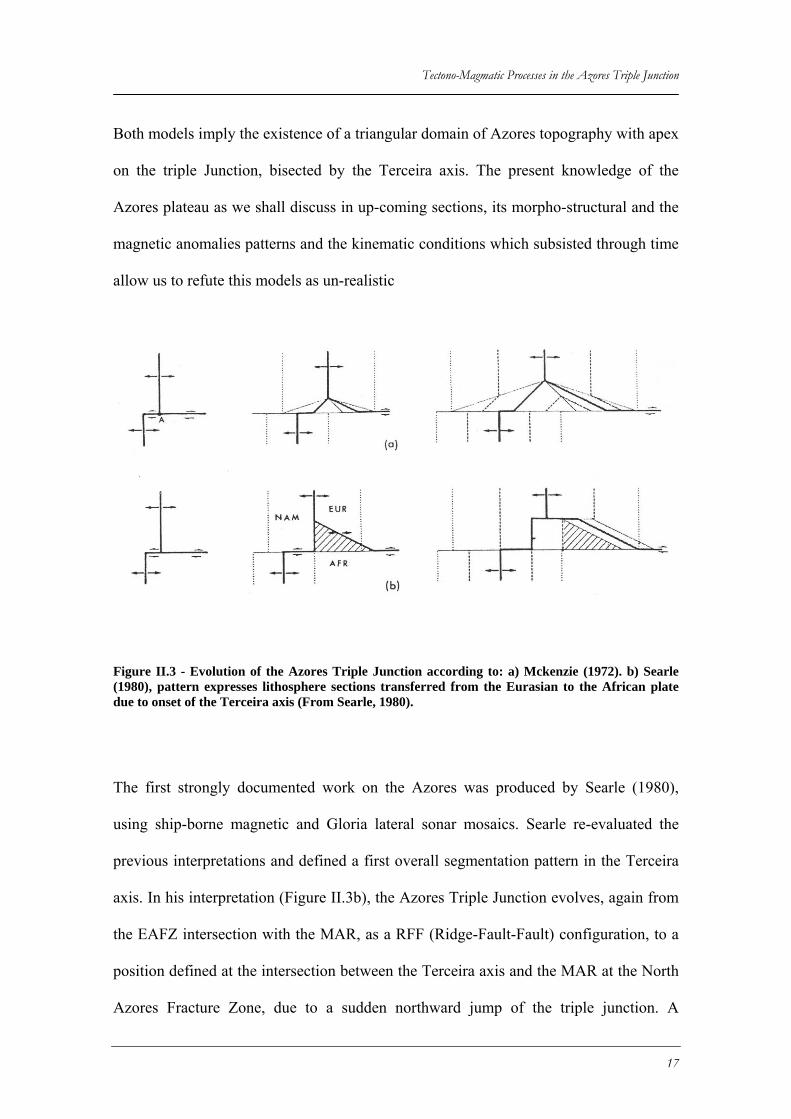
Figure II.3 - Evolution of the Azores Triple Junction according to: a) Mckenzie (1972). b) Searle (1980), pattern expresses lithosphere sections transferred from the Eurasian to the African plate due to onset of the Terceira axis (From Searle, 1980).
The first strongly documented work on the Azores was produced by Searle (1980),
using ship-borne magnetic and Gloria lateral sonar mosaics. Searle re-evaluated the
previous interpretations and defined a first overall segmentation pattern in the Terceira
axis. In his interpretation (Figure II.3b), the Azores Triple Junction evolves, again from
the EAFZ intersection with the MAR, as a RFF (Ridge-Fault-Fault) configuration, to a
position defined at the intersection between the Terceira axis and the MAR at the North
Azores Fracture Zone, due to a sudden northward jump of the triple junction. A
17
Chapter II –Review of the kinematic models for the ATJ and AHS triangular section of previous Eurasian generated lithosphere would than be truncated
by Terceira axis generation and transferred to the African plate..
Searle (1980) was however renitent in assuming the present ATJ position on the NAFZ,
on grounds of the orientation of this Fracture zone with respect to predicted directions
of opening between Eurasian and African plates (closer to ca. N58º), and does not
exclude, considering the tectonic fabric interpreted from the sonar images and the recent
volcanic activity, that the Triple Junction could be located further south around 38º 40’
N in the region west of Faial. He further considered the Terceira axis as a spreading
center but does not exclude the possibility, given the numerous linear ridges running
sub-parallel to the Terceira axis, that true seafloor spreading generating Azores crust
could be limited and the Azores would therefore represent a rift zone with a high
complex architecture resulting from a mélange of crust generated previously at the
MAR predated by Azores generated crust possibly along pre-existing tectonic
structures.
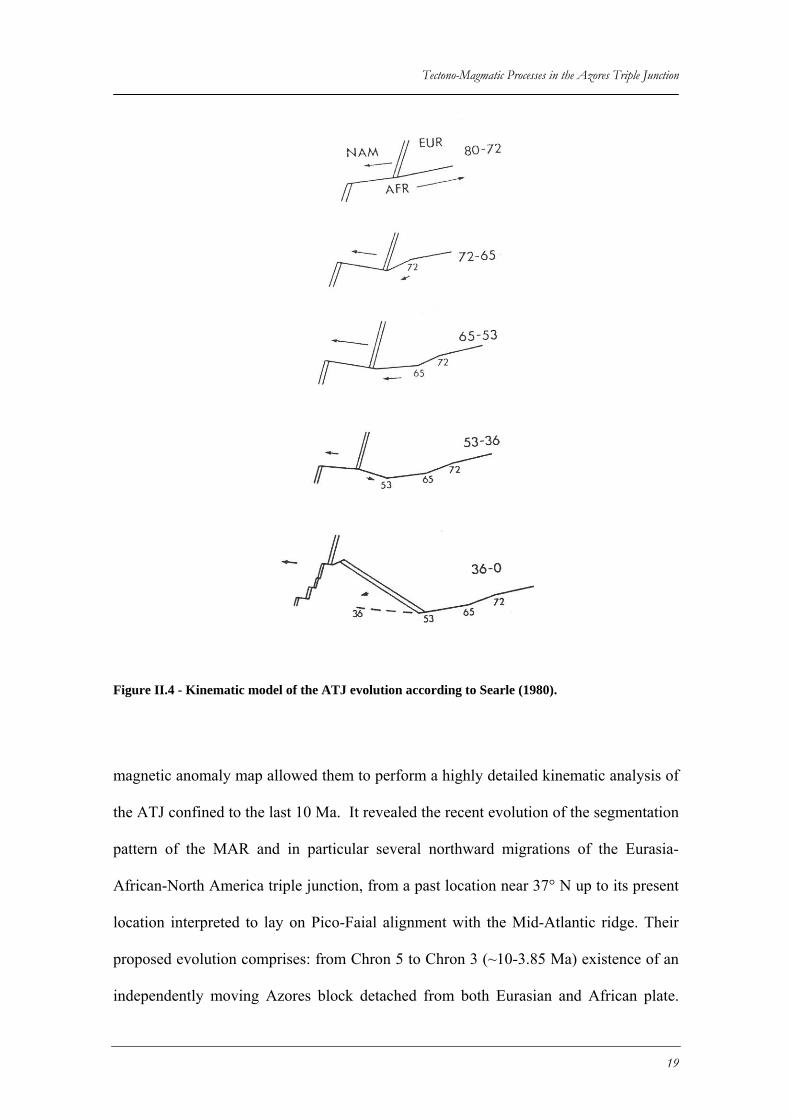
Finally, an assumption is made by this author concerning the age of the Triple junction
migration and beginning of the Terceira axis. By extrapolating the calculated spreading
of ca 3 mmyr-1 to the width of the spreading center (along the spreading direction), he
reaches an age of 55 Myr as an upper bound, although he assumes 36 Myr as more
realistic age for the generation of the Terceira axis, as a result of changes between the
African and Eurasian plates relative movement (Figure II.4).
II.2.3 The ATJ in the last 10 Ma: fine scale evolution of Triple Junction
Luís et al. (1994) and Luis (1996) presented a new Azores plateau aeromagnetic chart
with a much higher level of definition than previous ones (cf. Figure II.5). This new
18
Tectono-Magmatic Processes in the Azores Triple Junction
Figure II.4 - Kinematic model of the ATJ evolution according to Searle (1980).
magnetic anomaly map allowed them to perform a highly detailed kinematic analysis of
the ATJ confined to the last 10 Ma. It revealed the recent evolution of the segmentation
pattern of the MAR and in particular several northward migrations of the Eurasia-
African-North America triple junction, from a past location near 37° N up to its present
location interpreted to lay on Pico-Faial alignment with the Mid-Atlantic ridge. Their
proposed evolution comprises: from Chron 5 to Chron 3 (~10-3.85 Ma) existence of an
independently moving Azores block detached from both Eurasian and African plate.
19
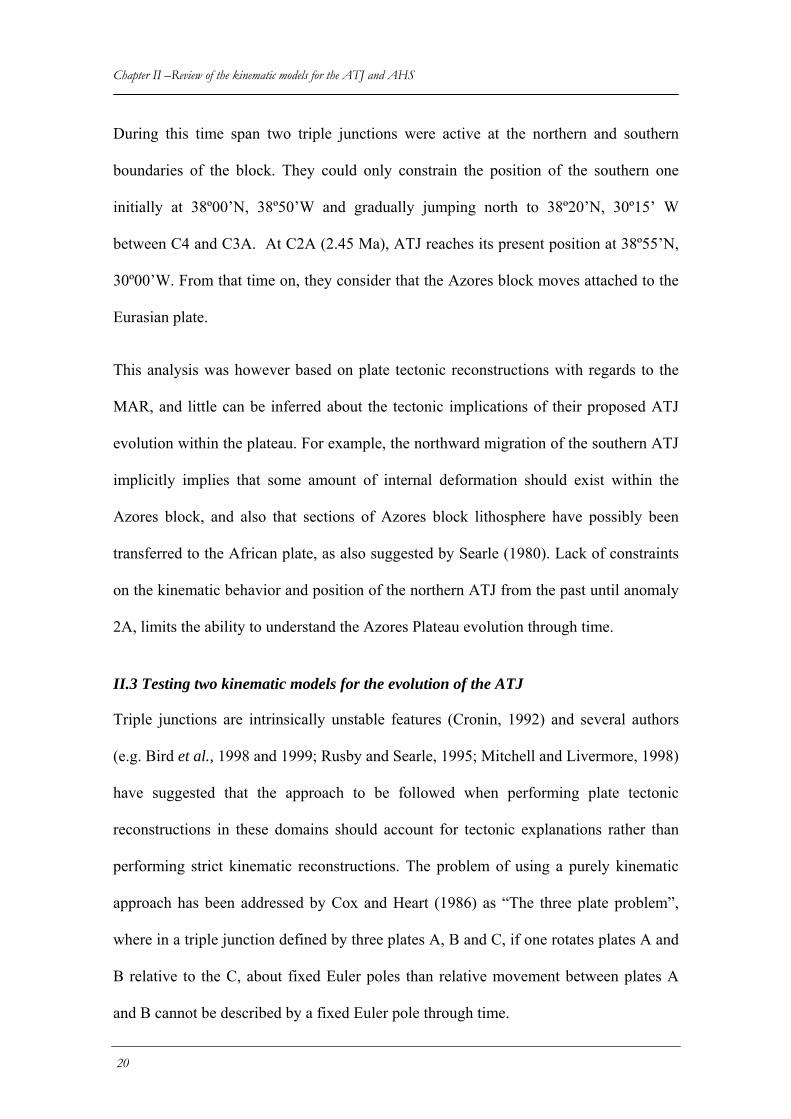
Chapter II –Review of the kinematic models for the ATJ and AHS During this time span two triple junctions were active at the northern and southern
boundaries of the block. They could only constrain the position of the southern one
initially at 38º00’N, 38º50’W and gradually jumping north to 38º20’N, 30º15’ W
between C4 and C3A. At C2A (2.45 Ma), ATJ reaches its present position at 38º55’N,
30º00’W. From that time on, they consider that the Azores block moves attached to the
Eurasian plate.
This analysis was however based on plate tectonic reconstructions with regards to the
MAR, and little can be inferred about the tectonic implications of their proposed ATJ
evolution within the plateau. For example, the northward migration of the southern ATJ
implicitly implies that some amount of internal deformation should exist within the
Azores block, and also that sections of Azores block lithosphere have possibly been
transferred to the African plate, as also suggested by Searle (1980). Lack of constraints
on the kinematic behavior and position of the northern ATJ from the past until anomaly
2A, limits the ability to understand the Azores Plateau evolution through time.
II.3 Testing two kinematic models for the evolution of the ATJ
Triple junctions are intrinsically unstable features (Cronin, 1992) and several authors
(e.g. Bird et al., 1998 and 1999; Rusby and Searle, 1995; Mitchell and Livermore, 1998)
have suggested that the approach to be followed when performing plate tectonic
reconstructions in these domains should account for tectonic explanations rather than
performing strict kinematic reconstructions. The problem of using a purely kinematic
approach has been addressed by Cox and Heart (1986) as “The three plate problem”,
where in a triple junction defined by three plates A, B and C, if one rotates plates A and
B relative to the C, about fixed Euler poles than relative movement between plates A
and B cannot be described by a fixed Euler pole through time.
20
Tectono-Magmatic Processes in the Azores Triple Junction
Figure II.5 - Schematic model of the Azores Triple Junction according to Luis et al., (1994) from anomaly 5 to the present. The axis is marked by the heavy line. The arrows represent the velocity of the Azores and Africa relative to North American Plate. AF-Africa; Ac – Azores; AM – America; EU – Eurasia; EAFZ – East Azores Fracture Zone, PFZ – Pico Fracture Zone; PAFZ – Princess Alice Fracture Zone; AFZ – Açor Fracture Zone; FFZ – Faial Fracture Zone; NAFZ – North Azores fracture Zone.
The attempt to resolve the different positions of the ATJ and the configuration of the
EU/AF plate boundary through time in the Azores using kinematic models has two
additional obstacles linked with the intrinsic nature of the plateau and provided by the
unstable triple junction configuration of this domain:
1. The EU/AF (or EU/NUB) plate boundary, with some exceptions around Terceira
axis, does not provide a coherent pattern of seafloor magnetic anomalies, thus not
providing consistent isochrones for plate tectonic reconstructions;
21
Chapter II –Review of the kinematic models for the ATJ and AHS 2. There are no clear transform faults across the Azores plateau that can provide plate
spreading direction constraints through time.
Here, we use the isochrons from Luis et al. (1996) and Canpam (1995) to check the
consistency of plate reconstructions and the validity of kinematic models presented in
section II.2.2. We consider specifically their underlying hypothesis that Pico is the N.
American plate structural analogue of the EAFZ, which, as presented previously, is
generally assumed as the plate boundary between EU and AF from times prior to at
least anomaly 6 in those models.
Anomaly picks from these authors complement each other. Canpam (1995) picked
anomalies covering a wider region from the Northern and Central Atlantic, whereas
Luis et al., (1994) and Luis (1996) chrons were retrieved from a denser aero-magnetic
map centred on the Azores region and therefore allowing a more detailed analysis of
this region. Magnetic anomalies selected for this approach are C13 (33.4 Ma), C6 (20.1
Ma), C5 (9.8 Ma) on all three plates. The magnetic time scale is from Cande and Kent
(1995). Their anomalies are displayed in Figure II.6.
The figure reveals that magnetic anomaly picks display a rather close pattern with the
exception of anomaly C13. Due to higher resolution of the aero-magnetic chart in the
Azores area, Luis was able to trace within the plateau, a trail of points for anomalies C5
and C6. Canpam does not consider any anomalies within the plateau and only traces
them to the intersection with the Terceira axis to the north and with the EAFZ to the
south. The definition of anomalies south of the Pico F.Z and in the African plate is
sparse due to very poor quality of existing magnetic data and the fit between both
authors is poor probably due to the magnetic time scale choosen.
22
Tectono-Magmatic Processes in the Azores Triple Junction
23
Figure II.6 - Magnetic anomaly map of Luis et al. (1996). Magnetic anomalies from Luis et al., 1994 are represented by circles, and those of Canpam et al., (1995) by triangles. The Azores Plateau 2500 m bathymetric contour and the outline of main morpho-tectonic features are also presented for reference as solid black lines.
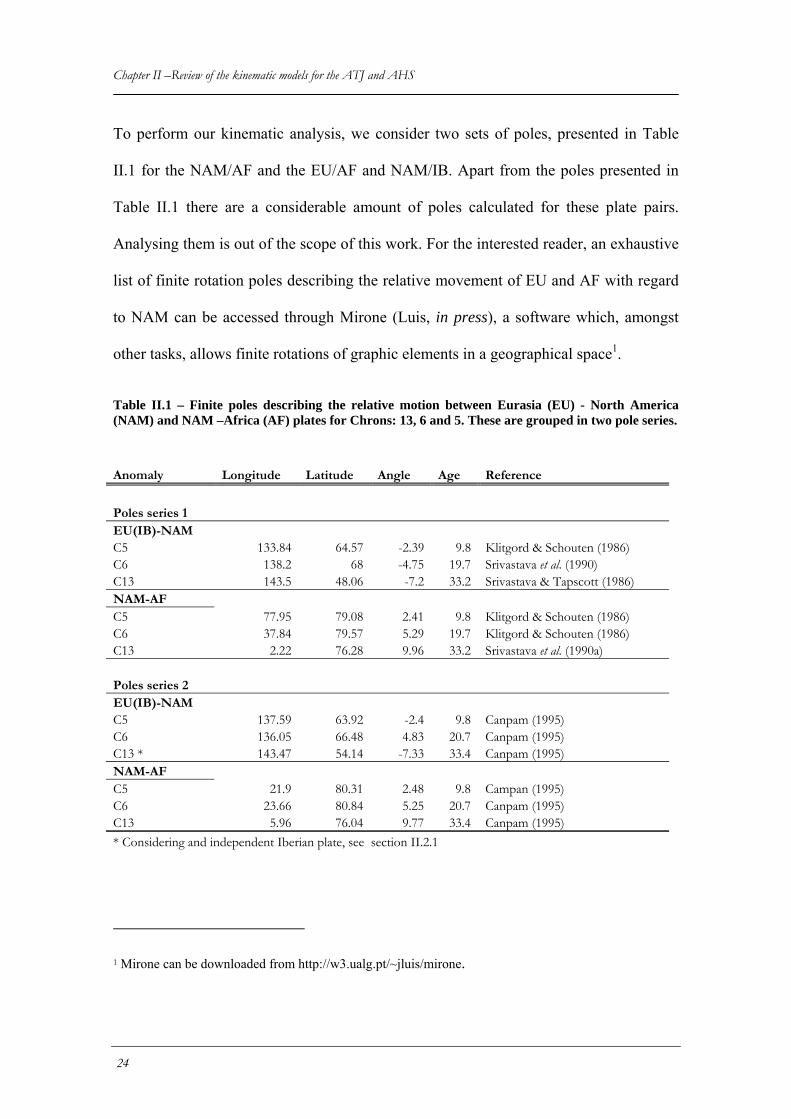
Chapter II –Review of the kinematic models for the ATJ and AHS To perform our kinematic analysis, we consider two sets of poles, presented in Table
II.1 for the NAM/AF and the EU/AF and NAM/IB. Apart from the poles presented in
Table II.1 there are a considerable amount of poles calculated for these plate pairs.
Analysing them is out of the scope of this work. For the interested reader, an exhaustive
list of finite rotation poles describing the relative movement of EU and AF with regard
to NAM can be accessed through Mirone (Luis, in press), a software which, amongst
other tasks, allows finite rotations of graphic elements in a geographical space1.
Table II.1 – Finite poles describing the relative motion between Eurasia (EU) - North America (NAM) and NAM –Africa (AF) plates for Chrons: 13, 6 and 5. These are grouped in two pole series.
Anomaly Longitude Latitude Angle Age Reference
Poles series 1 EU(IB)-NAM C5 133.84 64.57 -2.39 9.8 Klitgord & Schouten (1986) C6 138.2 68 -4.75 19.7 Srivastava et al. (1990) C13 143.5 48.06 -7.2 33.2 Srivastava & Tapscott (1986) NAM-AF C5 77.95 79.08 2.41 9.8 Klitgord & Schouten (1986) C6 37.84 79.57 5.29 19.7 Klitgord & Schouten (1986) C13 2.22 76.28 9.96 33.2 Srivastava et al. (1990a) Poles series 2 EU(IB)-NAM C5 137.59 63.92 -2.4 9.8 Canpam (1995) C6 136.05 66.48 4.83 20.7 Canpam (1995) C13 * 143.47 54.14 -7.33 33.4 Canpam (1995) NAM-AF C5 21.9 80.31 2.48 9.8 Campan (1995) C6 23.66 80.84 5.25 20.7 Canpam (1995) C13 5.96 76.04 9.77 33.4 Canpam (1995) * Considering and independent Iberian plate, see section II.2.1
1 Mirone can be downloaded from http://w3.ualg.pt/~jluis/mirone.
24
Tectono-Magmatic Processes in the Azores Triple Junction
II.3.1 Constraints provided by stage pole rotations
The method of describing the relative motion between Eurasian and Nubia plates
consists on the estimation of rotation parameters between these two plate pairs, by
studying their relative movement to the NAM plate. Finite rotation poles between
African (AF) and Eurasia (EU) can therefore be calculated by:
AFROT EU (t) = AFROTNA(t)+NAROTEU(t) (II.1)
Where AROTB(t) is the rotational parameters (latitude, longitude and angle) of the finite
rotation of plate A relative to plate B for a given time (t).
Stage poles (describing plates relative movement between time intervals), can, on the
other hand, be calculated by finite rotations as below.
EUROTAF (C6-0) + EUROTAFR(0-C5) =EUROTAF(C6-C5) (II.2)
Stage poles are here used to provide an assessment of the tectonic regimes acting on the
Azores plateau during discrete time intervals. This is achieved by rotating a set of
elements from their expected initial locations at the oldest time considered and trace
their circuit from that initial time to the present. One should bear in mind that the vector
for each time interval only provides an integral measurement of the total displacement
and not the incremental path within the time interval under consideration.
To perform this analysis we calculated the stage poles using equations (1) and (2) for set
of poles 1 and we also used stage poles calculated by Canpam (1995) from her finite
rotations poles. The resulting stage poles are presented in Table II.2.
25
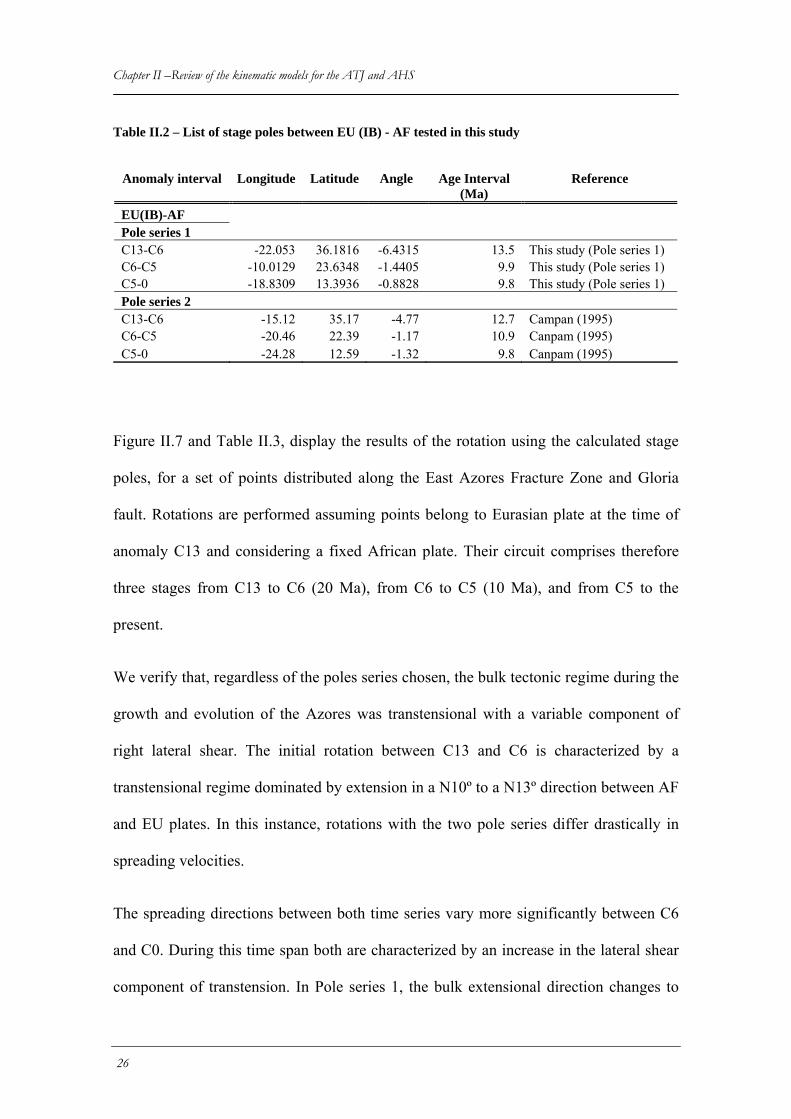
Chapter II –Review of the kinematic models for the ATJ and AHS Table II.2 – List of stage poles between EU (IB) - AF tested in this study
Anomaly interval Longitude Latitude Angle Age Interval
(Ma) Reference
EU(IB)-AF Pole series 1 C13-C6 -22.053 36.1816 -6.4315 13.5 This study (Pole series 1) C6-C5 -10.0129 23.6348 -1.4405 9.9 This study (Pole series 1) C5-0 -18.8309 13.3936 -0.8828 9.8 This study (Pole series 1) Pole series 2 C13-C6 -15.12 35.17 -4.77 12.7 Campan (1995) C6-C5 -20.46 22.39 -1.17 10.9 Canpam (1995) C5-0 -24.28 12.59 -1.32 9.8 Canpam (1995)
Figure II.7 and Table II.3, display the results of the rotation using the calculated stage
poles, for a set of points distributed along the East Azores Fracture Zone and Gloria
fault. Rotations are performed assuming points belong to Eurasian plate at the time of
anomaly C13 and considering a fixed African plate. Their circuit comprises therefore
three stages from C13 to C6 (20 Ma), from C6 to C5 (10 Ma), and from C5 to the
present.
We verify that, regardless of the poles series chosen, the bulk tectonic regime during the
growth and evolution of the Azores was transtensional with a variable component of
right lateral shear. The initial rotation between C13 and C6 is characterized by a
transtensional regime dominated by extension in a N10º to a N13º direction between AF
and EU plates. In this instance, rotations with the two pole series differ drastically in
spreading velocities.
The spreading directions between both time series vary more significantly between C6
and C0. During this time span both are characterized by an increase in the lateral shear
component of transtension. In Pole series 1, the bulk extensional direction changes to
26
Tectono-Magmatic Processes in the Azores Triple Junction
approximately SW-NE between C6 and C5, and then to WSW-ENE from C5 to the
present. These later spreading directions are very similar to that retrievable form
NUVEL1A for AF/EU, which vary between N65º to N70º from West to East across the
plateau (DeMets et al., 1994). Pole series 2 rotates from WSW-ENE to a nearly E-W
spreading direction therefore suggesting a more oblique spreading with respect to the
strike of the main plateau morphological features. The spreading direction predicted by
the stage poles series 2 between C5 and C0 is very similar to the present day spreading
direction retrieved from global and regional geodetic models based solely on GPS
observations like the Revel2000 (Sella et al., 2002) and Deos2K (Fernandes et al., 2006,
see also chapter IV).
Considering the orientation of small wavelength relief generation like the linear
volcanic ridges and assuming that they were formed in a context of pure traction, then
the possible timings for their generation can be constrained by kinematic scenarios
outlined in Figure II.7 and Table II.3.
From C13 and C6, considering Pole Series 1, the optimally oriented structures for pure
shear extension within the Azores domain are the EAFZ and some significant linear
features such as the linear volcanic ridge trending E-W between 25º30’W and 26º30’W
at the latitude of Terceira Island and the E-W elongated plateau which culminates in the
S. Miguel Island (Figure II.7). The orientation of these structures supports the
consideration that their growth is controlled by pré-existing FZ (Guest et al., 1999).
Their favorable orientation with respect to direction of extension during that time span,
could have promoted FZ reactivation and extension. Other E-W south facing
morphological steps between flat horizontal, probably highly sedimented terraces at ca.
38ºN between 26ºW and 27º30’W, might have been favored in the same time interval.
27
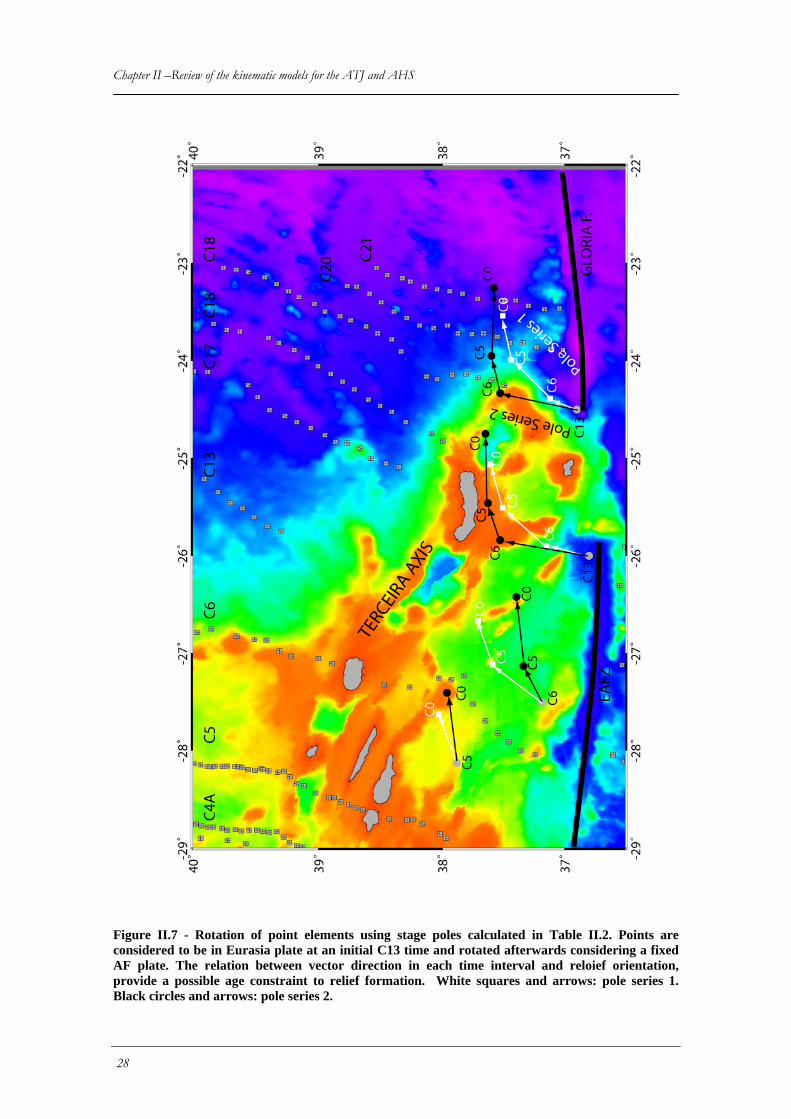
Chapter II –Review of the kinematic models for the ATJ and AHS
Figure II.7 - Rotation of point elements using stage poles calculated in Table II.2. Points are considered to be in Eurasia plate at an initial C13 time and rotated afterwards considering a fixed AF plate. The relation between vector direction in each time interval and reloief orientation, provide a possible age constraint to relief formation. White squares and arrows: pole series 1. Black circles and arrows: pole series 2.
28
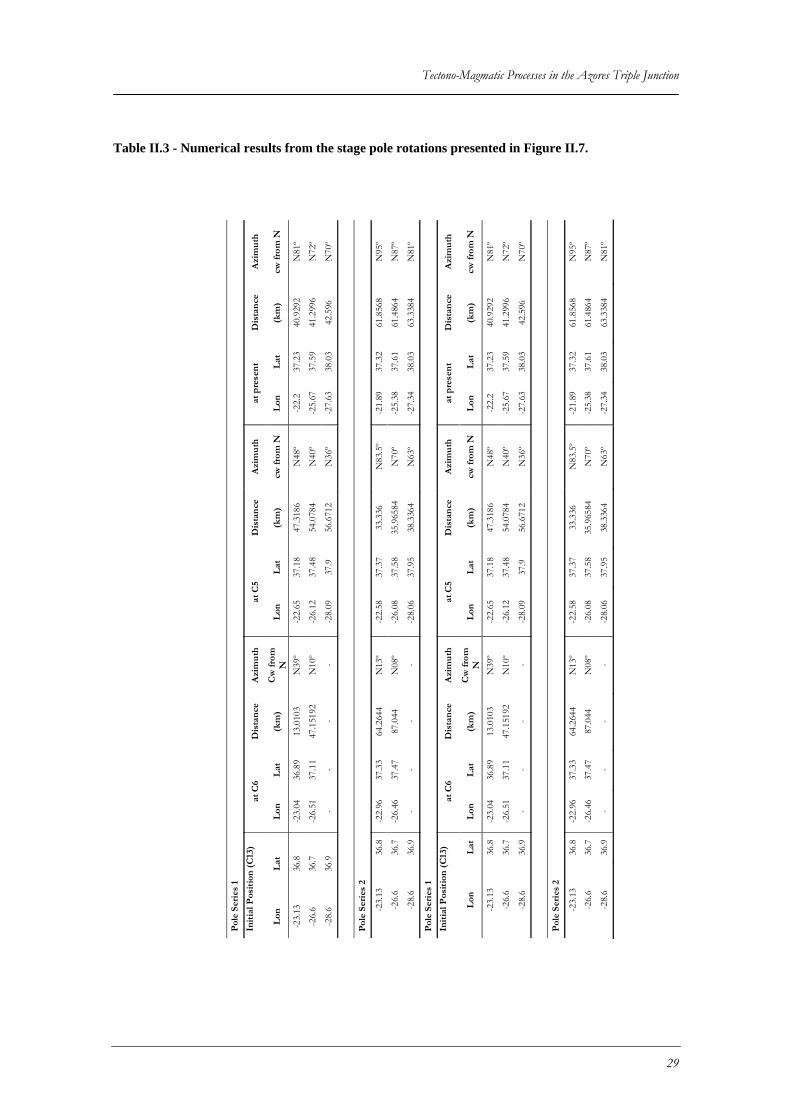
Tectono-Magmatic Processes in the Azores Triple Junction
Table II.3 - Numerical results from the stage pole rotations presented in Figure II.7.
Pol
e S
erie
s 1
Init
ial P
osit
ion
(C
13)
at
C6
Dis
tan
ce
Azi
mu
th
at C
5 D
ista
nce
A
zim
uth
at
pre
sen
t D
ista
nce
A
zim
uth
Lon
L
at
Lon
L
at
(km
) C
w f
rom
N
L
on
Lat
(k
m)
cw fr
om N
L
on
Lat
(k
m)
cw f
rom
N
-23.
13
36.8
-2
3.04
36
.89
13.0
103
N39
º -2
2.65
37
.18
47.3
186
N48
º -2
2.2
37.2
3 40
.929
2 N
81º
-26.
6 36
.7
-26.
51
37.1
1 47
.151
92
N10
º -2
6.12
37
.48
54.0
784
N40
º -2
5.67
37
.59
41.2
996
N72
º
-28.
6 36
.9
- -
- -
-28.
09
37.9
56
.671
2 N
36º
-27.
63
38.0
3 42
.596
N
70º
Pol
e S
erie
s 2
-23.
13
36.8
-2
2.96
37
.33
64.2
644
N13
º -2
2.58
37
.37
33.3
36
N83
.5º
-21.
89
37.3
2 61
.856
8 N
95º
-26.
6 36
.7
-26.
46
37.4
7 87
.044
N
08º
-26.
08
37.5
8 35
.965
84
N70
º -2
5.38
37
.61
61.4
864
N87
º
-28.
6 36
.9
- -
- -
-28.
06
37.9
5 38
.336
4 N
63º
-27.
34
38.0
3 63
.338
4 N
81º
Pol
e S
erie
s 1
Init
ial P
osit
ion
(C
13)
at
C6
Dis
tan
ce
Azi
mu
th
at C
5 D
ista
nce
A
zim
uth
at
pre
sen
t D
ista
nce
A
zim
uth
Lon
L
at
Lon
L
at
(km
) C
w f
rom
N
L
on
Lat
(k
m)
cw fr
om N
L
on
Lat
(k
m)
cw f
rom
N
-23.
13
36.8
-2
3.04
36
.89
13.0
103
N39
º -2
2.65
37
.18
47.3
186
N48
º -2
2.2
37.2
3 40
.929
2 N
81º
-26.
6 36
.7
-26.
51
37.1
1 47
.151
92
N10
º -2
6.12
37
.48
54.0
784
N40
º -2
5.67
37
.59
41.2
996
N72
º
-28.
6 36
.9
- -
- -
-28.
09
37.9
56
.671
2 N
36º
-27.
63
38.0
3 42
.596
N
70º
Pol
e S
erie
s 2
-23.
13
36.8
-2
2.96
37
.33
64.2
644
N13
º -2
2.58
37
.37
33.3
36
N83
.5º
-21.
89
37.3
2 61
.856
8 N
95º
-26.
6 36
.7
-26.
46
37.4
7 87
.044
N
08º
-26.
08
37.5
8 35
.965
84
N70
º -2
5.38
37
.61
61.4
864
N87
º
-28.
6 36
.9
- -
- -
-28.
06
37.9
5 38
.336
4 N
63º
-27.
34
38.0
3 63
.338
4 N
81º
29
Chapter II –Review of the kinematic models for the ATJ and AHS The remaining orientations of the linear volcanic ridges in the central sector of the
Plateau do not fit this pattern of fracture zone reactivation and their generation can be
linked to the migration northwards of the Triple junction as discussed. Stage poles from
both time series and corresponding extension directions favor their generation at a time
younger than 20 Ma.
The linear volcanic ridges in the plateau western sector (corresponding to the Central
group Islands of Pico-Faial and S. Jorge), considering their orientations, may again
result from reactivation of some Fracture Zone sections, their growth as magmatic
systems is favoured between anomaly 6 and 5, taking Poles Series 1 or in right lateral
transtensional considering Poles series 2. As we shall see later on (in chapter VII), to
some extent, magmatic growth of these structures can be considered irrespective of far-
field stresses, and more conditioned by local circumstances such as internal magma
pressure, and magma migration mechanisms.
II.3.2 Is the Pico FZ the structural homologue of the EAFZ?
The approach from previous section does not allow constraining the position of the ATJ
for a given time, as the chosen points used for rotation with the stage poles have
arbitrary positions with respect to the plate boundary for that time. They only provide a
measure of expectable plate boundary tectonic behavior. To constraint the position of
the ATJ at specific time intervals, we performed finite rotations between morpho-
tectonic elements and isochrones using the two poles series presented in table II.1. Plate
tectonic reconstructions were performed aiming at verification of the hypothesis that
Pico and EAFZ are structurally homologue structures.
30
Tectono-Magmatic Processes in the Azores Triple Junction
If one considers that the ATJ was located at the EAFZ-Pico FZ at the times C13 (33
Ma) and C6 (20 Ma), and that depart of the ATJ from this position has started in a
younger age, than the finite rotation of the points marking the intersection of each chron
with the Pico F.Z from the American plate with NAM-EU and NAM-AF finite poles
should plot over the position (in present coordinates) of the EAFZ. The results of this
approach are presented in Figures II.8 and II.9.
These reveal a large misfit and a poor closure of the ATJ at each time interval
considered. For example at C13 time (33.4 Ma), the misfit in the position between
stable EU/NAM and stable AF/NAM finite rotations of the equivalent point in the N.
American Plate is of ca. 87 km using poles from series 1. Considering poles from series
2 the misfit is larger, ca. 146 km. Even if we consider the mismatch in the overlap
between Canpam magnetic anomaly picks of C13NAM with respect to C13EU after
finite rotation (about 73 km), the resulting misfit in Pico F.Z with respect to EAFZ
would still be in the order of 73 km.
These misfits between the Pico FZ and the EAFZ in present day coordinates observed in
both Figures II.8 and II.9, regardless of the kinematic model chosen as a reference;
imply that, no simple kinematic closure of the three plates at the ATJ can be achieved.
Poles in series 1 and 2, perform relatively well in fitting the Pico FZ to the EAFZ after
rotation, when using NAM/AF poles. Therefore, EAFZ migth have acted as a plate
boundary fault between the northern limit of stable AF and the Azores domain. We shall
refer to this limit from now on as the SATJ (Southern Azores Triple Junction).
31
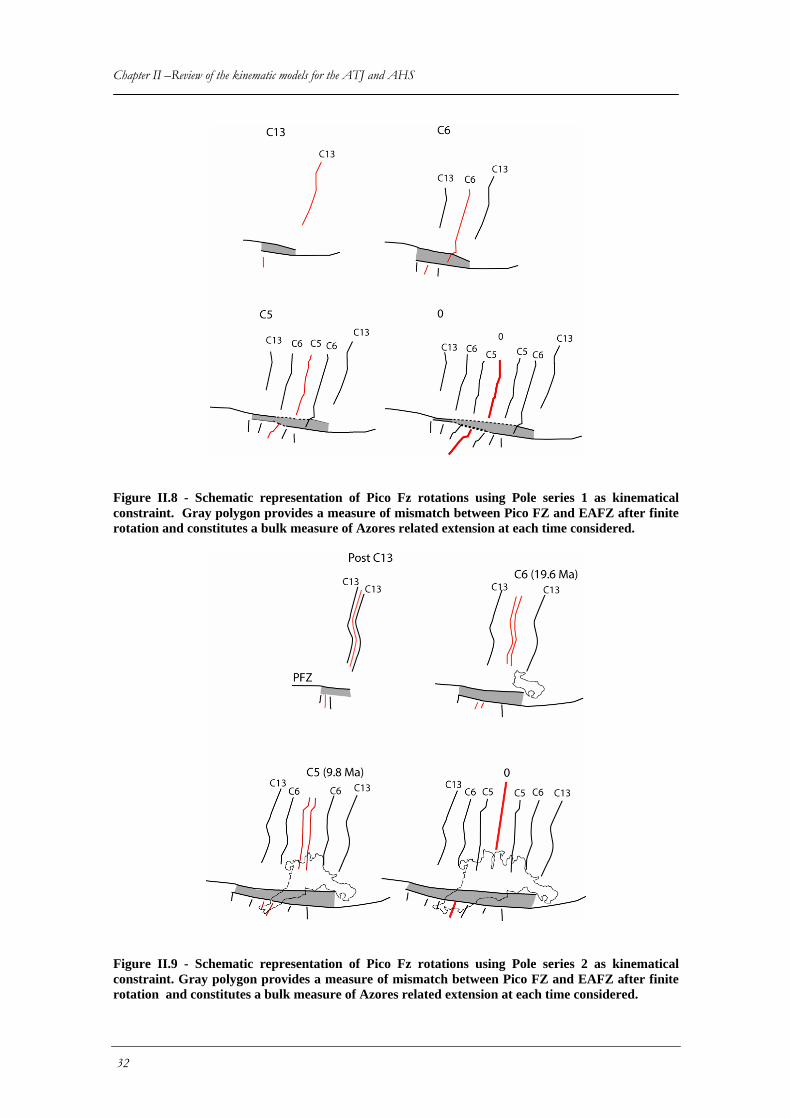
Chapter II –Review of the kinematic models for the ATJ and AHS
Figure II.8 - Schematic representation of Pico Fz rotations using Pole series 1 as kinematical constraint. Gray polygon provides a measure of mismatch between Pico FZ and EAFZ after finite rotation and constitutes a bulk measure of Azores related extension at each time considered.
Figure II.9 - Schematic representation of Pico Fz rotations using Pole series 2 as kinematical constraint. Gray polygon provides a measure of mismatch between Pico FZ and EAFZ after finite rotation and constitutes a bulk measure of Azores related extension at each time considered.
32
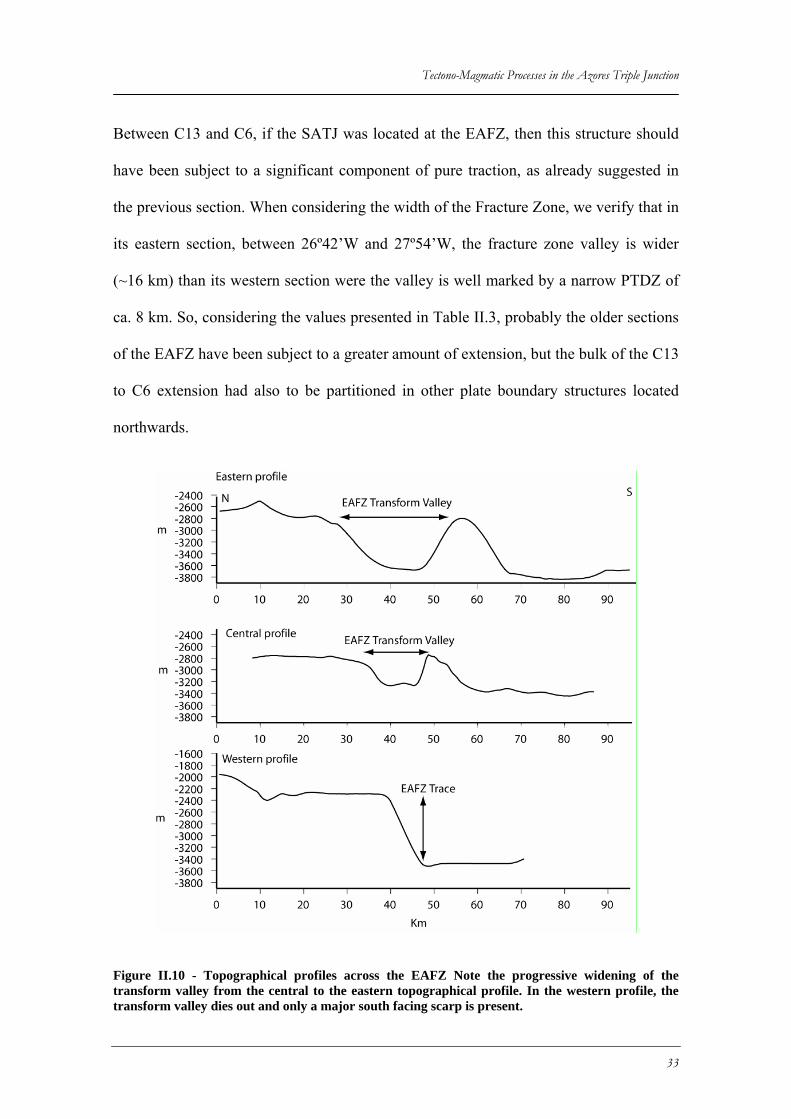
Tectono-Magmatic Processes in the Azores Triple Junction
Between C13 and C6, if the SATJ was located at the EAFZ, then this structure should
have been subject to a significant component of pure traction, as already suggested in
the previous section. When considering the width of the Fracture Zone, we verify that in
its eastern section, between 26º42’W and 27º54’W, the fracture zone valley is wider
(~16 km) than its western section were the valley is well marked by a narrow PTDZ of
ca. 8 km. So, considering the values presented in Table II.3, probably the older sections
of the EAFZ have been subject to a greater amount of extension, but the bulk of the C13
to C6 extension had also to be partitioned in other plate boundary structures located
northwards.
Figure II.10 - Topographical profiles across the EAFZ Note the progressive widening of the transform valley from the central to the eastern topographical profile. In the western profile, the transform valley dies out and only a major south facing scarp is present.
33
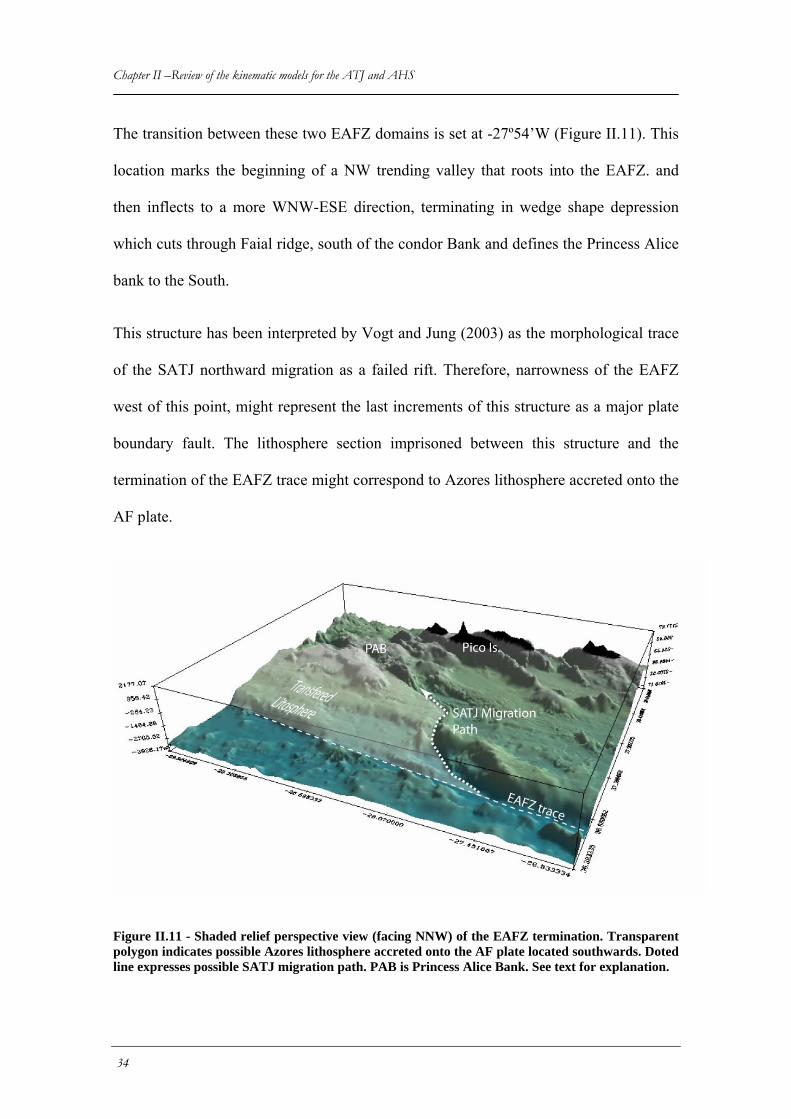
Chapter II –Review of the kinematic models for the ATJ and AHS The transition between these two EAFZ domains is set at -27º54’W (Figure II.11). This
location marks the beginning of a NW trending valley that roots into the EAFZ. and
then inflects to a more WNW-ESE direction, terminating in wedge shape depression
which cuts through Faial ridge, south of the condor Bank and defines the Princess Alice
bank to the South.
This structure has been interpreted by Vogt and Jung (2003) as the morphological trace
of the SATJ northward migration as a failed rift. Therefore, narrowness of the EAFZ
west of this point, might represent the last increments of this structure as a major plate
boundary fault. The lithosphere section imprisoned between this structure and the
termination of the EAFZ trace might correspond to Azores lithosphere accreted onto the
AF plate.
Figure II.11 - Shaded relief perspective view (facing NNW) of the EAFZ termination. Transparent polygon indicates possible Azores lithosphere accreted onto the AF plate located southwards. Doted line expresses possible SATJ migration path. PAB is Princess Alice Bank. See text for explanation.
34
Tectono-Magmatic Processes in the Azores Triple Junction
Following an analogue procedure, we constrained the northern plate boundary between
a stable Eurasian plate and the Azores domain by rotation of Pico FZ about NAM/EU
finite Euler poles. Upon rotation, its position is to northerly with respect to the EAFZ.
At C13, it lies in a point at the junction between the N-S striking Monaco Bank and the
Western tip of S. Miguel Island. At C6, it lies in a point ca. 38º N 27º W, which pins a
clear change in attitude of magnetic anomaly C6 from NNW-SSE to NNE-SSW as
picked by Luis et al. (Figure II.6).
By analogy to the SATJ, the trace of rotated Pico using NAM-EU finite rotation poles
tying this points is considered here as representative of the southern border of a
kinematically stable Eurasian plate, and will be referred to as the NATJ – (Northern
Azores Triple Junction).
The southern limit of a stable Eurasian plate, lying south of the Terceira axis, given the
positions of rotated elements referred to above, cannot be linked to any clear first order
morpho-tectonic signature in present day topography within the Azores plateau. This
has two implications: either the present day topography was shaped more recently,
possibly as a result of masking effects due to later tectono-magmatic events, or the
NATJ was never a discrete feature during the all time span, but rather corresponded to a
zone of distributed deformation.
The broad lens resulting from the mismatches in the ATJ closure (cf. Figure II.8 and
II.9) provides an integral measure of Azores deformation during the ATJ evolution from
33.4 Ma to the onset of the SATJ migration, and leads to the hypothesis that an Azores
domain, with a kinematic behavior independent of the two neighboring larger plates, has
subsisted at least from anomaly 13 to anomaly 5 when EAFZ ceases its activity.
35
Chapter II –Review of the kinematic models for the ATJ and AHS Moreover, as at C13 no ATJ closure can be achieved, right lateral transtension within
this plate boundary surely started prior to this age.
It remains unclear if the response to this deformation in the EU/AF plate boundary was
accommodated solely at the Mid-Atlantic ridge, for example by the re-arrangement of
the segmentation pattern, with possible growth of segments, by re-orientation of
existing ones and break-up of new non-transform discontinuities of higher orders, which
would ultimately lead to geometrical repositioning of the MAR axis. If this has been the
case, then the independent Azores domain grew solely from ridge dynamics and
therefore some equivalent offaxis signature should be traceable in the North American
plate. Lack of definition in existing data does not allow at present the verification of this
hypothesis.
Another possibility can be considered: if Azores domain generation has resulted from
tectonic-magmatic processes at the EU/AF plate boundary itself in the MAR off-axis
domain. This could be achieved, for instance as re-activation of fracture zones as leaky
structures or as formation of new fault zones within the active plate boundary domain.
In this case, instability and northward migration of both Azores domain northern and
southern limits would result from an intra-transform context, such as in some pacific
micro-plates like Easter, Galapagos and Juan Fernandez (Bird et al.,1998; Bird et al.,
1999; Naar and Hey, 1991), as a tectonic response to ruling kinematics conditions for
each time interval. The morphological evidences for the SATJ migration from the
EAFZ, favor this second hypothesis; even so, some of the SATJ and NATJ dynamics
through time can be accounted from magmatic pulses resulting from AHS activity as we
shall refer to below in section II.4.
36
Tectono-Magmatic Processes in the Azores Triple Junction
II.4 The Azores Hotspot
In the previous section, we considered the behavior of the ATJ along the time. We shall
now consider the different models describing the nature and dynamics of the AHS and
later we will address how they do mutually fit in.
In a time where there is a ongoing strong scientific community debate for or against
mantle plume dynamics, relevance of mantle convection vs. plate tectonic controls,
possible degrees of interaction with overlaying tectonic plates and even if plumes do
exist at all (see for details www.mantleplumes.org), it is relevant to recall that the AHS
remains a controversial topic in scientific literature.
The nature and dynamics of this mantle surge and the variations of the magma flux to
the plateau is of key importance to understand the Azores geodynamic evolution and to
constrain issues such as: 1) existence and style of hot spot trace paths across the
plateau; 2) present day position and area extent of the AHS; 3) Spatial-temporal
distribution of magma generation and constraints on the age of the plateau, its inner
structures and the Azores Archipelago Islands; 4) degree of interaction with the Azores
Triple Junction evolution through time, and therefore 5) relation with past and present
plate boundary configuration between Eurasian and Nubian plates, current location and
tectonic style of the Azores Triple Junction. Many of these points remain controversial
or unanswered, even between those who share favorable views on the Azores mantle
plume existence.
One point which remains nevertheless undisputed: the Azores volcanic platform results
from an excess in volcanism/magmatism. Accordingly, the crustal structure of the
Azores is equally anomalous (Escartin et al., 2001; Searle, 1976; Miranda et al., 1998;
37
Chapter II –Review of the kinematic models for the ATJ and AHS Matias, in press). Only the sub-lithospheric causes of this magmatic excess remain
controversial.
Numerous observations show evidence of an interaction between hot spots and Mid-
ocean ridges at various levels: a thermal interaction, resulting in more crust being
generated near hot spots, a geochemical interaction, implying a mixture of depleted
mantle sources feeding the mid-ocean ridges and enriched mantle sources of the hot
spot, and finally a dynamic interaction, responsible for the migration of second-order
segments away from the hot spots, and of an asymmetry of the accretion processes
(Müller, 1998; Hardarson et al., 1997, Small, 1995). Frequent observations of spreading
asymmetry and ridge jumps in sections of mid-ocean ridges close to hot spots suggest
that mantle flow from the hot spot may control the distribution of stresses in the
lithosphere above it (Ito et al., 2003; Mittelstaedt and Ito, 2005)
For the Azores case, available publications tend to address the evolution of the AHS and
ATJ as two independent realities, and little effort is made in the integration of their
common history. Yet, it is recognized unequivocally by the generality of the authors,
that both have interacted strongly at least from the past 20 Ma.
II.4.1 Nature of the Azores Hot-Spot (AHS)
The AHS has been interpreted in a diverse number of ways. The plateau bathymetric
anomaly is attributed as te outcome of activity from: a plume detached head (Silveira
and Stutzmann, 2002 and Silveira et al., 2006; Courtillot et al., 2003) a plume deeply
rooted in the lower mantle (Montelli et al., 2004) or with minor geochemical
contributions from it (Madureira et al., 2005); as a classical Hawain type hot-spot
(Gente et al, 2003), a wet spot (Schiling et al., 1975; Bonnati et al, 1990), an un-
38
Tectono-Magmatic Processes in the Azores Triple Junction
specified mantle anomaly (Mitchell et al., 2004); a plume related thermal/melt anomaly
(Escartin et al., 2001, Cannat et al., 1999), or finally refuted as a plume related
topographical expression (Anderson, 2001; Luis and Neves, 2006; Favela and
Anderson, 2000).
These discrepancies illustrate well the lack of scientific consensus with regard to this
region and the meaning of the processes which have acted upon it. One of the main
arguments favoring the AHS is its influence on the MAR, an effect which has been
relatively well studied (Schilling, 1985; Detrick et al., 1995; Bourdon et al., 1996;
Cannat et al., 1999; Escartin et al., 2001). The AHS- MAR interaction is expressed by
an asymmetrical bathymetric anomaly along axis extending from Kurtchakov FZ at 41º
N at least to the Hayes Fracture Zone (at ~33.5ºN) (Goslin et al., 1999), but it is
arguable that it extends further south to the Kanes F. Z. (at 24ºN) (Escartin et al.,
(2001). the MAR mid-valley is shallowest within the Azores. This bathymetry long
wave-length variation is consistent with other gradients such as gravity anomalies
(Detrick et al., 1995, Luis et al., 1998) and geochemical anomalies documented on
basalts both in the axial domain (Dosso et al., 1999, White et al., 1976) and in the off-
axis domain (Bougault et al., 1985).
All these long wavelength variations suggest either that the mantle is anomalously hot
and/or enriched (Cannat et al., 1999). Modeling of the effect of hot-spots on ridge
bathymetry and melt production is primarily a function of the plume flux (itself a
function of temperature and size of the plume head), mantle viscosity, spreading rate
and absolute motion of the ridge with respect to the plume (Escartin et al, 2001),
considering the Azores context, Ito and Lin, (1995) calculated values of approximately
70º C for temperature anomalies related with the Azores plume.
39
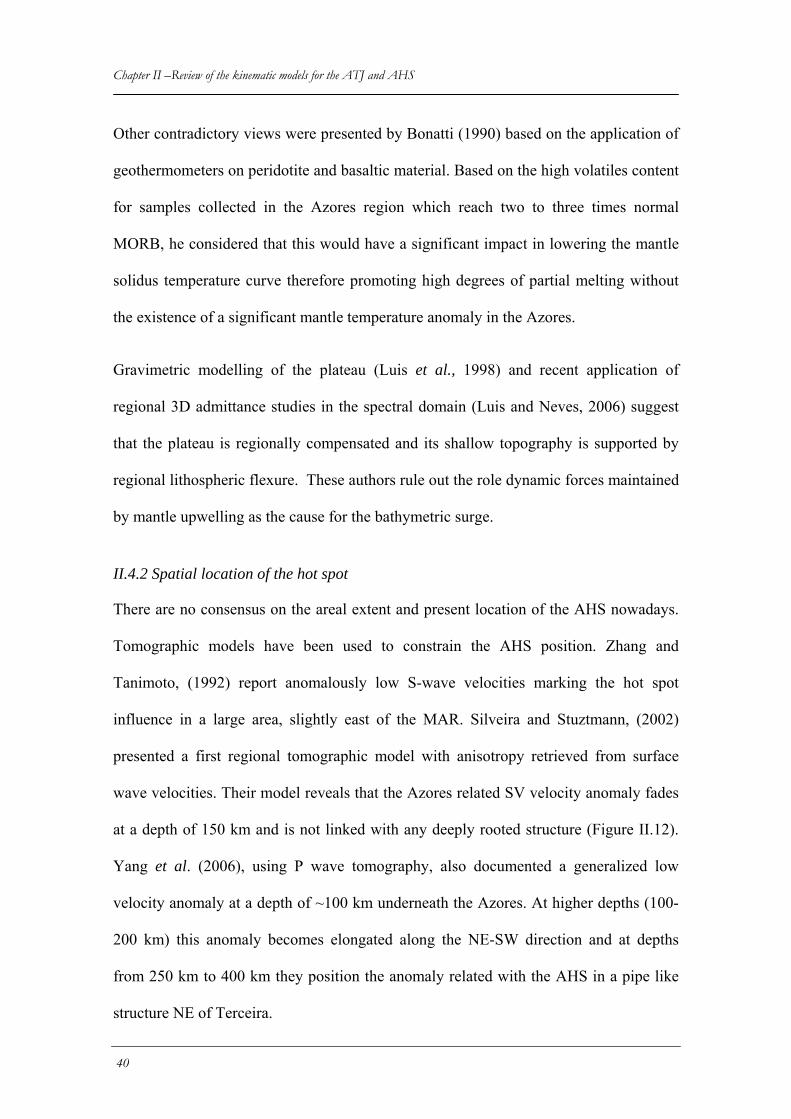
Chapter II –Review of the kinematic models for the ATJ and AHS Other contradictory views were presented by Bonatti (1990) based on the application of
geothermometers on peridotite and basaltic material. Based on the high volatiles content
for samples collected in the Azores region which reach two to three times normal
MORB, he considered that this would have a significant impact in lowering the mantle
solidus temperature curve therefore promoting high degrees of partial melting without
the existence of a significant mantle temperature anomaly in the Azores.
Gravimetric modelling of the plateau (Luis et al., 1998) and recent application of
regional 3D admittance studies in the spectral domain (Luis and Neves, 2006) suggest
that the plateau is regionally compensated and its shallow topography is supported by
regional lithospheric flexure. These authors rule out the role dynamic forces maintained
by mantle upwelling as the cause for the bathymetric surge.
II.4.2 Spatial location of the hot spot
There are no consensus on the areal extent and present location of the AHS nowadays.
Tomographic models have been used to constrain the AHS position. Zhang and
Tanimoto, (1992) report anomalously low S-wave velocities marking the hot spot
influence in a large area, slightly east of the MAR. Silveira and Stuztmann, (2002)
presented a first regional tomographic model with anisotropy retrieved from surface
wave velocities. Their model reveals that the Azores related SV velocity anomaly fades
at a depth of 150 km and is not linked with any deeply rooted structure (Figure II.12).
Yang et al. (2006), using P wave tomography, also documented a generalized low
velocity anomaly at a depth of ~100 km underneath the Azores. At higher depths (100-
200 km) this anomaly becomes elongated along the NE-SW direction and at depths
from 250 km to 400 km they position the anomaly related with the AHS in a pipe like
structure NE of Terceira.
40
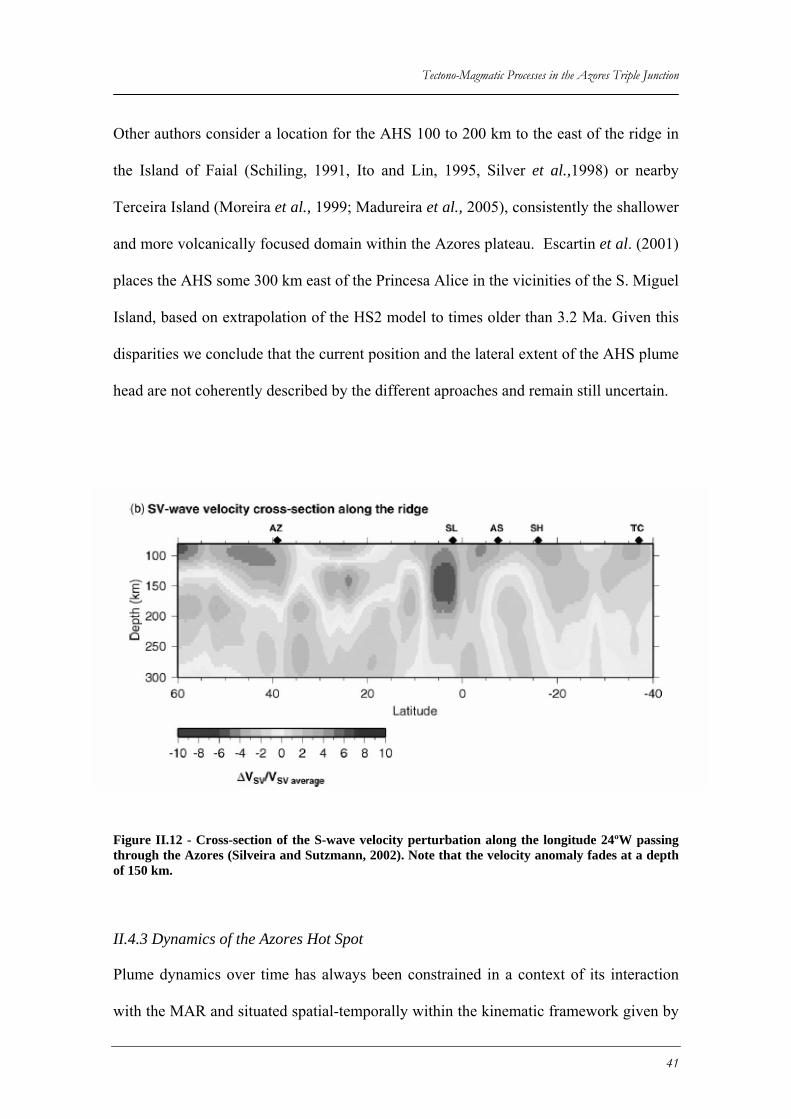
Tectono-Magmatic Processes in the Azores Triple Junction
Other authors consider a location for the AHS 100 to 200 km to the east of the ridge in
the Island of Faial (Schiling, 1991, Ito and Lin, 1995, Silver et al.,1998) or nearby
Terceira Island (Moreira et al., 1999; Madureira et al., 2005), consistently the shallower
and more volcanically focused domain within the Azores plateau. Escartin et al. (2001)
places the AHS some 300 km east of the Princesa Alice in the vicinities of the S. Miguel
Island, based on extrapolation of the HS2 model to times older than 3.2 Ma. Given this
disparities we conclude that the current position and the lateral extent of the AHS plume
head are not coherently described by the different aproaches and remain still uncertain.
Figure II.12 - Cross-section of the S-wave velocity perturbation along the longitude 24ºW passing through the Azores (Silveira and Sutzmann, 2002). Note that the velocity anomaly fades at a depth of 150 km.
II.4.3 Dynamics of the Azores Hot Spot
Plume dynamics over time has always been constrained in a context of its interaction
with the MAR and situated spatial-temporally within the kinematic framework given by
41
Chapter II –Review of the kinematic models for the ATJ and AHS seafloor spreading on this ridge system. It’s interaction with the ATJ third branch over
time has always been subdued probably due to inherent complexities of this plate
boundary. Below, we describe two contradictory models of interaction between the
AHS and the MAR overtime:
The interaction between the hot spot and the Mid-Atlantic ridge appears to be
responsible for a major thermal or magmatic event under the Mid-Atlantic Ridge 10 Ma
ago, leading to the formation of part of the Azores Plateau, and an increase of crustal
thickness between 5 and 8 km (Cannat et al., 1999; Escartin et al., 2001). This thermal
anomaly has propagated southward along the Mid-Atlantic Ridge axis. Following a
decrease in crustal production at the MAR since 5 Ma, the volcanic plateau was split
into two branches, diachronically, forming the V-shaped structure marking the south of
the present Azores plateau (Figure I.1). The decrease in crustal production at the MAR
may have resulted from a reduction in the hot spot activity, or from a change in the
dynamics of the interaction between the MAR and the hot spot.
No other event of this type has been recognized yet, in particular no other V-shaped
volcanic ridge is observed within, or outside the main one. This model assumes that the
AHS was centered along the ridge axis at the time of Chron 5, which corresponded at
that time to the SATJ defined at the intersection between EAFZ, Pico FZ and the MAR
in a RFF configuration. In subsequent times, while the melt anomaly migrated along the
ridge axis. The considered fixed plume migrated NE into the Azores Plateau at a rate of
~20 km/Ma, following the southwestward absolute motion of the Ridge and adjoining
plates, considering the HS2 reference frame. Southwestward migration of this thermal
anomaly would have occurred at a rate of 60 km/Ma, according to those authors.
42
Tectono-Magmatic Processes in the Azores Triple Junction
Figure II.13 - Sketches showing the location of selected bathymetry and gravity features from anomaly 4 (7.01 Ma) to the present. Thick black lines are MBA (Mantle Bouguer Anomaly) minima over the two edges of the West Jussieu Plateau (Flores ridge) and East Jussieu Plateau (Faial Ridge). Abbreviations: N. Az FZ – North Azores Fracture Zone, P.A. FZ – Princess Alice Fracture Zone, Az FZ – Açor Fracture Zone, P.A. Bank – Princess Alice Bank, C. Corvo Island, Fl – Flores Island, S.J – São Jorge Island, F – Faial, P. Pico Island, MG – Menez Gwen, FA – FAMOUS, LS – Lucky Strike (Cannat et al., 1999).
Gente et al, 2003 have proposed a model constraining the interaction between the MAR
and the AHS from 85 Ma to the present. They take Canpam (1995), earlier referred in
this work as the kinematic reference model for their reconstructions. Plate kinematic
reconstructions have revealed some key features and relations between the Azores
plateau, Hot Spot activity and neighbouring structures like the Great Meteor on the
African plate and the Corner Rise in the North American plate. However, as stated by
the authors:
43
Chapter II –Review of the kinematic models for the ATJ and AHS “no precise inference should be drawn from our reconstructions on the detailed
evolution of the Azores-Gibraltar line that marks the Africa-Eurasia Plate Boundary”.
Their model is sketched in Figure II.13 and can be summarised as follows: The
interaction between the AHS and the MAR starts at 85 Ma and results in the formation
of the Great Meteor seamounts (in the African Plate) and the Corner Rise in the
American Plate (see Figure I.1 for location). Northeastward migration of this interaction
along the MAR axis continues until anomaly 6 (20 Ma) resulting in the early stages of
Azores Plateau formation. Between anomalies 6 and 5 (10 Ma) plume influence in
centred in the Azores plateau and its interaction with the MAR gradually loses
significance. At 7 Ma the Azores plateau is fully formed and the melt generation arising
from plume activity ceases, this stage marks again the onset of normal seafloor
spreading at the MAR north of latitude 38º. In the Southern part of the plateau Rifting
of the Azores plateau started at C3 (4 Ma) and results in the formation of both Flores
and Faial ridges (also referred as West Jussieu and East Jussieu plateaus) as independent
morpho-tectonic features. The authors assume that the Azores plume is currently
centred below Terceira Island.
II.5 Discussion
II.5.1 Interaction between the Azores Hot Spot and the Azores Triple Junction
Constraints on the formation of the Azores plateau and its inner structure are sometimes
attributed to the kinematic evolution of the ATJ, others to the action of the AHS as we
have just seen. It seems clear that their concurrence in space and time is bound to have
promoted some degree of interaction between these two main processes.
44
Tectono-Magmatic Processes in the Azores Triple Junction
If it is clear that the AHS, resulted in the formation of thicker than normal oceanic crust
and the shaping of the anomalously shallow bathymetry; the geometry of the plateau,
its internal structure, and the northeastern and southeastern limits within the EU/AF
plate boundary (i.e Terceira axis and EAFZ) are clear tectonic features. This suggests
that the surface expression of the excess in magmatism is tectonically controlled.
Considering both the kinematic constraints of the ATJ and the models for the evolution
of the AHS, it results that the Azores deformation history started prior to any relevant
spatial influence of the AHS trace in this plate boundary domain. The models used in
section II.2.4 suggest that beginning of transtension started prior to anomaly 13 (i.e 33.4
Ma). According to Gente et al., (2003) the position of the hot spot, considering an
absolute reference frame, should be to southerly to bear important interactions or
consequences to the Triple Junction.
The age of the plateau and intrinsically the age of the Terceira axis are still subject to
considerable scatter in estimates. For example Canpam et al. (1995) sets an age for this
features as early as 36 Ma age. Vogt and Jung (2003) have defined 24 Ma as its limiting
age, Searle (1980) considers an estimate of 36 Ma. Given that the bathymetric anomaly
does not surpass C6, in the North American Plate it is plausible that the bulk of its
construction should have occurred prior to this age. As observed earlier, models
considering the AHS evolution also point to an estimate of 20 Ma for the beginning of
the most important period of AHS-MAR interaction which reaches a maximum at
approximately 10 Ma (C5) and then gradually decreases activity from 7 Ma to the
present.
45
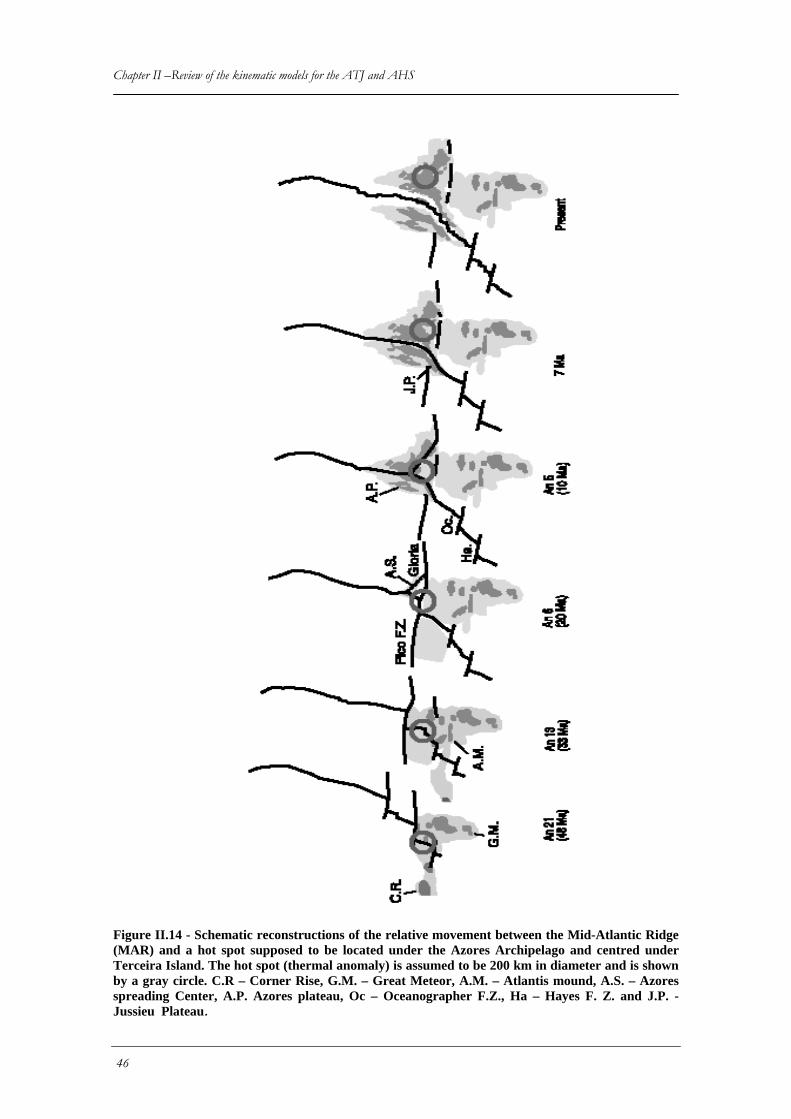
Chapter II –Review of the kinematic models for the ATJ and AHS
Figure II.14 - Schematic reconstructions of the relative movement between the Mid-Atlantic Ridge (MAR) and a hot spot supposed to be located under the Azores Archipelago and centred under Terceira Island. The hot spot (thermal anomaly) is assumed to be 200 km in diameter and is shown by a gray circle. C.R – Corner Rise, G.M. – Great Meteor, A.M. – Atlantis mound, A.S. – Azores spreading Center, A.P. Azores plateau, Oc – Oceanographer F.Z., Ha – Hayes F. Z. and J.P. - Jussieu Plateau.
46
Tectono-Magmatic Processes in the Azores Triple Junction
Presented models in section II.2.3 differ essentially in the proposed mechanisms for the
generation of the Faial and Flores ridges and the implications on the AHS dynamic
through time. The model proposed by Cannat et al. (1999) considers that the rifting
event leading to these main morpho-structures is essentially diachronical an directed
south westward. Conversely, Gente et al. (2003) considered a more typical hot spot
trace migrating progressively northward and associate the rifting of this plateau to a
single event which started some 7 Ma ago when abnormal hot spot derived excess in
magmatism ceased.
When considering the implications of both models addressing the possible
consequences to the ATJ of the prevalence of hot spot related activity within the plateau
in time, several limitations arise:
MAR generated magnetic anomalies, namely those that mark the onset of the plateau
(C6 and C5) are still traceable within the plateau, as we have seen in section 1.2.1, and
these seem inconsistent with widespread hot-spot influence of AHS on the plateau build
up. To render the hypothesis valid, then the southern termination of anomalies 5 and 6,
as picked by Luis et al. (1994), within the Plateau must be re-examined.
The magnetic anomalies of the Faial and Flores ridges are broadly positive, which
seems to refute the dyachronical nature of these structures proposed by Cannat et al.
(1999). Moreover from a geometric point of view, it is difficult to justify Cannat
hypothesis that the plume was centred on the Ridge axis and was the key factor in the
generation of the plateau. The plateau morphological asymmetry, with respect to the
present MAR position, cannot be accounted by the referred ridge axis migration.
47
Chapter II –Review of the kinematic models for the ATJ and AHS The prolongation westward of the EAFZ transform valley bordering the southern
termination of the Faial ridge and the Azores plateau as an abrupt morphological step
facing south is difficult to cope with a northward migration of the AHS, as its
interaction with the EAFZ should blur its surface expression and not be limited by it. A
more consistent behavior can be observed in the NAM plate where the Pico FZ
terminates quite abruptly eastwards against the plateau.
Finally, the morpho-structure of Terceira axis itself, where deep basin occur, does not
seem immediately linkable to a widespread excess in magmatism hot spot, relatable if
this structure would have defined the northern boundary of the Azores plateau since at
least anomaly C6 as represented in numerous models namely those of Gente et al.
(2003) and Cannat et al. (1999).
II.5.2 Onset of SATJ northwards Migration
Considering Gente et al. (2003) model as a complete portrait of AHS dynamic through
time, then what can we anticipate to be the response of the ATJ to the progressing AHS
northwards?
Probably a combination of changing kinematic conditions depicted in section II.2
associated with the body forces resultant from topography build up, might have induced
a tectonic response which resulted in strain re-localization and redefinition of the plate
boundary, as AHS migration would proceed.
As suggested by Vogt and Jung (2003), the abandonment of the SATJ from the EAFZ
and its progressive migration northward seems to have been crucial to the development
of the Azores plateau internal structure. Vogt and Jung (2003) attribute the generation of
the LVR, as a succession of failed rifts following this TJ migration, concomitant with
48
Tectono-Magmatic Processes in the Azores Triple Junction
the progressive hot spot track also to the north. As we shall see later (see Chapter V) we
favor a somewhat different interpretation as we consider that the western linear volcanic
ridge domain has at present a significant tectono-magmatic activity and constitutes a
part of inter-plate boundary zone.
Timing the onset of this migration is of key importance for the age relationship of
morphological features within the plateau. We interpret the triple junction migration as
a process that generated from a intra-transform setting between C6 and C5 and
terminated post east Jussieu plateau formation. The fact that the valley that marks this
migration cuts through a well shaped terrace and is not in-filled by magmatic products
and the disruption itself of the Faial ridge, suggests, that the overall SATJ migration
might have occurred in a magma-poor environment therefore at the at the onset of the
MAR normal seafloor spreading, (i.e. ca. 7 Ma according to Gente et al., 2003).
The gradual migration of the SATJ converges to expectable NATJ position. Probably
the changing in the kinematic conditions that supported this migration favored the
rupturing of the Terceira axis as an intra-oceanic rift zone, therefore redefining the
NATJ trace and plate boundary to a more northerly position along this structure.
Though the starting age can be tentatively constrained by Gente’s model, the end of
such process, which resulted in the present definition of the EU/AF plate boundary
dominantly along the Terceira axis is less easily definable. Probably, Luis et al., 1994
model where the repositioning of the SATJ is achieved by discrete small ridge jumps to
its present position, allegedly along the intersection of Faial-Pico strike with the MAR,
remains valid (also see discussion in Chapter VIII).
The disparities observed in some sectors of the Azores plateau between main morpho-
tectonic and magnetic anomaly features suggests that its present morphology and most
49
Chapter II –Review of the kinematic models for the ATJ and AHS of its magnetic character associated with the Azores trend have been shaped in recent
times, surely less than 7 Ma, and most probably less than 3 Ma as we shall see later in
chapters IV and V of this manuscript, when we will analyze in more detail the present
configuration of the ATJ and the EU/NUB plate boundary.
II.6 Conclusions
1) The rotations of a set of point elements within the plateau, inferred from calculated
EU/AF stage poles, suggest an overall dominance of a transtensional or oblique
extension regime from at least 33.4 (C13) to the present. From C13 to C6 any of these
regimes would be dominated by extension along a near N-S direction. From C6 to the
present extensional direction rotates to a direction closer to WSW-ENE or W-E
according to the reference kinematical model chosen.
2) The EAFZ can be approached as the structural homologue of the Pico FZ considering
NAM/WAF finite rotation poles. Therefore this structure acted as a southern plate
boundary SATJ for most of the evolution of the Azores plateau since anomaly C13.
3) The northern trace of rotated Pico FZ Position using NAM/EU finite rotation poles
(NATJ), does not correspond to any significant morphological feature. This implies that
either a discrete plate boundary never evolve fully, and that the Azores kinematic block
constituted an area of essentially distributed deformation, or that if existed this plate
boundary was mask later by subsequent tectono-magmatic events.
4) No simple closure of the ATJ is possible at anomaly C13, implying that deformation
associated with the Azores Triple Junction started prior to the 33.4 Ma. We need
therefore to evoke an Azores domain with a kinematic behavior independent of the two
larger plates. The expected position of the AHS implies little to no interaction of the hot
50
Tectono-Magmatic Processes in the Azores Triple Junction
spot with the SATJ existed at this time, and that the onset of Azores domain and
topography might have been, mainly tectonically controlled these early stages.
5) Strong interaction of the SATJ with the AHS started probably at C6 times (20 Ma)
according to the models referred to in this study. After a period of intense melt
production which reached a maximum at C5, rifting of the Azores plateau began around
7 Ma. Between C6 and C5 the EAFZ ceases to work as the SATJ, which departs from
the EAFZ (in a intra-transform context) northwestwards. The migration process lasted
to through times earlier than 7 Ma, as the most probable morpho-structure corresponds
to a valley largely depleted from magmatism, and therefore generated after the
maximum magmatic activity, AHS related.
51

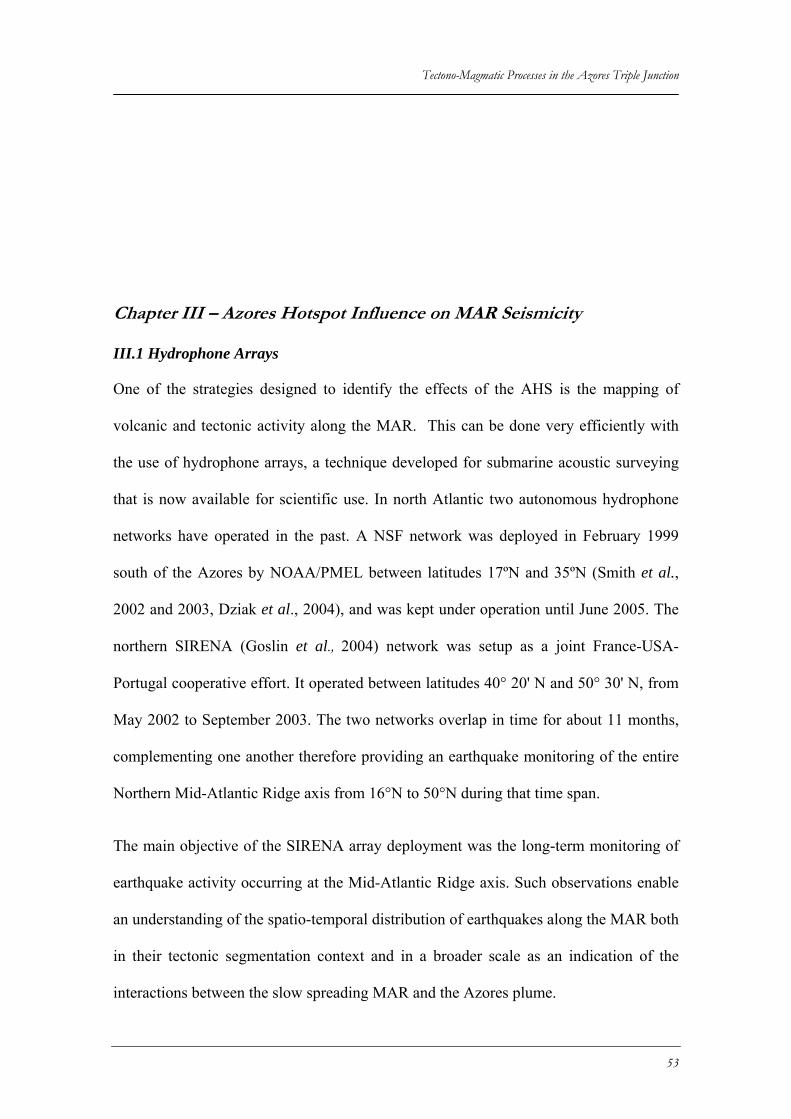
Tectono-Magmatic Processes in the Azores Triple Junction
Chapter III – Azores Hotspot Influence on MAR Seismicity
III.1 Hydrophone Arrays
One of the strategies designed to identify the effects of the AHS is the mapping of
volcanic and tectonic activity along the MAR. This can be done very efficiently with
the use of hydrophone arrays, a technique developed for submarine acoustic surveying
that is now available for scientific use. In north Atlantic two autonomous hydrophone
networks have operated in the past. A NSF network was deployed in February 1999
south of the Azores by NOAA/PMEL between latitudes 17ºN and 35ºN (Smith et al.,
2002 and 2003, Dziak et al., 2004), and was kept under operation until June 2005. The
northern SIRENA (Goslin et al., 2004) network was setup as a joint France-USA-
Portugal cooperative effort. It operated between latitudes 40° 20' N and 50° 30' N, from
May 2002 to September 2003. The two networks overlap in time for about 11 months,
complementing one another therefore providing an earthquake monitoring of the entire
Northern Mid-Atlantic Ridge axis from 16°N to 50°N during that time span.
The main objective of the SIRENA array deployment was the long-term monitoring of
earthquake activity occurring at the Mid-Atlantic Ridge axis. Such observations enable
an understanding of the spatio-temporal distribution of earthquakes along the MAR both
in their tectonic segmentation context and in a broader scale as an indication of the
interactions between the slow spreading MAR and the Azores plume.
53
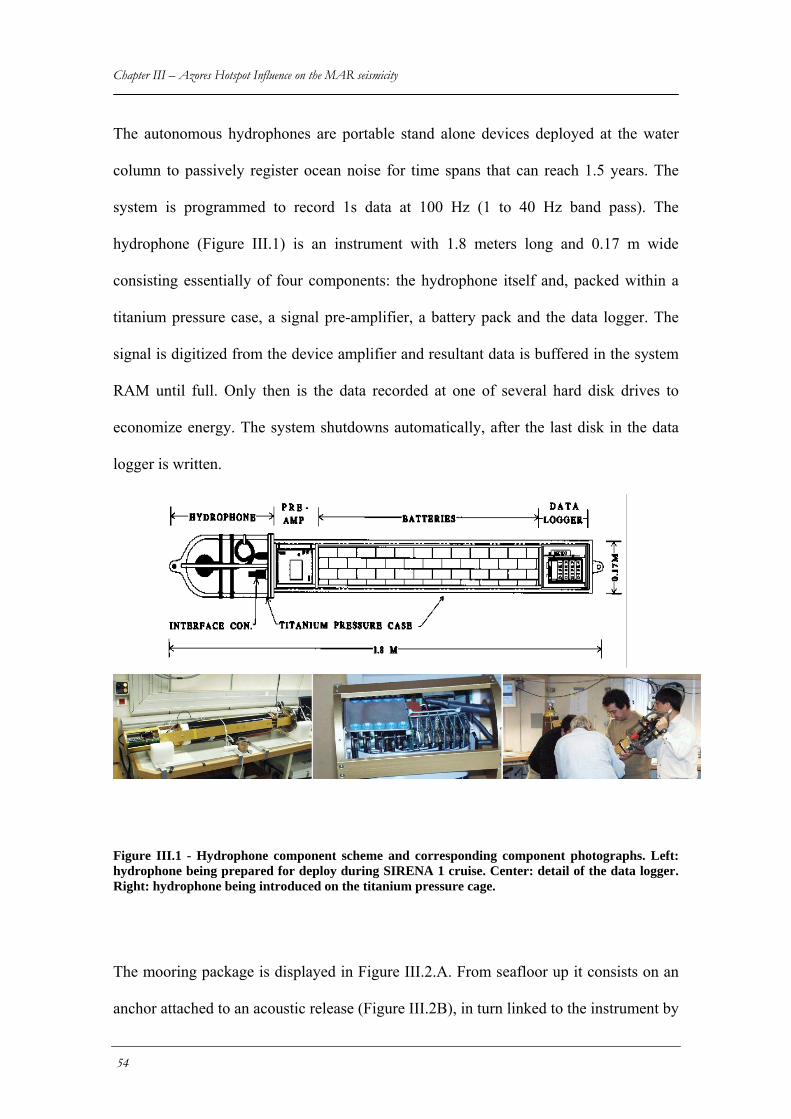
Chapter III – Azores Hotspot Influence on the MAR seismicity The autonomous hydrophones are portable stand alone devices deployed at the water
column to passively register ocean noise for time spans that can reach 1.5 years. The
system is programmed to record 1s data at 100 Hz (1 to 40 Hz band pass). The
hydrophone (Figure III.1) is an instrument with 1.8 meters long and 0.17 m wide
consisting essentially of four components: the hydrophone itself and, packed within a
titanium pressure case, a signal pre-amplifier, a battery pack and the data logger. The
signal is digitized from the device amplifier and resultant data is buffered in the system
RAM until full. Only then is the data recorded at one of several hard disk drives to
economize energy. The system shutdowns automatically, after the last disk in the data
logger is written.
Figure III.1 - Hydrophone component scheme and corresponding component photographs. Left: hydrophone being prepared for deploy during SIRENA 1 cruise. Center: detail of the data logger. Right: hydrophone being introduced on the titanium pressure cage.
The mooring package is displayed in Figure III.2.A. From seafloor up it consists on an
anchor attached to an acoustic release (Figure III.2B), in turn linked to the instrument by
54
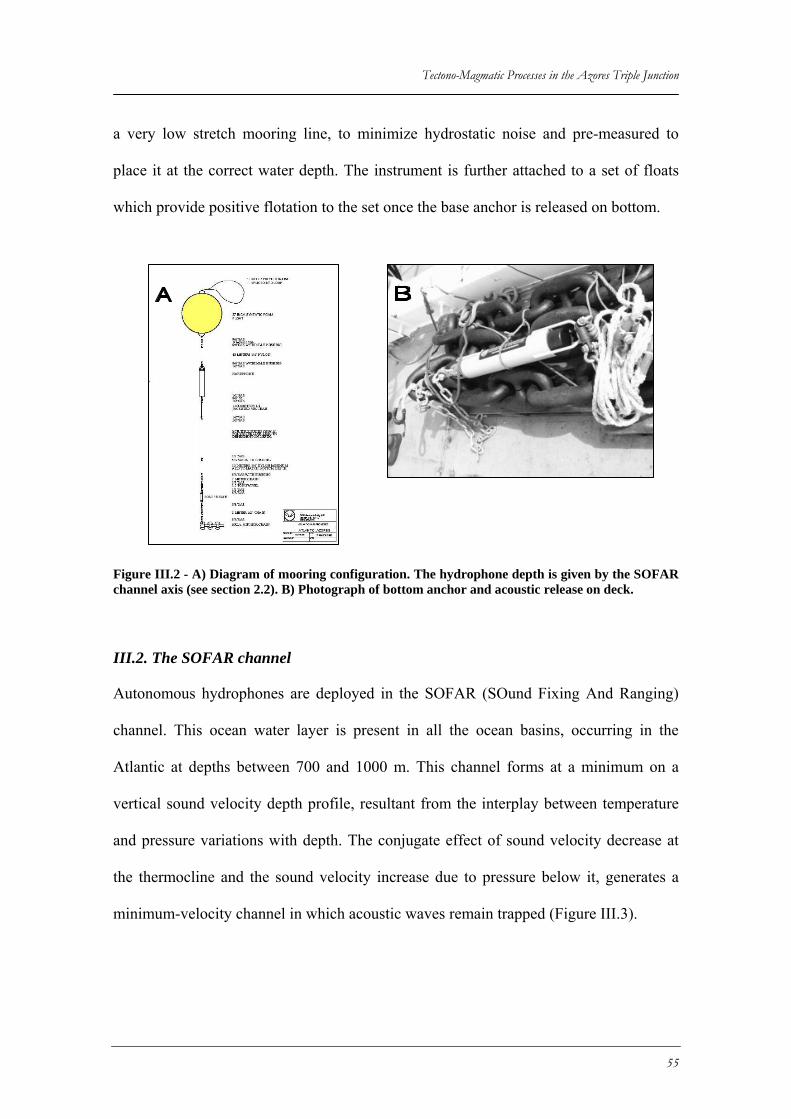
Tectono-Magmatic Processes in the Azores Triple Junction
a very low stretch mooring line, to minimize hydrostatic noise and pre-measured to
place it at the correct water depth. The instrument is further attached to a set of floats
which provide positive flotation to the set once the base anchor is released on bottom.
Figure III.2 - A) Diagram of mooring configuration. The hydrophone depth is given by the SOFAR channel axis (see section 2.2). B) Photograph of bottom anchor and acoustic release on deck.
III.2. The SOFAR channel
Autonomous hydrophones are deployed in the SOFAR (SOund Fixing And Ranging)
channel. This ocean water layer is present in all the ocean basins, occurring in the
Atlantic at depths between 700 and 1000 m. This channel forms at a minimum on a
vertical sound velocity depth profile, resultant from the interplay between temperature
and pressure variations with depth. The conjugate effect of sound velocity decrease at
the thermocline and the sound velocity increase due to pressure below it, generates a
minimum-velocity channel in which acoustic waves remain trapped (Figure III.3).
55
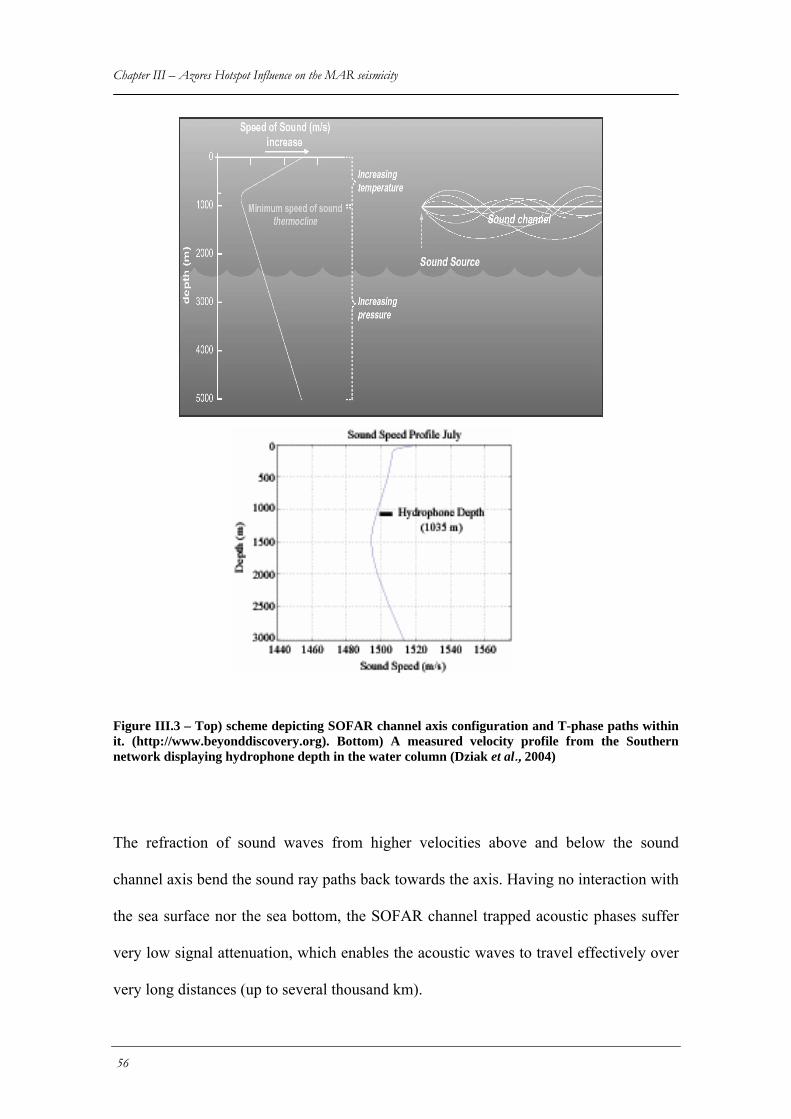
Chapter III – Azores Hotspot Influence on the MAR seismicity
Figure III.3 – Top) scheme depicting SOFAR channel axis configuration and T-phase paths within it. (http://www.beyonddiscovery.org). Bottom) A measured velocity profile from the Southern network displaying hydrophone depth in the water column (Dziak et al., 2004)
The refraction of sound waves from higher velocities above and below the sound
channel axis bend the sound ray paths back towards the axis. Having no interaction with
the sea surface nor the sea bottom, the SOFAR channel trapped acoustic phases suffer
very low signal attenuation, which enables the acoustic waves to travel effectively over
very long distances (up to several thousand km).
56
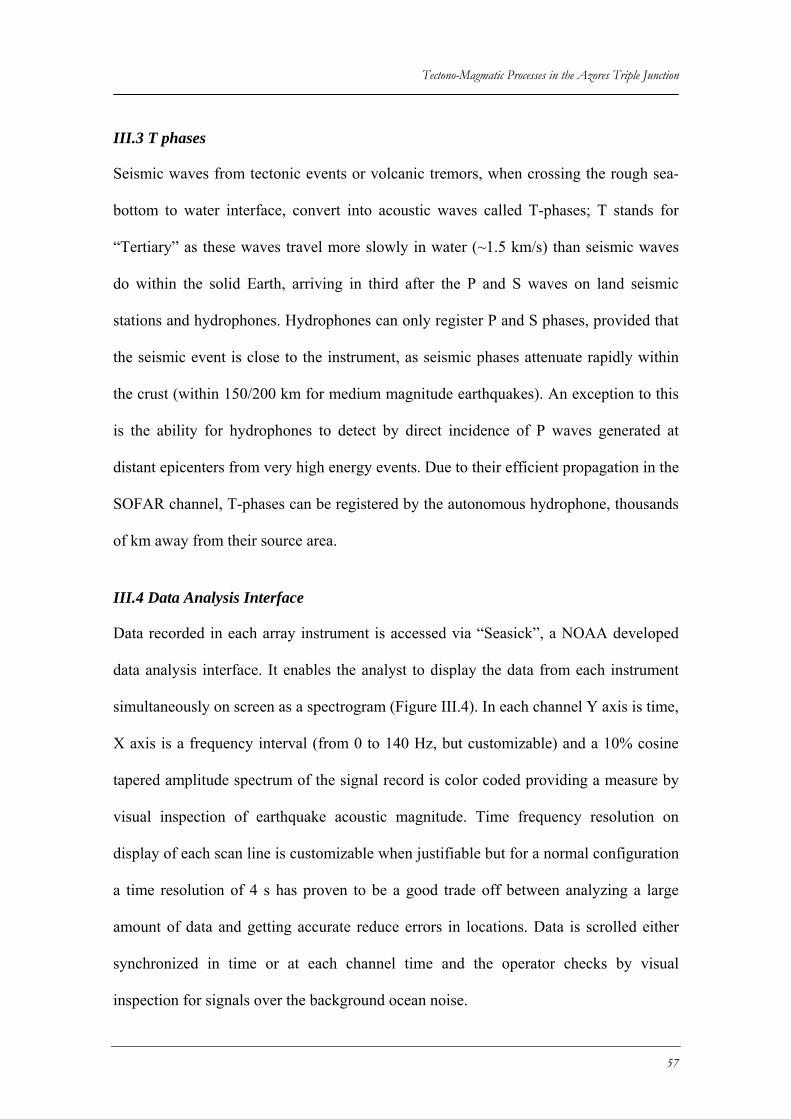
Tectono-Magmatic Processes in the Azores Triple Junction
III.3 T phases
Seismic waves from tectonic events or volcanic tremors, when crossing the rough sea-
bottom to water interface, convert into acoustic waves called T-phases; T stands for
“Tertiary” as these waves travel more slowly in water (~1.5 km/s) than seismic waves
do within the solid Earth, arriving in third after the P and S waves on land seismic
stations and hydrophones. Hydrophones can only register P and S phases, provided that
the seismic event is close to the instrument, as seismic phases attenuate rapidly within
the crust (within 150/200 km for medium magnitude earthquakes). An exception to this
is the ability for hydrophones to detect by direct incidence of P waves generated at
distant epicenters from very high energy events. Due to their efficient propagation in the
SOFAR channel, T-phases can be registered by the autonomous hydrophone, thousands
of km away from their source area.
III.4 Data Analysis Interface
Data recorded in each array instrument is accessed via “Seasick”, a NOAA developed
data analysis interface. It enables the analyst to display the data from each instrument
simultaneously on screen as a spectrogram (Figure III.4). In each channel Y axis is time,
X axis is a frequency interval (from 0 to 140 Hz, but customizable) and a 10% cosine
tapered amplitude spectrum of the signal record is color coded providing a measure by
visual inspection of earthquake acoustic magnitude. Time frequency resolution on
display of each scan line is customizable when justifiable but for a normal configuration
a time resolution of 4 s has proven to be a good trade off between analyzing a large
amount of data and getting accurate reduce errors in locations. Data is scrolled either
synchronized in time or at each channel time and the operator checks by visual
inspection for signals over the background ocean noise.
57
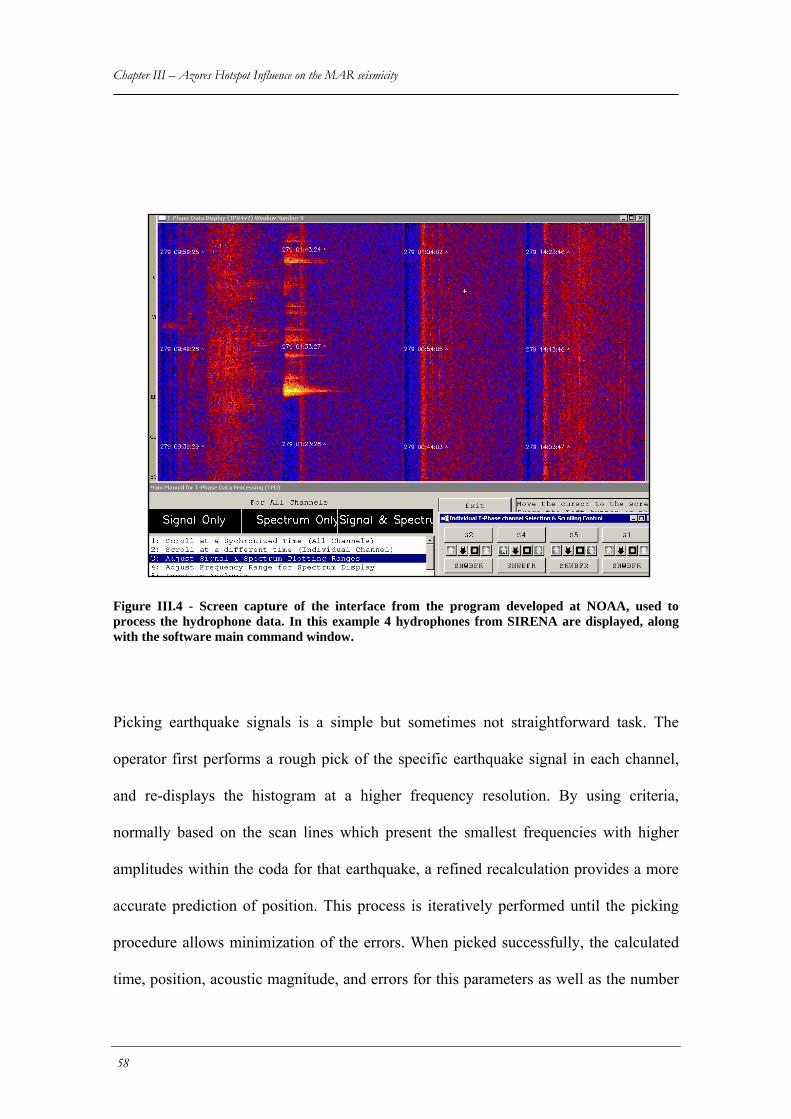
Chapter III – Azores Hotspot Influence on the MAR seismicity
Figure III.4 - Screen capture of the interface from the program developed at NOAA, used to process the hydrophone data. In this example 4 hydrophones from SIRENA are displayed, along with the software main command window.
Picking earthquake signals is a simple but sometimes not straightforward task. The
operator first performs a rough pick of the specific earthquake signal in each channel,
and re-displays the histogram at a higher frequency resolution. By using criteria,
normally based on the scan lines which present the smallest frequencies with higher
amplitudes within the coda for that earthquake, a refined recalculation provides a more
accurate prediction of position. This process is iteratively performed until the picking
procedure allows minimization of the errors. When picked successfully, the calculated
time, position, acoustic magnitude, and errors for this parameters as well as the number
58
Tectono-Magmatic Processes in the Azores Triple Junction
of hydrophones used in the localization of the event are than stored on a posit files for
posterior seismicity studies. ThePosit files from several arrays around the world are
made available on the NOAA website for download
(http://www.pmel.noaa.gov/vents/acoustics/seismicity/seismicity.html).
The detailed description of the mathematical methods built-in on the program to provide
T-phase source location and error estimates is out of scope of this work. Detailed
information on this issue can be found in Fox et al. (2001). Here we just summarize the
procedure briefly. Using built-in models of ocean sound propagation velocities, sound
is propagated from a preliminary location to the hydrophones using interactively a non
linear least square inversion method. Successive runs then, minimize the differences
between predicted and recorded arrival times. Several solutions are calculated on each
run to check consistency of initial source location; these consider the source location
falling within the center of the array, outside the array from the direction of the
hydrophone which registered the first arrival, and at the minimum residual error from a
coarser grid. The location is taken from the solution presenting the lowest root mean
square (RMS) residual error.
III.5 The SIRENA experiment
The SIRENA Project was set up in 2000, as a result of a cooperative agreement between
UMR6538/CNRS (Brest, France; PI J. Goslin), the “Géosciences Marines Lab” from
IPG Paris, the PMEL/NOAA (Pacific Marine Environmental Lab, Newport, OR, USA),
the CGUL (Lisbon University Geophysical Center) and the CIMA (Marine and
Environmental Research Center, University of Algarve – Portugal).
59
Chapter III – Azores Hotspot Influence on the MAR seismicity Two cruises have occurred within the framework of this project (Figure III.5):
SIRENA1-2002 cruise aboard the R/V Le Suroit, starting in Ponta Delgada (Açores) on
May, 16th and docking in Brest on June, 4th, 2002. Six hydrophones were successfully
deployed during SIRENA1 on both flanks of the Mid-Atlantic Ridge between
Kurtchatov Fracture Zone, immediately north of the Azores Plateau and a major
discontinuity south of the Charlie Gibbs Fracture Zone (between 40º20’N and 50º35’N).
(see report at http:// www-sdt.univ-brest.fr/ ~goslin/SIRENA/REPT).
A multi-beam survey of the ridge axis between latitudes 48°20’N and 50°05’N was
completed. Together with previous surveys, in particular TRIATNORD (Goslin et al,
1999), these data provides complete bathymetry coverage from 40°20’N to 51°55’N
(with the exception of the section between 46°N and 48°20’N, where only a few single-
beam and multi-beam tracks cross the MAR).
The hydrophone array was recovered during the SIRENA II/D274 cruise, sailed by RRS
Discovery from Govan, Scotland (Sept, 12th, 2003) to Ponta Delgada (Oct, 1st, 2003). Of
the six hydrophones deployed in May 2002 (see site locations on Figure III.5), only five
were recovered during SIRENA2/D274. We were not able to recover S3. Hydrophones
S1, S2, S4 and S5 recorded data during the entire time they were deployed. S6 stopped
recording data on the 12th day after its deployment. Despite this drawback, the four
operational hydrophones occupy the four corner sites of the array and data analysis
indicates they provide accurate locations of earthquakes that occurred within the array.
60
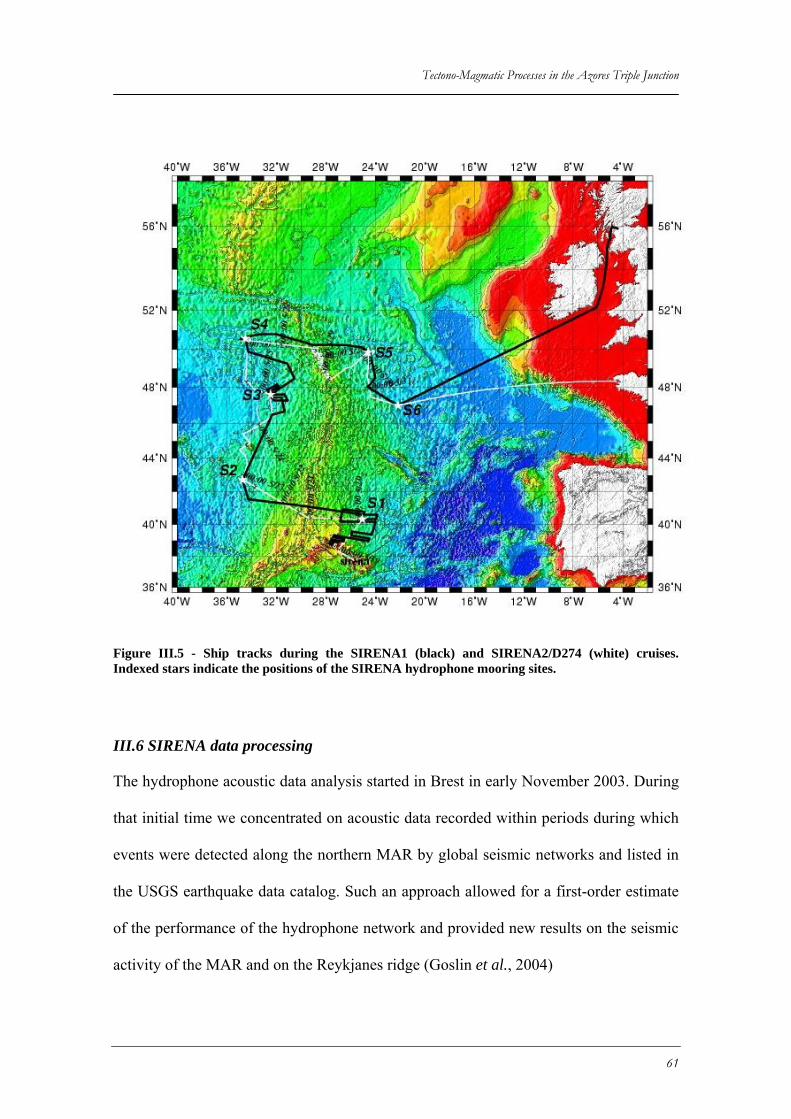
Tectono-Magmatic Processes in the Azores Triple Junction
Figure III.5 - Ship tracks during the SIRENA1 (black) and SIRENA2/D274 (white) cruises. Indexed stars indicate the positions of the SIRENA hydrophone mooring sites.
III.6 SIRENA data processing
The hydrophone acoustic data analysis started in Brest in early November 2003. During
that initial time we concentrated on acoustic data recorded within periods during which
events were detected along the northern MAR by global seismic networks and listed in
the USGS earthquake data catalog. Such an approach allowed for a first-order estimate
of the performance of the hydrophone network and provided new results on the seismic
activity of the MAR and on the Reykjanes ridge (Goslin et al., 2004)
61
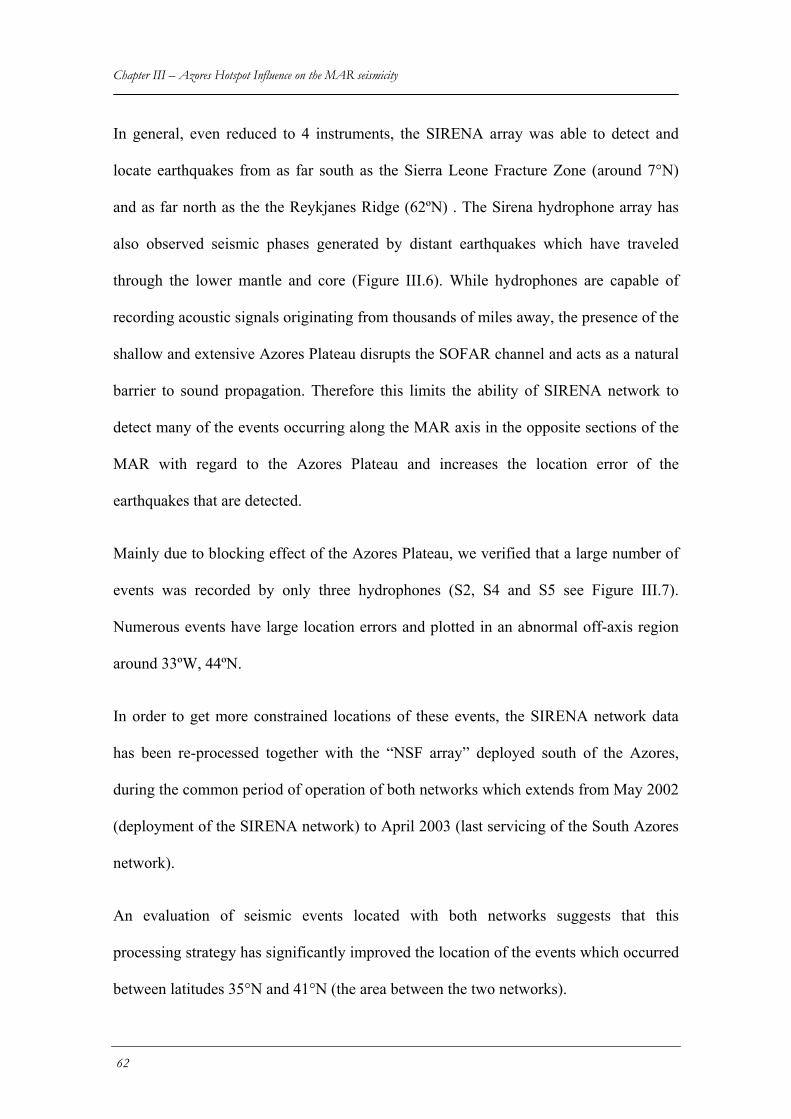
Chapter III – Azores Hotspot Influence on the MAR seismicity In general, even reduced to 4 instruments, the SIRENA array was able to detect and
locate earthquakes from as far south as the Sierra Leone Fracture Zone (around 7°N)
and as far north as the the Reykjanes Ridge (62ºN) . The Sirena hydrophone array has
also observed seismic phases generated by distant earthquakes which have traveled
through the lower mantle and core (Figure III.6). While hydrophones are capable of
recording acoustic signals originating from thousands of miles away, the presence of the
shallow and extensive Azores Plateau disrupts the SOFAR channel and acts as a natural
barrier to sound propagation. Therefore this limits the ability of SIRENA network to
detect many of the events occurring along the MAR axis in the opposite sections of the
MAR with regard to the Azores Plateau and increases the location error of the
earthquakes that are detected.
Mainly due to blocking effect of the Azores Plateau, we verified that a large number of
events was recorded by only three hydrophones (S2, S4 and S5 see Figure III.7).
Numerous events have large location errors and plotted in an abnormal off-axis region
around 33ºW, 44ºN.
In order to get more constrained locations of these events, the SIRENA network data
has been re-processed together with the “NSF array” deployed south of the Azores,
during the common period of operation of both networks which extends from May 2002
(deployment of the SIRENA network) to April 2003 (last servicing of the South Azores
network).
An evaluation of seismic events located with both networks suggests that this
processing strategy has significantly improved the location of the events which occurred
between latitudes 35°N and 41°N (the area between the two networks).
62
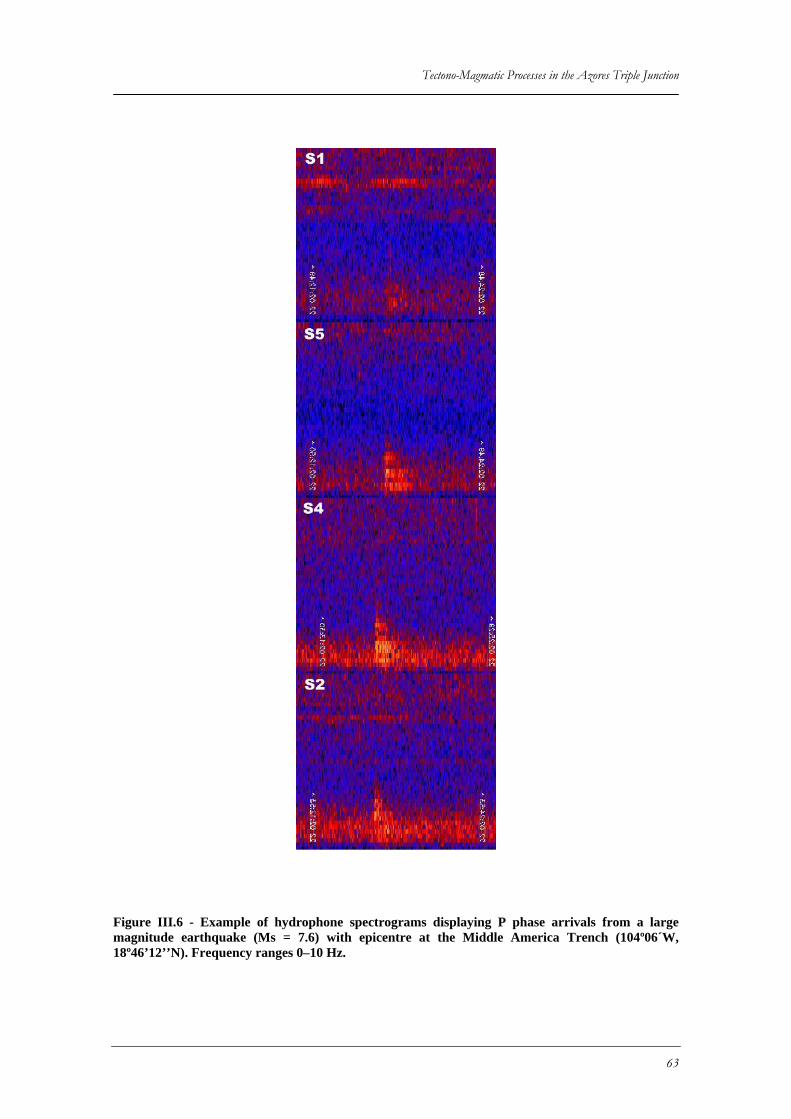
Tectono-Magmatic Processes in the Azores Triple Junction
Figure III.6 - Example of hydrophone spectrograms displaying P phase arrivals from a large magnitude earthquake (Ms = 7.6) with epicentre at the Middle America Trench (104º06´W, 18º46’12’’N). Frequency ranges 0–10 Hz.
63
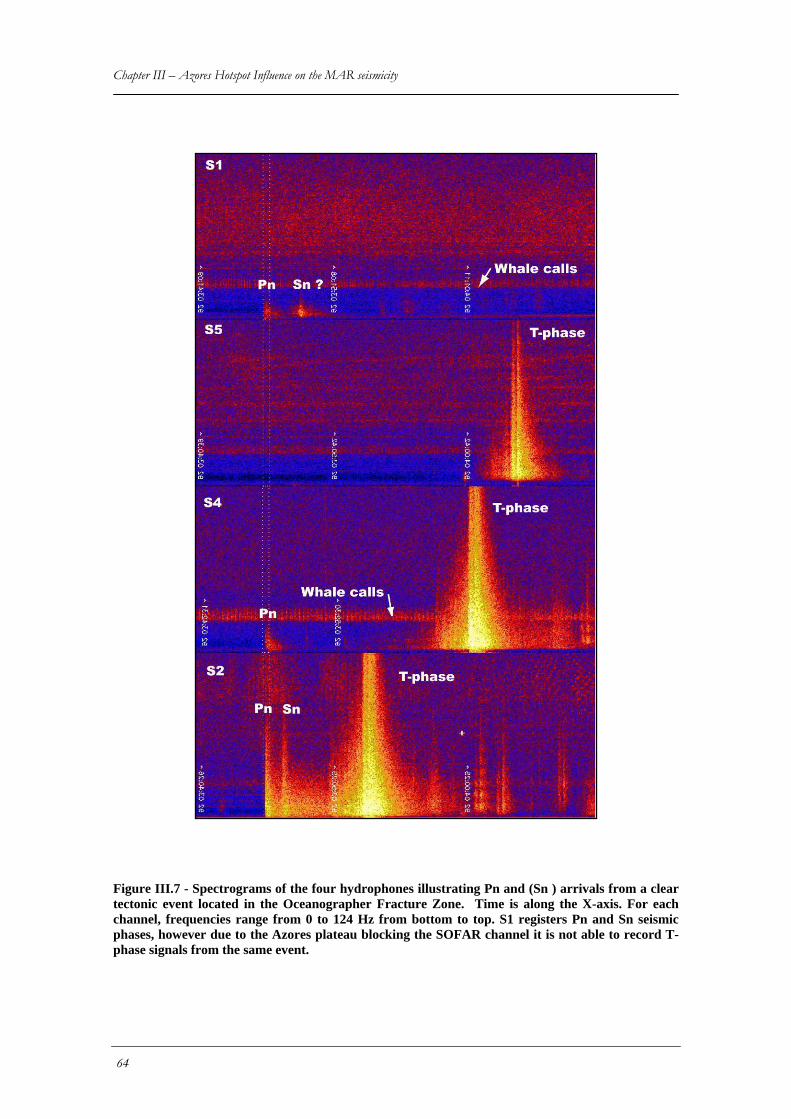
Chapter III – Azores Hotspot Influence on the MAR seismicity
Figure III.7 - Spectrograms of the four hydrophones illustrating Pn and (Sn ) arrivals from a clear tectonic event located in the Oceanographer Fracture Zone. Time is along the X-axis. For each channel, frequencies range from 0 to 124 Hz from bottom to top. S1 registers Pn and Sn seismic phases, however due to the Azores plateau blocking the SOFAR channel it is not able to record T-phase signals from the same event.
64
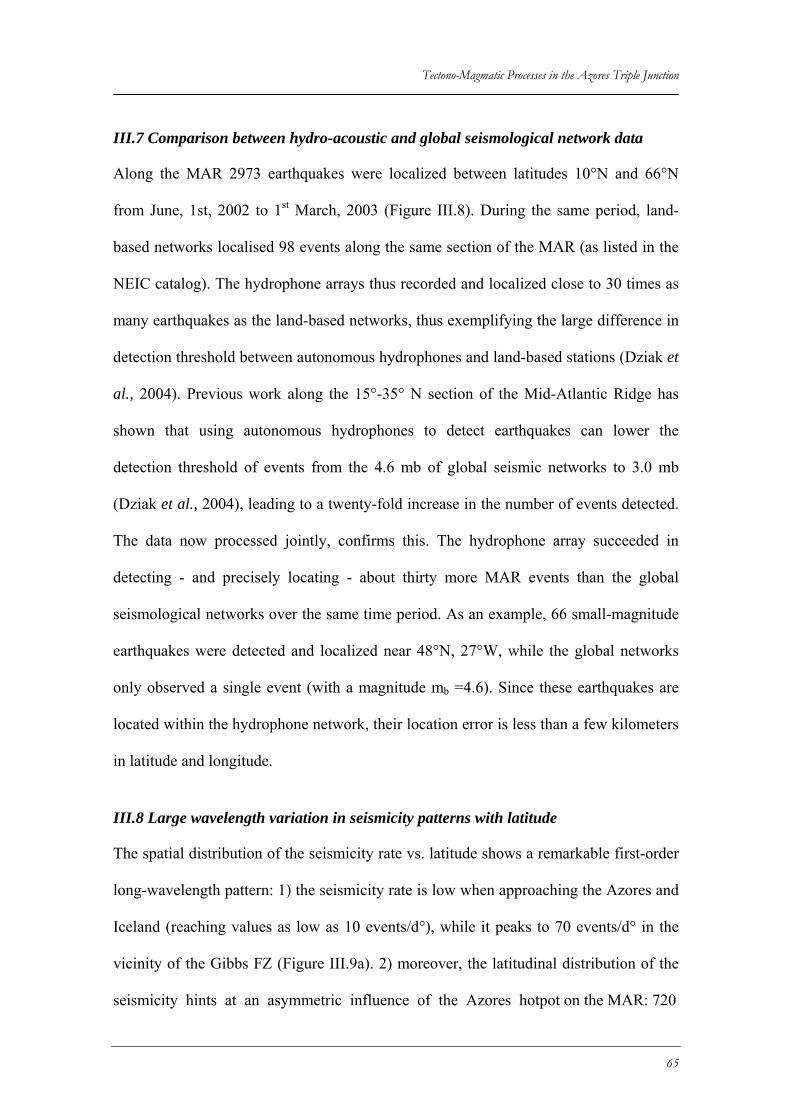
Tectono-Magmatic Processes in the Azores Triple Junction
III.7 Comparison between hydro-acoustic and global seismological network data
Along the MAR 2973 earthquakes were localized between latitudes 10°N and 66°N
from June, 1st, 2002 to 1st March, 2003 (Figure III.8). During the same period, land-
based networks localised 98 events along the same section of the MAR (as listed in the
NEIC catalog). The hydrophone arrays thus recorded and localized close to 30 times as
many earthquakes as the land-based networks, thus exemplifying the large difference in
detection threshold between autonomous hydrophones and land-based stations (Dziak et
al., 2004). Previous work along the 15°-35° N section of the Mid-Atlantic Ridge has
shown that using autonomous hydrophones to detect earthquakes can lower the
detection threshold of events from the 4.6 mb of global seismic networks to 3.0 mb
(Dziak et al., 2004), leading to a twenty-fold increase in the number of events detected.
The data now processed jointly, confirms this. The hydrophone array succeeded in
detecting - and precisely locating - about thirty more MAR events than the global
seismological networks over the same time period. As an example, 66 small-magnitude
earthquakes were detected and localized near 48°N, 27°W, while the global networks
only observed a single event (with a magnitude mb =4.6). Since these earthquakes are
located within the hydrophone network, their location error is less than a few kilometers
in latitude and longitude.
III.8 Large wavelength variation in seismicity patterns with latitude
The spatial distribution of the seismicity rate vs. latitude shows a remarkable first-order
long-wavelength pattern: 1) the seismicity rate is low when approaching the Azores and
Iceland (reaching values as low as 10 events/d°), while it peaks to 70 events/d° in the
vicinity of the Gibbs FZ (Figure III.9a). 2) moreover, the latitudinal distribution of the
seismicity hints at an asymmetric influence of the Azores hotpot on the MAR: 720
65
Chapter III – Azores Hotspot Influence on the MAR seismicity
Figure III.8 - Earthquake epicenters from June 1st to feb 28th 2003. Black dots epicenters from hydrophones. White triangles events registered in the NEIC seismic catalogue. White circles point the hydrophone position from the NSF southern array. Triangles point the SIRENA hydrophone locations.
66
Tectono-Magmatic Processes in the Azores Triple Junction
events have been localized inside the SIRENA array (between latitudes 40°20'N and
50°30'N), while 453 earthquakes have occurred south of the Azores, along a section of
the MAR of similar latitudinal extent (28°N > 38°N).
The spatial distribution of the seismicity rates (Figure III.9a) along the MAR anti-
correlates well, at long wavelengths, with the zero-age depths (Figure III.9c). These
correlations fit in well with the now classical image of a hotspot-influenced slow
spreading centre: globally thicker and more ductile crust would be emplaced along ridge
segments closer to the hotspot, while the thinner, colder and more brittle crust emplaced
along ridge sections free from the hotspot influence would produce a higher seismicity.
Finally, the along-ridge seismicity distribution correlates with the Vs velocity anomalies
at 100 km in the upper mantle (Figure III.9b). It is thus proposed that the thermal regime
of the upper mantle, as it results in variations of the rheology and thickness of the crust,
would be an important factor controlling the spatial distribution of the seismicty. The
later could then be used as an additional tool to characterize the along-ridge
asymmetrical influence of the Azores and Iceland hotspots on the MAR slow-spreading
center, as it was proposed by Goslin et al. (1999). Our study thus confirms the
asymmetry which was inferred earlier from global studies (e.g. Goslin et al., 1998;
1999).
III.9 Time-wise seismicity distributions along the MAR
Similarly to what was observed for the spatial distribution of the seismicity along the
Ridge, and even if a ten-month period cannot be considered as fully representative,
time-wise distributions of the seismicity along the MAR (Figure III.10) show very
different behaviours: 1) some sections of the MAR, which are considered as undergoing
little influenced by the Azores hotspot (e.g. the 46°-49°N section) are the loci of more
67
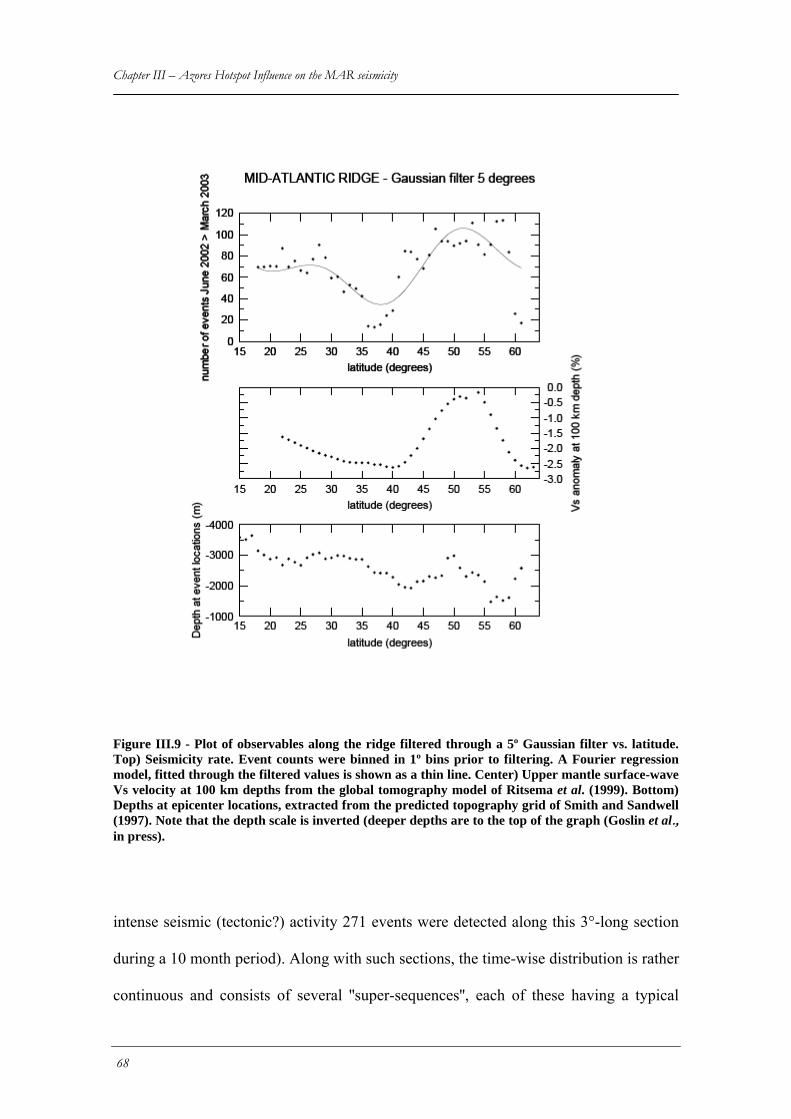
Chapter III – Azores Hotspot Influence on the MAR seismicity
Figure III.9 - Plot of observables along the ridge filtered through a 5º Gaussian filter vs. latitude. Top) Seismicity rate. Event counts were binned in 1º bins prior to filtering. A Fourier regression model, fitted through the filtered values is shown as a thin line. Center) Upper mantle surface-wave Vs velocity at 100 km depths from the global tomography model of Ritsema et al. (1999). Bottom) Depths at epicenter locations, extracted from the predicted topography grid of Smith and Sandwell (1997). Note that the depth scale is inverted (deeper depths are to the top of the graph (Goslin et al., in press).
intense seismic (tectonic?) activity 271 events were detected along this 3°-long section
during a 10 month period). Along with such sections, the time-wise distribution is rather
continuous and consists of several ''super-sequences'', each of these having a typical
68
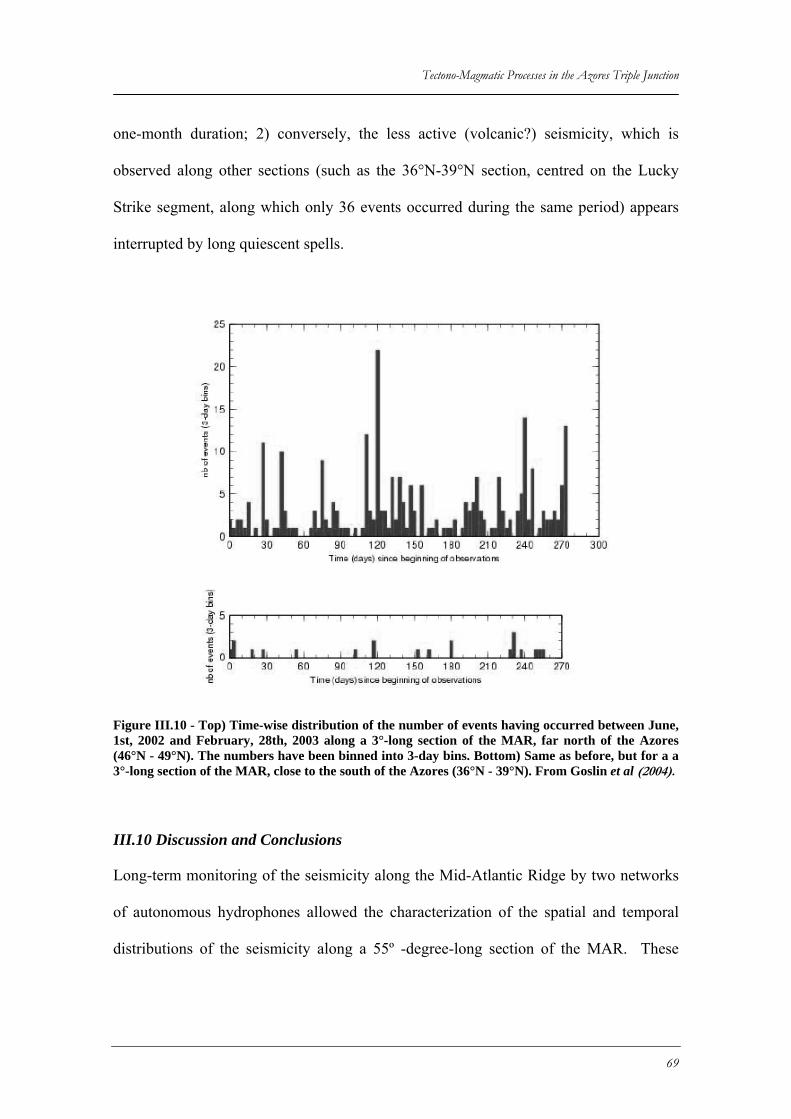
Tectono-Magmatic Processes in the Azores Triple Junction
one-month duration; 2) conversely, the less active (volcanic?) seismicity, which is
observed along other sections (such as the 36°N-39°N section, centred on the Lucky
Strike segment, along which only 36 events occurred during the same period) appears
interrupted by long quiescent spells.
Figure III.10 - Top) Time-wise distribution of the number of events having occurred between June, 1st, 2002 and February, 28th, 2003 along a 3°-long section of the MAR, far north of the Azores (46°N - 49°N). The numbers have been binned into 3-day bins. Bottom) Same as before, but for a a 3°-long section of the MAR, close to the south of the Azores (36°N - 39°N). From Goslin et al (2004).
III.10 Discussion and Conclusions
Long-term monitoring of the seismicity along the Mid-Atlantic Ridge by two networks
of autonomous hydrophones allowed the characterization of the spatial and temporal
distributions of the seismicity along a 55º -degree-long section of the MAR. These
69
Chapter III – Azores Hotspot Influence on the MAR seismicity distributions bring new insights both on ridge/hotspot interactions and on accretion
processes along a hotspot-influenced spreading center.
At long wavelengths, along-ridge seismicity rates appear closely correlated with other
observables which characterize the thermal regime of the crust and upper mantle. These
spatial correlations seem to confirm that the strong influence exerted on the MAR by the
Azores plume extends over a long distance to the South and that its extension is more
limited to the north of the hotspot.
At the ridge segment scale, time-wise epicentre distributions show that two different
modes can be observed in the MAR seismicity: A high and constant seismicity rate
would result from dominantly tectonic processes characterize colder sections of the
Ridge. Conversely, a more episodic low-rate seismicity, which would be due to
magmatic processes is observed near the centers of globally hotter - because they are
located closer to the Azores hotspot?- segments.
It is however important to recall that the Azores plateau interrupts the SOFAR channel
therefore inhibiting the accurate detection of hydro-accoustic events from the Azores
plateau. This might lead to a biased analysis when transported to the Azores Plateau
context. In the Azores, earthquake activity registered by local and global land based
seismological networks, (as we shall address in the next chapter) is abundant in the
some of the regions within the plateau, noticeably along the Terceira axis, as a result of
tectonic and volcanic activity. In the Azores the thermal structure and consequently the
lithosphere thickness along the Terceira axis are almost certainly quite different from
those of the MAR north and south of the Azores, and probably progressively thicker
70
Tectono-Magmatic Processes in the Azores Triple Junction
towards the Gloria fault (Bier, 2005), therefore favoring the onset of seismicity due to
increase in thickness of brittle sections of the lithosphere.
71

Tectono-Magmatic Processes in the Azores Triple Junction
Chapter IV - Defining the present day EU-NUB plate boundary
IV.1 Introduction
The determination of the Terceira axis segmentation pattern, the location of actively
spreading segments and discontinuities, the areal extent of the plate boundary itself, are
not easily definable. Poor definition of the plate boundary location arises probably from
the combination of factors like the extremely reduced spreading rate promoting an
unstructured pattern of magnetic anomalies or the highly discontinuous nature of
accretion, and the complex tectonic pattern. For example, it remains unclear, due to
absence of clear age relations which structures within the Terceira axis are actively
deforming, and if accretion is taking place in the topographical highs or lows, in the
submarine areas.
The beginning of GPS observation in the Azores with the installation in 1998 of the
TANGO (Trans-Atlantic Network for Geodynamics and Oceanography) project (Bastos
et al., 1998) has enabled to study from the geodetic point of view the present day
displacement field associated with the Azores Triple Junction.
In this chapter we review the models presented by different authors addressing the
tectonic pattern of the EU-NUB plate boundary in the present day. We summarize the
main seismo-tectonic observations and discuss new geodetic data presented by
Fernandes et al. (2006). We first examine segmentation geometry by comparing the
73
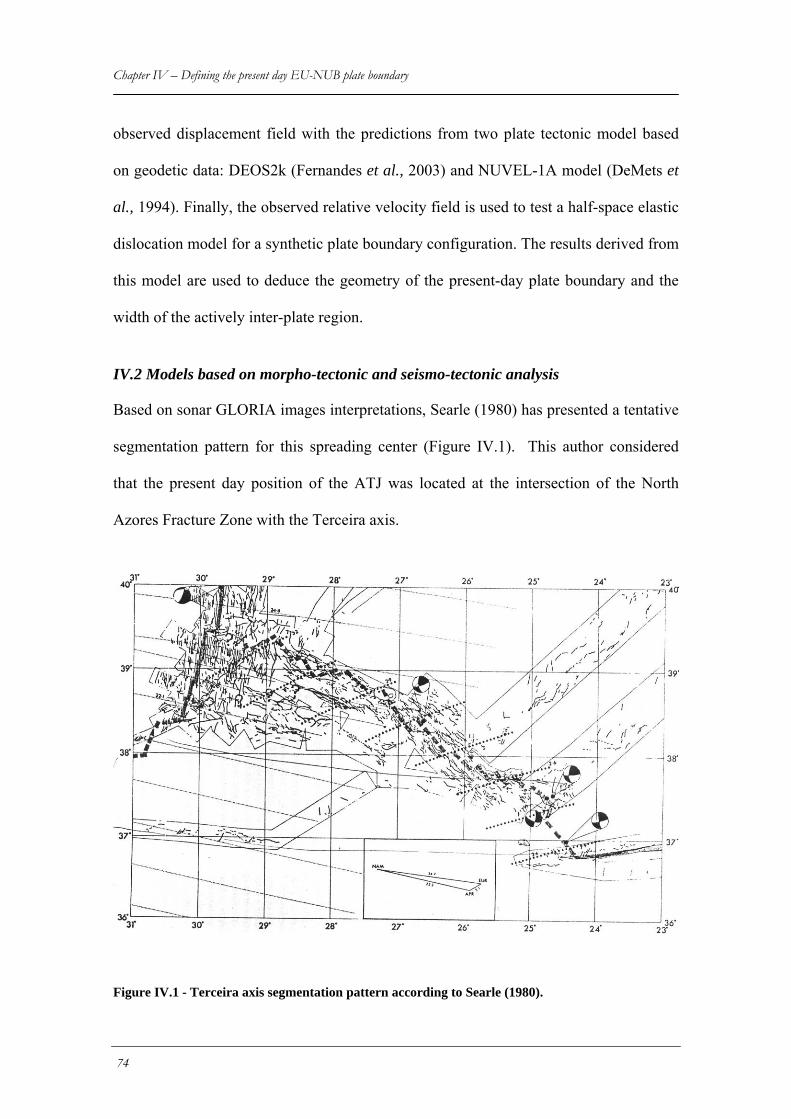
Chapter IV – Defining the present day EU-NUB plate boundary observed displacement field with the predictions from two plate tectonic model based
on geodetic data: DEOS2k (Fernandes et al., 2003) and NUVEL-1A model (DeMets et
al., 1994). Finally, the observed relative velocity field is used to test a half-space elastic
dislocation model for a synthetic plate boundary configuration. The results derived from
this model are used to deduce the geometry of the present-day plate boundary and the
width of the actively inter-plate region.
IV.2 Models based on morpho-tectonic and seismo-tectonic analysis
Based on sonar GLORIA images interpretations, Searle (1980) has presented a tentative
segmentation pattern for this spreading center (Figure IV.1). This author considered
that the present day position of the ATJ was located at the intersection of the North
Azores Fracture Zone with the Terceira axis.
Figure IV.1 - Terceira axis segmentation pattern according to Searle (1980).
74
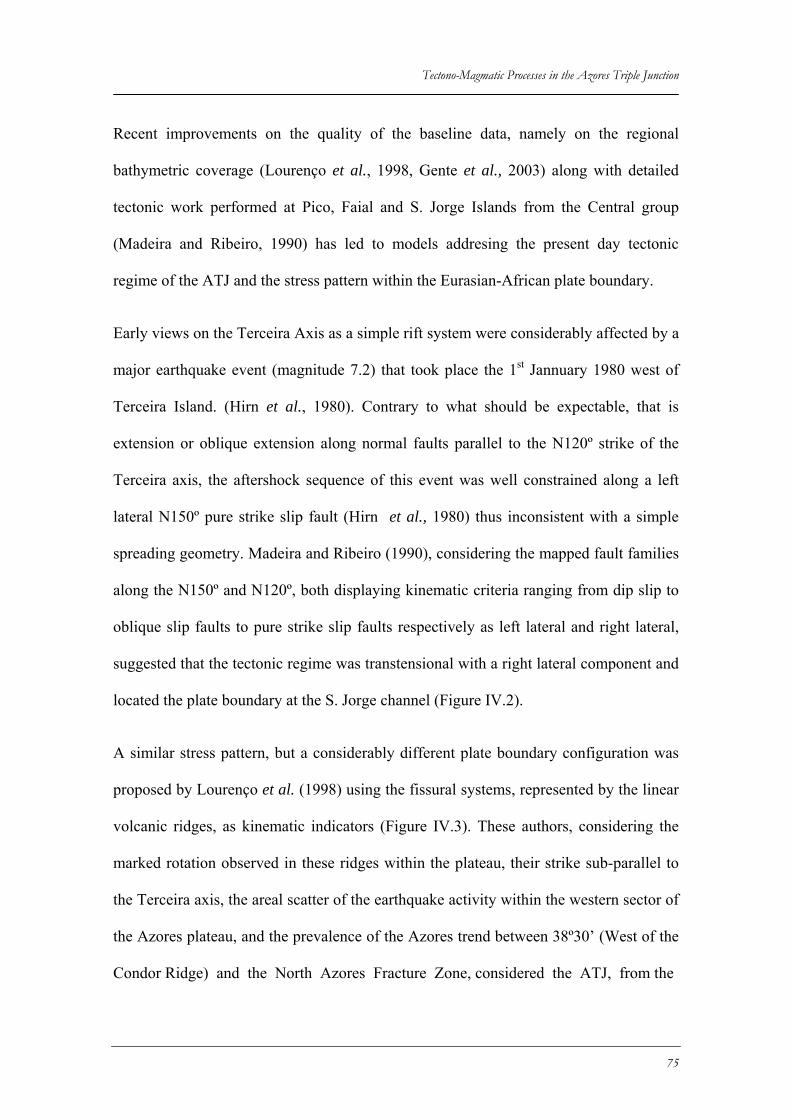
Tectono-Magmatic Processes in the Azores Triple Junction
Recent improvements on the quality of the baseline data, namely on the regional
bathymetric coverage (Lourenço et al., 1998, Gente et al., 2003) along with detailed
tectonic work performed at Pico, Faial and S. Jorge Islands from the Central group
(Madeira and Ribeiro, 1990) has led to models addresing the present day tectonic
regime of the ATJ and the stress pattern within the Eurasian-African plate boundary.
Early views on the Terceira Axis as a simple rift system were considerably affected by a
major earthquake event (magnitude 7.2) that took place the 1st Jannuary 1980 west of
Terceira Island. (Hirn et al., 1980). Contrary to what should be expectable, that is
extension or oblique extension along normal faults parallel to the N120º strike of the
Terceira axis, the aftershock sequence of this event was well constrained along a left
lateral N150º pure strike slip fault (Hirn et al., 1980) thus inconsistent with a simple
spreading geometry. Madeira and Ribeiro (1990), considering the mapped fault families
along the N150º and N120º, both displaying kinematic criteria ranging from dip slip to
oblique slip faults to pure strike slip faults respectively as left lateral and right lateral,
suggested that the tectonic regime was transtensional with a right lateral component and
located the plate boundary at the S. Jorge channel (Figure IV.2).
A similar stress pattern, but a considerably different plate boundary configuration was
proposed by Lourenço et al. (1998) using the fissural systems, represented by the linear
volcanic ridges, as kinematic indicators (Figure IV.3). These authors, considering the
marked rotation observed in these ridges within the plateau, their strike sub-parallel to
the Terceira axis, the areal scatter of the earthquake activity within the western sector of
the Azores plateau, and the prevalence of the Azores trend between 38º30’ (West of the
Condor Ridge) and the North Azores Fracture Zone, considered the ATJ, from the
75
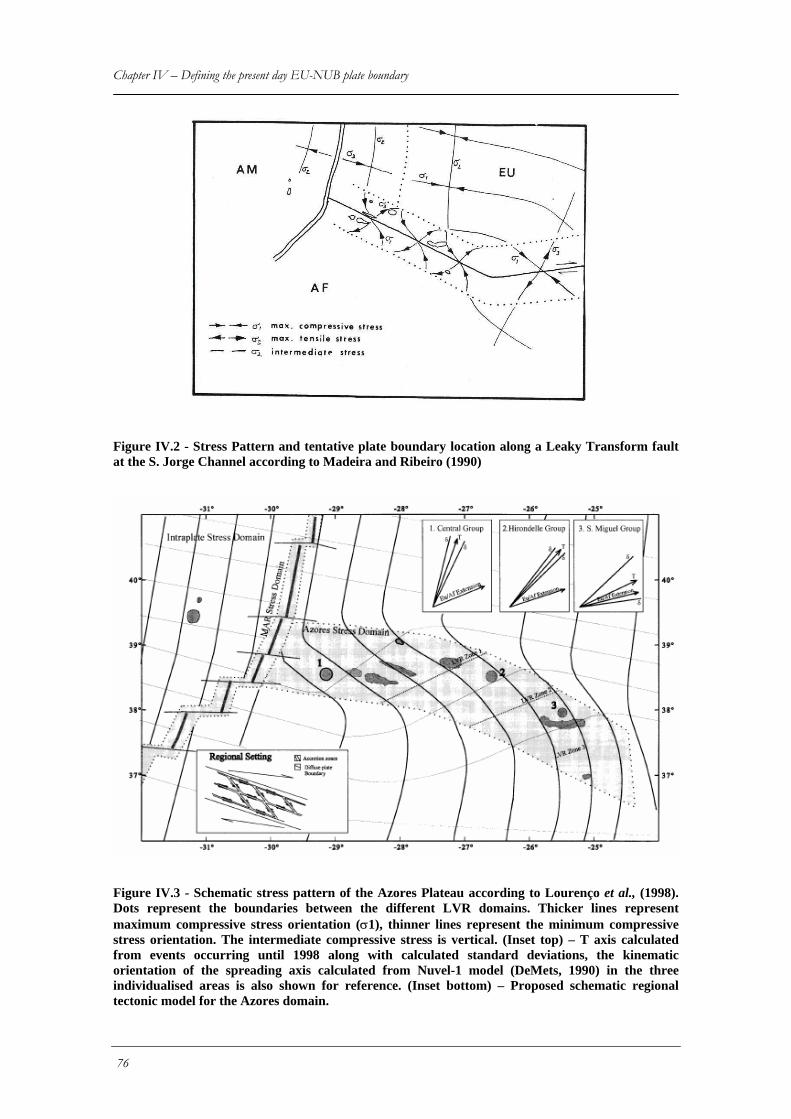
Chapter IV – Defining the present day EU-NUB plate boundary
Figure IV.2 - Stress Pattern and tentative plate boundary location along a Leaky Transform fault at the S. Jorge Channel according to Madeira and Ribeiro (1990)
Figure IV.3 - Schematic stress pattern of the Azores Plateau according to Lourenço et al., (1998). Dots represent the boundaries between the different LVR domains. Thicker lines represent maximum compressive stress orientation (σ1), thinner lines represent the minimum compressive stress orientation. The intermediate compressive stress is vertical. (Inset top) – T axis calculated from events occurring until 1998 along with calculated standard deviations, the kinematic orientation of the spreading axis calculated from Nuvel-1 model (DeMets, 1990) in the three individualised areas is also shown for reference. (Inset bottom) – Proposed schematic regional tectonic model for the Azores domain.
76
Tectono-Magmatic Processes in the Azores Triple Junction
tectonic point of view, as a distributed feature. They also observed the right lateral
transtensional character of the Azores domain which is interpreted as simultaneously
acting as an ultra-slow spreading centre at the Terceira axis and a transfer zone which
accommodates the dextral differential movement between stables Eurasian and African
plates.
Miranda et al., (1998) considering the earthquake distribution from local seismic
network, data form a passive OBS survey and the focal mechanisms from Azores
events, also inferred a transtensional regime from the tectonic fault system, where EU-
AF inter-plate right lateral shear would be partitioned between the two fault systems in a
framework of a tectonic block model (Figure IV.4). According to these authors, the
interplay between the two faulting directions defines the current morpho-structure of the
Terceira axis, where the basins are considered to coincide with tectonic blocks. The
shear deformation along the plate boundary would be accommodated by rotation of the
different fault controlled tectonic blocks.
More recently, Vogt and Jung (2003) returned to early views which approached
Terceira axis as a classical rift system. They classified the Terceira axis as a young (< 1
Ma) intra-oceanic oblique spreading rift system. Noticing the extremely low spreading
rates between EU and NUB predicted by NUVEL1A, and by comparing the first order
morphological structures of the Terceira axis with other ultra-slow and super-slow ridge
systems such as the Garkel, The Mohns- Knipovitch or the SWIR ridge systems, they
conclude that the Terceira axis (designated by these authors as Terceira rift) is the
slowest spreading environment in the world ridge system.
77
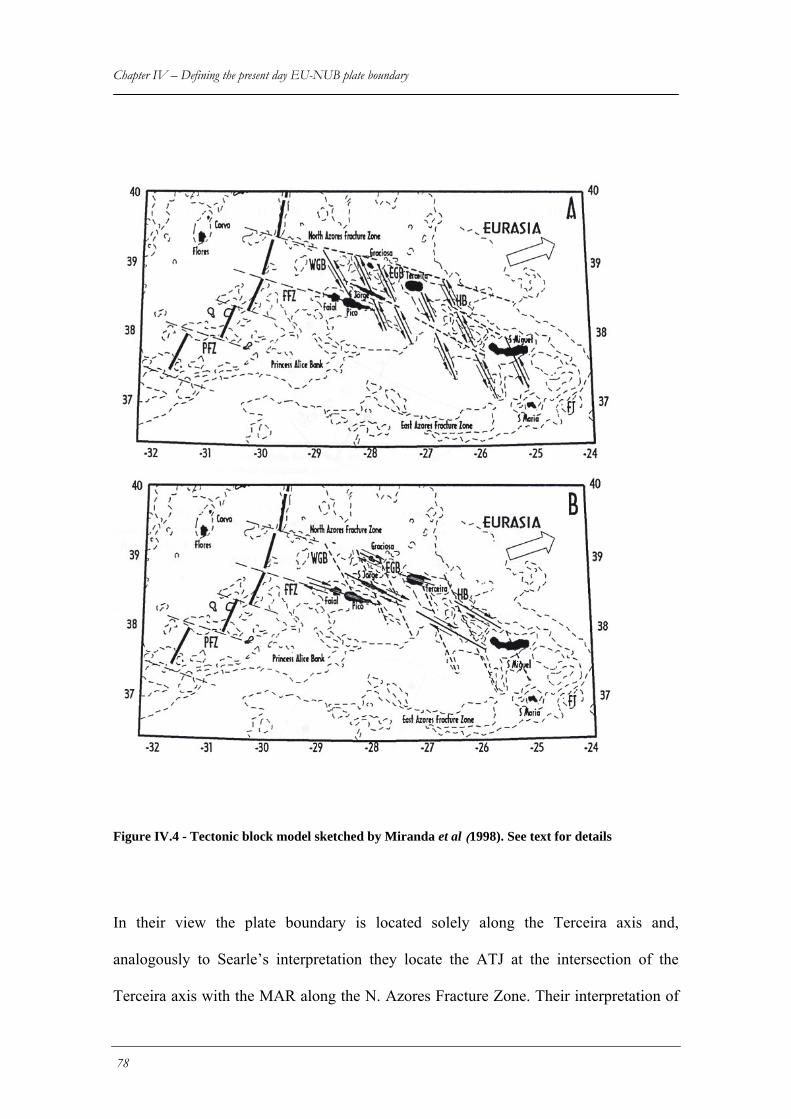
Chapter IV – Defining the present day EU-NUB plate boundary
Figure IV.4 - Tectonic block model sketched by Miranda et al (1998). See text for details
In their view the plate boundary is located solely along the Terceira axis and,
analogously to Searle’s interpretation they locate the ATJ at the intersection of the
Terceira axis with the MAR along the N. Azores Fracture Zone. Their interpretation of
78
Tectono-Magmatic Processes in the Azores Triple Junction
Terceira axis as an oblique rift zone excludes the block tectonic model presented by
Miranda et al. (1998) as Terceira axis basins are considered to correspond merely to
segments of the rift valley which were not filled with volcanism.
Volcano-tectonic activity on the inner sectors of the plateau south of the Terceira axis is
disregarded by these authors as significant and part of the plate boundary zone
processes. Rather they consider that these structures are linked to and are a result of ATJ
past northward migrating history in close link to the AHS migration northwards. They
interpret their growth as a result of magmatism remnant of HS activity under short-lived
presently abandoned rift axes. These interpretations and the significance of the linear
volcanic ridges as a part of the actual plate boundary processes will be discussed more
thoroughly in the next chapter.
IV.3 Earthquake data
IV.3.1 Epicenter spatial distributions
The Azores plateau displays quite a high level of seismicity but of low magnitude. The
epicentral locations shown in Figure IV.5 comprise the time span between 1994 and
2004, and are taken from the ISC (“international Seismological Catalogue”). We opted
to disregard epicenters from previous dates because 1994 was the year were the local
based SIVISA network entered in operation and corresponds to a better azimuthal
coverage and better constrained epicenter locations. Nevertheless, the period chosen
covers the time span of GPS TANGO network observations and provides a good
reference on how active processes distribute across the plateau.
The seismicity displays some amount of scattering but is largely aligned along the
Terceira Axis in a band ca. 80 km wide for its central and eastern part., essentially
79
Chapter IV – Defining the present day EU-NUB plate boundary confined within its northern and southern walls. In the western sector the band of
seismicity widens to about 180 km, and is limited to the south by Condor volcanic ridge
and the northen wall of Terceira axis between Terceira and Western Graciosa basin.
It is worth noting that the majority of epicenters are located on submarine areas. The
Islands generally display few occurrences. Islands such as Pico, S. Jorge, Graciosa,
Terceira and S. Maria are earthquake depleted. Exceptions to this scenario are S. Miguel
and Faial Islands. In the case of Faial, the earthquake cluster located NE of the Island
corresponds to main shock and aftershock sequences resulting from the 1999 destructive
earthquake that struck the Island, with epicenter NE of the Island (See section IV.4).
The earthquake activity in S, Miguel is of low magnitude swarm like type and is
probably related with volcanic activity at two volcanic systems within the Island, The
Sete cidades caldera on the NW tip of the Island and the Fogo Caldera a volcano located
near the center of the Island within the NW-SE trending Congro graben. Both systems
have been displaying signs of activity in recent times.
Other spatial clusters of activity along time are mainly focused, despite the scatter,
seawards west of volcanic ridges: Condor, Pico-Faial S. Jorge and within Terceira axis:
West Graciosa Basin and at the SE Terceira ridge between D. João de Castro bank and
Terceira Island
IV.3.2 Focal Mechanisms at the Azores
There are limited moment centroid solutions available at the Azores. These are
presented in Figure IV.5 following Harvard CMT convention. The vast majority of the
solutions are of low magnitude pure normal faulting events or with a minor component
of right lateral strike slip along N120º planes (Grimison and Chen, 1986; Bufforn et al,.
80
Tectono-Magmatic Processes in the Azores Triple Junction
1988). These events present normally traction T axes directions nearly perpendicular to
the Terceira axis at each location. This progressive rotation of tectonic directions from
WNW-ESE to nearly N-S at the intersection of the Terceira axis with the Gloria fault
was already recognized by Luis (1996) and Lourenço et al., (1998).
Two thrust events are documented in the Azores region. One is located north of the D. J.
Castro bank and was re-evaluated by Buforn et al. (1988) as a dominantly right lateral
strike slip event along a nearly East-West direction or conversely a left lateral strike slip
along a N-S fault plane. Another thrust event is located SE of S. Miguel near the
formigas islets. Its significance remains unclear, but might be related with structural
complexities at the intersection between the Terceira axis and the Gloria fault.
The highest magnitude events registered instrumentally that have occurred in the Azores
are of pure left lateral strike slip faulting along directions ranging NW-SE to N-S. This
faulting direction was first interpreted by analysis of aftershock epicenter distributions
(Hirn et al., 1980) following the highly destructive M = 7.2, Terceira, 1st Jannuray 1980
earthquake with epicenter at the Eastern Graciosa Basin.
IV.4 The Faial 1998 earthquake
This earthquake occurred on July 9th 1998, with epicenter at the sea 10 km NE of Faial
at a SIVISA computed location of 38º38.05’N 28º31.38’ W (Senos et al., 1998). This
event had a Mw = 6.1 and caused 8 casualties and 1500 homeless. Figure IV.5 displays
the focal mechanism for this event. Two conjugate planes determined are: Strike N61º
dip 82º and rake -180º and strike 151º, dip 90º, rake -8º.
Soon after the main shock, the seismological network was up-graded and documented
with very detail the aftershock sequence that followed, registering thousands of small
81
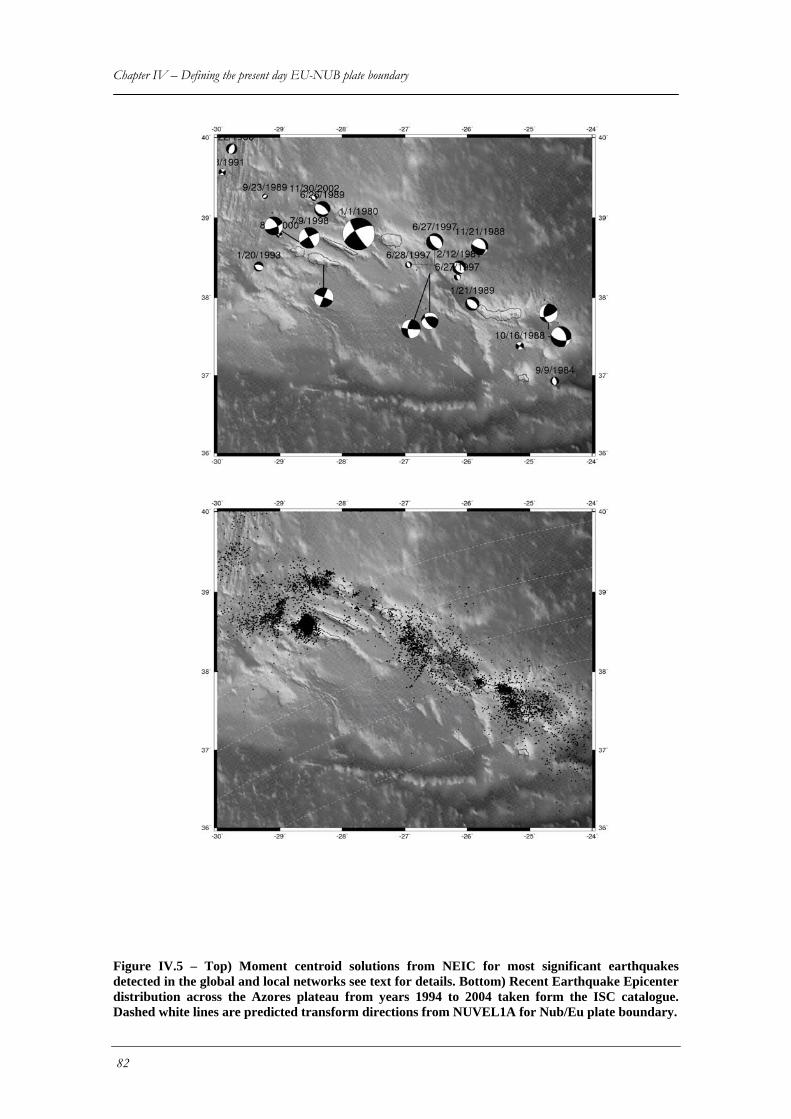
Chapter IV – Defining the present day EU-NUB plate boundary
Figure IV.5 – Top) Moment centroid solutions from NEIC for most significant earthquakes detected in the global and local networks see text for details. Bottom) Recent Earthquake Epicenter distribution across the Azores plateau from years 1994 to 2004 taken form the ISC catalogue. Dashed white lines are predicted transform directions from NUVEL1A for Nub/Eu plate boundary.
82
Tectono-Magmatic Processes in the Azores Triple Junction
magnitude events (Dias, 2006). The resulting epicenter distribution pattern displays a
major alignment along the N151º direction but is cut trough by epicenter alignments
which follow the other conjugate nodal plane direction. Fernandes et al. (2002) using
GPS data from the TANGO network, isolated the co-seismic displacement component
and modeled the dislocations provided by the two possible fault solutions in an
homogeneous elastic half-space. Results from their modeling procedure did not provide
any additional tectonic constraints, as both fault solutions provided equally satisfactory
fits to the observations.
More recently, Dias (2006) performed a complete re-evaluation of the earthquake
sequence following the main shock and aftershock epicenters have been re-located and
focal mechanisms resultant from that event have been revised and up-graded from
previous publications on the subject. Considering the aftershocks epicentral distribution,
they cluster in two nearly ortogonal tectonic directions following the main shock
rupture. Focal mechanisms display a complex pattern, and in any case, both possible
fault planes are clearly discordant from the orientation of Faial Island main faults
(Figure IV.6). Ruptures in the N60º direction, are dominantly oblique right lateral
normal faulting events. On the contrary focal mechanism distributed along the N160-
N170º vary between dip slip normal events and others which display a marked left
lateral strike slip component. The significance of these strike slip events, for the
tectonics of the present day tectonics of the Triple Junction will be dealt with in chapter
VIII.
83
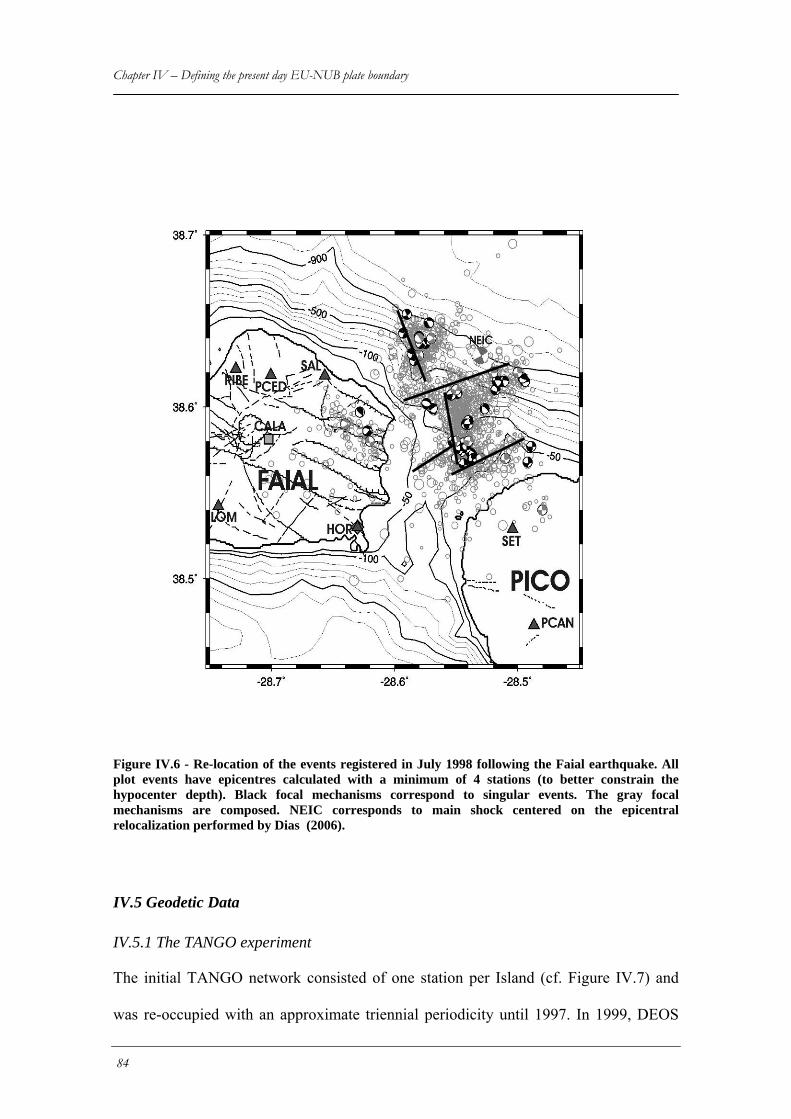
Chapter IV – Defining the present day EU-NUB plate boundary
Figure IV.6 - Re-location of the events registered in July 1998 following the Faial earthquake. All plot events have epicentres calculated with a minimum of 4 stations (to better constrain the hypocenter depth). Black focal mechanisms correspond to singular events. The gray focal mechanisms are composed. NEIC corresponds to main shock centered on the epicentral relocalization performed by Dias (2006).
IV.5 Geodetic Data
IV.5.1 The TANGO experiment
The initial TANGO network consisted of one station per Island (cf. Figure IV.7) and
was re-occupied with an approximate triennial periodicity until 1997. In 1999, DEOS
84
Tectono-Magmatic Processes in the Azores Triple Junction
(Department of Earth Observation and Satellite systems) and AOUP (Astronomical
Observatory of University of Porto) initiated a collaboration with the aim of maintaining
and expanding the original network. In September-October 1999, 26 new sites were
observed for the first time on the Central Group of the Azores Archipelago. In addition,
two permanent GPS stations were installed on Faial (2000) and Terceira (2001). In
2001, CGUL (University of Lisbon Geophysical Center), in collaboration with DEOS
and AOUP, added 30 new GPS stations in Terceira (May 2001, see Navarro et al.,
2003) and Faial and Pico (October 2001) Islands. These stations are being observed
every year to address the intra-Island displacement field over the Central Group. Figure
IV.7 presents the actual GPS network in the Central Group of the Azores Archipelago.
This will be referred to here as the Extended TANGO network.
Results from the initial TANGO network for the period 1988-1997 were already
presented by Bastos et al. (1998). A new evaluation of the TANGO network for the
1993-2000 period was presented by Fernandes et al. (2004). The 1988 and 1991
TANGO campaigns were not considered due to their low quality. The average opening
rate of the Middle Atlantic Ridge at the latitude of Graciosa/Corvo Islands was re-
evaluated as 23 mm/yr, consistent with global kinematic models, such as NUVEL-1A
(DeMets et al., 1994), and with local studies based on marine magnetic anomalies (Luis,
1996).
IV.5.2 GPS Results
The processing schemes for data used in this chapter are detailed in Fernandes et al.,
2006. They use daily solutions from each campaign and combine them into a single
campaign solution. Table IV.1 lists the overall r.m.s. of the residuals for the reference
stations used in each campaign. The overall residuals in all campaigns range between 1
85
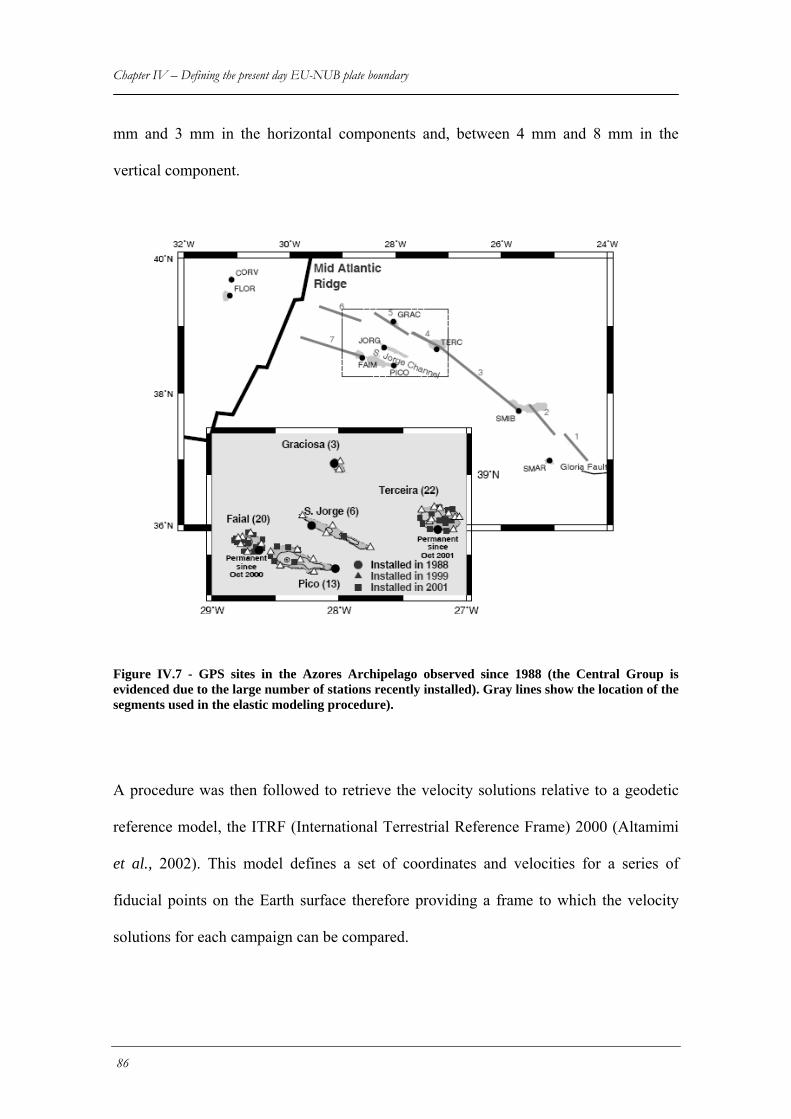
Chapter IV – Defining the present day EU-NUB plate boundary mm and 3 mm in the horizontal components and, between 4 mm and 8 mm in the
vertical component.
Figure IV.7 - GPS sites in the Azores Archipelago observed since 1988 (the Central Group is evidenced due to the large number of stations recently installed). Gray lines show the location of the segments used in the elastic modeling procedure).
A procedure was then followed to retrieve the velocity solutions relative to a geodetic
reference model, the ITRF (International Terrestrial Reference Frame) 2000 (Altamimi
et al., 2002). This model defines a set of coordinates and velocities for a series of
fiducial points on the Earth surface therefore providing a frame to which the velocity
solutions for each campaign can be compared.
86
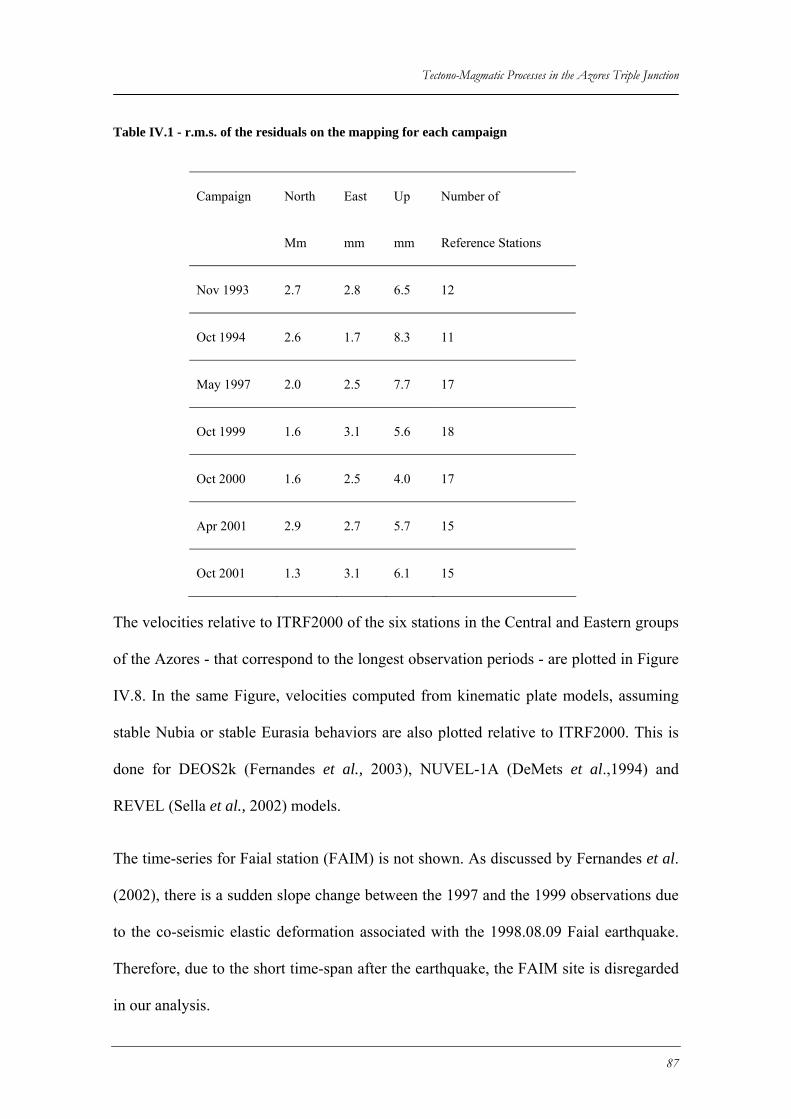
Tectono-Magmatic Processes in the Azores Triple Junction
Table IV.1 - r.m.s. of the residuals on the mapping for each campaign
Campaign North East Up Number of
Mm mm mm Reference Stations
Nov 1993 2.7 2.8 6.5 12
Oct 1994 2.6 1.7 8.3 11
May 1997 2.0 2.5 7.7 17
Oct 1999 1.6 3.1 5.6 18
Oct 2000 1.6 2.5 4.0 17
Apr 2001 2.9 2.7 5.7 15
Oct 2001 1.3 3.1 6.1 15
The velocities relative to ITRF2000 of the six stations in the Central and Eastern groups
of the Azores - that correspond to the longest observation periods - are plotted in Figure
IV.8. In the same Figure, velocities computed from kinematic plate models, assuming
stable Nubia or stable Eurasia behaviors are also plotted relative to ITRF2000. This is
done for DEOS2k (Fernandes et al., 2003), NUVEL-1A (DeMets et al.,1994) and
REVEL (Sella et al., 2002) models.
The time-series for Faial station (FAIM) is not shown. As discussed by Fernandes et al.
(2002), there is a sudden slope change between the 1997 and the 1999 observations due
to the co-seismic elastic deformation associated with the 1998.08.09 Faial earthquake.
Therefore, due to the short time-span after the earthquake, the FAIM site is disregarded
in our analysis.
87
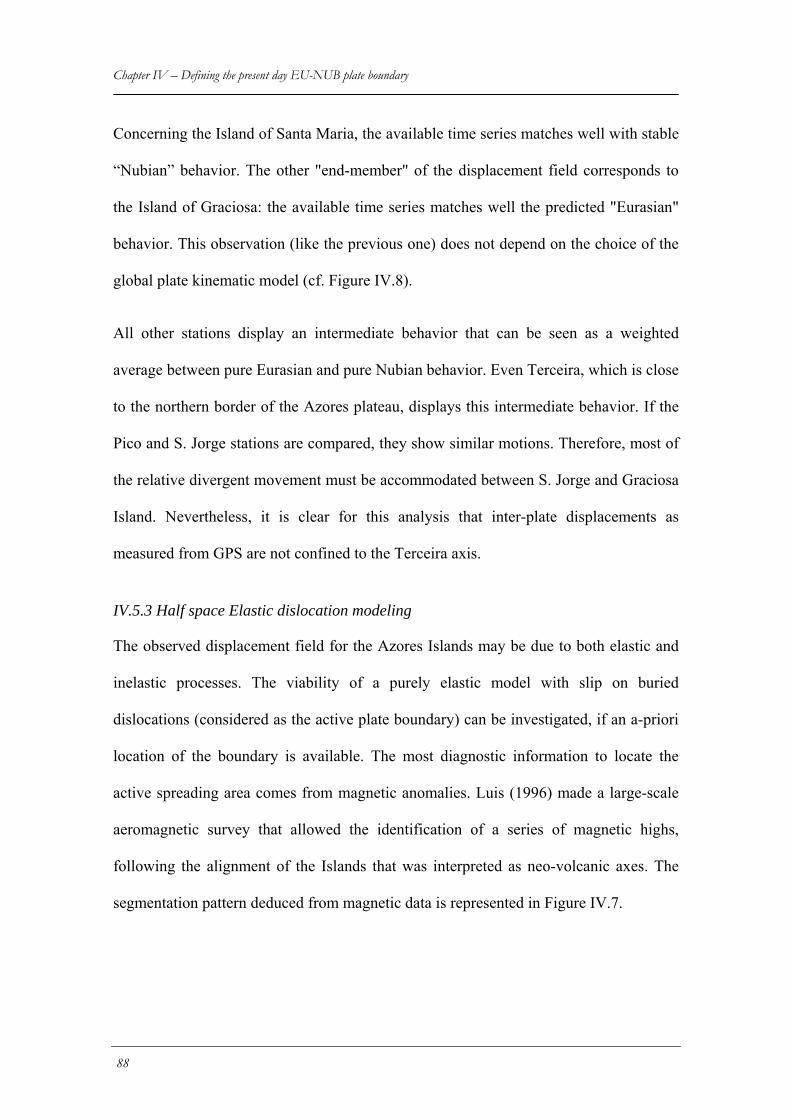
Chapter IV – Defining the present day EU-NUB plate boundary Concerning the Island of Santa Maria, the available time series matches well with stable
“Nubian” behavior. The other "end-member" of the displacement field corresponds to
the Island of Graciosa: the available time series matches well the predicted "Eurasian"
behavior. This observation (like the previous one) does not depend on the choice of the
global plate kinematic model (cf. Figure IV.8).
All other stations display an intermediate behavior that can be seen as a weighted
average between pure Eurasian and pure Nubian behavior. Even Terceira, which is close
to the northern border of the Azores plateau, displays this intermediate behavior. If the
Pico and S. Jorge stations are compared, they show similar motions. Therefore, most of
the relative divergent movement must be accommodated between S. Jorge and Graciosa
Island. Nevertheless, it is clear for this analysis that inter-plate displacements as
measured from GPS are not confined to the Terceira axis.
IV.5.3 Half space Elastic dislocation modeling
The observed displacement field for the Azores Islands may be due to both elastic and
inelastic processes. The viability of a purely elastic model with slip on buried
dislocations (considered as the active plate boundary) can be investigated, if an a-priori
location of the boundary is available. The most diagnostic information to locate the
active spreading area comes from magnetic anomalies. Luis (1996) made a large-scale
aeromagnetic survey that allowed the identification of a series of magnetic highs,
following the alignment of the Islands that was interpreted as neo-volcanic axes. The
segmentation pattern deduced from magnetic data is represented in Figure IV.7.
88
Tectono-Magmatic Processes in the Azores Triple Junction
igure IV.8 - Horizontal motions for the six TANGO sites with longest observation periods in the ral and Eastern groups. Estimated motion (circle) is fitted through the successive station
positions obtained from the campaign solutions. Predicted motions according with the DEOS2k
FCent
(star), NUVEL-1A (triangle), and REVEL (square) models correspond to those of stable Eurasia and stable Nubia. Elastic model prediction (diamond) uses DEOS2k for boundary conditions. Uncertainties are shown as 95 % confidence ellipses.
89
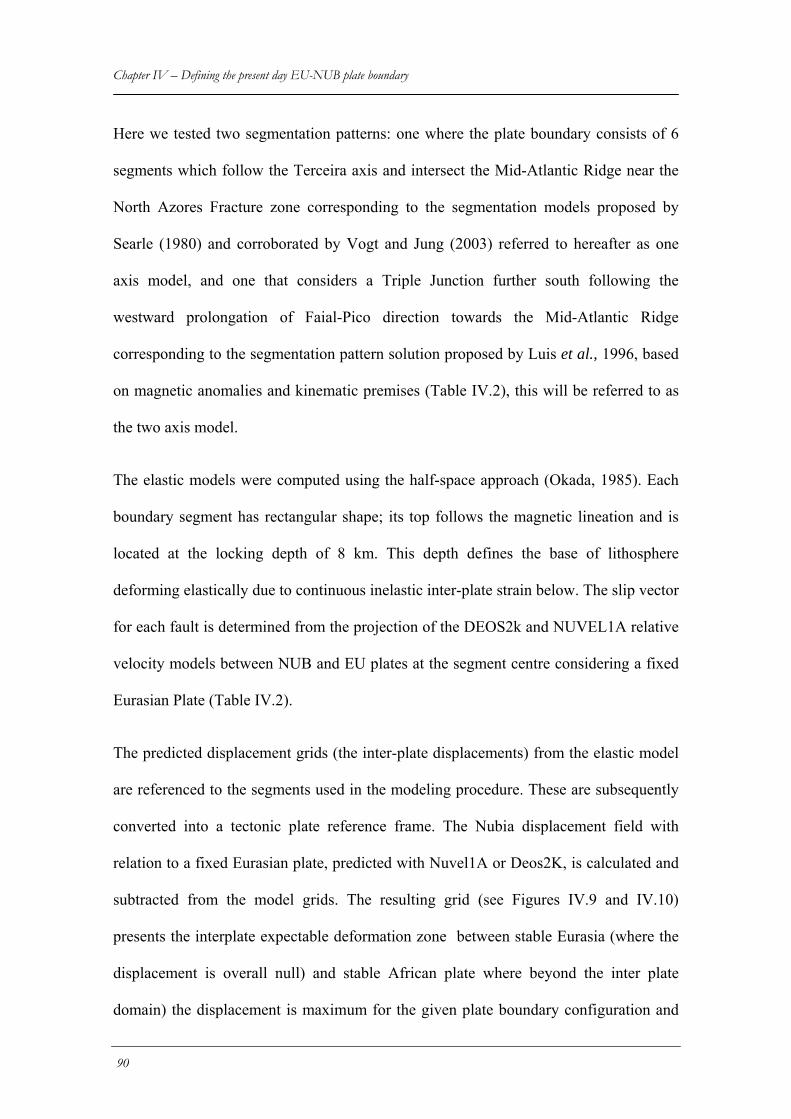
Chapter IV – Defining the present day EU-NUB plate boundary Here we tested two segmentation patterns: one where the plate boundary consists of 6
segments which follow the Terceira axis and intersect the Mid-Atlantic Ridge near the
North Azores Fracture zone corresponding to the segmentation models proposed by
Searle (1980) and corroborated by Vogt and Jung (2003) referred to hereafter as one
axis model, and one that considers a Triple Junction further south following the
westward prolongation of Faial-Pico direction towards the Mid-Atlantic Ridge
corresponding to the segmentation pattern solution proposed by Luis et al., 1996, based
on magnetic anomalies and kinematic premises (Table IV.2), this will be referred to as
the two axis model.
The elastic models were computed using the half-space approach (Okada, 1985). Each
rids (the inter-plate displacements) from the elastic model
domain) the displacement is maximum for the given plate boundary configuration and
boundary segment has rectangular shape; its top follows the magnetic lineation and is
located at the locking depth of 8 km. This depth defines the base of lithosphere
deforming elastically due to continuous inelastic inter-plate strain below. The slip vector
for each fault is determined from the projection of the DEOS2k and NUVEL1A relative
velocity models between NUB and EU plates at the segment centre considering a fixed
Eurasian Plate (Table IV.2).
The predicted displacement g
are referenced to the segments used in the modeling procedure. These are subsequently
converted into a tectonic plate reference frame. The Nubia displacement field with
relation to a fixed Eurasian plate, predicted with Nuvel1A or Deos2K, is calculated and
subtracted from the model grids. The resulting grid (see Figures IV.9 and IV.10)
presents the interplate expectable deformation zone between stable Eurasia (where the
displacement is overall null) and stable African plate where beyond the inter plate
90
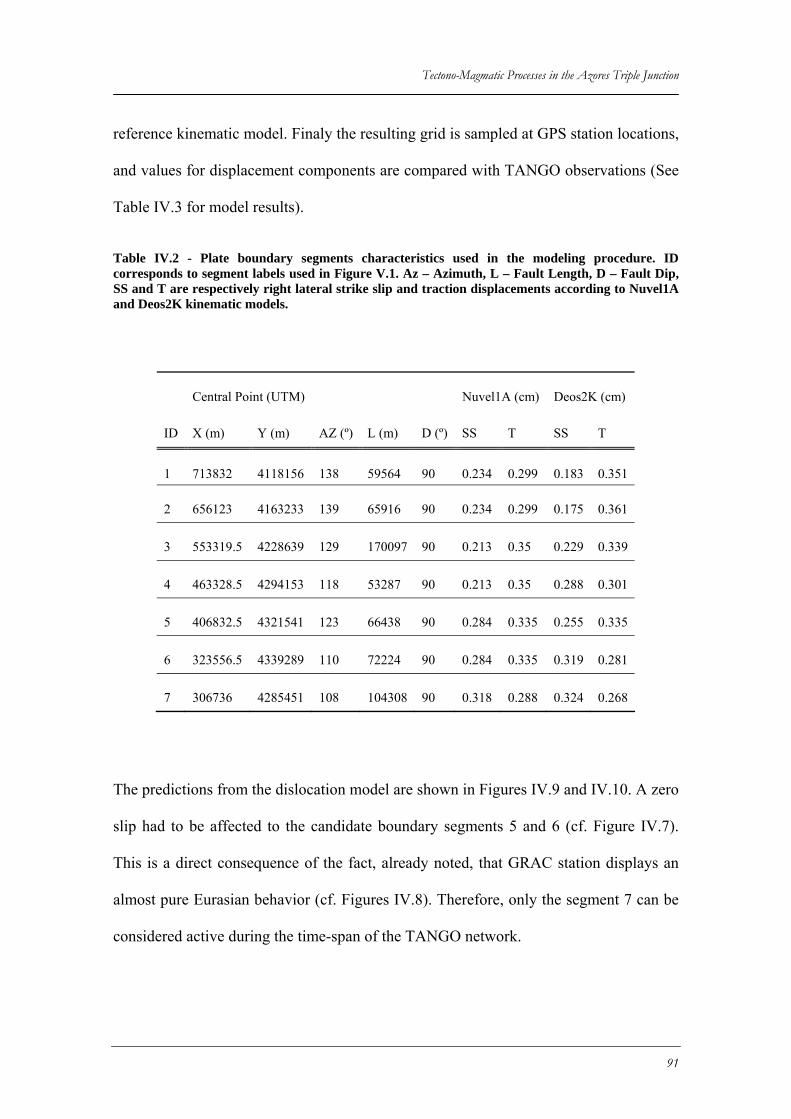
Tectono-Magmatic Processes in the Azores Triple Junction
reference kinematic model. Finaly the resulting grid is sampled at GPS station locations,
and values for displacement components are compared with TANGO observations (See
Table IV.3 for model results).
corresponds to segment labels usedSS and T are respectively right lateral
Table IV.2 - Plate boundary segments characteristics used in the modeling procedure. ID in Figure V.1. Az – Azimuth, L – Fault Length, D – Fault Dip,
strike slip and traction displacements according to Nuvel1A and Deos2K kinematic models.
The predictions from the dislocation model are shown in Figures IV.9 and IV.10. A zero
slip had to be affected to the candidate boundary segments 5 and 6 (cf. Figure IV.7).
This is a direct consequence of the fact, already noted, that GRAC station displays an
almost pure Eurasian behavior (cf. Figures IV.8). Therefore, only the segment 7 can be
considered active during the time-span of the TANGO network.
Central Point (UTM) Nuvel1A (cm) Deos2K (cm)
ID X (m) Y (m) AZ (º) L (m) D (º) SS T SS T
1 713832 4118156 138 59564 90 0.234 0.299 0.183 0.351
2 656123 4163233 139 65916 90 0.234 0.299 0.175 0.361
3 553319.5 4228639 129 170097 90 0.213 0.35 0.229 0.339
4 463328.5 4294153 118 53287 90 0.213 0.35 0.288 0.301
5 406832.5 4321541 123 66438 90 0.284 0.335 0.255 0.335
6 323556.5 4339289 110 72224 90 0.284 0.335 0.319 0.281
7 306736 4285451 108 104308 90 0.318 0.288 0.324 0.268
91
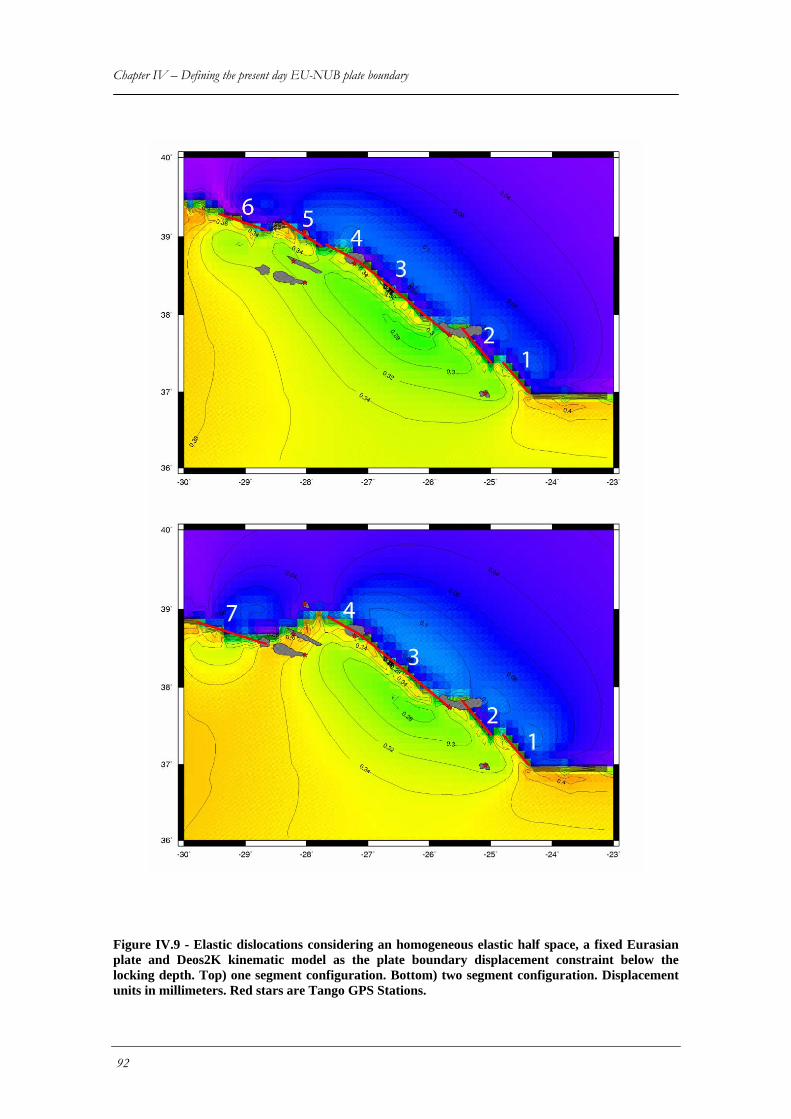
Chapter IV – Defining the present day EU-NUB plate boundary
Figure IV.9 - Elastic dislocations considering an homogeneous elastic half space, a fixed Eurasian plate and Deos2K kinematic model as the plate boundary displacement constraint below the locking depth. Top) one segment configuration. Bottom) two segment configuration. Displacement units in millimeters. Red stars are Tango GPS Stations.
92
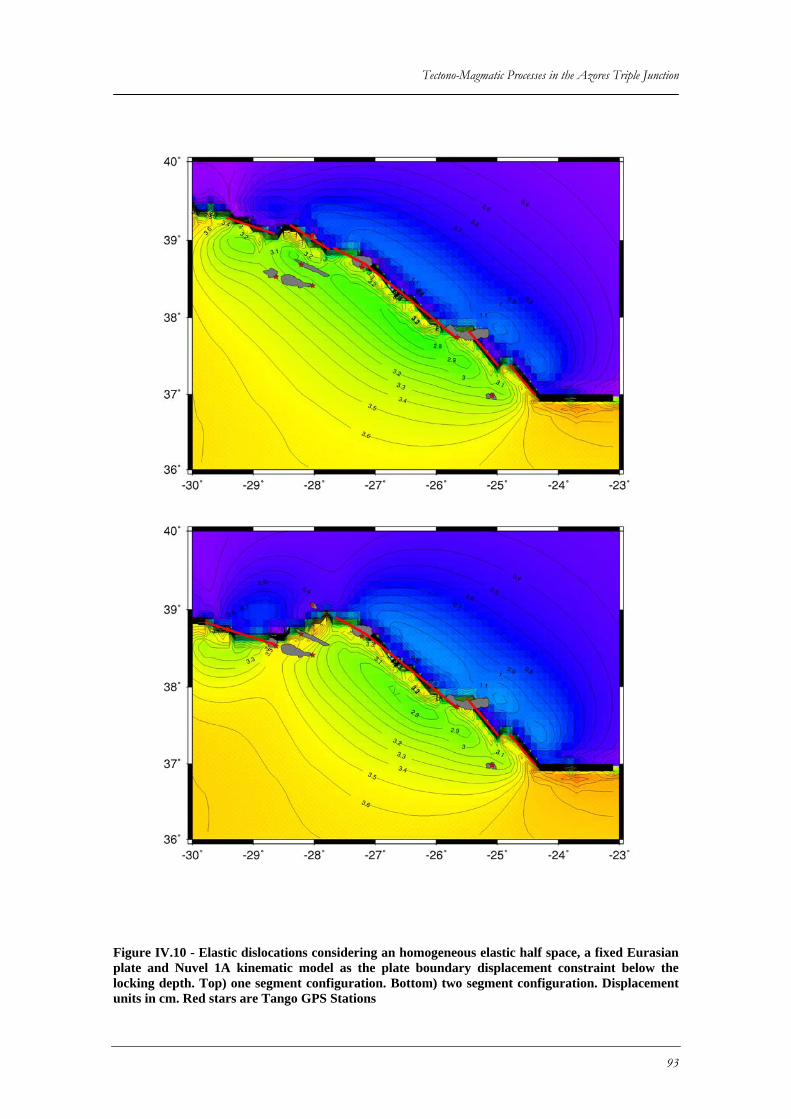
Tectono-Magmatic Processes in the Azores Triple Junction
Figure IV.10 - Elastic dislocations considering an homogeneous elastic half space, a fixed Eurasian plate and Nuvel 1A kinematic model as the plate boundary displacement constraint below the locking depth. Top) one segment configuration. Bottom) two segment configuration. Displacement units in cm. Red stars are Tango GPS Stations
93
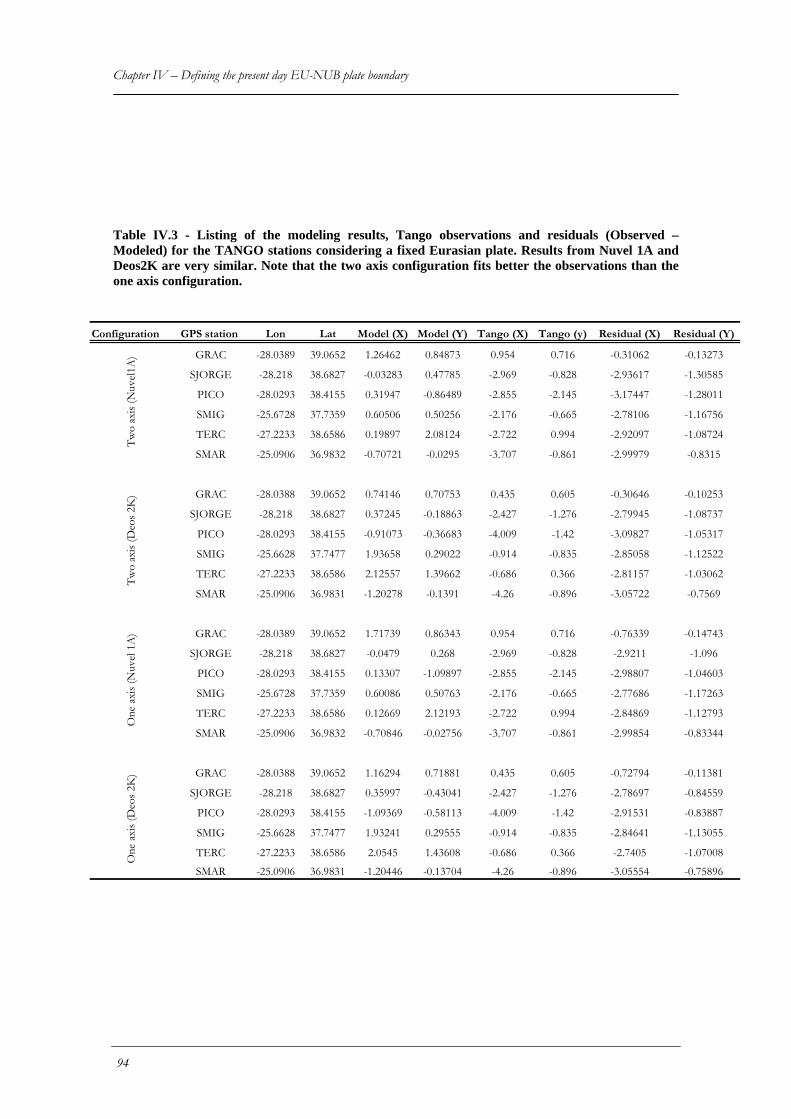
Chapter IV – Defining the present day EU-NUB plate boundary
Table d – Modeled) A and
eos2K are very similar. Note that the two axis configuration fits better the observations than the configuration.
Con uration GPS station Lon Lat Model (X) Model (Y) Tango (X) Tango (y) Residual (X) Residual (Y)
GRAC -28.0389 39.0652 1.26462 0.84873 0.954 0.716 -0.31062 -0.13273
SJORGE -28.218 38.6827 -0.03283 0.47785 -2.969 -0.828 -2.93617 -1.30585
PICO -28.0293 38.4155 0.31947 -0.86489 -2.855 -2.145 -3.17447 -1.28011
SMIG -25.6728 37.7359 0.60506 0.50256 -2.176 -0.665 -2.78106 -1.16756
TERC -27.2233 38.6586 0.19897 2.08124 -2.722 0.994 -2.92097 -1.08724
SMAR -25.0906 36.9832 -0.70721 -0.0295 -3.707 -0.861 -2.99979 -0.8315
GRAC -28.0388 39.0652 0.74146 0.70753 0.435 0.605 -0.30646 -0.10253
SJORGE -28.218 38.6827 0.37245 -0.18863 -2.427 -1.276 -2.79945 -1.08737
PICO -28.0293 38.4155 -0.91073 -0.36683 -4.009 -1.42 -3.09827 -1.05317
SMIG -25.6628 37.7477 1.93658 0.29022 -0.914 -0.835 -2.85058 -1.12522
TERC -27.2233 38.6586 2.12557 1.39662 -0.686 0.366 -2.81157 -1.03062
SMAR -25.0906 36.9831 -1.20278 -0.1391 -4.26 -0.896 -3.05722 -0.7569
GRAC -28.0389 39.0652 1.71739 0.86343 0.954 0.716 -0.76339 -0.14743
SJORGE -28.218 38.6827 -0.0479 0.268 -2.969 -0.828 -2.9211 -1.096
PICO -28.0293 38.4155 0.13307 -1.09897 -2.855 -2.145 -2.98807 -1.04603
SMIG -25.6728 37.7359 0.60086 0.50763 -2.176 -0.665 -2.77686 -1.17263
TERC -27.2233 38.6586 0.12669 2.12193 -2.722 0.994 -2.84869 -1.12793
SMAR -25.0906 36.9832 -0.70846 -0.02756 -3.707 -0.861 -2.99854 -0.83344
GRAC -28.0388 39.0652 1.16294 0.71881 0.435 0.605 -0.72794 -0.11381
SJORGE -28.218 38.6827 0.35997 -0.43041 -2.427 -1.276 -2.78697 -0.84559
PICO -28.0293 38.4155 -1.09369 -0.58113 -4.009 -1.42 -2.91531 -0.83887
SMIG -25.6628 37.7477 1.93241 0.29555 -0.914 -0.835 -2.84641 -1.13055
TERC -27.2233 38.6586 2.0545 1.43608 -0.686 0.366 -2.7405 -1.07008
SMAR -25.0906 36.9831 -1.20446 -0.13704 -4.26 -0.896 -3.05554 -0.75896
Two
axis
(Nuv
el1A
)Tw
o ax
is (D
eos 2
K)
One
axi
s (N
uvel
1A
)O
ne a
xis (
Deo
s 2K
)
IV.3 - Listing of the modeling results, Tango observations and residuals (Observefor the TANGO stations considering a fixed Eurasian plate. Results from Nuvel 1
Done axis
fig
94
Tectono-Magmatic Processes in the Azores Triple Junction
IV.6 Azores plate boundary configuration by geodesical constraints
he spatial distribution of the deformation associated with the Eurasia-Nubia plate
oundary remains poorly understood. The divergence between the two mega-plates
and the Pico-Faial lineaments, along which the high-amplitude
ctive plate boundary area is still unclear, and one of the main objectives of this work
was to get information from the GPS velocity field distribution to better understand its
road structure.
ons (Graciosa and S. Maria) display a clear
inematic behavior, with a displacement that follows respectively the Eurasian and
Nubian velocity vectors retrieved from DEOS2k. This result is consistent with the fact
that no significant active tectonic active structures are known north of Graciosa or south
f Santa Maria (Lourenço et al., 1998). Moreover, Santa Maria lacks any documented
neo-tectonic activity. In the case of Graciosa, we must still keep in mind that there is
historical volcanic and seismic activity locally. Thus, even if the behavior concerning
e last decade matches "pure Eurasia" and even if most of the present day Eurasia-
ubia divergence in this sector of the boundary is accommodated further south, it still
lies on an active deformation area. This seems to corroborate, at least from the geodetic
oint of view, the model of broad segmentation proposed by Luis et al. (1998).
should be emphasized that a time-scale problem exists in comparing current day plate
oundary configuration from GPS measurements with that deduced from plate tectonic
models that integrate the past 3 Myr (DeMets et al., 1994). The short time-span covered
by the TANGO measurements implies that interpretations can be highly susceptible to
T
b
seems to be accommodated (during the last 2 Myr) in a confined region that follows the
S. Miguel-Graciosa
magnetic anomalies have been mapped (Luis, 1996). The fine-scale geometry of this
a
b
Figures IV.8 and IV.11 show that two stati
k
o
th
N
p
It
b
95
Chapter IV – Defining the present day EU-NUB plate boundary longer term changes in the strain pattern. In this regard, many factors, such as fault
to Eurasian velocities at north) is mainly restricted
Vogt and Jung (2003) suggested that the Terceira Rift is the world's slowest spreading-
axis plate boundary. The Azores Plateau would have been formed by successive NE
jumps of the oblique spreading axis, where the present Terceira Rift is the latest stage.
These authors also suggest that the Azores Triple Point is located in the prolongation of
stress locking during inter-seismic periods, co-seismic induced deformation and swarm
activity, not necessarily associated with expressed volcanic phenomena, can all be
accounted for as transtensive strain, and thus condition the configuration and mechanics
of the inter-plate deformation zone.
From Figure IV.11, which shows both the main topographic features along the Azores
plateau together with the mean velocities deduced from the GPS array, it can be seen
that most of the deformation (that appears in the GPS mean velocities as a change
between Nubian velocities at south
to the highly tectonized area that includes the Islands themselves, as well as the
neighboring submarine topographic highs.
The presented preliminary results (mean velocities) concerning the Extended-TANGO
network show consistency with the motions deduced from the longer time-series. Table
IV.4 lists the weighted averaged of the motions for each Island considering all observed
stations (the associated uncertainty is the weighted r.m.s. of the residuals). Due to large
uncertainties, the differences observed to date cannot, at present, be interpreted in terms
of intra-Island tectonics. Further observations are needed to detect the interaction
between intra- and inter-Island tectonics.
IV.7 Conclusions
96
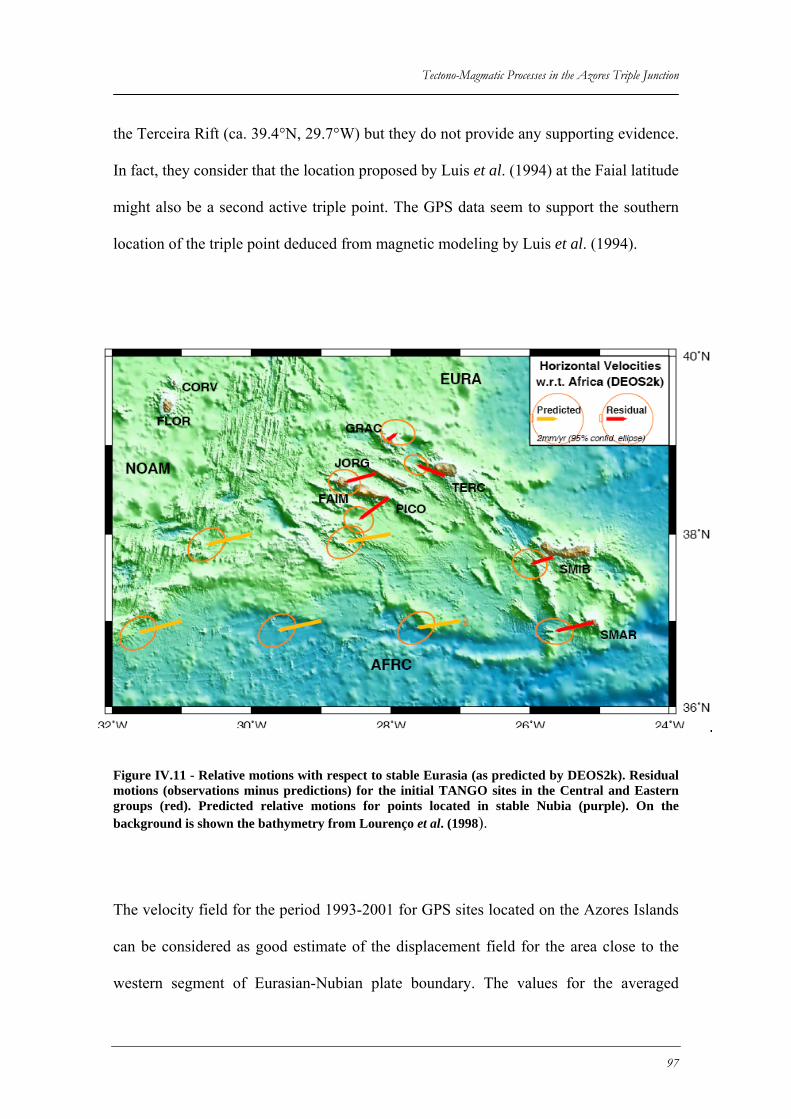
Tectono-Magmatic Processes in the Azores Triple Junction
the Terceira Rift (ca. 39.4°N, 29.7°W) but they do not provide any supporting evidence.
In fact, they consider that the location proposed by Luis et al. (1994) at the Faial latitude
might also be a second active triple point. The GPS data seem to support the southern
location of the triple point deduced from magnetic modeling by Luis et al. (1994).
stable Eurasia (as predicted by DEOS2k). Residual he initial TANGO sites in the Central and Eastern
groups (red). Predicted relative motions for points located in stable Nubia (purple). On the background is shown the bathymetry from Lourenço et al. (1998).
Figure IV.11 - Relative motions with respect tomotions (observations minus predictions) for t
The velocity field for the period 1993-2001 for GPS sites located on the Azores Islands
can be considered as good estimate of the displacement field for the area close to the
western segment of Eurasian-Nubian plate boundary. The values for the averaged
97
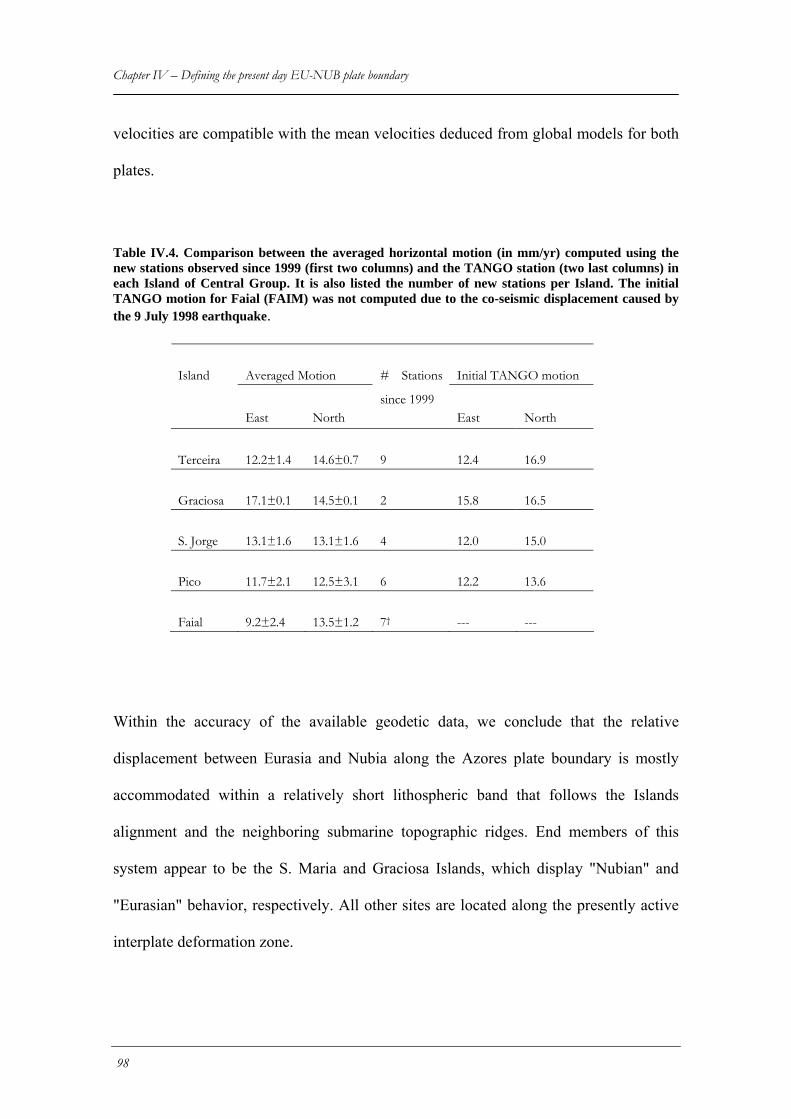
Chapter IV – Defining the present day EU-NUB plate boundary velocities are compatible with the mean velocities deduced from global models for both
plates.
Table IV.4. Comparison between the averaged horizontal motion (in mm/yr) computed usin
g the new stations observed since 1999 (first two columns) and the TANGO station (two last columns) in
sland of Central Group. It is also listed the number of new stations per Island. The initial ANGO motion for Faial (FAIM) was not computed due to the co-seismic displacement caused by
the 9 July 1998 earthquake.
ithin the accuracy of the available geodetic data, we conclude that the relative
displacement between Eurasia and Nubia along the Azores plate boundary is mostly
dges. End members of this
appear to be the S. Maria and Graciosa Islands, which display "Nubian" and
Averaged Motion Initial TANGO motion
each IT
Island
East North
# Stations
since 1999 East North
Terceira 12.2±1.4 14.6±0.7 9 12.4 16.9
Graciosa 17.1±0.1 14.5±0.1 2 15.8 16.5
S. Jorge 13.1±1.6 13.1±1.6 4 12.0 15.0
Pico 11.7±2.1 12.5±3.1 6 12.2 13.6
Faial 9.2±2.4 13.5±1.2 7† --- ---
W
accommodated within a relatively short lithospheric band that follows the Islands
alignment and the neighboring submarine topographic ri
system
"Eurasian" behavior, respectively. All other sites are located along the presently active
interplate deformation zone.
98
Tectono-Magmatic Processes in the Azores Triple Junction
An elastic half-space approach was used to model the expected velocity field for this
active boundary zone. Elastic predictions for all TANGO stations are close to the
observations, if a locking depth of 8 km is considered. Two major spreading axes, an
stly inactive during the occupation period of the TANGO
etwork.
eastern one running from S Miguel to Terceira and a western one from Faial to the Mid-
Atlantic Ridge, can be inferred. The candidate boundary segment that goes along the
Graciosa Island was mo
n
99

Tectono-Magmatic Processes in the Azores Triple Junction
Chapter V - LVR as active tectono-magmatic features of the EU-NUB plate boundary
V.1 Introduction
As seen in the previous chapter, GPS velocity solutions and forward elastic modeling
favor, from the geodetic point of view, an interpretation consisting in a plate boundary
divided in two broad segments: one defining the ATJ configuration exclusively centered
at the Faial-Pico, and another axis located from Terceira southeastwards along the
Terceira axis towards the Gloria Fault. This is valid taking both DEOS2K and
NUVEL1A kinematic models as reference.
However, the short time span in geodetic observations only provides a snapshot of
present day kinematic context. The existence of seismo-tectonic and volcanic activity
along the westernmost sectors of the Terceira axis, implies that geologically the plate
boundary is not confined to MAR-Faial-Pico segment and if both segments coexist in
time, some active transfer zone is bound to exist between this two overlapping axis.
The area enclosed in between these two axis is characterized by a series of sub-parallel
linear volcanic ridges (Lourenço et al., 1998) (see Figures V.1 and V.2), dividing flat
terraces with a uniform depth of 1200 m bsl. This domain encompasses the S. Jorge
Island, The Faial-Pico itself and two co-planar linear volcanic ridges designated by
“Condor Mar” and “Condor Terra”, It will be referred to hereafter as the LVR Sector 1.
101
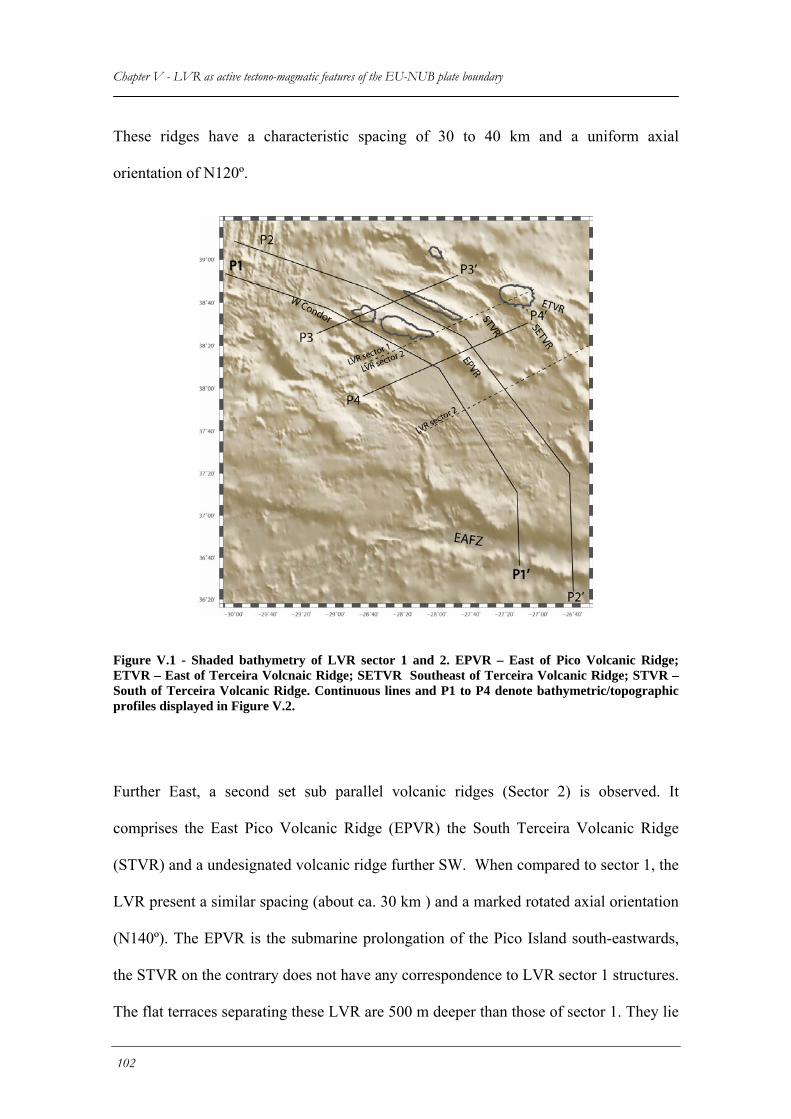
Chapter V - LVR as active tectono-magmatic features of the EU-NUB plate boundary These ridges have a characteristic spacing of 30 to 40 km and a uniform axial
orientation of N120º.
Figure V.1 - Shaded bathymetry of LVR sector 1 and 2. EPVR – East of Pico Volcanic Ridge; ETVR – East of Terceira Volcnaic Ridge; SETVR Southeast of Terceira Volcanic Ridge; STVR – South of Terceira Volcanic Ridge. Continuous lines and P1 to P4 denote bathymetric/topographic profiles displayed in Figure V.2.
Further East, a second set sub parallel volcanic ridges (Sector 2) is observed. It
comprises the East Pico Volcanic Ridge (EPVR) the South Terceira Volcanic Ridge
(STVR) and a undesignated volcanic ridge further SW. When compared to sector 1, the
LVR present a similar spacing (about ca. 30 km ) and a marked rotated axial orientation
(N140º). The EPVR is the submarine prolongation of the Pico Island south-eastwards,
the STVR on the contrary does not have any correspondence to LVR sector 1 structures.
The flat terraces separating these LVR are 500 m deeper than those of sector 1. They lie
102
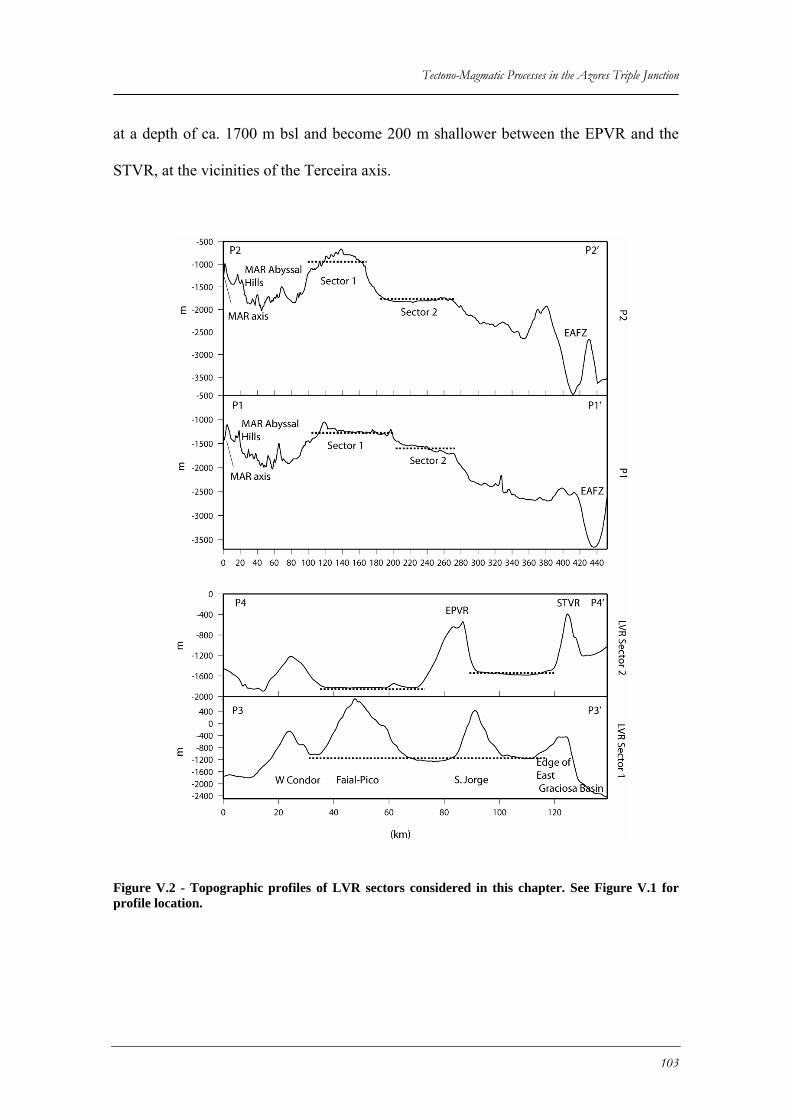
Tectono-Magmatic Processes in the Azores Triple Junction
at a depth of ca. 1700 m bsl and become 200 m shallower between the EPVR and the
STVR, at the vicinities of the Terceira axis.
Figure V.2 - Topographic profiles of LVR sectors considered in this chapter. See Figure V.1 for profile location.
103
Chapter V - LVR as active tectono-magmatic features of the EU-NUB plate boundary It is unclear if LVR Structures present in Sector 2 are apart of the Transfer zone as
suggested by Lourenço (1998), or if they correspond to already inactive structures
linked to the past evolution of the Plateau.
In this chapter we make used of previously published magnetic data, and sonar TOBI
images acquired during the Azzorre 99 cruise, to study the structure and geological
nature of the Azores plateau seafloor in both sectors. Given the uncertainty in the
relative ages of the structures (as previously discussed in Chapter II), we foccus analysis
in characterizing structures which prove either from magnetic anomalies or by
neotectonic indicators to be currently active.
Our goal is three folded: 1) to characterize the seaflor geology of the different volcanic
ridges. 2) To verify if any qualitative age progression exists amongst them in each
individual sector and between adjacent sectors. 3) To evaluate the tectono-magmatic
nature of the plate boundary processes and the dynamics of the transfer zone.
V.2 Data
V.2.1 Marine Magnetic data
To evaluate more thoroughly the nature of the seafloor, especially in what concerns
distribution of recent volcanism within the Azores Plateau, and to validate geological
interpretations of the sonar images, we produced a new magnetic map which
complements that of Luis, 1996 presented in chapter II (cf. Figure II.6).
This new map has the advantage of the magnetometer being closer to the source
magnetic layer as it results exclusively from marine magnetic observations and has
therefore a higher resolution more suitable to complement finer scale TOBI sonar
images interpretations. This map integrates new data retrieved from the AZZORRE99
104
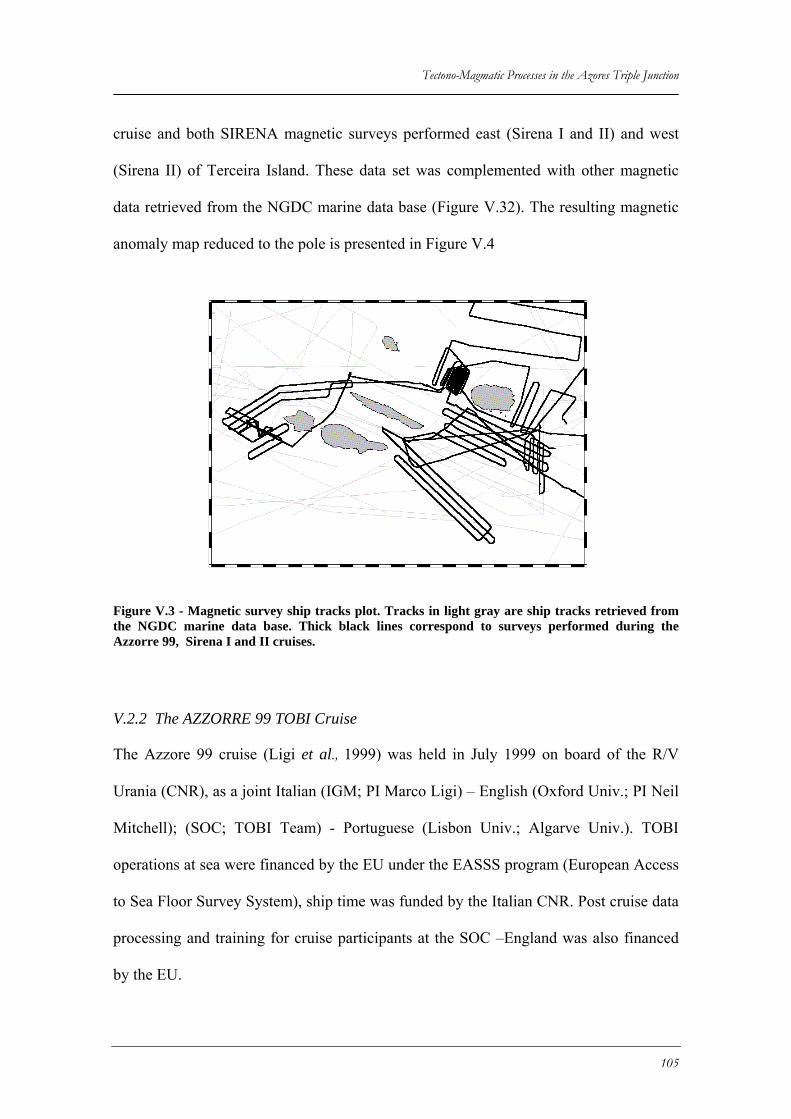
Tectono-Magmatic Processes in the Azores Triple Junction
cruise and both SIRENA magnetic surveys performed east (Sirena I and II) and west
(Sirena II) of Terceira Island. These data set was complemented with other magnetic
data retrieved from the NGDC marine data base (Figure V.32). The resulting magnetic
anomaly map reduced to the pole is presented in Figure V.4
Figure V.3 - Magnetic survey ship tracks plot. Tracks in light gray are ship tracks retrieved from the NGDC marine data base. Thick black lines correspond to surveys performed during the Azzorre 99, Sirena I and II cruises.
V.2.2 The AZZORRE 99 TOBI Cruise
The Azzore 99 cruise (Ligi et al., 1999) was held in July 1999 on board of the R/V
Urania (CNR), as a joint Italian (IGM; PI Marco Ligi) – English (Oxford Univ.; PI Neil
Mitchell); (SOC; TOBI Team) - Portuguese (Lisbon Univ.; Algarve Univ.). TOBI
operations at sea were financed by the EU under the EASSS program (European Access
to Sea Floor Survey System), ship time was funded by the Italian CNR. Post cruise data
processing and training for cruise participants at the SOC –England was also financed
by the EU.
105
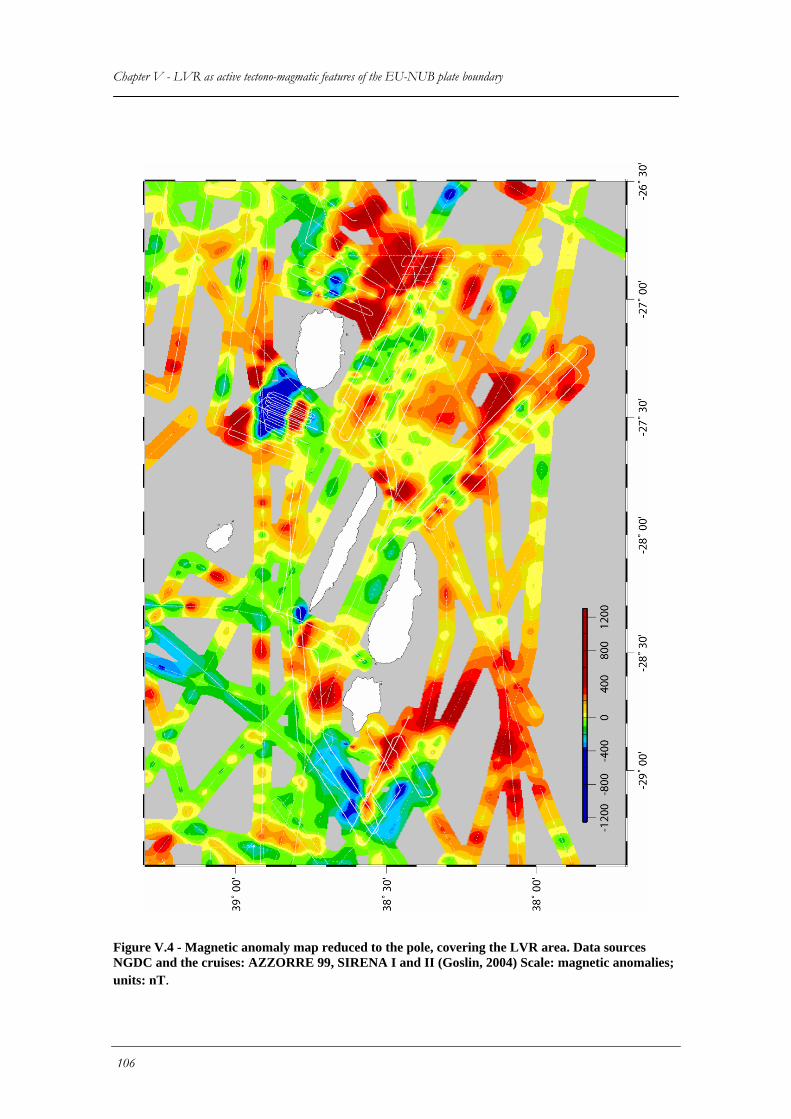
Chapter V - LVR as active tectono-magmatic features of the EU-NUB plate boundary
Figure V.4 - Magnetic anomaly map reduced to the pole, covering the LVR area. Data sources NGDC and the cruises: AZZORRE 99, SIRENA I and II (Goslin, 2004) Scale: magnetic anomalies; units: nT.
106
Tectono-Magmatic Processes in the Azores Triple Junction
The cruise surveyed the linear volcanic ridges in the Azores.. It consisted of two legs
with a stop at Faial Island for partial crew turn-over. The first leg allowed 10 days of
continuous coverage of TOBI sonar, chirp sonar, bathymetry and surface magnetic data,
southeast of Pico, S. Jorge and Terceira Island. The second leg provided equivalent data
on a region comprising the Condor Ridge and the West of Faial and S. Jorge submarine
prolongations. The sonar data acquired covers a total of 5 complete LVR and the west
sector of S. Jorge and Faial LVR (Figure V.5). The general quality of the data is fairly
good with the exception of the shallow portions on the top of the Condor Ridge (south
of Faial). The analysis of the mosaic corresponding to the SETVR will be performed in
the next chapter.
TOBI Sonar is a multi-sensor platform tow-yawed between 200 and 500 m from the
bottom. It was equipped with a two sided 30 kHz sidescan sonar, a 7.5 kHz sub-bottom
profiler, a CTD, a three-axis fluxgate magnetometer and a range of vehicle attitude
sensors (i.e pitch, roll and heading from a gyro-compass). The instrument is towed with
a 200 m umbilical behind a depressor weigth detaching the instrument from ship
movement. TOBI position was achieved by using the ships’ Simrad-Konsgberg HPR-
1507 system and a long-range (6km) transponder, that was mounted 45 deg. below the
TOBI’s depressor. Sonar has a total swath width of 6 to 8 km, and footprints of 4x 7 m
near the fish track but higher for the outer beams
Each mosaic results in a 8 bit image (256 tons of gray) where white pixels portrait high
backscaterring surfaces and black pixels correspond to acoustic shadows. These images
were drapped on top of bathymetric digital terrain models. The magnetic anomaly map
was overlain on top of the composition to further constrain the interpretations.
107
Chapter V - LVR as active tectono-magmatic features of the EU-NUB plate boundary
V.3 Magnetic anomalies and Acoustic Facies interpretation
V.3.1 LVR Sector 1
The available mosaics show quite clearly that the bulk of active volcanic activity in the
Azores western sector is concentrated in LVR, these structures correlate strongly with
positive magnetic anomalies. Furthermore their surroundings are almost exclusively
composed of a greyish homogeneous facies interpreted as pelagic and volcanic sediment
and turbidite fans.
The main volcanic facies present are homogeneous high backscatter surfaces probably
related with massive flows, hummocky textures related with pillow mound formation,
and individual circular volcanic cones sometimes with visible craters, that can reach
several tens of meters high. They occur both oriented along LVR major axis direction,
parallel to fault scarps, or as individual cones with a somewhat more random spatial
distribution.
It is possible to observe a high backscatter surface prolonging from the Capelinhos
1957/58 eruption site in the western tip of Faial for about 20 km towards WNW. This
high backscattering surface is cut by a well marked lineation interpreted as a major
fissure which aligns up with the Western Faial fissural system. (Figure V.6).
Due to its shallow depth the axial structure of the Condor ridge is poorly imaged. Figure
V.7 displays a high backscattering surface, suggesting a recent nature of the volcanic
terrain which contrasts with the surrounding greyish areas interpreted as pelagic or
volcanic sediment. The western tip of this 40 km long LVR consists of a highly
108
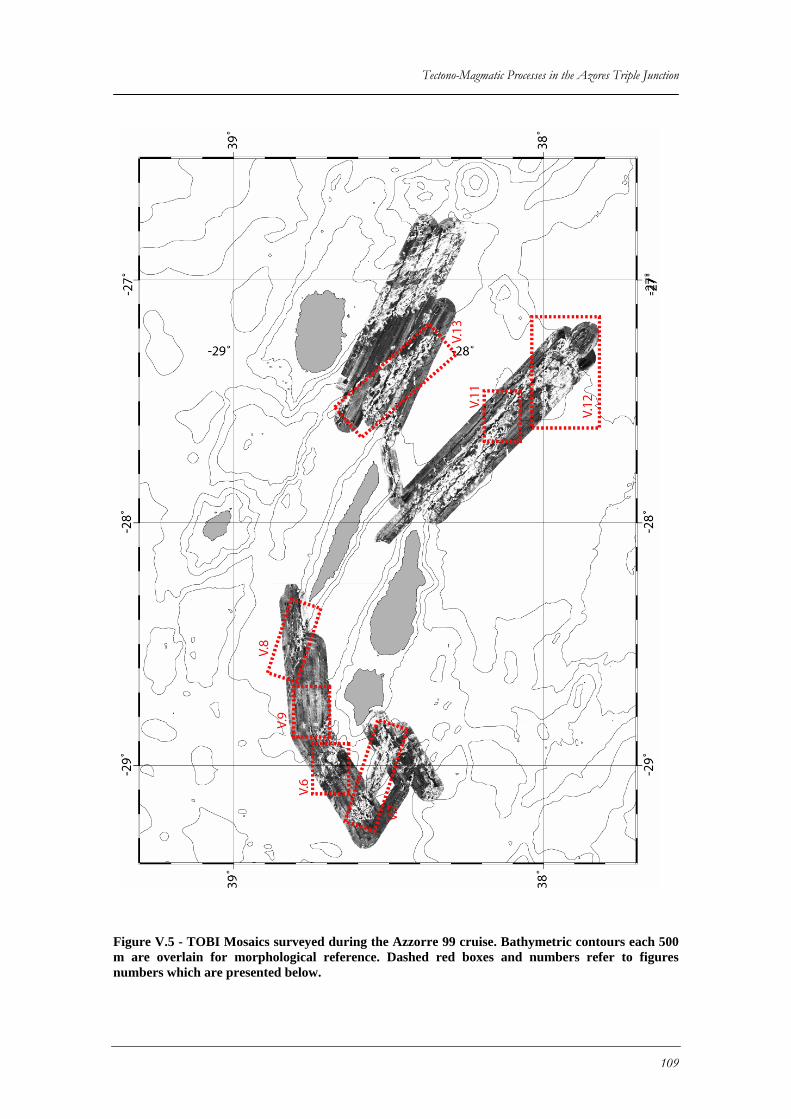
Tectono-Magmatic Processes in the Azores Triple Junction
Figure V.5 - TOBI Mosaics surveyed during the Azzorre 99 cruise. Bathymetric contours each 500 m are overlain for morphological reference. Dashed red boxes and numbers refer to figures numbers which are presented below.
109
Chapter V - LVR as active tectono-magmatic features of the EU-NUB plate boundary irregular pattern of high backscattering acoustic facies, probably related with a
combination of mass wasting debris at the slopping tip of the LVR and some volcanic
constructs like individual pillow mounds and more complex hummocky structures. No
clear tectonic structures are here visible.
Both LVR and corresponding tips correspond to marked positive anomalies probably
Brunhes and their surroundings are a wide area of negative polarity (probably
Matuyama), which in the case of West condor ridge define two elongated magnetic
anomaly lows parallel the axis of the LVR. It is not clear if in this case, the negative
bands were generated at the axis of the W Condor ridge and than rafted sideways.
However, given the flatness of the W Condor ridge surroundings and the lack of
significant tectonic or volcanic structures we come to an interpretation where the W
Condor ridge has simply grown over a negative polarity basement.
The seawards prolongation of the S. Jorge Island shows features which are somewhat
distinct from the observations of Faial western sector (Figure V.8). The prominent
inland fissural system aligned along the Island central axis prolongs seawards in the
same direction for about 12 km. The submarine extent of the Island western tip displays
a series of acoustic echoes which, probably due to its shallow depth, are poorly imaged.
Further west these terminate abruptly towards the centre of a 200 m deep graben. Faults
defining this graben structure are clearly outlined on the sonar image, they have the
same orientation of the S. Jorge Island and present little segmentation. There is no
indication of strike slip component and this are interpreted as dominantly dip-slip faults.
They extend for about 20 km to the image limits and cut thru seabed sediments, the base
of the fault scarp is irregularly bordered by a confined area of intermediate non-
110
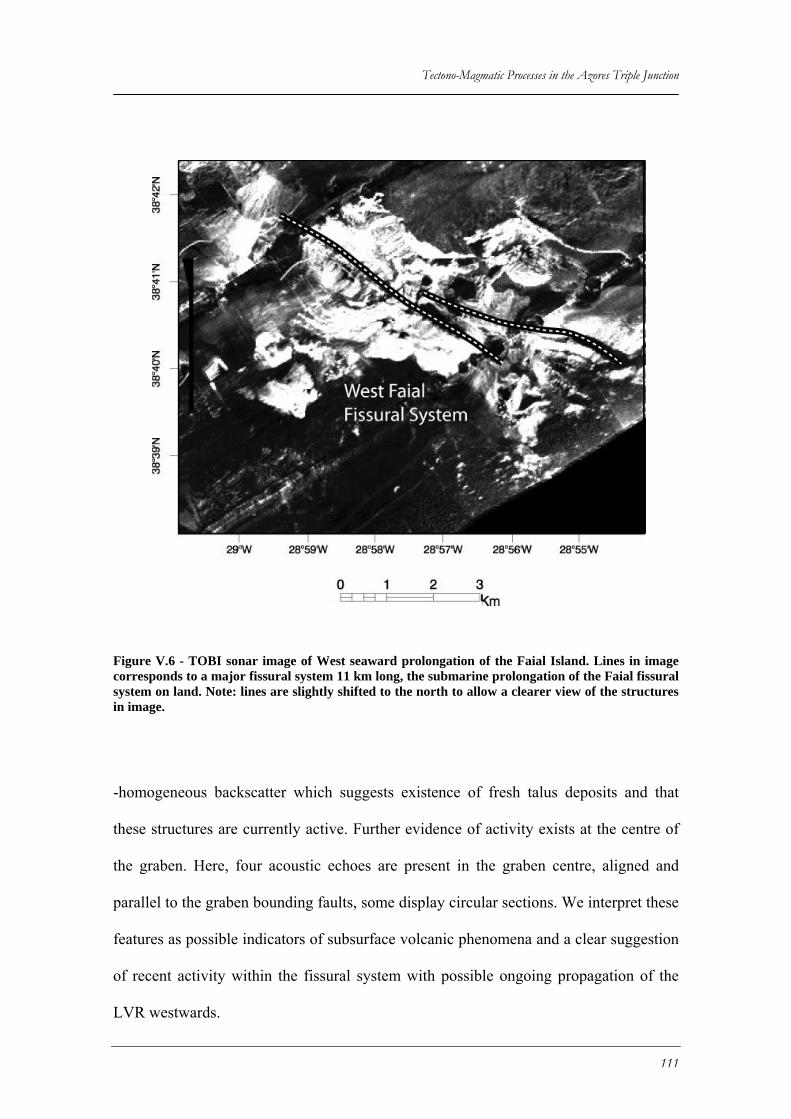
Tectono-Magmatic Processes in the Azores Triple Junction
Figure V.6 - TOBI sonar image of West seaward prolongation of the Faial Island. Lines in image corresponds to a major fissural system 11 km long, the submarine prolongation of the Faial fissural system on land. Note: lines are slightly shifted to the north to allow a clearer view of the structures in image.
-homogeneous backscatter which suggests existence of fresh talus deposits and that
these structures are currently active. Further evidence of activity exists at the centre of
the graben. Here, four acoustic echoes are present in the graben centre, aligned and
parallel to the graben bounding faults, some display circular sections. We interpret these
features as possible indicators of subsurface volcanic phenomena and a clear suggestion
of recent activity within the fissural system with possible ongoing propagation of the
LVR westwards.
111
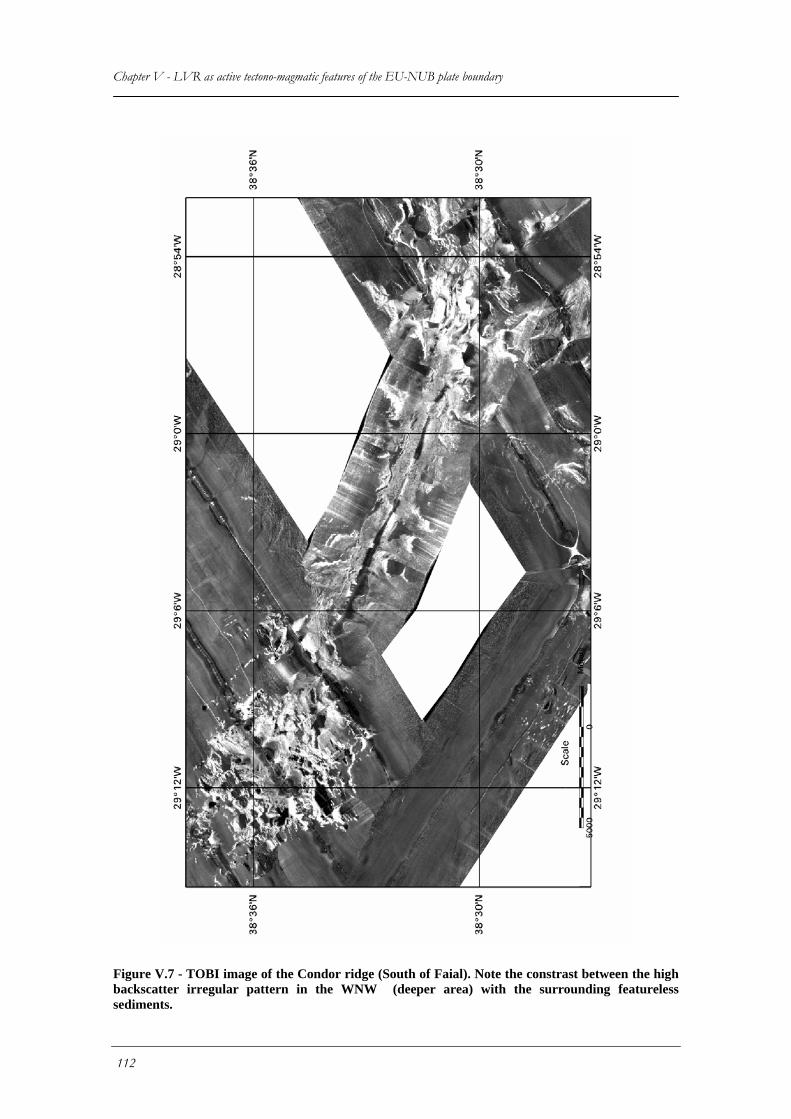
Chapter V - LVR as active tectono-magmatic features of the EU-NUB plate boundary
Figure V.7 - TOBI image of the Condor ridge (South of Faial). Note the constrast between the high backscatter irregular pattern in the WNW (deeper area) with the surrounding featureless sediments.
112
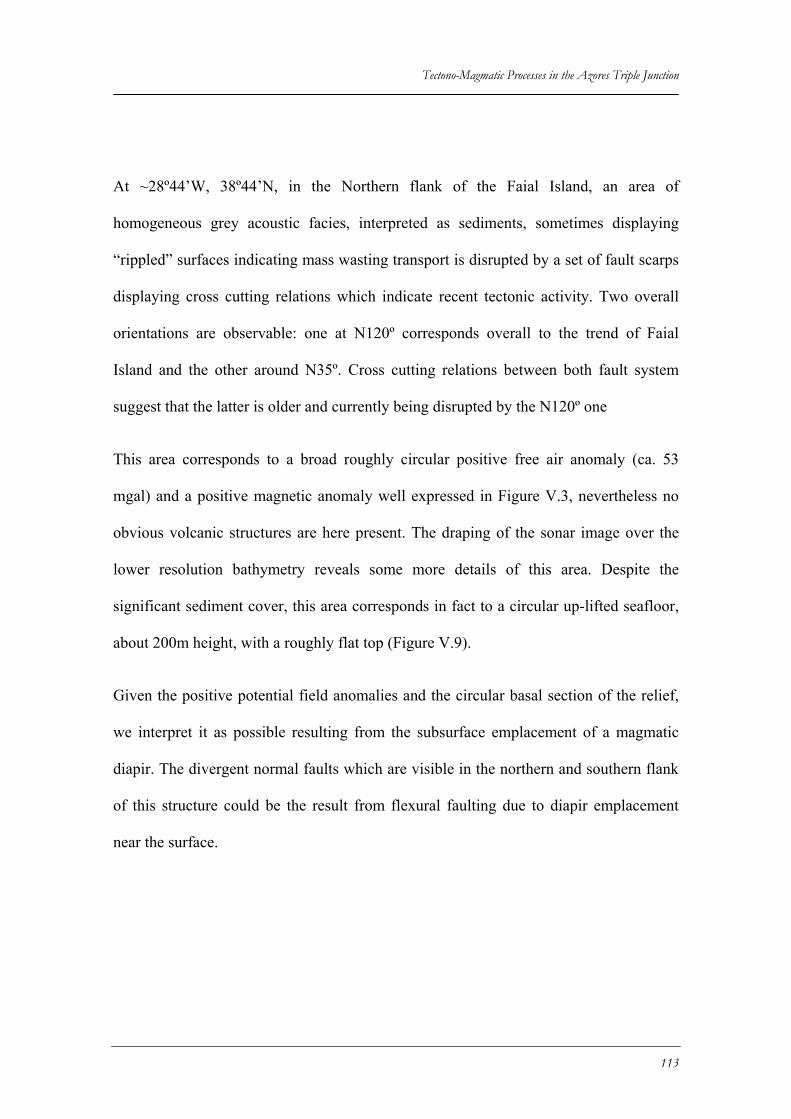
Tectono-Magmatic Processes in the Azores Triple Junction
At ~28º44’W, 38º44’N, in the Northern flank of the Faial Island, an area of
homogeneous grey acoustic facies, interpreted as sediments, sometimes displaying
“rippled” surfaces indicating mass wasting transport is disrupted by a set of fault scarps
displaying cross cutting relations which indicate recent tectonic activity. Two overall
orientations are observable: one at N120º corresponds overall to the trend of Faial
Island and the other around N35º. Cross cutting relations between both fault system
suggest that the latter is older and currently being disrupted by the N120º one
This area corresponds to a broad roughly circular positive free air anomaly (ca. 53
mgal) and a positive magnetic anomaly well expressed in Figure V.3, nevertheless no
obvious volcanic structures are here present. The draping of the sonar image over the
lower resolution bathymetry reveals some more details of this area. Despite the
significant sediment cover, this area corresponds in fact to a circular up-lifted seafloor,
about 200m height, with a roughly flat top (Figure V.9).
Given the positive potential field anomalies and the circular basal section of the relief,
we interpret it as possible resulting from the subsurface emplacement of a magmatic
diapir. The divergent normal faults which are visible in the northern and southern flank
of this structure could be the result from flexural faulting due to diapir emplacement
near the surface.
113
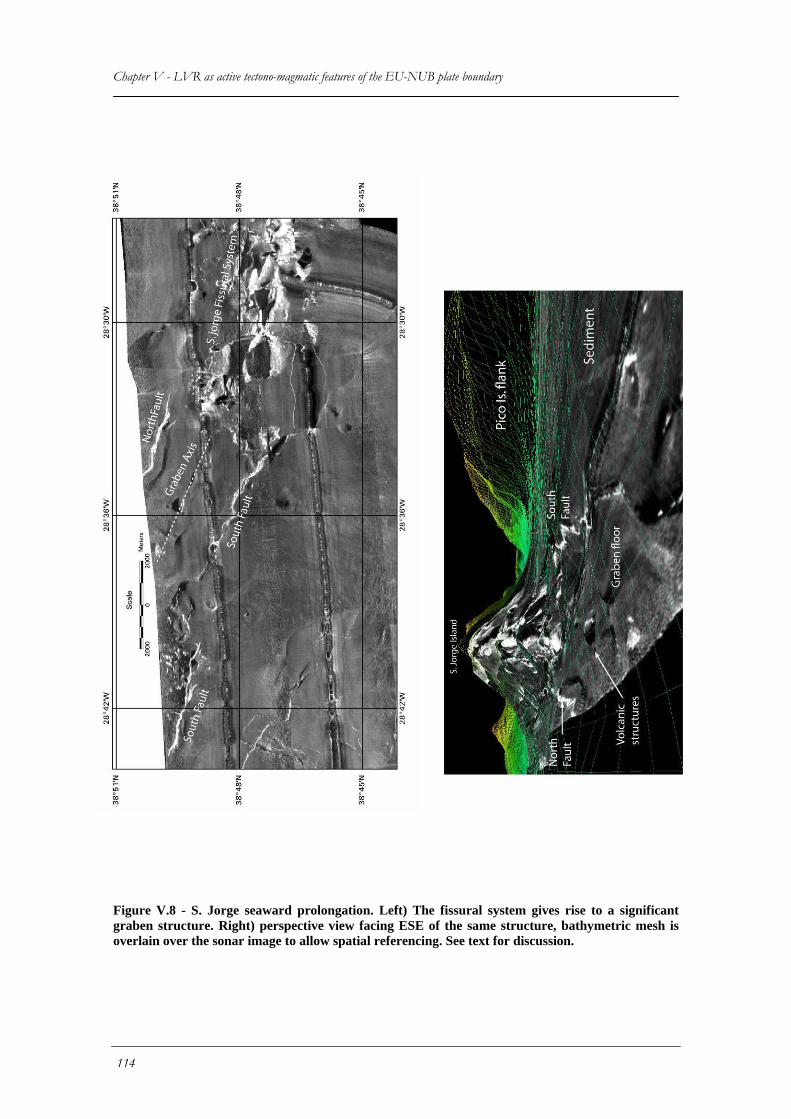
Chapter V - LVR as active tectono-magmatic features of the EU-NUB plate boundary
Figure V.8 - S. Jorge seaward prolongation. Left) The fissural system gives rise to a significant graben structure. Right) perspective view facing ESE of the same structure, bathymetric mesh is overlain over the sonar image to allow spatial referencing. See text for discussion.
114
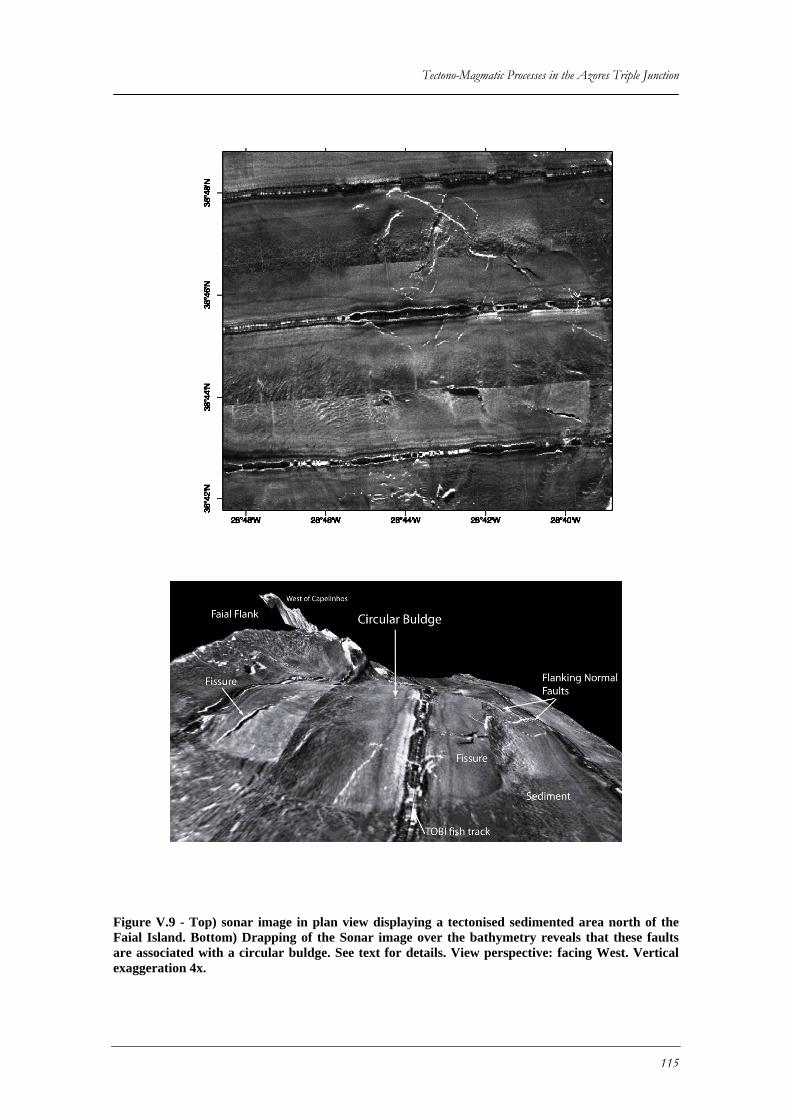
Tectono-Magmatic Processes in the Azores Triple Junction
Figure V.9 - Top) sonar image in plan view displaying a tectonised sedimented area north of the Faial Island. Bottom) Drapping of the Sonar image over the bathymetry reveals that these faults are associated with a circular buldge. See text for details. View perspective: facing West. Vertical exaggeration 4x.
115
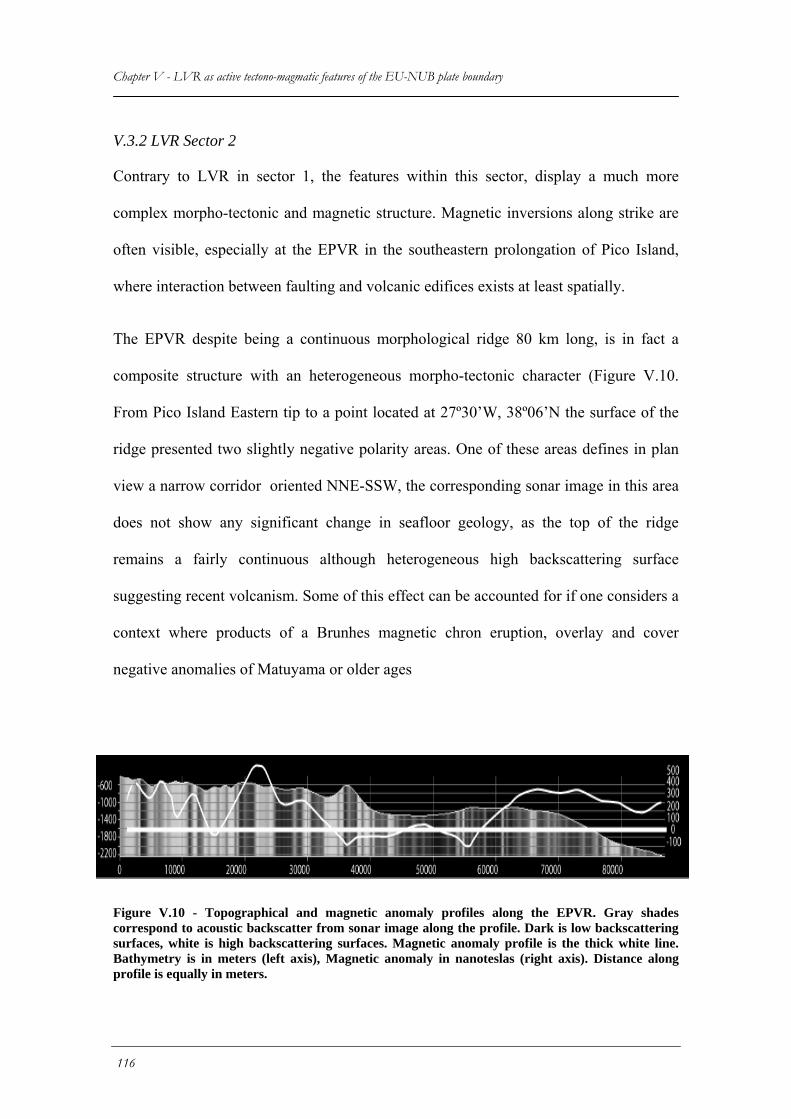
Chapter V - LVR as active tectono-magmatic features of the EU-NUB plate boundary
V.3.2 LVR Sector 2
Contrary to LVR in sector 1, the features within this sector, display a much more
complex morpho-tectonic and magnetic structure. Magnetic inversions along strike are
often visible, especially at the EPVR in the southeastern prolongation of Pico Island,
where interaction between faulting and volcanic edifices exists at least spatially.
The EPVR despite being a continuous morphological ridge 80 km long, is in fact a
composite structure with an heterogeneous morpho-tectonic character (Figure V.10.
From Pico Island Eastern tip to a point located at 27º30’W, 38º06’N the surface of the
ridge presented two slightly negative polarity areas. One of these areas defines in plan
view a narrow corridor oriented NNE-SSW, the corresponding sonar image in this area
does not show any significant change in seafloor geology, as the top of the ridge
remains a fairly continuous although heterogeneous high backscattering surface
suggesting recent volcanism. Some of this effect can be accounted for if one considers a
context where products of a Brunhes magnetic chron eruption, overlay and cover
negative anomalies of Matuyama or older ages
Figure V.10 - Topographical and magnetic anomaly profiles along the EPVR. Gray shades correspond to acoustic backscatter from sonar image along the profile. Dark is low backscattering surfaces, white is high backscattering surfaces. Magnetic anomaly profile is the thick white line. Bathymetry is in meters (left axis), Magnetic anomaly in nanoteslas (right axis). Distance along profile is equally in meters.
116
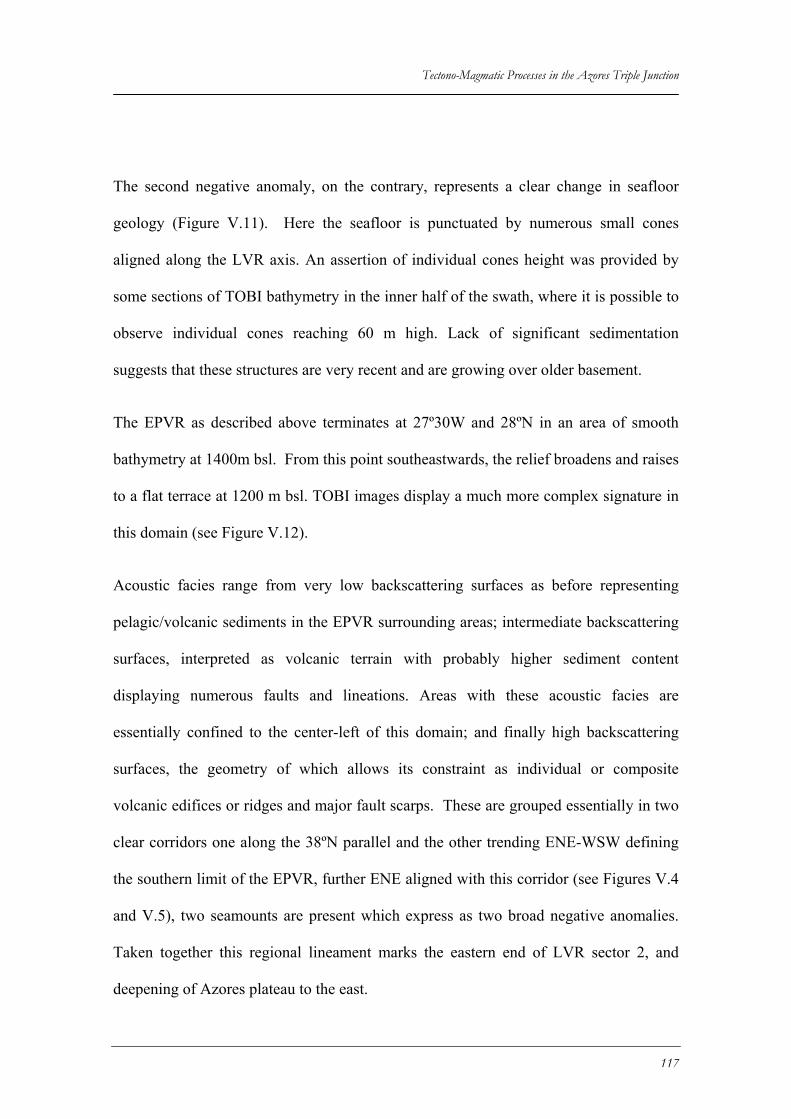
Tectono-Magmatic Processes in the Azores Triple Junction
The second negative anomaly, on the contrary, represents a clear change in seafloor
geology (Figure V.11). Here the seafloor is punctuated by numerous small cones
aligned along the LVR axis. An assertion of individual cones height was provided by
some sections of TOBI bathymetry in the inner half of the swath, where it is possible to
observe individual cones reaching 60 m high. Lack of significant sedimentation
suggests that these structures are very recent and are growing over older basement.
The EPVR as described above terminates at 27º30W and 28ºN in an area of smooth
bathymetry at 1400m bsl. From this point southeastwards, the relief broadens and raises
to a flat terrace at 1200 m bsl. TOBI images display a much more complex signature in
this domain (see Figure V.12).
Acoustic facies range from very low backscattering surfaces as before representing
pelagic/volcanic sediments in the EPVR surrounding areas; intermediate backscattering
surfaces, interpreted as volcanic terrain with probably higher sediment content
displaying numerous faults and lineations. Areas with these acoustic facies are
essentially confined to the center-left of this domain; and finally high backscattering
surfaces, the geometry of which allows its constraint as individual or composite
volcanic edifices or ridges and major fault scarps. These are grouped essentially in two
clear corridors one along the 38ºN parallel and the other trending ENE-WSW defining
the southern limit of the EPVR, further ENE aligned with this corridor (see Figures V.4
and V.5), two seamounts are present which express as two broad negative anomalies.
Taken together this regional lineament marks the eastern end of LVR sector 2, and
deepening of Azores plateau to the east.
117
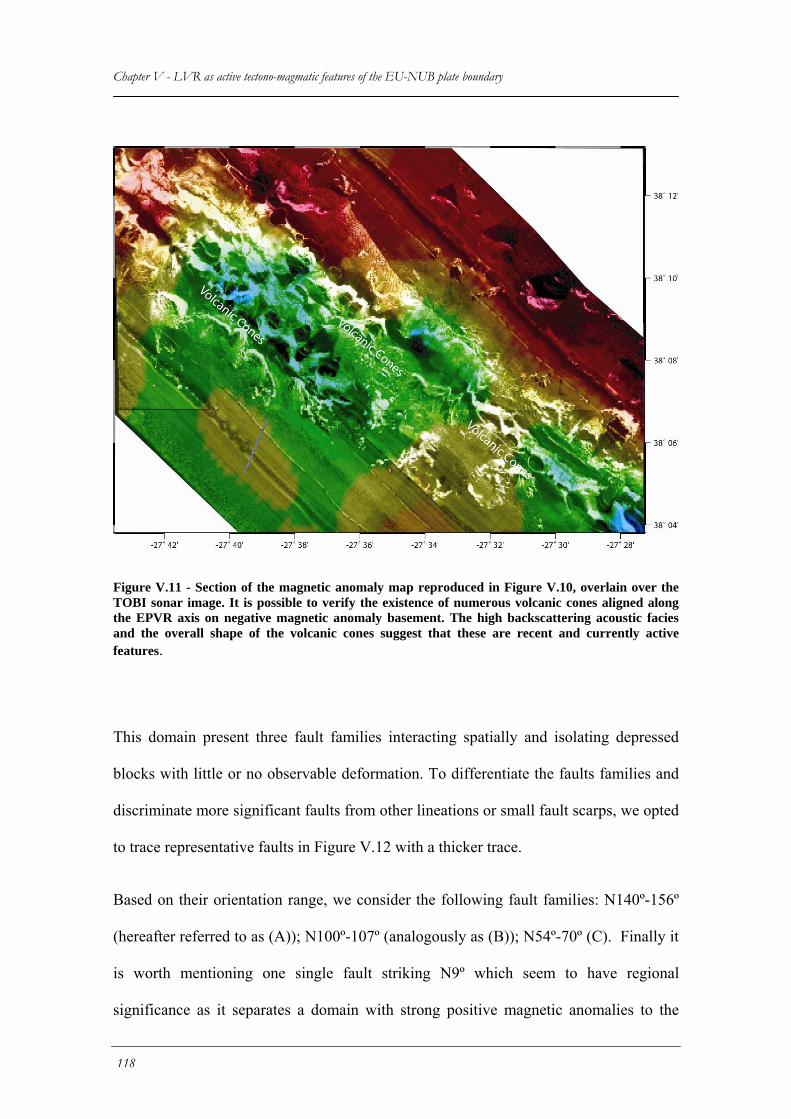
Chapter V - LVR as active tectono-magmatic features of the EU-NUB plate boundary
Figure V.11 - Section of the magnetic anomaly map reproduced in Figure V.10, overlain over the TOBI sonar image. It is possible to verify the existence of numerous volcanic cones aligned along the EPVR axis on negative magnetic anomaly basement. The high backscattering acoustic facies and the overall shape of the volcanic cones suggest that these are recent and currently active features.
This domain present three fault families interacting spatially and isolating depressed
blocks with little or no observable deformation. To differentiate the faults families and
discriminate more significant faults from other lineations or small fault scarps, we opted
to trace representative faults in Figure V.12 with a thicker trace.
Based on their orientation range, we consider the following fault families: N140º-156º
(hereafter referred to as (A)); N100º-107º (analogously as (B)); N54º-70º (C). Finally it
is worth mentioning one single fault striking N9º which seem to have regional
significance as it separates a domain with strong positive magnetic anomalies to the
118
Tectono-Magmatic Processes in the Azores Triple Junction
east, probably reflecting MAR generated crust, from a western domain with very low
amplitude magnetic anomalies.
Analysis of fault geometrical relations provides some constraints on the kinematics of
the different fault families. With the exception of faults belonging to (B) which seem to
prevail over the others, cross-cutting relations are not clear and no prevalence of one
family over the others seems to exist.
Faults from (A) sometimes isolate semi-circular terraces limited by normal faults
dipping in the same direction, these structures can be observed, both in a point at ca.
27º14’W, 37º57’N and ca. 27º24’W, 37º55.5. The S shape, in plain view, of such
structures and the prevalence of apparent normal components suggest that these are
oblique slips with a left lateral strike slip component. The left lateral component can be
additionally constrained by the analysis of a structure at ca. 27º30’W, 37º56’N, where a
fault striking N148º cuts through a series of sub parallel lineaments If these are
secondary faults subsidiary of the main shear then their shape in plane view also
suggests presence of a left lateral strike slip component.
Faults belonging to family (B) define a northern deformation corridor. These faults at
that location present two broad segments with a right lateral en-echelon pattern.. This
direction is also associated to the major volcanic ridges in the sonar images.
The (C) fault family is less prevalent than the previous ones in map view, and there are
no major fault scarps associated with it. Nevertheless, several TOBI sonar lineations
suggest its presence across the all domain. The most relevant fault of this system is
about 10 km long and its mid point is located ca. 27º22’W 37º56’N, again relation
between this fault and minor secondary structures, especially at the westernmost
119
Chapter V - LVR as active tectono-magmatic features of the EU-NUB plate boundary sections, points to some component of right lateral strike slip. Finally the same direction
(as referred to above) is defined by a major SE facing topographical step, corresponding
to the Eastern limit of LVR 2. To SE of it, the seafloor deepens to 2000m bsl, and high
backscatter relief’s become absent.
The last LVR we shall consider in this section is located South of Terceira and will be
referred to as STVR (South Terceira Volcanic ridge). This structure is 35 km long and
700 m high, and is sub parallel to the EPVR. The magnetic signature in the STVR
comprises both negative and positive low amplitude fairly uniform magnetic anomalies
with no obvious pattern of variation along strike. This is particularly relevant as the
seafloor north and south of this structure presents higher amplitude positive anomalies
but no distinct morphological structures when these are compared with both sonar and
bathymetric images.
Its geological character as observed from the sonar images (Figure V.13) is similar to
that of the northwestern part of the EPVR. Aligned along the STVR axis, numerous
small individual volcanic cones are present often displaying a small crater and
sometimes linking and forming ridges which seem analogue to AVR’s (Axial volcanic
ridges) occurring at Mid-Ocean Ridges. The ridge is dominated by volcanic processes
as no clear faults are traceable from the TOBI images. The flanks of this structure are
highly degraded and present numerous slump scars, the mass wasting deposits resulting
from this slope instability processes suffer little transport and remain confined as lobate
fans at the base of the LVR.
120
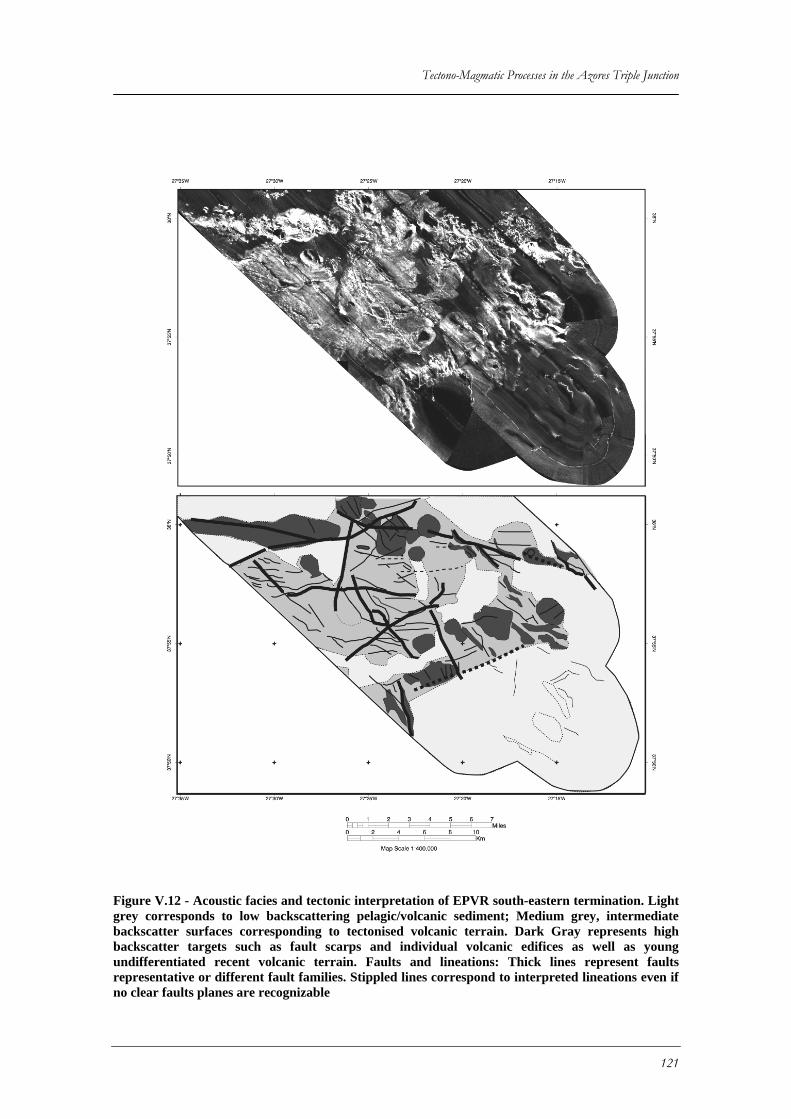
Tectono-Magmatic Processes in the Azores Triple Junction
Figure V.12 - Acoustic facies and tectonic interpretation of EPVR south-eastern termination. Light grey corresponds to low backscattering pelagic/volcanic sediment; Medium grey, intermediate backscatter surfaces corresponding to tectonised volcanic terrain. Dark Gray represents high backscatter targets such as fault scarps and individual volcanic edifices as well as young undifferentiated recent volcanic terrain. Faults and lineations: Thick lines represent faults representative or different fault families. Stippled lines correspond to interpreted lineations even if no clear faults planes are recognizable
121
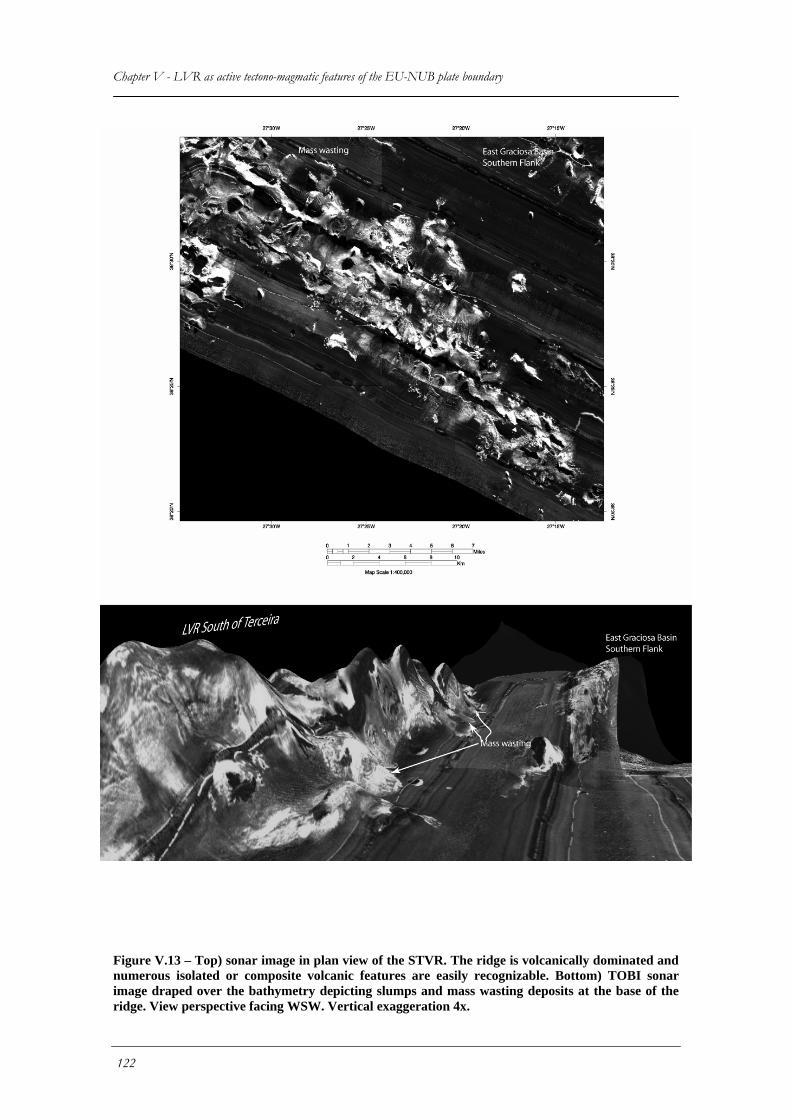
Chapter V - LVR as active tectono-magmatic features of the EU-NUB plate boundary
Figure V.13 – Top) sonar image in plan view of the STVR. The ridge is volcanically dominated and numerous isolated or composite volcanic features are easily recognizable. Bottom) TOBI sonar image draped over the bathymetry depicting slumps and mass wasting deposits at the base of the ridge. View perspective facing WSW. Vertical exaggeration 4x.
122
Tectono-Magmatic Processes in the Azores Triple Junction
V.4 Conclusions
The major characteristics of the Azores Linear Volcanic Ridge systems can be
summarized as follows:
1. All volcanic ridges imaged with TOBI sonar, regardless of their magnetic signature
present recent volcanism of fissural type aligned along their strikes.
2. Sector 1 LVR seem to be overall more recent than those of sector 2, it shows more
active volcanic features and displays consistently positive magnetic anomalies along
their strike. The LVR from sector 2 present a more complex magnetic anomaly
pattern sometimes masked by possible MAR generated magnetic anomalies. All the
LVR studied in this chapter present a clear dominance of volcanic processes, little
tectonisation is observed.
3. The western terminations of sector 1 LVR display evidences of ridge propagation
westwards, these comprise graben development west of S. Jorge tip, submarine
prolongation of the fissural system in Faial, more robust volcanic activity on the
western tip of condor ridge, and widespread earthquake activity as also detailed in
section IV.3.1.
4. As observed in the easternmost areas of the EPVR, the transition between LVR
sectors corresponds to domains of higher tectonisation where fault families seem to
define a somewhat irregular and complex shear zone and where essentially three
fault families were recognized.
5. The three fault families identified in that area are co-relatable by strike with the
expected orientation respectively of MAR transform zones and LVR1 strikes.
123
Chapter V - LVR as active tectono-magmatic features of the EU-NUB plate boundary
Oblique faults with a possible sinistral strike slip component as those which ruptured
during the Terceira 1980 and Faial 1998 earthquakes (see section IV.4) and finally
those which correspond to secondary ruptures at nearly 90º with the previous ones
during the same Faial earthquake. The tectonic significance of these later orientations
had never been discussed in previous works until the Faial event (Dias, 2006,
Fernandes et al., 2002) despite their morphological signature across the plateau
having been noted by Lourenço et al., 1998). They individualize the studied LVR
sectors, and surrounding flat terraces which become deeper towards east. This
direction as we shall see in the next chapter is also recognized inland at Terceira
Island.
124
Tectono-Magmatic Processes in the Azores Triple Junction
Chapter VI - Tectonics on the Terceira Island and neighbouring basins
VI.1 Introduction
The northern limit of the plateau consists of the Terceira rift. Its morphology is
characterized by a series of deep rhombic to square shape basins in plane view
separating the Islands and other major volcanic constructions which express as shallow
submarine banks. The distribution of the central volcanoes along the rift is relatively
regular, with major, active edifices every 80 to 100 km (Formigas, Grande Norte, São
Miguel – Sete Cidades, João de Castro submarine volcano, Terceira – Stª Barbara and
Graciosa main central volcano). Spreading centers with this characteristic spacing
characterize the second-order segmentation of most ultra-slow to slow-spreading mid-
ocean ridges (Briais and Rabinowicz, 2002; Rabinowicz and Briais, 2002). It is possible
that the distribution of the recent volcanic activity along the Terceira axis reflects a
control of the magma feeding by mantle processes, or by melt migration processes.
Vogt and Jung (2003) compared the morphological characteristics of the Terceira axis
with other ultra-slow spreading systems such as the South-West Indian Ridge (SWIR)
or the Gakkel ridge and classified it as an oblique, hiper-slow rift system. The Terceira
axis is considered, by these authors as a young (possible <1Ma) and wide oblique
graben structure disrupted and segmented by the equispaced volcanic centers.
125
Chapter VI - Tectonics on the Terceira Island and neighbouring basins As we discussed in Chapter II, the nucleation age for the Terceira axis has never been
totally constrained. Its complex magnetic structure, and lack of magnetic anomalies
older than Matuyama (Luis, et al., 1996), does not allow its classification as a fully
developed oceanic spreading system or otherwise as a young intra-oceanic rift system.
The magnetic and morpho-tectonic structure of the Terceira axis, varies significantly
between the Western half of Terceira Island and adjoining East graciosa Basin and the
Eastern half of Terceira Island and the North Hirondelle Basin (Figure VI.1). The
separation between these two domains is defined by the intersection of the Terceira
Island with the prolongation to NE of the limit between LVR sector 1 and 2. West of
Terceira, the Serreta ridge, disrupts the eastern flank of the East Graciosa Basin. The
most recent volcanic eruption in the Azores occurred on this ridge. East of the Island,
several linear volcanic ridges with heterogeneous magnetic character converge into the
Island plateau and define a broad v-shape morphology. To the present day it has never
been clear, if accretion takes place in a single or in several neovolcanic axis in this plate
boundary, and, as pointed by Searle (1980), if main plate boundary processes are
located in the bottom of the basins or associated with the linear volcanic ridges that
border them.
In this chapter we use all available altimetric/bathymetric data sources both in Terceira,
the East Graciosa Basin and the North Hirondele basin, to create an integrated Digital
Terrain Model (DTM). This map is used to interprete the tectonic pattern and its
variations within the context of Terceira axis as a plate boundary. By comparing
observations from both basins and in different sectors of the Island, we aim to verify if
the tectonic observations can be explained by a single tectonic regime (i.e right lateral
transtension) or if strain is accommodated differently in the domains to the west and
126
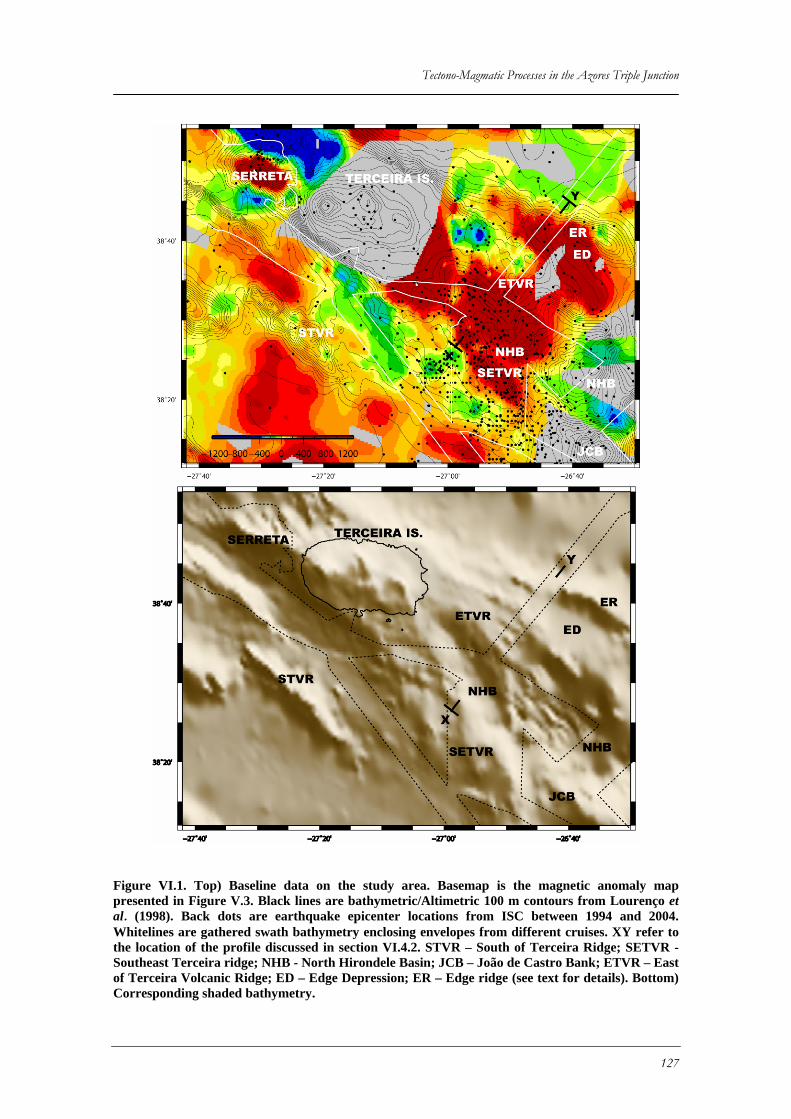
Tectono-Magmatic Processes in the Azores Triple Junction
Figure VI.1. Top) Baseline data on the study area. Basemap is the magnetic anomaly map presented in Figure V.3. Black lines are bathymetric/Altimetric 100 m contours from Lourenço et al. (1998). Back dots are earthquake epicenter locations from ISC between 1994 and 2004. Whitelines are gathered swath bathymetry enclosing envelopes from different cruises. XY refer to the location of the profile discussed in section VI.4.2. STVR – South of Terceira Ridge; SETVR - Southeast Terceira ridge; NHB - North Hirondele Basin; JCB – João de Castro Bank; ETVR – East of Terceira Volcanic Ridge; ED – Edge Depression; ER – Edge ridge (see text for details). Bottom) Corresponding shaded bathymetry.
127
Chapter VI - Tectonics on the Terceira Island and neighbouring basins East of Terceira Island. We finally attempt to draw a complete tectono-magmatic
framework for this area.
VI.2 Data and strategy
The compilation of bathymetric data acquired prior to 1998, presented by Lourenço et
al. (1998) was updated since, with other swath bathymetry data more focused around
the Terceira Island (Figure VI.2a), namely: 1) the SIRENA cruise (PI Jean Goslin)
provided a small Simrad EM300 survey gridded at 60x60m in the submarine ridge
located southeast of the Terceira Island (SETVR). The Serreta ridge, NW of Terceira,
was mapped over the Serreta eruption area by the R/V KNORR (Voyage 161, leg 4)
using a Seabeam 2100. MARCONNI contracted a inter-Island EM12 survey for optical
cable festooning and finally a EM12 transit from TRIATNORD cruise was gridded at
100x100 m resoluton (Goslin et al., 1999). Island topography was retrieved from digital
terrain models (DTM) from IGEOE and gridded at 30 x 30 m resolution. The resulting
map is presented in figure VI.2b. The swath bathymetry coverage is still rather limited
especially in the northern flank of the Terceira axis. It is possible to observe a sharp
contrast in the information provided by the higher resolution data sets, notably the
SIRENA, Knorr and the Island DTM with respect to background bathymetric image
from Lourenço et al., (1998).
The map is analysed together with very high resolution (4 m x 4 m) orto-photo maps
covering the Island, to retrieve a regional lineation map. This map comprises confirmed
or possible faults and volcanic alignments and unassigned lineations retrived from the
ortho-photo maps and from the DTM. The orientation of all digitized features was
analyzed and grouped in sets based on characteristic ranges of orientations. Fault
128
Tectono-Magmatic Processes in the Azores Triple Junction
kinematic constraints were interpreted based on the spatial relations between the
different sets and validated by direct field observations.
The analysis of bathymetric data was complemented with geological and tectonic
interpretations provided by high resolution sonar images acquiered during the Azzorre
99 cruise over the SETVR (See chapter V).
VI.3 Terceira Tectonics
VI.3.1 Geological setting
The Terceira Island is the third largest Island in the Azores Archipelago with an area of
402 km2. and is approximately 29 km long in the W-E direction and 18 km wide in the
N-S direction (Figure VI.3). The Island is made up of four overlapping strato-volcanos
with summit calderas, build up of volcanic sucessions ranging from basaltic to trachyte
lava flows and pyroclastic deposits (Self, 1976; Calvert et al., 2006; Nunes 2000). From
west to east, the volcanos St. Barbara, Guilherme Moniz and Cinco Picos are ligned up
along a fissural system materialized by alignments of scoria and pumice cones of
essentially basaltic nature following the same strike. St. Barbara is the most robust
volcano and its summit marks the highest point of the Island (1021 m). Located to NE
of St. Barbara, the Caldera of Pico Alto is a cluster of trachyte domes and short trachyte
flows in close association with The Guilherme Moniz northern flank. From these four
polygenetic volcanos only St. Barbara and Pico Alto are considered active (Self, 1976).
The later is considered the source for the extensive pyroclastic deposits belonging to the
Lages Ignimbrite covering the NE extent of the Island (Nunes et al., 2000) and which
erupted some 19 to 21 Ka (Self et al., 1976; Calvert et al., 2006). Age relations have
been established from geological mapping (Zbyszewski et al., 1971) and volcanic
129
Chapter VI - Tectonics on the Terceira Island and neighbouring basins stratigraphy studies (Self, 1976, Nunes, 2000). K/Ar dating (Feraud et al., 1980) for
the top of the different calderas yield values ranging from less then 30 Ka in Stª Barbara
to 300 Ka at the “Serra do Cume” (“Cinco Picos”). More recently Calvert et al. (2006),
performed seven new 40Ar/39Ar on Terceira Island, there main results point to a E-W
progression in strato-volcano growth. Cinco Picos argon ages yields 370 Ka to 380 Ka
for end of volcano growth and formation of the large 7 x 9 km caldera later covered by
basalts from the fissural system. The interior of the caldera also presents some volcanic
cones related with this system. Guilherme Moniz was active from 270 Ka to 111 Ka.
The vast majority of Pico Alto eruption, according to the same authors took place in the
interval between 9000 and 1000 years BP. Finaly the Argon age of 29 Ka for the St.
Barbara volcano is consistent with that obtained by Feraud (1980).
Historical eruptions have occurred associated both with St Barbara volcano and the
fissural system. Hot springs “furnas de enxofre” exist in the center of the Island. In 1761
two occurrences are documented. The event started by an explosion on the Misterio dos
Negros location. East of this site, and shortly after the explosion a basaltic flow
designated by “Mistério dos Biscoitos” occurred, flowing from the fissural system along
the Northern flank of the Island (Zbyszewski et al., 1971). Other recent eruptions at the
centre of the Island and linked with the fissural system displayed an isotopic age of
approximately 2115 years (Zbyszewski et al, 1971). At sea, volcanic activity has been
concentrated NW of the Island in a submarine shallow ridge striking WNW-ESE named
Serreta. This was the location of the 1867 and 1999 eruptions (Luis et al., 1999). (see
section VI.4.1).
130
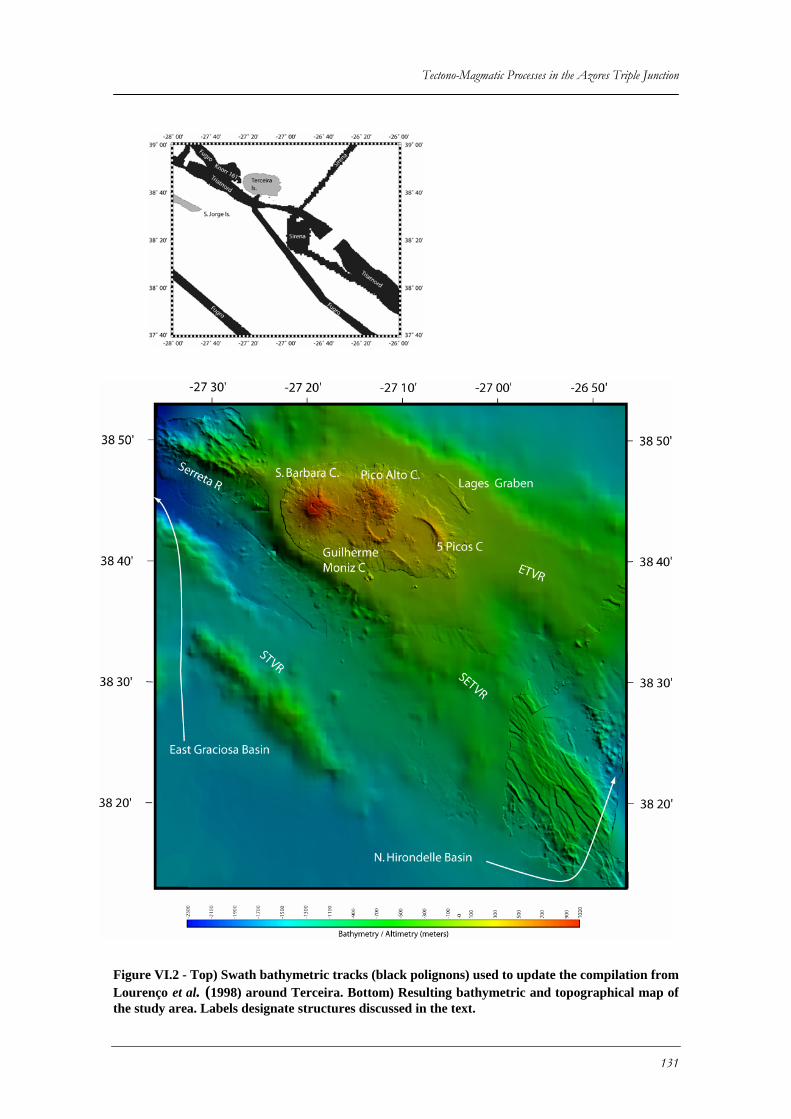
Tectono-Magmatic Processes in the Azores Triple Junction
Figure VI.2 - Top) Swath bathymetric tracks (black polignons) used to update the compilation from Lourenço et al. (1998) around Terceira. Bottom) Resulting bathymetric and topographical map of the study area. Labels designate structures discussed in the text.
131
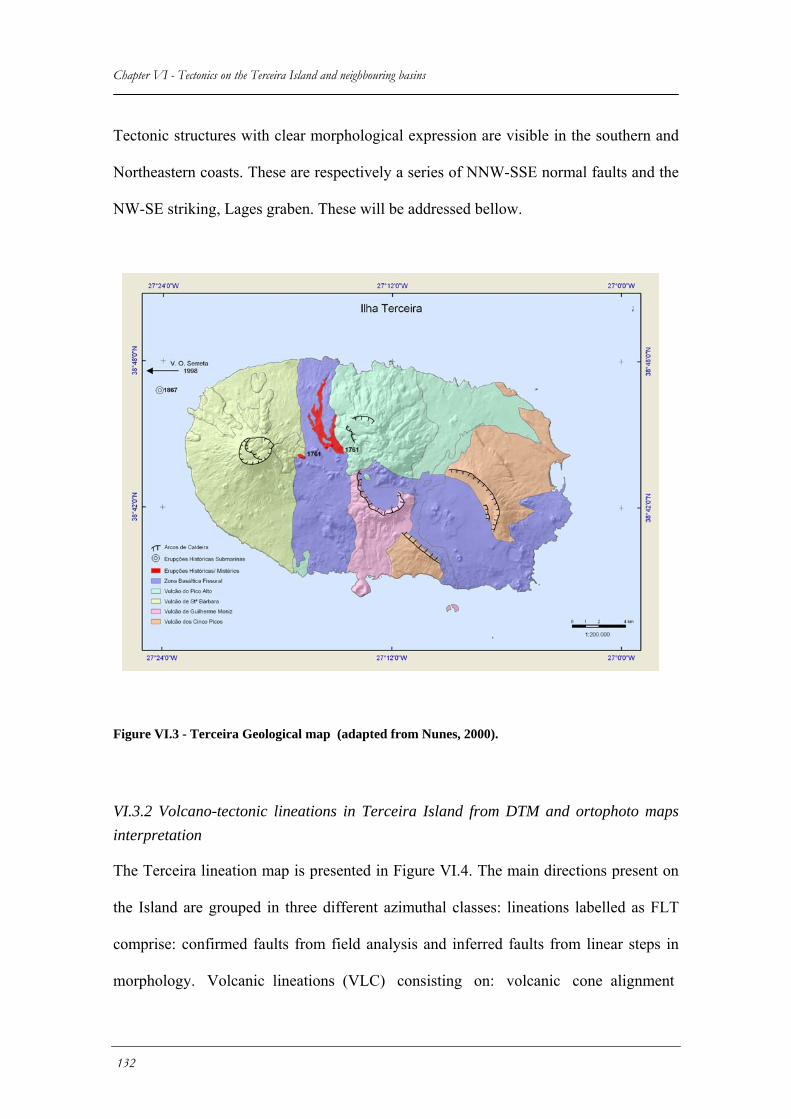
Chapter VI - Tectonics on the Terceira Island and neighbouring basins Tectonic structures with clear morphological expression are visible in the southern and
Northeastern coasts. These are respectively a series of NNW-SSE normal faults and the
NW-SE striking, Lages graben. These will be addressed bellow.
Figure VI.3 - Terceira Geological map (adapted from Nunes, 2000).
VI.3.2 Volcano-tectonic lineations in Terceira Island from DTM and ortophoto maps interpretation
The Terceira lineation map is presented in Figure VI.4. The main directions present on
the Island are grouped in three different azimuthal classes: lineations labelled as FLT
comprise: confirmed faults from field analysis and inferred faults from linear steps in
morphology. Volcanic lineations (VLC) consisting on: volcanic cone alignment
132
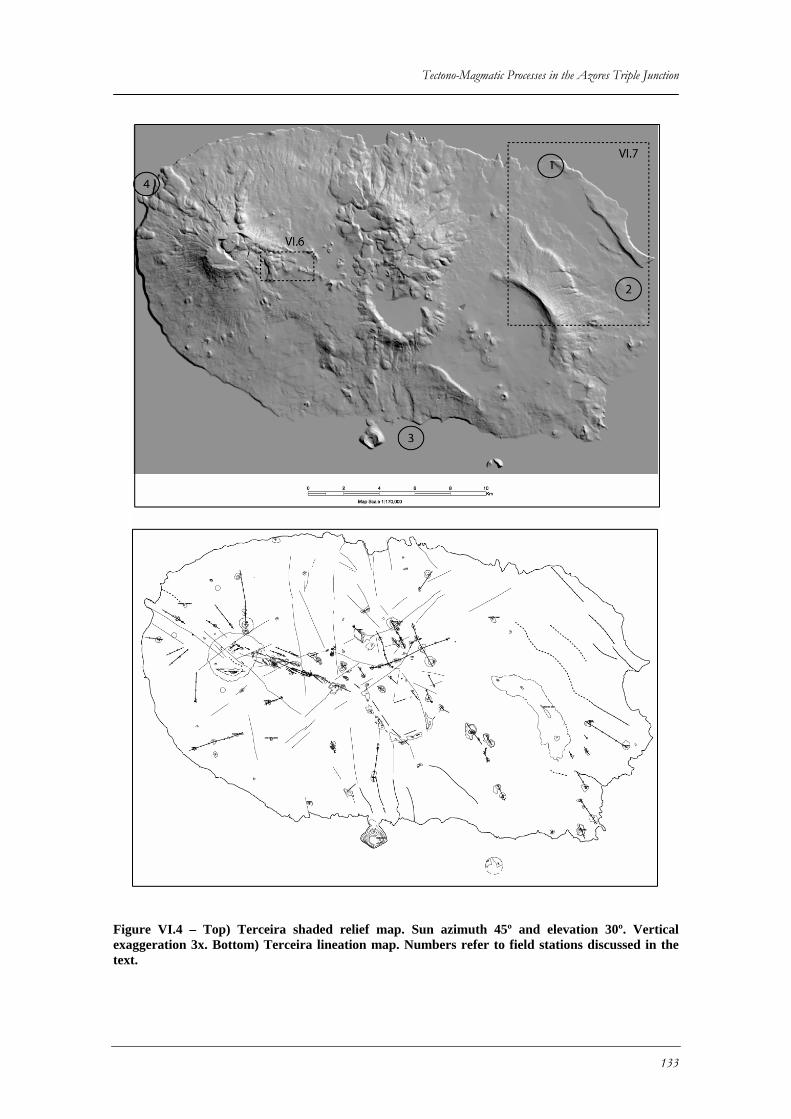
Tectono-Magmatic Processes in the Azores Triple Junction
Figure VI.4 – Top) Terceira shaded relief map. Sun azimuth 45º and elevation 30º. Vertical exaggeration 3x. Bottom) Terceira lineation map. Numbers refer to field stations discussed in the text.
133
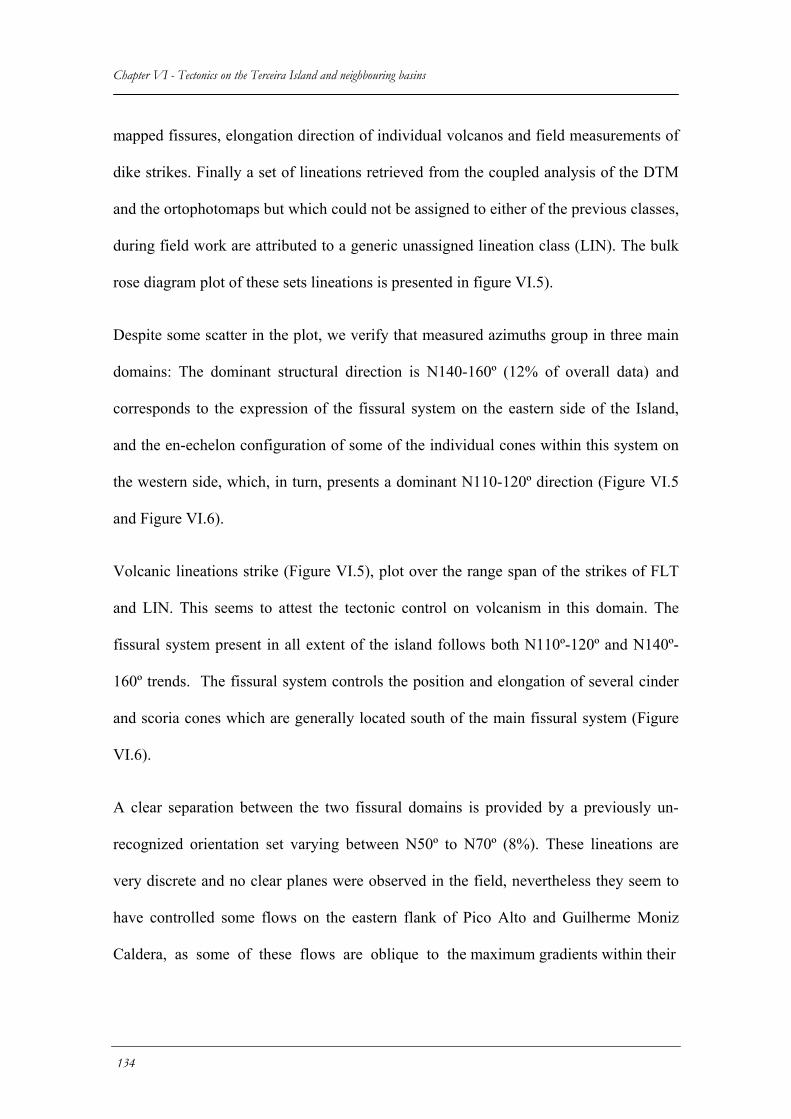
Chapter VI - Tectonics on the Terceira Island and neighbouring basins mapped fissures, elongation direction of individual volcanos and field measurements of
dike strikes. Finally a set of lineations retrieved from the coupled analysis of the DTM
and the ortophotomaps but which could not be assigned to either of the previous classes,
during field work are attributed to a generic unassigned lineation class (LIN). The bulk
rose diagram plot of these sets lineations is presented in figure VI.5).
Despite some scatter in the plot, we verify that measured azimuths group in three main
domains: The dominant structural direction is N140-160º (12% of overall data) and
corresponds to the expression of the fissural system on the eastern side of the Island,
and the en-echelon configuration of some of the individual cones within this system on
the western side, which, in turn, presents a dominant N110-120º direction (Figure VI.5
and Figure VI.6).
Volcanic lineations strike (Figure VI.5), plot over the range span of the strikes of FLT
and LIN. This seems to attest the tectonic control on volcanism in this domain. The
fissural system present in all extent of the island follows both N110º-120º and N140º-
160º trends. The fissural system controls the position and elongation of several cinder
and scoria cones which are generally located south of the main fissural system (Figure
VI.6).
A clear separation between the two fissural domains is provided by a previously un-
recognized orientation set varying between N50º to N70º (8%). These lineations are
very discrete and no clear planes were observed in the field, nevertheless they seem to
have controlled some flows on the eastern flank of Pico Alto and Guilherme Moniz
Caldera, as some of these flows are oblique to the maximum gradients within their
134
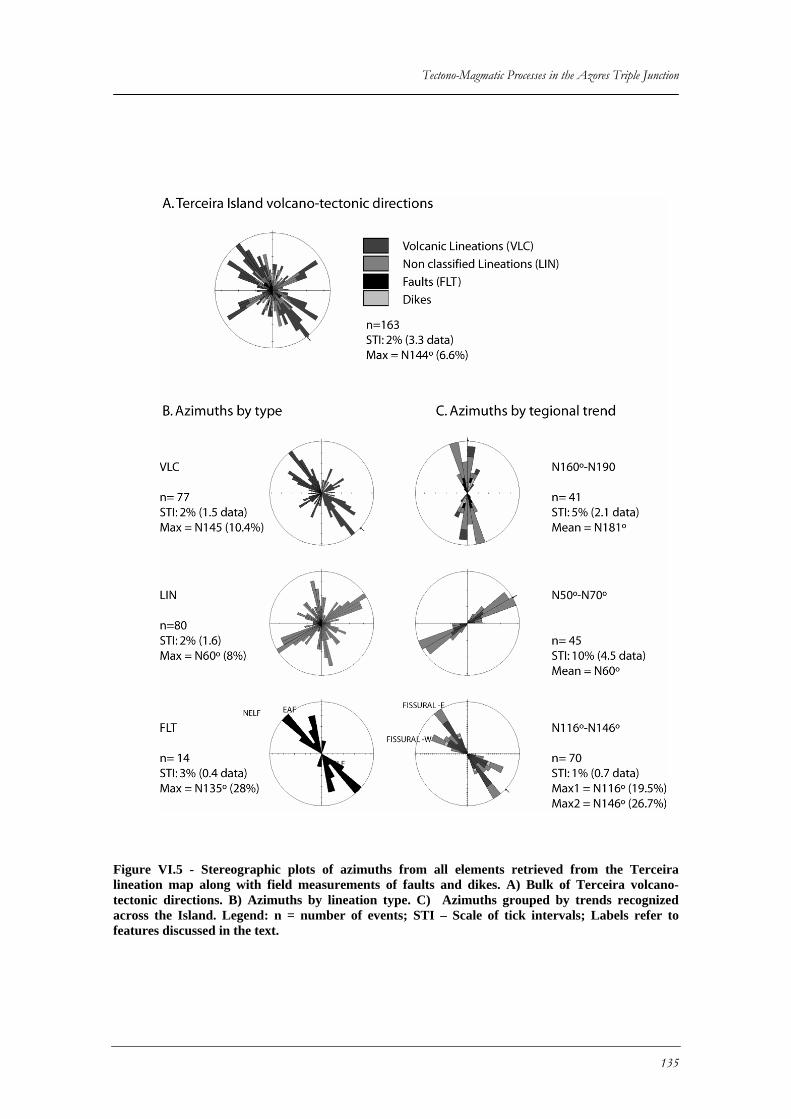
Tectono-Magmatic Processes in the Azores Triple Junction
Figure VI.5 - Stereographic plots of azimuths from all elements retrieved from the Terceira lineation map along with field measurements of faults and dikes. A) Bulk of Terceira volcano-tectonic directions. B) Azimuths by lineation type. C) Azimuths grouped by trends recognized across the Island. Legend: n = number of events; STI – Scale of tick intervals; Labels refer to features discussed in the text.
135
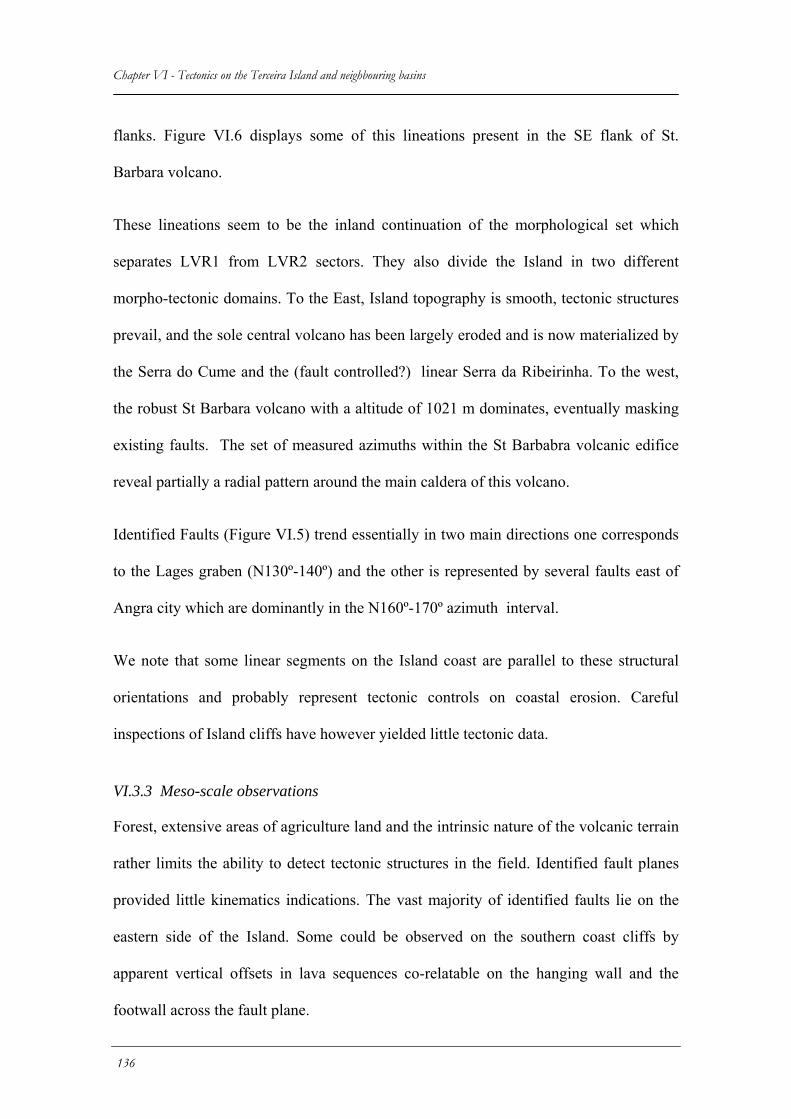
Chapter VI - Tectonics on the Terceira Island and neighbouring basins flanks. Figure VI.6 displays some of this lineations present in the SE flank of St.
Barbara volcano.
These lineations seem to be the inland continuation of the morphological set which
separates LVR1 from LVR2 sectors. They also divide the Island in two different
morpho-tectonic domains. To the East, Island topography is smooth, tectonic structures
prevail, and the sole central volcano has been largely eroded and is now materialized by
the Serra do Cume and the (fault controlled?) linear Serra da Ribeirinha. To the west,
the robust St Barbara volcano with a altitude of 1021 m dominates, eventually masking
existing faults. The set of measured azimuths within the St Barbabra volcanic edifice
reveal partially a radial pattern around the main caldera of this volcano.
Identified Faults (Figure VI.5) trend essentially in two main directions one corresponds
to the Lages graben (N130º-140º) and the other is represented by several faults east of
Angra city which are dominantly in the N160º-170º azimuth interval.
We note that some linear segments on the Island coast are parallel to these structural
orientations and probably represent tectonic controls on coastal erosion. Careful
inspections of Island cliffs have however yielded little tectonic data.
VI.3.3 Meso-scale observations
Forest, extensive areas of agriculture land and the intrinsic nature of the volcanic terrain
rather limits the ability to detect tectonic structures in the field. Identified fault planes
provided little kinematics indications. The vast majority of identified faults lie on the
eastern side of the Island. Some could be observed on the southern coast cliffs by
apparent vertical offsets in lava sequences co-relatable on the hanging wall and the
footwall across the fault plane.
136
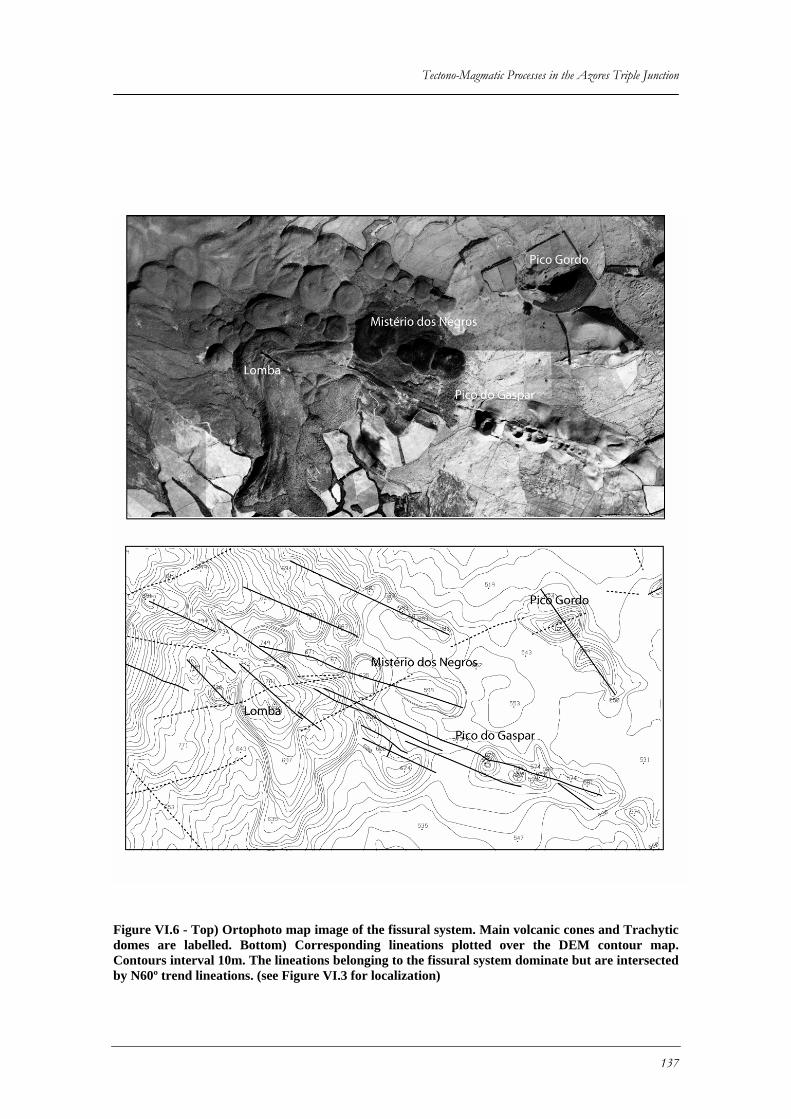
Tectono-Magmatic Processes in the Azores Triple Junction
Figure VI.6 - Top) Ortophoto map image of the fissural system. Main volcanic cones and Trachytic domes are labelled. Bottom) Corresponding lineations plotted over the DEM contour map. Contours interval 10m. The lineations belonging to the fissural system dominate but are intersected by N60º trend lineations. (see Figure VI.3 for localization)
137
Chapter VI - Tectonics on the Terceira Island and neighbouring basins The faults in the Island, group in two main areas (see Figure VI.4) for location: the
Lages Graben faults and The East Angra faults. These are briefly documented below.
Additionally it is worth mentioning a set of brittle structures associated with the onset of
a trachytic lava flow in the Ponta da Serreta promontory. Despite constituting a
somewhat off-topic, we opted to address them in this manuscript as an illustration of the
peculiarities that can arise from tectonic studies in volcanic terrains.
VI.3.3.1 The Lages Graben
The Lages Graben, the most evident tectonic feature in Terceira Island, is a 10 km long,
3.5 km wide and trends N130º. This feature may extend further SE through the seafloor.
The surface of the graben is covered by a ignimbrite deposit dated of 18 Kyr BP (Before
Present) by Feraud et al. (1980). The Lages Graben North-Eastern bounding fault
(NELF) is well expressed in topography. The NELF in plan view presents three sinuous
segments with a tight en-echelon configuration. Further to SE, near Praia da Victoria,
within the graben, a secondary fault is traceable from the topography and has been
mapped in the Terceira Geological Map (Zbyszewski et al., 1971)
Each segment displays a well defined SW facing scarp. At the tips of the segments the
scarp is strongly attenuated and is retreated to its adjacent scarp traces therefore
defining bridge structures (Figure VI.7). The bridge structures can result from 1) the
en-echelon nature of the fault; 2) interaction with intersecting faults and 3) soft linkage
at adjacent fault segment tips (Hossack, 1983). We were not able to verify any of these
possibilities during field work.
The NELF fault zone is exposed in an outcrop on the Island’s NE coast (station 1 in
Figure VI.4 and VI.7). It presents a well exposed section of the fault damage zone (see
138
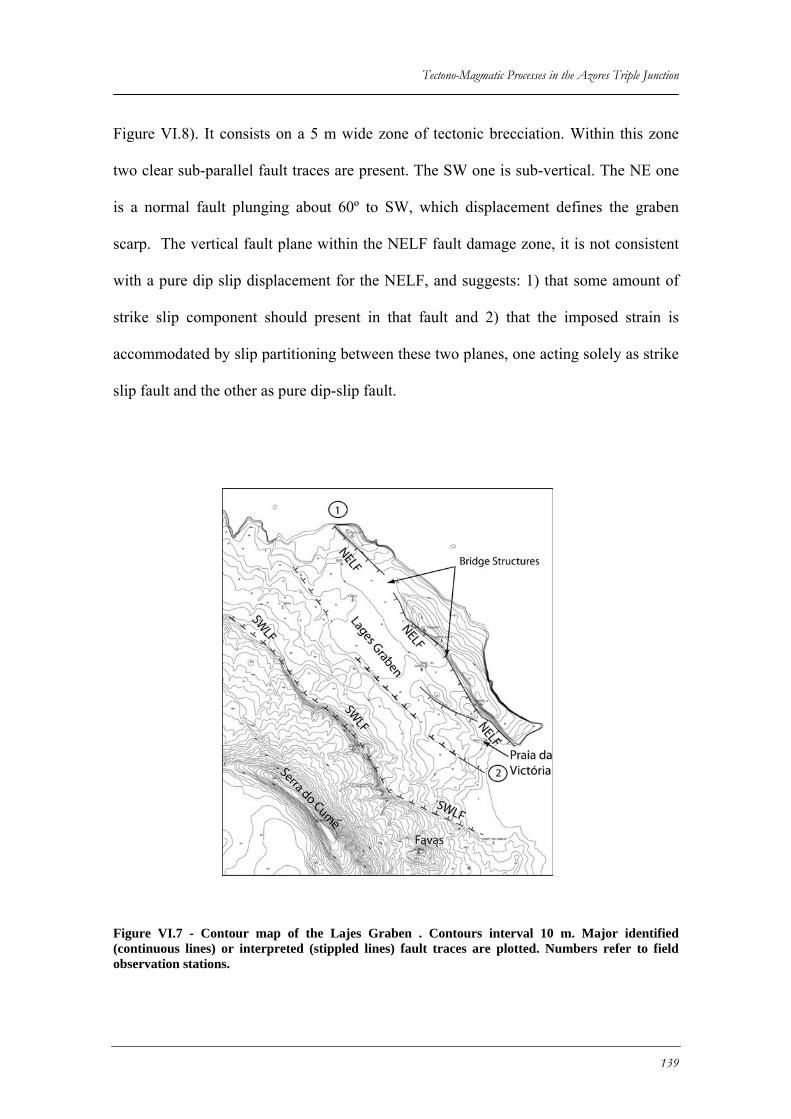
Tectono-Magmatic Processes in the Azores Triple Junction
Figure VI.8). It consists on a 5 m wide zone of tectonic brecciation. Within this zone
two clear sub-parallel fault traces are present. The SW one is sub-vertical. The NE one
is a normal fault plunging about 60º to SW, which displacement defines the graben
scarp. The vertical fault plane within the NELF fault damage zone, it is not consistent
with a pure dip slip displacement for the NELF, and suggests: 1) that some amount of
strike slip component should present in that fault and 2) that the imposed strain is
accommodated by slip partitioning between these two planes, one acting solely as strike
slip fault and the other as pure dip-slip fault.
Figure VI.7 - Contour map of the Lajes Graben . Contours interval 10 m. Major identified (continuous lines) or interpreted (stippled lines) fault traces are plotted. Numbers refer to field observation stations.
139
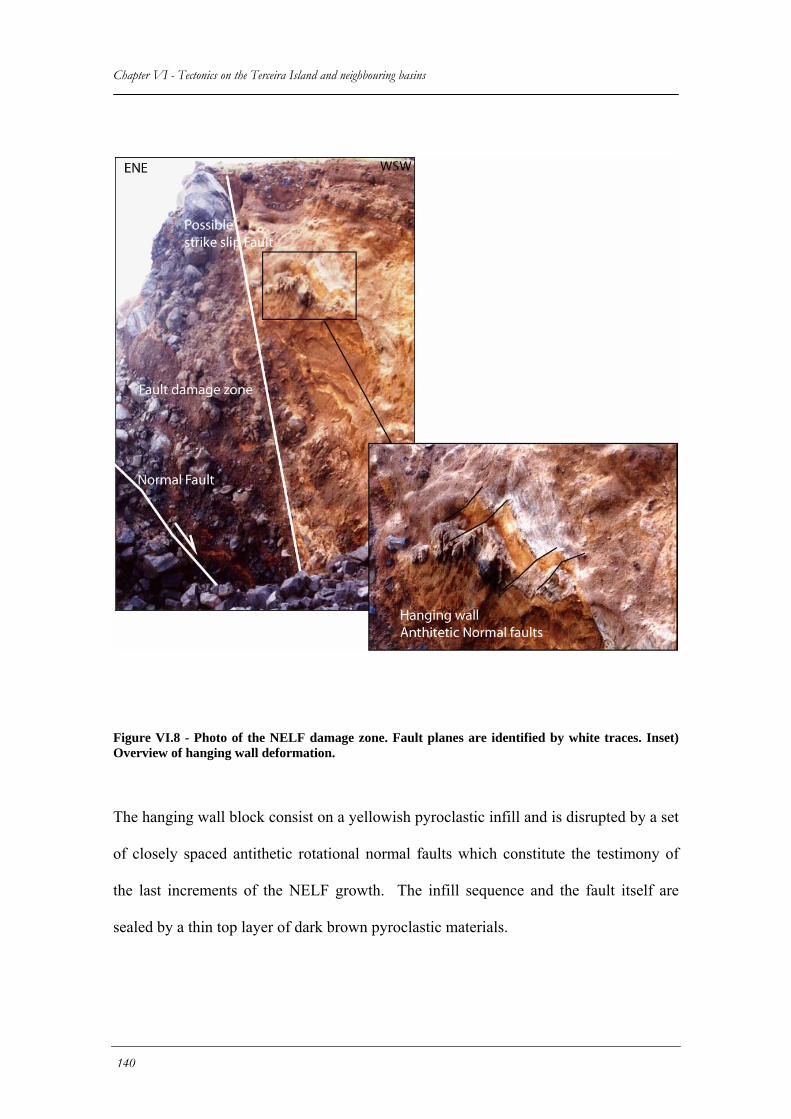
Chapter VI - Tectonics on the Terceira Island and neighbouring basins
Figure VI.8 - Photo of the NELF damage zone. Fault planes are identified by white traces. Inset) Overview of hanging wall deformation.
The hanging wall block consist on a yellowish pyroclastic infill and is disrupted by a set
of closely spaced antithetic rotational normal faults which constitute the testimony of
the last increments of the NELF growth. The infill sequence and the fault itself are
sealed by a thin top layer of dark brown pyroclastic materials.
140
Tectono-Magmatic Processes in the Azores Triple Junction
The SWLF fault is less well exposed. The clear step observed in topography consists on
a contact between a trachyte flow unit and the graben floor. We performed, where
possible, a series of transects across this morphological step, normal to the possible fault
trace, which did not result in any clear fault plane identification. We noted nevertheless
that, to NE of the main morphological step, the bottom of the graben is reached by a
succession of small step like terraces, providing faint lineations in the DTM retrieved
images and contour maps (Figure VI.4). Confirmation of these as fault related, is
achieved in the western sector of the Praia da Victoria bay cliff (station 2 in Figure
VI.7). Here, faults crop out and a complete geological cross section on the SW graben
bounding faults is displayed. (Figure VI.9). The overall SW-NE oriented cross section
displays a cylindrical fold in pyroclasts, with 20º deeping flanks and axial plane nearly
E-W. It is unclear if this fold is simply the result of cohesive ash fall deposition over a
possible positive paleo-relief in the sub-surface or whether it results from tectonic
processes. Further NE from the fold, a horst structure is present, defined to SW by a 60º
deeping normal fault, striking N144º (F2 in Figure VI.8), thus subparallel to the SWLF;
and to NE by a fault (F1) striking N80ºW and dipping 75º northwards. Analogously to
the NELF, the dips of this fault exclude them as having simple dip-slip components, and
suggest existance of some sort of strain partitioning, with presence of oblique or strike
slip components. Considering the regional fault kinematics, it is conceivable that F1 is
associated with right lateral strike slip. In this case the observed fold could also form, as
a consequence of space problems, at the intersection between both fault systems.
Verification of this hypothesis however, was not possible, as we were not able to detect
any occurrence of faults to SW of the fold.
141
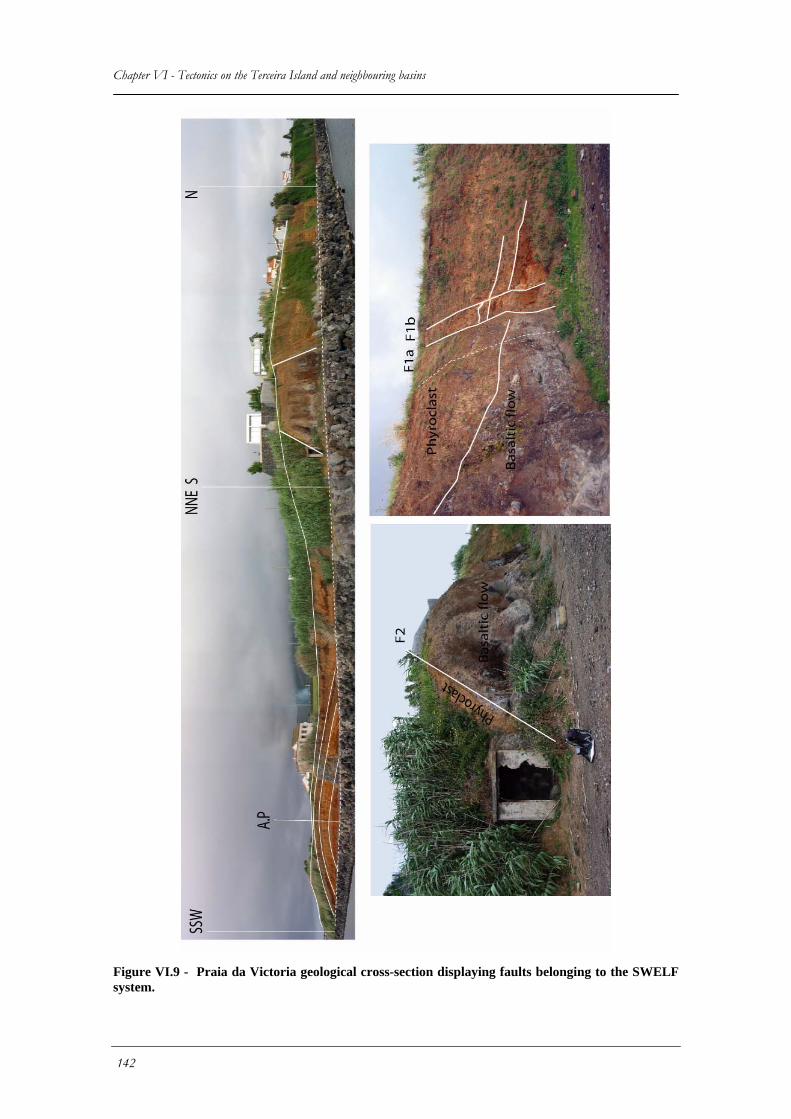
Chapter VI - Tectonics on the Terceira Island and neighbouring basins
Figure VI.9 - Praia da Victoria geological cross-section displaying faults belonging to the SWELF system.
142
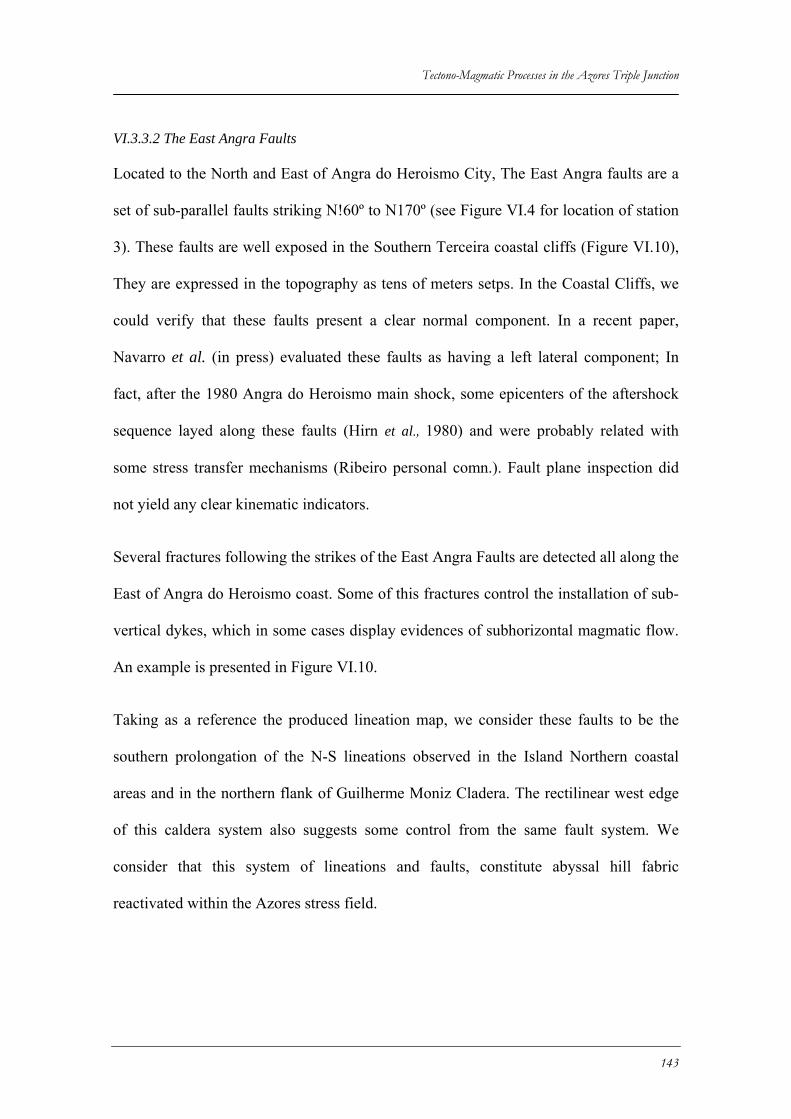
Tectono-Magmatic Processes in the Azores Triple Junction
VI.3.3.2 The East Angra Faults
Located to the North and East of Angra do Heroismo City, The East Angra faults are a
set of sub-parallel faults striking N!60º to N170º (see Figure VI.4 for location of station
3). These faults are well exposed in the Southern Terceira coastal cliffs (Figure VI.10),
They are expressed in the topography as tens of meters setps. In the Coastal Cliffs, we
could verify that these faults present a clear normal component. In a recent paper,
Navarro et al. (in press) evaluated these faults as having a left lateral component; In
fact, after the 1980 Angra do Heroismo main shock, some epicenters of the aftershock
sequence layed along these faults (Hirn et al., 1980) and were probably related with
some stress transfer mechanisms (Ribeiro personal comn.). Fault plane inspection did
not yield any clear kinematic indicators.
Several fractures following the strikes of the East Angra Faults are detected all along the
East of Angra do Heroismo coast. Some of this fractures control the installation of sub-
vertical dykes, which in some cases display evidences of subhorizontal magmatic flow.
An example is presented in Figure VI.10.
Taking as a reference the produced lineation map, we consider these faults to be the
southern prolongation of the N-S lineations observed in the Island Northern coastal
areas and in the northern flank of Guilherme Moniz Cladera. The rectilinear west edge
of this caldera system also suggests some control from the same fault system. We
consider that this system of lineations and faults, constitute abyssal hill fabric
reactivated within the Azores stress field.
143
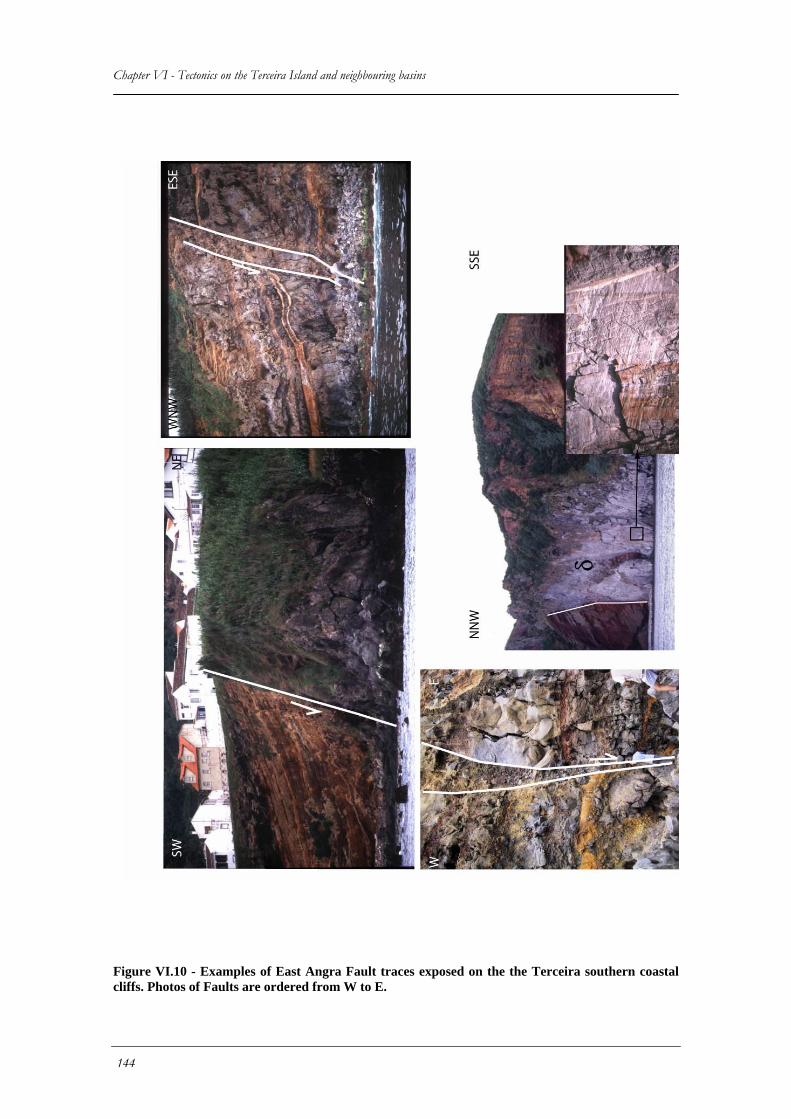
Chapter VI - Tectonics on the Terceira Island and neighbouring basins
Figure VI.10 - Examples of East Angra Fault traces exposed on the the Terceira southern coastal cliffs. Photos of Faults are ordered from W to E.
144
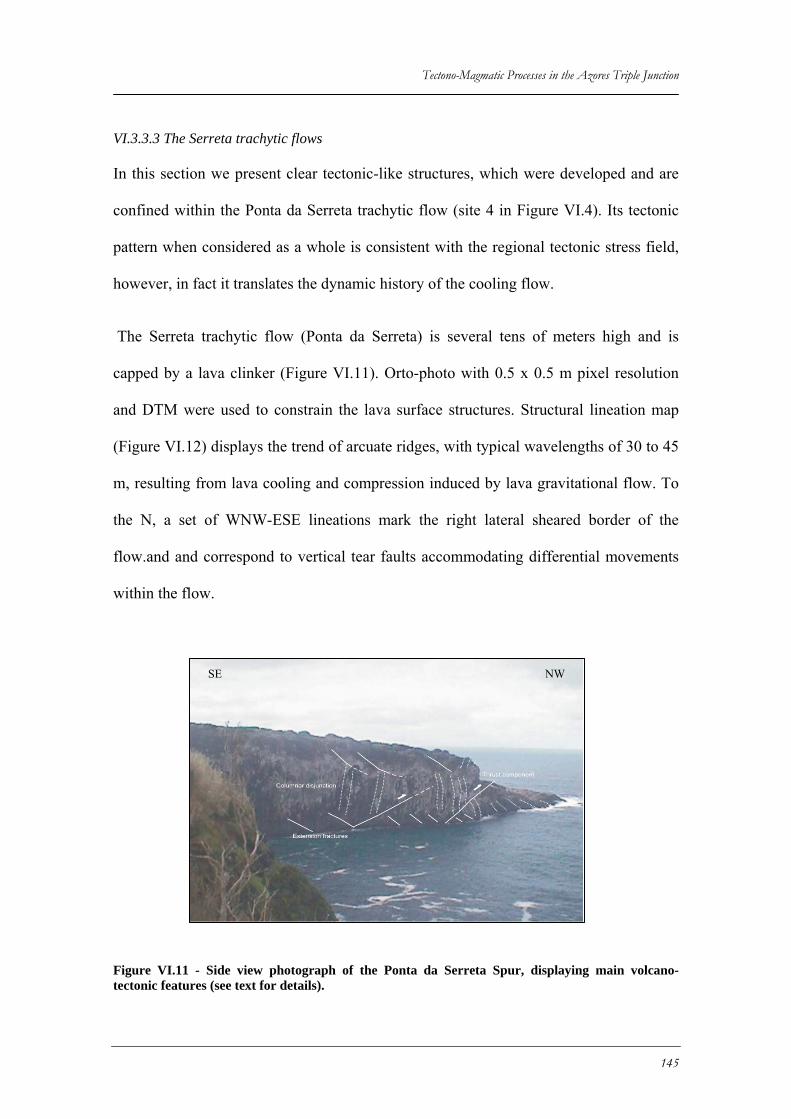
Tectono-Magmatic Processes in the Azores Triple Junction
VI.3.3.3 The Serreta trachytic flows
In this section we present clear tectonic-like structures, which were developed and are
confined within the Ponta da Serreta trachytic flow (site 4 in Figure VI.4). Its tectonic
pattern when considered as a whole is consistent with the regional tectonic stress field,
however, in fact it translates the dynamic history of the cooling flow.
The Serreta trachytic flow (Ponta da Serreta) is several tens of meters high and is
capped by a lava clinker (Figure VI.11). Orto-photo with 0.5 x 0.5 m pixel resolution
and DTM were used to constrain the lava surface structures. Structural lineation map
(Figure VI.12) displays the trend of arcuate ridges, with typical wavelengths of 30 to 45
m, resulting from lava cooling and compression induced by lava gravitational flow. To
the N, a set of WNW-ESE lineations mark the right lateral sheared border of the
flow.and and correspond to vertical tear faults accommodating differential movements
within the flow.
SE NW
Figure VI.11 - Side view photograph of the Ponta da Serreta Spur, displaying main volcano-tectonic features (see text for details).
145
Chapter VI - Tectonics on the Terceira Island and neighbouring basins The structures observed in the Ponta da Serreta seacliff are brittle to ductile shear zones
developing low angle frontal (synthetic and antithetic) and lateral ramps; deformed
columnar disjunction and other brittle planar discontinuities. Ductile-brittle transition in
a context of progressive deformation within viscous flow is given by the deformed
prisms. Flow front is characterised by brittle reverse faults and extensional fractures
(Figure VI.11).
Figure VI.12 - Left) Ortophotomap of the Ponta da Serreta Spur. Right) corresponding structural map.
146
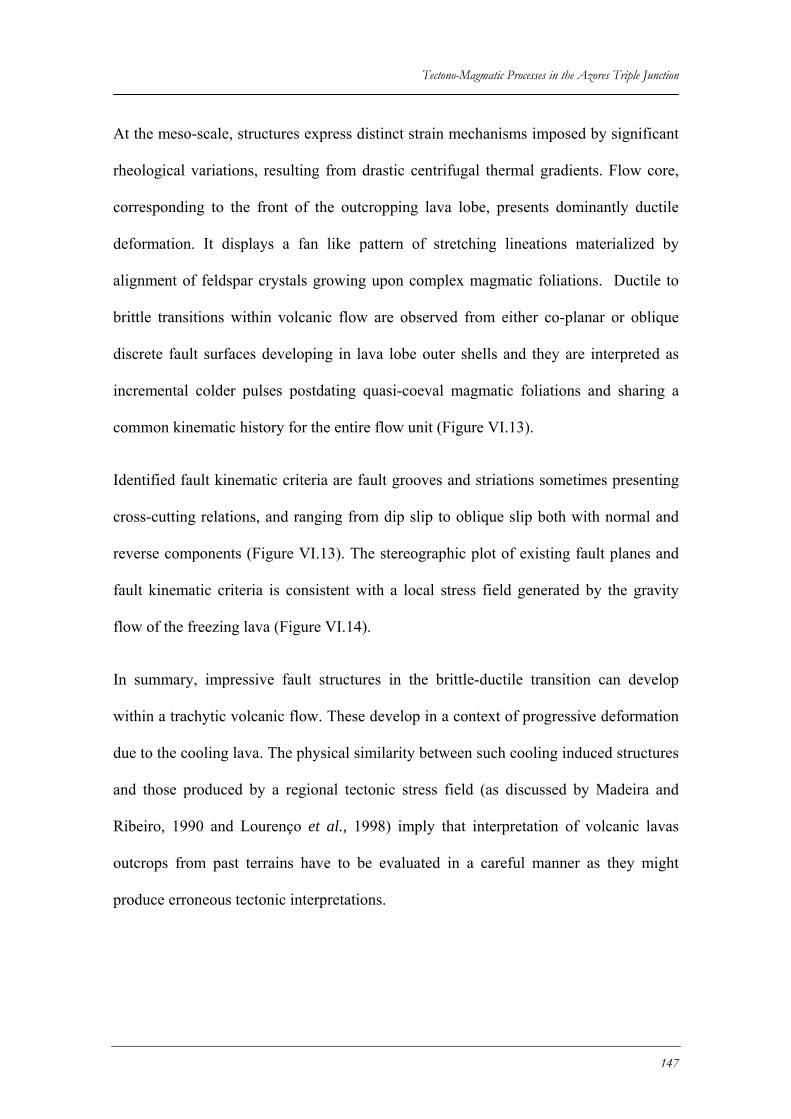
Tectono-Magmatic Processes in the Azores Triple Junction
At the meso-scale, structures express distinct strain mechanisms imposed by significant
rheological variations, resulting from drastic centrifugal thermal gradients. Flow core,
corresponding to the front of the outcropping lava lobe, presents dominantly ductile
deformation. It displays a fan like pattern of stretching lineations materialized by
alignment of feldspar crystals growing upon complex magmatic foliations. Ductile to
brittle transitions within volcanic flow are observed from either co-planar or oblique
discrete fault surfaces developing in lava lobe outer shells and they are interpreted as
incremental colder pulses postdating quasi-coeval magmatic foliations and sharing a
common kinematic history for the entire flow unit (Figure VI.13).
Identified fault kinematic criteria are fault grooves and striations sometimes presenting
cross-cutting relations, and ranging from dip slip to oblique slip both with normal and
reverse components (Figure VI.13). The stereographic plot of existing fault planes and
fault kinematic criteria is consistent with a local stress field generated by the gravity
flow of the freezing lava (Figure VI.14).
In summary, impressive fault structures in the brittle-ductile transition can develop
within a trachytic volcanic flow. These develop in a context of progressive deformation
due to the cooling lava. The physical similarity between such cooling induced structures
and those produced by a regional tectonic stress field (as discussed by Madeira and
Ribeiro, 1990 and Lourenço et al., 1998) imply that interpretation of volcanic lavas
outcrops from past terrains have to be evaluated in a careful manner as they might
produce erroneous tectonic interpretations.
147
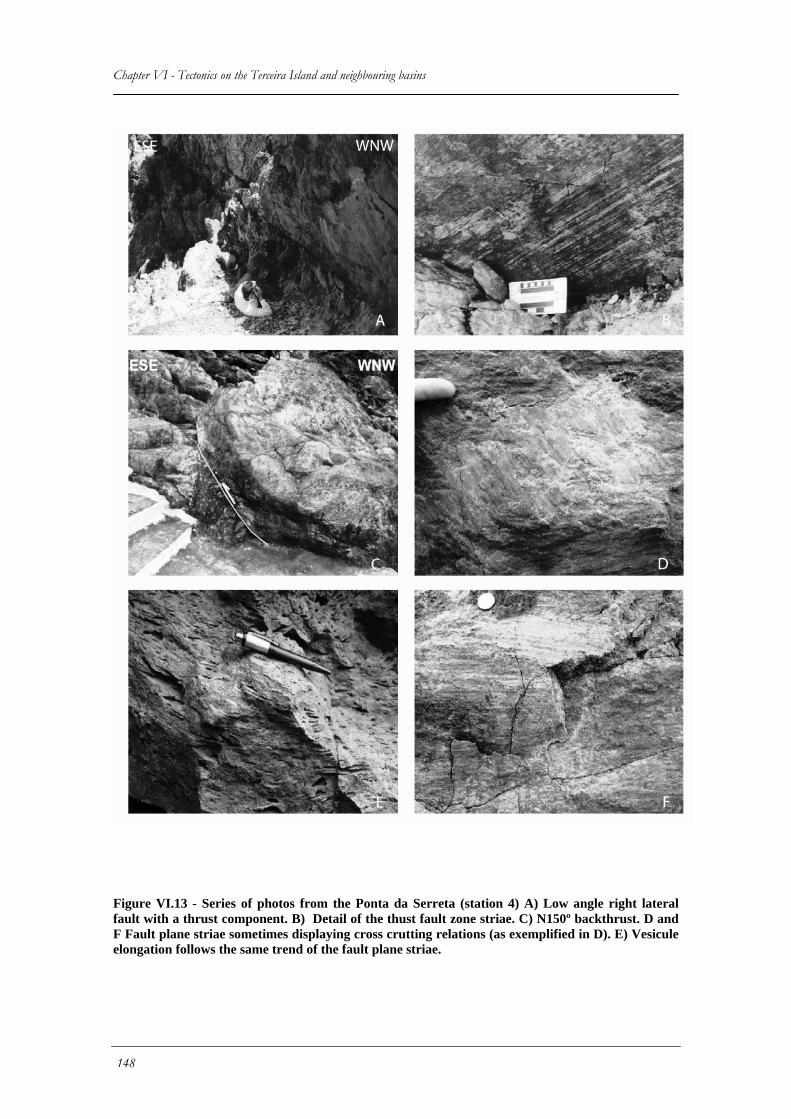
Chapter VI - Tectonics on the Terceira Island and neighbouring basins
Figure VI.13 - Series of photos from the Ponta da Serreta (station 4) A) Low angle right lateral fault with a thrust component. B) Detail of the thust fault zone striae. C) N150º backthrust. D and F Fault plane striae sometimes displaying cross crutting relations (as exemplified in D). E) Vesicule elongation follows the same trend of the fault plane striae.
148
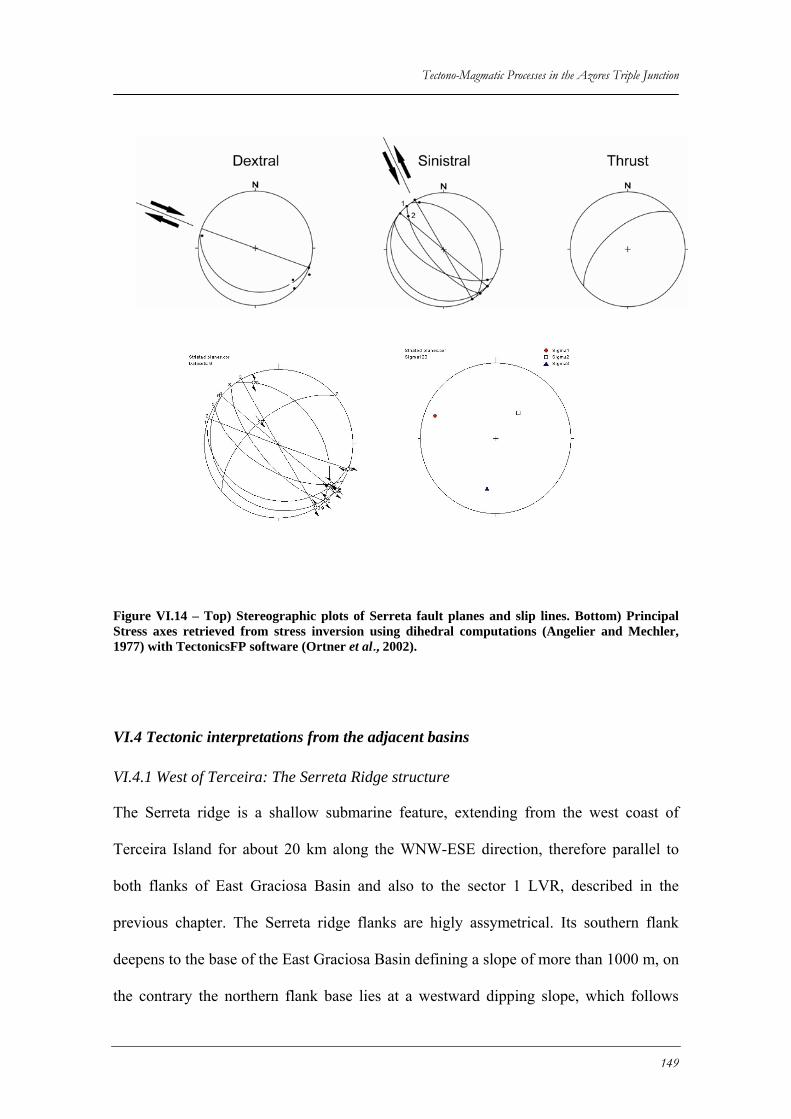
Tectono-Magmatic Processes in the Azores Triple Junction
Figure VI.14 – Top) Stereographic plots of Serreta fault planes and slip lines. Bottom) Principal Stress axes retrieved from stress inversion using dihedral computations (Angelier and Mechler, 1977) with TectonicsFP software (Ortner et al., 2002).
VI.4 Tectonic interpretations from the adjacent basins
VI.4.1 West of Terceira: The Serreta Ridge structure
The Serreta ridge is a shallow submarine feature, extending from the west coast of
Terceira Island for about 20 km along the WNW-ESE direction, therefore parallel to
both flanks of East Graciosa Basin and also to the sector 1 LVR, described in the
previous chapter. The Serreta ridge flanks are higly assymetrical. Its southern flank
deepens to the base of the East Graciosa Basin defining a slope of more than 1000 m, on
the contrary the northern flank base lies at a westward dipping slope, which follows
149
Chapter VI - Tectonics on the Terceira Island and neighbouring basins roughly the same westward inclination of the Serreta ridge axis. Therefore the northern
flank Serreta presents a fairly uniform height of ca. 500 m. The spatial relation of
Serreta structure with the main St. Barbara volcano seems analogue of what was
observed between the Capelinhos fissural system and the Faial Island central caldera.
The axis of Serreta is well aligned with the inland fissural system, suggesting that the
St. Barbara volcano has grow over and masked it.
Northwards, sub-parallel to the Serreta ridge, two more ridges are present (Ridges 2 and
3) (Figure VI.15) both with a length of approximately 8 km and an average height of
respectively 400 m and 200 m. Ridge 2 aligns with a massif trachytic flow on land,
suggesting a structural control of the valley where this flow is present. Ridge 3 has no
obvious prolongation in land.
The three main ridges present a similar morphology and are spaced at equal intervals of
4 km. Despite some limitations in the areal extent of the survey, their configuration
suggests a rigth lateral en-echelon pattern along N65º. Contrary to Serreta Ridge which
displays a strong positive anomaly of about 1000 nT, the other two neighbouring ridges
present negative anomalies of respectively ca. -50 nT and ca. -1060 nT. If these are
contemporary features, as their morphology suggests, than they are growing on strong
reversely magnetized basement of the Terceira axis. Other possibility, given their
magnetic anomalies, is that they are older features. In this case, their orientations
suggesting a fairly homogeneous stress field along recent times in this domain.
The three ridges are formed by several segments linked together either due to bending
of continuous ridge tips towards one another, or by possible splay formation from the
dominate ridge segment. These linkage zones are areas of disturbed relief. In the Serreta
150
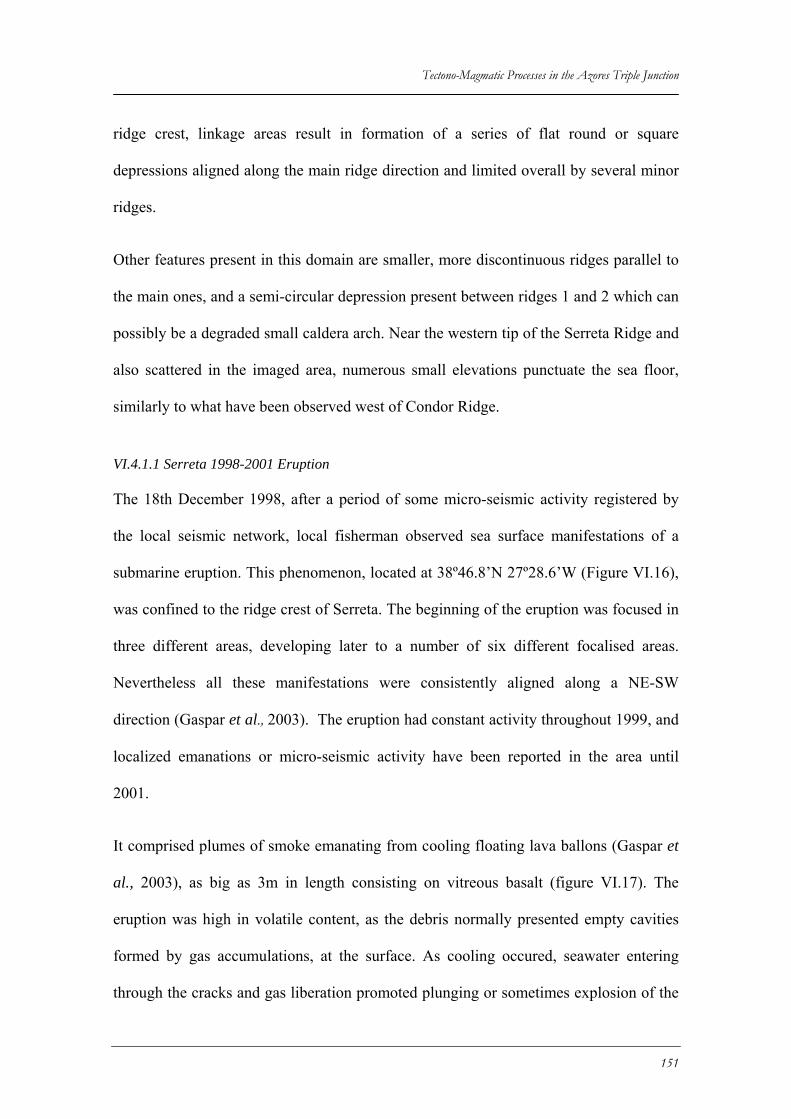
Tectono-Magmatic Processes in the Azores Triple Junction
ridge crest, linkage areas result in formation of a series of flat round or square
depressions aligned along the main ridge direction and limited overall by several minor
ridges.
Other features present in this domain are smaller, more discontinuous ridges parallel to
the main ones, and a semi-circular depression present between ridges 1 and 2 which can
possibly be a degraded small caldera arch. Near the western tip of the Serreta Ridge and
also scattered in the imaged area, numerous small elevations punctuate the sea floor,
similarly to what have been observed west of Condor Ridge.
VI.4.1.1 Serreta 1998-2001 Eruption
The 18th December 1998, after a period of some micro-seismic activity registered by
the local seismic network, local fisherman observed sea surface manifestations of a
submarine eruption. This phenomenon, located at 38º46.8’N 27º28.6’W (Figure VI.16),
was confined to the ridge crest of Serreta. The beginning of the eruption was focused in
three different areas, developing later to a number of six different focalised areas.
Nevertheless all these manifestations were consistently aligned along a NE-SW
direction (Gaspar et al., 2003). The eruption had constant activity throughout 1999, and
localized emanations or micro-seismic activity have been reported in the area until
2001.
It comprised plumes of smoke emanating from cooling floating lava ballons (Gaspar et
al., 2003), as big as 3m in length consisting on vitreous basalt (figure VI.17). The
eruption was high in volatile content, as the debris normally presented empty cavities
formed by gas accumulations, at the surface. As cooling occured, seawater entering
through the cracks and gas liberation promoted plunging or sometimes explosion of the
151
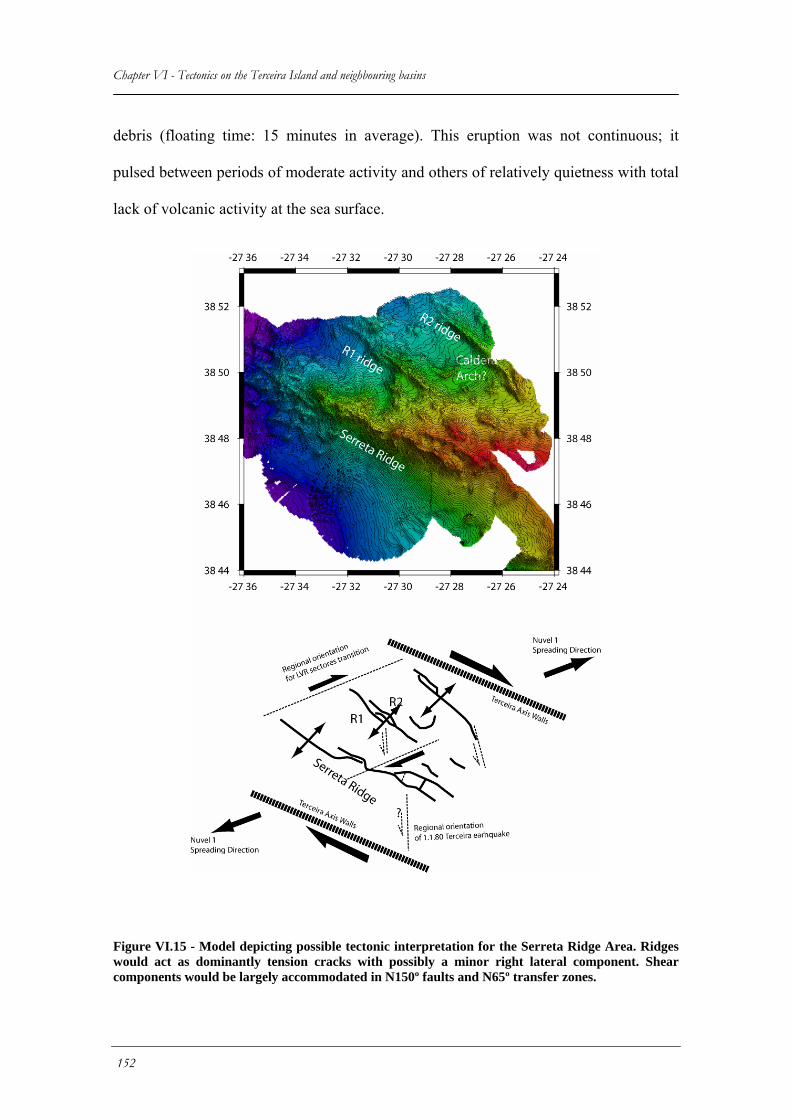
Chapter VI - Tectonics on the Terceira Island and neighbouring basins debris (floating time: 15 minutes in average). This eruption was not continuous; it
pulsed between periods of moderate activity and others of relatively quietness with total
lack of volcanic activity at the sea surface.
Figure VI.15 - Model depicting possible tectonic interpretation for the Serreta Ridge Area. Ridges would act as dominantly tension cracks with possibly a minor right lateral component. Shear components would be largely accommodated in N150º faults and N65º transfer zones.
152
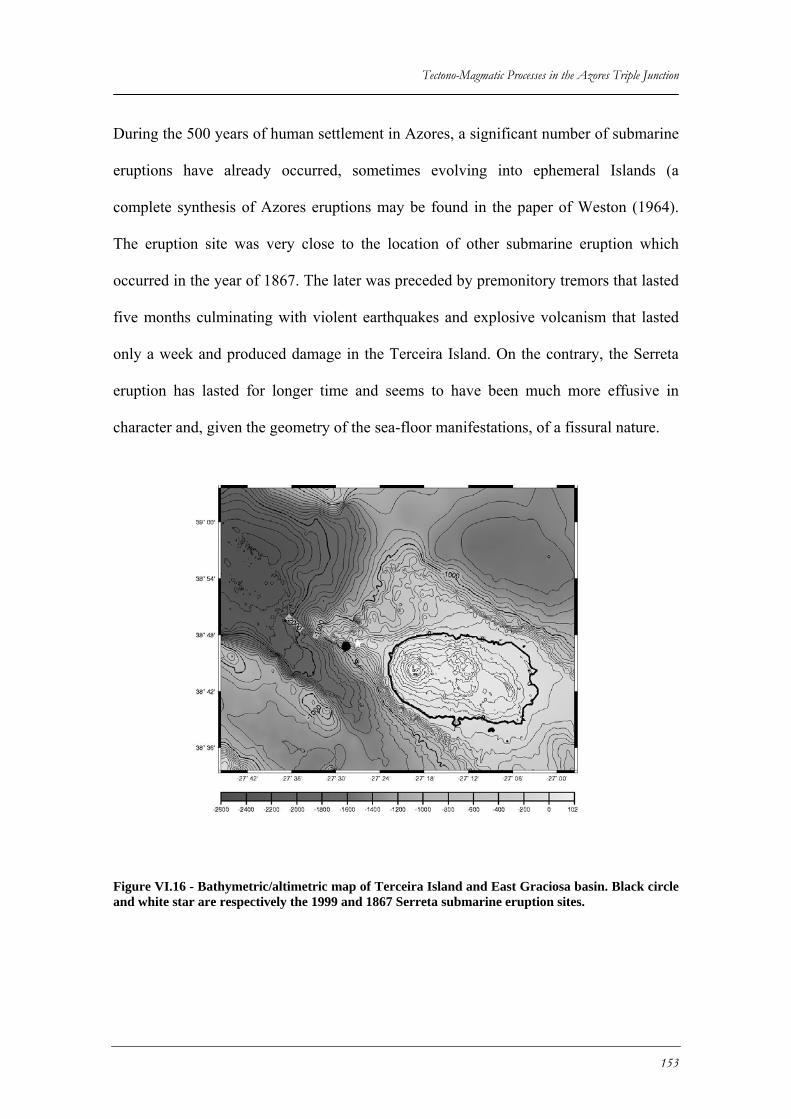
Tectono-Magmatic Processes in the Azores Triple Junction
During the 500 years of human settlement in Azores, a significant number of submarine
eruptions have already occurred, sometimes evolving into ephemeral Islands (a
complete synthesis of Azores eruptions may be found in the paper of Weston (1964).
The eruption site was very close to the location of other submarine eruption which
occurred in the year of 1867. The later was preceded by premonitory tremors that lasted
five months culminating with violent earthquakes and explosive volcanism that lasted
only a week and produced damage in the Terceira Island. On the contrary, the Serreta
eruption has lasted for longer time and seems to have been much more effusive in
character and, given the geometry of the sea-floor manifestations, of a fissural nature.
Figure VI.16 - Bathymetric/altimetric map of Terceira Island and East Graciosa basin. Black circle and white star are respectively the 1999 and 1867 Serreta submarine eruption sites.
153
Chapter VI - Tectonics on the Terceira Island and neighbouring basins Using sparse echo-soundings collected by the Portuguese Hidrographic Institute prior to
the onset of the eruption, and multi-beam data collected by the Knorr, after the eruption
main episodes, we are able to trace, at least qualitatively, the changes in the seafloor
topography (See Figure VI.18). The pre-eruption survey displays an ortogonal “bay”
like relief which interrupts the Serreta ridge crest. This bay is open southwards. The
most significant change in the topography at the eruption site, is visible in the post
eruption survey as that “embayment” is now closed into a square section depression and
the Serreta ridge becomes a continuous feature. Despite the different resolutions of the
surveys, profiles from both surveys, across this new feature, yield sufficient bathymetric
correlation on the sections off the eruption location to allow characterization of
bathymetry change. The profiles suggest that the eruption probably started a a depth of
around 450 m bsl and created a continuous relief about 120 m high, overall. The slope
of the southern flank probably became steeper as suggested by the profiles. The
orientation of the newly formed ridge does not match the reports of NE-SW but
observation suggest that some leakage from a NNE-SSW ridge east of it but in close
proximity might have occurred (Gaspar et al., 2003)
Figure VI.17 – Left) photograph of a “lava ballon” sample. Right) Photograph of a series of lava ballon at the sea surface during one of the Serreta eruption events (Source: http://www.volcano.si.edu, Photos by CVUA, Centro de Vulcanologia da Universidade dos Açores).
154
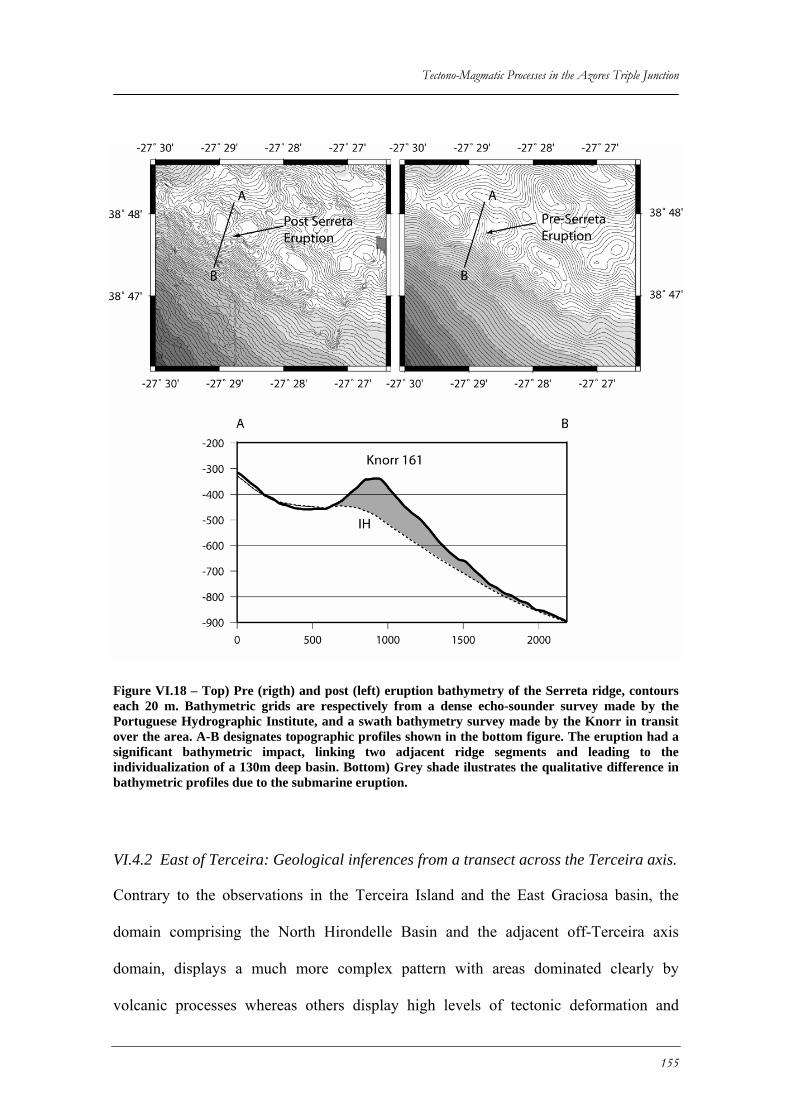
Tectono-Magmatic Processes in the Azores Triple Junction
Figure VI.18 – Top) Pre (rigth) and post (left) eruption bathymetry of the Serreta ridge, contours each 20 m. Bathymetric grids are respectively from a dense echo-sounder survey made by the Portuguese Hydrographic Institute, and a swath bathymetry survey made by the Knorr in transit over the area. A-B designates topographic profiles shown in the bottom figure. The eruption had a significant bathymetric impact, linking two adjacent ridge segments and leading to the individualization of a 130m deep basin. Bottom) Grey shade ilustrates the qualitative difference in bathymetric profiles due to the submarine eruption.
VI.4.2 East of Terceira: Geological inferences from a transect across the Terceira axis.
Contrary to the observations in the Terceira Island and the East Graciosa basin, the
domain comprising the North Hirondelle Basin and the adjacent off-Terceira axis
domain, displays a much more complex pattern with areas dominated clearly by
volcanic processes whereas others display high levels of tectonic deformation and
155
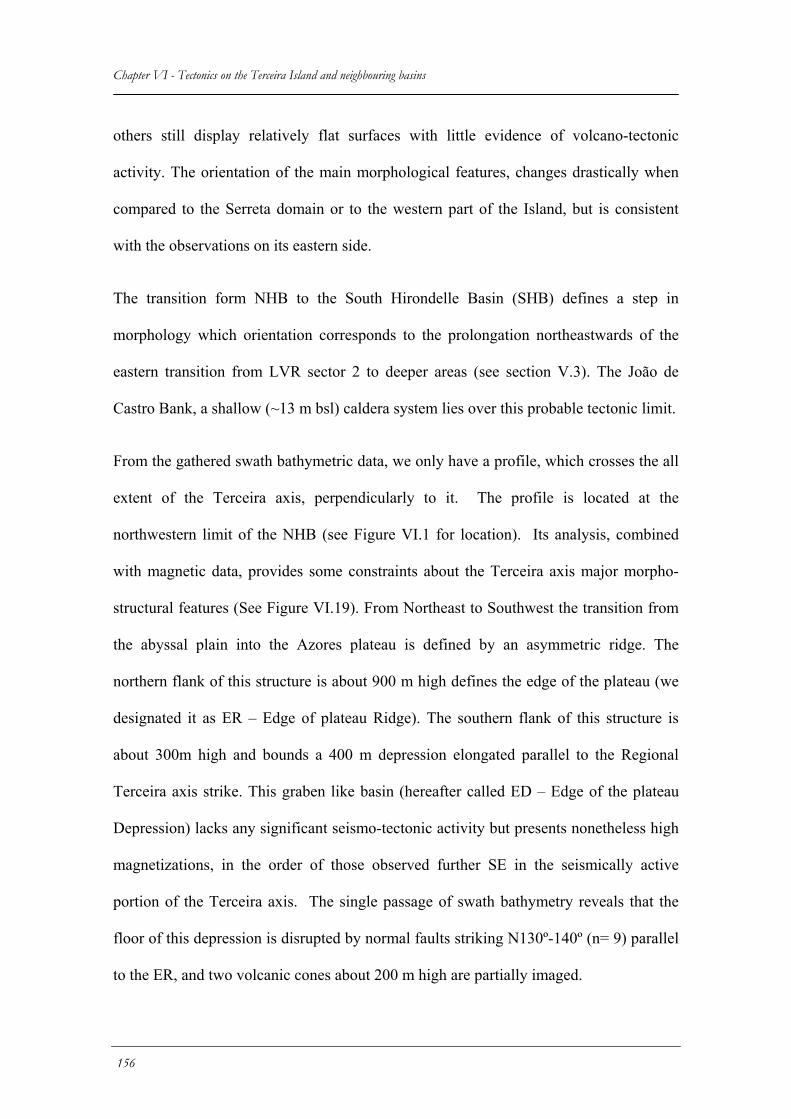
Chapter VI - Tectonics on the Terceira Island and neighbouring basins others still display relatively flat surfaces with little evidence of volcano-tectonic
activity. The orientation of the main morphological features, changes drastically when
compared to the Serreta domain or to the western part of the Island, but is consistent
with the observations on its eastern side.
The transition form NHB to the South Hirondelle Basin (SHB) defines a step in
morphology which orientation corresponds to the prolongation northeastwards of the
eastern transition from LVR sector 2 to deeper areas (see section V.3). The João de
Castro Bank, a shallow (~13 m bsl) caldera system lies over this probable tectonic limit.
From the gathered swath bathymetric data, we only have a profile, which crosses the all
extent of the Terceira axis, perpendicularly to it. The profile is located at the
northwestern limit of the NHB (see Figure VI.1 for location). Its analysis, combined
with magnetic data, provides some constraints about the Terceira axis major morpho-
structural features (See Figure VI.19). From Northeast to Southwest the transition from
the abyssal plain into the Azores plateau is defined by an asymmetric ridge. The
northern flank of this structure is about 900 m high defines the edge of the plateau (we
designated it as ER – Edge of plateau Ridge). The southern flank of this structure is
about 300m high and bounds a 400 m depression elongated parallel to the Regional
Terceira axis strike. This graben like basin (hereafter called ED – Edge of the plateau
Depression) lacks any significant seismo-tectonic activity but presents nonetheless high
magnetizations, in the order of those observed further SE in the seismically active
portion of the Terceira axis. The single passage of swath bathymetry reveals that the
floor of this depression is disrupted by normal faults striking N130º-140º (n= 9) parallel
to the ER, and two volcanic cones about 200 m high are partially imaged.
156
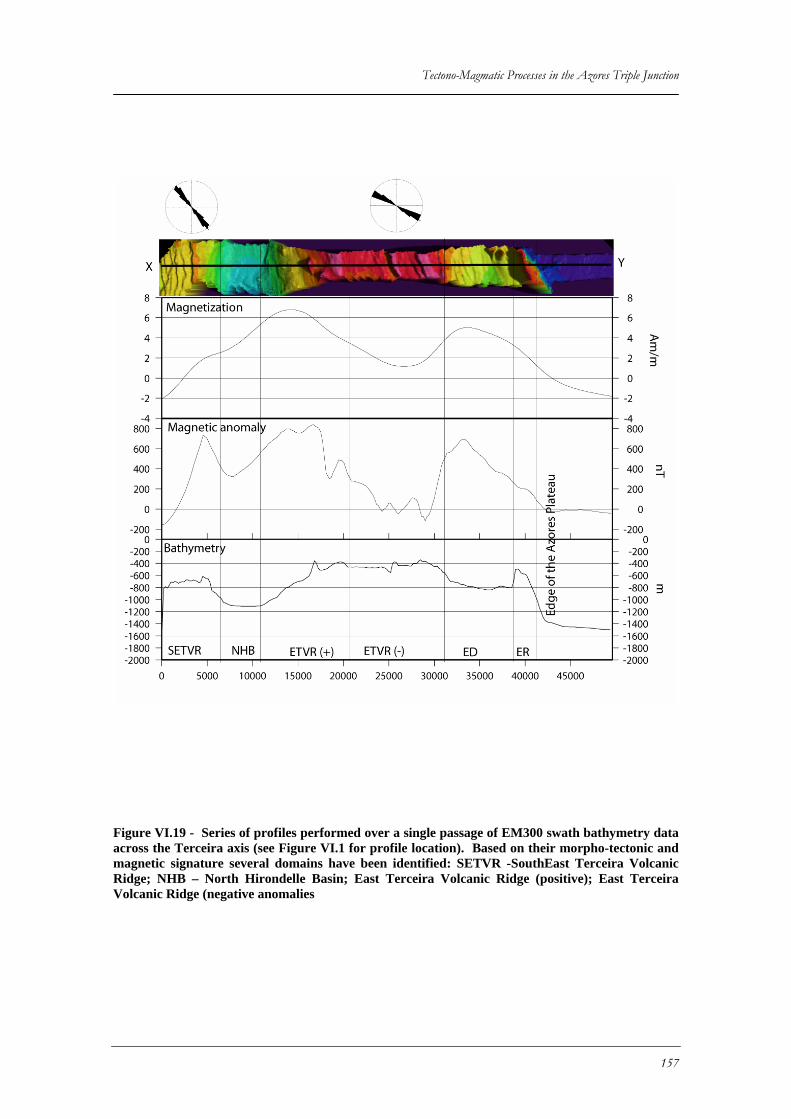
Tectono-Magmatic Processes in the Azores Triple Junction
Figure VI.19 - Series of profiles performed over a single passage of EM300 swath bathymetry data across the Terceira axis (see Figure VI.1 for profile location). Based on their morpho-tectonic and magnetic signature several domains have been identified: SETVR -SouthEast Terceira Volcanic Ridge; NHB – North Hirondelle Basin; East Terceira Volcanic Ridge (positive); East Terceira Volcanic Ridge (negative anomalies
157
Chapter VI - Tectonics on the Terceira Island and neighbouring basins The following topographical high, here referred to as the East Terceira Volcanic Ridge
Ridge (ETVR), shows two distinct areas based on the orientation of tectonic structures
and its magnetic character. The first of these areas tends to have negative or near zero
magnetizations and corresponds to a rough surface deepening towards East. Normal
fault scarps imaged by the single passage confined to this areas of low magnetization
have a distinctive orientation from the previous ones, as they strike between N110º and
N114º (n=4). Volcanic structures are absent. Further Southwest the ETVR becomes
strongly positive (locally in the profile it reaches ca 7 Am/m) and dominated by
volcanic processes. This is confirmed, as we shall see below, by the far NE portion of
the Sirena bathymetric map and the AZ99 TOBI mosaic, where in the prolongation of
this domain towards SE, numerous volcanic cones cover deeper portions of the NHB
(see Figure VI.2 for spatial reference).
The NHB, in this profile is bound between the ETVR and the Southeast Terceira
Volcanic Ridge (SETVR). In pratice, it prolongs towards the Terceira Island as a V-
shaped depression, where its apex, at around 300 m bsl, defines the geometrical
convergence between both marginal ridges.
VI.4.3 The SouthEast Terceira Ridge (SETVR)
The amount of data over this ridge, either from swath bathymetry from Sirena I cruise
(Lourenço et al., 2003) and the TOBI mosaic that was performed during the Azzore99
cruise (Ligi et al., 1999), makes one of the most documented submarine structures in the
Azores apart from the Islands themselves. For instance GLORIA images from Searle
(1980) see Figure VI.20, would only provide a hint on the high level of tectonic
deformation here present, and in terms of regional bathymetry, (as observable in Figure
VI.2) despite reproducing the overall shape of the ridge, it does not provide any
158
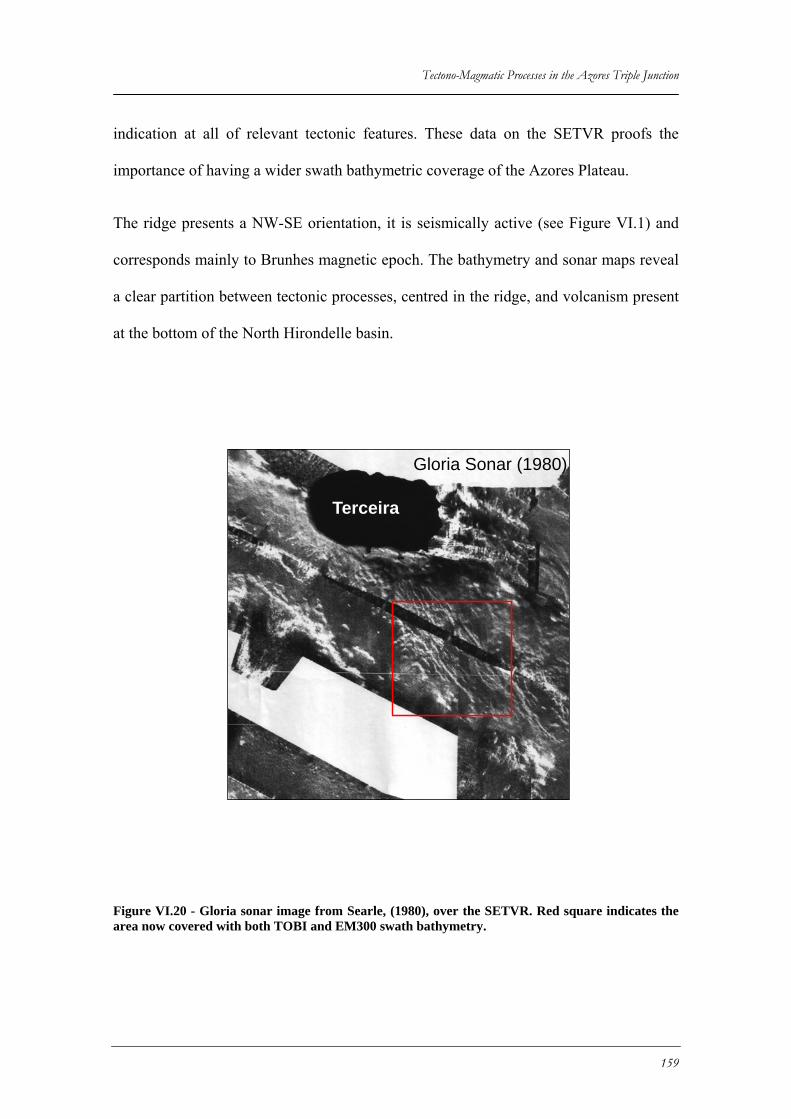
Tectono-Magmatic Processes in the Azores Triple Junction
indication at all of relevant tectonic features. These data on the SETVR proofs the
importance of having a wider swath bathymetric coverage of the Azores Plateau.
The ridge presents a NW-SE orientation, it is seismically active (see Figure VI.1) and
corresponds mainly to Brunhes magnetic epoch. The bathymetry and sonar maps reveal
a clear partition between tectonic processes, centred in the ridge, and volcanism present
at the bottom of the North Hirondelle basin.
Terceira
Gloria Sonar (1980)
Figure VI.20 - Gloria sonar image from Searle, (1980), over the SETVR. Red square indicates the area now covered with both TOBI and EM300 swath bathymetry.
159
Chapter VI - Tectonics on the Terceira Island and neighbouring basins The acoustic facies interpretation from TOBI is presented in Figure VI.21. We have
defined essentially 5 different acoustic facies: Clusters of bright linear, or otherwise
linear acoustic shadows (for faults facing away from sonar ensonification direction), are
classified as tectonic terrain, polygons of faults identified within this domain were
digitized. High to medium backscattering surfaces, with irregular textures sometimes
forming hummocks or with identifiable conic or with basal circular sections have been
classified as volcanic terrain. If a significant number of faults were present disrupting
bright backscaterring surfaces, these domains were classified as tectonised volcanic
terrain. Sediment terrain corresponds to areas of homogeneous low backscatter. Finally,
making additional use of swath bathymetry to help interpretation process and define
more sharply the base of the ridge, areas of talus deposits and mass wasting deposits
were mapped. In the first case, outlined by narrow bands, at the base of fault scarps,
with variable degrees of backscatter, characteristic of talus deposits. Corrugations in
sediment facies in the dowdip direction and flanking fan like shapes in plan view,
typical of slump deposits (Figure VI.22-3) were indistinctly classified as mass wasting
deposits.
The SETVR axis is a broad high backscatter surface of volcanic nature, given its high
amplitude magnetic anomaly. All the areal extent of the ridge is disrupted by a strand of
sub-parallel but highly anastomosed normal faults striking between N130º and N150º.
At 27ºW, 38º25N, in the SW ridge axial flank, a distinct rhombic shape topographic low
is present, defined by a continuous low backscattering sedimented surface which
correlates with a negative magnetic anomaly. This low is fault controlled in its Southern
and Northern limits. Its Eastern and Western flanks, correspond to sharp N-S contacts
160
Tectono-Magmatic Processes in the Azores Triple Junction
between low and high backscaterring surfaces, which are cut through, by faults
belonging the same dominant fault system in the SETVR.
The top of the SETVR consists on an arched demi-.horst, and it is interpretable either as
volcanic structure remnant (caldera system?), existing prior to onset of the tectonic
stage in the ridge or otherwise a giant scar from the gravitational collapse of the
northeastern flank. Both ridge flanks display gullies and mass wasting fans at the base
of the slope (Figure VI.22-3). The ridge vicinities are almost exclusively composed of a
grayish homogeneous acoustic facies interpreted as pelagic and volcanic sediment. The
numerous untectonized volcanic cones, present to NE, in the northern flank of the North
Hirondelle basin (see Figures VI.19 and VI.22-1), form alignments sub-parallel to the
ridge main strike and contrast with the densly fractured pattern observable in the
SETVR. The high magnetization values observed in the areas covered by this volcanic
constructs suggests that this is the current neo-volcanic axis in this domain. Limited
data, limits our ability to constrain its areal extent along the plate boundary.
Faulting geometries their inter-relationships and fault orientations, in the SETVR,
provide clues concerning their kinematic behaviour. Some faults present horse-tail
terminations. Fault splays often link to neighbour faults defining extensional duplexes
(Figure VI.22-2), relay ramps and fault wedge basins and highs of roughly rhombic
shape (see Figure VI.22-4). These faulting patterns observed in the SETVR are
conformal with right lateral oblique extension component. Typical wrench structures
like strike slip pull-apart basins are not observed in this domain.
161
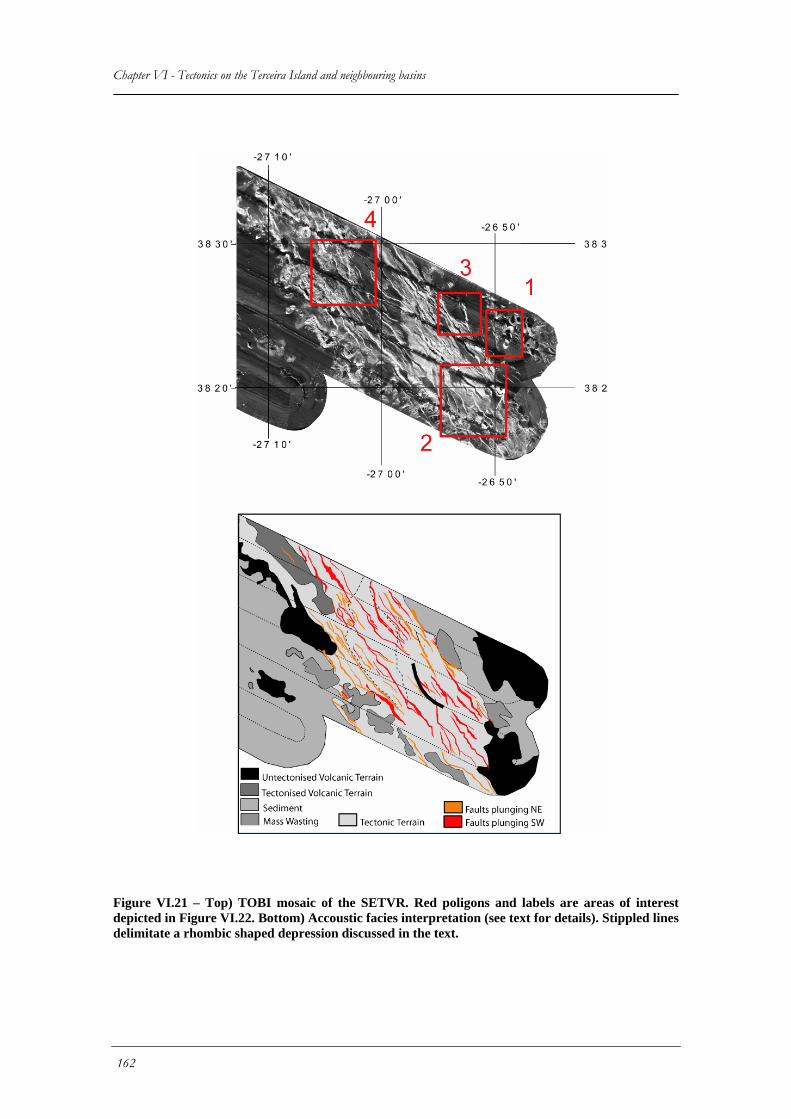
Chapter VI - Tectonics on the Terceira Island and neighbouring basins
Figure VI.21 – Top) TOBI mosaic of the SETVR. Red poligons and labels are areas of interest depicted in Figure VI.22. Bottom) Accoustic facies interpretation (see text for details). Stippled lines delimitate a rhombic shaped depression discussed in the text.
162
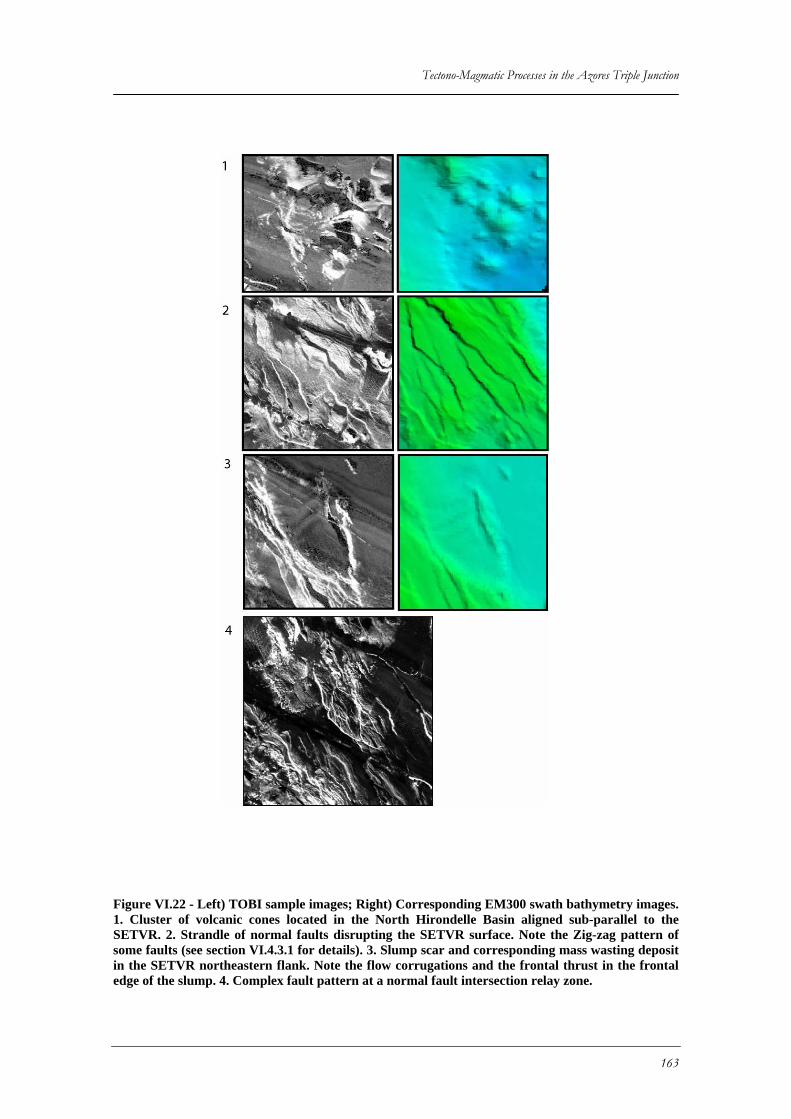
Tectono-Magmatic Processes in the Azores Triple Junction
Figure VI.22 - Left) TOBI sample images; Right) Corresponding EM300 swath bathymetry images. 1. Cluster of volcanic cones located in the North Hirondelle Basin aligned sub-parallel to the SETVR. 2. Strandle of normal faults disrupting the SETVR surface. Note the Zig-zag pattern of some faults (see section VI.4.3.1 for details). 3. Slump scar and corresponding mass wasting deposit in the SETVR northeastern flank. Note the flow corrugations and the frontal thrust in the frontal edge of the slump. 4. Complex fault pattern at a normal fault intersection relay zone.
163
Chapter VI - Tectonics on the Terceira Island and neighbouring basins
VI.5 Discussion and conclusions
In this chapter we have addressed the tectonic pattern, and the partition between
volcanic and tectonic processes in the Terceira axis, between the East Graciosa Basin
and the North Hirondelle Basin.
The distribution of tectonic and volcanic processes varies significantly across the
studied sector of the Terceira axis. In Figure VI.23 we present a tectonic model that
summarizes our main observations. West of Terceira, volcanic accretion seems confined
to the Serreta ridge, expressing as fault controlled fissural volcanism. The East graciosa
basin floor is barren in volcanism and clear cut tectonic structures, nevertheless a left
lateral strike slip N150º faulting direction is bound to play a significant role in the plate
boundary strain accomodation. Linkage of bathymetric observations with inland data is
straight forward for the Serreta ridge as the submarine prolongation of the fissural
system inland, clearly expressed between the Guilherme Moniz and St. Barbara
calderas.
The Island of Terceira displays a complex tectonic pattern where four tectonic
directions were recognaized often controlling volcanic cone morphology, dikes, lava
flows paths and possibly same sections of the coast line. These are according to strike:
1) WNW-ESE. Corresponding to the fissural system in the Island west of Guilherme
Moniz Caldera. Possibly corresponding to tension fractures with some minor rigth
lateral displacement provided by the en-echelon arrangement of individual cones
elongation axis.
164
Tectono-Magmatic Processes in the Azores Triple Junction
2) N-S. Expressed by the East Angra faults; interpreted as possible reactivation of MAR
generated fabric. This system ruptured as left lateral Strike slips in the 1980 Terceira
earhquake.
3) NNW-SSE. Expressed by the Lages Graben and the Cinco Picos Caldera fissural
system. Co-existance of vertical and 60º dipping fault planes belonging to this fault
family suggest that some strain partitioning should exist associated with it.
4) ENE-WSW lineation family. These devide the Island in two halfs with distinct
morphologies. Volcano-tectonic orientations also denote the clear change in orientation
of the fissural system between the Island western and eastern halfs. Furthermore as
discussed in Chapter V, this fabric seems to have a regional significance related as a
relay zone parallel to the opening direction between AF (Nub) and Eurasia as
constrained by NUVEL1A kinematic model.
The seafloor structure East of Terceira displays a higher magnetic and morpho-
strucutural complexity than the submarine domain west of it. The linkage of submarine
observations with the East of the Island is less clear mainly because of data availability
limitations.
The Lages Graben follows the same strike as the SETVR pervasive faulting. In SETVR,
the faulting pattern seems dominanted by right lateral oblique extension. Faulting on the
ETVR follows a strike close to the Island fissural system. The observed active
submarine fissural volcanism is concentrated in a region parallel to the SETVR but
lying deeper and between this two ridge systems. Furthermore consistent high
magnetization values and lack of tectonization leeds us to the conclusion that this
fissural volcanism materializes the neo-volcanic zone in the submarine domain east of
165
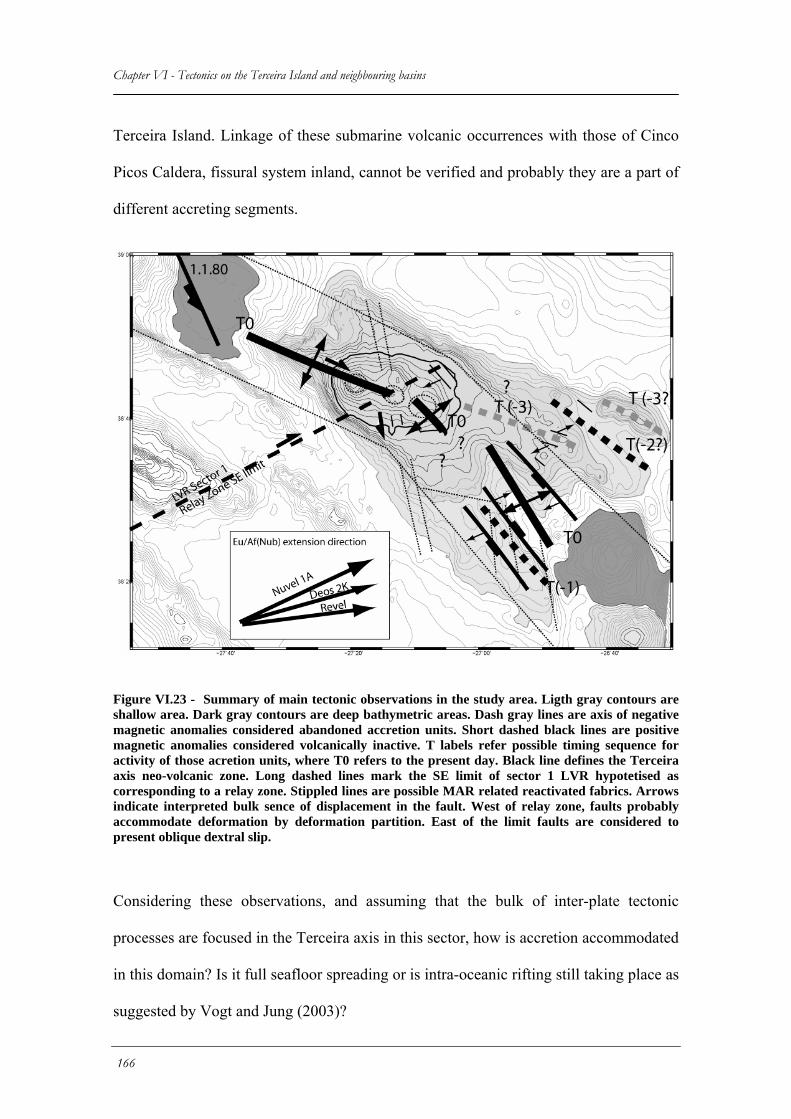
Chapter VI - Tectonics on the Terceira Island and neighbouring basins Terceira Island. Linkage of these submarine volcanic occurrences with those of Cinco
Picos Caldera, fissural system inland, cannot be verified and probably they are a part of
different accreting segments.
Figure VI.23 - Summary of main tectonic observations in the study area. Ligth gray contours are shallow area. Dark gray contours are deep bathymetric areas. Dash gray lines are axis of negative magnetic anomalies considered abandoned accretion units. Short dashed black lines are positive magnetic anomalies considered volcanically inactive. T labels refer possible timing sequence for activity of those acretion units, where T0 refers to the present day. Black line defines the Terceira axis neo-volcanic zone. Long dashed lines mark the SE limit of sector 1 LVR hypotetised as corresponding to a relay zone. Stippled lines are possible MAR related reactivated fabrics. Arrows indicate interpreted bulk sence of displacement in the fault. West of relay zone, faults probably accommodate deformation by deformation partition. East of the limit faults are considered to present oblique dextral slip.
Considering these observations, and assuming that the bulk of inter-plate tectonic
processes are focused in the Terceira axis in this sector, how is accretion accommodated
in this domain? Is it full seafloor spreading or is intra-oceanic rifting still taking place as
suggested by Vogt and Jung (2003)?
166
Tectono-Magmatic Processes in the Azores Triple Junction
Existance, both in the Island and in the SETVR of N-S striking fault segments and the
point source style of volcanism which resulted in the construction of the Island,
probably at the intersection of tectonic structures (Self, 1976; Lourenço et al., 1998)
leads us to the conclusion that Terceira axis “basement” can be in fact tectonically
subsided MAR generated seafloor due to rifting of lithosphere resultant from EU-NU
plate boundary processes without effective seafloor spreading. We envisage, therefore
that the extremely slow nature of extension within the Terceira axis, has resulted in
vertical stacking of volcanic products along main active tectonic trends. The Brunhes
and Matuyama magnetic anomalies, documented within the Terceira axis would
represent the last volcanic expression within that system. In this case, the spatial
arrangement of magnetic anomalies within the Terceira axis, and the main orientation of
the principal volcano-tectonic features, can provide some clues on the sucession of
magmatic and tectonic accretion events and their spatial distribution across this plate
boundary.
Searle (1980) stated that it was unclear form the studied GLORIA images, if the plate
boundary corresponded to the topographical highs or lows. Considering the strike of
faults imaged on the ETVR subparallel to the Western Terceira Island fissural system
strike and its overall orientation, we consider that this must have been initially a single
accreting segment and the older one (See also section II.2.6), probably corresponding to
reactivation of a MAR transform (axis at T-3 time in Figure VI.23). Magmatic activity
essentially ceased in Matuyama age. The ER follows the same strike of the ETVR and
presents a similar magnetic anomaly character suggesting that it has been active during
the same T-3 period.The timing for ED generation is also unclear. Probably it was
formed in a recent time (axis at T-2 time?) and active volcanism and minor earthquake
167
Chapter VI - Tectonics on the Terceira Island and neighbouring basins activity suggest that is still an active feature, despite never having evolved fully to a an
acretion axis. Activity then jumped into the SETVR resulting in the construction of this
ridge by volcanic processes (at T-1 time). Subsquently as extension proceeded volcanic
processes get focalized in the southeastern edge of the ETVR, materialising the present
day acretion axis (T0 axis). All the across axis domain, notably the SETVR and ETVR,
undergo mainly concomintant oblique extension.
We interpret these clokwise jumps in accretion axis as the result of two conjugate
factors:
1) Variations in the thickness of the lithosphere brittle layer. As magmatic processes
proceed, progressive topography build up and therefore increase in load as well as
crustal thickness, could lead to a re-organization of the magmatic plumbing system and
reactivation of subparallel pre-existing structures but in a thinner and weaker brittle
layer, therefore more favourable to rupture as volcanic conduits
2) The prevailing kinematic conditions through time. As referred in Chapter IV, the
extension at this plate boundary has progressively rotated from NE-SW to more E-W
directions (as constrained respectively by Nuvel-1A and by GPS models). This
modification of kinematic constraints could have resulted in changement of the tectonic
regime from right lateral transtension dominated by wrenching, still prevailing in the
studied western domain to oblique right lateral extension in this eastern domain. In the
latter with consequent reactivation of NW-SE left lateral faulting directions as oblique
normal faults. We suggest that the Terceira axis neovolcanic axis, at least in this sector,
is re-organizing and fitting the current kinematic conditions.
168
Tectono-Magmatic Processes in the Azores Triple Junction
Chapter VII - Geodynamic inferences of 1957-58 Capelinhos Eruption (Faial)
VII.1 Introduction
Geodetic monuments were installed for the first time on Faial Island in 1937. Fifty years
later they were reoccupied with triangulation and trilateration and, just before the 9 July
1998 earthquake, they were once again observed, now with GPS instruments. In spite of
the significant volcanic and seismic events during this period, a quantitative assessment
of the Island’s deformation has never been attempted. In this section, we summarise the
results of re-processing of geodetic data covering a time span of 60 years, to assess the
long-term deformation pattern of the Island recently presented as a form of a paper
(Catalão et al., 2006). We show that displacements are large over the western part of
Faial Island, and mainly limited to the 1937-1967 period; in the eastern part of Faial
Island the displacement field is below the accuracy threshold of conventional geodetic
techniques for the whole time span. Most of the Island deformation, as we shall discuss
below, probably was accommodated in a single event, corresponding to the 1957
Capelinhos eruption and subsequent earthquake activity. This unique data allows
constraining the dynamics of active volcanic processes and how they contribute to inter-
plate deformation at the Azores. Its generalization also provides clues on modes of
growth of the LVR at least for sector 1.
169
Chapter VII - Geodynamic inferences of 1957-58 Capelinhos Eruption (Faial)
VII.2 The eruption and associated earthquake activity
Since the arrival of the first settlers, in the early XV century, several aerial eruptions
have been reported in most of the Islands. Faial Island in particular was the site of a few
historical eruptions; the last one and the best described is the Capelinhos eruption. This
eruption started on the 27th of September 1957, 1 km offshore the western tip of Faial
Island. During about 1 month (until 30 October) intensive explosive activity was
observed, with uninterrupted emission of bombs and scoria. A small Island was formed,
built up with tephra and basaltic lapilli reaching 600 m in diameter on the base and a
height of 80 m above sea level. On the 30th October the explosive volcanic activity
ceased and the Island collapsed. Subsequent activity led to the construction of an ash
arc, which reached 150 m height in 1958. Contact between the active chimney and
seawater was responsible for the high explosive character of the eruption in the first 7
months of the eruption. There is a large photographic survey and many written
information concerning this eruption (Castello-Branco et al., 1959, Machado, 1958a,
1958b, 1959a, 1959b, Machado et al., 1959, Machado et al., 1962, Zbyszewski et al.,
1959).
On May 13th, 1958, there was a readjustment of the volcanic edifice inducing a seismic
crisis with more than 450 events recorded. In some places macroseismic intensity
reached X, in the Modified Mercalli scale (Machado, 1959a). Three source areas were
identified: one immediately southwest of the central caldera, other northwest, at half
distance between the caldera and the active crater. The focal depth was estimated by
Machado (1959a) to be approximately 1 km. A series of fractures was observed with
subsidence parallel to the N105 cinder cones alignment and uplift along sea cliffs. A
long narrow belt parallel and along the north side of the cinder cones was depressed
170
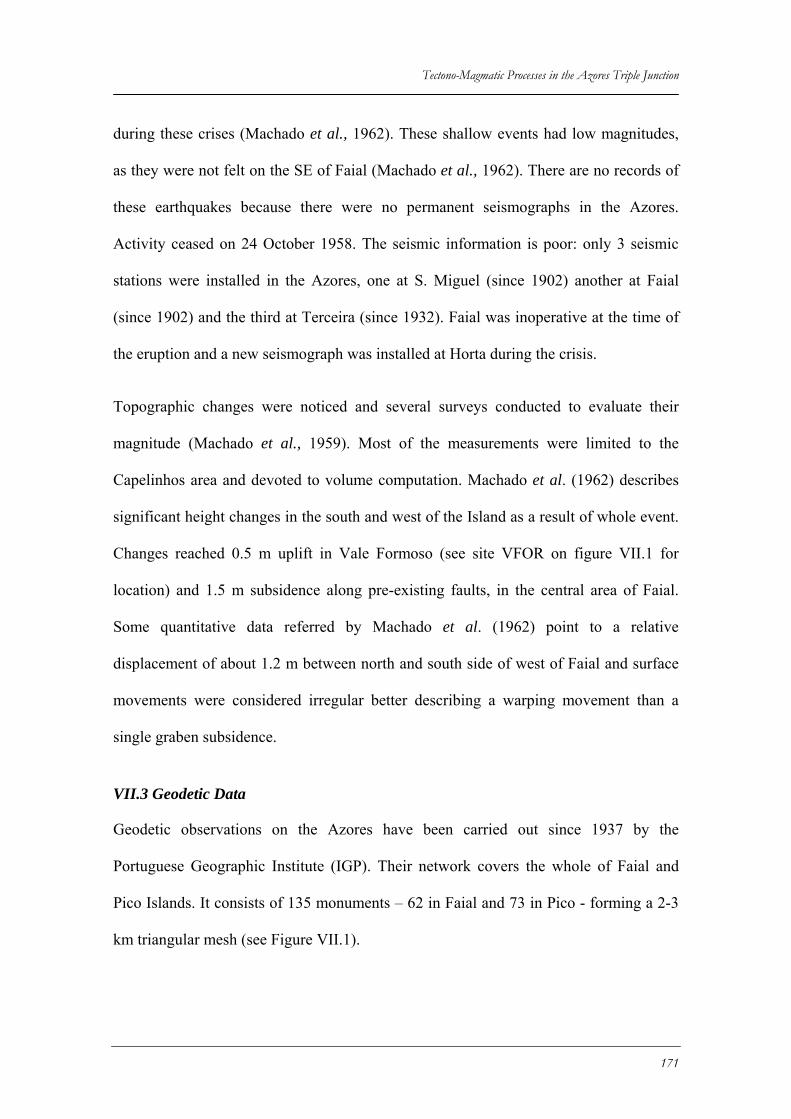
Tectono-Magmatic Processes in the Azores Triple Junction
during these crises (Machado et al., 1962). These shallow events had low magnitudes,
as they were not felt on the SE of Faial (Machado et al., 1962). There are no records of
these earthquakes because there were no permanent seismographs in the Azores.
Activity ceased on 24 October 1958. The seismic information is poor: only 3 seismic
stations were installed in the Azores, one at S. Miguel (since 1902) another at Faial
(since 1902) and the third at Terceira (since 1932). Faial was inoperative at the time of
the eruption and a new seismograph was installed at Horta during the crisis.
Topographic changes were noticed and several surveys conducted to evaluate their
magnitude (Machado et al., 1959). Most of the measurements were limited to the
Capelinhos area and devoted to volume computation. Machado et al. (1962) describes
significant height changes in the south and west of the Island as a result of whole event.
Changes reached 0.5 m uplift in Vale Formoso (see site VFOR on figure VII.1 for
location) and 1.5 m subsidence along pre-existing faults, in the central area of Faial.
Some quantitative data referred by Machado et al. (1962) point to a relative
displacement of about 1.2 m between north and south side of west of Faial and surface
movements were considered irregular better describing a warping movement than a
single graben subsidence.
VII.3 Geodetic Data
Geodetic observations on the Azores have been carried out since 1937 by the
Portuguese Geographic Institute (IGP). Their network covers the whole of Faial and
Pico Islands. It consists of 135 monuments – 62 in Faial and 73 in Pico - forming a 2-3
km triangular mesh (see Figure VII.1).
171
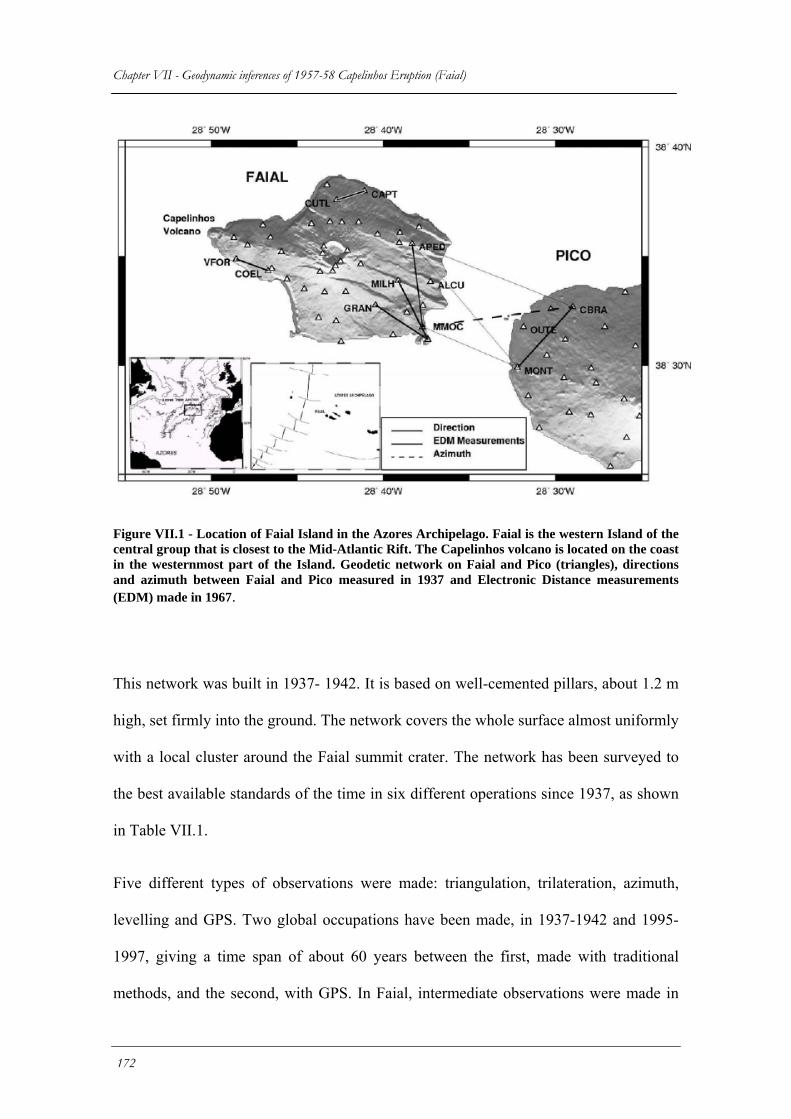
Chapter VII - Geodynamic inferences of 1957-58 Capelinhos Eruption (Faial)
172
Figure VII.1 - Location of Faial Island in the Azores Archipelago. Faial is the western Island of the central group that is closest to the Mid-Atlantic Rift. The Capelinhos volcano is located on the coast in the westernmost part of the Island. Geodetic network on Faial and Pico (triangles), directions and azimuth between Faial and Pico measured in 1937 and Electronic Distance measurements (EDM) made in 1967.
This network was built in 1937- 1942. It is based on well-cemented pillars, about 1.2 m
high, set firmly into the ground. The network covers the whole surface almost uniformly
with a local cluster around the Faial summit crater. The network has been surveyed to
the best available standards of the time in six different operations since 1937, as shown
in Table VII.1.
Five different types of observations were made: triangulation, trilateration, azimuth,
levelling and GPS. Two global occupations have been made, in 1937-1942 and 1995-
1997, giving a time span of about 60 years between the first, made with traditional
methods, and the second, with GPS. In Faial, intermediate observations were made in
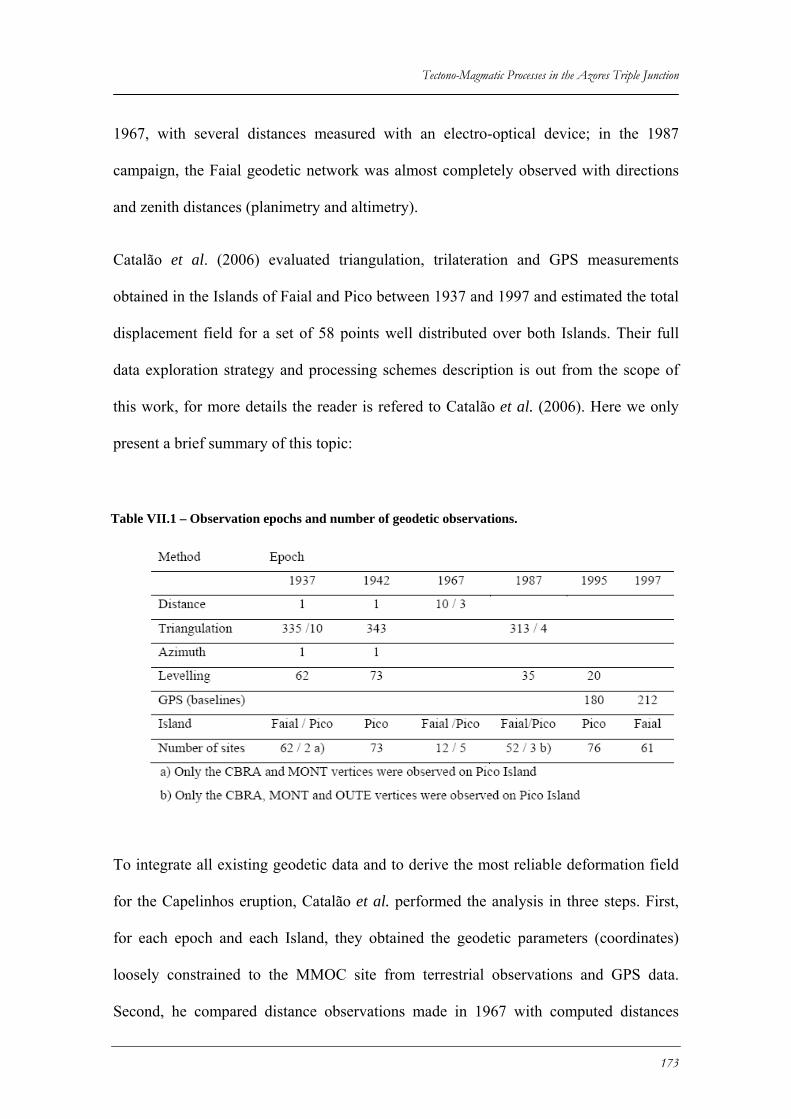
Tectono-Magmatic Processes in the Azores Triple Junction
1967, with several distances measured with an electro-optical device; in the 1987
campaign, the Faial geodetic network was almost completely observed with directions
and zenith distances (planimetry and altimetry).
Catalão et al. (2006) evaluated triangulation, trilateration and GPS measurements
obtained in the Islands of Faial and Pico between 1937 and 1997 and estimated the total
displacement field for a set of 58 points well distributed over both Islands. Their full
data exploration strategy and processing schemes description is out from the scope of
this work, for more details the reader is refered to Catalão et al. (2006). Here we only
present a brief summary of this topic:
Table VII.1 – Observation epochs and number of geodetic observations.
To integrate all existing geodetic data and to derive the most reliable deformation field
for the Capelinhos eruption, Catalão et al. performed the analysis in three steps. First,
for each epoch and each Island, they obtained the geodetic parameters (coordinates)
loosely constrained to the MMOC site from terrestrial observations and GPS data.
Second, he compared distance observations made in 1967 with computed distances
173
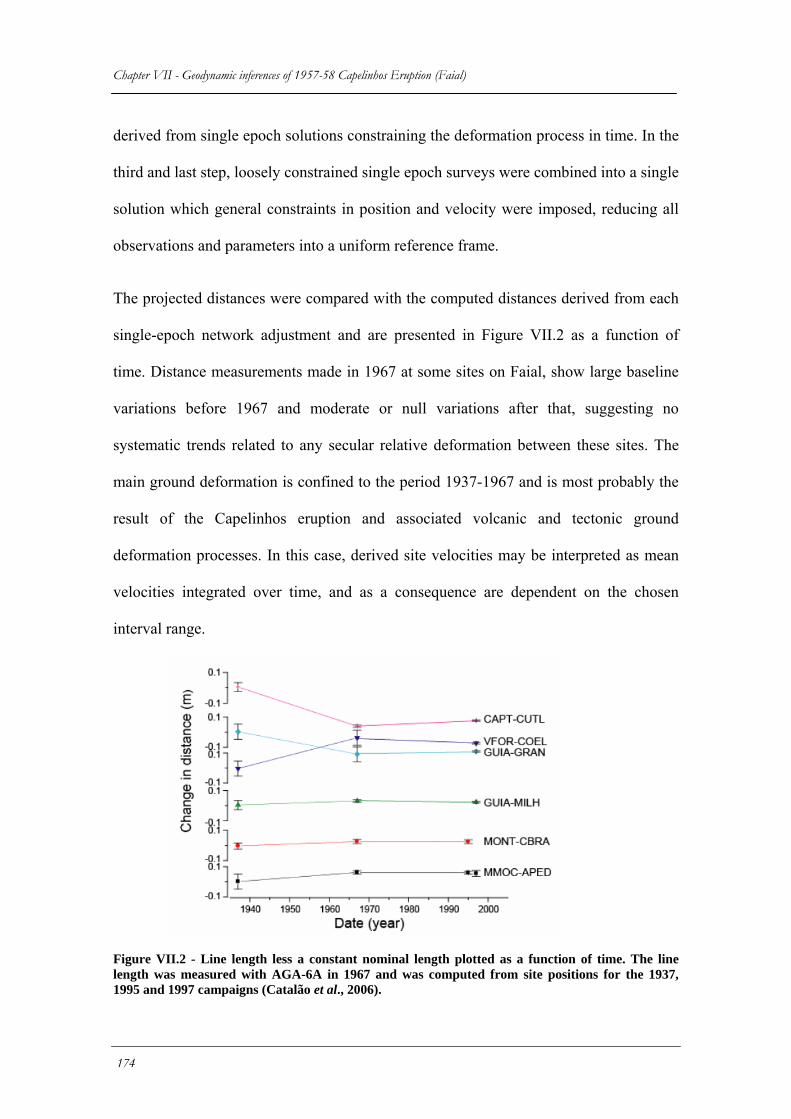
Chapter VII - Geodynamic inferences of 1957-58 Capelinhos Eruption (Faial) derived from single epoch solutions constraining the deformation process in time. In the
third and last step, loosely constrained single epoch surveys were combined into a single
solution which general constraints in position and velocity were imposed, reducing all
observations and parameters into a uniform reference frame.
The projected distances were compared with the computed distances derived from each
single-epoch network adjustment and are presented in Figure VII.2 as a function of
time. Distance measurements made in 1967 at some sites on Faial, show large baseline
variations before 1967 and moderate or null variations after that, suggesting no
systematic trends related to any secular relative deformation between these sites. The
main ground deformation is confined to the period 1937-1967 and is most probably the
result of the Capelinhos eruption and associated volcanic and tectonic ground
deformation processes. In this case, derived site velocities may be interpreted as mean
velocities integrated over time, and as a consequence are dependent on the chosen
interval range.
Figure VII.2 - Line length less a constant nominal length plotted as a function of time. The line length was measured with AGA-6A in 1967 and was computed from site positions for the 1937, 1995 and 1997 campaigns (Catalão et al., 2006).
174
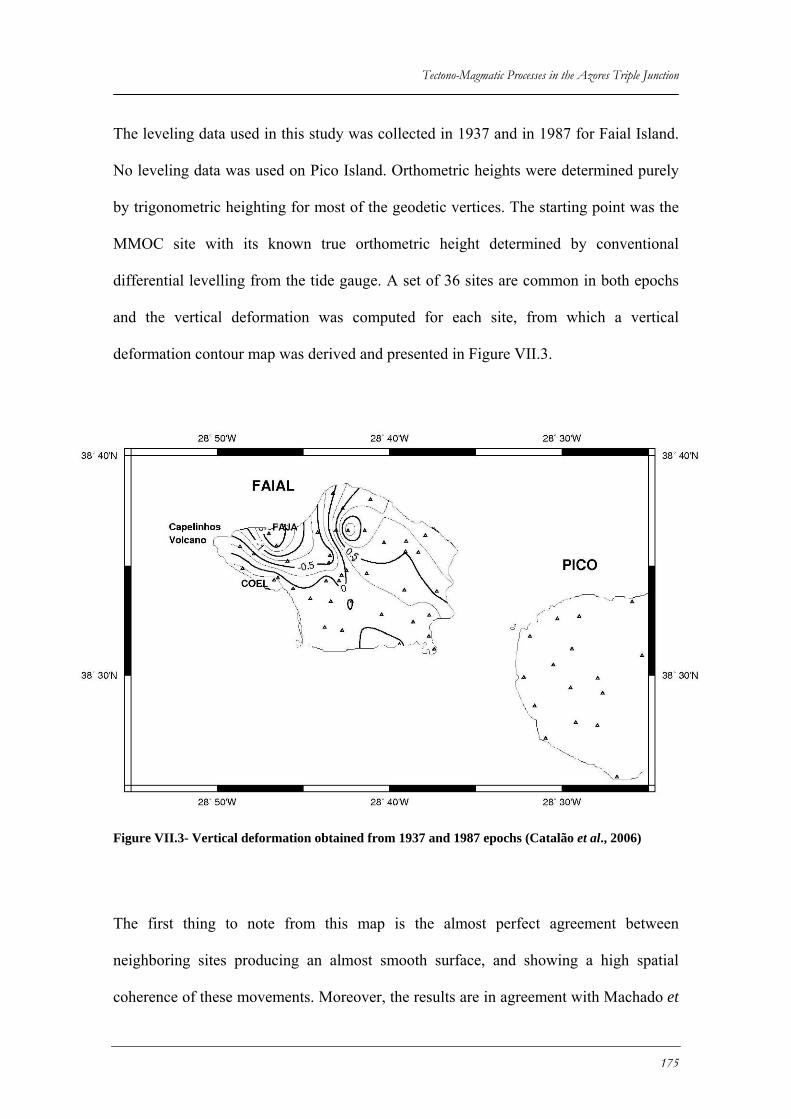
Tectono-Magmatic Processes in the Azores Triple Junction
The leveling data used in this study was collected in 1937 and in 1987 for Faial Island.
No leveling data was used on Pico Island. Orthometric heights were determined purely
by trigonometric heighting for most of the geodetic vertices. The starting point was the
MMOC site with its known true orthometric height determined by conventional
differential levelling from the tide gauge. A set of 36 sites are common in both epochs
and the vertical deformation was computed for each site, from which a vertical
deformation contour map was derived and presented in Figure VII.3.
Figure VII.3- Vertical deformation obtained from 1937 and 1987 epochs (Catalão et al., 2006)
The first thing to note from this map is the almost perfect agreement between
neighboring sites producing an almost smooth surface, and showing a high spatial
coherence of these movements. Moreover, the results are in agreement with Machado et
175
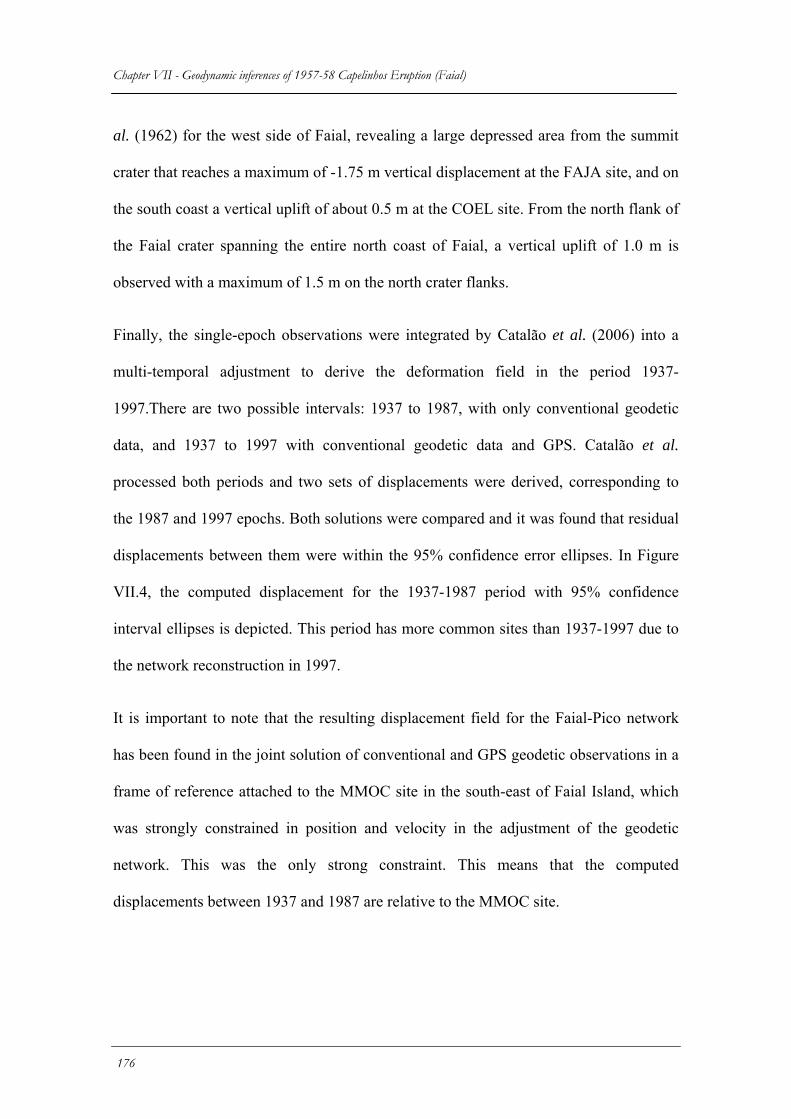
Chapter VII - Geodynamic inferences of 1957-58 Capelinhos Eruption (Faial) al. (1962) for the west side of Faial, revealing a large depressed area from the summit
crater that reaches a maximum of -1.75 m vertical displacement at the FAJA site, and on
the south coast a vertical uplift of about 0.5 m at the COEL site. From the north flank of
the Faial crater spanning the entire north coast of Faial, a vertical uplift of 1.0 m is
observed with a maximum of 1.5 m on the north crater flanks.
Finally, the single-epoch observations were integrated by Catalão et al. (2006) into a
multi-temporal adjustment to derive the deformation field in the period 1937-
1997.There are two possible intervals: 1937 to 1987, with only conventional geodetic
data, and 1937 to 1997 with conventional geodetic data and GPS. Catalão et al.
processed both periods and two sets of displacements were derived, corresponding to
the 1987 and 1997 epochs. Both solutions were compared and it was found that residual
displacements between them were within the 95% confidence error ellipses. In Figure
VII.4, the computed displacement for the 1937-1987 period with 95% confidence
interval ellipses is depicted. This period has more common sites than 1937-1997 due to
the network reconstruction in 1997.
It is important to note that the resulting displacement field for the Faial-Pico network
has been found in the joint solution of conventional and GPS geodetic observations in a
frame of reference attached to the MMOC site in the south-east of Faial Island, which
was strongly constrained in position and velocity in the adjustment of the geodetic
network. This was the only strong constraint. This means that the computed
displacements between 1937 and 1987 are relative to the MMOC site.
176
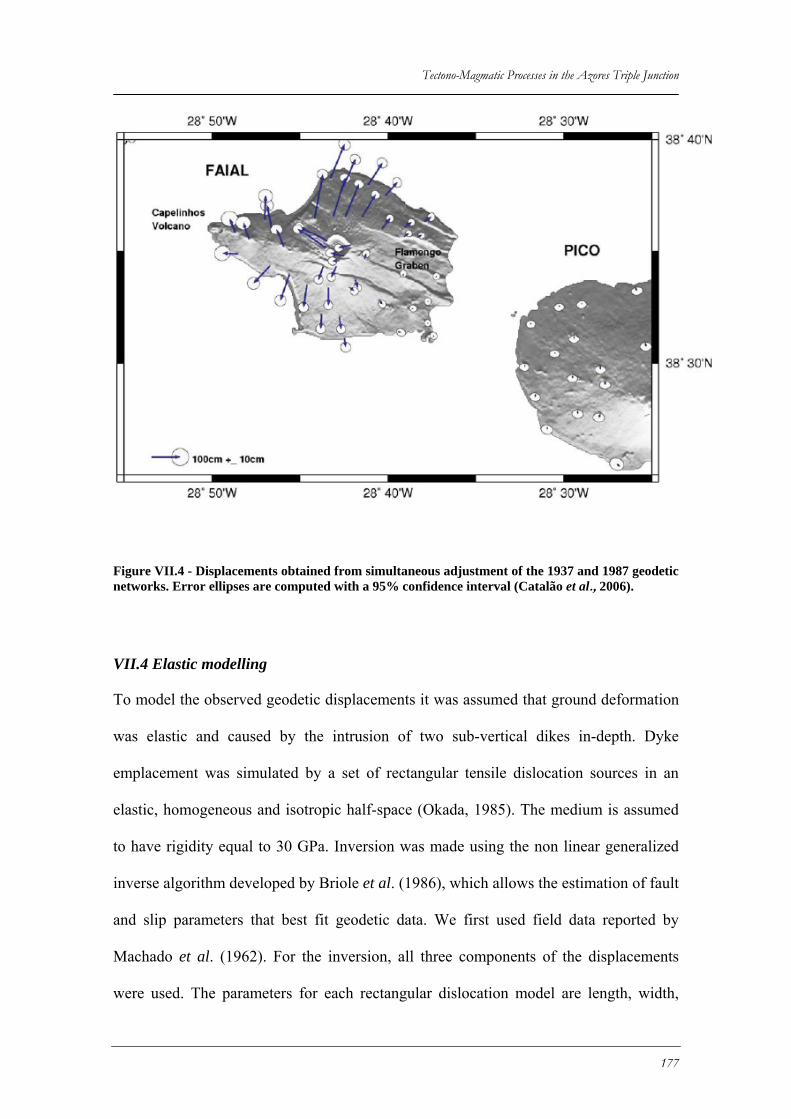
Tectono-Magmatic Processes in the Azores Triple Junction
177
Figure VII.4 - Displacements obtained from simultaneous adjustment of the 1937 and 1987 geodetic networks. Error ellipses are computed with a 95% confidence interval (Catalão et al., 2006).
VII.4 Elastic modelling
To model the observed geodetic displacements it was assumed that ground deformation
was elastic and caused by the intrusion of two sub-vertical dikes in-depth. Dyke
emplacement was simulated by a set of rectangular tensile dislocation sources in an
elastic, homogeneous and isotropic half-space (Okada, 1985). The medium is assumed
to have rigidity equal to 30 GPa. Inversion was made using the non linear generalized
inverse algorithm developed by Briole et al. (1986), which allows the estimation of fault
and slip parameters that best fit geodetic data. We first used field data reported by
Machado et al. (1962). For the inversion, all three components of the displacements
were used. The parameters for each rectangular dislocation model are length, width,
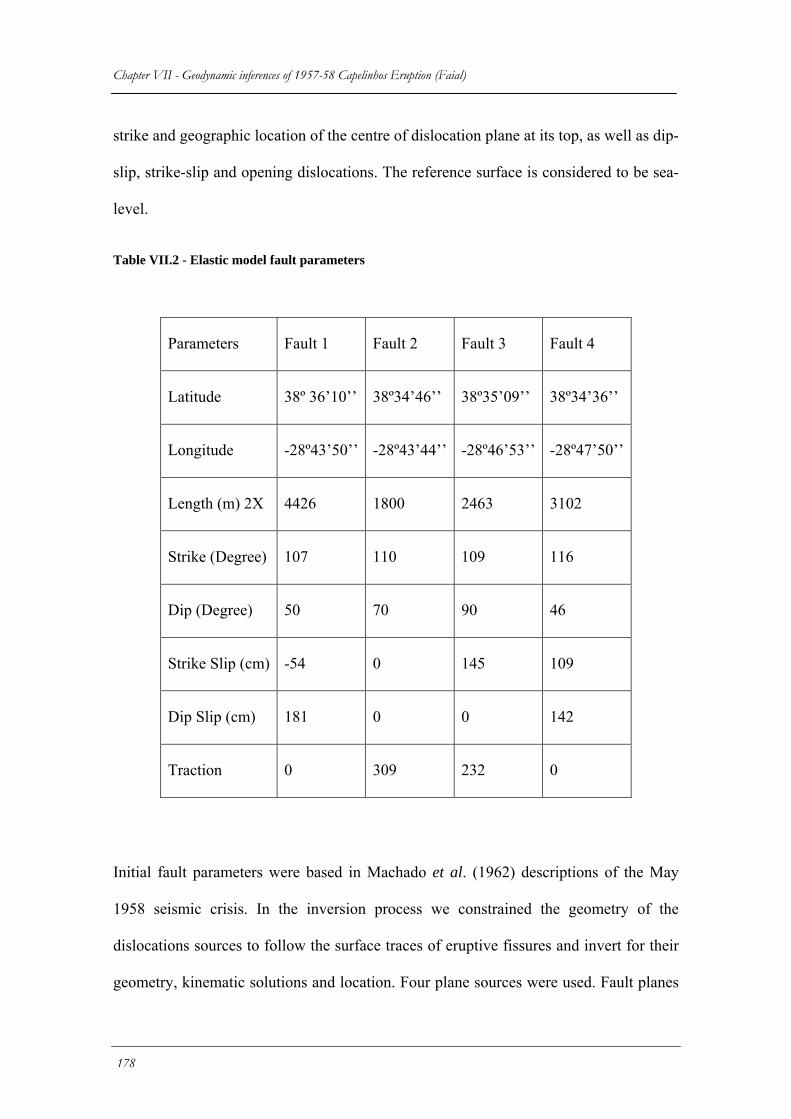
Chapter VII - Geodynamic inferences of 1957-58 Capelinhos Eruption (Faial) strike and geographic location of the centre of dislocation plane at its top, as well as dip-
slip, strike-slip and opening dislocations. The reference surface is considered to be sea-
level.
Table VII.2 - Elastic model fault parameters
Parameters Fault 1 Fault 2 Fault 3 Fault 4
Latitude 38º 36’10’’ 38º34’46’’ 38º35’09’’ 38º34’36’’
Longitude -28º43’50’’ -28º43’44’’ -28º46’53’’ -28º47’50’’
Length (m) 2X 4426 1800 2463 3102
Strike (Degree) 107 110 109 116
Dip (Degree) 50 70 90 46
Strike Slip (cm) -54 0 145 109
Dip Slip (cm) 181 0 0 142
Traction 0 309 232 0
Initial fault parameters were based in Machado et al. (1962) descriptions of the May
1958 seismic crisis. In the inversion process we constrained the geometry of the
dislocations sources to follow the surface traces of eruptive fissures and invert for their
geometry, kinematic solutions and location. Four plane sources were used. Fault planes
178
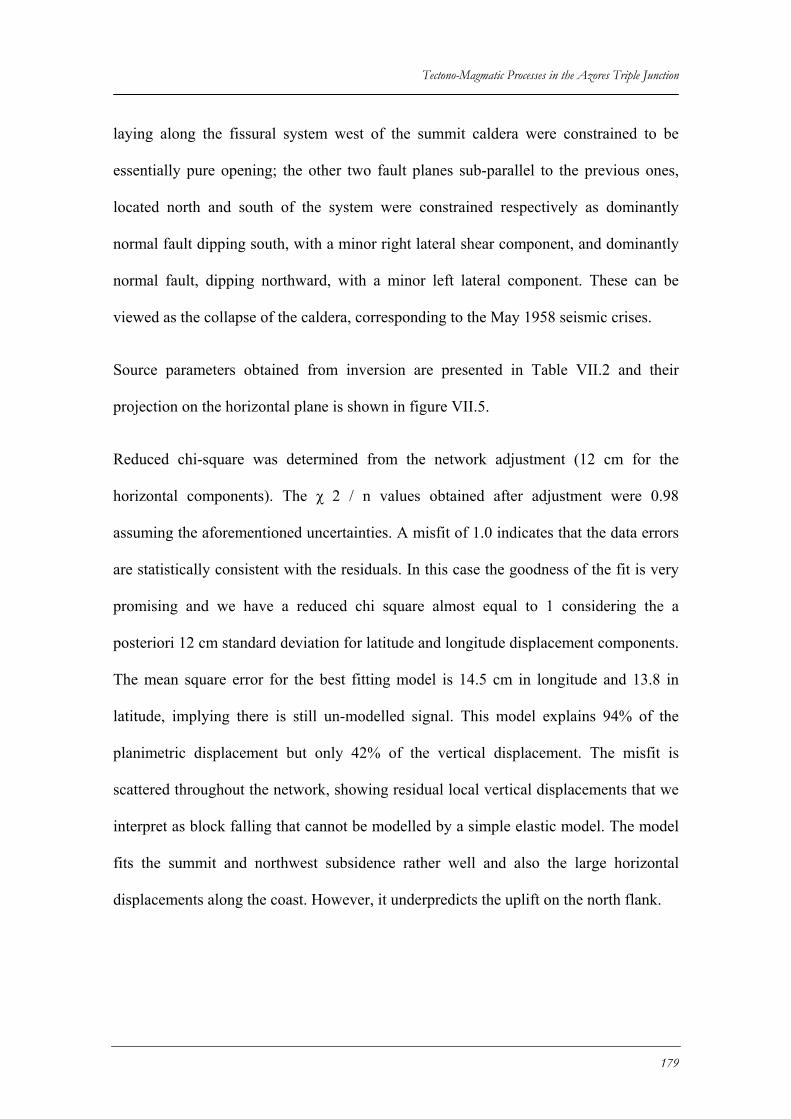
Tectono-Magmatic Processes in the Azores Triple Junction
laying along the fissural system west of the summit caldera were constrained to be
essentially pure opening; the other two fault planes sub-parallel to the previous ones,
located north and south of the system were constrained respectively as dominantly
normal fault dipping south, with a minor right lateral shear component, and dominantly
normal fault, dipping northward, with a minor left lateral component. These can be
viewed as the collapse of the caldera, corresponding to the May 1958 seismic crises.
Source parameters obtained from inversion are presented in Table VII.2 and their
projection on the horizontal plane is shown in figure VII.5.
Reduced chi-square was determined from the network adjustment (12 cm for the
horizontal components). The χ 2 / n values obtained after adjustment were 0.98
assuming the aforementioned uncertainties. A misfit of 1.0 indicates that the data errors
are statistically consistent with the residuals. In this case the goodness of the fit is very
promising and we have a reduced chi square almost equal to 1 considering the a
posteriori 12 cm standard deviation for latitude and longitude displacement components.
The mean square error for the best fitting model is 14.5 cm in longitude and 13.8 in
latitude, implying there is still un-modelled signal. This model explains 94% of the
planimetric displacement but only 42% of the vertical displacement. The misfit is
scattered throughout the network, showing residual local vertical displacements that we
interpret as block falling that cannot be modelled by a simple elastic model. The model
fits the summit and northwest subsidence rather well and also the large horizontal
displacements along the coast. However, it underpredicts the uplift on the north flank.
179
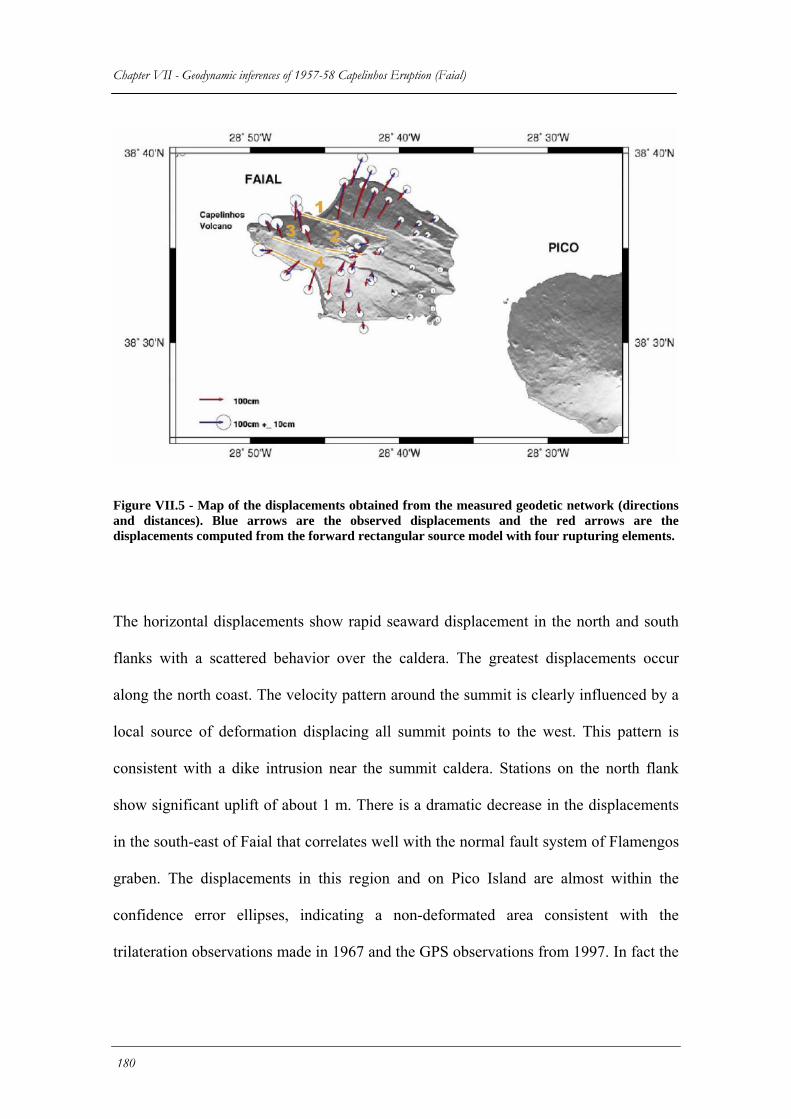
Chapter VII - Geodynamic inferences of 1957-58 Capelinhos Eruption (Faial)
Figure VII.5 - Map of the displacements obtained from the measured geodetic network (directions and distances). Blue arrows are the observed displacements and the red arrows are the displacements computed from the forward rectangular source model with four rupturing elements.
The horizontal displacements show rapid seaward displacement in the north and south
flanks with a scattered behavior over the caldera. The greatest displacements occur
along the north coast. The velocity pattern around the summit is clearly influenced by a
local source of deformation displacing all summit points to the west. This pattern is
consistent with a dike intrusion near the summit caldera. Stations on the north flank
show significant uplift of about 1 m. There is a dramatic decrease in the displacements
in the south-east of Faial that correlates well with the normal fault system of Flamengos
graben. The displacements in this region and on Pico Island are almost within the
confidence error ellipses, indicating a non-deformated area consistent with the
trilateration observations made in 1967 and the GPS observations from 1997. In fact the
180
Tectono-Magmatic Processes in the Azores Triple Junction
eruption and the subsequent seismic crises did not affect either the east of Faial nor Pico
Island.
Most of the deformation is spatially constrained to the central and western zones of
Faial Island. Northern and western stations have average displacements of 1.5 m
(relative to MMOC), while stations on eastern Faial and Pico show no significant
relative motion. It is known (Machado et al., 1962) that the eruption and associated
seismic crises were hardly felt in Pico, this is confirmed by the geodetic data therefore
no significant deformation has affected Pico Island since 1937.
Vertical displacements show subsidence of the north-west zone with a maximum of -1.5
m and coastal uplift on the south-west zone with a maximum of 0.5 m. This uplift along
the south coast constrains the fault position and argues in favour of normal faulting
along this fault. There are three stations with significant subsidence along the north-
west coast.
As we have only a few occupation epochs during the whole time span we cannot
completely discriminate the time variation of the displacement field. However, we know
that displacements were smaller than the accuracy of conventional geodetic techniques
during the 1967-97 period, and also that the magnitude of the displacements deduced
from our work agree well with the independent measures presented by Machado et al.
(1962) for the deformation generated by the 1957-58 events. We can conclude that
surface displacement observed between 1937 and 1997 is mainly a consequence of a
single series of events related to the Capelinhos dyke emplacement event and related
eruption as suggested by our modeling procedure.
181

Tectono-Magmatic Processes in the Azores Triple Junction
Chapter VIII - Physical models of rifting and transform faulting in a wedge-shape lithosphere
VIII.1 Introduction
Most of the physical processes that must be evoked to support tectonic interpretations in
the Azores are not well understood as in the case of rifting and transform fault
generation. In the Azores mantle processes which contribute for the formation of rifting
in the Terceira axis and transform fault generation can be driven both by plates
divergent spreading and by the Azores Hot Spot dynamics in space and time. As this
interaction between the Azores Hot Spot and Azores lithosphere is not yet fully
understood, physical modelling as shall be presented bellow is a usefull tool to provide
constraints on the relevance of some of those factors. In this chapter we disregard plume
related mantle processes and foccus our attention in ridge push as a driving force for
ortogonal transform fault generation and for spreading to occur.
The way in which mantle processes contribute to plate tectonics has long been a subject
for debate. After more than 30 years of studies of oceanic ridges, several objections
were raised to the early views in which plate motions are fundamentally a result of
mantle convection (Cox & Hart, 1986) and lithospheric plates ride passively on a
moving asthenosphere. Molnar (1988) considered that flow in the asthenosphere is no
183
Chapter VIII – Physical Models of rifting and transform faulting in a wedge shaped lithosphere more than a trigger for plate motion. Davies (1992) suggested that plates govern the
flow and that they are integral parts of the convection process. More radically, Stüwe
(2002) calculated that differential stresses at the base of the lithosphere are too small to
transmit forces from the asthenospheric mantle to the lithosphere. On petrologic
arguments, he also concluded that the ascending paths of convective cells are not
directly under oceanic ridges.
There is growing support for the idea that tectonic plates are active components of
global convection. According to this view, plate tectonics are an example of self-
organization (Anderson, 2001 and 2002), whereby forces at the edges of plates directly
influence processes in the convecting mantle. The recognized forces are ridge push, slab
pull, trench suction and basal drag (see Turcotte and Schubert, 1982). Balancing them
are shearing, slab bending, friction on transform faults, and continental collision (e.g.
Forsyth and Uyeda, 1975; Richter, 1977; Chapple and Tullis, 1977, Cox & Hart, 1986,
Favela and Anderson, 2000).
First order oceanic transform faults tend to be geometrically simple; on the whole they
are parallel to plate motions, disturbed only by significant changes in kinematic
conditions (Fox and Gallo 1984 and 1986; Carbotte and Macdonald, 1994; Hey et al.,
1995). Non-transform discontinuities also exist, but they are ephemeral, and result from
local interactions (MacDonald, 1986 and 1988; Grindlay et al, 1991; Grindlay and Fox,
1993). Transform faults that strike at 90º to adjacent ridge segments are common in
nature, for example in the Mid-Atlantic Ridge south of the Azores, the Hayes and
Oceanograper Fracture Zones display such a configuration. Within the ATJ domain,
there are no clear first order transform linked with the Eu-Af plate boundary, however
we have here presented reported co-seismic ruptures in orthogonal planes, as shown by
184
Tectono-Magmatic Processes in the Azores Triple Junction
Faial 1998 earthquake, and orthogonal geometrical relations is fault patterns namely in
the East of Terceira Island and adjoining North Hirondelle Basin or across the LVR
sectors. These geometrical relations are not accountable from classical theories of
fracture mechanics.
In this chapter, we investigate the structures that are formed in ridges, straight or offset.
The presence of a heavy wedge-shaped lithosphere above a buoyant asthenosphere leads
to isostatic compensation, forming ridges and abyssal plains. The topography of the
ridge results in ridge push. This is a driving force for extension on the ridge, as well as
for transform motion at ridge offsets.
VIII.2 Background on physical models of ridges and transform faults
Physical modelling has been successful to some extent in reproducing ridges and
transform faults. Oldenburg and Brune (1972, 1975) obtained good likenesses, using
paraffin wax as a model material. They concluded that equivalent structures in nature
result from tensile forces that originate through buoyancy forces acting in plates, rather
than through underlying viscous drag.
O’Bryan et al., (1975) published results based on the wax model of Oldenburg and
Brune, and the Cox “tennis ball experiment” (Cox, 1973). They produced realistic ridge
and transform geometries and suggested that transform faults orthogonal to the ridge
would result from upward propagation of a zigzag pattern at the base of the lithosphere
or top of the asthenosphere. Ragnarsson et al. (1996) used similar wax models to
address ridge dynamics and structure. They concluded that, above a critical spreading
velocity, a transient segmented ridge and orthogonal fracture zones form.
185
Chapter VIII – Physical Models of rifting and transform faulting in a wedge shaped lithosphere Shemenda and Grocholsky (1991, 1994) used a wax-like hydrocarbon, forcibly cooled
from above, to simulate both melt and a semi-brittle upper layer subject to horizontal
tension. In their experiments, a ridge resulted from an unstable, non-stationary and
asymmetric three-dimensional process. They were not able to produce orthogonal
transform faults, but rather transfer zones, which grew in width or ceased to be active as
a function of adjacent ridge dynamics.
Dauteuil and Brun (1993) used analogue models consisting of brittle and ductile layers
to study the structural pattern of the highly oblique Mohns Ridge. Mart and Dauteuil
(2000) used similar layers, isostatically compensated, to model obliquely rifting
systems. In both sets of experiments, the resulting fault pattern included en-echelon
ridges, normal to the extension direction, and intervening zones of oblique strike slip.
Mauduit and Dauteuil (1996a and 1996b) and Dauteuil et al., (2002), using isostatically
compensated two-layer models of sand and silicone putty, altered the lithospheric
strength in the transform zone. The resulting fault zones were narrow, when the
lithosphere was strong; and wider and more complex, when the lithosphere was weak.
In nature, Dauteuil et al. (2002) concluded that spreading rates and offset lengths are the
main factors controlling lithospheric strength at transform faults.
Tentler (2003) used centrifuged models, in which up-rise of lighter and weaker ductile
material (an analogue for the asthenosphere) promoted passive rifting in an overlying
brittle layer. In some experiments, propagating cracks interfered longitudinally and
developed into “overlapping spreading centres”. Tentler (2003) suggested that such
overlap might lead to orthogonal ridge-transform configurations in true mid-oceanic
ridges.
186
Tectono-Magmatic Processes in the Azores Triple Junction
None of the above analogue modelling strategies has focussed specifically on the
interplay between gravitational forces, rifting and the generation of transform faults
between offset spreading segments. To do so we must investigate the problem by means
of physical models in which the driving forces for the development of axial rifts are
gravitational in origin. They come from density jumps at a dipping interface, rather than
from a convecting mantle. Although in nature the role of heat is essential, in that it
governs the thickness of a cooling lithosphere, we do not model its conduction or
advection. Instead, we assume that, as a result of cooling and spreading, the lithosphere
is a wedge of small apical angle. We test the mechanical response of such a wedge and
then of an offset between ridge segments. In some experiments, the offset is purely
geometrical, whereas in others we have reduced the frictional resistance by using
artificially embedded faults. The underlying question is, can gravitational forces explain
the common occurrence of major oceanic transform faults, which are orthogonal to
adjacent ridge segments?
VIII.3 Dynamics of a spreading oceanic lithosphere
The oceanic lithosphere can be considered as a thermal boundary layer and its base as
an isotherm. To calculate the shapes of isotherms, we follow Turcotte and Schubert
(2002): if the oceanic lithosphere cools in the same way as a semi-infinite half-space, its
temperature at a time t is given by (Turcotte and Schubert, 1982, equation 4-113, page
160):
(T – Tm)/(Tm – Ts) = erf {z/2(κ t)1/2} (1)
In equation (1), the terms on the left and right are dimensionless, T is the current
temperature at the base of the lithosphere, Tm is the temperature deep in the
187
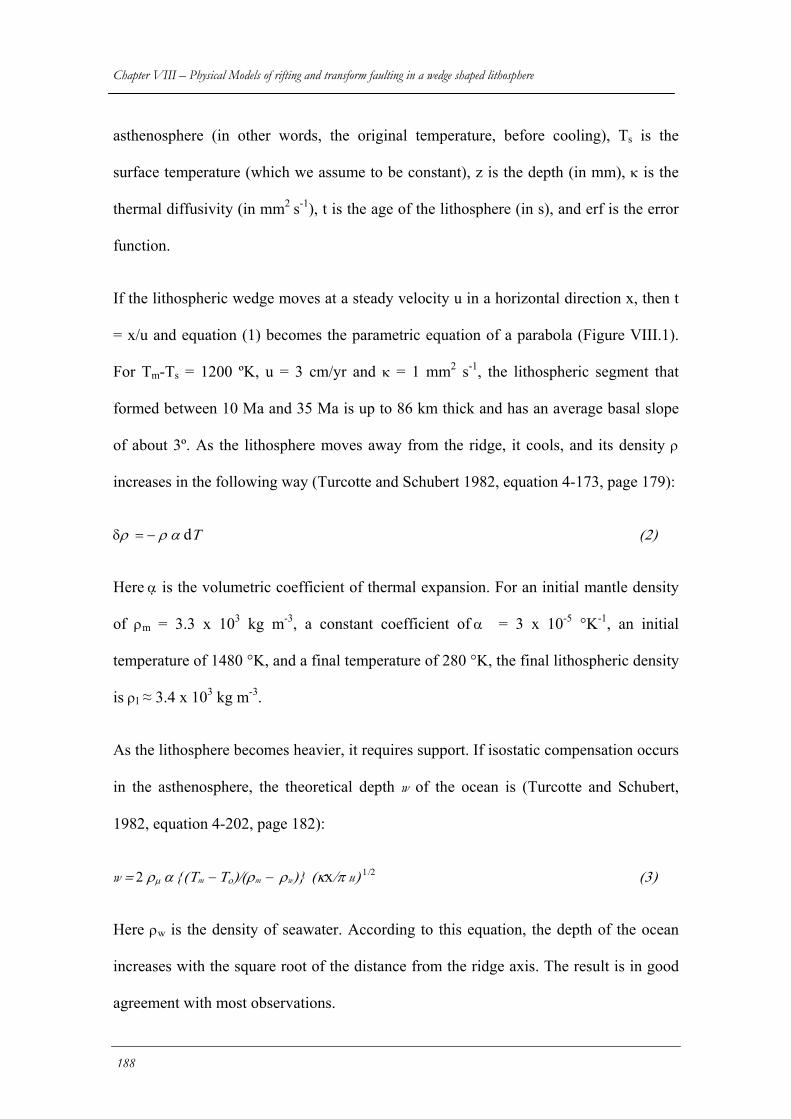
Chapter VIII – Physical Models of rifting and transform faulting in a wedge shaped lithosphere asthenosphere (in other words, the original temperature, before cooling), Ts is the
surface temperature (which we assume to be constant), z is the depth (in mm), κ is the
thermal diffusivity (in mm2 s-1), t is the age of the lithosphere (in s), and erf is the error
function.
If the lithospheric wedge moves at a steady velocity u in a horizontal direction x, then t
= x/u and equation (1) becomes the parametric equation of a parabola (Figure VIII.1).
For Tm-Ts = 1200 ºK, u = 3 cm/yr and κ = 1 mm2 s-1, the lithospheric segment that
formed between 10 Ma and 35 Ma is up to 86 km thick and has an average basal slope
of about 3º. As the lithosphere moves away from the ridge, it cools, and its density ρ
increases in the following way (Turcotte and Schubert 1982, equation 4-173, page 179):
δρ = − ρ α dΤ (2)
Here α is the volumetric coefficient of thermal expansion. For an initial mantle density
of ρm = 3.3 x 10³ kg m-3, a constant coefficient of α = 3 x 10⁻⁵ °K-1, an initial
temperature of 1480 °K, and a final temperature of 280 °K, the final lithospheric density
is ρl ≈ 3.4 x 10³ kg m-3.
As the lithosphere becomes heavier, it requires support. If isostatic compensation occurs
in the asthenosphere, the theoretical depth w of the ocean is (Turcotte and Schubert,
1982, equation 4-202, page 182):
w = 2 ρµ α {(Τm − Το)/(ρm − ρw)} (κx/π u) 1/2 (3)
Here ρw is the density of seawater. According to this equation, the depth of the ocean
increases with the square root of the distance from the ridge axis. The result is in good
agreement with most observations.
188
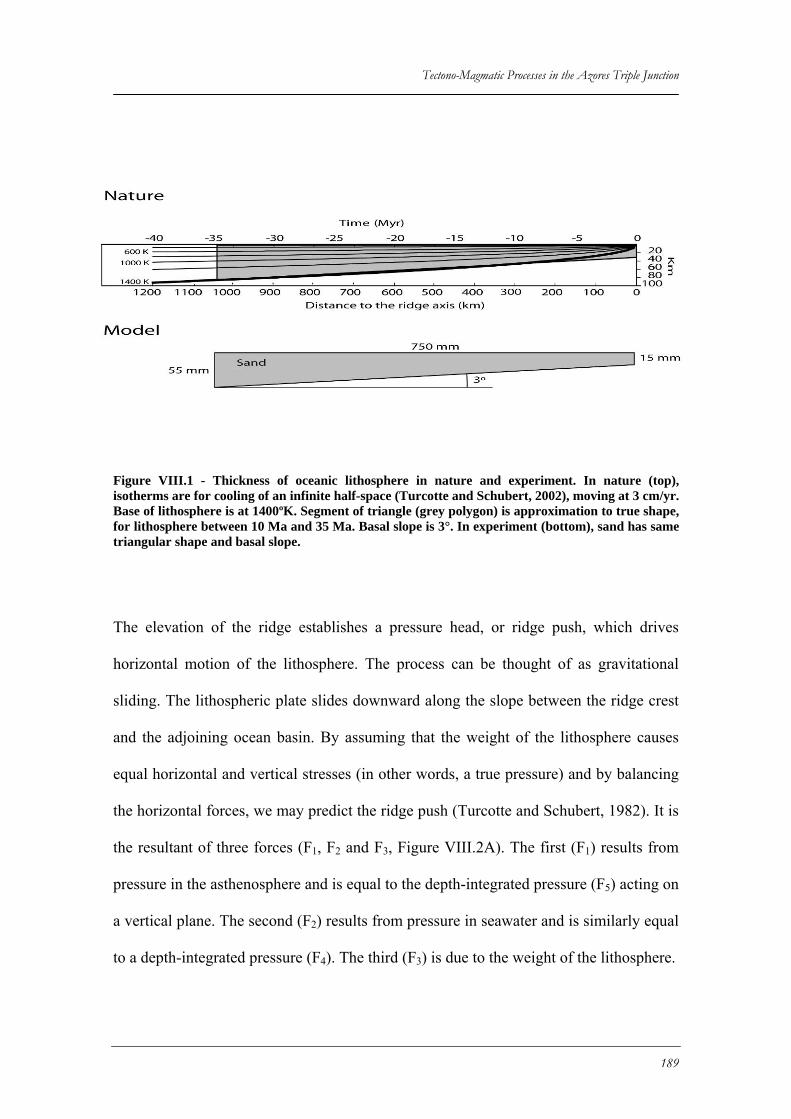
Tectono-Magmatic Processes in the Azores Triple Junction
Figure VIII.1 - Thickness of oceanic lithosphere in nature and experiment. In nature (top), isotherms are for cooling of an infinite half-space (Turcotte and Schubert, 2002), moving at 3 cm/yr. Base of lithosphere is at 1400ºK. Segment of triangle (grey polygon) is approximation to true shape, for lithosphere between 10 Ma and 35 Ma. Basal slope is 3°. In experiment (bottom), sand has same triangular shape and basal slope.
The elevation of the ridge establishes a pressure head, or ridge push, which drives
horizontal motion of the lithosphere. The process can be thought of as gravitational
sliding. The lithospheric plate slides downward along the slope between the ridge crest
and the adjoining ocean basin. By assuming that the weight of the lithosphere causes
equal horizontal and vertical stresses (in other words, a true pressure) and by balancing
the horizontal forces, we may predict the ridge push (Turcotte and Schubert, 1982). It is
the resultant of three forces (F1, F2 and F3, Figure VIII.2A). The first (F1) results from
pressure in the asthenosphere and is equal to the depth-integrated pressure (F5) acting on
a vertical plane. The second (F2) results from pressure in seawater and is similarly equal
to a depth-integrated pressure (F4). The third (F3) is due to the weight of the lithosphere.
189
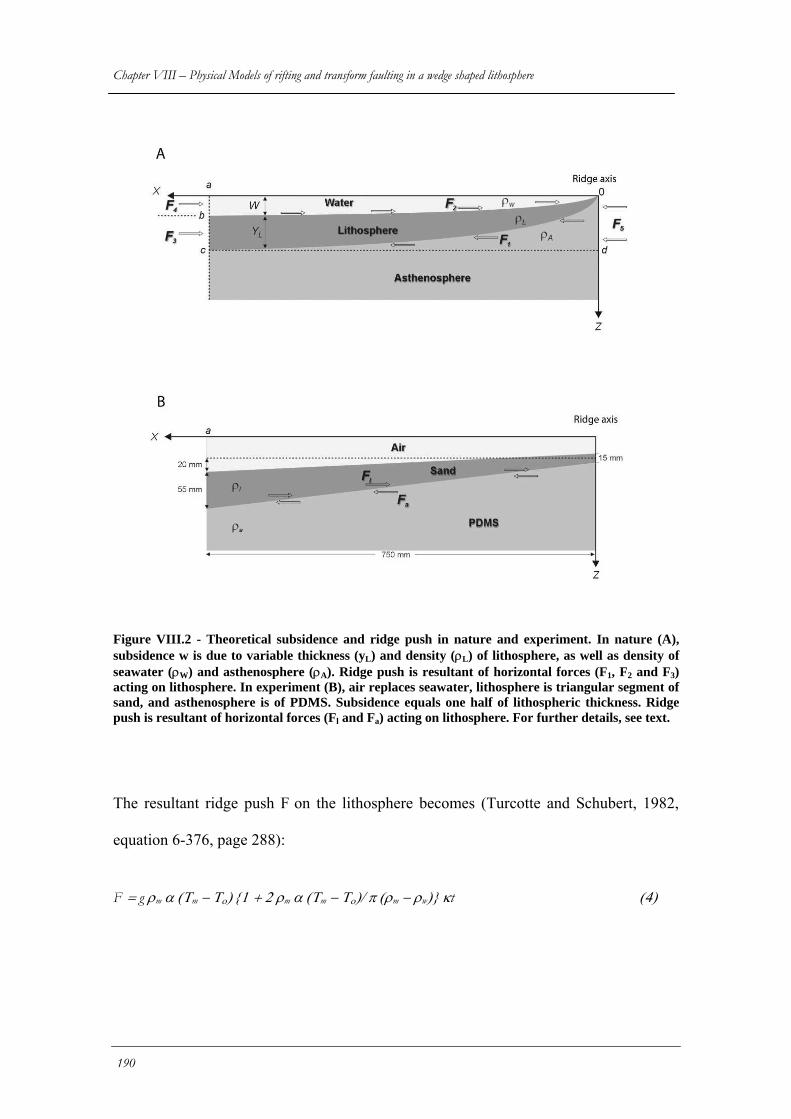
Chapter VIII – Physical Models of rifting and transform faulting in a wedge shaped lithosphere
190
Figure VIII.2 - Theoretical subsidence and ridge push in nature and experiment. In nature (A), subsidence w is due to variable thickness (yL) and density (ρL) of lithosphere, as well as density of seawater (ρW) and asthenosphere (ρA). Ridge push is resultant of horizontal forces (F1, F2 and F3) acting on lithosphere. In experiment (B), air replaces seawater, lithosphere is triangular segment of sand, and asthenosphere is of PDMS. Subsidence equals one half of lithospheric thickness. Ridge push is resultant of horizontal forces (Fl and Fa) acting on lithosphere. For further details, see text.
The resultant ridge push F on the lithosphere becomes (Turcotte and Schubert, 1982,
equation 6-376, page 288):
F = g ρm α (Τm − Το) {1 + 2 ρm α (Τm − Το)/ π (ρm − ρw)} κt (4)
Tectono-Magmatic Processes in the Azores Triple Junction
Here g is the acceleration due to gravity (9.81 m s-2). According to equation (4), the
ridge push is directly proportional to the horizontal distance from the ridge axis, and
therefore to the age of the lithosphere. For a density of water of ρw = 1.0 x 10³ kg m-3, a
temperature difference of 1200 °K, and values of the other parameters as before, the
total ridge push on an oceanic lithosphere, which is 100 Ma old, is ca. 3.8 x 10¹² N m-1
(Turcotte and Schubert, 1982, page 288). This is a force per unit length, parallel to the
ridge. On a lithosphere that has moved at 3 cm/yr for a distance of 1050 km, so that it is
35 Ma old, the ridge push is ca. 1.4 x 10¹² N m-1.
If the only stress that balances the ridge push is a horizontal shear stress, acting on an
area (1050 km by 1 m) at the base of the lithosphere, its magnitude is ca. 1.3 x 10⁶ Pa. If
the viscosity of the asthenosphere is 1020 Pa s (Turcotte and Schubert, 1982), the
corresponding rate of shear beneath the lithosphere is ca. 1.3 x 10⁻¹⁴ s-1. If the plate
velocity is 3 cm/year (ca. 1 x 10⁻⁹ m s-1), and if this attenuates linearly with depth, it
must do so down to at least 130 km. As this depth is conservative for the asthenosphere,
we conclude that the ridge push is sufficient to cause plate motion. Any excess ridge
push is available for causing a longitudinal stress gradient in the lithosphere or for
driving strike-slip motion on transform faults.
VIII.4 Model configurations and scaling
All the experiments (except Model B) were done in a wooden box, 2300 mm long, 500
mm wide and 150 mm deep (Figure VIII.3). Thin sheets of transparent polyester
(Mylar) covered the walls. At the two ends of the model were motor-driven L-shaped
pistons, 90 mm high and 500 mm wide. They rested and could slide on end walls, 60
mm high and 1500 mm apart.
191
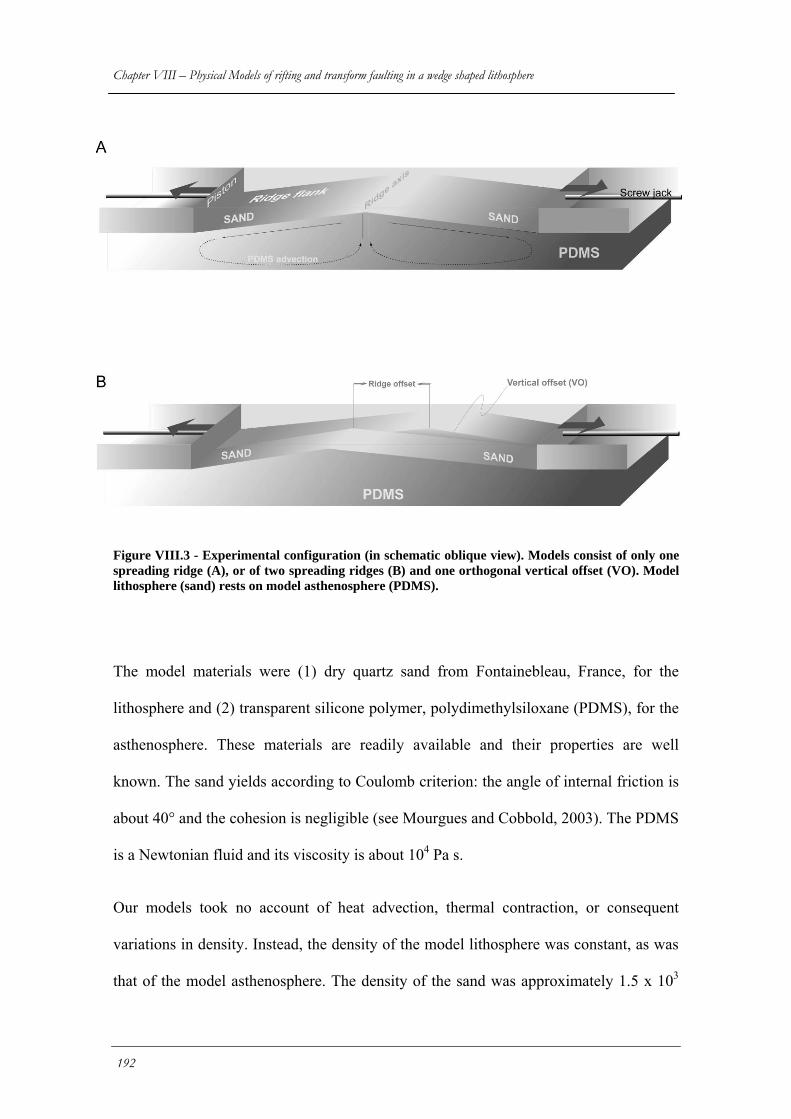
Chapter VIII – Physical Models of rifting and transform faulting in a wedge shaped lithosphere
Figure VIII.3 - Experimental configuration (in schematic oblique view). Models consist of only one spreading ridge (A), or of two spreading ridges (B) and one orthogonal vertical offset (VO). Model lithosphere (sand) rests on model asthenosphere (PDMS).
The model materials were (1) dry quartz sand from Fontainebleau, France, for the
lithosphere and (2) transparent silicone polymer, polydimethylsiloxane (PDMS), for the
asthenosphere. These materials are readily available and their properties are well
known. The sand yields according to Coulomb criterion: the angle of internal friction is
about 40° and the cohesion is negligible (see Mourgues and Cobbold, 2003). The PDMS
is a Newtonian fluid and its viscosity is about 104 Pa s.
Our models took no account of heat advection, thermal contraction, or consequent
variations in density. Instead, the density of the model lithosphere was constant, as was
that of the model asthenosphere. The density of the sand was approximately 1.5 x 10³
192
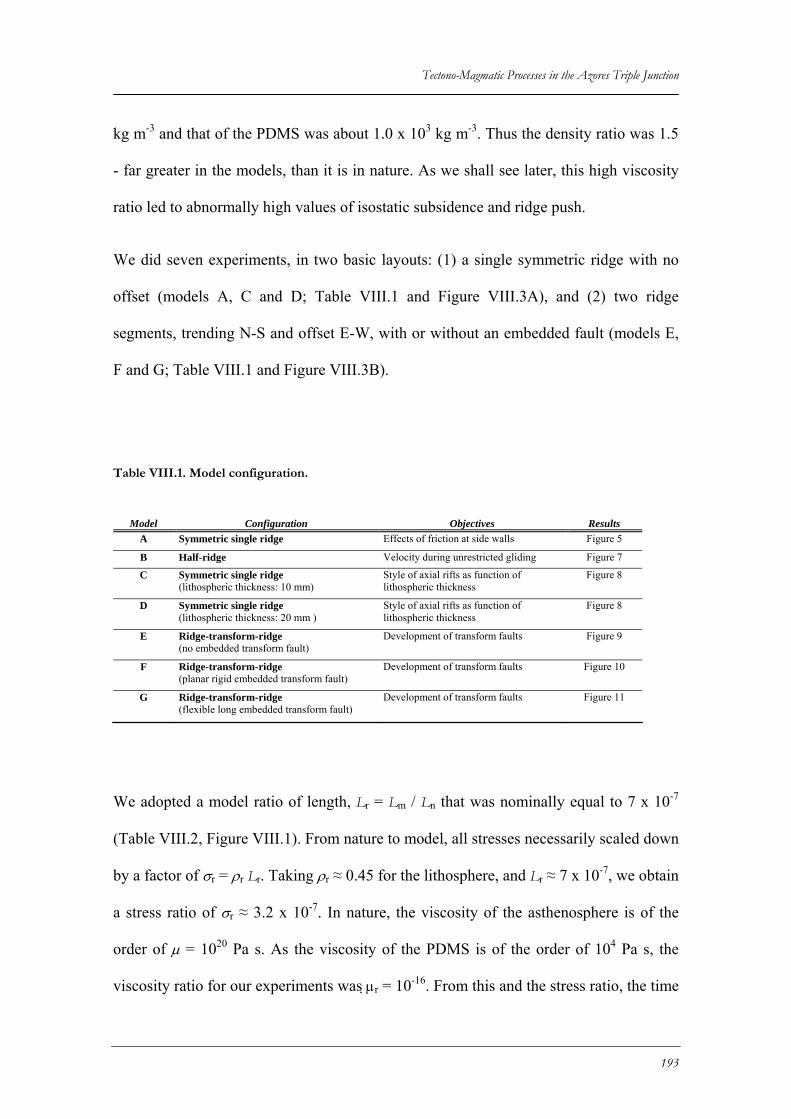
Tectono-Magmatic Processes in the Azores Triple Junction
kg m-3 and that of the PDMS was about 1.0 x 10³ kg m-3. Thus the density ratio was 1.5
- far greater in the models, than it is in nature. As we shall see later, this high viscosity
ratio led to abnormally high values of isostatic subsidence and ridge push.
We did seven experiments, in two basic layouts: (1) a single symmetric ridge with no
offset (models A, C and D; Table VIII.1 and Figure VIII.3A), and (2) two ridge
segments, trending N-S and offset E-W, with or without an embedded fault (models E,
F and G; Table VIII.1 and Figure VIII.3B).
Table VIII.1. Model configuration.
Model Configuration Objectives Results A Symmetric single ridge Effects of friction at side walls Figure 5
B Half-ridge Velocity during unrestricted gliding Figure 7
C Symmetric single ridge (lithospheric thickness: 10 mm)
Style of axial rifts as function of lithospheric thickness
Figure 8
D Symmetric single ridge (lithospheric thickness: 20 mm )
Style of axial rifts as function of lithospheric thickness
Figure 8
E Ridge-transform-ridge (no embedded transform fault)
Development of transform faults Figure 9
F Ridge-transform-ridge (planar rigid embedded transform fault)
Development of transform faults Figure 10
G Ridge-transform-ridge (flexible long embedded transform fault)
Development of transform faults Figure 11
We adopted a model ratio of length, Lr = Lm / Ln that was nominally equal to 7 x 10⁻⁷
(Table VIII.2, Figure VIII.1). From nature to model, all stresses necessarily scaled down
by a factor of σr = ρr Lr. Taking ρr ≈ 0.45 for the lithosphere, and Lr ≈ 7 x 10⁻⁷, we obtain
a stress ratio of σr ≈ 3.2 x 10⁻⁷. In nature, the viscosity of the asthenosphere is of the
order of µ = 1020 Pa s. As the viscosity of the PDMS is of the order of 104 Pa s, the
viscosity ratio for our experiments was µr = 10-16. From this and the stress ratio, the time
193
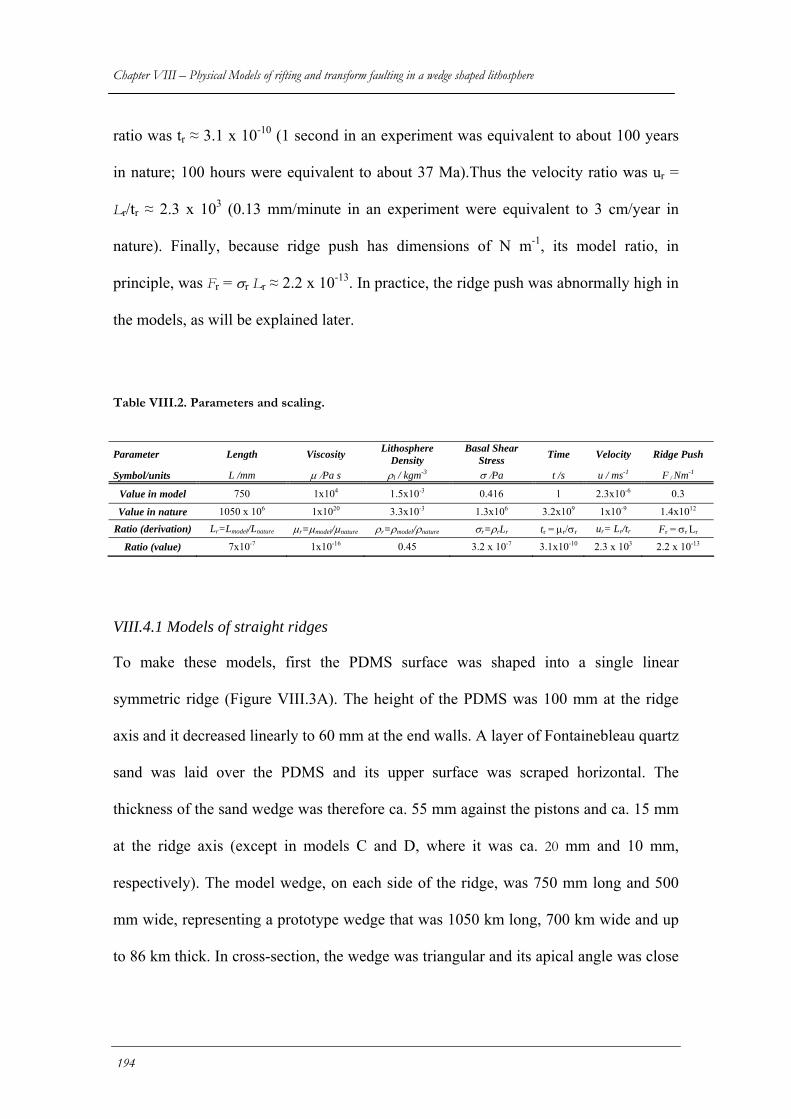
Chapter VIII – Physical Models of rifting and transform faulting in a wedge shaped lithosphere ratio was tr ≈ 3.1 x 10⁻¹⁰ (1 second in an experiment was equivalent to about 100 years
in nature; 100 hours were equivalent to about 37 Ma).Thus the velocity ratio was ur =
Lr/tr ≈ 2.3 x 10³ (0.13 mm/minute in an experiment were equivalent to 3 cm/year in
nature). Finally, because ridge push has dimensions of N m-1, its model ratio, in
principle, was Fr = σr Lr ≈ 2.2 x 10⁻¹³. In practice, the ridge push was abnormally high in
the models, as will be explained later.
Table VIII.2. Parameters and scaling.
Parameter Length Viscosity Lithosphere Density
Basal Shear Stress Time Velocity Ridge Push
Symbol/units L /mm µ /Pa s ρl / kgm-3 σ /Pa t /s u / ms-1 F / Nm-1
Value in model 750 1x10⁴ 1.5x10⁻³ 0.416 1 2.3x10⁻⁶ 0.3
Value in nature 1050 x 106 1x10²⁰ 3.3x10⁻³ 1.3x10⁶ 3.2x10⁹ 1x10⁻⁹ 1.4x10¹²
Ratio (derivation) Lr=Lmodel/Lnature µr=µmodel/µnature ρr=ρmodel/ρnature σr=ρrLr tr = µr/σr ur= Lr/tr Fr = σr Lr
Ratio (value) 7x10⁻⁷ 1x10-16 0.45 3.2 x 10⁻⁷ 3.1x10⁻¹⁰ 2.3 x 10³ 2.2 x 10⁻¹³
VIII.4.1 Models of straight ridges
To make these models, first the PDMS surface was shaped into a single linear
symmetric ridge (Figure VIII.3A). The height of the PDMS was 100 mm at the ridge
axis and it decreased linearly to 60 mm at the end walls. A layer of Fontainebleau quartz
sand was laid over the PDMS and its upper surface was scraped horizontal. The
thickness of the sand wedge was therefore ca. 55 mm against the pistons and ca. 15 mm
at the ridge axis (except in models C and D, where it was ca. 20 mm and 10 mm,
respectively). The model wedge, on each side of the ridge, was 750 mm long and 500
mm wide, representing a prototype wedge that was 1050 km long, 700 km wide and up
to 86 km thick. In cross-section, the wedge was triangular and its apical angle was close
194
Tectono-Magmatic Processes in the Azores Triple Junction
to 3°. This was a simplification that made it easier to construct the models. The
underlying PDMS represented an asthenosphere, 164 km deep.
In a matter of minutes after construction the shape of the model changed as a result of
isostatic compensation. At the axis, where the heavy lithosphere was relatively thin, the
upper surface rose. On the flanks, where the lithosphere was thicker, it sank. However,
at the lateral boundaries, the lithosphere did not move, because it was in dry frictional
contact with the sidewalls and end walls. Nowhere did the model asthenosphere have
the opportunity to extrude, as a result of the pressure that the heavy lithosphere exerted
upon it.
For ideal isostatic compensation of a perfectly triangular wedge, the subsidence w is
directly proportional to the thickness h of the model lithosphere and to the density ratio:
w/ h = ρl/ρa − 1 (5)
In a perfectly triangular wedge, where the density is 1.5 x 10³ kg m-3 for the lithosphere
and 1.0 x 10³ kg m-3 for the asthenosphere, the theoretical subsidence is one half of the
lithospheric thickness. In our models, which were segments of triangular wedges, the
theoretical subsidence was w ≈ 27.5 mm at the far end, and w ≈ 7.5 mm at the near end
(Figure VIII.2B). Thus the theoretical relief was 20 mm, representing an abnormal value
of almost 30 km in nature.
In a perfectly triangular wedge, the ridge push F is equal to the difference between the
vertically integrated pressures in the asthenosphere (Fa) and the lithosphere (Fl):
F = Fa - Fl = g ρa∫ h + w z dz - g ρl ∫ h z dz = (g/2){ρa (h + w)2 - ρl h2} (6)
195
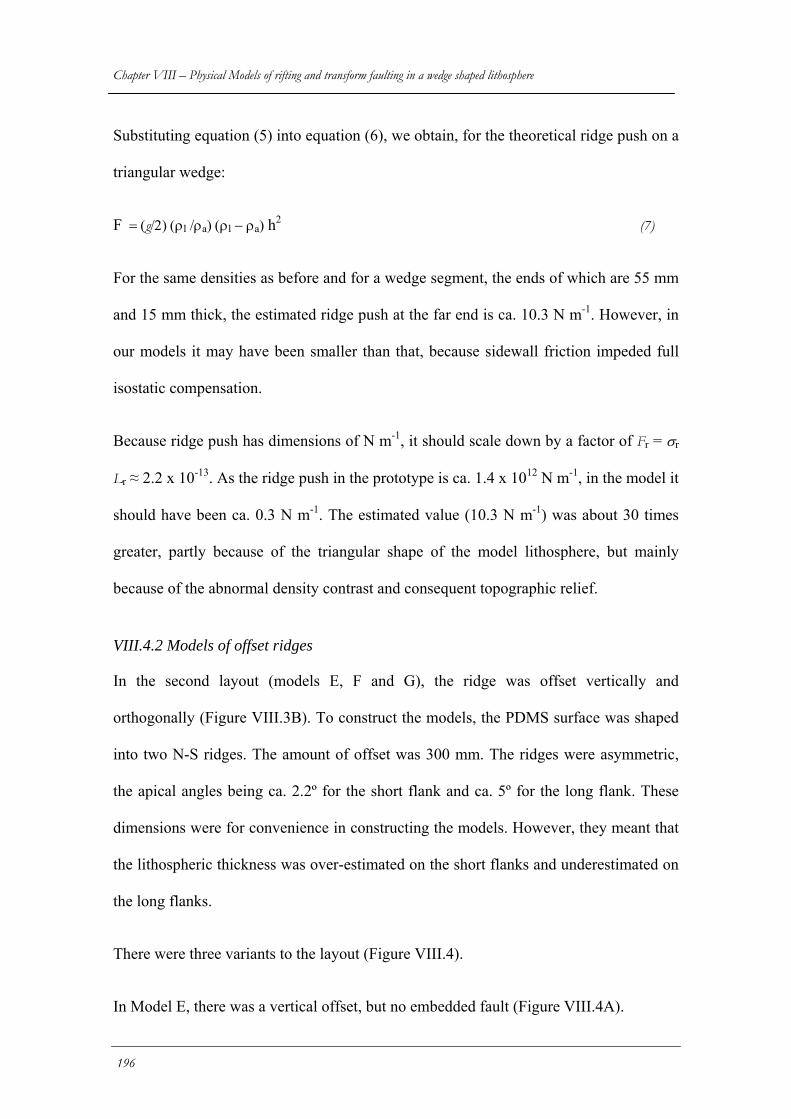
Chapter VIII – Physical Models of rifting and transform faulting in a wedge shaped lithosphere Substituting equation (5) into equation (6), we obtain, for the theoretical ridge push on a
triangular wedge:
F = (g/2) (ρl /ρa) (ρl − ρa) h2 (7)
For the same densities as before and for a wedge segment, the ends of which are 55 mm
and 15 mm thick, the estimated ridge push at the far end is ca. 10.3 N m-1. However, in
our models it may have been smaller than that, because sidewall friction impeded full
isostatic compensation.
Because ridge push has dimensions of N m-1, it should scale down by a factor of Fr = σr
Lr ≈ 2.2 x 10⁻¹³. As the ridge push in the prototype is ca. 1.4 x 10¹² N m-1, in the model it
should have been ca. 0.3 N m-1. The estimated value (10.3 N m-1) was about 30 times
greater, partly because of the triangular shape of the model lithosphere, but mainly
because of the abnormal density contrast and consequent topographic relief.
VIII.4.2 Models of offset ridges
In the second layout (models E, F and G), the ridge was offset vertically and
orthogonally (Figure VIII.3B). To construct the models, the PDMS surface was shaped
into two N-S ridges. The amount of offset was 300 mm. The ridges were asymmetric,
the apical angles being ca. 2.2º for the short flank and ca. 5º for the long flank. These
dimensions were for convenience in constructing the models. However, they meant that
the lithospheric thickness was over-estimated on the short flanks and underestimated on
the long flanks.
There were three variants to the layout (Figure VIII.4).
In Model E, there was a vertical offset, but no embedded fault (Figure VIII.4A).
196
Tectono-Magmatic Processes in the Azores Triple Junction
In Model F, there was an embedded fault, consisting of two Mylar sheets and an
intervening thin glass plate (Figure VIII.4B). The Mylar sheets spanned the distance
(300 mm) between the two ridge segments. Downward, they penetrated no more than 5
mm into the PDMS. Upward, they reached into the sand as much as 5 mm above the
ridges. The glass plate was also 300 mm long, but it reached the bottom of the box.
In Model G, there was an embedded fault, consisting of two longer Mylar sheets, but no
intervening glass plate. One end of each sheet was at a ridge axis, whereas the other end
went well beyond the other ridge axis (Figure VIII.4C). Between the ridges, the Mylar
sheets were in mutual contact, whereas beyond the ridges they were in contact with
PDMS or sand.
The Mylar sheets were in dry frictional contact, with each other (Model G), with the
glass plate (Model F) and with the sand. Although for these contacts we did not measure
the frictional resistances, we observed that they were less than the internal friction of the
sand. In contrast, all materials adhered strongly to the PDMS. In Model F, the glass
plate rendered the embedded fault inflexible.
In a matter of minutes after construction, the shape of the model changed, as a result of
isostatic compensation. At the ridge axes, where the heavy lithosphere was relatively
thin, the upper surface rose. On the flanks, where the lithosphere was thicker, it
subsided. At the lateral boundaries, the lithosphere did not move, because it was in dry
frictional contact with the sidewalls and end walls. For similar reasons, uplift was less
pronounced along the trace of the ridge offset, than it was on the ridges or their
immediate flanks.
197
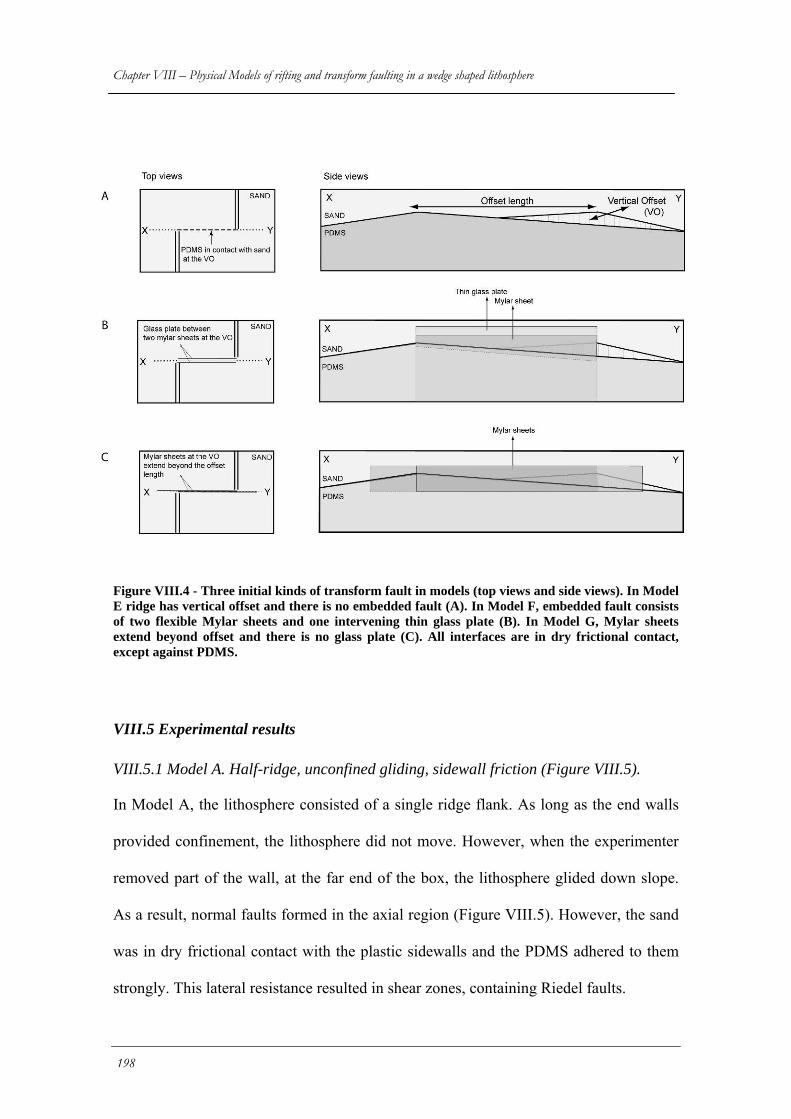
Chapter VIII – Physical Models of rifting and transform faulting in a wedge shaped lithosphere
198
Figure VIII.4 - Three initial kinds of transform fault in models (top views and side views). In Model E ridge has vertical offset and there is no embedded fault (A). In Model F, embedded fault consists of two flexible Mylar sheets and one intervening thin glass plate (B). In Model G, Mylar sheets extend beyond offset and there is no glass plate (C). All interfaces are in dry frictional contact, except against PDMS.
VIII.5 Experimental results
VIII.5.1 Model A. Half-ridge, unconfined gliding, sidewall friction (Figure VIII.5).
In Model A, the lithosphere consisted of a single ridge flank. As long as the end walls
provided confinement, the lithosphere did not move. However, when the experimenter
removed part of the wall, at the far end of the box, the lithosphere glided down slope.
As a result, normal faults formed in the axial region (Figure VIII.5). However, the sand
was in dry frictional contact with the plastic sidewalls and the PDMS adhered to them
strongly. This lateral resistance resulted in shear zones, containing Riedel faults.
Tectono-Magmatic Processes in the Azores Triple Junction
To reduce the sidewall friction, we fixed four Mylar sheets (Mylar 1, Figure VIII.6) to
the end walls, in such a way that they ran along the sidewalls. Another four Mylar
sheets (Mylar 2) were fixed to the sidewalls, but in lower positions, so that they partly
overlapped the upper sheets. On withdrawing the end walls and the attached upper
Mylar sheets at a constant rate of 20 mm/hr, we found that no shear zones developed
against the sidewalls.
VIII.5.2 Model B. Unconfined gliding, no sidewall friction.
Model B was built outside the apparatus, on a rigid plate dipping at 3°. The model
consisted of a triangular wedge of sand, resting on a layer of PDMS, 3 cm thick. All
lateral boundaries were free. Under its own weight, the lithosphere glided down slope.
The experiment lasted one hour.
The upper part of the model glided slowly, whereas the lower part glided more rapidly.
As a result, the entire model was subject to extension. The velocity at a point in the
centre of the model increased slowly, up to a value of about 120 mm/hour (Figure
VIII.7).
VIII.5.3 Models C and D. Straight ridges, confined gliding, limited sidewall friction
In models C and D, a piston moving at 10 mm/hour limited the rate of gliding of the
model lithosphere. The result of gliding was extension in the ridge axis (Figure VIII.8).
When the extension had reached 1%, an axial rift formed. To avoid the PDMS welling
up unduly and to simulate the formation of oceanic crust by cooling, we deposited thin
layers of sand episodically in the axial rift. The thickness of this sand exerted a strong
control on the development of extensional faults in the axial rift.
199
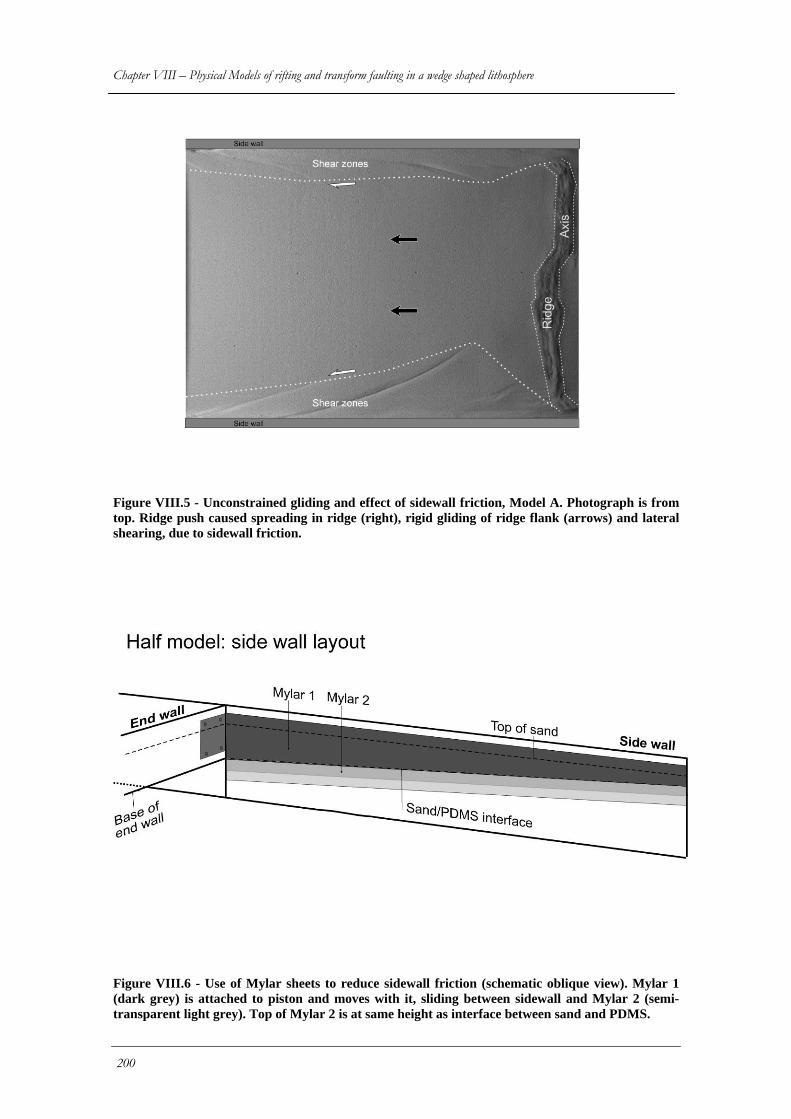
Chapter VIII – Physical Models of rifting and transform faulting in a wedge shaped lithosphere
Figure VIII.5 - Unconstrained gliding and effect of sidewall friction, Model A. Photograph is from top. Ridge push caused spreading in ridge (right), rigid gliding of ridge flank (arrows) and lateral shearing, due to sidewall friction.
Figure VIII.6 - Use of Mylar sheets to reduce sidewall friction (schematic oblique view). Mylar 1 (dark grey) is attached to piston and moves with it, sliding between sidewall and Mylar 2 (semi-transparent light grey). Top of Mylar 2 is at same height as interface between sand and PDMS.
200
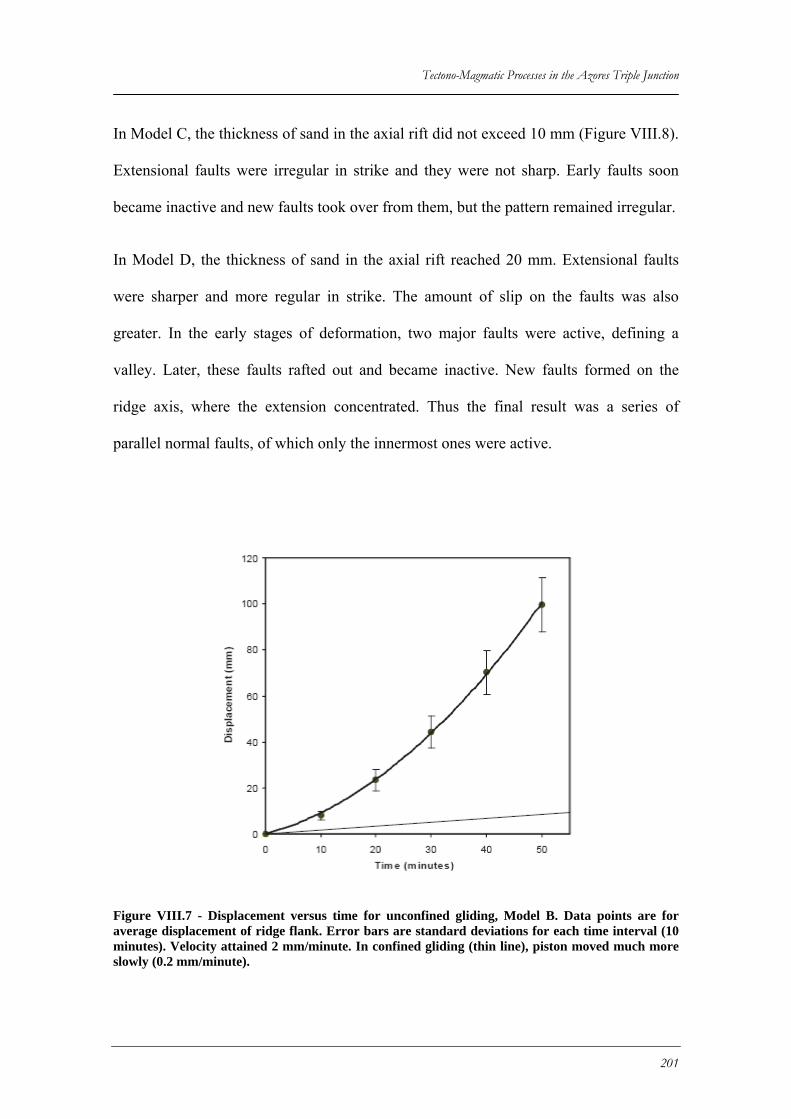
Tectono-Magmatic Processes in the Azores Triple Junction
In Model C, the thickness of sand in the axial rift did not exceed 10 mm (Figure VIII.8).
Extensional faults were irregular in strike and they were not sharp. Early faults soon
became inactive and new faults took over from them, but the pattern remained irregular.
In Model D, the thickness of sand in the axial rift reached 20 mm. Extensional faults
were sharper and more regular in strike. The amount of slip on the faults was also
greater. In the early stages of deformation, two major faults were active, defining a
valley. Later, these faults rafted out and became inactive. New faults formed on the
ridge axis, where the extension concentrated. Thus the final result was a series of
parallel normal faults, of which only the innermost ones were active.
Figure VIII.7 - Displacement versus time for unconfined gliding, Model B. Data points are for average displacement of ridge flank. Error bars are standard deviations for each time interval (10 minutes). Velocity attained 2 mm/minute. In confined gliding (thin line), piston moved much more slowly (0.2 mm/minute).
201
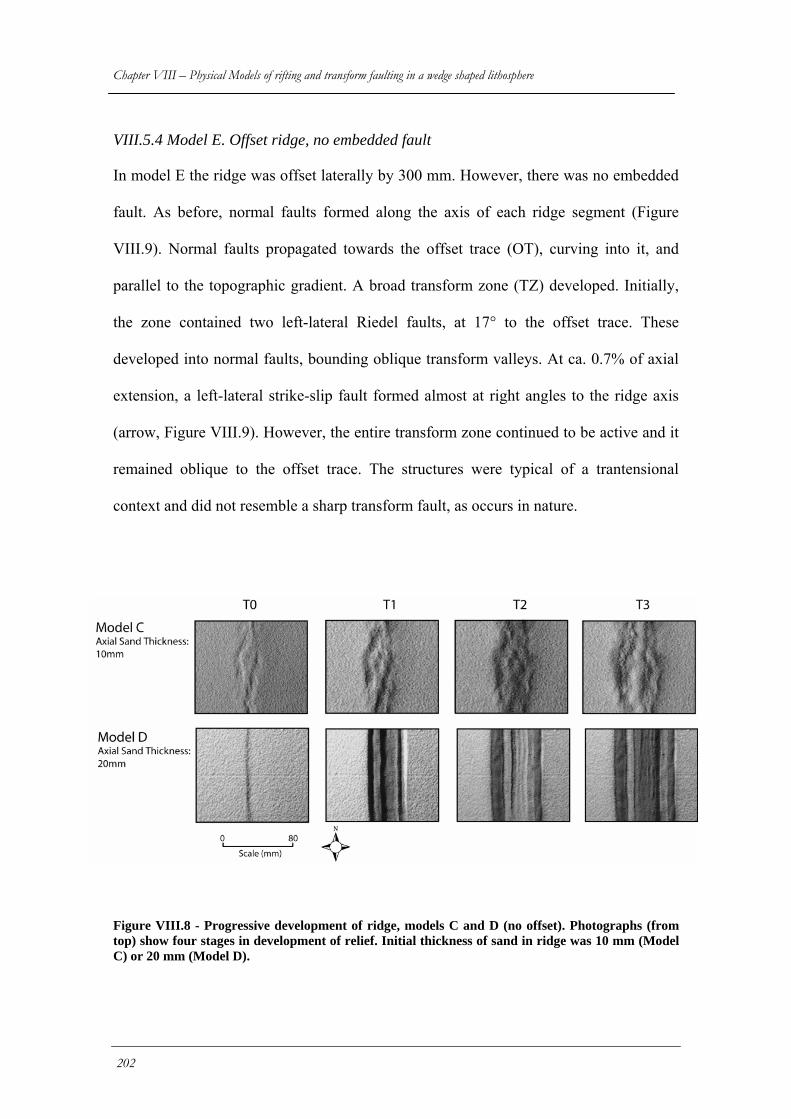
Chapter VIII – Physical Models of rifting and transform faulting in a wedge shaped lithosphere
VIII.5.4 Model E. Offset ridge, no embedded fault
In model E the ridge was offset laterally by 300 mm. However, there was no embedded
fault. As before, normal faults formed along the axis of each ridge segment (Figure
VIII.9). Normal faults propagated towards the offset trace (OT), curving into it, and
parallel to the topographic gradient. A broad transform zone (TZ) developed. Initially,
the zone contained two left-lateral Riedel faults, at 17° to the offset trace. These
developed into normal faults, bounding oblique transform valleys. At ca. 0.7% of axial
extension, a left-lateral strike-slip fault formed almost at right angles to the ridge axis
(arrow, Figure VIII.9). However, the entire transform zone continued to be active and it
remained oblique to the offset trace. The structures were typical of a trantensional
context and did not resemble a sharp transform fault, as occurs in nature.
Figure VIII.8 - Progressive development of ridge, models C and D (no offset). Photographs (from top) show four stages in development of relief. Initial thickness of sand in ridge was 10 mm (Model C) or 20 mm (Model D).
202
Tectono-Magmatic Processes in the Azores Triple Junction
VIII.5.5 Model F. Offset ridge, rigid planar embedded fault (Figure VIII.10).
In Model F, the embedded fault consisted of two Mylar sheets and an intervening glass
plate. The fault was therefore rigid and inflexible, but it allowed slip. At ca. 5.1%, 6%
and 7.2% of axial extension, sand was added to depressions in the transform zone
(Figure VIII.10).
In the initial stages of the experiment, two axial rifts formed, as before. However, this
time the rifts propagated as far as the offset trace, remaining straight. At about 0.6% of
axial extension, a narrow transform zone appeared, on one side of the offset trace, and at
about 79º to the ridge axis. It contained two left-lateral faults. At about 5% of axial
extension, the southern fault propagated eastward, intersecting the outer bounding fault
of the axial rift (arrow 1, Figure VIII.9), whilst the northern fault splayed and
propagated westward. A pure left-lateral strike-slip fault (arrow 2, Figure VIII.9) cut
across the transform zone. At ca. 6.7% extension, a new oblique-slip fault (left-lateral
normal) formed on the northern side of the transform zone (arrow, Figure VIII.9, 6.7%
extension). Thus the transform zone became straighter, but it remained oblique to the
offset trace. Again, the structures were typical of trantension, as in Model E.
VIII.5.6 Model G. Transform with long flexible embedded fault
In Model G, the embedded fault consisted of two Mylar sheets but no glass plate. The
fault was therefore inextensible but flexible.
In the early stages of the experiment two axial rifts formed as before. Again, they
propagated as far as the offset trace, remaining straight. However, this time a single,
discrete fault formed along the offset trace, at right angles to the ridge axis (Figure
203
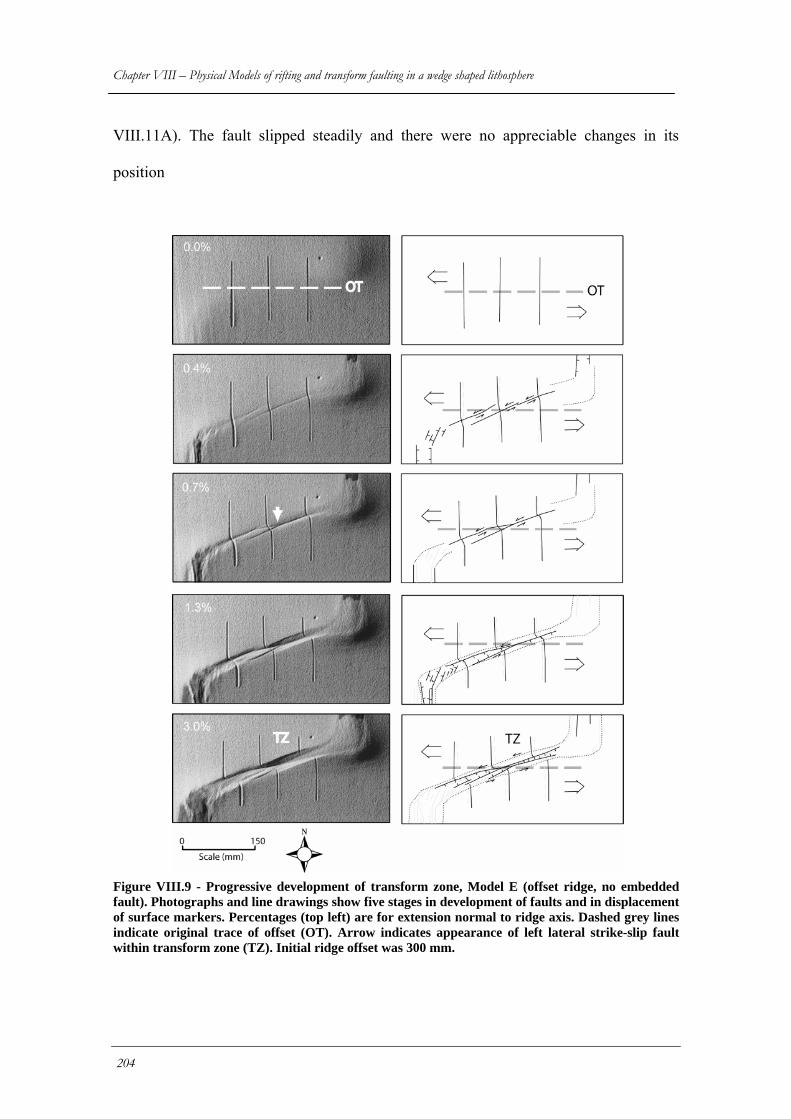
Chapter VIII – Physical Models of rifting and transform faulting in a wedge shaped lithosphere VIII.11A). The fault slipped steadily and there were no appreciable changes in its
position
Figure VIII.9 - Progressive development of transform zone, Model E (offset ridge, no embedded fault). Photographs and line drawings show five stages in development of faults and in displacement of surface markers. Percentages (top left) are for extension normal to ridge axis. Dashed grey lines indicate original trace of offset (OT). Arrow indicates appearance of left lateral strike-slip fault within transform zone (TZ). Initial ridge offset was 300 mm.
204
Tectono-Magmatic Processes in the Azores Triple Junction
In the early stages of the experiment two axial rifts formed as before. Again, they
propagated as far as the offset trace, remaining straight. However, this time a single,
discrete fault formed along the offset trace, at right angles to the ridge axis (Figure
VIII.11A). The fault slipped steadily and there were no appreciable changes in its
position or orientation. No strike-slip motion occurred elsewhere. Such a kinematical
configuration is typical of transform faults in nature (Figure VIII.11B)
VIII.6 Discussion
VIII.6.1 Straight ridges
In the experiments, horizontal ridge push resulted in lithosphere gliding and the
development of axial rifts. It is likely that ridge push caused a component of horizontal
compression, which was insufficient to generate reverse faults, but sufficient to obstruct
the formation of extensional structures, other than the axial rifts. Thus the experiments
yielded realistic structures and kinematics, which were closely comparable to those in
nature.
In the experiments, both the magnitude of the ridge push and the velocity of gliding
were an order of magnitude too large, as compared with the values obtained from
scaling. The exaggerated values were almost certainly due to the strong contrast in
density between model lithosphere and asthenosphere. Despite these exaggerations, the
experiments confirmed that ridge push is capable of (and sufficient for) driving plate
motion and generating axial rifts. There is no need to invoke other forces, coming for
example from thermal convection in the asthenosphere. However, this does not mean
that some such additional forces do not exist in nature.
205
Chapter VIII – Physical Models of rifting and transform faulting in a wedge shaped lithosphere In the experiments, the shapes of the axial rifts depended on the thickness of sand.
Where the axial sand was thin (so that the asthenosphere was shallow), the ridge was an
area of distributed extensional deformation, where bounding faults were short-lived and
had small scarps; where the sand was thick, the axial rift was straight and wide, and the
two bounding faults were long-lived, taking up most of the extension and developing
prominent scarps. On the Mid-Atlantic ridge, faults have a similar pattern (Shaw and
Lin, 1993), which has been interpreted as a function of the thermal regime. In cold
domains at the ends of ridge segments, the lithosphere is thick and strong, and faults are
long- lived. In contrast, at the segment centres, where the lithosphere is weaker and
thinner, faults are closely spaced and short-lived, and they have smaller displacements.
There are several explanations for abyssal hills on ridge flanks (see Edwards et al., 1991
and references therein). Amongst the possible structures are half-grabens, resulting from
block tilting.
In Model D, fault blocks rafted away from the active axial domain and became tilted,
between faults dipping toward the ridge axis. Thus Model D accounts well for the
structural fabric of abyssal hills in nature.
VIII.6.2 Offset ridges
In Model E, where the thickness of the lithosphere was offset and the ridge push acted
in opposite senses on each side, why did a transform fault not form at 90º to the ridge
axis? We suspect that various factors worked against it. First, the amount of isostatic
uplift was smaller at the offset ends of the ridges, than it was elsewhere along them.
Therefore the ridge push must have attenuated toward the offset trace. Second, the
206
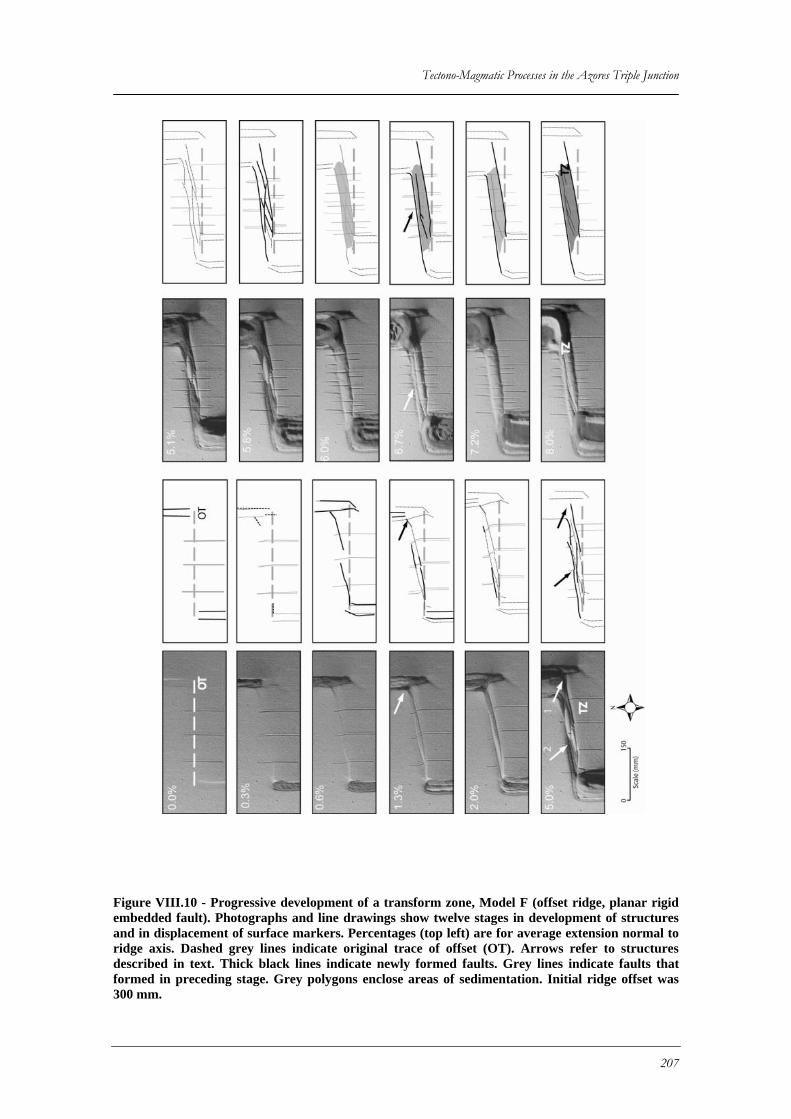
Tectono-Magmatic Processes in the Azores Triple Junction
Figure VIII.10 - Progressive development of a transform zone, Model F (offset ridge, planar rigid embedded fault). Photographs and line drawings show twelve stages in development of structures and in displacement of surface markers. Percentages (top left) are for average extension normal to ridge axis. Dashed grey lines indicate original trace of offset (OT). Arrows refer to structures described in text. Thick black lines indicate newly formed faults. Grey lines indicate faults that formed in preceding stage. Grey polygons enclose areas of sedimentation. Initial ridge offset was 300 mm.
207
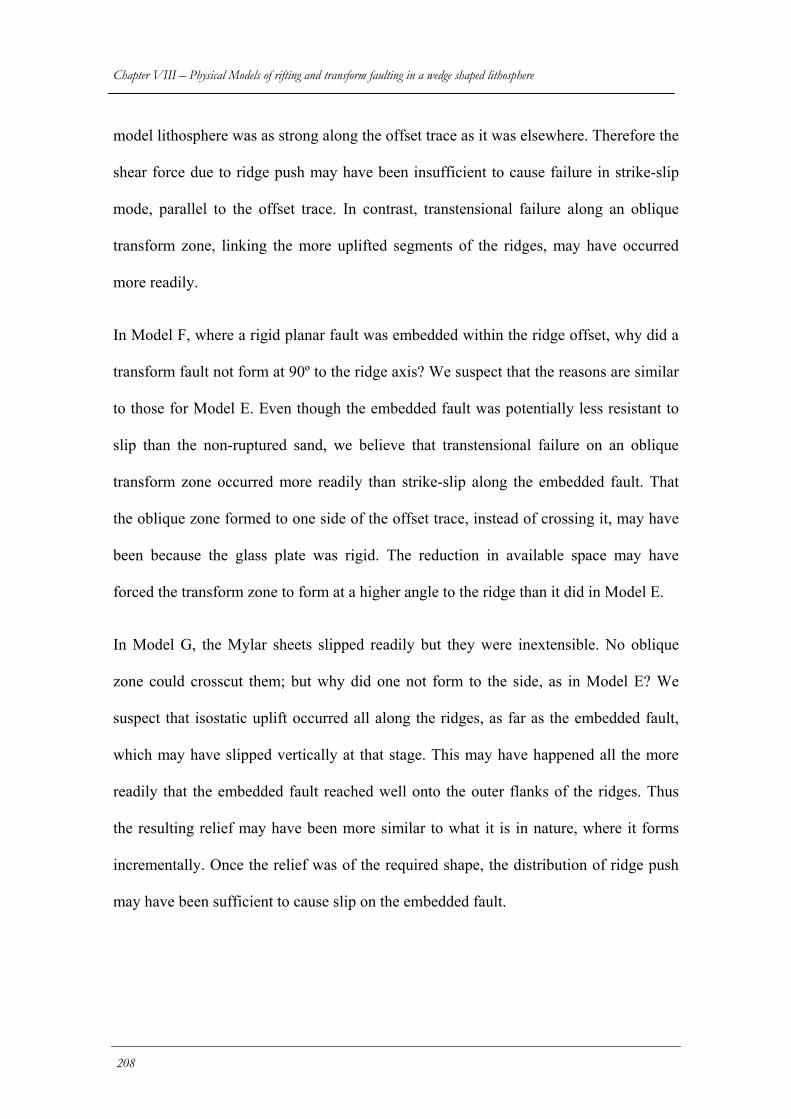
Chapter VIII – Physical Models of rifting and transform faulting in a wedge shaped lithosphere model lithosphere was as strong along the offset trace as it was elsewhere. Therefore the
shear force due to ridge push may have been insufficient to cause failure in strike-slip
mode, parallel to the offset trace. In contrast, transtensional failure along an oblique
transform zone, linking the more uplifted segments of the ridges, may have occurred
more readily.
In Model F, where a rigid planar fault was embedded within the ridge offset, why did a
transform fault not form at 90º to the ridge axis? We suspect that the reasons are similar
to those for Model E. Even though the embedded fault was potentially less resistant to
slip than the non-ruptured sand, we believe that transtensional failure on an oblique
transform zone occurred more readily than strike-slip along the embedded fault. That
the oblique zone formed to one side of the offset trace, instead of crossing it, may have
been because the glass plate was rigid. The reduction in available space may have
forced the transform zone to form at a higher angle to the ridge than it did in Model E.
In Model G, the Mylar sheets slipped readily but they were inextensible. No oblique
zone could crosscut them; but why did one not form to the side, as in Model E? We
suspect that isostatic uplift occurred all along the ridges, as far as the embedded fault,
which may have slipped vertically at that stage. This may have happened all the more
readily that the embedded fault reached well onto the outer flanks of the ridges. Thus
the resulting relief may have been more similar to what it is in nature, where it forms
incrementally. Once the relief was of the required shape, the distribution of ridge push
may have been sufficient to cause slip on the embedded fault.
208
Tectono-Magmatic Processes in the Azores Triple Junction
Figure VIII.11 - Progressive development of transform zone, Model G (offset ridge, flexible embedded fault). Photographs (A) show eight stages in progressive development of structures and in displacement of surface markers. Diagram (B) illustrates kinematical aspects. Initial offset of ridges was 300 mm. Points (P and P’) mark ends of Mylar sheets, beyond offset trace (OT). During deformation, distance P -P´ increased, external marker lines (m) underwent no offset, and internal marker lines (m’) became offset across transform fault.
209
Chapter VIII – Physical Models of rifting and transform faulting in a wedge shaped lithosphere In nature, although the brittle upper crust is relatively strong, well-formed faults appear
to be very weak (Sibson, 1994; Scholz, 1996; Behn et al., 2002). In particular, the
resistance to slip along transform faults is considered to be extremely small (Zoback,
1991). However, the reasons for this are not entirely clear. Various possibilities have
been suggested.
The coefficient of internal friction is smaller in the fault gouge than it is in the wall
rock (Parsons, 2002).
As a result of fluid overpressure (Byerlee, 1990) or seepage forces (Mourgues and
Cobbold, 2003), the effective stresses in the fault zone are smaller than they are outside.
Transform faults form at the onset of cooling and they remain weak, as a result of
thermal contraction (Collette, 1974; Turcotte, 1974).
A biaxial stress field promotes extension and fault unlocking in a direction parallel to
the ridge axis (Zoback, 1991; Gudmundsson, 1995).
Long-term interaction with other faults (“fault unclamping”) reduces the normal stress
on a transform fault (Parsons, 2002).
Presence of serpentinites within the principal transform displacement zone or at ridge
transform intersections (Escartin et al., 1997, Hirth et al., 1998, Escartin et al., 2001b).
Our experiments do not provide any clues as to which of these potential mechanisms
operates in nature. However, the experiments do indicate that transform faults must be
weaker than the surrounding oceanic lithosphere.
210
Tectono-Magmatic Processes in the Azores Triple Junction
Chapter IX – Discussion and main conclusions
The Azores are a region subject to a unique geodynamic setting in the world, it
comprises: An area of anoumously thick oceanic crust expression of a non-conventional
Hot Spot, an unstable triple Junction, geometrically and kinematically complex, and a
plate boundary which displays the slowest spreading rate in the world ridge system.
During the course of this work, we analysed the spatio-temporal variability of the large
and small scale processes which interact in the Azores domain, these can be broadly
systematized as ATJ-AHS for large spatio-temporal scales (Plateau scale) and in
seismo-tectonic and volcano-tectonic events for smaller spatial working scales (Islands
and surrounding deeps) at the present day.
For the large scales, we discussed possible scenarios of interaction between the ATJ
and the AHS through time as described independently by different authors for the
kinematic evolution of the Azores. We focused on interpreting possible tectonic
scenarios for the generation of the plateau main morpho-tectonic features, and study
possible positions and tectonic natures of the ATJ along a time span comprising the age
intervals: 33 Ma to 20 Ma; 20 Ma to 10 Ma and 10 Ma to present.
For the smaller temporal scales we used multidisciplinary data with different resolution
to gain insights on the dynamics of the volcano-tectonic systems in the Azores. We
211
Chapter IX – Discussion and main conclusions approached the Terceira axis as a spreading system and we studied its behaviour with
respect to GPS derived kinematics. Two configurations for the Terceira axis
segmentation were tested by means of elastic half space dislocation modelling. The
detailed tectonics of Terceira Island and some insights on the morpho-structure of
neighbouring segments was achieved, using mainly the conjugate analysis of side scan
sonar images, magnetic charts and when available detailed swath bathymetry data.
Finally, we considered seismo-tectonic and geodetic data and results from a recent
series of volcanic and tectonic events to constrain how magmatic accretion couples with
far-field tectonic regimes interact in the Azores domain.
Our main conclusions can be summarized as follows:
IX.1 ATJ Evolution
The existence of a kinematic independent Azores domain seems to have occurred long
before the interaction of the Azores plateau with the AHS, and is at least older than C13
(33.4 Ma). An estimation of the tectonic character acting through the plateau at different
time intervals varies according to the kinematic model choosen but yield transtension or
oblique extension as the most favourable tectonic regimes along the time span
considered. This result is supported by the poor ATJ closure obtained using published
kinematic poles. Considering NAM/AF finite rotation poles, the EAFZ can be
approached as the structural homologue of the Pico FZ this conclusion is not
corroborated by analougous EU/NAM rotations. Therefore if this structure acted as a
southern plate boundary (South Azores Triple Junction - SATJ) for most of the
evolution of the Azores plateau. The southern edge of stable Eurasia (here referred as
the North Azores Triple Junction - NATJ), could be defined along some structures
212
Tectono-Magmatic Processes in the Azores Triple Junction
(ETVR, S. Miguel Island) as precursors of the current continuous Terceira axis as a
discrete plate boundary. We are not able to provide an age estimate for the Terceira
Axis nucleation. Given the amount of extension estimated for the time span using EU-
AF stage poles, probably this structure did not act as a stable plate boundary for the time
span considered, and therefore it has been distributed across the Azores plateau.
Strong interaction of the SATJ with the AHS started probably at C6 times (20 Ma)
according to the models referred in this study. After a period of intense melt production
and topography build-up which reached a maximum at C5, rifting of the Azores plateau
and onset of normal seafloor spreading begun around 7 to 4 Ma as defined in those
models. BetweenC6 and C5 (ca. 15 Ma) the SATJ departed from the EAFZ (from an
intra-transform context) northwestwards as suggested also by Vogt and Jung (2003).
The Linear volcanic ridges that define the internal morpho-structure of the plateau are
sub-parallel to the SATJ migration path and to the current Terceira axis segmentation
pattern. Three different mechanisms can be evoked to justify their growth:
1) simultaneous growth by reactivation of fracture zones as leaky transforms. 2)
diachronical growth due to the AHS migration northward. 3) Diachronical growth due
to SATJ migration from an intra-transform setting. A schematic representation of these
three hypotheses is presented in Figure IX.1.
Reactivation of MAR fracture zones in the Azores plateau, seems a plausible
explanation for the LVR in sector 1, given their orientations, but seems to be less
applicable to the LVR from sector 2 as in this case, FZ traces, would correspond to a ca.
20º clockwise rotation of sector 2 domain. Evidences of such a block rotation, like
development of compressional ridges, are not clearly visible across the plateau,
213
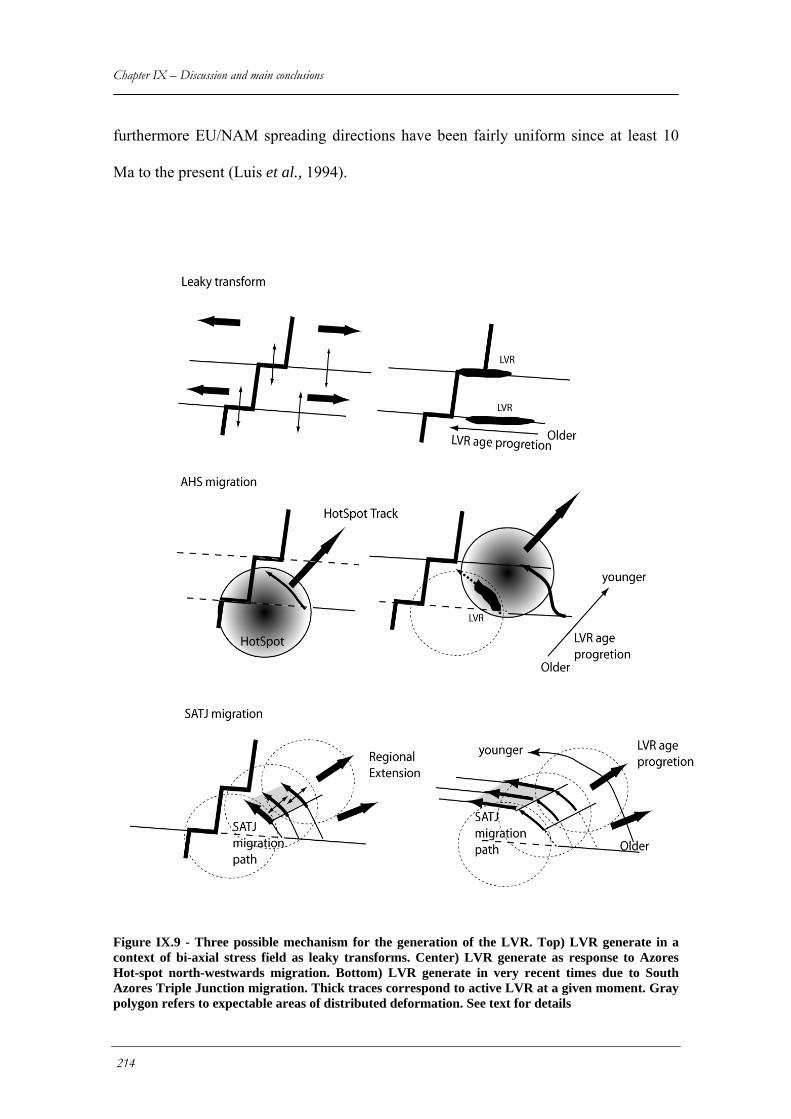
Chapter IX – Discussion and main conclusions furthermore EU/NAM spreading directions have been fairly uniform since at least 10
Ma to the present (Luis et al., 1994).
Figure IX.9 - Three possible mechanism for the generation of the LVR. Top) LVR generate in a context of bi-axial stress field as leaky transforms. Center) LVR generate as response to Azores Hot-spot north-westwards migration. Bottom) LVR generate in very recent times due to South Azores Triple Junction migration. Thick traces correspond to active LVR at a given moment. Gray polygon refers to expectable areas of distributed deformation. See text for details
214
Tectono-Magmatic Processes in the Azores Triple Junction
The second hypothesis implies a northeastern oriented age progression of the LVR as a
response to the migration in the same direction of the AHS (Vogt and Jung, 2003).
These authors consider, by comparing the strikes of the LVR in both sectors that the
LVR are traces of failed rifts either spreading obliquely (Sector 1) or normal (sector 2)
to the main Nuvel1A conditions. Those authors propose a mechanism to justify both the
migration of the plate boundary and the arcuate shape of the LVR, where thickening of
the crust could have caused a zone weakening near the edge of the spreading boundary
and its relocation northwards. This mechanism remains valid at a broader scale, to
explain northward migration of the Triple Junction, but the age progression it implies
for the LVR (progressively younger towards NE), does not fit our main observations
that geological and magnetic anomaly characteristics LVR sectors are coherent
internally but clearly distinct between sectors.
Finally, the third hypothesis, that we favour, links the LVR sector formation with the
progressive SATJ migration northwestwards. As discussed in chapter II, considering
that the ridges in each sector run parallel to the proposed SATJ migration path, we
envisage that this progressive migration was underlined by areas of distributed
deformation on the southern edge of the Eurasian plate. These tectonic features could
be either reactivated MAR fabrics or, as it was probably the case of sector 2, newly
formed. These tectonic features would dominantly control magmatism and LVR
formation at each ATJ progressive migration stage. This model implies that from the
EAFZ towards the Mid-Atlantic Ridge there is an age progression which seems
consistent with the fact that the magnetic structure of LVR in sector 2 is more complex,
and active volcanism less robust than their counterparts in sector 1. The main area of
earthquake activity is currently located west of sector 1, where there are also evidences
215
Chapter IX – Discussion and main conclusions for westward progression of these ridges. Observed active volcanism in sector 2 could
be residual and feed either by Pico Central volcano and related fissural plumbing system
in the case of EPVR or by analogue processes through the S. Jorge fissural system or
the Terceira axis itself in the case of STVR.
As triple junction migration proceeded, older sections of the LVR are progressively
abandoned as failed rifts of the distributed plate boundary. Moreover, this becomes
progressively focalized along the Terceira axis and a new area of distributed
deformation is created further west. This is, in our view the current status of LVR
sector 1 comprising also the MAR off-axis domain between the Condor Ridge and the
Graciosa parallels.
Contrary to what is referred by Vogt and Jung, we consider that the morphological
transitions between LVR sectors have tectonic implications, as they correspond to
discrete steps between bathymetric terraces and deepning of the Azores plateau. This
sector limits as already observed, follow the strike of the expected NUVEL1A EU/AF
spreading directions. Attesting to their probably recent age, they still have a reduced
expression in the Azores morphology.
IX.2 ATJ Present day Structure
Inter-Island GPS observations allowed the study of the kinematic behaviour of each
Island with respect to both stable Eurasia and African plates. We were able to constrain
that the bulk of inter-plate deformation is focused along the Terceira axis, with the
exception of its northern sector corresponding to the Central Islands Group where
deformation is partitioned between Terceira-Graciosa southwards towards Condor ridge
south of Faial Island. A broad segmentation pattern for the present day is proposed
216
Tectono-Magmatic Processes in the Azores Triple Junction
based on half space elastic dislocation modelling and geodetical observables. It defines
a plate boundary centered mainly on the Terceira axis up to the East Graciosa Basin
longitudes and then on a southern segment defined by the Pico-Faial alignment
intersection with the MAR.
This simple segmentation pattern does not fit all geological observations, and we
consider therefore that the plate boundary between the western sections of the Terceira
axis and the Faial-Pico volcanic ridge constitutes and area of distributed deformation.
The GPS based solution, provided in Chapter IV does not accommodate fully the
mechanics of the Triple Junction, the areal scatter of epicenter locations on the western
LVR sector 1 nor the recent earthquake activity west of Graciosa Island documented in
seismic catalogues. As the GPS solution suggests that present ongoing ATJ activity is
located at the Faial Pico alignment, some tectonic transfer mechanism needs to be
evoked to accommodate concomitance of this activity within this area, its concentration
eastwards along the Terceira Ridge and the constrasting lack of significant seismo-
tectonic activity on the deeper sections of the plateau south of this region.
Analysis of recent tectono-magmatic events and fault relations from sonar and
bathymetric images, digital elevation models and ortophotomaps from Terceira Island,
along with magnetic data have allowed us definition of three fault families grouped
mainly in NNW-SSE, corresponding to the left lateral ruptures of 1980 in Angra do
Heroismo and 1998 in Faial; WSW-ENE, also showned in recent studies based on the
Faial 1998 earthquake (Dias, 2006; Fernandes, 2006) which seem conspicuous regional
features in LVR sector 1 and finnaly WNW-ESE corresponding to the strike of the LVR
in this sector.
217
Chapter IX – Discussion and main conclusions The azimuth for the relative motion between Eurasia and Africa is in sector 1, N66º for
the NUVEL 1A (De Mets et al, 1994) model. The azimuth for the relative motion
between Eurasia to Nubia is N72º and N80º for the models DEOS2K (Fernandes et al.,
2003) and REVEL (Sella et al., 2002), respectively. These are based solely on GPS
observations and should be used as a reference for present-day motions.
The displacement vectors obtained by the elastic modelling of a set of rectangular
sources, performed in chapter VII, has shown a natural agreement with the expected
opening normal to the Faial fissural system. However this opening direction is oblique
when compared to Eu-Af(Nub) expectable direction (between ca. 35º and 50º) and,
furthermore the expectable right lateral component across this plate boundary is
missing. A similar result was obtained by (Lourenço et al., 1998) which showed that
traction vector averages calculated from focal mechanisms parallel to the Faial graben
directions, have an obliquity between ca 48 and 58º, when compared with kinematic
models describing the behaviour of this plate boundary. Other LVR in this sector like S.
Jorge, or the Serreta ridge seem to present a similar discrepancy given their WNW-ESE
strikes.
A possible interpretation for these apparently contradictory observations is to assume a
partitioning in space and time of Nuvel 1A spreading vectors and in two main
components (see Figure XI.2): one of pure traction (rifting stage) and one dominated by
shear (tectonic rotation stage).
Rifting events are magmatic dominated and related with dyke emplacement along LVR
axis and characterized, as constrained by the Capelinhos eruption model by extension
normal to the LVR axis. These spreading events trigger nearly pure dip-slip faulting in
218
Tectono-Magmatic Processes in the Azores Triple Junction
crustal sections along dyke strike, laterally adjacent and roofing the dyke emplacement
and possible fissural type eruptions on the surface. Generalizing the Capelinhos eruption
geodetical observations, we can therefore consider the dyke emplacement process and
the corresponding growth of the LVR as a type I magma filled crack propagation. For
example, the graben in the western tip of S. Jorge Island can represent the crack tip
process zone and tip depression, typical of this structures. In this regard, growth of the
Islands would be intrinsically more dependent of internal magma pressure distributions
and of magma migration paths across pre-existing zones of weakness during dyke
emplacement process than of the external regional stress field.
Shear stages would be characterized by left lateral strike slip faulting along N150º fault
planes like those which characterize the major Faial and Angra do Heroismo
earthquakes, and also along the WSW-ENE faulting directions, in this case acting as
probable relay zones with mixed right lateral strike slip and dip-slip displacements.
Furthermore, if they are disrupted by slip along N150 faults, than opening as tension
cracks or as normal faults is favoured. This might translate the mechanism and
distribution of the aftershocks of the Faial 1998 earthquake.
This two modes of tectono-magmatic strain accommodation would characterize the
distributed deformation nature of the interplate zone (roughly LVR sector 1) adjoining
the Terceira axis and Faial-Pico axis (Figure IX.3). The stress field prevailing in this
area would than be right lateral transtensional, with maximum compressive stress
horizontal and sub-parallel to the LVR. This regime, and the non-coaxialiality of
deformation, can induce strain partitioning as observed at times in Terceira Island field
studies.
219
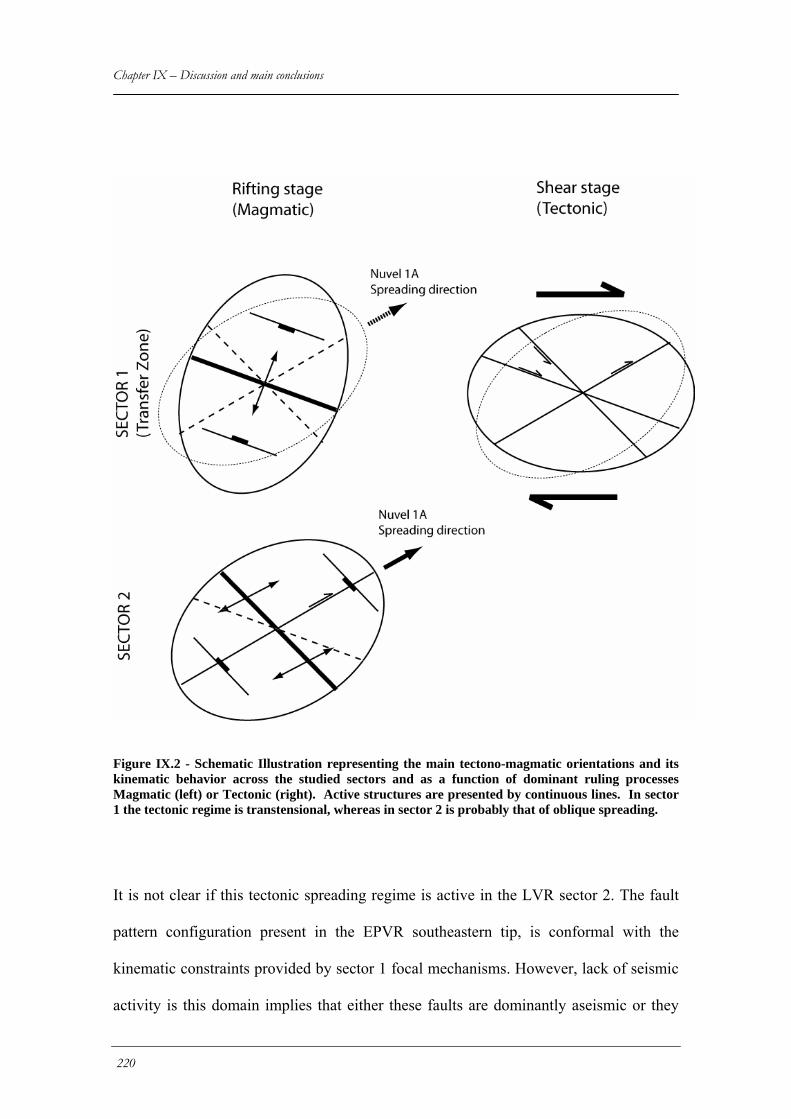
Chapter IX – Discussion and main conclusions
Figure IX.2 - Schematic Illustration representing the main tectono-magmatic orientations and its kinematic behavior across the studied sectors and as a function of dominant ruling processes Magmatic (left) or Tectonic (right). Active structures are presented by continuous lines. In sector 1 the tectonic regime is transtensional, whereas in sector 2 is probably that of oblique spreading.
It is not clear if this tectonic spreading regime is active in the LVR sector 2. The fault
pattern configuration present in the EPVR southeastern tip, is conformal with the
kinematic constraints provided by sector 1 focal mechanisms. However, lack of seismic
activity is this domain implies that either these faults are dominantly aseismic or they
220
Tectono-Magmatic Processes in the Azores Triple Junction
are becoming inactive and that LVR are being progressively abandoned as failed rifts.
Consequently, in this sector, extension seems to be focalizing within the Terceira axis
itself. The faulting pattern in the SETVR, despite having strike which is sub-parallel to
left lateral rupture of Angra do Heroismo earthquake, is more consistent with oblique
right lateral extensional regime. This imposes that the stress regime changes accordingly
and is characterized by a maximum compressive stress sub-vertical and minimum
compressive stress sub-horizontal and sub-parallel to the spreading directions predicted
by Nuvel-1A or GPS based kinematic models (e.g. Revel and Deos2k), therefore
characterized by coaxial deformation.
This focalized plate boundary domain fits between two other faulting domains defined
by Ribeiro (2002) along the Terceira axis. This author suggests a relation exists between
the lithosphere state of stress off axis with the response of faulting in each domain on
axis (cf. Figure 4.9, pg 193 from Ribeiro et al., 2002). East of the area here studied in
more detail, in S. Miguel Island and its vicinities, right lateral strike slip faults are
reported by this author, striking N150º, probably related with the intersection of this
segment with the Gloria Fault.
The transition from distributed transtension to focalized oblique extension is defined by
a set of morphological setps between LVR 1 and LVR2 sectors here interpreted as
tectonic faults which are acting as tranfer zones between both domains and which
strikes are parallel to Nuvel1A spreading directions (i.e WSW-ENE).
221
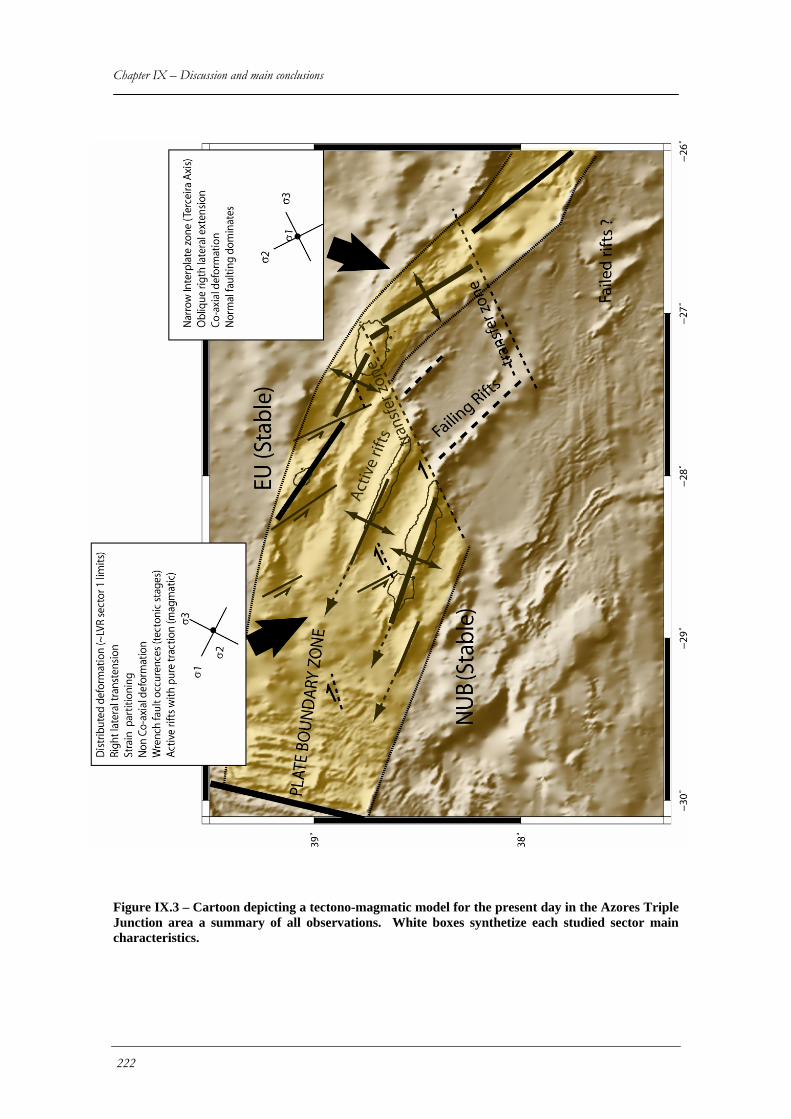
Chapter IX – Discussion and main conclusions
Figure IX.3 – Cartoon depicting a tectono-magmatic model for the present day in the Azores Triple Junction area a summary of all observations. White boxes synthetize each studied sector main characteristics.
222
Tectono-Magmatic Processes in the Azores Triple Junction
IX.3 Future Research
A great deal of work needs to be performed to refine and improve the knowledge we
have been gaining in the Azores domain in the past few years. The main problem in
Azores interpretations is the almost absolute lack of knowledge on boundary conditions,
notably, its thermal structure in depth, and the still limited data we have on the Azores
plateau bathymetry itself. In my point of view future efforts in Azores research,
considering each scientific domain should be :
Geodesy:
Continuing the inter-Island and intra-Island GPS observation efforts, which have been
performed in the framework of TANGO and STAMINA projects, and increment intra-
Island networks, would consolidate GPS interpretation by lengthening the time series in
this geodynamic context and provide an additional tool to constrain how the far-field
displacement vectors are partitioning within each Island complex volcano-tectonic
architecture therefore constraining its crustal deformation.
Geophysics:
Our ability to perform a detailed analysis of the processes which act and shape the
Azores is undermined by inexistence of a proper bathymetric basemap. A continued
effort to collect swath bathymetry in this domain is crucial to allow clearer answers and
as a ground to evaluate the third and fourth dimensions (i.e. depth and time).
Heat flow measurements within some of the Terceira axis basins would help clarify in
what extent is the Azores truly a rift system or otherwise a fully developed spreading
center. Determining the structure of the basins with reflection/refraction studies would
223
Chapter IX – Discussion and main conclusions also provide more constraints for the gravimetric modelling as well as provide tectonic
constraints on its role in Terceira axis dynamics. Refinement of the seismic catalogue,
namely in what deals with azimuthal coverage, and better definition of hypocentral
distribution would also favour analysis and tectonic interpretations.
Geology:
Direct seafloor observations by submersible or ROV as well as sampling of the basins
walls would help define a clear crustal structure for this particular case of hyper-slow
plate boundary.
Following Vogt and Jung, 2003, one of the basins within the Terceira axis, should be a
target for an ODP drilling site, as an enormous amount of information could be
retrieved from such an initiative. It would allow determination of the age of the basins
and hence of the Terceira axis, their detailed structure, and the way hyper-slow crustal
construction is achieved.
Isotopic Dating of seafloor monogenic volcanism and samples of the base of the LVR
would help to constrain the Azores temporal evolution.
Analogue and Numerical Modelling:
Some insights on LVR development and the physical properties of Azores lithosphere
and thermal structure could be gained by numerical modelling of the LVR growth,
namely the suggestion that these structures are propagating westwards either as newly
formed cracks or by reactivation of pre-existing fracture zones.
224
Tectono-Magmatic Processes in the Azores Triple Junction
X - Cited References
Altamimi, Z., Sillard, P., Boucher, C., (2002). ITRF2000: A new release of the International Terrestrial Reference Frame for earth Science applications. J. Geophys. Res. B10, doi:10.1029/2001JB000561.
Anderson, D.L. (2001). Top-down tectonics? Science 293, 2016-2018.
Anderson, D.L. (2002). Plate tectonics as a far- from- equilibrium self-organized system. In: Stein S., Freymuller J. (Eds.), AGU Monograph: Plate Boundary Zone, Geodynamics Series 30, 411-425.
Angelier, J. and Mechler P. (1977). Sur une méthode graphique de recherche des contraintes principales également utilisable en tectonique et en séismologie: la méthode des diedres droits. Bull.. Sóc. Geol Fr:, 7, 6: 1309-1318.
Bastos, L., Osório, J., Barbeito, A., Hein, G. (1998). Results from geodetic measurements in the western part of the African-Eurasian plate boundary. Tectonophysics 294, 261-269.
Behn, M.D., Lin, J and Zuber, M. (2002). Evidence of weak oceanic transform faults. Geophys. Res. Lett., v. 29, n 24, 2207, doi: 10.1029/2002GL015612
Beier, C. (2006). The magmatic evolution of oceanic plateaus: a case study from the Azores. PhD thesis, Kiel University, 175 pg.
Bird, R.T., Naar, D.F., Larson, R.L., Searle, R.C., and C.R. Scotese (1998). Plate tectonic reconstructions of the Juan Fernandez microplate: Transformation from internal shear to rigid rotation, J. Geophys. Res., v. 103, no. B4, p. 7049-7067.
Bird, R.T., S.F. Tebbens, M.C. Kleinrock and D.F. Naar (1999). Episodic triple junction migration by rift propagation and microplates, Geology 27, 911-914.
225
X – Cited References
Bonatti, E. (1990). Not so hot .hot spots. in the oceanic mantle, Science, 250, (4977), 107-111.
Bonnin, J. (1978). Évolution géodynamique de la ligne Acores-Gibraltar. Ph.D. Dissertation. Universite Paris VII, Paris 144pp.
Bougault, H., and Cande, S. C. (1985) Background, objectives and summary of principal results: Deep sea drilling project sites 556–564, Initial Rep. Deep Sea Drill. Proj., 82, 5–16.
Bourdon, B., Zindler, A., Elliott, T., Langmuir, C.H. (1996). Constraints on mantle melting at mid-ocean ridges from global 238Ur230Th disequilibria data. Nature 384, 231–235.
Briais A., and M. Rabinowicz (2002). Temporal variations of the segmentation of slow to intermediate spreading mid-ocean ridges, 1, Synoptic observations based on satellite altimetry data, J. Geophys. Res., 107 (B5), doi:10.1029/2001JB000533.
Briole, P., De Natale, G., Gaulon, R., Pingue, F., Scarpa, R. (1986). Inversion of geodetic data and seismicity associated with the Friuli earthquake sequence (1976–1977). Ann. Geophys. 4, 481–492.
Buforn E., Udias A., Colombas M. (1988). “Seismicity source of the mechanisms and tectonics of the Azores-Gibraltar plate boundary”. Tectonophysics, 152, 89-118.
Byerlee, J. D. (1990). Friction, overpressure and fault normal compression. Geophys. Res. Lett. 17, 2109-2112.
Calvert, A., Moore T., Richard B., McGeehin J. P., Rodrigues da Silva A. M. (2006). Volcanic history and 40Ar/39Ar and 14C geochronology of Terceira Island, Azores, Portugal. J. Volc. Geotherm. Res. V156, 1-2,103-115.
Cande, S.C. and Kent, D.V. (1995), Revised calibration of the geomagnetic polarity timescale for the late Cretaceous and Cenozoic. J. Geophys. Res., 100, 6,093-6,095.
Cannat, M., Briais, A., Deplus, C., Escartin, J., Georgen, J., Lin, J., Mercouriev, S., Meyzen, C., Muller, M., Pouliquen, G., Rabain, A. and da Silva, P. (1999). Mid-Atlantic Ridge-Azores hotspot interactions: along-axis migration of a hotspot-derived event of enhanced magmatism 10 to 3 Ma ago. Earth Planet. Sci. Lett., 173(3): 257-269.
226
Tectono-Magmatic Processes in the Azores Triple Junction
Carbotte, S.M., Macdonald, K.C. (1994). Comparison of seafloor tectonic fabric at intermediate, fast and super fast spreading ridges: Influence of spreading rate, plate motions, and ridge segmentation on fault patterns. J. Geophys. Res. 99, B7, 13609-13631.
Castello-Branco, A., Zbyszewski, G., Moitinho de Almeida, F., da Veiga Ferreira, O. (1959). Rapport de la Premiere mission Geologique. Serv. Geol. Port. Mem. 4, 9–27.
Catalão, J., Miranda J. M., Lourenço N. (2006). Deformation associated with the Faial (Capelinhos) 1957-58 Eruption. Inferences from 1937-1997 geodetic measurements. J. Volc. Geotherm. Res. v155, Issues 3-4 , 15 July 2006, Pages 151-163.
Campan, A. (1995). Analyse cinématique de l’Atlantique équatorial: Implications sur l’évolution de l’Atlantique sud et sur la frontière des plaques Amérique du nord/Amérique du sud, thèse de doctorat, 352 pp., Univ. Pierre et Marie Curie (Paris VI), Paris.
Chapple, W.M., Tullis, T.E. (1977). Evaluation of forces that drive the plates. J. Geophys. Res. 82, 1967-1984.
Collette, B.J. (1974). Thermal contraction joints in a spreading floor as origin of fracture zones. Nature 251, 299-300.
Courtillot, V., Davaille, A., Besse, J., and Stock, J. (2003). Three distinct types of hotspots in the Earth’s mantle. Earth Planet. Sci Lett., 205, 295-308.
Cox, A. (1973). Introduction. In: Cox, A. (ed.), Plate tectonics and geomagnetic reversals. W. H. Freeman and Co., New York, p. 40-47.
Cox, A., Hart, R.B. (1986). Plate tectonics: how it works. Blackwell Scientific Publications, Palo Alto, 389 pp.
Cronin, V.S., (1992). Types and kinematic stability of triple junctions. Tectonophysics 207 (3–4), 287–301.
Dauteuil O., Bourgeois O., Mauduit T. (2002). Lithosphere strength controls oceanic transform zone structure: insights from analogue models. Geophys. J. Int. 150, 706-714.
227
X – Cited References
Dauteuil, O., Brun, J.-P. (1993). Oblique rifting in a slow-spreading ridge. Nature 361, 145-148.
Davies, G.F., Richards, M. A. (1992). Mantle convection. Journal of Geology 100, 151-206.
DeMets, C., Gordon, R., Argus, D., Stein, S. (1994). Effect of recent revisions to the geomagnetic reversal time scale on estimates of current plate motions. Geophys. Res. Lett. 21, 2191-2194.
Detrick, B., Needham, H.D., Renard, V. (1995). Gravity anomalies and crustal thickness variations along the Mid-Atlantic Ridge between 10ºN and 40ºN. J. Geophys. Res. 100, 3767-3778.
Dias, N. A. (2006). "Estudo da sequência sísmica gerada pelo sismo do Faial de 9 de Julho de 1998: anisotropia crustal, inversão tomográfica e caracterização sismo-tectónica", PhD thesis, University of Lisbon.
Dosso, L., H. Bougault, C. Langmuir, C. Bollinger, O. Bonnier, and J. Etoubleau, (1999). The age and distribution of mantle heterogeneity along the Mid-Atlantic Ridge (31 –41 degrees N), Earth Planet. Sci. Lett., 170, 269–286.
Dziak, R. P., Bohnensteihl, D. R., Matsumoto, H., Fox, C. G., Smith, D. K., Tolstoy, M., Haxel, J., Fowler, M. (2004). P- and T-wave detection thresholds, Pn velocity estimate, and detection of lower mantle and core P-waves on Ocean Sound-Channel Hydrophones at the Mid-Atlantic Ridge. Bull Seism Soc. Am.
Edwards, M.H., Fornari, D.J., Malinverno, A, Ryan, B. F. (1991). The regional tectonic fabric of the East Pacific Rise from 12º50’N to 15º10’N. J. Geophys. Res. 96, 7995-8017.
Escartin, J., G. Hirth, and B. Evans (1997). Nondilatant brittle deformation of serpentinites: implications for the Mohr-Coulomb theory and the strength of faults. Journal of Geophysical Research, 102,2897-2913.
Escartin, J. M. Cannat; G. Pouliquen; A. Rabain and J. Lin. (2001). Constraints on the interaction between the Mid-Atlantic Ridge and the Azores hotspot from bathymetry and gravity (36-39N), J. Geophys. Res., 106, 21719-21736.
228
Tectono-Magmatic Processes in the Azores Triple Junction
Escartín, J., G. Hirth, and B. Evans (2001b) Strength and mode of deformation of partially serpentinized peridotites: implications for the rheology and tectonics of oceanic lithosphere, Geology, 29, 11, 1023-1026.
Favela, J., Anderson, D. (2000). Extensional tectonics and global volcanism. In: Boschi, E., Ekstrom, G., Morelli, A (Eds.), Problems in geophysics for the New Millennium. Editrice Compositori, Bologna, p. 463-498.
Fernandes, R.M.S., Simons, W., Ambrosius, B., Bastos, L., June (2000). Análise de diferentes metodologias no processamento de campanhas GPS. In: Actas da II Conferência Nacional de Cartografia e Geodesia. IPCC, Luso, Portugal, pp. 92-99.
Fernandes, R.M.S., Miranda, J., Catalão, J., Luis, J., Bastos, L., Ambrosius, B. (2002). Coseismic Displacements of the MW=6.1, July 9, 1998, Faial Earthquake (Azores, North Atlantic). Geophys. Res. Lett. 29 (16), doi:10.1029/2001GL014415.
Fernandes, R.M.S., B.A.C. Ambrosius, R. Noomen, L. Bastos, M.J.R. Wortel, W. Spakman, and R. Govers. (2003). The relative motion between Africa and Eurasia as derived from ITRF2000 and GPS data, Geophys. Res. Lett., 30(16), 1828, doi:10.1029/2003GL017089.
Fernandes, R.M.S., L. Bastos, B. A. C. Ambrosius, R. Noomen, S. Matheussen, and P. Baptista, (2004). Recent geodetic results in the Azores Triple Junction region, Pure and Applied Geophysics, 161 (3), 683-699, doi:10.1007/s00024-003-2469-y.
Fernandes, R.M.S., L. Bastos, J.M. Miranda, N. Lourenço, B.A.C. Ambrosius, R. Noomen, W. Simons (2006). Defining the Plate Boundaries in the Azores Region. J. Volc. Geotherm. Res., 156, 1-9.
Féraud, G., Kaneoka, I. and Allegre, C.J. (1980). K-Ar Ages and Stress Pattern in the Azores - Geodynamic Implications. Earth Planet. Sci Lett., 46(2): 275-286.
Forsyth, D.W., Uyeda, S. (1975). On the relative importance of the driving forces of plate motion. Geophysical Journal of the Royal Astronomical Society 43, 163-200.
Fox, P.J., Gallo, D.G. (1984). A tectonic model for Ridge-Transform-Ridge plate boundaries: implications for the structure of oceanic lithosphere. Tectonophysics 104, 205–242.
229
X – Cited References
Fox, P.J., Gallo, D.G. (1986). The Geology of North Atlantic transform plate boundaries and their aseismic extensions. In: Tucholke, B.E., Vogt, P.R. (Eds.), The Western North Atlantic Region. Geological Society of America, vol. M, pp. 157-172.
Fox, C.G., H. Matsumoto, and T.-K.A. Lau (2001): Monitoring Pacific Ocean seismicity from an autonomous hydrophone array. J. Geophys. Res., 106(B3), 4183–4206.
Galdeano, A., Moreau, M.G., Pozzi, J.P., Berthou, P.Y., and Malod, J.A. (1989). New paleomagnetic results from Cretaceous sediments near Lisboa (Portugal) and implications for the rotation of Iberia. Earth Planet. Sci. Lett., 92:95–106.
Gaspar, J.L., Queiroz, G., Pacheco, J.M., Ferreira, T., Wallenstein, N., Almeida, M.H., Coutinho, R. (2003) - Basaltic lava balloons produced during the 1998-2001 Serreta Submarine Ridge eruption (Azores). In: Subaqueous Explosive Volcanism, White, J., Clague, D., Smellie, J. (Eds.), American Geophysical Union, Geophysical Monograph 140, 205-212.
Gente P., Dyment, J., Maia, M., Goslin, J. (2003). Interaction between the Mid-Atlantic Ridge and the Azores hot spot during the last 85 Myr: Emplacement and rifting of the hot spot-derived plateaus, Geochemistry Geophysics Geosystystems 4 (10), 8514 doi:10.1029/2003GC000527
Goslin, J., J.-L. Thirot, O. Noel, and J. Francheteau, (1998). Slow-ridge/hotspot interactions from global gravity, seismic tomography and 87Sr/86Sr isotope data, Geophys. J. Int., 135, 700–710.
Goslin, J. & the TRIATNORD Scientific Party (1999). Extent of Azores plume influence on the Mid-Atlantic Ridge north of the hotspot. Geology, 27, 991-994.
Goslin, J., Lourenço, N., Dziak, R., Bohnenstiehl D. R., Haxel , J. and Luis J. (2004). Long-term seismicity of the Reykjanes Ridge (North Atlantic) recorded by a regional hydrophone array. Geophys. J. Int. 162,2, pg 516 DOI 10.1111/j.1365-246X2005.02678.
Goslin, J. and the SIRENA Team: Bazin, S., Dziak, R.P., Fox, C.G., Fowler, M., Haxel, J., Lourenço, N., Luis, J., Martin, C., Perrot, J. & Royer, J.Y.,2004. Longterm seismicity of Northern 15°N60 °N) MidAtlantic Ridge (MAR) recorded by regional autonomous hydrophones arrays: a widespread alongridge influence of the Azores and Iceland hotspots. AGU Fall Meeting. San Francisco, 1014.
230
Tectono-Magmatic Processes in the Azores Triple Junction
Grimison N. L., Chen W. (1986). “The Azores Gibraltar plate boundary: focal mechanisms, depths of earthquakes and their tectcmics implications”. J. Geophys, Res., 92, 2029-2047.
Grindlay, N. R., Fox, P.J. (1993). Lithospheric stresses associated with nontransform offsets of the Mid-Atlantic Ridge: implications from finite element analysis. Tectonics, 12, 982-1003.
Grindlay, N.R., Fox, P. J., Macdonald, K.C. (1991). Second-order ridge axis discontinuities in the South Atlantic: morphology, structure and evolution. Mar. Geophys. Res. 13, 21-49.
Gudmundsson, A. (1995). Stress fields associated with oceanic transform faults. Earth Planet. Sci. Lett. 136, 603-614.
Guest, J.E., J.L. Gaspar, P.D. Cole, G. Queiroz, A.M., Duncan, N. Wallenstein, T. Ferreira e J.-M. Pacheco, (1999). Volcanic Geology of Furnas Volcano, São Miguel, Azores. J. Volc. Geotherm. Res. 92 (1-2); 1-29.
Harðarson, B.S., Fitton, J.G., Ellam, R.M. and Pringle, M.S. (1997). Rift relocation - a geochemical and geochronological investigation of a paleo-rift in NW Iceland. Earth Planet. Sci. Lett., 153, 181-196.
Hey, R.N., Johnson, P.D., Martinez, F., Korenaga, J., Somers, M.L., Hugget, Q.J., LeBas, T.P., Rusby, R.I., Naar, D.F. (1995). Plate boundary reorganisation at a large-offset, rapidly propagating rift. Nature 378, 167-170.
Hirn, A., Haessler, H., Tronc, P. H., Wittlinger, G., Victor, L. M., (1980). Aftershock sequence of the January 1, 1980, earthquake and present-day tectonics in the Azores. Geophys. Res. Lett. 7, 501-504.
Hirth, G., J. Escartín, and J. Lin (1998). The rheology of the lower oceanic crust: implications for lithospheric deformation at mid-ocean ridges, in: Faulting and Magmatism at Mid-Ocean ridges, Eds. Buck et al., AGU Monograph, 291-303.
Hossack, J.R. (1983). A cross section through the Scandinavian Caledonides constructed with the aid of branch-line maps. Journal of Structural Gepology. 5, 2, 103-111.
231
X – Cited References
Ito, G. and J. Lin, (1995). Oceanic spreading center-hot spot interactions: Constraints from along-isochron bathymetric and gravity anomalies, Geology, 23, 657-660.
Ito, G., Lin, J., Graham, D. (2003). Observational and theoretical studies of the dynamics of mantle plume-Mid Ocean Ridge Interaction. Reviews of Geophysics, 41, 4, 1017-2003. doi:10.1029/2002RG000117.
Klitgord, K., Schouten, H. (1986). Plate kinematics of the Central Atlantic. In: Vogt, P.R., Tucholke, B.E. (Eds.), The Geology of North America. vol. M. The Western North Atlantic Region. Geological Society of America, pp. 351-378.
Krause, D. C., Watkins, N. D. (1970). North Atlantic crustal genesis in the vicinity of the Azores. Geophys. J. R. astr. Soc. 19, 261-283.
Ligi M and the AZORRE99 Team. (1999). Giant Volcanic Ridges Amongst the Azores Islands”. AGU Fall Metting.
Lourenço, N., Miranda, J., Luis, J., Ribeiro, A., Mendes-Victor, L., Madeira, J., Needham, H., (1998). Morpho-tectonic analysis of the Azores Volcanic Plateau from a new bathymetric compilation of the area. Marine Geophys. Res. 20, 141-156.
Lourenço N., J.M. Miranda; J. Luís, I. Silva , J. Goslin And M. Ligi. (2003). High Resolution Bathymetric And Sonar Images of a Ridge Southeast of Terceira Island (Azores Plateau). Geophysical Research Abstracts, Vol. 5, 12602.
Luis. J. F. (2006 in press). Mirone: A multi-purpose tool for exploring grid data. Accepted for publication in Computers & GeoSciences.
Luis, J. F. and Neves, M. C. (2006) The isostatic compensation of the Azores Plateau: a 3D admittance and coherence analysis. J. Volc. Geotherm Res., v156, Issues 1-2 , Pages 10-22.
Luis J. F., N. Lourenço, J. M. Miranda, J. L.Gaspar and G. Queiroz. (1999). A Submarine Eruption west of Terceira Island (Azores Archipelago). Interridge News. Vol 8: Nº1: 13-14.
Luis, J. F., Miranda, J., Galdeano, A., Patriat, P., (1998). Contraints on the structure of the Azores spreading center from gravity data. Mar. Geophys. Res. 20, 157-170.
232
Tectono-Magmatic Processes in the Azores Triple Junction
Luis, J. F., Miranda, J., Galdeano, A., Patriat, P., Rossignol, J., Mendes-Victor, L. (1994). The Azores Triple Junction evolution since 10ma from an aeromagnetic survey of the Mid-Atlantic ridge. Earth and Planet. Sci. Lett. 125, 439-459.
Luis, J.F., (1996). Le Plateau des Açores et le Point Triple Associé: Analyse Géophysique et Evolution, Ph.D. Thesis, Paris VII, Paris.
Macdonald, K.C. (1986). The crest of the Mid-Atlantic Ridge: models for the crustal generation processes and tectonics. In: Vogt, P.R., Tucholke, B.E. (Eds.), The Geology of North America. The Western North Atlantic Region. Geological Society of America, vol. M, pp. 51-66.
Macdonald, K.C. (1988). A new view of the mid-ocean ridge from the behaviour of ridge-axis discontinuities. Nature 335, 217-225.
Machado, F. (1957). Caldeiras Vulcânicas dos Açores. Atlântida, 1(5); 275-278.
Machado, F. (1958a). Actividade Vulcânica da Ilha do Faial (Sept. To Dec. 1957). Atlantida 2, 225–236.
Machado, F. (1958b). Actividade Vulcânica da Ilha do Faial (Jan. to April 1957). Atlantida 2, 305–315.
Machado, F. (1959a). Actividade Vulcânica da Ilha do Faial (May to Aug. 1958). Atlantida 3, 40–55.
Machado, F. (1959b). Actividade Vulcânica da Ilha do Faial (Sept. To Oct.. 1958). Atlantida 3, 153–159.
Machado, F., Nascimento, J.M., Denis, A.F. (1959). Evolução Topografica do cone Vulcanico dos Capelinhos. Le Volcanisme de l' ile de Faial. Serv. Geol. Portugal, Mem., vol. 4, pp. 65–71.
Machado, F., Parsons, W., Richards, A., Mulford, J.W. (1962). Capelinhos eruption of Fayal Volcano, Azores, 1957–1958. J. Geophys. Res. 67 (9), 3519–3529.
Madeira, J., Ribeiro, A. (1990). Geodynamic models for the Azores Triple Junction: a contribution from tectonics. Tectonophysics 184, 405-415.
233
X – Cited References
Madureira, P, Moreira, M., Mata, J., Allegre, J. C. (2005). Primitive helium and neon isotopes in Terceira island (Azores archipelago). Earth Planet. Sci. Lett, 233, 429-440.
Mart, Y., Dauteuil, O. (2000). Analogue experiments of propagation of oblique rifts. Tectonophysics 316, 121-132.
Matias, L., Dias, N.A., Morais, I., Vales, D., Carrilho, F., Madeira, J., Gaspar, J.L., Senos, L. and Silveira, A.B., (in press, 2006). Characterization of the seismic sequence triggered by the 9th of July, 1998, earthquake near Faial (Azores). J. Seismology.
Mauduit, T. & Dauteuil, O. (1996a). Small-scale models of oceanic transform zones. J. Geophys. Res., 101, 20195-20209.
Mauduit, T., Dauteuil O. (1996b). Fault patterns of oceanic transform zones: analog modeling. J. Geophys. Res. 101, B9, 20195-20209.
McKenzie, D. P. (1972). Active tectonics of the Mediterranean region. Geophys. J. R. Astron. Soc. 30, 109-185.
Mitchell, N. C., Scmitt, T., Isidro, E., Tempera, F., Cardigos, F., Nunes, J. C., Figueiredo, J. (1994). Multibeam sonar survey of the central Azores volcanic islands, Interridge news, v 13, 18-20.
Miranda J. M., J. Freire Luis, I. Abreu, L. A. Mendes Victor, A. Galdeano, J. C. Rossignol (1991). Tectonic Framework of the Açores Triple Junction, Geophys, Res. Lett., v 18, n.8, p 1421-1424.
Miranda, J., Victor, L. M., Simões, J., Luis, J., Matias, L., Shimamura, H., Shiobara, H., Nemoto, H., Mochizuki, H., Hirn, A., Lépine, J. (1998). Tectonic setting of the Azores Plateau deduced from a OBS survey. Mar. Geophys. Res. 20, 171-182.
Mitchell, N. C., and R. A. Livermore (1998). The present configuration of the Bouvet triple junction, Geology, 26, 267-270.
Mittelstaedt, E., Ito, G. (2005). Plume-ridge interaction, lithospheric stresses and the origin of near-ridge volcanic lineaments. Geoch. Geophys. Geosys. , 6, 6, 1-20. Doi: 10.1029/2004GC000860.
234
Tectono-Magmatic Processes in the Azores Triple Junction
Molnar, P. (1988). Continental tectonics in the aftermath of plate tectonics. Nature, 385, 131-137.
Montelli, R, Nolet G, Dahlen, F, Masters G, Engdahl, E and Hung, S. (2004). Finite-frequency tomography reveals a variety of mantle plumes, Science, Vol. 303, p. 338-343.
Moreira, M., R. Doucelande, M. D. Kurz, B. Dupré, and C. J.Allègre (1999). Helium and lead isotope geochemistry of the Azores archipelago, Earth Planet. Sci. Lett., 169, 189–205.
Mourgues, R., Cobbold, P. R. (2003). Some tectonic consequences of fluid pressures and seepage forces as demonstrated by sandbox modelling. Tectonophysics, 376, 75-97.
Müller, R.D., Roest, W.R. and Royer, J.-Y. (1998). Asymmetric seafloor spreading expresses ridge-plume interactions, Nature, 396, 455-459.
Naar, D.F., and R.N. Hey (1991). Tectonic evolution of the Easter microplate, J. Geophys. Res. 96, 7961-7993.
Navarro A, Catalao J, Miranda JM, Fernandes RM. (2003). "Estimation of the Terceira Island (Azores) main strain rates from GPS data". Earth Planets and Space, 55 (10): 637-642.
Nunes, J.C. (2000) Estudo geológico da depressão vulcânica de São Sebastião (Ilha Terceira, Açores) e área envolvente. Project PPERCAS-Azores University Report, Vol. 1/2000. Ponta Delgada, Portugal.
O’Bryan, J.W., Cohen, R., Gilliland, W.N. (1975). Experimental origin of transform faults and striated spreading-center segments. Geological Society of America Bulletin 86, 793-796.
Okada Y., (1985). Surface deformation due to shear and tensile faults in a half space, Bull. Seism. Soc. Am. 75, 1135-1154.
Oldenburg, D.W., Brune, J.N. (1972). Ridge transform fault spreading pattern in freezing wax. Science 178, 301-304.
Oldenburg, D.W., Brune, J.N. (1975). An explanation for the orthogonality of ocean ridges and transform faults. J. Geophys. Res. 80, 2575-2585.
235
X – Cited References
Olivet, J.L., Bonnin, J., Beuzart, P., and Auzende, J.M., (1984). Cinématique de l'Atlantique nord et central. Publ. Cent. Natl Exploit. Oceans, Rapp. Sci. Tech., 54:108–112.
Ortner, H., Reiter, F., Acs, P. (2002). Easy handling of tectonic data: the programs TectonicVB for Mac and TectonicsFP for Windows (TM). Computers and Geosciences 28, 1193–1200.
Parsons, T. (2002). Nearly frictionless faulting by unclamping in long-term interaction models. Geology 30, 1063-1066.
Rabinowicz M., and A. Briais, (2002). Temporal variations of the segmentation of slow to intermediate spreading mid-ocean ridges 2. A three-dimensional model in terms of lithosphere accretion and convection within the partially molten mantle beneath the ridge axis, J. Geophys. Res., 107 (B6), doi:10.1029/2001JB000343.
Ragnarsson, R., Ford, J.L., Santangelo, C.D., Bodenschatz, E. (1996). Rifts in spreading wax layers. Physical Review Letters 76, 3456.
Ribeiro, A. (2002). Soft Plate and Impact Tectonics. Springer-Verlag 324 p.
Richter, F.M. (1977). On the driving mechanism of plate tectonics. Tectonophysics 38, 61-88.
Ritsema, J., Van Heijt, H.J. & Woodhouse, J.H. (1999). Complex shear wave velocity structure imaged beneath Africa and Iceland. Science, 286, 1925-1928.
Roest, W.R., and Srivastava, S.P. (1991). Kinematics of the plate boundaries between Eurasia, Iberia and Africa in the North Atlantic from the late Cretaceous to present. Geology, 19:613–616.
Rusby, R. and Searle, R. (1995). A history of the Easter microplate, 5.25 Ma to present. J. Geophys. Res. 100(B7): doi: 10.1029/94JB02779.
Schilling, J-G., (1975). Azores mantle blob: rare-earth evidence. Earth Planet. Sci. Lett., 25:103-115.
Schilling, J-G., (1985). Upper mantle heterogeneities and dynamics. Nature, 314, 62-67.
Schilling, J.G., (1991). Fluxes and excess temperatures of mantle plumes inferred from their interaction with migrating mid-ocean ridges, Nature, 352, 397-403.
236
Tectono-Magmatic Processes in the Azores Triple Junction
Scholz, C.H. (1996). Faults without friction? Nature 381, 556-557.
Searle, R.C. (1976). Lithospheric structure of the Azores Plateau from Rayleigh-wave dispersion. Geophys. J. Roy. Astron. Soc. 44; 537-546. 186.
Searle, R. (1980). Tectonics pattern of the Azores spreading centre and triple junction. Earth and Planet. Sci. Lett. 51, 415-434.
Self, S. (1976). The recent volcanology of Terceira, Azores: Journal of the Geological Society of London, v. 132, p. 645-666.
Sella, G., Dixon, T. H., Mao A., (2002). REVEL: a model for recent plate velocities from space geodesy, J. Geophys. Res. 107(B4), 2081, doi:10.1029/2000JB000033.
Shaw, P.R., Lin, J. 1993. Causes and consequences of variations in faulting style at the Mid-Atlantic Ridge. J. Geophys. Res. 98, 1839-21851.
Shemenda, A.I., Grokholsky, A.L. (1991). A formation and evolution of overlapping spreading centres (constrained on the basis of physical modeling). Tectonophysics 199, 389-404.
Shemenda, A.I., Grokholsky, A.L. (1994). Physical modeling of slow spreading ridges. J. Geophys. Res. 99, 9137-9153.
Sibson, R.H. (1994). An assessment of field evidence for 'Byerlee' friction. Pure and Applied Geophysics 142, 645-662.
Silveira, G., Stutzmann, E., Davaille, A., Montagner, J.-P. Mendes-Victor. L. and Sebai, A. (2006). Azores hotspot signature in the upper mantle", J. Volc. Geotherm. Res., 156, 23–34.
Silveira., G. and Stutzmann, E. (2002). Anisotropic Tomography of the Atlantic Ocean. Phys. Earth Planet. Inter. 132, 237.
Silver, P.G., Russo, R.M., Lithgow-Bertelloni, C. (1998). Coupling of South American and African plate motion and plate deformation. Science, 279, 60-63.
Small, C. (1995). Observations of ridge-hotspot interactions in the Southern Ocean, J. Geophys. Res., 100, 17,931–17,946.
237
X – Cited References
Smith, W. H. F. & Sandwell, D. T., (1997). Global sea oor topography from satellite altimetry and ship depth soundings, Science, 277, 1956-1962.
Smith, D.K., J. Escartin, M. Cannat, M. Tolstoy, C.G. Fox, D. R. Bohnenstiehl, S. Bazin (2003). Spatial and temporal distribution of seismicity along the northern Mid-Atlantic Ridge (15-35ºN). J. Geophys. Res., 108, 2167, 10.1029/2002JB001964.
Smith, D.K., Tolstoy, M., Fox, C.G., Bohnenstiehl, D.R., Matsumoto, H. and Fowler, M.J. (2002). Hydroacoustic monitoring of seismicity at the slow-spreading Mid-Atlantic Ridge. Geophys. Res. Lett., 29, 13-1:13-4.
Srivastava, S.P., and Tapscott, C.R., (1986). Plate kinematics of the North Atlantic, in Tucholke, B.E., and Vogt, P.R., eds., The Geology of North America: The Western Atlantic Region, DNAG Series, vol. M, Geol. Soc. of America, pp. 379-404.
Srivastava, S.P., Roest, W.R., Kovacs, L.C., Oakey, G., Levesque, S., Verhoef, J., and Macnab, R., (1990a). Motion of Iberia since the Late Jurassic: results from detailed aeromagnetic measurements in the Newfoundland Basin. Tectonophysics, 184:229-260.
Srivastava, S.P., Schouten, H., Roest, W.R., Klitgord, K.D., Kovacs, L.C., Verhoef, J., and Macnab, R., (1990b). Iberian plate kinematics: a jumping plate boundary between Eurasia and Africa. Nature, 344:756–759.
Stüwe, K. (2002). Geodynamics of the lithosphere: an introduction. Springer-Verlag, 449 pp.
Tentler, T. (2003). Analogue modelling of overlapping spreading centers: insights into their propagation and coalescence. Tectonophysics 376, 99-115.
Thibaud, R., Gente, P. & Maia, M. (1998). A systematic analysis of the Mid-Atlantic Ridge morphology and gravity between 15°N and 40°N : constraints on the thermal structure. J. Geophys. Res., 103, 24223-24243.
Turcotte, D.L. (1974). Are transform faults thermal contraction cracks? J. Geophys. Res. 79, 2573-2577.
Turcotte, D.L., Schubert, G. (1982). Geodynamics. John Wiley and Sons, New York. 450 p.
238
Tectono-Magmatic Processes in the Azores Triple Junction
Verhoef, J., W.R. Roest, R. Macnab, J. Arkani-Hamed, and Members of the Project Team (1996). Magnetic anomalies of the Arctic and North Atlantic Oceans and adjacent land areas, GSC Open file 3125, Geological Survey of Canada, 225 pp., 300 figures.
Vogt, P.R..(1976) Plumes, sub-axial pipe flow, and topography along the mid-oceanic ridge. Earth and Planetary Science Letters, 29, 309-325.
Vogt, P.R., Jung W.Y. (2003) The Terceira Rift as hyper-slow, hotspot dominated oblique spreading axis: A comparison with other slow-spreading plate boundaries, Earth and Planet. Sci. Lett., 218, 77–90, doi:10.1016/S0012–821X(03)00627–7.
Wessel, P., Smith, W. (1991). Free software helps map and display data. Eos Trans. AGU, 72, 441.
Weston, F (1964). List of recorded volcanic eruptions in the Azores with. brief reports, Bol. Mus. Lab. Min. Geol. Fac. Ciencias de Lisboa,. 10, 3–18.
White, W. M., J. G. Schilling, and S. R. Hart (1976). Evidence for the Azores mantle plume from strontium isotopes geochemistry of the central North Atlantic, Nature, 263, 659–663.
Yang, T., Shen, Y., Lee, S., Solomon S.C. and Hung, S.-H. (2006). Upper mantle structure beneath the Azores hotspot from finite-frequency seismic tomography, Earth and Planetary Science Letters, Volume 250, Issues 1-2, , 15, Pages 11-26.
Zbyszewski, G., da Veiga Ferreira, O. (1959). Rapport de la Deuxième mission Géologique. Le Volcanisme de l' ile de Faial. Serv. Geol. Portugal, Mem., vol. 4, pp. 29–55.
Zbyszewski, G., Candido de Medeiros, A., da Veiga Ferreira, O., e Torre de Assuncão, C. (1971). Carta geologica de Portugal na escala de 1/50,000-Ilha Terceira. Servicos Geologicos de Portugal, Lisboa.
Zhang, Y.-S. and T.Tanimoto (1992) Ridges, hotspots and their interpretation as observed in seismic velocity maps, Nature, 355, 45-49.
Zoback, M.D. (1991). State of stress and crustal deformation along weak transform faults. Philosophical Transactions of the Royal Society of London 337, 141-150.
239


