Embed Size (px)
Citation preview
Vol 30 no 1 2014 pages 61ndash70BIOINFORMATICS ORIGINAL PAPER doi101093bioinformaticsbtt597
Structural bioinformatics Advance Access publication October 27 2013
Telling metabolic stories to explore metabolomics data a case
study on the yeast response to cadmium exposurePaulo Vieira Milreu12 Cecilia Coimbra Klein123 Ludovic Cottret4 Vicente Acuna125Etienne Birmele126 Michele Borassi7 Christophe Junot8 Alberto Marchetti-Spaccamela9Andrea Marino10 Leen Stougie11 Fabien Jourdan12 Pierluigi Crescenzi10Vincent Lacroix12 and Marie-France Sagot121INRIA Grenoble Rhone-Alpes amp Universite de Lyon F-69000 Lyon 2Universite Lyon 1 CNRS UMR5558 LBBE France3Laboratorio Nacional de Computacao Cientıfica (LNCC) Petropolis Brazil 4LISBP UMR CNRS 5504 - INRA 792Toulouse France 5Mathomics Center for Mathematical Modeling (UMI-2807 CNRS) and Center for Genome Regulation(Fondap 15090007) University of Chile Santiago Chile 6Lab Statistique et Genome CNRS UMR8071 INRA1152Universite drsquoEvry France 7Scuola Normale Superiore 56126 Pisa Italy 8Laboratoire drsquoEtude du Metabolisme desMedicaments DSViBiTecSSPI CEASaclay 91191 Gif-sur-Yvette France 9La Sapienza University of Rome Rome10Dipartimento di Sistemi e Informatica Universita di Firenze I-50134 Firenze Italy 11VU University and CWIAmsterdam The Netherlands and 12INRA UMR1331 - Toxalim Toulouse France
Associate Editor Alfonso Valencia
ABSTRACT
Motivation The increasing availability of metabolomics data
enables to better understand the metabolic processes involved in
the immediate response of an organism to environmental changes
and stress The data usually come in the form of a list of metabolites
whose concentrations significantly changed under some conditions
and are thus not easy to interpret without being able to precisely
visualize how such metabolites are interconnected
Results We present a method that enables to organize the data
from any metabolomics experiment into metabolic stories Each
story corresponds to a possible scenario explaining the flow of
matter between the metabolites of interest These scenarios may
then be ranked in different ways depending on which interpretation
one wishes to emphasize for the causal link between two affected
metabolites enzyme activation enzyme inhibition or domino effect
on the concentration changes of substrates and products Equally
probable stories under any selected ranking scheme can be further
grouped into a single anthology that summarizes in a unique subnet-
work all equivalently plausible alternative stories An anthology is
simply a union of such stories We detail an application of the
method to the response of yeast to cadmium exposure We use this
system as a proof of concept for our method and we show that we
are able to find a story that reproduces very well the current know-
ledge about the yeast response to cadmium We further show that this
response is mostly based on enzyme activation We also provide a
framework for exploring the alternative pathways or side effects this
local response is expected to have in the rest of the network We
discuss several interpretations for the changes we see and we sug-
gest hypotheses that could in principle be experimentally tested
Noticeably our method requires simple input data and could be
used in a wide variety of applications
Availability and implementation The code for the method
presented in this article is available at httpgobbolinogforgeinriafr
Contact pvmilreugmailcom vincentlacroixuniv-lyon1fr marie-
francesagotinriafr
Supplementary information Supplementary data are available at
Bioinformatics online
Received on June 4 2013 revised on September 19 2013 accepted
on October 14 2013
1 INTRODUCTION
One of the main goals of metabolic studies is to understand the
metabolic processes involved in the adaptation to an environ-
mental change Recently metabolomic techniques gained the
spotlight by providing a way to monitor metabolism by measur-
ing the concentration of metabolites in different conditions or at
different time points A typical result from such an experiment is
a list of metabolites whose concentrations significantly changed
when the cell or organism was exposed to some stress How to
interpret this list became then a new research topic consisting in
identifying the metabolic processes that link the metabolites
of interest possibly explaining the observed variations in their
concentrations This topic goes in the literature by the name
of lsquometabolite set enrichment analysisrsquo and is an extension to
metabolism of work that was initiated in the context of transcrip-
tomics and then proteomics under the name of lsquogene set enrich-
ment analysisrsquo [see (Subramanian et al 2005) for what is
possibly the first work on this and (Khatri et al 2012) for a
recent survey] The simplest idea one may think of is to highlight
the set of metabolites identified in the experiment that have
significantly changed their concentration let us call them discri-
minating compounds and then to visually analyze their intercon-
nections This is what is done notably in Xia et al (2012)
However like a number of other approaches on metabolite set
enrichment analysis the projection of enriched metabolites is
done on pathways instead of the whole network thereby missingTo whom correspondence should be addressed
The Author 2013 Published by Oxford University Press
This is an Open Access article distributed under the terms of the Creative Commons Attribution Non-Commercial License (httpcreativecommonsorglicenses
by-nc30) which permits non-commercial re-use distribution and reproduction in any medium provided the original work is properly cited For commercial
re-use please contact journalspermissionsoupcom
(alternative) pathways not annotated in current databases ormore generally paths traversing several pathwaysFor genome-scale networks the metabolism of a whole organ-
ism is considered which may be large (Thiele and Palsson 2010)whereas a metabolic perturbation caused by some stress condi-tion may impact only a small portion of this complex network
Even if it is sometimes possible to visually identify the pathwaysthat explain some of the variations in the monitored metabolitesgetting an overall explanation for all the observed variations
usually cannot be performed by visual inspectionRecently automatic methods have been proposed to deal with
this kind of data (Antonov et al 2009 Dittrich et al 2008
Faust et al 2010 Leader et al 2011) A natural idea is to tryto link all discriminating compounds through chains of reac-tions One possible model for this is by means of a Steiner
tree which is a minimum cost tree that connects all nodesbelonging to a predefined subset called terminals which in thecase of metabolism would be the discriminating compounds
(Dittrich et al 2008 Scott et al 2005) However any pair ofmetabolites may be connected through several alternative pathswithin a network and each of these paths may validly explain the
observed changes of concentration In this context the extractionof subgraphs appears to be more relevant than the extraction ofsubtrees The number of alternative paths between two metabol-
ites may however be large and restricting the search to allthe shortest or lightest (the weight is given by the sum of theout-degrees of the vertices in the path) paths between pairs of
metabolites seems to be a realistic compromiseThis is the approach followed by (Croes et al 2006 Faust
et al 2010 van Helden et al 2002) where the authors concen-
trate on a pair of discriminating compounds and search for sub-graphs corresponding to source-to-sink paths between them InAntonov et al (2009) this approach is pushed one step further as
the authors consider all pairs of metabolites and unify all theshortest paths this time with a maximum length k In practicethis may lead to large networks (if k is too big) or to disconnected
ones (if k is too small)The aforementionedmethods are based only on the topology of
the network but one could consider different approaches basedon flux distributions over the set of reactions such as elementary
modes (Schuster andHilgetag 1994 Schuster et al 1999) that areminimal subnetworks working at steady state One difficulty in
this case is that flux-based models need stoichiometric values aswell as a definition of the boundaries of the system under analysiswhich are not always simple to identify particularly in the case of
a metabolomics experiment in which the list of discriminatingcompounds does not directly define such boundaries Moreoverflux approaches are focused on reactions and are not designed to
take into account endogenous metabolite concentrations Thevery same metabolites may play different roles in different meta-bolic processes being source in one intermediate in a second and
target in a third one The inability and the unwillingness to tell apriori the role of the discriminating compounds in each scenarioto be proposed is a key factor of our approach we are interested
not only in connecting the discriminating compounds but also inestablishing their individual role for each scenarioOur approach is a subgraph extraction technique in which we
want to find maximal directed acyclic subgraphs (DAGs) whose
set of sources and targets are discriminating compounds We call
such subgraphs metabolic stories or for short simply stories Inpractice for a given set of discriminating compounds thenumber of stories may be large Because we do not have a
clear criterion for choosing which of these stories is the mostrelevant we first aim at enumerating them all In a secondstep we discuss ways to rank them based on how the concentra-
tion of the discriminating compounds is observed to vary in theexperiment This procedure allows a good filter of the solutions
selecting stories that best fit the experimental data
2 MODELS
21 Modeling metabolic stories
In this section we introduce the notion of story and give arationale for its definition Briefly stories are subgraphs that
summarize the flow of matter from a set of source metabolitesto a set of target metabolites The candidates to be the endpoints(sources or targets) of a story should belong to the set of
discriminating compounds To guarantee that stories will haveat least one source and one target we introduce the acyclicity
constraint These two combined constraints lead us to search forDAGs with sources and targets contained in the given set ofdiscriminating compounds Then because there can be several
paths connecting two discriminating compounds and we wantthe story to contain all these alternative paths we impose a con-
straint of maximality that is we search for maximal DAGs inthe sense that alternative pathways between all the nodes shouldbe included if their addition does not create cycles In other
words a DAG is maximal if by adding any arc makes it not aDAG anymore meaning that it contains at least one cycleOur goal is to have an algorithm that enumerates all stories
ie to provide all possible scenarios that explain the observedtransformations Because our focus is on the relation between
discriminating compounds we use a representation of metabolicnetworks focused on metabolites the so-called compound net-work (Lacroix et al 2008) that is a directed graph in which
vertices are compounds and there is an arc from a compoundto another compound if there is a reaction that consumes the firstto produce the second
More formally we introduce a constrained version of the prob-lem of enumerating all maximal DAGs of a graph G(Schwikowski and Speckenmeyer 2002) Let G frac14 ethB [WETHORN be
a directed graph such that B W frac14 We write V frac14 B [WNodes in B are said to be black nodes and correspond to the
discriminating compounds whereas those in W are said to bewhite nodes Let dthornethuTHORN and dethuTHORN denote respectively the in-degree and the out-degree of a node u Node u is called a source
if dthornethuTHORN frac14 0 and dethuTHORN40 and a target if dethuTHORN frac14 0 and dthornethuTHORN40A metabolic story of G is a maximal acyclic subgraph
G0 frac14 ethB [W0E0THORN of G with W
0 W and E0 E and such
that for each node w 2W0 w is neither a source nor a target
red in G0 Maximality means that it is not possible to add other
arcs or nodes without creating cycles or white sources or targetsWe denote by ethGTHORN the set of stories of G
22 Enumerating metabolic stories
A first step of our algorithm to enumerate ethGTHORN is to apply
compression operations on the input graph obtaining a more
62
PVMilreu et al
compact representation which is equivalent in terms of storysets The operations are (i) white source and target removalthat consists in removing iteratively white nodes that are either
sources or targets as such nodes cannot appear in any story(ii) self-loop removal that consists in removing all arcs of theform ethu uTHORN because stories are acyclic such arcs do not appear
in any story (iii) forward and backward bottleneck removal thatconsists in removing a white node v whose out-degree (respect-
ively in-degree) is equal to 1 and directly connecting any pre-decessor (respectively successor) of v to the unique successor(respectively predecessor) of v (without creating multiarcs) Our
preprocessing algorithm consists in applying operations (i) (ii)and (iii) successively until no more white sources and targets
self-loops and bottlenecks are present in the graph We call theresulting graph a compressed networkIn (Acuna et al 2012) we proposed a first method to enu-
merate stories based on a polynomial-time algorithm to computeone story This is briefly recalled in Supplementary Material S1More recently we developed a much faster enumerator for stories
based on a linear-time enumeration algorithm for non-maximalstories (Borassi et al 2013) that allows us to explore the whole
set of solutions even for genome-scale metabolic networks Thisis the enumerator algorithm we use here
23 Scoring function
From a formal point of view there is no qualitative difference
between any two stories In this sense whether a given discrimi-nating compound is a source an intermediate node or a target in
a story is indifferent for the enumeration process as all possiblescenarios satisfying the three properties given by the definitionnamely maximality of paths acyclicity and sourcetarget con-
straint have to be computedHowever in practice the number of stories can be large and
being able to rank them greatly facilitates their analysis To do
this we propose the following score function
sethSTHORN frac14X
xy2S
ethxTHORN ethyTHORN ethx yTHORN
where the score s(S) of a story S is the sum for each blacktransformation xy of the product of the node weights ethxTHORNand ethyTHORN of the nodes x and y times the path weight ethxyTHORNA black transformation is defined as an arc or a simple whitepath between two black nodes A simple white path is a simple
path (ie containing no cycles) composed of only white nodesbetween two black ones The values assigned to the node and
path weights will depend on the data available and are thusperfectly suited for the integration of various omics data Forour analysis we used the topology of the stories and additional
data from the metabolomics experiments as described in moredetail in the Section 3 (see Table 2)
24 Yeast metabolic network
For the analysis of the metabolics experiment (Madalinski et al2008) we used the metabolic reconstruction of Saccharomyces
cerevisiae s288c available in MetExplore (Cottret et al 2010)(the metabolic model was built based on the YeastCyc database)The procedure followed is briefly described in Supplementary
Material S2
3 RESULTS
31 Metabolic stories to analyze metabolomics data
To illustrate how to use our method we concentrate on the study
of the exposition of Scerevisiae to the toxic cadmium (Cd2thorn)reported in Madalinski et al (2008) A widely studied metabolic
pathway in Scerevisiae is the one responsible for glutathione
biosynthesis as it is related to the detoxification process of thecell when exposed to high concentrations of cadmium (Fauchon
et al 2002 Lafaye et al 2005 Madalinski et al 2008) Previous
studies demonstrated that the presence of such a metal in theenvironment has a huge impact in terms of gene expression and
metabolism showing that there is a strong response both at the
metabolomic and proteomic levels Basically glutathione needs
to be produced because it is a thiol metabolite linked to thedetoxification of cadmium through a process called chelation
(Li et al 1997) Plants are the natural biotope of Scerevisiae
and it is known that they are able to tolerate cadmium and othermetals up to 1 of their dry weight which is believed to provide
defense against herbivores and pathogenic microorganisms
(Fauchon et al 2002) This exposition to cadmium in naturalconditions provides a reason for yeast to keep a detoxification
pathway However the biosynthesis of glutathione requires high
quantities of sulfur To save sulfur there is a replacement of
abundant sulfur-rich proteins related to other metabolic pro-cesses by sulfur-depleted isozymes (ie other enzymes that have
the same function) Such is the case for the enzymes pyruvate
decarboxylase (Pdc1p) enolase (Eno2p) and aldehyde dehydro-genase (Ald6p) that are replaced by isozymes containing less
sulfur amino acids (ie methionine and cysteine) that are mobi-
lized in the glutathione pathway and are less available for proteinsynthesis (Fauchon et al 2002) This response affects a large
portion of the metabolic network and represents the mechanism
used by the cell to survive under this specific stress condition
Sulfur limitation conditions slow down the growth rate but donot induce this same sulfur-sparing response (Fauchon et al
2002) A schema of the known glutathione biosynthesis meta-
bolic pathway is presented in Figure 1The metabolic network used for this analysis (see the Section 2
for a description) contains 600 metabolites and 949 arcsMadalinski et al (2008) identified a list of 24 metabolites
Fig 1 Glutathione biosynthetic pathway Compounds in bold are dis-
criminating in Madalinski et al (2008) and are involved in the synthesis of
glutathione Source adapted from Figure 1 in Lafaye et al (2005)
63
Telling metabolic stories to explore metabolomics data
whose concentration significantly changed after cadmium expos-ure shown in the table given in Supplementary Material S3It is important to notice here that identification of the metab-
olites that have changed their concentration is based on a min-imum of two orthogonal criteria relative to an authenticcompound analyzed under identical experimental conditionsretention time and mass spectrum or retention time and 1H
nuclear magnetic resonance (NMR) spectra accurate mass andtandem mass spectra or accurate mass and related isotopic clus-ters or 1H andor 13C NMR with 2D NMR spectrum (Sumner
et al 2007) However many metabolites are not commerciallyavailable and many of them may require tedious and expensivechemical synthesis which often hampers their definitive metab-
olite identification Thus such compounds remain putativelyannotated or characterizedWe decided to perform two analyses to explore the effect of
cadmium exposure on Scerevisiae cells We first enumeratedmetabolic stories using a set of black nodes restricted to themeasured metabolites that are known to participate to the bio-
synthesis of glutathione The idea is to check whether ourmethod is able to recover one or more stories that correspondto the known metabolic pathway In a second step we enumer-
ated metabolic stories using the entire list of 24 discriminatingcompounds identified in the metabolomics experiments In thiscase the goal is to analyze both the response of glutathione
biosynthesis but also the potential response of other pathwaysand the side effects of these responses in the rest of the network
32 First analysis local response to cadmium exposure
biosynthetic pathway of glutathione
We first consider the aforementioned metabolic pathway directlyinvolved in cadmium detoxification namely the glutathionebiosynthetic pathway to enumerate stories and check whether
we are able to recover one that fits our current knowledge of thebiological process We thus selected as black nodes for this firstanalysis only the metabolites that were measured in the experi-
ment (Madalinski et al 2008) and that are also known to par-ticipate in the glutathione biosynthetic pathway (Fauchon et al2002) These eight compounds are presented in the table given in
Supplementary Material S3 with the third column marked aslsquoyesrsquo glutathione O-acetylhomoserine methionine glutamateglutamylcysteine serine glycine and cystathionine
321 Compressed network A first practical result that followsdirectly from the properties of our definition of stories is the com-pressed representation of the subnetwork in which all interactions
between the discriminating compounds are captured The com-pression is obtained in two steps In the first step we extract allbiologically relevant routes between the black nodes In our case
we computed lightest paths between black nodes using the out-degree of a node as its weight which has been defended as beingmore biologically sound than a simple shortest-path approach
(Blum and Kohlbacher 2008) The second step is to apply thefour compression rules that were previously described briefly (seeSection 2) and that are fully detailed in Acuna et al (2012)
The compressed network obtained for the reduced set of blacknodes contains 10 nodes and 25 arcs ie represents 498 ofcompression in terms of nodes and497 in terms of arcs with
respect to the original input size of the Scerevisiae metabolic
network The resulting compressed network is shown inFigure 2 This compression ratio is spectacular as it is nowmuch easier to visually inspect the network in which we can
highlight the metabolites of interest This type of visualizationis therefore already a result in itself which can readily be used
to start proposing causal explanations for the changes of metab-olite concentrations To facilitate this we further enrich thisrepresentation with the information on the direction of the
change of concentration (whether the metabolite concentrationincreased or decreased) and the intensity of this change Of the 8metabolites considered 3 had a significant increase of their con-
centration (reduced glutathione cystathionine and glutamylcys-teine) whereas the other 5 had a significant decrease of their
concentration (methionine O-acetylhomoserine glutamateserine and glycine) From now on we will denote the first setas green nodes and the second set as red nodes The other nodes
whose concentration did not change significantly will remainidentified as white nodes We notice that this distinction betweenred and green nodes is only possible for applications where two
conditions are compared This is the case we consider in thisarticle When more than two conditions are compared our meth-
odology still applies keeping the terminology of black and whitenodes We can produce the compressed network and enumeratethe stories The ranking scheme described later would however
need to be adapted Finally during the preprocessing of thenetwork some paths are compressed into a single arc To distin-guish between reactions linking two compounds and these com-
pressed paths we used solid lines for the former and dashed linesfor the latter Importantly the compression of the network is
lossless as it is easily reversible for instance if we need to haveaccess to the full path of white nodes that indirectly link twoblack nodes Interestingly in practice although most white
nodes can be compressed some remain Their compressionwould prevent us from being able to enumerate the full set ofstories These compounds although not detected as discriminat-
ing seem to also play an important role in the studied process as
Fig 2 The compressed network computed considering as black nodes
the eight compounds of the table in Supplementary Material S3 marked
as present in the glutathione biosynthetic pathway Green nodes are the
ones whose concentration significantly increased in the presence of cad-
mium whereas the red are the ones whose concentration significantly
decreased The diameter of the nodes is proportional to the concentration
change Solid arcs represent single reactions connecting the two com-
pounds whereas dashed ones correspond to a chain of at least two
reactions
64
PVMilreu et al
they are at the crossroads between at least two possible routesbetween discriminating compounds
322 Enumerating and scoring the stories The compressednetwork is already a result per se but its visual inspection
remains difficult the many cycles it contains allow for a readingof the flow of matter in many possible directions thereby sug-
gesting several possible causal scenarios Therefore we go one
step further in the analysis and enumerate the metabolic storiesIn this analysis there are a total of 222 stories
With the aim of classifying the set of computed stories wehave to define how to assign values to the node and arc weights
needed by our score function scheme (see Section 2)There are basically four kinds of interactions that may be
observed in a metabolic story (see Table 1) In the following
proposal for causal interpretation of each type of arc we willmake the simplifying assumption that each arc is independent
from the other ones In this context an arc linking a red node to
a green node will correspond to the consumption of the red nodeto the benefit of the green node If we focus solely on this arc this
can only be explained by an activation of the enzyme catalyzing
the reaction linking the two nodes On the other hand an arclinking a green node to a red node can be interpreted as the
inhibition of the enzyme catalyzing the reaction linking the two
nodes Finally an arc linking two red nodes can be explainedby a domino effect The simple fact that the substrate concentra-
tion decreases causes the product concentration to decrease
This domino effect does not require any enzyme change It justcorresponds to a change in concentration that propagates The
case of green to green arcs can be explained by a similar effect
We additionally need to assume that the enzyme is not present ina limiting amountWe remind that in this section our approach is local and
focuses on single transformations We always favor the most
parsimonious explanation (the one with fewest enzyme changes)but in practice other plausible explanations could be proposed
for each arc Importantly the notion of enzyme activation
or inhibition as used in this article should be understood in a
general sense as it captures allosteric regulation of the enzyme
or transcriptional regulation of the gene(s) encoding the enzyme
In the application considered here the time separating the
measurements (before and after exposure to cadmium) is large
enough to allow to interpret enzyme activations as a change
in their concentration through a transcriptional response Our
methodology also applies when the time separating the measure-
ments is shorter In the following we propose three ranking
schemes for stories In each of them we favor one type of arc
which means that we look for the stories with a large number of
arcs of this type Even if the individual explanation of each arc is
not necessarily correct the overall optimization of the total
number of each arc type makes intuitive sense and we show
that in practice it enables to explore efficiently the space of all
stories
323 Three scoring schemes Let us start by defining the arcweights that are restricted to being 1 0 or thorn1 The first scoring
scheme privileges stories where green nodes are preferentially
targets in the story (ie are produced) and on the other hand
red nodes are preferentially sources in the story (ie are con-
sumed) Let us call this score function enzyme-activation-first
as it should privilege arcs from red to green nodes and penalize
the inverse as shown in Table 2a Another possibility is to classify
first stories in which the concentration change responses are
privileged as shown in Table 2b Let us call this score function
concentration-change-first as it should privilege arcs from red to
red nodes or green to green nodes Finally we may define a score
function in which we privilege arcs going from green nodes to red
nodes in such a case these arcs represent enzyme inhibition
as shown in Table 2c Let us call this score function enzyme-
inhibition-first
Once an arc weighting scheme has been chosen we define the
node weights For our experiments we define the value ethxTHORNfor a given node x as its normalized intensity ratio which is its
intensity ratio divided by the maximum intensity ratio observed
in the experiment (if v is a green node) or the minimum intensity
ratio observed in the experiment divided by the intensity ratio of
the node (if v is a red node) An example is given in the figure in
Supplementary Material S4
324 Application to cadmium stress response in yeast Using thethree presented score functions we were able to rank the 222
Table 2 Weights for different score functions of a story
(a) Enzyme activation first (b) Concentration Change first (c) Enzyme inhibition first
Outgoing arcs Outgoing arcs Outgoing arcs
Arc To red To green Arc To red To green Arc To red To green
From red 0 1 From red 1 1 From red 0 1
From green 1 0 From green 1 1 From green 1 0
Note Table exhibiting the arc weights for interactions between green and red nodes used for computing the score of a story in the context of a metabolomics experiment (a)
weights used to privilege enzyme activation (b) weights used to privilege concentration change and (c) weights used to privilege enzyme inhibition
Table 1 Biological interpretation for arcs in a story
Arc To red To green
From red Concentration change Enzyme activation
From green Enzyme inhibition Concentration change
65
Telling metabolic stories to explore metabolomics data
stories previously computed and identify the top scoring stories
for each one of the three functions Figure 3a shows one of the
six optimal stories according to the enzyme-activation-first
scheme Figure 3b shows the single optimal story according to
the concentration-change-first scheme and Figure 3c shows one
of the two optimal stories found according to the enzyme inhib-
ition first scheme The goal of this first analysis is to try to iden-
tify stories that could correspond to the current knowledge on
the response of yeast to cadmium exposure ie a story that
corresponds to the glutathione biosynthetic pathway previously
presented in Figure 1 Among the top scored stories the one
given by the enzyme-activation-first score function (see
Figure 3a) agrees well with the current knowledge of yeast re-
sponse to cadmium The discussion in Madalinski et al (2008)
presents as a result a flux corresponding to the detoxification of
cadmium by glutathione explaining that the levels of metabolites
involved in the glutathione biosynthesis pathway (homocysteine
cystathionine glutamyl-cysteine and glutathione itself) were
increased following cadmium exposure which is the same flow
of matter preserved in the story shown in Figure 3a The story
selected by the concentration-change-first score function shown
in Figure 3b preferentially preserves arcs between two nodes of a
same color The idea is that an increase (or a decrease) of con-
centration of a given metabolite could be a side effect of the
increase (or decrease) of another one The goal is to minimize
the number of arcs that suggest some enzyme activity change ie
arcs that involve red and green nodes Interestingly the story
that scores best with this ranking scheme does not fit with the
current knowledge of the response to cadmium exposure This
means that in principle there exists a scenario that uses fewer
red to green or green to red arcs than the true response (and
therefore fewer enzyme changes) but this scenario is not the
one taken in practice There can be a number of reasons whythis optimal scenario is not taken Although any enzyme can in
principle be activated or inhibited in practice some have moredegrees of freedom In addition some reactions annotated
as reversible in general happen to have one clearly favored
direction in specific conditions Finally the story presented inFigure 3c preferentially preserves green to red arcs that could
represent an enzyme inhibition Again this scenario does notfit with the current knowledge on yeast response to cadmium
which indicates that the response is probably not based mostlyon enzyme inhibition
325 Anthologies In Figure 3a a story with score 1252 for theenzyme-activation-first score function is presented However
there are other five stories that achieved the same scoreThese tied optimal stories may be combined into a single graph
representation to ease the analysis of their differences aspresented in Figure 4 A unique graph representing the union
of several different stories is called an anthology Notice thatdifferently from stories which are maximal DAGs an anthology
contains at least one cycle The sources and targets (sinks) of an
anthology (if any remains) are however black nodes only aswith stories In this case the equivalent stories are due to the fact
that serine glycine and oxalacetic acid are all interconnected byreversible paths
33 Second analysis global response to cadmium exposure
For the second analysis we decided to explore the globalresponse to cadmium exposure and we considered all 24
discriminating compounds One of them pyroline-hydroxy-
carboxylate was eliminated when computing the lightest paths
Fig 4 The anthology combining the six maximal stories obtained with
the enzyme-activation-first score function Notice that the anthology pre-
serves the flow of matter observed in the pathway known to be involved
in cadmium detoxification by the yeast Once more green nodes are the
ones whose concentration significantly increased in the presence of cad-
mium whereas the red are the ones whose concentration significantly
decreased The diameter of the nodes is proportional to the magnitude
of the concentration change as measured by the intensity ratio of
the compound Solid arcs represent single reactions connecting the two
compounds whereas dashed ones correspond to a chain of at least two
reactions
(a) (b) (c)
Fig 3 The best stories generated for our analysis taking into account
only the metabolites known to be present in the glutathione biosynthesis
and whose concentration significantly changed after cadmium exposure
Green nodes are the ones whose concentration significantly increased in
the presence of cadmium whereas the red nodes are the ones whose
concentration significantly decreased The diameter of the nodes is pro-
portional to the concentration change Solid arcs represent single reac-
tions connecting the two compounds whereas dashed ones correspond to
a chain of at least two reactions
66
PVMilreu et al
between all pairs of black nodes as it was part of a small dis-
connected component of the original input graph most probably
due to missing information in the metabolic network reconstruc-tion as the metabolite was present in the metabolome of the
strain The computed compressed network contains 34 nodes
and 76 arcs ie a compression of 94 in terms of nodes and
92 in terms of arcs The resulting compressed network is
shown in Figure 5 Again this compressed network is already
a result per se as it enables to visualize jointly all the possibleways of explaining the flow of matter through the network
However in this case again and probably even more than
before the readability is complicated and we therefore go
one step further and compute all storiesThis time the number of stories is much larger there
are 3 934 160 in total In fact this exact number could only be
obtained with the recent improvement we proposed in Borassi
et al (2013) Before that the computation would not end in
reasonable time and we only had an approximate number Inour initial analysis the score function that selected a story that
best fitted the targeted known metabolic pathway of the gluta-
thione biosynthesis was the enzyme-activation-first scoring
scheme For this reason we used it also to analyze the larger
dataset produced in this second analysis obtaining 20 maximal
stories presented as an anthology in Figure 6 Considering all themetabolites that were measured in the experiment as black nodes
in our method allows us to have a more global view of the
organismrsquos response to cadmium exposure This enables to
explore whether the other identified paths apart from the ones
involved in the glutathione pathway are part of this response or
simply side effects of the sulfur redirection as further discussed
in the next section
34 Analytic tools
All the compressed networks stories and anthologies presented
in this section were computed using our algorithm called Touche
(Borassi et al 2013) For visualization and analytical purposes
we used Cytoscape (Shannon et al 2003) which is a software fornetwork visualization enriched with a plug-in we developed to
enable loading visualizing and inspecting the three aforemen-tioned objects (compressed networks stories anthologies)
inside Cytoscape The plug-in applies the given visual propertiescorresponding to a metabolomics experiment (eg colour and
diameter of the nodes the thickness of an arc corresponding tothe frequency of the arc in the stories composing the anthology)
and allows a zoom-in in the dashed arcs exhibiting the pathsconnecting the two nodes Both Touche and the Cytoscape plug-
in are available on demand
4 DISCUSSION
Focusing specifically on the biological application presented inthe previous section we may see that exploring the topological
properties of the stories through the preprocessing of the input
Fig 6 Anthology corresponding to the 20 stories with the maximal score
computed for the experiment on yeast s288c exposed to cadmium Red
nodes correspond to metabolites whose concentration decreased and
green nodes to those whose concentration increased in the metabolomics
experiment White nodes have their concentration unchanged or it could
not be measured The diameter of the nodes is proportional to the con-
centration change Solid arcs represent single reactions connecting the
two compounds whereas dashed ones correspond to a chain of at least
two reactions The arcrsquos thickness represents the frequency of the arc in
the stories making up the anthology whereas gray arcs correspond to
reactions known to be part of the response to cadmium
Fig 5 The compressed network computed for the whole list of
discriminating compounds of the table in Supplementary Material 3
and the metabolic network of the yeast strain s288c Green nodes are
the ones whose concentration significantly increased in the presence of
cadmium whereas the red are the ones whose concentration significantly
decreased The diameter of the nodes is proportional to the concentration
change Solid arcs represent single reactions connecting the two
compounds whereas dashed ones correspond to a chain of at least two
reactions
67
Telling metabolic stories to explore metabolomics data
network creates a compressed network that captures all the
relationships between the discriminating compounds in a much
smaller graph than the whole network This already allows a
visual inspection of the observed variations which is rather dif-
ficult if not impossible in the entire network On the other hand
one may easily highlight in a whole metabolic pathway map
those metabolites whose concentration were detected as having
changed using the YeastCyc database However because the
pathways are presented as disconnected it is not possible to
follow a path that traverses several pathways (see Figure in
Supplementary Material S5) To demonstrate the utility of our
approach we used data from Madalinski et al (2008) in which
the authors monitor changes in metabolite concentration as a
response of the yeast Scerevisiae to cadmium a toxic chemical
The aim of this study is to analyze the global response of an
organism to a stress Using only the metabolomics experiment
data to choose the discriminating compounds and to rank the
stories we are able to obtain stories that correspond well to the
current biological understanding of the system under study as
well as to propose new alternatives that could serve as a basis for
further experimental validations Because regulatory information
and quantitative information are not needed by the method this
allows it to be used for metabolic network reconstructions even
when they are not well refined and where these additional infor-
mations may be unavailable or incompleteThe method herein presented allows visual inspection of a set
of discriminating compounds (either local or broader) from
metabolomics data in the compressed network stories andor
anthology with no a priori selected pathways The metabolic
stories may be ranked in different ways depending on which
interpretation one wishes to emphasize for the causal link
between two affected metabolites enzyme activation enzyme
inhibition or domino effect on the concentration changes of sub-
strates and products Equally probable stories under any selected
ranking scheme can be further grouped into a single anthology
that summarizes in a single subnetwork all equivalently plausible
alternative stories
41 First analysis local response to cadmium exposure
The first analysis performed aimed at locally inspecting the yeast
response to cadmium exposure limited to the biosynthetic path-
way of glutathione given in Figure 1 Of the 222 stories found
the ones favoring enzyme activation were clearly closer to our
current understanding of this response where an increased
sulfur flux passes through homocysteine cystathionine cysteine
and glutamyl-cysteine to yield high levels of glutathione
(Madalinski et al 2008) This same flow of matter is captured
in the anthology combining the six best stories under this scoring
scheme shown in Figure 4Interestingly we show that there exists one scenario that in
principle uses fewer enzymes to explain the observed changes in
concentration This is the scenario that favors concentration
changes shown in Figure 5b However this scenario does not
match the current knowledge of the main pathway of yeast
response to cadmium In fact it even uses some reactions in the
opposite direction Because these reactions are annotated as
reversible they can be taken in both directions at least in theory
and this explains that we found these alternative stories Those are
scenarios that are a priori possible They are not necessarily
lsquochosenrsquo in practice possibly because the reactions are only
reversible under some conditions that are not met in this experi-
ment Unfortunately the precise conditions under which a reac-
tion is reversible are in general not well known The addition
of such knowledge would for sure enable to reduce substantially
the number of stories we output as a large part of the combina-
torial explosion we observe comes from these lsquocyclesrsquo Conversely
understanding why some possible scenarios are not taken in prac-
tice could help to better annotate the reversibility of reactionsFrom the list of discriminating compounds identified in
Madalinski et al (2008) the ones that are involved in the gluta-
thione biosynthetic pathway (as shown in bold in Fig 1) are as
follows O-acetylhomoserine methionine serine cystathionine
glutamate -glutamyl-cysteine glycine and glutathione All of
them are present in the compressed networks stories and
anthologies herein presented (Figs 2ndash6) As concerns cysteine
and homocysteine they were either not measured or not discri-
minating in Madalinski et al (2008) thus in our analysis they
appear as white nodes and may be compressed inside an arc
(dashed arcs in Figs 2ndash6) Cysteine is included in the dashed
arc linking cystathionine and L-gamma-glutamyl-cysteine that
is its expected place based on the biosynthetic pathway of gluta-
thione Homocysteine is represented as a white node in all fig-
ures Because it is at a crossroads between three black nodes
(cystathione methionine and O-acetylhomoserine) it could not
be compressedInterestingly the compounds involved in the methyl cycle
which is a sulfur salvage pathway (see Fig 1) were not recovered
in the highest score stories found in our first analysis The reason
is that the lightest path found between methionine and
cystathione in that analysis passed through the reaction catalyzed
by the enzyme homocysteine S-methyltransferase (Mht1) which
is assigned as reversible in the YeastCyc database (Caspi et al
2010) and in our data This enzyme was described as recycling
S-adenosylmethionine (AdoMet) to methionine (Thomas et al
2000)
42 Second analysis global response to cadmium exposure
This more local view of the behavior of the metabolic network of
yeast in this stress condition may be contrasted with the second
analysis where the whole list of discriminating compounds was
considered The anthology combining the 20 best stories under
the scoring scheme favoring enzyme activation is presented in
Figure 6 where the reactions corresponding to the glutathione
biosynthesis are highlighted in gray This is a strong point of our
method as it allows exploring alternative but close scenarios
through the analysis of these (and possibly other) stories
altogether which might provide new insights on the underlying
processes that took place under the given conditions
Among the 35 nodes presented in this anthology eight have
sulfur in their chemical structure AdoMet -glutamylcysteine
5-methylthioadenosine (MTA) O-acetyl-L-homoserine cystei-
nylglycine glutathione cystathionine and L-methionine
Among these sulfured metabolites the only one that is not
involved in the glutathione biosynthesis is MTA which is instead
involved in the MTA cycle a sulfur salvage pathway (Thomas
and Surdin-Kerjan 1997) This recycles AdoMet to methionine
68
PVMilreu et al
through a chain of reactions whereas Mht1 (mentioned earlier in
the text) can also perform it in one step which is important for
controlling the intracellular ratio between these two metabolites
(Thomas et al 2000) Although there is a redirection of sulfur
flux to glutathione biosynthesis after cadmium exposure the
levels of MTA increased as well as those of arginine which is
a precursor for MTA The metabolites in the methyl cycle are
recovered with the white nodes AdoMet and homocysteine pre-
sent in the anthology and the metabolite S-adenosyl-homocyst-
eine compressed into the arc between them We have previously
tried to link arginine to sulfur metabolism by emphasizing that it
is a precursor of spermidine a polyamine metabolite that is itself
involved in the biosynthesis of MTA a metabolite associated
with the methyl cycle and whose levels are increased after cad-
mium exposure (Madalinski et al 2008) However experimental
data lacked to support this assumption By using the metabolic
stories based approach the increased levels of arginine are linked
to decreased concentrations of citrulline which has not been
formally identified in our experimental conditions and which
is itself linked to glutamate Besides citrulline was identified as
a discriminating compound in Madalinski et al (2008) but was
only indicated as putative requiring more analysis for final iden-
tification Our results seem to confirm that citrulline was cor-
rectly identified This emphasizes the relevance of using this kind
of approach to generate biological hypotheses that have to be
further investigated by biologists Of note such a link between
arginine and sulfur metabolism has been noticed in other organ-
isms (Sekowska et al 2001) and links between nitric oxide and
polyamines have been established with cadmium toxicity in
wheat roots (Groppa et al 2008) Furthermore this global
view of the discriminating compounds links the sulfur metabol-
ism to non-sulfur amino acids and other metabolites through
intermediates of the central metabolism The amino acids that
are precursors to the glutathione synthesis have their levels
reduced as expected whereas most of the others increased
This agrees with the fact that global protein synthesis rapidly
drops after cadmium exposure (Lafaye et al 2005) reducing
the consumption of amino acids not directly connected to gluta-
thione synthesis
43 Perspectives
We presented a generic method that enables to analyze metabo-
lomics data This method requires simple input and can be
applied to a wide variety of situations Clearly the results of
the method can be improved with the addition of other types
of data For instance the use of carbon tracing experiments
could help in focusing directly on the stories that are involved
in the response to the stress condition instead of considering the
set of all possible stories Besides we assumed that the set of
discriminating compounds did not need to be questioned
However these are predicted based on the analysis of peaks in
a spectrum We remark that extracting such information is in
itself a bioinformatics challenge Therefore a possible extension
of the method could be to take into account noisy data ie to
deal with a level of confidence for the roles of discriminating
compounds and non-discriminating compounds From the mod-
eling point of view we enforce that each story corresponds to a
flow of matter by the acyclicity constraint We could relax this
constraint by allowing internal cycles and therefore computing
for each combination of sources and targets a single story This
will lead to a completely different model and is beyond the scope
of this article
ACKNOWLEDGMENTS
The authors would like to thank S Klamt and JJ Heijnen for
fruitful discussions
Funding European Research Council under the European
Communityrsquos Seventh Framework Programme (FP72007-
2013)ERC grant agreement no (247073)10 the French project
(ANR MIRI BLAN08-1335497) and the ANR funded LabEx
ECOFECT It was partially supported by the Plateforme
Bioinformatique de Toulouse ANR-BBSRC Systryp the
CIRIC-INRIA Chile line Natural Resources the NWO-CLS
MEMESA project and the lsquoDISCOrsquo PRIN National Research
Project
Conflict of Interest none declared
REFERENCES
AcunaV et al (2012) Telling stories enumerating maximal directed acyclic
graphs with a constrained set of sources and targets Theor Comput Sci
457 1ndash9
AntonovAV et al (2009) Ticl ndash a web tool for network-based interpretation of
compound lists inferred by high-throughput metabolomics FEBS J 276
2084ndash2094
BlumT and KohlbacherO (2008) Using atom mapping rules for an improved
detection of relevant routes in weighted metabolic networks J Comput Biol
15 565ndash576
BorassiM et al (2013) Telling stories fast via linear-time delay pitch enumeration
In 12th International Symposium SEA 2013 Rome Italy June 5-7 2013
Proceedings
CaspiR et al (2010) The metacyc database of metabolic pathways and enzymes
and the biocyc collection of pathwaygenome databases Nucleic Acids Res 38
D473ndashD479
CottretL et al (2010) Metexplore a web server to link metabolomic experiments
and genome-scale metabolic networks Nucleic Acids Res 38 W132ndashW137
CroesD et al (2006) Inferring meaningful pathways in weighted metabolic
networks J Mol Biol 356 222ndash236
DittrichMT et al (2008) Identifying functional modules in protein-protein
interaction networks an integrated exact approach Bioinformatics 24
i223ndashi231
FauchonM et al (2002) Sulfur sparing in the yeast proteome in response to sulfur
demand Mol Cell 9 713ndash723
FaustK et al (2010) Pathway discovery in metabolic networks by subgraph
extraction Bioinformatics 26 1211ndash1218 2010
GroppaMD et al (2008) Benavides Nitric oxide polyamines and cd-induced
phytotoxicity in wheat roots Phytochemistry 69 2609ndash2615
KhatriP et al (2012) Ten years of pathway analysis current approaches and out-
standing challenges PLoS Comput Biol 8 e1002375
LacroixV et al (2008) An introduction to metabolic networks and their structural
analysis IEEEACM Trans Comput Biol Bioinform 5 594ndash617
LafayeA et al (2005) Combined proteome and metabolite-profiling analyses
reveal surprising insights into yeast sulfur metabolism J Biol Chem 280
24723ndash24730
LeaderDP et al (2011) Barrett Pathos a web facility that uses metabolic maps to
display experimental changes in metabolites identified by mass spectrometry
Rapid Commun Mass Spectrom 25 3422ndash3426
LiZ-S et al (1997) A new pathway for vacuolar cadmium sequestration in
Saccharomyces cerevisiae Ycf1-catalyzed transport of glutathionato cadmium
Proc Natl Acad Sci USA 94 42ndash47
69
Telling metabolic stories to explore metabolomics data
MadalinskiG et al (2008) Direct introduction of biological samples into a ltq-
orbitrap hybrid mass spectrometer as a tool for fast metabolome analysis
Anal Chem 80 3291ndash3303
SchusterS et al (1999) Detection of elementary flux modes in biochemical
networks a promising tool for pathway analysis and metabolic engineering
Trends Biotechnol 17 53ndash60
SchusterS and HilgetagC (1994) On elementary flux modes in biochemical
reaction systems at steady state J Biol Syst 2 165ndash182
SchwikowskiB and SpeckenmeyerE (2002) On enumerating all minimal solutions
of feedback problems Discrete Appl Math 117 253ndash265
ScottMS et al (2005) Identifying regulatory subnetworks for a set of genes
Mol Cell Proteomics 4 683ndash692
SekowskaA et al (2001) Extracting biological information from DNA arrays
an unexpected link between arginine and methionine metabolism in bacillus
subtilis Genome Biol 2
ShannonP et al (2003) Cytoscape a software environment for integrated models
of biomolecular interaction networks Genome Res 13 2498ndash2504
SubramanianA et al (2005) Gene set enrichment analysis a knowledge-based
approach for interpreting genome-wide expression profiles Proc Natl Acad
Sci USA 102 15545ndash15550
SumnerLW et al (2007) Proposed minimum reporting standards for chemical
analysis Metabolomics 3 211ndash221
ThieleI and PalssonBO (2010) A protocol for generating a high-quality genome-
scale metabolic reconstruction Nat Protoc 5 93ndash121
ThomasD et al (2000) Reverse methionine biosynthesis from s-adenosylmethio-
nine in eukaryotic cells J Biol Chem 275 40718ndash40724
ThomasD and Surdin-KerjanY (1997) Metabolism of sulfur amino acids in
Saccharomyces cerevisiae Microbiol Mol Biol Rev 61 503ndash532
van HeldenJ et al (2002) Bioinformatics and Genome Analysis In MewesH-W
SeidelH and WeissB (eds) Graph-Based Analysis of Metabolic Networks
Vol 38 Springer Berlin Heidelberg pp 245ndash274
XiaJ et al (2012) Metaboanalyst 20-a comprehensive server for metabolomic
data analysis Nucleic Acids Res 40 W127ndashW133
70
PVMilreu et al
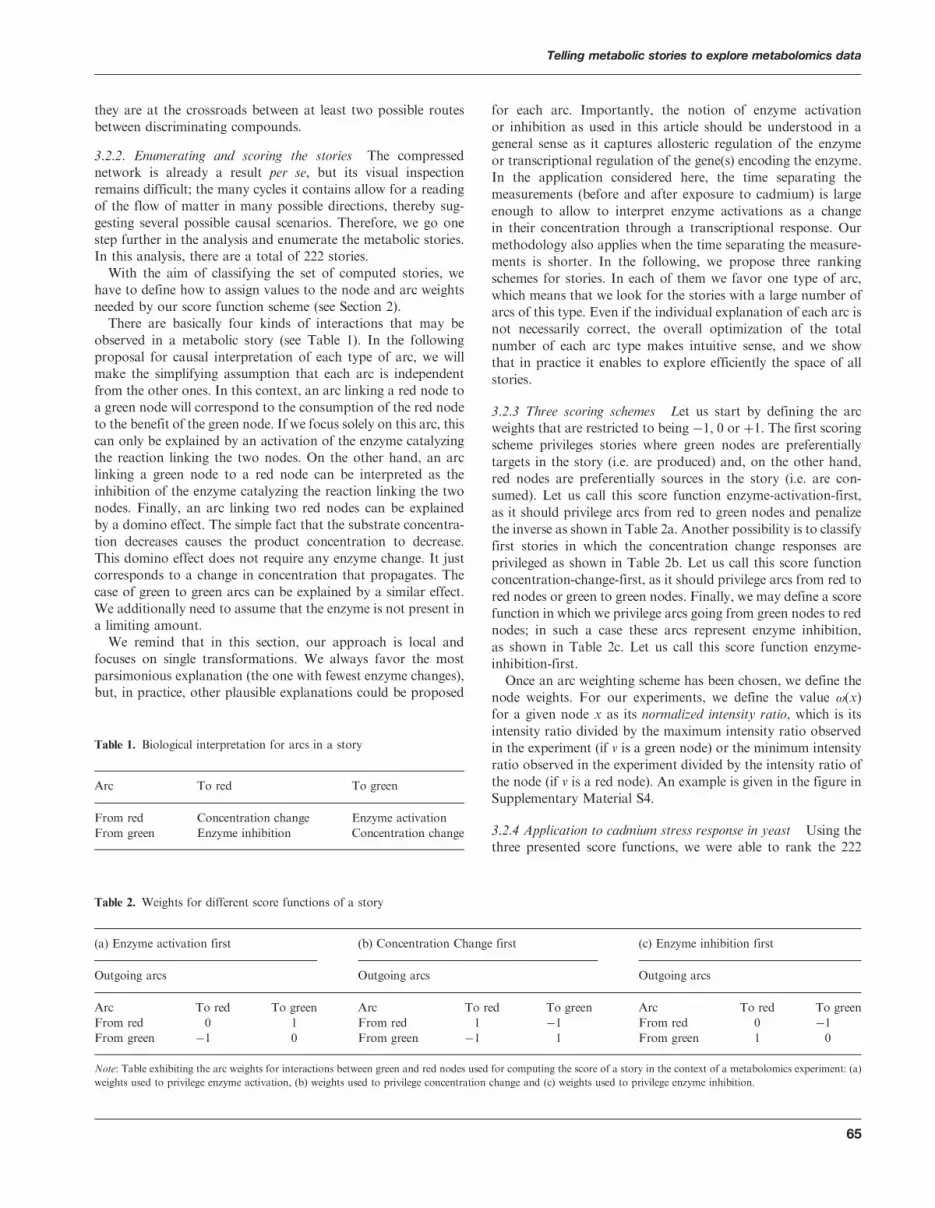
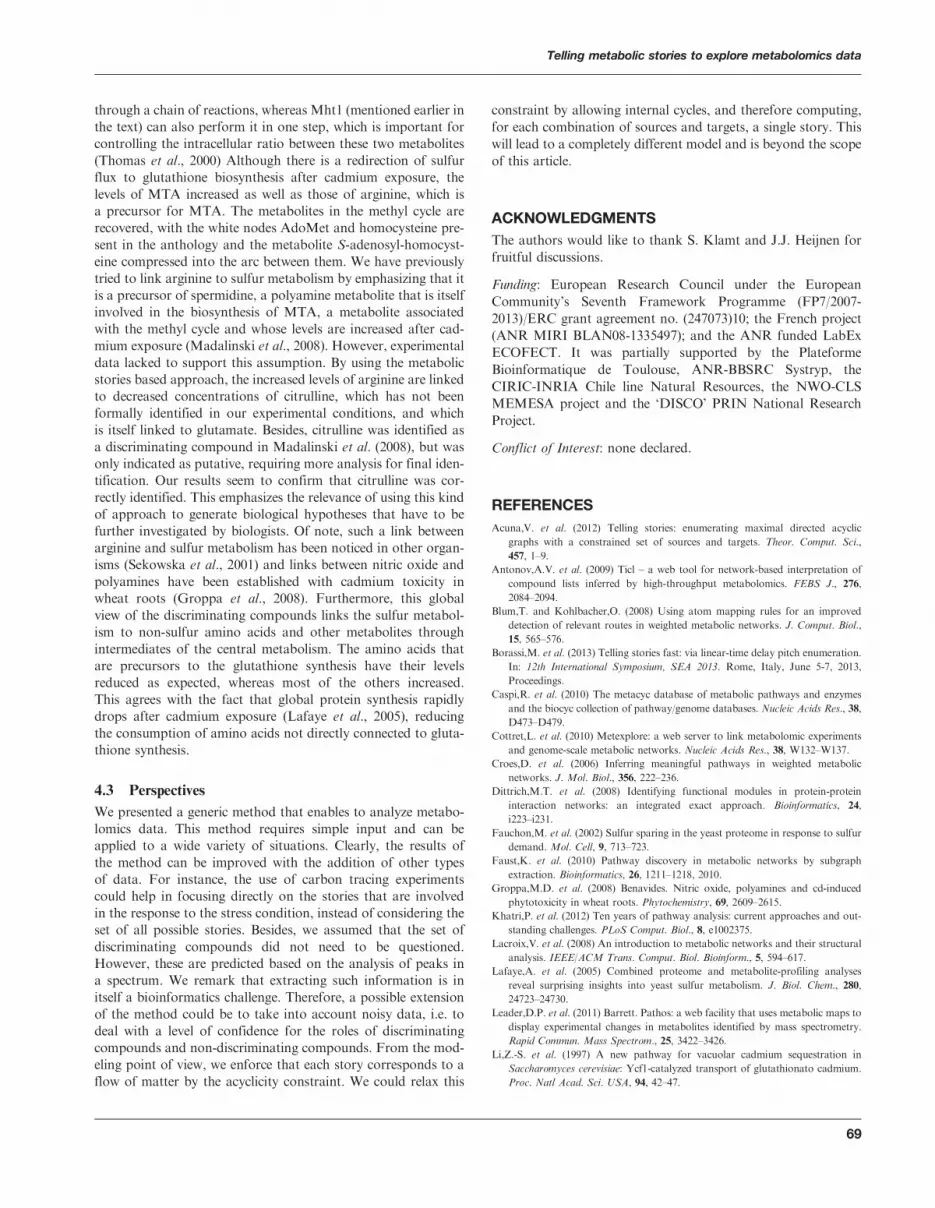


