Embed Size (px)
Citation preview

Cerebral Cortex June 2008;18:1350--1360
doi:10.1093/cercor/bhm166
Advance Access publication September 24, 2007
Temporal Dynamics of Adaptation toNatural Sounds in the Human AuditoryCortex
Christian F. Altmann1,2, Hiroki Nakata1, Yasuki Noguchi1,3,
Koji Inui1, Minoru Hoshiyama1,3, Yoshiki Kaneoke1 and
Ryusuke Kakigi1
1Department of Integrative Physiology, National Institute for
Physiological Sciences, Okazaki 444-8585, Japan, 2Institute of
Medical Psychology, Johann-Wolfgang-Goethe University,
60528 Frankfurt am Main, Germany and 3Department of Health
Sciences, Faculty of Medicine, Nagoya University, Higashi-ku,
Nagoya 461-8673, Japan
We aimed at testing the cortical representation of complex naturalsounds within auditory cortex by conducting 2 human magnetoen-cephalography experiments. To this end, we employed an adaptationparadigm and presented subjects with pairs of complex stimuli,namely, animal vocalizations and spectrally matched noise. In Exper-iment 1, we presented stimulus pairs of same or different animalvocalizations and same or different noise. Our results suggest a 2-step process of adaptation effects: first, we observed a general item-unspecific reduction of the N1m peak amplitude at 100 ms, followedby an item-specific amplitude reduction of the P2m component at 200ms after stimulus onset for both animal vocalizations and noise.Multiple dipole source modeling revealed the right lateral Heschl’sgyrus and the bilateral superior temporal gyrus as sites of adaptation.In Experiment 2, we tested for cross-adaptation between animalvocalizations and spectrally matched noise sounds, by presentingpairs of an animal vocalization and its corresponding or a differentnoise sound. We observed cross-adaptation effects for the P2mcomponent within bilateral superior temporal gyrus. Thus, our resultssuggest selectivity of the evoked magnetic field at 200 ms afterstimulus onset in nonprimary auditory cortex for the spectral finestructure of complex sounds rather than their temporal dynamics.
Keywords: animal vocalizations, complex sounds, MEG, repetitionsuppression
Introduction
The characterization of computational processes in the brain is
an ultimate goal in the cognitive neurosciences. However,
noninvasive functional neuroimaging methods are restricted by
their limited spatial resolution. Recently, adaptation paradigms
have been widely applied to overcome these limitations and to
characterize the stimulus selectivity of cortical areas. These
paradigms employ adaptation effects, that is, signal decreases
due to stimulus repetition. In the visual domain, functional
magnetic resonance imaging (fMRI) adaptation has been
employed to characterize processing in both early (Tootell
et al. 1998) and higher order visual areas (Grill-Spector et al.
1999, 2006; James et al. 2002; Altmann et al. 2004). Recent
magnetoencephalography (MEG) studies characterized the
temporal profile of adaptation to visual shapes and suggest
a change not only in response amplitude due to adaptation but
also in response timing (Noguchi et al. 2004).
In the auditory domain, adaptation paradigms have not been
as extensively employed. Human fMRI studies showed evidence
for correlations between behavioral effects of repetition
priming and repetition-associated reduction of fMRI responses
to environmental sounds (Bergerbest et al. 2004). Furthermore,
combined human fMRI and electroencephalography (EEG)/
MEG studies have provided evidence for stimulus-specific
adaptation effects both for pure tones and noise (Jaaskelainen
et al. 2004) and vowels (Ahveninen et al. 2006) in nonprimary
auditory areas.
However, the temporal profile of adaptation to repeated
stimulation with complex nonlanguage-related natural sounds
is largely unknown. Furthermore, it is unclear what the acous-
tic and higher order features are that lead to adaptation in the
auditory cortex. Thus, in these experiments, we aimed at in-
vestigating the representation of complex natural sounds and
spectrally matched noise using an MEG adaptation paradigm.
We employed only a single category of natural sounds, namely,
animal vocalizations. This class of nonspeech sounds is learned
early in development and is associated to perceptually rich and
tangible objects in our environment. Neurophysiological studies
in the macaque revealed preferential responses of neurons for
conspecific monkey vocalizations in nonprimary auditory cor-
tex within the anterior lateral belt (Rauschecker et al. 1995;
Rauschecker 1997, 1998; Rauschecker and Tian 2000; Tian
et al. 2001). Furthermore, positron emission tomography stu-
dies in the macaque showed increased metabolic responses in
the bilateral superior temporal gyrus (STG) for general animal
vocalizations but left-lateralized responses for conspecific calls
(Poremba et al. 2004). In humans, areas within bilateral STG
and the superior temporal sulcus (STS) have been suggested to
be involved in the processing of human voices and vocaliza-
tions (Belin et al. 2000; Fecteau et al. 2004, 2005) and envi-
ronmental sounds (Giraud and Price 2001; Maeder et al. 2001;
Lewis et al. 2004). Recent EEG experiments provided evidence
for an early dissociation of processing of animal vocalizations
compared with sounds of artificial objects (Murray et al. 2006).
In a previous MEG study, changes of animal vocalizations, vow-
els, and noise resulted in evoked magnetic mismatch fields over
bilateral anterior temporal and inferior frontal regions and left-
lateralized enhancements of fast oscillatory activity (Kaiser
et al. 2002). Similarly, a series of fMRI studies presented sub-
jects with complex natural sounds (animal voices, tools,
dropped objects, and liquids) and revealed stronger fMRI
activity in the bilateral middle portion of the STG for animal
compared with tool sounds (Lewis et al. 2005).
To investigate adaptation processes to animal vocalizations,
we conducted 2 experiments. In Experiment 1, we presented
subjects with pairs of stimuli, that either consisted of 2 iden-
tical or different animal vocalizations or of 2 identical or dif-
ferent noise sounds. If the cortical representation of animal
vocalizations is based on their identity or their temporal dy-
namics, we hypothesized that adaptation effects should occur
for the animal vocalizations only, but not for the noise pairs. If,
however, adaptation occurs for both categories of stimuli, the
� The Author 2007. Published by Oxford University Press. All rights reserved.
For permissions, please e-mail: [email protected]
by guest on June 22, 2016http://cercor.oxfordjournals.org/
Dow
nloaded from
observed adaptation effects are possibly based on the spectral
fine structure of the stimuli, rather than their temporal prop-
erties. Alternatively, adaptation effects could occur for both
animal vocalizations and noise stimuli, but at distinct spatial
locations or within different time windows suggesting differ-
ential representation of the stimuli. Thus, localization of the
underlying neural generators is necessary to characterize adap-
tation to the different stimulus categories. In Experiment 2, we
tested for cross-adaptation between animal vocalizations and
spectrally matched noise sounds. To this end, we presented
pairs of animal vocalizations and a spectrally matched or a
nonmatched noise sound. Cross-adaptation would further in-
dicate representation of spectral sound features rather than
spectrotemporal features.
Materials and Methods
SubjectsTwelve healthy, right-handed volunteers (age range 23--53, 8 males, 4
females) participated in Experiment 1. One subject was excluded from
analysis, because no clear evoked response (N1m and P2m compo-
nents) to auditory stimulation was obtained. All apart from the ex-
cluded subjects participated in Experiment 2 (age range 23--53, 8 males,
3 females). The subjects had normal hearing abilities and gave their
informed consent to participate in the study. The experiments were
performed in accordance with the ethical standards laid down in the
1964 declaration of Helsinki and approved by the ethics committee of
the National Institute for Physiological Sciences, Okazaki, Japan.
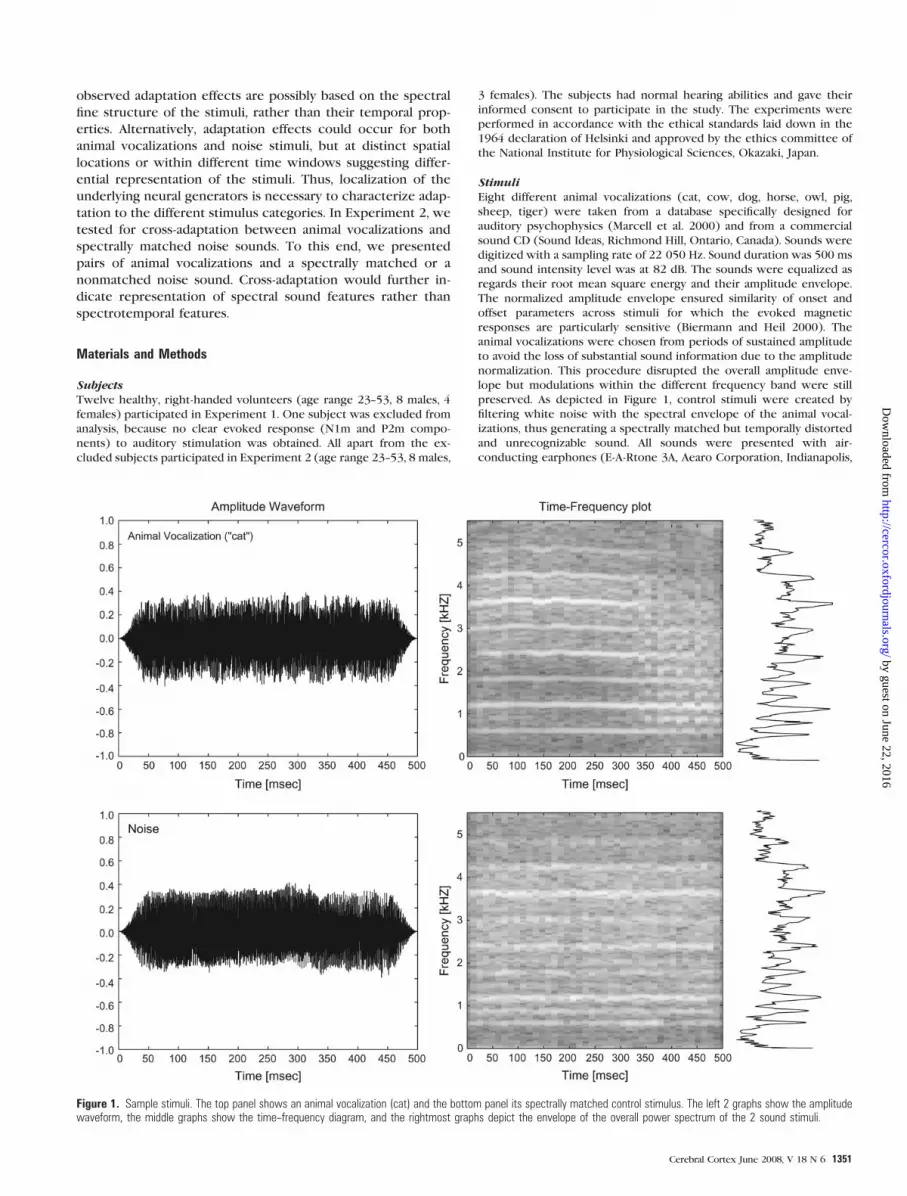
StimuliEight different animal vocalizations (cat, cow, dog, horse, owl, pig,
sheep, tiger) were taken from a database specifically designed for
auditory psychophysics (Marcell et al. 2000) and from a commercial
sound CD (Sound Ideas, Richmond Hill, Ontario, Canada). Sounds were
digitized with a sampling rate of 22 050 Hz. Sound duration was 500 ms
and sound intensity level was at 82 dB. The sounds were equalized as
regards their root mean square energy and their amplitude envelope.
The normalized amplitude envelope ensured similarity of onset and
offset parameters across stimuli for which the evoked magnetic
responses are particularly sensitive (Biermann and Heil 2000). The
animal vocalizations were chosen from periods of sustained amplitude
to avoid the loss of substantial sound information due to the amplitude
normalization. This procedure disrupted the overall amplitude enve-
lope but modulations within the different frequency band were still
preserved. As depicted in Figure 1, control stimuli were created by
filtering white noise with the spectral envelope of the animal vocal-
izations, thus generating a spectrally matched but temporally distorted
and unrecognizable sound. All sounds were presented with air-
conducting earphones (E-A-Rtone 3A, Aearo Corporation, Indianapolis,
Figure 1. Sample stimuli. The top panel shows an animal vocalization (cat) and the bottom panel its spectrally matched control stimulus. The left 2 graphs show the amplitudewaveform, the middle graphs show the time--frequency diagram, and the rightmost graphs depict the envelope of the overall power spectrum of the 2 sound stimuli.
Cerebral Cortex June 2008, V 18 N 6 1351
by guest on June 22, 2016http://cercor.oxfordjournals.org/
Dow
nloaded from

IN). The frequency transformation characteristics of the auditory
stimulation system ensured reliable stimulus presentation up to 4.4
kHz. The onsets and offsets of all sounds were smoothed utilizing
a Hanning window with a 50-ms rise and decay period.
ProcedureBefore the MEG experiment, subjects were asked whether they could
spontaneously name the animal vocalizations. On average, 6.4/8 animal
vocalizations were correctly named (cat 8/11, cow 11/11, dog 11/11,
horse 11/11, owl 7/11, pig 6/11, sheep 11/11, tiger 4/11 subjects
correctly naming the respective animal), while the noise sounds were
not recognizable. Moreover, we tested the subjects’ ability to distin-
guish between animal vocalizations and the spectrally matched noise
sound in a 2-alternative forced-choice task. To this end, subjects were
presented with pairs of an animal vocalizations and its matched noise
sound and were instructed to indicate the presentation of an animal
vocalization. Performance was at a high level in this task (percent cor-
rect rate 93%), indicating a clear perceptual difference between the 2
sound categories. The MEG experiments consisted of 6 experimental
runs with a duration of 4 min. Each trial consisted of a pair of stimuli,
the first stimulus (S1) was presented for 500 ms, followed by an inter-
stimulus interval of 500 ms, then the second stimulus (S2) was pre-
sented for 500 ms, followed by a 1500-ms silent period. In Experiment
1, the stimuli were paired according to the following conditions: 1)
2 identical animal vocalizations, 2) 2 different animal vocalizations, 3) 2
identical noise sounds, and 4) 2 different noise sounds. In Experiment
2, we paired the stimuli according to the following conditions: 1) an
animal vocalization and the spectrally matched noise sound, 2) an
animal vocalization and a different noise sound, and 3) and 4) were
similar to 1) and 2) but with reversed stimulus order. Additionally, we
introduced a target condition in which a pure tone (1000 Hz) was
randomly paired with a noise stimulus or an animal vocalization. The
pure tone appeared randomly either as S1 or S2 stimulus and was
matched in length and average root mean square to the animal vocal-
izations and noise stimuli. Subjects were instructed to press a button
whenever they heard the 1000-Hz pure tone. Subjects performed at
a high level at the detection task during the experiment (correct hits:
93% in both experiments). Within a run, we presented each condition
and the target condition 16 times. Thus, for each condition, we
acquired 96 trials.
MEG Acquisition and Data AnalysisThe magnetic responses to the auditory stimuli were recorded with
a helmet-shaped 306-channel detector array (Vectorview; ELEKTA
Neuromag, Helsinki, Finland), which comprised 102 identical triple
sensor elements. Each sensor element consisted of 2 orthogonal planar
gradiometers and one magnetometer coupled to a multi-SQUID (super-
conducting quantum interference device) and thus provided 3 inde-
pendent measurements of the magnetic fields. In the present study, we
analyzed MEG signals recorded from 204-channel planar-type gradi-
ometers. The signals from these sensors are strongest when the sensors
are located just above local cerebral sources (Nishitani and Hari 2002).
The MEG signals were recorded with 0.1--200 Hz band-pass filters and
digitized at 1 kHz. Before MEG recordings, 4 head position indicator
(HPI) coils were placed at specific sites on the scalp. To determine the
exact head location with respect to the MEG sensors, electric current
was fed to the HPI coils, and the resulting magnetic fields were mea-
sured with the magnetometer. These procedures allowed for alignment
of the individual head coordinate system with the magnetometer
coordinate system. The locations of HPI coils with respect to the 3
anatomical landmarks (nasion and bilateral) were also measured using
a 3-dimensional digitizer to align the coordinate systems of MEG with
magnetic resonance (MR) images obtained with a 3-T magnetic reso-
nance imaging system (Allegra; Siemens, Erlangen, Germany). We adopted
a head-based coordinate system used in a previous study (Wasaka et al.
2003). In this coordinate system, the x-axis was fixed with the
preauricular points, with the positive direction to the right. The
positive y-axis passed through the nasion from posterior to anterior,
and the z-axis thus pointed upward.
The signals in the 4 conditions were averaged separately, time locked
to the onset of the S1 stimuli. The averaging epoch ranged from 100 ms
before to 2000 ms after the S1 onset, and the prestimulus period (initial
100 ms) was used as the baseline. Epochs in which signal variation was
larger than 3000 fT were excluded from averaging. The averaged re-
sponses were low-pass filtered with a cut-off frequency of 40 Hz,
employing a zero-phase shift Butterworth filter. To avoid motor con-
tamination, only responses to nontarget pairs were used in the analysis.
For each subject, vector sums were calculated from the longitudinal
and latitudinal derivates of the responses recorded on the planar
gradiometers at each of the 102 recording sites. Vector sums were
computed by squaring the sum of MEG signals of each gradiometer pair
and then calculating the square root of this sum (Bonte et al. 2006). For
an initial overview of the evoked magnetic fields, we computed areal
averages across 24 gradiometer pairs in left and right temporal lobe,
respectively, similar to previous studies (Tarkiainen et al. 2003). The
peak amplitude and latency of the N1m component were determined
for each subject by evaluating a 60-ms window centered on 100 ms
after stimulus onset. Accordingly, the P2m peak latency and amplitude
were determined within a 100-ms window centered on 200 ms after
stimulus onset.
Source locations and the time courses of source activities for each
individual subject were determined using multiple source analysis and
brain electric source analysis (NeuroScan, Mclean, VA), as described
previously (Inui et al. 2004, 2006). The multiple dipole models were
obtained for the evoked magnetic field in response to the S1 stim-
ulation, in particular within the time range from 0 to 300 ms after S1
onset. Single dipoles were added successively to model the evoked
magnetic fields. The model adequacy was assessed by examining 1) the
percent variance (Hari et al. 1988), 2) the F-ratio (ratio of reduced chi-
square values before and after adding a new source) (Supek and Aine
1993), and 3) residual waveforms (i.e., the difference between the
recorded data and the model). Channels that exhibited an excessive
noise level were excluded from analysis (average: 4.3/204 channels per
subject). Goodness-of-fit values for the N1m and P2m components in
response to the S1 stimulation were above 80% for all subjects and
conditions. The anatomical sites of the sources were determined by
coregistration with the individual subjects’ anatomical MR image.
To assess the differences across conditions for the peak amplitudes
and peak latencies of the vector sums over the left and right temporal
lobes, we employed a repeated measurement analysis of variance (ANOVA)
with factors component (N1m/P2m), hemisphere (left/right), stimulus
category (animal/noise), and repetition (same/different) for Experi-
ment 1. In Experiment 2, we conducted a repeated measurement
ANOVA with factors component (N1m/P2m), hemisphere (left/right),
stimulus order (animal vocalization as first stimulus/animal vocalization
as second stimulus), and repetition (same/different).
Results
Experiment 1: Adaptation Effects for AnimalVocalizations and Noise Sounds
As shown in Figure 2, in Experiment 1 we observed 2 pro-
minent components following S1 and S2 for the evoked mag-
netic responses averaged across left and right temporal areas,
respectively. First, an N1m component occurred with a peak
latency at about 105 (Standard deviation ±11) ms after S1 stim-
ulus onset and second, a P2m component with a peak latency at
about 211 (±16) ms after S1 onset. Similar components were
observed in response to S2 presentation, that is an N1m
component peaking at about 108 (±16) ms after S2 onset and
a P2m component with a peak latency of about 216 (±22) ms
after S2 onset. The peak amplitudes were reduced for the S2
compared with the S1 response. In particular, the N1m
component exhibited a reduction of about 18%, whereas the
P2m component was reduced by about 13%. Employing a 4-way
repeated measurement ANOVA, we observed a significant main
effect for repetition (F1,10 = 8.85, P < 0.05) and an interaction
between component and repetition (F1,10 = 15.64, P < 0.01).
1352 Adaptation to Natural Sounds d Altmann et al.
by guest on June 22, 2016http://cercor.oxfordjournals.org/
Dow
nloaded from

The reductions from S1 to S2 showed no differences across
conditions for the N1m component (hemisphere: F1,10 = 1.02, P
= 0.34; stimulus category: F1,10 < 1, P = 0.95; repetition:
F1,10 < 1, P = 0.69). However, the P2m component clearly
showed stronger reductions for same compared with different
stimuli (repetition: F1,10 = 15.00, P < 0.01) but no effects of
hemisphere (F1,10 = 3.37, P = 0.10) or stimulus category
(F1,10 < 1, P = 0.73). No peak latency differences were
observed for either the N1m or the P2m component in
response to S1 or S2 (P > 0.05 for all repeated measurement
ANOVAs with factors stimulus category and condition). Thus,
our data suggest that stimulus repetition results in a general,
item-unspecific reduction of evoked magnetic fields for the
N1m component. More specifically, the N1m component of the
S2 evoked magnetic response was reduced both when the
same or a different stimulus was repeated. In contrast,
amplitude reductions for the P2m component in both left
and right temporal lobe areas were item specific, that is,
reductions occurred only when the same item was repeated.
Multiple dipole modeling revealed sources in the bilateral
lateral Heschl’s gyrus (HG) in all subjects. Within these HG
sources, a clear N1m component was observed for all subjects
and a P2m component was observed for 8/11 in left HG and
9/11 subjects in right HG. Furthermore, we observed dipole
sources in the left STG for 7/11, in right STG for 9/11, in left
planum temporale for 2/11 and right planum temporale for
3/11, in the left posterior parietal cortex for 3/11, and in the
right anterior insula for 2/11 subjects. On average, we fitted 5.3
(minimum: 4, maximum: 7) dipole sources to the magnetic field
evoked by S1 presentation for each single subject. While Figure 3
shows the evoked magnetic field topography, Figure 4 depicts
the corresponding dipole models for 2 representative subjects.
The left HG source exhibited an N1m component at about
113 (±14) ms and the right HG source at about 112 (±12) ms
Figure 2. Averaged vector sums of the evoked magnetic fields in Experiment 1. (a) Group-averaged (n 5 11) time courses of the evoked magnetic fields for left and righttemporal sensors. (b) Average S1--S2 reduction of the peak amplitudes for the evoked magnetic field. Error bars depict mean standard errors.
Cerebral Cortex June 2008, V 18 N 6 1353
by guest on June 22, 2016http://cercor.oxfordjournals.org/
Dow
nloaded from

after S2 onset and was followed by a P2m component at 211
(±33) ms in left HG and at 223 (±27) ms for the right HG. For
the left STG source, we observed a P2m component at about
215 (±28) ms after S2 onset and for the right STG at 209 (±22)ms. As shown in Figure 5a, we did not observe significant
differences across conditions for the N1m component in HG
(left HG—stimulus category: F1,10 = 1.22, P = 0.29; repetition:
F1,10 < 1, P = 0.90; interaction: F1,10 < 1, P = 0.91; right HG—
stimulus category: F1,10 < 1, P = 0.98; repetition: F1,10 = 3.46, P =0.09; interaction: F1,10 < 1, P = 0.95). Interestingly, the P2m
component within the right HG exhibited significantly larger
amplitude reductions when the same stimuli were repeated
(F1,7 = 9.13, P < 0.05) and a tendency for such a repetition
effect within the left HG (F1,8 = 4.94, P = 0.06). For both left and
right STG, we observed a significant item-specific adaptation
effect for the P2m component (left STG: F1,6 = 6.58, P < 0.05;
right STG: F1,8 = 5.15, P < 0.05), but no main effect for the
stimulus category (left STG: F1,6 < 1, P = 0.43; right STG:
F1,8 < 1, P = 0.86), and no interaction between the factors
repetition and stimulus category (left STG: F1,6 < 1, P = 0.75;
right STG: F1,8 < 1, P = 0.78). There were no significant effects
for the peak latencies across conditions (P > 0.05 for all re-
peated measurement ANOVAs). Thus, item-specific adaptation
effects were observed for the P2 component amplitude in the
bilateral STG and right lateral HG.
As depicted in Figure 5b, the STG sources were localized
mainly lateral to the HG sources. The position of the STG
sources varied between subjects along the anterior--posterior
axis. As shown in Table 1, the spatial location of the dipole
sources did not show significant differences across conditions
(P > 0.05 for all 2-way repeated measurement ANOVAs with
factors stimulus category and repetition).
Experiment 2: Cross-Adaptation between AnimalVocalizations and Noise Sounds
In Experiment 2, we tested for cross-adaptation between ani-
mal vocalizations and noise sounds. A 4-way repeated measure-
ments ANOVA on the N1m and P2m components revealed
a significant main effect for repetition (F1,10 = 5.08, P < 0.05)
and an interaction between component and repetition (F1,10 =5.15, P < 0.05). As depicted in Figure 6a,b, the reductions from
S1 to S2 showed no differences across conditions for the N1m
component (hemisphere: F1,10 < 1, P = 0.71; stimulus order:
F1,10 < 1, P = 0.76; repetition: F1,10 = 1.94, P = 0.19). However,
the P2m component showed cross-adaptation effects between
animal vocalizations and their matched noise sounds (repeti-
tion: F1,10 = 6.61, P < 0.05) but no effects of hemisphere
(F1,10 < 1, P = 0.55) or stimulus order (F1,10 < 1, P = 0.89).
Similar to Experiment 1, we obtained multiple dipole models
for Experiment 2. While clear N1m components were observed
in the bilateral HG for all subjects, a P2m component was found
in 11/11 for left HG, 10/11 subjects in right HG, 6/11 in left
STG, and 9/11 in right STG. As shown in Figure 6c, repetition
effects were observed for the P2m component in the bilateral
STG only (left STG: F1,5 = 7.45, P < 0.05; right STG: F1,8 = 8.09,
P < 0.05) but not for the N1m component in HG (left HG: F1,10 =3.68, P = 0.08; right HG: F1,10 < 1, P = 0.71) or for the P2m
component in HG (left HG: F1,10 = 1.83, P = 0.21; right HG:
F1,9 = 3.12, P = 0.11). Additionally, we found an effect of
stimulus order for the P2m component within HG (left HG:
F1,10 = 9.46, P < 0.05; right HG: F1,9 = 6.64, P < 0.05), that is,
more reduction when an animal vocalization was preceded by
a noise sound compared with when an animal vocalization
preceded a noise sound. Thus, cross-adaptation effects be-
tween animal vocalizations and noise sounds were observed for
the P2 component amplitude in the bilateral STG, similar to the
adaptation effects seen in Experiment 1.
Discussion
Employing an MEG adaptation paradigm, we observed 2 forms
of repetition induced response attenuation in the human
auditory cortex. First, our data suggest item-unspecific ampli-
tude reductions for the N1m component at about 100 ms after
stimulus onset. More specifically, the N1m component showed
reductions not only when 2 identical but also when 2 different
Figure 3. Topography of the evoked magnetic field for 2 representative subjects. (a and b) The topography of the evoked magnetic field for the N1m and P2m componentsuperimposed onto a standard head surface.
1354 Adaptation to Natural Sounds d Altmann et al.
by guest on June 22, 2016http://cercor.oxfordjournals.org/
Dow
nloaded from

sounds were repeated. This component was followed by item-
specific amplitude reductions of the P2m component at about
200 ms after stimulus onset, that is, reductions occurred only
when the same stimulus was repeated. Furthermore, in a second
experiment, we observed cross-adaptation between animal
vocalizations and spectrally matched noise sounds for the P2m
component. Because animal vocalizations and noise sounds
shared the overall spectral content, but not temporospectral
properties or meaning, we suggest an involvement of the P2m
component in spectral processes.
In studies investigating auditory evoked potentials (AEPs),
the P2 component is usually observed 150--250 ms after the
onset of an auditory stimulus (Crowley and Colrain 2004) and
has been shown to exhibit enhancements after training in
a pitch discrimination task (Bosnyak et al. 2004) and vowel
discrimination (Reinke et al. 2003). Increases of the P2
amplitude have been observed after speech training (Trembley
and Kraus 2002), and the P2 amplitude has been suggested to
be a marker for musical experience (Shahin et al. 2003).
Similarly, the P2m component, the magnetic counterpart of the
Figure 4. Dipole models for 2 representative subjects. (a and c) The location of the estimated dipoles (condition: animal vocalization different) superimposed on the individualsubject’s cortical surface reconstruction. Sources within lateral HG are depicted in red, STG sources are depicted in light blue, and all other estimated dipoles are depicted ingreen. Dashed circles show the location of occluded source centers. (b and d) The source waveforms for the estimated dipoles (HG and STG).
Cerebral Cortex June 2008, V 18 N 6 1355
by guest on June 22, 2016http://cercor.oxfordjournals.org/
Dow
nloaded from

P2 response as determined in MEG studies has been shown to
be enhanced in long-term trained musicians during listening to
musical instrument tones (Kuriki et al. 2006). However, pre-
vious AEP studies reported modulation of the P2 amplitude not
only by discrimination training but also by mere repetition
of speech sounds (Sheehan et al. 2005). Furthermore, the P2
amplitude is possibly not only modulated by long-term or short-
term plasticity, but it also showed sensitivity to acoustic stim-
ulus features such as the spectral complexity of musical sounds
(Shahin et al. 2005).
In the present study, source modeling has suggested that the
generators of the P2m are located along the bilateral STG and
within the lateral HG. This corroborates previous findings that
suggested secondary auditory cortex lateral to HG as generator
of the P2 component investigated in AEP studies (Scherg et al.
1989; Picton et al. 1999; Bosnyak et al. 2004; Shahin et al. 2005).
MEG studies on complex sound, vowel, and music processing
have shown that the sources of the P2m component are ante-
rior to the N1m sources (Tiitinen et al. 1999; Kuriki et al. 2006;
Hoshiyama et al. 2007). However, our findings suggest inter-
individual variability of P2m source localization. More specif-
ically, we observed P2m sources both anterior and posterior to
the N1m source. A previous study combined MEG recordings
and intracerebral recordings and obtained similar results, that
is, source localizations both anterior and posterior to HG
(Godey et al. 2001). The authors proposed that multiple sources
in the superior temporal cortex might underlie P2m generation.
A recent fMRI study suggested involvement of the left STG in
the selective representation of animal vocalizations (Altmann
et al. 2007). In contrast to the present study, the natural
a)
Noise DifferentNoise Same
Animal SameAnimal Different
left HG - N1m right HG - N1m left STG - P2m right STG - P2m 0.0
0.2
0.4
0.6
Red
uctio
n R
ates
(R
1-R
2)/R
1
b)
-70 -60 -50 -40 -30 -20 0 10 20 30 40 50 60 70
-10
0
10
20
30
40
50
-10
x-coordinate [mm]
y-co
ordi
nate
[mm
]
y-coordinate [mm]
STGHG
-1001020304050
40
50
60
70
80
90
100
-20
y-coordinate [mm]
z-co
ordi
nate
[mm
]
-10 0 10 20 30 40 50
40
50
60
70
80
90
100
-20
z-co
ordi
nate
[mm
]
left HG - P2m right HG -P2m
Dipole locations in Head-coordinate system for Experiment 1
Average reduction rates of source dipole moments for Experiment 1
Figure 5. (a) Average S1--S2 reduction of peak amplitudes for the source dipole moments in Experiment 1. For the left and right HG sources, both the N1m and P2m amplitudereductions are shown (left 4 bar graphs). For left and right STG source, the P2m amplitude reductions are shown (right 2 bar graphs). Error bars depict mean standard errorsacross subjects. (b) Source dipole locations for all subjects averaged across conditions for the HG and STG dipoles in a head coordinate system. The upper 2 graphs show theposition in the x--y coordinate plane and the lower 2 graphs in the y--z coordinate plane.
1356 Adaptation to Natural Sounds d Altmann et al.
by guest on June 22, 2016http://cercor.oxfordjournals.org/
Dow
nloaded from

amplitude envelope of the stimuli was preserved in this fMRI
experiment. Adaptation effects were observed for the animal
vocalizations only, and no cross-adaptation between animal
vocalizations and spectrally matched control stimuli was ob-
served. This suggested selective representation of the spec-
trotemporal dynamics of the stimuli rather than simple spectral
features. In contrast, our present results showed adaptation
effects for the P2m component for both the animal vocal-
izations and spectrally matched noise and cross-adaptation
between the 2 sound categories. Thus, the P2m component
appears to be more related to the representation of the spectral
fine structure of auditory stimuli rather than temporal features.
The lack of adaptation effects that are specific to the animal
vocalizations might be accounted for by the similarity of the
temporal amplitude envelope between animal vocalizations and
noise sounds in the present study. The discrepancy between
fMRI adaptation effects and the P2m reductions in the STG
possibly indicates the colocalization of different processes in
higher order auditory areas. Accordingly, areas in the superior
temporal lobe have been associated with processing of both
temporal and spectral aspects of auditory stimuli. For example,
recent fMRI studies have revealed overlapping areas within the
lateral HG and the planum temporale that are sensitive to both
amplitude and frequency-modulated tones (Giraud et al. 2000;
Hart et al. 2003). fMRI studies that investigated brain responses
to changes in the spectral envelope of noise and harmonic
sounds showed selectivity for the spectral envelope in the right
STS (Warren et al. 2005).
The spatial estimation of the N1m component in this study
are in line with intracerebral recordings (Godey et al. 2001;
Yvert et al. 2005) that suggested auditory cortex in interme-
diate and lateral HG and the planum temporale as generators.
Similarly, combined MEG/fMRI studies employing an fMRI-
weighted source estimation approach provided evidence for 2
N1m generators in the anterolateral HG and posterior STG/
planum temporal and proposed for the N1m component an
important role as a marker for neuronal adaptation (Jaaskelai-
nen et al. 2004; Ahveninen et al. 2006). More specifically, the
N1m response has been shown to exhibit stimulus-specific
amplitude reductions when pure tones or vowels were re-
peatedly presented. In contrast, in the present study, adapta-
tion effects were restricted to the P2m response. This finding is
in line with recent MEG evidence that provided evidence for
P2m-amplitude reductions due to repetition of a complex tone
(Hoshiyama et al. 2007). In this study, the N1m was not
sensitive to the spectral fine structure of the stimulus. Possibly,
the N1m response is determined by both adaptation and lateral
inhibition effects. In particular, lateral inhibition occurs
between neurons with neighboring frequency tuning as
suggested by MEG studies (Pantev et al. 1999, 2004; Okamoto
et al. 2004). For the P2m response, such lateral inhibition
effects have not been observed (Okamoto et al. 2005), but
further research is needed to clarify inhibitory processes
related to the P2m component. Thus, due to the broadband
spectral properties of the employed stimuli, the N1m might
have been affected by both adaptation and inhibition effects,
whereas the P2m showed a clear adaptation effect, possibly less
affected by lateral inhibition. Alternatively, because the N1m
component has been proposed to be particularly sensitive to
sound onset parameters (Biermann and Heil 2000), it is also
possible that the lack of item-specific adaptation effects for the
N1m component can be accounted for by the similarity of
sounds regarding their onset parameters. In the present study,
all noise stimuli and animal vocalizations had a similar
amplitude envelope. Employing sounds with preserved natural
amplitude modulation might lead to item-specific adaptation
effects for the N1 component.
Thus, although the N1m components generated within the
lateral HG did not exhibit item-selective adaptation effects,
sources within right lateral HG and along the bilateral STG
adapted in a item-specific manner at about 200 ms after
stimulus onset. Further research is required to systematically
test the sensitivity of the N1m and P2m components to
different types of auditory stimuli with varying degrees of
acoustic and semantic complexity.
Conclusions
In sum, our study provides evidence for item-specific adapta-
tion effects for the P2m component, at about 200 ms after
stimulus onset. Multiple dipole source analysis suggested
nonprimary auditory cortex within right lateral HG and along
the bilateral STG as the underlying cortical substrate. Item-
specific adaptation effects were not limited to animal vocal-
izations but were also observed for spectrally matched noise.
Furthermore, we observed cross-adaptation between animal
vocalizations and spectrally matched but spectrotemporally
different noise sounds for the P2m component within bilateral
STG. These findings suggest that adaptation effects for the P2m
component are based on the spectral structure of the auditory
stimulus rather than the temporal dynamics or the meaning of
the sound. Thus, we propose an implication of the auditory
P2m component in the processing of spectrally complex
sounds and a role in both short- and long-term plasticity of
auditory cortex.
Funding
Japan Society for the Promotion of Science fellowship to C.F.A.
Notes
The authors are most grateful to Yasuyuki Takeshima, Osamu Nagata,
and Masahiro Hirai for technical assistance. Conflict of Interest: None
declared.
Table 1Head-related coordinates in mm ± standard deviation averaged across subjects for the HG and
STG sources in Experiment 1
Source Condition x y z
HG, left Animal, same �49 ± 7 13 ± 7 63 ± 9Animal, different �51 ± 8 13 ± 7 63 ± 7Noise, same �48 ± 6 13 ± 6 62 ± 8Noise, different �49 ± 10 14 ± 7 62 ± 6
HG, right Animal, same 52 ± 6 20 ± 5 60 ± 6Animal, different 51 ± 6 18 ± 7 60 ± 6Noise, same 52 ± 5 19 ± 6 60 ± 6Noise, different 54 ± 4 19 ± 7 62 ± 4
STG, left Animal, same �56 ± 10 13 ± 17 59 ± 7Animal, different �55 ± 10 15 ± 17 62 ± 9Noise, same �55 ± 9 14 ± 17 60 ± 8Noise, different �55 ± 10 12 ± 18 61 ± 9
STG, right Animal, same 56 ± 7 11 ± 15 56 ± 10Animal, different 55 ± 7 12 ± 14 56 ± 10Noise, same 56 ± 6 13 ± 15 54 ± 8Noise, different 57 ± 7 13 ± 14 57 ± 9
Cerebral Cortex June 2008, V 18 N 6 1357
by guest on June 22, 2016http://cercor.oxfordjournals.org/
Dow
nloaded from

Figure 6. Averaged vector sums of the evoked magnetic fields in Experiment 2. (a) Group-averaged (n 5 11) time courses of the evoked magnetic fields for left and righttemporal sensors. (b) Average S1--S2 reduction of the peak amplitudes for the evoked magnetic field. (c) Average S1--S2 reduction of peak amplitudes for the source dipolemoments in Experiment 2. For the left and right HG sources, both the N1m and P2m amplitude reductions are shown (left 4 bar graphs). For left and right STG source, the P2mamplitude reductions are shown (right 2 bar graphs). Error bars depict mean standard errors across subjects.
1358 Adaptation to Natural Sounds d Altmann et al.
by guest on June 22, 2016http://cercor.oxfordjournals.org/
Dow
nloaded from

Address correspondence to Christian F. Altmann, Institute of Medical
Psychology, Heinrich-Hoffmann-Strasse 10, 60528 Frankfurt am Main,
Germany. Email: [email protected].
References
Ahveninen J, Jaaskelainen IP, Raij T, Bonmassar G, Devore S,
Hamalainen M, Levanen S, Lin FH, Sams M, Shinn-Cunningham BG,
et al. 2006. Task-modulated ‘‘what’’ and ‘‘where’’ pathway in human
auditory cortex. Proc Natl Acad Sci USA. 103:14608--14613.
Altmann CF, Deubelius A, Kourtzi Z. 2004. Shape saliency modulates
contextual processing in the human lateral occipital complex. J
Cogn Neurosci. 16:794--804.
Altmann CF, Doehrmann O, Kaiser J. 2007. Selectivity for animal
vocalizations in the human auditory cortex. Cereb Cortex. doi:
10.1093/cercor/bhl167.
Belin P, Zatorre RJ, Lafaille P, Ahad P, Pike B. 2000. Voice-selective areas
in the human auditory cortex. Nature. 403:309--312.
Bergerbest D, Ghahremani DG, Gabrieli JD. 2004. Neural correlates of
auditory repetition priming: reduced fMRI activation in the auditory
cortex. J Cogn Neurosci. 16:966--977.
Biermann S, Heil P. 2000. Parallels between timing of onset responses of
single neurons in cat and of evoked magnetic fields in human
auditory cortex. J Neurophysiol. 84:2426--2439.
Bonte M, Parviainen T, Hytonen K, Salmelin R. 2006. Time course of
top-down and bottom-up influences of syllable processing in the
auditory cortex. Cereb Cortex. 16:115--123.
Bosnyak DJ, Eaton RA, Roberts LE. 2004. Distributed auditory cortical
representations are modified when non-musicians are trained at
pitch discrimination with 40 Hz amplitude modulated tones. Cereb
Cortex. 14:1088--1099.
Crowley KE, Colrain IM. 2004. A review of the evidence for P2 being an
independent component process: age, sleep and modality. Clin
Neurophysiol. 115:732--744.
Fecteau S, Armony JL, Joanette Y, Belin P. 2004. Is voice processing
species-specific in human auditory cortex? An fMRI study. Neuro-
image. 23:840--848.
Fecteau S, Armony JL, Joanette Y, Belin P. 2005. Sensitivity to voice in
human prefrontal cortex. J Neurophysiol. 94:2251--2254.
Giraud AL, Lorenzi C, Ashburner J, Wable J, Johnsrude I, Frackowiak R,
Kleinschmidt A. 2000. Representation of the temporal envelope of
sounds in the human brain. J Neurophysiol. 84:1588--1598.
Giraud AL, Price CJ. 2001. The constraints functional neuroimaging
places on classical models of auditory word processing. J Cogn
Neurosci. 13:754--765.
Godey B, Schwartz D, de Graaf JB, Chauvel P, Liegeois-Chauvel C. 2001.
Neuromagnetic source localization of auditory evoked fields and
intracerebral evoked potentials: a comparison of data in the same
patients. Clin Neurophysiol. 112:1850--1859.
Grill-Spector K, Henson R, Martin A. 2006. Repetition and the brain:
neural models of stimulus-specific effects. Trends Cogn Sci.
10:14--23.
Grill-Spector K, Kushnir T, Edelman S, Avidan G, Itzchak Y, Malach R.
1999. Differential processing of objects under various viewing
conditions in the human lateral occipital complex. Neuron.
24:187--203.
Hari R, Joutsiniemi S-L, Sarvas J. 1988. Spatial resolution of neuro-
magnetic records: theoretical calculations in a spherical model.
Electroencephalogr Clin Neurophysiol. 71:64--72.
Hart HC, Palmer AR, Hall DA. 2003. Amplitude and frequency-
modulated stimuli activate common regions of human auditory
cortex. Cereb Cortex. 13:773--781.
Hoshiyama M, Okamoto H, Kakigi R. 2007. Priority of adaptation to
mismatch response following undiscriminable auditory stimulation:
a magnetoencephalographic study. Eur J Neurosci. 25:854--862.
Inui K, Okamoto H, Miki K, Gunji A, Kakigi R. 2006. Serial and parallel
processing in the human auditory cortex: a magnetoencephalo-
graphic study. Cereb Cortex. 16:18--30.
Inui K, Wang X, Tamura Y, Kaneoke Y, Kakigi R. 2004. Serial processing
in the human somatosensory system. Cereb Cortex. 14:851--857.
Jaaskelainen IP, Ahveninen J, Bonmassar G, Dale AM, Ilmoniemi RJ,
Levanen S, Lin FH, May P, Melcher J, Stufflebeam S, et al. 2004.
Human posterior auditory cortex gates novel sounds to conscious-
ness. Proc Natl Acad Sci USA. 101:6809--6814.
James TW, Humphrey GK, Gati JS, Menon R, Goodale MA. 2002.
Diferential effects of viewpoint on object-driven activation in dorsal
and ventral streams. Neuron. 35:793--801.
Kaiser J, Lutzenberger W, Ackermann H, Birbaumer N. 2002. Dynamics
of gamma-band activity induced by auditory pattern changes in
humans. Cereb Cortex. 12:212--221.
Kuriki S, Kanda S, Hirata Y. 2006. Effects of musical experience on
different components of MEG responses elicited by sequential
piano-tones and chords. J Neurosci. 26:4046--4053.
Lewis JW, Brefczynski JA, Phinney RE, Janik JJ, DeYoe EA. 2005. Distinct
cortical pathways for processing tool versus animal sounds. J
Neurosci. 25:5148--5158.
Lewis JW, Wightman FL, Brefczynski JA, Phinney RE, Binder JR,
DeYoe EA. 2004. Human brain regions involved in recognizing
environmental sounds. Cereb Cortex. 14:1008--1021.
Maeder PP, Meuli RA, Adriani M, Bellmann A, Fornari E, Thiran JP,
Pittet A, Clarke S. 2001. Distinct pathways involved in sound recog-
nition and localization: a human fMRI study. Neuroimage. 14:802--816.
Marcell MM, Borella D, Greene M, Kerr E, Rogers S. 2000. Confrontation
naming of environmental sounds. J Clin Exp Neuropsychol. 22:
830--864.
Murray MM, Camen C, Gonzalez Andino SL, Bovet P, Clarke S. 2006.
Rapid brain discrimination of sounds of objects. J Neurosci. 26:
1293--1302.
Nishitani N, Hari R. 2002. Viewing lip forms: cortical dynamics. Neuron.
36:1211--1220.
Noguchi Y, Inui K, Kakigi R. 2004. Temporal dynamics of neural adap-
tation effect in the human visual ventral stream. J Neurosci. 14:
6283--6290.
Okamoto H, Kakigi R, Gunji A, Kubo T, Pantev C. 2005. The depen-
dence of the auditory evoked N1m decrement on the bandwidth of
preceding notch-filtered noise. Eur J Neurosci. 21:1957--1961.
Okamoto H, Ross B, Kakigi R, Kubo T, Pantev C. 2004. N1m recovery
from decline after exposure to noise with strong spectral contrasts.
Hear Res. 196:77--86.
Pantev C, Okamoto H, Ross B, Stoll W, Ciurlia-Guy E, Kakigi R, Kubo T.
2004. Lateral inhibition and habituation of the human auditory
cortex. Eur J Neurosci. 19:2337--2344.
Pantev C, Wollbrink A, Roberts LE, Engelien A, Lutkenhoner B. 1999.
Short-term plasticity of the human auditory cortex. Brain Res.
842:192--199.
Picton TW, Alain C, Woods DL, John MS, Scherg M, Valdes-Sosa P,
Bosch-Bayard J, Trujillo NJ. 1999. Intracerebral sources of human
auditory evoked potentials. Audiol Neurootol. 4:64--79.
Poremba A, Malloy M, Saunders RC, Carson RE, Herscovitch P,
Mishkin M. 2004. Species-specific calls evoke asymmetric activity
in the monkey’s temporal poles. Nature. 427:448--451.
Rauschecker JP. 1997. Processing of complex sounds in the auditory
cortex of cat, monkey, and man. Acta Otolaryngol Suppl. 532:34--38.
Rauschecker JP. 1998. Parallel processing in the auditory cortex of
primates. Audiol Neurootol. 3:86--103.
Rauschecker JP, Tian B. 2000. Mechanisms and streams for processing
of ‘‘what’’ and ‘‘where’’ in auditory cortex. Proc Natl Acad Sci USA.
97:11800--11806.
Rauschecker JP, Tian B, Hauser M. 1995. Processing of complex sounds
in the macaque nonprimary auditory cortex. Science. 268:111--114.
Reinke KS, He Y, Wang C, Alain C. 2003. Perceptual learning modulates
sensory evoked response during vowel segregation. Brain Res Cogn
Brain Res. 17:781--791.
Scherg M, Vajsar J, Picton TW. 1989. A source analysis of the late human
auditory evoked potentials. J Cogn Neurosci. 1:336--355.
Shahin A, Bosnyak DJ, Trainor LJ, Roberts LE. 2003. Enhancement of
neuroplastic P2 and N1c auditory evoked potentials in skilled
musicians. J Neurosci. 23:5545--5552.
Shahin A, Roberts LE, Pantev C, Trainor LJ, Ross B. 2005. Modulation of
P2 auditory-evoked responses by the spectral complexity of musical
sounds. Neuroreport. 16:1781--1785.
Sheehan KA, McArthur GM, Bishop DVM. 2005. Is discrimination
training necessary to cause changes in the P2 auditory event-related
Cerebral Cortex June 2008, V 18 N 6 1359
by guest on June 22, 2016http://cercor.oxfordjournals.org/
Dow
nloaded from

brain potential to speech sounds? Brain Res Cogn Brain Res.
25:547--553.
Supek S, Aine CJ. 1993. Simulation studies of multiple dipole
neuromagnetic source localization: model order and limits of
source resolution. IEEE Trans Biomed Eng. 40:529--540.
Tarkiainen A, Helenius P, Salmelin R. 2003. Category-specific occipito-
temporal activation during face perception in dyslexic individuals:
an MEG study. Neuroimage. 19:1194--1204.
Tian B, Reser D, Durham A, Kustov A, Rauschecker JP. 2001. Functional
specialization in rhesus monkey auditory cortex. Science. 292:
290--293.
Tiitinen H, Sivonen P, Alku P, Virtanen J, Naatanen R. 1999. Elec-
tromagnetic recordings reveal latency differences in speech and
tone processing in humans. Brain Res Cogn Brain Res. 8:355--363.
Tootell RB, Hadjikhani NK, Vanduffel W, Liu AK, Mendola JD, Sereno MI,
Dale AM. 1998. Functional analysis of primary visual cortex (V1) in
humans. Proc Natl Acad Sci USA. 95:811--817.
Trembley KN, Kraus N. 2002. Auditory training induces asymmetrical
changes in cortical neural activity. J Speech Lang Hear Res. 45:
564--572.
Warren JD, Jennings AR, Griffiths TD. 2005. Analysis of the spectral en-
velope of sounds by the human brain. Neuroimage. 24:1052--1057.
Wasaka T, Hoshiyama M, Nakata H, Nishihira Y, Kakigi R. 2003. Gating
of somatosensory evoked magnetic fields during the preparatory pe-
riod of self-initiated finger movement. Neuroimage. 20:1830--1838.
Yvert B, Fischer C, Bertrand O, Pernier J. 2005. Localization of human
supratemporal auditory areas from intracerebral auditory evoked po-
tentials using distributed source models. Neuroimage. 28:140--153.
1360 Adaptation to Natural Sounds d Altmann et al.
by guest on June 22, 2016http://cercor.oxfordjournals.org/
Dow
nloaded from


