Embed Size (px)
Citation preview

1 23
BiogeochemistryAn International Journal ISSN 0168-2563 BiogeochemistryDOI 10.1007/s10533-012-9700-9
Temporal variation in river nutrient anddissolved lignin phenol concentrations andthe impact of storm events on nutrientloading to Hood Canal, Washington, USA
Nicholas D. Ward, Jeffrey E. Richey &Richard G. Keil

1 23
Your article is protected by copyright and
all rights are held exclusively by Springer
Science+Business Media B.V.. This e-offprint
is for personal use only and shall not be self-
archived in electronic repositories. If you
wish to self-archive your work, please use the
accepted author’s version for posting to your
own website or your institution’s repository.
You may further deposit the accepted author’s
version on a funder’s repository at a funder’s
request, provided it is not made publicly
available until 12 months after publication.

Temporal variation in river nutrient and dissolved ligninphenol concentrations and the impact of storm eventson nutrient loading to Hood Canal, Washington, USA
Nicholas D. Ward • Jeffrey E. Richey •
Richard G. Keil
Received: 13 April 2011 / Accepted: 31 December 2011
� Springer Science+Business Media B.V. 2012
Abstract Rapid rainfall events can be responsible
for a large proportion of annual nutrient and carbon
loading from a watershed. The bioavailability of
organic matter during these rapid loading events
increases, suggesting that storms play a relevant role
in the mobilization of potentially labile terrestrial
carbon. A high correlation between river discharge
rates and dissolved and particulate nutrient and carbon
concentrations during autumn and winter storms was
observed in several temperate Pacific Northwest
rivers. Dissolved and particulate lignin concentrations
also increased with river discharge; for example,
in October 2009 dissolved lignin concentrations
increased roughly 240% with a 200% increase in river
discharge. During these storms a unique phenolic
composition was observed for dissolved lignin that
was rapidly mobilized from surface soils relative to the
base flow of dissolved lignin. The observed increase in
Ad/Al ratios with discharge indicates that rapidly
mobilized dissolved lignin is more degraded than the
base flow of dissolved lignin. Similarly, a marked
increase in C/V ratios and decrease in the S/V ratio of
dissolved lignin phenols with increasing river dis-
charge was observed. These results may indicate a
difference in source between mobilized and base flow
pools, or, more likely, preferential degradation and
mobilization/retention of specific lignin phenols. The
cumulative results from this year-long data set indicate
that a shallow nutrient-rich pool of particulate and
dissolved organic matter accumulates in watersheds
during periods of soil-saturation deficiency (summer).
Autumn and winter storms mobilize this pool of
accumulated nutrients from surface soils, which is
exhausted with successive winter storms.
Keywords Fluvial � Lignin � Mobilization �Nutrients � Organic carbon � Storm runoff
Introduction
The magnitude of nutrient export from a watershed has
been demonstrated to be closely coupled with the rate
of water discharge on seasonal time scales (Guillaud
et al. 2008). Studies have also shown a tight coupling
between river discharge rates and dissolved nitrogen
and carbon concentrations on timescales from days to
weeks (e.g. Boyer et al. 1997; Hinton et al. 1998;
Buffam et al. 2001; Sigleo and Frick 2003). Rapid
loading events have been estimated to contribute to as
much as 86% of annual OC export in forested
watersheds (Raymond and Saiers 2010) and 71–85%
of OC export in agricultural watersheds (Dalzell et al.
2007). Furthermore, it has been shown that organic
matter (OM) biodegradability significantly increases
N. D. Ward (&) � J. E. Richey � R. G. Keil
School of Oceanography, University of Washington,
P. O. Box 355351, Seattle, WA 98195-5351, USA
e-mail: [email protected]
123
Biogeochemistry
DOI 10.1007/s10533-012-9700-9
Author's personal copy

with peak discharge in both temperate and high-
latitude river systems, suggesting that storm events
play a significant role in mobilization of potentially
labile terrestrial carbon (Buffam et al. 2001; Holmes
et al. 2008; Fellman et al. 2009). Small streams are the
primary source of terrestrial material to river systems
because of the tight land–water interface; rapidly
changing conditions at this spatial scale leads to
dynamic chemical conditions within the stream
(Vannote et al. 1980; Peterson et al. 2001; McClain
and Elsenbeer 2001).
Our understanding of downstream N cycling has
been greatly improved by various 15N tracer studies,
which allow the quantification of important processes
such as nitrification and subsequent NO3- and NH4
?
uptake (e.g. Mulholland et al. 2000; Peterson et al.
2001; Webster et al. 2003; Deegan et al. 2011).
Observations of short term compositional changes in
stream OC such as increases in aromaticity, detected
by specific UV absorbance, with peak discharge have
allowed for a more detailed characterization of OC and
hydrologic flowpaths (Hood et al. 2006; Vidon et al.
2008; van Verseveld et al. 2009). Spatial analysis
suggests that distinct landscape units become func-
tional during these hydrologic events, altering nutrient
and dissolved organic carbon (DOC) mobilization
dynamics throughout the course of a storm (Hinton
et al. 1998; McGlynn and McDonnell 2003; Ocampo
et al. 2006). However, the mechanistic mobilization
dynamics of inorganic and organic constituents from
the terrestrial biome are still not well constrained.
Input of nutrient-rich freshwater has been shown to
cause eutrophication in nutrient-limited estuarine or
coastal systems, which under certain conditions results
in hypoxic events due to microbial respiration of
sinking bloom-derived OM (Rabalais et al. 2001;
Howarth and Marino 2006). Observations in Hood
Canal, Washington—a branch of the Puget Sound
estuary where this study is focused—have shown that
low dissolved oxygen conditions in Hood Canal,
especially in the southernmost Lynch Cove region
(Fig. 1), have become more persistent and widespread
in recent decades compared to the 1930s–1960s,
resulting in increased frequency of hypoxic and fish
kill events (Newton et al. 1995, 2002). One possible
driver for the observed increase in frequency of
hypoxic events is an increase in watershed nutrient
loading rates. Changes in land use can have profound
effects on the chemical composition of a stream and
greatly influence the potential for watershed nutrient
delivery (Biggs et al. 2004; Thomas et al. 2004; Neill
et al. 2006). Recent increases in urbanization and N2
fixing red alder tree prevalence has likely influenced
the nutrient inventory of the Hood Canal watershed
(Newton et al. 2002). Thus, understanding the timing
and magnitude of river nutrient delivery is critical for
predicting potential impacts of a watershed on the
basin in which it drains. Furthermore, in order to
assess the fate of terrestrially derived OM in the
context of global biogeochemical cycling, it is crucial
to first understand the mechanisms by which OM is
mobilized from land into river systems.
In this study, we measured variability in stream
nutrient and OM concentration and composition at a
fine temporal resolution in an effort to enhance our
understanding of the dynamical coupling of hydro-
logic and geochemical fluxes into streams. Storm
events were sampled over a three to 4 day period on a
3–4 h interval for an entire year in the Skokomish and
Union Rivers, which drain into the Lynch Cove region
of Hood Canal (Fig. 1). In addition to the measure-
ment of dissolved nutrients and particulate OM,
dissolved lignin phenol concentrations were measured
to determine changes in the composition and source of
DOC throughout the course of a storm. Lignin is a
terrestrial biomarker unique to vascular plants that can
be used as an indicator of the OM source (e.g. Hedges
and Ertel 1982; Goni and Hedges 1992); changes in
phenolic ratios throughout a storm were used to
determine variation in the composition of OM mobi-
lized by base flow and rapid shallow flow. The goal of
this study is two-fold: to assess the impact of short
term storm events on nutrient loading rates and
hypoxia in Hood Canal, Washington and to gain a
better understanding of the mechanisms behind nutri-
ent and OM mobilization in an effort to improve
predictive capabilities concerning the fate of terres-
trially derived material in the context of global
biogeochemical cycling.
Methods
Study area
The Hood Canal watershed (Fig. 1) has a surface area
of *3,050 km2, of which Hood Canal itself comprises
12%. The watershed can be separated into three zones:
Biogeochemistry
123
Author's personal copy

Fig. 1 (Top) Modeled
dissolved O2 concentrations
in the Hood Canal basin
during the August 2006
hypoxic event (HCDOP
Citizen Monitoring Data and
UW Spatial Analysis Lab
projection). (Bottom) Map
of the Hood Canal drainage
basin. Sample sites for this
study are a the Skokomish
River, which is relatively
large, and b the Union River,
which is representative of
the many small streams that
compose the Kitsap
Peninsula watershed
(PRISM Internet Map
Server)
Biogeochemistry
123
Author's personal copy

(1) the large mountainous watersheds of the Olympic
Mountains with hydrographs dominated by snowmelt,
(2) the Skokomish River (the largest catchment in the
watershed), and (3) the smaller, lower elevation
watersheds that dominate the Kitsap Peninsula and
the southern, southeastern, and northwestern parts of
Hood Canal. More than 60% of the total annual
precipitation occurs between November and January,
and less than 10% occurs between June and August
(Peterson et al. 1997). Similarly, TDN concentrations
in the Skokomish and Union Rivers peak during
autumn and winter months and reach a minimum
during dry summer months (Steinberg et al. 2010).
Hood Canal is characterized by slow marine flushing
rates. Low DO conditions are most prevalent in the
southernmost Lynch Cove region of Hood Canal,
where DO concentrations less than 5 mg l-1 were
observed below the pycnocline every month of the
year from 1998 to 2000 (Fig. 1; Newton et al. 2002).
For this reason, we focused on the two rivers
representative of those draining primarily into the
Lynch Cove region, the Skokomish and Union Rivers.
The Skokomish River catchment, accounting for
*22% of the freshwater input into Hood Canal with
an average annual runoff rate of 3.2 m/year and
discharge of 37.6 m3/s, is situated in the southwest
portion of the watershed, where annual precipitation
rates are generally highest (Steinberg et al. 2010). The
Skokomish catchment is sparsely populated with 0–4
people/km2 and is primarily mature coniferous forest
(46%) managed as national parks, and national or
commercial forest (Steinberg et al. 2010).
The Union River drains into the southeast tip of
Lynch Cove. The Union River and the numerous
similar lowland draining streams account for *24%
of the freshwater input into Hood Canal with a runoff
rate of 1.1 m/year (Steinberg et al. 2010). Compared
to the Skokomish catchment, these lowland catch-
ments have experienced more disturbance by clear-
ing, suburban development, and wetland draining
(Ness and Fowler 1960 McCreary 1975; McMurphy
1980). These watersheds have moderate population
densities averaging 20 people/km2. Dominant land
use is primarily coniferous (*23% mature, *15%
young) and mixed deciduous (*30%) forests (Stein-
berg et al. 2010). Approximately 50% of the land
covered by mixed deciduous forest consists of
N2-fixing red alder trees (L. McGeoch, unpublished
data).
Sampling and analysis
Samples were collected at three to 4 h intervals
depending on forecasted storm duration using
Teledyne ISCO autosamplers placed roughly 4 km
upstream of the river mouths of the Union
(47�27048.6100N, 122�49055.9200W) and Skokomish
Rivers (47�19009.7300N, 123�08022.4700W). Water
was pumped through Teflon tubing placed near the
center of the river and fitted with a coarse mesh to
exclude large debris (7 mm pore size). Twenty-four
samples were collected for each storm in acid-washed
1 l polyethylene bottles, which were also pre-rinsed
with river water prior to sampling. Upon completion of
the autosampler sequence, samples were immediately
placed on ice and transported to the lab for filtration
and analysis. Significant storm events were sampled
over a three or 4 day period from October 2008
through October 2009. Real-time river discharge data
for the Skokomish River was obtained from USGS
(http://waterdata.usgs.gov/nwis/rt). Union River dis-
charge data was provided by the Hood Canal Salmon
Enhancement Group (HCSEG).
Dissolved nutrient samples (NO3-, NO2
-, NH4?,
SiO44-, and PO4
3-) were filtered through Whatman�
cellulose acetate filters (0.45 lm), and analyzed on an
Alpkem RFA/2 autoanalyzer. TDN and DOC were
measured on a Shimadzu DOC analyzer after filtering
through pre-combusted Whatman� GF/F glass fiber
filters (0.7 lm nominal pore size) into pre-cleaned
glass vials. Dissolved organic nitrogen (DON) con-
centration was calculated by subtracting all inorganic
nitrogen species from TDN. For particulates, between
100 and 600 ml of stream water (depending on
turbidity) were filtered through pre-combusted What-
man� GF/F glass fiber filters. Particulates captured on
the filters were then dried at 55�C for 24 h, acid-
fumigated for 24 h, dried at 55�C for an additional
24 h, and packed in tin capsules. The samples were
analyzed for N and C concentration and stable isotope
ratios at UC-Davis Stable Isotope Facility on a PDZ
Europa ANCA-GSL elemental analyzer. Total sus-
pended sediment (TSS) was assessed by filtering
between 100–600 ml of water through pre-weighed/
combusted Whatman� GF/F glass fiber filters. The
filters were then dried 55�C for 48 h, and reweighed.
Solid phase extraction of dissolved lignin was
performed as described by Keil and Neibauer (2009);
water samples were prefiltered through combusted
Biogeochemistry
123
Author's personal copy

Whatman� GF/F glass fiber filters, acidified to pH 2
with HCl, and passed through 200 mg Waters Oasis
HLB cartridges at a rate of 3 ml min-1. Solid phase
extraction cartridges were pre-conditioned sequen-
tially with 1 ml methanol, 1 ml ethyl acetate and 1 ml
acidified (pH 2) MilliQ water. The solid phase was
then eluted from the cartridge with 10 ml ethyl acetate
at 3 ml/minute. Samples were analyzed via Gas
Chromatography using an Agilent 6890N GC-FID
following an alkaline CuO oxidation performed in a
CEM Microwave Accelerated Reaction System as
described by Goni and Montgomery 2000. Particulate
lignin samples were analyzed in the same fashion; the
Whatman� GF/F glass fiber filters used to measure
TSS were placed directly into the Teflon microwave
vessels to undergo CuO oxidation (Goni and Mont-
gomery 2000). Combusted filters were used as blanks
to assess any lignin signature present on the GF/F
filters, which was nominal.
Results
Dissolved organic and inorganic constituents
During the first significant autumn storm (i.e. several
days of consistent rainfall) after a dry summer, both
TDN and DOC concentrations are tightly coupled with
river discharge in both the Union and Skokomish
Rivers (ture 2, Table 2). For example, throughout the
sampled 3 Oct 2008 storm, DOC and TDN concen-
trations increased from 42 and 4.2 to 193 lmol l-1
and 12.6 lmol l-1, respectively, in the Skokomish
River. The peak in both TDN and DOC concentrations
occurred approximately 3–6 h after the peak in river
discharge. This strong coupling persisted through the
November samplings in the Union River. Although
DOC and TDN concentrations increased with the large
peak in discharge at the end of the November
Skokomish River sampling, there was less correlation
between discharge and DOC and TDN concentrations
during smaller peaks in discharge throughout the week
long sampling (Table 1).
After several months of consistent rainfall, the
correlation between discharge and DOC and TDN
concentrations began to diminish; for example, during
the January 2009 Union River sampling, a 137%
increase in river discharge yielded a 22 and 8%
increase in TDN and DOC concentrations,
respectively, whereas a 62% increase in river dis-
charge in the October 2008 sampling yielded an
approximately 52 and 132% increase in TDN and
DOC concentrations, respectively (Fig. 2). Further-
more, the correlation coefficients for the relationship
between discharge and DOC and TDN concentrations
decreases from October (DOC R2 = 0.88) to January
(DOC R2 = 0.27) (Table 2). March and June 2009
samplings showed even less response in TDN and
DOC concentrations to increased river discharge
(Table 1); TDN and DOC concentrations did not
move significantly from the average during these
rainfall events and correlation constants, especially for
TDN, remained low (Table 2). However, TDN con-
centrations also remained fairly constant during the
September 2009 sampling, with a small increase in
DOC in both rivers (Table 1). During this sampling,
there was almost no correlation between river dis-
charge and TDN and DOC concentrations in the
Union River (DOC R2 = 0.03), whereas the Skoko-
mish River showed a slight correlation between
discharge and DOC concentrations (DOC R2 = 0.51)
(Table 2). DOC:TDN, DOC:DON, TDN:PO43-, and
DON:PO43- ratios are all positively correlated with
river discharge in autumn and winter storms. The
correlation between C:N and N:P ratios and discharge
is strongest when the correlation between nutrient
concentrations and discharge is strongest (Fig. 3).
Throughout the sampled 2008–2009 water year,
TDN was on average composed of approximately 80%
NO3- and 17% DON in the Union River and 51%
NO3- and 43% DON in the Skokomish River
(Table 1). Relative to inorganic N, DON contributes
more to the TDN pool during wet autumn months than
the rest of the year. For example, in the Skokomish
River TDN is composed of 44% NO3- and 52% DON
from October through November whereas TDN is
composed of 65% NO3- and 27% DON from January
through September (Table 1). Short term dissolved
NO3- concentrations followed the same pattern as
TDN. DON concentrations also increased with
increasing river discharge in autumn and winter
storms; this relationship diminished during spring
and summer samplings (Table 1). Peaks in both NO3-
and DON concentrations exhibited similar timing to
TDN—peak concentrations occurred 3–6 h after peak
river discharge. Phosphate concentrations increase
only to a small extent prior to peak river flow, then
level out, which is reflected in the N:P ratios discussed
Biogeochemistry
123
Author's personal copy

Ta
ble
1S
torm
sam
pli
ng
dat
afo
rth
eU
nio
nan
dS
ko
ko
mis
hR
iver
s
Riv
erD
ate
Tim
eR
iver
flow
(m3/s
)
DO
C
(lm
ol
l-1)
TD
N
(lm
ol
l-1)
SiO
4
(lm
ol
l-1)
NO
3-
(lm
ol
l-1)
PO
43-
(lm
ol
l-1)
DO
N
(lm
ol
l-1)
TS
S
(mg
l-1)
PO
C
(mg
l-1)
PO
N
(mg
l-1)
D13C
(%)
D15N
(%)
Tota
l
lignin
(mg
l-1)
S/V
C/V
Ad/
Al
(v)
SK
OK
10/3
1/0
816:3
014.2
470
6.7
165
1.2
0.0
25.3
44.6
0.6
00.0
4-
26.3
2.1
6.5
E-0
30.5
80.1
61.2
0
SK
OK
10/3
1/0
820:3
015.0
669
6.4
166
1.6
0.0
14.5
66.2
5.8
E-0
30.6
30.2
00.9
7
SK
OK
11/1
/08
0:3
017.6
165
4.3
166
0.8
0.0
23.1
67.7
0.6
60.1
0-
25.8
2.9
7.0
E-0
30.7
70.2
51.6
0
SK
OK
11/1
/08
4:3
018.6
368
7.9
166
2.0
0.0
15.4
96.0
SK
OK
11/1
/08
8:3
017.9
559
4.7
166
1.2
0.0
13.3
49.3
0.9
80.0
7-
26.2
2.9
5.3
E-0
30.6
10.1
81.3
5
SK
OK
11/2
/08
0:3
017.1
049
3.5
169
1.2
0.0
02.1
92.2
0.6
30.0
4-
25.3
3.4
SK
OK
11/2
/08
4:3
017.2
752
4.9
169
1.4
0.0
03.2
62.2
0.7
10.0
4-
26.4
3.1
5.3
E-0
30.7
00.2
11.4
4
SK
OK
11/2
/08
8:3
018.1
251
4.0
170
1.5
0.0
02.2
82.4
4.9
E-0
30.7
50.2
21.4
3
SK
OK
11/2
/08
12:3
019.1
448
4.4
170
1.7
0.0
02.5
22.9
8.4
E-0
30.5
80.1
91.4
0
SK
OK
11/2
/08
16:3
021.2
452
4.4
171
1.6
0.0
02.6
71.4
8.6
E-0
30.7
00.2
81.1
4
SK
OK
11/2
/08
20:3
022.6
845
3.5
169
1.5
0.0
01.7
52.3
0.4
70.0
3-
26.2
3.8
9.4
E-0
30.6
30.2
00.9
5
SK
OK
11/3
/08
0:3
023.9
872
4.0
169
1.3
0.0
02.6
13.6
6.3
E-0
30.6
80.2
01.0
4
SK
OK
11/3
/08
4:3
024.9
551
3.8
171
0.9
0.0
02.6
52.8
0.6
20.0
4-
26.1
3.5
8.7
E-0
30.6
90.2
21.2
8
SK
OK
11/3
/08
12:3
028.3
255
4.1
169
0.8
0.0
03.1
74.5
0.7
10.0
5-
26.4
2.6
SK
OK
11/4
/08
0:3
030.3
064
3.8
160
1.1
0.0
12.4
19.5
0.6
00.0
3-
25.4
2.2
9.5
E-0
30.6
30.3
21.6
4
SK
OK
11/4
/08
15:0
031.4
377
5.4
162
3.2
0.0
10.7
41.4
7.8
E-0
30.3
90.1
51.1
3
SK
OK
11/4
/08
21:0
029.7
368
5.9
164
3.4
0.0
11.6
96.2
7.1
E-0
30.4
60.1
71.1
1
SK
OK
11/5
/08
3:0
028.3
258
5.1
177
3.6
0.0
10.5
06.4
0.4
40.0
2-
26.0
3.5
1.1
E-0
20.4
40.1
71.0
9
SK
OK
11/5
/08
6:0
027.6
961
4.3
164
3.7
0.0
10.0
00.5
70.0
3-
26.4
3.0
1.0
E-0
20.5
40.1
71.9
6
SK
OK
11/5
/08
9:0
026.9
056
4.8
166
3.7
0.0
10.0
04.6
8.7
E-0
30.4
00.1
61.3
1
SK
OK
11/5
/08
21:0
024.9
549
4.5
177
3.4
0.0
10.0
03.6
0.3
80.0
9-
26.7
2.5
1.1
E-0
20.4
10.1
41.0
8
SK
OK
11/6
/08
3:0
025.1
550
4.8
165
3.5
0.0
10.0
03.7
0.3
40.0
2-
26.4
3.4
1.9
E-0
20.6
90.1
21.6
4
SK
OK
11/6
/08
9:0
027.8
955
4.5
164
3.6
0.0
00.0
03.3
0.5
10.0
3-
26.6
2.9
1.4
E-0
20.5
80.2
11.4
3
SK
OK
11/6
/08
15:0
044.4
672
5.1
159
3.9
0.0
30.3
84.7
0.3
10.0
7-
26.7
3.1
1.2
E-0
20.6
20.1
51.5
2
SK
OK
11/6
/08
21:0
0226.8
135
7.2
0.0
90.0
0117.8
2.8
10.2
9-
27.4
2.8
5.7
E-0
30.6
10.1
51.1
3
SK
OK
11/7
/08
3:0
0387.9
214
14.3
135
6.9
0.1
26.5
1943.4
5.3
20.6
5-
27.0
2.6
4.7
E-0
30.4
40.1
50.9
8
SK
OK
11/7
/08
9:0
0487.1
156
10.3
145
6.4
0.1
03.2
16.3
E-0
30.4
50.1
81.0
3
UN
IO1/6
/09
20:0
03.0
6285
37.6
25
31.4
0.2
44.9
344.9
3.0
40.2
5-
27.1
3.8
3.6
E-0
10.5
40.2
91.8
8
UN
IO1/7
/09
5:0
06.4
8378
48.7
14
39.4
0.2
47.9
5239.6
7.0
80.5
6-
28.0
-3.0
3.6
E-0
10.5
70.2
11.5
3
UN
IO1/7
/09
17:0
06.1
4329
43.1
22
35.4
0.2
26.6
583.1
9.3
80.8
1-
27.9
-4.4
6.7
E-0
10.1
20.0
51.1
3
UN
IO1/8
/09
2:0
013.5
6389
46.1
838.6
0.1
96.1
4434.6
19.0
51.4
9-
27.8
-2.1
2.6
E-0
10.6
50.2
61.0
8
UN
IO1/8
/09
11:0
08.8
1308
39.2
15
34.1
0.1
64.2
9379.5
8.9
00.7
9-
27.9
-5.9
2.6
E-0
10.6
40.2
61.1
9
UN
IO1/9
/09
14:0
02.9
2210
38.4
49
33.1
0.2
04.2
432.5
2.5
60.1
6-
26.9
1.8
2.8
E-0
10.8
90.2
00.9
9
SK
OK
3/1
3/0
919:3
019.1
440
8.3
35
2.8
0.0
35.5
211.8
0.6
40.0
34
-25.3
2.8
1.2
E-0
20.6
10.0
90.8
9
Biogeochemistry
123
Author's personal copy

Ta
ble
1co
nti
nu
ed
Riv
erD
ate
Tim
eR
iver
flow
(m3/s
)
DO
C
(lm
ol
l-1)
TD
N
(lm
ol
l-1)
SiO
4
(lm
ol
l-1)
NO
3-
(lm
ol
l-1)
PO
43-
(lm
ol
l-1)
DO
N
(lm
ol
l-1)
TS
S
(mg
l-1)
PO
C
(mg
l-1)
PO
N
(mg
l-1)
D13C
(%)
D15N
(%)
Tota
l
lignin
(mg
l-1)
S/V
C/V
Ad/
Al
(v)
SK
OK
3/1
4/0
911:3
022.1
436
4.5
66
3.6
0.0
60.3
14.1
0.4
50.0
40
-27.4
3.3
8.1
E-0
31.5
40.8
40.3
7
SK
OK
3/1
4/0
923:3
024.1
841
5.7
48
3.6
0.0
41.0
45.6
0.8
60.0
42
-28.1
3.3
9.8
E-0
30.6
90.1
81.2
6
SK
OK
3/1
5/0
923:3
023.7
940
5.4
53
4.1
0.0
40.3
98.0
0.4
70.0
61
-25.8
3.4
3.4
E-0
20.0
40.0
10.1
3
SK
OK
3/1
6/0
923:3
025.3
244
6.5
78
4.4
0.0
81.6
08.2
0.6
20.0
47
-28.3
2.0
5.9
E-0
30.7
00.1
81.0
7
SK
OK
3/1
7/0
915:3
026.3
144
6.1
47
3.9
0.0
52.0
810.4
0.6
10.0
41
-26.6
2.3
6.8
E-0
30.8
30.2
52.2
0
UN
IO6/1
9/0
914:0
01.1
082
20.4
385
16.5
0.2
92.9
2.5
8.4
E-0
30.5
40.1
40.8
6
UN
IO6/2
0/0
96:0
01.3
688
21.6
406
17.5
0.3
33.2
1.4
9.0
E-0
30.6
60.2
30.7
1
UN
IO6/2
0/0
910:0
01.3
080
18.9
397
17.0
0.2
81.6
8.5
7.9
E-0
30.6
90.1
60.7
3
UN
IO6/2
0/0
914:0
01.1
387
20.4
399
17.1
0.3
13.2
1.6
6.8
E-0
30.5
00.1
30.7
6
UN
IO6/2
0/0
922:0
01.2
583
20.7
397
18.7
0.2
91.6
2.1
8.5
E-0
30.5
50.1
80.5
1
UN
IO6/2
1/0
92:0
01.3
685
22.0
397
19.0
0.2
82.7
1.9
6.7
E-0
30.5
40.1
40.9
1
SK
OK
9/5
/09
21:0
03.7
134
4.0
211
2.4
0.2
21.5
74.8
0.6
50.0
46
-26.2
2.9
SK
OK
9/6
/09
1:0
03.7
134
3.9
211
2.6
0.2
11.2
84.3
4E
-03
0.1
40.1
11.0
2
SK
OK
9/7
/09
1:0
06.3
150
4.6
202
3.0
0.1
41.5
415.5
1.1
00.1
03
-27.6
1.6
7.4
8E
-03
0.2
30.1
11.3
1
SK
OK
9/7
/09
5:0
07.9
948
4.3
197
3.1
0.1
21.1
150.2
2.5
90.3
54
-28.9
0.5
6.9
7E
-03
0.2
50.1
61.1
8
SK
OK
9/7
/09
9:0
08.7
254
5.1
195
3.8
0.1
10.6
865.3
2.4
80.2
84
-29.2
-4.3
6.8
6E
-03
0.2
60.1
41.4
2
SK
OK
9/7
/09
17:0
08.3
053
4.0
196
3.6
0.1
30.2
242.0
2.3
00.2
95
-27.8
-2.3
6.2
1E
-03
0.4
80.1
70.8
6
SK
OK
9/8
/09
1:0
07.5
658
5.4
200
3.9
0.1
50.8
22.1
80.2
14
-29.1
-3.5
UN
IO9/5
/09
19:0
00.6
597
18.7
399
17.4
0.5
10.6
43.9
0.6
70.0
56
-28.2
1.7
7.4
0E
-03
0.7
00.1
21.0
4
UN
IO9/6
/09
10:0
00.6
5115
21.0
401
18.8
0.5
51.1
04.6
0.8
40.0
63
-26.8
2.1
6.1
9E
-03
0.2
50.1
31.9
0
UN
IO9/6
/09
13:0
00.7
9125
19.2
393
18.0
0.5
10.9
74.0
6.9
8E
-03
0.3
60.1
91.0
7
UN
IO9/6
/09
16:0
00.9
1131
18.5
392
17.5
0.5
00.9
04.2
0.6
50.0
98
-28.4
3.1
6.2
8E
-03
0.3
40.1
40.8
1
UN
IO9/6
/09
19:0
00.8
5130
18.6
394
17.7
0.5
10.8
73.5
5.7
2E
-03
0.3
60.1
61.1
1
UN
IO9/6
/09
22:0
00.7
6130
19.5
400
18.6
0.5
30.4
54.2
0.7
20.0
49
-26.6
2.7
5.9
4E
-03
0.3
00.1
51.0
0
UN
IO9/7
/09
1:0
00.7
4153
22.1
402
19.4
0.5
61.4
22.3
6.1
9E
-03
0.2
70.1
61.2
7
UN
IO9/7
/09
4:0
00.7
1126
20.7
402
20.0
0.4
80.6
13.4
0.8
50.0
58
-26.5
2.0
UN
IO9/7
/09
10:0
00.6
8124
21.0
407
19.7
0.5
30.7
93.1
0.6
70.1
05
-27.1
2.7
UN
IO9/7
/09
16:0
00.6
5137
20.5
402
18.4
0.5
51.4
92.7
0.5
80.0
47
-26.5
3.7
UN
IO9/7
/09
22:0
00.6
8177
23.6
391
19.7
0.6
33.5
86.4
1.0
10.1
04
-28.0
3.8
UN
IO10/1
3/0
917:4
50.5
969
19.1
397
12.5
0.3
16.3
0.8
40.1
19
-27.2
2.3
6.6
E-0
30.7
90.2
10.9
9
UN
IO10/1
4/0
91:4
50.6
271
19.4
395
13.0
0.2
86.0
0.6
60.0
43
-26.8
3.3
7.0
E-0
30.8
00.1
20.3
9
UN
IO10/1
4/0
99:4
50.7
9129
20.4
384
11.9
0.4
08.2
0.8
80.0
65
-27.9
3.1
1.1
E-0
20.5
60.1
50.7
2
UN
IO10/1
4/0
917:4
51.2
7310
30.6
346
17.3
0.4
112.8
2.4
50.2
14
-28.1
3.1
UN
IO10/1
5/0
91:4
50.9
9295
37.2
367
25.4
0.2
510.7
1.8
50.1
44
-28.1
3.4
1.3
E-0
20.5
20.2
30.7
2
Biogeochemistry
123
Author's personal copy

previously. In all storm events sampled throughout the
year, SiO44- concentrations decrease with increasing
river discharge (Fig. 2; Table 1).
Total suspended sediments and particulate organic
nitrogen and carbon
TSS concentrations were correlated with river dis-
charge during all sampled storm events; R2 values
were above 0.80 for every sampled storm (Table 2).
TSS concentrations generally reached a maximum
simultaneously with or slightly prior to Peak River
discharge, and began to drop several hours (*6–12 h)
before river flow decreased. Similar to the observed
trends in dissolved nutrient concentrations, particulate
organic N and C (PON and POC) concentrations are
strongly coupled with river discharge during autumn
and winter storms (Fig. 4). As with dissolved nutrient
concentrations, the coupling between particulate N
and C concentrations and river discharge began to
diminish after several major winter storms; for exam-
ple, R2 values for POC dropped from 0.94 in January
to 0.01 in March (Table 2). A key difference between
dissolved and particulate nutrient concentrations is
that POC and PON concentrations peaked simulta-
neously or prior to peak river discharge similar to TSS.
Stable isotope analysis of POC revealed several
notable trends. q13C-POC generally became more
depleted with increasing river discharge in all sampled
storms. For example, q13C-POC varied from -25.3 to
-27.0% throughout the week long November sam-
pling of the Skokomish River with the most depleted
values occurring at peak discharge (Table 1). As with
other measured parameters, this trend was most
evident in autumn samplings. Throughout the year,
q13C-POC values ranged from -25.3 to -29.2%,
indicating a primary input of C3 terrestrial OM.
Dissolved and particulate lignin phenols
As with DOC, the total concentration of dissolved
lignin was correlated with river discharge during
autumn storms (Fig. 5); data from the 13–17 October
2009 sampling showed the clearest trends and tightest
correlations between discharge and the measured
parameters (R2 = 0.88), and will thus be considered
to best represent autumn storm conditions. During this
sampling, both DOC and dissolved lignin concentra-
tions increased with discharge, however, the total massTa
ble
1co
nti
nu
ed
Riv
erD
ate
Tim
eR
iver
flow
(m3/s
)
DO
C
(lm
ol
l-1)
TD
N
(lm
ol
l-1)
SiO
4
(lm
ol
l-1)
NO
3-
(lm
ol
l-1)
PO
43-
(lm
ol
l-1)
DO
N
(lm
ol
l-1)
TS
S
(mg
l-1)
PO
C
(mg
l-1)
PO
N
(mg
l-1)
D13C
(%)
D15N
(%)
Tota
l
lignin
(mg
l-1)
S/V
C/V
Ad/
Al
(v)
UN
IO10/1
5/0
99:4
50.8
2290
34.1
384
21.2
0.2
912.3
0.8
20.1
13
-28.4
3.1
1.0
E-0
20.4
30.1
20.7
7
UN
IO10/1
5/0
917:4
50.7
6213
30.7
405
19.9
0.2
29.6
0.9
00.0
66
-26.8
3.2
7.8
E-0
30.4
60.1
10.7
3
UN
IO10/1
6/0
91:4
50.7
4190
29.5
409
19.0
0.2
69.3
1.0
80.0
83
-27.5
3.5
6.5
E-0
30.4
30.1
50.7
0
UN
IO10/1
6/0
99:4
50.7
9188
26.4
399
16.8
0.3
08.4
0.6
80.0
80
-27.2
3.4
9.9
E-0
30.5
10.1
40.9
5
UN
IO10/1
6/0
917:4
51.3
3374
32.8
373
19.3
0.3
112.9
2.6
00.1
59
-28.3
2.7
1.1
E-0
20.3
70.1
41.2
2
UN
IO10/1
6/0
921:4
51.3
6496
43.0
349
26.5
0.4
015.8
2.6
70.1
96
-26.8
3.8
1.6
E-0
20.4
30.1
71.0
6
UN
IO10/1
7/0
91:4
51.6
1538
45.1
342
28.2
0.3
116.3
3.9
40.2
70
-28.1
3.1
1.8
E-0
20.4
10.1
60.9
5
UN
IO10/1
7/0
95:4
51.4
4630
63.8
348
42.5
0.2
720.4
12.3
50.9
54
-28.6
3.0
1.8
E-0
20.4
60.2
01.0
3
UN
IO10/1
7/0
99:4
52.2
4728
63.5
290
41.3
0.4
621.5
10.8
90.8
01
-28.5
2.6
2.2
E-0
20.4
90.1
80.7
1
For
bre
vit
y,
not
all
dat
ais
pre
sente
d.
For
aco
mple
teta
ble
wit
hal
ldat
apoin
tsan
dpar
amet
ers
mea
sure
d,
ple
ase
conta
ctth
ele
adau
thor
Biogeochemistry
123
Author's personal copy

Fig. 2 TDN, DOC, and
silica concentrations in the
Union River during the first
significant autumn storm of
2008 (top), and a subsequent
winter 2009 storm (bottom)
Table 2 Correlation
between river discharge and
DOC, TDN, POC, PON,
and TSS during sampled
storms
River Storm start date DOC
R2TDN
R2POC
R2PON
R2TSS
R2
Union 3 Oct 2008 0.88 0.73
Skokomish 2 Oct 2008 0.90 0.71
Union 31 Oct 2008 0.87 0.92
Skokomish 31 Oct 2008 0.11 0.11 0.96 0.96 0.84
Union 6 Jan 2009 0.27 0.33 0.94 0.94 0.86
Union 13 Mar 2009 0.73 0.38
Skokomish 13 Mar 2009 0.50 0.28 0.01 0.19 0.80
Union 19 Jun 2009 0.11 0.13
Union 4 Sep 2009 0.03 0.29
Skokomish 4 Sep 2009 0.51 0.14 0.88 0.80 0.85
Union 13 Oct 2009 0.88 0.70 0.95 0.84
Skokomish 13 Oct 2009 0.66 0.16
Biogeochemistry
123
Author's personal copy

of dissolved lignin per mass of carbon (mg lignin/100
mg DOC) decreases, indicating a dilution of the DOC
pool with non-lignin organic carbon (Fig. 5). During
autumn storms there is an apparent increase in the ratio
of cinnamyl to vannilyl phenols (C/V ratio) with
increasing discharge as well as a decrease in the ratio of
syringal to vannilyl phenols (S/V ratio; Fig. 5). Fur-
thermore, there is a systematic increase in the ratio of
vannilyl acids to vannilyl aldehydes [Ad/Al (v)]
throughout the autumn storm event (Table 1). Similar
results are seen during the November 2008 and January
2009 samplings in terms of lignin concentrations and
the ratio of lignin to DOC, although trends in C/V, S/V,
and Ad/Al ratios are less distinguishable (Table 1).
During the March 2009 sampling there appears to be a
decrease in both total lignin concentrations and the
lignin to DOC ratio and no distinguishable trends in
Ad/Al (v), S/V, C/V, and (Table 1).
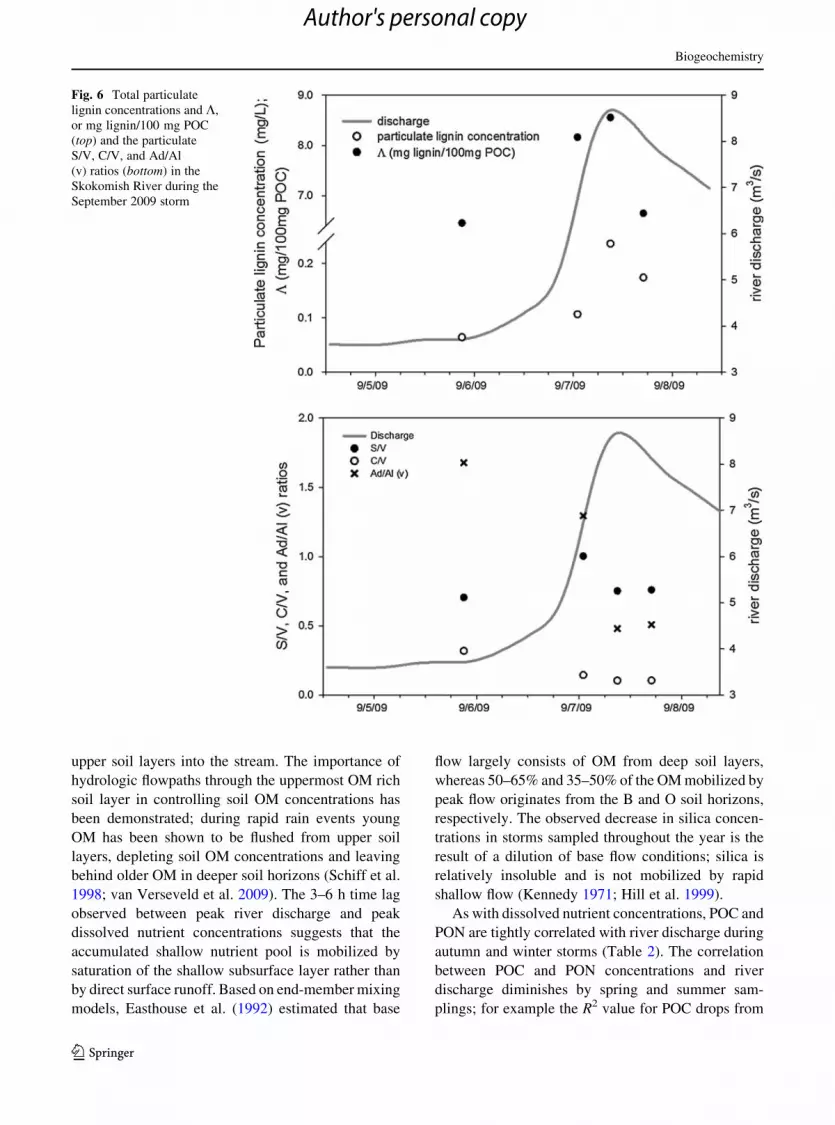
Particulate lignin concentrations were measured
during the September 2009 storm. As with POC, total
particulate lignin concentrations increased with
increasing discharge (Fig. 6). K, or mg lignin per
100 mg POC, also increased with river discharge in
contrast to observations in the ratio of dissolved lignin
Fig. 3 The ratio of
dissolved carbon to nitrogen
(DOC:TDN) and the ratio of
dissolved nitrogen to
phosphorus (TDN:PO43-) in
the Union River during the
first autumn storm in 2008
Fig. 4 Particulate organic carbon and particulate organic nitrogen concentrations in the Union River September 2009
Biogeochemistry
123
Author's personal copy

to DOC (Fig. 5). Trends in the particulate lignin
phenol ratios also showed opposite trends relative to
dissolved lignin measurements during autumn storms
(i.e. October 2009 sampling). With increasing
discharge, S/V increased and both C/V and Ad/Al
(v) decreased (Fig. 6).
Discussion
Nutrient accumulation and mobilization
We suggest that nutrients accumulate in the upper soil
layers in the Hood Canal watershed during long dry
periods and are mobilized during autumn and winter
rainfall events. Excess nutrients are exhausted by
successive winter storms. By late winter/early spring,
nutrient concentrations exhibit little response to
increased river discharge suggesting that the
watershed has two distinct nutrient pools; (i) a deep
soil nutrient pool that supports base flow nutrient
concentrations throughout the year and (ii) an addi-
tional nutrient pool that accumulates in the shallow
subsurface soil layer during periods of low soil
saturation (i.e. summer dry periods) (Fig. 7). Horn-
berger et al. (1994) described the N-flushing hypoth-
esis, which suggests that when the soil saturation
deficit is high, nutrients accumulate in upper soil
layers, and as the soil saturation deficit decreases, a
saturated subsurface layer flushes nutrients from the
Fig. 5 Total dissolved
lignin concentrations and
the lignin to DOC ratio (top)
and the ratio of syringal to
vannilyl dissolved lignin
phenols (S/V) and the ratio
of cinnamyl to vannilyl
dissolved lignin phenols
(C/V) (bottom) in the Union
River during the first
significant autumn storm of
2009. As C/V increases
material is more woody
versus leafy; as S/V
decreases material is more
gymnosperm-derived versus
angiosperm derived
Biogeochemistry
123
Author's personal copy
upper soil layers into the stream. The importance of
hydrologic flowpaths through the uppermost OM rich
soil layer in controlling soil OM concentrations has
been demonstrated; during rapid rain events young
OM has been shown to be flushed from upper soil
layers, depleting soil OM concentrations and leaving
behind older OM in deeper soil horizons (Schiff et al.
1998; van Verseveld et al. 2009). The 3–6 h time lag
observed between peak river discharge and peak
dissolved nutrient concentrations suggests that the
accumulated shallow nutrient pool is mobilized by
saturation of the shallow subsurface layer rather than
by direct surface runoff. Based on end-member mixing
models, Easthouse et al. (1992) estimated that base
flow largely consists of OM from deep soil layers,
whereas 50–65% and 35–50% of the OM mobilized by
peak flow originates from the B and O soil horizons,
respectively. The observed decrease in silica concen-
trations in storms sampled throughout the year is the
result of a dilution of base flow conditions; silica is
relatively insoluble and is not mobilized by rapid
shallow flow (Kennedy 1971; Hill et al. 1999).
As with dissolved nutrient concentrations, POC and
PON are tightly correlated with river discharge during
autumn and winter storms (Table 2). The correlation
between POC and PON concentrations and river
discharge diminishes by spring and summer sam-
plings; for example the R2 value for POC drops from
Fig. 6 Total particulate
lignin concentrations and K,
or mg lignin/100 mg POC
(top) and the particulate
S/V, C/V, and Ad/Al
(v) ratios (bottom) in the
Skokomish River during the
September 2009 storm
Biogeochemistry
123
Author's personal copy

0.96 in January 2009 to 0.01 in March 2009 (Table 2).
The persistent correlation between discharge and TSS
throughout the year supports the hypothesis that
accumulated nutrients are completely leached out of
soils by frequent winter storms. Thus, as with dissolved
nutrients, a shallow pool of particulates with high
nutrient content accumulates during long dry periods.
Whereas dissolved constituents are mobilized primar-
ily via saturation/solubilization of the sub surface soil
layer, the occurrence of peak POC and PON concen-
trations simultaneously or prior to peak river discharge
indicates that surficial processes such as displacement
of discrete storage pools, surface runoff, and bank
erosion are likely the primary means for mobilization
of accumulated particulate nutrients and carbon. For
example, in the September 2009 sampling POC and
PON are moderately correlated with river discharge
(R2 = 0.88 and 0.80 respectively), whereas dissolved
nutrient concentrations are not (DOC R2 = 0.51; TDN
R2 = 0.14; Table 2). Relative to later autumn storms,
the September sampling occurred during a light rain
event, which was likely not sufficient enough to
saturate the upper soil layer and mobilize dissolved
nutrients, whereas particulate material was mobilized
by rapid surficial processes. For example, discharge in
the Union River during the September 2009 sampling
ranged from only 0.65–0.91 m3/s, whereas discharge
in the October 2009 sampling ranged from 0.59 to
2.24 m3/s (Table 1).
Organic matter characterization
Additional layers of complexity can be added onto the
simple two nutrient pool model described above based
on trends seen in carbon to nitrogen and lignin phenol
ratios. Upon first inspection, the observed correlation
between river discharge and DOC:DON ratios appears
to indicate that the source of material to the shallow
dissolved nutrient pool is of distinct origin from the
source of the base flow pool; for example, material
mobilized from the shallow soil pool has an elevated
DOC:DON, which may indicate that the source of this
pool is derived more from wood/vascular plant
detritus than the base flow pool (Liaw and MacCrim-
mon 1977; Naiman and Sedell 1979). The increase in
total dissolved lignin with discharge seems to support
this, since lignin is unique to vascular plants (Sarka-
nenk and Ludwig 1971). However, since the material
in the base flow pool persists in soils longer than in the
shallow pool it is also possible that the two pools are of
similar origin and that the source signature has been
altered by biogeochemical processes such as degra-
dation and sorption (e.g. Aufdenkampe et al. 2001;
Hernes et al. 2007).
Fig. 7 a Nutrients accumulate in the shallow subsurface layer
in dry summer months, are mobilized during autumn/winter
storms, and are depleted from the accumulated shallow
subsurface pool by late winter/spring. b Base flow is the sum
of deep subsurface flow and delayed shallow subsurface flow
(Ward and Robinson 1990). Rapid flow consists of surface
runoff and shallow subsurface flow. c Particulate organic matter
(i.e. litterfall) degrades providing dissolved and particulate OM
to the accumulated shallow subsurface nutrient/OM pool.
d Surface and shallow subsurface material is mobilized by
rapid flow leading to increased nutrient/OM concentrations
during storm events. e Compounds that do not easily mobilize
eventually fuel base flow chemical flux. Base flow of water
provides a constant chemical flux to the river
Biogeochemistry
123
Author's personal copy

Throughout autumn storms, the ratio of lignin to
DOC decreases with increasing discharge. One expla-
nation for the apparent enrichment of dissolved lignin
in the deep base flow pool is that dissolved lignin is
relatively more difficult to mobilize from soils than
other dissolved organic carbon compounds; thus, other
carbon compounds are more readily mobilized from
soils into streams by rapid shallow flow. For example,
Kaiser et al. (2004) observed that the hydrophobic
fraction of lignin-rich DOM in soils is much less
mobile relative to the hydrophilic fraction of DOM,
composed primarily of carbohydrates, due to sorption
of lignin-derived compounds by Al and Fe oxides–
hydroxides. Easthouse et al. (1992) also observed a
pronounced increase in the relative proportion of
hydrophilic acids in stream water during an autumn
storm event, followed by a lesser contribution in a
subsequent storm. Another possible explanation is that
the more rapidly cycled shallow pool of dissolved
constituents has undergone less biodegradation than
the deep base flow pool. Since few organisms are
capable of directly consuming lignin, it is often
considered relatively refractory compared to other
carbon compounds (Trojanowski 1969; Crawford and
Crawford 1980). However, the observed increase in
the ratio of dissolved vannilyl acids to aldehydes [Ad/
Al (v)] with increasing river discharge is contradictory
to the above explanation. Upon biodegradation Ad/Al
typically increases (Ertel and Hedges 1984; Hedges
et al. 1988; Opsahl and Benner 1995), implying that
DOM that is mobilized by storm events is more highly
degraded than the base flow of DOM. In fact, many
recent studies have began to show that lignin in the
dissolved phase is much more labile than once thought
(Benner et al. 1991; Haddad et al. 1992; Opsahl and
Benner 1995; Dittmar and Lara 2001; Otto and
Simpson 2006).
It is likely that both biodegradation and sorption,
which can be a rapid process relative to degradation
(McKnight et al. 1992; Qualls and Haines 1992; Day
et al. 1994; Aufdenkampe et al. 2001; Hernes et al.
2007), play an important role in the mobilization of
dissolved carbon compounds. The observed data may
imply that non-degraded dissolved lignin phenols (e.g.
aldehydes) are relatively more difficult to mobilize
from soils than their degraded counterpart (e.g. acids).
The products of dissolved lignin degradation are
mobilized by rapid shallow flow, whereas non-
degraded dissolved lignin phenols are much less
soluble and persist in soils until further degradation.
Prolonged exposure to water (i.e. base flow), on the
other hand is capable of mobilizing the somewhat
insoluble non-degraded dissolved lignin phenols sim-
ilarly to silica mobilization. This hypothesis is in
contrast to observations in high-latitude settings.
Spencer et al. (2008) suggest that relatively less
degraded OM, including lignin phenols, is released
into high latitude rivers during spring flushing events.
Cold winter temperatures prior to a high-latitude
spring flushing, however, would inhibit OM degrada-
tion within soils, while drastic increases in river
discharge may mobilize substantial amounts of OM
regardless of its relative mobility. This DOC, how-
ever, has been shown to be highly labile once
mobilized into the aquatic setting (Holmes et al.
2008). In contrast, biodegradation within soils is
promoted during warm summer and autumn months in
the temperate system studied here, allowing a prefer-
ential mobilization of more soluble/degraded OM
during smaller peaks in discharge relative to high
latitude spring flushings. Alternatively, it is possible
that the less-degraded Ad/Al(v) signature of base flow
dissolved lignin is unrelated to sorption processes and
is simply an indicator that the deep soil horizons
contain old, recalcitrant OM, whereas upper soil layers
contain more fresh, labile OM that has been recently
degraded. Numerous studies have shown that peaks in
discharge release young labile OM relative to base
flow (Schiff et al. 1998; Sanderman et al. 2009; van
Verseveld et al. 2009).
The ratio of cinnamyl (C), vannilyl (V), and
syringyl (S) phenols is an indicator of OM source;
an increased C/V indicates a more non-woody than
woody source and an elevated S/V indicates an
angiosperm source (Hedges and Mann 1979; Hedges
and Ertel 1982). Thus, the observed increase in C/V
and decrease in S/V ratios of dissolved lignin with
increasing river discharge indicates that the mobi-
lized material contains more leafy/gymnosperm-
derived compounds compared to the base flow of
DOM. On the other hand, the systematic changes to
C/V and S/V may indicate a preferential mobiliza-
tion of cinnamyl phenols and retention of syringyl
phenols relative to vanillyl phenols. Opposite trends
in the ratio of lignin to OC, C/V, S/V, and Ad/Al
(v) are observed in particulate lignin (Fig. 6).
Perhaps compounds that are less likely to be
mobilized by rapid flow are sorbed to the particulate
Biogeochemistry
123
Author's personal copy

phase, which is either retained in soils or mobilized
into the stream by surficial processes. However,
particulate lignin data was only collected for one
storm and is insufficient to entirely support the
above hypothesis. It is likely that dissolved C/V and
S/V ratios are controlled by the same mechanism
described previously—preferential degradation of
vanillyl versus syringyl phenols produces relatively
more vanillyl acids (which are more easily mobi-
lized than the non-degraded counterpart) than
syringyl acids, for example. Likewise, it is possible
that the shallow pool of young labile OM has simply
undergone more degradation, and thus more pheno-
lic fractionation, than the old refractory base flow
pool.
The cumulative results from this year-long data
set indicate that a shallow nutrient-rich pool of
particulate and dissolved organic matter accumulates
in watersheds during periods of soil-saturation
deficiency (summer). Autumn and winter storms
mobilize this pool of accumulated nutrients from
surface soils, which is exhausted with successive
winter storms. Results from this study will allow for
more accurate nutrient and carbon export estimates
from rivers with the development of more sophis-
ticated watershed chemical models, which can be
applied to river systems worldwide and used to
tackle a diverse set of hydrological and biogeo-
chemical issues. Furthermore, this unique high-
resolution data set has contributed to a deeper
understanding of the mechanisms involved in the
mobilization of nutrients and OM from terrestrial
biomes into river systems—a necessary step toward
understanding the overall role of river systems in
global biogeochemical cycling.
Acknowledgments Funding and support was provided by the
UW School of Oceanography, the Puget Sound Regional
Synthesis Model (PRISM), Washington Sea Grant, and the
Hood Canal Dissolved Oxygen Program (HCDOP). Sample
collection was made possible primarily by Dan Hannafious and
Sean Hildebrandt of the HCSEG. Sample preparation and
dissolved lignin phenol analyses were performed in the UW
School of Oceanography Marine Organic Geochemistry Lab
and supported in part by NSF 0926395 to Richard G. Keil.
Dissolved nutrient analyses were performed by Aaron Morello
and Kathy Krogslund in the UW School of Oceanography
Marine Chemistry Lab. Particulate nutrient and stable isotope
analyses were performed by the UC Davis Stable Isotope
Facility. River discharge data was provided by the United States
Geological Survey (USGS) and HCSEG.
References
Aufdenkampe AK, Hedges JI, Richey JE, Krusche AV, Llerena
CA (2001) Sorptive fractionation of dissolved organic
nitrogen and amino acids onto fine sediments within the
Amazon basin. Limnol Oceanogr 46(8):1921–1935
Benner R, Fogel ML, Sprague EK (1991) Diagenesis of
belowground biomass of Spartina alterniflora in salt-
marsh sediments. Limnol Oceanogr 36(7):1358–1374
Biggs TW, Dunne WT, Martinelli LA (2004) Natural controls
and human impacts on stream nutrient concentrations in a
deforested region of the Brazilian Amazon basin. Bio-
geochemistry 68:227–257
Boyer EW, Hornberger GM, Bencala KE, McKnight DM (1997)
Response characteristics of DOC flushing in an alpine
catchment. Hydrol Process 11:1635–1647
Buffam I, Galloway JN, Blum LK, McGlathery KJ (2001) A
stormflow/baseflow comparison of dissolved organic
matter concentrations and bioavailability in an Appala-
chian stream. Biogeochemistry 53:269–306
Crawford DL, Crawford RL (1980) Microbial degradation of
lignin. Enzyme Microb Technol 2:11–22
Dalzell BJ, Filley TR, Harbor JM (2007) The role of hydrology
in annual organic carbon loads and terrestrial organic
matter export from a midwestern agricultural watershed.
Geochim Cosmochim Acta 71:1448–1462
Day GM, Hart BT, McKelvie ID, Beckett R (1994) Adsorption
of natural organic matter onto goethite. Colloid Surf A
89:1–13
Deegan LA, Neill C, Haupert CL, Ballester MVR, Krusche AV,
Victoria RL, Thomas SM, de Moor E (2011) Amazon
deforestation alters small stream structure, nitrogen bio-
geochemistry and connectivity to larger rivers. Biogeo-
chemistry 106:53–74
Dittmar T, Lara RJ (2001) Molecular evidence for lignin deg-
radation in sulfate-reducing mangrove sediments (Amazo-
nia, Brazil). Geochim Cosmochim Acta 65(9):1417–1428
Easthouse KB, Mulder J, Christophersen N, Seip HM (1992)
Dissolved organic carbon fractions in soil and stream water
during variable hydrologic conditions at Birkenes, Sour-
thern Norway. Water Resour Res 28:1585–1596
Ertel JR, Hedges JI (1984) The lignin component of humic
substances: distribution among soil and sedimentary
humic, fulvic, and base-insoluble fractions. Geochim
Cosmochim Acta 48:2065–2074
Fellman JB, Hood E, Edwards RT, D’Amore DV (2009)
Changes in the concentration, biodegradability, and fluo-
rescent properties of dissolved organic matter during
stormflows in coastal temperate watersheds. J Geophys
Res-Biogeosci 112:G0300
Goni MA, Hedges JI (1992) Lignin dimers: structures, distri-
butions and potential geochemical application. Geochim
Cosmochim Acta 56:4025–4043
Goni MA, Montgomery S (2000) Alkaline CuO oxidation with a
microwave digestion system: lignin analyses of geochem-
ical samples. Anal Chem 72:3116–3121
Guillaud JF, Aminot A, Delmas D, Gohin F, Lunven M, Labry
C, Herbland, A (2008) Seasonal variation of riverine
nutrient inputs in the northern Bay of Biscay (France), and
Biogeochemistry
123
Author's personal copy

patterns of marine phytoplankton response. J Mar Syst
72(1–4): 309–319 (oceanography of the Bay of Biscay)
Haddad RJ, Newell SY, Martens CS, Fallon RD (1992) Early
diagenesis of lignin-associated phenolics in the salt marsh
grass Spartina alteriflora. Geochim Cosmochim Acta
56:3751–3764
Hedges JI, Ertel JR (1982) Characterization of lignin by gas
capillary chromatography of cupric oxide oxidation prod-
ucts. Anal Chem 54:174–178
Hedges JI, Mann DC (1979) The characterization of plant tis-
sues by their lignin oxidation products. Geochim Cosmo-
chim Acta 43:1803–1807
Hedges JI, Blanchette RA, Weliky K, Devol AH (1988) Effects
of fungal degradation on the CuO oxidation products of
lignin: a controlled laboratory study. Geochim Cosmochim
Acta 52:2717–2726
Hernes PJ, Robinson AC, Aufdenkampe AK (2007) Fraction-
ation of lignin during leaching and sorption and implica-
tions for organic matter ‘‘freshness’’. Geophys Res Lett
34:L1740
Hill AR, Kemp WA, Buttle JM, Goodyear D (1999) Nitrogen
chemistry of subsurface storm runoff on forested Canadian
Shield hillslopes. Water Resour Res 35:811–821
Hinton MJ, Schiff SL, English MC (1998) Sources and flow-
paths of dissolved organic carbon during storms in two
forested watersheds of the Precambrian Shield. Biogeo-
chemistry 41:175–197
Hood E, Gooseff MN, Johnson SL (2006) Changes in the
character of stream water dissolved organic carbon during
flushing in three small watersheds, Oregon. J Geophys Res-
Biogeosci 111: G01007
Holmes RM, McClelland JW, Raymond PA, Frazer BB, Pet-
erson BJ, Stieglitz M (2008) Lability of DOC transported
by Alaskan rivers to the arctic ocean. Geophys Res Lett 35:
L03402
Hornberger GM, Bencala KE, McKnight DM (1994) Hydro-
logical controls on dissolved organic carbon during
snowmelt in the Snake River near Montezuma, Colorado.
Biogeochemistry 25:147–165
Howarth RW, Marino R (2006) Nitrogen as the limiting nutrient
for eutrophication in coastal marine ecosystems: evolving
views over three decades. Limnol Oceanogr 51:364–376
Kaiser K, Guggenberger G, Haumaier L (2004) Changes in
dissolved lignin-derived phenols, neutral sugars, uronic
acids, and amino sugars with depth in forested Haplic
Arenosols and Rendzic Leptosols. Biogeochemistry 70:
135–151
Keil RG, Neibauer JA (2009) Analysis of cooking spices in
natural waters. Limnol Oceanogr Methods 7:848–855
Kennedy VC (1971) Silica variation in stream water with time
and discharge. In: Hem JD (ed) Nonequilibrium systems in
natural water chemistry, vol. 106. American Chemical
Society Advances in Chemistry, Washington, pp 95–130
Liaw WK, MacCrimmon HR (1977) Assessment of particulate
organic matter in river water. Int Rev Gesamten Hydrobiol
62:445–463
McCreary FR (1975) Soil survey of Jefferson County area,
Washington. USDA Soil Conservation Service, Washington
McMurphy CJ (1980) Soil survey of Kitsap County area,
Washington. USDA Soil Conservation Service,
Washington
McClain ME, Elsenbeer H (2001) Terrestrial inputs to Amazon
streams and internal biogeochemical processing. In:
McClain ME, Victoria RL, Richey JE (eds) The biogeo-
chemistry of the Amazon basin. Oxford University Press,
New York, pp 185–208
McGlynn BL, McDonnell JJ (2003) Role of discrete landscape
units in controlling catchment dissolved organic carbon
dynamics. Water Resour Res 27: 3065–3073
McKnight DM, Bencala KE, Zeliweger GW, Aiken GR, Feder
GL, Thorn KA (1992) Sorption of dissolved organic carbon
by hydrous aluminum and iron oxides occurring at the
confluence of Deer Creek with the Snake River, Summit
County, Colorado. Environ Sci Technol 26:1388–1396
Mulholland PJ, Tank JL, Sanzone DM, Wolheim WM, Peterson
BG, Webster JR, Meyer JL (2000) Nitrogen cycling in a
forest stream determined by a 15N tracer addition. Ecol
Monogr 70:471–493
Naiman RJ, Sedell JR (1979) Character-ization of particulate
organic matter transported by some Cascade Mountain
streams. J Fish Res Board Can 36:17–31
Neill C, Deegan LA, Thomas SM, Haupert CL, Krusche AV,
Ballester VM, Victoria RL (2006) Deforestation alters
channel hydraulic and biogeochemical characteristics of
small lowland Amazonian streams. Hydrol Process 20:
2563–2580
Ness AO, Fowler RH (1960) Soil survey of Mason County,
Washington. USDA Soil Conservation Service in cooper-
ation with Washington Agricultural Experiment Station,
Washington
Newton JA, Thomson AL, Eisner LB, Hannach, GA, Albertson
SL (1995) Dissolved oxygen concentrations in Hood
Canal: are conditions different than forty years ago? In:
Puget Sound Research ‘95 Proceedings, Puget Sound
Water Quality Authority, Olympia, pp 1002–1008
Newton JA, Albertson SL, Van Voorhis K, Maloy C, Siegel E
(2002) Washington State Marine Water Quality in 1998
through 2000, Washington State Department of Ecology,
Environmental Assessment Program, Publication #02-03-
056, Olympia, WA
Ocampo CJ, Oldham CE, Sivapalan M (2006) Nitrate attenua-
tion in agricultural catchments: shifting balances between
transport and reaction. Water Resour Res 42: W01408
Opsahl S, Benner R (1995) Early diagenesis of vascular plant
tissues: lignin and cutin decomposition and biogeochemi-
cal implications. Geochim Cosmochim Acta 59:4889–
4904
Otto A, Simpson MJ (2006) Evaluation of CuO oxidation
parameters for determining the source and stage of lignin
degradation in soil. Biogeochemistry 80(2):121–142
Peterson DL, Schreiner EG, Buckingham NM (1997) Gradients,
vegetation and climate: spatial and temporal dynamics in
the Olympic Mountains, USA. Global ecology and bioge-
ography. Letters 6:7–17
Peterson BJ, Wolheim WM, Mulholland PJ, Webster JR, Meyer
JL, Tank JL, Martı0 E, Bowden WB, Valett HM, Hershey E,
McDowell WH, Dodds WK, Hamilton SK, Gregory SV,
Morrall DD (2001) Control of nitrogen export from
watersheds by headwater streams. Science 292:86–90
Qualls RG, Haines BL (1992) Biodegradability of dissolved
organic matter in forest throughfall, soil solution, and
stream water. Soil Sci Soc Am J 56:578–586
Biogeochemistry
123
Author's personal copy

Rabalais NN, Turner RE, Wiseman WJ (2001) Hypoxia in the
Gulf of Mexico. J Environ Qual 30:320–329
Raymond PA, Saiers JE (2010) Event controlled DOC export
from forested watersheds. Biogeochemistry 100:197–209
Sanderman J, Lohse KA, Baldock JA, Amundson R (2009)
Linking soils and streams: sources and chemistry of dis-
solved organic matter in a small coastal watershed. Water
Resour Res 45: W03418
Sarkanenk V, Ludwig CH (1971) Lignins. Wiley-Interscience,
New York
Schiff S, Aravena R, Mewhinney E, Elgood R, Warner B, Dillon
P, Trumbore S (1998) Precambrian shield wetlands:
hydrologic control of the sources and export of dissolved
organic matter. Clim Change 40:167–188
Sigleo AC, Frick WE (2003) Seasonal variations in river flow
and nutrient concentrations in a Northwestern USA
watershed. In: Proceedings of the first interagency on
research in the watersheds, USDA, Benson, Arizona,
pp 370–376
Spencer RGM, Aiken GR, Wickland KP, Striegl RG, Hernes PJ
(2008) Seasonal and spatial variability in dissolved organic
matter quantity and composition from the Yukon River
basin, Alaska. Glob Biogeochem Cycles 22: GB4002
Steinberg PD, Brett MT, Bechtold JS, Richey JE, McGeoch LE,
Osborne SN (2010) The influence of watershed charac-
teristics on nitrogen export to Hood Canal, Washington,
USA. Biogeochemistry. doi:10.1007/s10533-010-9521-7
Thomas SM, Neill C, Deegan LA, Krusche AV, Ballester VM,
Victoria RL (2004) Influences of land use and stream size
on particulate and dissolved materials in a small Amazo-
nian stream network. Biogeochemistry 68:135–151
Trojanowski J (1969) Biological degradation of lignin. Int
Biodeterior Bull 5, 119e124
van Verseveld WJ, McDonnell JJ, Lajtha K (2009) The role of
hillslope hydrology in controlling nutrient loss. J Hydrol
367: 177–187
Vannote RL, Minshall GW, Cummins KW, Sedell JR, Cushing
CE (1980) The river continuum concept. Can J Fish Aquat
Sci 37:30–137
Vidon P, Wagner LE, Soyeux E (2008) Changes in the character
of DOC in streams during storms in two Midwestern
watersheds with contrasting land uses. Biogeochemistry
88:257–270
Ward RC, Robinson M (1990) Principles of hydrology. 3rd edn.
McGraw Hill, Maidenhead, p 365
Webster JR, Mulholland PJ, Tank JL, Valett HM, Dodds WK,
Peterson BJ, Bowden WB, Dahm CN, Findlay S, Gregory
SV, Grimm NB, Hamilton SK, Johnson SL, Martı0 E,
McDowell WH, Meyer JL, Morrall DD, Thomas SM,
Wolheim WM (2003) Factors affecting ammonium uptake
in streams—an inter-biome perspective. Freshw Biol
48:1329–1352
Biogeochemistry
123
Author's personal copy

![2-[( E )-(2,3-Dimethylphenyl)iminomethyl]phenol](https://img.pdfslide.net/doc/110x75/631eeb0c0e3ac35f4f0063dd/2-e-23-dimethylphenyliminomethylphenol.jpg)


