Embed Size (px)
Citation preview
Ten years of soil CO2 continuous monitoring onMt. Etna: Exploring the relationship betweenprocesses of soil degassing and volcanic activity
Marco Liuzzo, Sergio Gurrieri, Gaetano Giudice, and Giovanni GiuffridaIstituto Nazionale di Geofisica e Vulcanologia, Sezione di Palermo, Palermo, IT-90146,Italy ([email protected])
[1] The measurement of soil CO2 flux variations is a well�established practice in many volcanic areasaround the world. Until recently, however, most of these were made using direct sampling methods.These days, a variety of automatic devices providing real-time data now make the continuous monitoringof volcanic areas possible. A network of automatic geochemical monitoring stations (EtnaGas network)was developed by INGV Palermo and installed at various sites on the flanks of Mt. Etna. Here, we presenta large set of soil CO2 flux data recorded by the network, dating back 10 years, a period in which severalnoteworthy eruptive phenomena occurred. Our statistical analysis strongly suggests that anomalousmeasurements of soil CO2 flux are attributable to volcanic origin and in almost all cases precede volcanicactivity. Here, we present the actual data series recorded by EtnaGAS and an interpretative model of theexpected behavior of soil CO2 flux (in terms of increase-decrease cycles), which corresponded well withthe volcanic activity during this period. Through the use of a comparative approach, incorporating bothvolcanological and geochemical data, the global soil CO2 flux trends are put into a coherent framework,highlighting close links between the time flux variations and volcanic activities. These insights, madepossible from 10 years of uninterrupted data, confirm the importance of continuous monitoring ofvolcanic soil degassing, and may contribute in the forecasting of imminent eruptive activity or thetemporal evolution of an in-progress eruption, therefore facilitating Civil Defense planning in volcanicareas under high-hazard conditions.
Components: 9,846 words, 8 figures, 1 tables.
Keywords: Mt. Etna; volcano monitoring; lava fountaining; CO2.
Index Terms: 8430 Volcanic gases: Volcanology; 8419 Volcano monitoring: Volcanology; 8499 General or miscellane-ous: Volcanology; 4302 Geological: Natural Hazards; 7280 Volcano seismology: Seismology.
Received 5 February 2013; Revised 31 May 2013; Accepted 7 June 2013; Published 00 Month 2013.
Liuzzo, M., S. Gurrieri, G. Giudice, and G. Giuffrida (2013), Ten years of soil CO2 continuous monitoring on Mt. Etna:Exploring the relationship between processes of soil degassing and volcanic activity, Geochem. Geophys. Geosyst., 14,doi:10.1002/ggge.20196.
1. Introduction
[2] Throughout the Mediterranean area, Mt. Etnais well known for its frequent eruptions and exten-sive lava flows, being, among all of the basaltic
volcanoes, one of the most active in the world.The repeated eruptive activities from the flank ofthe volcano and from the craters on the summitarea have produced different types of volcanicphenomena, varying from weak, passive lava
© 2013. American Geophysical Union. All Rights Reserved. 1
Article
Volume 00, Number 00
0 MONTH 2013
doi: 10.1002/ggge.20196
ISSN: 1525-2027
flows to strong paroxysms [Behncke and Neri,2003; Burton et al., 2005]. The most violent par-oxysms and the most extensive lava flows havepresented, and continue to present, a serious threatto both local economic activities and to the veryhigh density of people living around the volcano[Andronico et al., 2009].
[3] The frequent activity of the last two decadeshas induced the scientific community and CivilDefense to focus more attention upon the surveil-lance of the volcano, resulting in a variety of vol-canic monitoring systems which have beendeveloped over the years, now making Mt. Etnaone of the most intensively monitored volcanoesin the world [Bonaccorso et al., 2011a].
[4] In terms of seismic monitoring, instrumentsare now very efficient and reliable; in fact, the net-work for the continuous monitoring of seismic ac-tivity was the first one to be set up on Mt. Etna.With regard to geochemical monitoring, however,this was previously only possible using discretesampling methods, and, whilst well established inseveral areas of the volcano, was generally carriedout at weekly intervals at most. It is only recentlythat suitable technologies have become availablewhich permit the continuous automated monitor-ing of any meaningful geochemical parameters onMt. Etna. The first network of continuous monitor-ing of geochemical parameters in this region wasdeveloped by the Istituto Nazionale di Geofisica eVulcanologia (INGV) of Palermo [Gurrieri et al.,2008] to monitor soil CO2 flux (EtnaGAS net-work). CO2 was selected as it is recognized as oneof the most important gas species for monitoringvolcanic activity [Symonds et al., 2001]. Mt. Etnais one of the world’s most degassing volcanoes,particularly in terms of the total rate of magmaticsoil CO2 release [Allard et al., 1991; Symonds,1998]. The first of the EtnaGAS network stationsto be installed was in December 2002 (P78), withfurther additions made over the following years.Today, EtnaGAS comprises 18 automatic stationswhich are located close to the main volcanic struc-tures of Mt. Etna in areas of the volcano character-ized by strong soil CO2 emissions.
[5] The data sets acquired from the network allowus to investigate the role of passive CO2 soildegassing and its relationship with the dynamicsof the volcano itself. A previous lack of insightinto this has been particularly due to the fact thatEtnaGAS is the first automated geochemical net-work for continuous monitoring which widely andhomogeneously covers a volcano. Following the
acquisition of raw data, we use an interpretativemethod which takes into account the continuousvariations of CO2 degassing from all the networkstations, evaluating their anomalies in relation tovolcanic activities. In this paper, we show theresults of 10 years of CO2 soil flux variation,describing different cycles of increase-decrease. Wehave included data from published literature regard-ing the plume CO2/SO2 ratio variations and the vol-canic activities, showing how, in these contexts, thecycles of CO2 variations can provide an extremelyuseful aid in the understanding of volcanic activityon Mt. Etna and, moreover, lead to an enhancedability to predict the course of further activity.
2. Volcanic Activity During 2004–2012
[6] Mt. Etna is one of the most active volcanoes inthe world, erupting every 1.5 years on averageover the last century. This study focuses on fivedistinct eruptive periods, as described below.
2.1. Period 2004–2005
[7] The first starting on 9 September 2004, inwhich a new fracture appeared on the southeastflank of the SEC, producing a lava flow that lasteduntil 8 March 2005; this eruption was characterizedby the absence of any prior seismic signal or anyinitial paroxysmal activities. For these reasons, sev-eral authors consider the 2004–2005 volcanic activ-ity to be the first recorded example of a passiveeruption caused by sliding on the eastern flank.
2.2. Period 2006
[8] This eruptive period can be split into twophases: The first began on the night of 14 July2006, and lasted until 23 July 2006; this phasewas characterized by Strombolian activity withstrong lava fountaining which reached heights inexcess of 250 m and was clearly visible from thecity of Catania. No evident geophysical changespreceded this phase [Bonforte et al., 2008] and itwas only upon the onset of the eruption that anincrease in volcanic tremor amplitude wasobserved [Neri et al., 2006].
[9] The second phase started on 31 August andended on 15 December, with a brief interruptionof a few days. This eruption created a field of frac-tures on the eastern flank of the Southeast Crater(SEC) at about 3000 m asl, where a lava flow wasemitted. This second phase involved new episodesof Strombolian activity: (i) at the beginning; (ii)
LIUZZO ET AL. : CO2 SOIL DEGASSING AND VOLCANIC ACTIVITY 10.1002/ggge.20196
2
on 13 October, when a new fracture opened up onthe eastern flank of the SEC; and (iii) on 26 Octo-ber, also involving the south flank of the BoccaNuova Crater (BNC), which began erupting simul-taneously with the continuing activity on theSoutheast crater. Minor episodes of Strombolianactivity occurred at SEC before the end of theeruption, some of which were particularly strongalthough short in duration (16, 19, and 24 Novem-ber) [Behncke et al., 2009].
2.3. Period 2007
[10] The volcanic activity during 2007 was alsocharacterized by very short, although, powerfulevents. Each of these began with normal Strombo-lian activity and culminated with lava fountainsand lava flow. The first occurred on 31 March andfinished just some hours later. The others occurredon 11 and 29 April and on 7 May. Again, in themiddle of August, new Strombolian explosionsoccurred at the SEC, culminating in lava fountainsand a lava effusion during the night of 4 Septemberand the early hours of 5 September. The last eventoccurred on 23 November on the same site as thatof 4 September, with the same characteristics.
2.4. Period 2008–2009
[11] During the first month of 2008, small ash emis-sions (e.g., 14, 15, 20, 25 February) were frequentlyobserved from the summit area. On 10 May, astrong explosive phase accompanied by a lava foun-tain and a large lava flow began in the afternoon andlasted until the night of the same day. On 13 May,there was new paroxystic activity, accompanied bystrong tremor signals. This marked the onset of anew eruption which, after the initial paroxysms,continued with very little other than effusive activ-ity, interrupted only by brief Strombolian activitybetween 11 and 14 March, with a consequentincreased lava output. The 2008–2009 eruptionlasted more then a year, finishing in mid July 2009.
[12] The remaining part of 2009 proceeded with-out further eruptive activities, with the importantexception, however, of 6 November, when a smalldegassing ‘‘hole’’ opened up on the flank of theSEC from which a red glowing light could be seenby all the villages around the southern slopes ofthe volcano. This continued without further conse-quence until the end of the year.
2.5. Period 2010–2012
[13] This is the last of the five eruptive periods dis-cussed in this paper. In this period, a new crater
(Pit Crater) was formed, caused by some intracra-teric collapses that occurred during the summer of2010, which considerably enlarged the small holethat had opened up at the base of the SoutheastCrater on 6 November 2009, increasing its diame-ter from just a few meters to a few hundred meters.At the beginning of the new year (during the nightbetween 11 and 12 January 2011), a huge paroxys-tic phase began at the new Pit Crater, accompaniedby a lava fountain and a lava flow which lasted forseveral hours. The violence of this paroxysmerupted a volume of magma close to 1.55 � 106
m3 in only 4 h [Ganci et al., 2012]. Although thetype of activity of this eruption is similar to theparoxysms that occurred during 2007, the volumeof magma erupted was four times higher than in2007 [Harris et al., 2011]. The paroxysm of 12January was the first of 18 paroxysms that tookplace over 2011, all of which bore the same char-acteristics: (i) short in duration; (ii) strong inenergy, as demonstrated by the very large lavafountaining; and (iii) emitting a comparable vol-ume of erupted lava. During the first 4 months of2012, a further seven paroxysms with similar fea-tures followed (5 January; 9 February; 4 and 18March; 1, 12, and 24 April), reaching a total of 25paroxysms since the first in 2011.
[14] It is interesting to compare the total amountof lava erupted during the 2011–2012 period withthat of the previous eruptions of 2008–2009: Har-ris et al. [2011] estimated 68 � 106 m3 for the2008–2009 eruptions, which lasted 420 days,while Ganci et al. [2012], using a comparablemethod, estimated the total amount of lava eruptedfor all the 18 events in 2011, including the first ofthe 2012 (5 January), at about 25.4 � 106 m3. Thisis remarkable if we consider that the huge amountof lava erupted over these 19 episodes was emittedin the equivalent of less than 9 days, and that thisvalue might have been underestimated as theweather conditions during the events on 18 Febru-ary and 19 September did not permit any measure-ment survey. Furthermore, we do not know thecontributions of lava erupted from the subsequentsix episodes (9 February to 24 April) as there areno published data. This indicates that the volcanicactivities during 2011–2012 were very different tothose observed in the previous years.
3. Network Features
[15] EtnaGas network consists of 18 automatic sta-tions located close to the main volcanic structures
LIUZZO ET AL. : CO2 SOIL DEGASSING AND VOLCANIC ACTIVITY 10.1002/ggge.20196
3
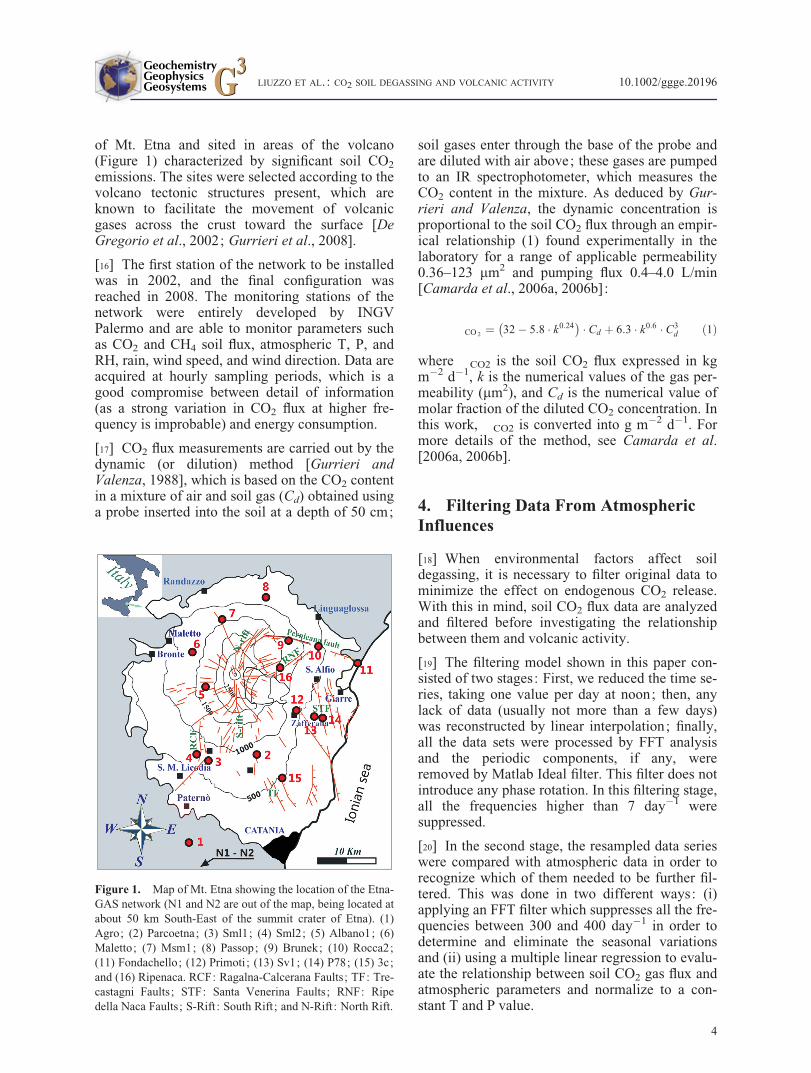
of Mt. Etna and sited in areas of the volcano(Figure 1) characterized by significant soil CO2
emissions. The sites were selected according to thevolcano tectonic structures present, which areknown to facilitate the movement of volcanicgases across the crust toward the surface [DeGregorio et al., 2002; Gurrieri et al., 2008].
[16] The first station of the network to be installedwas in 2002, and the final configuration wasreached in 2008. The monitoring stations of thenetwork were entirely developed by INGVPalermo and are able to monitor parameters suchas CO2 and CH4 soil flux, atmospheric T, P, andRH, rain, wind speed, and wind direction. Data areacquired at hourly sampling periods, which is agood compromise between detail of information(as a strong variation in CO2 flux at higher fre-quency is improbable) and energy consumption.
[17] CO2 flux measurements are carried out by thedynamic (or dilution) method [Gurrieri andValenza, 1988], which is based on the CO2 contentin a mixture of air and soil gas (Cd) obtained usinga probe inserted into the soil at a depth of 50 cm;
soil gases enter through the base of the probe andare diluted with air above; these gases are pumpedto an IR spectrophotometer, which measures theCO2 content in the mixture. As deduced by Gur-rieri and Valenza, the dynamic concentration isproportional to the soil CO2 flux through an empir-ical relationship (1) found experimentally in thelaboratory for a range of applicable permeability0.36–123 mm2 and pumping flux 0.4–4.0 L/min[Camarda et al., 2006a, 2006b]:
�CO 2 ¼ 32� 5:8 � k0:24� �
� Cd þ 6:3 � k0:6 � C3d ð1Þ
where �CO2 is the soil CO2 flux expressed in kgm�2 d�1, k is the numerical values of the gas per-meability (mm2), and Cd is the numerical value ofmolar fraction of the diluted CO2 concentration. Inthis work, �CO2 is converted into g m�2 d�1. Formore details of the method, see Camarda et al.[2006a, 2006b].
4. Filtering Data From AtmosphericInfluences
[18] When environmental factors affect soildegassing, it is necessary to filter original data tominimize the effect on endogenous CO2 release.With this in mind, soil CO2 flux data are analyzedand filtered before investigating the relationshipbetween them and volcanic activity.
[19] The filtering model shown in this paper con-sisted of two stages: First, we reduced the time se-ries, taking one value per day at noon; then, anylack of data (usually not more than a few days)was reconstructed by linear interpolation; finally,all the data sets were processed by FFT analysisand the periodic components, if any, wereremoved by Matlab Ideal filter. This filter does notintroduce any phase rotation. In this filtering stage,all the frequencies higher than 7 day�1 weresuppressed.
[20] In the second stage, the resampled data serieswere compared with atmospheric data in order torecognize which of them needed to be further fil-tered. This was done in two different ways: (i)applying an FFT filter which suppresses all the fre-quencies between 300 and 400 day�1 in order todetermine and eliminate the seasonal variationsand (ii) using a multiple linear regression to evalu-ate the relationship between soil CO2 gas flux andatmospheric parameters and normalize to a con-stant T and P value.
Figure 1. Map of Mt. Etna showing the location of the Etna-GAS network (N1 and N2 are out of the map, being located atabout 50 km South-East of the summit crater of Etna). (1)Agro; (2) Parcoetna; (3) Sml1; (4) Sml2; (5) Albano1; (6)Maletto; (7) Msm1; (8) Passop; (9) Brunek; (10) Rocca2;(11) Fondachello; (12) Primoti; (13) Sv1; (14) P78; (15) 3c;and (16) Ripenaca. RCF: Ragalna-Calcerana Faults; TF: Tre-castagni Faults; STF: Santa Venerina Faults; RNF: Ripedella Naca Faults; S-Rift : South Rift; and N-Rift: North Rift.
LIUZZO ET AL. : CO2 SOIL DEGASSING AND VOLCANIC ACTIVITY 10.1002/ggge.20196
4
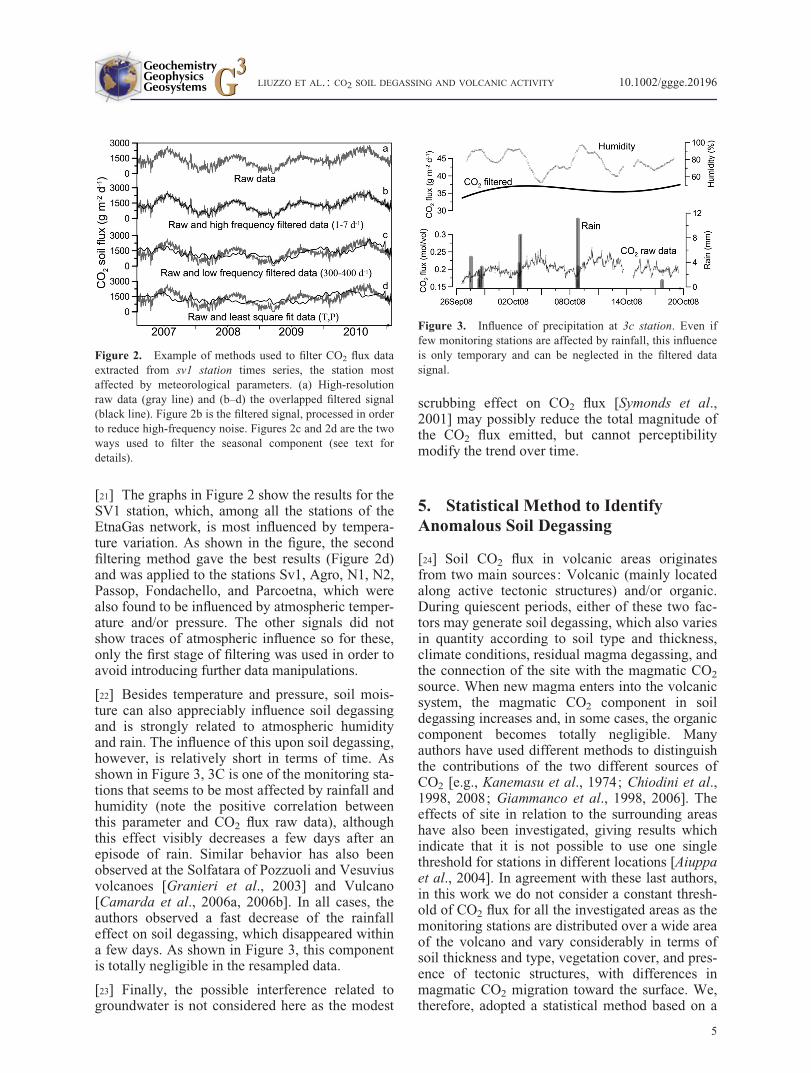
[21] The graphs in Figure 2 show the results for theSV1 station, which, among all the stations of theEtnaGas network, is most influenced by tempera-ture variation. As shown in the figure, the secondfiltering method gave the best results (Figure 2d)and was applied to the stations Sv1, Agro, N1, N2,Passop, Fondachello, and Parcoetna, which werealso found to be influenced by atmospheric temper-ature and/or pressure. The other signals did notshow traces of atmospheric influence so for these,only the first stage of filtering was used in order toavoid introducing further data manipulations.
[22] Besides temperature and pressure, soil mois-ture can also appreciably influence soil degassingand is strongly related to atmospheric humidityand rain. The influence of this upon soil degassing,however, is relatively short in terms of time. Asshown in Figure 3, 3C is one of the monitoring sta-tions that seems to be most affected by rainfall andhumidity (note the positive correlation betweenthis parameter and CO2 flux raw data), althoughthis effect visibly decreases a few days after anepisode of rain. Similar behavior has also beenobserved at the Solfatara of Pozzuoli and Vesuviusvolcanoes [Granieri et al., 2003] and Vulcano[Camarda et al., 2006a, 2006b]. In all cases, theauthors observed a fast decrease of the rainfalleffect on soil degassing, which disappeared withina few days. As shown in Figure 3, this componentis totally negligible in the resampled data.
[23] Finally, the possible interference related togroundwater is not considered here as the modest
scrubbing effect on CO2 flux [Symonds et al.,2001] may possibly reduce the total magnitude ofthe CO2 flux emitted, but cannot perceptibilitymodify the trend over time.
5. Statistical Method to IdentifyAnomalous Soil Degassing
[24] Soil CO2 flux in volcanic areas originatesfrom two main sources: Volcanic (mainly locatedalong active tectonic structures) and/or organic.During quiescent periods, either of these two fac-tors may generate soil degassing, which also variesin quantity according to soil type and thickness,climate conditions, residual magma degassing, andthe connection of the site with the magmatic CO2
source. When new magma enters into the volcanicsystem, the magmatic CO2 component in soildegassing increases and, in some cases, the organiccomponent becomes totally negligible. Manyauthors have used different methods to distinguishthe contributions of the two different sources ofCO2 [e.g., Kanemasu et al., 1974; Chiodini et al.,1998, 2008; Giammanco et al., 1998, 2006]. Theeffects of site in relation to the surrounding areashave also been investigated, giving results whichindicate that it is not possible to use one singlethreshold for stations in different locations [Aiuppaet al., 2004]. In agreement with these last authors,in this work we do not consider a constant thresh-old of CO2 flux for all the investigated areas as themonitoring stations are distributed over a wide areaof the volcano and vary considerably in terms ofsoil thickness and type, vegetation cover, and pres-ence of tectonic structures, with differences inmagmatic CO2 migration toward the surface. We,therefore, adopted a statistical method based on a
Figure 2. Example of methods used to filter CO2 flux dataextracted from sv1 station times series, the station mostaffected by meteorological parameters. (a) High-resolutionraw data (gray line) and (b–d) the overlapped filtered signal(black line). Figure 2b is the filtered signal, processed in orderto reduce high-frequency noise. Figures 2c and 2d are the twoways used to filter the seasonal component (see text fordetails).
Figure 3. Influence of precipitation at 3c station. Even iffew monitoring stations are affected by rainfall, this influenceis only temporary and can be neglected in the filtered datasignal.
LIUZZO ET AL. : CO2 SOIL DEGASSING AND VOLCANIC ACTIVITY 10.1002/ggge.20196
5
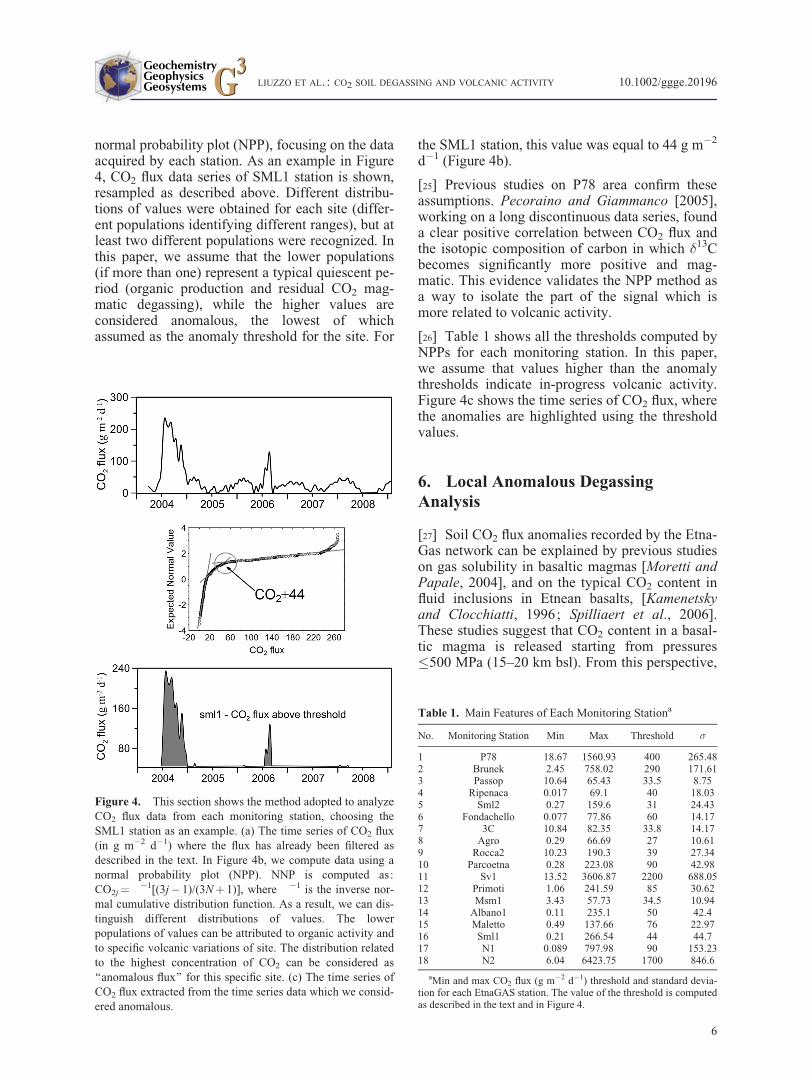
normal probability plot (NPP), focusing on the dataacquired by each station. As an example in Figure4, CO2 flux data series of SML1 station is shown,resampled as described above. Different distribu-tions of values were obtained for each site (differ-ent populations identifying different ranges), but atleast two different populations were recognized. Inthis paper, we assume that the lower populations(if more than one) represent a typical quiescent pe-riod (organic production and residual CO2 mag-matic degassing), while the higher values areconsidered anomalous, the lowest of whichassumed as the anomaly threshold for the site. For
the SML1 station, this value was equal to 44 g m�2
d�1 (Figure 4b).
[25] Previous studies on P78 area confirm theseassumptions. Pecoraino and Giammanco [2005],working on a long discontinuous data series, founda clear positive correlation between CO2 flux andthe isotopic composition of carbon in which �13Cbecomes significantly more positive and mag-matic. This evidence validates the NPP method asa way to isolate the part of the signal which ismore related to volcanic activity.
[26] Table 1 shows all the thresholds computed byNPPs for each monitoring station. In this paper,we assume that values higher than the anomalythresholds indicate in-progress volcanic activity.Figure 4c shows the time series of CO2 flux, wherethe anomalies are highlighted using the thresholdvalues.
6. Local Anomalous DegassingAnalysis
[27] Soil CO2 flux anomalies recorded by the Etna-Gas network can be explained by previous studieson gas solubility in basaltic magmas [Moretti andPapale, 2004], and on the typical CO2 content influid inclusions in Etnean basalts, [Kamenetskyand Clocchiatti, 1996; Spilliaert et al., 2006].These studies suggest that CO2 content in a basal-tic magma is released starting from pressures�500 MPa (15–20 km bsl). From this perspective,
Figure 4. This section shows the method adopted to analyzeCO2 flux data from each monitoring station, choosing theSML1 station as an example. (a) The time series of CO2 flux(in g m�2 d�1) where the flux has already been filtered asdescribed in the text. In Figure 4b, we compute data using anormal probability plot (NPP). NNP is computed as:CO2j¼��1[(3j� 1)/(3Nþ 1)], where ��1 is the inverse nor-mal cumulative distribution function. As a result, we can dis-tinguish different distributions of values. The lowerpopulations of values can be attributed to organic activity andto specific volcanic variations of site. The distribution relatedto the highest concentration of CO2 can be considered as‘‘anomalous flux’’ for this specific site. (c) The time series ofCO2 flux extracted from the time series data which we consid-ered anomalous.
Table 1. Main Features of Each Monitoring Stationa
No. Monitoring Station Min Max Threshold �
1 P78 18.67 1560.93 400 265.482 Brunek 2.45 758.02 290 171.613 Passop 10.64 65.43 33.5 8.754 Ripenaca 0.017 69.1 40 18.035 Sml2 0.27 159.6 31 24.436 Fondachello 0.077 77.86 60 14.177 3C 10.84 82.35 33.8 14.178 Agro 0.29 66.69 27 10.619 Rocca2 10.23 190.3 39 27.3410 Parcoetna 0.28 223.08 90 42.9811 Sv1 13.52 3606.87 2200 688.0512 Primoti 1.06 241.59 85 30.6213 Msm1 3.43 57.73 34.5 10.9414 Albano1 0.11 235.1 50 42.415 Maletto 0.49 137.66 76 22.9716 Sml1 0.21 266.54 44 44.717 N1 0.089 797.98 90 153.2318 N2 6.04 6423.75 1700 846.6
aMin and max CO2 flux (g m�2 d�1) threshold and standard devia-tion for each EtnaGAS station. The value of the threshold is computedas described in the text and in Figure 4.
LIUZZO ET AL. : CO2 SOIL DEGASSING AND VOLCANIC ACTIVITY 10.1002/ggge.20196
6
it is reasonable to attribute the strong increase inCO2 flux recorded by the monitoring stations ei-ther to a new input of volatile-rich magma enteringa deep storage area or to its ascent from the lowervolcanic conduits. The excess of CO2, no longer inequilibrium with the magma owing to the changedconditions, will be released from the early stage ofthis hypothesis, reaching the surface of the vol-cano before and/or during a possible subsequentvolcanic activity. The variation in CO2 flux, asdescribed above, may be related to an in-progressdeep magmatic activity that could evolve into avolcanic event observed at the surface; however,it cannot be assumed that this is always the case.In some situations, in fact, this phenomenon mighteven determine ‘‘false positive’’ cases with regardto CO2 flux variations.
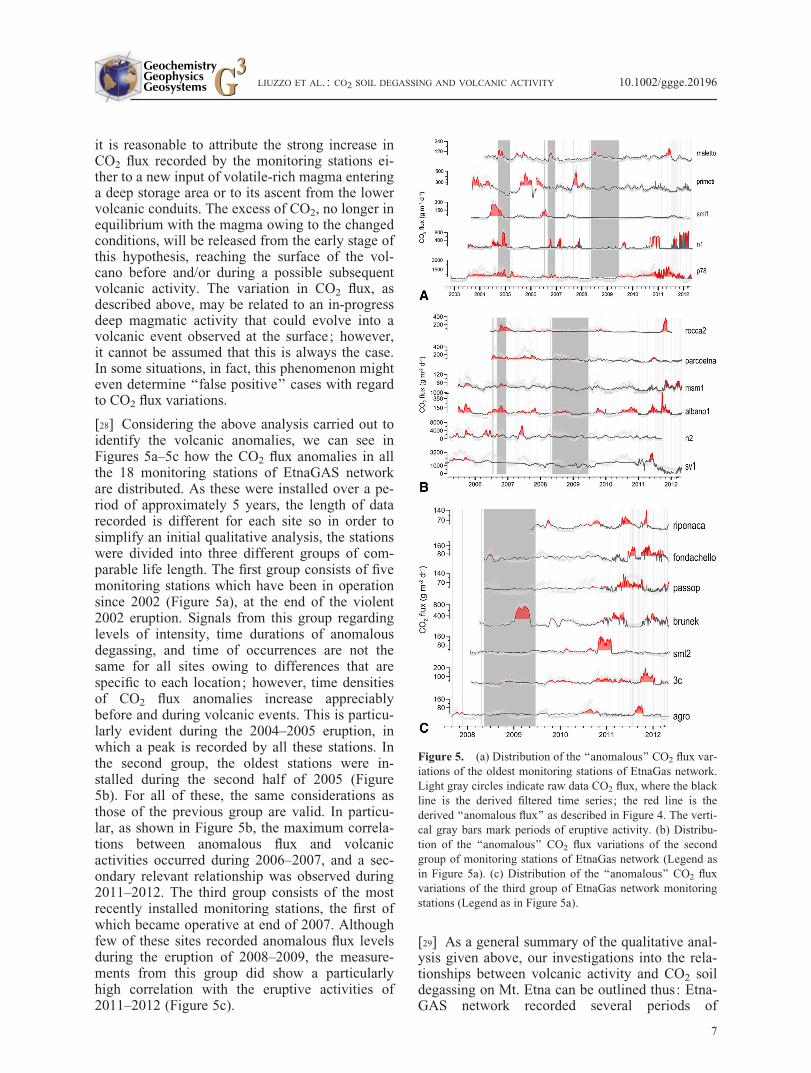
[28] Considering the above analysis carried out toidentify the volcanic anomalies, we can see inFigures 5a–5c how the CO2 flux anomalies in allthe 18 monitoring stations of EtnaGAS networkare distributed. As these were installed over a pe-riod of approximately 5 years, the length of datarecorded is different for each site so in order tosimplify an initial qualitative analysis, the stationswere divided into three different groups of com-parable life length. The first group consists of fivemonitoring stations which have been in operationsince 2002 (Figure 5a), at the end of the violent2002 eruption. Signals from this group regardinglevels of intensity, time durations of anomalousdegassing, and time of occurrences are not thesame for all sites owing to differences that arespecific to each location; however, time densitiesof CO2 flux anomalies increase appreciablybefore and during volcanic events. This is particu-larly evident during the 2004–2005 eruption, inwhich a peak is recorded by all these stations. Inthe second group, the oldest stations were in-stalled during the second half of 2005 (Figure5b). For all of these, the same considerations asthose of the previous group are valid. In particu-lar, as shown in Figure 5b, the maximum correla-tions between anomalous flux and volcanicactivities occurred during 2006–2007, and a sec-ondary relevant relationship was observed during2011–2012. The third group consists of the mostrecently installed monitoring stations, the first ofwhich became operative at end of 2007. Althoughfew of these sites recorded anomalous flux levelsduring the eruption of 2008–2009, the measure-ments from this group did show a particularlyhigh correlation with the eruptive activities of2011–2012 (Figure 5c).
[29] As a general summary of the qualitative anal-ysis given above, our investigations into the rela-tionships between volcanic activity and CO2 soildegassing on Mt. Etna can be outlined thus: Etna-GAS network recorded several periods of
Figure 5. (a) Distribution of the ‘‘anomalous’’ CO2 flux var-iations of the oldest monitoring stations of EtnaGas network.Light gray circles indicate raw data CO2 flux, where the blackline is the derived filtered time series; the red line is thederived ‘‘anomalous flux’’ as described in Figure 4. The verti-cal gray bars mark periods of eruptive activity. (b) Distribu-tion of the ‘‘anomalous’’ CO2 flux variations of the secondgroup of monitoring stations of EtnaGas network (Legend asin Figure 5a). (c) Distribution of the ‘‘anomalous’’ CO2 fluxvariations of the third group of EtnaGas network monitoringstations (Legend as in Figure 5a).
LIUZZO ET AL. : CO2 SOIL DEGASSING AND VOLCANIC ACTIVITY 10.1002/ggge.20196
7
anomalous soil CO2 flux levels, and all locationsshowed anomalies that can be correlated with vol-canic events. Although these are remarkableresults, it is not easy to correlate the anomalousmeasurements with volcanic activity in a simple,intelligible manner, owing to the large number ofstations and the aforementioned variations in termsof their specific locations. In addition, a lack ofsynchronicity is recognizable in some casesbetween different sites. These incongruities can beeasily explained, however, considering the size ofthe area covered by the EtnaGAS network (morethan 1.4 � 103 km2) and that each volcanic eventhas been characterized by different magmatic dy-namics involving different tectonic systems andheterogeneous geologic features of the volcano,each affecting the site in different way.
7. Data Discussion
[30] In accordance with the previous considerationregarding the uneven distributions of anomalies, itwas important to use a different data processingapproach to obtain a unified signal of CO2 fluxfrom all the monitoring stations. Therefore, eachsoil CO2 flux series was normalized in the range0–1 and calculated using the equation:
�nNorm tð Þ ¼
Xn
i¼1
�i tð Þ � �mini
�maxi � �min
i
[31] where n is the number of stations, �i(t) is themeasured flux at the site i and time t, �i
min and�i
max are, respectively, the minimum and the max-imum values of the i flux series. In this way, eachstation has the same weight and �n
Norm does nothave the flux physical quantity, but can be seen asa type of variable representing the total soil CO2
flux at a specific time.
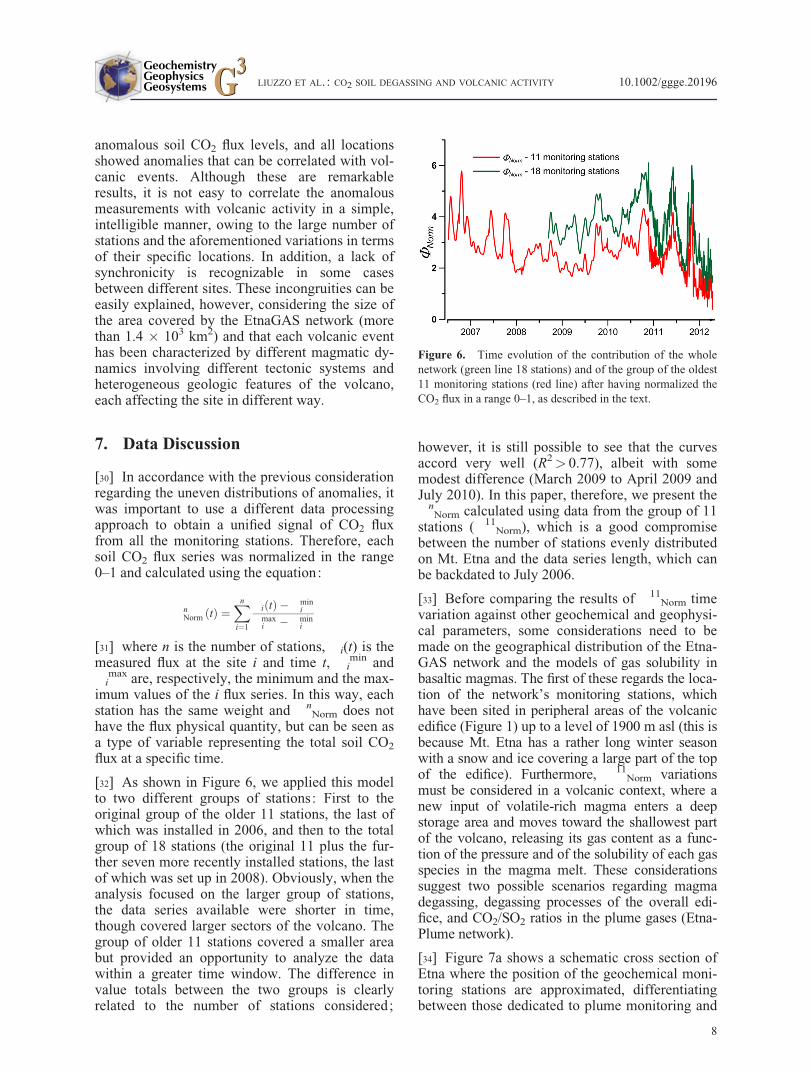
[32] As shown in Figure 6, we applied this modelto two different groups of stations: First to theoriginal group of the older 11 stations, the last ofwhich was installed in 2006, and then to the totalgroup of 18 stations (the original 11 plus the fur-ther seven more recently installed stations, the lastof which was set up in 2008). Obviously, when theanalysis focused on the larger group of stations,the data series available were shorter in time,though covered larger sectors of the volcano. Thegroup of older 11 stations covered a smaller areabut provided an opportunity to analyze the datawithin a greater time window. The difference invalue totals between the two groups is clearlyrelated to the number of stations considered;
however, it is still possible to see that the curvesaccord very well (R2> 0.77), albeit with somemodest difference (March 2009 to April 2009 andJuly 2010). In this paper, therefore, we present the�n
Norm calculated using data from the group of 11stations (�11
Norm), which is a good compromisebetween the number of stations evenly distributedon Mt. Etna and the data series length, which canbe backdated to July 2006.
[33] Before comparing the results of �11Norm time
variation against other geochemical and geophysi-cal parameters, some considerations need to bemade on the geographical distribution of the Etna-GAS network and the models of gas solubility inbasaltic magmas. The first of these regards the loca-tion of the network’s monitoring stations, whichhave been sited in peripheral areas of the volcanicedifice (Figure 1) up to a level of 1900 m asl (this isbecause Mt. Etna has a rather long winter seasonwith a snow and ice covering a large part of the topof the edifice). Furthermore, �11
Norm variationsmust be considered in a volcanic context, where anew input of volatile-rich magma enters a deepstorage area and moves toward the shallowest partof the volcano, releasing its gas content as a func-tion of the pressure and of the solubility of each gasspecies in the magma melt. These considerationssuggest two possible scenarios regarding magmadegassing, degassing processes of the overall edi-fice, and CO2/SO2 ratios in the plume gases (Etna-Plume network).
[34] Figure 7a shows a schematic cross section ofEtna where the position of the geochemical moni-toring stations are approximated, differentiatingbetween those dedicated to plume monitoring and
Figure 6. Time evolution of the contribution of the wholenetwork (green line 18 stations) and of the group of the oldest11 monitoring stations (red line) after having normalized theCO2 flux in a range 0–1, as described in the text.
LIUZZO ET AL. : CO2 SOIL DEGASSING AND VOLCANIC ACTIVITY 10.1002/ggge.20196
8
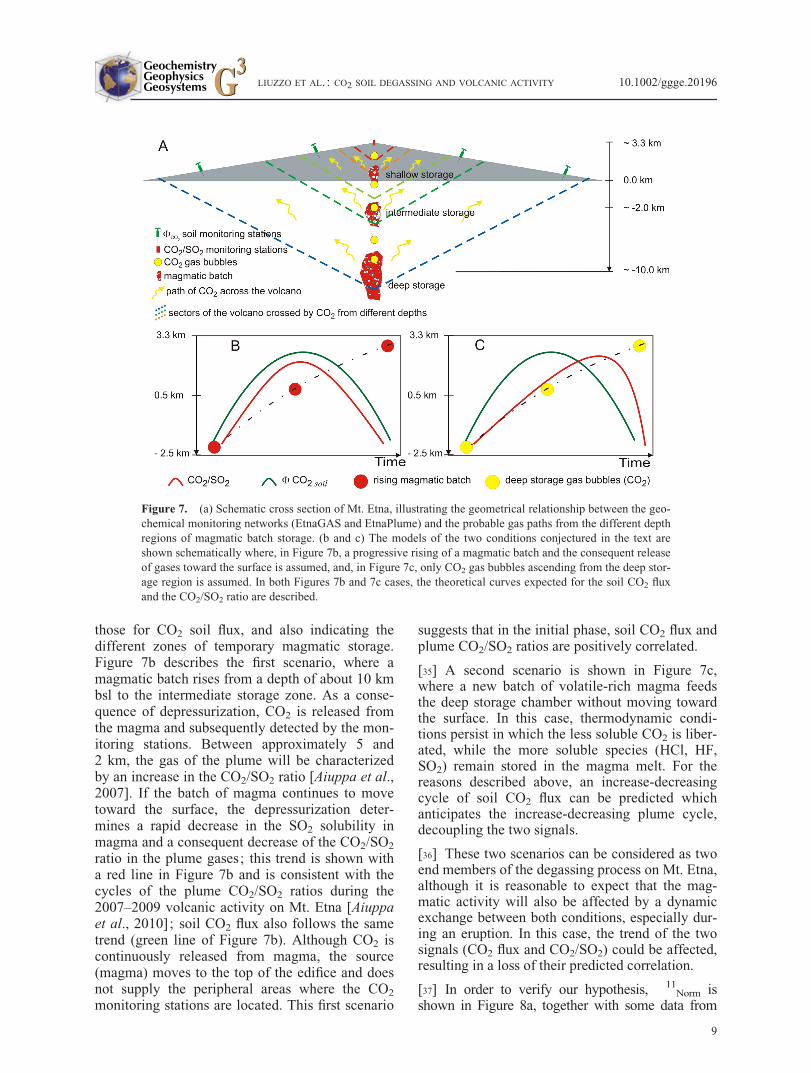
those for CO2 soil flux, and also indicating thedifferent zones of temporary magmatic storage.Figure 7b describes the first scenario, where amagmatic batch rises from a depth of about 10 kmbsl to the intermediate storage zone. As a conse-quence of depressurization, CO2 is released fromthe magma and subsequently detected by the mon-itoring stations. Between approximately 5 and2 km, the gas of the plume will be characterizedby an increase in the CO2/SO2 ratio [Aiuppa et al.,2007]. If the batch of magma continues to movetoward the surface, the depressurization deter-mines a rapid decrease in the SO2 solubility inmagma and a consequent decrease of the CO2/SO2
ratio in the plume gases; this trend is shown witha red line in Figure 7b and is consistent with thecycles of the plume CO2/SO2 ratios during the2007–2009 volcanic activity on Mt. Etna [Aiuppaet al., 2010]; soil CO2 flux also follows the sametrend (green line of Figure 7b). Although CO2 iscontinuously released from magma, the source(magma) moves to the top of the edifice and doesnot supply the peripheral areas where the CO2
monitoring stations are located. This first scenario
suggests that in the initial phase, soil CO2 flux andplume CO2/SO2 ratios are positively correlated.
[35] A second scenario is shown in Figure 7c,where a new batch of volatile-rich magma feedsthe deep storage chamber without moving towardthe surface. In this case, thermodynamic condi-tions persist in which the less soluble CO2 is liber-ated, while the more soluble species (HCl, HF,SO2) remain stored in the magma melt. For thereasons described above, an increase-decreasingcycle of soil CO2 flux can be predicted whichanticipates the increase-decreasing plume cycle,decoupling the two signals.
[36] These two scenarios can be considered as twoend members of the degassing process on Mt. Etna,although it is reasonable to expect that the mag-matic activity will also be affected by a dynamicexchange between both conditions, especially dur-ing an eruption. In this case, the trend of the twosignals (CO2 flux and CO2/SO2) could be affected,resulting in a loss of their predicted correlation.
[37] In order to verify our hypothesis, �11Norm is
shown in Figure 8a, together with some data from
Figure 7. (a) Schematic cross section of Mt. Etna, illustrating the geometrical relationship between the geo-chemical monitoring networks (EtnaGAS and EtnaPlume) and the probable gas paths from the different depthregions of magmatic batch storage. (b and c) The models of the two conditions conjectured in the text areshown schematically where, in Figure 7b, a progressive rising of a magmatic batch and the consequent releaseof gases toward the surface is assumed, and, in Figure 7c, only CO2 gas bubbles ascending from the deep stor-age region is assumed. In both Figures 7b and 7c cases, the theoretical curves expected for the soil CO2 fluxand the CO2/SO2 ratio are described.
LIUZZO ET AL. : CO2 SOIL DEGASSING AND VOLCANIC ACTIVITY 10.1002/ggge.20196
9
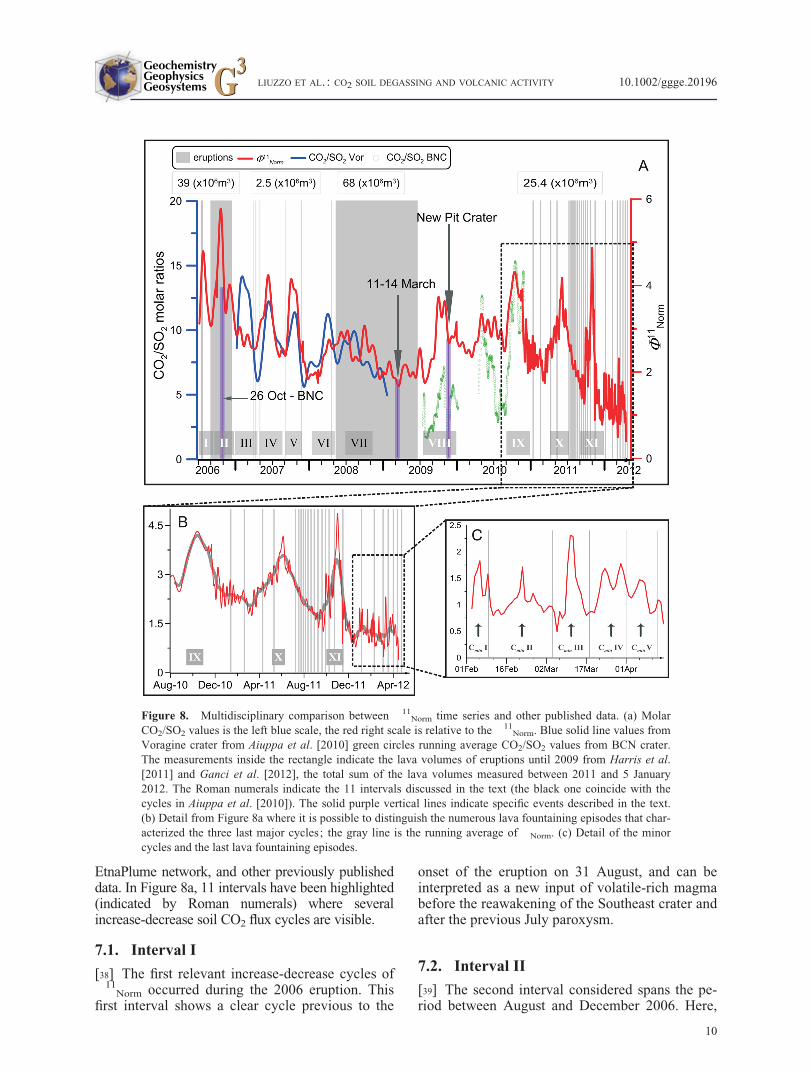
EtnaPlume network, and other previously publisheddata. In Figure 8a, 11 intervals have been highlighted(indicated by Roman numerals) where severalincrease-decrease soil CO2 flux cycles are visible.
7.1. Interval I
[38] The first relevant increase-decrease cycles of�11
Norm occurred during the 2006 eruption. Thisfirst interval shows a clear cycle previous to the
onset of the eruption on 31 August, and can beinterpreted as a new input of volatile-rich magmabefore the reawakening of the Southeast crater andafter the previous July paroxysm.
7.2. Interval II
[39] The second interval considered spans the pe-riod between August and December 2006. Here,
Figure 8. Multidisciplinary comparison between �11Norm time series and other published data. (a) Molar
CO2/SO2 values is the left blue scale, the red right scale is relative to the �11Norm. Blue solid line values from
Voragine crater from Aiuppa et al. [2010] green circles running average CO2/SO2 values from BCN crater.The measurements inside the rectangle indicate the lava volumes of eruptions until 2009 from Harris et al.[2011] and Ganci et al. [2012], the total sum of the lava volumes measured between 2011 and 5 January2012. The Roman numerals indicate the 11 intervals discussed in the text (the black one coincide with thecycles in Aiuppa et al. [2010]). The solid purple vertical lines indicate specific events described in the text.(b) Detail from Figure 8a where it is possible to distinguish the numerous lava fountaining episodes that char-acterized the three last major cycles; the gray line is the running average of �Norm. (c) Detail of the minorcycles and the last lava fountaining episodes.
LIUZZO ET AL. : CO2 SOIL DEGASSING AND VOLCANIC ACTIVITY 10.1002/ggge.20196
10
there are two recognizable cycles, in which thefirst reached the highest value on 22 October andthen rapidly decreased just before the opening ofthe new vent on the South flank of the BoccaNuova Crater, on 26 October, a separate eruptionfrom the coexisting Southeast Crater eruption. Webelieve that this cycle is particularly important asit is the only case during the entire period analyzedthat involved both the Southeast craters and theBocca Nuova craters simultaneously. The smallersecond cycle began after 26 October and finishedjust after the 2006 eruption. It is not possible tolink this second cycle to any definite sequence ofevents, being either possibly related to the laterstages of the 2006 eruption, or to a new contribu-tion of a deep batch of magma that anticipated thethird interval, where, in fact, there is a lack of cor-relation with the increase-decrease CO2/SO2
plume ratio, as we can see in detail in the nextinterval.
7.3. Intervals III–VII
[40] The following five intervals (III–VII inblack), with the exception of the third, coincidedwith increase-decrease CO2/SO2 plume ratiocycles, described in Aiuppa et al. [2010]. Of these,it is particularly clear that intervals IV, V, and VIshow a good correlation between the plume andthe �11
Norm signal. As outlined above, the lack ofcorrelation with the third interval cannot beexplained simply, although it is plausible to con-jecture that the absence of a clear cycle of �11
Norm
in this interval is due to the fact that it is integratedwithin the very high variations of the previous sec-ond interval. As an alternative explanation, it isalso possible to suppose that the plume variationcycle in interval III is shifted to a later time com-pared to the second �11
Norm cycle in interval II,probably because the magma feeding the firsteruptive activity of 2007 was stored in an interme-diate reservoir for a time, before continuing to-ward the upper part of the volcano.
[41] Interval VII also shows a low correlationbetween the two signals, plume and �11
Norm. Thisis, however, an expected result within the modelas it coincides with the 2008–2009 eruption inwhich there was most probably a dynamic passagebetween the two scenarios described above (Fig-ures 7b and 7c). Regarding the 2008–2009 erup-tion, the �11
Norm cycle in interval VII can beconsidered concluded just before the brief Strom-bolian activity on 11–14 March 2009, after whichthe eruption continued to decrease steadily untilfinishing entirely.
[42] These first seven intervals show, on thewhole, a slight decline of the �11
Norm, which fin-ishes at the end of the 2008–2009 eruption. Inorder to explain this decreasing trend, we have toconsider that: (i) the 2008–2009 eruption is recog-nized as a weak eruption which, following the ini-tial paroxysm of the first day, continued with amild effusion; (ii) compared with the previous2006 eruption, and in relationship with the lengthof each eruption, the daily rate of magma eruptedin 2006 is 3.5 times greater than in 2008–2009 (39m3 in 69 days for 2006 eruption to 68 m3 in 420days for 2008–2009 eruption); (iii) the petro-graphic analysis of the lava samples between 2007and 2008 show a well-defined trend toward a moreevolved magma in the products erupted and are,therefore, less volatile rich. This trend was inter-rupted on 17 June 2008, in which the products ofthe effusive activity were being fed by a moreprimitive magma [Bonaccorso et al., 2011b]. After17 June, the analysis of the subsequent effusiveproducts again showed a less primitive bulk rockcomposition (Corsaro R.A. INGV—Catania perso-nal communication); and (iv) in addition, theCO2/SO2 ratio cycles from Voragine crater show amoderate decreasing trend of peaks between 2007and 2008, which is more evident if we also con-sider that during the 2006 eruption, CO2/SO2
ratios reached much higher values, reaching apeak of 45 on 26 October [Aiuppa et al., 2007],than in the following cycles highlighted in this pa-per. These considerations clearly indicate, there-fore, that the 2008–2009 eruption was sustainedby a less volatile-rich magma, compared to theprevious 2006 eruption.
7.4. Interval VIII
[43] The more stable degassing phase, whichbegan at the end of 2008 and lasted until the firstday of July 2009, was interrupted again by a newcycle of the �11
Norm variation. This increase-decrease phase can be located between the firstdays of July 2009 and 6 November, immediatelybefore the opening of the small ‘‘hole’’ on the east-ern flank of the Southeast Crater, which started todegas without interruption. After this cycle, thesubsequent degassing rate continued with a rela-tively high �11
Norm average. To understand betterthe �11
Norm variations from this interval, it israther important to consider the evolution of thisnew structural feature over time; after its initialformation of 6 November 2009, the structurebegan to collapse during the following summer of2010, generating a pit crater which continued to
LIUZZO ET AL. : CO2 SOIL DEGASSING AND VOLCANIC ACTIVITY 10.1002/ggge.20196
11
degas. The subsequent paroxysms starting on2011, from what was then referred to as ‘‘Pit Cra-ter,’’ were responsible for the formation of a newcone, which is now referred to as ‘‘New South-East Crater,’’ which is, at the time of writing, com-parable in size to the present Southeast crater. Thisevidence of a possible change in volcanic behaviorseems to correspond with the later phases of erup-tions between 2011 and the early part of 2012,which were characterized by strong Strombolianepisodes and notable fountaining.
7.5. Intervals IX–XI
[44] In these last intervals, the �11Norm variations
showed three other major increase-decreasecycles. A first increase of �11
Norm (interval IX)starts at mid June, reaching the highest valuesaround October, followed by a fast decrease phase,finishing at the end of 2010. On 12 January, strongStrombolian activity from the Pit Crater markedthe beginning of a ‘‘new season’’ of activity onEtna, which was distinguished by numerous epi-sodes of quite spectacular paroxysms of lava foun-taining, with jets of incandescent lava reachingover 500 m in height.
[45] Interval X began abruptly with a renewedinput of fresh volatile-rich magma. It is notewor-thy that the decreasing phase of the �11
Norm beginsbefore the most intensive period of Strombolianactivity between June and October 2011.
[46] Finally, interval XI shows a strong �11Norm
variation in a relatively briefer time than the previ-ous. These last major increase-decrease cycles endbefore the final period of fountaining that occurredthroughout the first 4 months of 2012.
[47] We can observe that the �11Norm cycles
between intervals VIII and IX correlate well withthe CO2/SO2 ratios at Bocca Nuova crater (BNC),which, during this period, was the most active cra-ter of the volcano (unfortunately, other BNC dataare not available for this period, particularly duringthe winter, owing to station maintenance difficul-ties, and no significant data were recorded by theother two EtnaPlume network monitoring stations).
[48] As pointed out in Aiuppa et al. [2010], cyclesof increase-decrease of CO2/SO2 plume ratios arevery closely linked to volcanic activity. Theseauthors, using a multidisciplinary approach,showed that the resumption of volcanic activity atSEC was systematically anticipated by a completeCO2/SO2 plume cycle (increasing-decreasing) andmarked by sharp increases in tremor. In agreement
with geophysical data, this model is consistentwith preeruptive magma storage at 1–2.8 km reser-voir below the summit crater.
[49] All the decreasing phases of the �11Norm
cycles depicted in Figure 8a correlate very wellwith the fast increase of tremor occurring beforeeach eruptive event, as deducible from INGV-CTreports (www.ct.ingv.it). These are not included inthe graph in order to simplify Figure 8a. Theseobservations are coherent with those made inAiuppa et al. [2010] and Cannata et al. [2010].Furthermore, �11
Norm increase-decrease cyclescan be put in relationship with the eruptive activityand the volumes of erupted magma [Harris et al.,2011; Ganci et al., 2012], even if, as explained insection 6, a simple direct relationship cannot beexpected between them. Nevertheless, it is notablethat the eruptions during 2011–2012, althoughvery short in duration, produced a quantity oferupted lava of approximately 25 � 106 m3 (thetime amounting to only about 9 days in total, cal-culated until the first paroxysm in January 2012),which is more comparable with the 2006 eruption(in total 39 � 106 m3) than with the small 2007eruptions (in total 2.5 � 106 m3). This aspect israther important as it explains the large �11
Norm
time variations during the intervals IX, X, and XI(detail in Figure 8b).
[50] Additional information can be obtained usinga more detailed analysis of the �11
Norm over ashorter time scale. As shown in Figure 8c, �11
Norm
time variation allows us to distinguish some otherminor increase-decrease cycles during the finalphases of the 2011–2012 eruptions. The verypowerful fountaining episodes that characterizedthis period occurred at the final decreasing phaseof these minor cycles (CminI–CminV). In all ofthese, there persists a remarkably good correspon-dence with the above described model and the fol-lowing paroxysms on Mt. Etna of the last year.Similarly, other minor cycles between the lastthree major cycles during intervals IX–XI are alsorecognizable if not always as easily distinguish-able. A possible explanation for this is that themajor cycles are sustained by a strong flux of gasrelated to the ongoing volcanic activity and subse-quent rapid series of paroxysms, which then pro-duced a masking effect upon the minor cycles. Asis visible in Figure 8a, in the last three intervals,the �11
Norm signal appears to be affected by a sortof ‘‘noise,’’ the effect of the overlapping minorcycles, which is absent before interval IX. It is re-markable to note that this noise, and its interfer-ence with the signal, coincides with the periods of
LIUZZO ET AL. : CO2 SOIL DEGASSING AND VOLCANIC ACTIVITY 10.1002/ggge.20196
12
strong fountaining (2011–2012). In contrast, wecan see that the minor cycles shown in Figure 8c,which mark the final eruptive episodes, are far lessmasked as no new input of magma could supportan increasing flux of gas.
8. Conclusions
[51] These analyses of soil CO2 flux from Etna-GAS network give a new insight into the volcanicactivities during the 2004–2012 period, and con-tribute to a better understanding of the degassingprocesses on Mt. Etna. The findings discussedabove suggest the following considerations: (i)The results of �11
Norm presented here, which havebeen integrated within a multidisciplinary context,shed new light on our understanding and interpre-tation of CO2 flux degassing cycles in relation tovolcanic activities, through which it has been pos-sible to distinguish major cycles of degassing thatare clearly connected to the main volcanic activ-ities occurring over the last 6 years. Furthermore,the minor cycles which, when not masked by themajor cycles, show the same cycling trends thatanticipated the explosive activity and exceptionalfountaining episodes which took place between2011 and 2012. (ii) The results obtained are clearlydue to the improved system of data acquisitionmade possible by the network, which has taken usfrom the previous periodic sampling surveys to thenow almost real-time acquisition of high-resolution data. In addition, the EtnaGAS networkdemonstrates a real robustness in terms of itsmaintenance and, therefore, reliability, compara-ble to the existing well-tested seismological net-work, thus guarantying a continuity of solid dataacquisition. (iii) Finally, it must be considered thatthe analysis of Mt. Etna volcanic activities in rela-tion to the �11
Norm signals has focused upon a pe-riod of time in which only the summit craters wereinvolved and are possibly very different from lat-eral eruptions, where the main conduit of the cen-tral craters would perhaps play a different role inthe migration of gas toward the surface. For exam-ple, the first four monitoring stations of the EtnaGasnetwork recorded high rates of CO2 soil flux duringthe 2004–2005 lateral eruption despite the fact thatthis eruption was not characterized by any explo-sive behavior. Future lateral eruptions may, there-fore, contribute in a different way to the total rateof CO2 degassing on Etna. With the expansion ofthe network, we will be able strengthen further ourability to identify the different regions of the vol-cano that are affected by anomalous soil degassing,
which may be particularly useful in the case of lat-eral eruptions and their future evolution over ashort-time period, especially considering theircloser proximity to populated areas.
[52] These results not only confirm the importanceof the continuous monitoring of soil CO2 emis-sions in the surveillance of volcanic activity onMt. Etna, but, moreover, open up an interestingscenario for the surveillance of other active volca-noes around the world.
Acknowledgments
[53] The authors would like to thank the Editor for his sup-port, and the reviewers for their important and carefully con-sidered suggestions, which have no doubt fundamentallyimproved the content of this work. The authors would alsolike to thank S. Caffo (volcanologist of Parco dell’Etna) forhis indispensable help in the setting up of the network insidethe park. This study has benefited from funding provided bythe Italian Presidenza del Consiglio dei Ministri—Diparti-mento della Protezione Civile (DPC). This paper does notnecessarily represent DPC official opinion and policies.
References
Aiuppa A., A. Caleca, C. Federico, S. Gurrieri, and M. Valenza(2004), Diffuse degassing of carbon dioxide at Somma–Ve-suvius volcanic complex (Southern Italy) and its relationwith regional tectonics, J. Volcanol. Geotherm. Res.,133(1–4), 55–79, doi:10.1016/S0377-0273(03)00391-3.
Aiuppa, A., R. Moretti, C. Federico, G. Giudice, S. Gurrieri,M. Liuzzo, P. Papale, H. Shinohara, and M. Valenza (2007),Forecasting Etna eruptions by real-time observation of vol-canic gas composition, Geology, 35(12), 1115–1118,doi:10.1130/G24149A.
Aiuppa, A., et al. (2010), Patterns in the recent 2007–2008 ac-tivity of Mount Etna volcano investigated by integrated geo-physical and geochemical observations, Geochem. Geophys.Geosyst., 11, Q09008, doi:10.1029/2010GC003168.
Allard, P., et al. (1991), Eruptive and diffuse emissions of CO2
from Mount Etna, Nature, 351, 387–391.Andronico, D., S. Scollo, A. Cristaldi, and F. Ferrari (2009),
Monitoring ash emission episodes at Mt. Etna: The 16 No-vember 2006 case study, J. Volcanol. Geotherm. Res., 180,123–134, doi:10.1016/j.jvolgeores. 2008.10.019.
Behncke, B., and M. Neri (2003), Cycles and trends in therecent eruptive behaviour of Mount Etna (Italy), Can. J.Earth Sci., 40, 1405–1411, doi:10.1139/e03–052.
Behncke, B., S. Falsaperla, and E. Pecora (2009), Complexmagma dynamics at Mount Etna revealed by seismic, ther-mal, and volcanological data, J. Geophys. Res., 114,B03211, doi:10.1029/2008JB005882.
Bonaccorso, A., A. Bonforte, S. Calvari, C. Del Negro, G. DiGrazia, G. Ganci, M. Neri, A. Vicari, and E. Boschi (2011a),The initial phases of the 2008–2009 Mount Etna eruption: Amultidisciplinary approach for hazard assessment, J. Geo-phys. Res., 116, B03203, doi:10.1029/2010JB007906.
LIUZZO ET AL. : CO2 SOIL DEGASSING AND VOLCANIC ACTIVITY 10.1002/ggge.20196
13
Bonaccorso, A., A. Cannata, R. A. Corsaro, G. Di Grazia, S.Gambino, F. Greco, L. Miraglia, and A. Pistorio (2011b),Multidisciplinary investigation on a lava fountain preceding aflank eruption: The 10 May 2008 Etna case, Geochem. Geo-phys. Geosyst., 12, Q07009, doi:10.1029/2010GC003480.
Bonforte, A., A. Bonaccorso, F. Guglielmino, M. Palano, andG. Puglisi (2008), Feeding system and magma storagebeneath Mt. Etna as revealed by recent inflation/deflationcycles, J. Geophys. Res., 113, B05406, doi:10.1029/2007JB005334.
Burton, M., et al. (2005) Etna 2004–2005: An archetype forgeodynamically-controlled effusive eruptions, Geophys.Res. Lett., 32, L09303, doi:10.1029/2005GL022527.
Camarda, M., S. Gurrieri, and M. Valenza (2006a), CO2 fluxmeasurements in volcanic areas using the dynamic concen-tration method: Influence of soil permeability, J. Geophys.Res., 111, B05202, doi :10.1029/2005JB003898.
Camarda, M., S. Gurrieri, and M. Valenza (2006b), In situ per-meability measurements based on a radial gas advectionmodel: Relationships between soil permeability and diffuseCO2 degassing in volcanic areas, Pure Appl. Geophys.,163(4), 897–914, doi :10.1007/s00024-006-0045-y.
Cannata, A., G. Giudice, S. Gurrieri, P. Montalto, S. Alparone,G. Di Grazia, R. Favarea, S. Gresta, and M. Liuzzo (2010),Relationship between soil CO2 flux and volcanic tremor atMt Etna: Implications for magma dynamics, Environ. EarthSci., 61, 477–489, doi:10.1007/s12665-009-0359-z.
Chiodini, G., R. Cioni, M. Guidi, L. Marini, and B. Raco(1998), Soil CO2 flux measurements in volcanic and geo-thermal areas, Appl. Geochem., 13, 534–552.
Chiodini, G., S. Caliro, C. Cardellini, R. Avino, D. Granieri,and A. Schmidt (2008), Carbon isotopic composition of soilCO2 efflux, a powerful method to discriminate differentsources feeding soil CO2 degassing in volcanic–hydrother-mal areas, Earth Planet. Sci. Lett., 274, 372–379,doi:10.1016/j.epsl.2008.07.051.
De Gregorio, S., I. S. Diliberto, S. Giammanco, S. Gurrieri,and M. Valenza (2002), Tectonic control over large-scalediffuse degassing in eastern Sicily (Italy), Geofluids, 2, 273–284.
Ganci, G., A. J. L. Harris, C. Del Negro, Y. Guehenneux, A.Cappello, P. Labazuy, S. Calvari, and M. Gouhier (2012), Ayear of lava fountaining at Etna: Volumes from SEVIRI, Geo-phys. Res. Lett., 39, L06305, doi:10.1029/2012GL051026.
Giammanco, S., S. Gurrieri, and M. Valenza (1998), Anomaloussoil CO2 degassing in relation to faults and eruptive fissureson Mount Etna (Sicily, Italy), Bull. Volcanol., 60, 252–259.
Giammanco, S., S. Gurrieri, and M. Valenza (2006), Fault-controlled soil CO2 degassing and shallow magma bodies:Summit and lower East Rift of Kilauea Volcano (Hawaii),
1997, Pure Appl. Geophys., 163(4), 853–867, doi:10.1007/s00024-006-0039-9.
Granieri, D., G. Chiodini, W. Marzocchi, and R. Avino(2003), Continuous monitoring of CO2 soil diffuse degassingat Phlegraean Fields (Italy); influence of environmental andvolcanic parameters, Earth Planet. Sci. Lett., 212, 167–179,doi :10.1016/S0012–821X(03)00232-2.
Gurrieri, S., and M. Valenza (1988), Gas transport in naturalporous mediums: A method for measuring CO2 flows fromthe ground in volcanic and geothermal areas, Rend. Soc. Ital.Mineral. Petrol., 43, 1151–1158.
Gurrieri, S., M. Liuzzo, and G. Giudice, (2008), Continuousmonitoring of soil CO2 flux on Mt. Etna: The 2004–2005eruption and the role of regional tectonics and volcano tec-tonics, J. Geophys. Res., 113, B09206, doi:10.1029/2007JB005003, 2008.
Harris, A., A. Steffke, S. Calvari, and L. Spampinato (2011),Thirty years of satellite-derived lava discharge rates at Etna:Implications for steady volumetric output, J. Geophys. Res.,116, B08204, doi:10.1029/2011JB008237.
Kamenetsky, V., and R. Clocchiatti (1996), Primitive magma-tism of Mt. Etna: Insights from mineralogy and melt inclu-sions, Earth Planet. Sci. Lett., 142, 553–572, doi:10.1016/0012–821X(96)00115-X.
Kanemasu, E. T., W. L. Powers, and J. W. Sij, (1974), Fieldchamber measurements of CO2 flux from soil surface, SoilSci., 118, 233–237.
Moretti, R., and P. Papale (2004), On the oxidation state andvolatile behaviour in multi-component gas–melt equilibria,Chem. Geol., 213, 265–280, doi:10.1016/j.chemgeo.2004.08.048.
Neri, M., B. Behncke, M. Burton, G. Galli, S. Giammanco, E.Pecora, E. Privitera, and D. Reitano (2006), Continuous soilradon monitoring during the July 2006 Etna eruption, Geo-phys. Res. Lett., 33, L24316, doi:10.1029/2006GL028394.
Pecoraino, G., and S. Giammanco (2005), Geochemical char-acterization and temporal changes in parietal gas emissionsat Mt. Etna (Italy) during the period July 2000–July 2003,Terr. Atmos. Oceanic Sci., 16(4), 805–841.
Spilliaert, N., P. Allard, N. Metrich, and A. V. Sobolev (2006),Melt inclusion record of the conditions of ascent, degassing,and extrusion of volatile-rich alkali basalt during the power-ful 2002 flank eruption of Mount Etna (Italy), J. Geophys.Res., 111, B04203, doi:10.1029/2005JB003934.
Symonds, R. B. (1998), Compositions, origins, emission ratesand atmospheric impacts of volcanic gases, U.S. Geol. Surv.Open File Rep. 98–776.
Symonds, R. B., T. M. Gerlach, and M. H. Reed (2001), Mag-matic gas scrubbing: Implications for volcano monitoring,J. Volcanol. Geotherm. Res., 108, 303–341.
LIUZZO ET AL. : CO2 SOIL DEGASSING AND VOLCANIC ACTIVITY 10.1002/ggge.20196
14


