Embed Size (px)
Citation preview
Article
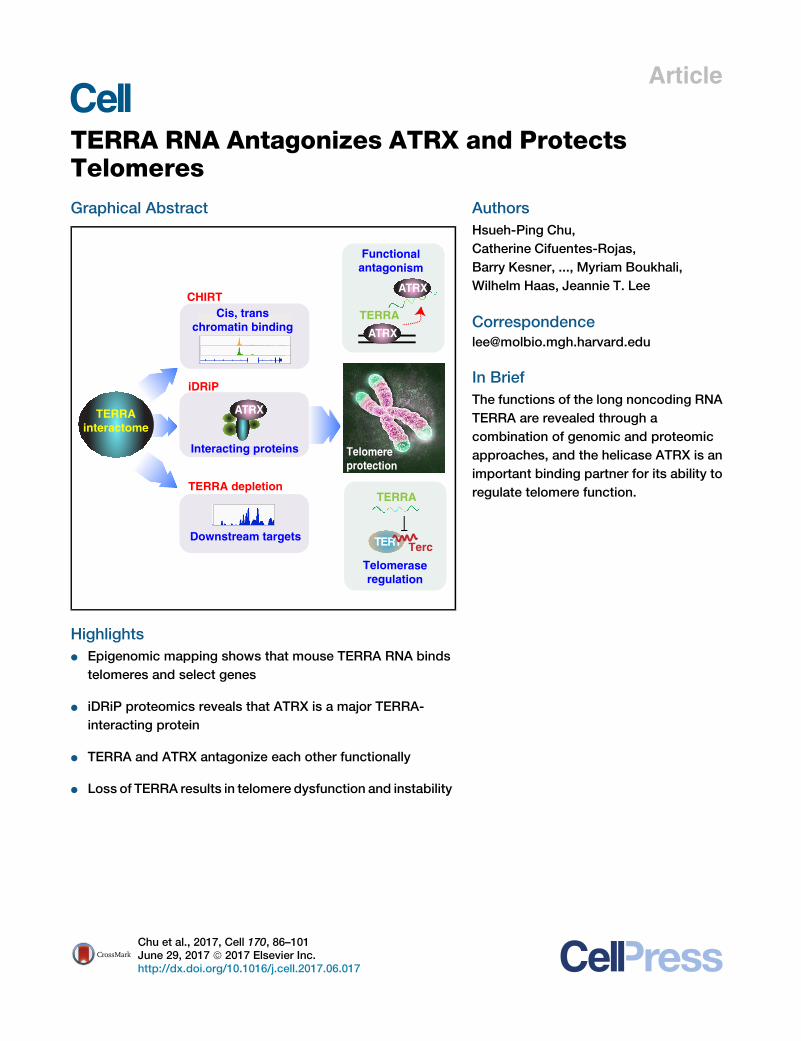
TERRA RNA Antagonizes ATRX and Protects
TelomeresGraphical Abstract
TERRAinteractome
iDRiP
CHIRT
TERRA
TERT
TERRA
Terc
Telomeraseregulation
Cis, transchromatin binding
Interacting proteins
TERRA depletion
Downstream targets
Functionalantagonism
ATRX
Telomereprotection
ATRX
ATRX
Highlights
d Epigenomic mapping shows that mouse TERRA RNA binds
telomeres and select genes
d iDRiP proteomics reveals that ATRX is a major TERRA-
interacting protein
d TERRA and ATRX antagonize each other functionally
d Loss of TERRA results in telomere dysfunction and instability
Chu et al., 2017, Cell 170, 86–101June 29, 2017 ª 2017 Elsevier Inc.http://dx.doi.org/10.1016/j.cell.2017.06.017
Authors
Hsueh-Ping Chu,
Catherine Cifuentes-Rojas,
Barry Kesner, ..., Myriam Boukhali,
Wilhelm Haas, Jeannie T. Lee
In Brief
The functions of the long noncoding RNA
TERRA are revealed through a
combination of genomic and proteomic
approaches, and the helicase ATRX is an
important binding partner for its ability to
regulate telomere function.
Article
TERRA RNA Antagonizes ATRXand Protects TelomeresHsueh-Ping Chu,1,2,3 Catherine Cifuentes-Rojas,1,2,3 Barry Kesner,1,2,3 Eric Aeby,1,2,3 Hun-goo Lee,1,2,3 Chunyao Wei,1,2,3
Hyun Jung Oh,1,2,3 Myriam Boukhali,4,5 Wilhelm Haas,4,5 and Jeannie T. Lee1,2,3,6,*1Howard Hughes Medical Institute, Boston, MA 02114, USA2Department of Molecular Biology, Massachusetts General Hospital, Boston, MA 02114, USA3Department of Genetics, Harvard Medical School, Boston, MA 02114, USA4Massachusetts General Hospital Cancer Center, Charlestown, Boston, MA 02114, USA5Department of Medicine, Harvard Medical School, Boston, MA 02114, USA6Lead Contact*Correspondence: [email protected]
http://dx.doi.org/10.1016/j.cell.2017.06.017
SUMMARY
Through an integration of genomic and proteomicapproaches to advance understanding of long non-coding RNAs, we investigate the function of the telo-meric transcript, TERRA. By identifying thousandsof TERRA target sites in the mouse genome, wedemonstrate that TERRA can bind both in cis to telo-meres and in trans to genic targets. We then define alarge network of interacting proteins, includingepigenetic factors, telomeric proteins, and the RNAhelicase, ATRX. TERRA and ATRX share hundredsof target genes and are functionally antagonistic atthese loci: whereas TERRA activates, ATRX re-presses gene expression. At telomeres, TERRA com-petes with telomeric DNA for ATRX binding, sup-presses ATRX localization, and ensures telomericstability. Depleting TERRA increases telomerase ac-tivity and induces telomeric pathologies, includingformation of telomere-induced DNA damage fociand loss or duplication of telomeric sequences. Weconclude that TERRA functions as an epigenomicmodulator in trans and as an essential regulator oftelomeres in cis.
INTRODUCTION
The Human Genome and ENCODE projects have shown that the
protein-coding potential of the mammalian genome is extremely
limited (Birney et al., 2007; Kung et al., 2013). Although only 2%
of the genome is coding, >90% is transcribed. This transcrip-
tional activity largely produces long noncoding RNAs (lncRNAs),
the functions of which have remained mostly unknown. This
pervasive transcription extends to the ends of eukaryotic chro-
mosomes. In spite of associated heterochromatin, telomeric
ends actively synthesize a heterogeneous population of long
noncoding RNAs dubbed TERRA (telomeric repeat-containing
RNAs) (Azzalin et al., 2007; Schoeftner and Blasco, 2008; Zhang
et al., 2009). TERRA ranges in size from 100 bases to >100 kb
86 Cell 170, 86–101, June 29, 2017 ª 2017 Elsevier Inc.
and contains the canonical telomeric repeat sequence,
UUAGGG, as well as sequences unique to the subtelomeric re-
gion of each chromosome. The function of TERRA has generated
major interest in light of its association with human diseases such
as cancer, aging, and ICF syndrome (Maicher et al., 2012; Azza-
lin and Lingner, 2015). Early observations noted that TERRARNA
is localized to the ends of nearly all mammalian chromosomes,
with RNA foci being especially prominently associated with sex
chromosomes (Azzalin and Lingner, 2008; Schoeftner and
Blasco, 2008; Zhang et al., 2009). Cytological studies have
also indicated that only about half of detectable TERRA tran-
scripts are localized to telomeres (Le et al., 2013).
Because of the preferential association with telomeres, inves-
tigation into TERRA function has focused almost exclusively on
telomeres—structures that cap physical ends of linear chromo-
somes and protect them from unprogrammed shortening and
genetic rearrangements (Blackburn et al., 2006; Bernardes de
Jesus and Blasco, 2013; Doksani and de Lange, 2014; Azzalin
and Lingner, 2015). Multiple studies have implicated TERRA as
regulator of telomerase and telomere length (Sandell et al.,
1994; Redon et al., 2010; Maicher et al., 2012; Pfeiffer and
Lingner, 2012; Fei et al., 2015). TERRA has also been proposed
to regulate recombination between telomeric ends (Balk et al.,
2013; Lopez de Silanes et al., 2014; Yu et al., 2014) and serve
as a scaffold for recruitment of chromatin factors such as HP1,
histone methyltransferases, and shelterins to telomeric hetero-
chromatin (Deng et al., 2009). TERRA therefore appears to be
an integral part of telomeric architecture. However, while major
progress has been made toward understanding TERRA biology,
its specific in vivo functions and mechanisms remain ill-
defined—especially regarding whether TERRA plays a direct
role in each of the proposed functions (Azzalin and Lingner,
2015; Rippe and Luke, 2015).
Major obstacles in the quest to uncover TERRA function have
been related to (1) the inability to deplete TERRA RNA by using
knockdown technology and the infeasibility of creating TERRA
deletions at telomeric ends; (2) an incomplete knowledge of
the TERRA protein interactome; and (3) a poor understanding
of where TERRA binds in the genome (Maicher et al., 2012; Az-
zalin and Lingner, 2015; Rippe and Luke, 2015). Similar limita-
tions apply to nearly all lncRNAs, explaining the pervasive
Gene A Gene B
D
C
G H
5 μm
A TERRA DAPITERRA
Higher exposureLower exposure
TERRA
E
F
TERRA Sense ctrlNormalized to input 4054 78Normalized to sense 4076 -Normalized to no-RNase H 3880 -
Number of TERRA binding sites(10-fold enriched)
J
Chromatin isolation
Probe hybridizationCapture on beads
Elute with RNaseHIsolate DNADeep sequencing
chromatin
CHIRT-seq
TERRARNA
Captureprobes
Chemicalcrosslinking
Chromatin fragmentation
TERRAbindingsite
TERRAbinding
siteGenomebrowser
view
CHIRT-seq
I
RNA FISH
TERRA RNA
DNA FISH
PAR DNA
2 μm
B
0
20
40
60
80
100
% T
ER
RA
RN
A -
PA
R D
NA
col
ocal
izat
ion
n=2
04
ES
PARTERRADAPI
Distal intergenic:47.2% Intron: 40.1%Promoter: 5.4%Downtream: 4.7%Coding exon: 0.7%5'UTR: 0.6%3'UTR: 1.4%
Distal intergenic
Intron
TERRA CHIRT-seq
ES cells
TERRA RAP1 Merge2 μm
2 μm TERRA TRF2 Merge
TERRA binding(121)
non-TERRA binding (436)
Genomicregionswith telomericrepeats
TE
RR
A-A
S
TE
RR
A -S
Inpu
t
CHIRT-seq
ES cells
No
RN
aseH
1997
230 133 10
500
1000
1500
2000
2500
Telo
mer
ic r
epea
ten
richm
ent
over
inpu
t
Capture probes
Polr 3k Gm14496
[0-1000]
[0-1000]
[0-1000]
[0-1000]
Chr2 telomeric end
Xcr1 Ccr1
[0-30000]
[0-30000]
[0-30000]
[0-30000]
Gm7120 Ccl28
Chr13 telomeric endChr9 telomeric end
Tmx3
TERRA/Input
Sense/Input
TERRA/no-RNaseH
TERRA/Sense
sequence gap
(TTAGGG)n
[0-1000]
[0-1000]
[0-1000]
[0-1000]
Abcb10
Chr8 internal[0-500]
[0-500]
[0-500]
[0-500]
Apbb2 Uchl1os
Chr5 internal
Hes3Gpr153
Chr4 internal
Pxylp1
Chr9 internal
TERRA/Input
Sense/Input
TERRA/no-RNaseH
TERRA/Sense
(TTAGGG)n
Chr18 telomeric end[0-500]
[0-500]
[0-500]
[0-500]
[0-15000]
[0-15000]
[0-15000]
[0-15000]
[0-1000]
[0-1000]
[0-1000]
[0-1000]
[0-20000]
[0-20000]
[0-20000]
[0-20000]
Mid1
[0-11623]
[0-11623]
[0-11623]
[0-11623]
Asmt
[0-1502]
[0-1502]
[0-1502]
[0-1502]
Erdr1
TERRA/Input
Sense/Input
TERRA/no-RNaseH
TERRA/Sense
(TTAGGG)n
Pseudoautosomal region (Chr X,Y)[0-47909]
[0-47909]
[0-47909]
[0-47909]
(legend on next page)
Cell 170, 86–101, June 29, 2017 87
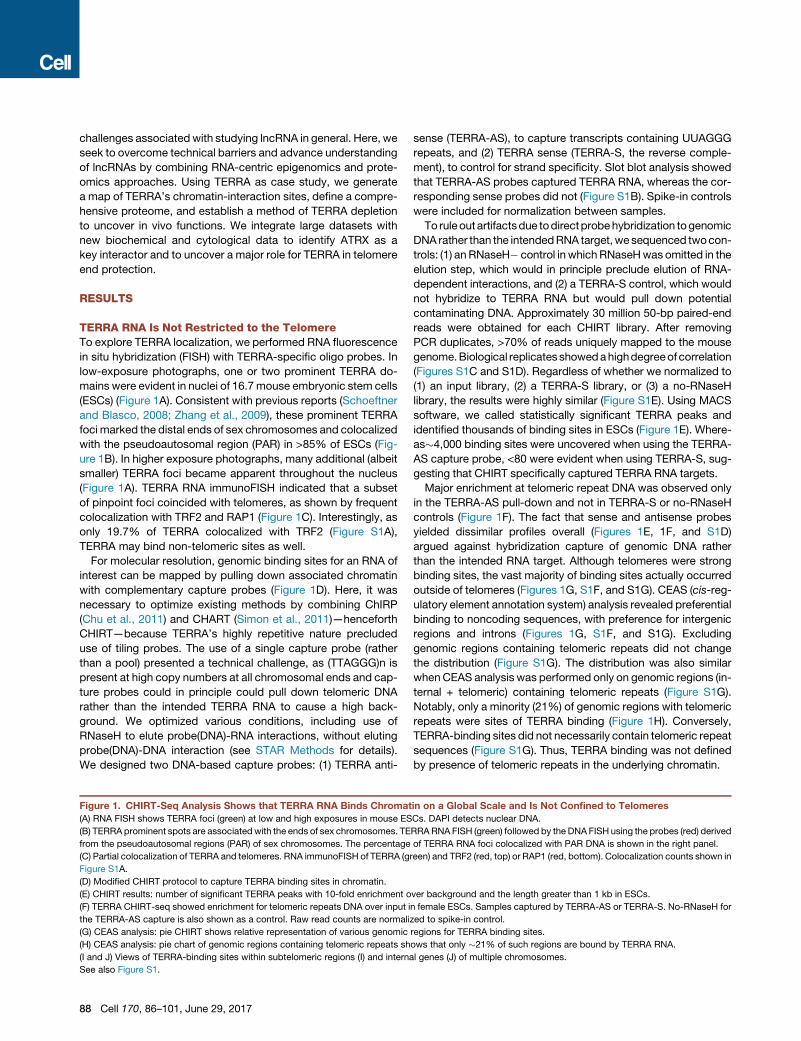
challenges associated with studying lncRNA in general. Here, we
seek to overcome technical barriers and advance understanding
of lncRNAs by combining RNA-centric epigenomics and prote-
omics approaches. Using TERRA as case study, we generate
a map of TERRA’s chromatin-interaction sites, define a compre-
hensive proteome, and establish a method of TERRA depletion
to uncover in vivo functions. We integrate large datasets with
new biochemical and cytological data to identify ATRX as a
key interactor and to uncover a major role for TERRA in telomere
end protection.
RESULTS
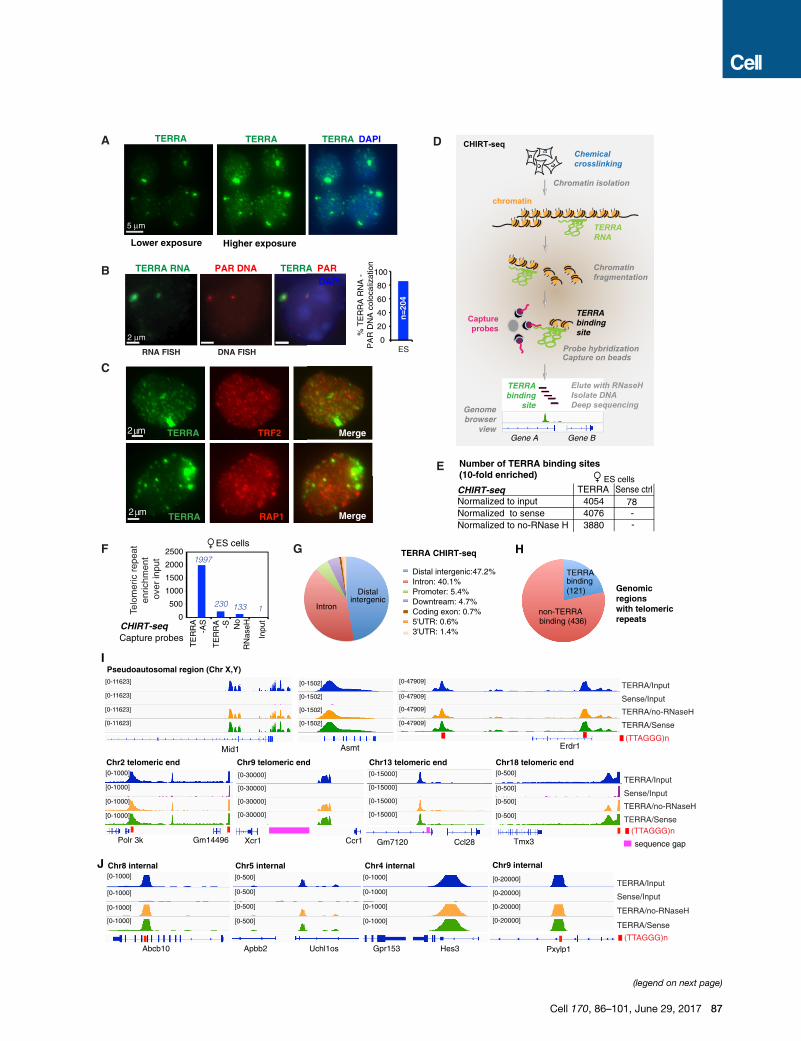
TERRA RNA Is Not Restricted to the TelomereTo explore TERRA localization, we performed RNA fluorescence
in situ hybridization (FISH) with TERRA-specific oligo probes. In
low-exposure photographs, one or two prominent TERRA do-
mains were evident in nuclei of 16.7mouse embryonic stem cells
(ESCs) (Figure 1A). Consistent with previous reports (Schoeftner
and Blasco, 2008; Zhang et al., 2009), these prominent TERRA
foci marked the distal ends of sex chromosomes and colocalized
with the pseudoautosomal region (PAR) in >85% of ESCs (Fig-
ure 1B). In higher exposure photographs, many additional (albeit
smaller) TERRA foci became apparent throughout the nucleus
(Figure 1A). TERRA RNA immunoFISH indicated that a subset
of pinpoint foci coincided with telomeres, as shown by frequent
colocalization with TRF2 and RAP1 (Figure 1C). Interestingly, as
only 19.7% of TERRA colocalized with TRF2 (Figure S1A),
TERRA may bind non-telomeric sites as well.
For molecular resolution, genomic binding sites for an RNA of
interest can be mapped by pulling down associated chromatin
with complementary capture probes (Figure 1D). Here, it was
necessary to optimize existing methods by combining ChIRP
(Chu et al., 2011) and CHART (Simon et al., 2011)—henceforth
CHIRT—because TERRA’s highly repetitive nature precluded
use of tiling probes. The use of a single capture probe (rather
than a pool) presented a technical challenge, as (TTAGGG)n is
present at high copy numbers at all chromosomal ends and cap-
ture probes could in principle could pull down telomeric DNA
rather than the intended TERRA RNA to cause a high back-
ground. We optimized various conditions, including use of
RNaseH to elute probe(DNA)-RNA interactions, without eluting
probe(DNA)-DNA interaction (see STAR Methods for details).
We designed two DNA-based capture probes: (1) TERRA anti-
Figure 1. CHIRT-Seq Analysis Shows that TERRA RNA Binds Chromat
(A) RNA FISH shows TERRA foci (green) at low and high exposures in mouse ES
(B) TERRA prominent spots are associatedwith the ends of sex chromosomes. TE
from the pseudoautosomal regions (PAR) of sex chromosomes. The percentage
(C) Partial colocalization of TERRA and telomeres. RNA immunoFISH of TERRA (gr
Figure S1A.
(D) Modified CHIRT protocol to capture TERRA binding sites in chromatin.
(E) CHIRT results: number of significant TERRA peaks with 10-fold enrichment o
(F) TERRA CHIRT-seq showed enrichment for telomeric repeats DNA over input i
the TERRA-AS capture is also shown as a control. Raw read counts are normali
(G) CEAS analysis: pie CHIRT shows relative representation of various genomic
(H) CEAS analysis: pie chart of genomic regions containing telomeric repeats sh
(I and J) Views of TERRA-binding sites within subtelomeric regions (I) and interna
See also Figure S1.
88 Cell 170, 86–101, June 29, 2017
sense (TERRA-AS), to capture transcripts containing UUAGGG
repeats, and (2) TERRA sense (TERRA-S, the reverse comple-
ment), to control for strand specificity. Slot blot analysis showed
that TERRA-AS probes captured TERRA RNA, whereas the cor-
responding sense probes did not (Figure S1B). Spike-in controls
were included for normalization between samples.
To ruleoutartifactsdue todirectprobehybridization togenomic
DNA rather than the intendedRNA target,we sequenced twocon-
trols: (1) an RNaseH� control in whichRNaseHwas omitted in the
elution step, which would in principle preclude elution of RNA-
dependent interactions, and (2) a TERRA-S control, which would
not hybridize to TERRA RNA but would pull down potential
contaminating DNA. Approximately 30 million 50-bp paired-end
reads were obtained for each CHIRT library. After removing
PCR duplicates, >70% of reads uniquely mapped to the mouse
genome.Biological replicates showedahighdegreeof correlation
(Figures S1C and S1D). Regardless of whether we normalized to
(1) an input library, (2) a TERRA-S library, or (3) a no-RNaseH
library, the results were highly similar (Figure S1E). Using MACS
software, we called statistically significant TERRA peaks and
identified thousands of binding sites in ESCs (Figure 1E). Where-
as�4,000 binding sites were uncovered when using the TERRA-
AS capture probe, <80 were evident when using TERRA-S, sug-
gesting that CHIRT specifically captured TERRA RNA targets.
Major enrichment at telomeric repeat DNA was observed only
in the TERRA-AS pull-down and not in TERRA-S or no-RNaseH
controls (Figure 1F). The fact that sense and antisense probes
yielded dissimilar profiles overall (Figures 1E, 1F, and S1D)
argued against hybridization capture of genomic DNA rather
than the intended RNA target. Although telomeres were strong
binding sites, the vast majority of binding sites actually occurred
outside of telomeres (Figures 1G, S1F, and S1G). CEAS (cis-reg-
ulatory element annotation system) analysis revealed preferential
binding to noncoding sequences, with preference for intergenic
regions and introns (Figures 1G, S1F, and S1G). Excluding
genomic regions containing telomeric repeats did not change
the distribution (Figure S1G). The distribution was also similar
whenCEAS analysis was performed only on genomic regions (in-
ternal + telomeric) containing telomeric repeats (Figure S1G).
Notably, only a minority (21%) of genomic regions with telomeric
repeats were sites of TERRA binding (Figure 1H). Conversely,
TERRA-binding sites did not necessarily contain telomeric repeat
sequences (Figure S1G). Thus, TERRA binding was not defined
by presence of telomeric repeats in the underlying chromatin.
in on a Global Scale and Is Not Confined to Telomeres
Cs. DAPI detects nuclear DNA.
RRARNAFISH (green) followed by the DNA FISH using the probes (red) derived
of TERRA RNA foci colocalized with PAR DNA is shown in the right panel.
een) and TRF2 (red, top) or RAP1 (red, bottom). Colocalization counts shown in
ver background and the length greater than 1 kb in ESCs.
n female ESCs. Samples captured by TERRA-AS or TERRA-S. No-RNaseH for
zed to spike-in control.
regions for TERRA binding sites.
ows that only �21% of such regions are bound by TERRA RNA.
l genes (J) of multiple chromosomes.
B
TE
RR
AD
AP
I
ES cells, 12 hours
TERRA KD Scr KD
5 μm
A C
ED
0.0
0.5
1.0
1.5
Tm
x3
Wls
Mid
1
Erd
r1
Asm
t
Scr KD TERRA KD
Fol
d ch
ange
*
***
***
RT-qPCR
FSubtelomeric target genes
9
3
0.5
mar
ker
ResidualRNA
kb
0.39
1.00
TE
RR
AS
cr
TERRA
[LNA]
Northern blot
TE
RR
AS
cr
4 μM 8 μM
0.25
1.00
953
1.51
0.5
TERRA
GAPDH
0.05
1.00
0.27
1.00
TE
RR
AS
cr
TE
RR
AS
cr
2 μM 2 μM
kb
1 hr 6 hr 12 hr
Csf2ra
[0-200]
[0-0.3]
[0-0.3]
[0-200]
[0-1]
Chr19: 61,220-61,335 kb
Wls
[0-200]
[0-0.5]
[0-0.5]
[0-200]
Chr3: 159,835-159,940 kb
Tmx3
[0-500]
[0-0.7]
[0-0.7]
[0-500]
[0-3]
Chr18: 90,508-90,605 kb
[0-0.5]
[0-0.5]
0-0.7]
0-0.7]
Gm20939Gm19792700099C18RikMettl1
Chr17: 94,720-94,900 kb[0-200]
[0-1]
[0-1]
[0-200]
[0-3]
[0-1]
[0-1]
TERRA
SenseCH
IRT
-seq
Scr KD
TERRA KDRN
A-s
eq
POLII-S5
TERRA
SenseCH
IRT
-seq
Scr KDTERRA
KD
RN
A-s
eq
POLII-S5
TERRA
SenseCH
IRT
-seq
Scr KDTERRA
KDRN
A-s
eq(W
)
POLII-S5
Scr KDTERRA
KD
RN
A-s
eq(C
)
G
02468
101214
3 2.5 2 1.5 1
02468
101214
-3 -2.5 -2 -1.5 -1
Upregulatedgenes
Downregulatedgenes
Log2 fold change[ΔFPKM of TERRA KD/Scr KD]
Cum
ulat
ive
freq
uenc
y (%
) P<0.001
P<0.001
non-targets(n=15,871)
2
4
6
8
0 +3-3
Relative distance (kb)
Rel
ativ
eT
ER
RA
bin
ding
DownregulatedUpregulatedAll
24
6
12
810
0 +3-3
Relative distance (kb)
246
12
810
14
Relative distance (bp)
0 30001000 2000-1000 4000
TERRAtargets(n=914)
TSS TTSTSS TTS
Mean of normalized counts
Log2
fold
cha
nge
1e-01 1e+01 1e+03 1e+05
-2-1
01
2
P<0.05DESeq2
(legend on next page)
Cell 170, 86–101, June 29, 2017 89
Nonetheless, chromosome maps showed greatest TERRA
density at or near telomeric ends (Figure S1H; telomeric reads
could be unambiguously aligned by their chromosome-specific
subtelomeric sequences). TERRA read coverage was high within
subtelomeric regions of nearly all chromosomes (chr), most
prominently chr 2, 9, 13, 18, and the sex chromosomes, with tar-
gets being as much as tens of kilobases away from the telomeric
repeat (Figure 1I). Consistent with TERRA RNA FISH, the stron-
gest TERRA binding sites occurred within the pseudoautosomal
regions (PARs) of sex chromosomes (Figure 1I). TERRA also
bound within internal chromosomal regions and within genes,
where it favored introns (Figure 1J). Thus, although TERRA has
mainly been studied in the context of telomeres (Le et al.,
2013; Rippe and Luke, 2015), TERRA binds chromatin targets
throughout the genome. We conclude that TERRA binds both
in cis at telomeres and in trans within or near genes.
TERRA Depletion Causes Dysregulation of TERRATarget GenesDetermination of TERRA’s in vivo function requires a method of
TERRA depletion. Previous efforts to deplete TERRA RNA (and
many other nuclear lncRNAs) have been unsuccessful. Deletio-
nal approaches have been infeasible due to the essential nature
of telomeric sequences. Knockdown approaches using siRNA
and shRNA approaches have also failed to eliminate TERRA.
Here, we took an alternative approach and developed single-
stranded antisense oligonucleotides (ASOs) with locked nucleic
acids (LNA) chemistry and a gapmer design to promote RNaseH-
mediated degradation of TERRA RNA in vivo. Northern blot anal-
ysis showed that treatment of cells with 2 mM TERRA-specific
ASO resulted in 95% depletion of TERRA transcripts after 1 hr
and �75% depletion after 6 hr (Figure 2A). Longer depletions
were more successful with higher concentrations of ASOs (Fig-
ure 2A). Regardless of conditions, RNA FISH indicated dramatic
effects, as TERRA RNA foci disappeared nearly completely
within 1 hr and the depletion lasted for at least 24 hr (Figures
2B and S2A). Thus, gapmer ASOs are an effective means of
depleting TERRA.
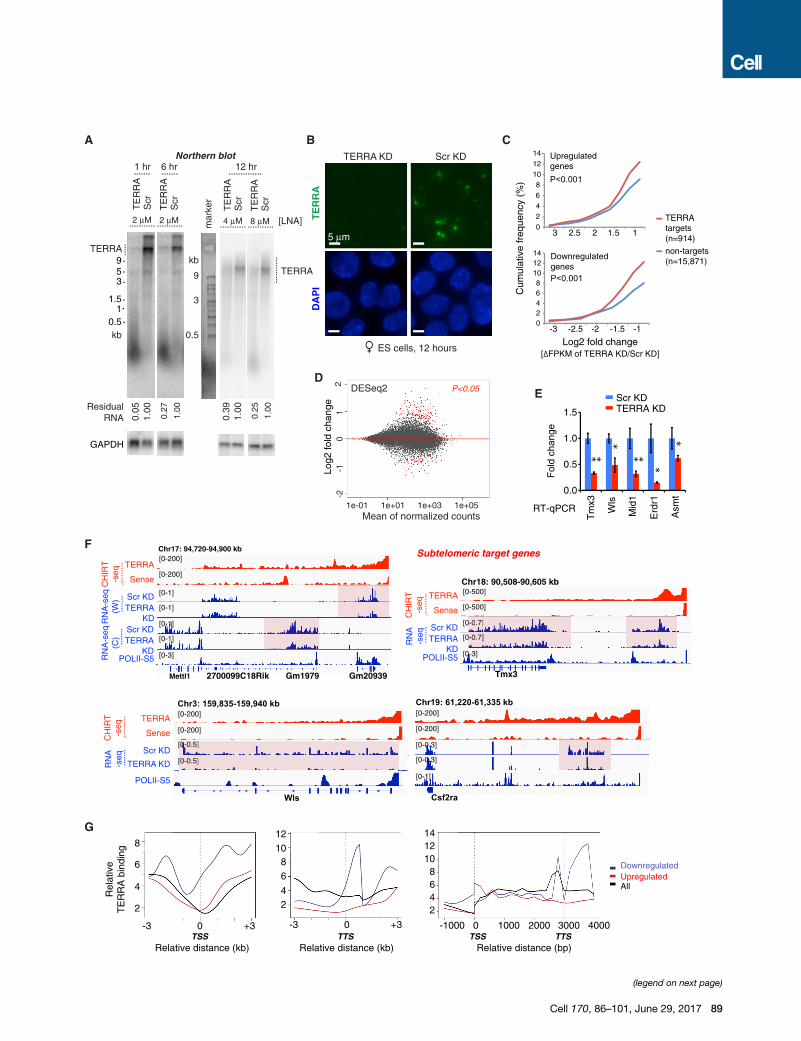
Transcriptomic analysis at the 12 hr time point showed high
reproducibility between two biological replicates (Figure S2B).
Cumulative distribution plots (CDPs) demonstrated significant
changes in expression of TERRA targets relative to non-targets
after TERRA depletion (Figure 2C, p < 0.001), indicating that
Figure 2. TERRA Depletion Results in Dysregulation of Gene Expressio
(A) Northern blot analysis of TERRA RNA shows depletion by treatment with gapm
LNA control. GAPDH RNA is used as loading control, and percentage of remaini
(B) RNA FISH confirming TERRA depletion after 12 hr of LNA treatment. Photos
(C) Cumulative frequency plots for up- and downregulated genes, showing Log2
without TERRA sites. p values determined by 2-tailed Chi-square test with Yate’
(D) MA Bland-Altman plot to visualize RNA-seq data transformed onto the M (log2
KD versus Scr KD. Red dots, genes with significant change (P-adjust < 0.05) usi
(E) RT-qPCR of subtelomeric genes following TERRA KD. p values (** < 0.01; * <
(F) RNA-seq analysis. Examples of downregulated subtelomeric genes following T
the relevant strand is shown, with exception of Chr17 subtelomeric end where
normalized to total mapped fragments.
(G) Average metasite (left, middle) and metagene (right) profiles for TERRA bindin
(blue), upregulated (red), and all (black) genes in TERRA KD.
See also Figures S2 and S3.
90 Cell 170, 86–101, June 29, 2017
TERRA target genes were more likely to be affected by TERRA
depletion. A Bland-Altman M (log ratio) and A (mean average)
plot showed significant changes in gene expression after TERRA
depletion (Figure 2D and Table S1). Interestingly, subtelomeric
target genes were consistently downregulated, as shown by
RT-qPCR (Figure 2E) and RNA-seq (Figure 2F; decreased read
counts across gene bodies). Internal target genes could either
be up- or downregulated (Figures S2C and S2D and Table S1).
The sense LNA control yielded a distinct profile with little to no
overlap (Figures S2E and S2F), arguing against a nonspecific ef-
fect. Gene ontology (GO) analysis indicated that downregulated
genes are highly associated with TOR signaling and transcrip-
tional regulation (Figure S3A), whereas upregulated genes are
associated with heart development and telomere capping (Fig-
ure S3B). There was an intersection of telomerase pathway
genes with genes that were upregulated after TERRA depletion
(Figure S3C). Intriguingly, metasite and metagene profiles
showed greatest TERRA binding densities over genes that
were downregulated upon TERRA depletion (Figure 2G). The
analysis also revealed a propensity of TERRA RNA to bind genes
near the transcription start site (TSS, promoter) and/or the tran-
scription termination site (TTS). This finding was specific to the
class of downregulated genes. Upregulated and unaffected
genes did not exhibit this propensity. Together, these data
demonstrate that TERRA RNA has a direct positive influence
on expression of a subset of target genes.
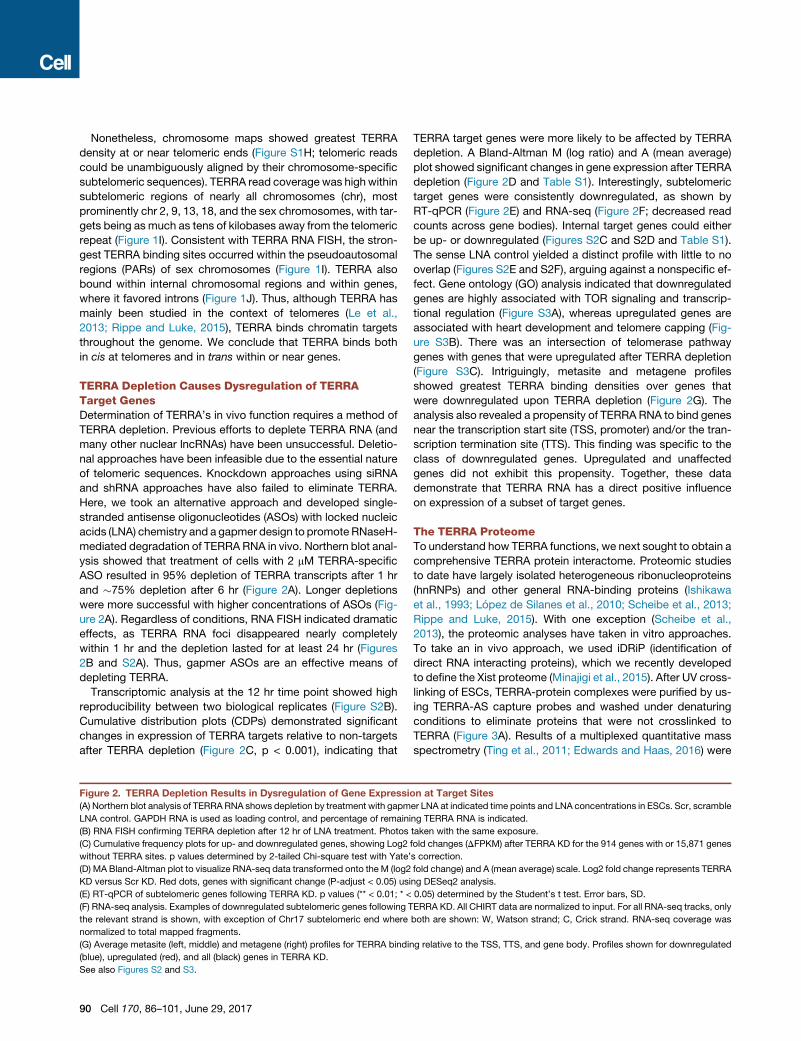
The TERRA ProteomeTo understand how TERRA functions, we next sought to obtain a
comprehensive TERRA protein interactome. Proteomic studies
to date have largely isolated heterogeneous ribonucleoproteins
(hnRNPs) and other general RNA-binding proteins (Ishikawa
et al., 1993; Lopez de Silanes et al., 2010; Scheibe et al., 2013;
Rippe and Luke, 2015). With one exception (Scheibe et al.,
2013), the proteomic analyses have taken in vitro approaches.
To take an in vivo approach, we used iDRiP (identification of
direct RNA interacting proteins), which we recently developed
to define the Xist proteome (Minajigi et al., 2015). After UV cross-
linking of ESCs, TERRA-protein complexes were purified by us-
ing TERRA-AS capture probes and washed under denaturing
conditions to eliminate proteins that were not crosslinked to
TERRA (Figure 3A). Results of a multiplexed quantitative mass
spectrometry (Ting et al., 2011; Edwards and Haas, 2016) were
n at Target Sites
er LNA at indicated time points and LNA concentrations in ESCs. Scr, scramble
ng TERRA RNA is indicated.
taken with the same exposure.
fold changes (DFPKM) after TERRA KD for the 914 genes with or 15,871 genes
s correction.
fold change) and A (mean average) scale. Log2 fold change represents TERRA
ng DESeq2 analysis.
0.05) determined by the Student’s t test. Error bars, SD.
ERRA KD. All CHIRT data are normalized to input. For all RNA-seq tracks, only
both are shown: W, Watson strand; C, Crick strand. RNA-seq coverage was
g relative to the TSS, TTS, and gene body. Profiles shown for downregulated
B
C
Shelterin complex(telomeres)
ALT & othertelomeric functions
Cell cycle
A
Nuclei isolation
Probe hybridizationCapture on beads
Denaturing washDNase treatmentElution
Rel
ativ
eab
unda
nce
m/z
Multiplexed quantitative mass spectrometry
chromatin
iDRiP-MS
Interactingproteins
TERRARNA
Captureprobes
UV crosslinking
DNase treatmentChromatin solubilization
TRF1POT1
POT1BTPP1TIN2
ATRXPMLBLM
SMC5SMC6
FANCAPAXIP1
SMARCAL1RTEL1
COIL
CTC1STN1
CSTcomplex
Cajalbodies
WAPLBorealin
MIS18BP1AKAP8ECF2TIAL1
G2E3AURKBAURKCSGOL2
MPHOSPH8CDCA2MKI67PLK1
PRC1CASC5CENPCINCENPNIPBLKIF20ATPX2KIF2CKIF20B
Chromatin& transcription
WAPLSLTM
CNOT2NSD1
SETD2TARDBPZNF106ZNF326MYEF2
EZH2KAT6BEHMT1
SMCHD1NACC1SCML2
SETDB1WRNIP1PRDM2CHD2CHD8CHD1
MTF2SON
FAM208ADNTTIP2ARL14EPNACC1SAFB2NONO
CELF1DHX9
RBM4BRBMX2SRSF5SRSF7
RBM14RBM45MORC3ELAVL1ELAVL2RPS4LRALYSSB
DHX8UTP11L
NIP7SRP68CSTF2SRP68
CECELELELLC FF1F11FDDHHXXXD 999
RBBBMM44BBBB4RBBBMMXXX222SSRRSRSSSFF5F555SSSRRSRSSFFF777
RRBMRBMM14414RRBM45MMOMORC3C33EELAVL1AAELAVL2AARPSRR 4LLRAAALLLYYLLLLLSSBSSBSSB
DDHDHHXHXXX88UUTUTTPPP1111LL
NNIPP777SSSRRRPP6668CCCSCSSTSTTFF22SSRRRPPPS 68688
Nuclear matrix
HNRNPMHNRNPH2HNRNPCHNRNPDHNRNPI
PTBP2PTBP1
HNRNPA3HNRNPA0HNRNPFHNRNPU
RNA bindingproteins
D GO Term Count % P-value FDRRNA binding 34 27.6 6.0E-19 8.0E-17nucleotide binding 52 42.3 7.4E-16 5.2E-14DNA binding 44 35.8 1.9E-13 8.5E-12chromatin binding 11 8.9 2.2E-7 7.5E-6telomeric DNA binding 5 4.1 9.2E-7 2.5E-5helicase activity 7 5.7 4.0E-4 8.9E-3ATP binding 23 18.7 7.9E-4 1.5E-2DNA helicase activity 4 3.3 8.2E-4 1.4E-2nucleoside binding 24 19.5 9.2E-4 1.4E-2protein-lysine N-methyltransferase 4 3.3 9.2E-4 1.2E-2
CST complexDNA damageALT ShelterinsDNA replication
Other pathways
RPA1RPA2ORC1ORC2ORC5POLA1
RRRRRPPPA1A11AAPPPPRRRRRPPPA222AAPPPPORCORCORC1ORCORCORCO 222OOORCRCRC5555PPOLPOLOLOLPP AAA1A1A11
DNAreplication
TERRARNA
(legend on next page)
Cell 170, 86–101, June 29, 2017 91
then analyzed for enrichment over several negative control
samples—those pulled down by TERRA-sense, luciferase (non-
mammalian), andU1 (abundant RNA) capture probes (Figure S4).
We averaged two biological replicates and uncovered 134 en-
riched proteins (>2-fold enrichment compared to luciferase con-
trol) belonging to several functional groups (Figure 3B and Table
S2): (1) chromatin and transcription factors (e.g., EZH2,
SMCHD1), (2) proteins involved in alternative telomere length-
ening (ALT), (3) the shelterin complex, (4) cell cycle regulators,
(5) DNA replication proteins, and (6) general RNA-binding pro-
teins and nuclear matrix factors. Their absence in the control
TERRA-sense iDRiP and their substantial enrichment relative
to the luciferase and U1 samples suggested a specific pull-
down of TERRA-associated proteins (Figures S4A–S4C). Shel-
terin proteins, POT1 and TRF1, were �32-fold enriched over
background; telomere-function-associated proteins, PAXIP1
and RTEL1, were >16-fold enriched, as were associated CST
complex and Cajal body proteins, CTC1, STN1, and COIL; and
ALT-pathway-related proteins, ATRX, PML, and SMC6, were
>4-fold enriched (Figure S4C). All noted proteins were signifi-
cantly enriched over the TERRA-sense pull-down, suggesting
a direct association with TERRA RNA rather than telomeric
repeat DNA. A subset of the iDRiP-identified factors had previ-
ously been shown to bind the telomere (e.g., shelterins and
ALT proteins), but the relationship to TERRARNAwas not known
(de Lange, 2009; Dejardin and Kingston, 2009; Deng et al., 2009;
Grolimund et al., 2013). Thus, in addition to revealing known
TERRA interactors, TRF1, POT1 (Deng et al., 2009), nuclear ma-
trix factors, and general RNA-binding proteins (Ishikawa et al.,
1993; Lopez de Silanes et al., 2010; Scheibe et al., 2013; Rippe
and Luke, 2015), iDRiP uncovered a wide variety of new TERRA-
binding proteins.
To visualize interconnections in the TERRA proteome, we
analyzed data from iDRiP-MS biological replicates in the context
of protein interaction data deposited in public databases. The re-
sulting connectivity map using the Ingenuity Pathway Analysis
(Figure 3C) fortified the deduced groupings, and telomere
signaling, DNA repair proteins, and cell cycle and DNA replica-
tion factors were identified as interaction hubs among the prote-
omic network for TERRA. Independent analysis using a GO algo-
rithm also revealed enrichment for factors involved in DNA
replication, nucleic acid binding, telomere association, helicase
activity, and methyltransferases (Figure 3D). The deduced con-
nectome suggests a key organizational role in chromatin regula-
tion, telomere function, DNA replication, and the cell cycle.
Co-occupancy of ATRX and TERRA on ChromatinTargetsWe asked whether enriched interactors colocalize with TERRA
RNA in vivo. We correlated our CHIRT data with ESC ChIP
Figure 3. iDRiP-Mass Spectrometry Analysis Reveals an Extensive TE
(A) The iDRiP-MS approach to define the TERRA interactome.
(B) TERRA-interacting proteins subclassified into functional groups.
(C) Connectivity map for the TERRA interactome using IPA software (QIAGEN). So
interaction. Solid ovals, TERRA interactors. Empty ovals, TERRA non-interactors
(D) GO analysis identified enriched pathways by DAVID bioinformatics resources
See also Figure S4.
92 Cell 170, 86–101, June 29, 2017
data (Kagey et al., 2010; Law et al., 2010; Pinter et al., 2012;
Sarma et al., 2014; Kung et al., 2015; Minajigi et al., 2015) by
comparing coverage densities of various chromatin factors to
the TERRA landscape (TERRA binding peak x = 0) (Figure 4A).
Intriguingly, ATRX density was highly correlated with TERRA
binding, showing a stronger colocalization than any other chro-
matin mark. Because ATRX is known to aid deposition of
H3K9me3 at telomeres (Clynes et al., 2015), we examined the
H3K9me3 histone mark and found significant enrichment at
telomeric heterochromatin. Furthermore, TERRA binding was
strongly correlated with H3K27me3, the modification placed by
EZH2, the catalytic subunit of Polycomb repressive complex 2
(PRC2), which is known to associate with ATRX (Sarma et al.,
2014). On the other hand, TERRA was depleted of activate his-
tone marks, including H3K4me3 and H3K36me3, as well as
RNA polymerase II, POL-II-S5. TERRA peaks were also depleted
of CTCF and cohesins (SMC1 subunit), two factors associated
with telomeric transcription (Deng et al., 2012). However, CTCF
and cohesins were often found nearby (Figures 4A and S5A).
Proteomic data also showed that the cohesin release factor,
WAPL, binds TERRA (Figure 3B). The correlative plots held
true when telomere-associated TERRA peaks were excluded
from analysis (Figure S5A). The only exception was the loss of
the H3K9me3 peak, consistent with H3K9me3 being enriched
in telomeric constitutive heterochromatin (rather than at genes).
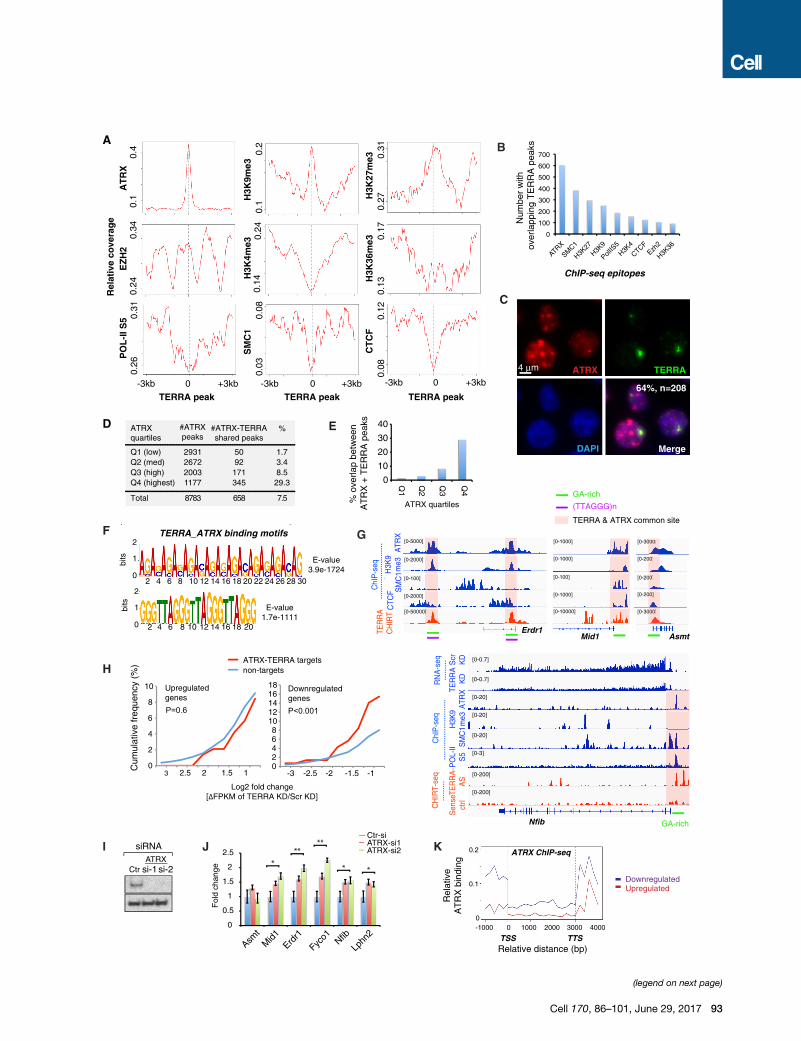
Because ATRX stood out (Figures 4A, 4B, and S5A), we
focused analysis on TERRA-ATRX interactions. Immuno-RNA
FISH showed that prominent TERRA foci colocalized with a sub-
set of ATRX foci (64%, n = 208; Figure 4C). To ask whether
TERRA shared a DNA-binding motif with ATRX, we divided
ATRX-binding sites into quartiles by coverage densities (low,
medium, high, and highest). Intriguingly, �30% of ATRX sites
in the highest quartile (Q4) showed co-occupancy with TERRA
RNA (Figures 4D and 4E). The majority of overlapping sites
occurred within repetitive sequences. De novo motif analysis
using MEME uncovered several common, highly enriched DNA
motifs (Figure 4F). The strongest motifs were the (GA)n repeat
(E value = 3.9e�1,724) and the telomeric repeat including
(TTAGGG)n and (CCCTAA)n (E value = 1.7e�1,111), examples
of which are shown in the colocalized ATRX and TERRA peaks
within Erdr1,Mid1, andAsmt (Figure 4G). Thus, TERRA occupies
chromatin sites with highest ATRX density and shares binding
motifs with its protein partner, ATRX.
Functional Antagonism between TERRA and ATRXGiven that ATRX is a chromatin remodeler that regulates gene
expression (Clynes et al., 2015), we asked whether TERRAmod-
ulates gene expression through interaction with ATRX. For the
subset of genes targeted by both TERRA and ATRX, there was
a significant net downregulation of gene expression after TERRA
RRA Proteome
lid lines, strong direct interactions. Dashed lines, no current evidence for direct
.
. p values determined by Fisher Exact test. Benjamini FDR shown.
H3K
9me3
0.1
0.2
H3K
27m
e30.
270.
31
0.14
0.24
H3K
4me3
0.13
0.17
H3K
36m
e3
0.26
0.31
PO
L-l
I S5
+3kb-3kb 0
0.24
0.34
EZ
H2
+3kb-3kb 0
0.08
SM
C1
+3kb-3kb 00.
080.
12C
TC
F
0.1
0.4
AT
RX
TERRA peak
A
TERRA peak TERRA peak
Rel
ativ
e co
vera
ge
0.03
B
4 μm ATRX TERRA
DAPI Merge
C
64%, n=208
TERRA_ATRX binding motifs
0
1
2
bits
0
1
2
bits
2 4 6 8 10 12 14 16 18 20 22 24 26 28 30
2 4 6 8 10 12 14 16 18 20
E-value1.7e-1111
E-value3.9e-1724
E%
Q1 (low) 2931 50 1.7Q2 (med) 2672 92 3.4Q3 (high) 2003 171 8.5Q4 (highest) 1177 345 29.3
#ATRXpeaks
#ATRX-TERRAshared peaks
Total 8783 658 7.5
ATRXquartiles
D
Mid1
ATR
X
[0-5000]
SM
C1H
3K9
me3
CTC
F
[0-100]
[0-2000]
[0-2000]
[0-50000]
TER
RA
CH
IRT
ChI
P-s
eq
Asmt
[0-3000]
[0-3000]
[0-200]
[0-200]
[0-200]
[0-1000]
[0-1000]
[0-100]
[0-1000]
[0-10000]
00]
00]
0]
0]
0]
00
00
00
00
00
]
G
H
siRNA
Ctr si-1si-2ATRX
0
0.5
1
1.5
2
2.5
Asmt
Erdr1
Mid1
Fyco1 Nfib
Lphn
2
Fol
d ch
ange
Ctr-siATRX-si1ATRX-si2
****
* * *
J
F
0
10
20
30
40
% o
verla
p be
twee
nA
TR
X +
TE
RR
A p
eaks
Q1
Q2
Q3
Q4
ATRX quartiles
Log2 fold change[ΔFPKM of TERRA KD/Scr KD]
I
TERRA & ATRX common site
(TTAGGG)n
GA-rich
Erdr1
ChI
P-s
eqC
HIR
T-se
q
ATR
XS
MC
1H3K
9m
e3P
OL-
IIS
5
RN
A-s
eq Scr KD
TER
RA
K
D
[0-20]
[0-20]
[0-20]
[0-3]
[0-200]
[0-0.7]
[0-0.7]
[0-200]
Nfib
TER
RA
-A
SS
ense
ctrl
GA-rich
Num
ber
with
over
lapp
ing
TE
RR
A p
eaks
ChIP-seq epitopes
over
lapp
ing
TE
RR
A p
eak
0
100
200
300
400
500
600
700
ATRX
SMC1
H3K27
H3K9
PolIIS
5H3K
4
CTCFEzh
2
H3K36
02468
1012141618
-3 -2.5 -2 -1.5 -10
2
4
6
8
10
3 2.5 2 1.5 1
ATRX-TERRA targetsnon-targets
P<0.001P=0.6
Cum
ulat
ive
freq
uenc
y (%
)
Upregulatedgenes
Downregulatedgenes
0 30001000 2000-1000 40000
0.2
0.1
Rel
ativ
eA
TR
X b
indi
ng
DownregulatedUpregulated
Relative distance (bp)TSS TTS
ATRX ChIP-seqK
(legend on next page)
Cell 170, 86–101, June 29, 2017 93
depletion (Figures 4H, S5B, and S5C). At Nfib, for example,
TERRA RNA and ATRX bound the promoter within a GA-rich
motif, and TERRA depletion resulted in reduced expression
(Figure 4G), indicating that TERRA binding has a positive influ-
ence on Nfib expression. Likewise, TERRA depletion resulted
in downregulation of the ATRX-TERRA target genes, Erdr1,
Mid1, Asmt, Fyco1, and Lphn2, all of which harbor ATRX-TERRA
motifs (Figures 4G, 2E, and S5B). These data support a general
expression-promoting role for TERRA RNA at TERRA-ATRX
target genes. On the other hand, knocking down ATRX protein
using two different siRNAs (Figure 4I) resulted in the opposite ef-
fect—a significant upregulation of Mid1, Erdr1, Fyco1, Lphn2,
and Nfib (Figure 4J). Thus, TERRA and ATRX have opposite ef-
fects at shared target genes, with TERRA promoting gene
expression and ATRX suppressing it. Supporting this, metagene
analysis showed that downregulated genes have significantly
higher ATRX binding near the TSS (Figure 4K). This trend was
not observed for other epitopes, including H3K4me3 and
CTCF (Figure S6). We conclude that, at shared genomic targets,
TERRA and ATRX are functionally antagonistic.
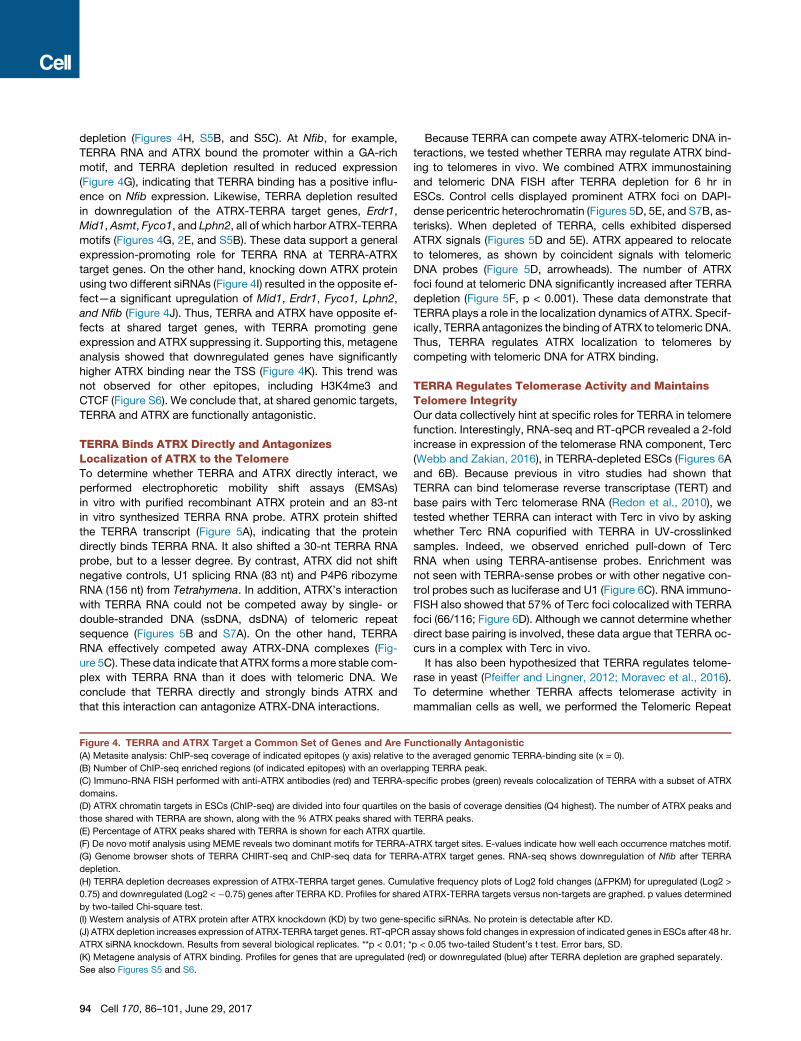
TERRA Binds ATRX Directly and AntagonizesLocalization of ATRX to the TelomereTo determine whether TERRA and ATRX directly interact, we
performed electrophoretic mobility shift assays (EMSAs)
in vitro with purified recombinant ATRX protein and an 83-nt
in vitro synthesized TERRA RNA probe. ATRX protein shifted
the TERRA transcript (Figure 5A), indicating that the protein
directly binds TERRA RNA. It also shifted a 30-nt TERRA RNA
probe, but to a lesser degree. By contrast, ATRX did not shift
negative controls, U1 splicing RNA (83 nt) and P4P6 ribozyme
RNA (156 nt) from Tetrahymena. In addition, ATRX’s interaction
with TERRA RNA could not be competed away by single- or
double-stranded DNA (ssDNA, dsDNA) of telomeric repeat
sequence (Figures 5B and S7A). On the other hand, TERRA
RNA effectively competed away ATRX-DNA complexes (Fig-
ure 5C). These data indicate that ATRX forms amore stable com-
plex with TERRA RNA than it does with telomeric DNA. We
conclude that TERRA directly and strongly binds ATRX and
that this interaction can antagonize ATRX-DNA interactions.
Figure 4. TERRA and ATRX Target a Common Set of Genes and Are F
(A) Metasite analysis: ChIP-seq coverage of indicated epitopes (y axis) relative to
(B) Number of ChIP-seq enriched regions (of indicated epitopes) with an overlap
(C) Immuno-RNA FISH performed with anti-ATRX antibodies (red) and TERRA-s
domains.
(D) ATRX chromatin targets in ESCs (ChIP-seq) are divided into four quartiles on
those shared with TERRA are shown, along with the % ATRX peaks shared with
(E) Percentage of ATRX peaks shared with TERRA is shown for each ATRX quar
(F) De novo motif analysis using MEME reveals two dominant motifs for TERRA-A
(G) Genome browser shots of TERRA CHIRT-seq and ChIP-seq data for TERR
depletion.
(H) TERRA depletion decreases expression of ATRX-TERRA target genes. Cumu
0.75) and downregulated (Log2 < �0.75) genes after TERRA KD. Profiles for shar
by two-tailed Chi-square test.
(I) Western analysis of ATRX protein after ATRX knockdown (KD) by two gene-sp
(J) ATRX depletion increases expression of ATRX-TERRA target genes. RT-qPCR
ATRX siRNA knockdown. Results from several biological replicates. **p < 0.01; *
(K) Metagene analysis of ATRX binding. Profiles for genes that are upregulated (
See also Figures S5 and S6.
94 Cell 170, 86–101, June 29, 2017
Because TERRA can compete away ATRX-telomeric DNA in-
teractions, we tested whether TERRA may regulate ATRX bind-
ing to telomeres in vivo. We combined ATRX immunostaining
and telomeric DNA FISH after TERRA depletion for 6 hr in
ESCs. Control cells displayed prominent ATRX foci on DAPI-
dense pericentric heterochromatin (Figures 5D, 5E, and S7B, as-
terisks). When depleted of TERRA, cells exhibited dispersed
ATRX signals (Figures 5D and 5E). ATRX appeared to relocate
to telomeres, as shown by coincident signals with telomeric
DNA probes (Figure 5D, arrowheads). The number of ATRX
foci found at telomeric DNA significantly increased after TERRA
depletion (Figure 5F, p < 0.001). These data demonstrate that
TERRA plays a role in the localization dynamics of ATRX. Specif-
ically, TERRA antagonizes the binding of ATRX to telomeric DNA.
Thus, TERRA regulates ATRX localization to telomeres by
competing with telomeric DNA for ATRX binding.
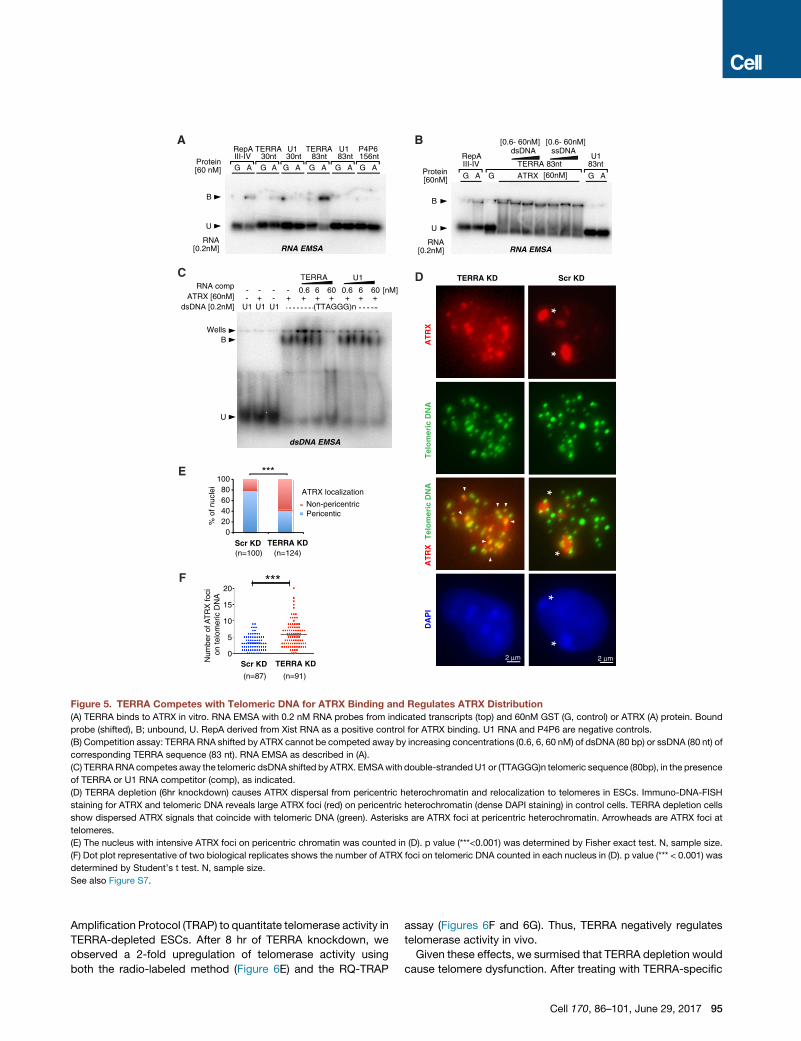
TERRA Regulates Telomerase Activity and MaintainsTelomere IntegrityOur data collectively hint at specific roles for TERRA in telomere
function. Interestingly, RNA-seq and RT-qPCR revealed a 2-fold
increase in expression of the telomerase RNA component, Terc
(Webb and Zakian, 2016), in TERRA-depleted ESCs (Figures 6A
and 6B). Because previous in vitro studies had shown that
TERRA can bind telomerase reverse transcriptase (TERT) and
base pairs with Terc telomerase RNA (Redon et al., 2010), we
tested whether TERRA can interact with Terc in vivo by asking
whether Terc RNA copurified with TERRA in UV-crosslinked
samples. Indeed, we observed enriched pull-down of Terc
RNA when using TERRA-antisense probes. Enrichment was
not seen with TERRA-sense probes or with other negative con-
trol probes such as luciferase and U1 (Figure 6C). RNA immuno-
FISH also showed that 57% of Terc foci colocalized with TERRA
foci (66/116; Figure 6D). Although we cannot determine whether
direct base pairing is involved, these data argue that TERRA oc-
curs in a complex with Terc in vivo.
It has also been hypothesized that TERRA regulates telome-
rase in yeast (Pfeiffer and Lingner, 2012; Moravec et al., 2016).
To determine whether TERRA affects telomerase activity in
mammalian cells as well, we performed the Telomeric Repeat
unctionally Antagonistic
the averaged genomic TERRA-binding site (x = 0).
ping TERRA peak.
pecific probes (green) reveals colocalization of TERRA with a subset of ATRX
the basis of coverage densities (Q4 highest). The number of ATRX peaks and
TERRA peaks.
tile.
TRX target sites. E-values indicate how well each occurrence matches motif.
A-ATRX target genes. RNA-seq shows downregulation of Nfib after TERRA
lative frequency plots of Log2 fold changes (DFPKM) for upregulated (Log2 >
ed ATRX-TERRA targets versus non-targets are graphed. p values determined
ecific siRNAs. No protein is detectable after KD.
assay shows fold changes in expression of indicated genes in ESCs after 48 hr.
p < 0.05 two-tailed Student’s t test. Error bars, SD.
red) or downregulated (blue) after TERRA depletion are graphed separately.
C
G A G A G A G A G A G A
RepAIII-IV
TERRA30nt
U130nt
TERRA83nt
U183nt
P4P6156nt
RNA[0.2nM]
A
Protein[60 nM]
RNA EMSA
B
RNA EMSA
G A
RepAIII-IV
G A
U183ntTERRA 83nt
G ATRX
dsDNA ssDNA
[60nM]
[0.6- 60nM]
Protein[60nM]
[0.6- 60nM]
RNA[0.2nM]
U1 ATRX [60nM] - + - + + + + + + +
U1TERRA
[nM]RNA comp -- 0.6 6 60 0.6 6 60--
Wells
dsDNA EMSA
dsDNA [0.2nM]
B
U
D
U1 (TTAGGG)n U1
B
U
B
U
TERRA KDScr KD0
5
10
15
20***
Num
ber
of A
TR
X fo
ci
on te
lom
eric
DN
A
(n=87) (n=91)
E
020406080
100***
% o
f nuc
lei
F
Non-pericentric Pericentic
ATRX localization
TERRA KDScr KD(n=100) (n=124)
Tel
om
eric
DN
AA
TR
XA
TR
XT
elo
mer
ic D
NA
DA
PI
Scr KDTERRA KD
**
**
**
2 μm2 μm
Figure 5. TERRA Competes with Telomeric DNA for ATRX Binding and Regulates ATRX Distribution
(A) TERRA binds to ATRX in vitro. RNA EMSA with 0.2 nM RNA probes from indicated transcripts (top) and 60nM GST (G, control) or ATRX (A) protein. Bound
probe (shifted), B; unbound, U. RepA derived from Xist RNA as a positive control for ATRX binding. U1 RNA and P4P6 are negative controls.
(B) Competition assay: TERRA RNA shifted by ATRX cannot be competed away by increasing concentrations (0.6, 6, 60 nM) of dsDNA (80 bp) or ssDNA (80 nt) of
corresponding TERRA sequence (83 nt). RNA EMSA as described in (A).
(C) TERRARNA competes away the telomeric dsDNA shifted by ATRX. EMSAwith double-strandedU1 or (TTAGGG)n telomeric sequence (80bp), in the presence
of TERRA or U1 RNA competitor (comp), as indicated.
(D) TERRA depletion (6hr knockdown) causes ATRX dispersal from pericentric heterochromatin and relocalization to telomeres in ESCs. Immuno-DNA-FISH
staining for ATRX and telomeric DNA reveals large ATRX foci (red) on pericentric heterochromatin (dense DAPI staining) in control cells. TERRA depletion cells
show dispersed ATRX signals that coincide with telomeric DNA (green). Asterisks are ATRX foci at pericentric heterochromatin. Arrowheads are ATRX foci at
telomeres.
(E) The nucleus with intensive ATRX foci on pericentric chromatin was counted in (D). p value (***<0.001) was determined by Fisher exact test. N, sample size.
(F) Dot plot representative of two biological replicates shows the number of ATRX foci on telomeric DNA counted in each nucleus in (D). p value (*** < 0.001) was
determined by Student’s t test. N, sample size.
See also Figure S7.
Amplification Protocol (TRAP) to quantitate telomerase activity in
TERRA-depleted ESCs. After 8 hr of TERRA knockdown, we
observed a 2-fold upregulation of telomerase activity using
both the radio-labeled method (Figure 6E) and the RQ-TRAP
assay (Figures 6F and 6G). Thus, TERRA negatively regulates
telomerase activity in vivo.
Given these effects, we surmised that TERRA depletion would
cause telomere dysfunction. After treating with TERRA-specific
Cell 170, 86–101, June 29, 2017 95
RN
A-s
eq Scr KD
TER
RA
K
D
RN
A-s
eq Scr KD
TER
RA
K
D
[0-20]
[0-20]
[0-12]
[0-12]
Terc
Rep
licat
e 1
Rep
licat
e 2
0.0
0.5
1.0
1.5
2.0
Scr KD TER KD
Terc
leve
ls(F
old
chan
ge)
Terc
pul
ldow
nas
% o
f inp
ut
Captureprobes
0.0
0.2
0.4
0.6
0.8
1.0
1.2
1.4
TERRA
Sense Lu
c U1
TERRA-Terccopurification
A B C
0
1
2
ScrKD
Telo
mer
ase
activ
ity
E F
0
0.3
0.6
0.9
1.2
29 30 31 32 33 34 35
G
Ct values
[Cel
l ext
reac
t] lo
g10
TERRAKD
TERRAKD
Scr KD
RQ-TRAP assay RQ-TRAP assayTERRA KD Scr KDNC[Cell extract]
TRAP assay
Relative activity 2 1
TERRA
DAPI
TercTercTERRA
5 μmTRF2TRF2Terc
D
57%, n=116
Scr
KD
Telomeric DNA DAPIγ H2AX
TE
RR
A K
D
2 μm
MergeI
H
0
10
20
30
40
≥3 ≥5 ≥8
% N
ucle
i with
indi
cate
dT
IF p
atte
rn
n=101
n=113Scr KD
TERRA KD
Sense KDn=127no transfectionn=125
******
***
Number of TIF fociper nucleus
(legend on next page)
96 Cell 170, 86–101, June 29, 2017
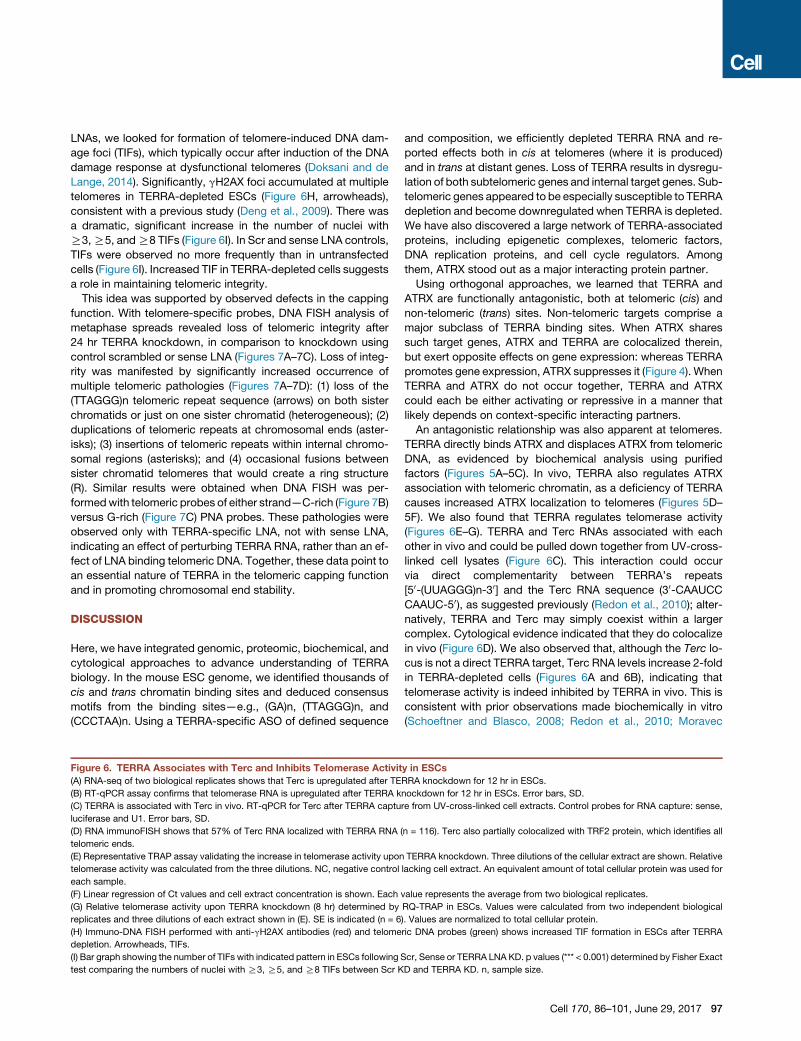
LNAs, we looked for formation of telomere-induced DNA dam-
age foci (TIFs), which typically occur after induction of the DNA
damage response at dysfunctional telomeres (Doksani and de
Lange, 2014). Significantly, gH2AX foci accumulated at multiple
telomeres in TERRA-depleted ESCs (Figure 6H, arrowheads),
consistent with a previous study (Deng et al., 2009). There was
a dramatic, significant increase in the number of nuclei with
R3,R5, andR8 TIFs (Figure 6I). In Scr and sense LNA controls,
TIFs were observed no more frequently than in untransfected
cells (Figure 6I). Increased TIF in TERRA-depleted cells suggests
a role in maintaining telomeric integrity.
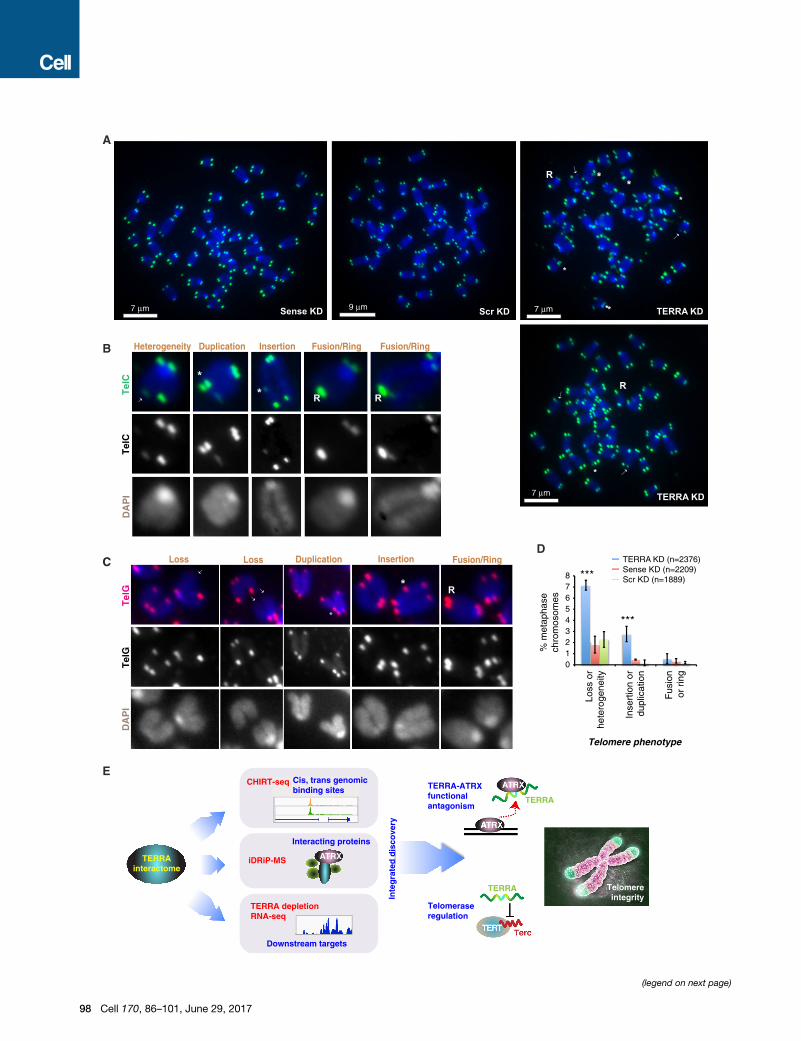
This idea was supported by observed defects in the capping
function. With telomere-specific probes, DNA FISH analysis of
metaphase spreads revealed loss of telomeric integrity after
24 hr TERRA knockdown, in comparison to knockdown using
control scrambled or sense LNA (Figures 7A–7C). Loss of integ-
rity was manifested by significantly increased occurrence of
multiple telomeric pathologies (Figures 7A–7D): (1) loss of the
(TTAGGG)n telomeric repeat sequence (arrows) on both sister
chromatids or just on one sister chromatid (heterogeneous); (2)
duplications of telomeric repeats at chromosomal ends (aster-
isks); (3) insertions of telomeric repeats within internal chromo-
somal regions (asterisks); and (4) occasional fusions between
sister chromatid telomeres that would create a ring structure
(R). Similar results were obtained when DNA FISH was per-
formedwith telomeric probes of either strand—C-rich (Figure 7B)
versus G-rich (Figure 7C) PNA probes. These pathologies were
observed only with TERRA-specific LNA, not with sense LNA,
indicating an effect of perturbing TERRA RNA, rather than an ef-
fect of LNA binding telomeric DNA. Together, these data point to
an essential nature of TERRA in the telomeric capping function
and in promoting chromosomal end stability.
DISCUSSION
Here, we have integrated genomic, proteomic, biochemical, and
cytological approaches to advance understanding of TERRA
biology. In the mouse ESC genome, we identified thousands of
cis and trans chromatin binding sites and deduced consensus
motifs from the binding sites—e.g., (GA)n, (TTAGGG)n, and
(CCCTAA)n. Using a TERRA-specific ASO of defined sequence
Figure 6. TERRA Associates with Terc and Inhibits Telomerase Activit
(A) RNA-seq of two biological replicates shows that Terc is upregulated after TE
(B) RT-qPCR assay confirms that telomerase RNA is upregulated after TERRA k
(C) TERRA is associated with Terc in vivo. RT-qPCR for Terc after TERRA captu
luciferase and U1. Error bars, SD.
(D) RNA immunoFISH shows that 57% of Terc RNA localized with TERRA RNA
telomeric ends.
(E) Representative TRAP assay validating the increase in telomerase activity upon
telomerase activity was calculated from the three dilutions. NC, negative control
each sample.
(F) Linear regression of Ct values and cell extract concentration is shown. Each
(G) Relative telomerase activity upon TERRA knockdown (8 hr) determined by
replicates and three dilutions of each extract shown in (E). SE is indicated (n = 6
(H) Immuno-DNA FISH performed with anti-gH2AX antibodies (red) and telome
depletion. Arrowheads, TIFs.
(I) Bar graph showing the number of TIFs with indicated pattern in ESCs following
test comparing the numbers of nuclei with R3, R5, and R8 TIFs between Scr K
and composition, we efficiently depleted TERRA RNA and re-
ported effects both in cis at telomeres (where it is produced)
and in trans at distant genes. Loss of TERRA results in dysregu-
lation of both subtelomeric genes and internal target genes. Sub-
telomeric genes appeared to be especially susceptible to TERRA
depletion and become downregulated when TERRA is depleted.
We have also discovered a large network of TERRA-associated
proteins, including epigenetic complexes, telomeric factors,
DNA replication proteins, and cell cycle regulators. Among
them, ATRX stood out as a major interacting protein partner.
Using orthogonal approaches, we learned that TERRA and
ATRX are functionally antagonistic, both at telomeric (cis) and
non-telomeric (trans) sites. Non-telomeric targets comprise a
major subclass of TERRA binding sites. When ATRX shares
such target genes, ATRX and TERRA are colocalized therein,
but exert opposite effects on gene expression: whereas TERRA
promotes gene expression, ATRX suppresses it (Figure 4). When
TERRA and ATRX do not occur together, TERRA and ATRX
could each be either activating or repressive in a manner that
likely depends on context-specific interacting partners.
An antagonistic relationship was also apparent at telomeres.
TERRA directly binds ATRX and displaces ATRX from telomeric
DNA, as evidenced by biochemical analysis using purified
factors (Figures 5A–5C). In vivo, TERRA also regulates ATRX
association with telomeric chromatin, as a deficiency of TERRA
causes increased ATRX localization to telomeres (Figures 5D–
5F). We also found that TERRA regulates telomerase activity
(Figures 6E–G). TERRA and Terc RNAs associated with each
other in vivo and could be pulled down together from UV-cross-
linked cell lysates (Figure 6C). This interaction could occur
via direct complementarity between TERRA’s repeats
[50-(UUAGGG)n-30] and the Terc RNA sequence (30-CAAUCCCAAUC-50), as suggested previously (Redon et al., 2010); alter-
natively, TERRA and Terc may simply coexist within a larger
complex. Cytological evidence indicated that they do colocalize
in vivo (Figure 6D). We also observed that, although the Terc lo-
cus is not a direct TERRA target, Terc RNA levels increase 2-fold
in TERRA-depleted cells (Figures 6A and 6B), indicating that
telomerase activity is indeed inhibited by TERRA in vivo. This is
consistent with prior observations made biochemically in vitro
(Schoeftner and Blasco, 2008; Redon et al., 2010; Moravec
y in ESCs
RRA knockdown for 12 hr in ESCs.
nockdown for 12 hr in ESCs. Error bars, SD.
re from UV-cross-linked cell extracts. Control probes for RNA capture: sense,
(n = 116). Terc also partially colocalized with TRF2 protein, which identifies all
TERRA knockdown. Three dilutions of the cellular extract are shown. Relative
lacking cell extract. An equivalent amount of total cellular protein was used for
value represents the average from two biological replicates.
RQ-TRAP in ESCs. Values were calculated from two independent biological
). Values are normalized to total cellular protein.
ric DNA probes (green) shows increased TIF formation in ESCs after TERRA
Scr, Sense or TERRA LNA KD. p values (*** < 0.001) determined by Fisher Exact
D and TERRA KD. n, sample size.
Cell 170, 86–101, June 29, 2017 97
TERRA
TERRAinteractome
iDRiP-MS
CHIRT-seq
A
Telomeraseregulation
Cis, trans genomicbinding sites
Interacting proteins
TERRA depletionRNA-seq
Downstream targets
ATRX
TERRA-ATRXfunctionalantagonism
B
A
E
D
Heterogeneity Duplication Insertion Fusion/Ring Fusion/Ring
RR**
Loss Duplication Insertion Loss
*
* R
Fusion/Ring
Tel
G
Tel
C
DA
PI
DA
PI
Tel
GT
elC
012345678
TERRA KD (n=2376)Sense KD (n=2209)Scr KD (n=1889)
% m
etap
hase
chro
mos
omes
***
***
TERRA KD
TERRA KD
Sense KD Scr KD
*
*
*
**
*
R
R
C
Loss
or
hete
roge
neity
Fus
ion
or r
ing
Inse
rtio
n or
dupl
icat
ion
Telomereintegrity
Telomere phenotype
yrevocsi
ddetar
getnI
*7 μm7 μm 9 μm
7 μm
TERRA
TERRA
(legend on next page)
98 Cell 170, 86–101, June 29, 2017
et al., 2016). ESCs naturally express high levels of TERRA,
consistent with their long telomeres and a need to regulate telo-
mere length. TERRA is known to be regulated in a cell-cycle-
dependent manner (Porro et al., 2010), with low levels in late
S phase when telomere replication and telomerase recruitment
occur (Wellinger et al., 1993; Schmidt et al., 2016). On the other
hand, evidence has also shown that TERRA is involved in telo-
merase recruitment to telomeres and promotes telomere length-
ening in yeast (Moravec et al., 2016). Though seemingly contra-
dictory, TERRA-mediated telomerase inhibition and recruitment
are not mutually exclusive. TERRA is bound by additional pro-
teins in vivo, and its activity could depend on the exact compo-
sition of interactors. A fine balance between Terc and TERRA
RNA levels could be vital to telomerase regulation, with an imbal-
ance resulting in telomere instability.
Indeed, TERRA appears to be essential for telomere end
protection. Increased telomere dysfunction was observed by
TIF assays in ESCs depleted of TERRA (Figures 6H and 6I)
(Deng et al., 2009; Lopez de Silanes et al., 2014). Furthermore,
various telomeric pathologies were also manifested on meta-
phase chromosomes after TERRA depletion, including loss of
(TTAGGG)n sequences from chromosomal ends, insertions
and duplications of (TTAGGG)n within internal chromosomal
regions, and telomeric fusions that form ring-like chromosomal
structures (Figure 7). A caveat of note is that telomeres typi-
cally have an �200-base 30 single-strand overhang, on the
same G-rich strand as TERRA. Our gapmer ASO could there-
fore target either TERRA or the DNA overhang and exert the
observed effects via either or both, in principle. It is currently
not possible to distinguish between these possibilities. How-
ever, our sense ASO (LNA) control targeted the C-rich strand
of telomeric DNA, not TERRA RNA. The C-rich strand may
partially exist in single-stranded form due to engagement in a
D-loop and T-loop with the G-rich strand. Given that the sense
LNA did not cause increased TIF formation (Figures 6H and 6I)
or metaphase chromosome pathology (Figure 7), we favor the
idea that the observed effects are at least partially due to
depleting TERRA RNA.
In support of TERRA’s end-protection function is the proposed
antagonistic relationship between TERRA and ATRX (Figures
3–5). ATRX has been known to play a key role in telomere biology
(Lovejoy et al., 2012; Doksani and de Lange, 2014). We now
know that TERRA and ATRX directly interact (Figure 5). In the
context of telomere protection, the antagonistic ATRX-TERRA
relationship is especially notable. ATRX suppresses the ALT
Figure 7. TERRA Maintains Telomere Integrity in ESCs
(A) DNA FISH analysis using telomeric repeat probes of ESCmetaphase spreads. T
each panel. ESCs were harvested after 24 hr knockdown with TERRA LNA vers
erogeneous) or both sister chromatids. Asterisks, insertion or duplication. R, ring
(B) Magnified examples of each aberrant telomere phenotype. DNA FISH performe
the TelC and DAPI signals are merged in the color image.
(C) Magnified examples of each aberrant telomere phenotype. DNA FISH performe
the TelG and DAPI signals are merged in the color image.
(D) Quantitation of each telomeric pathology. Two biological replicates of each kn
p values determined by two-tailed Chi-square analysis. Number of counted chro
(E) Summary: the TERRA interactome revealed by combining CHIRT, iDRiP, and
plays a critical role in telomere function by antagonizing ATRX, controlling telome
from http://med.stanford.edu/content/dam/sm-news/images/2015/01/telomeres
pathway that is activated in many cancers to promote telomere
lengthening in the absence of telomerase (Lovejoy et al., 2012;
Doksani and de Lange, 2014). In tumors lacking telomerase
and ATRX function, elongated telomeres are associated with
increased TERRA expression (Barthel et al., 2017). We propose
that TERRA may be repressing both telomerase expression and
ATRX function in these contexts. Thus, apart from protecting
chromosomal ends in normal cells, TERRA expression may pro-
mote ALT in cancer cells by specifically suppressing ATRX and
telomerase. Consistent with this idea, our proteomic analysis
identified many other proteins in the ALT pathway, including
PML, BLOOM, and SMC5 and SMC6. In the future, the data-
rich resources provided by CHIRT and iDRiP can be used to
extend analysis of TERRA function in the context of its chromatin
and protein interaction networks.
STAR+METHODS
Detailed methods are provided in the online version of this paper
and include the following:
d KEY RESOURCES TABLE
d CONTACT FOR REAGENT AND RESOURCE SHARING
d EXPERIMENTAL MODEL AND SUBJECT DETAILS
d METHOD DETAILS
elo
us
or
d u
d u
ock
mo
LNA
rase
.jpg
B FISH
B CHIRT-seq
B TERRA CHIRT-seq analysis
B ChIP-seq analysis
B TERRA knockdown
B RNA-seq analysis
B Northern blotting analysis
B Quantitative RT-PCR
B iDRiP
B Detection of TERC-TERRA interaction from UV-cross-
linked cells
B Quantitative proteomics
B Proteomics network and GO analysis
B Immuno-FISH
B Electrophoretic mobility shift assay (EMSA)
B RQ-TRAP and TRAP assays
B Knockdown ATRX by siRNA
B Metaphase analysis of telomeric integrity
d QUANTIFICATION AND STATISTICAL ANALYSIS
d DATA AND SOFTWARE AVAILABILITY
meric DNA, green.Metaphase chromosomes, blue. A single cell is shown in
control (Scr and sense) LNAs. Arrows, loss of telomeric cap on one (het-
fused telomeres.
sing C-rich telomeric PNA probes (TelC). Black and white images shown for
sing G-rich telomeric PNA probes (TelG). Black and white images shown for
down were averaged. Error bars are SD. ***p < 0.001, compared to Scr KD.
somes is indicated.
-mediated knockdown enabled determination of TERRA function. TERRA
activity, and maintaining telomeric integrity. Chromosome image adapted
.
Cell 170, 86–101, June 29, 2017 99
SUPPLEMENTAL INFORMATION
Supplemental Information includes three tables and can be found with this
article online at http://dx.doi.org/10.1016/j.cell.2017.06.017.
AUTHOR CONTRIBUTIONS
H-P.C. and J.T.L. conceived of and designed the study. H-P.C. conducted
CHIRT, iDRiP, RNA-seq, and immune-FISH analyses. C.C.R performed
EMSA. B.K and H-P.C. analyzed NGS datasets. H.L. analyzed ATRX ChIP-
seq data. E.A. conducted TRAP experiments. H-P.C. and H.J.O. developed
CHIRT. C.W. assisted with RNA-seq library preparation, and M.B. and W.H.
carried out quantitative proteomic experiments. H-P.C. and J.T.L. wrote the
manuscript.
ACKNOWLEDGMENTS
We thank all members of the lab for valuable discussions and feedback. We
also thank C.-S. Wu for advising on IPA software and T. de Lange for discus-
sion. This work is supported by grants from the NIH to J.T.L. (R01-GM58839),
and to C.C.R. (K99-GM115868). J.T.L. is an Investigator of the Howard Hughes
Medical Institute.
Received: November 30, 2016
Revised: May 26, 2017
Accepted: June 9, 2017
Published: June 29, 2017
REFERENCES
Anders, S., Pyl, P.T., and Huber, W. (2015). HTSeq–a Python framework to
work with high-throughput sequencing data. Bioinformatics 31, 166–169.
Azzalin, C.M., and Lingner, J. (2008). Telomeres: the silence is broken. Cell Cy-
cle 7, 1161–1165.
Azzalin, C.M., and Lingner, J. (2015). Telomere functions grounding on TERRA
firma. Trends Cell Biol. 25, 29–36.
Azzalin, C.M., Reichenbach, P., Khoriauli, L., Giulotto, E., and Lingner, J.
(2007). Telomeric repeat containing RNA and RNA surveillance factors at
mammalian chromosome ends. Science 318, 798–801.
Balk, B., Maicher, A., Dees, M., Klermund, J., Luke-Glaser, S., Bender, K., and
Luke, B. (2013). Telomeric RNA-DNA hybrids affect telomere-length dynamics
and senescence. Nat. Struct. Mol. Biol. 20, 1199–1205.
Barthel, F.P., Wei, W., Tang, M., Martinez-Ledesma, E., Hu, X., Amin, S.B., Ak-
demir, K.C., Seth, S., Song, X., Wang, Q., et al. (2017). Systematic analysis of
telomere length and somatic alterations in 31 cancer types. Nat. Genet. 49,
349–357.
Bernardes de Jesus, B., and Blasco, M.A. (2013). Telomerase at the intersec-
tion of cancer and aging. Trends Genet. 29, 513–520.
Birney, E., Stamatoyannopoulos, J.A., Dutta, A., Guigo, R., Gingeras, T.R.,
Margulies, E.H., Weng, Z., Snyder, M., Dermitzakis, E.T., Thurman, R.E.,
et al.; ENCODE Project Consortium; NISC Comparative Sequencing Program;
Baylor College of Medicine Human Genome Sequencing Center; Washington
University Genome Sequencing Center; Broad Institute; Children’s Hospital
Oakland Research Institute (2007). Identification and analysis of functional el-
ements in 1% of the human genome by the ENCODE pilot project. Nature 447,
799–816.
Blackburn, E.H., Greider, C.W., and Szostak, J.W. (2006). Telomeres and telo-
merase: the path frommaize, Tetrahymena and yeast to human cancer and ag-
ing. Nat. Med. 12, 1133–1138.
Chen, L.Y., Majerska, J., and Lingner, J. (2013). Molecular basis of telomere
syndrome caused by CTC1 mutations. Genes Dev. 27, 2099–2108.
Chu, C., Qu, K., Zhong, F.L., Artandi, S.E., and Chang, H.Y. (2011). Genomic
maps of long noncoding RNA occupancy reveal principles of RNA-chromatin
interactions. Mol. Cell 44, 667–678.
100 Cell 170, 86–101, June 29, 2017
Cifuentes-Rojas, C., Hernandez, A.J., Sarma, K., and Lee, J.T. (2014). Regula-
tory interactions between RNA and polycomb repressive complex 2. Mol. Cell
55, 171–185.
Clynes, D., Jelinska, C., Xella, B., Ayyub, H., Scott, C., Mitson, M., Taylor, S.,
Higgs, D.R., and Gibbons, R.J. (2015). Suppression of the alternative length-
ening of telomere pathway by the chromatin remodelling factor ATRX. Nat.
Commun. 6, 7538.
Cristofari, G., and Lingner, J. (2006). Telomere length homeostasis requires
that telomerase levels are limiting. EMBO J. 25, 565–574.
de Lange, T. (2009). How telomeres solve the end-protection problem. Sci-
ence 326, 948–952.
Dejardin, J., and Kingston, R.E. (2009). Purification of proteins associated with
specific genomic Loci. Cell 136, 175–186.
Deng, Z., Norseen, J., Wiedmer, A., Riethman, H., and Lieberman, P.M. (2009).
TERRA RNA binding to TRF2 facilitates heterochromatin formation and ORC
recruitment at telomeres. Mol. Cell 35, 403–413.
Deng, Z., Wang, Z., Stong, N., Plasschaert, R., Moczan, A., Chen, H.-S., Hu,
S., Wikramasinghe, P., Davuluri, R.V., Bartolomei, M.S., et al. (2012). A role
for CTCF and cohesin in subtelomere chromatin organization, TERRA tran-
scription, and telomere end protection. EMBO J. 31, 4165–4178.
Doksani, Y., and de Lange, T. (2014). The role of double-strand break repair
pathways at functional and dysfunctional telomeres. Cold Spring Harb. Per-
spect. Biol. 6, a016576.
Edwards, A., and Haas, W. (2016). Multiplexed Quantitative Proteomics for
High-Throughput Comprehensive Proteome Comparisons of Human Cell
Lines. Methods Mol. Biol. 1394, 1–13.
Elias, J.E., and Gygi, S.P. (2007). Target-decoy search strategy for increased
confidence in large-scale protein identifications by mass spectrometry. Nat.
Methods 4, 207–214.
Eng, J.K., McCormack, A.L., and Yates, J.R. (1994). An approach to correlate
tandemmass spectral data of peptides with amino acid sequences in a protein
database. J. Am. Soc. Mass Spectrom. 5, 976–989.
Fei, Q., Yang, X., Jiang, H., Wang, Q., Yu, Y., Yu, Y., Yi, W., Zhou, S., Chen, T.,
Lu, C., et al. (2015). SETDB1 modulates PRC2 activity at developmental genes
independently of H3K9 trimethylation in mouse ES cells. Genome Res. 25,
1325–1335.
Grolimund, L., Aeby, E., Hamelin, R., Armand, F., Chiappe, D., Moniatte, M.,
and Lingner, J. (2013). A quantitative telomeric chromatin isolation protocol
identifies different telomeric states. Nat. Commun. 4, 2848.
Huang, D.W., Sherman, B.T., and Lempicki, R.A. (2009a). Bioinformatics
enrichment tools: paths toward the comprehensive functional analysis of large
gene lists. Nucleic Acids Res. 37, 1–13.
Huang, D.W., Sherman, B.T., and Lempicki, R.A. (2009b). Systematic and inte-
grative analysis of large gene lists using DAVID bioinformatics resources. Nat.
Protoc. 4, 44–57.
Huttlin, E.L., Jedrychowski, M.P., Elias, J.E., Goswami, T., Rad, R., Beausoleil,
S.A., Villen, J., Haas, W., Sowa, M.E., and Gygi, S.P. (2010). A tissue-specific
atlas of mouse protein phosphorylation and expression. Cell 143, 1174–1189.
Ishikawa, F., Matunis, M.J., Dreyfuss, G., and Cech, T.R. (1993). Nuclear pro-
teins that bind the pre-mRNA 30 splice site sequence r(UUAG/G) and the hu-
man telomeric DNA sequence d(TTAGGG)n. Mol. Cell. Biol. 13, 4301–4310.
Kagey, M.H., Newman, J.J., Bilodeau, S., Zhan, Y., Orlando, D.A., van Ber-
kum, N.L., Ebmeier, C.C., Goossens, J., Rahl, P.B., Levine, S.S., et al.
(2010). Mediator and cohesin connect gene expression and chromatin archi-
tecture. Nature 467, 430–435.
Kharchenko, P.V., Tolstorukov, M.Y., and Park, P.J. (2008). Design and anal-
ysis of ChIP-seq experiments for DNA-binding proteins. Nat. Biotechnol. 26,
1351–1359.
Kim, D., Pertea, G., Trapnell, C., Pimentel, H., Kelley, R., and Salzberg, S.L.
(2013). TopHat2: accurate alignment of transcriptomes in the presence of in-
sertions, deletions and gene fusions. Genome Biol. 14, R36.
Kung, J.T., Colognori, D., and Lee, J.T. (2013). Long noncoding RNAs: past,
present, and future. Genetics 193, 651–669.
Kung, J.T., Kesner, B., An, J.Y., Ahn, J.Y., Cifuentes-Rojas, C., Colognori, D.,
Jeon, Y., Szanto, A., del Rosario, B.C., Pinter, S.F., et al. (2015). Locus-specific
targeting to the X chromosome revealed by the RNA interactome of CTCF.
Mol. Cell 57, 361–375.
Langmead, B., and Salzberg, S.L. (2012). Fast gapped-read alignment with
Bowtie 2. Nat. Methods 9, 357–359.
Law, M.J., Lower, K.M., Voon, H.P., Hughes, J.R., Garrick, D., Viprakasit, V.,
Mitson, M., De Gobbi, M., Marra, M., Morris, A., et al. (2010). ATR-X syndrome
protein targets tandem repeats and influences allele-specific expression in a
size-dependent manner. Cell 143, 367–378.
Le, P.N., Maranon, D.G., Altina, N.H., Battaglia, C.L., and Bailey, S.M. (2013).
TERRA, hnRNP A1, and DNA-PKcs Interactions at Human Telomeres. Front.
Oncol. 3, 91.
Lee, J.T., Davidow, L.S., andWarshawsky, D. (1999). Tsix, a gene antisense to
Xist at the X-inactivation centre. Nat. Genet. 21, 400–404.
Lopez de Silanes, I., Stagno d’Alcontres, M., and Blasco, M.A. (2010). TERRA
transcripts are bound by a complex array of RNA-binding proteins. Nat. Com-
mun. 1.
Lopez de Silanes, I., Grana, O., De Bonis, M.L., Dominguez, O., Pisano, D.G.,
and Blasco, M.A. (2014). Identification of TERRA locus unveils a telomere pro-
tection role through association to nearly all chromosomes. Nat. Commun.
5, 4723.
Love, M.I., Huber, W., and Anders, S. (2014). Moderated estimation of fold
change and dispersion for RNA-seq data with DESeq2. Genome Biol. 15, 550.
Lovejoy, C.A., Li, W., Reisenweber, S., Thongthip, S., Bruno, J., de Lange, T.,
De, S., Petrini, J.H., Sung, P.A., Jasin, M., et al.; ALT Starr Cancer Consortium
(2012). Loss of ATRX, genome instability, and an altered DNA damage
response are hallmarks of the alternative lengthening of telomeres pathway.
PLoS Genet. 8, e1002772.
Maicher, A., Kastner, L., Dees, M., and Luke, B. (2012). Deregulated telomere
transcription causes replication-dependent telomere shortening and pro-
motes cellular senescence. Nucleic Acids Res. 40, 6649–6659.
McAlister, G.C., Huttlin, E.L., Haas, W., Ting, L., Jedrychowski, M.P., Rogers,
J.C., Kuhn, K., Pike, I., Grothe, R.A., Blethrow, J.D., and Gygi, S.P. (2012).
Increasing the multiplexing capacity of TMTs using reporter ion isotopologues
with isobaric masses. Anal. Chem. 84, 7469–7478.
McAlister, G.C., Nusinow, D.P., Jedrychowski, M.P., Wuhr, M., Huttlin, E.L.,
Erickson, B.K., Rad, R., Haas, W., and Gygi, S.P. (2014). MultiNotch MS3 en-
ables accurate, sensitive, and multiplexed detection of differential expression
across cancer cell line proteomes. Anal. Chem. 86, 7150–7158.
Minajigi, A., Froberg, J.E., Wei, C., Sunwoo, H., Kesner, B., Colognori, D.,
Lessing, D., Payer, B., Boukhali, M., Haas, W., and Lee, J.T. (2015). Chromo-
somes. A comprehensive Xist interactome reveals cohesin repulsion and an
RNA-directed chromosome conformation. Science 349.
Moravec, M., Wischnewski, H., Bah, A., Hu, Y., Liu, N., Lafranchi, L., King,
M.C., and Azzalin, C.M. (2016). TERRA promotes telomerase-mediated telo-
mere elongation in Schizosaccharomyces pombe. EMBO Rep. 17, 999–1012.
Pfeiffer, V., and Lingner, J. (2012). TERRA promotes telomere shortening
through exonuclease 1-mediated resection of chromosome ends. PLoS
Genet. 8, e1002747.
Pinter, S.F., Sadreyev, R.I., Yildirim, E., Jeon, Y., Ohsumi, T.K., Borowsky, M.,
and Lee, J.T. (2012). Spreading of X chromosome inactivation via a hierarchy
of defined Polycomb stations. Genome Res. 22, 1864–1876.
Porro, A., Feuerhahn, S., Reichenbach, P., and Lingner, J. (2010). Molecular
dissection of telomeric repeat-containing RNA biogenesis unveils the pres-
ence of distinct and multiple regulatory pathways. Mol. Cell. Biol. 30,
4808–4817.
Quinlan, A.R., and Hall, I.M. (2010). BEDTools: a flexible suite of utilities for
comparing genomic features. Bioinformatics 26, 841–842.
Redon, S., Reichenbach, P., and Lingner, J. (2010). The non-coding RNA
TERRA is a natural ligand and direct inhibitor of human telomerase. Nucleic
Acids Res. 38, 5797–5806.
Rippe, K., and Luke, B. (2015). TERRA and the state of the telomere. Nat.
Struct. Mol. Biol. 22, 853–858.
Sandell, L.L., Gottschling, D.E., and Zakian, V.A. (1994). Transcription of a
yeast telomere alleviates telomere position effect without affecting chromo-
some stability. Proc. Natl. Acad. Sci. USA 91, 12061–12065.
Sarma, K., Cifuentes-Rojas, C., Ergun, A., Del Rosario, A., Jeon, Y., White, F.,
Sadreyev, R., and Lee, J.T. (2014). ATRX directs binding of PRC2 to Xist RNA
and Polycomb targets. Cell 159, 869–883.
Scheibe, M., Arnoult, N., Kappei, D., Buchholz, F., Decottignies, A., Butter, F.,
and Mann, M. (2013). Quantitative interaction screen of telomeric repeat-con-
taining RNA reveals novel TERRA regulators. Genome Res. 23, 2149–2157.
Schmidt, J.C., Zaug, A.J., and Cech, T.R. (2016). Live Cell Imaging Reveals the
Dynamics of Telomerase Recruitment to Telomeres. Cell 166, 1188–1197.e9.
Schoeftner, S., and Blasco, M.A. (2008). Developmentally regulated transcrip-
tion of mammalian telomeres by DNA-dependent RNA polymerase II. Nat. Cell
Biol. 10, 228–236.
Shin, H., Liu, T., Manrai, A.K., and Liu, X.S. (2009). CEAS: cis-regulatory
element annotation system. Bioinformatics 25, 2605–2606.
Simon, M.D., Wang, C.I., Kharchenko, P.V., West, J.A., Chapman, B.A., Alek-
seyenko, A.A., Borowsky, M.L., Kuroda, M.I., and Kingston, R.E. (2011). The
genomic binding sites of a noncoding RNA. Proc. Natl. Acad. Sci. USA 108,
20497–20502.
Ting, L., Rad, R., Gygi, S.P., and Haas, W. (2011). MS3 eliminates ratio distor-
tion in isobaric multiplexed quantitative proteomics. Nat. Methods 8, 937–940.
Trapnell, C., Hendrickson, D.G., Sauvageau, M., Goff, L., Rinn, J.L., and
Pachter, L. (2013). Differential analysis of gene regulation at transcript resolu-
tion with RNA-seq. Nat. Biotechnol. 31, 46–53.
Webb, C.J., and Zakian, V.A. (2016). Telomerase RNA ismore than a DNA tem-
plate. RNA Biol. 13, 683–689.
Wellinger, R.J., Wolf, A.J., and Zakian, V.A. (1993). Origin activation and forma-
tion of single-strand TG1-3 tails occur sequentially in late S phase on a yeast
linear plasmid. Mol. Cell. Biol. 13, 4057–4065.
Yu, T.Y., Kao, Y.W., and Lin, J.J. (2014). Telomeric transcripts stimulate telo-
mere recombination to suppress senescence in cells lacking telomerase.
Proc. Natl. Acad. Sci. USA 111, 3377–3382.
Zhang, Y., Liu, T., Meyer, C.A., Eeckhoute, J., Johnson, D.S., Bernstein, B.E.,
Nusbaum, C., Myers, R.M., Brown, M., Li, W., and Liu, X.S. (2008). Model-
based analysis of ChIP-Seq (MACS). Genome Biol. 9, R137.
Zhang, L.-F., Ogawa, Y., Ahn, J.Y., Namekawa, S.H., Silva, S.S., and Lee, J.T.
(2009). Telomeric RNAs mark sex chromosomes in stem cells. Genetics 182,
685–698.
Cell 170, 86–101, June 29, 2017 101
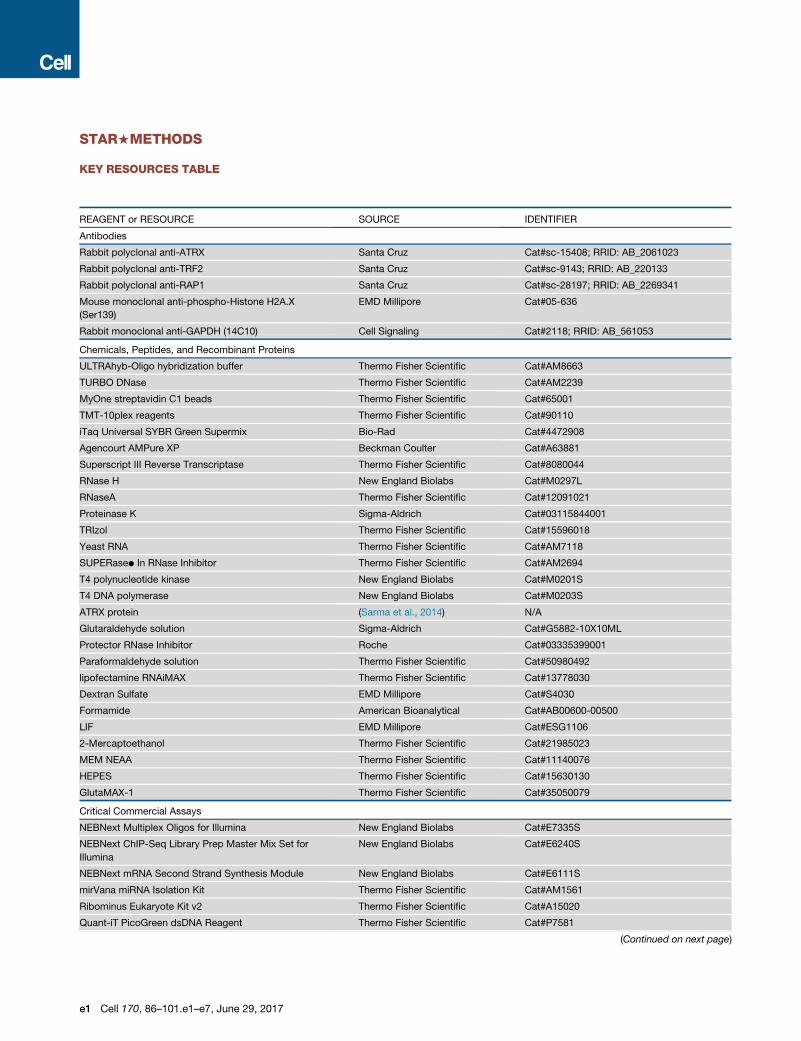
STAR+METHODS
KEY RESOURCES TABLE
REAGENT or RESOURCE SOURCE IDENTIFIER
Antibodies
Rabbit polyclonal anti-ATRX Santa Cruz Cat#sc-15408; RRID: AB_2061023
Rabbit polyclonal anti-TRF2 Santa Cruz Cat#sc-9143; RRID: AB_220133
Rabbit polyclonal anti-RAP1 Santa Cruz Cat#sc-28197; RRID: AB_2269341
Mouse monoclonal anti-phospho-Histone H2A.X
(Ser139)
EMD Millipore Cat#05-636
Rabbit monoclonal anti-GAPDH (14C10) Cell Signaling Cat#2118; RRID: AB_561053
Chemicals, Peptides, and Recombinant Proteins
ULTRAhyb-Oligo hybridization buffer Thermo Fisher Scientific Cat#AM8663
TURBO DNase Thermo Fisher Scientific Cat#AM2239
MyOne streptavidin C1 beads Thermo Fisher Scientific Cat#65001
TMT-10plex reagents Thermo Fisher Scientific Cat#90110
iTaq Universal SYBR Green Supermix Bio-Rad Cat#4472908
Agencourt AMPure XP Beckman Coulter Cat#A63881
Superscript III Reverse Transcriptase Thermo Fisher Scientific Cat#8080044
RNase H New England Biolabs Cat#M0297L
RNaseA Thermo Fisher Scientific Cat#12091021
Proteinase K Sigma-Aldrich Cat#03115844001
TRIzol Thermo Fisher Scientific Cat#15596018
Yeast RNA Thermo Fisher Scientific Cat#AM7118
SUPERased In RNase Inhibitor Thermo Fisher Scientific Cat#AM2694
T4 polynucleotide kinase New England Biolabs Cat#M0201S
T4 DNA polymerase New England Biolabs Cat#M0203S
ATRX protein (Sarma et al., 2014) N/A
Glutaraldehyde solution Sigma-Aldrich Cat#G5882-10X10ML
Protector RNase Inhibitor Roche Cat#03335399001
Paraformaldehyde solution Thermo Fisher Scientific Cat#50980492
lipofectamine RNAiMAX Thermo Fisher Scientific Cat#13778030
Dextran Sulfate EMD Millipore Cat#S4030
Formamide American Bioanalytical Cat#AB00600-00500
LIF EMD Millipore Cat#ESG1106
2-Mercaptoethanol Thermo Fisher Scientific Cat#21985023
MEM NEAA Thermo Fisher Scientific Cat#11140076
HEPES Thermo Fisher Scientific Cat#15630130
GlutaMAX-1 Thermo Fisher Scientific Cat#35050079
Critical Commercial Assays
NEBNext Multiplex Oligos for Illumina New England Biolabs Cat#E7335S
NEBNext ChIP-Seq Library Prep Master Mix Set for
Illumina
New England Biolabs Cat#E6240S
NEBNext mRNA Second Strand Synthesis Module New England Biolabs Cat#E6111S
mirVana miRNA Isolation Kit Thermo Fisher Scientific Cat#AM1561
Ribominus Eukaryote Kit v2 Thermo Fisher Scientific Cat#A15020
Quant-iT PicoGreen dsDNA Reagent Thermo Fisher Scientific Cat#P7581
(Continued on next page)
e1 Cell 170, 86–101.e1–e7, June 29, 2017
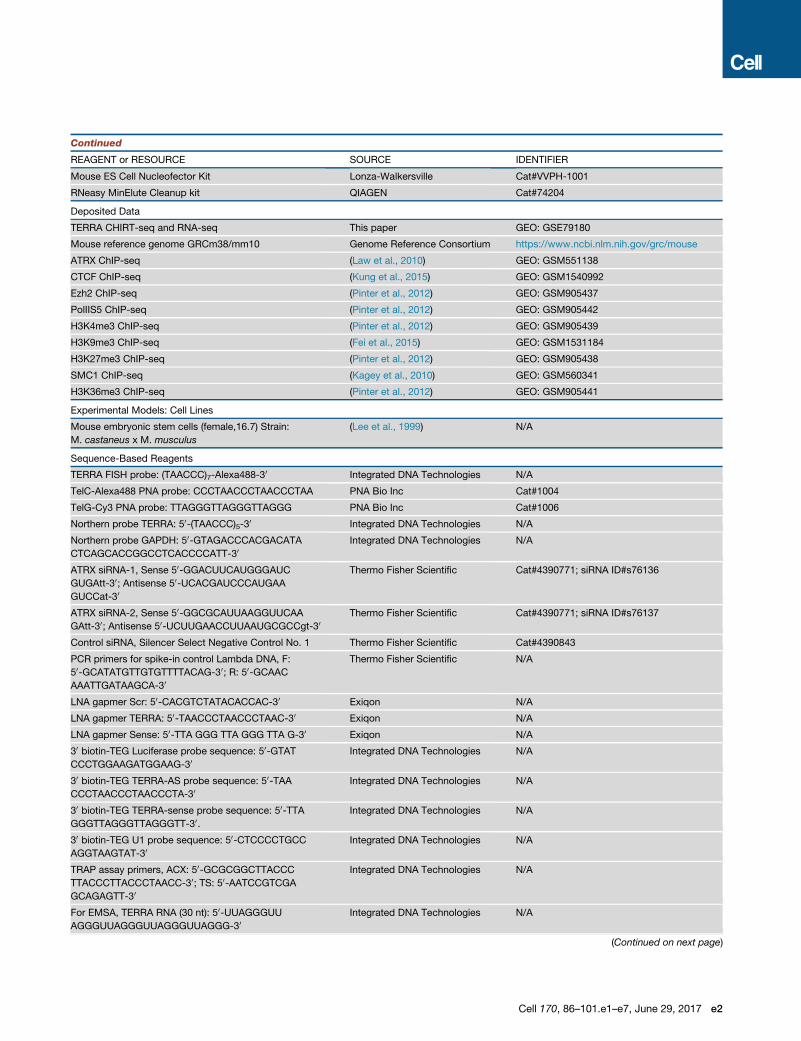
Continued
REAGENT or RESOURCE SOURCE IDENTIFIER
Mouse ES Cell Nucleofector Kit Lonza-Walkersville Cat#VVPH-1001
RNeasy MinElute Cleanup kit QIAGEN Cat#74204
Deposited Data
TERRA CHIRT-seq and RNA-seq This paper GEO: GSE79180
Mouse reference genome GRCm38/mm10 Genome Reference Consortium https://www.ncbi.nlm.nih.gov/grc/mouse
ATRX ChIP-seq (Law et al., 2010) GEO: GSM551138
CTCF ChIP-seq (Kung et al., 2015) GEO: GSM1540992
Ezh2 ChIP-seq (Pinter et al., 2012) GEO: GSM905437
PolIIS5 ChIP-seq (Pinter et al., 2012) GEO: GSM905442
H3K4me3 ChIP-seq (Pinter et al., 2012) GEO: GSM905439
H3K9me3 ChIP-seq (Fei et al., 2015) GEO: GSM1531184
H3K27me3 ChIP-seq (Pinter et al., 2012) GEO: GSM905438
SMC1 ChIP-seq (Kagey et al., 2010) GEO: GSM560341
H3K36me3 ChIP-seq (Pinter et al., 2012) GEO: GSM905441
Experimental Models: Cell Lines
Mouse embryonic stem cells (female,16.7) Strain:
M. castaneus x M. musculus
(Lee et al., 1999) N/A
Sequence-Based Reagents
TERRA FISH probe: (TAACCC)7-Alexa488-30 Integrated DNA Technologies N/A
TelC-Alexa488 PNA probe: CCCTAACCCTAACCCTAA PNA Bio Inc Cat#1004
TelG-Cy3 PNA probe: TTAGGGTTAGGGTTAGGG PNA Bio Inc Cat#1006
Northern probe TERRA: 50-(TAACCC)5-30 Integrated DNA Technologies N/A
Northern probe GAPDH: 50-GTAGACCCACGACATA
CTCAGCACCGGCCTCACCCCATT-30Integrated DNA Technologies N/A
ATRX siRNA-1, Sense 50-GGACUUCAUGGGAUC
GUGAtt-30; Antisense 50-UCACGAUCCCAUGAA
GUCCat-30
Thermo Fisher Scientific Cat#4390771; siRNA ID#s76136
ATRX siRNA-2, Sense 50-GGCGCAUUAAGGUUCAA
GAtt-30; Antisense 50-UCUUGAACCUUAAUGCGCCgt-30Thermo Fisher Scientific Cat#4390771; siRNA ID#s76137
Control siRNA, Silencer Select Negative Control No. 1 Thermo Fisher Scientific Cat#4390843
PCR primers for spike-in control Lambda DNA, F:
50-GCATATGTTGTGTTTTACAG-30; R: 50-GCAAC
AAATTGATAAGCA-30
Thermo Fisher Scientific N/A
LNA gapmer Scr: 50-CACGTCTATACACCAC-30 Exiqon N/A
LNA gapmer TERRA: 50-TAACCCTAACCCTAAC-30 Exiqon N/A
LNA gapmer Sense: 50-TTA GGG TTA GGG TTA G-30 Exiqon N/A
30 biotin-TEG Luciferase probe sequence: 50-GTAT
CCCTGGAAGATGGAAG-30Integrated DNA Technologies N/A
30 biotin-TEG TERRA-AS probe sequence: 50-TAACCCTAACCCTAACCCTA-30
Integrated DNA Technologies N/A
30 biotin-TEG TERRA-sense probe sequence: 50-TTAGGGTTAGGGTTAGGGTT-30.
Integrated DNA Technologies N/A
30 biotin-TEG U1 probe sequence: 50-CTCCCCTGCC
AGGTAAGTAT-30Integrated DNA Technologies N/A
TRAP assay primers, ACX: 50-GCGCGGCTTACCC
TTACCCTTACCCTAACC-30; TS: 50-AATCCGTCGA
GCAGAGTT-30
Integrated DNA Technologies N/A
For EMSA, TERRA RNA (30 nt): 50-UUAGGGUU
AGGGUUAGGGUUAGGGUUAGGG-30Integrated DNA Technologies N/A
(Continued on next page)
Cell 170, 86–101.e1–e7, June 29, 2017 e2
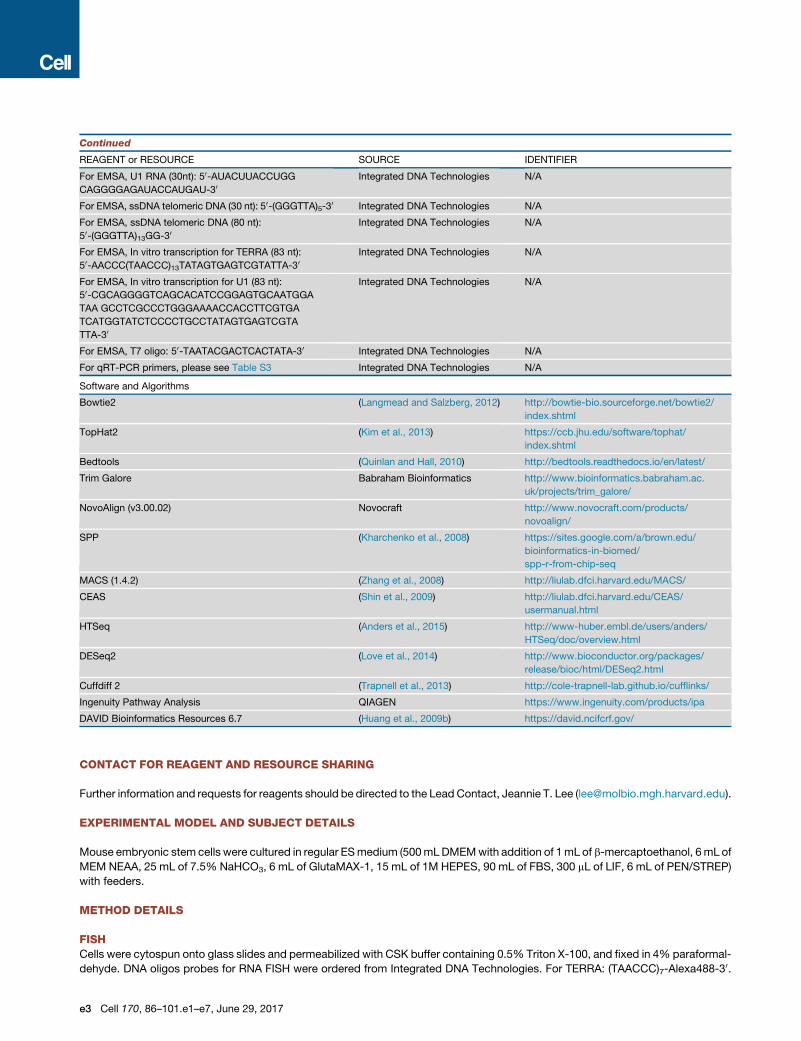
Continued
REAGENT or RESOURCE SOURCE IDENTIFIER
For EMSA, U1 RNA (30nt): 50-AUACUUACCUGG
CAGGGGAGAUACCAUGAU-30Integrated DNA Technologies N/A
For EMSA, ssDNA telomeric DNA (30 nt): 50-(GGGTTA)5-30 Integrated DNA Technologies N/A
For EMSA, ssDNA telomeric DNA (80 nt):
50-(GGGTTA)13GG-30Integrated DNA Technologies N/A
For EMSA, In vitro transcription for TERRA (83 nt):
50-AACCC(TAACCC)13TATAGTGAGTCGTATTA-30Integrated DNA Technologies N/A
For EMSA, In vitro transcription for U1 (83 nt):
50-CGCAGGGGTCAGCACATCCGGAGTGCAATGGA
TAA GCCTCGCCCTGGGAAAACCACCTTCGTGA
TCATGGTATCTCCCCTGCCTATAGTGAGTCGTA
TTA-30
Integrated DNA Technologies N/A
For EMSA, T7 oligo: 50-TAATACGACTCACTATA-30 Integrated DNA Technologies N/A
For qRT-PCR primers, please see Table S3 Integrated DNA Technologies N/A
Software and Algorithms
Bowtie2 (Langmead and Salzberg, 2012) http://bowtie-bio.sourceforge.net/bowtie2/
index.shtml
TopHat2 (Kim et al., 2013) https://ccb.jhu.edu/software/tophat/
index.shtml
Bedtools (Quinlan and Hall, 2010) http://bedtools.readthedocs.io/en/latest/
Trim Galore Babraham Bioinformatics http://www.bioinformatics.babraham.ac.
uk/projects/trim_galore/
NovoAlign (v3.00.02) Novocraft http://www.novocraft.com/products/
novoalign/
SPP (Kharchenko et al., 2008) https://sites.google.com/a/brown.edu/
bioinformatics-in-biomed/
spp-r-from-chip-seq
MACS (1.4.2) (Zhang et al., 2008) http://liulab.dfci.harvard.edu/MACS/
CEAS (Shin et al., 2009) http://liulab.dfci.harvard.edu/CEAS/
usermanual.html
HTSeq (Anders et al., 2015) http://www-huber.embl.de/users/anders/
HTSeq/doc/overview.html
DESeq2 (Love et al., 2014) http://www.bioconductor.org/packages/
release/bioc/html/DESeq2.html
Cuffdiff 2 (Trapnell et al., 2013) http://cole-trapnell-lab.github.io/cufflinks/
Ingenuity Pathway Analysis QIAGEN https://www.ingenuity.com/products/ipa
DAVID Bioinformatics Resources 6.7 (Huang et al., 2009b) https://david.ncifcrf.gov/
CONTACT FOR REAGENT AND RESOURCE SHARING
Further information and requests for reagents should be directed to the Lead Contact, Jeannie T. Lee ([email protected]).
EXPERIMENTAL MODEL AND SUBJECT DETAILS
Mouse embryonic stem cells were cultured in regular ESmedium (500mLDMEMwith addition of 1mL of b-mercaptoethanol, 6mL of
MEM NEAA, 25 mL of 7.5% NaHCO3, 6 mL of GlutaMAX-1, 15 mL of 1M HEPES, 90 mL of FBS, 300 mL of LIF, 6 mL of PEN/STREP)
with feeders.
METHOD DETAILS
FISHCells were cytospun onto glass slides and permeabilized with CSK buffer containing 0.5% Triton X-100, and fixed in 4% paraformal-
dehyde. DNA oligos probes for RNA FISH were ordered from Integrated DNA Technologies. For TERRA: (TAACCC)7-Alexa488-30.
e3 Cell 170, 86–101.e1–e7, June 29, 2017
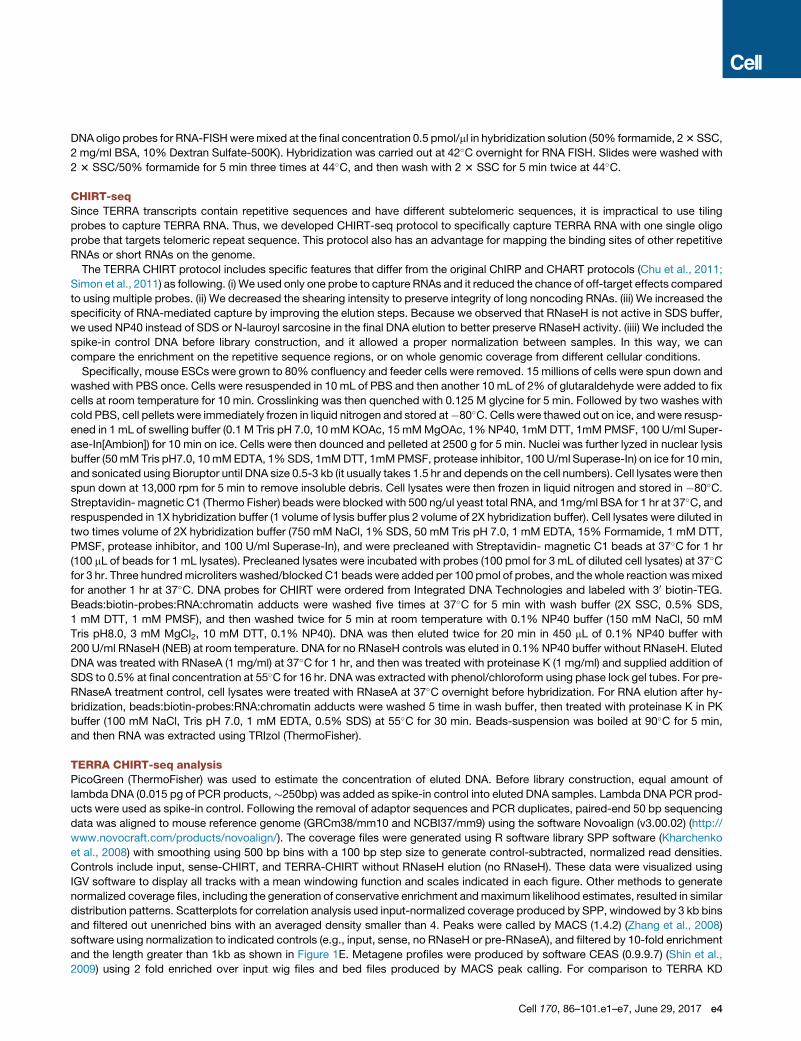
DNAoligo probes for RNA-FISHweremixed at the final concentration 0.5 pmol/ml in hybridization solution (50% formamide, 23SSC,
2 mg/ml BSA, 10% Dextran Sulfate-500K). Hybridization was carried out at 42�C overnight for RNA FISH. Slides were washed with
2 3 SSC/50% formamide for 5 min three times at 44�C, and then wash with 2 3 SSC for 5 min twice at 44�C.
CHIRT-seqSince TERRA transcripts contain repetitive sequences and have different subtelomeric sequences, it is impractical to use tiling
probes to capture TERRA RNA. Thus, we developed CHIRT-seq protocol to specifically capture TERRA RNA with one single oligo
probe that targets telomeric repeat sequence. This protocol also has an advantage for mapping the binding sites of other repetitive
RNAs or short RNAs on the genome.
The TERRA CHIRT protocol includes specific features that differ from the original ChIRP and CHART protocols (Chu et al., 2011;
Simon et al., 2011) as following. (i) We used only one probe to capture RNAs and it reduced the chance of off-target effects compared
to using multiple probes. (ii) We decreased the shearing intensity to preserve integrity of long noncoding RNAs. (iii) We increased the
specificity of RNA-mediated capture by improving the elution steps. Because we observed that RNaseH is not active in SDS buffer,
we used NP40 instead of SDS or N-lauroyl sarcosine in the final DNA elution to better preserve RNaseH activity. (iiii) We included the
spike-in control DNA before library construction, and it allowed a proper normalization between samples. In this way, we can
compare the enrichment on the repetitive sequence regions, or on whole genomic coverage from different cellular conditions.
Specifically, mouse ESCs were grown to 80% confluency and feeder cells were removed. 15 millions of cells were spun down and
washed with PBS once. Cells were resuspended in 10 mL of PBS and then another 10 mL of 2% of glutaraldehyde were added to fix
cells at room temperature for 10 min. Crosslinking was then quenched with 0.125 M glycine for 5 min. Followed by two washes with
cold PBS, cell pellets were immediately frozen in liquid nitrogen and stored at�80�C. Cells were thawed out on ice, andwere resusp-
ened in 1 mL of swelling buffer (0.1 M Tris pH 7.0, 10 mM KOAc, 15 mMMgOAc, 1%NP40, 1mMDTT, 1mM PMSF, 100 U/ml Super-
ase-In[Ambion]) for 10 min on ice. Cells were then dounced and pelleted at 2500 g for 5 min. Nuclei was further lyzed in nuclear lysis
buffer (50mMTris pH7.0, 10mMEDTA, 1%SDS, 1mMDTT, 1mMPMSF, protease inhibitor, 100 U/ml Superase-In) on ice for 10min,
and sonicated using Bioruptor until DNA size 0.5-3 kb (it usually takes 1.5 hr and depends on the cell numbers). Cell lysates were then
spun down at 13,000 rpm for 5 min to remove insoluble debris. Cell lysates were then frozen in liquid nitrogen and stored in �80�C.Streptavidin- magnetic C1 (Thermo Fisher) beads were blocked with 500 ng/ul yeast total RNA, and 1mg/ml BSA for 1 hr at 37�C, andrespuspended in 1X hybridization buffer (1 volume of lysis buffer plus 2 volume of 2X hybridization buffer). Cell lysates were diluted in
two times volume of 2X hybridization buffer (750 mM NaCl, 1% SDS, 50 mM Tris pH 7.0, 1 mM EDTA, 15% Formamide, 1 mM DTT,
PMSF, protease inhibitor, and 100 U/ml Superase-In), and were precleaned with Streptavidin- magnetic C1 beads at 37�C for 1 hr
(100 mL of beads for 1 mL lysates). Precleaned lysates were incubated with probes (100 pmol for 3 mL of diluted cell lysates) at 37�Cfor 3 hr. Three hundredmicroliters washed/blocked C1 beads were added per 100 pmol of probes, and thewhole reaction wasmixed
for another 1 hr at 37�C. DNA probes for CHIRT were ordered from Integrated DNA Technologies and labeled with 30 biotin-TEG.
Beads:biotin-probes:RNA:chromatin adducts were washed five times at 37�C for 5 min with wash buffer (2X SSC, 0.5% SDS,
1 mM DTT, 1 mM PMSF), and then washed twice for 5 min at room temperature with 0.1% NP40 buffer (150 mM NaCl, 50 mM
Tris pH8.0, 3 mM MgCl2, 10 mM DTT, 0.1% NP40). DNA was then eluted twice for 20 min in 450 mL of 0.1% NP40 buffer with
200 U/ml RNaseH (NEB) at room temperature. DNA for no RNaseH controls was eluted in 0.1%NP40 buffer without RNaseH. Eluted
DNA was treated with RNaseA (1 mg/ml) at 37�C for 1 hr, and then was treated with proteinase K (1 mg/ml) and supplied addition of
SDS to 0.5% at final concentration at 55�C for 16 hr. DNA was extracted with phenol/chloroform using phase lock gel tubes. For pre-
RNaseA treatment control, cell lysates were treated with RNaseA at 37�C overnight before hybridization. For RNA elution after hy-
bridization, beads:biotin-probes:RNA:chromatin adducts were washed 5 time in wash buffer, then treated with proteinase K in PK
buffer (100 mM NaCl, Tris pH 7.0, 1 mM EDTA, 0.5% SDS) at 55�C for 30 min. Beads-suspension was boiled at 90�C for 5 min,
and then RNA was extracted using TRIzol (ThermoFisher).
TERRA CHIRT-seq analysisPicoGreen (ThermoFisher) was used to estimate the concentration of eluted DNA. Before library construction, equal amount of
lambda DNA (0.015 pg of PCR products,�250bp) was added as spike-in control into eluted DNA samples. Lambda DNA PCR prod-
ucts were used as spike-in control. Following the removal of adaptor sequences and PCR duplicates, paired-end 50 bp sequencing
data was aligned to mouse reference genome (GRCm38/mm10 and NCBI37/mm9) using the software Novoalign (v3.00.02) (http://
www.novocraft.com/products/novoalign/). The coverage files were generated using R software library SPP software (Kharchenko
et al., 2008) with smoothing using 500 bp bins with a 100 bp step size to generate control-subtracted, normalized read densities.
Controls include input, sense-CHIRT, and TERRA-CHIRT without RNaseH elution (no RNaseH). These data were visualized using
IGV software to display all tracks with a mean windowing function and scales indicated in each figure. Other methods to generate
normalized coverage files, including the generation of conservative enrichment andmaximum likelihood estimates, resulted in similar
distribution patterns. Scatterplots for correlation analysis used input-normalized coverage produced by SPP, windowed by 3 kb bins
and filtered out unenriched bins with an averaged density smaller than 4. Peaks were called by MACS (1.4.2) (Zhang et al., 2008)
software using normalization to indicated controls (e.g., input, sense, no RNaseH or pre-RNaseA), and filtered by 10-fold enrichment
and the length greater than 1kb as shown in Figure 1E. Metagene profiles were produced by software CEAS (0.9.9.7) (Shin et al.,
2009) using 2 fold enriched over input wig files and bed files produced by MACS peak calling. For comparison to TERRA KD
Cell 170, 86–101.e1–e7, June 29, 2017 e4
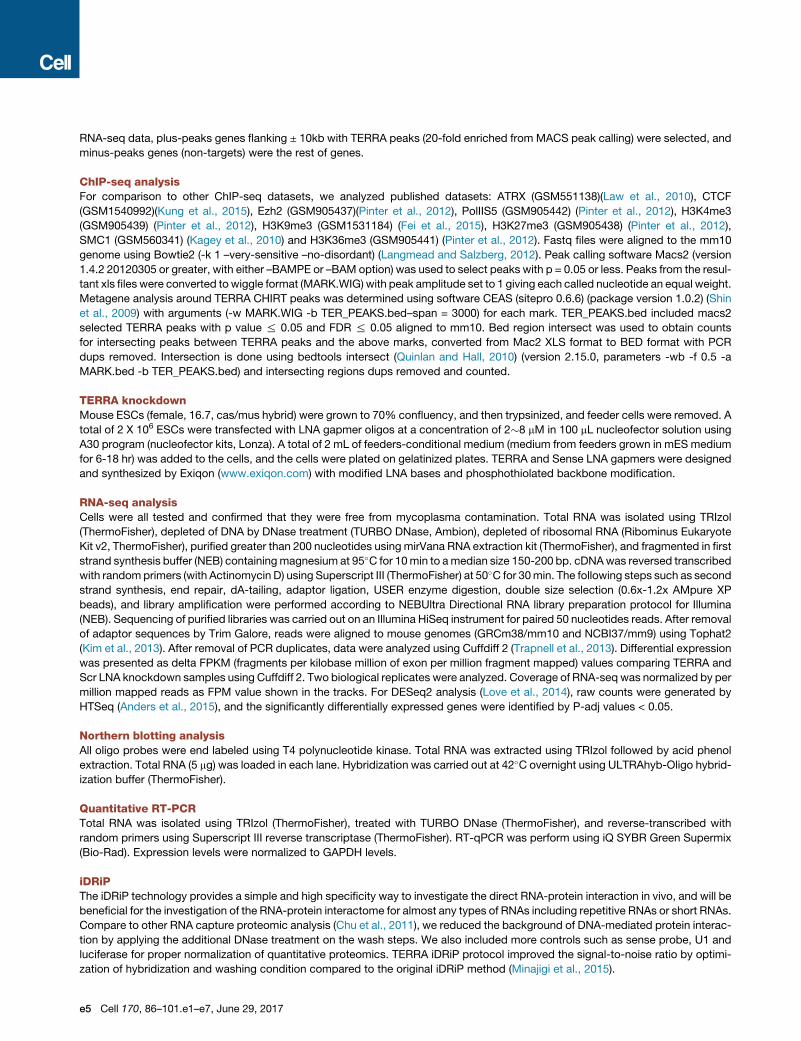
RNA-seq data, plus-peaks genes flanking ± 10kb with TERRA peaks (20-fold enriched from MACS peak calling) were selected, and
minus-peaks genes (non-targets) were the rest of genes.
ChIP-seq analysisFor comparison to other ChIP-seq datasets, we analyzed published datasets: ATRX (GSM551138)(Law et al., 2010), CTCF
(GSM1540992)(Kung et al., 2015), Ezh2 (GSM905437)(Pinter et al., 2012), PolIIS5 (GSM905442) (Pinter et al., 2012), H3K4me3
(GSM905439) (Pinter et al., 2012), H3K9me3 (GSM1531184) (Fei et al., 2015), H3K27me3 (GSM905438) (Pinter et al., 2012),
SMC1 (GSM560341) (Kagey et al., 2010) and H3K36me3 (GSM905441) (Pinter et al., 2012). Fastq files were aligned to the mm10
genome using Bowtie2 (-k 1 –very-sensitive –no-disordant) (Langmead and Salzberg, 2012). Peak calling software Macs2 (version
1.4.2 20120305 or greater, with either –BAMPE or –BAM option) was used to select peaks with p = 0.05 or less. Peaks from the resul-
tant xls files were converted to wiggle format (MARK.WIG) with peak amplitude set to 1 giving each called nucleotide an equal weight.
Metagene analysis around TERRA CHIRT peaks was determined using software CEAS (sitepro 0.6.6) (package version 1.0.2) (Shin
et al., 2009) with arguments (-w MARK.WIG -b TER_PEAKS.bed–span = 3000) for each mark. TER_PEAKS.bed included macs2
selected TERRA peaks with p value % 0.05 and FDR % 0.05 aligned to mm10. Bed region intersect was used to obtain counts
for intersecting peaks between TERRA peaks and the above marks, converted from Mac2 XLS format to BED format with PCR
dups removed. Intersection is done using bedtools intersect (Quinlan and Hall, 2010) (version 2.15.0, parameters -wb -f 0.5 -a
MARK.bed -b TER_PEAKS.bed) and intersecting regions dups removed and counted.
TERRA knockdownMouse ESCs (female, 16.7, cas/mus hybrid) were grown to 70% confluency, and then trypsinized, and feeder cells were removed. A
total of 2 X 10⁶ ESCs were transfected with LNA gapmer oligos at a concentration of 2�8 mM in 100 mL nucleofector solution using
A30 program (nucleofector kits, Lonza). A total of 2 mL of feeders-conditional medium (medium from feeders grown in mES medium
for 6-18 hr) was added to the cells, and the cells were plated on gelatinized plates. TERRA and Sense LNA gapmers were designed
and synthesized by Exiqon (www.exiqon.com) with modified LNA bases and phosphothiolated backbone modification.
RNA-seq analysisCells were all tested and confirmed that they were free from mycoplasma contamination. Total RNA was isolated using TRIzol
(ThermoFisher), depleted of DNA by DNase treatment (TURBO DNase, Ambion), depleted of ribosomal RNA (Ribominus Eukaryote
Kit v2, ThermoFisher), purified greater than 200 nucleotides using mirVana RNA extraction kit (ThermoFisher), and fragmented in first
strand synthesis buffer (NEB) containingmagnesium at 95�C for 10min to amedian size 150-200 bp. cDNAwas reversed transcribed
with randomprimers (with Actinomycin D) using Superscript III (ThermoFisher) at 50�C for 30min. The following steps such as second
strand synthesis, end repair, dA-tailing, adaptor ligation, USER enzyme digestion, double size selection (0.6x-1.2x AMpure XP
beads), and library amplification were performed according to NEBUltra Directional RNA library preparation protocol for Illumina
(NEB). Sequencing of purified libraries was carried out on an Illumina HiSeq instrument for paired 50 nucleotides reads. After removal
of adaptor sequences by Trim Galore, reads were aligned to mouse genomes (GRCm38/mm10 and NCBI37/mm9) using Tophat2
(Kim et al., 2013). After removal of PCR duplicates, data were analyzed using Cuffdiff 2 (Trapnell et al., 2013). Differential expression
was presented as delta FPKM (fragments per kilobase million of exon per million fragment mapped) values comparing TERRA and
Scr LNA knockdown samples using Cuffdiff 2. Two biological replicates were analyzed. Coverage of RNA-seq was normalized by per
million mapped reads as FPM value shown in the tracks. For DESeq2 analysis (Love et al., 2014), raw counts were generated by
HTSeq (Anders et al., 2015), and the significantly differentially expressed genes were identified by P-adj values < 0.05.
Northern blotting analysisAll oligo probes were end labeled using T4 polynucleotide kinase. Total RNA was extracted using TRIzol followed by acid phenol
extraction. Total RNA (5 mg) was loaded in each lane. Hybridization was carried out at 42�C overnight using ULTRAhyb-Oligo hybrid-
ization buffer (ThermoFisher).
Quantitative RT-PCRTotal RNA was isolated using TRIzol (ThermoFisher), treated with TURBO DNase (ThermoFisher), and reverse-transcribed with
random primers using Superscript III reverse transcriptase (ThermoFisher). RT-qPCR was perform using iQ SYBR Green Supermix
(Bio-Rad). Expression levels were normalized to GAPDH levels.
iDRiPThe iDRiP technology provides a simple and high specificity way to investigate the direct RNA-protein interaction in vivo, and will be
beneficial for the investigation of the RNA-protein interactome for almost any types of RNAs including repetitive RNAs or short RNAs.
Compare to other RNA capture proteomic analysis (Chu et al., 2011), we reduced the background of DNA-mediated protein interac-
tion by applying the additional DNase treatment on the wash steps. We also included more controls such as sense probe, U1 and
luciferase for proper normalization of quantitative proteomics. TERRA iDRiP protocol improved the signal-to-noise ratio by optimi-
zation of hybridization and washing condition compared to the original iDRiP method (Minajigi et al., 2015).
e5 Cell 170, 86–101.e1–e7, June 29, 2017
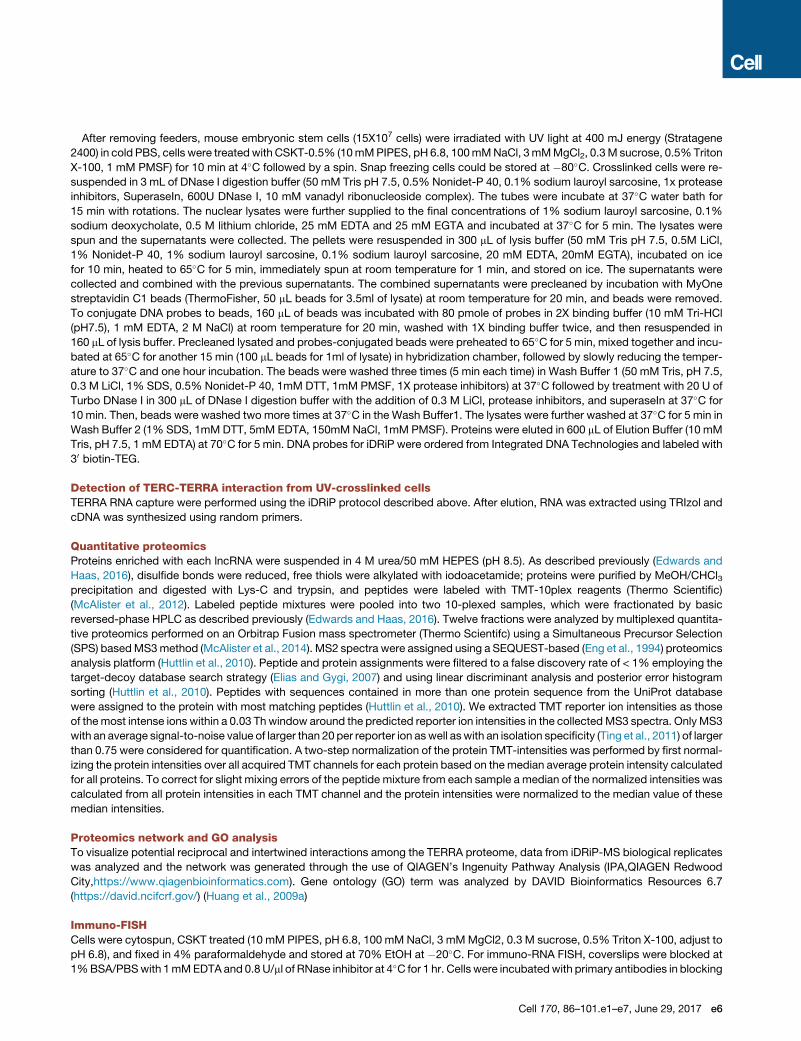
After removing feeders, mouse embryonic stem cells (15X107 cells) were irradiated with UV light at 400 mJ energy (Stratagene
2400) in cold PBS, cells were treatedwith CSKT-0.5% (10mMPIPES, pH 6.8, 100mMNaCl, 3mMMgCl2, 0.3M sucrose, 0.5%Triton
X-100, 1 mM PMSF) for 10 min at 4�C followed by a spin. Snap freezing cells could be stored at �80�C. Crosslinked cells were re-
suspended in 3 mL of DNase I digestion buffer (50 mM Tris pH 7.5, 0.5% Nonidet-P 40, 0.1% sodium lauroyl sarcosine, 1x protease
inhibitors, SuperaseIn, 600U DNase I, 10 mM vanadyl ribonucleoside complex). The tubes were incubate at 37�C water bath for
15 min with rotations. The nuclear lysates were further supplied to the final concentrations of 1% sodium lauroyl sarcosine, 0.1%
sodium deoxycholate, 0.5 M lithium chloride, 25 mM EDTA and 25 mM EGTA and incubated at 37�C for 5 min. The lysates were
spun and the supernatants were collected. The pellets were resuspended in 300 mL of lysis buffer (50 mM Tris pH 7.5, 0.5M LiCl,
1% Nonidet-P 40, 1% sodium lauroyl sarcosine, 0.1% sodium lauroyl sarcosine, 20 mM EDTA, 20mM EGTA), incubated on ice
for 10 min, heated to 65�C for 5 min, immediately spun at room temperature for 1 min, and stored on ice. The supernatants were
collected and combined with the previous supernatants. The combined supernatants were precleaned by incubation with MyOne
streptavidin C1 beads (ThermoFisher, 50 mL beads for 3.5ml of lysate) at room temperature for 20 min, and beads were removed.
To conjugate DNA probes to beads, 160 mL of beads was incubated with 80 pmole of probes in 2X binding buffer (10 mM Tri-HCl
(pH7.5), 1 mM EDTA, 2 M NaCl) at room temperature for 20 min, washed with 1X binding buffer twice, and then resuspended in
160 mL of lysis buffer. Precleaned lysated and probes-conjugated beads were preheated to 65�C for 5 min, mixed together and incu-
bated at 65�C for another 15 min (100 mL beads for 1ml of lysate) in hybridization chamber, followed by slowly reducing the temper-
ature to 37�C and one hour incubation. The beads were washed three times (5 min each time) in Wash Buffer 1 (50 mM Tris, pH 7.5,
0.3 M LiCl, 1% SDS, 0.5% Nonidet-P 40, 1mM DTT, 1mM PMSF, 1X protease inhibitors) at 37�C followed by treatment with 20 U of
Turbo DNase I in 300 mL of DNase I digestion buffer with the addition of 0.3 M LiCl, protease inhibitors, and superaseIn at 37�C for
10 min. Then, beads were washed two more times at 37�C in the Wash Buffer1. The lysates were further washed at 37�C for 5 min in
Wash Buffer 2 (1% SDS, 1mM DTT, 5mM EDTA, 150mM NaCl, 1mM PMSF). Proteins were eluted in 600 mL of Elution Buffer (10 mM
Tris, pH 7.5, 1 mM EDTA) at 70�C for 5 min. DNA probes for iDRiP were ordered from Integrated DNA Technologies and labeled with
30 biotin-TEG.
Detection of TERC-TERRA interaction from UV-crosslinked cellsTERRA RNA capture were performed using the iDRiP protocol described above. After elution, RNA was extracted using TRIzol and
cDNA was synthesized using random primers.
Quantitative proteomicsProteins enriched with each lncRNA were suspended in 4 M urea/50 mM HEPES (pH 8.5). As described previously (Edwards and
Haas, 2016), disulfide bonds were reduced, free thiols were alkylated with iodoacetamide; proteins were purified by MeOH/CHCl3precipitation and digested with Lys-C and trypsin, and peptides were labeled with TMT-10plex reagents (Thermo Scientific)
(McAlister et al., 2012). Labeled peptide mixtures were pooled into two 10-plexed samples, which were fractionated by basic
reversed-phase HPLC as described previously (Edwards and Haas, 2016). Twelve fractions were analyzed by multiplexed quantita-
tive proteomics performed on an Orbitrap Fusion mass spectrometer (Thermo Scientifc) using a Simultaneous Precursor Selection
(SPS) basedMS3method (McAlister et al., 2014). MS2 spectra were assigned using a SEQUEST-based (Eng et al., 1994) proteomics
analysis platform (Huttlin et al., 2010). Peptide and protein assignments were filtered to a false discovery rate of < 1% employing the
target-decoy database search strategy (Elias and Gygi, 2007) and using linear discriminant analysis and posterior error histogram
sorting (Huttlin et al., 2010). Peptides with sequences contained in more than one protein sequence from the UniProt database
were assigned to the protein with most matching peptides (Huttlin et al., 2010). We extracted TMT reporter ion intensities as those
of themost intense ions within a 0.03 Thwindow around the predicted reporter ion intensities in the collectedMS3 spectra. Only MS3
with an average signal-to-noise value of larger than 20 per reporter ion aswell aswith an isolation specificity (Ting et al., 2011) of larger
than 0.75 were considered for quantification. A two-step normalization of the protein TMT-intensities was performed by first normal-
izing the protein intensities over all acquired TMT channels for each protein based on the median average protein intensity calculated
for all proteins. To correct for slight mixing errors of the peptide mixture from each sample a median of the normalized intensities was
calculated from all protein intensities in each TMT channel and the protein intensities were normalized to the median value of these
median intensities.
Proteomics network and GO analysisTo visualize potential reciprocal and intertwined interactions among the TERRA proteome, data from iDRiP-MS biological replicates
was analyzed and the network was generated through the use of QIAGEN’s Ingenuity Pathway Analysis (IPA,QIAGEN Redwood
City,https://www.qiagenbioinformatics.com). Gene ontology (GO) term was analyzed by DAVID Bioinformatics Resources 6.7
(https://david.ncifcrf.gov/) (Huang et al., 2009a)
Immuno-FISHCells were cytospun, CSKT treated (10 mM PIPES, pH 6.8, 100 mM NaCl, 3 mMMgCl2, 0.3 M sucrose, 0.5% Triton X-100, adjust to
pH 6.8), and fixed in 4% paraformaldehyde and stored at 70% EtOH at �20�C. For immuno-RNA FISH, coverslips were blocked at
1%BSA/PBSwith 1mMEDTA and 0.8 U/ml of RNase inhibitor at 4�C for 1 hr. Cells were incubatedwith primary antibodies in blocking
Cell 170, 86–101.e1–e7, June 29, 2017 e6
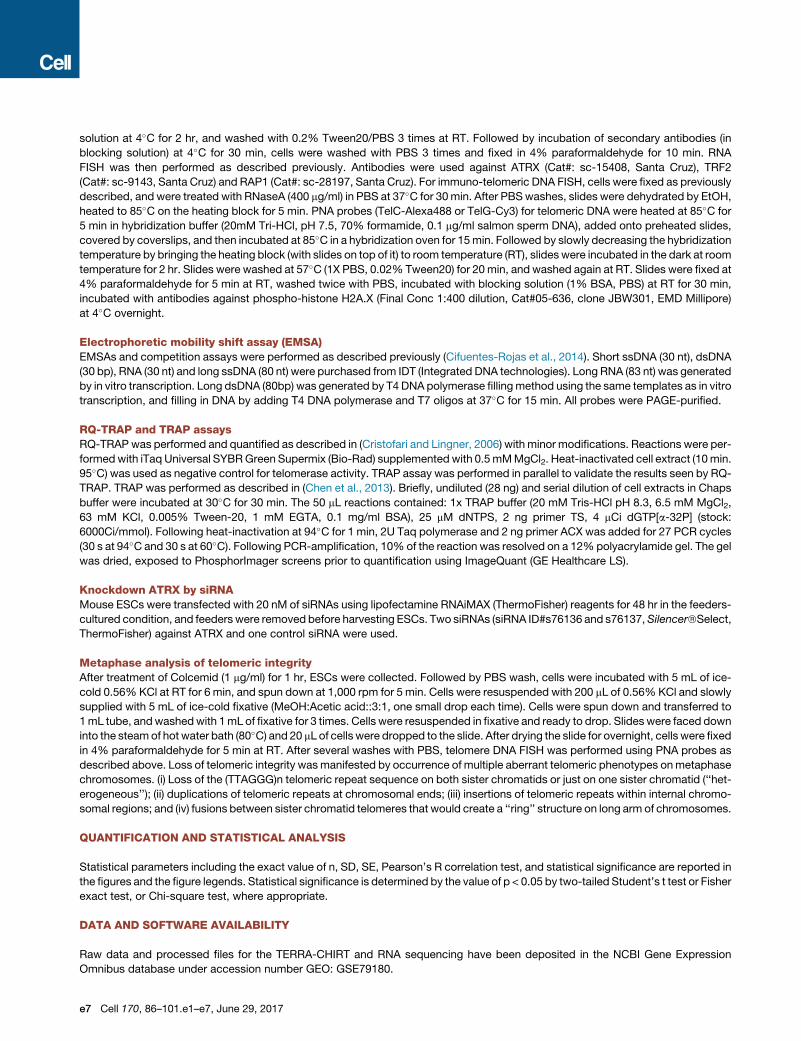
solution at 4�C for 2 hr, and washed with 0.2% Tween20/PBS 3 times at RT. Followed by incubation of secondary antibodies (in
blocking solution) at 4�C for 30 min, cells were washed with PBS 3 times and fixed in 4% paraformaldehyde for 10 min. RNA
FISH was then performed as described previously. Antibodies were used against ATRX (Cat#: sc-15408, Santa Cruz), TRF2
(Cat#: sc-9143, Santa Cruz) and RAP1 (Cat#: sc-28197, Santa Cruz). For immuno-telomeric DNA FISH, cells were fixed as previously
described, and were treated with RNaseA (400 mg/ml) in PBS at 37�C for 30min. After PBSwashes, slides were dehydrated by EtOH,
heated to 85�C on the heating block for 5 min. PNA probes (TelC-Alexa488 or TelG-Cy3) for telomeric DNA were heated at 85�C for
5 min in hybridization buffer (20mM Tri-HCl, pH 7.5, 70% formamide, 0.1 mg/ml salmon sperm DNA), added onto preheated slides,
covered by coverslips, and then incubated at 85�C in a hybridization oven for 15min. Followed by slowly decreasing the hybridization
temperature by bringing the heating block (with slides on top of it) to room temperature (RT), slides were incubated in the dark at room
temperature for 2 hr. Slides were washed at 57�C (1X PBS, 0.02% Tween20) for 20 min, and washed again at RT. Slides were fixed at
4% paraformaldehyde for 5 min at RT, washed twice with PBS, incubated with blocking solution (1% BSA, PBS) at RT for 30 min,
incubated with antibodies against phospho-histone H2A.X (Final Conc 1:400 dilution, Cat#05-636, clone JBW301, EMD Millipore)
at 4�C overnight.
Electrophoretic mobility shift assay (EMSA)EMSAs and competition assays were performed as described previously (Cifuentes-Rojas et al., 2014). Short ssDNA (30 nt), dsDNA
(30 bp), RNA (30 nt) and long ssDNA (80 nt) were purchased from IDT (Integrated DNA technologies). Long RNA (83 nt) was generated
by in vitro transcription. Long dsDNA (80bp) was generated by T4 DNA polymerase fillingmethod using the same templates as in vitro
transcription, and filling in DNA by adding T4 DNA polymerase and T7 oligos at 37�C for 15 min. All probes were PAGE-purified.
RQ-TRAP and TRAP assaysRQ-TRAP was performed and quantified as described in (Cristofari and Lingner, 2006) with minor modifications. Reactions were per-
formedwith iTaq Universal SYBRGreen Supermix (Bio-Rad) supplemented with 0.5mMMgCl2. Heat-inactivated cell extract (10min.
95�C) was used as negative control for telomerase activity. TRAP assay was performed in parallel to validate the results seen by RQ-
TRAP. TRAP was performed as described in (Chen et al., 2013). Briefly, undiluted (28 ng) and serial dilution of cell extracts in Chaps
buffer were incubated at 30�C for 30 min. The 50 mL reactions contained: 1x TRAP buffer (20 mM Tris-HCl pH 8.3, 6.5 mM MgCl2,
63 mM KCl, 0.005% Tween-20, 1 mM EGTA, 0.1 mg/ml BSA), 25 mM dNTPS, 2 ng primer TS, 4 mCi dGTP[a-32P] (stock:
6000Ci/mmol). Following heat-inactivation at 94�C for 1 min, 2U Taq polymerase and 2 ng primer ACX was added for 27 PCR cycles
(30 s at 94�C and 30 s at 60�C). Following PCR-amplification, 10%of the reaction was resolved on a 12%polyacrylamide gel. The gel
was dried, exposed to PhosphorImager screens prior to quantification using ImageQuant (GE Healthcare LS).
Knockdown ATRX by siRNAMouse ESCs were transfected with 20 nM of siRNAs using lipofectamine RNAiMAX (ThermoFisher) reagents for 48 hr in the feeders-
cultured condition, and feeders were removed before harvesting ESCs. Two siRNAs (siRNA ID#s76136 and s76137,Silencer�Select,
ThermoFisher) against ATRX and one control siRNA were used.
Metaphase analysis of telomeric integrityAfter treatment of Colcemid (1 mg/ml) for 1 hr, ESCs were collected. Followed by PBS wash, cells were incubated with 5 mL of ice-
cold 0.56% KCl at RT for 6 min, and spun down at 1,000 rpm for 5 min. Cells were resuspended with 200 mL of 0.56% KCl and slowly
supplied with 5 mL of ice-cold fixative (MeOH:Acetic acid::3:1, one small drop each time). Cells were spun down and transferred to
1mL tube, andwashedwith 1mL of fixative for 3 times. Cells were resuspended in fixative and ready to drop. Slides were faced down
into the steamof hot water bath (80�C) and 20 mL of cells were dropped to the slide. After drying the slide for overnight, cells were fixed
in 4% paraformaldehyde for 5 min at RT. After several washes with PBS, telomere DNA FISH was performed using PNA probes as
described above. Loss of telomeric integrity wasmanifested by occurrence of multiple aberrant telomeric phenotypes onmetaphase
chromosomes. (i) Loss of the (TTAGGG)n telomeric repeat sequence on both sister chromatids or just on one sister chromatid (‘‘het-
erogeneous’’); (ii) duplications of telomeric repeats at chromosomal ends; (iii) insertions of telomeric repeats within internal chromo-
somal regions; and (iv) fusions between sister chromatid telomeres that would create a ‘‘ring’’ structure on long arm of chromosomes.
QUANTIFICATION AND STATISTICAL ANALYSIS
Statistical parameters including the exact value of n, SD, SE, Pearson’s R correlation test, and statistical significance are reported in
the figures and the figure legends. Statistical significance is determined by the value of p < 0.05 by two-tailed Student’s t test or Fisher
exact test, or Chi-square test, where appropriate.
DATA AND SOFTWARE AVAILABILITY
Raw data and processed files for the TERRA-CHIRT and RNA sequencing have been deposited in the NCBI Gene Expression
Omnibus database under accession number GEO: GSE79180.
e7 Cell 170, 86–101.e1–e7, June 29, 2017
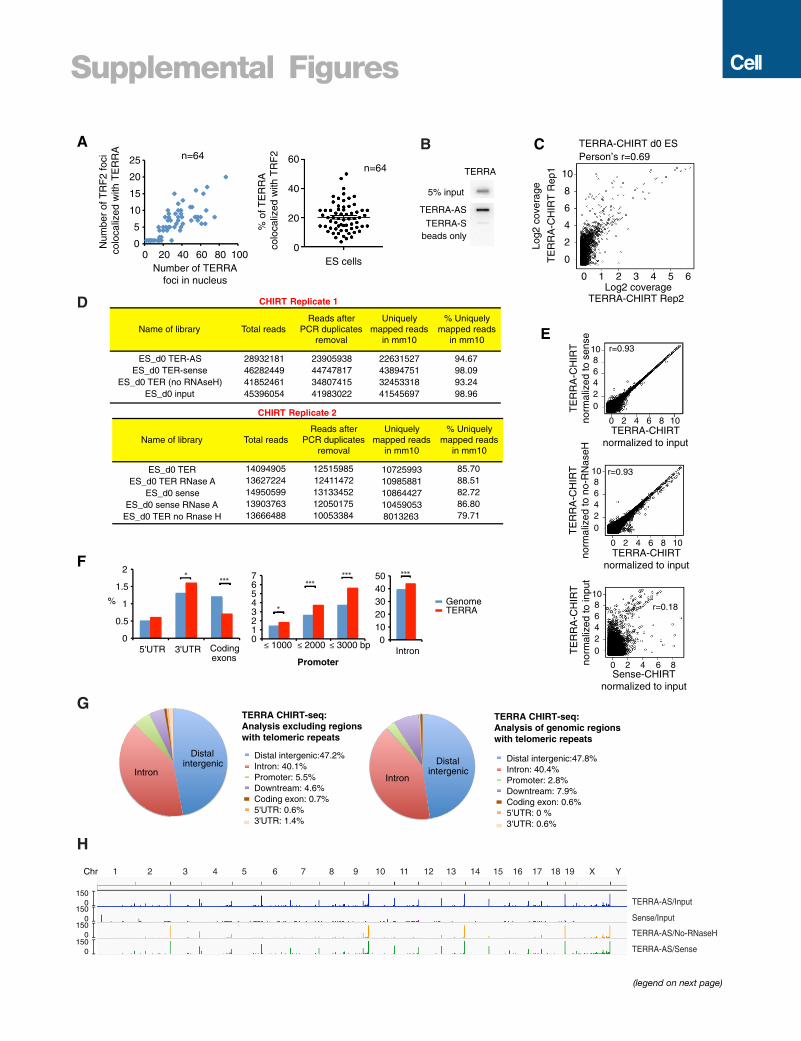
Supplemental Figures
B TERRA-CHIRT d0 ES
0 63 4 521
0
2
4
6
8
10
Log2 coverageTERRA-CHIRT Rep2
Log2
cov
erag
e
TE
RR
A-C
HIR
T R
ep1
Person’s r=0.69
Name of library Total readsReads after
PCR duplicates removal
Uniquely mapped reads
in mm10
% Uniquely mapped reads
in mm10
ES_d0 TER-AS 28932181 23905938 22631527 94.67ES_d0 TER-sense 46282449 44747817 43894751 98.09
ES_d0 TER (no RNAseH) 41852461 34807415 32453318 93.24ES_d0 input 45396054 41983022 41545697 98.96
Replicate 1
Name of library Total readsReads after
PCR duplicates removal
Uniquely mapped reads
in mm10
% Uniquely mapped reads
in mm10
ES_d0 TER 14094905 12515985 10725993 85.70ES_d0 TER RNase A 13627224 12411472 10985881 88.51
ES_d0 sense 14950599 13133452 10864427 82.72ES_d0 sense RNase A 13903763 12050175 10459053 86.80
ES_d0 TER no Rnase H 13666488 10053384 8013263 79.71
Replicate 2
CHIRT
CHIRT
Number of TERRAfoci in nucleus
Num
ber
of T
RF
2 fo
ci c
oloc
aliz
ed w
ith T
ER
RA
0
20
40
60
% o
f TE
RR
A
colo
caliz
ed w
ith T
RF
2ES cells
0
5
10
15
20
25
0 20 40 60 80 100
n=64n=64
A
Distal intergenic:47.2% Intron: 40.1%Promoter: 5.5%Downtream: 4.6%Coding exon: 0.7%5'UTR: 0.6%3'UTR: 1.4%
Distal intergenic
Intron
TERRA CHIRT-seq:Analysis excluding regionswith telomeric repeats
Distal intergenic:47.8% Intron: 40.4%Promoter: 2.8%Downtream: 7.9%Coding exon: 0.6%5'UTR: 0 %3'UTR: 0.6%
TERRA CHIRT-seq:Analysis of genomic regionswith telomeric repeats
Distal intergenic
Intron
C
E
F
TERRA
TERRA-AS
TERRA-Sbeads only
5% input
D
******
GenomeTERRA
******
0
0.5
1
1.5
2
5'UTR 3'UTR Coding exons
***
01020304050
Intron≤ 1000 ≤ 2000 ≤ 3000 bp
Promoter
01234567
*
*
%
G
0 2 4 6 8
TE
RR
A-C
HIR
Tno
rmal
ized
to in
put
246810
0
Sense-CHIRTnormalized to input
r=0.18
0 2 4 6 8 10
2468
10
0TE
RR
A-C
HIR
Tno
rmal
ized
to s
ense
TERRA-CHIRTnormalized to input
r=0.93
0 2 4 6 8 10TERRA-CHIRT
normalized to input
246810
0TE
RR
A-C
HIR
Tno
rmal
ized
to n
o-R
Nas
eH
r=0.93
%
Chr
TERRA-AS/Input
Sense/Input
TERRA-AS/No-RNaseH
TERRA-AS/Sense
1 2 3 4 5 6 7 8 9 10 11 12 13 14 15 16 17 18 19 X Y
0150
0150
0150
0150
H
(legend on next page)
Figure S1. TERRA CHIRT-Seq Statistics, Related to Figure 1
(A) TERRA colocalization counts with TRF2 for the data in Figure 1C. 414 out of 2014 TERRA foci (19.7%) were colocalized with TRF2 in mouse ESCs. n = number
of counted nuclei.
(B) RNA slotblot analysis showing that TERRA-AS specifically captured TERRA RNA by CHIRT. Total RNA was extracted from beads after probe hybridization
without RNase H elution.
(C) Scatterplot comparing Log2 coverages of biological replicates for TERRA CHIRT-seq analysis in ESCs. Pearson’s r was shown. Replicate 1 (Rep1) was
normalized with input. Replicate 2 (Rep2) was normalized to RNaseA pre-treated control.
(D) Read statistics for two biological replicates of the TERRA CHIRT-seq analysis.
(E) Scatterplot analysis comparing log2 coverages of TERRA CHIRT normalized using different methods. Pearson’s r shown.
(F) CEAS analysis shows significant over-representation of introns and noncoding regulatory regions. Exons are under-represented. ***p < 0.001; *p < 0.05 (one-
sided binomial test). The genome reference was obtained from the CHIRT input.
(G) CEAS analysis: Left panel, Pie chart showing relative representation of various genomic regions when the CHIRT analysis excludes genomic regions con-
taining telomeric repeats. Right panel, Pie chart showing relative representation of various genomic regions when the CHIRT analysis is performed on genomic
regions containing telomeric repeats.
(H) CHIRT-seq tracks showing TERRA enrichment at the ends of various chromosomes in female ESCs. Different normalization methods reveal similar results
(TERRA/input; TERRA/no RNase H; TERRA/sense). Note: TERRA-Sense CHIRT did not resemble TERRA-AS CHIRT.
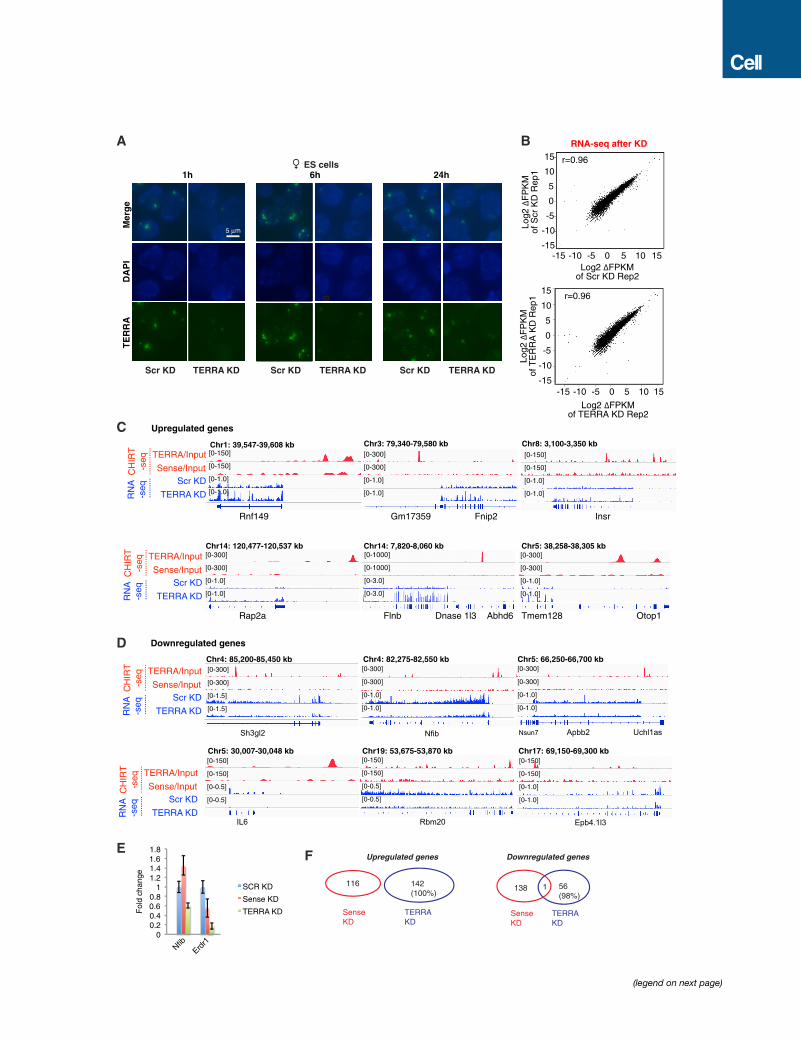
-15 150 5 10-5-10
0
-15
15
10
5
-5
-10Log2
ΔF
PK
Mof
Scr
KD
Rep
1
RNA-seq after KD
r=0.96
-15 150 5 10-5-10
0
-15
15
10
5
-5
-10
r=0.96
Log2
ΔF
PK
Mof
TE
RR
A K
D R
ep1
BA
[0-150]
[0-150]
[0-1.0]
[0-1.0]
Rnf149
Chr1: 39,547-39,608 kbTERRA/Input
Sense/InputCH
IRT
-seq
Scr KD
TERRA KDRN
A-s
eq
Upregulated genes
[0-300]
[0-300]
[0-1.0]
[0-1.0]
Fnip2Gm17359
Chr3: 79,340-79,580 kb[0-150]
[0-150]
[0-1.0]
[0-1.0]
Chr8: 3,100-3,350 kb
Insr
[0-300]
[0-300]
[0-1.0]
[0-1.0]
Rap2a
Chr14: 120,477-120,537 kbTERRA/Input
Sense/InputCH
IRT
-seq
Scr KD
TERRA KDRN
A-s
eq
[0-1000]
[0-1000]
[0-3.0]
[0-3.0]
Flnb Abhd6Dnase 1l3
Chr14: 7,820-8,060 kb[0-300]
[0-300]
[0-1.0]
[0-1.0]
Tmem128 Otop1
Chr5: 38,258-38,305 kb
Sh3gl2
Chr4: 85,200-85,450 kb [0-300]
[0-300]
[0-1.5]
[0-1.5]
[0-300]
[0-300]
[0-1.0]
[0-1.0]
Nfib
Chr4: 82,275-82,550 kb[0-300]
[0-300]
[0-1.0]
[0-1.0]
Apbb2 Uchl1asNsun7
Chr5: 66,250-66,700 kb
[0-150]
[0-150]
[0-0.5]
[0-0.5]
IL6
Chr5: 30,007-30,048 kb[0-150]
[0-150]
[0-0.5]
[0-0.5]
Rbm20
Chr19: 53,675-53,870 kb[0-150]
[0-150]
[0-1.0]
[0-1.0]
Epb4.1l3
Chr17: 69,150-69,300 kb
TERRA/Input
Sense/InputCH
IRT
-seq
Scr KD
TERRA KDRN
A-s
eq
TERRA/Input
Sense/InputCH
IRT
-seq
Scr KD
TERRA KDRN
A-s
eq
Downregulated genes
C
1h 6h 24h
TE
RR
AD
AP
IM
erg
e
B
ES cells
TERRA KDScr KD
5 µm
TERRA KDScr KD TERRA KDScr KD
D
Log2 ΔFPKMof TERRA KD Rep2
Log2 ΔFPKMof Scr KD Rep2
00.20.40.60.8
11.21.41.61.8
NfibErd
r1
SCR KD
Sense KD
TERRA KDFol
d ch
ange
E F
1142(100%)
56(98%)
116 138
Upregulated genes Downregulated genes
Sense KD
TERRA KD
TERRA KD
Sense KD
(legend on next page)

Figure S2. RNA-Seq Analysis after TERRA Knockdown by LNA Gapmers, Related to Figure 2
(A) RNA FISH confirming TERRA depletion after 1, 6, and 24 hr of LNA treatment in ESCs.
(B) Scatterplots comparing log2 FPKM values show good correlation between biological replicates of RNA-seq in both Scr KD and TERRA KD in ESCs. Pearson’s
r is shown.
(C) CHIRT-seq tracks (red) for TERRA binding sites near differentially upregulated genes after TERRA KD in ESCs. RNA-seq coverage is FPM (fragments per
million)-normalized and tracks are shown in blue.
(D) CHIRT-seq tracks (red) for TERRA binding sites near differentially downregulated genes after TERRA KD in ESCs. RNA-seq coverage is FPM (fragments per
million)-normalized and tracks are shown in blue.
(E) Quantitative RT-qPCR of Nfib and Erdr1 expression after Scr, sense, or TERRA LNA knockdown.
(F) RNA-seq analysis of sense LNA knockdown controls show largely non-overlapping changes in comparison to TERRA-specific knockdown.
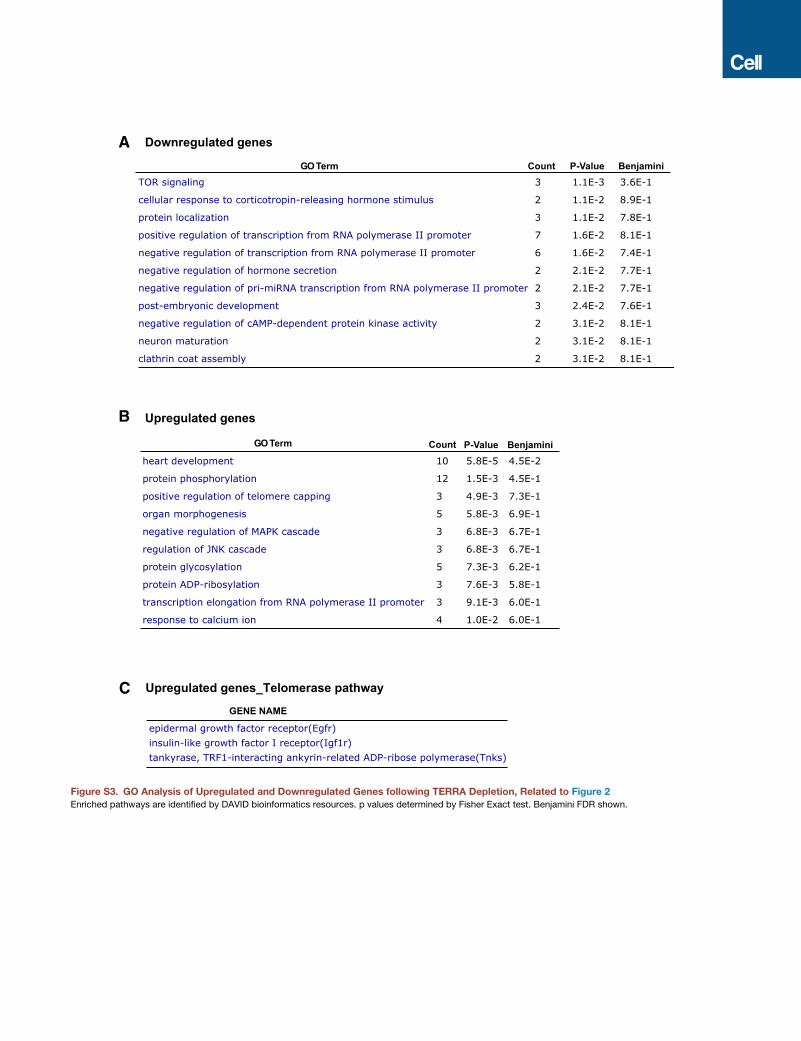
Count P-Value BenjaminiTOR signaling 3 1.1E-3 3.6E-1
cellular response to corticotropin-releasing hormone stimulus 2 1.1E-2 8.9E-1
protein localization 3 1.1E-2 7.8E-1
positive regulation of transcription from RNA polymerase II promoter 7 1.6E-2 8.1E-1
negative regulation of transcription from RNA polymerase II promoter 6 1.6E-2 7.4E-1
negative regulation of hormone secretion 2 2.1E-2 7.7E-1
negative regulation of pri-miRNA transcription from RNA polymerase II promoter 2 2.1E-2 7.7E-1
post-embryonic development 3 2.4E-2 7.6E-1
negative regulation of cAMP-dependent protein kinase activity 2 3.1E-2 8.1E-1
neuron maturation 2 3.1E-2 8.1E-1
clathrin coat assembly 2 3.1E-2 8.1E-1
GO Term
Downregulated genesA
Count P-Value Benjaminiheart development 10 5.8E-5 4.5E-2
protein phosphorylation 12 1.5E-3 4.5E-1
positive regulation of telomere capping 3 4.9E-3 7.3E-1
organ morphogenesis 5 5.8E-3 6.9E-1
negative regulation of MAPK cascade 3 6.8E-3 6.7E-1
regulation of JNK cascade 3 6.8E-3 6.7E-1
protein glycosylation 5 7.3E-3 6.2E-1
protein ADP-ribosylation 3 7.6E-3 5.8E-1
transcription elongation from RNA polymerase II promoter 3 9.1E-3 6.0E-1
response to calcium ion 4 1.0E-2 6.0E-1
Upregulated genesB
GO Term
GENE NAME
epidermal growth factor receptor(Egfr)insulin-like growth factor I receptor(Igf1r)tankyrase, TRF1-interacting ankyrin-related ADP-ribose polymerase(Tnks)
Upregulated genes_Telomerase pathwayC
Figure S3. GO Analysis of Upregulated and Downregulated Genes following TERRA Depletion, Related to Figure 2
Enriched pathways are identified by DAVID bioinformatics resources. p values determined by Fisher Exact test. Benjamini FDR shown.
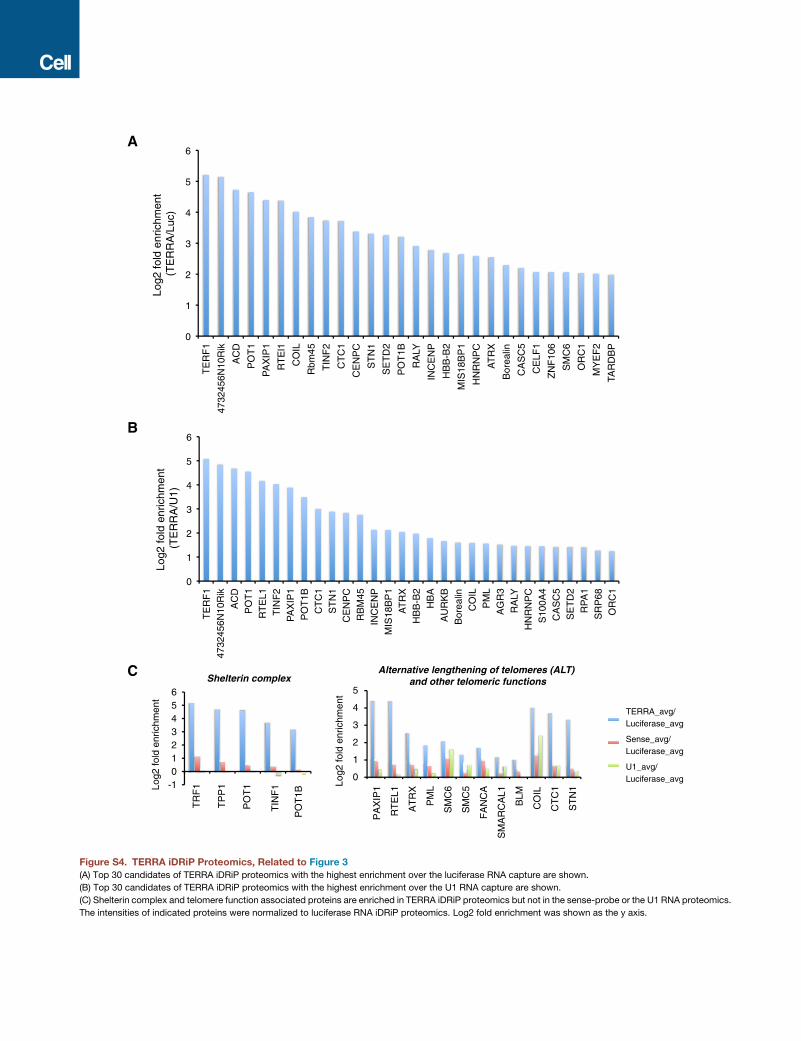
ALo
g2 fo
ld e
nric
hmen
t (
TE
RR
A/L
uc)
Log2
fold
enr
ichm
ent
(T
ER
RA
/U1)
B
0
1
2
3
4
5
6
TE
RF
1
4732
456N
10R
ik
AC
D
PO
T1
PA
XIP
1
RT
El1
CO
IL
Rbm
45
TIN
F2
CT
C1
CE
NP
C
ST
N1
SE
TD
2
PO
T1B
RA
LY
INC
EN
P
HB
B-B
2
MIS
18B
P1
HN
RN
PC
AT
RX
Bor
ealin
CA
SC
5
CE
LF1
ZN
F10
6
SM
C6
OR
C1
MY
EF
2
TAR
DB
P
0
1
2
3
4
5
6
TE
RF
147
3245
6N10
Rik
AC
DP
OT
1R
TE
L1T
INF
2P
AX
IP1
PO
T1B
CT
C1
ST
N1
CE
NP
CR
BM
45IN
CE
NP
MIS
18B
P1
AT
RX
HB
B-B
2H
BA
AU
RK
BB
orea
linC
OIL
PM
LA
GR
3R
AL Y
HN
RN
PC
S10
0A4
CA
SC
5S
ET
D2
RP
A1
SR
P68
OR
C1
C
-10123456
TERRA_avg/Luciferase_avg
Sense_avg/Luciferase_avg
U1_avg/Luciferase_avg0
1
2
3
4
5
PA
XIP
1
RT
EL1
AT
RX
PM
L
SM
C6
SM
C5
FA
NC
A
SM
AR
CA
L1
BLM
CO
IL
CT
C1
ST
N1Lo
g2 fo
ld e
nric
hmen
t
Log2
fold
enr
ichm
ent
TR
F1
PO
T1B
TIN
F1
PO
T1
TP
P1
Shelterin complexAlternative lengthening of telomeres (ALT)
and other telomeric functions
Figure S4. TERRA iDRiP Proteomics, Related to Figure 3
(A) Top 30 candidates of TERRA iDRiP proteomics with the highest enrichment over the luciferase RNA capture are shown.
(B) Top 30 candidates of TERRA iDRiP proteomics with the highest enrichment over the U1 RNA capture are shown.
(C) Shelterin complex and telomere function associated proteins are enriched in TERRA iDRiP proteomics but not in the sense-probe or the U1 RNA proteomics.
The intensities of indicated proteins were normalized to luciferase RNA iDRiP proteomics. Log2 fold enrichment was shown as the y axis.
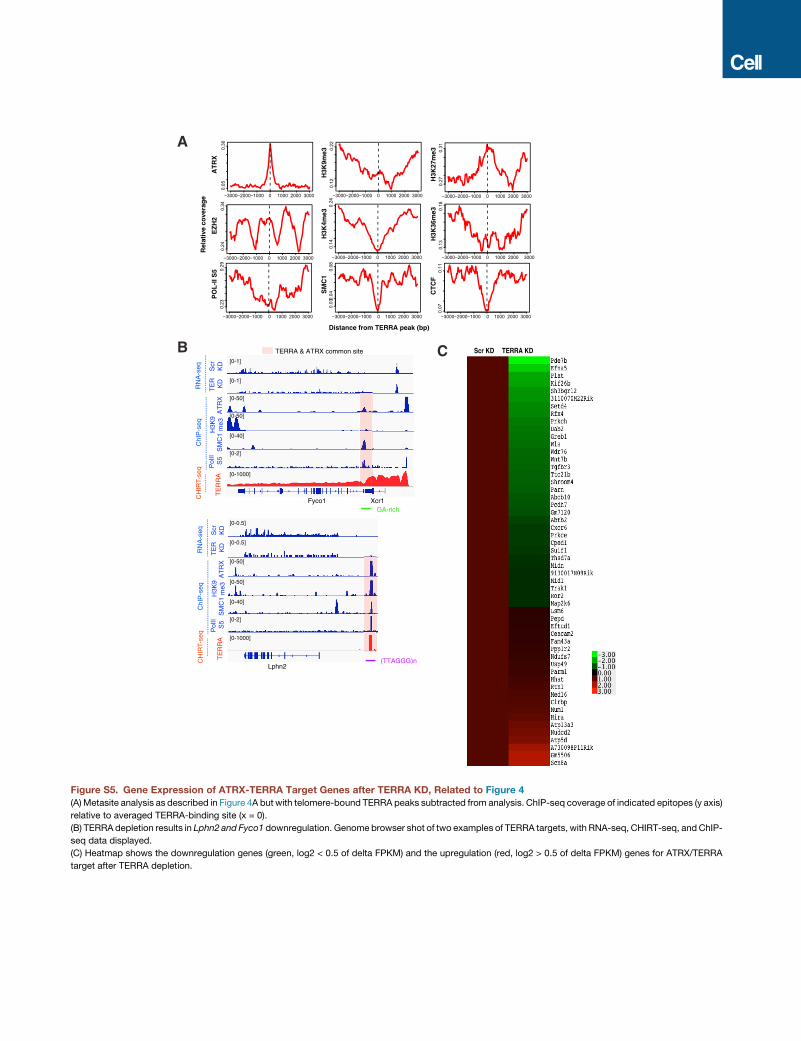
B
ChI
P-s
eq
TE
RR
A
CH
IRT-
seq
AT
RX
SM
C1
H3K
9m
e3P
olII
S5
RN
A-s
eq Scr
KD
TE
R
KD
Fyco1 Xcr1
[0-50]
[0-40]
[0-50]
[0-2]
[0-1000]
[0-1]
[0-1]
Lphn2
[0-0.5]
[0-0.5]
[0-50]
[0-40]
[0-50]
[0-2]
[0-1000]
A
ChI
P-s
eq
TE
RR
A
CH
IRT-
seq
AT
RX
SM
C1
H3K
9m
e3P
olII
S5
RN
A-s
eq Scr
KD
TE
R
KD
Scr KD TERRA KD
(TTAGGG)n
GA-rich
TERRA & ATRX common site
−3000−2000−1000 0 1000 2000 3000
0.07
0.11
−3000−2000−1000 0 1000 2000 3000
0.12
0.22
−3000−2000−1000 0 1000 2000 3000
0.27
0.31
−3000−2000−1000 0 1000 2000 3000
0.05
0.30
−3000−2000−1000 0 1000 2000 3000
0.14
0.24
−3000−2000−1000 0 1000 2000 3000
0.23
0.29
−3000−2000−1000 0 1000 2000 3000
0.03
0.04
0.08
−3000−2000−1000 0 1000 2000 3000
0.13
0.18
−3000−2000−1000 0 1000 2000 3000
0.24
0.34
H3K
9me3
H3K
27m
e3
H3K
4me3
H3K
36m
e3
PO
L-l
I S5
EZ
H2
SM
C1
CT
CF
AT
RX
Distance from TERRA peak (bp)
Rel
ativ
e co
vera
ge
C
Figure S5. Gene Expression of ATRX-TERRA Target Genes after TERRA KD, Related to Figure 4
(A) Metasite analysis as described in Figure 4A but with telomere-bound TERRA peaks subtracted from analysis. ChIP-seq coverage of indicated epitopes (y axis)
relative to averaged TERRA-binding site (x = 0).
(B) TERRA depletion results in Lphn2 and Fyco1 downregulation. Genome browser shot of two examples of TERRA targets, with RNA-seq, CHIRT-seq, and ChIP-
seq data displayed.
(C) Heatmap shows the downregulation genes (green, log2 < 0.5 of delta FPKM) and the upregulation (red, log2 > 0.5 of delta FPKM) genes for ATRX/TERRA
target after TERRA depletion.
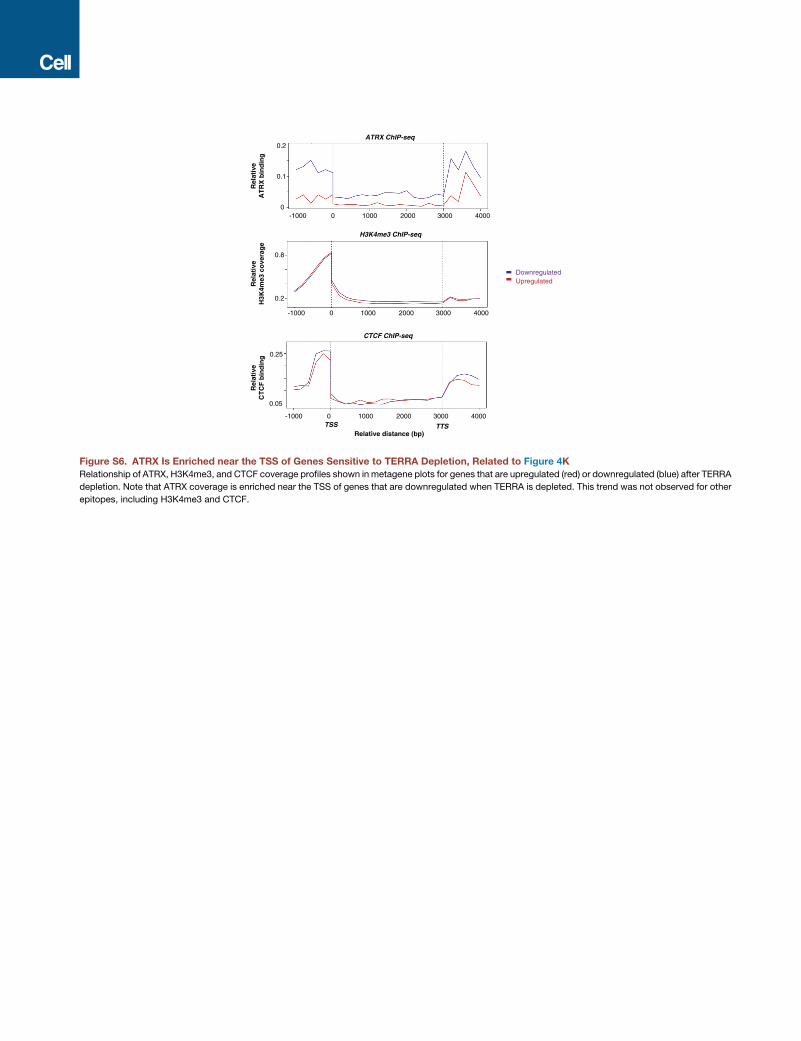
0 30001000 2000-1000 40000
0.2
0.1
0.2
0.8
0 30001000 2000-1000 4000
0 30001000 2000-1000 4000
0.05
0.25
DownregulatedUpregulated
Relative distance (bp)TSS TTS
ATRX ChIP-seq
H3K4me3 ChIP-seq
CTCF ChIP-seq
Rel
ativ
eA
TR
X b
ind
ing
Rel
ativ
eH
3K4m
e3 c
ove
rag
eR
elat
ive
CT
CF
bin
din
g
Figure S6. ATRX Is Enriched near the TSS of Genes Sensitive to TERRA Depletion, Related to Figure 4K
Relationship of ATRX, H3K4me3, and CTCF coverage profiles shown in metagene plots for genes that are upregulated (red) or downregulated (blue) after TERRA
depletion. Note that ATRX coverage is enriched near the TSS of genes that are downregulated when TERRA is depleted. This trend was not observed for other
epitopes, including H3K4me3 and CTCF.
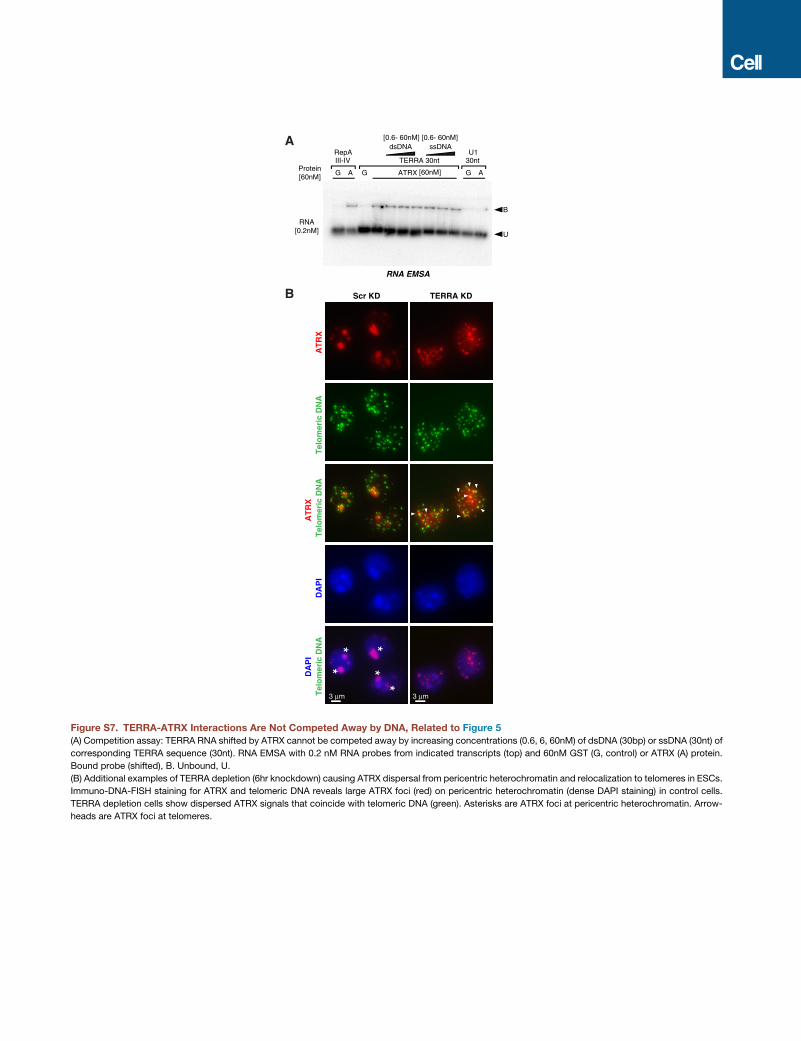
G A
RepAIII-IV
G A
U130ntTERRA 30nt
G ATRX
dsDNA ssDNA
[60nM]
[0.6- 60nM]
RNA[0.2nM]
B
U
Protein[60nM]
[0.6- 60nM]
RNA EMSA
TERRA KDScr KD
Tel
om
eric
DN
AA
TR
X
3 µm
**
**
*
3 µm
AT
RX
Tel
om
eric
DN
AD
AP
ID
AP
IT
elo
mer
ic D
NA
A
B
Figure S7. TERRA-ATRX Interactions Are Not Competed Away by DNA, Related to Figure 5
(A) Competition assay: TERRA RNA shifted by ATRX cannot be competed away by increasing concentrations (0.6, 6, 60nM) of dsDNA (30bp) or ssDNA (30nt) of
corresponding TERRA sequence (30nt). RNA EMSA with 0.2 nM RNA probes from indicated transcripts (top) and 60nM GST (G, control) or ATRX (A) protein.
Bound probe (shifted), B. Unbound, U.
(B) Additional examples of TERRA depletion (6hr knockdown) causing ATRX dispersal from pericentric heterochromatin and relocalization to telomeres in ESCs.
Immuno-DNA-FISH staining for ATRX and telomeric DNA reveals large ATRX foci (red) on pericentric heterochromatin (dense DAPI staining) in control cells.
TERRA depletion cells show dispersed ATRX signals that coincide with telomeric DNA (green). Asterisks are ATRX foci at pericentric heterochromatin. Arrow-
heads are ATRX foci at telomeres.


