Embed Size (px)
Citation preview
209K.J. Carlson and D. Marchi (eds.), Reconstructing Mobility: Environmental, Behavioral, and Morphological Determinants, DOI 10.1007/978-1-4899-7460-0_12,© Springer Science+Business Media New York 2014
Abstract Inferences about Neandertal home range sizes have historically been reconstructed with reference to lithic raw material transport distances. Here we use data on northern latitude social carnivores to predict home range sizes for Neandertal groups. Given that Neandertals must have relied heavily on animal protein and fat in the plant food-poor environments of Pleistocene Europe, their home range sizes and levels of logistical mobility were likely largely determined by prey abundance and distribution. We use the gray wolf (Canis lupus) to develop a model that relates climatic variables and predator group aggregate mass to home range size. Pack size data were combined with average wolf mass values to produce mass-specific terri-tory sizes (in km2 kg−1), which in turn allowed for the prediction of home range areas for Neandertal groups of varying sizes. Results indicate that even at fairly small social group sizes (less than 33 individuals) Neandertals likely required and maintained large territories (≈1,400–5,400 km2), which is consistent with results of studies of lithic raw material procurement patterns. The concordance between these two types of estimates lends support to the idea that lithic raw material procurement was embedded in subsistence mobility in the European Mousterian.
Keywords Wolf • Home range • Mousterian • Late Pleistocene • Paleoanthropology
Chapter 12Territory Size in Canis lupus: Implications for Neandertal Mobility
Christopher S. Walker and Steven E. Churchill
C.S. Walker (*) Department of Evolutionary Anthropology, Duke University, Biological Sciences Building, Box 90383, Durham, NC 27708, USAe-mail: [email protected]
S.E. Churchill Department of Evolutionary Anthropology, Duke University, Biological Sciences Building, Box 90383, Durham, NC 27708, USA
Evolutionary Studies Institute, University of the Witwatersrand, Private Bag 3, Wits 2050, South Africae-mail: [email protected]
210
12.1 Introduction
Mobility is arguably the key variable in the adaptive strategies of foraging people, as it is through the management of camp and individual movement across the land-scape that hunter-gatherers deal with problems of biodepletion and temporal and geographic patchiness of resources, and through which they exploit the resource structure of their environment (Binford 1980, 2001; Kelly 1983). Two key sets of questions have emerged in studies of Neandertal mobility: (1) what combination of camp moves (residential mobility) and individual movement (logistical mobility) did Neandertals commonly employ to exploit resources in their foraging territories (i.e., their “home ranges”), and (2) how large were Neandertal home ranges, how variable was territory size across time and space, and what factors conditioned this variability?
Despite focused research attention, little consensus has emerged about Neandertal settlement systems. Site size, faunal indicators of season of site occupation, infer-ences about site function, lithic indicators of hunting intensity, and lithic raw mate-rial procurement distances have all been brought to bear on the question. These indicators suggest to some that Neandertals employed a settlement system based on high residential and low logistical mobility [a circulating (Wallace and Shea 2006) or “forager” (Binford 1980) system], at least at some times and in some places (Mellars 1996; Çep and Waiblinger 2001; Zilhão 2001; Martínez-Moreno et al. 2004). However, these same indicators suggest that, at certain times and places, Neandertals might have been employing a radiating mobility system (Wallace and Shea 2006) also known as a “logistical collector” system (Binford 1980) involving few residential moves and high logistical mobility (Lieberman 1993; Lieberman andShea 1994; Patou-Mathis 2000; Marks and Chabai 2001; Wallace and Shea 2006). Still others detect evidence of mixed strategies, seasonally alternating between cir-culating and radiating strategies (Richter 2001), or systems that were complex, tem-porally variable, or impossible to discern based on current evidence (see Lieberman1998; Hovers 2001; Adler and Tushabramishvili 2004; Rivals et al. 2009).
For modern human groups, resource distribution and hunting dependence are central to understanding ranging behavior, with sparse resources and high reliance on hunting both increasing potential home range sizes (Roebroeks 2003). Since these ecological parameters are unknown for Mousterian foragers (although reason-able inferences can be made: see below), indirect proxies such as raw material trans-port distances have been used to infer territory size. Raw material transport distances are hypothesized to reflect territory use when raw material procurement is embed-ded in subsistence and settlement systems (see Binford 1979; Milliken 1988), as is believed to be the case for Neandertals (Kuhn 1995). The maximum transport dis-tance of a material from source to camp has thus been used as an indicator of poten-tial maximum territory size (Fernandes et al. 2008), and the prevalence of resources from a given distance has been taken as a reflection of home range size and mobility. Mousterian assemblages, particularly in western Europe, tend to be predominantly made on very local (within about 5 km of the site: Mellars 1996) sources, although
C.S. Walker and S.E. Churchill
211
most sites contain a small but significant portion of artifacts produced from raw materials sourced at intermediate distances (5–30 km: Mellars 1996; Kuhn 2011). However, materials procured from more distant locations (100–200 km at some Neandertal sites: Conard and Adler 1997; Féblot-Augustins 1997; Slimak and Giraud 2007; Spinapolice 2012), although rare, have been taken by some to suggest the maintenance of expansive territories among Mousterian foragers, at least in northern and central Europe (taking into account zooarcheological data as well: Féblot-Augustins 1993; Patou-Mathis 2000). Still, the preponderance of local and near-local flint in Mousterian assemblages suggests moderately-sized territories and low mobility overall (Féblot-Augustins 1993; Mellars 1996; Fernandes et al. 2008; Fernández-Laso et al. 2011). High energy budgets, combined with a high energetic cost of transport and slow walking speeds (Steudel-Numbers and Tilkens 2004; Wall-Scheffler 2014), may have also constrained the ability of Neandertals to main-tain large territories (see MacDonald et al. 2009). In Marine Isotope Stage (MIS) 5a unit 1 of Baume-Vallée (south-central France), flint was found from as far away as 46 km, suggesting a potential territory of 6,644 km2 (Fernandes et al. 2008). Similarly, at the nearby MIS 3 site of Le Rond de Saint-Arcons, raw materials wereimported from up to 40 km away, indicating a potential maximum territory area of 5,024 km2 (Fernandes et al. 2008). A larger territory—13,000 km2—has been sug-gested for Neandertals of the Aquitaine Basin (south-western France) based on raw materials in MIS 7-6 levels at Vaufrey and other sites (Geneste 1988; Féblot- Augustins 1993). At the (likely MIS 3) eastern European site of Karabi Tamchin in Crimea, the majority of flint was harvested from 25 km away, implying an approxi-mate territory of only 1,962 km2 (Burke 2006). However, Burke (2006) proposes that Crimean Neandertals needed the entire 27,000 km2 Crimean peninsula to har-vest their mobile primary prey (Equus hydruntinus). This territory estimate, how-ever, is based on population sizes between 175 (the lowest viable breeding population: Wobst 1974) and 300 Neandertals (an estimate derived from Steele’s (1996) equation predicting range size from group size based on carnivore and pri-mate models), and thus are not reflective of the home range size of a smaller social group within that population. In central and north-central Europe, where raw mate-rial transport distances are typically larger, flint movement generally suggests terri-tory sizes on the order of 10,000 km2 [for example, at Raj Cave (Poland) and Külna (Czech Republic): Féblot-Augustins 1993]. Even the largest of these estimates are moderate in the context of more recent, comparable hunter-gatherer groups. Nunamiut Eskimo and Crow Indian groups, both of which relied primarily on hunt-ing of terrestrial game (87 and 80 % of total diet, respectively), exploited territories upwards of 60,000 km2 (Kelly 1983). Other northern latitude groups that relied more heavily on marine resources, such as the Baffinland Inuit (25,000 km2) and Netsilingmiut (6,000 km2), utilized somewhat smaller, but still sizeable, territories. Given a diet with moderately high to high dependency on meat and fat (see Kuhn and Stiner 2006; Speth 2012), one might expect home range sizes closer to those observed in modern northern latitude foragers who were consuming mostly terrestrial game (although the modern groups may have existed at larger sizes: see Kelly 1995).
12 Territory Size in Canis lupus: Implications for Neandertal Mobility
212
Morphologically, Neandertals exhibit high levels of lower limb long bone diaphyseal robusticity (but not outside the norm for highly-mobile modern human foragers), which has been interpreted by some to reflect high mobility (Trinkaus 1983a, b). Might this suggest that they were exploiting large territories?
Carnivores have also been used to model Neandertal territory size, which results in what seem to be unrealistically small estimates (ranging from 834 km2 for a group of 25–7,356 km2 for a population of 300: Steele 1996). Data on actual mobil-ity in carnivores (such as day range sizes), however, is scarce and, despite efforts to empirically delineate the determinants of carnivore mobility (Gittleman and Harvey 1982; Carbone et al. 2005), the resulting models are problematic because (1) they require input variables which are highly variable across space and which, for Pleistocene Eurasia, would themselves be highly estimated; (2) they generally involve proportional equations, but lack proportionality constants, such that direct estimates are not obtainable; and (3) the results are generally applicable only at a broad interspecific scale (since the empirical relationships are determined on carni-vores that range in size over orders of magnitude). This latter concern is perhaps the most troubling, since the large intraspecific variation in mobility observed in some of the larger-bodied species (Gittleman and Harvey 1982; Höner et al. 2005; Jędrzejewski et al. 2007) causes the observed interspecific relationships to break-down at the family taxonomic level and below. As with humans, mobility is a vari-able that can be adjusted by carnivores to adapt to local ecological factors, and as with humans, this variability makes it difficult to characterize the behavior of any given species, even within a given biome. Consequently, any carnivore models of Neandertal mobility are, at best, tools of estimation.
Nevertheless, there are some noteworthy observations from carnivore studies with potential ramifications for understanding Neandertal mobility. First, across the order Carnivora, home range size varies positively with metabolic need (and thus body size) and with the proportion of meat in the diet (Gittleman and Harvey 1982). Accordingly, we can expect relatively large mammals like the Neandertals, with a moderately- to heavily- terrestrial animal-based diet (see Kuhn and Stiner 2006), to have had to range widely to sustain themselves. Second, in both lions and wolves, it has been shown that territory sizes and core areas vary inversely with the encounter rates of ungulates (Gittleman and Harvey 1982; Jędrzejewski et al. 2007). Although primary productivity decreased during colder climatic cycles in the Pleistocene, attendant changes in plant biomass structure (specifically, a reduction in allocation of primary productivity to inedible supportive structures), as woodland gave way to open steppe, would have increased animal production. Thus, Neandertal territory size and mobility (as well as those of the other members of the large-bodied carni-vore guild) would likely have decreased during colder, more open conditions. Finally, following the observation by Carbone and Gittleman (2002) that it takes a standing crop of 10,000 kg of prey to support 90 kg of carnivore, regardless of predator body size, there must exist a relationship between the aggregate mass of a carnivore group, secondary biomass in prey species, and territory size. A similar relationship would be expected among Neandertals, although the extent to which they were feeding at a lower trophic level would weaken this relationship. Following this logic, the aim of
C.S. Walker and S.E. Churchill
213
this paper is to construct a new model for Neandertal territory size based upon Canis lupus, one of the primary large-bodied carnivores of northern latitudes, that incorpo-rates environmental variables and that, consequently, can be used as a predictive tool across the entirety of the Neandertal range and climatic events. Note that this model is based on the empirical relationship between prey biomass and predator biomass, across all carnivores, and is, thus, robust to any potential differences between wolves and Neandertals in hunting tactics or prey choice.
12.2 Gray Wolf Ecology and Behavior
Though nonhuman primates are the closest living relatives of the genus Homo, eco-logical differences between extant nonhuman primates and extinct hominins have led some to suggest that the best models for hominid biogeography are social carni-vores, a group that typically exhibits high habitat tolerance (Schaller and Lowther1969). Behavioral similarities between wolves and Pleistocene hominins, including a varied diet, social flexibility, and a capacity for endurance locomotion, make Canis a particularly compelling comparative genus (Arcadi 2006). Of the extant members of Canis, the gray wolf (C. lupus) most closely fills the niche once occu-pied by Neandertals and is used here as the model species. Like Neandertals, wolvesoccupy northern latitudes, can survive in both extreme cold and milder climates, prey predominately on large ungulates, and exhibit social flexibility (see Arcadi 2006; Kuhn and Stiner 2006).
Gray wolves are endurance hunters, known to travel as far as 200 km in a day in search of prey (though average 20–30 km), and up to 20 km actively pursuing prey (Mech 1970; Mech and Korb 1978; Arcadi 2006). They are capable of sustained trotting and average 8.7 km h−1 during travel (Mech 1994). Moderate-to large-sized game such as deer, moose, and bison form the bulk of the gray wolf diet; however, gray wolves have also been known to prey upon smaller game such as mice, rabbit, and fish, and will eat plant matter as well (Mech and Peterson 2003; Peterson and Ciucci 2003). When prey is abundant, gray wolves prefer juvenile or elderly large game and typically only resort to prime-aged adult large game when prey choice is limited (Fritts and Mech 1981). Gray wolves can take a diversity of vertebrate prey due to social flexibility in hunting group size and their relatively small body size (Arcadi 2006). Thus, an individual gray wolf is small enough to subsist upon small prey, but multiple wolves can join together to hunt larger animals. Bears are the primary competition for gray wolves with specific species varying by location. Smaller bears are typically dominated by a pack of gray wolves; however, gray wolves are often subordinate to more massive bears such as larger individuals of Ursus arctos (Ballard et al. 2003). Gray wolves also overlap with felines such as mountain lions and lynx in many areas, but, as smaller-bodied solitary animals, they pose less of a threat than bears and, further, as both opportunistic scavengers and hunters, gray wolves also often compete with scavengers ranging from birds to foxes to coyotes (Ballard et al. 2003).
12 Territory Size in Canis lupus: Implications for Neandertal Mobility
214
Like extant primates (and, most likely, extinct hominins), wolves and othercanids exhibit flexibility with regard to social dynamics, including group composi-tion and size (Arcadi 2006). Typical gray wolf packs range between 5 and 10 indi-viduals, but can balloon to upwards of 20 individuals (Fuller et al. 2003). Numerous group types have been observed, including all male groups, single male/single female groups, large fission/fusion groups, and polygynous groups (Mech and Boitani 2003). As in humans, both sexes disperse in gray wolves (Lehman et al.1992; Hill et al. 2011).
Gray wolf territory size is highly variable, ranging from just a few square kilome-ters to tens of thousands of square kilometers (US Fish and Wildlife Service 2008). For the majority of carnivores, territory size increases with body mass and the amount of meat in the diet (Gittleman and Harvey 1982). Studies specific to gray wolf home ranges have generally found correlations between territory size and vari-ables relating to prey distribution (Van Ballenberghe et al. 1975; Fritts and Mech 1981; Messier 1985; Fuller et al. 1992; Ballard et al. 1997; Jędrzejewski et al. 2007). Fuller and colleagues (1992) found that wolf territory size is, as might be expected, negatively correlated with increasing ungulate density. Greater ungulate densities result in less travel required to find prey and, consequently, smaller ranges. Others have pointed to moose density, specifically, as the primary determinant of pack size, and, in turn, territory size (Messier 1985). Similarly, Van Ballenberghe and colleagues (1975) note a correlation between high prey density, large packs, and small territories. Some research, however, suggests that pack size and territory size are not correlated and that latitude (a proxy inversely related to terrestrial ecosystem productivity) is the single best predictor of territory size in gray wolves (Jędrzejewski et al. 2007). Alternative findings include a negative correlation between prey density and dispersal events (Fritts and Mech 1981) and a positive correlation between ter-ritory size and prey migration (Ballard et al. 1997). Not only is territory size smaller when prey are abundant, but new, typically small, territories are formed during times of plenty (Fritts and Mech 1981). Further, while gray wolves do not commonly fol-low the migrations of prey such as caribou, they will pursue migrating herds during periods of low prey density (Ballard et al. 1997). This creates a temporary, yet dra-matic, spike in range and can lead to new territory formation (Ballard et al. 1997). Lastly, regardless of territory size, within a given normal (nonmigratory) territory,often a more commonly used core territory exists (Jędrzejewski et al. 2007).
As a starting point, we might predict that mass-specific territory size (that is, the area required to support one kilogram of wolf) is inversely proportional to prey biomass density, and that prey biomass density will account for most of the variance in wolf territory size once pack size (and thus pack aggregate mass) is controlled for. We might also expect that climatic variables (mean winter temperature and precipitation) and geography (latitude), as a proxy measure of environmental vari-ables, will be highly intercorrelated with prey biomass and will fall out of the model. Assuming that a significant relationship between prey biomass density, wolf pack aggregate mass, and territory size can be established, we can then use this relationship
C.S. Walker and S.E. Churchill
215
to predict the territory sizes of Neandertal social groups of varying sizes (varying aggregate mass) living in varied prey biomass densities.
12.3 Materials and Methods
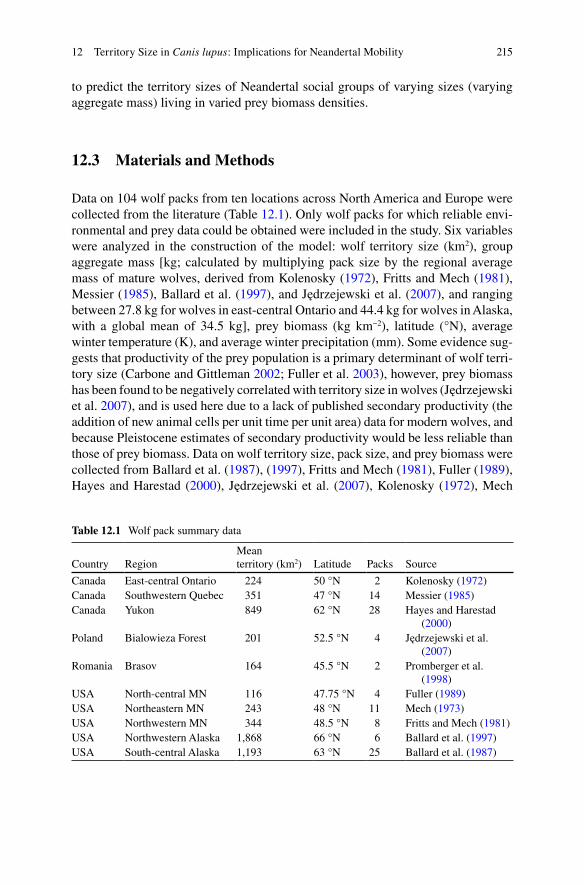
Data on 104 wolf packs from ten locations across North America and Europe were collected from the literature (Table 12.1). Only wolf packs for which reliable envi-ronmental and prey data could be obtained were included in the study. Six variables were analyzed in the construction of the model: wolf territory size (km2), group aggregate mass [kg; calculated by multiplying pack size by the regional average mass of mature wolves, derived from Kolenosky (1972), Fritts and Mech (1981), Messier (1985), Ballard et al. (1997), and Jędrzejewski et al. (2007), and ranging between 27.8 kg for wolves in east-central Ontario and 44.4 kg for wolves in Alaska, with a global mean of 34.5 kg], prey biomass (kg km−2), latitude (°N), average winter temperature (K), and average winter precipitation (mm). Some evidence sug-gests that productivity of the prey population is a primary determinant of wolf terri-tory size (Carbone and Gittleman 2002; Fuller et al. 2003), however, prey biomass has been found to be negatively correlated with territory size in wolves (Jędrzejewski et al. 2007), and is used here due to a lack of published secondary productivity (the addition of new animal cells per unit time per unit area) data for modern wolves, and because Pleistocene estimates of secondary productivity would be less reliable than those of prey biomass. Data on wolf territory size, pack size, and prey biomass were collected from Ballard et al. (1987), (1997), Fritts and Mech (1981), Fuller (1989), Hayes and Harestad (2000), Jędrzejewski et al. (2007), Kolenosky (1972), Mech
Table 12.1 Wolf pack summary data
Country RegionMean territory (km2) Latitude Packs Source
Canada East-central Ontario 224 50 °N 2 Kolenosky (1972)Canada Southwestern Quebec 351 47 °N 14 Messier (1985)Canada Yukon 849 62 °N 28 Hayes and Harestad
(2000)Poland Bialowieza Forest 201 52.5 °N 4 Jędrzejewski et al.
(2007)Romania Brasov 164 45.5 °N 2 Promberger et al.
(1998)USA North-central MN 116 47.75 °N 4 Fuller (1989)USA Northeastern MN 243 48 °N 11 Mech (1973)USA Northwestern MN 344 48.5 °N 8 Fritts and Mech (1981)USA Northwestern Alaska 1,868 66 °N 6 Ballard et al. (1997)USA South-central Alaska 1,193 63 °N 25 Ballard et al. (1987)
12 Territory Size in Canis lupus: Implications for Neandertal Mobility
216
(1973), Messier (1985), and Promberger et al. (1998). Temperature and precipita-tion data were obtained from online databases of the Western Regional Climate Center (http://www.wrcc.dri.edu/spi/divplot1map.html), Canada’s National Climate Data and Information Archive (http://www.climate.weatheroffice.ec.gc.ca/index.html), the Alaska Climate Research Center (http:// climate.gi.alaska.edu/), and the European Climate Assessment and Dataset (http://eca.knmi.nl/). Mean winter tem-perature and precipitation data are specific to the year in which wolf data were col-lected and come from weather stations nearest the wolf study areas. Climate estimates for Late Pleistocene Europe are from Stage 3 Project published datasets(ftp://ftp.essc.psu.edu/pub/emsei/pollard/Stage3/).
Data were analyzed using a pairwise correlation test and backward elimination regressions with Durbin-Watson tests for autocorrelation in JMP Pro 10 (JMP®, Version 10 Pro. SAS Institute Inc., Cary, NC). A Pairwise correlation test was used to examine the relationship between all model variables and to identify potential sources of cross-correlation. Backward elimination regressions were then utilized to identify an equation, with the fewest possible variables, that best explains change in wolf territory size. A Durbin-Watson test was applied to each regression model to identify the presence or absence of autocorrelation. Lastly, late Pleistocene Europeanclimate estimates and Neanderthal aggregate mass estimates were introduced to the model to produce a probable range of potential Neandertal territory sizes.
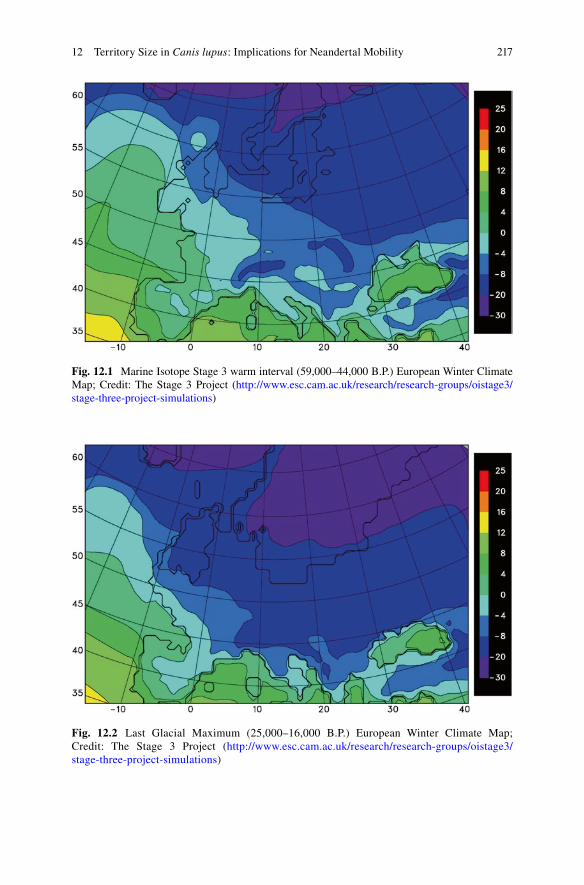
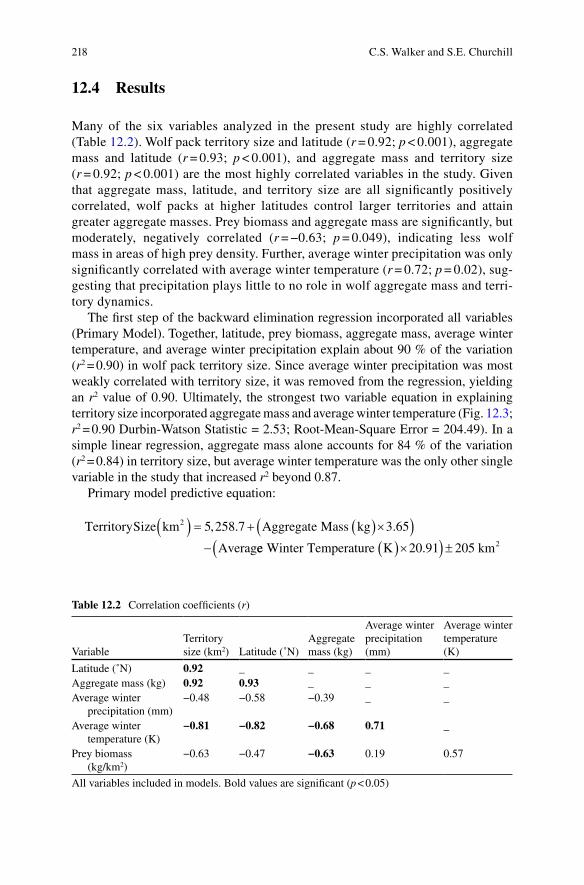
Many researchers believe that Neandertals were organized into small groups, per-haps on the order of 8–12 individuals (e.g., Smith 2007; Vallverdú et al. 2010; Lalueza-Foxa et al. 2011). Among modern, non-sedentary foragers, modal group sizes tend to be around 25–30 individuals (Kelly 1995). We thus sought to model Neandertal home range sizes for social groups between about 10–30 individuals. According to Ruff and colleagues (1997), the body size of an average Neandertal was 77.9 ± 4.7 kg for males and 66.4 ± 4.8 kg for females. For the purpose of group composition projections, 36 kg (one-half the mean male/female body size) was cho-sen to represent the size of a juvenile Neandertal. Neandertal aggregate mass values of 500, 1,000, and 1,500 kg were used as sample estimates for input into the model. The number of Neandertals represented by these aggregate masses would vary depending on the age and sex composition of the group, but if one makes some sim-plifying assumptions [dependency ratios varied between 1.25–3.00 (Binford 2001), all dependents were juveniles (see Caspari and Lee 2004), and sex ratios among producers were equal] these values should roughly correspond with groups of 10–11, 19–23, and 29–33 individuals, respectively. Average winter temperature during MIS 3 Warm Interval (59,000–44,000 years before present) and the last glacial maximum (LGM) (25,000–16,000 years before present) estimated by the Stage 3 project(Figs. 12.1 and 12.2, respectively; ftp://ftp.essc.psu.edu/pub/emsei/pollard/Stage3/) were incorporated into the model for two regions: southern France and the Crimean Peninsula, where territory estimates based upon archeological evidence have been published (Burke 2006; Fernandes et al. 2008). While Neandertals appear to have been fully extinct by the LGM (MIS 2), we used the LGM average winter tempera-ture estimates from the Stage 3 project as broadly representative of climatic condi-tions endured by Neandertals during the preceding glacial maxima (MIS 4 and 6).
C.S. Walker and S.E. Churchill
217
Fig. 12.1 Marine Isotope Stage 3 warm interval (59,000–44,000 B.P.) European Winter Climate Map; Credit: The Stage 3 Project (http://www.esc.cam.ac.uk/research/research-groups/oistage3/stage-three-project-simulations)
Fig. 12.2 Last Glacial Maximum (25,000–16,000 B.P.) European Winter Climate Map; Credit: The Stage 3 Project (http://www.esc.cam.ac.uk/research/research-groups/oistage3/stage-three-project-simulations)
12 Territory Size in Canis lupus: Implications for Neandertal Mobility
218
12.4 Results
Many of the six variables analyzed in the present study are highly correlated (Table 12.2). Wolf pack territory size and latitude (r = 0.92; p < 0.001), aggregate mass and latitude (r = 0.93; p < 0.001), and aggregate mass and territory size (r = 0.92; p < 0.001) are the most highly correlated variables in the study. Given that aggregate mass, latitude, and territory size are all significantly positively correlated, wolf packs at higher latitudes control larger territories and attain greater aggregate masses. Prey biomass and aggregate mass are significantly, but moderately, negatively correlated (r = −0.63; p = 0.049), indicating less wolf mass in areas of high prey density. Further, average winter precipitation was only significantly correlated with average winter temperature (r = 0.72; p = 0.02), sug-gesting that precipitation plays little to no role in wolf aggregate mass and terri-tory dynamics.
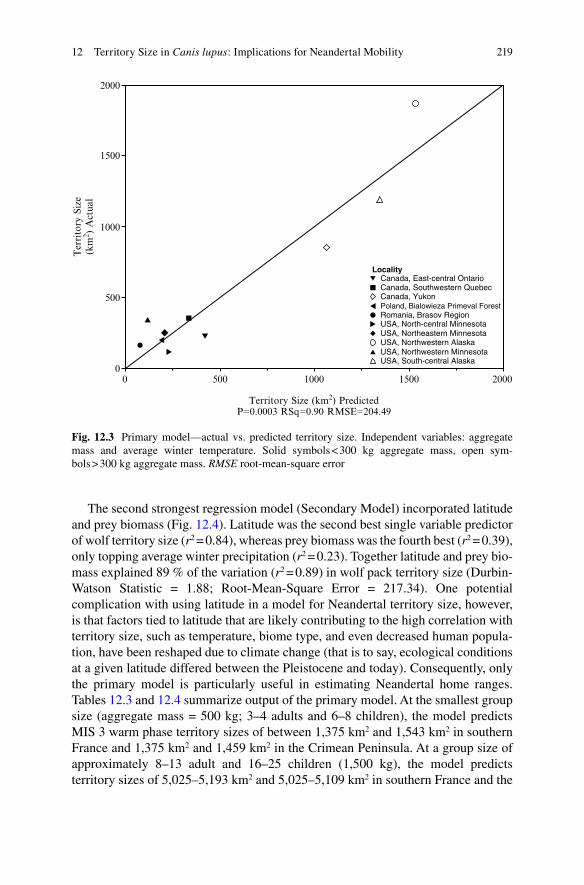
The first step of the backward elimination regression incorporated all variables (Primary Model). Together, latitude, prey biomass, aggregate mass, average winter temperature, and average winter precipitation explain about 90 % of the variation (r2 = 0.90) in wolf pack territory size. Since average winter precipitation was most weakly correlated with territory size, it was removed from the regression, yielding an r2 value of 0.90. Ultimately, the strongest two variable equation in explaining territory size incorporated aggregate mass and average winter temperature (Fig. 12.3; r2 = 0.90 Durbin-Watson Statistic = 2.53; Root-Mean-Square Error = 204.49). In a simple linear regression, aggregate mass alone accounts for 84 % of the variation (r2 = 0.84) in territory size, but average winter temperature was the only other single variable in the study that increased r2 beyond 0.87.
Primary model predictive equation:
TerritorySize km Aggregate Mass kg
Averag
2 5 258 7 3 65( ) = + ( )´( )-
, . .
ee Winter Temperature K km( )´( ) ±20 91 205 2.
Table 12.2 Correlation coefficients (r)
VariableTerritory size (km2) Latitude (˚N)
Aggregate mass (kg)
Average winter precipitation (mm)
Average winter temperature (K)
Latitude (˚N) 0.92 _ _ _ _Aggregate mass (kg) 0.92 0.93 _ _ _Average winter
precipitation (mm)−0.48 −0.58 −0.39 _ _
Average winter temperature (K)
−0.81 −0.82 −0.68 0.71 _
Prey biomass (kg/km2)
−0.63 −0.47 −0.63 0.19 0.57
All variables included in models. Bold values are significant (p < 0.05)
C.S. Walker and S.E. Churchill
219
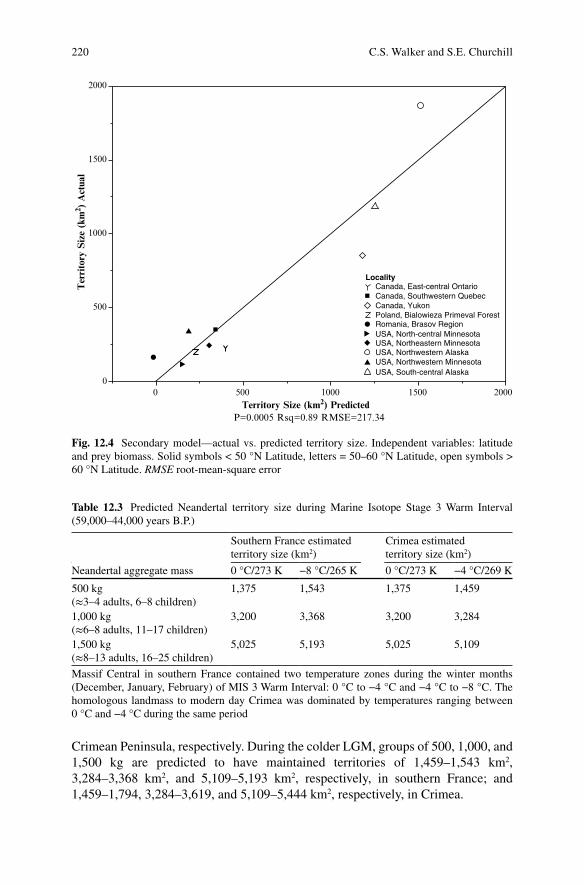
The second strongest regression model (Secondary Model) incorporated latitude and prey biomass (Fig. 12.4). Latitude was the second best single variable predictorof wolf territory size (r2 = 0.84), whereas prey biomass was the fourth best (r2 = 0.39), only topping average winter precipitation (r2 = 0.23). Together latitude and prey bio-mass explained 89 % of the variation (r2 = 0.89) in wolf pack territory size (Durbin- Watson Statistic = 1.88; Root-Mean-Square Error = 217.34). One potential complication with using latitude in a model for Neandertal territory size, however, is that factors tied to latitude that are likely contributing to the high correlation with territory size, such as temperature, biome type, and even decreased human popula-tion, have been reshaped due to climate change (that is to say, ecological conditions at a given latitude differed between the Pleistocene and today). Consequently, only the primary model is particularly useful in estimating Neandertal home ranges. Tables 12.3 and 12.4 summarize output of the primary model. At the smallest group size (aggregate mass = 500 kg; 3–4 adults and 6–8 children), the model predicts MIS 3 warm phase territory sizes of between 1,375 km2 and 1,543 km2 in southern France and 1,375 km2 and 1,459 km2 in the Crimean Peninsula. At a group size of approximately 8–13 adult and 16–25 children (1,500 kg), the model predicts territory sizes of 5,025–5,193 km2 and 5,025–5,109 km2 in southern France and the
LocalityCanada, East-central OntarioCanada, Southwestern QuebecCanada, Yukon
Romania, Brasov RegionUSA, North-central MinnesotaUSA, Northeastern MinnesotaUSA, Northwestern AlaskaUSA, Northwestern MinnesotaUSA, South-central Alaska
Territory Size (km2) Predicted
2000
1500
1000
500
00 500 1000 1500 2000
Ter
rito
ry S
ize
(km
2 ) A
ctua
l
P=0.0003 RSq=0.90 RMSE=204.49
Poland, Bialowieza Primeval Forest
Fig. 12.3 Primary model—actual vs. predicted territory size. Independent variables: aggregate mass and average winter temperature. Solid symbols < 300 kg aggregate mass, open sym-bols > 300 kg aggregate mass. RMSE root-mean-square error
12 Territory Size in Canis lupus: Implications for Neandertal Mobility
220
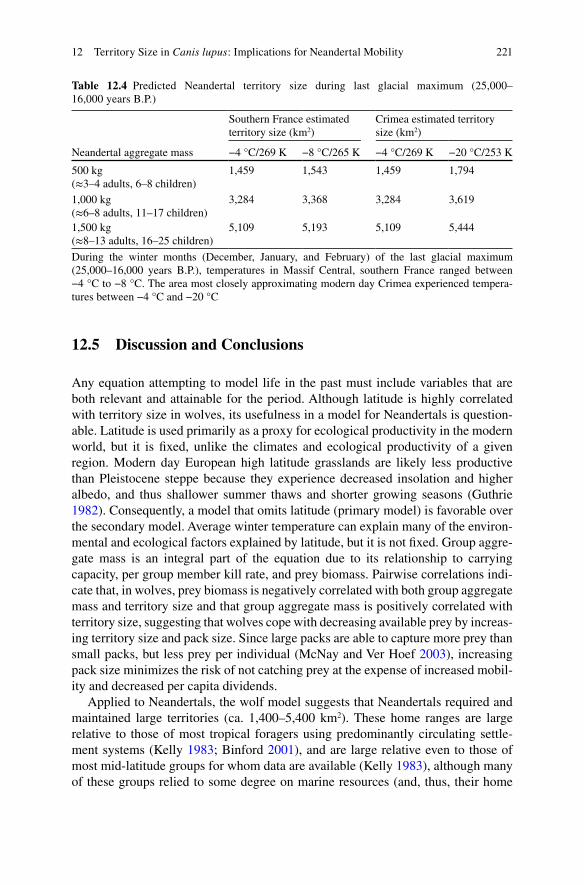
Crimean Peninsula, respectively. During the colder LGM, groups of 500, 1,000, and1,500 kg are predicted to have maintained territories of 1,459–1,543 km2, 3,284–3,368 km2, and 5,109–5,193 km2, respectively, in southern France; and 1,459–1,794, 3,284–3,619, and 5,109–5,444 km2, respectively, in Crimea.
LocalityCanada, East-central OntarioCanada, Southwestern QuebecCanada, YukonPoland, Bialowieza Primeval ForestRomania, Brasov RegionUSA, North-central MinnesotaUSA, Northeastern Minnesota
USA, Northwestern MinnesotaUSA, South-central Alaska
200015001000
P=0.0005 Rsq=0.89 RMSE=217.34
50000
500
1000
1500
2000
USA, Northwestern Alaska
Territory Size (km2) Predicted
Ter
rito
ry S
ize
(km
2 ) A
ctua
l
Fig. 12.4 Secondary model—actual vs. predicted territory size. Independent variables: latitude and prey biomass. Solid symbols < 50 °N Latitude, letters = 50–60 °N Latitude, open symbols >60 °N Latitude. RMSE root-mean-square error
Table 12.3 Predicted Neandertal territory size during Marine Isotope Stage 3 Warm Interval (59,000–44,000 years B.P.)
Southern France estimated territory size (km2)
Crimea estimated territory size (km2)
Neandertal aggregate mass 0 °C/273 K −8 °C/265 K 0 °C/273 K −4 °C/269 K
500 kg(≈3–4 adults, 6–8 children)
1,375 1,543 1,375 1,459
1,000 kg(≈6–8 adults, 11–17 children)
3,200 3,368 3,200 3,284
1,500 kg(≈8–13 adults, 16–25 children)
5,025 5,193 5,025 5,109
Massif Central in southern France contained two temperature zones during the winter months (December, January, February) of MIS 3 Warm Interval: 0 °C to −4 °C and −4 °C to −8 °C. The homologous landmass to modern day Crimea was dominated by temperatures ranging between 0 °C and −4 °C during the same period
C.S. Walker and S.E. Churchill
221
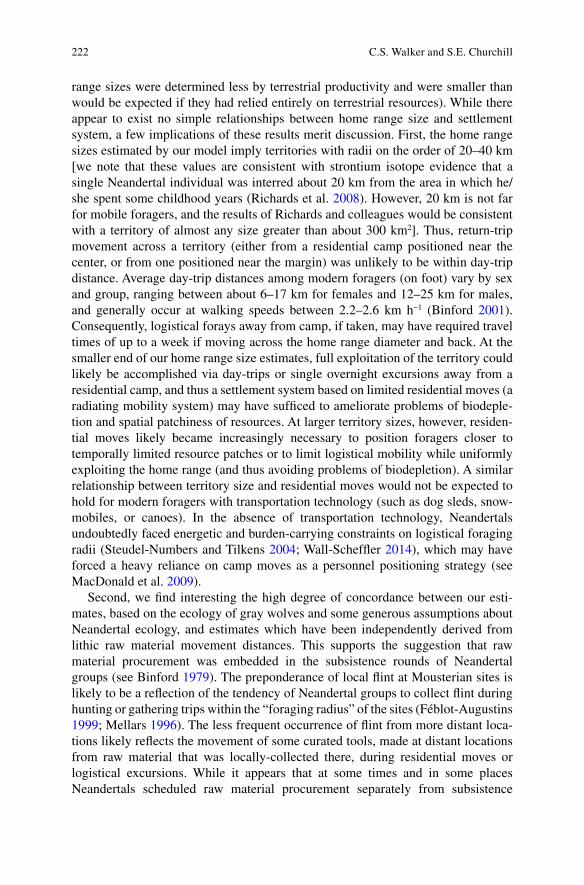
12.5 Discussion and Conclusions
Any equation attempting to model life in the past must include variables that are both relevant and attainable for the period. Although latitude is highly correlated with territory size in wolves, its usefulness in a model for Neandertals is question-able. Latitude is used primarily as a proxy for ecological productivity in the modernworld, but it is fixed, unlike the climates and ecological productivity of a given region. Modern day European high latitude grasslands are likely less productive than Pleistocene steppe because they experience decreased insolation and higher albedo, and thus shallower summer thaws and shorter growing seasons (Guthrie 1982). Consequently, a model that omits latitude (primary model) is favorable over the secondary model. Average winter temperature can explain many of the environ-mental and ecological factors explained by latitude, but it is not fixed. Group aggre-gate mass is an integral part of the equation due to its relationship to carrying capacity, per group member kill rate, and prey biomass. Pairwise correlations indi-cate that, in wolves, prey biomass is negatively correlated with both group aggregate mass and territory size and that group aggregate mass is positively correlated with territory size, suggesting that wolves cope with decreasing available prey by increas-ing territory size and pack size. Since large packs are able to capture more prey than small packs, but less prey per individual (McNay and Ver Hoef 2003), increasing pack size minimizes the risk of not catching prey at the expense of increased mobil-ity and decreased per capita dividends.
Applied to Neandertals, the wolf model suggests that Neandertals required and maintained large territories (ca. 1,400–5,400 km2). These home ranges are large relative to those of most tropical foragers using predominantly circulating settle-ment systems (Kelly 1983; Binford 2001), and are large relative even to those of most mid-latitude groups for whom data are available (Kelly 1983), although many of these groups relied to some degree on marine resources (and, thus, their home
Table 12.4 Predicted Neandertal territory size during last glacial maximum (25,000–16,000 years B.P.)
Southern France estimated territory size (km2)
Crimea estimated territory size (km2)
Neandertal aggregate mass −4 °C/269 K −8 °C/265 K −4 °C/269 K −20 °C/253 K
500 kg(≈3–4 adults, 6–8 children)
1,459 1,543 1,459 1,794
1,000 kg(≈6–8 adults, 11–17 children)
3,284 3,368 3,284 3,619
1,500 kg(≈8–13 adults, 16–25 children)
5,109 5,193 5,109 5,444
During the winter months (December, January, and February) of the last glacial maximum (25,000–16,000 years B.P.), temperatures in Massif Central, southern France ranged between −4 °C to −8 °C. The area most closely approximating modern day Crimea experienced tempera-tures between −4 °C and −20 °C
12 Territory Size in Canis lupus: Implications for Neandertal Mobility
222
range sizes were determined less by terrestrial productivity and were smaller than would be expected if they had relied entirely on terrestrial resources). While there appear to exist no simple relationships between home range size and settlement system, a few implications of these results merit discussion. First, the home range sizes estimated by our model imply territories with radii on the order of 20–40 km [we note that these values are consistent with strontium isotope evidence that a single Neandertal individual was interred about 20 km from the area in which he/she spent some childhood years (Richards et al. 2008). However, 20 km is not far for mobile foragers, and the results of Richards and colleagues would be consistent with a territory of almost any size greater than about 300 km2]. Thus, return-trip movement across a territory (either from a residential camp positioned near the center, or from one positioned near the margin) was unlikely to be within day-trip distance. Average day-trip distances among modern foragers (on foot) vary by sex and group, ranging between about 6–17 km for females and 12–25 km for males, and generally occur at walking speeds between 2.2–2.6 km h−1 (Binford 2001). Consequently, logistical forays away from camp, if taken, may have required travel times of up to a week if moving across the home range diameter and back. At the smaller end of our home range size estimates, full exploitation of the territory could likely be accomplished via day-trips or single overnight excursions away from a residential camp, and thus a settlement system based on limited residential moves (a radiating mobility system) may have sufficed to ameliorate problems of biodeple-tion and spatial patchiness of resources. At larger territory sizes, however, residen-tial moves likely became increasingly necessary to position foragers closer to temporally limited resource patches or to limit logistical mobility while uniformly exploiting the home range (and thus avoiding problems of biodepletion). A similar relationship between territory size and residential moves would not be expected to hold for modern foragers with transportation technology (such as dog sleds, snow-mobiles, or canoes). In the absence of transportation technology, Neandertals undoubtedly faced energetic and burden-carrying constraints on logistical foraging radii (Steudel-Numbers and Tilkens 2004; Wall-Scheffler 2014), which may have forced a heavy reliance on camp moves as a personnel positioning strategy (see MacDonald et al. 2009).
Second, we find interesting the high degree of concordance between our esti-mates, based on the ecology of gray wolves and some generous assumptions about Neandertal ecology, and estimates which have been independently derived from lithic raw material movement distances. This supports the suggestion that raw material procurement was embedded in the subsistence rounds of Neandertal groups (see Binford 1979). The preponderance of local flint at Mousterian sites is likely to be a reflection of the tendency of Neandertal groups to collect flint during hunting or gathering trips within the “foraging radius” of the sites (Féblot-Augustins 1999; Mellars 1996). The less frequent occurrence of flint from more distant loca-tions likely reflects the movement of some curated tools, made at distant locations from raw material that was locally-collected there, during residential moves or logistical excursions. While it appears that at some times and in some places Neandertals scheduled raw material procurement separately from subsistence
C.S. Walker and S.E. Churchill
223
rounds (Milliken 2007; Spinapolice 2012), which might suggest a more complex, radiating mobility strategy, they were generally not doing so. We wish to avoid making too much of these results, since human foraging systems are highly dynamic across space and time, and thus it is inherently foolish to make gross generaliza-tions about Neandertal mobility and settlement systems. Nonetheless, territory sizes estimated by the wolf model and by lithic studies, and the concordance between these two independent estimates, seem to us consistent with settlement systems that may have relied more heavily on residential than logistical movement (circulating mobility), in territories that, by virtue of their large size, demanded fairly high mobility levels of their occupants.
Acknowledgements Thanks to Damiano Marchi and Kristian J. Carlson for the opportunity to participate in the symposium and to contribute to this volume, and to David Mech for providing useful guidance during the data collection process. We are also grateful to two anonymous review-ers whose insights and comments served to improve this chapter.
References
Adler DS, Tushabramishvili N (2004) Middle Palaeolithic patterns of settlement and subsistence in the southern Caucasus. In: Conard N (ed) Settlement dynamics of the Middle Paleolithic and Middle Stone Age, vol II. Kerns, Tübingen, pp 91–132
Arcadi AC (2006) Species resilience in Pleistocene hominids that traveled far and ate widely: an analogy to the wolf-like canids. J Hum Evol 51:383–394
Ballard WB, Whitman JS, Gardner CL (1987) Ecology of an exploited wolf population in south-central Alaska. Wildlife Monogr 98:1–54
Ballard WB, Ayres LA, Krausman PR, Reed DJ, Fancy SG (1997) Ecology of wolves in relationto a migratory caribou herd in northwest Alaska. Wildlife Monogr 135:3–47
Ballard WB, Carbyn LN, Smith DW (2003) Wolf interactions with non-prey. In: Mech LD, BoitaniL (eds) Wolves: behavior, ecology, and conservation. University of Chicago Press, Chicago,pp 259–271
Binford LR (1979) Organization and formation processes: looking at curated technologies. J Anthropol Res 35:255–273
Binford LR (1980) Willow smoke and dog’s tails: hunter-gatherer settlement systems and archaeo-logical site formation. Am Antiquity 45:4–20
Binford LR (2001) Constructing frames of reference: an analytical method for archaeologicaltheory building using hunter-gatherer and environmental data sets. University of California Press, Berkeley
Burke A (2006) Neanderthal settlement patterns in Crimea: a landscape approach. J Anthropol Arch 25:510–523
Carbone C, Gittleman JL (2002) A common rule for the scaling of carnivore density. Science295:2273–2276
Carbone C, Cowlishaw G, Isaac NJB, Rowcliffe JM (2005) How far do animals go? Determinants of day range in mammals. Am Nat 165:290–297
Caspari R, Lee SH (2004) Older age becomes common late in human evolution. Proc Natl AcadSci U S A 101:10895–10900
Çep B, Waiblinger J (2001) The use of cave and open-air sites in southern Germany. In: Conard N (ed) Settlement dynamics of the Middle Paleolithic and Middle Stone Age, vol II. Kerns, Tübingen, pp 251–263
12 Territory Size in Canis lupus: Implications for Neandertal Mobility
224
Conard NJ, Adler DS (1997) Lithic reduction and hominid behavior in the Middle Paleolithic ofthe Rhineland. J Anthropol Res 53:147–175
Féblot-Augustins J (1993) Mobility strategies in the late Middle Palaeolithic of central Europe and western Europe: elements of stability and variability. J Anthropol Arch 12:211–265
Féblot-Augustins J (1997) La Circulation des Matières Premières au Paléolithique. ERAUL, LiègeFéblot-Augustins J (1999) Raw material transport patterns and settlement systems in the European
Lower and Middle Palaeolithic: continuity, change and variability. In: Roebroeks W, Gamble C(eds) The Middle Palaeolithic occupation of Europe. Leiden University, Leiden, pp 193–214
Fernandes P, Raynal JP, Moncel MH (2008) Middle Paleolithic raw material gathering territories and human mobility in the southern Massif Central, France: first results from a petro- archeological study on flint. J Archaeol Sci 35:2357–2370
Fernández-Laso MC, Chacón Navarro MG, García-Antón MD, Rivals F (2011) Territorial mobil-ity of Neanderthal groups: a case study from Level M of Abric Romaní (Capellades, Barcelona,Spain). In: Conard NJ, Richter J (eds) Neanderthal lifeways, subsistence and technology: one hundred and fifty years of Neanderthal study. Springer, Dordrecht, pp 187–202
Fritts SH, Mech LD (1981) Dynamics, movements, and feeding ecology of a newly protected wolfpopulation in northwestern Minnesota. Wildlife Monogr 80:3–79
Fuller TK (1989) Population dynamics of wolves in north-central Minnesota. Wildlife Monogr 105:3–41
Fuller TK, Berg WE, Radde GL, Lenarz MS, Joselyn GB (1992) A history and current estimate ofwolf distribution and numbers in Minnesota. Wildlife Soc B 20:42–55
Fuller TK, Mech LD, Cochrane JF (2003) Wolf population dynamics. In: Mech LD, Boitani L(eds) Wolves: behavior, ecology, and conservation. University of Chicago Press, Chicago, pp 161–191
Geneste JM (1988) Les industries de la grotte Vaufrey: technologie du débitage, économie et cir-culation de la matière première. In: Rigaud JP (ed) La Grotte Vaufrey: Paléoenvironnement,chronologie, activités humaines. Société Préhistorique Française, Paris, pp 441–517
Gittleman JL, Harvey PH (1982) Carnivore home-range size, metabolic needs and ecology. BehavEcol Sociobiol 10:57–63
Guthrie RD (1982) Mammals of the mammoth steppe as palaeoenvironmental indicators. In: Hopkins DM, Matthews JV, Schweger CE, Young SB (eds) Palaeoecology of Beringia. Academic, New York, pp 307–326
Hayes RD, Harestad AS (2000) Demography of a recovering wolf population in the Yukon. Can J Zoolog 78:36–48
Hill KR, Walker RS, Božičević M, Eder J, Headland T, Hewlett B et al (2011) Co-residence patterns in hunter-gatherer societies show unique human social structure. Science 331:1286–1289
Höner OP, Wachter B, East ML, Runyoro VA, Hofer H (2005) The effect of prey abundance andforaging tactics on the population dynamics of a social, territorial carnivore, the spotted hyena. Oikos 108:544–554
Hovers E (2001) Territorial behavior in the Middle Paleolithic of the Southern Levant. In: ConardNJ (ed) Settlement dynamics of the Middle Paleolithic and Middle Stone Age. Kerns, Tübingen, pp 123–152
Jędrzejewski W, Schmidt K, Theuerkauf J, Jędrzejewska B, Kowalczyk R (2007) Territory size of wolves Canis lupus: linking local (Białowieża Primeval Forest, Poland) and Holarctic-scale patterns. Ecography 30:66–76
Kelly R (1983) Hunter-gatherer mobility strategies. J Anthropol Res 37:277–306Kelly R (1995) The foraging spectrum. Smithsonian Institution, Washington, DCKolenosky GB (1972) Wolf predation on wintering deer in east-central Ontario. J Wildlife Manage
36:357–369Kuhn SL (1995) Mousterian lithic technology: an ecological perspective. Princeton University
Press, Princeton
C.S. Walker and S.E. Churchill
225
Kuhn SL (2011) Neanderthal technoeconomics: an assessment and suggestions for future develop-ments. In: Conard NJ, Richter J (eds) Neanderthal lifeways, subsistence and technology: one hundred fifty years of Neanderthal study. Springer, Dordrecht, pp 99–110
Kuhn SL, Stiner MC (2006) What’s a mother to do? Curr Anthropol 47:953–981Lalueza-Foxa C, Rosas A, Estalrrich A, Gigli I, Campos PF, García-Tabernero A et al (2011)
Genetic evidence for patrilocal mating behavior among Neandertal groups. Proc Natl Acad Sci U S A 108:250–253
Lehman N, Clarkson P, Mech LD, Meier TJ, Wayne RK (1992) A study of the genetic relationshipswithin and among wolf packs using DNA fingerprinting and mitochondrial DNA. Behav Ecol Sociobiol 30:83–94
Lieberman DE (1993) The rise and fall of seasonal mobility among hunter-gatherers: the case ofthe southern Levant. Curr Anthropol 34:599–614
Lieberman DE (1998) Neandertal and early modern human mobility patterns. In: Akazawa T, AokiK, Bar-Yosef O (eds) Neandertals and modern humans in western Asia. Plenum, New York, pp 263–275
Lieberman DE, Shea JJ (1994) Behavioral differences between archaic and modern humans in theLevantine Mousterian. Am Anthropol 96:300–332
MacDonald K, Roebroeks W, Verpoorte A (2009) An energetics perspective on the Neanderthal record. In: Hublin JJ, Richards MP (eds) The evolution of hominin diets: integrating approaches to the study of Palaeolithic subsistence. Springer Science + Business Media BV, New York, pp 211–220
Marks AE, Chabai VP (2001) Constructing Middle Paleolithic settlement systems in Crimea: potentials and limitations. In: Conard NJ (ed) Settlement dynamics of the Middle Paleolithic and Middle Stone Age. Kerns, Tübingen, pp 179–204
Martínez-Moreno J, Mora R, de la Torre I (2004) Methodological approach for understanding Middle Palaeolithic settlement dynamics at La Roca dels Bous (Noguera, Catalunya, northeastSpain). In: Conard N (ed) Settlement dynamics of the Middle Paleolithic and Middle Stone Age, vol II. Kerns, Tübingen, pp 393–414
McNay ME, Ver Hoef JM (2003) Predation of moose and caribou by a regulated wolf population. Alaska Department of Fish and Game Report
Mech LD (1970) The wolf: the ecology and behavior of an endangered species. Natural HistoryPress, New York
Mech LD (1973) Wolf numbers in the Superior National Forest of Minnesota. USDA ForestService research paper NC-97. St. Paul, Minnesota: North-Central Forest Experiment Station, pp. 1–10
Mech LD (1994) Travel speeds of arctic wolves. J Mammal 75:741–742Mech LD, Boitani L (2003) Wolf social ecology. In: Mech LD, Boitani L (eds) Wolves: behavior,
ecology, and conservation. University of Chicago Press, Chicago, pp 1–34Mech LD, Korb M (1978) An unusually long pursuit of a deer by a wolf. J Mammal 59:860–861Mech LD, Peterson RO (2003) Wolf-prey relations. In: Mech LD, Boitani L (eds) Wolves: behav-
ior, ecology, and conservation. University of Chicago Press, Chicago, pp 131–160Mellars P (1996) The Neanderthal legacy: an archaeological perspective from Western Europe.
Princeton University Press, PrincetonMessier F (1985) Social organization, spatial distribution, and population density of wolves in
relation to moose density. Can J Zool 63:1068–1077Milliken S (1988) Hunter-gatherer land use in the Late Glacial south-east Italy. Oxford J Archaeol
17:269–286Milliken S (2007) Neanderthals, anatomically modern humans, and ‘modern human behaviour’ in
Italy. Oxford J Archaeol 26:331–358Patou-Mathis M (2000) Neanderthal subsistence behaviors in Europe. Int J Osteoarch 10:
379–395Peterson RO, Ciucci P (2003) The wolf as a carnivore. In: Mech LD, Boitani L (eds) Wolves:
behavior, ecology, and conservation. University of Chicago Press, Chicago, pp 104–130
12 Territory Size in Canis lupus: Implications for Neandertal Mobility
226
Promberger C, Ionescu O, Mertens A, Minca M, Predoiu G, Promberger-Furpab B et al (1998) Carpathian large carnivore project—annual report 1997/1998. Munich Wildlife Society, Ettal
Richards M, Harvati K, Grimes V, Smith C, Smith T, Hublin JJ, Panagopoulou E (2008) Strontium isotope evidence of Neanderthal mobility at the site of Lakonis, Greece using laser-ablationPIMMS. J Archaeol Sci 35(5):1251–1256
Richter J (2001) For lack of a wise old man? Late Neanderthal land-use patterns in the AltmühlRiver valley, Bavaria. In: Conard NJ (ed) Settlement dynamics of the Middle Paleolithic and Middle Stone Age. Kerns, Tübingen, pp 205–219
Rivals F, Moncel MH, Patou-Mathis M (2009) Seasonality and intra-site variation of Neanderthal occupations in the Middle Palaeolithic locality of Payre (Ardèche, France) using dental wearanalyses. J Arch Sci 36:1070–1078
Roebroeks W (2003) Landscape learning and the earliest peopling of Europe. In: Rockman M,Steele J (eds) Colonization of unfamiliar landscapes: the archaeology of adaptation. Routledge, London, pp 99–115
Ruff CB, Trinkaus E, Holliday TW (1997) Body mass and encephalization in Pleistocene Homo. Nature 387:173–176
Schaller GB, Lowther GR (1969) The relevance of carnivore behavior to the study of early hominids. Southwest J Anthropol 25:307–341
Slimak L, GiraudY (2007) Circulations sur plusieurs centaines de kilomètres durant le Paléolithiquemoyen. Contribution à la connaissance des sociétés néandertaliennes. C R Palevol 6:359–368
Smith RF (2007) An individual-based comparative advantage model: did economic specialization mediate the fluctuating climate of the late Pleistocene during the transition from Neanderthals to modern humans? PhD Dissertation. Rutgers University, New Brunswick, NJ
Speth JD (2012) Middle Palaeolithic subsistence in the Near East: zooarchaeological perspec-tives—past, present and future. Before Farming 2012:1
Spinapolice EE (2012) Raw material economy in Salento (Apulia, Italy): new perspectives on Neanderthal mobility patterns. J Arch Sci 39:680–689
Steele J (1996) On predicting hominid group sizes. In: Steele J, Shennan S (eds) The archaeology of human ancestry. Routledge, New York, pp 230–252
Steudel-Numbers K, Tilkens M (2004) The effect of lower limb length on the energetic cost of locomotion: implications for fossil hominins. J Hum Evol 47:95–109
Trinkaus E (1983a) Neandertal postcrania and the adaptive shift to modern humans. In: Trinkaus E (ed) The Mousterian legacy: human biocultural changes in the Upper Pleistocene. Oxford: British Archaeological Reports International Series 164, pp. 165–200
Trinkaus E (1983b) The Shanidar Neandertals. Academic, New YorkUS Fish & Wildlife Service (2008) Grey wolf (Canis lupus). Department of the Interior,
Washington, DCVallverdú J, Vaquero M, Cáceres I, Allué E, Rosell J, Saladié P et al (2010) Sleeping activity area
within the site structure of archaic human groups. Curr Anthropol 51:137–145Van Ballenberghe V, Erickson AW, Byman D (1975) Ecology of the timber wolf in Northeastern
Minnesota. Wildlife Monogr 43:1–43Wallace IJ, Shea JJ (2006) Mobility patterns and core technologies in the Middle Paleolithic of the
Levant. J Arch Sci 33:1293–1309Wall-Scheffler CM (2014) The balance between burden carrying, variable terrain and thermo-
regulatory pressures in assessing morphological variation. In: Carlson KJ, Marchi D (eds) Reconstructing mobility: environmental, behavioral, and morphological determinants. Springer, Heidelberg
Wobst HM (1974) Boundary conditions for Paleolithic social systems: a simulation approach. Am Antiquity 39:147–178
Zilhão J (2001) Middle Paleolithic settlement patterns in Portugal. In: Conard N (ed) Settlement dynamics of the Middle Paleolithic and Middle Stone Age. Kerns, Tübingen, pp 597–608
C.S. Walker and S.E. Churchill


