Embed Size (px)
Citation preview
ITEM EVALUATION OF THE READING TEST OF THE MALAYSIAN UNIVERSITY ENGLISH TEST (MUET)
RUSILAH BINTI YUSUP
Submitted in partial fulfilment of the requirements for the degree of Master of Assessment and Evaluation
Melbourne Graduate School of Education (MGSE)
The University of Melbourne
September 2012
i
ABSTRACT
The present study is an item-level evaluation of the reading test of the Malaysian
University English Test (MUET), the high-stakes entrance test for Malaysian pre-degree
students. It comprises an in-depth analysis of student responses at item level as an
explanation why this compulsory entry test appears to be formidable challenge for test
takers. The study aims to assess the quality of the test items from the framework of two
widely used psychometric theories – classical test theory (CTT) and the Rasch model.
Additionally, it examines the effects of item features and examinees’ characteristics in
determining the difficulty level of the test items. These two issues have been explored
by using regression analysis and differential item functioning (DIF) respectively. The
findings of item analysis demonstrate the complementary nature of CTT and the Rasch
model as useful tools for test design and evaluation. The study also reports that item
difficulty of this reading test is influenced largely by question format features
(particularly plausibility of the distractors) rather than passage-related variables and
question-type variables. DIF analysis points out that natural/real differences are seen as
a possible explanation for variation between the various groups being examined. These
findings, though subject to limitations, have practical implications for instruction, test
construction and educational research. Also, it provides directions for future exploration
of several issues identified through this study. Due to the limitation of the study, it only
focuses on one of the four components of MUET, that is reading test.
ii
DECLARATION
This thesis does not contain material which has been accepted for any other degree in
any university. To the best of my knowledge and belief, this thesis contains no material
previously published or written by any other person, except where due reference is
given in the text.
Signature: .............................................................

iii
ACKNOWLEDGEMENT
First and foremost, praises to Allah, the Most Gracious the Most Merciful, by His Grace
and Will alone have made this journey possible.
This research would not have succeeded without the support of several people, to whom
I am greatly indebted.
My sincere and heartfelt gratitude to my dissertation supervisors, Associate Professor
Esther Care and Associate Professor Margaret Wu, for their guidance, encouragement
and thoughtfulness throughout this challenging journey. I am honoured to have been
given the opportunity to work with these brilliant and kind individuals.
I am also very grateful to the Ministry of Education Malaysia for granting me a study
leave and scholarship in my pursuit of academic development.
Last but not least, to my beloved family and friends, my deepest gratitude for their
endless love and unwavering emotional support.
Thank you all.
iv
TABLE OF CONTENTS
ABSTRACT ..................................................................................................................... i
DECLARATION ............................................................................................................. ii
ACKNOWLEDGEMENT ............................................................................................. iii
TABLE OF CONTENTS ............................................................................................. iv
LIST OF TABLES …..................................................................................................... vi
LIST OF FIGURES ....................................................................................................... vii
CHAPTER 1 INTRODUCTION
1.1 Introduction ....................................................................................................... 1
1.2 Problem Statement ............................................................................................. 4
1.3 Aim / Purpose of the Study ............................................................................... 6
1.4 Research Questions ........................................................................................... 9
1.5 Significance and Limitation of the Study ....................................................... 10
1.6 Structure of the Thesis ..................................................................................... 11
CHAPTER 2 A REVIEW OF LITERATURE
2.1 Introduction ……............................................................................................ 13
2.2 Assessment of Reading Comprehension ......................................................... 14
2.3 Psychometric Item Analysis of the MUET Reading Test ............................... 17
2.4 The Effects of Test Features and Examinee’s Characteristics on Item Difficulty of Reading Test ...................................................................... 26
2.5 Review of Previous Studies ............................................................................. 34
2.6 Summary ......................................................................................................... 37
v
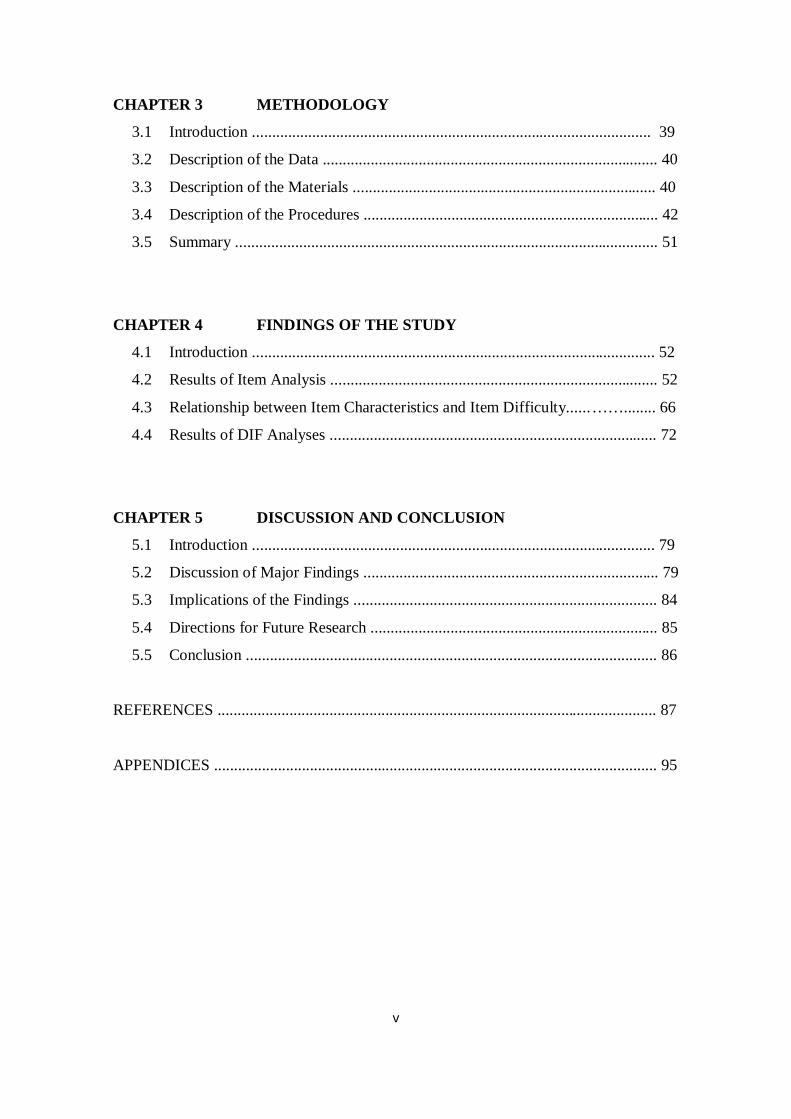
CHAPTER 3 METHODOLOGY
3.1 Introduction .................................................................................................... 39
3.2 Description of the Data .................................................................................... 40
3.3 Description of the Materials ............................................................................ 40
3.4 Description of the Procedures .......................................................................... 42
3.5 Summary .......................................................................................................... 51
CHAPTER 4 FINDINGS OF THE STUDY
4.1 Introduction ..................................................................................................... 52
4.2 Results of Item Analysis .................................................................................. 52
4.3 Relationship between Item Characteristics and Item Difficulty...... ……........ 66
4.4 Results of DIF Analyses .................................................................................. 72
CHAPTER 5 DISCUSSION AND CONCLUSION
5.1 Introduction ..................................................................................................... 79
5.2 Discussion of Major Findings .......................................................................... 79
5.3 Implications of the Findings ............................................................................ 84
5.4 Directions for Future Research ........................................................................ 85
5.5 Conclusion ....................................................................................................... 86
REFERENCES .............................................................................................................. 87
APPENDICES ............................................................................................................... 95
vi
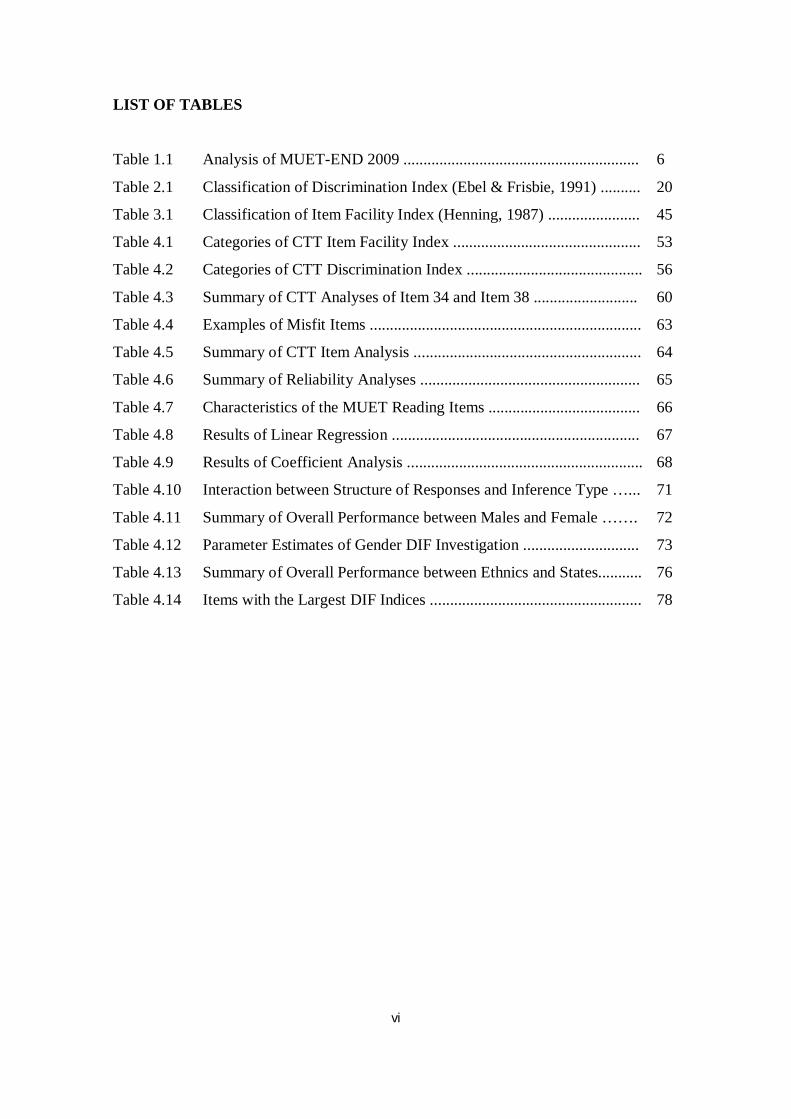
LIST OF TABLES
Table 1.1 Analysis of MUET-END 2009 ........................................................... 6
Table 2.1 Classification of Discrimination Index (Ebel & Frisbie, 1991) .......... 20
Table 3.1 Classification of Item Facility Index (Henning, 1987) ....................... 45
Table 4.1 Categories of CTT Item Facility Index ............................................... 53
Table 4.2 Categories of CTT Discrimination Index ............................................ 56
Table 4.3 Summary of CTT Analyses of Item 34 and Item 38 .......................... 60
Table 4.4 Examples of Misfit Items .................................................................... 63
Table 4.5 Summary of CTT Item Analysis ......................................................... 64
Table 4.6 Summary of Reliability Analyses ....................................................... 65
Table 4.7 Characteristics of the MUET Reading Items ...................................... 66
Table 4.8 Results of Linear Regression .............................................................. 67
Table 4.9 Results of Coefficient Analysis ........................................................... 68
Table 4.10 Interaction between Structure of Responses and Inference Type …... 71
Table 4.11 Summary of Overall Performance between Males and Female ……. 72
Table 4.12 Parameter Estimates of Gender DIF Investigation ............................. 73
Table 4.13 Summary of Overall Performance between Ethnics and States........... 76
Table 4.14 Items with the Largest DIF Indices ..................................................... 78
vii
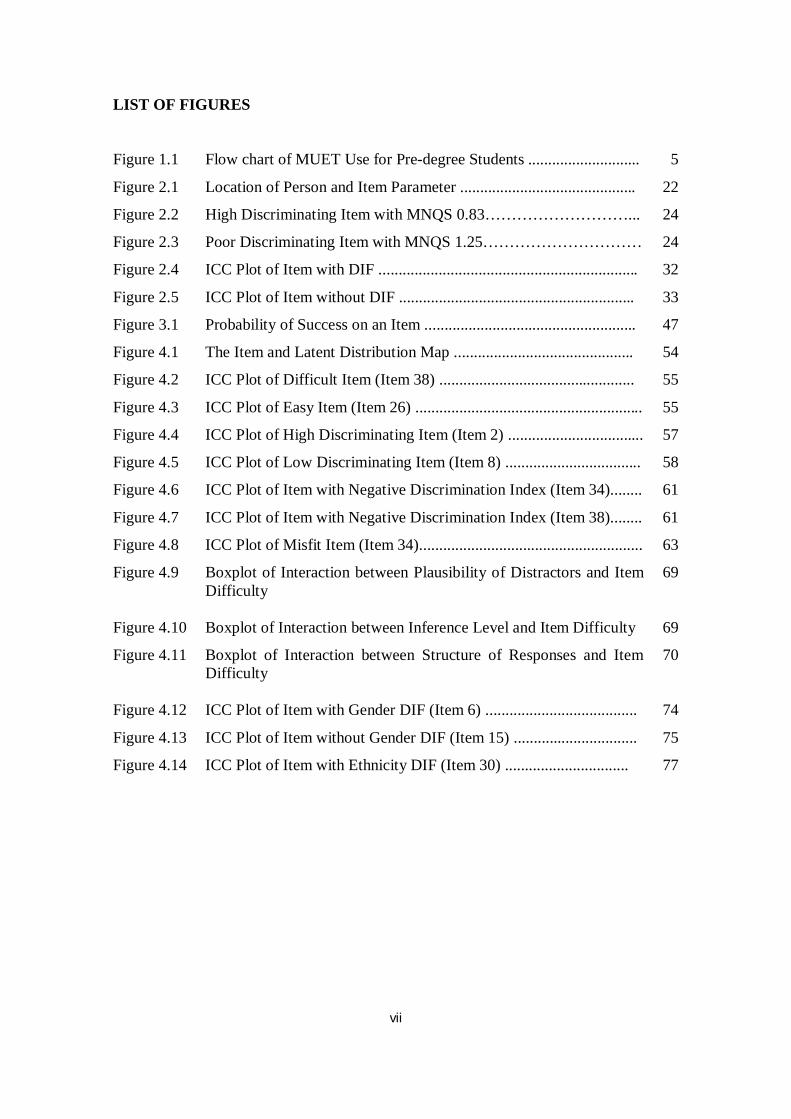
LIST OF FIGURES
Figure 1.1 Flow chart of MUET Use for Pre-degree Students ............................ 5
Figure 2.1 Location of Person and Item Parameter ............................................ 22
Figure 2.2 High Discriminating Item with MNQS 0.83………………………... 24
Figure 2.3 Poor Discriminating Item with MNQS 1.25………………………… 24
Figure 2.4 ICC Plot of Item with DIF ................................................................. 32
Figure 2.5 ICC Plot of Item without DIF ........................................................... 33
Figure 3.1 Probability of Success on an Item ..................................................... 47
Figure 4.1 The Item and Latent Distribution Map ............................................. 54
Figure 4.2 ICC Plot of Difficult Item (Item 38) ................................................. 55
Figure 4.3 ICC Plot of Easy Item (Item 26) ......................................................... 55
Figure 4.4 ICC Plot of High Discriminating Item (Item 2) .................................. 57
Figure 4.5 ICC Plot of Low Discriminating Item (Item 8) .................................. 58
Figure 4.6 ICC Plot of Item with Negative Discrimination Index (Item 34)........ 61
Figure 4.7 ICC Plot of Item with Negative Discrimination Index (Item 38)........ 61
Figure 4.8 ICC Plot of Misfit Item (Item 34)........................................................ 63
Figure 4.9 Boxplot of Interaction between Plausibility of Distractors and Item Difficulty
69
Figure 4.10 Boxplot of Interaction between Inference Level and Item Difficulty 69
Figure 4.11 Boxplot of Interaction between Structure of Responses and Item Difficulty
70
Figure 4.12 ICC Plot of Item with Gender DIF (Item 6) ...................................... 74
Figure 4.13 ICC Plot of Item without Gender DIF (Item 15) ............................... 75
Figure 4.14 ICC Plot of Item with Ethnicity DIF (Item 30) ............................... 77

1
CHAPTER 1: INTRODUCTION
1.1 INTRODUCTION
Broadly speaking, the purpose of educational testing and assessment is straightforward;
to measure or gauge what learners know or can do. Testing or assessment is seen as a
process of gathering evidence to infer the performance of an individual
(McNamara,2000). In the educational context, many educators recognize that tests play
a crucial role as an arsenal of tools to measure student achievement.
In the Malaysian context, the outcome of assessment through standardized tests1 is seen
as the linchpin to track how well students perform throughout their schooling years.
Stakeholders in education, particularly students, teachers and parents, make inferences
about students’ overall performance from national standardized high-stakes
examinations like Penilaian Menengah Rendah (PMR or Lower Secondary Evaluation),
Sijil Pelajaran Malaysia (SPM or Malaysian Certificate of Education) and Sijil Tinggi
Pelajaran Malaysia (STPM or Malaysian Higher School Certificate Examination).
After PMR for example, students will be streamed into either a Science stream or Arts
stream based on their results. Those with distinctive results in SPM will have the
advantage of entering matriculation centres2 which offer a pre-university programme for
Malaysian ‘bumiputera’ students as a preparation for them to qualify to Degree
Programmes in the fields of Science and Technology in both local and overseas
universities.
The results of standardized tests serve a variety of purposes in educational settings. At
the individual level, Mertler (2007) asserts that test scores are used to describe one’s
learning abilities and levels of achievements. The information helps students to identify
1 A test that is developed, administered and scored in a predetermined standard manner.
Students take the same set of exam questions, marked with the same marking scheme and graded using the same grading system.
2 Centres for foundation studies which offer one or two-year programmes run by the Ministry of Education.
2
their areas of strength and weakness (Schwartz, 1984) and this guides them to modify or
adapt to the instruction based on their own needs (Mertler, 2007). In addition, test
results can provide useful information at group level. Often, test results are used to
compare students with other students (Schwartz, 1984). Tests serve as an indicator of
general ability levels of students across classes, grade levels, schools or states.
Over the decades, we have witnessed a change in the use of educational testing.
Educational tests no longer serve primarily as indicators of educational achievement.
Tests have become an effective policy device to implement changes or modifications to
educational policies (Baker, 1989) and to monitor the effectiveness of instruction or
academic courses (Bachman & Palmer, 1996). Test results are now used to evaluate
teachers, administrators, and even the quality of an entire curricular and instructional
program. As an example, many higher educational institutions make use of scores from
standardized tests as the sole, mandatory, or primary criterion for admissions or
certification. Therefore, education stakeholders should view the results of tests as a
source of information which needs to be put into good use to reach appropriate
decisions about students, instruction and curriculum at large.
1.1.1 English Language in Malaysia
Owing to the legacy of British, the English language has been spoken in Malaysia for
decades. From pre-independence days until today, it has been widely spoken and is
therefore considered the second language of the country. It has been used extensively in
commercial and social settings, formal and informal situations – in business
transactions, internet communication, advertisement and entertainment industry. In
government administration, although Malay is the official language, English usage is
frequent and necessary in many international transactions and correspondences. To a
certain extent, English has become part and parcel of the life of Malaysians. As an
example, failure in securing jobs after graduation is often linked to the inability to
communicate effectively in English. It is also a common notion in Malaysia that one’s
success in today’s competitive global world is associated with the mastery of the
English language.
3
Due to its importance, English has been made a compulsory subject taught and tested as
a second language from the first year of an individual's primary education to the end of
his/her secondary education in Form Five. Unfortunately, prior to 1999, English was not
taught or tested at the Sixth Form or pre-university level. However, upon entry into the
local public tertiary institutions, these pre-1999 students were required to undergo a
course in English language proficiency. This is because at the tertiary level, although
the medium of instruction in the public universities is the national language (Malay),
English is widely used to teach science and mathematics-related subjects or courses.
It was with the dual purpose of filling the gap with respect to the training and learning
of English and that of consolidating and enhancing the language literacy of the Sixth
Form and pre-university students, that the Malaysian University English Test (MUET)
was first introduced in 1999, along with a curriculum/syllabus for delivery at Sixth
Form and equivalent level.
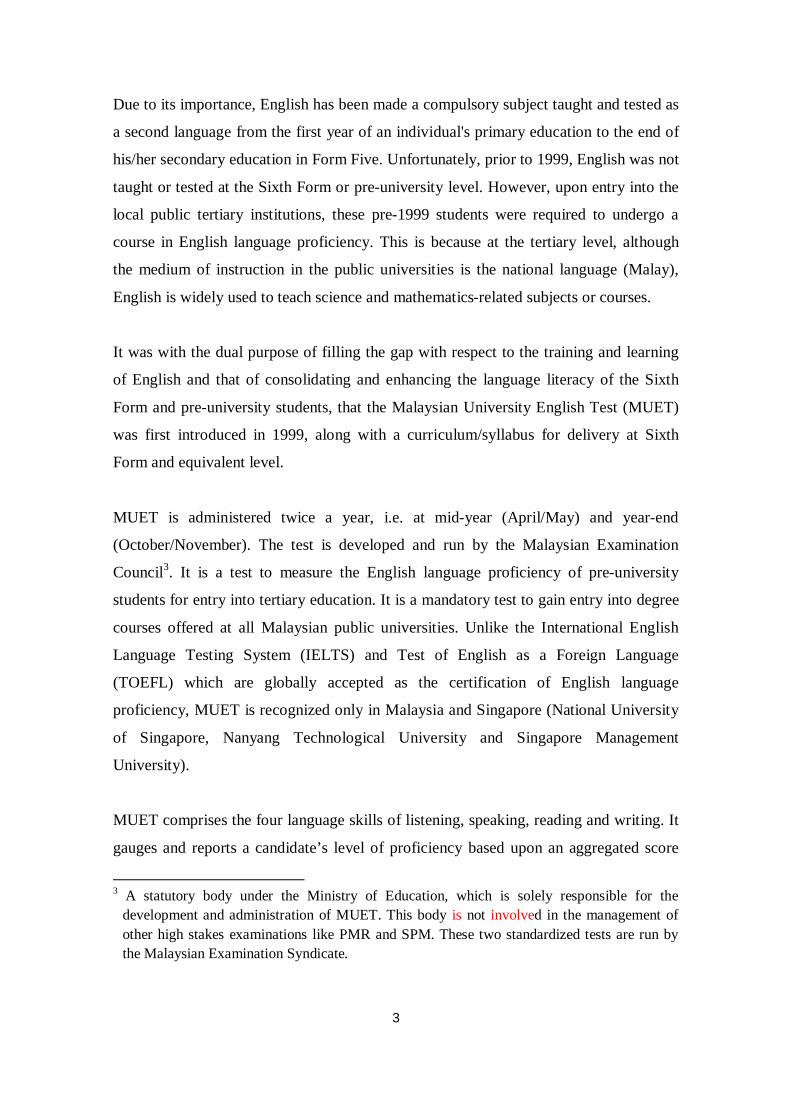
MUET is administered twice a year, i.e. at mid-year (April/May) and year-end
(October/November). The test is developed and run by the Malaysian Examination
Council3. It is a test to measure the English language proficiency of pre-university
students for entry into tertiary education. It is a mandatory test to gain entry into degree
courses offered at all Malaysian public universities. Unlike the International English
Language Testing System (IELTS) and Test of English as a Foreign Language
(TOEFL) which are globally accepted as the certification of English language
proficiency, MUET is recognized only in Malaysia and Singapore (National University
of Singapore, Nanyang Technological University and Singapore Management
University).
MUET comprises the four language skills of listening, speaking, reading and writing. It
gauges and reports a candidate’s level of proficiency based upon an aggregated score
3 A statutory body under the Ministry of Education, which is solely responsible for the
development and administration of MUET. This body is not involved in the management of other high stakes examinations like PMR and SPM. These two standardized tests are run by the Malaysian Examination Syndicate.
4
ranging from zero to 300 which is then converted into a banding system ranging from
the lowest, Band 1 to the highest, Band 6.
The MUET syllabus aims to equip students with the appropriate level of proficiency in
English so as to enable them to perform effectively in their academic pursuits at tertiary
level. The syllabus is designed to bridge the gap in language needs between secondary
and tertiary education by enhancing communicative competency, providing the context
for language use that is related to the tertiary experience and developing critical
thinking through the competent use of language skills. In a broader sense, it aims to
prepare Malaysian university graduates to be able to compete effectively at the global
level which requires the mastery of the lingua-franca spoken all over the world.
1.2 PROBLEM STATEMENT
After having received the SPM examination results, qualified students may move on to
study in various higher learning institutions in the country. They can choose to enrol in
Form Six (pre-university level), a matriculation college, a teacher training institute, a
polytechnic or a community college. At this level, English is given considerable
emphasis. For example, English is taught in teacher training colleges and matriculation
centres to help students to enhance their English proficiency as well as to prepare them
for the MUET exam. Teaching English or the MUET syllabus for pre-university
students is therefore, seen as a consolidation phase or continuation of what they have
learnt in secondary schools.
Achievement in MUET acts as an indicator of a student’s language proficiency level
and enables him or her to enrol for undergraduate programmes at Malaysian public
universities or other higher learning institutions. For most universities, students must
obtain a higher band in MUET in order to be accepted in the faculties of Engineering,
Dentistry, Medicine and Law. In University Malaya, for example, students aspiring to
pursue Bachelor of Law and Bachelor of TESL need to pass with at least Band 4 or
equivalent. In another case, Band 5 for MUET is the minimum requirement for students
enrolling in the Faculty of Law in MARA University of Technology. Thus, to be
granted admission to their choice of programme, students must pass the MUET with a
5
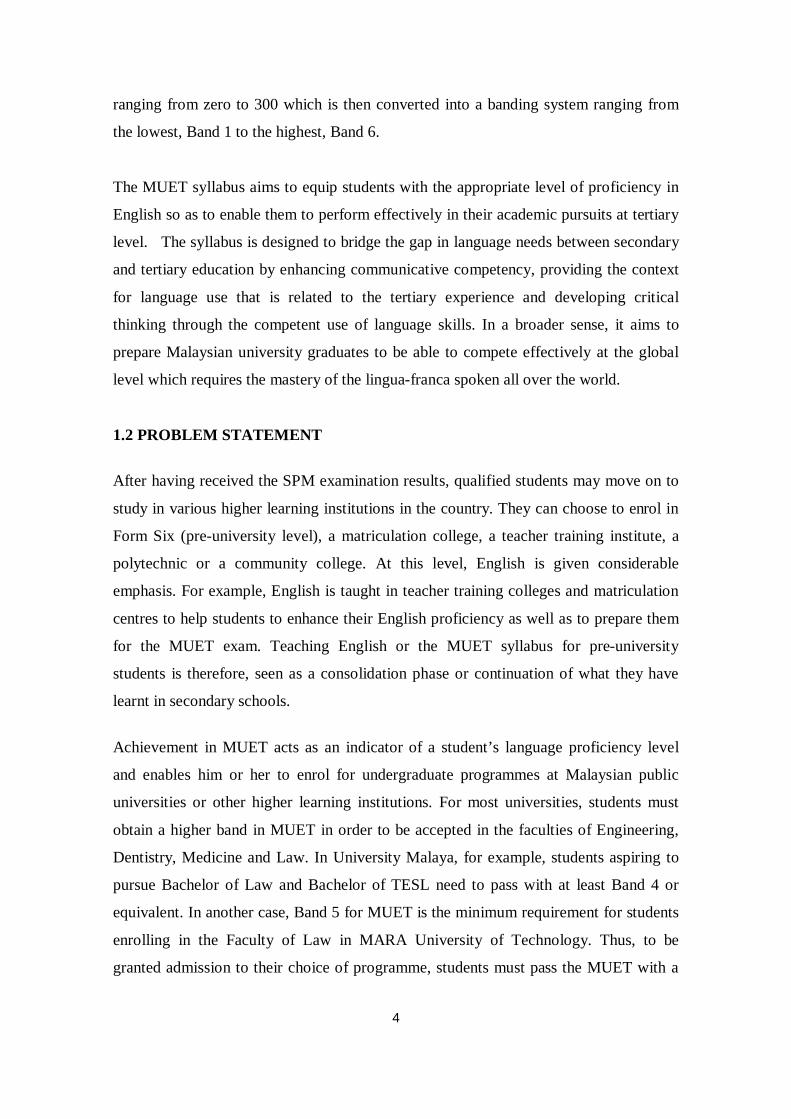
satisfactory grade to meet the requirement outlined by the universities. The following
chart depicts the use of MUET for pre-degree students in sixth form and equivalent.
Figure 1.1: Flow Chart of MUET Use for Pre-degree Students
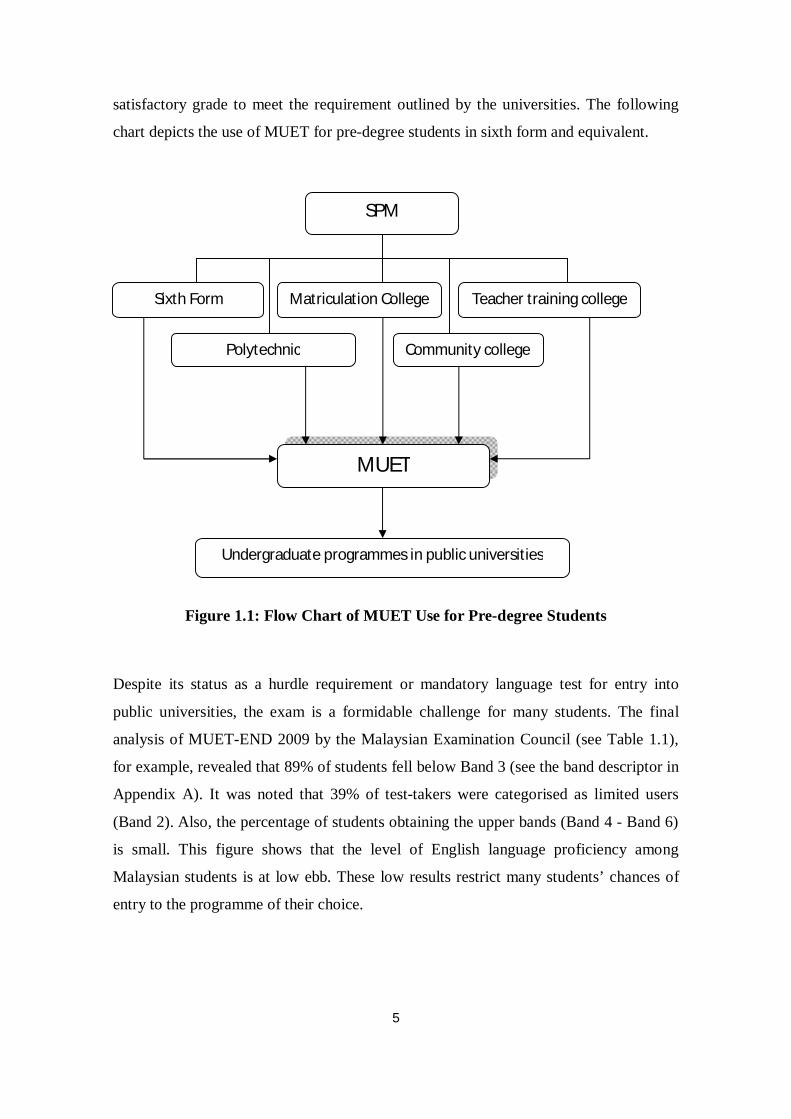
Despite its status as a hurdle requirement or mandatory language test for entry into
public universities, the exam is a formidable challenge for many students. The final
analysis of MUET-END 2009 by the Malaysian Examination Council (see Table 1.1),
for example, revealed that 89% of students fell below Band 3 (see the band descriptor in
Appendix A). It was noted that 39% of test-takers were categorised as limited users
(Band 2). Also, the percentage of students obtaining the upper bands (Band 4 - Band 6)
is small. This figure shows that the level of English language proficiency among
Malaysian students is at low ebb. These low results restrict many students’ chances of
entry to the programme of their choice.
SPM
Sixth Form Matriculation College Teacher training college
Polytechnic Community college
MUET
Undergraduate programmes in public universities
6
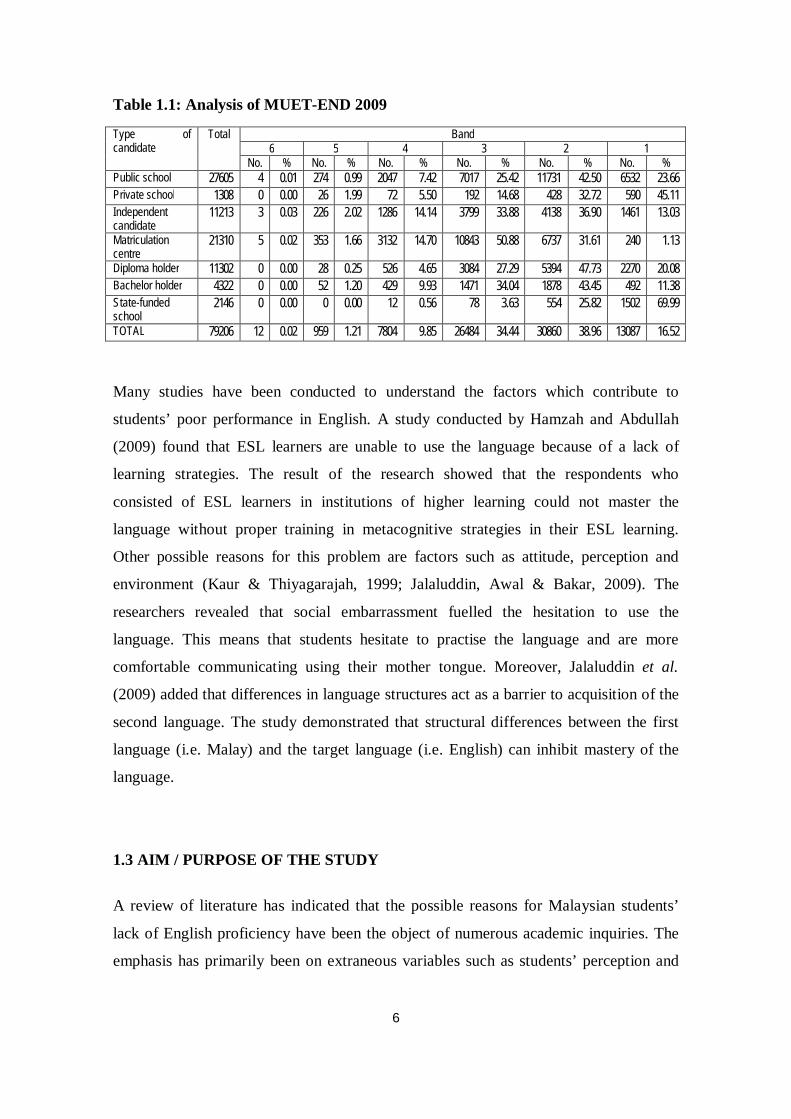
Table 1.1: Analysis of MUET-END 2009
Type of candidate
Total Band 6 5 4 3 2 1
No. % No. % No. % No. % No. % No. % Public school 27605 4 0.01 274 0.99 2047 7.42 7017 25.42 11731 42.50 6532 23.66
Private school 1308 0 0.00 26 1.99 72 5.50 192 14.68 428 32.72 590 45.11
Independent candidate
11213 3 0.03 226 2.02 1286 14.14 3799 33.88 4138 36.90 1461 13.03
Matriculation centre
21310 5 0.02 353 1.66 3132 14.70 10843 50.88 6737 31.61 240 1.13
Diploma holder 11302 0 0.00 28 0.25 526 4.65 3084 27.29 5394 47.73 2270 20.08
Bachelor holder 4322 0 0.00 52 1.20 429 9.93 1471 34.04 1878 43.45 492 11.38
State-funded school
2146 0 0.00 0 0.00 12 0.56 78 3.63 554 25.82 1502 69.99
TOTAL 79206 12 0.02 959 1.21 7804 9.85 26484 34.44 30860 38.96 13087 16.52
Many studies have been conducted to understand the factors which contribute to
students’ poor performance in English. A study conducted by Hamzah and Abdullah
(2009) found that ESL learners are unable to use the language because of a lack of
learning strategies. The result of the research showed that the respondents who
consisted of ESL learners in institutions of higher learning could not master the
language without proper training in metacognitive strategies in their ESL learning.
Other possible reasons for this problem are factors such as attitude, perception and
environment (Kaur & Thiyagarajah, 1999; Jalaluddin, Awal & Bakar, 2009). The
researchers revealed that social embarrassment fuelled the hesitation to use the
language. This means that students hesitate to practise the language and are more
comfortable communicating using their mother tongue. Moreover, Jalaluddin et al.
(2009) added that differences in language structures act as a barrier to acquisition of the
second language. The study demonstrated that structural differences between the first
language (i.e. Malay) and the target language (i.e. English) can inhibit mastery of the
language.
1.3 AIM / PURPOSE OF THE STUDY
A review of literature has indicated that the possible reasons for Malaysian students’
lack of English proficiency have been the object of numerous academic inquiries. The
emphasis has primarily been on extraneous variables such as students’ perception and
7
attitude, social environment and linguistic factors. It appears that these extraneous
variables are hindrances to Malaysian students mastering the language and eventually
this affects their performance in a language test, in this case MUET (Kaur &
Thiyagarajag, 1999; Jalaluddin, et al., 2009; Hamzah & Abdullah, 2009).
Unfortunately, studies that concentrate on the influence of the actual test items on the
difficulty level of a particular test have been minimal. To date, there have been no
previously published or unpublished studies undertaking a comprehensive exploration
of these psychometric issues in the Malaysian context, although analysis of this problem
has been hampered by restricted access to the test data.
Based on the results obtained from the previous administrations of MUET, many test-
takers of MUET struggle with the reading comprehension test. There is concern that
Malaysian students and graduates lack reading comprehension skills (Sarudin &
Zubairy, 2008). Malaysian university graduates also have been criticised for lacking
general reading skills to perform effectively at the workplace. Of the four components
in MUET, reading comprehension has been given the highest weighting, i.e. 40% of the
total score. This clearly shows that the Malaysian educational policy is concerned with
equipping students with reading skills to engage successfully in tertiary education. This
is due to the fact that in the second language learning context, reading is perceived as a
prominent academic skill for university students. Carrell (1988) acknowledges that:
It is through reading that learners are exposed to new information and are able to
interpret, evaluate and synthesize the course content. Yet, most often, many students
who enrol in higher learning institutions are unprepared for the reading demands of
academic life. Poor performance on MUET can be seen as one of the indicators of this
“In second language teaching/learning situations for academic purposes, especially in higher education in English-medium universities, or other programmes that make extensive use of academic reading materials written in English, reading is paramount. Quite simply, without solid reading proficiency, second language readers cannot perform at levels they must in order to succeed...”
(Carrell, 1988, p.1)
8
problem. Factors such as poor reading strategies, low interest in reading English
materials and reading habits are mentioned by researchers as the causes of reading
problems for Malaysian ESL learners (Ramaiah & Nambiar, 1993; Abdul Majid, Jelas
& Azman, 2002, Ibrahim, 2005, 2006). Obviously, reading comprehension is seen as
the key to unlocking success and thus warrants particular attention, especially in the
ESL context.
As mentioned earlier, a national standardized high stakes examination like MUET plays
a vital role in assessing Malaysian students’ academic achievement. MUET is used as a
means of entry to undergraduate courses in public universities. It is essential therefore
that the test is of high quality. Previous studies show that extraneous factors have been
the focal point of examining the poor achievement in the English language test. In the
Malaysian context, empirical research that focuses on the psychometric property of the
test at the item level has yet to receive due attention. The main purpose of the present
study is to address this gap and to examine the psychometric properties of the test (the
quality of the test) as well as to investigate the role played by test item characteristics as
the contributing factors for the difficulty level of MUET, particularly the reading
component.
Pumfrey (1976) and Schwartz (1984) summarized that the most important
characteristics of a good reading test are validity, reliability and practicality. The first
two characteristics are relevant to the present study. Therefore, for the purpose of this
research, it is necessary to investigate the quality of individual items in order to examine
the reliability and validity of this MUET reading test. This is because test developers
have recognized that reliability and validity of test scores are contingent upon the
quality of the test items (Reynolds, Livingston & Wilson, 2009). Logically, as the
quality of the individual items improves, the overall quality of the test also improves.
This process of item analysis is viewed as the key to the development of a successful
test as it provides insights about the pattern of students’ response to an item and the
relation of the item to the overall performance (Nunnally & Bernstein, 1994). The item
analysis in this research utilized the two analytic procedures that are commonly used in
test development and validation, namely traditional or standard item analysis within the
9
framework of Classical Test Theory (CTT) and the Rasch model, one of the models of
Item Response Theory (IRT).
The second aim of this research is to explore the influence of item features on the
difficulty of reading comprehension items. Investigation dwelled on several
characteristics of test items such as the type of question, length of the passage,
plausibility of distractors and number of alternatives as the contributing agents to item
difficulty. In this study, a regression analysis was conducted to investigate the
relationship between the selected item features/characteristics and the difficulty level of
the reading comprehension items.
Another purpose of this research is to examine the effect of students’ background
characteristics on their responses to items of the MUET reading test. Differential Item
Functioning (DIF) analysis was utilised to explore the extent to which the indicators of
DIF such as gender, geographical location and ethnicity, are likely to reflect students’
responses. In the case of high-stake examination, DIF analysis is important as the reality
of plurality in Malaysia should be taken into consideration in the construction of any
test item. Standardized tests, which, by definition, give all test-takers the same test
under the same (or reasonably equal) conditions, should ensure fairness regardless of
race, socioeconomic status, or other considerations.
1.4 RESEARCH QUESTIONS
Based on the above discussion, this research is designed to address the following
questions:
1. How do the items spread in terms of their difficulty value and ability of the
students?
2. How good are the items of the MUET reading test?
3. To what extent do the selected features of the test items contribute to the item
difficulty in the MUET reading test?
4. Is there any differential item functioning in the MUET reading test in terms of
gender, geographical location and ethnicity?
10
1.5 SIGNIFICANCE AND LIMITATION OF THE STUDY
It is hoped that this study will meet its objectives as mentioned earlier. Furthermore, it is
intended to provide sound information to the Ministry of Education generally, and to the
concerned divisions, particularly the Malaysian Examination Council and the Malaysian
Examination Syndicate. It is certainly a hope that the findings of this research will help
the institutions to implement quality control measures on their examination materials.
Information gained from this research can serve as a guide for those individuals who are
actively involved in the design and construction of test items, as it will provide a better
understanding of measurement complexity. More specifically, the findings from item
analysis of this study can be used by the Malaysian Examination Council test
constructors to design new sets of items for a more defensible reading test in MUET.
Item analysis indeed is valuable in improving items which will be used again in later
tests. It can also be used to eliminate ambiguous or misleading items. Popham (2000)
suggested that in large-scale-test development, empirical item-improvement through
item analysis should be given a major emphasis. It is this kind of empirical analysis that
facilitates the revision of test items.
The study of test features effects and DIF, in addition, can contribute to the
understanding of the effect of item features and examinee background characteristics on
the construct the test is intended to measure. The results of the effects of individual item
on the difficulty level of this reading test will inform the test writers to balance the
contents of particular features in the development of test items. The DIF analysis,
furthermore, will guide the test designers to control the possible causes of differences of
the groups being compared. Test characteristic effect and DIF investigation help test
evaluators to ensure test validity (Osterlind & Everson, 2009; Camilli & Shepard, 1994)
and to make decisions on the interpretation of a test score.
Due to time constraints, this research examines the factors affecting the item difficulty
of the reading test only. Thus, the findings of the study cannot be seen as the whole
performance and quality of MUET which consists of three other language skills;
listening, speaking and writing. In addition, the statistical analysis generated from the
11
data only relies on the features of model used; the Rasch model. It does not deal with
the other derivations of CTT (e.g., generalizability theory) and IRT models (e.g., two-
parameter model and three-parameter model).
Due to its limitation, the findings of this study cannot be generalized to the whole
population because the participants are limited to those candidates of MUET-END 2009
from two states; Sabah and Capitol Territory of Kuala Lumpur only.
1.6 STUCTURE OF THE THESIS
This thesis is divided into five chapters.
Chapter 1 provides introductory information for the study. The importance of English
language in Malaysian setting and the implementation of MUET for pre-university
students is described. The problems of low English proficiency among Malaysian
students are also discussed. This chapter introduces the aims of the study and the
research questions which need to be addressed in this study.
Chapter 2 outlines a review of literature on the topics of interest in this study. First, it
highlights the psychometric properties of CTT and the Rasch model for the item
analysis. It explains the item facility, item discrimination, reliability and fit index,
which are used to check the quality of the overall test. Second, it looks at the type of
several test characteristics which have been examined by the researchers to influence
the item difficulty of a test. Third, the discussion of the meaning of DIF and its relation
to bias is then presented. At the end, this chapter reviews the previous research related
to this study.
Chapter 3 describes the methodology utilized for this research. This includes the
description of the data/sample and the materials. This section also outlines the three
phases which are conducted in order to investigate the answers of the research
questions. The three procedures involved in the study are:
Item analysis of CTT and the Rasch model
12
Coding of individual items and regression analysis
DIF analysis
Chapter 4 presents the findings of the study. The first section describes the results of
the CTT and the Rasch item analysis. Next, the findings of the investigation on the six
predictors of item difficulty are discussed. The last part of this chapter reports the extent
to which the DIF indicators (gender, ethnicity and state) influence students’ response to
an item.
Chapter 5 gives the main conclusions from the findings of the study by providing
answers to the research questions. Implications of the findings for teaching and testing
MUET and further research are also given in this chapter.

13
CHAPTER 2: A REVIEW OF LITERATURE
2.1 INTRODUCTION
In the context of second language acquisition, reading is by far the most important skill
to be learnt (Carrell, 1988). Certainly, many learners of English language find
themselves engaged in reading most of the time in order to master the language. In
addition, the ability to read is a central asset in today’s modern, technologically-oriented
world. Numerous research findings have shown strong links between reading
proficiency and success in educational contexts at all ages; from the primary school to
university level (Adamson, 1993; Collier, 1989). In higher educational institutions that
make extensive use of academic materials written in English, reading is arguably the
basic foundation on which academic skills of the individual are built. In academia, most
subjects taught are based on a simple process – read, synthesize, analyze and process
information. Simply put, students’ performance in tertiary level is contingent upon their
reading proficiency.
Recognizing the importance of reading as a part of academic literacy, it is no surprise
that there have been many attempts to measure reading skills. Students’ reading ability
is frequently assessed using standardized tests. Today, there are dozens of commercial
reading tests, and for the purpose of English as a foreign/second language assessment,
the most frequently used tests are TOEFL and IELTS, that can be used as a means to
determine the attainment in or attitude towards reading (Pumfrey, 1976). These tests are
assumed to gauge reading ability which requires the test-takers to read various types of
passages and to respond to questions about the passage. The nature of the multiple-
choice format, which characterizes many standardized tests, provides an objective way
to determine the correct and incorrect responses. Many educators and researchers favour
this type of standardized test mainly due to its practicality (Brown, 2004).
14
2.2 ASSESSMENT OF READING COMPREHENSION
Devine (1989) defines reading comprehension as:
The above definition of reading comprehension implies that reading is a dynamic and
complex process (Pumfrey, 1976; Alderson, 2000; Devine, 1989; Carrell, 1988;
Schwartz, 1984). This means that readers are involved in an active process to construct
meaning from print or writing. The interactivity nature of reading, nonetheless, poses
challenges to the test design of reading skills. Ample studies have demonstrated that
reading assessment has particular complexities (Weaver & Kintsch, 1991; Klapper,
1992) due to the complex and active interactions between reader, text and task.
The first major challenge is that reading comprehension involves dynamic and multi-
component processes (Fletcher, 2006; Snow, 2003). Readers use a variety of reading
strategies to decipher the meaning of a written text. For example, readers may use
semantic, syntax and context clues to make sense of the meaning of unknown words.
They may also use various cognitive skills such as inferring, reasoning, predicting,
comparing and contrasting to draw conclusion of their interpretation of the text.
Readers also need to integrate the words they have read with their prior knowledge,
experience, attitude and language (in the case of second/foreign language context, this
refers to the interference of first language into the reading process). These complicated
activities pose an essential question; how do test constructors decide which aspect of
reading to measure? It appears that the complexity of cognitive process to derive
“Reading comprehension is the process of using syntactic, semantic, and rhetorical information found in printed texts to reconstruct in the reader’s mind, using the knowledge of the world he or she possesses (plus appropriate cognitive and reasoning abilities when necessary), a hypothesis or personal explanation that may account for the message that existed in the writer’s mind as the printed text was prepared.”
(Devine, 1989, p.120)
15
meaning challenges the test designers to accurately measure the many skills required for
a particular reading test.
Alderson (2000) and McKay (2006) supported the above notion and confirmed that
reading is both process and product. The process of reading is a reader-text interaction
which involves many different things that are going on when a reader reads. The
product of reading is comprehension or construction of meaning; that is, the
understanding of what has been read. Both need to be assessed. Alderson asserted that
any variable that has impact on either reading process or its product needs to be taken
into account in test design and test validation. He also noted that assessing the process
of reading can be a challenging task for educational practitioners.
Additionally, Pumfrey (1976) pointed out that “reading is characteristically
developmental” (p.11). This suggests that the skills required by young readers
inevitably differ from adult learners especially those at the tertiary stages of education.
Thus, the relative importance of particular reading skills at a given stage should be a
prime concern in designing items for reading assessment.
Another challenge of reading assessment is that, like listening, it is often associated with
the measurement of other skills (Mckay, 2006). For instance, judgement of student’s
reading ability is observable through speaking or writing. Therefore, care needs to be
taken so that assessment of reading will not be ‘contaminated’ by other skills. In regard
to the integration of reading with other language skills, its unobservable nature calls for
the assessment to be carried out by inference (Brown, 2004). As a result, this leads to a
challenge in the justification or interpretation of the test. The irony here is that the
interpretation of testing comprehension of receptive skills has become a controversial
issue due to the reality that different readers infer from or interpret a written text in
different ways (Alllison, 1999).
The preceding challenges, nonetheless, lead to another crucial issue in reading
assessment, that is, construct validity. As described in the Standards for Educational
and Psychological Testing (AERA, APA, & NCME, 1999), validity refers to “the
16
degree to which evidence and theory support the interpretations of test scores entailed
by proposed uses of tests” (p. 9) and a construct is defined as “the concept or
characteristic that a test is designed to measure” (p. 173). In its simplest terms, construct
validity refers to multiple sources of evidence supporting or refuting the accurate
interpretation of test score (Messick, 1995).
Leading scholars of language testing have identified two major threats to score validity:
construct underrepresentation and construct-irrelevant variance. Messick (1996)
asserted that the validity of the test is affected by an inadequate or incomplete sampling
of the construct (construct underrepresentation) and the measurements of ‘things’ that
are simply not relevant to a construct (construct-irrelevant variance).
It has been repeatedly noted that any sources of construct-irrelevant variance may lead
to incorrect inference of the test takers, and therefore, diminish validity (McNamara,
2000; Alderson, 2000).
It is clear that a construction of reading assessment requires a series of decisions. It is a
demanding task for test writers to decide what skills to measure, how to measure them
and how to interpret the test score. Despite its challenges, it has been acknowledged that
assessment of reading plays a crucial role in educational practice and research. It is
claimed that reading test results can be used as an indicator for evaluation of various
approaches to the teaching of reading (Pumfrey, 1976; Schwartz, 1984) and for
improvement of reading comprehension ability (Snow, 2003). This is because of the
positive washback4 of reading assessment that provides strategies for researchers and
teachers to identify and diagnose reading comprehension problem in students. The
importance of reading assessment then justifies that research on comprehension
assessment is paramount. In his introductory note of Alderson’s (2000) book, Bachman
recognized that “reading, through which we can access worlds of ideas and feelings, as
4 Generally, washback refers to the effect of testing on the process of teaching and learning.
Bachman and Palmer (1996) consider washback to be a subset of a test impact on a larger context; educational system and society.
17
well as the knowledge of the ages and visions of the future, is at once the most
extensively researched and the most enigmatic of the so-called language skills” (p. x).
2.3 PSYCHOMETRIC ITEM ANALYSIS OF THE MUET READING TEST
Both sets of stakeholders, teachers and students, perceive MUET as a high stakes test.
Due to its significance as a mandatory requirement for admission into public
universities, it is, therefore, essential to assess the reliability and validity of this test. In
other words, as part of evaluation practice, it is fundamental to review test items after
they have been constructed or administered.
The process of evaluating the effectiveness of individual items in a test is called item
analysis. It is normally conducted for the purpose of item selections in the construction
and revision phases of the test. In addition, it is also performed to investigate how well
the items are working with a target group of students. Nunnally and Bernstein (1994)
highlighted that item analysis is extremely useful as it furnishes important information
how examinees respond to each item and how each item relates to the overall
performance of the test. In this study, all 45 items of the MUET reading test are
scrutinized for statistical analysis using the framework of CTT and the Rasch model.
It should be emphasized here that the purpose of this paper is not to compare the two
approaches; but to demonstrate how they complement each other as a tool for
educational assessment. The discussion of psychometric characteristics of CTT and the
Rasch model in this section will necessarily be an overview, without extensive recourse
to the mathematical equations of the concerned properties, and the contentious
arguments about which particular approach is superior.
2.3.1 Classical Test Theory (CTT)
CTT is derived from a relatively simple assumption. CTT statistics are based on the
total scores on a test. It assumes that total scores, typically defined as the number of
correct responses, serve as the sole indicator of a person’s level of ability or knowledge
(de Ayala, 2009). Obviously, in CTT, the examinee’s attained score on the whole test is
18
the unit of focus. Hambleton and Jones (1993) acknowledge that the major advantage of
CTT is its “relatively weak assumptions”, which makes it easy to apply in many testing
situations. It is considered to be “weak” because the above assumption is likely to be
met by the data.
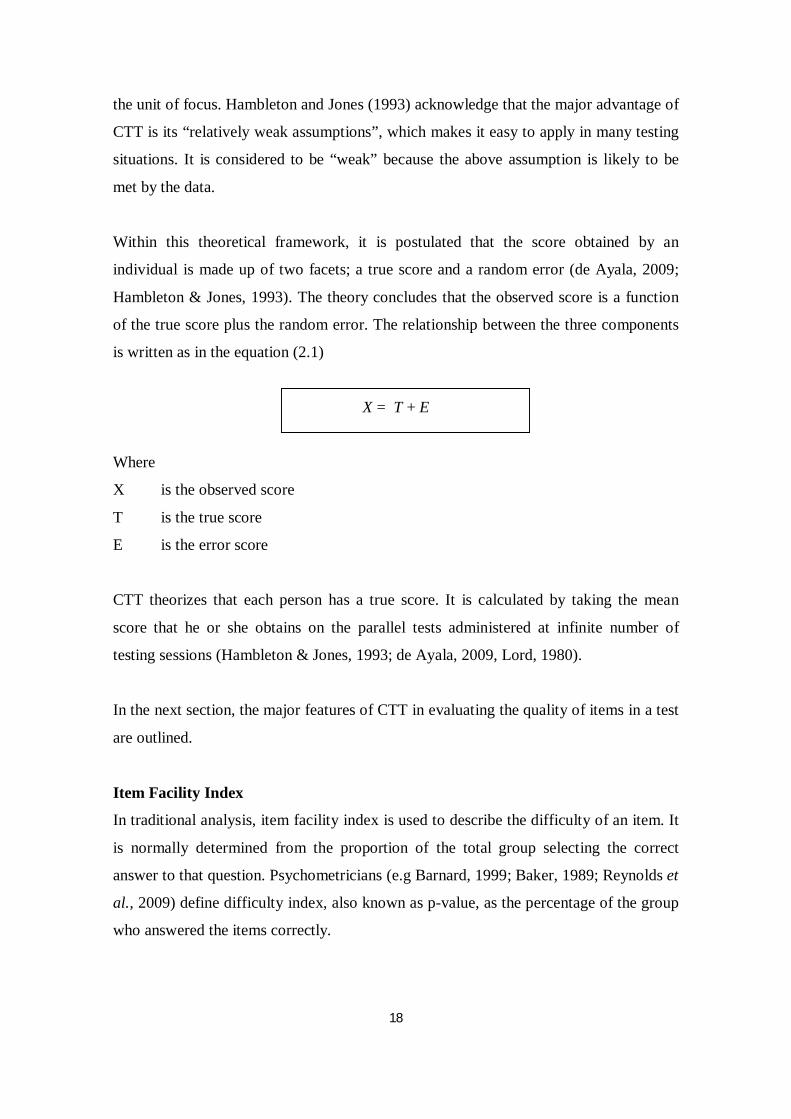
Within this theoretical framework, it is postulated that the score obtained by an
individual is made up of two facets; a true score and a random error (de Ayala, 2009;
Hambleton & Jones, 1993). The theory concludes that the observed score is a function
of the true score plus the random error. The relationship between the three components
is written as in the equation (2.1)
X = T + E
Where
X is the observed score
T is the true score
E is the error score
CTT theorizes that each person has a true score. It is calculated by taking the mean
score that he or she obtains on the parallel tests administered at infinite number of
testing sessions (Hambleton & Jones, 1993; de Ayala, 2009, Lord, 1980).
In the next section, the major features of CTT in evaluating the quality of items in a test
are outlined.
Item Facility Index
In traditional analysis, item facility index is used to describe the difficulty of an item. It
is normally determined from the proportion of the total group selecting the correct
answer to that question. Psychometricians (e.g Barnard, 1999; Baker, 1989; Reynolds et
al., 2009) define difficulty index, also known as p-value, as the percentage of the group
who answered the items correctly.
19
The range of facility index is from 0% to 100%, or more typically written as a
proportion as 0.0 to 1.00. A value of p =100% indicates that all the students selected the
correct answer and so that item is very “easy”. A value of 0 indicates that none of the
students selected the correct answer and so that item is very “difficult”. Simply put, the
higher the p-value, the easier the item.
Test constructors use this facility index to rank the items in a subset (Baker, 1989).
Notably, it is common practice in a test construction that a subtest starts with an easy
item. From a motivational perspective, this is deliberately done to get students relaxed
and confident so their exam anxiety can be lowered.
Ebel and Frisbie (1991) concluded that the value of difficulty index reflects the content
of the item and the ability of the group responding to the item.
Discrimination Index
Item discrimination is another property used in CTT as a guiding principle to assess the
quality of test items. It refers to the ability of an item to differentiate among students on
the basis of how well they know the material being tested. It evaluates the extent to
which item responses discriminate between high achievers and low achievers.
The item discrimination index can take on negative values and can range between -1.00
and 1.00. A discrimination index value of 1 is considered a perfect positive
discriminator. A value of 0 means no relationship between score on this item and
overall score and so the question does not discriminate between the two sub-groups of
students. High positive correlation is obtained for items that high-scoring students on
the test tend to get the item right and low-scoring students on the test tend to get wrong.
Such items are interpreted to be high in discrimination. Negatively discriminating items,
on the other hand, show the opposite relationship (Ebel & Frisbie, 1991). Obviously,
high discriminating items are able to divide students into two subgroups: upper group
and lower group or high achiever and lower achiever.
20
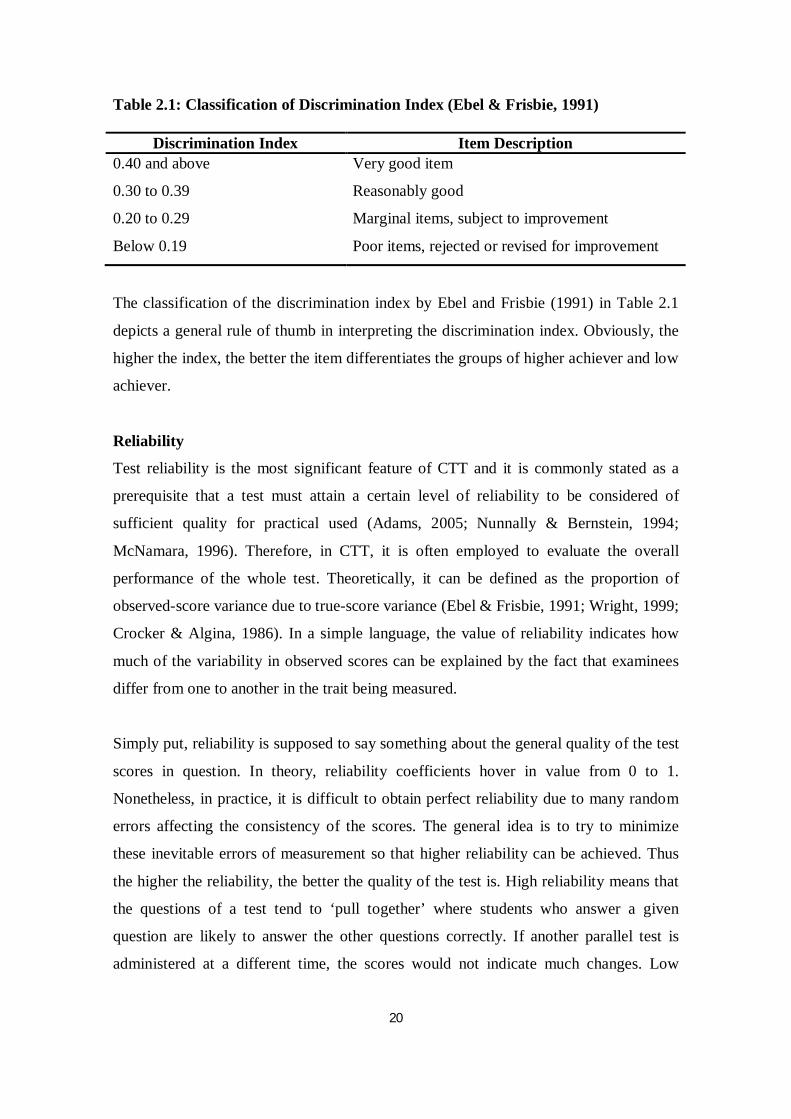
Table 2.1: Classification of Discrimination Index (Ebel & Frisbie, 1991)
Discrimination Index Item Description 0.40 and above Very good item
0.30 to 0.39 Reasonably good
0.20 to 0.29 Marginal items, subject to improvement
Below 0.19 Poor items, rejected or revised for improvement
The classification of the discrimination index by Ebel and Frisbie (1991) in Table 2.1
depicts a general rule of thumb in interpreting the discrimination index. Obviously, the
higher the index, the better the item differentiates the groups of higher achiever and low
achiever.
Reliability
Test reliability is the most significant feature of CTT and it is commonly stated as a
prerequisite that a test must attain a certain level of reliability to be considered of
sufficient quality for practical used (Adams, 2005; Nunnally & Bernstein, 1994;
McNamara, 1996). Therefore, in CTT, it is often employed to evaluate the overall
performance of the whole test. Theoretically, it can be defined as the proportion of
observed-score variance due to true-score variance (Ebel & Frisbie, 1991; Wright, 1999;
Crocker & Algina, 1986). In a simple language, the value of reliability indicates how
much of the variability in observed scores can be explained by the fact that examinees
differ from one to another in the trait being measured.
Simply put, reliability is supposed to say something about the general quality of the test
scores in question. In theory, reliability coefficients hover in value from 0 to 1.
Nonetheless, in practice, it is difficult to obtain perfect reliability due to many random
errors affecting the consistency of the scores. The general idea is to try to minimize
these inevitable errors of measurement so that higher reliability can be achieved. Thus
the higher the reliability, the better the quality of the test is. High reliability means that
the questions of a test tend to ‘pull together’ where students who answer a given
question are likely to answer the other questions correctly. If another parallel test is
administered at a different time, the scores would not indicate much changes. Low
21
reliability, in contrast, shows that the questions seemed unrelated to each other in terms
of who answer them correctly.
2.3.2 The Rasch Model
Unlike CTT, the key feature on which IRT is based, is that there is underlying latent
trait that is being measured (Hambleton, Swaminathan & Rogers, 1991). That is why
this approach is also known as latent trait theory to emphasize this idea. Under this
notion, the unobservable nature of the trait is manifested by the item responses and the
test score (Wu, 2010; Wu & Adams, 2008). This means that the performance of an
individual in a test is seen as the predictor of his or her ability level.
Following the above basic principle, the Rasch model, the one-parameter IRT model
developed by a Danish mathematician Georg Rasch (1960), focuses on the pattern of
item responses. It applies a mathematical function that specifies the probability of a
discrete outcome, such as a correct response to an item, in terms of person and item
parameters. In contrast to traditional framework, the Rasch model is probabilistic in
nature (Bond & Fox, 2007; Hambleton et al., 1991; Henning, 1987). The assumption of
this model is based on the probability of success on an item can be completely
determined by two values: an item difficulty and a person ability . This probability
function, known as item characteristic curve (Hambleton et al., 1991; de Ayala, 2009)
can be explained by equation (2.2):
exp1exp1XPp
Where
p = P( X = 1 ) is the probability of correct response
is the person-parameter
is the item-parameter, generally known as item difficulty
22
Equation is given for the case of dichotomous5 data where (X= 1) indicates success (the
correct response) on the item, and (X= 0) means failure (the incorrect response).
In analysing the quality of a test, here are the main elements of Rasch model which need
to be examined.
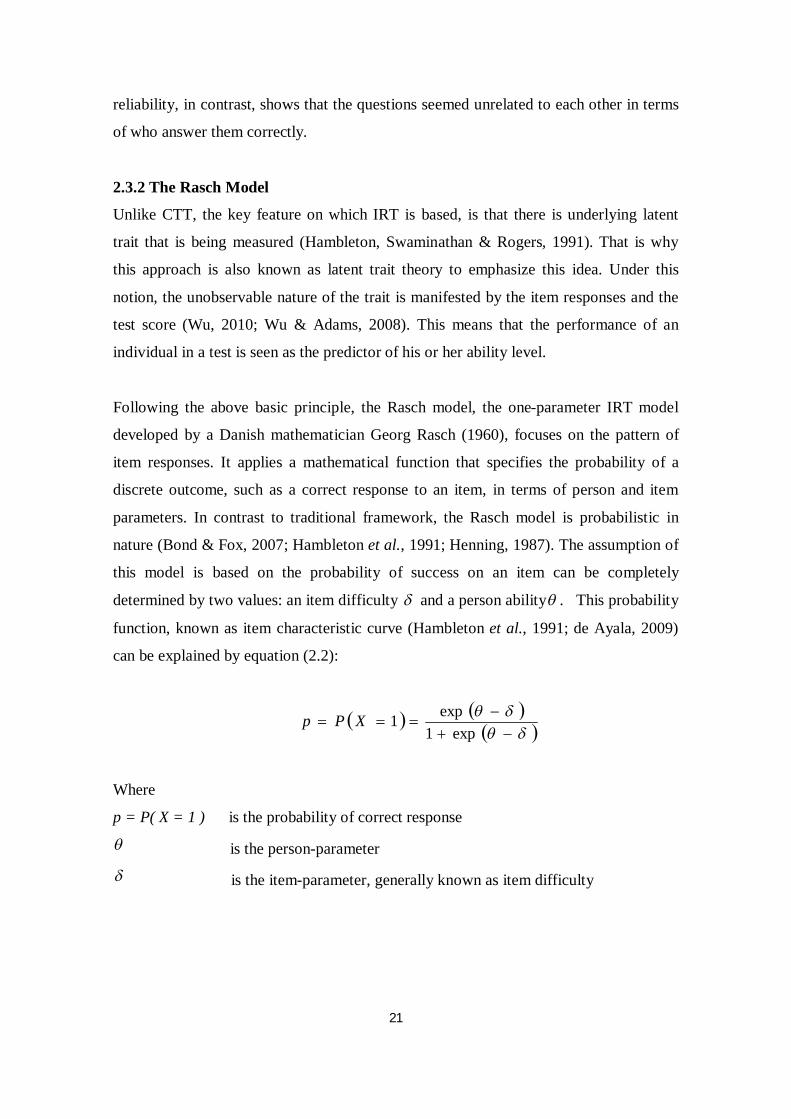
Item Difficulty and Person Estimate Ability
Initially, in the Rasch Model, person ability and item difficulty are conjointly estimated
and placed on a single numerical scale called logit (log odds unit). Person-parameter
and item-parameter are aligned on this scale where the probability of success is
routinely defined at 0.5 (Hambleton et al., 1991; Bond & Fox, 2007, Lord, 1980). That
is, a person’s ability measure is set at the point where he or she has a 50 percent chance
to either succeed or to fail. The logit scale is expressed according to an interval scale
where mean and standard deviation are arbitrary (Nunnally & Bernstein, 1994; Bond &
Fox, 2007). Therefore, the estimations of item-parameter and person-parameter are
about relative estimation, not an absolute measure.
3
basic knowledge
Task Difficulties
advanced
knowledge
Location of a student
1
2
6
3
4
5
Figure 2.1: Location of Person and Item Parameter (Wu & Adams, 2008 )
5 Dichotomous item is an item with only two types of response categories; correct (1) and
incorrect (0)
23
Figure 2.1 depicts the item-person map which constitutes an important difference
between Rasch measurement and CTT. As can be seen, the locations of the items and
the locations of students are calibrated on the same continuum. The upper end of the
continuum indicates greater ability level than the lower end. This suggests that items
located at the upper end require students to have advanced knowledge to answer the
items correctly. On the other hand, items at the lower end are assumed to deal with
questions of basic knowledge. It implies that these items are easy items because the
probability of students responding correctly to them is higher than those at the upper
end.
Item Discrimination
Under the Rasch model, item discrimination is called ‘equal discrimination’ or ‘equal
slope parameter’. The model assumes that all items have the same discriminating power
in measuring the latent variable of the object (Hambleton et al., 1991). This technical
property describes how well an item can differentiate between examinees having
abilities below the item location and those having abilities above the item location. The
assumptions of same discrimination index across items can be examined through the
ICC plot (Wu, 2010; Woods & Baker, 1985) and the mean square (MNSQ) statistics
(Wu & Adams, 2008).
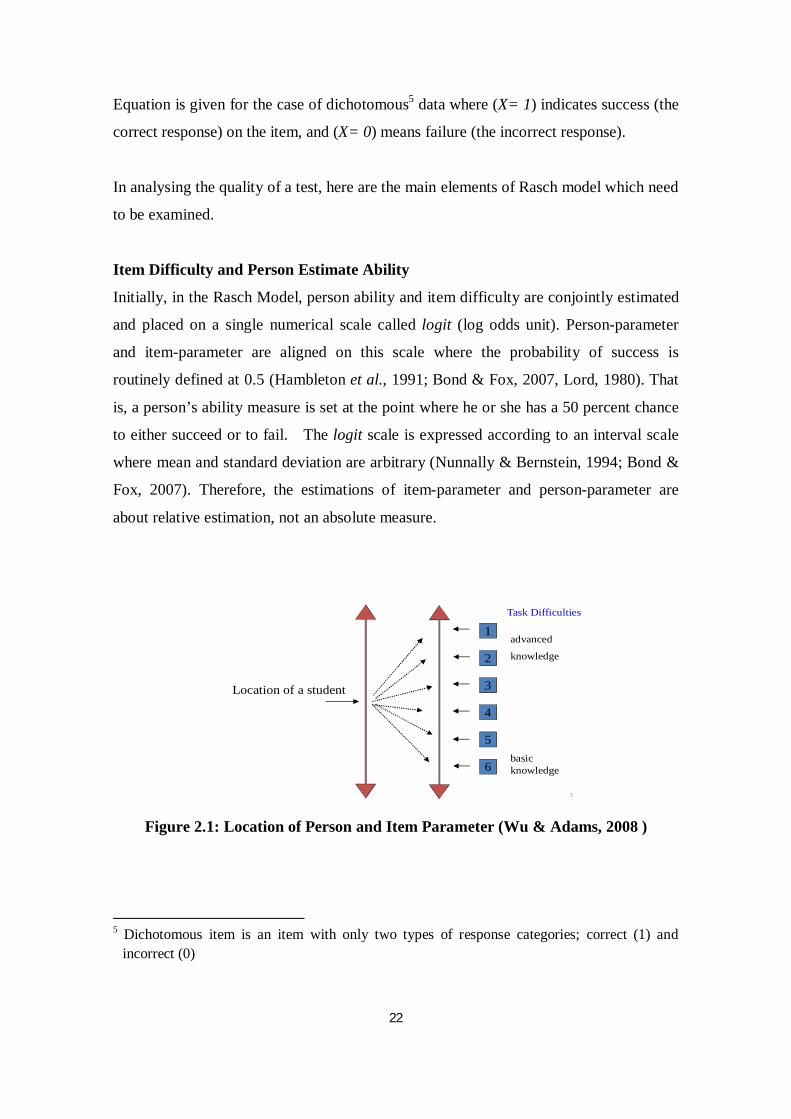
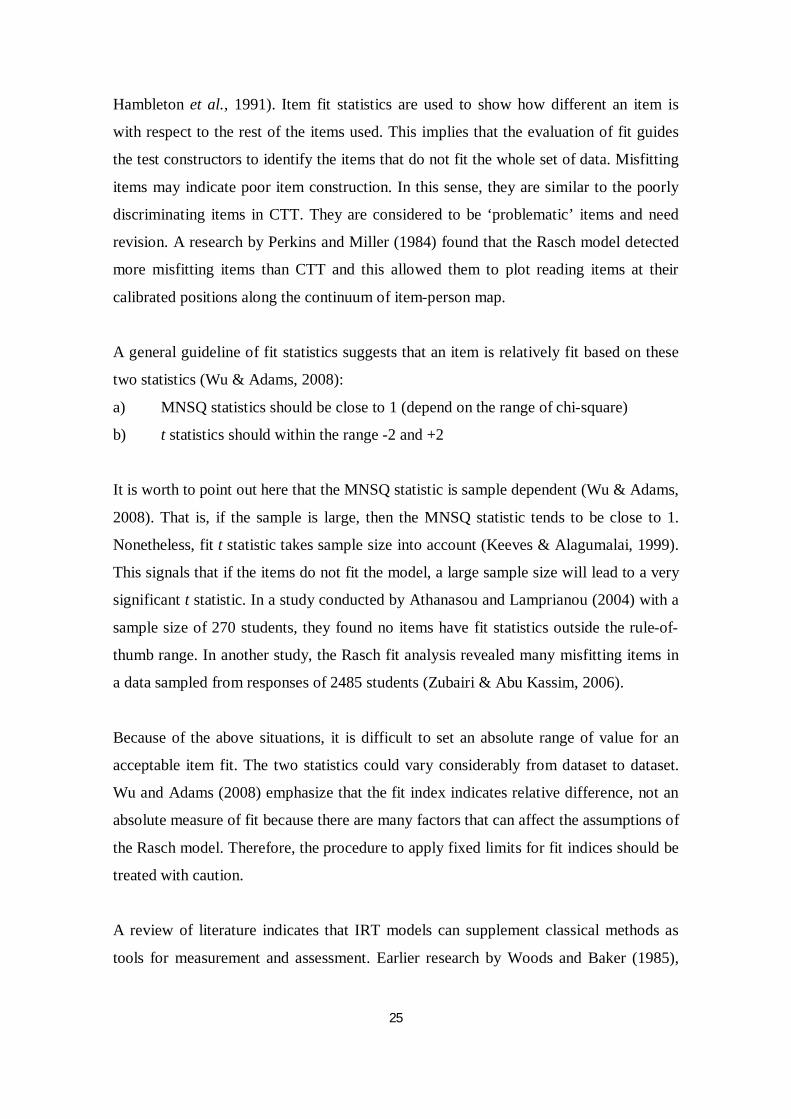
The concept of discrimination is illustrated in Figure 2.2 and Figure 2.3. As seen in
Figure 2.2, the steeper the curve the better the item can discriminate. It is also noted that
the MNSQ statistics is less than 1. On the other hand, Figure 2.3 demonstrates poor
discriminating item with a flatter curve and MNSQ statistics that is greater than 1.
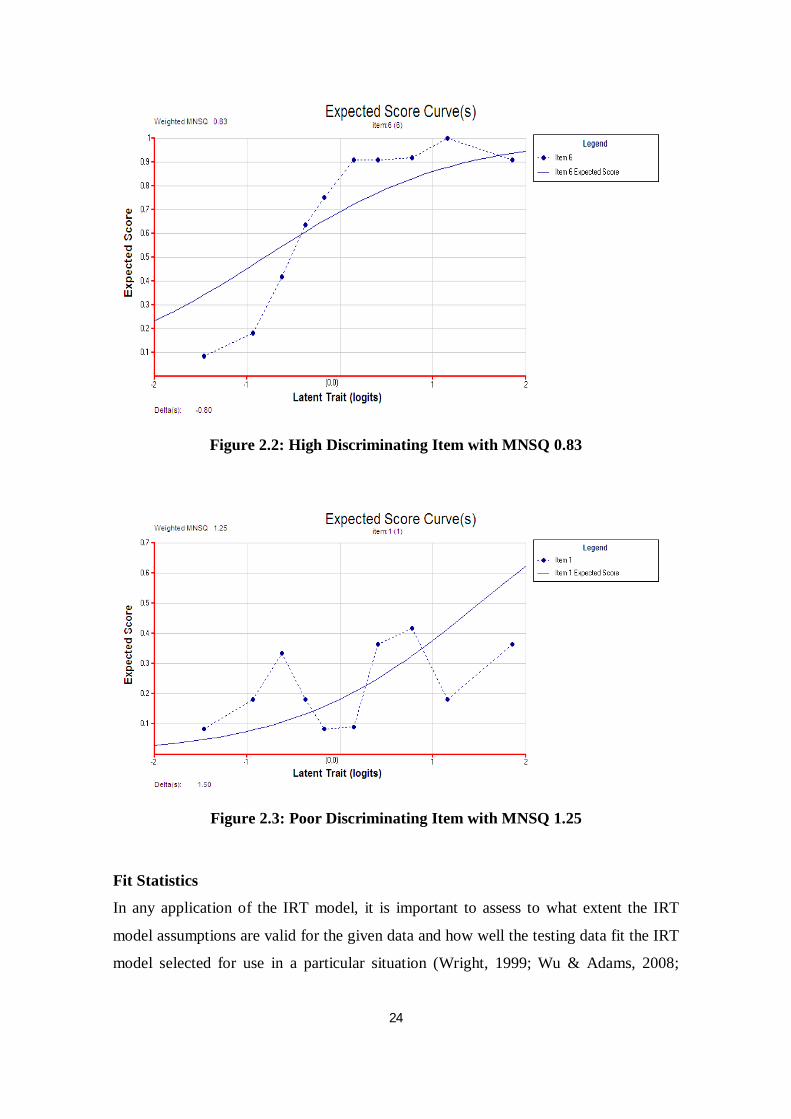
24
Figure 2.2: High Discriminating Item with MNSQ 0.83
Figure 2.3: Poor Discriminating Item with MNSQ 1.25
Fit Statistics
In any application of the IRT model, it is important to assess to what extent the IRT
model assumptions are valid for the given data and how well the testing data fit the IRT
model selected for use in a particular situation (Wright, 1999; Wu & Adams, 2008;
25
Hambleton et al., 1991). Item fit statistics are used to show how different an item is
with respect to the rest of the items used. This implies that the evaluation of fit guides
the test constructors to identify the items that do not fit the whole set of data. Misfitting
items may indicate poor item construction. In this sense, they are similar to the poorly
discriminating items in CTT. They are considered to be ‘problematic’ items and need
revision. A research by Perkins and Miller (1984) found that the Rasch model detected
more misfitting items than CTT and this allowed them to plot reading items at their
calibrated positions along the continuum of item-person map.
A general guideline of fit statistics suggests that an item is relatively fit based on these
two statistics (Wu & Adams, 2008):
a) MNSQ statistics should be close to 1 (depend on the range of chi-square)
b) t statistics should within the range -2 and +2
It is worth to point out here that the MNSQ statistic is sample dependent (Wu & Adams,
2008). That is, if the sample is large, then the MNSQ statistic tends to be close to 1.
Nonetheless, fit t statistic takes sample size into account (Keeves & Alagumalai, 1999).
This signals that if the items do not fit the model, a large sample size will lead to a very
significant t statistic. In a study conducted by Athanasou and Lamprianou (2004) with a
sample size of 270 students, they found no items have fit statistics outside the rule-of-
thumb range. In another study, the Rasch fit analysis revealed many misfitting items in
a data sampled from responses of 2485 students (Zubairi & Abu Kassim, 2006).
Because of the above situations, it is difficult to set an absolute range of value for an
acceptable item fit. The two statistics could vary considerably from dataset to dataset.
Wu and Adams (2008) emphasize that the fit index indicates relative difference, not an
absolute measure of fit because there are many factors that can affect the assumptions of
the Rasch model. Therefore, the procedure to apply fixed limits for fit indices should be
treated with caution.
A review of literature indicates that IRT models can supplement classical methods as
tools for measurement and assessment. Earlier research by Woods and Baker (1985),
26
Zubairi and Abu Kassim (2006) and Henning (1984) provided support for the
complementary nature of CTT and the Rasch model. Other studies demonstrate a
practical application of the Rasch model as a measurement strategy to assess and
evaluate language testing and assessments (see Henning, Hudson & Turner, 1985;
Perkins & Miller, 1984; Athanasou & Lamprianou, 2004).
2.4 THE EFFECTS OF TEST FEATURES AND EXAMINEE’S
CHARACTERISTICS ON ITEM DIFFICULTY OF READING TEST
In the field of language testing, it has been identified that the performance of students
on a comprehension test is a result of interaction between reader, text and test. Bachman
and Palmer (1996) highlighted that the characteristics of the tasks and the characteristics
of individuals that affect both language use and language test performance should be of
central interest in designing any language test. Alderson (2000) also agreed that
characteristics of both reader and test will affect the reading assessment.
Based on the correspondence between reader, text and test, one of the main concerns in
reading comprehension research has been the estimation of the contribution of the
characteristics of test features that are related or unrelated to the construct being
measured and/or test takers to the performance of reading ability. Moreover, the
identification of those factors is a prime concern in language testing to achieve a
construct validation result (Bachman, 1990; McNamara, 1996). This is to ensure that the
test is not affected by threats which may influence the performance of the students.
Acknowledging the importance of the dynamic interaction between reader, text and test,
the present study aims to identify the test features and individual characteristics that
contribute to the item difficulty of the MUET reading comprehension. For the first part
of the study, several test features have been identified to investigate the effect of these
characteristics on item difficulty. The second part of the study comprises a statistical
analysis of test item: differential item functioning (DIF) in order to understand the
relationship between students’ characteristics and test items.
27
2.4.1 Item Test Characteristics
The investigation of the effect of item test characteristics on the difficulty of reading
comprehension item often involves an analysis of various variables including passage
features, question type features and question format variables.
As previously mentioned, construct validity is a fundamental issue that should be taken
into serious consideration in any educational assessment (Messick, 1995; Osterlind &
Everson, 2009; McNamara & Roever, 2006; Camilli & Shepard, 1994; de Ayala, 2009).
Therefore, it is important here to differentiate the variables under consideration into two
subgroups: construct-relevant and construct-irrelevant variance.
Alderson (2000) has asserted that constructs of reading are those “variables that have an
impact on either the reading process or its products” (p. 120). He further exemplifies
those factors such as text variables, linguistic features, reader’s background,
subject/topic knowledge and a range of relevant reading skills and strategies as
important components of reading constructs. It is obvious that the first two variables –
passage features and question type features – are included as the constructs of reading.
On the other hand, construct-irrelevant variance refers to the situation where a test
gauges proficiencies irrelevant to the intended construct. Alderson (2000) identified that
overemphasis on metacognition and metalinguistic knowledge, as well as readers’
motivation and emotional state, are likely to underrepresent the construct of reading. He
also has explicitly highlighted that the test method is one of the sources that can
contaminate the constructs of reading assessment. Evidently, the last variable used in
this study – question format – is a source of construct-irrelevant variance.
Passage Feature Variables
Several features of text have been investigated to predict the difficulty of the reading
test. The most typical variable for passage feature is the type of the text. In the
Progressive Achievement Test in Reading (known as PAT-R), a reading comprehension
test used in Australian Schools, five text types are used; narrative, factual, expository,
tabular or graphical and procedural (Stephanou, Anderson & Urbach, 2008). In other
research regarding the type of text, Carr (2006) classified passage variables into arts,
28
humanities, social science, life science and earth/physical science. He also divided
passage variables into rhetorical features, propositional content, cohesion and focus
constructions.
Another commonly used text feature is the length of the passage. This feature is coded
according to the number of paragraphs and lines each passage contains (Scheuneman &
Gerritz, 1990). It is assumed that passages with more sentences or words are potentially
more difficult to comprehend.
Other studies have indicated a growing interest in examining other new features of
passage variable known to affect reading comprehension, including propositional
density of the text (Ozuru, Rowe, O’Reilly & McNamara, 2008) word frequency (Ozuru
et al., 2008; Davey, 1988; Scheuneman & Gerritz, 1990, Drum, Calfee & Cook, 1981),
concreteness (Davey, 1988) and proportion of clauses (Davey, 1988).
Question Type Variables
Researchers have used a variety of categories for the classification of question type.
Generally, the assumed level of cognitive operation provided by Bloom taxonomies has
dominated most of the question type in reading test and other language tests as well
(Davey, 1988; Davey & Macready, 1985, McKenna & Stahl, 2009). These questions
range from items requiring simple retrieval of information in the passage to those
involving higher level of inference and reasoning.
Pearson and Johnson (1978), classified question type into three simpler taxonomies:
textually explicit, textually implicit and script-based (Alderson, 2000; Davey, 1988).
Textually explicit questions are those items having both the question information and
the correct answer in a single sentence. Textually implicit questions, on the other hand,
require the examinee to locate the information across sentences. The third category,
script-based, involves the integration of text information and reader’s background
knowledge and the correct answer cannot be found in the text itself.
29
The coding scheme above is somewhat similar to McKenna and Stahl’s (2009) three
levels of question types: 1) Literal questions involve retrieval of information that has
been explicitly mentioned in the text, 2) Inferential questions require readers to make
logical connections among the facts in the text in order to arrive at an answer which
cannot be located in the passage, and 3) Critical questions call for value judgement
about the reading material and definitely the answers are not in the text. Using the same
framework of cognitive operation in locating the answers and making inference, PAT-R
has grouped the items of reading comprehension into: retrieving directly stated
information (RI), reflecting on texts (RF), interpreting explicit information (IF) and
interpreting by making inferences (II) (Stephanou et al., 2008). In addition to the
previously mentioned categories, McKay (2006) added another type known as text-
based questions that focus on the grammatical and vocabulary knowledge of the
readers.
Another way of categorizing question type is to distinguish between abstract and
concrete information requested by a question. Mosenthal (1996) addressed the level of
abstractness or concreteness of the information in a question and coded the items into
five levels: 1) the most concrete - calls for identification of persons, animals, or things,
2) highly concrete – asks for information about time, attributes or amounts, 3)
intermediate – requires the identification of manner, goal, purpose, alternative, attempt
or condition, 4) highly abstract – involves the identification of cause, effect, reason or
result, and 5) the most abstract – calls for information on equivalence, difference or
theme.
Other classifications of question type have been suggested by other researchers to
predict the difficulty of reading comprehension items. Researchers have begun to use
the question-classification framework of prior studies and suggested their own version
of coding schemes (e.g. Ozuru et al., 2007, 2008; Scheuneman & Gerritz, 1990; Davey,
1988).
30
Question Format Variables
Perhaps the most popular classification of question format in reading tests is the
multiple-choice item6 vs. free-response item7. Several works have demonstrated that
question formats can serve as a source of difficulty of reading comprehension items
(e.g. Davey, LaSasso & Macready, 1983; Ebel, 1982).
Due to the fact that standardized reading tests often utilize the multiple-choice format,
classifications of question format focus on features of multiple-choice items which
consist of stem and alternatives (made up of several wrong answers, known as
distractors, and at least one correct answer). For example, stem, the stimulus segment or
statement of a multiple-choice item, is frequently grouped into wh- direct question8 and
incomplete statement9 format (Popham, 2000).
Other question format variables that have become of interest for exploration include
stem length, stem content words, structure of alternatives/options, length of correct
answer and distractors, etc. For example, Scheuneman and Gerritz (1990) recommended
three categories of option structures based on the previous work of Carlton and Harris
(1989). The categories were: a) complete sentence or complex phrases containing
clauses that could stand alone as sentence, b) simple phrases, and c) short lists of 1-4
words. In another study, question format is addressed in terms of the falsity of the
distractors. A falsifiable distractor means that the information which establishes that the
option is incorrect is explicit in the text, whereas a distractor is not falsifiable if the
passage does not provide explicit textual evidence (Ozuru et al., 2008).
6 The format which requires students to respond to a question by selecting the correct answer
from three, four or five options
7 Also known as constructed-response item. This question requires students to write or construct their answer, rather than simply selecting it
8 Complete statement of question which normally begins with wh-question (i.e. what, who, when, where, which, why, whose and how) and ends with question mark
9 The question is formatted as incomplete statement where an omission occurs at the end of the stem/question
31
2.4.2 Individual Characteristics and Differential Item Functioning (DIF)
According to Bachman’s and Palmer’s (1996) philosophy of language testing, fairness
is one of the central considerations in test design. Fairness stipulates equal educational
opportunities for all students regardless of their ethnic background, economic and social
status and gender. The Code of Fair Testing in Education developed by the Joint
Committee on Testing Practices (2004) urges test developers to design tests that are as
fair as possible without demeaning the examinees of different races, ethnic background,
gender or demographical location (rural and urban).
Fairness is a complex and broad area, involving test design, development, test
administration and scoring procedures (Kunnan, 2000; Popham, 2000; McNamara &
Roever, 2006). In the layperson’s view, bias is typically associated with unfairness and
favouritism. Psychometrically, Angoff (1993) defined an item is biased if test takers of
equal ability from different groups respond differently to the item. Shepard et al. (1981)
defined bias as “a kind of invalidity that harms one group than another” (p. 318).
In the language testing context, examination items are considered biased if they contain
sources of difficulty that are not relevant to the construct being measured (Zumbo,
1999). This suggests that bias is present when construct-irrelevant characteristics of the
test takers influence the score of a test. An item might also be considered biased if it
contains language or content that is differentially difficult for different subgroups of
test-takers. In addition, an item might demonstrate item structure and format bias if
there are ambiguities or inadequacies in the item stem, test instructions, or distractors
(Hambleton & Rogers, 1995).
There are two methods to investigate potential bias in measurement/assessment
(Zumbo, 1999); (a) judgmental and (b) statistical. Zumbo recommended that in a high-
stake test, statistical techniques seem feasible and defensible to flag potentially biased
items and this leads us to differential item functioning (DIF).
The problem of inconsistent behaviour of common items across administrations can be
viewed as an instance of (DIF), where two groups taking two different forms with some
items in common are the focal and reference groups. Supposedly, two groups of student
32
with the same level of English language proficiency should have equal probabilities of
responding to a reading test item correctly. If their probabilities are different, the item is
said to exhibit DIF.
Dorans and Holland (1993) defined DIF as a psychometric difference between groups
that are matched on the ability or the achievement measured by an item. That is, an item
exhibits DIF if it provides a consistent advantage or disadvantage to members of a
group, not because of differences in the trait of interest, but because of differences in
other traits or because different versions (e.g., translations) of an item measure different
traits. More simply, when examinees in different groups have different probabilities of
answering an item correctly after controlling for overall ability, the item is said to
exhibit DIF (Shepard et al., 1981).
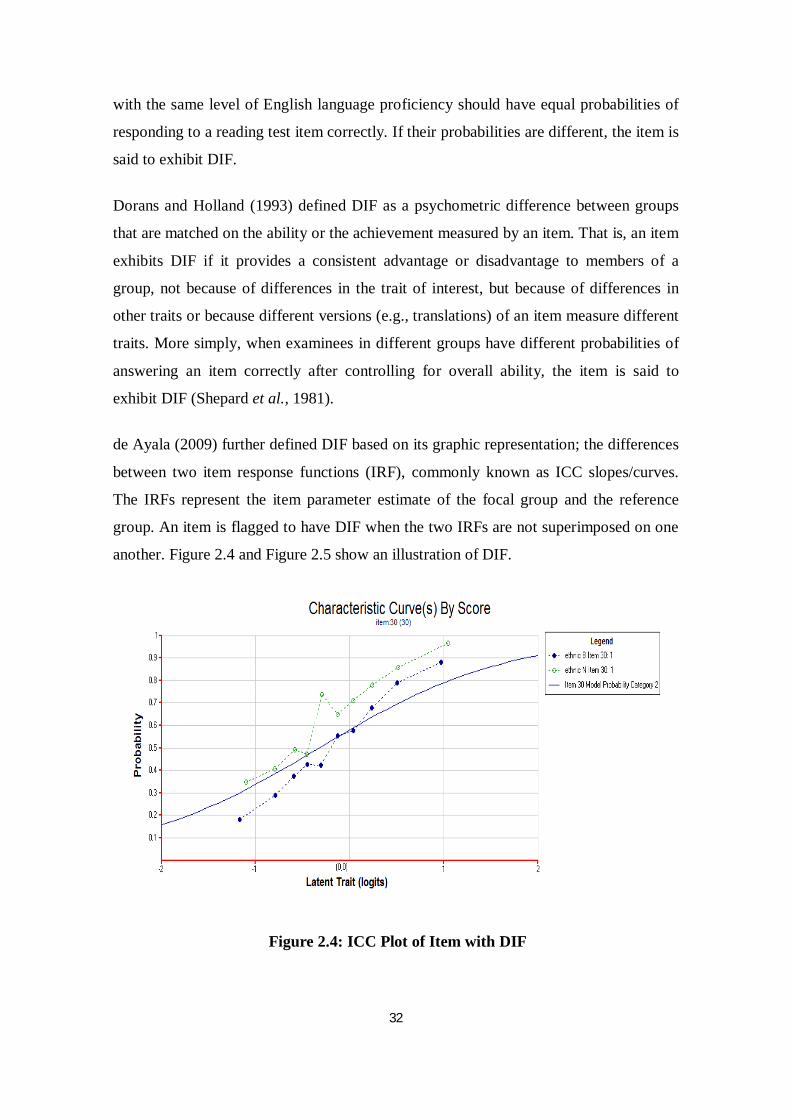
de Ayala (2009) further defined DIF based on its graphic representation; the differences
between two item response functions (IRF), commonly known as ICC slopes/curves.
The IRFs represent the item parameter estimate of the focal group and the reference
group. An item is flagged to have DIF when the two IRFs are not superimposed on one
another. Figure 2.4 and Figure 2.5 show an illustration of DIF.
Figure 2.4: ICC Plot of Item with DIF
33
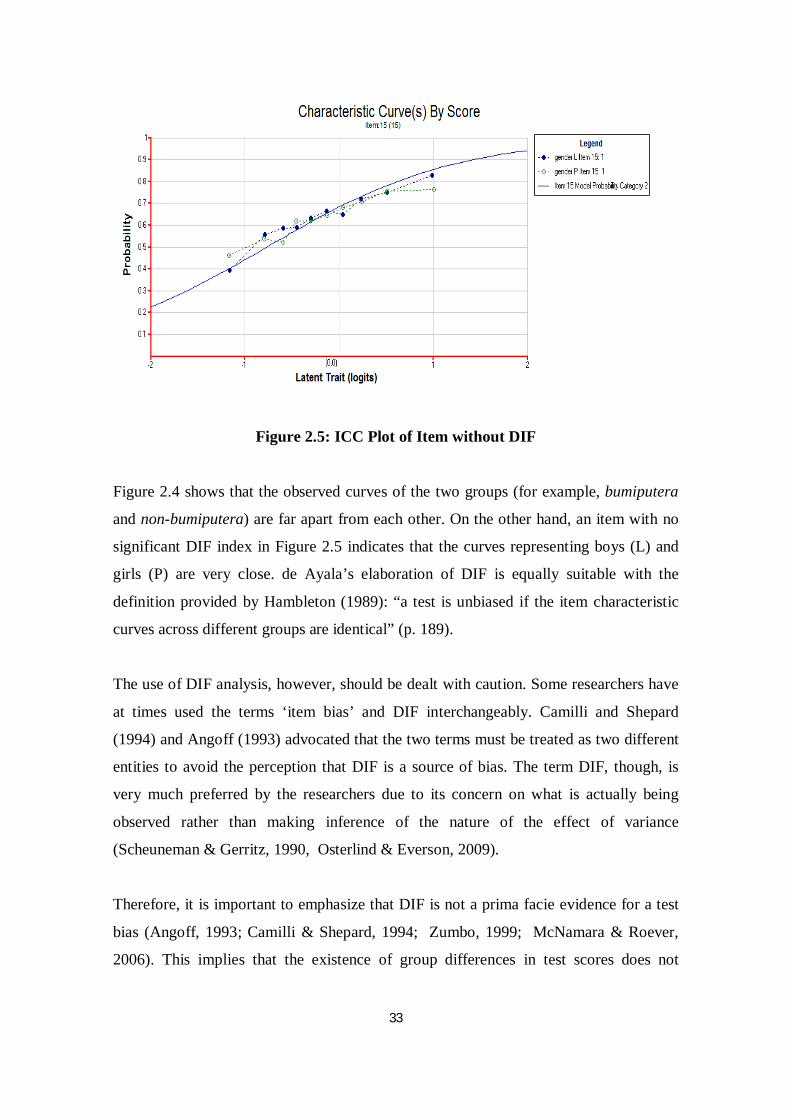
Figure 2.5: ICC Plot of Item without DIF
Figure 2.4 shows that the observed curves of the two groups (for example, bumiputera
and non-bumiputera) are far apart from each other. On the other hand, an item with no
significant DIF index in Figure 2.5 indicates that the curves representing boys (L) and
girls (P) are very close. de Ayala’s elaboration of DIF is equally suitable with the
definition provided by Hambleton (1989): “a test is unbiased if the item characteristic
curves across different groups are identical” (p. 189).
The use of DIF analysis, however, should be dealt with caution. Some researchers have
at times used the terms ‘item bias’ and DIF interchangeably. Camilli and Shepard
(1994) and Angoff (1993) advocated that the two terms must be treated as two different
entities to avoid the perception that DIF is a source of bias. The term DIF, though, is
very much preferred by the researchers due to its concern on what is actually being
observed rather than making inference of the nature of the effect of variance
(Scheuneman & Gerritz, 1990, Osterlind & Everson, 2009).
Therefore, it is important to emphasize that DIF is not a prima facie evidence for a test
bias (Angoff, 1993; Camilli & Shepard, 1994; Zumbo, 1999; McNamara & Roever,
2006). This implies that the existence of group differences in test scores does not
34
necessarily mean the test scores are biased. Thus, if items do not exhibit DIF, then it is
likely that no test bias is present. However, the presence of DIF in an item is not
necessarily an indicator of test bias, rather, it should be investigated further to unlock
the possible causes for its differential functioning. A review analysis known as “logical
evidence of bias” should be implemented to determine the relevance or irrelevance of
the source of DIF to the construct being measured (de Ayala, 2009). The earlier DIF
studies (see Elder, 1996; Chen & Henning, 1985; Kunnan, 1990) have found no pattern
of bias. For example, Chen and Henning (1985) pointed out that the differences in
performance between native speakers of Chinese and native speakers of Spanish in
UCLA’s ESL placement test were actually real and simply a reflection of English use in
real-world interaction. The items flagged to advantage the Spanish test-takers were not
bias as English consists of some Spanish cognates.
Another major caveat that should be taken into account in DIF is that the explanation of
DIF is highly speculative and it is a matter of guesswork (McNamara & Roever, 2006).
The crux of the matter lies in the question whether the DIF occurs due to the real
difference in the attribute being measured or as a result of extraneous factors. Therefore,
Camilli and Shepard (1994) strongly recommended that a statistical finding of DIF
should be reviewed by a panel of experts as to explain why the items seem to be
relatively more difficult for different groups. Regardless of DIF analyses, the removal of
items which seem to disadvantage one particular group is subjected to the decision of
the panel of experts.
2.5 REVIEW OF PREVIOUS STUDIES
Numerous literature reviews have indicated that the two variables; item test features and
individual characteristics of examinees, are relevant predictors of performance on
reading comprehension test.
2.5.1 Related Studies on Item Test Features
A review of studies examining the effect of test features on a test performance suggests
that variation of specific characteristics influence difficulty of comprehension items. In
35
reading comprehension, several empirical studies identified a number of features that
may affect reading task difficulty. Davey and Lasasso (1984) noted that textually
explicit items were significantly easier than the textually implicit ones.
Using other classifications of test variables, Freedle and Kostin (1993) analyzed TOEFL
reading items and found that seven categories of item characteristics affected the item
difficulty. The seven variables noted as the sources of item difficulty were; lexical
overlap between text and the key, sentence length, passage length, paragraph length,
rhetorical organization, the use of negation, the use of referential and passage length.
More recently, Ozuru et al. (2008) compared the extent to which item and text
characteristics predict the difficulty of comprehension item for the 7th – 9th and 10th –
11th grade levels. The result highlighted that young readers were primarily influenced
by text features – in particular vocabulary difficulty. This finding was consistent with
those of Just and Carpenter (1992) and Perfetti (1985) that implies that passage contains
unfamiliar, infrequent words tend to contribute to the low performance on the test.
Exploration to assess the effect of test feature on reading tests continues. Athanasou and
Lamprianou’s (2004) investigation on a diagnostic reading test of Greek-Australian
high school students showed that longer key words had a large effect on the difficulty of
the questions. The findings of several studies (e.g. Ozuru et al., 2008; Just & Carpenter,
1992; Perfetti, 1985, Athanasou & Lamprianou, 2004, Rupp, Garcia & Jamieson, 2001)
summarized that the length of test features had a significant influence on the
performance of reading test: the longer the words, the more difficult the question was.
In a different study, Davey (1988) assessed 20 predictor test features on reading
performance of successful and unsuccessful readers. The finding revealed that two
features - location of response information and stem length - showed a significant effect
for both groups. A somewhat similar result was coined by Sheehan and Ginther (2001)
who identified that the item difficulty of reading test from TOEFL was largely
influenced by the location of the target information.
36
Another interesting issue related to the test features variable is concerned with the
relative contribution of passage and no-passage factors on performance of reading test.
Researchers embarked on investigating the effect of text availability when students
answered the question. In many of these studies, participants were divided into two
groups; the first group was allowed to look back at the test when answering the
question, while in the other group, the text was removed before the questions were
answered.
The results of text availability studies have been mixed. Freedle and Kostin (1994)
concluded that two thirds of the variance in item difficulty was associated with variables
that were solely related to the passage. However, the findings of other researches (Katz
& Lautenschlager, 1994, 2001; Embretson & Wetzel, 1987; Ozuru et al., 2007)
contradicted the former study. The latter studies pointed out that reading comprehension
task may measure factors that have nothing to do with the passage. This revealing
summary raised the question about the validity of multiple choice reading tests.
2.5.2 Related Studies on DIF
In the relevant literature on the effect of individual characteristics on the test
performance, it is interesting to note that gender difference has predominantly been
investigated as a source of variance in academic achievement. Reports of many
assessments have described that there is a gender gap in attainment in language and
other literacy-based subjects throughout the education system. For example, the
Programme for International student Assessment (PISA) in 2000 when reading literacy
was the focus of study in 32 countries, females outperformed males in all participating
countries (Kirsch et al., 2002). Perhaps the outcomes of such reports have prompted the
researchers to utilize DIF analysis in order to understand gender differences.
With regard to the assessment of reading comprehension, evidence about students’
reading preference suggests that girls are more accustomed to reading narratives, and
this may be one of the factors that contribute to better performance on related items
(Twist & Sainsbury, 2009; Scheuneman & Gerritz, 1990).
37
DIF analysis is not limited to gender. Why students with similar ability level do not
obtain similar test scores in standardized examination has also been attributed to other
factors such as difference in racial and ethnic groups and academic background. In their
case study, Alderson and Urquhart (1983) pointed out that student academic discipline
affected the comprehension of reading. The participants who consisted of four different
groups of university students from different faculties showed that reading texts which
contained familiar content related to their area of study, were likely to help them to
perform better. The research conducted by Pae (2004) replicated the same observation.
The result of DIF analysis reflected that items dealing with science-related topics were
differentially easier for the Science students, whereas items about human relationship
were easier for the Humanities.
Further explorations of DIF in reading assessment have been attempted to link it with
the features of the test itself. Scheuneman and Gerritz’s (1990) study tried to examine
the extent to which item features associated with examinees’ characteristics are likely to
reflect the item difficulty. The finding showed a number of significant relationships
between item features and indicators of DIF. As an example, Science content in reading
passage was associated to be relatively difficult for both females and Black examinees.
This information indicates that the difficulty of text type is presumably linked to DIF
indicators, in this case, gender and ethnicity.
2.6 SUMMARY
This chapter has concentrated on the literature review relevant to the current study. It
has looked at the complexity of the reading process and how this complexity poses a
challenging task for the test constructors and item writers.
The chapter also has introduced some psychometric properties of CTT and the Rasch
model, the two widely used tools for test development and improvement. This is to
provide insights for the item-analytical procedure to make judgement on the quality of
the items of the MUET reading paper.
38
As emphasized by experts in language testing, the identification of factors affecting the
performance of students in language tests is of central interest in test construction. This
study, therefore, is an attempt to investigate the effect of two important components –
the item test features and examinee’s characteristics – on the reading test items. An
overview of several types of test features is presented. It describes three major variables
– passage, question type and question format – which are often used to predict the
difficulty of reading test items. The chapter also outlines the discussion on DIF, a
statistical procedure to explore the influence of examinee’s characteristics such as
gender, ethnicity, socio-economic status and demographic location, on individual test
items.
This chapter also has reviewed some previous studies related to the impact of test
features and individual background on the performance of reading test. The review has
pointed out that the findings of past studies report a significant relationship between
item difficulty of reading test and test features and indicators of DIF. Previous research
indicates that the effect of item features and individual characteristics on the assessment
of comprehension is complex and depends on the nature of the source of the text and
individual item of the test in question.
39
CHAPTER 3: METHODOLOGY
3.1 INTRODUCTION
This study is built on the inquiry about several important questions related to the
performance of students on the reading test of MUET, the high-stake English test used
for admission for Malaysian public universities. It is an item-level based analysis which
seeks to explore the following questions:
1. How do the items spread in terms of their difficulty value and ability of the
students?
2. How good are the items of the MUET reading test?
3. To what extent do the features of the test contribute to the difficulty of item in
the MUET reading test?
4. Is there any differential item functioning in the MUET reading test in term of
gender, geographical location and ethnicity?
In order to address the above questions, the study has undertaken three phases of
empirical exploration. Phase 1 involves item analysis of the MUET Reading
Comprehension paper. Item characteristics such as difficulty and discrimination indices
were examined using the CTT analyses and one-parameter IRT model, the Rasch
model. In Phase 2, the test items are analyzed using regression to assess the effect of
various features of passages, question types and question formats on the difficulty of the
reading items. Prior to this, all the 45 individual items were coded in terms of their test
task characteristics. There are six features chosen for this study which are discussed in
detail in the subsequent section. The last phase addresses the potential issue of
invariance of item difficulties for the subgroups of examinees who sat for the test. DIF
analysis is utilized here to examine the extent to which test-takers’ characteristics (i.e.
gender, ethnicity and demographic location) may influence their success to respond
correctly to the test items.
40
For the statistical procedures mentioned above, this study has utilised ConQuest, a
computer program for fitting item responses and latent regression (Wu, Adams, Wilson
& Haldane, 2007), in performing CTT and the Rasch item analyses and examining DIF.
Regression analysis, in addition, was used to investigate the relationship between the
chosen item test characteristics and item difficulty of reading test.
3.2 DESCRIPTION OF THE DATA
The data used for this study was a secondary data of End-MUET Reading Component
which was administered in October 2009. The data was a courtesy from the Malaysian
Examinations Council, the body authorized for the administration and design of the test.
The data was a sample of 8472 students, consisting of 3389 males and 5089 females
from two states; Sabah and the capitol territory, Kuala Lumpur. Majority of these
students were the Sixth form students from public schools, private schools and state-
funded schools. Nonetheless, as shown in Table 1.1 (see Chapter 1), there were other
candidates – matriculation centre students, diploma holders, bachelor holders – who sat
for this standardized university entrance English test.
3.3 DESCRIPTION OF THE MATERIALS
The reading component in the test battery is a 90-minute paper comprising 45-
dichotomously scored items. This test primarily focuses on expository tests which are
taken from newspapers, journals, magazines and academic books/materials. The
questions are based on six passages of varying length and difficulty level. There were
six different topics for this particular MUET’s end-year paper; Legal Issue/Law,
Advertisement/Communication, Business, IQ Enhancement, Travel and Youth
Leadership.
The MUET booklet on Regulations, Test Specifications, Test Formats and Sample
Questions published in 2006 by the Malaysian Examinations Council describes the test
as a competency test to assess a candidate’s ability to comprehend various types of text
of different length and level of complexity (content and language). Generally, the
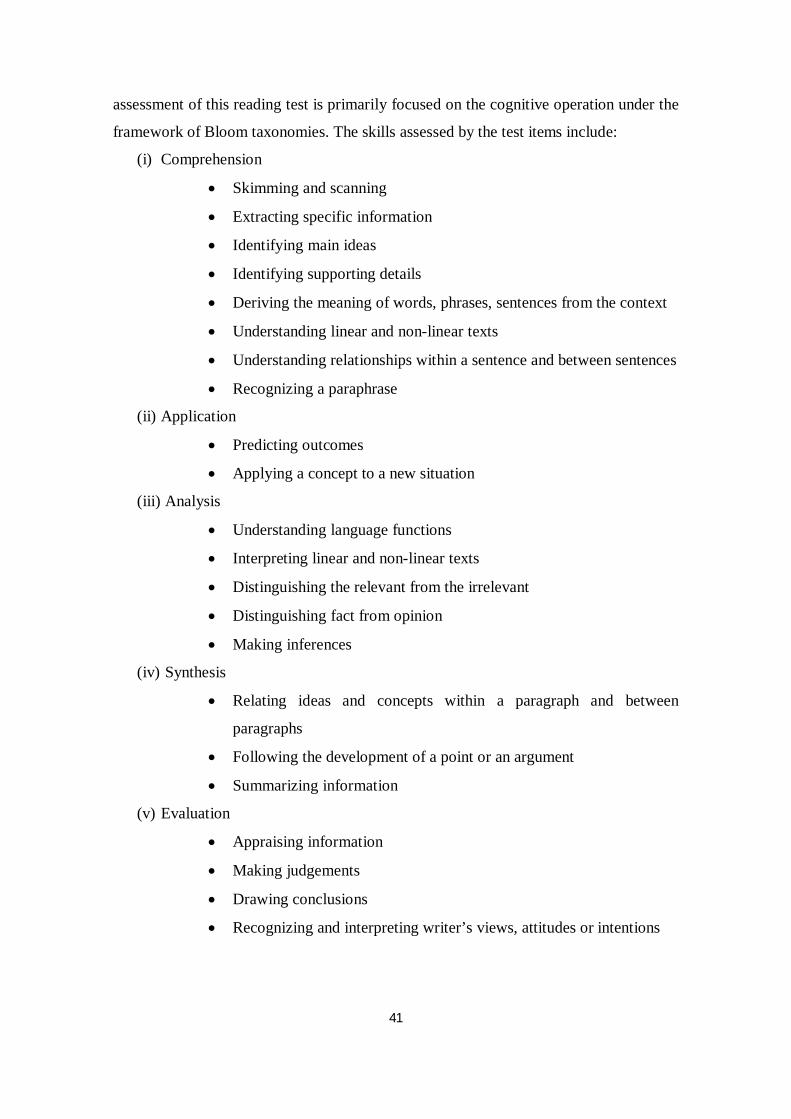
41
assessment of this reading test is primarily focused on the cognitive operation under the
framework of Bloom taxonomies. The skills assessed by the test items include:
(i) Comprehension
Skimming and scanning
Extracting specific information
Identifying main ideas
Identifying supporting details
Deriving the meaning of words, phrases, sentences from the context
Understanding linear and non-linear texts
Understanding relationships within a sentence and between sentences
Recognizing a paraphrase
(ii) Application
Predicting outcomes
Applying a concept to a new situation
(iii) Analysis
Understanding language functions
Interpreting linear and non-linear texts
Distinguishing the relevant from the irrelevant
Distinguishing fact from opinion
Making inferences
(iv) Synthesis
Relating ideas and concepts within a paragraph and between
paragraphs
Following the development of a point or an argument
Summarizing information
(v) Evaluation
Appraising information
Making judgements
Drawing conclusions
Recognizing and interpreting writer’s views, attitudes or intentions
42
3.4 DESCRIPTION OF THE PROCEDURES
3.4.1 Coding of Individual Items
The 45 questions of the MUET reading comprehension and their answers options were
coded using various classification schemes. Generally, three major facets – passage
variable, question type variable and question format variable – were identified from the
literature to be examined as a potential source of item difficulty of the reading test.
These variables were then subcategorized into various types.
The first coding involved the passage variable which focused only on one variable; the
length of the passage. This variable was coded based on the number of the lines in the
text. The scheme was taken from the study conducted by Scheuneman and Gerritz
(1990). The texts were coded into three types according to the number of lines each
passage contained: (i) text with more than 25 lines, (ii) text with more than 35 lines and
(iii) text with more than 45 lines.
The second major variable dealt with the type of questions. It was then subdivided into
two sub-variables; (a) type of questions (Stephanou et al., 2008) and (b) inference type
(Davey, 1988). The type of question addressed the type of passage comprehension
processes that the students needed to engage, in order to reach for an answer. There
were four levels in this scheme, which was developed for PAT-R 2008. However, for
the purpose of this study, the original order has been rearranged to fit accordingly to the
difficulty level of the items in this test. The first level comprises retrieving directly
stated information (RI) for which the answer of the question was explicitly stated in the
passage. Minimal text processing is required for this question as students need to
identify a close match or synonym between wording of the items and the relevant
information in the text. The second level involves interpreting explicit information (IE)
across sentences or paragraphs. Answering this question involves identifying a
paraphrase or rewording of the information in the passage which matches to the
wording in the item. As contrast to the first level, students need to link and combine
explicitly stated information across several sentences or sections of a passage. The third
level consists of interpreting by making inference (II) question. In order to reach for a
43
correct answer, this question requires students to recognize the information implied or
suggested by the author using the clues in the passages, but not directly stated in the
text. Finally, the fourth level is reflecting on texts (RF). The information needed to
answer the item is not explicitly stated in the passage. The test takers must bring their
prior knowledge to make inference about situation in the text.
The above coding system was somewhat similar to Ozuru’s et al. (2008) classification
on the reading comprehension items in terms of relation between passage and question.
PAT-R’s coding was preferred in this study as opposed to Ozuru’s due to two reasons.
First, it appears that PAT-R’s category clearly divides the items into explicitly and
implicitly stated information. Specifically, the first two categories – RI and IE – are
concerned with the precisely-mentioned relevant information in the passage. On the
other hand, the last two; II and RF, focus on the information which is not directly stated
in the text. Second, it differentiates the level of comprehension in details from sentence
level (RI), across-sentence/paragraph level (IE), integration of textual information with
inference skill (II) and integration of textual information with prior knowledge (RF).
The other category; inference type, was coined from Davey’s research in 1988. This
variable classifies items into five categories representing their inference level required
to reach for the key answer; (i) no inference, (ii) paraphrase inference, (iii) across-
sentence (bridging) inference, (iv) macrostructure (gist) inference and (v) reader-based
(prior knowledge) inference.
In addition to the previously mentioned variables, items were also coded in relation to
the question format which concerned with features of the options and distractors of the
questions. Firstly, options were analyzed according to their structure (Scheuneman &
Gerritz, 1990; Carlton & Harris, 1989). Three categories are used to appropriately fit the
majority of items; (i) short lists of 1-4 words, (ii) simple phrases and (iii) complete
sentences or complex phrases containing clauses that could stand alone as sentence.
Options are also grouped according to the number of alternatives given. In this test,
there were only two types used; (i) 3-option and (ii) 4-option. In order to investigate the
effect of the distractor to the item difficulty, distractors were also coded following the
44
coding method of Davey (1988). This analysis addressed the degree to which the
incorrect response options (distractors) were plausible. The coding schemes for this are;
(i) no distractors are plausible and (ii) one or more distractors were plausible.
To summarize, there were six predictors chosen for this study to assess their relative
significance on the difficulty of the 45 MUET reading comprehension items (see details
of the coding scheme in Appendix B). Those test features that had come under scrutiny
were:
1) Passage variable
a) The length of the passage
2) Question type variable
a) Type of question
b) Inference type/level
3) Question format variable
a) Structures of the responses/alternatives
b) Number of options/alternatives
c) Plausibility of the distractors
3.4.2 Statistical Analyses
3.4.2.1) CTT and Rasch Item Analyses
The first statistical analysis performed for the data was item analysis under the CTT and
one parameter model of IRT framework using the statistical software, ConQuest which
can produce analyses for both approaches.
In the traditional item analysis which focuses on the total score of a test, the items were
examined based on the three major psychometric characteristics of CTT; item facility
indices, discrimination indices and reliability coefficients. The command file for item
analysis of this dichotomous data is found in Appendix C.
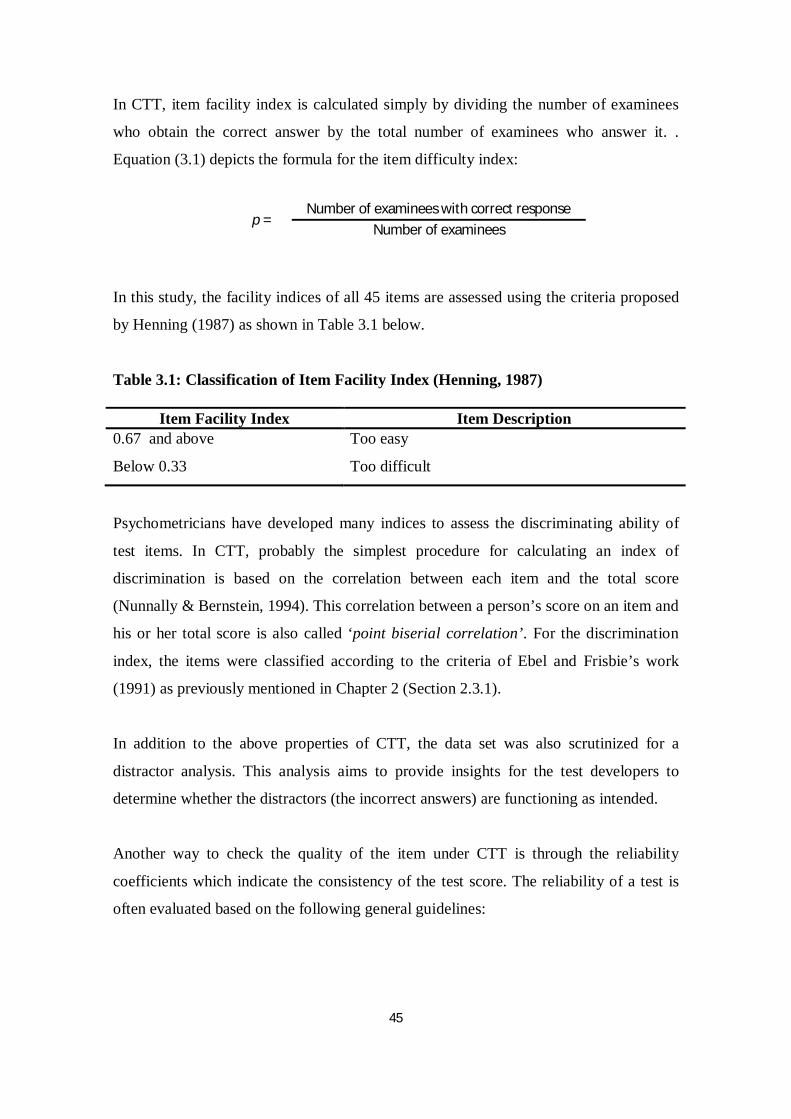
45
In CTT, item facility index is calculated simply by dividing the number of examinees
who obtain the correct answer by the total number of examinees who answer it. .
Equation (3.1) depicts the formula for the item difficulty index:
In this study, the facility indices of all 45 items are assessed using the criteria proposed
by Henning (1987) as shown in Table 3.1 below.
Table 3.1: Classification of Item Facility Index (Henning, 1987)
Item Facility Index Item Description 0.67 and above Too easy
Below 0.33 Too difficult
Psychometricians have developed many indices to assess the discriminating ability of
test items. In CTT, probably the simplest procedure for calculating an index of
discrimination is based on the correlation between each item and the total score
(Nunnally & Bernstein, 1994). This correlation between a person’s score on an item and
his or her total score is also called ‘point biserial correlation’. For the discrimination
index, the items were classified according to the criteria of Ebel and Frisbie’s work
(1991) as previously mentioned in Chapter 2 (Section 2.3.1).
In addition to the above properties of CTT, the data set was also scrutinized for a
distractor analysis. This analysis aims to provide insights for the test developers to
determine whether the distractors (the incorrect answers) are functioning as intended.
Another way to check the quality of the item under CTT is through the reliability
coefficients which indicate the consistency of the test score. The reliability of a test is
often evaluated based on the following general guidelines:
p = Number of examinees with correct response
Number of examinees
46
A reliability estimates of 0.90 or even 0.95 are highly expected for high stake
tests which involve making important decision about individuals (Nunnally &
Bernstein, 1994; Reynolds et al., 2009)
In many testing situations like personality test and group and individually
administered achievement tests, reliability index should yield at the minimum of
0.80 (Reynolds et al., 2009)
Modest reliability indices of at least 0.70 are acceptable for teacher-made
classroom tests (Reynolds et al., 2009)
Reliability indices as low as 0.50 can be tolerated for teacher-made test,
provided that the test score will be combined with the scores from other
assessments (Ebel & Frisbie, 1991)
It can be seen from the preceding guidelines that a satisfactory level of reliability is
often associated with the intended purpose of the test. That is, the procedure to set
minimum values of reliability coefficients need to be established according the context
of score use. Therefore, there are no absolute standards to serve as fixed criteria to make
judgement about the reliability of a test.
In this study, several analyses were performed to see the increase of reliability statistic
by removing those items with low discriminating indices. It is recommended by the
psychometricians that deletion of non-discriminating items is one of the measures taken
to improve the reliability of a test (Alugamalai & Curtis, 2005; Reynolds et al., 2009).
For the Rasch analyses, test items were also evaluated using the item difficulty and item
discrimination index. Unlike CTT, difficulty of item is estimated from the probability of
a person to have 50 percent chance of getting the item correct. The probability of a
correct response to an item is a function of ability as expressed in the item characteristic
curve (ICC). The higher a person's relative ability to the difficulty of an item, the higher
the probability of a correct response on that item. When a person's location on the latent
trait is equal to the difficulty of the item, there is by definition a 0.5 probability of a
correct response in the Rasch model (Hambleton et al., 1991; Bond & Fox, 2007). In
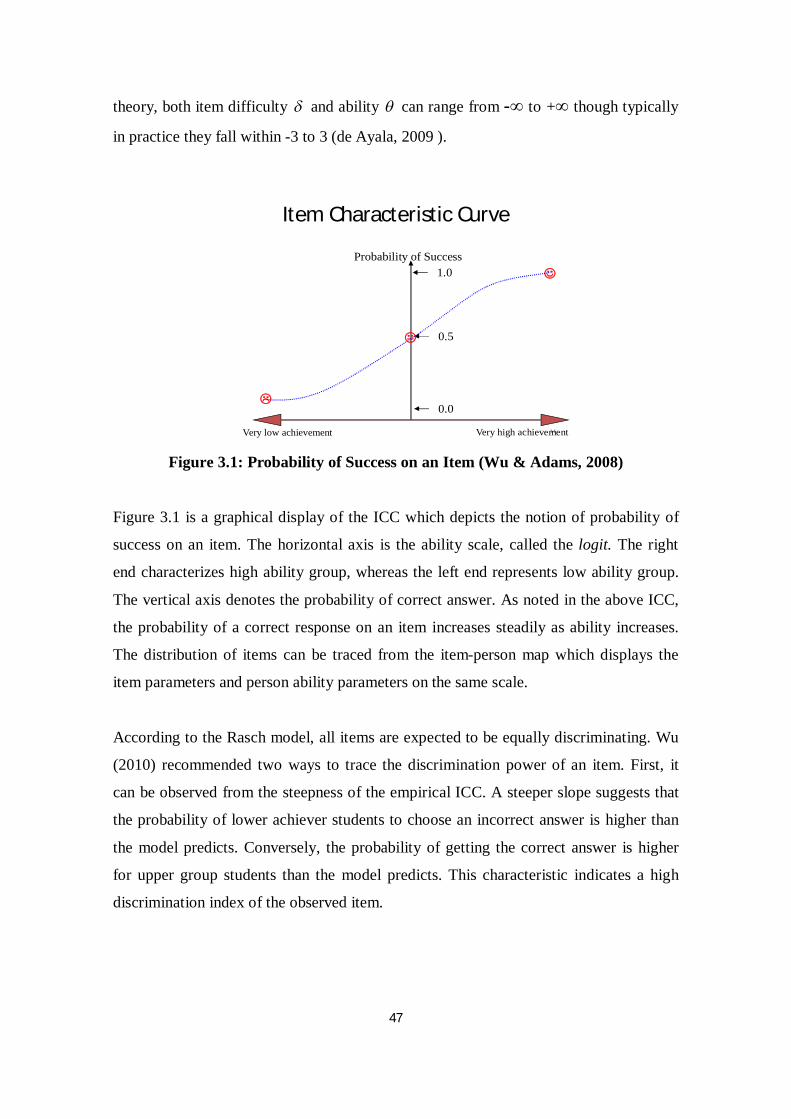
47
theory, both item difficulty and ability can range from -∞ to +∞ though typically
in practice they fall within -3 to 3 (de Ayala, 2009 ).
Item Characteristic Curve
14
Probability of Success
Very low achievement Very high achievement
1.0
0.0
0.5
Figure 3.1: Probability of Success on an Item (Wu & Adams, 2008)
Figure 3.1 is a graphical display of the ICC which depicts the notion of probability of
success on an item. The horizontal axis is the ability scale, called the logit. The right
end characterizes high ability group, whereas the left end represents low ability group.
The vertical axis denotes the probability of correct answer. As noted in the above ICC,
the probability of a correct response on an item increases steadily as ability increases.
The distribution of items can be traced from the item-person map which displays the
item parameters and person ability parameters on the same scale.
According to the Rasch model, all items are expected to be equally discriminating. Wu
(2010) recommended two ways to trace the discrimination power of an item. First, it
can be observed from the steepness of the empirical ICC. A steeper slope suggests that
the probability of lower achiever students to choose an incorrect answer is higher than
the model predicts. Conversely, the probability of getting the correct answer is higher
for upper group students than the model predicts. This characteristic indicates a high
discrimination index of the observed item.
48
Another method to examine the discrimination index is through a fit statistic which is
represented by fit means square – MNSQ - in ConQuest (Wu & Adams, 2008). This
approach suggests that a low discriminating item has MNSQ index of greater than 1,
whereas a high discriminating item is reflected by MNSQ index of less than 1.
Another key aspect of Rasch analysis is the evaluation of fit which offers information
about items that do not contribute to the whole set of data. Several methods have been
employed to assess the goodness of fit of a dataset to the Rasch model. Perhaps one of
the most promising goodness-of fit analyses is the residual based fit statistics
(Hambleton et al., 1991). This type of statistic concerns the degree of correspondence
between what is expected and what is observed (Bond & Fox, 2007; McNamara, 1996;
Hambleton et al., 1991). This method suggests that the evaluation of model-fit data can
be tested by comparing the predicted and the actual responses of examinees to particular
items.
In ConQuest, residual fit statistics are reported in the form of two sets of statistics; mean
square statistics and t statistics. Theoretically, the mean square statistics (MNSQ)
denotes that the slope of the observed ICC should be similar to the slope of the
predicted/modeled ICC (Wu & Adams, 2008). It is assumed that this statistic has an
expectation of one. Hence, in order for items to be considered to fit the Rasch model,
they should have MNSQ statistic with the range 0.77 to 1.30 (Adams & Khoo, 1993) or
a narrower range from 0.83 to 1.20 (Keeves & Alagumalai, 1999).
The second statistic used as an indication of misfit is the t statistic which is defined as
“a normal deviate with a mean of zero and a standard deviation of one” (Wu & Adams,
2008). Many psychometricians conventionally accept that the value of t outside the
range of -2 to +2 shows the violation of the expectation of the Rasch model (Bond &
Fox, 2007; McNamara, 1996; Wu & Adams, 2008).
3.4.2.2) Regression Analyses
In response to the third research question “to what extent do the features of the test
contribute to the difficulty of an item in the MUET reading test?”, regression analyses
49
were performed. The analyses were conducted to assess the simultaneous effects of six
different test features on the item difficulty of the MUET reading test.
Regression analysis is a statistical tool that is designed to model the relationships
between variables; dependent variable10 and independent variable11. It is often used to
explore the causal effect of one variable upon another – the effect of price increase upon
demand, for example. To address the issues in question, one needs to gather data on the
variable of interest and employs regression to estimate the quantitative effect of the
independent variable(s) upon dependent variable.
In this study, linear regression was employed to test for correlation between the
dependent variable (item difficulty) and six independent variables (various test features
based upon prior research). The variables identified to predict the source of item
difficulty were:
1) The length of the text
2) Type of question
3) Inference type/level
4) Structure of the response/alternative
5) Number of options/alternatives
6) Plausibility of the distractors
A keen interest of this study is to examine the extent to which the above variables yield
similar results as those in the earlier research on the factors affecting the difficulty of
reading test. The findings of the current study are expected to confirm the following
hypotheses:
10 Also referred as criterion variable. It is a variable that is affected or changed by the
independent variable.
11 A variable which is presumed to affect or determine a dependent variable. Also known as predictor variable.
50
1) Lengthy passage is likely to be more difficult to comprehend compared to
shorter ones because the density of words or sentences may affect the
information-processing demand of the text
2) Items with implicitly-textual evidence are significantly difficult as they require
the examinees to infer the correct answer throughout the passage
3) Items requiring higher level of cognitive skills turn out to be more difficult to
answer
4) Responses/alternatives that contain fewer words tend to be easier because longer
sentences/phrases place greater demand in understanding
5) Questions with more options to choose from tend to be difficult because students
need to assess all the information given in order to reach for the best answer
6) Items with more than one plausible distractor are potentially difficult as they
share more information with the correct answer and the information in the
passage
3.4.2.3) DIF Analysis
Analysis of DIF is crucial in reading assessment due to the likelihood that readers have
different ways of reaching an answer. This analysis is useful to reveal the possible
source of item difficulty of reading test between different groups of examinees.
DIF is a statistical procedure employed to investigate individual items in a test. It
signals an indication of departure from the IRT model if examinees from different
groups (i.e. gender, ethnicity or socio-economic status) have different probability to
give a certain response to an item.
In the Rasch model, an item exhibits DIF if there is significant variance between the
subgroups. This statistical difference can be calculated by dividing the estimated DIF
parameter by its standard error. If the index is not in the range between -2 and +2, then,
the item is flagged as exhibiting DIF.
To inspect if there is existence of DIF in this MUET reading paper, the analysis
involved contrasting the test-takers according to their gender (male and female),
51
ethnicity (bumiputera and non-bumiputera12) and demographic location (Kuala Lumpur
and Sabah).
3.5 SUMMARY
This chapter has outlined a range of methods to address the research questions presented
in Chapter 1. The first statistical procedure under the framework of CTT and the Rasch
model has taken into account the major psychometrics properties to make judgement
about the quality of items of this high-stake standardized test.
Regression analysis has been employed in response to the issue of relationships between
item difficulty and the test features. This is to discover which variable has a profound
effect on the performance of test-takers in the reading test. The last empirical
exploration has dealt with DIF analysis which aims to assess the influence of students’
characteristics on their response to individual items in the test.
In summary, it is necessary to scrutinize the test items and examinees’ characteristics to
establish whether there is any evidence that the results are affected by factors other than
reading ability.
12 consists of the Chinese and Indians who originally migrated to Malaya (Malaysia) to work in
gold mines and rubber estates.
52
CHAPTER 4: FINDINGS OF THE STUDY
4.1 INTRODUCTION
The aim of this research is to evaluate the individual items of MUET reading
comprehension test. Therefore, the study has formulated four research questions which
have been addressed in Chapter 1.
In the following sections, the results of the statistical analyses for answering the
research questions are presented. The first section focuses on the outputs of CTT and
the Rasch model in evaluating the quality of the test from an item-level analysis of item
difficulty, discrimination index, fit indices and test reliability. Next, the findings of the
effect of test features, i.e., the six predictors, on the difficulty of the reading
comprehension items are discussed. A description of the results of DIF analyses is then
explained in the last section.
4.2 RESULTS OF ITEM ANALYSIS
In this section, the psychometric analyses of CTT and Rasch model will be discussed.
The findings are evaluated according to the item psychometric properties – item
facility/difficulty, discrimination index, fit statistics as well as overall test reliability.
Item Facility
In CTT, the difficulty of an item is defined as the percentage of the group who answer
the item correctly. The results of Table 4.1 show that the difficulty level of the items
range from 0.03 to 0.81 where 0 is for an item where no student obtain correct answer
and 1 is for an item with correct response from all examinees. All the 45 items can be
categorized according to Henning’s (1987) criteria as follows:
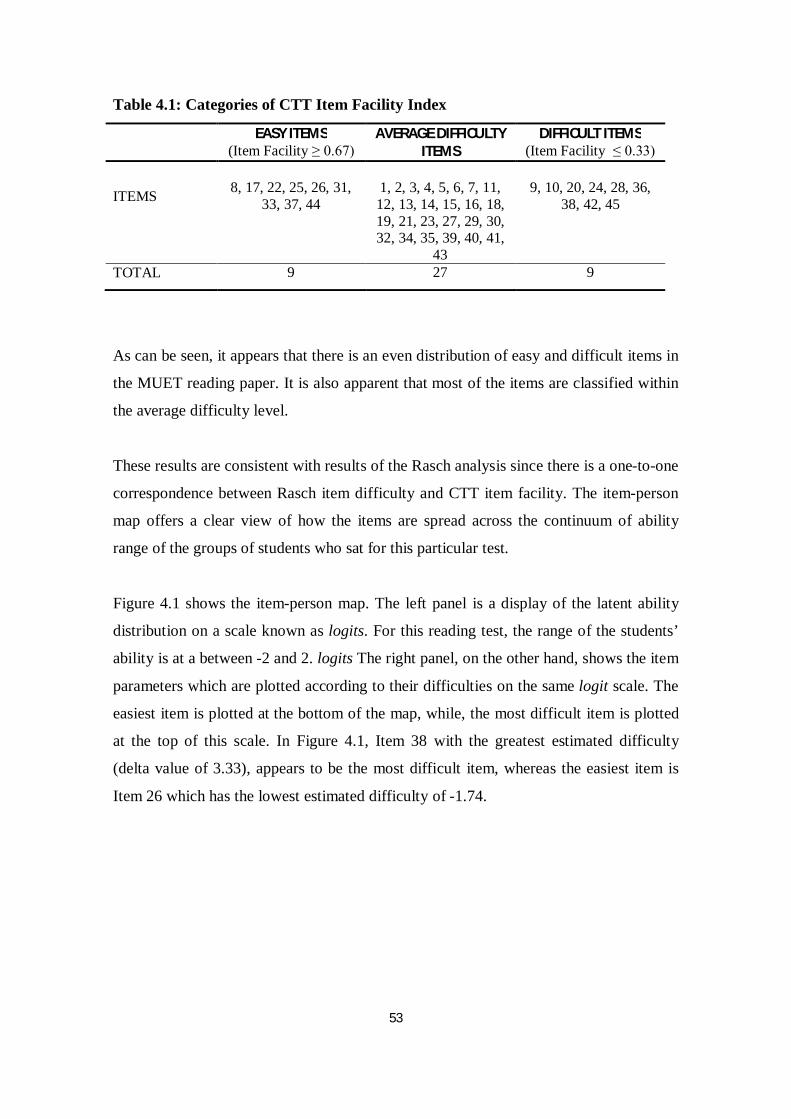
53
Table 4.1: Categories of CTT Item Facility Index
EASY ITEMS (Item Facility ≥ 0.67)
AVERAGE DIFFICULTY ITEMS
DIFFICULT ITEMS (Item Facility ≤ 0.33)
ITEMS
8, 17, 22, 25, 26, 31,
33, 37, 44
1, 2, 3, 4, 5, 6, 7, 11, 12, 13, 14, 15, 16, 18, 19, 21, 23, 27, 29, 30, 32, 34, 35, 39, 40, 41,
43
9, 10, 20, 24, 28, 36,
38, 42, 45
TOTAL 9 27 9
As can be seen, it appears that there is an even distribution of easy and difficult items in
the MUET reading paper. It is also apparent that most of the items are classified within
the average difficulty level.
These results are consistent with results of the Rasch analysis since there is a one-to-one
correspondence between Rasch item difficulty and CTT item facility. The item-person
map offers a clear view of how the items are spread across the continuum of ability
range of the groups of students who sat for this particular test.
Figure 4.1 shows the item-person map. The left panel is a display of the latent ability
distribution on a scale known as logits. For this reading test, the range of the students’
ability is at a between -2 and 2. logits The right panel, on the other hand, shows the item
parameters which are plotted according to their difficulties on the same logit scale. The
easiest item is plotted at the bottom of the map, while, the most difficult item is plotted
at the top of this scale. In Figure 4.1, Item 38 with the greatest estimated difficulty
(delta value of 3.33), appears to be the most difficult item, whereas the easiest item is
Item 26 which has the lowest estimated difficulty of -1.74.
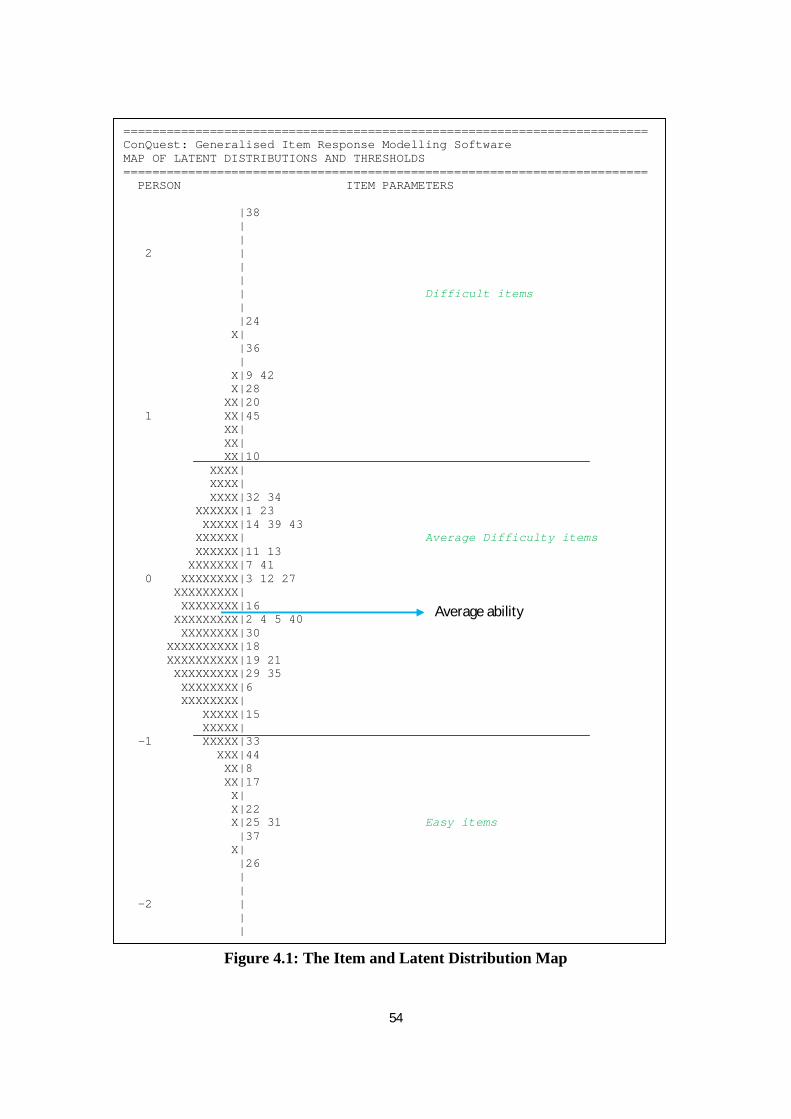
54
dif
Figure 4.1: The Item and Latent Distribution Map
========================================================================= ConQuest: Generalised Item Response Modelling Software MAP OF LATENT DISTRIBUTIONS AND THRESHOLDS ========================================================================= PERSON ITEM PARAMETERS
|38 | | 2 | | | | Difficult items | |24 X| |36 | X|9 42 X|28 XX|20 1 XX|45 XX| XX| XX|10 XXXX| XXXX| XXXX|32 34 XXXXXX|1 23 XXXXX|14 39 43 XXXXXX| Average Difficulty items XXXXXX|11 13 XXXXXXX|7 41 0 XXXXXXXX|3 12 27 XXXXXXXXX| XXXXXXXX|16 XXXXXXXXX|2 4 5 40 XXXXXXXX|30 XXXXXXXXXX|18 XXXXXXXXXX|19 21 XXXXXXXXX|29 35 XXXXXXXX|6 XXXXXXXX| XXXXX|15 XXXXX| -1 XXXXX|33 XXX|44 XX|8 XX|17 X| X|22 X|25 31 Easy items |37 X| |26 | | -2 | | |
Average ability
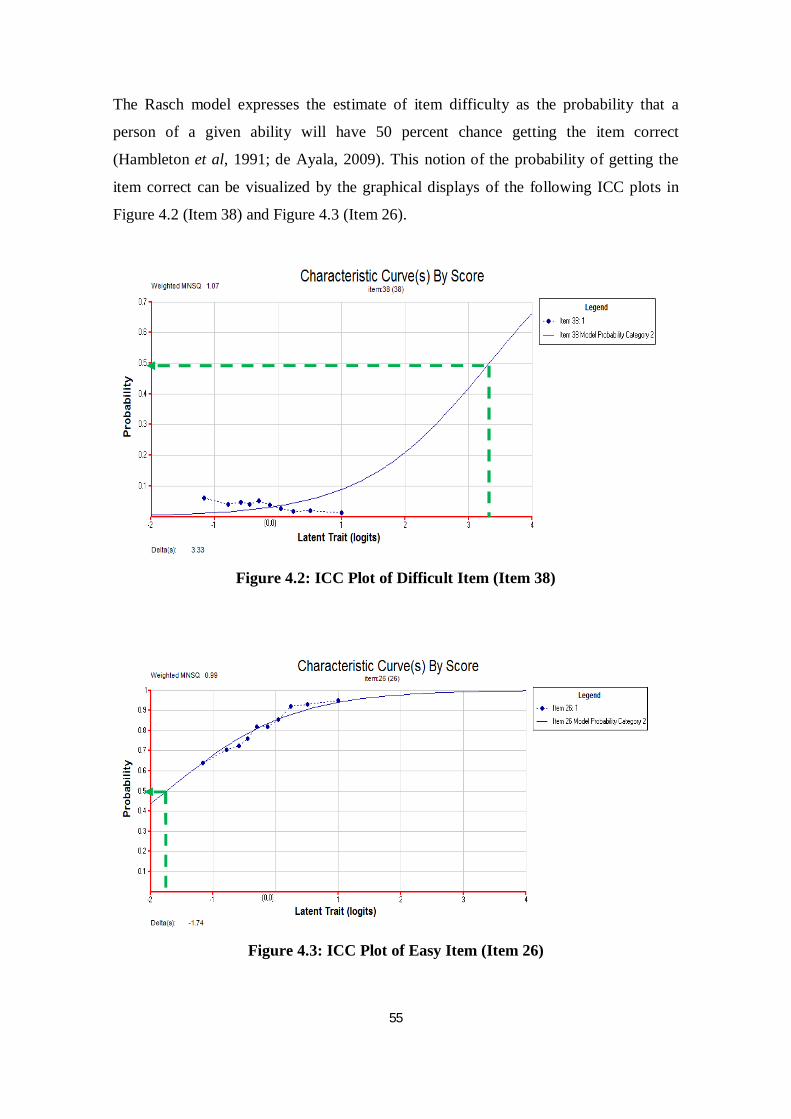
55
The Rasch model expresses the estimate of item difficulty as the probability that a
person of a given ability will have 50 percent chance getting the item correct
(Hambleton et al, 1991; de Ayala, 2009). This notion of the probability of getting the
item correct can be visualized by the graphical displays of the following ICC plots in
Figure 4.2 (Item 38) and Figure 4.3 (Item 26).
Figure 4.2: ICC Plot of Difficult Item (Item 38)
Figure 4.3: ICC Plot of Easy Item (Item 26)
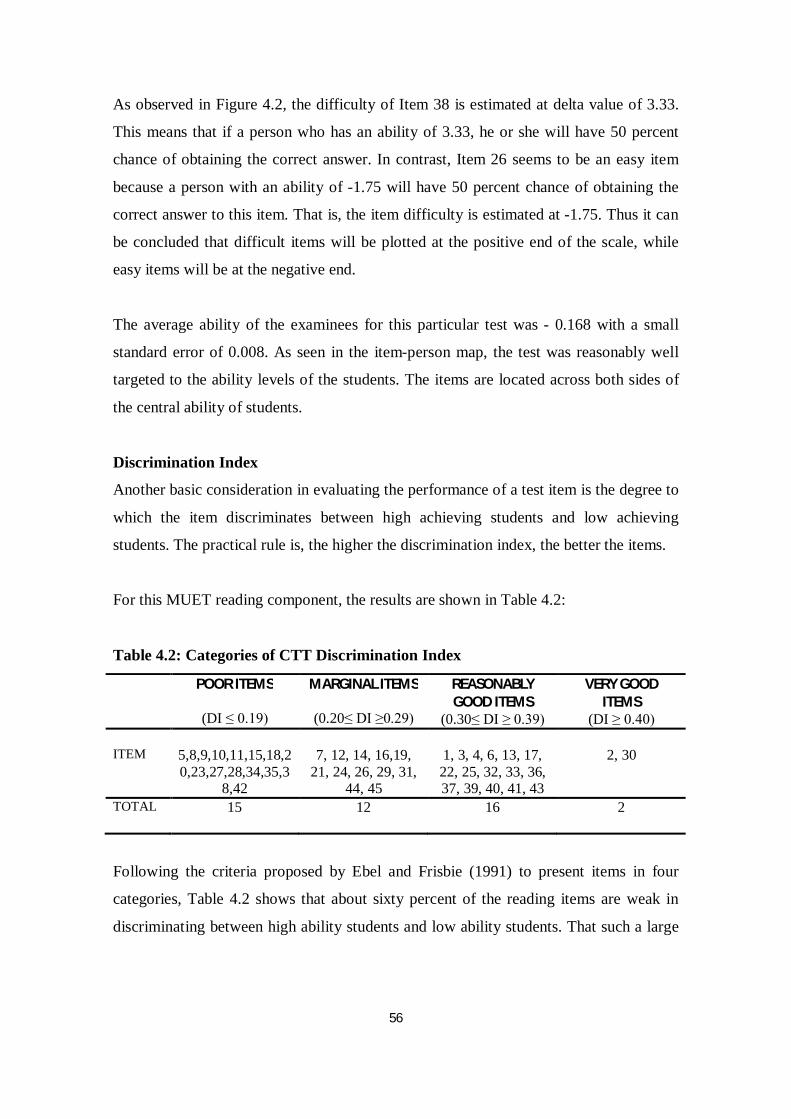
56
As observed in Figure 4.2, the difficulty of Item 38 is estimated at delta value of 3.33.
This means that if a person who has an ability of 3.33, he or she will have 50 percent
chance of obtaining the correct answer. In contrast, Item 26 seems to be an easy item
because a person with an ability of -1.75 will have 50 percent chance of obtaining the
correct answer to this item. That is, the item difficulty is estimated at -1.75. Thus it can
be concluded that difficult items will be plotted at the positive end of the scale, while
easy items will be at the negative end.
The average ability of the examinees for this particular test was - 0.168 with a small
standard error of 0.008. As seen in the item-person map, the test was reasonably well
targeted to the ability levels of the students. The items are located across both sides of
the central ability of students.
Discrimination Index
Another basic consideration in evaluating the performance of a test item is the degree to
which the item discriminates between high achieving students and low achieving
students. The practical rule is, the higher the discrimination index, the better the items.
For this MUET reading component, the results are shown in Table 4.2:
Table 4.2: Categories of CTT Discrimination Index
POOR ITEMS
(DI ≤ 0.19)
MARGINAL ITEMS
(0.20≤ DI ≥0.29)
REASONABLY GOOD ITEMS
(0.30≤ DI ≥ 0.39)
VERY GOOD ITEMS
(DI ≥ 0.40) ITEM
5,8,9,10,11,15,18,20,23,27,28,34,35,3
8,42
7, 12, 14, 16,19,
21, 24, 26, 29, 31, 44, 45
1, 3, 4, 6, 13, 17, 22, 25, 32, 33, 36, 37, 39, 40, 41, 43
2, 30
TOTAL 15 12 16 2
Following the criteria proposed by Ebel and Frisbie (1991) to present items in four
categories, Table 4.2 shows that about sixty percent of the reading items are weak in
discriminating between high ability students and low ability students. That such a large
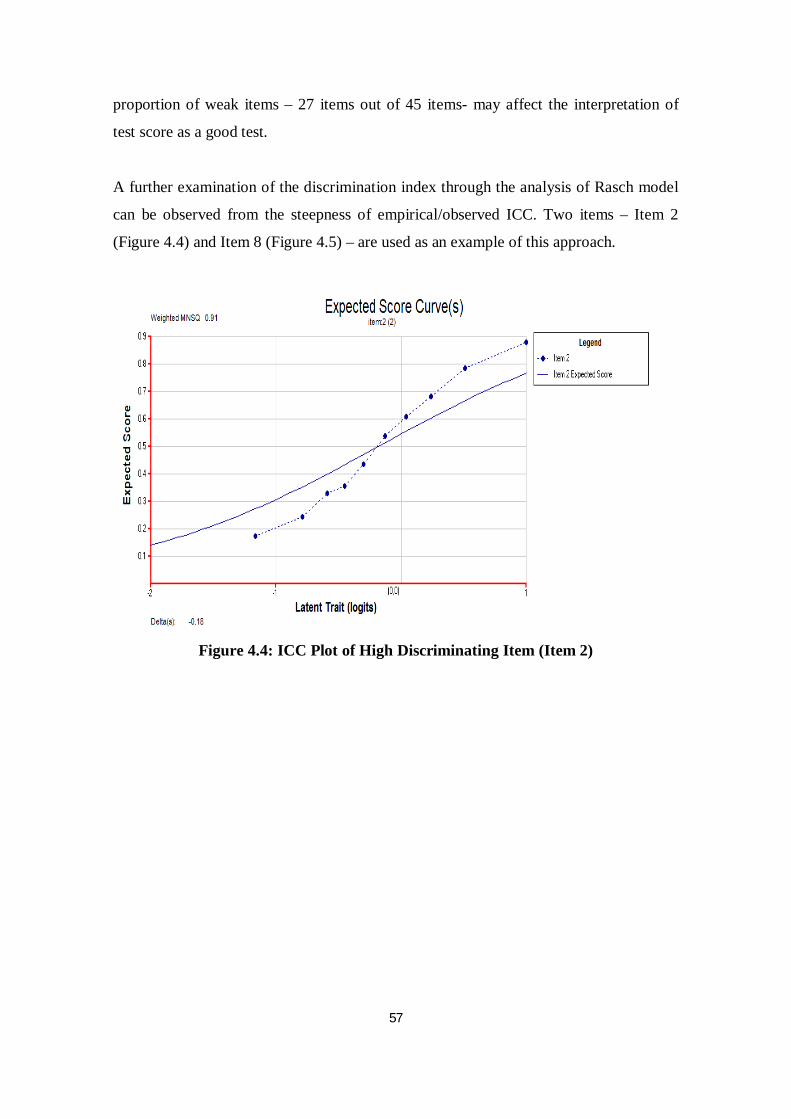
57
proportion of weak items – 27 items out of 45 items- may affect the interpretation of
test score as a good test.
A further examination of the discrimination index through the analysis of Rasch model
can be observed from the steepness of empirical/observed ICC. Two items – Item 2
(Figure 4.4) and Item 8 (Figure 4.5) – are used as an example of this approach.
Figure 4.4: ICC Plot of High Discriminating Item (Item 2)
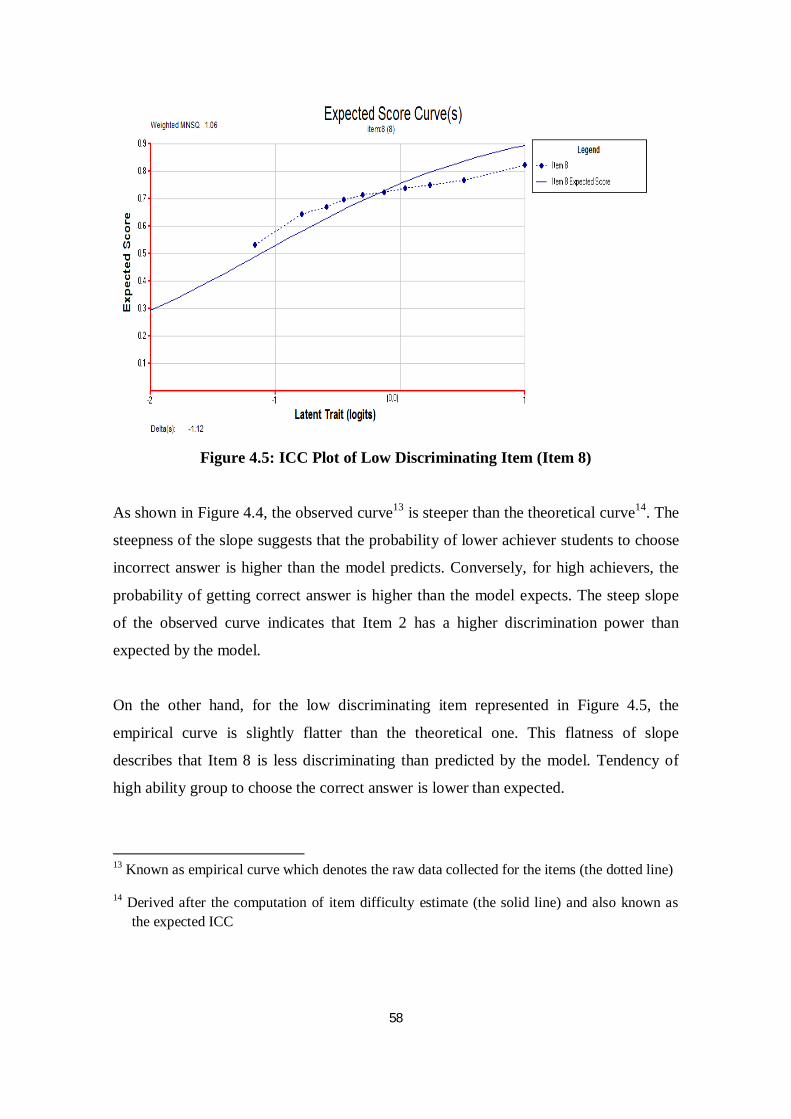
58
Figure 4.5: ICC Plot of Low Discriminating Item (Item 8)
As shown in Figure 4.4, the observed curve13 is steeper than the theoretical curve14. The
steepness of the slope suggests that the probability of lower achiever students to choose
incorrect answer is higher than the model predicts. Conversely, for high achievers, the
probability of getting correct answer is higher than the model expects. The steep slope
of the observed curve indicates that Item 2 has a higher discrimination power than
expected by the model.
On the other hand, for the low discriminating item represented in Figure 4.5, the
empirical curve is slightly flatter than the theoretical one. This flatness of slope
describes that Item 8 is less discriminating than predicted by the model. Tendency of
high ability group to choose the correct answer is lower than expected.
13 Known as empirical curve which denotes the raw data collected for the items (the dotted line)
14 Derived after the computation of item difficulty estimate (the solid line) and also known as the expected ICC
59
Another way to check the discriminating power of an item in Rasch model is to use the
fit statistic – reported as mean square (MNSQ) in ConQuest (Wu & Adams, 2008). It
postulates that discriminating power of an item is reflected by the extent to which the
MNSQ is greater or less than 1. In Figure 4.4, for example, it is observed that when the
empirical ICC is steeper than the theoretical curve, the MNSQ is less than one (0.91).
This indicates that Item 2 has high discriminating power. Note, on the other hand, Item
8 (Figure 4.5) is less discriminating due to its flatter observed curve and MNSQ index
of more than 1 (1.06).
It is important to mention that inspection of item discrimination often leads to another
important analysis, that is distractor analysis. This is because less discriminating items
are frequently scrutinized for distractor analysis to examine the possible source of their
low discrimination indices. Popham (2000) and Reynolds et al. (2009) advocated that
such items need closer examination and possible revision.
In the light of this study, it is apparent that item distractor analysis plays an important
role to explore the causes of poor discrimination power of 15 items (items with close-to-
zero and negative discrimination index) which are classified as poor items (see Table
4.2).
The finding of the analysis finds out that there are two items – Item 34 and Item 38 –
which require further investigation. It is noted that these items have negative value of
discrimination indices; (-0.06) and (-0.11) respectively. CTT analysis of these items is
summarized in Table 4.3:
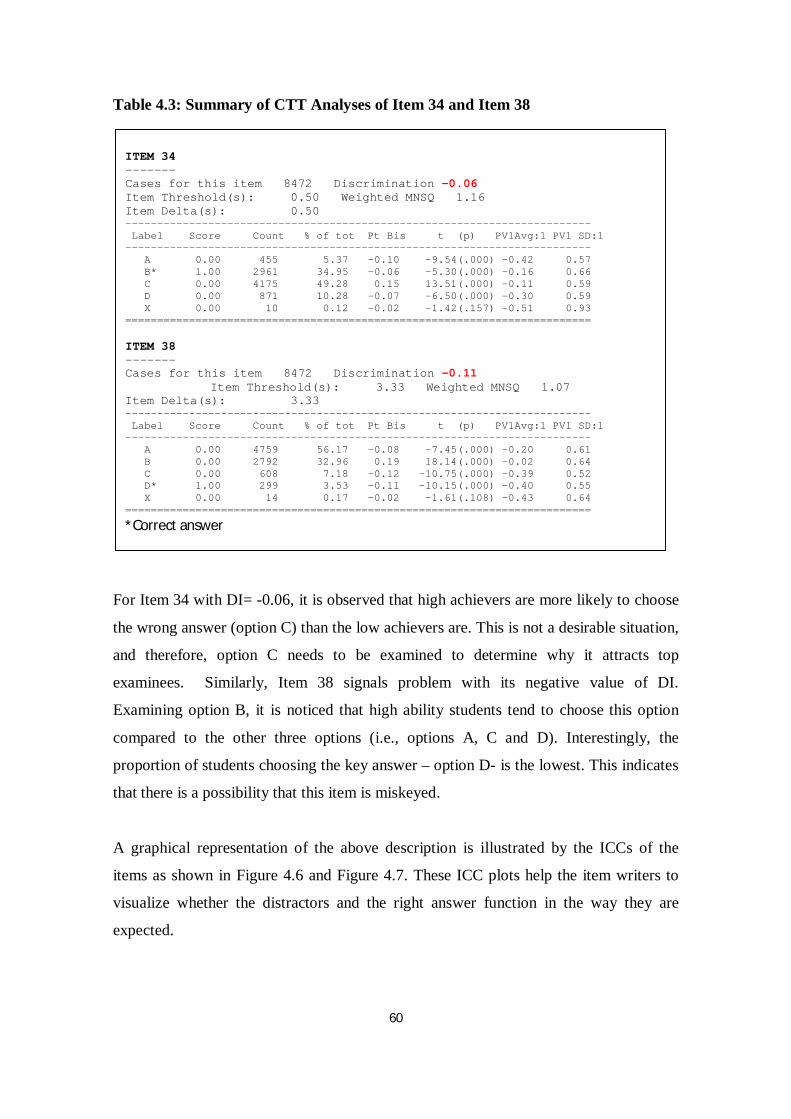
60
Table 4.3: Summary of CTT Analyses of Item 34 and Item 38
For Item 34 with DI= -0.06, it is observed that high achievers are more likely to choose
the wrong answer (option C) than the low achievers are. This is not a desirable situation,
and therefore, option C needs to be examined to determine why it attracts top
examinees. Similarly, Item 38 signals problem with its negative value of DI.
Examining option B, it is noticed that high ability students tend to choose this option
compared to the other three options (i.e., options A, C and D). Interestingly, the
proportion of students choosing the key answer – option D- is the lowest. This indicates
that there is a possibility that this item is miskeyed.
A graphical representation of the above description is illustrated by the ICCs of the
items as shown in Figure 4.6 and Figure 4.7. These ICC plots help the item writers to
visualize whether the distractors and the right answer function in the way they are
expected.
ITEM 34 ------- Cases for this item 8472 Discrimination -0.06 Item Threshold(s): 0.50 Weighted MNSQ 1.16 Item Delta(s): 0.50 ------------------------------------------------------------------------- Label Score Count % of tot Pt Bis t (p) PV1Avg:1 PV1 SD:1 ------------------------------------------------------------------------- A 0.00 455 5.37 -0.10 -9.54(.000) -0.42 0.57 B* 1.00 2961 34.95 -0.06 -5.30(.000) -0.16 0.66 C 0.00 4175 49.28 0.15 13.51(.000) -0.11 0.59 D 0.00 871 10.28 -0.07 -6.50(.000) -0.30 0.59 X 0.00 10 0.12 -0.02 -1.42(.157) -0.51 0.93 ========================================================================= ITEM 38 ------- Cases for this item 8472 Discrimination -0.11
Item Threshold(s): 3.33 Weighted MNSQ 1.07 Item Delta(s): 3.33 ------------------------------------------------------------------------- Label Score Count % of tot Pt Bis t (p) PV1Avg:1 PV1 SD:1 ------------------------------------------------------------------------- A 0.00 4759 56.17 -0.08 -7.45(.000) -0.20 0.61 B 0.00 2792 32.96 0.19 18.14(.000) -0.02 0.64 C 0.00 608 7.18 -0.12 -10.75(.000) -0.39 0.52 D* 1.00 299 3.53 -0.11 -10.15(.000) -0.40 0.55 X 0.00 14 0.17 -0.02 -1.61(.108) -0.43 0.64 ========================================================================= *Correct answer
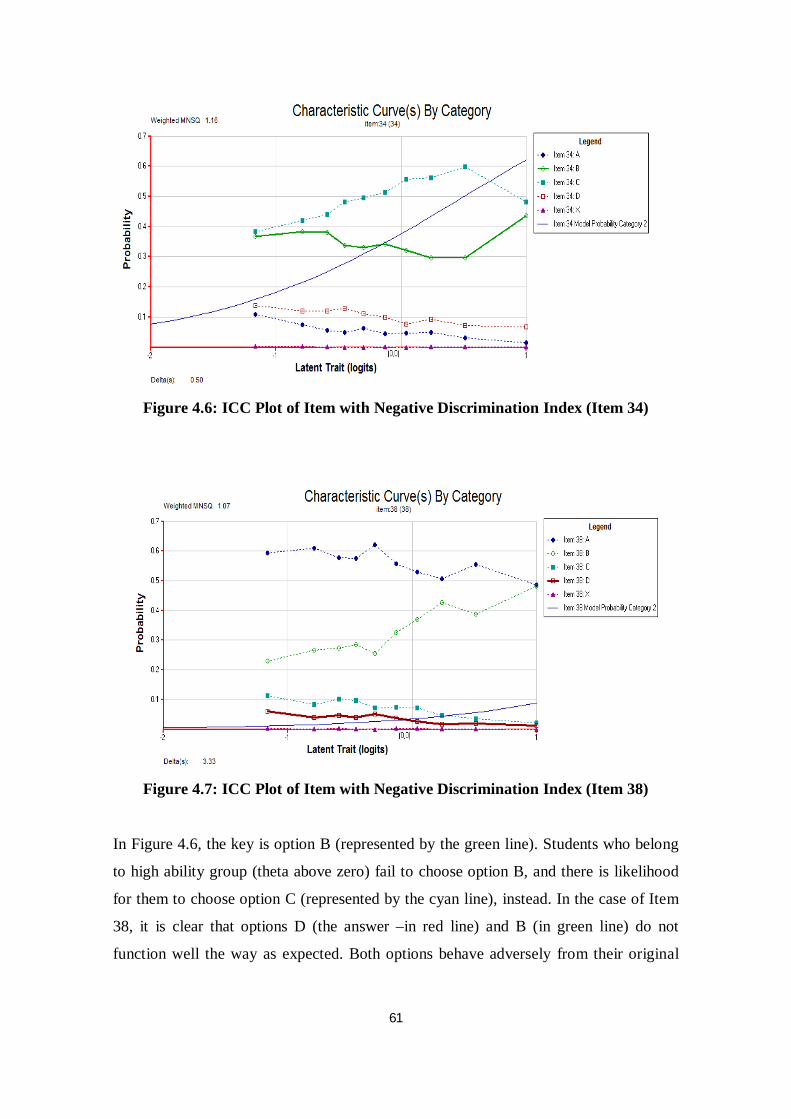
61
Figure 4.6: ICC Plot of Item with Negative Discrimination Index (Item 34)
Figure 4.7: ICC Plot of Item with Negative Discrimination Index (Item 38)
In Figure 4.6, the key is option B (represented by the green line). Students who belong
to high ability group (theta above zero) fail to choose option B, and there is likelihood
for them to choose option C (represented by the cyan line), instead. In the case of Item
38, it is clear that options D (the answer –in red line) and B (in green line) do not
function well the way as expected. Both options behave adversely from their original
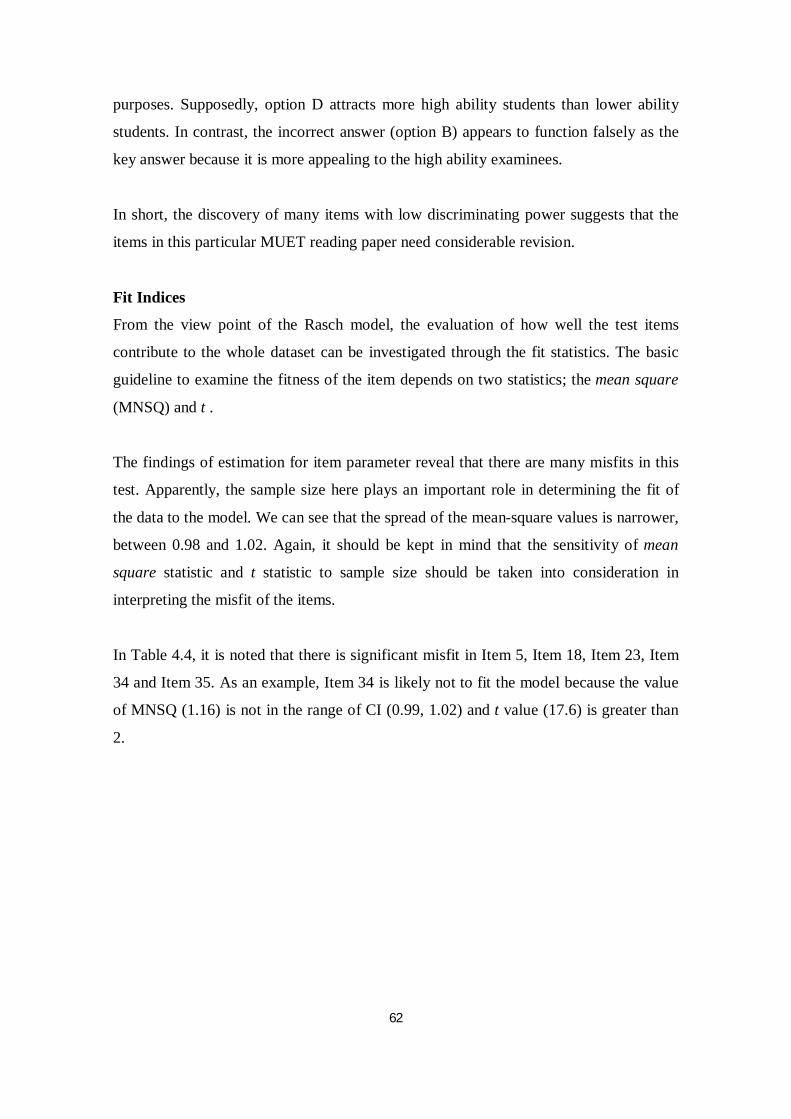
62
purposes. Supposedly, option D attracts more high ability students than lower ability
students. In contrast, the incorrect answer (option B) appears to function falsely as the
key answer because it is more appealing to the high ability examinees.
In short, the discovery of many items with low discriminating power suggests that the
items in this particular MUET reading paper need considerable revision.
Fit Indices
From the view point of the Rasch model, the evaluation of how well the test items
contribute to the whole dataset can be investigated through the fit statistics. The basic
guideline to examine the fitness of the item depends on two statistics; the mean square
(MNSQ) and t .
The findings of estimation for item parameter reveal that there are many misfits in this
test. Apparently, the sample size here plays an important role in determining the fit of
the data to the model. We can see that the spread of the mean-square values is narrower,
between 0.98 and 1.02. Again, it should be kept in mind that the sensitivity of mean
square statistic and t statistic to sample size should be taken into consideration in
interpreting the misfit of the items.
In Table 4.4, it is noted that there is significant misfit in Item 5, Item 18, Item 23, Item
34 and Item 35. As an example, Item 34 is likely not to fit the model because the value
of MNSQ (1.16) is not in the range of CI (0.99, 1.02) and t value (17.6) is greater than
2.
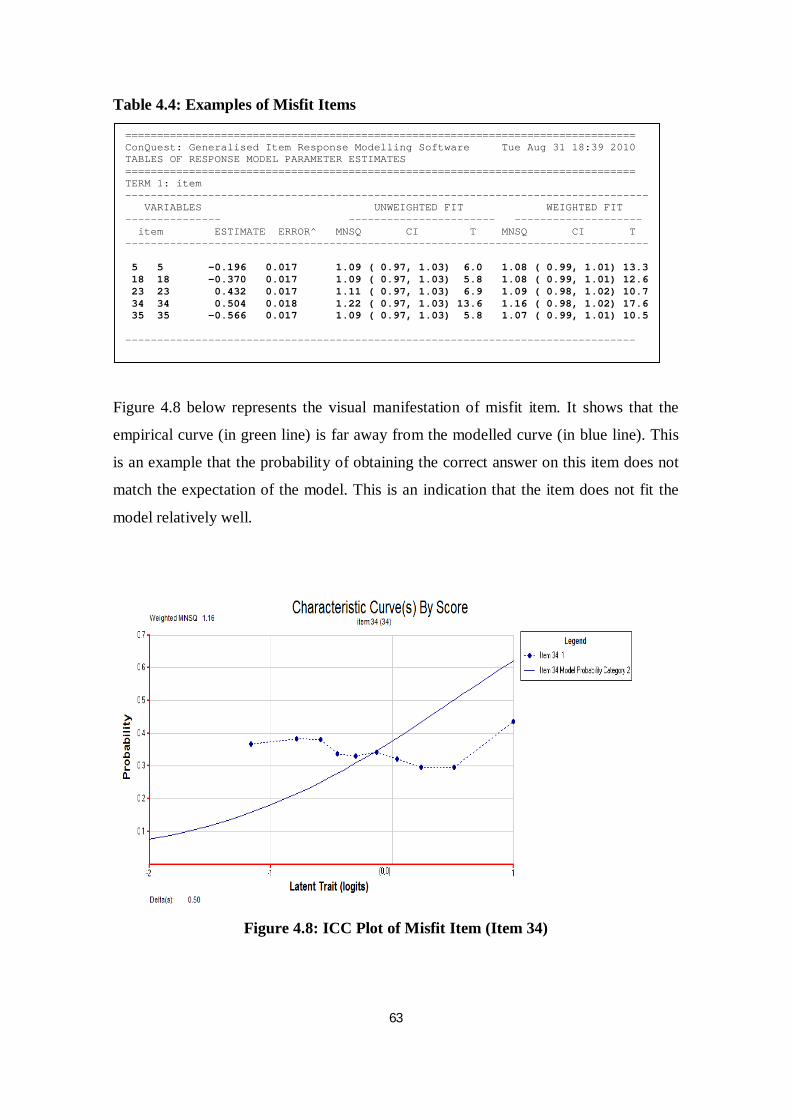
63
Table 4.4: Examples of Misfit Items
Figure 4.8 below represents the visual manifestation of misfit item. It shows that the
empirical curve (in green line) is far away from the modelled curve (in blue line). This
is an example that the probability of obtaining the correct answer on this item does not
match the expectation of the model. This is an indication that the item does not fit the
model relatively well.
Figure 4.8: ICC Plot of Misfit Item (Item 34)
================================================================================ ConQuest: Generalised Item Response Modelling Software Tue Aug 31 18:39 2010 TABLES OF RESPONSE MODEL PARAMETER ESTIMATES ================================================================================ TERM 1: item ---------------------------------------------------------------------------------- VARIABLES UNWEIGHTED FIT WEIGHTED FIT --------------- ----------------------- -------------------- item ESTIMATE ERROR^ MNSQ CI T MNSQ CI T ---------------------------------------------------------------------------------- 5 5 -0.196 0.017 1.09 ( 0.97, 1.03) 6.0 1.08 ( 0.99, 1.01) 13.3 18 18 -0.370 0.017 1.09 ( 0.97, 1.03) 5.8 1.08 ( 0.99, 1.01) 12.6 23 23 0.432 0.017 1.11 ( 0.97, 1.03) 6.9 1.09 ( 0.98, 1.02) 10.7 34 34 0.504 0.018 1.22 ( 0.97, 1.03) 13.6 1.16 ( 0.98, 1.02) 17.6 35 35 -0.566 0.017 1.09 ( 0.97, 1.03) 5.8 1.07 ( 0.99, 1.01) 10.5 --------------------------------------------------------------------------------
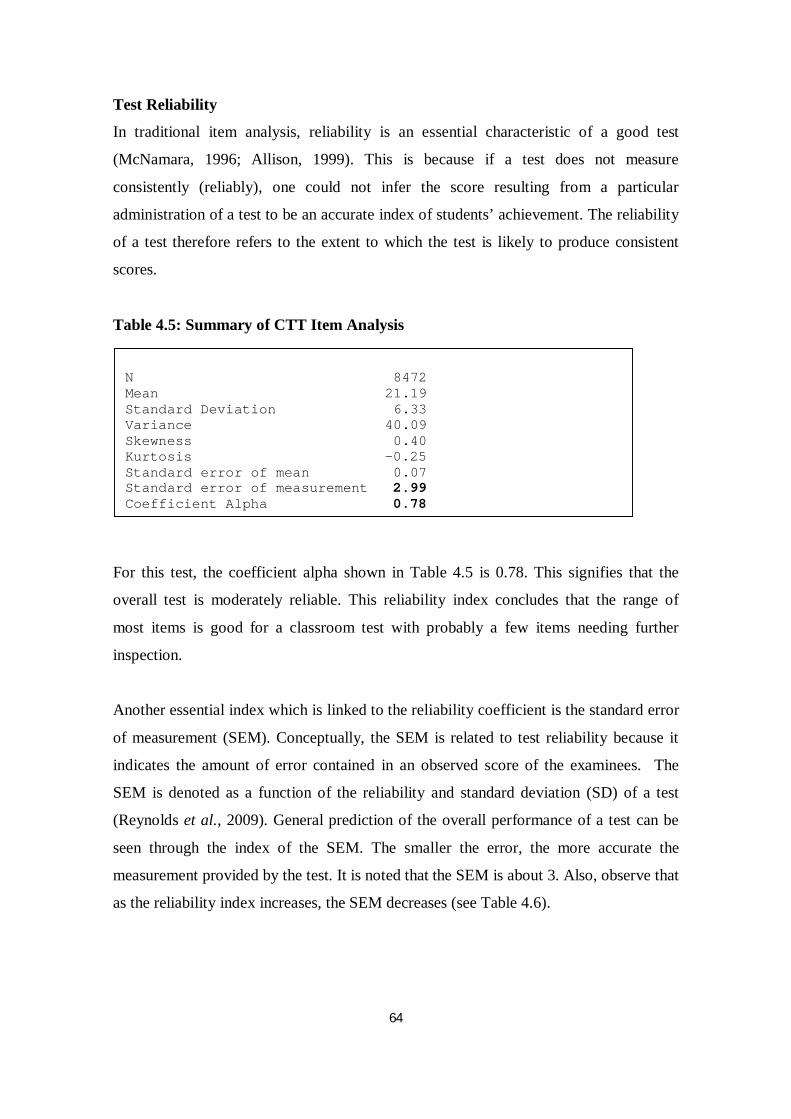
64
Test Reliability
In traditional item analysis, reliability is an essential characteristic of a good test
(McNamara, 1996; Allison, 1999). This is because if a test does not measure
consistently (reliably), one could not infer the score resulting from a particular
administration of a test to be an accurate index of students’ achievement. The reliability
of a test therefore refers to the extent to which the test is likely to produce consistent
scores.
Table 4.5: Summary of CTT Item Analysis
For this test, the coefficient alpha shown in Table 4.5 is 0.78. This signifies that the
overall test is moderately reliable. This reliability index concludes that the range of
most items is good for a classroom test with probably a few items needing further
inspection.
Another essential index which is linked to the reliability coefficient is the standard error
of measurement (SEM). Conceptually, the SEM is related to test reliability because it
indicates the amount of error contained in an observed score of the examinees. The
SEM is denoted as a function of the reliability and standard deviation (SD) of a test
(Reynolds et al., 2009). General prediction of the overall performance of a test can be
seen through the index of the SEM. The smaller the error, the more accurate the
measurement provided by the test. It is noted that the SEM is about 3. Also, observe that
as the reliability index increases, the SEM decreases (see Table 4.6).
N 8472 Mean 21.19 Standard Deviation 6.33 Variance 40.09 Skewness 0.40 Kurtosis -0.25 Standard error of mean 0.07 Standard error of measurement 2.99 Coefficient Alpha 0.78
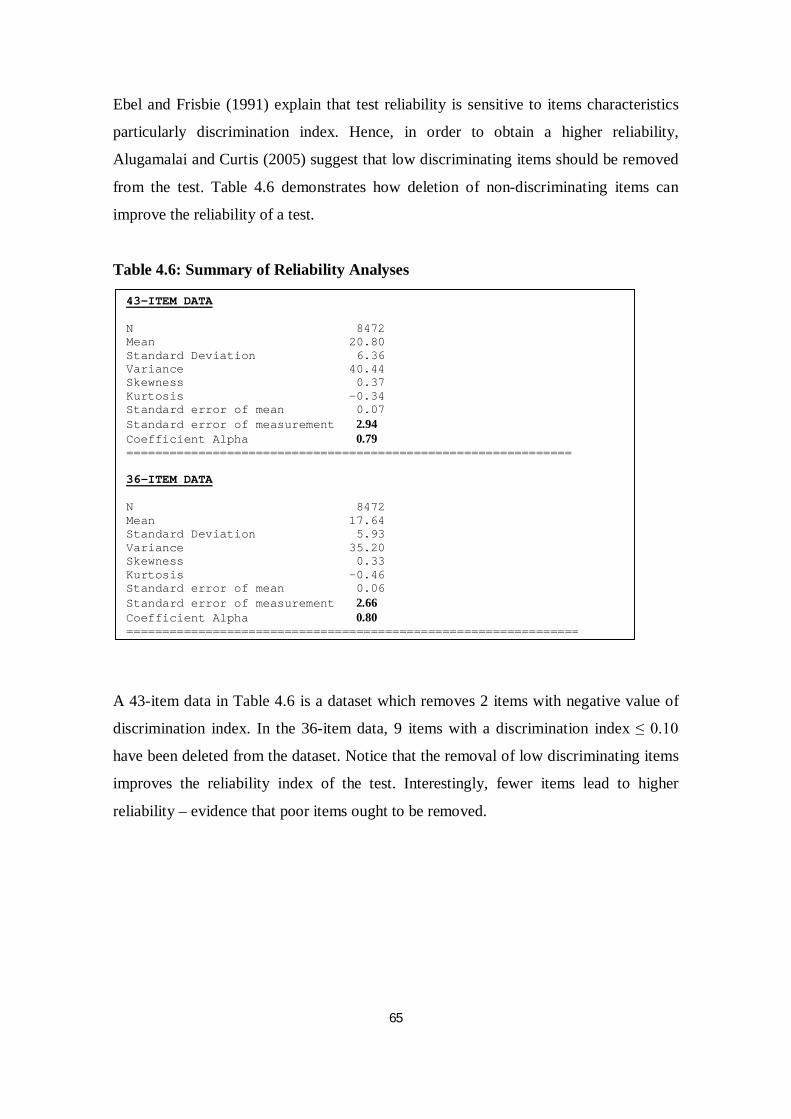
65
Ebel and Frisbie (1991) explain that test reliability is sensitive to items characteristics
particularly discrimination index. Hence, in order to obtain a higher reliability,
Alugamalai and Curtis (2005) suggest that low discriminating items should be removed
from the test. Table 4.6 demonstrates how deletion of non-discriminating items can
improve the reliability of a test.
Table 4.6: Summary of Reliability Analyses
A 43-item data in Table 4.6 is a dataset which removes 2 items with negative value of
discrimination index. In the 36-item data, 9 items with a discrimination index ≤ 0.10
have been deleted from the dataset. Notice that the removal of low discriminating items
improves the reliability index of the test. Interestingly, fewer items lead to higher
reliability – evidence that poor items ought to be removed.
43-ITEM DATA N 8472 Mean 20.80 Standard Deviation 6.36 Variance 40.44 Skewness 0.37 Kurtosis -0.34 Standard error of mean 0.07 Standard error of measurement 2.94 Coefficient Alpha 0.79 ============================================================== 36-ITEM DATA N 8472 Mean 17.64 Standard Deviation 5.93 Variance 35.20 Skewness 0.33 Kurtosis -0.46 Standard error of mean 0.06 Standard error of measurement 2.66 Coefficient Alpha 0.80 ===============================================================
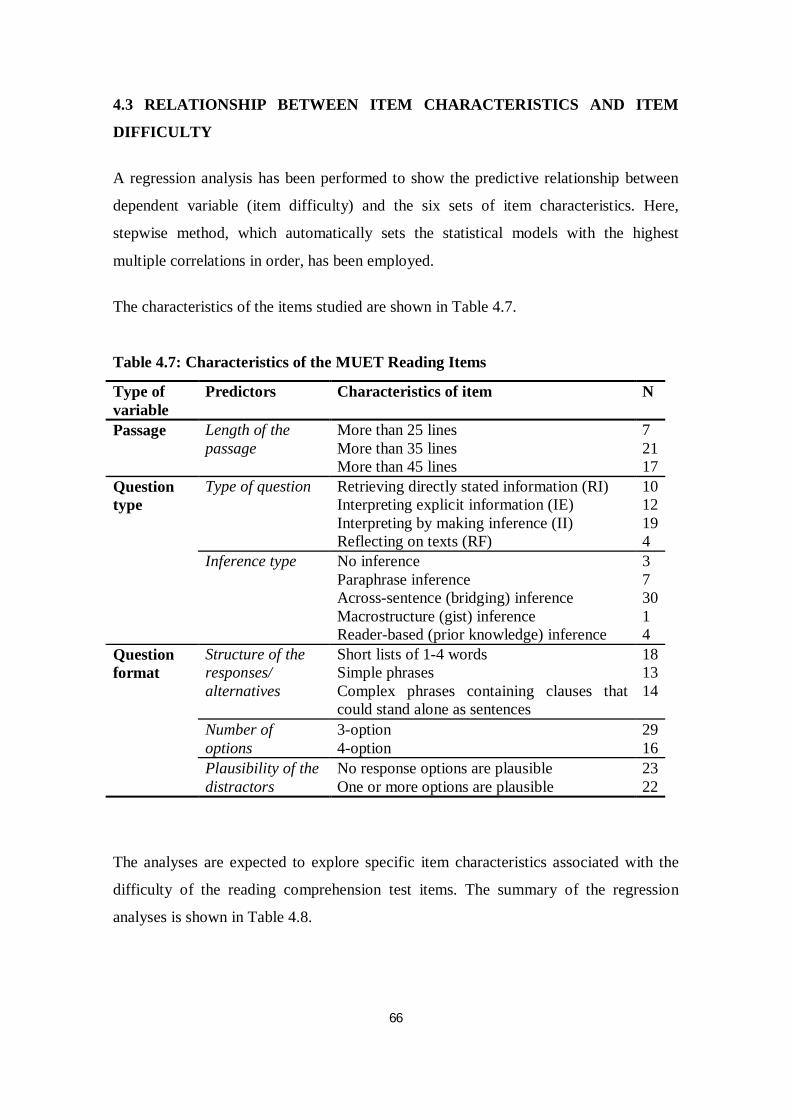
66
4.3 RELATIONSHIP BETWEEN ITEM CHARACTERISTICS AND ITEM
DIFFICULTY
A regression analysis has been performed to show the predictive relationship between
dependent variable (item difficulty) and the six sets of item characteristics. Here,
stepwise method, which automatically sets the statistical models with the highest
multiple correlations in order, has been employed.
The characteristics of the items studied are shown in Table 4.7.
Table 4.7: Characteristics of the MUET Reading Items
Type of variable
Predictors Characteristics of item N
Passage Length of the passage
More than 25 lines More than 35 lines More than 45 lines
7 21 17
Question type
Type of question Retrieving directly stated information (RI) Interpreting explicit information (IE) Interpreting by making inference (II) Reflecting on texts (RF)
10 12 19 4
Inference type No inference Paraphrase inference Across-sentence (bridging) inference Macrostructure (gist) inference Reader-based (prior knowledge) inference
3 7 30 1 4
Question format
Structure of the responses/ alternatives
Short lists of 1-4 words Simple phrases Complex phrases containing clauses that could stand alone as sentences
18 13 14
Number of options
3-option 4-option
29 16
Plausibility of the distractors
No response options are plausible One or more options are plausible
23 22
The analyses are expected to explore specific item characteristics associated with the
difficulty of the reading comprehension test items. The summary of the regression
analyses is shown in Table 4.8.
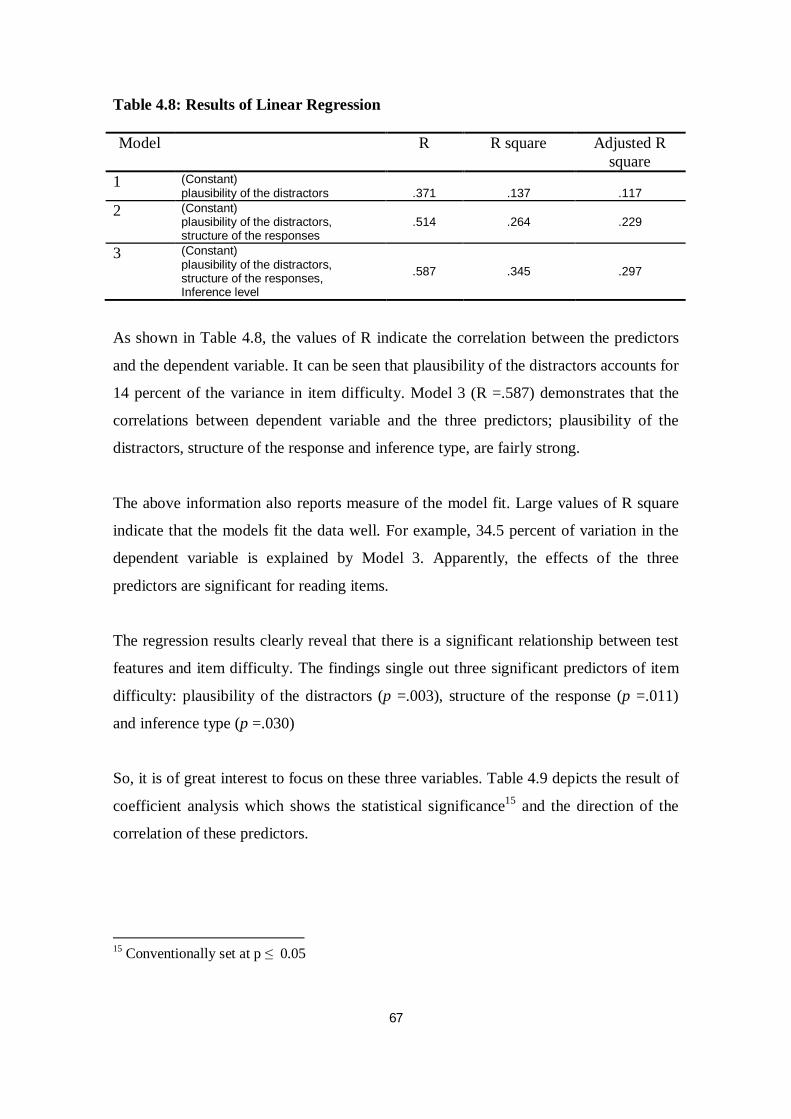
67
Table 4.8: Results of Linear Regression Model R R square Adjusted R
square 1 (Constant)
plausibility of the distractors
.371
.137
.117 2 (Constant)
plausibility of the distractors, structure of the responses
.514 .264 .229
3 (Constant) plausibility of the distractors, structure of the responses, Inference level
.587 .345 .297
As shown in Table 4.8, the values of R indicate the correlation between the predictors
and the dependent variable. It can be seen that plausibility of the distractors accounts for
14 percent of the variance in item difficulty. Model 3 (R =.587) demonstrates that the
correlations between dependent variable and the three predictors; plausibility of the
distractors, structure of the response and inference type, are fairly strong.
The above information also reports measure of the model fit. Large values of R square
indicate that the models fit the data well. For example, 34.5 percent of variation in the
dependent variable is explained by Model 3. Apparently, the effects of the three
predictors are significant for reading items.
The regression results clearly reveal that there is a significant relationship between test
features and item difficulty. The findings single out three significant predictors of item
difficulty: plausibility of the distractors (p =.003), structure of the response (p =.011)
and inference type (p =.030)
So, it is of great interest to focus on these three variables. Table 4.9 depicts the result of
coefficient analysis which shows the statistical significance15 and the direction of the
correlation of these predictors.
15 Conventionally set at p ≤ 0.05
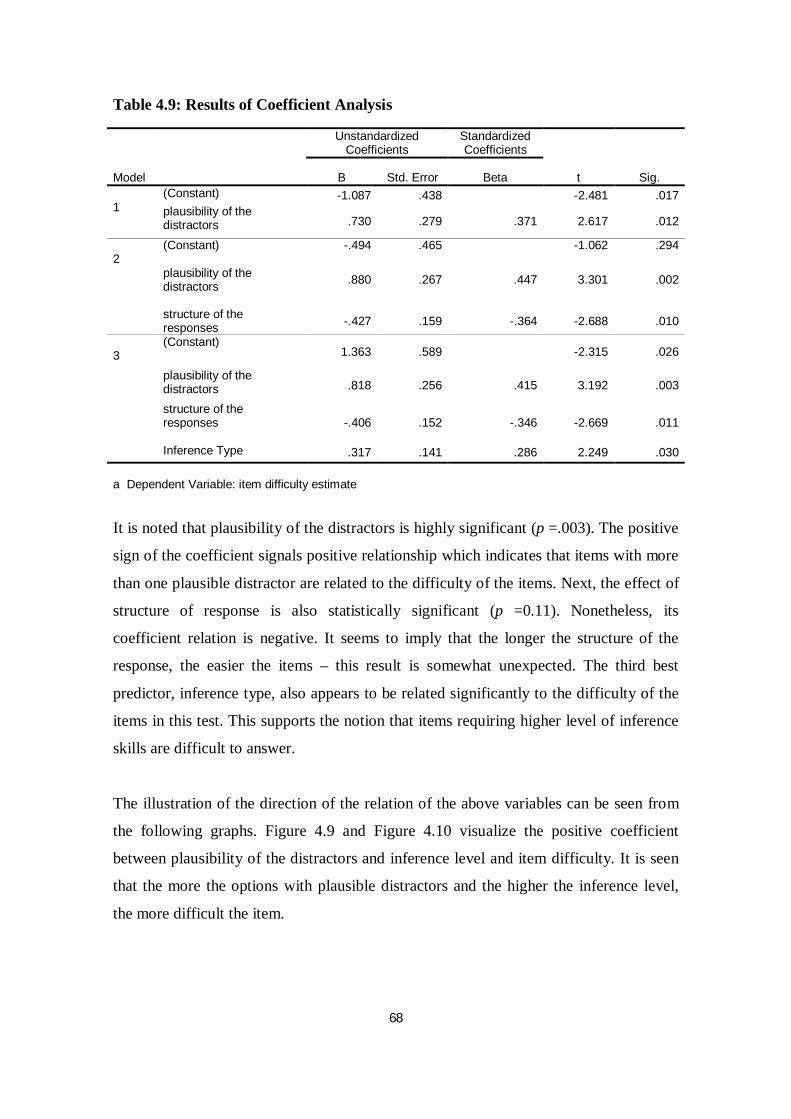
68
Table 4.9: Results of Coefficient Analysis
Model
Unstandardized Coefficients
Standardized Coefficients
t Sig. B Std. Error Beta 1
(Constant) -1.087 .438 -2.481 .017 plausibility of the distractors .730 .279 .371 2.617 .012
2
(Constant) -.494 .465 -1.062 .294 plausibility of the distractors
.880 .267 .447 3.301 .002
structure of the responses -.427 .159 -.364 -2.688 .010
3
(Constant) 1.363 .589 -2.315 .026
plausibility of the distractors .818 .256 .415 3.192 .003
structure of the responses
-.406 .152 -.346 -2.669 .011
Inference Type .317 .141 .286 2.249 .030 a Dependent Variable: item difficulty estimate
It is noted that plausibility of the distractors is highly significant (p =.003). The positive
sign of the coefficient signals positive relationship which indicates that items with more
than one plausible distractor are related to the difficulty of the items. Next, the effect of
structure of response is also statistically significant (p =0.11). Nonetheless, its
coefficient relation is negative. It seems to imply that the longer the structure of the
response, the easier the items – this result is somewhat unexpected. The third best
predictor, inference type, also appears to be related significantly to the difficulty of the
items in this test. This supports the notion that items requiring higher level of inference
skills are difficult to answer.
The illustration of the direction of the relation of the above variables can be seen from
the following graphs. Figure 4.9 and Figure 4.10 visualize the positive coefficient
between plausibility of the distractors and inference level and item difficulty. It is seen
that the more the options with plausible distractors and the higher the inference level,
the more difficult the item.
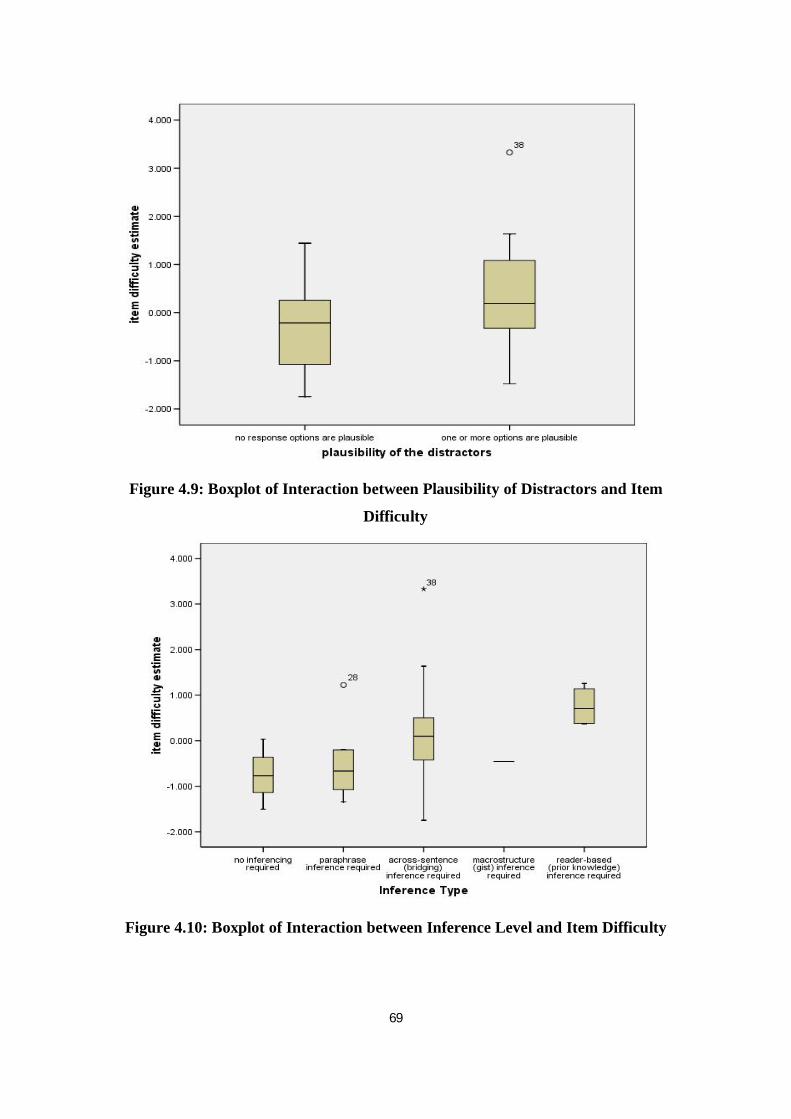
69
Figure 4.9: Boxplot of Interaction between Plausibility of Distractors and Item
Difficulty
Figure 4.10: Boxplot of Interaction between Inference Level and Item Difficulty
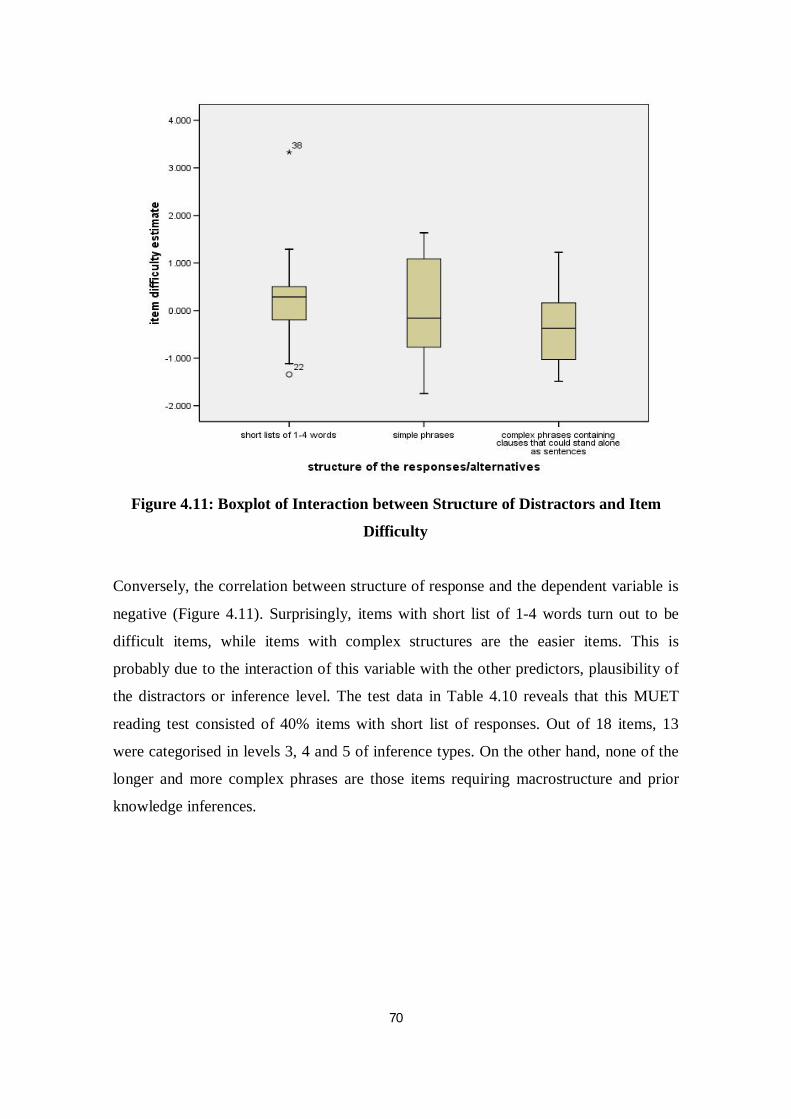
70
Figure 4.11: Boxplot of Interaction between Structure of Distractors and Item
Difficulty
Conversely, the correlation between structure of response and the dependent variable is
negative (Figure 4.11). Surprisingly, items with short list of 1-4 words turn out to be
difficult items, while items with complex structures are the easier items. This is
probably due to the interaction of this variable with the other predictors, plausibility of
the distractors or inference level. The test data in Table 4.10 reveals that this MUET
reading test consisted of 40% items with short list of responses. Out of 18 items, 13
were categorised in levels 3, 4 and 5 of inference types. On the other hand, none of the
longer and more complex phrases are those items requiring macrostructure and prior
knowledge inferences.
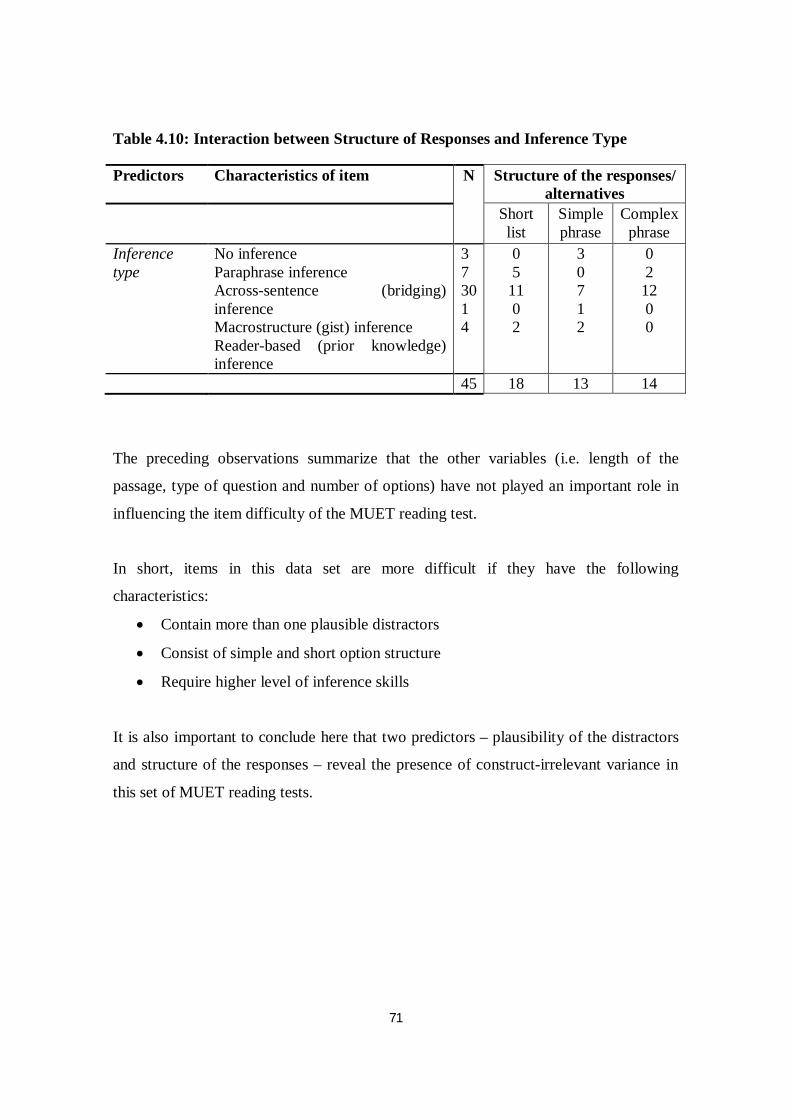
71
Table 4.10: Interaction between Structure of Responses and Inference Type
Predictors Characteristics of item N Structure of the responses/ alternatives
Short list
Simple phrase
Complex phrase
Inference type
No inference Paraphrase inference Across-sentence (bridging) inference Macrostructure (gist) inference Reader-based (prior knowledge) inference
3 7 30 1 4
0 5
11 0 2
3 0 7 1 2
0 2
12 0 0
45 18 13 14
The preceding observations summarize that the other variables (i.e. length of the
passage, type of question and number of options) have not played an important role in
influencing the item difficulty of the MUET reading test.
In short, items in this data set are more difficult if they have the following
characteristics:
Contain more than one plausible distractors
Consist of simple and short option structure
Require higher level of inference skills
It is also important to conclude here that two predictors – plausibility of the distractors
and structure of the responses – reveal the presence of construct-irrelevant variance in
this set of MUET reading tests.
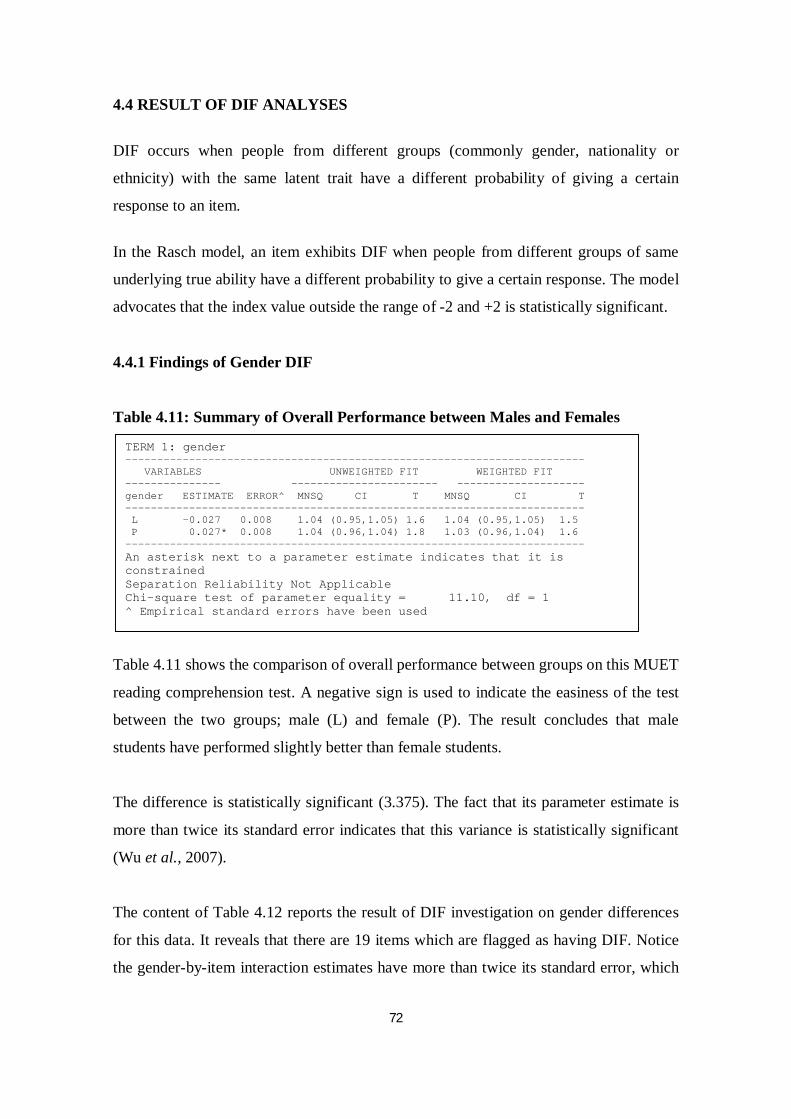
72
4.4 RESULT OF DIF ANALYSES
DIF occurs when people from different groups (commonly gender, nationality or
ethnicity) with the same latent trait have a different probability of giving a certain
response to an item.
In the Rasch model, an item exhibits DIF when people from different groups of same
underlying true ability have a different probability to give a certain response. The model
advocates that the index value outside the range of -2 and +2 is statistically significant.
4.4.1 Findings of Gender DIF
Table 4.11: Summary of Overall Performance between Males and Females
Table 4.11 shows the comparison of overall performance between groups on this MUET
reading comprehension test. A negative sign is used to indicate the easiness of the test
between the two groups; male (L) and female (P). The result concludes that male
students have performed slightly better than female students.
The difference is statistically significant (3.375). The fact that its parameter estimate is
more than twice its standard error indicates that this variance is statistically significant
(Wu et al., 2007).
The content of Table 4.12 reports the result of DIF investigation on gender differences
for this data. It reveals that there are 19 items which are flagged as having DIF. Notice
the gender-by-item interaction estimates have more than twice its standard error, which
TERM 1: gender ------------------------------------------------------------------------ VARIABLES UNWEIGHTED FIT WEIGHTED FIT --------------- ----------------------- -------------------- gender ESTIMATE ERROR^ MNSQ CI T MNSQ CI T ------------------------------------------------------------------------ L -0.027 0.008 1.04 (0.95,1.05) 1.6 1.04 (0.95,1.05) 1.5 P 0.027* 0.008 1.04 (0.96,1.04) 1.8 1.03 (0.96,1.04) 1.6 ------------------------------------------------------------------------ An asterisk next to a parameter estimate indicates that it is constrained Separation Reliability Not Applicable Chi-square test of parameter equality = 11.10, df = 1 ^ Empirical standard errors have been used
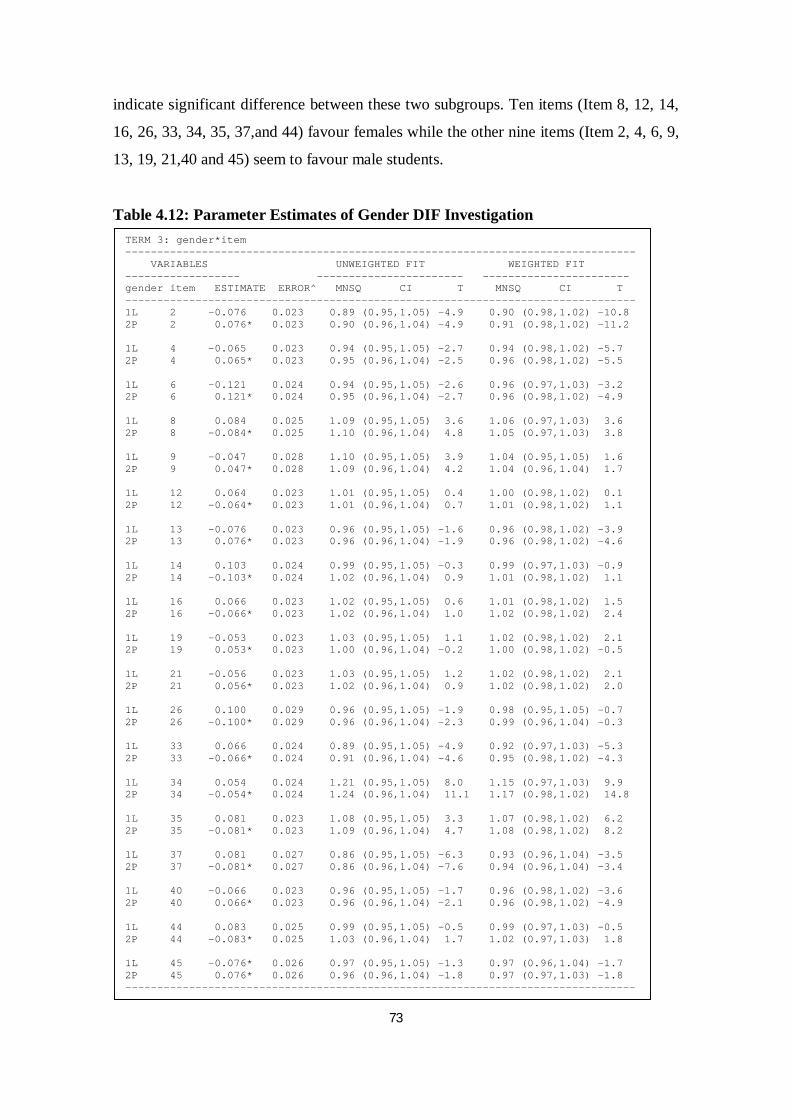
73
indicate significant difference between these two subgroups. Ten items (Item 8, 12, 14,
16, 26, 33, 34, 35, 37,and 44) favour females while the other nine items (Item 2, 4, 6, 9,
13, 19, 21,40 and 45) seem to favour male students.
Table 4.12: Parameter Estimates of Gender DIF Investigation
TERM 3: gender*item -------------------------------------------------------------------------------- VARIABLES UNWEIGHTED FIT WEIGHTED FIT ------------------ ----------------------- ----------------------- gender item ESTIMATE ERROR^ MNSQ CI T MNSQ CI T -------------------------------------------------------------------------------- 1L 2 -0.076 0.023 0.89 (0.95,1.05) -4.9 0.90 (0.98,1.02) -10.8 2P 2 0.076* 0.023 0.90 (0.96,1.04) -4.9 0.91 (0.98,1.02) -11.2 1L 4 -0.065 0.023 0.94 (0.95,1.05) -2.7 0.94 (0.98,1.02) -5.7 2P 4 0.065* 0.023 0.95 (0.96,1.04) -2.5 0.96 (0.98,1.02) -5.5 1L 6 -0.121 0.024 0.94 (0.95,1.05) -2.6 0.96 (0.97,1.03) -3.2 2P 6 0.121* 0.024 0.95 (0.96,1.04) -2.7 0.96 (0.98,1.02) -4.9 1L 8 0.084 0.025 1.09 (0.95,1.05) 3.6 1.06 (0.97,1.03) 3.6 2P 8 -0.084* 0.025 1.10 (0.96,1.04) 4.8 1.05 (0.97,1.03) 3.8 1L 9 -0.047 0.028 1.10 (0.95,1.05) 3.9 1.04 (0.95,1.05) 1.6 2P 9 0.047* 0.028 1.09 (0.96,1.04) 4.2 1.04 (0.96,1.04) 1.7 1L 12 0.064 0.023 1.01 (0.95,1.05) 0.4 1.00 (0.98,1.02) 0.1 2P 12 -0.064* 0.023 1.01 (0.96,1.04) 0.7 1.01 (0.98,1.02) 1.1 1L 13 -0.076 0.023 0.96 (0.95,1.05) -1.6 0.96 (0.98,1.02) -3.9 2P 13 0.076* 0.023 0.96 (0.96,1.04) -1.9 0.96 (0.98,1.02) -4.6 1L 14 0.103 0.024 0.99 (0.95,1.05) -0.3 0.99 (0.97,1.03) -0.9 2P 14 -0.103* 0.024 1.02 (0.96,1.04) 0.9 1.01 (0.98,1.02) 1.1 1L 16 0.066 0.023 1.02 (0.95,1.05) 0.6 1.01 (0.98,1.02) 1.5 2P 16 -0.066* 0.023 1.02 (0.96,1.04) 1.0 1.02 (0.98,1.02) 2.4 1L 19 -0.053 0.023 1.03 (0.95,1.05) 1.1 1.02 (0.98,1.02) 2.1 2P 19 0.053* 0.023 1.00 (0.96,1.04) -0.2 1.00 (0.98,1.02) -0.5 1L 21 -0.056 0.023 1.03 (0.95,1.05) 1.2 1.02 (0.98,1.02) 2.1 2P 21 0.056* 0.023 1.02 (0.96,1.04) 0.9 1.02 (0.98,1.02) 2.0 1L 26 0.100 0.029 0.96 (0.95,1.05) -1.9 0.98 (0.95,1.05) -0.7 2P 26 -0.100* 0.029 0.96 (0.96,1.04) -2.3 0.99 (0.96,1.04) -0.3 1L 33 0.066 0.024 0.89 (0.95,1.05) -4.9 0.92 (0.97,1.03) -5.3 2P 33 -0.066* 0.024 0.91 (0.96,1.04) -4.6 0.95 (0.98,1.02) -4.3 1L 34 0.054 0.024 1.21 (0.95,1.05) 8.0 1.15 (0.97,1.03) 9.9 2P 34 -0.054* 0.024 1.24 (0.96,1.04) 11.1 1.17 (0.98,1.02) 14.8 1L 35 0.081 0.023 1.08 (0.95,1.05) 3.3 1.07 (0.98,1.02) 6.2 2P 35 -0.081* 0.023 1.09 (0.96,1.04) 4.7 1.08 (0.98,1.02) 8.2 1L 37 0.081 0.027 0.86 (0.95,1.05) -6.3 0.93 (0.96,1.04) -3.5 2P 37 -0.081* 0.027 0.86 (0.96,1.04) -7.6 0.94 (0.96,1.04) -3.4 1L 40 -0.066 0.023 0.96 (0.95,1.05) -1.7 0.96 (0.98,1.02) -3.6 2P 40 0.066* 0.023 0.96 (0.96,1.04) -2.1 0.96 (0.98,1.02) -4.9 1L 44 0.083 0.025 0.99 (0.95,1.05) -0.5 0.99 (0.97,1.03) -0.5 2P 44 -0.083* 0.025 1.03 (0.96,1.04) 1.7 1.02 (0.97,1.03) 1.8 1L 45 -0.076* 0.026 0.97 (0.95,1.05) -1.3 0.97 (0.96,1.04) -1.7 2P 45 0.076* 0.026 0.96 (0.96,1.04) -1.8 0.97 (0.97,1.03) -1.8 --------------------------------------------------------------------------------
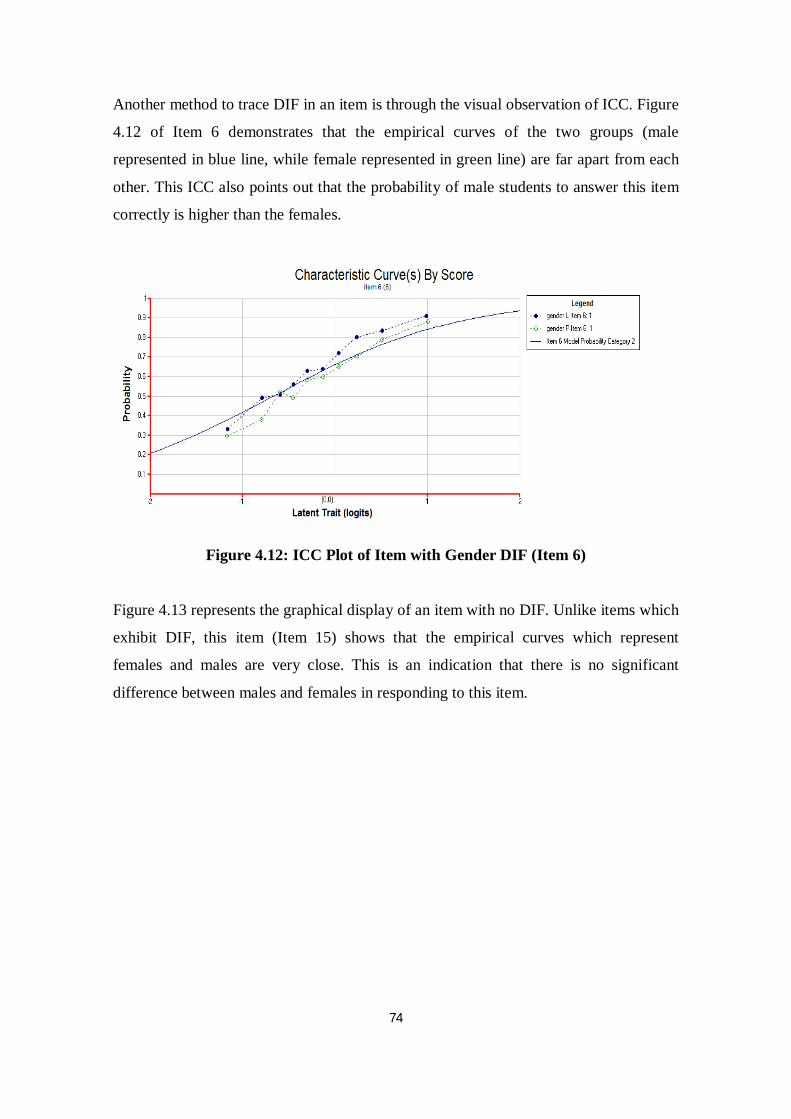
74
Another method to trace DIF in an item is through the visual observation of ICC. Figure
4.12 of Item 6 demonstrates that the empirical curves of the two groups (male
represented in blue line, while female represented in green line) are far apart from each
other. This ICC also points out that the probability of male students to answer this item
correctly is higher than the females.
Figure 4.12: ICC Plot of Item with Gender DIF (Item 6)
Figure 4.13 represents the graphical display of an item with no DIF. Unlike items which
exhibit DIF, this item (Item 15) shows that the empirical curves which represent
females and males are very close. This is an indication that there is no significant
difference between males and females in responding to this item.
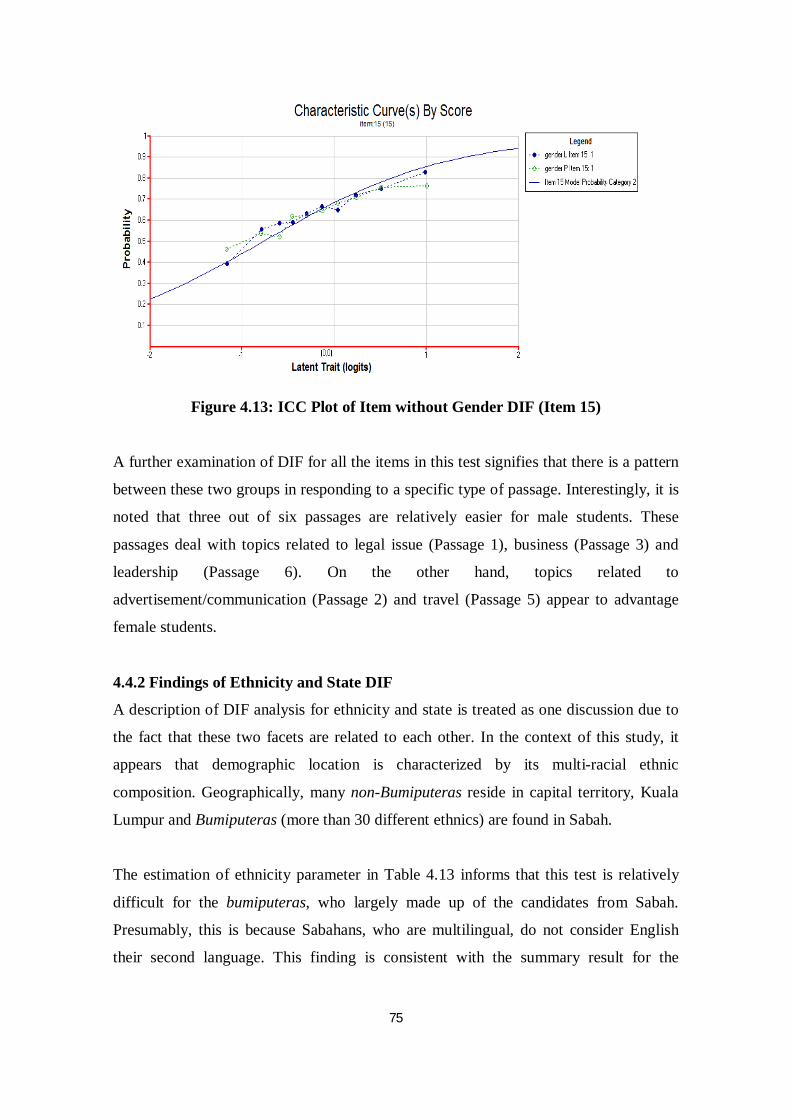
75
Figure 4.13: ICC Plot of Item without Gender DIF (Item 15)
A further examination of DIF for all the items in this test signifies that there is a pattern
between these two groups in responding to a specific type of passage. Interestingly, it is
noted that three out of six passages are relatively easier for male students. These
passages deal with topics related to legal issue (Passage 1), business (Passage 3) and
leadership (Passage 6). On the other hand, topics related to
advertisement/communication (Passage 2) and travel (Passage 5) appear to advantage
female students.
4.4.2 Findings of Ethnicity and State DIF
A description of DIF analysis for ethnicity and state is treated as one discussion due to
the fact that these two facets are related to each other. In the context of this study, it
appears that demographic location is characterized by its multi-racial ethnic
composition. Geographically, many non-Bumiputeras reside in capital territory, Kuala
Lumpur and Bumiputeras (more than 30 different ethnics) are found in Sabah.
The estimation of ethnicity parameter in Table 4.13 informs that this test is relatively
difficult for the bumiputeras, who largely made up of the candidates from Sabah.
Presumably, this is because Sabahans, who are multilingual, do not consider English
their second language. This finding is consistent with the summary result for the
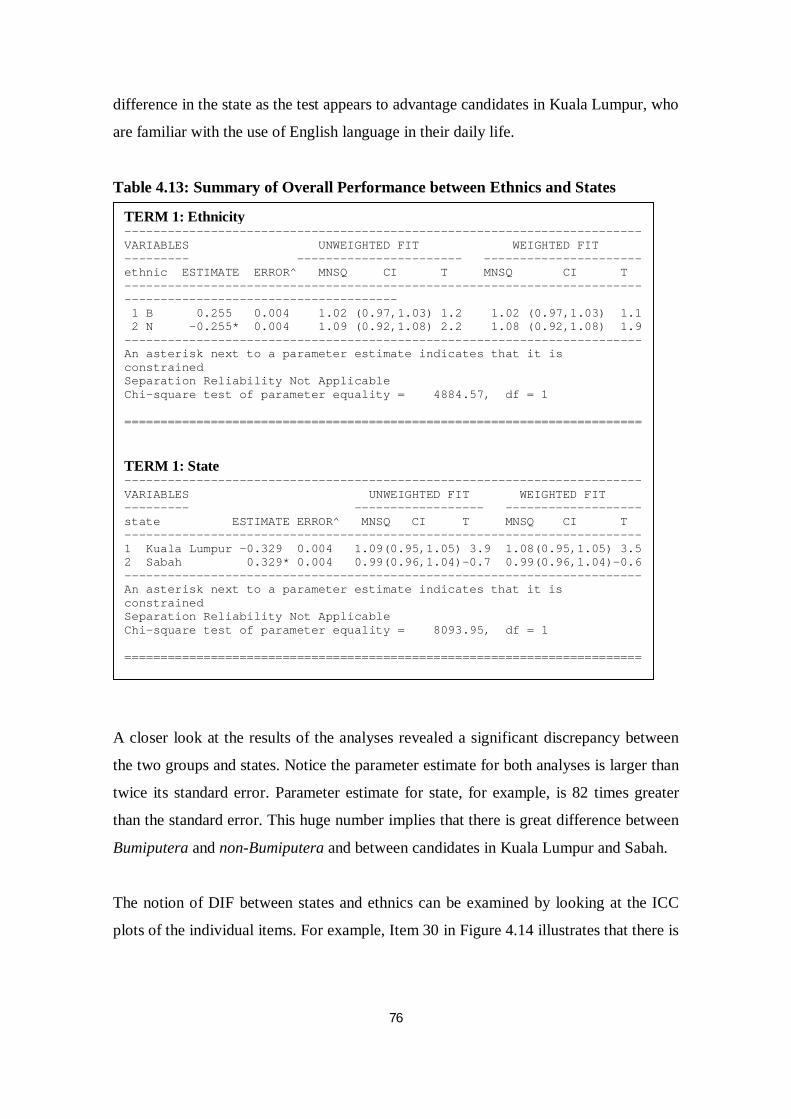
76
difference in the state as the test appears to advantage candidates in Kuala Lumpur, who
are familiar with the use of English language in their daily life.
Table 4.13: Summary of Overall Performance between Ethnics and States
A closer look at the results of the analyses revealed a significant discrepancy between
the two groups and states. Notice the parameter estimate for both analyses is larger than
twice its standard error. Parameter estimate for state, for example, is 82 times greater
than the standard error. This huge number implies that there is great difference between
Bumiputera and non-Bumiputera and between candidates in Kuala Lumpur and Sabah.
The notion of DIF between states and ethnics can be examined by looking at the ICC
plots of the individual items. For example, Item 30 in Figure 4.14 illustrates that there is
TERM 1: Ethnicity ------------------------------------------------------------------------ VARIABLES UNWEIGHTED FIT WEIGHTED FIT --------- ----------------------- ---------------------- ethnic ESTIMATE ERROR^ MNSQ CI T MNSQ CI T -------------------------------------------------------------------------------------------------------------- 1 B 0.255 0.004 1.02 (0.97,1.03) 1.2 1.02 (0.97,1.03) 1.1 2 N -0.255* 0.004 1.09 (0.92,1.08) 2.2 1.08 (0.92,1.08) 1.9 ------------------------------------------------------------------------ An asterisk next to a parameter estimate indicates that it is constrained Separation Reliability Not Applicable Chi-square test of parameter equality = 4884.57, df = 1 ========================================================================
TERM 1: State ------------------------------------------------------------------------ VARIABLES UNWEIGHTED FIT WEIGHTED FIT --------- ------------------ ------------------- state ESTIMATE ERROR^ MNSQ CI T MNSQ CI T ------------------------------------------------------------------------ 1 Kuala Lumpur -0.329 0.004 1.09(0.95,1.05) 3.9 1.08(0.95,1.05) 3.5 2 Sabah 0.329* 0.004 0.99(0.96,1.04)-0.7 0.99(0.96,1.04)-0.6 ------------------------------------------------------------------------ An asterisk next to a parameter estimate indicates that it is constrained Separation Reliability Not Applicable Chi-square test of parameter equality = 8093.95, df = 1 ========================================================================
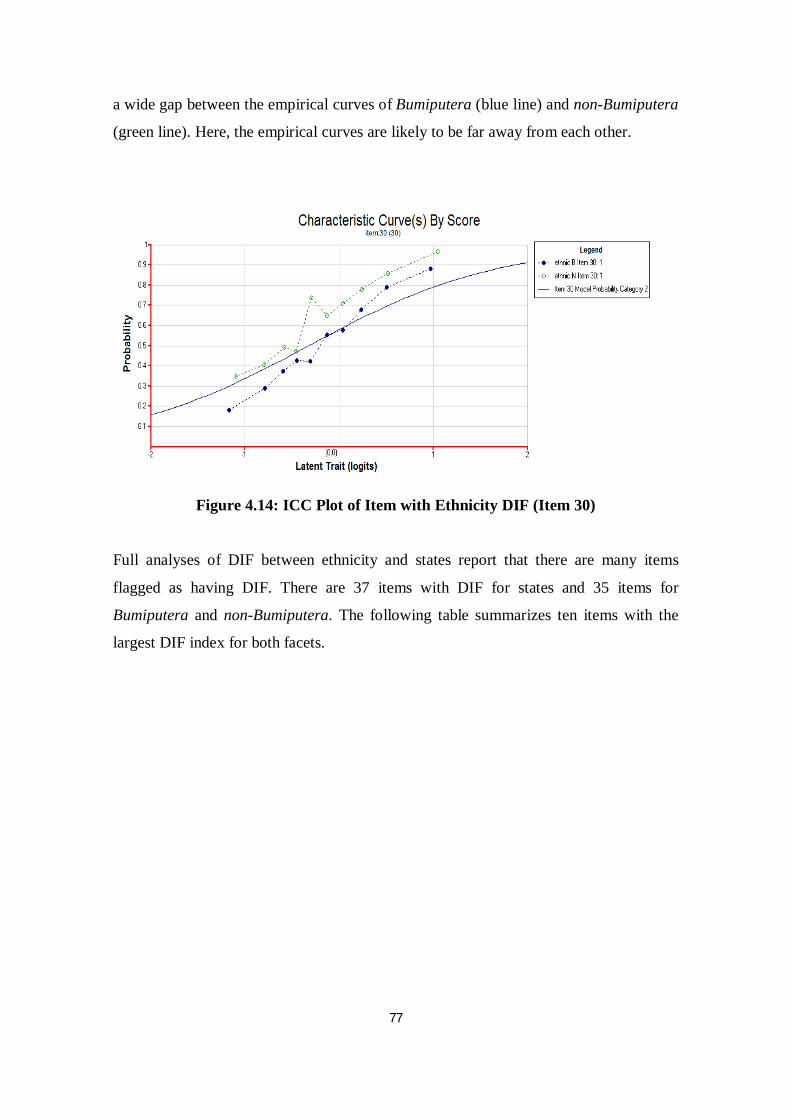
77
a wide gap between the empirical curves of Bumiputera (blue line) and non-Bumiputera
(green line). Here, the empirical curves are likely to be far away from each other.
Figure 4.14: ICC Plot of Item with Ethnicity DIF (Item 30)
Full analyses of DIF between ethnicity and states report that there are many items
flagged as having DIF. There are 37 items with DIF for states and 35 items for
Bumiputera and non-Bumiputera. The following table summarizes ten items with the
largest DIF index for both facets.
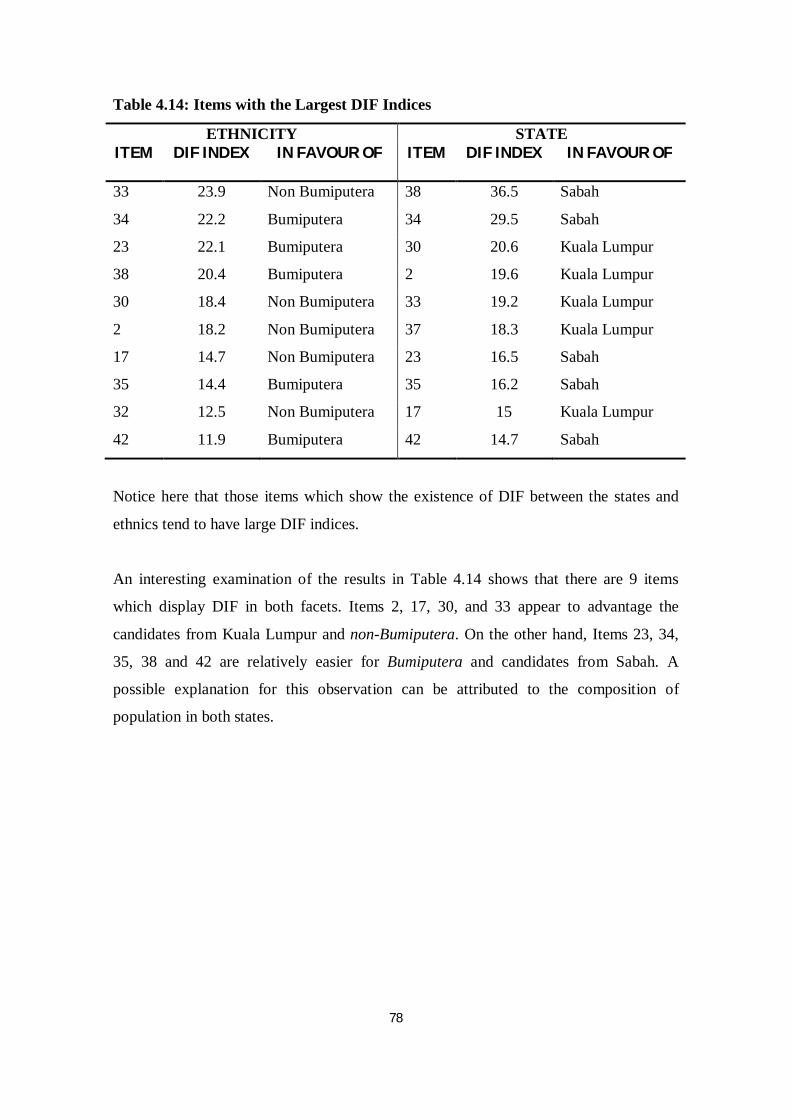
78
Table 4.14: Items with the Largest DIF Indices
ETHNICITY STATE ITEM DIF INDEX IN FAVOUR OF ITEM DIF INDEX IN FAVOUR OF
33 23.9 Non Bumiputera 38 36.5 Sabah
34 22.2 Bumiputera 34 29.5 Sabah
23 22.1 Bumiputera 30 20.6 Kuala Lumpur
38 20.4 Bumiputera 2 19.6 Kuala Lumpur
30 18.4 Non Bumiputera 33 19.2 Kuala Lumpur
2 18.2 Non Bumiputera 37 18.3 Kuala Lumpur
17 14.7 Non Bumiputera 23 16.5 Sabah
35 14.4 Bumiputera 35 16.2 Sabah
32 12.5 Non Bumiputera 17 15 Kuala Lumpur
42 11.9 Bumiputera 42 14.7 Sabah
Notice here that those items which show the existence of DIF between the states and
ethnics tend to have large DIF indices.
An interesting examination of the results in Table 4.14 shows that there are 9 items
which display DIF in both facets. Items 2, 17, 30, and 33 appear to advantage the
candidates from Kuala Lumpur and non-Bumiputera. On the other hand, Items 23, 34,
35, 38 and 42 are relatively easier for Bumiputera and candidates from Sabah. A
possible explanation for this observation can be attributed to the composition of
population in both states.
79
CHAPTER 5: DISCUSSION AND CONCLUSION
5.1 INTRODUCTION
This study sets out to explore several issues which may impact the difficulty level of
MUET, the high-stake English test used for admission into Malaysian public
universities. A primary interest of the study has been focused on assessing the quality of
the highest weighted component of MUET, that is the reading test. The 45 test items
have been scrutinised through item analyses based on CTT and the Rasch model. Also,
the study investigates to what extent features of test items and student background
characteristics influence the difficulty of the items. These two issues have been
examined through regression analysis and DIF analysis respectively.
The subsequent sections present the summary of the main findings. The discussion
focuses on addressing the research questions raised in Chapter 1. Furthermore, this
chapter discusses the implications of the findings for practice and future research.
5.2 DISCUSSION OF MAJOR FINDINGS
This section discusses the findings with respect to the four research questions posed in
Chapter 1. The results from item analysis, regression analysis and DIF analysis are used
to address the questions.
How do the items spread in terms of their difficulty values and the ability of the
students?
It is concluded that the test was reasonably well targeted for the ability of students. On
the basis of CTT and Rasch analyses, it can be seen that there is equal distribution of
easy and difficult items in the test. The Rasch analyses provide a clear view of the item
distribution and student ability through the item-person map. From the map, it is clear
that the majority of the items are distributed around the average ability of students at
logit -0.168.
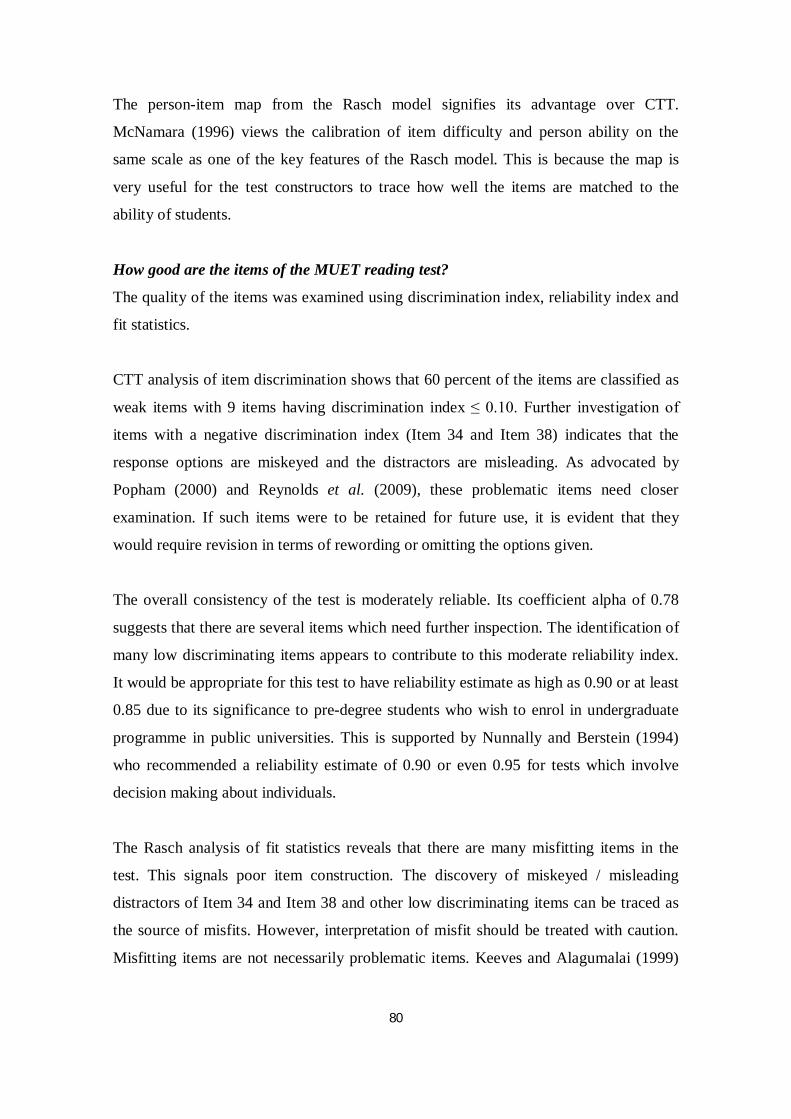
80
The person-item map from the Rasch model signifies its advantage over CTT.
McNamara (1996) views the calibration of item difficulty and person ability on the
same scale as one of the key features of the Rasch model. This is because the map is
very useful for the test constructors to trace how well the items are matched to the
ability of students.
How good are the items of the MUET reading test?
The quality of the items was examined using discrimination index, reliability index and
fit statistics.
CTT analysis of item discrimination shows that 60 percent of the items are classified as
weak items with 9 items having discrimination index ≤ 0.10. Further investigation of
items with a negative discrimination index (Item 34 and Item 38) indicates that the
response options are miskeyed and the distractors are misleading. As advocated by
Popham (2000) and Reynolds et al. (2009), these problematic items need closer
examination. If such items were to be retained for future use, it is evident that they
would require revision in terms of rewording or omitting the options given.
The overall consistency of the test is moderately reliable. Its coefficient alpha of 0.78
suggests that there are several items which need further inspection. The identification of
many low discriminating items appears to contribute to this moderate reliability index.
It would be appropriate for this test to have reliability estimate as high as 0.90 or at least
0.85 due to its significance to pre-degree students who wish to enrol in undergraduate
programme in public universities. This is supported by Nunnally and Berstein (1994)
who recommended a reliability estimate of 0.90 or even 0.95 for tests which involve
decision making about individuals.
The Rasch analysis of fit statistics reveals that there are many misfitting items in the
test. This signals poor item construction. The discovery of miskeyed / misleading
distractors of Item 34 and Item 38 and other low discriminating items can be traced as
the source of misfits. However, interpretation of misfit should be treated with caution.
Misfitting items are not necessarily problematic items. Keeves and Alagumalai (1999)
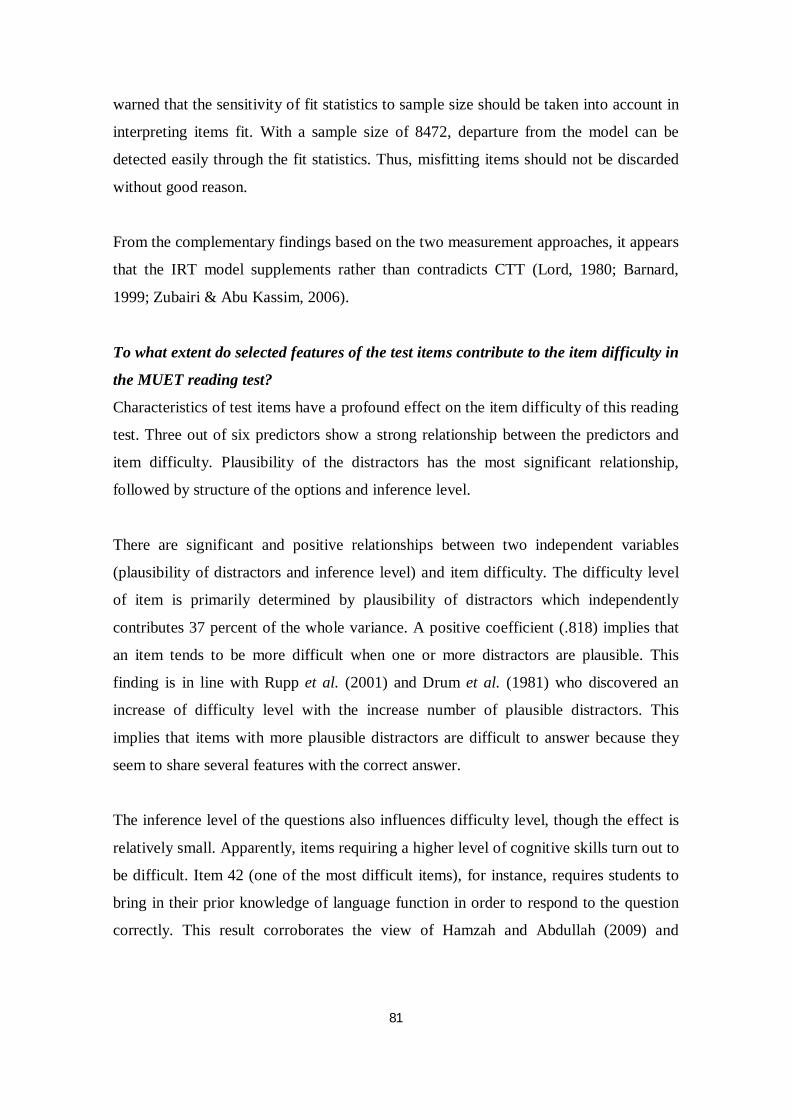
81
warned that the sensitivity of fit statistics to sample size should be taken into account in
interpreting items fit. With a sample size of 8472, departure from the model can be
detected easily through the fit statistics. Thus, misfitting items should not be discarded
without good reason.
From the complementary findings based on the two measurement approaches, it appears
that the IRT model supplements rather than contradicts CTT (Lord, 1980; Barnard,
1999; Zubairi & Abu Kassim, 2006).
To what extent do selected features of the test items contribute to the item difficulty in
the MUET reading test?
Characteristics of test items have a profound effect on the item difficulty of this reading
test. Three out of six predictors show a strong relationship between the predictors and
item difficulty. Plausibility of the distractors has the most significant relationship,
followed by structure of the options and inference level.
There are significant and positive relationships between two independent variables
(plausibility of distractors and inference level) and item difficulty. The difficulty level
of item is primarily determined by plausibility of distractors which independently
contributes 37 percent of the whole variance. A positive coefficient (.818) implies that
an item tends to be more difficult when one or more distractors are plausible. This
finding is in line with Rupp et al. (2001) and Drum et al. (1981) who discovered an
increase of difficulty level with the increase number of plausible distractors. This
implies that items with more plausible distractors are difficult to answer because they
seem to share several features with the correct answer.
The inference level of the questions also influences difficulty level, though the effect is
relatively small. Apparently, items requiring a higher level of cognitive skills turn out to
be difficult. Item 42 (one of the most difficult items), for instance, requires students to
bring in their prior knowledge of language function in order to respond to the question
correctly. This result corroborates the view of Hamzah and Abdullah (2009) and
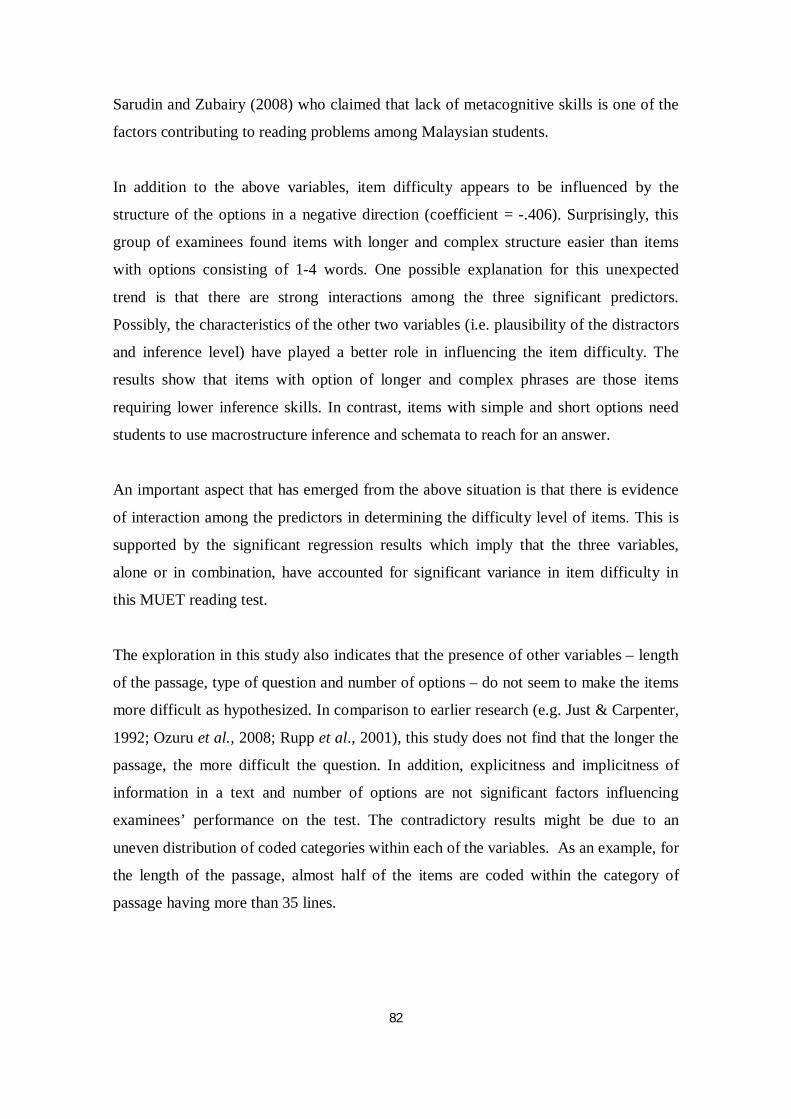
82
Sarudin and Zubairy (2008) who claimed that lack of metacognitive skills is one of the
factors contributing to reading problems among Malaysian students.
In addition to the above variables, item difficulty appears to be influenced by the
structure of the options in a negative direction (coefficient = -.406). Surprisingly, this
group of examinees found items with longer and complex structure easier than items
with options consisting of 1-4 words. One possible explanation for this unexpected
trend is that there are strong interactions among the three significant predictors.
Possibly, the characteristics of the other two variables (i.e. plausibility of the distractors
and inference level) have played a better role in influencing the item difficulty. The
results show that items with option of longer and complex phrases are those items
requiring lower inference skills. In contrast, items with simple and short options need
students to use macrostructure inference and schemata to reach for an answer.
An important aspect that has emerged from the above situation is that there is evidence
of interaction among the predictors in determining the difficulty level of items. This is
supported by the significant regression results which imply that the three variables,
alone or in combination, have accounted for significant variance in item difficulty in
this MUET reading test.
The exploration in this study also indicates that the presence of other variables – length
of the passage, type of question and number of options – do not seem to make the items
more difficult as hypothesized. In comparison to earlier research (e.g. Just & Carpenter,
1992; Ozuru et al., 2008; Rupp et al., 2001), this study does not find that the longer the
passage, the more difficult the question. In addition, explicitness and implicitness of
information in a text and number of options are not significant factors influencing
examinees’ performance on the test. The contradictory results might be due to an
uneven distribution of coded categories within each of the variables. As an example, for
the length of the passage, almost half of the items are coded within the category of
passage having more than 35 lines.
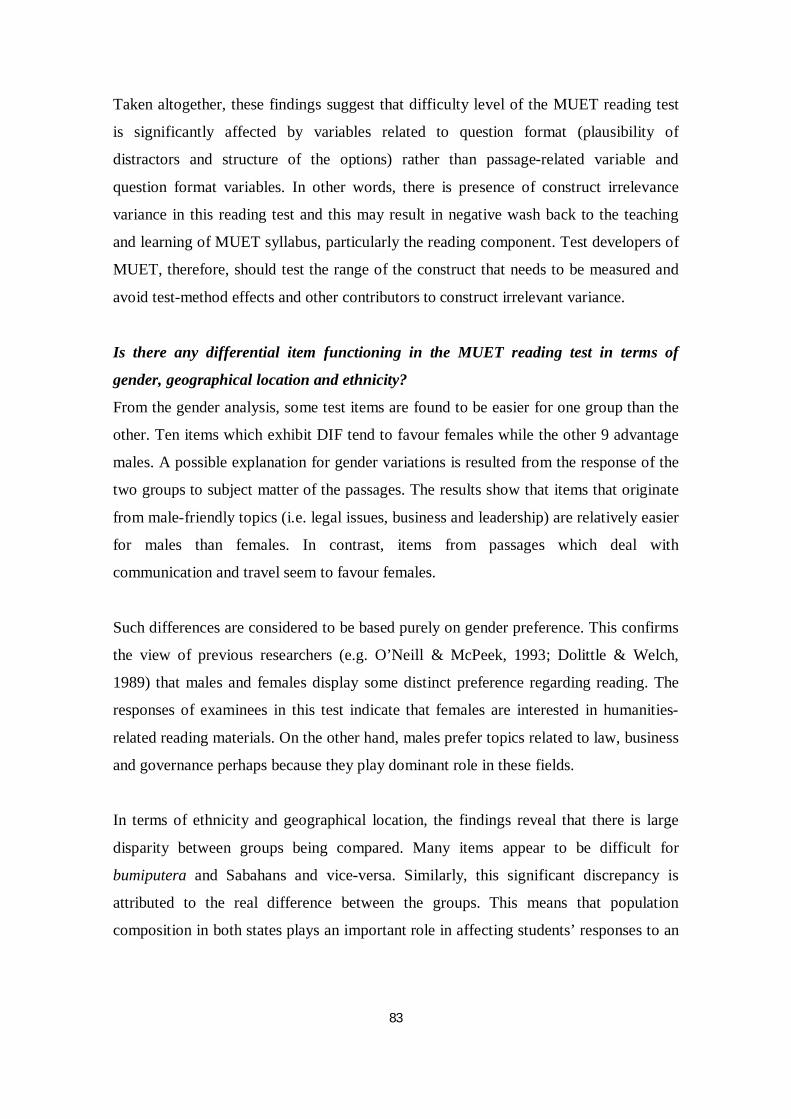
83
Taken altogether, these findings suggest that difficulty level of the MUET reading test
is significantly affected by variables related to question format (plausibility of
distractors and structure of the options) rather than passage-related variable and
question format variables. In other words, there is presence of construct irrelevance
variance in this reading test and this may result in negative wash back to the teaching
and learning of MUET syllabus, particularly the reading component. Test developers of
MUET, therefore, should test the range of the construct that needs to be measured and
avoid test-method effects and other contributors to construct irrelevant variance.
Is there any differential item functioning in the MUET reading test in terms of
gender, geographical location and ethnicity?
From the gender analysis, some test items are found to be easier for one group than the
other. Ten items which exhibit DIF tend to favour females while the other 9 advantage
males. A possible explanation for gender variations is resulted from the response of the
two groups to subject matter of the passages. The results show that items that originate
from male-friendly topics (i.e. legal issues, business and leadership) are relatively easier
for males than females. In contrast, items from passages which deal with
communication and travel seem to favour females.
Such differences are considered to be based purely on gender preference. This confirms
the view of previous researchers (e.g. O’Neill & McPeek, 1993; Dolittle & Welch,
1989) that males and females display some distinct preference regarding reading. The
responses of examinees in this test indicate that females are interested in humanities-
related reading materials. On the other hand, males prefer topics related to law, business
and governance perhaps because they play dominant role in these fields.
In terms of ethnicity and geographical location, the findings reveal that there is large
disparity between groups being compared. Many items appear to be difficult for
bumiputera and Sabahans and vice-versa. Similarly, this significant discrepancy is
attributed to the real difference between the groups. This means that population
composition in both states plays an important role in affecting students’ responses to an
84
item. Many items are easy for non-bumiputeras who mainly constitute candidates from
Kuala Lumpur; the majority of these prefer to use English in their daily life.
The results in this study replicate observations from previous projects (Elder, 1996;
Chen & Henning, 1985) which concluded that actual differences between subgroups of
examinees are seen as a potential source of DIF. Therefore, before omitting a
‘problematic’ item, it should be reviewed thoroughly by the panel of experts to
illuminate the possible causes of its significant difference.
5.3 IMPLICATIONS OF THE FINDINGS
The findings yielded in this study have implications for different groups of people. The
first group is language teachers. Utilization of item analysis can help teachers to identify
misconceptions in the materials that need further explanation. With regard to the effects
of test features on students’ performance in reading test, it provides insights for teachers
to focus more on the features that have strong influence on the difficulty of an item. In
addition, DIF analysis helps teachers to understand the difference between groups so
that they can look for solutions to decrease the gap.
The second group is test developers. It is clear that an examination of individual items is
fundamental in test evaluation as it allows test developers to identify problematic items
and remedy them. Moreover, the complementary nature of CTT and the Rasch model
demonstrates that test constructors can incorporate both approaches as measurement
strategies for test design and evaluation. Furthermore, the evidences of test features and
individuals’ characteristics effect on examinees’ performance on an item informs test
makers to balance content or item features in the test specification, so that they can
reduce the variation effect. Findings from both analyses also can be used as a test
validation to clarify what the test is measuring. The study also shows that DIF is
difficult to interpret. Therefore, removal of items flagged as DIF should be considered
seriously.
85
The last group is researchers of reading and language assessment. The findings have
added support to the notion that CTT and the Rasch model are complementary
approaches which prove to be useful tools for language test development and
evaluation. In addition, test feature effects on item difficulty provide useful information
about specific variables that can influence students’ performance on a reading test. The
findings of DIF also show that DIF is not necessarily an indication that the test
disadvantages one particular group. This reemphasizes the standpoint that DIF is not
necessarily evidence for test bias (Angoff, 1993; Camilli & Shepard, 1994; McNamara
& Roever, 2006; de Ayala, 2009). This study also presents directions for researchers to
investigate several issues identified below.
5.4 DIRECTIONS FOR FUTURE RESEARCH
The findings of the study have shed light on directions for future research. The
following are several areas that seem ripe for further exploration:
1. Since the results are based on a limited item pool (45 items) and passages (6
passages), there is a need to replicate the study on a bundle of items and
passages so that the findings can be generalized in a wider context. It would also
be interesting to explore the same issues on other components of MUET –
listening, speaking and writing. This would provide a clear picture of the factors
that might affect lack of satisfactory grade on MUET.
2. The unexpected effect of the structure of the options clearly deserves more
attention in future. Further investigation is necessary to explain the negative
effects of this variable on the difficulty level of reading items.
3. Increasing the number of variables might be useful in examining the influence of
test features on students’ success on reading assessment or other types of
language tests. Other important item characteristics that might be added to future
study are correct-answer variables, stem-related variables, vocabulary-related
variables and new passage-related variables.
4. Given the fact that pre-university students are streamed into various classes (i.e.
Science, Art and Commerce), it would be useful to investigate the effect of
students’ background discipline on reading comprehension. Presumably,
86
examinees’ responses to specific subject matter are related to their prior
knowledge – particularly to the field/course they have taken.
5. Another important area of additional research is interaction between indicators
of DIF and item characteristics as a source contributing to item difficulty. It
would be of great interest to explore if a causal link between these two facets
could be established in influencing students’ responses to an item.
5.5 CONCLUSION
This study is built primarily on the exploration of factors that affect students’
performance on reading test. Previous research on reading English as a second language
in the Malaysian context, has seldom examined the role of item-level analysis as an
explanation for why the reading test of MUET appears to be challenging for Malaysian
students. The current study addresses this gap.
One salient finding that has emerged from this study is the usefulness of CTT and the
Rasch model as a tool for measurement and evaluation of language test. It is shown that
both psychometric theories complement each other. The study also concludes that
characteristics of the test items are significant factors in item difficulty. It is found that
plausibility of distractors, structure of the options and inference level have strong
influence on determining the difficulty level of this reading test. The DIF procedure,
furthermore, provides insights about the influence of examinees’ background on their
success to respond to individual items. Real differences between gender, ethnicity and
state are seen as the source of DIF in this test.
Conclusions derived from this study should be interpreted in the light of a few
constraints. As a small and focused analysis, the results of this research may provide
useful insights for researchers, test developers and educators about important issues that
need to be dealt with in reading assessment.
87
REFERENCES:
Abdul Majid, F., M.Jelas, Z., & Azman, N. (2002). Selected Malaysian adult learners' academic reading strategies: a case study (Publication. Retrieved 15 April 2010: http:www.face.stir.ac.uk/documents/Paper61
Adams, R. J. (2005). Reliability as a measurement design effect. Studies in Educational
Evaluation, 31(2-3), 167 - 172. Adams, R. J., & Khoo, S. T. (1993). QUEST: The interactive test analysis system.
Melbourne: ACER. Adamson, H. D. (1993). Academic competence: theory and classroom practice --
preparing ESL for content courses. White Plains, NY: Longmans. Alagumalai, S., & Curtis, D. (2005). Classical test theory. In S. Alagumalai, D. D.
Curtis & N. Hungi (Eds.), Applied Rasch measurement: a book of exemplars: papers in honour of John P.Keeves (pp. 1-14). Dordrecht ; Norwell, MA Springer.
Alderson, J. C. (2000). Assessing reading. Cambridge: Cambridge University Press. Alderson, J. C., & Urquhart, A. H. (1983). The effect of student background discipline
on comprehension: a pilot study. In A. Hughes & D. Porter (Eds.), Current development in language testing (pp. 121-128). London: Academic Press.
Allison, D. (1999). Language testing and evaluation: an introductory course.
Singapore: Singapore University Press. American Psychological Association, American Educational Research Association, &
National Council on Measurement in Education. (1999). Standards for educational and psychological testing. Washington, D.C.: American Educational Research Association.
Angoff, W. H. (1993). Perspective on differential item functioning methodology. In P.
W. Holland & H. Wainer (Eds.), Differential item functioning (pp. 3 - 33). New Jersey: Lawrence Erlbaum Associates, Publishers.
Athanasou, J. A., & Lamprianou, I. (2004). Reading in one's ethnic language: a study of
Greek-Australian high school students. Australian Journal of Educational & Developmental Psychology, 4, 86 - 96.
Bachman, L. F. (1990). Fundamental considerations in language testing. Oxford:
Oxford University Press. Bachman, L. F., & Palmer, A. S. (1996). Language testing in practice. Oxford: Oxford
University Press.
88
Baker, D. (1989). Language testing: a critical survey and practical guide. London: Edward Arnold.
Baker, E. L. (1989). Mandated tests: educational reform or quality indicator. In B. R.
Gifford (Ed.), Test policy and test performance: education, language and culture. Boston: Kluwer Academic Publishers.
Barnard, J. J. (1999). Item analysis in test construction. In G. N. Masters & J. P. Keeves
(Eds.), Advances in measurement in educational research and assessment. Amsterdam; New York: Pergamon.
Bond, T. G., & Fox, C. M. (2007). Applying the Rasch model: fundamental
measurement in the human sciences (2nd ed.). New Jersey: Lawrence Erlbaum Associates, Publishers.
Brown, H. D. (2004). Language assessment: principles and classroom practices. New
York: Longman. Camilli, G., & Shepard, L. A. (1994). Methods for identifying biased test items (Vol. 4).
Thousand Oaks, California: SAGE Publications. Carlton, S. T., & Harris, A. M. (1989). Characteristics associated with differential item
performance on the SAT: gender and majority/minority group comparisons. Unpublished manuscript.
Carr, N. T. (2006). The factor structure of test task characteristics and examinee
performance. Language Testing, 23(3), 269-289. Carrell, P. L. (1988). Introduction: interactive approach to second language reading. In
P. L. Carrell, J. Devine & D. Eskey (Eds.), Interactive approach to second language reading. Cambridge: Cambridge University Press.
Chen, Z., & Henning, G. (1985). Linguistic and cultural bias in language proficiency
tests. Language Testing, 2(2), 155-163. Code of Fair Testing Practices in Education. (2004). Washington, DC: Joint Committee
on Testing Practices.
Collier, V. P. (1989). How long? A synthesis of research on academic achievement in a second language. TESOL Quarterly, 23(3), 509 - 531.
Crocker, L., & Algina, J. (1986). Introduction to classical and modern test theory. New
York: Holt, Rinehart and Winston. Davey, B. (1988). Factors affecting the difficulty of reading comprehension items for
successful and unsuccessful readers. Journal of Experimental Education, 56(2), 67 - 76.
89
Davey, B., & LaSasso, C. (1984). The interaction of reader and task factors in the assessment of reading comprehension. Journal of Experimental Education, 52(4), 199 - 206.
Davey, B., LaSasso, C., & Macready, G. (1983). A comparison of reading
comprehension task performance for dear and hearing readers. Journal of Speech and Hearing Research, 26, 622 - 628.
Davey, B., & Macready, G. (1985). Prerequisite relations among inference tasks for
skilled and less-skilled reader. journal of Educational Psychology, 77, 539 - 552. de Ayala, R. J. d. (2009). The theory and practice of item response theory. New York:
The Guilford Press. Devine, T. G. (1989). Teaching reading in the elementary school: from theory to
practice. Massachusetts, US: Allyn and Bacon, Inc. Dolittle, A., & Welch, C. (1989). Gender differences in performance on a college level
achievement test. Iowa City, IA: American College Testing Programme. Dorans, N. J., & Holland, P. W. (1993). DIF detection and description: mantel-haenszel
and standardization. In P. W. Holland & H. Wainer (Eds.), Differential item functioning (pp. 35 - 66). New Jersey: Lawrence Erlbaum Associates, Publishers.
Drum, P. A., Calfee, R. C., & Cook, L. K. (1981). The effects of surface structure
variables on performance in reading comprehension test. Reading Research Quarterly, 16(14), 486-514.
Ebel, R. L. (1982). Proposed solutions to two problems of test construction. Journal of
Educational Measurement, 19, 276 - 278. Ebel, R. L., & Frisbie, D. A. (1991). Essentials of educational measurement (5th ed.).
Engelwood Cliffs, N.J: Prentice Hall. Elder, C. (1996). The effect of language background on foreign language test
performance: the case of Chinese, Italian, and modern Greek. Language Learning, 46, 233-282.
Embretson, S., & Wetzel, C. D. (1987). Component latent trait models for paragraph
comprehension. Applied Psychological Measurement, 11, 175 - 193. Fletcher, M. J. (2006). Measuring reading comprehension. Scientific study of Reading,
10, 323 - 330. Freedle, R., & Kostin, I. (1993). The prediction of TOEFL reading item difficulty:
implications for construct validity. Language Testing, 10(2), 133 - 167.
90
Freedle, R., & Kostin, I. (1994). Can multiple-choice reading tests be construct-valid? A reply to Katz, Lautenschlager, Blackburn and Harris. Psychological Science, 5, 107 - 110.
Hambleton, R. K. (1989). Principles and selected applications of item response theory.
In R. L. Linn (Ed.), Education measurement (3rd ed., pp. 147-200). New York: MacMillan Publishers.
Hambleton, R. K., & Jones, R. W. (1993). Comparison of classical test theory and item
response theory and their applications to test development. Educational Measurement: Issues and Practices, 12(3), 38 - 47.
Hambleton, R. K., Swaminathan, H., & Rogers, H. J. (1991). Fundamentals of item
response theory. Newbury Park, California: SAGE Publications. Hamzah, M. S. G., & Abdullah, S. K. (2009). Analysis on metacognitive strategies in
reading and writing among Malaysian ESL learners in four education institutions. European Journal of Sciences, 11(4), 676 - 683.
Henning, G. (1984). Advantages of latent trait measurement in language testing.
Language Testing, 1(2), 123-133. Henning, G. (1987). A guide to language testing: development, evaluation, research.
Cambridge Mass: Newberry House Publisher. Henning, G., Hudson, T., & Turner, J. (1985). Item response theory and the assumption
of unidimensionality for language tests. Language Testing, 2(2), 141-154. Ibrahim, A. H. (2005). The effect of purposeful questioning technique in reading
performance. Paper presented at the 2nd National Seminar on Second/Foreign Language Learners and Learning.
Ibrahim, A. H. (2006). The process and problems of reading. Masalah Pendidikan, 115
- 129. Jalaluddin, N. H., Awal, N. M., & Bakar, K. A. (2009). Linguistics and environment in
English language learning: towards the development of quality human capital. European Journal of Sciences, 9(4), 627 - 642.
Just, M. A., & Carpenter, P. A. (1992). A capacity theory of comprehension: individual
differences in working memory. Psychological Review, 99, 122 - 149. Kartz, S., & Lautenschlager, G. J. (1994). Answering reading comprehension questions
without passages on the SAT-I, ACT and GRE. Educational Assessment, 2, 295 - 308.
91
Kartz, S., & Lautenschlager, G. J. (2001). The contribution of passage and no-passage factors to item performance on the SAT reading task. Educational Assessment, 7(2), 165 - 176.
Kaur, S., & Thiyagarajah, R. (1999). The English reading habits of ELLs students in
University Science Malaysia. Paper presented at the 6th International Literacy and Education Research Network Conference on Learning.
Keeves, J. P., & Alagumalai, S. (1999). New approaches to measurement. In G. N.
Masters & J. P. Keeves (Eds.), Advances in measurement in educational research and assessment (pp. 23-42). Amsterdam, New York: Pergamon.
Kirsch, I., Jong, J. d., LaFontaine, D., McQueen, J., Mendelovits, J., & Monseur, C.
(2002). Reading for change: performance and engagement across countries: result from PISA 2000. Paris: OECD.
Klapper, J. (1992). Reading in a foreign language; theoretical issues. Language
Learning, 1(5), 53 - 56. Kunnan, A. J. (1990). DIF in native language and gender groups in an ESL placement
test. TESOL Quarterly, 24, 741-746. Kunnan, A. J. (2000). Fairness and justice for all. In A. J. Kunnan (Ed.), Fairness and
validation in language assessment (pp. 1 - 14). Cambridge: Cambridge University Press.
Lord, F. M. (1980). Application of item response theory to practical testing problems.
New Jersey: Lawrence Erlbaum Associates Publishers. McKay, P. (2006). Assessing young language learners. Cambridge: Cambridge
University Press. McKenna, M. C., & Stahl, K. A. D. (2009). Assessment for reading instruction (2nd
ed.). New York: The Guilford Press. McNamara, T., & Roever, C. (2006). Language testing: the social dimension. Malden,
MA: Blackwell Publishing. McNamara, T. F. (1996). Measuring second language performance. London; New
York: Longman. McNamara, T. F. (2000). Language testing. New York: Oxford University Press. Mertler, C. A. (2007). Interpreting standardized test scores: strategies for data-driven
instructional decision making. Los Angeles: SAGE Publications.
92
Messick, S. (1995). Validity of psychological assessment: Validation of inferences from persons’ responses and performances as scientific inquiry into score meaning. American Psychologist, 50 (9), 741-749.
Messick, S. (1996). Validity and washback in language testing. Language Testing 13
(3), 241-256. Mosenthal, P. (1996). Understanding the strategies of document literacy and their
conditions of use. Journal of Educational Psychology, 88, 314 - 332. Nunnally, J. C., & Bernstein, I. H. (1994). Psychometric theory (3rd ed.). New York:
McGraw-Hill, Inc. O'Neill, K. A., & McPeek, W. M. (1993). Item and test characteristics that are
associated with differential item functioning. In P. W. Holland & H. Wainer (Eds.), Differential item functioning (pp. 255-276). Hillsdale, NJ: Lawrence Erlbaum Associates.
Osterlind, S. J., & Everson, H. T. (2009). Differential Item Functioning (2nd ed.).
Thousand Oaks, CA: SAGE Publications. Ozuru, Y., Best, R., Bell, C., Witherspoon, A., & McNamara, D. S. (2007). Influence of
question format and text availability on the assessment of expository text comprehension. Cognition and Instruction, 25(4), 399 - 438.
Ozuru, Y., Rowe, M., O'Reilly, T., & McNamara, D. S. (2008). Where's the difficulty in
standardized reading tests: the passage or the question? Behaviour Research Methods, 40(4), 1001 - 1015.
Pae, T.-I. (2004). DIF for examinees with different academic background. Language
Testing, 21(1), 53 - 73. Pearson, P. D., & Johnson, D. D. (1978). Teaching reading comprehension. New York,
NJ: Holt, Rinehart and Winston. Perfetti, C. (1985). reading ability. New York: Oxford University Press. Perkins, K., & Miller, L. D. (1984). Comparative analyses of English as a second
language reading comprehension data: classical test theory and latent trait measurement. Language Testing, 1(1), 20-31.
Popham, W. J. (2000). Modern educational measurement: practical guidelines for
educational leaders (3rd ed.). Boston: Allyn and Bacon. Pumfrey, P. D. (1976). Reading: tests and assessment techniques. London: Hodder and
Stoughton.
93
Ramaiah, M., & Nambiar, M. K. (1993). Do undergraduates understand what they read: an investigation into the comprehension monitoring of ESL students through the use of textual anomalies. Journal of Educational Research, 15, 95 - 106.
Rasch, G. (1960). Probabilistic models for some intelligence and attainment test.
Copenhagen: Danmarks Paedogogiske Institut. Reynolds, C. R., Livingston, R. B., & Wilson, V. (2009). Measurement and assessment
in education. Upper Saddle River, N.J: Pearson Merrill. Rupp, A. A., Garcia, P., & Jamieson, J. (2001). Combining multiple regression and
CART to understand difficulty in second language reading and listening comprehension test. International Journal of Testing, 1(3 & 4), 185 - 216.
Sarudin, I., & Zubairy, A. M. (2008). Assessment of language proficiency of university
students. Paper presented at the 34th International Association for Educational Assessment (IAEA).
Scheuneman, J. D. (1982). A posteriori analyses of biased items. In R. A. Berk (Ed.),
Handbook of methods for detecting test bias (pp. 180 - 197). Baltimore and London: The Johns Hopkins University Press.
Scheuneman, J. D., & Gerritz, K. (1990). Using differential item functioning procedures
to explore sources of item difficulty and group performance characteristics. Journal of Educational Measurement, 27(2), 109-131.
Schwartz, S. (1984). Measuring reading competence: a theoretical-prescriptive
approach. New York: Plenum Press. Sheehan, K. M., & Ginther, A. (2001). what do passage-based multiple-choice verbal
reasoning items really measure? an analysis of the cognitive skills underlying performance on the current TOEFL reading section. Paper presented at the the 2001 Annual Meeting of the National Council of Measurement in Education.
Shepard, L. A., Camilli, G., & Averill, M. (1981). Comparison of procedures for
detecting test-item bias with both internal and external ability criteria. Journal of Educational Statistics, 6, 317 - 375.
Snow, C. E. (2003). Assessment of reading comprehension. In A. P. Sweet & C. E.
Snow (Eds.), Rethinking reading comprehension (pp. 192 - 218). New York: Guilford.
Stephanou, A., Anderson, P., & Urbach, D. (2008). PAT-R Progressive Achievement
Tests in Reading: comprehension, vocabulary and spelling (4th ed.). Camberwell, Victoria: Australian Council for Educational Research.
Twist, L., & Sainsbury, M. (2009). Girl friendly? Investigating the gender gap in
national reading tests at age 11. Educational Research, 51(2), 283-297.
94
Weaver, C. A., & Kintsch, W. (1991). Expository text. In R. Barr, M. L. Kamil, P. Mosenthal & P. D. Pearson (Eds.), Handbook of reading research (Vol. 2). New York: Longman.
Woods, A., & Baker, R. (1985). Item response theory. Language Testing, 2(2), 117-140. Wright, B. D. (1999). Rasch measurement models. In G. N. Masters & J. P. Keeves
(Eds.), Advances in measurement in educational research and assessment. Amsterdan; New York: Pergamon.
Wu, M. (2010). Using item response theory as a tool in educational measurement.
Unpublished book chapter. University of Melbourne. Wu, M. L., & Adams, R. J. (2008). Properties of Rasch residual fit statistics.
Unpublished paper. Wu, M. L., Adams, R. J., Wilson, M. R., & Haldane, S. A. (2007). ACER ConQuest
Version 2.0. Camberwell, Victoria: ACER Press. Zubairi, A. M., & Kassim, N. L. A. (2006). Classical and Rasch analyses of
dichotomously scored reading comprehension test items. Malaysian Journal of ELT Research, 2, 1-20.
Zumbo, B. D. (1999). A handbook on the theory and methods of differential item
functioning: logistic regression modelling as unitary framework for binary and likert-type (ordinal) item scores. Ottawa, Canada: Directorate of Human Resources Research and Evaluation, Department of National Defence.
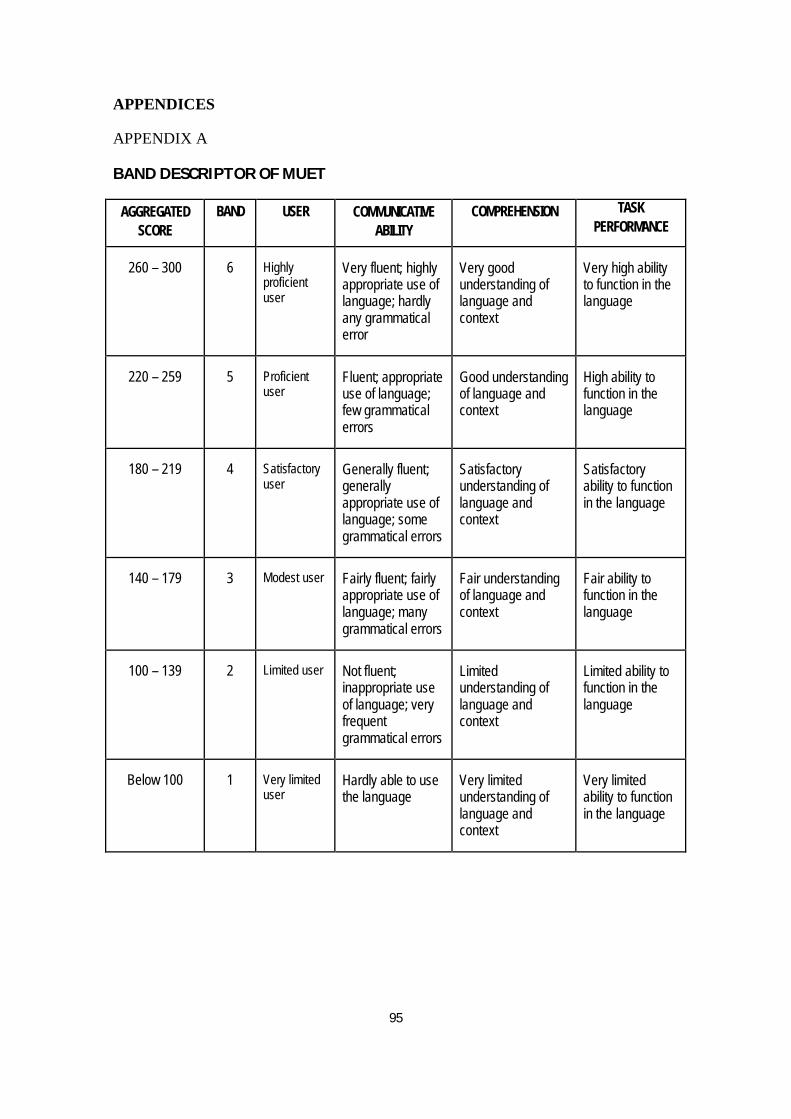
95
APPENDICES
APPENDIX A
BAND DESCRIPTOR OF MUET
AGGREGATED
SCORE
BAND USER COMMUNICATIVE
ABILITY
COMPREHENSION TASK
PERFORMANCE
260 – 300 6 Highly proficient user
Very fluent; highly appropriate use of language; hardly any grammatical error
Very good understanding of language and context
Very high ability to function in the language
220 – 259 5 Proficient user
Fluent; appropriate use of language; few grammatical errors
Good understanding of language and context
High ability to function in the language
180 – 219 4 Satisfactory user
Generally fluent; generally appropriate use of language; some grammatical errors
Satisfactory understanding of language and context
Satisfactory ability to function in the language
140 – 179 3 Modest user Fairly fluent; fairly appropriate use of language; many grammatical errors
Fair understanding of language and context
Fair ability to function in the language
100 – 139 2 Limited user Not fluent; inappropriate use of language; very frequent grammatical errors
Limited understanding of language and context
Limited ability to function in the language
Below 100 1 Very limited user
Hardly able to use the language
Very limited understanding of language and context
Very limited ability to function in the language
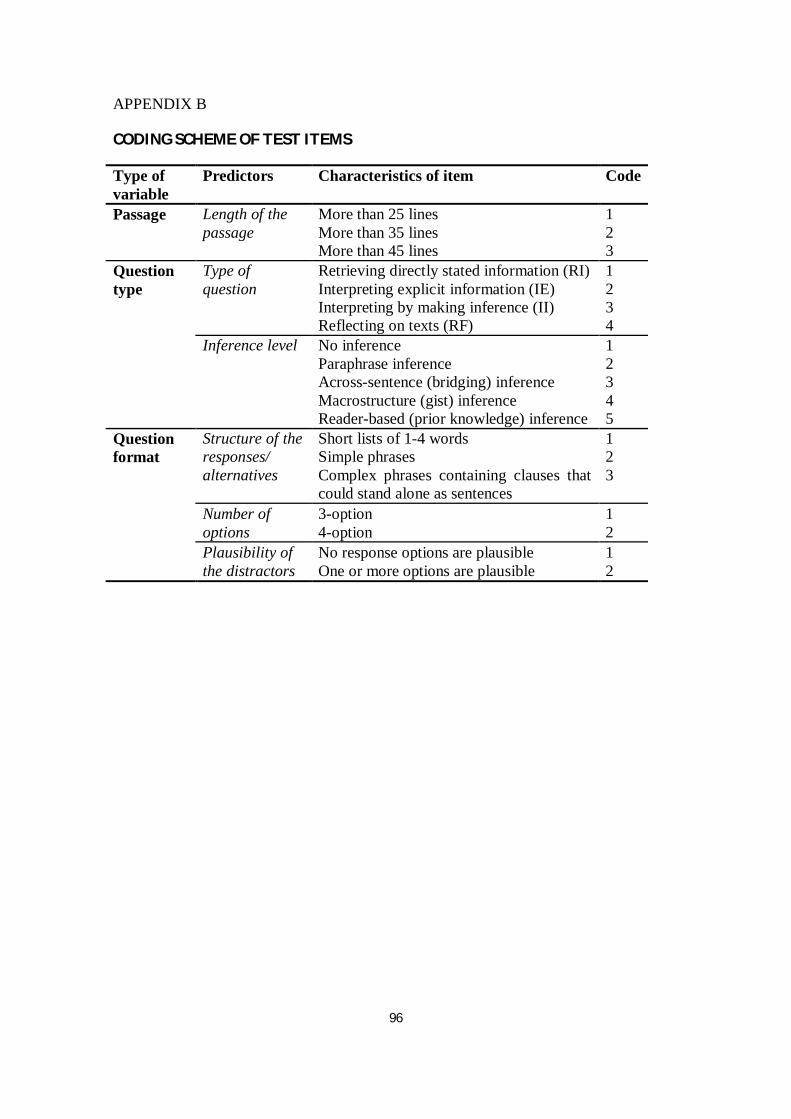
96
APPENDIX B
CODING SCHEME OF TEST ITEMS
Type of variable
Predictors Characteristics of item Code
Passage Length of the passage
More than 25 lines More than 35 lines More than 45 lines
1 2 3
Question type
Type of question
Retrieving directly stated information (RI) Interpreting explicit information (IE) Interpreting by making inference (II) Reflecting on texts (RF)
1 2 3 4
Inference level No inference Paraphrase inference Across-sentence (bridging) inference Macrostructure (gist) inference Reader-based (prior knowledge) inference
1 2 3 4 5
Question format
Structure of the responses/ alternatives
Short lists of 1-4 words Simple phrases Complex phrases containing clauses that could stand alone as sentences
1 2 3
Number of options
3-option 4-option
1 2
Plausibility of the distractors
No response options are plausible One or more options are plausible
1 2
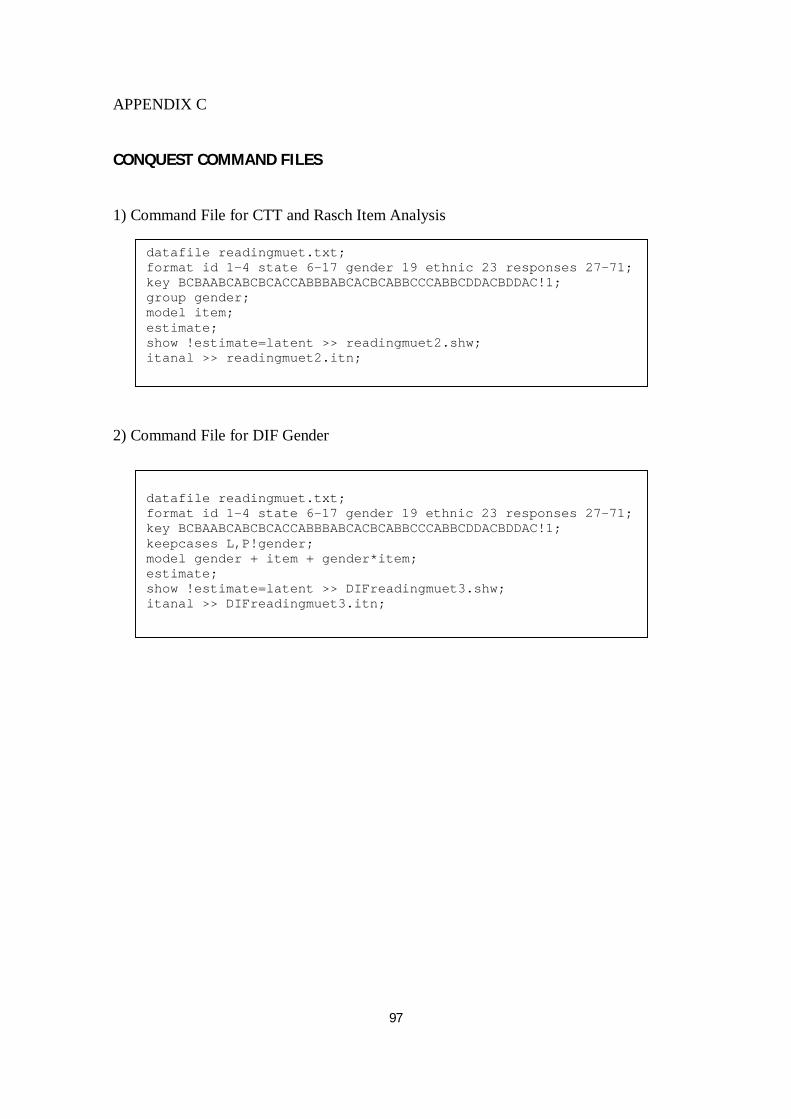
97
APPENDIX C
CONQUEST COMMAND FILES
1) Command File for CTT and Rasch Item Analysis
2) Command File for DIF Gender
datafile readingmuet.txt; format id 1-4 state 6-17 gender 19 ethnic 23 responses 27-71; key BCBAABCABCBCACCABBBABCACBCABBCCCABBCDDACBDDAC!1; keepcases L,P!gender; model gender + item + gender*item; estimate; show !estimate=latent >> DIFreadingmuet3.shw; itanal >> DIFreadingmuet3.itn;
datafile readingmuet.txt; format id 1-4 state 6-17 gender 19 ethnic 23 responses 27-71; key BCBAABCABCBCACCABBBABCACBCABBCCCABBCDDACBDDAC!1; group gender; model item; estimate; show !estimate=latent >> readingmuet2.shw; itanal >> readingmuet2.itn;


