Embed Size (px)
Citation preview

orbit VOL. 32 | NO. 4 | OCT 2012
A Technical Publication for
Advancing the Practice of
Operating Asset Condition
Monitoring, Diagnostics, and
Performance Optimization
ORBIT
VOLU
ME 32 • N
UM
BER 4 • OC
T 2012
TEXA
S A&
M TU
RBOM
ACH
INERY SYM
POSIU
M
Texas A&M Turbomachinery SymposiumMORE THAN 40 YEARS OF BENTLY NEVADA PARTICIPATION

Copyright © 2012 Texas A&M University. All rights reserved. Used with permission.
41st Turbomachinery SYMPOSIUM
28th Pump usERs sYMPosiuM
George R. Brown Convention Center; Houston) 1x 9124-2712012
Exhibits Open Free to the Public
Tuesday & Wednesday 2:30 p.m. - 7:00 p.m.
Thursday 9:30a.m. - 12:00 p.m.
For more information Call979.845.7417 or email at [email protected]
Sponsored by: The Turbomachinery Laboratory Texas A&M University • College Station
http://turbolab.tamu.edu

IN THIS ISSUE
In this Issue
orbitVolume 32 | Number 4 | Oct 2012
A Technical Publication for Advancing the Practice of Operating Asset Condition Monitoring, Diagnostics, and Performance Optimization
Publisher: GE Oil & Gas Editor: Gary B. SwiftDesign Coordination: Eileen O’ConnellDesign: Gina AlteriEuropean Circulation: Estelle SéjournéNorth American Circulation: Karen SchanhalsPrinter: RR Donnelley
CONTRIBUTORSGE Oil & Gas Eric ButterfieldRoengchai ChumaiPhil HanifanDavid O’ConnorPankaj SharmaJoe TaylorMichael ThevanhMark Werkheiser
Deepak Fertilisers, Taloja Mr. U.N. Mishra
Electricity Generating Authority of Thailand, BangpakongUthan Thubtong
CREDITSBently Nevada CommunicationsNik Noel
Questions, suggestions, and letters to the editor may be addressed to: ORBIT Magazine 1631 Bently Parkway South Minden, Nevada USA 89423 Phone: 775.782.3611 Fax: 775.215.2855 e-mail: [email protected]
Printed quarterly in the USA.
* Denotes a trademark of Bently Nevada, Inc., a wholly owned subsidiary of General Electric Company.
Copyright © 2012 General Electric Company. All rights reserved.
1624
FEATURES
Designing and Machining a Keyphasor* Trigger
System 1* Software Identifies Rotor Instability
NEWS
07 Global Training Update
08 New Engineer Training
10 Product Update: The 3500/45E Position Monitor
DEPARTMENTS
Case Histories 38 Diagnosing Generator Rotor Thermal Sensitivity
From the Desk of…50 Looking Forward to 45 More Years!
System 1 Tips & Tricks54 Collecting Slow Roll Reference Data
EDITOR’S NOTE
Roger retired several years earlier, but he has
remained in close contact with the Bently Nevada*
Asset Condition Monitoring team. Since this issue is
focused on Turbomachinery, I asked him about his
involvement with the world-renowned symposium
hosted by Texas A&M University. It turns out that he
participated in 30 consecutive events, starting with the
very first one back in 1972. Our conversation quickly
moved from “business” to “fun” and Roger shared one
of his favorite memories of the event from back in the
early days when it was still small enough to be held
in College Park (home of the Texas A&M campus).
It turns out that well-known vibration condition monitoring
expert, Charlie Jackson, and our own machinery
alignment expert, Al Campbell, shared a proud Scottish
ancestry. After the day’s technical sessions were over,
one of their favorite activities was to dress in their
traditional kilts, and march through the hotel hospitality
suites and around the swimming pool – playing bagpipes
and leading an impromptu parade of participants!
Newcomers were always taken by surprise, while
returning participants who knew what to expect were
delighted to join the unofficial festivities once again.
Since this issue focuses on condition monitoring
of turbomachininery, we have included
articles on several related topics.
Editor’s Notepad
Gary Swift
Editor
Orbit Magazine
Greetings, and welcome to
Orbit! While researching
the topics for this
Turbomachinery-themed
issue, I had the enjoyable
experience of talking with
legacy Bently Nevada
employees #3 (Roger Harker)
and #4 (Phil Hanifan). Phil
retired during the production
of this issue, but before
he left, he wrote an article
for us – looking back on
some interesting parts of
his 45 years of service.

Cheers!
Gary
IN THIS ISSUE
Designing and Machining a Keyphasor* Trigger (page 16)
Our lead article includes some useful tips for successfully field-machining
a Keyphasor triggering feature. By using a simple jig to securely support a
drill motor, it is possible to machine a shallow circular indentation – or even
an elongated slot - in a suitable part of the shaft surface without undue
risk. Keyphasor transducers are very important for effective monitoring and
diagnostics – and in situations where the OEM has not provided a triggering
feature, field-machining of such a feature may be the only option.
System 1* Software Identifies Rotor Instability (page 24)This article describes a classic instance of fluid-induced instability of a steam
turbine driving an air compressor in a fertilizer plant in India. Our diagnostic
engineer was able to determine the problem using System 1 data, and plant
staff collaborated with the OEM to modify the steam turbine bearings to
improve rotor stability. The redesign included machining the bearings from
their original cylindrical “sleeve” design to a classic “lemon-bore” design.
Diagnosing Generator Rotor Thermal Sensitivity (page 38)This case history describes a thermally sensitive generator rotor at a power
plant in Thailand. Our diagnostic engineer advised the plant staff as they
performed load testing and used other analysis techniques to rule out possible
contributing factors. Visual inspection confirmed suspicions of shorted
rotor turns, and a partial rewind repair was completed. When combined
with a “compromise balance,” these measures allowed the generator to
be returned to service until a full overhaul could be accomplished.
2012 has flown by, and it is difficult to believe that this is already the final
Orbit issue of the year! We will start the new year with a “back-to-basics”
issue on Transducers, and I invite you to join us again in January.
* Denotes a trademark of Bently Nevada, Inc., a wholly owned subsidiary of General Electric Company.
Copyright © 2012 General Electric Company. All rights reserved.

6 ORBIT Vol .32 • No.4 • Oct .2012
NEWS

Course Registration
For registration information and details of the
available courses in all of our global regions,
please visit us at our web portal:
http://ge-energy.turnstilesystems.com/
For more information on courses in
your region, contact us directly:
North America• Mark Werkheiser | North American Regional Training
Manager – Bently Nevada | [email protected]
• Mark Sando | North American Regional Training
Coordinator | [email protected]
Training Courses• 3500 Operation & Maintenance
• Advanced Machinery Dynamics
• ADRE Sxp / 408 DSPi
• Decision Support
• Fundamentals of Vibration
• Machinery Diagnostics
• Machinery Fundamentals / Applied Diagnostics
• Reciprocating Compressor Monitoring & Diagnostics
• System 1 Fundamentals
• Wind Turbine Condition Monitoring
For the convenience of our customers, our public
training courses are hosted at more than 30
different training centers in widespread locations
around the world. If needed, we can also provide
on-site training at your specific location.
Training Centers
• Argentina: Buenos Aires
• Australia: Perth
• Australia: Sydney
• Bahrain
• Brazil: Rio de Janeiro
• Brazil: Sao Paulo
• Canada: Edmonton
• Canada: Fort McMurray
• China: Shanghai
• Colombia: Bogota
• France: Nantes
• Germany: Neu-Isenburg
• India: Mumbai
• India: New Delhi
• Indonesia: Bali
• Italy: Florence
• Malaysia: Kuala Lumpur
• Mexico: Mexico City
• Netherlands: Rotterdam
• New Zealand: Auckland
• Norway: Bergen
• Qatar: Doha
• Russia: Moscow
• Saudi Arabia: Khobar
• Singapore
• South Africa: Midrand
• South Korea: Seoul
• Thailand: Pattaya
• Turkey: Istanbul
• United Arab Emirates:
Abu Dhabi
• United Kingdom:
Warrington
• USA: Houston, Texas
• USA: Minden, Nevada
• Venezuela: Maracaibo
• Venezuela:
Puerto La Cruz
* Denotes a trademark of Bently Nevada, Inc., a wholly owned subsidiary of General Electric Company.
Copyright © 2012 General Electric Company. All rights reserved.
Every year we conduct more than a hundred training sessions on the transducers,
monitor systems and software of our Bently Nevada* Asset Condition Monitoring
product line, and on the associated diagnostic disciplines that our products support.
globaltrainingupdate
Oct .2012 • No.4 • Vol .32 ORBIT 7
NEWS

The Bently Nevada Technology team is a growing,
vital and innovative organization that needs fresh
new talent – with new ideas – in order to effectively
meet customer expectations. To enhance our team,
we hire new Engineers – many of whom have recently
completed their university masters or bachelors
programs, with degrees in Computer Science or
Electrical, Mechanical or Human Factors Engineering.
To facilitate the transition of our new Engineers into the
GE organization, we periodically conduct new engineer
training classes. These sessions feature presentations
from our most senior Engineering mentors, and
include topics on our culture, history, Bently Nevada
core technology and our product design processes.
newengineertraining
NEWS

Our latest group of new Engineers
received training at the Minden,
Nevada USA headquarters for the
Bently Nevada* Asset Condition
Monitoring product line.
FROM LEFT TO RIGHT: Nathan Mayes, David O’Connor (Course Facilitator), Nick Aboumrad, Daryl Van kampen, Joseph Montgomery, Cameron Graybeal, Victor Nunez, Patrick O’Bryan, Jackie Tappan, Daniel Dilts, Phil Hanifan (Mentor), Cindy Hughes (front), Trevor Seyfried (back), Felicia Groso, Gina Morrow and Nick Niemann.
"IT’S EXCITING TO ADD
SUCH GREAT TALENT TO
THE GE BENTLY NEVADA
ENGINEERING TEAM. BENTLY
HAS A PROUD HERITAGE OF
TECHNICAL EXCELLENCE AND
INNOVATION, AND I KNOW
THESE HAND-SELECTED
INDIVIDUALS WILL BE ABLE
TO CONTINUE THIS LEGACY."
— ERIC BUTTERFIELD BENTLY NEVADA ENGINEERING MANAGER
"IT’S ALWAYS A PLEASURE
WORKING WITH OUR NEW
ENGINEERS, AND HELPING
THEM GET OFF TO A GREAT
START IN OUR TECHNOLOGY
ORGANIZATION."
— DAVID O’CONNOR NEW APPLICATIONS ENGINEER
Shortly after this class photo was taken, Chief Engineer
Phil Hanifan (Bently Nevada employee #0004) retired
after 45 years of service. Over this past year, Phil has
focused on passing along his wealth of knowledge and
providing valuable coaching to our Technology employees
before heading to his well-deserved retirement.
At this point it is too early to know for sure, but it is
not unreasonable to anticipate that one or more of
the new Engineers in this photo may remain with the
organization and serve as mentors 45 years in the
future – to Engineers from the class of 2057!
* Denotes a trademark of Bently Nevada, Inc., a wholly owned subsidiary of General Electric Company.
Copyright © 2012 General Electric Company. All rights reserved.
Oct .2012 • No.4 • Vol .32 ORBIT
NEWS

Joe Taylor
Bently Nevada Product Manager
the3500/45epositionmonitor
10 ORBIT Vol .32 • No.4 • Oct .2012
NEWS
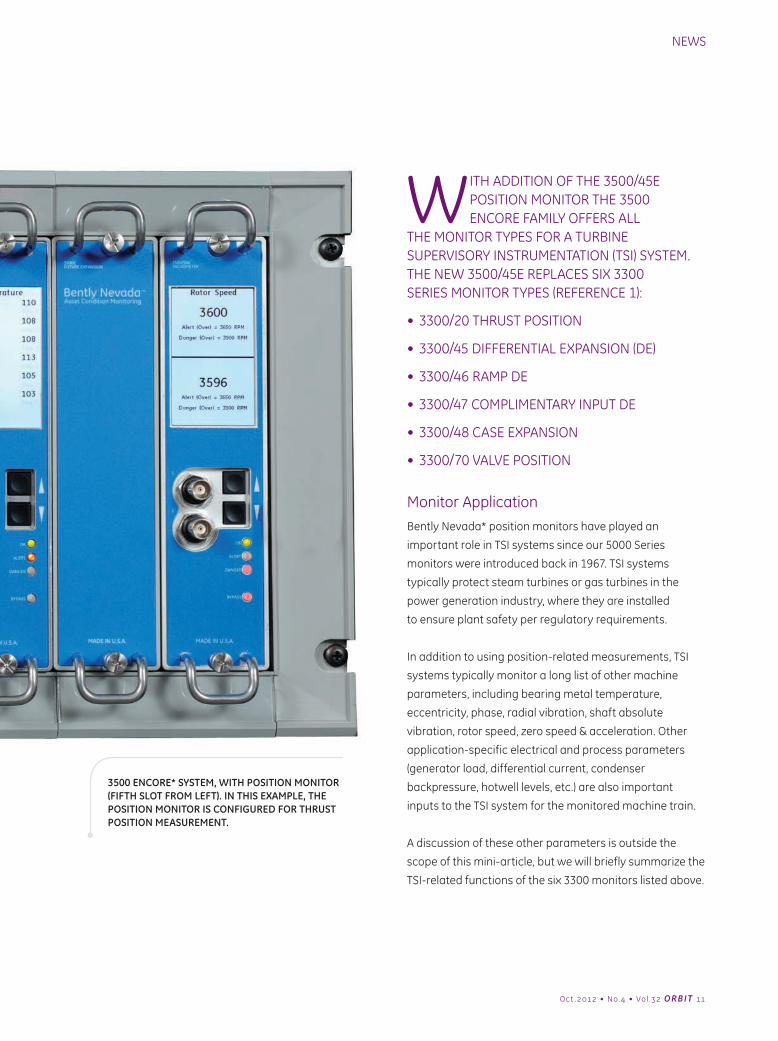
3500 ENCORE* SYSTEM, WITH POSITION MONITOR (FIFTH SLOT FROM LEFT). IN THIS EXAMPLE, THE POSITION MONITOR IS CONFIGURED FOR THRUST POSITION MEASUREMENT.
Monitor Application
Bently Nevada* position monitors have played an
important role in TSI systems since our 5000 Series
monitors were introduced back in 1967. TSI systems
typically protect steam turbines or gas turbines in the
power generation industry, where they are installed
to ensure plant safety per regulatory requirements.
In addition to using position-related measurements, TSI
systems typically monitor a long list of other machine
parameters, including bearing metal temperature,
eccentricity, phase, radial vibration, shaft absolute
vibration, rotor speed, zero speed & acceleration. Other
application-specific electrical and process parameters
(generator load, differential current, condenser
backpressure, hotwell levels, etc.) are also important
inputs to the TSI system for the monitored machine train.
A discussion of these other parameters is outside the
scope of this mini-article, but we will briefly summarize the
TSI-related functions of the six 3300 monitors listed above.
WITH ADDITION OF THE 3500/45E POSITION MONITOR THE 3500 ENCORE FAMILY OFFERS ALL
THE MONITOR TYPES FOR A TURBINE SUPERVISORY INSTRUMENTATION (TSI) SYSTEM. THE NEW 3500/45E REPLACES SIX 3300 SERIES MONITOR TYPES (REFERENCE 1):
• 3300/20 THRUST POSITION
• 3300/45 DIFFERENTIAL EXPANSION (DE)
• 3300/46 RAMP DE
• 3300/47 COMPLIMENTARY INPUT DE
• 3300/48 CASE EXPANSION
• 3300/70 VALVE POSITION
Oct .2012 • No.4 • Vol .32 ORBIT 11
NEWS
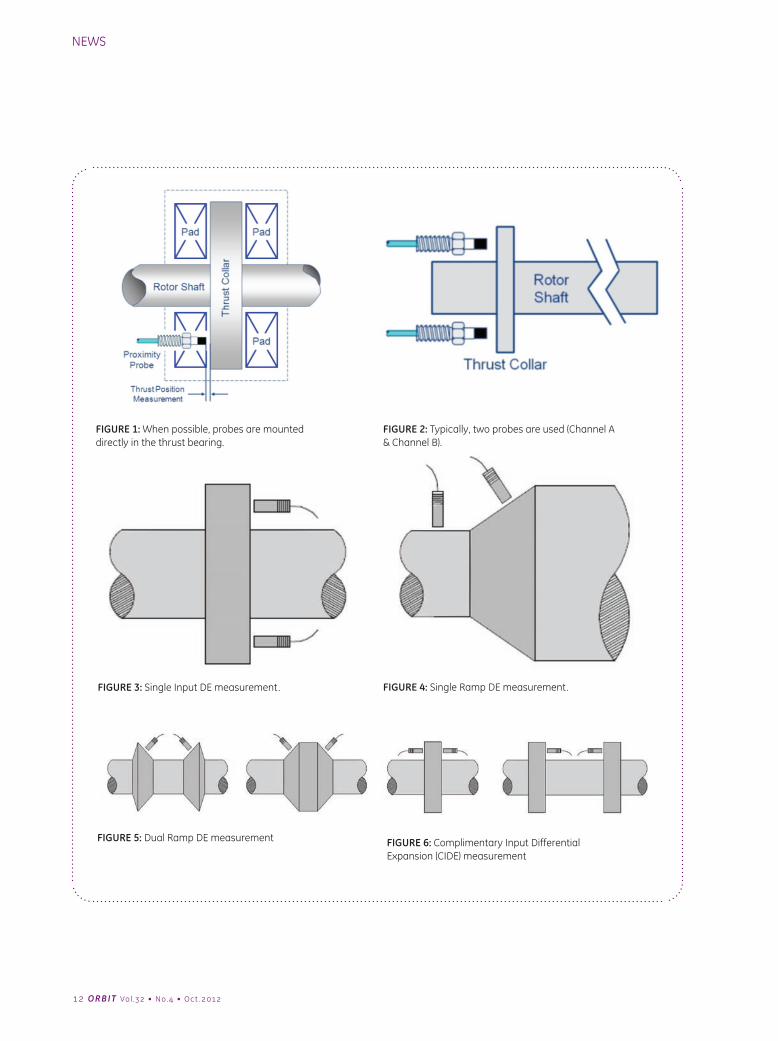
FIGURE 1: When possible, probes are mounted directly in the thrust bearing.
FIGURE 3: Single Input DE measurement.
FIGURE 2: Typically, two probes are used (Channel A & Channel B).
FIGURE 4: Single Ramp DE measurement.
FIGURE 5: Dual Ramp DE measurement FIGURE 6: Complimentary Input Differential Expansion (CIDE) measurement
12 ORBIT Vol .32 • No.4 • Oct .2012
NEWS
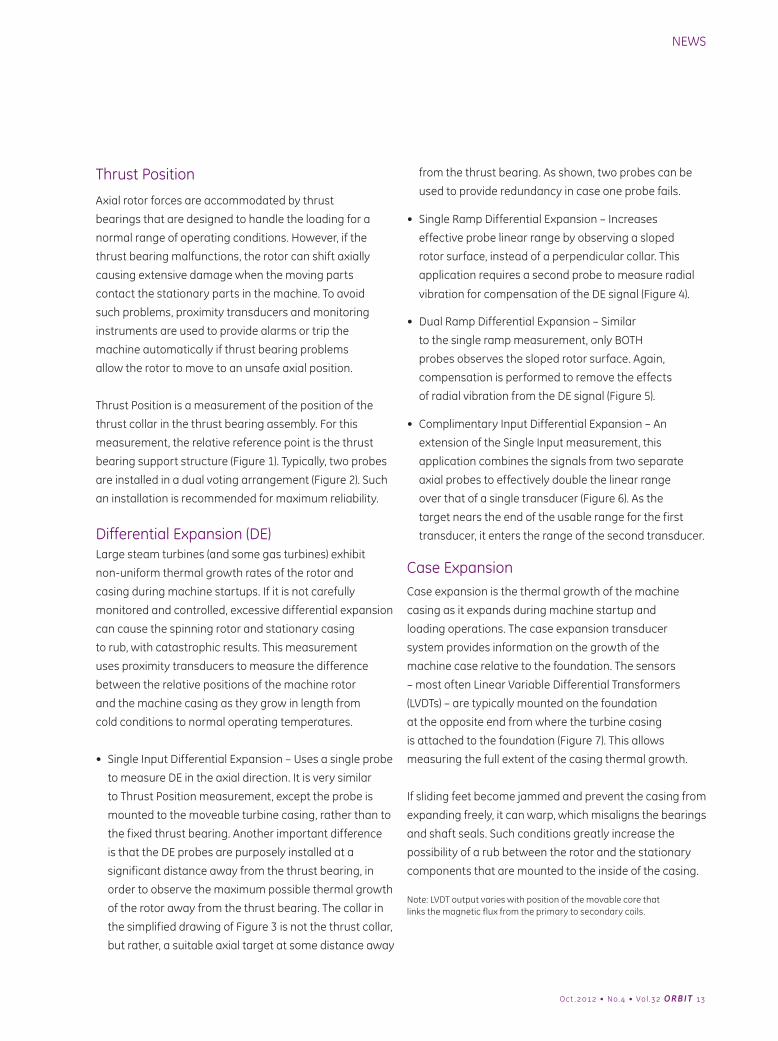
Thrust Position
Axial rotor forces are accommodated by thrust
bearings that are designed to handle the loading for a
normal range of operating conditions. However, if the
thrust bearing malfunctions, the rotor can shift axially
causing extensive damage when the moving parts
contact the stationary parts in the machine. To avoid
such problems, proximity transducers and monitoring
instruments are used to provide alarms or trip the
machine automatically if thrust bearing problems
allow the rotor to move to an unsafe axial position.
Thrust Position is a measurement of the position of the
thrust collar in the thrust bearing assembly. For this
measurement, the relative reference point is the thrust
bearing support structure (Figure 1). Typically, two probes
are installed in a dual voting arrangement (Figure 2). Such
an installation is recommended for maximum reliability.
Differential Expansion (DE)Large steam turbines (and some gas turbines) exhibit
non-uniform thermal growth rates of the rotor and
casing during machine startups. If it is not carefully
monitored and controlled, excessive differential expansion
can cause the spinning rotor and stationary casing
to rub, with catastrophic results. This measurement
uses proximity transducers to measure the difference
between the relative positions of the machine rotor
and the machine casing as they grow in length from
cold conditions to normal operating temperatures.
• Single Input Differential Expansion – Uses a single probe
to measure DE in the axial direction. It is very similar
to Thrust Position measurement, except the probe is
mounted to the moveable turbine casing, rather than to
the fixed thrust bearing. Another important difference
is that the DE probes are purposely installed at a
significant distance away from the thrust bearing, in
order to observe the maximum possible thermal growth
of the rotor away from the thrust bearing. The collar in
the simplified drawing of Figure 3 is not the thrust collar,
but rather, a suitable axial target at some distance away
from the thrust bearing. As shown, two probes can be
used to provide redundancy in case one probe fails.
• Single Ramp Differential Expansion – Increases
effective probe linear range by observing a sloped
rotor surface, instead of a perpendicular collar. This
application requires a second probe to measure radial
vibration for compensation of the DE signal (Figure 4).
• Dual Ramp Differential Expansion – Similar
to the single ramp measurement, only BOTH
probes observes the sloped rotor surface. Again,
compensation is performed to remove the effects
of radial vibration from the DE signal (Figure 5).
• Complimentary Input Differential Expansion – An
extension of the Single Input measurement, this
application combines the signals from two separate
axial probes to effectively double the linear range
over that of a single transducer (Figure 6). As the
target nears the end of the usable range for the first
transducer, it enters the range of the second transducer.
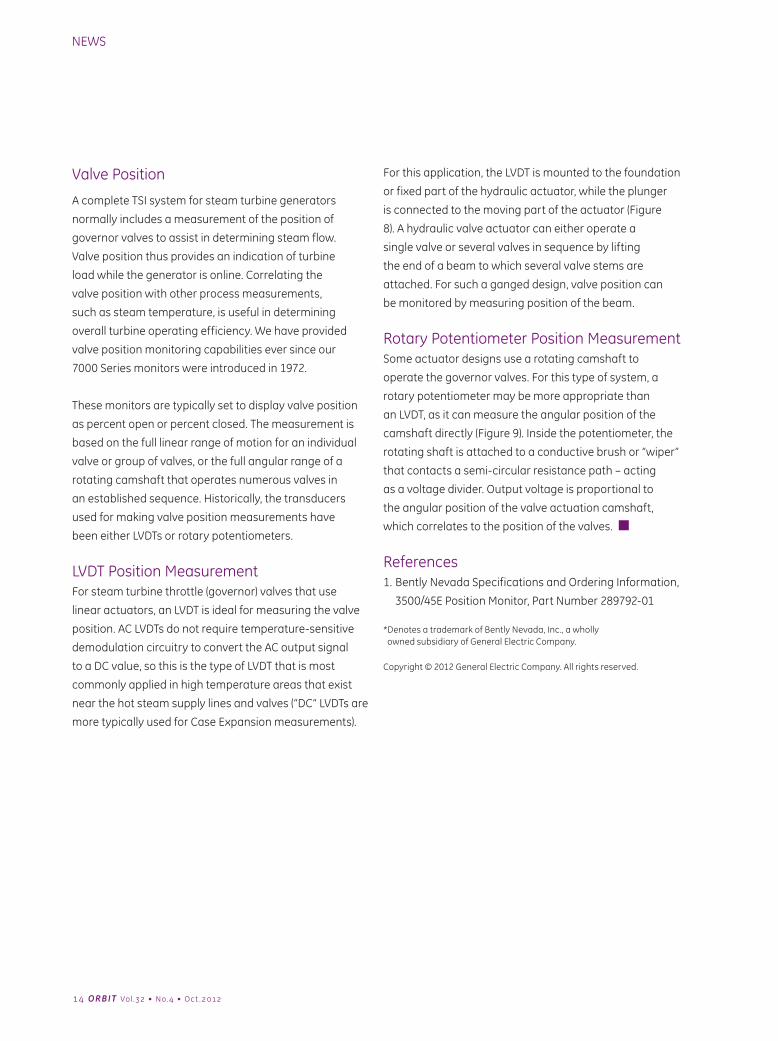
Case ExpansionCase expansion is the thermal growth of the machine
casing as it expands during machine startup and
loading operations. The case expansion transducer
system provides information on the growth of the
machine case relative to the foundation. The sensors
– most often Linear Variable Differential Transformers
(LVDTs) – are typically mounted on the foundation
at the opposite end from where the turbine casing
is attached to the foundation (Figure 7). This allows
measuring the full extent of the casing thermal growth.
If sliding feet become jammed and prevent the casing from
expanding freely, it can warp, which misaligns the bearings
and shaft seals. Such conditions greatly increase the
possibility of a rub between the rotor and the stationary
components that are mounted to the inside of the casing.
Note: LVDT output varies with position of the movable core that links the magnetic flux from the primary to secondary coils.
Oct .2012 • No.4 • Vol .32 ORBIT 13
NEWS
Valve Position
A complete TSI system for steam turbine generators
normally includes a measurement of the position of
governor valves to assist in determining steam flow.
Valve position thus provides an indication of turbine
load while the generator is online. Correlating the
valve position with other process measurements,
such as steam temperature, is useful in determining
overall turbine operating efficiency. We have provided
valve position monitoring capabilities ever since our
7000 Series monitors were introduced in 1972.
These monitors are typically set to display valve position
as percent open or percent closed. The measurement is
based on the full linear range of motion for an individual
valve or group of valves, or the full angular range of a
rotating camshaft that operates numerous valves in
an established sequence. Historically, the transducers
used for making valve position measurements have
been either LVDTs or rotary potentiometers.
LVDT Position MeasurementFor steam turbine throttle (governor) valves that use
linear actuators, an LVDT is ideal for measuring the valve
position. AC LVDTs do not require temperature-sensitive
demodulation circuitry to convert the AC output signal
to a DC value, so this is the type of LVDT that is most
commonly applied in high temperature areas that exist
near the hot steam supply lines and valves (“DC” LVDTs are
more typically used for Case Expansion measurements).
For this application, the LVDT is mounted to the foundation
or fixed part of the hydraulic actuator, while the plunger
is connected to the moving part of the actuator (Figure
8). A hydraulic valve actuator can either operate a
single valve or several valves in sequence by lifting
the end of a beam to which several valve stems are
attached. For such a ganged design, valve position can
be monitored by measuring position of the beam.
Rotary Potentiometer Position MeasurementSome actuator designs use a rotating camshaft to
operate the governor valves. For this type of system, a
rotary potentiometer may be more appropriate than
an LVDT, as it can measure the angular position of the
camshaft directly (Figure 9). Inside the potentiometer, the
rotating shaft is attached to a conductive brush or “wiper”
that contacts a semi-circular resistance path – acting
as a voltage divider. Output voltage is proportional to
the angular position of the valve actuation camshaft,
which correlates to the position of the valves.
References1. Bently Nevada Specifications and Ordering Information,
3500/45E Position Monitor, Part Number 289792-01
* Denotes a trademark of Bently Nevada, Inc., a wholly owned subsidiary of General Electric Company.
Copyright © 2012 General Electric Company. All rights reserved.
14 ORBIT Vol .32 • No.4 • Oct .2012
NEWS
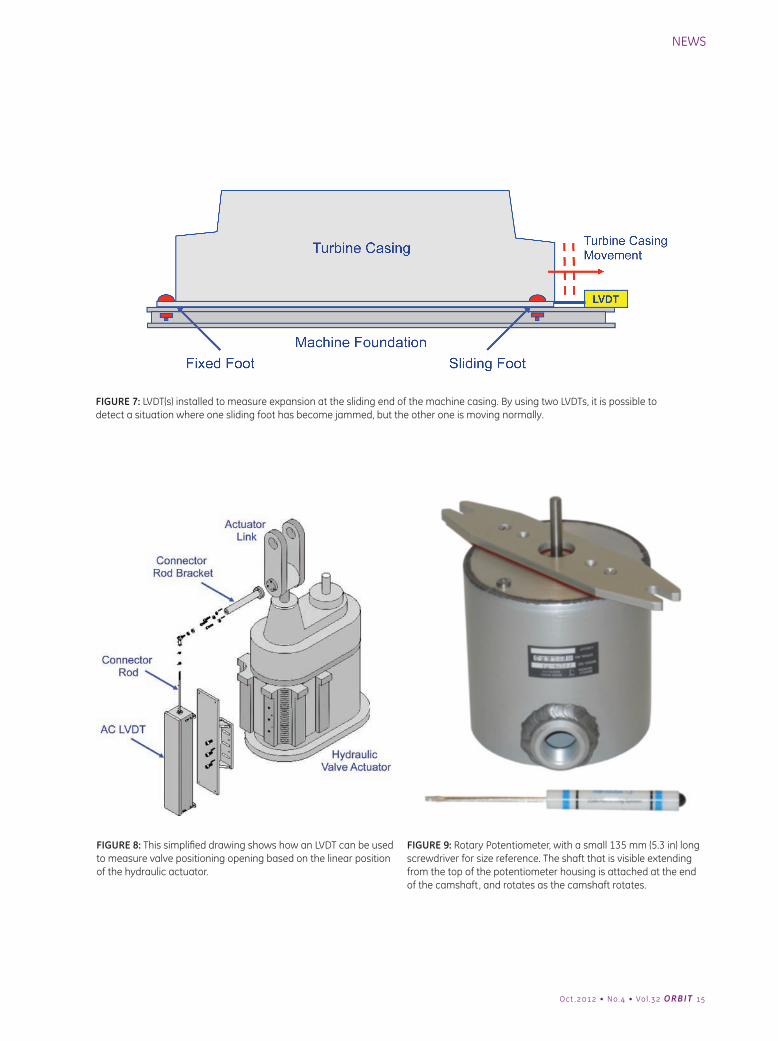
FIGURE 7: LVDT(s) installed to measure expansion at the sliding end of the machine casing. By using two LVDTs, it is possible to detect a situation where one sliding foot has become jammed, but the other one is moving normally.
FIGURE 8: This simplified drawing shows how an LVDT can be used to measure valve positioning opening based on the linear position of the hydraulic actuator.
FIGURE 9: Rotary Potentiometer, with a small 135 mm (5.3 in) long screwdriver for size reference. The shaft that is visible extending from the top of the potentiometer housing is attached at the end of the camshaft, and rotates as the camshaft rotates.
Oct .2012 • No.4 • Vol .32 ORBIT 15
NEWS

ACCURATE DIAGNOSIS OF ROTATING MACHINERY PROBLEMS REQUIRES A COMPLETE SET OF MACHINE VIBRATION INFORMATION. This information comes from the three primary parts of the data that we can obtain from a vibration signal: direct amplitude, frequency, and phase. Relative phase is the timing relationship between two vibration signals, while absolute phase compares a vibration signal to a once per-turn reference pulse.
designingandmachiningakeyphasor*triggerEffective Site Machining Options
16 ORBIT Vol .32 • No.4 • Oct .2012
FEATURES
The Keyphasor signal is a once-per-turn voltage
pulse provided by a transducer (normally an eddy
current proximity measurement system). The
Keyphasor signal is used by monitoring, diagnostic,
and management systems to generate filtered
vibration amplitude, phase lag, speed, and a variety
of other useful information. Keyphasor-referenced
information can help the Operator or Machinery
Specialist identify developing machine problems or
distinguish serious problems from less serious ones.
The Keyphasor signal is used to generate more
than one third of the vibration-related information
regarding the condition of the machine. Phase (relative
and absolute) is a critical part of this information.
Without phase information, overall machine condition
and machine faults would often be very difficult,
if not impossible, to diagnose (Reference 1).
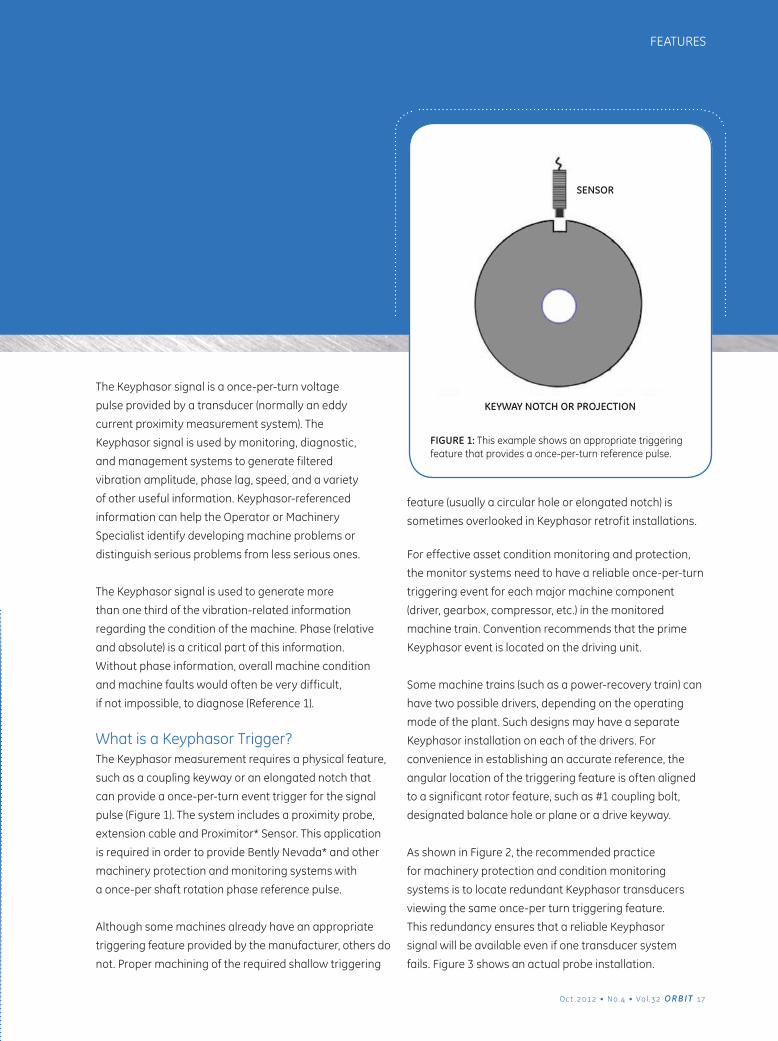
What is a Keyphasor Trigger?The Keyphasor measurement requires a physical feature,
such as a coupling keyway or an elongated notch that
can provide a once-per-turn event trigger for the signal
pulse (Figure 1). The system includes a proximity probe,
extension cable and Proximitor* Sensor. This application
is required in order to provide Bently Nevada* and other
machinery protection and monitoring systems with
a once-per shaft rotation phase reference pulse.
Although some machines already have an appropriate
triggering feature provided by the manufacturer, others do
not. Proper machining of the required shallow triggering
feature (usually a circular hole or elongated notch) is
sometimes overlooked in Keyphasor retrofit installations.
For effective asset condition monitoring and protection,
the monitor systems need to have a reliable once-per-turn
triggering event for each major machine component
(driver, gearbox, compressor, etc.) in the monitored
machine train. Convention recommends that the prime
Keyphasor event is located on the driving unit.
Some machine trains (such as a power-recovery train) can
have two possible drivers, depending on the operating
mode of the plant. Such designs may have a separate
Keyphasor installation on each of the drivers. For
convenience in establishing an accurate reference, the
angular location of the triggering feature is often aligned
to a significant rotor feature, such as #1 coupling bolt,
designated balance hole or plane or a drive keyway.
As shown in Figure 2, the recommended practice
for machinery protection and condition monitoring
systems is to locate redundant Keyphasor transducers
viewing the same once-per turn triggering feature.
This redundancy ensures that a reliable Keyphasor
signal will be available even if one transducer system
fails. Figure 3 shows an actual probe installation.
SENSOR
KEYWAY NOTCH OR PROJECTION
FIGURE 1: This example shows an appropriate triggering feature that provides a once-per-turn reference pulse.
Oct .2012 • No.4 • Vol .32 ORBIT 17
FEATURES
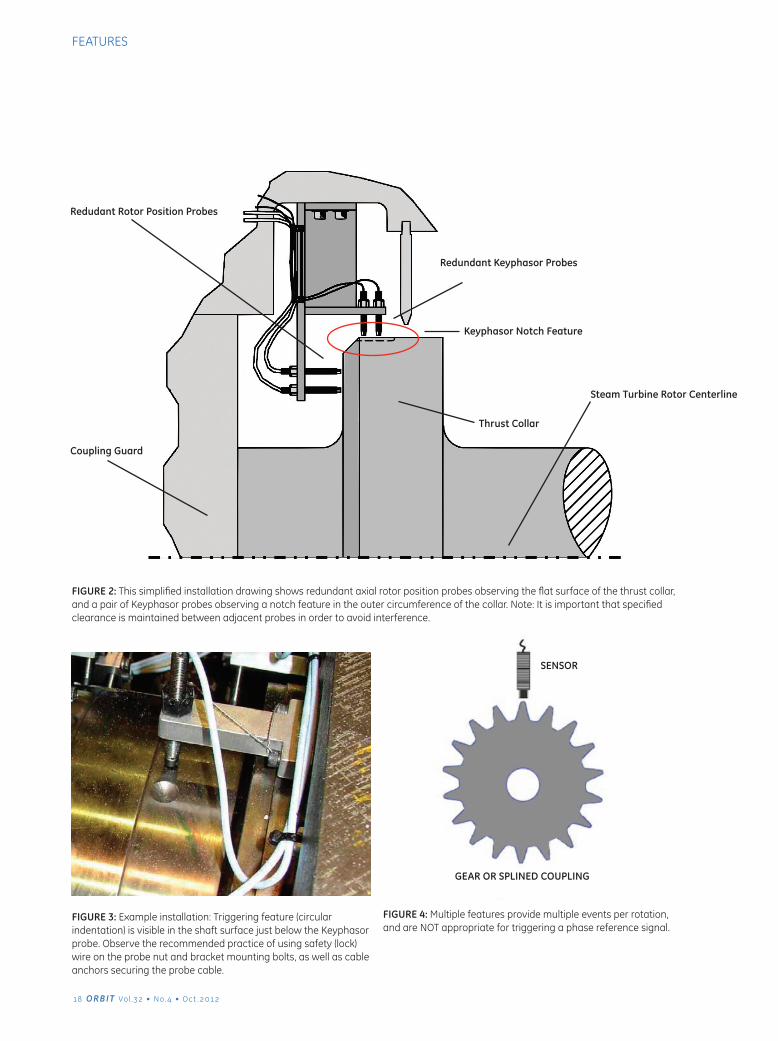
FIGURE 2: This simplified installation drawing shows redundant axial rotor position probes observing the flat surface of the thrust collar, and a pair of Keyphasor probes observing a notch feature in the outer circumference of the collar. Note: It is important that specified clearance is maintained between adjacent probes in order to avoid interference.
FIGURE 3: Example installation: Triggering feature (circular indentation) is visible in the shaft surface just below the Keyphasor probe. Observe the recommended practice of using safety (lock) wire on the probe nut and bracket mounting bolts, as well as cable anchors securing the probe cable.
FIGURE 4: Multiple features provide multiple events per rotation, and are NOT appropriate for triggering a phase reference signal.
Redundant Keyphasor Probes
Redudant Rotor Position Probes
Coupling Guard
Keyphasor Notch Feature
Thrust Collar
Steam Turbine Rotor Centerline
GEAR OR SPLINED COUPLING
SENSOR
18 ORBIT Vol .32 • No.4 • Oct .2012
FEATURES
A Question of Balance
When planning to machine a triggering feature for a
Keyphasor retrofit application, engineers sometimes
become concerned about deliberately creating a potential
source of out-of-balance and often want to consider a
counterbalance located at 180° opposite the designed
feature. This second feature, if located in the same lateral
location on the shaft gives rise to the system seeing
two events per turn, hence creating application issues.
However, it is generally feasible to locate a section of
rotor not forming part of a journal, seal area, probe
track or lying in the Keyphasor lateral plane, that can
accommodate the location of such a counterbalance.
Any form of machining that is performed on a machine
shaft has to be carried out with due regard to the
integrity of the unit. The volume of material removed to
form a Keyphasor triggering feature should be produced
under controlled conditions that can be replicated to
give an identical effect to create a counterbalance.
While it is conventional to refer to out-of-balance in grams
of mass, it is sometimes easier to calculate the material
in volume, at a given radius from the shaft centerline to
the center of the removed volume. Should the required
counter balance hole need to be located on a larger or
smaller diameter part of the rotor, the volume & radius
method provides an easier calculation. This is true
even when there are differing shaft materials involved,
although caution should be exercised, as there are some
instances where material differences can have an effect.
A question that should be asked is whether a
counterbalance is actually needed. The possible
need for a counterbalance may be more applicable
to smaller, higher speed machinery. On large units
such as steam or gas turbine generator machine
trains, it may well be found that there is no need to
provide such a counterbalance – as the unbalance
effect of the removed material is miniscule compared
with the huge overall mass of the machine rotor.
Multi-Event Measurements
We have sometimes seen examples where engineering
companies and OEMs provide their machines with designs
to install a Keyphasor probe to observe the teeth on the
gearwheel in a gearbox or on a multi toothed speed
sensing wheel – assuming that an electronic multiplier/
divider could be utilized to provide a once-per-turn
signal (Figure 4). However, such an application does
not fulfill all of the requirements of a repeatable once
per turn phase reference event and should therefore
be avoided. A multi-toothed design is appropriate
for Speed, Zero-Speed and Overspeed applications,
but it should not be used for phase reference.
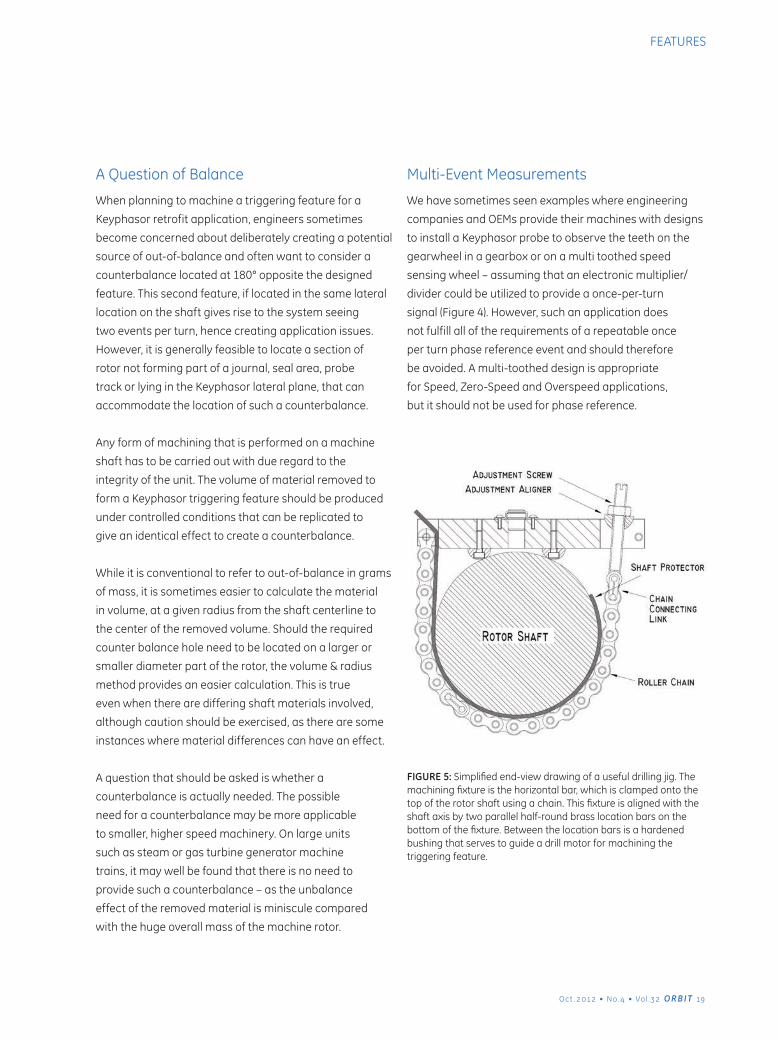
FIGURE 5: Simplified end-view drawing of a useful drilling jig. The machining fixture is the horizontal bar, which is clamped onto the top of the rotor shaft using a chain. This fixture is aligned with the shaft axis by two parallel half-round brass location bars on the bottom of the fixture. Between the location bars is a hardened bushing that serves to guide a drill motor for machining the triggering feature.
Oct .2012 • No.4 • Vol .32 ORBIT 1
FEATURES
Axial Keyphasor Installations
Axial Keyphasor installations are not recommended
unless considerable care is taken in the evaluation
of axial float, differential expansion, and probe gap
setting. These installations should be avoided, as there
have been many instances where the application failed
to provide the required functionality of a repeatable
once per event phase reference marker. A Keyphasor
probe should never double for any other function such
as Axial or Thrust position, Vibration or Eccentricity.
However, a Keyphasor signal may be used to provide
a Speed indication as well as a phase reference.
Accommodating Axial MovementIn the majority of cases, it will be possible to
locate the Keyphasor triggering feature close
to a thrust bearing, where axial movement and
thermal growth are often minimal. In this instance,
the design should be for a symmetrical trigger
such as a round dimple or shallow hole.
However, because of machinery constraints, it may
sometimes be necessary to locate the Keyphasor probe at
a location where axial growth can be substantial. In such a
case, an elongated triggering feature (slot) will be required
to accommodate axial growth. Such a triggering notch or
slot may also be required on machines having no thrust
bearing, such as some electric motors, which depend
on magnetic forces to keep the rotor approximately
centered within the motor. With such designs, the
coupling provides the axial stiffness to the driven unit.
Controlled Field Machining of Triggering Feature
In most cases, the machining of the Keyphasor
trigger at an OEM or machinery repair or rebuild
facility can be accomplished easily, since the rotor
is accessible, and a multitude of milling tools is
available. However, it can be riskier to machine a
proper event trigger with the rotor in the machine.
For field machining, a Keyphasor triggering event can be
produced using a ¾ in or 20 mm ball-nosed cutter. The
nose cutter radius helps in preventing the formation of
sharp internal corners that can be the source of stress
risers. This size of cutter requires an in-situ machining tool
or jig that is sometimes difficult to use in confined spaces.
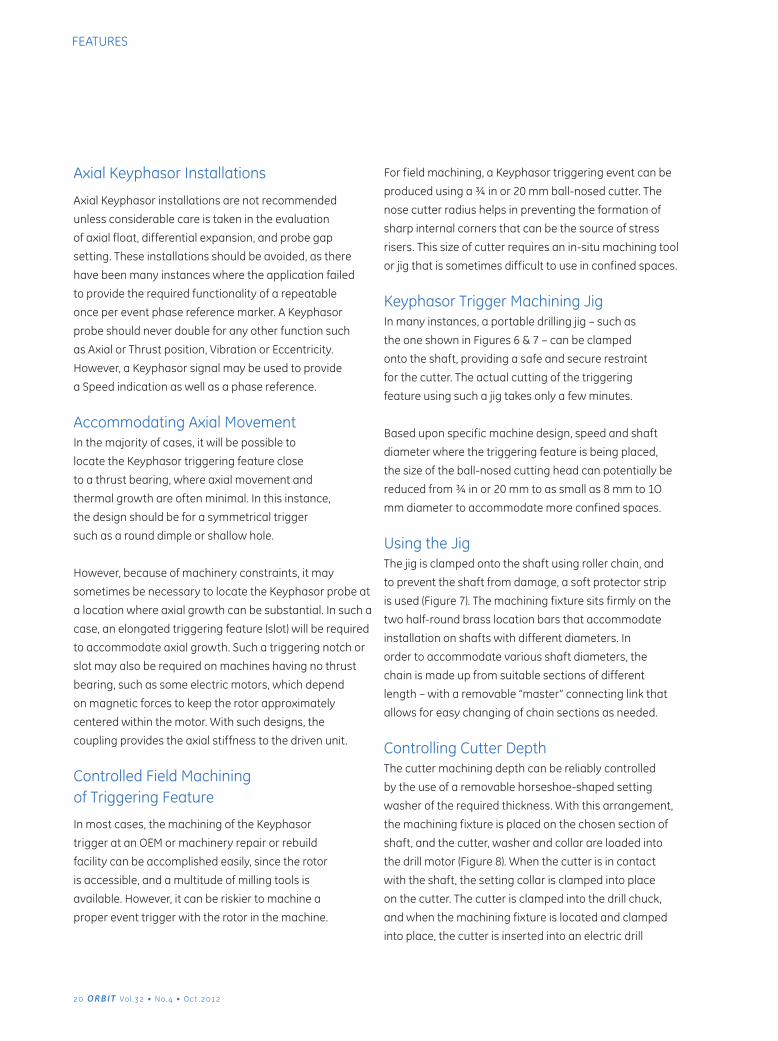
Keyphasor Trigger Machining JigIn many instances, a portable drilling jig – such as
the one shown in Figures 6 & 7 – can be clamped
onto the shaft, providing a safe and secure restraint
for the cutter. The actual cutting of the triggering
feature using such a jig takes only a few minutes.
Based upon specific machine design, speed and shaft
diameter where the triggering feature is being placed,
the size of the ball-nosed cutting head can potentially be
reduced from ¾ in or 20 mm to as small as 8 mm to 1O
mm diameter to accommodate more confined spaces.
Using the JigThe jig is clamped onto the shaft using roller chain, and
to prevent the shaft from damage, a soft protector strip
is used (Figure 7). The machining fixture sits firmly on the
two half-round brass location bars that accommodate
installation on shafts with different diameters. In
order to accommodate various shaft diameters, the
chain is made up from suitable sections of different
length – with a removable “master” connecting link that
allows for easy changing of chain sections as needed.
Controlling Cutter DepthThe cutter machining depth can be reliably controlled
by the use of a removable horseshoe-shaped setting
washer of the required thickness. With this arrangement,
the machining fixture is placed on the chosen section of
shaft, and the cutter, washer and collar are loaded into
the drill motor (Figure 8). When the cutter is in contact
with the shaft, the setting collar is clamped into place
on the cutter. The cutter is clamped into the drill chuck,
and when the machining fixture is located and clamped
into place, the cutter is inserted into an electric drill
20 ORBIT Vol .32 • No.4 • Oct .2012
FEATURES
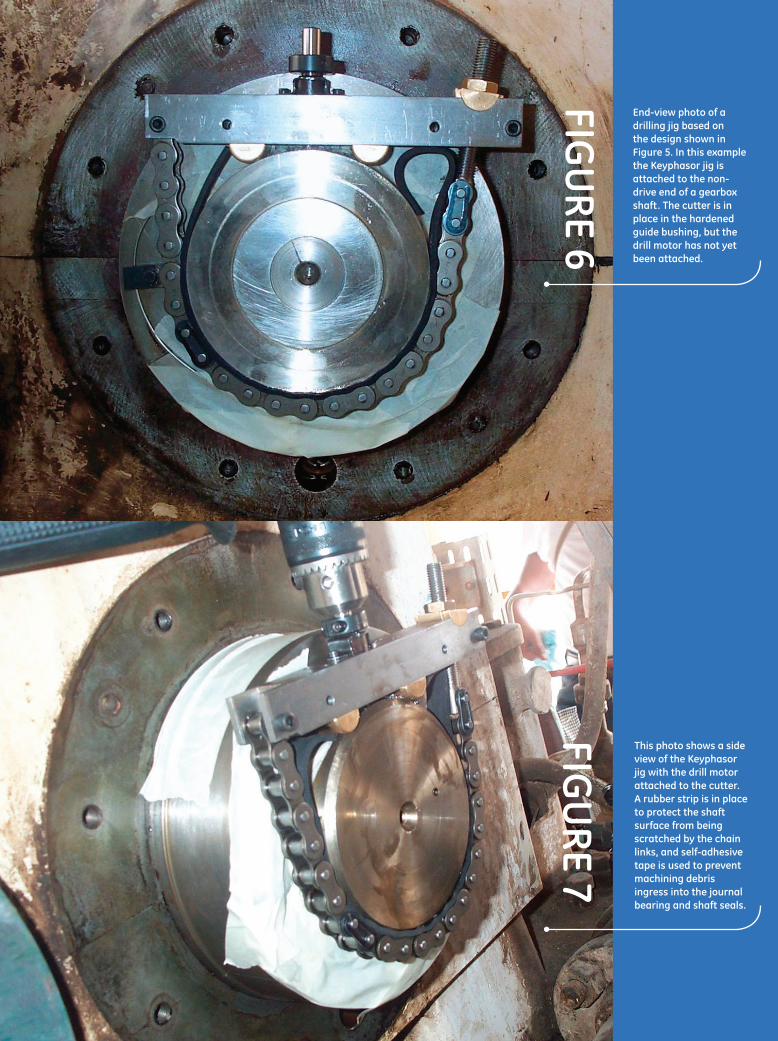
End-view photo of a drilling jig based on the design shown in Figure 5. In this example the Keyphasor jig is attached to the non-drive end of a gearbox shaft. The cutter is in place in the hardened guide bushing, but the drill motor has not yet been attached.
This photo shows a side view of the Keyphasor jig with the drill motor attached to the cutter. A rubber strip is in place to protect the shaft surface from being scratched by the chain links, and self-adhesive tape is used to prevent machining debris ingress into the journal bearing and shaft seals.
FIGU
RE 6FIG
URE 7
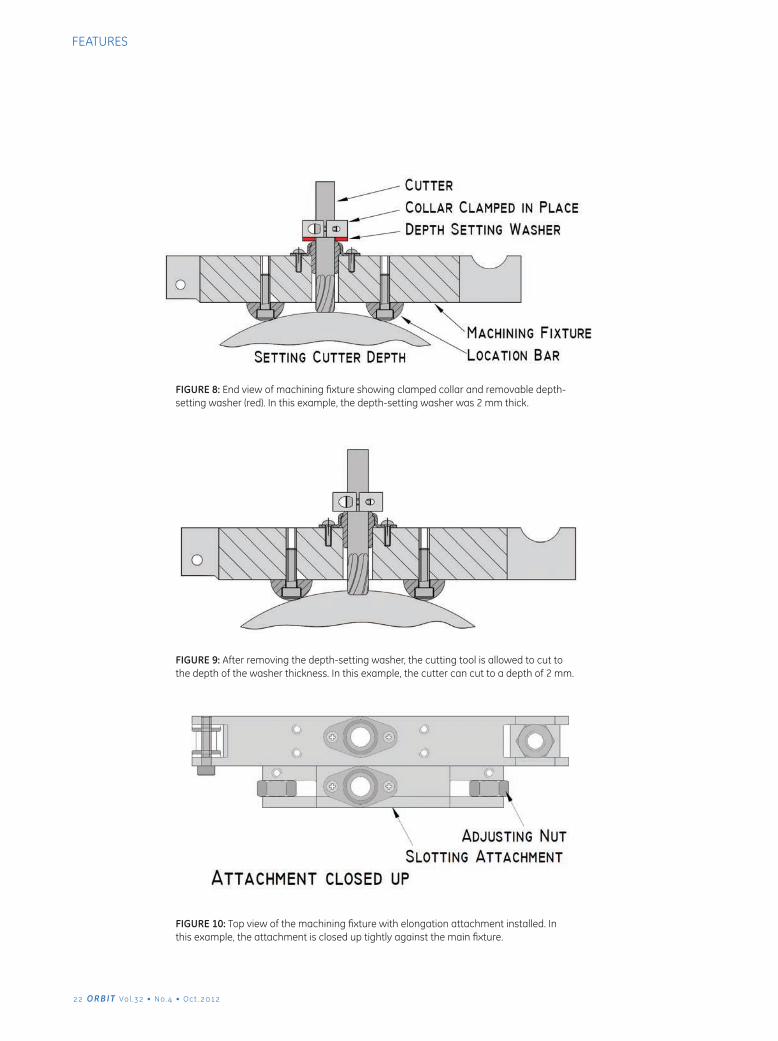
FIGURE 10: Top view of the machining fixture with elongation attachment installed. In this example, the attachment is closed up tightly against the main fixture.
FIGURE 8: End view of machining fixture showing clamped collar and removable depth-setting washer (red). In this example, the depth-setting washer was 2 mm thick.
FIGURE 9: After removing the depth-setting washer, the cutting tool is allowed to cut to the depth of the washer thickness. In this example, the cutter can cut to a depth of 2 mm.
22 ORBIT Vol .32 • No.4 • Oct .2012
FEATURES
motor and the depth-setting washer is removed (Figure
9). This gives a very controlled and repeatable depth
of cut based on the thickness of the setting washer..
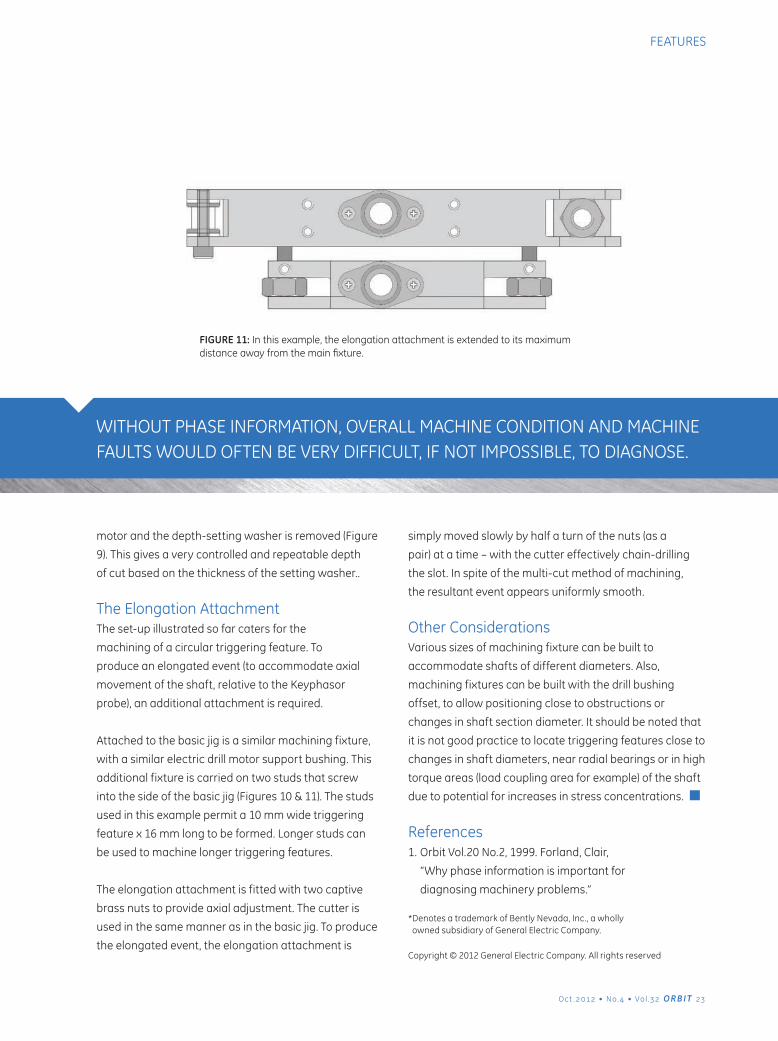
The Elongation AttachmentThe set-up illustrated so far caters for the
machining of a circular triggering feature. To
produce an elongated event (to accommodate axial
movement of the shaft, relative to the Keyphasor
probe), an additional attachment is required.
Attached to the basic jig is a similar machining fixture,
with a similar electric drill motor support bushing. This
additional fixture is carried on two studs that screw
into the side of the basic jig (Figures 10 & 11). The studs
used in this example permit a 10 mm wide triggering
feature x 16 mm long to be formed. Longer studs can
be used to machine longer triggering features.
The elongation attachment is fitted with two captive
brass nuts to provide axial adjustment. The cutter is
used in the same manner as in the basic jig. To produce
the elongated event, the elongation attachment is
simply moved slowly by half a turn of the nuts (as a
pair) at a time – with the cutter effectively chain-drilling
the slot. In spite of the multi-cut method of machining,
the resultant event appears uniformly smooth.
Other ConsiderationsVarious sizes of machining fixture can be built to
accommodate shafts of different diameters. Also,
machining fixtures can be built with the drill bushing
offset, to allow positioning close to obstructions or
changes in shaft section diameter. It should be noted that
it is not good practice to locate triggering features close to
changes in shaft diameters, near radial bearings or in high
torque areas (load coupling area for example) of the shaft
due to potential for increases in stress concentrations.
References1. Orbit Vol.20 No.2, 1999. Forland, Clair,
“Why phase information is important for
diagnosing machinery problems.”
* Denotes a trademark of Bently Nevada, Inc., a wholly owned subsidiary of General Electric Company.
Copyright © 2012 General Electric Company. All rights reserved
FIGURE 11: In this example, the elongation attachment is extended to its maximum distance away from the main fixture.
WITHOUT PHASE INFORMATION, OVERALL MACHINE CONDITION AND MACHINE FAULTS WOULD OFTEN BE VERY DIFFICULT, IF NOT IMPOSSIBLE, TO DIAGNOSE.
Oct .2012 • No.4 • Vol .32 ORBIT 23
FEATURES

system 1*software identifies rotor instability
24 ORBIT Vol .32 • No.4 • Oct .2012
FEATURES
Pankaj Sharma
Machinery Diagnostic Services Manager
Mr. U.N. Mishra
General Manager – Engineering
Deepak Fertilizer
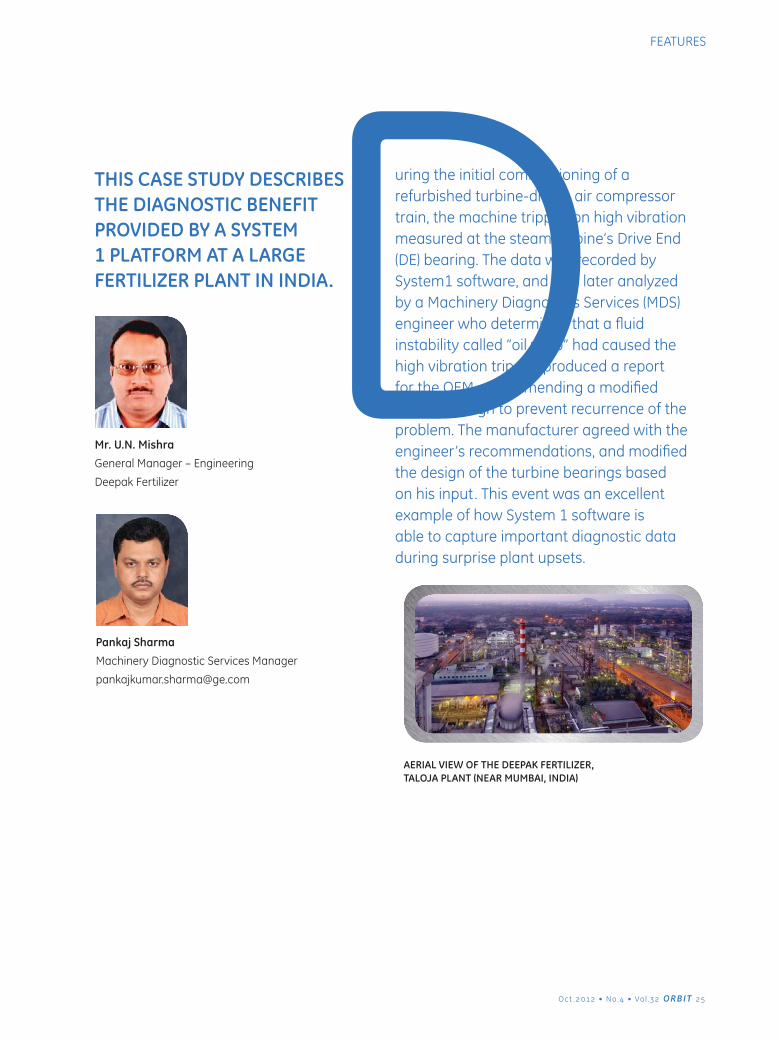
THIS CASE STUDY DESCRIBES THE DIAGNOSTIC BENEFIT PROVIDED BY A SYSTEM 1 PLATFORM AT A LARGE FERTILIZER PLANT IN INDIA. D
AERIAL VIEW OF THE DEEPAK FERTILIZER, TALOJA PLANT (NEAR MUMBAI, INDIA)
uring the initial commissioning of a refurbished turbine-driven air compressor train, the machine tripped on high vibration measured at the steam turbine’s Drive End (DE) bearing. The data was recorded by System1 software, and was later analyzed by a Machinery Diagnostics Services (MDS) engineer who determined that a fluid instability called “oil whip” had caused the high vibration trip. He produced a report for the OEM, recommending a modified bearing design to prevent recurrence of the problem. The manufacturer agreed with the engineer’s recommendations, and modified the design of the turbine bearings based on his input. This event was an excellent example of how System 1 software is able to capture important diagnostic data during surprise plant upsets.
Oct .2012 • No.4 • Vol .32 ORBIT 25
FEATURES
Historical Background
The events in this case history article occurred at Deepak
Fertilizer and Petrochemicals Company Ltd.’s fertilizer
plant in Taloja, India, during December of 2010. This
plant was originally built in 1982, and has an output
of about 1000 tons per year of Ammonium Nitrate.
As part of a plant-wide upgrade project, the main air
compressor in the weak nitric acid plant was overhauled
using refurbished parts. During the air compressor
overhaul, a Bently Nevada 3500 Series monitoring
system was installed, along with System1 software.
The air compressor described in this article had been
installed for more than 25 years at the time of its
overhaul. The machine train includes a steam turbine,
two separate centrifugal air compressors, and a turbo-
expander (Figure 1). The expander reduces the required
steam turbine power output during times when reactor
off-gas is available to provide power via the expander.
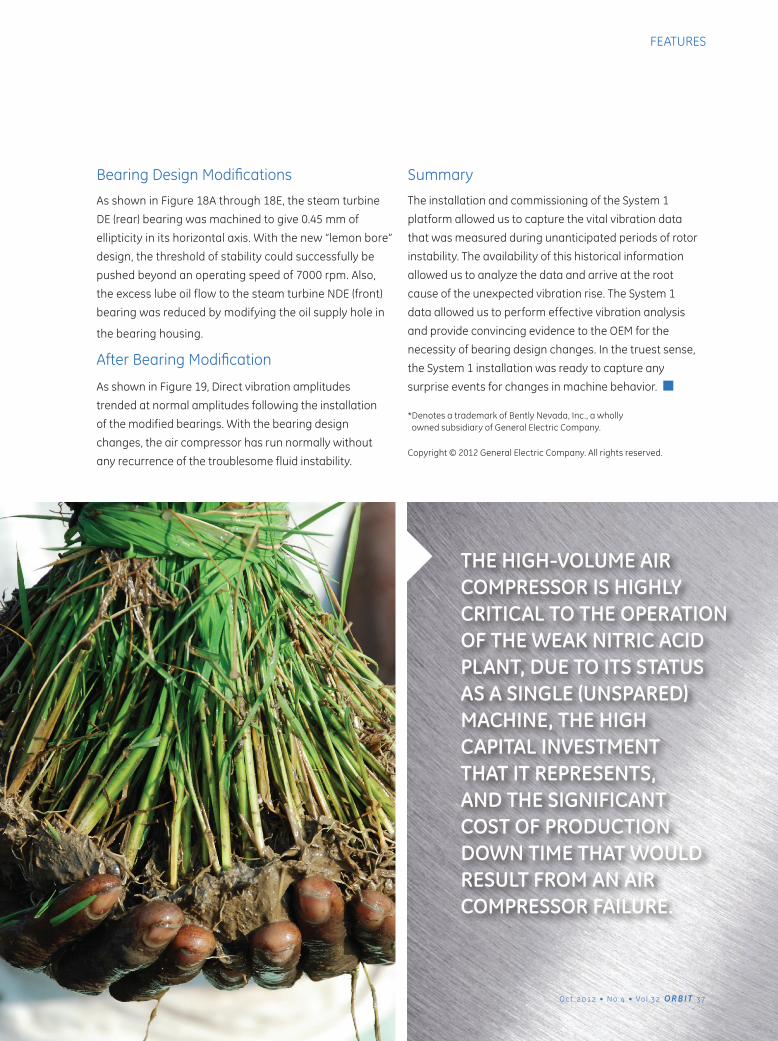
Asset Criticality Note: The production of nitric acid is a
necessary step in the manufacture of fertilizer. The high-
volume air compressor is highly critical to the operation
of the weak nitric acid plant, due to its status as a single
(unspared) machine, the high capital investment that it
represents, and the significant cost of production down
time that would result from an air compressor failure.
Sequence of EventsDuring the compressor startup on December 8,
2010 at 5 PM, the steam turbine tripped on high
vibration at the Drive End (DE) bearing. The observed
symptoms are summarized below (Figure 2).
• Vibration amplitude on the turbine DE bearing
(6104-4A2 & 4B2) suddenly increased.
• No changes in process conditions or
bearing temperature were observed.
• Possible steam pressure changes were
suspected, but could not be confirmed.
• A similar rise in vibration amplitude had been
observed on November 27, 2010. However, the
steam turbine did not trip during that occurrence.
The local Bently Nevada MDS Engineer was conducting
a training program at the time of the trip, so he was
not immediately available to review the data. However,
after completing his training commitments, he was able
to evaluate the data and come to an understanding
of the root cause of the vibration rise. This was an
excellent example of how System 1 software can
capture high-resolution data whenever a surprise plant
upset occurs, and facilitate diagnostic analysis of this
data as soon as someone is available to review it.
Vibration Data Plots and AnalysisThe System 1 Event Manager (Figure 2) showed that
the steam turbine tripped on high vibration amplitude
at the DE Bearing. However, further investigation
revealed that the vibration actually began to increase
almost one hour before the trip finally occurred.
As shown in Figure 3, the rise in “Direct” (unfiltered)
amplitude was not caused by an increase in 1X amplitudes.
When observing the data that was collected
around the time of the trip (Figure 4), it appears that
the vibration amplitudes exceeded the “Danger”
(automatic trip) setpoint at about 16:55:57 hours, but
that vibration then continued to increase for about
9 more seconds (to about 16:56:06), before finally
falling below the Danger setpoint at about 16:56:08.
This scenario may lead us to believe that, after the
vibration amplitude exceeded the Danger setpoint,
there was an unusual delay with the trip relay that
prevented a reduction in vibration until after 16:56:06.
However, the actual trip delay was verified to be only 3
seconds, which is normal. What the data really shows is
a somewhat unexpected instance of vibration continuing
to increase for a few seconds after the turbine trip.
26 ORBIT Vol .32 • No.4 • Oct .2012
FEATURES
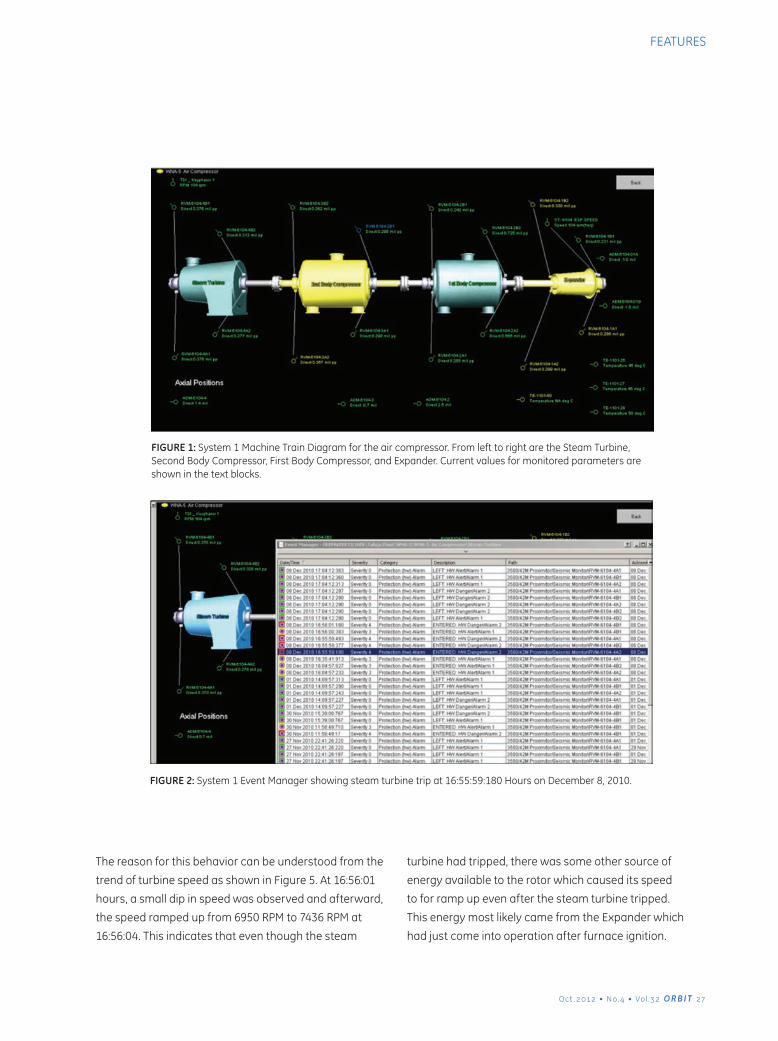
FIGURE 2: System 1 Event Manager showing steam turbine trip at 16:55:59:180 Hours on December 8, 2010.
FIGURE 1: System 1 Machine Train Diagram for the air compressor. From left to right are the Steam Turbine, Second Body Compressor, First Body Compressor, and Expander. Current values for monitored parameters are shown in the text blocks.
The reason for this behavior can be understood from the
trend of turbine speed as shown in Figure 5. At 16:56:01
hours, a small dip in speed was observed and afterward,
the speed ramped up from 6950 RPM to 7436 RPM at
16:56:04. This indicates that even though the steam
turbine had tripped, there was some other source of
energy available to the rotor which caused its speed
to for ramp up even after the steam turbine tripped.
This energy most likely came from the Expander which
had just come into operation after furnace ignition.
Oct .2012 • No.4 • Vol .32 ORBIT 27
FEATURES
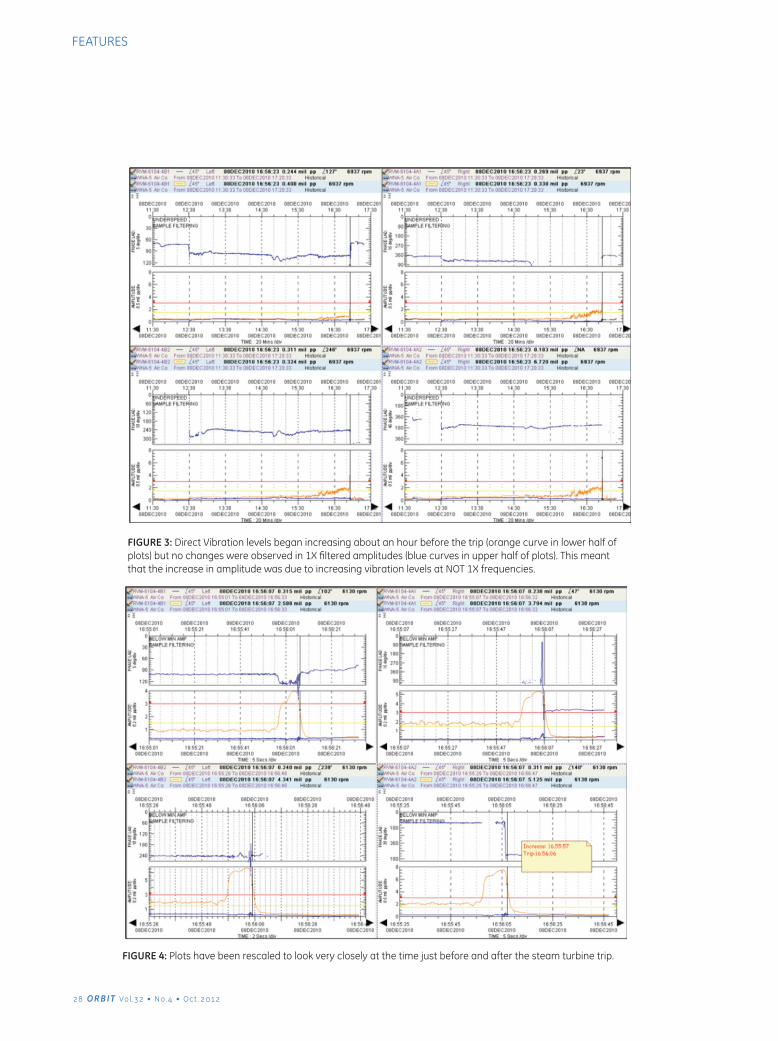
FIGURE 4: Plots have been rescaled to look very closely at the time just before and after the steam turbine trip.
FIGURE 3: Direct Vibration levels began increasing about an hour before the trip (orange curve in lower half of plots) but no changes were observed in 1X filtered amplitudes (blue curves in upper half of plots). This meant that the increase in amplitude was due to increasing vibration levels at NOT 1X frequencies.
28 ORBIT Vol .32 • No.4 • Oct .2012
FEATURES
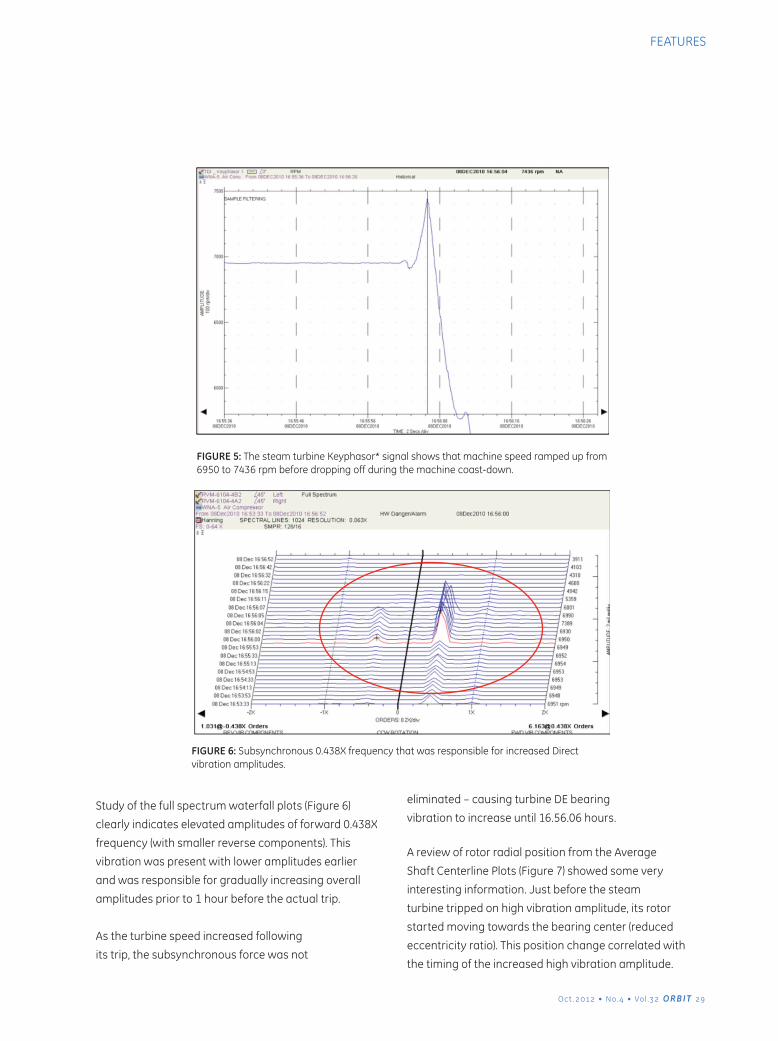
FIGURE 6: Subsynchronous 0.438X frequency that was responsible for increased Direct vibration amplitudes.
FIGURE 5: The steam turbine Keyphasor* signal shows that machine speed ramped up from 6950 to 7436 rpm before dropping off during the machine coast-down.
Study of the full spectrum waterfall plots (Figure 6)
clearly indicates elevated amplitudes of forward 0.438X
frequency (with smaller reverse components). This
vibration was present with lower amplitudes earlier
and was responsible for gradually increasing overall
amplitudes prior to 1 hour before the actual trip.
As the turbine speed increased following
its trip, the subsynchronous force was not
eliminated – causing turbine DE bearing
vibration to increase until 16.56.06 hours.
A review of rotor radial position from the Average
Shaft Centerline Plots (Figure 7) showed some very
interesting information. Just before the steam
turbine tripped on high vibration amplitude, its rotor
started moving towards the bearing center (reduced
eccentricity ratio). This position change correlated with
the timing of the increased high vibration amplitude.
Oct .2012 • No.4 • Vol .32 ORBIT 2
FEATURES
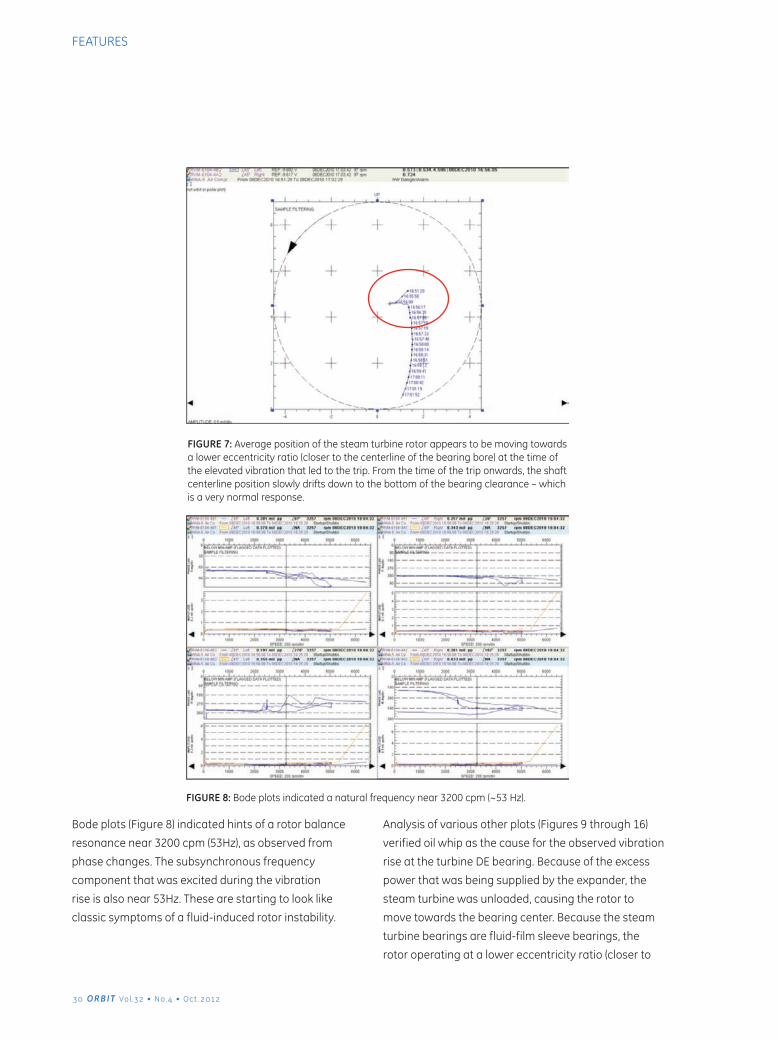
FIGURE 8: Bode plots indicated a natural frequency near 3200 cpm (~53 Hz).
FIGURE 7: Average position of the steam turbine rotor appears to be moving towards a lower eccentricity ratio (closer to the centerline of the bearing bore) at the time of the elevated vibration that led to the trip. From the time of the trip onwards, the shaft centerline position slowly drifts down to the bottom of the bearing clearance – which is a very normal response.
Bode plots (Figure 8) indicated hints of a rotor balance
resonance near 3200 cpm (53Hz), as observed from
phase changes. The subsynchronous frequency
component that was excited during the vibration
rise is also near 53Hz. These are starting to look like
classic symptoms of a fluid-induced rotor instability.
Analysis of various other plots (Figures 9 through 16)
verified oil whip as the cause for the observed vibration
rise at the turbine DE bearing. Because of the excess
power that was being supplied by the expander, the
steam turbine was unloaded, causing the rotor to
move towards the bearing center. Because the steam
turbine bearings are fluid-film sleeve bearings, the
rotor operating at a lower eccentricity ratio (closer to
30 ORBIT Vol .32 • No.4 • Oct .2012
FEATURES
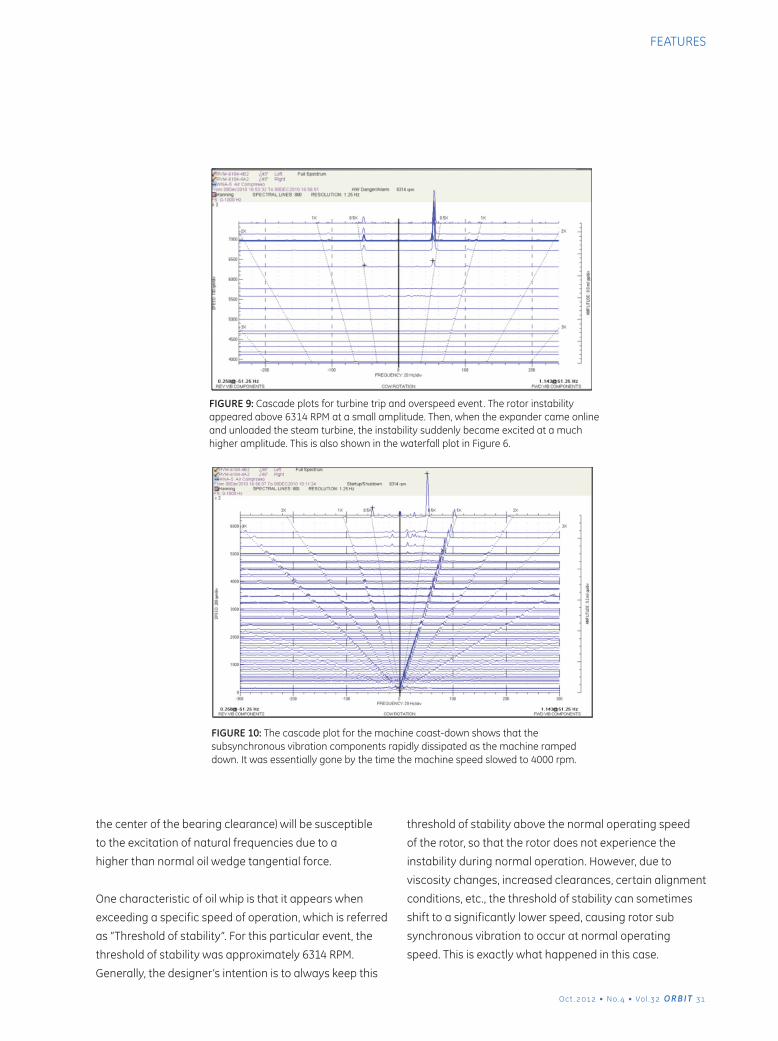
FIGURE 10: The cascade plot for the machine coast-down shows that the subsynchronous vibration components rapidly dissipated as the machine ramped down. It was essentially gone by the time the machine speed slowed to 4000 rpm.
FIGURE 9: Cascade plots for turbine trip and overspeed event. The rotor instability appeared above 6314 RPM at a small amplitude. Then, when the expander came online and unloaded the steam turbine, the instability suddenly became excited at a much higher amplitude. This is also shown in the waterfall plot in Figure 6.
the center of the bearing clearance) will be susceptible
to the excitation of natural frequencies due to a
higher than normal oil wedge tangential force.
One characteristic of oil whip is that it appears when
exceeding a specific speed of operation, which is referred
as “Threshold of stability”. For this particular event, the
threshold of stability was approximately 6314 RPM.
Generally, the designer’s intention is to always keep this
threshold of stability above the normal operating speed
of the rotor, so that the rotor does not experience the
instability during normal operation. However, due to
viscosity changes, increased clearances, certain alignment
conditions, etc., the threshold of stability can sometimes
shift to a significantly lower speed, causing rotor sub
synchronous vibration to occur at normal operating
speed. This is exactly what happened in this case.
Oct .2012 • No.4 • Vol .32 ORBIT 31
FEATURES
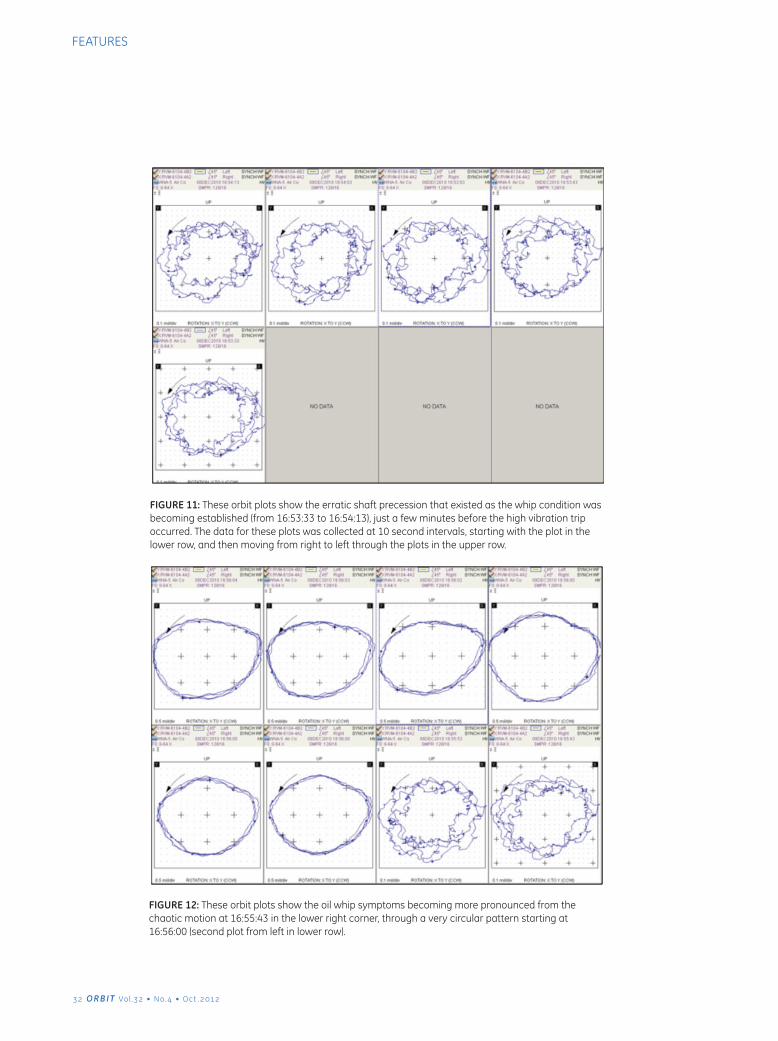
FIGURE 12: These orbit plots show the oil whip symptoms becoming more pronounced from the chaotic motion at 16:55:43 in the lower right corner, through a very circular pattern starting at 16:56:00 (second plot from left in lower row).
FIGURE 11: These orbit plots show the erratic shaft precession that existed as the whip condition was becoming established (from 16:53:33 to 16:54:13), just a few minutes before the high vibration trip occurred. The data for these plots was collected at 10 second intervals, starting with the plot in the lower row, and then moving from right to left through the plots in the upper row.
32 ORBIT Vol .32 • No.4 • Oct .2012
FEATURES
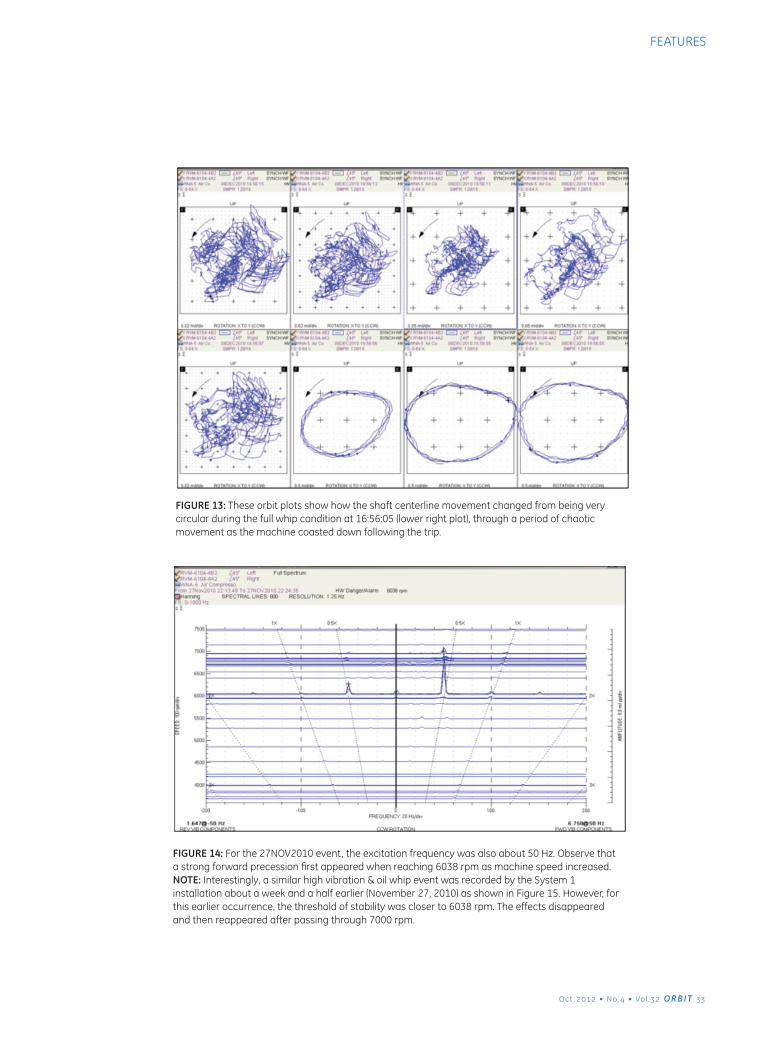
FIGURE 14: For the 27NOV2010 event, the excitation frequency was also about 50 Hz. Observe that a strong forward precession first appeared when reaching 6038 rpm as machine speed increased. NOTE: Interestingly, a similar high vibration & oil whip event was recorded by the System 1 installation about a week and a half earlier (November 27, 2010) as shown in Figure 15. However, for this earlier occurrence, the threshold of stability was closer to 6038 rpm. The effects disappeared and then reappeared after passing through 7000 rpm.
FIGURE 13: These orbit plots show how the shaft centerline movement changed from being very circular during the full whip condition at 16:56:05 (lower right plot), through a period of chaotic movement as the machine coasted down following the trip.
Oct .2012 • No.4 • Vol .32 ORBIT 33
FEATURES
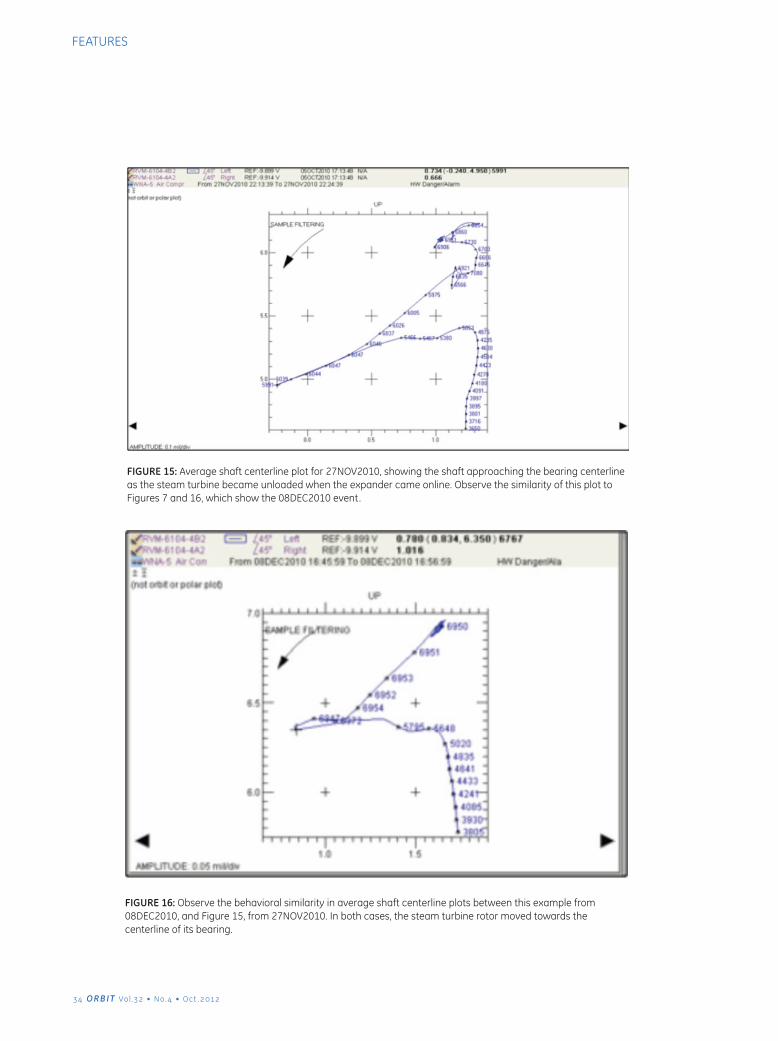
FIGURE 16: Observe the behavioral similarity in average shaft centerline plots between this example from 08DEC2010, and Figure 15, from 27NOV2010. In both cases, the steam turbine rotor moved towards the centerline of its bearing.
FIGURE 15: Average shaft centerline plot for 27NOV2010, showing the shaft approaching the bearing centerline as the steam turbine became unloaded when the expander came online. Observe the similarity of this plot to Figures 7 and 16, which show the 08DEC2010 event.
34 ORBIT Vol .32 • No.4 • Oct .2012
FEATURES
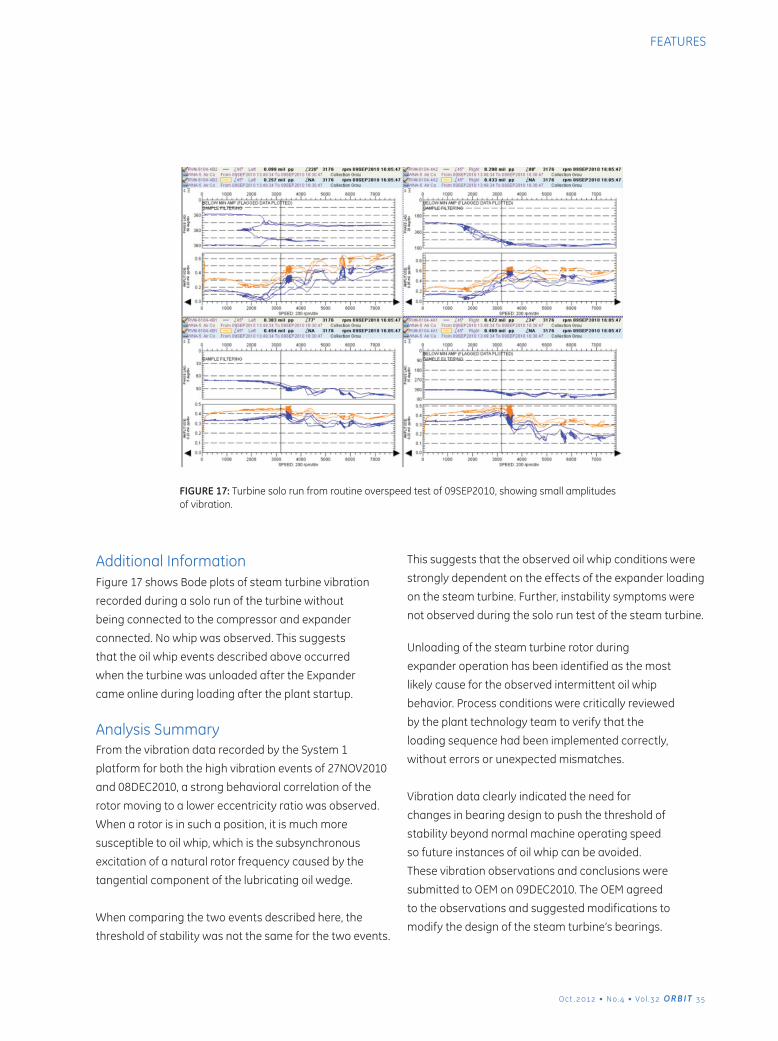
Additional InformationFigure 17 shows Bode plots of steam turbine vibration
recorded during a solo run of the turbine without
being connected to the compressor and expander
connected. No whip was observed. This suggests
that the oil whip events described above occurred
when the turbine was unloaded after the Expander
came online during loading after the plant startup.
Analysis SummaryFrom the vibration data recorded by the System 1
platform for both the high vibration events of 27NOV2010
and 08DEC2010, a strong behavioral correlation of the
rotor moving to a lower eccentricity ratio was observed.
When a rotor is in such a position, it is much more
susceptible to oil whip, which is the subsynchronous
excitation of a natural rotor frequency caused by the
tangential component of the lubricating oil wedge.
When comparing the two events described here, the
threshold of stability was not the same for the two events.
This suggests that the observed oil whip conditions were
strongly dependent on the effects of the expander loading
on the steam turbine. Further, instability symptoms were
not observed during the solo run test of the steam turbine.
Unloading of the steam turbine rotor during
expander operation has been identified as the most
likely cause for the observed intermittent oil whip
behavior. Process conditions were critically reviewed
by the plant technology team to verify that the
loading sequence had been implemented correctly,
without errors or unexpected mismatches.
Vibration data clearly indicated the need for
changes in bearing design to push the threshold of
stability beyond normal machine operating speed
so future instances of oil whip can be avoided.
These vibration observations and conclusions were
submitted to OEM on 09DEC2010. The OEM agreed
to the observations and suggested modifications to
modify the design of the steam turbine’s bearings.
FIGURE 17: Turbine solo run from routine overspeed test of 09SEP2010, showing small amplitudes of vibration.
Oct .2012 • No.4 • Vol .32 ORBIT 35
FEATURES
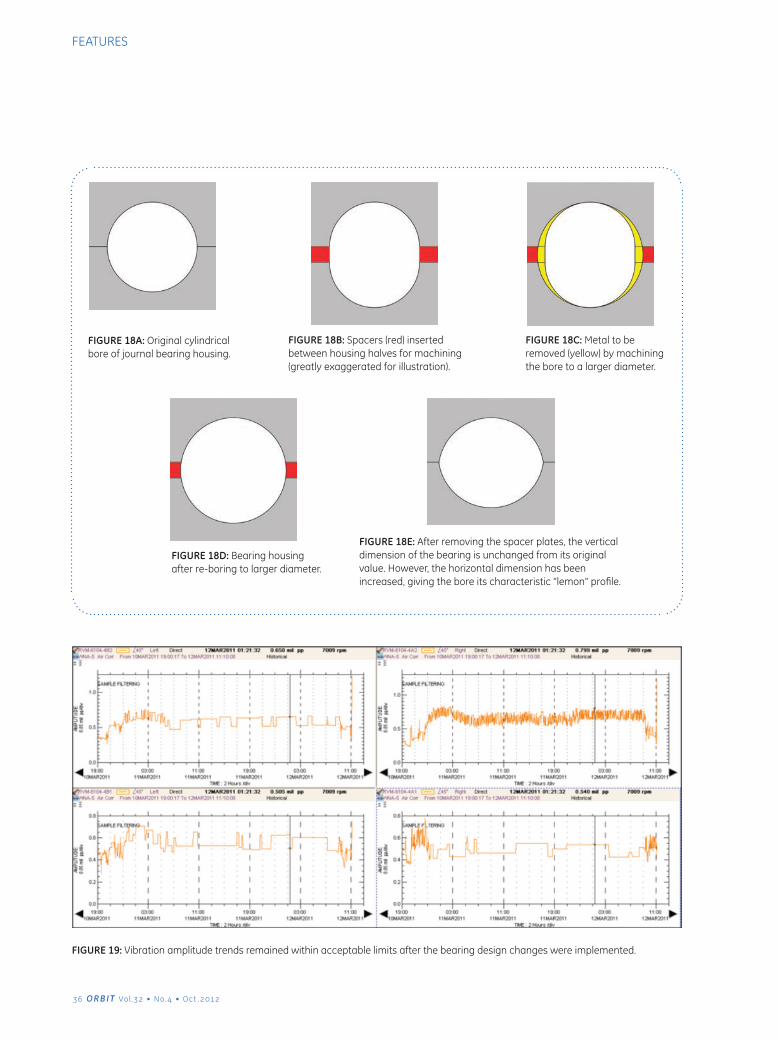
FIGURE 18A: Original cylindrical bore of journal bearing housing.
FIGURE 18B: Spacers (red) inserted between housing halves for machining (greatly exaggerated for illustration).
FIGURE 18C: Metal to be removed (yellow) by machining the bore to a larger diameter.
FIGURE 18D: Bearing housing after re-boring to larger diameter.
FIGURE 18E: After removing the spacer plates, the vertical dimension of the bearing is unchanged from its original value. However, the horizontal dimension has been increased, giving the bore its characteristic “lemon” profile.
FIGURE 19: Vibration amplitude trends remained within acceptable limits after the bearing design changes were implemented.
36 ORBIT Vol .32 • No.4 • Oct .2012
FEATURES
Bearing Design Modifications
As shown in Figure 18A through 18E, the steam turbine
DE (rear) bearing was machined to give 0.45 mm of
ellipticity in its horizontal axis. With the new “lemon bore”
design, the threshold of stability could successfully be
pushed beyond an operating speed of 7000 rpm. Also,
the excess lube oil flow to the steam turbine NDE (front)
bearing was reduced by modifying the oil supply hole in
the bearing housing.
After Bearing Modification
As shown in Figure 19, Direct vibration amplitudes
trended at normal amplitudes following the installation
of the modified bearings. With the bearing design
changes, the air compressor has run normally without
any recurrence of the troublesome fluid instability.
Summary
The installation and commissioning of the System 1
platform allowed us to capture the vital vibration data
that was measured during unanticipated periods of rotor
instability. The availability of this historical information
allowed us to analyze the data and arrive at the root
cause of the unexpected vibration rise. The System 1
data allowed us to perform effective vibration analysis
and provide convincing evidence to the OEM for the
necessity of bearing design changes. In the truest sense,
the System 1 installation was ready to capture any
surprise events for changes in machine behavior.
* Denotes a trademark of Bently Nevada, Inc., a wholly owned subsidiary of General Electric Company.
Copyright © 2012 General Electric Company. All rights reserved.
THE HIGH-VOLUME AIR COMPRESSOR IS HIGHLY CRITICAL TO THE OPERATION OF THE WEAK NITRIC ACID PLANT, DUE TO ITS STATUS AS A SINGLE (UNSPARED) MACHINE, THE HIGH CAPITAL INVESTMENT THAT IT REPRESENTS, AND THE SIGNIFICANT COST OF PRODUCTION DOWN TIME THAT WOULD RESULT FROM AN AIR COMPRESSOR FAILURE.
Oct .2012 • No.4 • Vol .32 ORBIT 37
FEATURES

diagnosinggeneratorrotorthermalsensitivity
Roengchai Chumai
Technical Leader
Bently Nevada Machinery
Diagnostics Services
Uthan Thubtong
EGAT, Bangpakong
Combined Cycle Plant
Chachoengsao, Thailand
38 ORBIT Vol .32 • No.4 • Oct .2012
DEPARTMENTS
CASE HISTORIES

ELECTRICITY GEN
ERATING
AUTH
ORITY O
F THAILAN
D (EG
AT) BANG
PAKON
G SITE
A thermally-sensitive rotor can cause
excessive generator vibration amplitudes
at normal operating conditions when field current is raised to
increase output voltage (and associated MVAR loading). In most
cases, it will not preclude generator operation. However, it may
limit operation at high field current, or lead to reduced generation
capacity and efficiency. It can also negatively impact long-term
operation due to repeated forced outages.
There are many possible root causes of this problem, including
blocked ventilation and cooling media, shorted turns, coil insulation
degradation due to moisture ingression, and malfunction of the
cooling gas system. Any of these factors that produce a non-
uniform circumferential thermal distribution around the rotor will
cause asymmetric thermal expansion and rotor bow, resulting in an
increase in vibration response (Reference 1).
Appropriate condition monitoring and diagnostic tools are required
to pinpoint the exact root cause such that the appropriate remedial
action can be taken. Experience shows that most generator
rotors have at least some shorted turns – especially if they have
been in service for a long time. This situation is considered to
be acceptable unless it causes excessive vibration amplitude at
normal operating conditions.
This article demonstrates the use of a modern online machine
condition monitoring system to identify a thermally sensitive rotor in
a 100 MW hydrogen-cooled generator unit installed in a combined
cycle power plant. Other technologies (magnetic flux probe testing,
visual inspection and electrical testing) were used to confirm the
diagnosis, leading to the decision to repair the rotor windings.
Oct .2012 • No.4 • Vol .32 ORBIT 3
DEPARTMENTS
CASE HISTORIES
The Site
EGAT’s Bangpakong site is the largest
power generating facility in Thailand
(Reference 2), accounting for more
than 25% of country’s electricity
supply. The plant is located about
100 km from Bangkok in a major
industrial area in the eastern part of
the country. The complex includes
four thermal plant blocks and five
combined cycle plant blocks with a
total installed capacity of 3,680 MW.
The subject unit is a 100 MW, 3000
rpm, hydrogen-cooled generator
driven by a General Electric (GE) Frame
9E heavy duty gas turbine, installed
in one of the combined cycle blocks.
Event HistoryThe generator discussed in this case
study has been in operation since
1992. It was not initially equipped
with eddy current displacement
transducers for measuring shaft
vibration. However, “seismic”
vibration transducers (moving-coil
velocity sensors) were installed on
the bearing caps of both the gas
turbine and generator. The vibration
data was monitored directly by
the machine control system for
machine protection and operation.
Due to a significant non-recoverable
degradation in plant efficiency,
Bangpakong’s management team
planned a major refurbishment to
the gas turbine units of combined
cycle blocks 3 and 4 in 2007.
Project scope included the instal-
lation of machine condition and
performance monitoring systems,
with the following features:
• Eddy current displacement
transducers for measuring
shaft vibration at all gas turbine
and generator bearings (five
measurement planes in total)
plus a Keyphasor* transducer
for measuring vibration phase
angle and machine speed.
• A continuous online machine
condition monitoring system
including a Bently Nevada* 3500
Series vibration monitoring system
with Transient Data Interface (TDI)
module for communicating with a
Bently Nevada System 1* condition
monitoring and diagnostic system.
• An EfficiencyMap* online
performance monitoring
system for equipment and plant
thermodynamic monitoring
and optimization. (The System
1 database is used as the
plant historian data server for
the performance monitoring
calculation engine.)
• The existing GE Mark** IV machine
control system was upgraded
to a Mark VI system. All process
data was exported to the System
1 server for correlating with
vibration and performance
calculation data using GE Standard
Messages (GSM) protocol. For
the steam turbine-generator set,
process data were imported from
the plant’s distributed control
system (DCS) using Modbus®
communication protocol.
The continuous online condition
monitoring system provided value
to EGAT from the very first startup
during ongoing project commis-
sioning when the on-site machinery
diagnostic engineer noticed abnormal
vibration characteristics at the
generator measurement planes.
Vibration amplitudes were very
sensitive to generator MW and MVAR
loads, with levels corresponding
closely to generator loading.
Fluctuating vibration amplitudes
were around 200 to 300 microns
depending on generator load, with
a predominantly synchronous (1X)
vibration frequency component. Plant
personnel were advised to closely
monitor and investigate further
for the root cause. The trend plot
of generator vibration amplitudes
versus load is shown in Figure 1.
Initially, a thermal sensitivity
problem was suspected since the
rotor’s behavior appeared to be
consistent with a thermal bow. As
load increased, the synchronous
vibration vectors at both ends of the
generator remained in-phase with
each other, with increasing amplitude.
This symptom tends to occur when
there is a temperature gradient
across the generator rotor. The higher
temperature side of the rotor expands
more than the lower temperature
side and causes the rotor to bow
when field current increases. There
are many different factors that
can cause thermal sensitivity of a
40 ORBIT Vol .32 • No.4 • Oct .2012
DEPARTMENTS
CASE HISTORIES
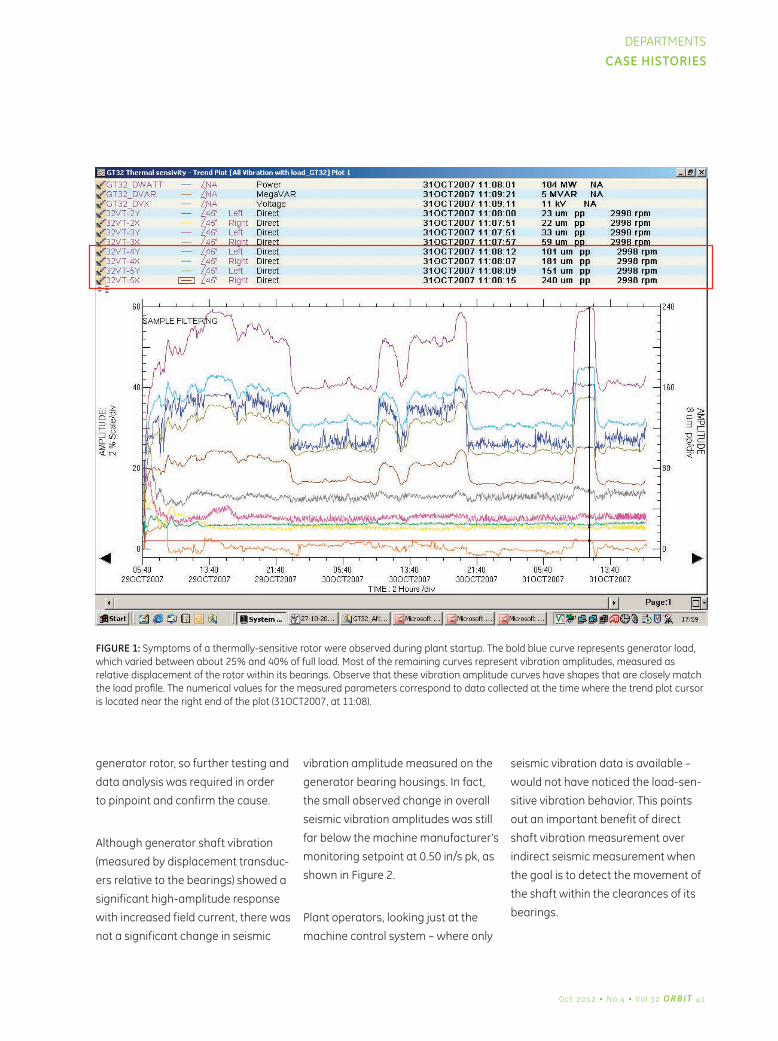
FIGURE 1: Symptoms of a thermally-sensitive rotor were observed during plant startup. The bold blue curve represents generator load, which varied between about 25% and 40% of full load. Most of the remaining curves represent vibration amplitudes, measured as relative displacement of the rotor within its bearings. Observe that these vibration amplitude curves have shapes that are closely match the load profile. The numerical values for the measured parameters correspond to data collected at the time where the trend plot cursor is located near the right end of the plot (31OCT2007, at 11:08).
generator rotor, so further testing and
data analysis was required in order
to pinpoint and confirm the cause.
Although generator shaft vibration
(measured by displacement transduc-
ers relative to the bearings) showed a
significant high-amplitude response
with increased field current, there was
not a significant change in seismic
vibration amplitude measured on the
generator bearing housings. In fact,
the small observed change in overall
seismic vibration amplitudes was still
far below the machine manufacturer’s
monitoring setpoint at 0.50 in/s pk, as
shown in Figure 2.
Plant operators, looking just at the
machine control system – where only
seismic vibration data is available –
would not have noticed the load-sen-
sitive vibration behavior. This points
out an important benefit of direct
shaft vibration measurement over
indirect seismic measurement when
the goal is to detect the movement of
the shaft within the clearances of its
bearings.
Oct .2012 • No.4 • Vol .32 ORBIT 41
DEPARTMENTS
CASE HISTORIES
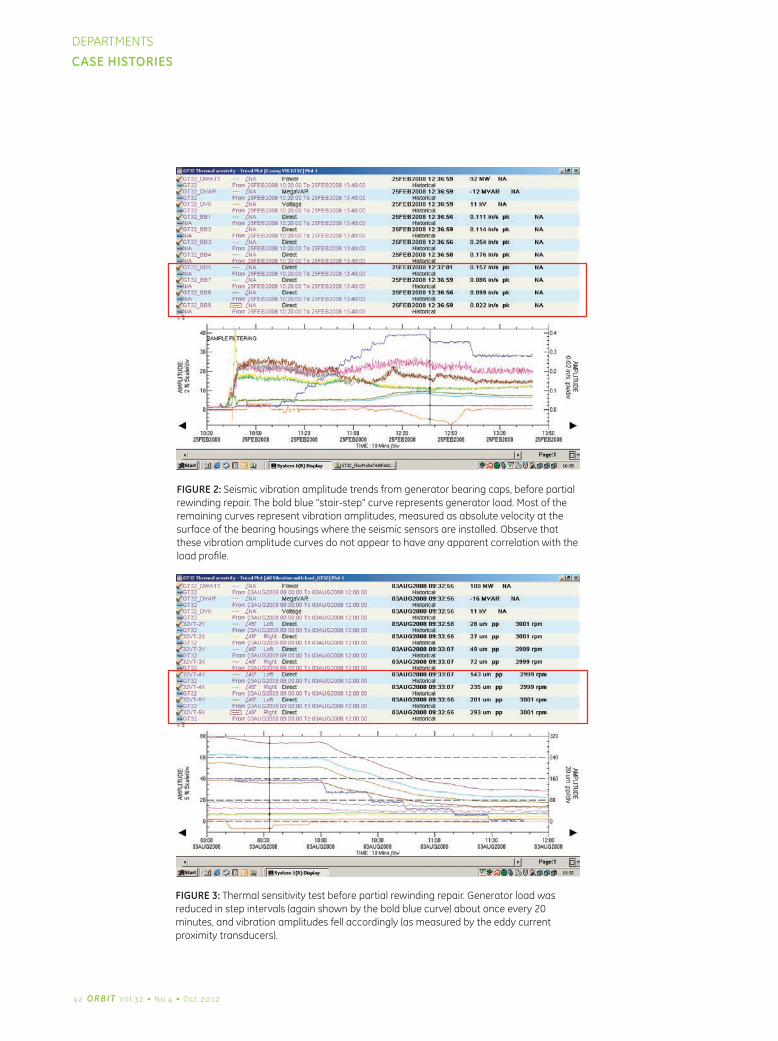
FIGURE 2: Seismic vibration amplitude trends from generator bearing caps, before partial rewinding repair. The bold blue “stair-step” curve represents generator load. Most of the remaining curves represent vibration amplitudes, measured as absolute velocity at the surface of the bearing housings where the seismic sensors are installed. Observe that these vibration amplitude curves do not appear to have any apparent correlation with the load profile.
FIGURE 3: Thermal sensitivity test before partial rewinding repair. Generator load was reduced in step intervals (again shown by the bold blue curve) about once every 20 minutes, and vibration amplitudes fell accordingly (as measured by the eddy current proximity transducers).
42 ORBIT Vol .32 • No.4 • Oct .2012
DEPARTMENTS
CASE HISTORIES
Thermal Sensitivity Testing
In order to confirm the suspected
thermal bowing problem, the unit
was subjected to a thermal sensitivity
test (Figure 3) by deliberately
varying generator load while closely
monitoring vibration data with the
online continuous machine condition
monitoring system. It was found that
vibration amplitudes measured on the
generator were load-dependent, with
amplitude increasing when generator
power and field current increased and
decreasing when load decreased.
The maximum shaft vibration
amplitudes at normal operating
condition exceeded the Zone C limit
of ISO 7919-2 Standard boundary
(260 microns displacement), falling
within Zone D (Reference 3). Vibration
amplitude in this zone is normally
considered of sufficient severity
to cause damage to the machine;
therefore, continued operation in
this zone is not recommended.
The excessive overall vibration
amplitude showed a predominant
synchronous frequency component
due to rotor unbalance caused
by a rotor thermal bow under
increased generator load.
This behavior is caused by
asymmetric thermal distribution
across the generator rotor, resulting in
uneven thermal expansion. Typically,
a localized hot spot on the rotor
forging tends to thermally expand
more than the opposite side of the
rotor, initiating the thermal bow. The
rotor bow amplitude increases with
increasing field current and MW load
since more heat must be dissipated
in the rotor at higher load operation.
In the case of a rotor winding fault
(such as a shorted turn) the localized
heating, and hence rotor deflection,
is closely related to the rotor current.
Root Cause DeterminationFirst, the possibility of asymmetrical
cooling of the generator rotor was
investigated by reviewing on-line
process data of hydrogen gas
temperature measurement at varying
loads over a period of time. This
evaluation showed no correlation
between hydrogen temperature
and generator shaft vibration, so
asymmetrical cooling was eliminated
as a root cause possibility.
The investigation then focused
on a generator rotor shorted turn
scenario. Shorted turns in the
generator rotor are commonly the
results of insulation breakdown
caused by aging and turn-to-turn
movement. The unit was aging, with
a long history of peaking service,
with frequent load changes that
closely match the expected profile
for this failure mode. Other known
mechanisms for thermal bowing of
the rotor include coil foreshortening,
end-strap elongation, inadequate
end-turn blocking, metallic
contamination, and moisture induced
into the generator (Reference 4).
Coil foreshortening refers to an
effect that occurs over a number of
heat-up and cool-down cycles of the
rotor. The copper bars in the rotor
slots expand more than the steel
forging of the rotor during heat-up.
But friction between the bars and
slots – especially near the ends of
the rotor – limits the lengthwise
expansion of the bars, causing the
copper to become compressed
(and plastically deformed, if its yield
strength is exceeded). After the rotor
is stopped and cooled down, the
copper bars contract, pulling the end
windings toward the rotor, which can
cause the end windings to become
misaligned and even cracked.
End-strap elongation is an effect that
is caused by friction between the
winding end-straps and the retaining
rings. The retaining rings increase in
diameter (due to centrifugal force and
thermal expansion) as the generator
is started and loaded. If the friction
force between the top of the end
straps and the insulation on the
retaining rings is too high, the end
straps will move with the retaining
rings as they expand. If the yield
strength of the copper is exceeded,
permanent deformation may occur,
causing them to be elongated. This
cycle can be repeated over and over
as the generator is started, loaded,
unloaded, and stopped over its life.
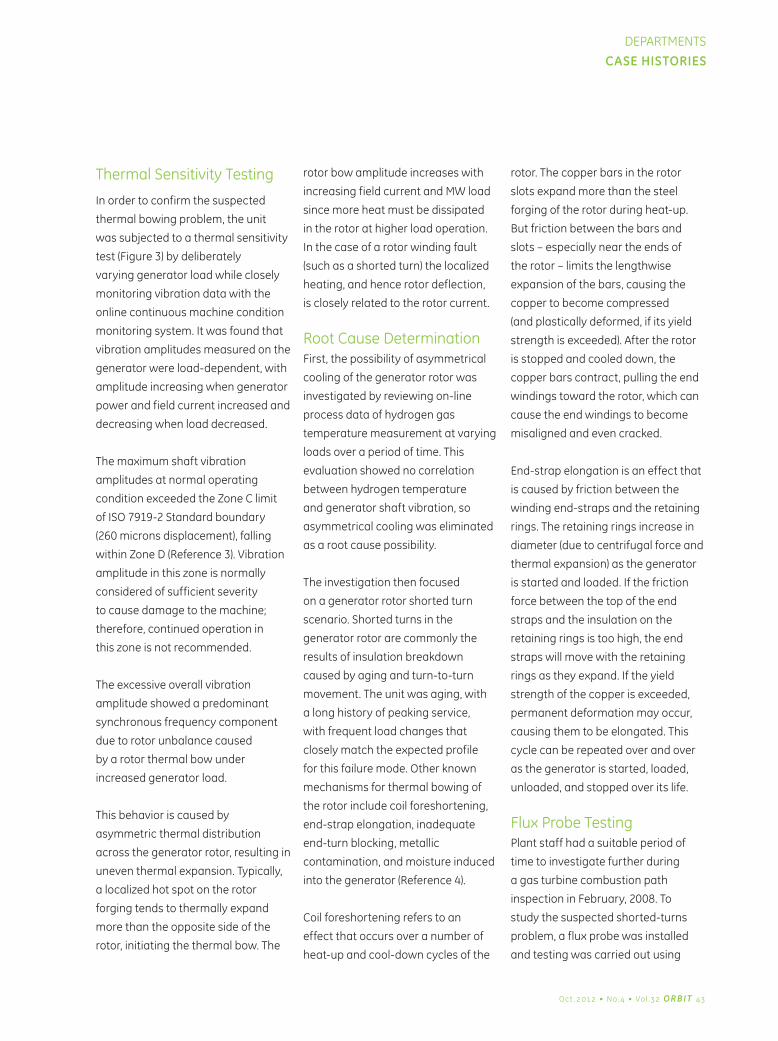
Flux Probe TestingPlant staff had a suitable period of
time to investigate further during
a gas turbine combustion path
inspection in February, 2008. To
study the suspected shorted-turns
problem, a flux probe was installed
and testing was carried out using
Oct .2012 • No.4 • Vol .32 ORBIT 43
DEPARTMENTS
CASE HISTORIES
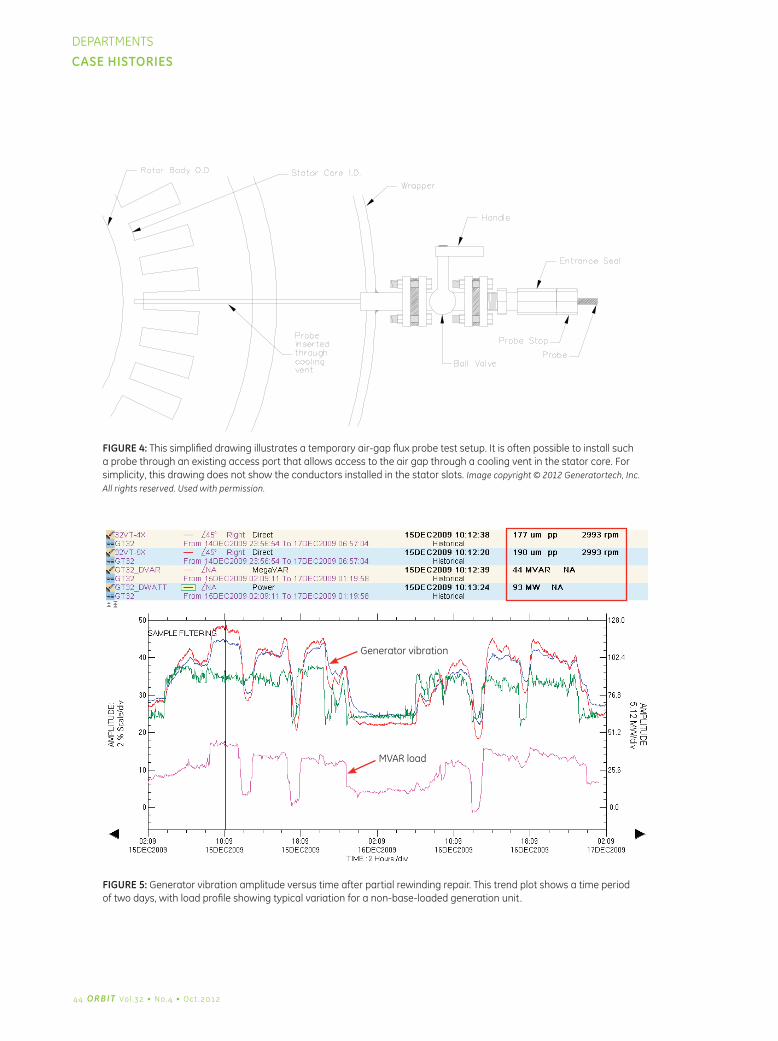
FIGURE 4: This simplified drawing illustrates a temporary air-gap flux probe test setup. It is often possible to install such a probe through an existing access port that allows access to the air gap through a cooling vent in the stator core. For simplicity, this drawing does not show the conductors installed in the stator slots. Image copyright © 2012 Generatortech, Inc. All rights reserved. Used with permission.
FIGURE 5: Generator vibration amplitude versus time after partial rewinding repair. This trend plot shows a time period of two days, with load profile showing typical variation for a non-base-loaded generation unit.
Generator vibration
MVAR load
44 ORBIT Vol .32 • No.4 • Oct .2012
DEPARTMENTS
CASE HISTORIES
sophisticated data acquisition
instrumentation and specialized
data analysis techniques. The flux
probe provides on-line monitoring of
generator magnetic flux across the
air gap when the generator is running
in normal operating conditions.
This method can be used to detect
shorted turns, as it is sensitive to
rate-of-change of radial flux in the
air gap. As each rotor slot passes
the flux probe, the slot leakage flux
from that slot is detected. Rotor
slot leakage flux refers to flux
that does not cross the air gap to
reach the stator winding. Since the
leakage flux does not include stator
current, the leakage flux does not
contribute to power generation
(Reference 4). As shown in Figure
4, the flux probe can be installed
through a suitable fitting on either a
temporary or a permanent basis.
Indications of potential shorted-turns
were found at one turn of coil #2,
three turns of coil #3, and one turn
of coil #7. However, the root cause
could not be confirmed until a visual
inspection could be carried out. At
this time a physical inspection of the
generator rotor assembly could not
be performed due to operational
constraints. The inspection had to
be deferred until the next hot path
inspection, which was not scheduled
to occur until the final quarter of 2008.
Visual Inspection FindingsDuring the subsequent hot gas path
inspection (October to December,
2008), a visual inspection of the
generator windings was performed.
The inspection confirmed the
presence of failed insulation leading
to the already suspected shorted-turn
problem at coils #2 and #3. At these
short circuited locations, electrical
resistance is relatively low, resulting
in low rotor temperature whereas
on the opposite side of the rotor,
where resistance is normal, the
temperature is somewhat higher.
The rotor tends to expand on the
higher temperature side causing
the rotor to thermally bow and
subsequently causing synchronous
vibration to increase (Reference 1).
Since available time during the hot
gas path inspection was very limited,
a full generator rotor rewind repair
could not be carried out, requiring
instead a partial rewind repair of the
rotor. Following the partial repair, the
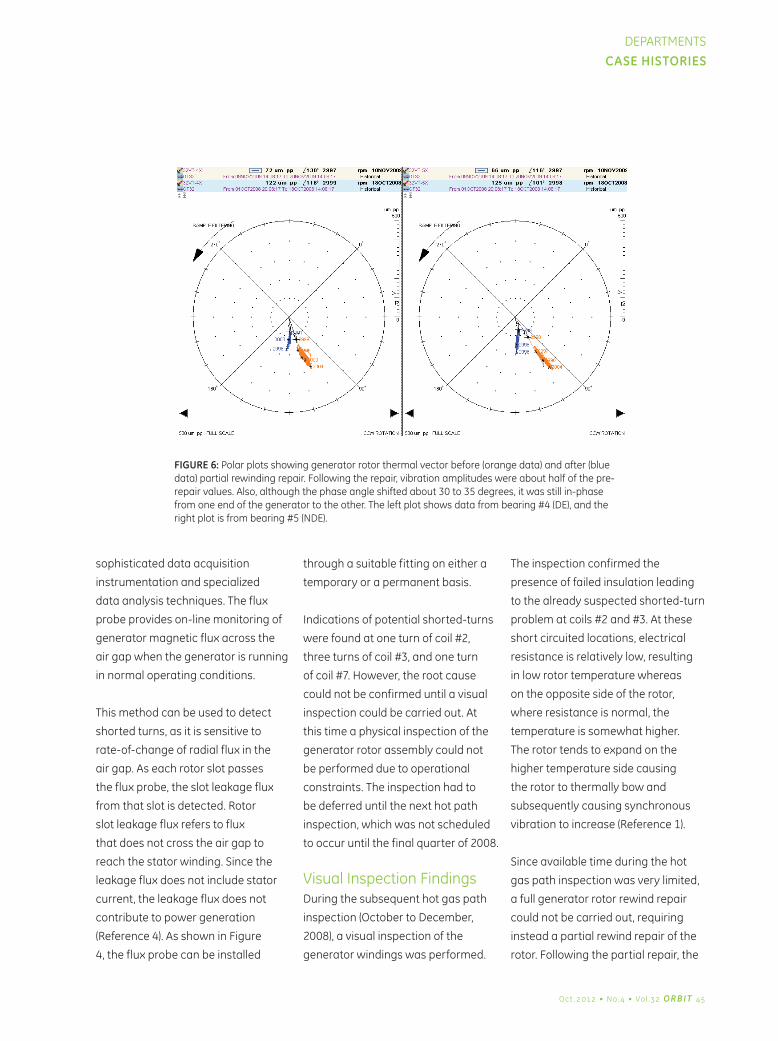
FIGURE 6: Polar plots showing generator rotor thermal vector before (orange data) and after (blue data) partial rewinding repair. Following the repair, vibration amplitudes were about half of the pre-repair values. Also, although the phase angle shifted about 30 to 35 degrees, it was still in-phase from one end of the generator to the other. The left plot shows data from bearing #4 (DE), and the right plot is from bearing #5 (NDE).
Oct .2012 • No.4 • Vol .32 ORBIT 45
DEPARTMENTS
CASE HISTORIES
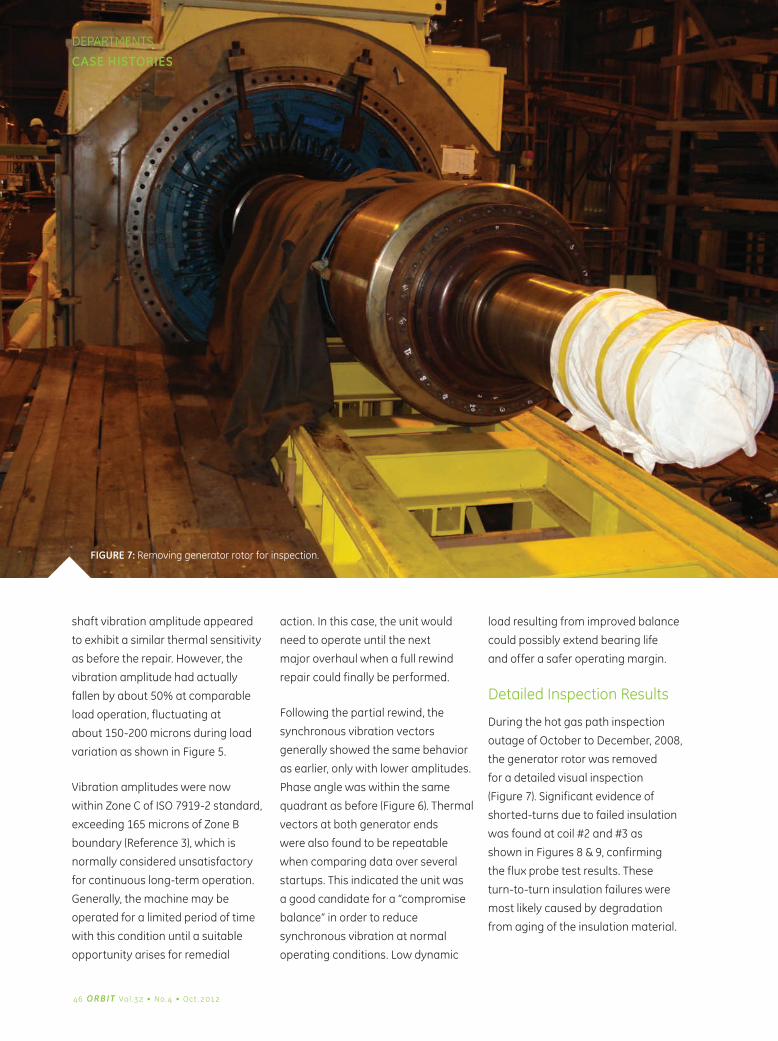
FIGURE 7: Removing generator rotor for inspection.
shaft vibration amplitude appeared
to exhibit a similar thermal sensitivity
as before the repair. However, the
vibration amplitude had actually
fallen by about 50% at comparable
load operation, fluctuating at
about 150-200 microns during load
variation as shown in Figure 5.
Vibration amplitudes were now
within Zone C of ISO 7919-2 standard,
exceeding 165 microns of Zone B
boundary (Reference 3), which is
normally considered unsatisfactory
for continuous long-term operation.
Generally, the machine may be
operated for a limited period of time
with this condition until a suitable
opportunity arises for remedial
action. In this case, the unit would
need to operate until the next
major overhaul when a full rewind
repair could finally be performed.
Following the partial rewind, the
synchronous vibration vectors
generally showed the same behavior
as earlier, only with lower amplitudes.
Phase angle was within the same
quadrant as before (Figure 6). Thermal
vectors at both generator ends
were also found to be repeatable
when comparing data over several
startups. This indicated the unit was
a good candidate for a “compromise
balance” in order to reduce
synchronous vibration at normal
operating conditions. Low dynamic
load resulting from improved balance
could possibly extend bearing life
and offer a safer operating margin.
Detailed Inspection Results
During the hot gas path inspection
outage of October to December, 2008,
the generator rotor was removed
for a detailed visual inspection
(Figure 7). Significant evidence of
shorted-turns due to failed insulation
was found at coil #2 and #3 as
shown in Figures 8 & 9, confirming
the flux probe test results. These
turn-to-turn insulation failures were
most likely caused by degradation
from aging of the insulation material.
46 ORBIT Vol .32 • No.4 • Oct .2012
DEPARTMENTS
CASE HISTORIES
Other inspection results showed
accumulated metallic rust at the end
windings, which could have come
from the generator heater and/
or hydrogen gas cooler, as well as
excessive moisture due to air dryer
and hydrogen purifier malfunction.
Evidence was also found of some
movement of the end windings and
insulation blocks and also of blocked
cooling holes in the rotor – all of
which can contribute generator
rotor thermal sensitivity problems.
However, the major problem in
this case was considered to be the
shorted-turns, hence the partial
rewind repair. A full rewind repair
of the generator rotor was planned
for the next major overhaul.
RecommendationsIt is estimated that more than 50%
of installed generators worldwide
are operating with some shorted-
turns, but the majority of them
have no problem except in the
case where excessive vibration
requires reduced load capacity
and may lead to a forced outage
for remedial work (Reference 5).
The effects of shorted-turns are rotor
thermal unbalance and associated
excessive vibration, higher field
current required for the same load,
higher operating temperature, and
a decrease in power generating
efficiency (Reference 4). Due to
operational constraints, the unit
in this case study was not able to
perform a full generator rotor rewind
repair during the scheduled hot gas
path inspection. Therefore, it had
to return to conditional operation
with close supervisory monitoring.
The Bently Nevada System 1
machinery monitoring platform
is ideally suited to this application
as it monitors real time dynamic
(waveform) vibration data as well as
relevant process data. Also, when
the unit undergoes regular thermal
sensitivity testing, the System 1
software can be used to continuously
monitor and document generator
vibration response throughout the
test. Available data can also be
used for diagnosing any potential
problem as it occurs, as well as for
predictive maintenance planning.
The following recommendations were
made to closely monitor the affected
unit and plan further remedial
actions for the next major overhaul.
• Vibration amplitudes after the
partial rewind repair were reduced
to 220 microns from previous 300
microns at base load of 100 MW
and 30 MVAR. This behavior is
repeatable and therefore can be
addressed through trim balancing.
A compromise trim balance
was therefore recommended to
further reduce the synchronous
vibration amplitude and allow
unrestricted operation.
• In order to promptly identify
any further deterioration of
rotor integrity, vibration data
should be closely monitored
and correlated with relevant
process variables such as MW,
MVAR, field current, field voltage,
generator voltage, cooling gas
temperature, winding temperature.
• Until the full rewinding repair
is able to be performed, it was
recommended that a flux probe test
be conducted every three months
at different load MW and MVAR to
identify any further propagation of
the known shorted-turns problem.
• The rust-affected gas heater
and cooler should be checked for
correct function and scheduled
for replacement, if necessary,
during the major overhaul.
• Ingress of moisture into the
generator should be investigated
and remedial measures
implemented to eliminate the
problem. The hydrogen drying
system and hydrogen gas purifier
should be checked for correct
function. The hydrogen gas dew
point should be maintained
at or below 7.5 deg C when
shut down (Reference 5).
ConclusionsThe identified thermal sensitivity of
the generator rotor does not prevent
it from operation unless excessive
vibration amplitudes at normal
operating condition or significant
capacity constraints, or efficiency
losses, necessitate a forced outage.
Proper diagnosis of this type of
problem requires many disciplines
and integration of diagnostic tools.
Online dynamic vibration data is
required to correctly monitor and
Oct .2012 • No.4 • Vol .32 ORBIT 47
DEPARTMENTS
CASE HISTORIES

FIGURE 8A: Example of shorted turn found at turns 4-5 of coil #2
FIGURE 8B: Example of shorted turn found at turns 4-5 of coil #2
FIGURE 9A: Example of shorted turn found at coil #3.
FIGURE 9B: Example of shorted turn found at coil #3 (looking through magnifier).
48 ORBIT Vol .32 • No.4 • Oct .2012
DEPARTMENTS
CASE HISTORIES
diagnose changes in rotor integrity
over time. This includes monitoring
the change in rotor deflection shape
with thermal bow, dynamic vibration
characteristics, and correlation
with relevant process variables
such as hot and cold cooling gas
temperature, field current, and
generation load (MW and MVAR).
Flux probe installation and associated
test results can be used effectively to
validate a suspected shorted-turns
problem and distinguish it from
other possible factors which might
cause similar vibration behavior,
for example, blocked ventilation,
asymmetrical cooling, insulation
variation, wedge fit, distance block
fitting, retaining ring assembly
movement, tight slots, and heat
sensitive rotor forging (Reference 1).
Finally, the on-line condition
monitoring system can be beneficial
for real time machine condition
assessment and prompt identification
of any developing problems.
AcknowledgementsThis work would not have been
completed without many significant
supporters. The authors would like
to sincerely thank the management
of EGAT Bangpakong power plant
for their support and permission to
publish this practical case study,
and the Bently Nevada Asset
Condition Monitoring team for their
excellent work on this project.
References
1. Zwoysky, R.J., and Genovese, W.M.,
2001, Generator Rotor Thermal
Sensitivity - Theory and Experience,
GER-3809, GE Power Systems.
2. Electricity Generating Authority
of Thailand (EGAT), 2009, Bang
Pakong Power Plant. General
information retrieved July, 2012
from http://www.egat.co.th/
3. International Standard ISO
7912-2, Mechanical vibration –
Evaluation of machine vibration
by measurements on rotating
shafts – Part 2: Land-based steam
turbines and generators in excess
of 50 MW with normal operating
speeds of 1500 r/min, 1800 r/
min, 3000 r/min and 3600 r/min.
Second edition, 2001-11-15.
4. Albright, D.J., Albright, D.R., and
Albright, J.D., 1999, Flux Probes
Provide On-Line Detection of
Generator Shorted Turns, Power
Engineering, September.
5. Albright, D.J., and Albright,
D.R., 2003, Generator Field
Winding Short Turns: Moisture
Effects, EPRI – Steam Turbine-
Generatortech Workshop and
Vender Exposition, Nashville, TN.
Additional References
• Albright, D.J., and Albright, D.R.,
Generator Field Winding Short
Turns: Observed Condition and
Causes, Advanced Generator
Maintenance Technology Seminar,
Retrieved January 29, 2010 from
http://www.generatortech.com/.
• Albright, D.R., 1970, Interturn
Short-Circuit Detection for Turbine-
Generator Rotor Windings, Institute
of Electrical and Electronics
Engineers Summer Power
Meeting and EHV Conference.
• Albright, D.J., Albright, D.R., and
Albright, J.D., Generator Winding
Shorted Turn Detection Technology,
Retrieved January 29, 2010 from
http://www.generatortech.com/.
Modbus is a registered trademark of Modicon, Inc. (Schneider Automation International).
* Denotes a trademark of Bently Nevada, Inc., a wholly owned subsidiary of General Electric Company.
** Denotes a trademark of General Electric Company.
Copyright © 2012 General Electric Company, all rights reserved.
Oct .2012 • No.4 • Vol .32 ORBIT 4
DEPARTMENTS
CASE HISTORIES

ON A FISHING TRIP IN YELLOWSTONE NATIONAL PARK
50 ORBIT Vol .32 • No.4 • Oct .2012

lookingforwardto45moreyears!Phil Hanifan | Bently Nevada Chief Engineer (retired)Phil Hanifan has recently retired after 45 years with the Bently Nevada team. Before he headed off to his new adventures, he left us with some nuggets of wisdom — Editor
As I consider my upcoming
retirement, I look forward
to many enjoyable years
in that new endeavor – so I am
reluctant to look back, preferring
the anticipation of the unknown
rather than reliving the past.
However, sometimes it is worth
making an exception to that rule,
and I would like to review some of
the pleasantries of my decades of
work experience with the Bently
Nevada team. That work experience
was (and still is) based upon several
simple but profound principles that
were first presented at a seminar
at the Harvard Business School;
Safety, Quality, Timeliness, Cost.
1 Safety – Keep the safety of
yourself, your people and your
customers as your first priority.
2 Quality – Your customers
deserve and expect your
absolute best performance.
3 Timeliness – Stick to
your word and have an
excellent say-do ratio
as close to one as possible.
4 Cost – Eliminate waste and
non-productive activity.
GE’s Bently Nevada* Asset
Condition Monitoring business
elected to follow these principals
– in this order of priority.
To elaborate on these principles
with respect to design, never make a
design that violates safety principles,
always take the time to do the design
right, spend the extra time, hours or
dollars to meet your commitments
(strive for a say-do ratio of 100%) and
constantly eliminate wasted activities.
Bently Nevada (BN) exemplified those
priorities under our original owner,
Don Bently, and we have continued to
do so under the management of the
General Electric Company. Although
these are simple principles to state,
it is not quite as easy to learn how to
demonstrate them in the business
environment. Some past examples
may be useful for illustration.
SafetyBently Nevada employees were
constantly reminded by our owner
that we provide products that
meet our customers’ needs – not
necessarily their wants. The method
utilized to assure a proper product
offering was to design based
upon engineering principals.
One principal that we learned early
in our BN history was that proper
protection of light high speed
machine rotors required directly
measuring the shaft vibration with
eddy current sensors rather than
attempting to measure the motion
of a massive casing and assuming
that such a measurement properly
represented the shaft motion.
However, a large and very important
order opportunity was presented to
us with a specification that precluded
the use of eddy current transducers.
While we were in the process of
developing a proposal without eddy
current probes, Mr. Bently walked
into the conference room and asked
what was going on. When we told
him that we were contemplating
a quotation without eddy current
probes, we were suddenly presented
with a new question: “Where are
you guys working next week?”
This question was sufficient incentive
for us to develop a quotation
recommending eddy current probes
– with casing measurements as an
additional measurement, rather than
the primary protection parameter.
We lost that order to a competitor
and Mr. Bently congratulated the
team for doing the right thing. In
less than a year, the customer
Oct .2012 • No.4 • Vol .32 ORBIT 51
DEPARTMENTS
FROM THE DESK OF

suffered a high vibration event on the
monitored machine, which resulted
in complete destruction of the rotor.
We received a subsequent quotation
request from them to retrofit all
similar installed machines with eddy
current systems for protection.
Lesson Learned: It is always
best to base our response to
an order on sound engineering
principles, even if it results in the
order being lost at the time.
QualityA process change implemented in the
BN circuit board assembly process
in the early 1970s inadvertently left
contaminants on the printed wiring
assemblies. When installed in a high
humidity location, the contaminant
activated – causing the integrated
circuits to fall off the boards. We
began getting calls from customers
that these components, specifically
the LM301 (general purpose) Op
Amps, were rattling around in
the bottom of the enclosure!
We performed an immediate
investigation, and when we
discovered and eliminated the
root cause, we searched our serial
number records to locate every
customer who purchased systems
with this defect. All customers were
contacted and visited by our Field
Service technicians and all circuit
boards were replaced free of charge.
The expense was considerable
but this was the performance that
was expected by our owner.
Years later at a customer seminar I
was talking with several customers.
One of them said, “We hardly knew
who Bently Nevada was when a
Bently Field Technician knocked on
the plant door and said ‘You have
a machine with a Bently Nevada
vibration monitor installed on it and
we are here to fix a potential problem
with the monitor.’ It was rarely heard
of at that time that a supplier would
fix known problems, much less come
visit your site and fix a potential
problem we didn’t even know about
yet. That sold us on Bently Nevada!”
Lesson Learned: What had initially
looked like a business-ending
mistake yielded benefits as an
opportunity to prove that we stood
behind the quality of our products.
TimelinessDelivery time or completion time is
easy to measure so it is often the first
and worse yet, the only parameter
measured. This automatically places
Timeliness ahead of Safety and
Quality unless those parameters
are measured with equal precision,
which nearly never happens.
Therefore, one should never establish
a timeliness measure unless equal
or, better yet, greater emphasis
is placed on safety and quality.
An example of placing the “em-PHA-
sis” on the wrong “syl-AH-ble”
was a strict measure of work
center timeliness placed on the
BN manufacturing line when I was
Manufacturing Manager. There
had been chronic problems with
late work order completion which
cascaded into late assembly and test
work and ultimately late customer
delivery. My Production Control
Manager and I decided that we
would have a timeliness meeting
every Monday morning with the
General Manager. Every work center
supervisor who had late work orders
would have to appear and explain
the causes for the late deliveries.
After a while, the number of late work
orders decreased dramatically.
However, at nearly the same time,
customer complaints of “out-of-
the-box” quality problems began
to arise. We were perplexed by
the quality problems since every
circuit board was not only tested
but run through a 72 hour elevated
temperature burn cycle before
“ …SEVERAL SIMPLE BUT PROFOUND PRINCIPLES…WERE FIRST PRESENTED AT A SEMINAR AT THE HARVARD BUSINESS SCHOOL; SAFETY, QUALITY, TIMELINESS, COST. GE’S BENTLY NEVADA ASSET CONDITION MONITORING BUSINESS ELECTED TO FOLLOW THESE PRINCIPALS – IN THIS ORDER OF PRIORITY.”
52 ORBIT Vol .32 • No.4 • Oct .2012
DEPARTMENTS
FROM THE DESK OF

being installed into the customer’s
final product. The customer’s final
product was then also fully tested
before shipment. So why were we
seeing these quality issues?
One evening at about 7:00 p.m.,
the Production Control Manager
and I decided to see how the swing
shift was doing. In the process of
reviewing the board test and burn-in
work center we saw three separate
boxes of circuit cards. We asked the
operator, “Why the three boxes?”
The answer was, “Box 1 has boards
that were fully tested and burned-in.
Box 2 has boards that were tested
and are ready for burn-in and Box 3
has boards that are not yet tested.”
We noted that Box 3 contained the
most boards and asked, “Will you
get all of this done on this shift?” The
operator said, “Yes, all boards will
be moved to the next work center
at the end of this shift whether they
were fully tested and burned-in
or not because we have a strict
measurement of timeliness and no
one wants to be called into the GMs
office to explain a late work order.”
Lesson Learned: Obviously, we
found at least part of the source of
our quality problems. When more
emphasis is placed on timeliness
than on quality, quality problems
will reach your customer.
Cost
Lack of understanding of cost
elements can lead to unsound
decisions. A ten cent component
purchased from a “bargain basement”
supplier can incur thousands of
dollars in cost to rectify the damage
caused by that misplaced priority.
Early in Bently Nevada history we
frequently questioned some of the
suppliers and the fact that they may
not have been the lowest-priced
option. However, in discussions with
our owner, he made it perfectly clear
that we were to use the best possible
quality product and not the cheapest
thing we could get our hands on.
One day we were presenting a
significant contract to purchase
integrated circuits from a Japanese
supplier. At that time, the prevailing
perception was that Japanese
quality was very low (this was prior
to the Japanese industries adopting
the quality principles taught by W.
Edward Deming and other world
renowned quality leaders). Mr. Bently
immediately called us in his office
and questioned us, saying, “Why are
you buying this Japanese stuff? I told
you I want the best quality parts!”
After we recovered from this assault,
we carefully showed him the industry
data and engineering studies
demonstrating that the Japanese
quality was actually exceeding the
quality of American suppliers at that
time in our history. When presented
with the data, the owner recognized
that he was going to have to change
his outdated perspective of where
the highest quality products were
being manufactured. He allowed the
purchasing agreement to proceed.
Other incidents where cost was
considered in a different perspective
involved providing Field Service
to our customers. We recognized
that the production output of the
machinery that our equipment
monitored and protected often far
outweighed the cost of our installed
monitoring products, and that if our
products were not fully operational,
we could delay the monitored
machinery from going on line.
More than once, we received an
urgent customer call for Field Service
support to get our equipment
installed, calibrated and on-line,
but there was not time to process
a customer purchase order for
the requested service. The owner
directed us to “do what is right for the
customer” and added that if we did
our job right, getting a purchase order
after the fact was going to be easy.
Lesson Learned: This proved to
be the case in many instances,
establishing a high degree of trust
and confidence in the work of Bently
Field Service organization and
resulting in many repeat orders.
* Denotes a trademark of Bently Nevada, Inc., a wholly owned subsidiary of General Electric Company.
Copyright © 2012 General Electric Company. All rights reserved
Oct .2012 • No.4 • Vol .32 ORBIT 53
DEPARTMENTS
FROM THE DESK OF

collectingslowrollreferencedata
Michael Thevanh
Bently Nevada Field Application Engineer (FAE)
DEAR SYSTEM 1 USER, In this issue, we’ll show you how to
collect slow roll reference data. Slow
roll data is collected from proximity
probes observing a rotating shaft
when the rotational speeds are too
slow to contribute any meaningful
rotor-dynamic effects in the signal.
Using slow roll reference data can be
helpful when diagnosing a machine
issue. It lets you remove unwanted
runout to get a better picture of the
machine at running speed, but this
technique should be used with caution.
At the end of this article you will find a
reference to an Orbit article describing
the use of slow roll data in detail.
We hope you enjoy this issue!
Sincerely,
Your FAE Team
54 ORBIT Vol .32 • No.4 • Oct .2012
DEPARTMENTS
SYSTEM 1* SOFTWARE TIPS & TRICKS
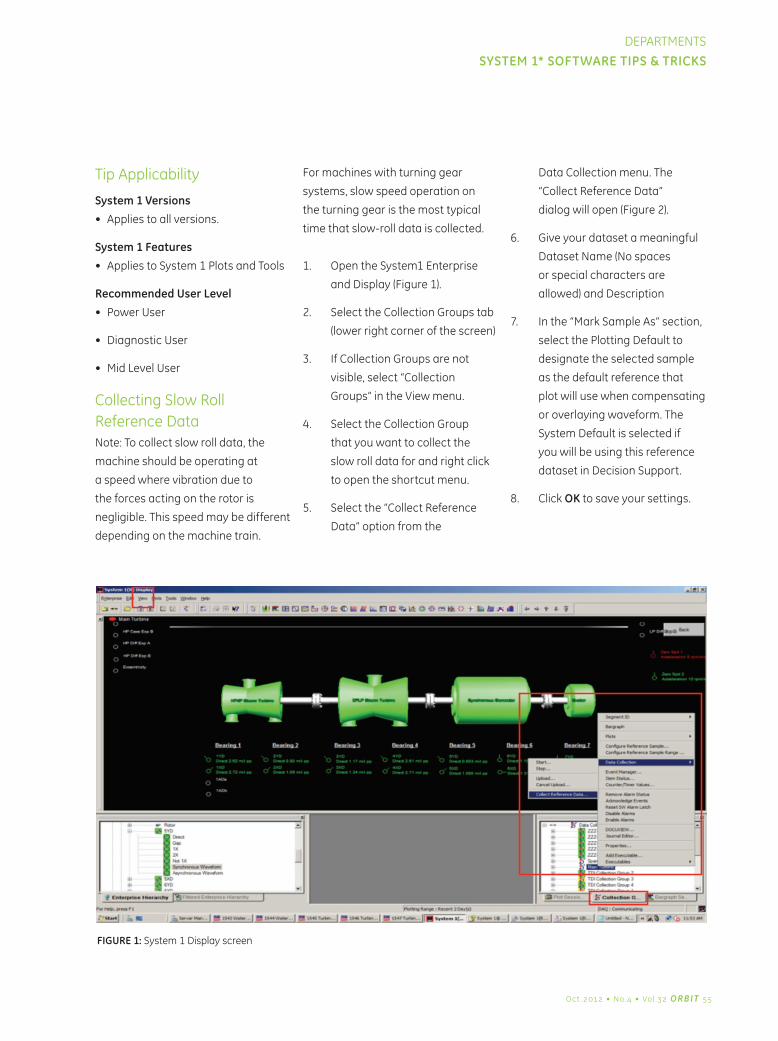
Tip Applicability
System 1 Versions
• Applies to all versions.
System 1 Features
• Applies to System 1 Plots and Tools
Recommended User Level
• Power User
• Diagnostic User
• Mid Level User
Collecting Slow Roll Reference DataNote: To collect slow roll data, the
machine should be operating at
a speed where vibration due to
the forces acting on the rotor is
negligible. This speed may be different
depending on the machine train.
For machines with turning gear
systems, slow speed operation on
the turning gear is the most typical
time that slow-roll data is collected.
1. Open the System1 Enterprise
and Display (Figure 1).
2. Select the Collection Groups tab
(lower right corner of the screen)
3. If Collection Groups are not
visible, select “Collection
Groups” in the View menu.
4. Select the Collection Group
that you want to collect the
slow roll data for and right click
to open the shortcut menu.
5. Select the “Collect Reference
Data” option from the
Data Collection menu. The
“Collect Reference Data”
dialog will open (Figure 2).
6. Give your dataset a meaningful
Dataset Name (No spaces
or special characters are
allowed) and Description
7. In the “Mark Sample As” section,
select the Plotting Default to
designate the selected sample
as the default reference that
plot will use when compensating
or overlaying waveform. The
System Default is selected if
you will be using this reference
dataset in Decision Support.
8. Click OK to save your settings.
FIGURE 1: System 1 Display screen
Oct .2012 • No.4 • Vol .32 ORBIT 55
DEPARTMENTS
SYSTEM 1* SOFTWARE TIPS & TRICKS
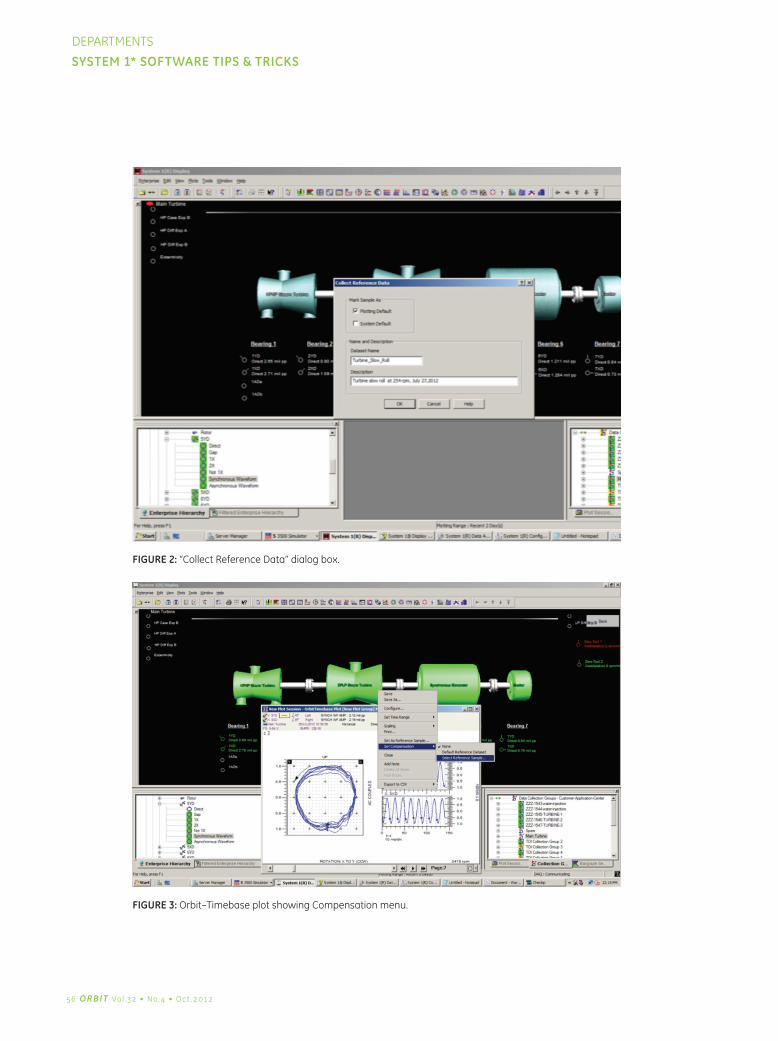
FIGURE 2: “Collect Reference Data” dialog box.
FIGURE 3: Orbit–Timebase plot showing Compensation menu.
56 ORBIT Vol .32 • No.4 • Oct .2012
DEPARTMENTS
SYSTEM 1* SOFTWARE TIPS & TRICKS
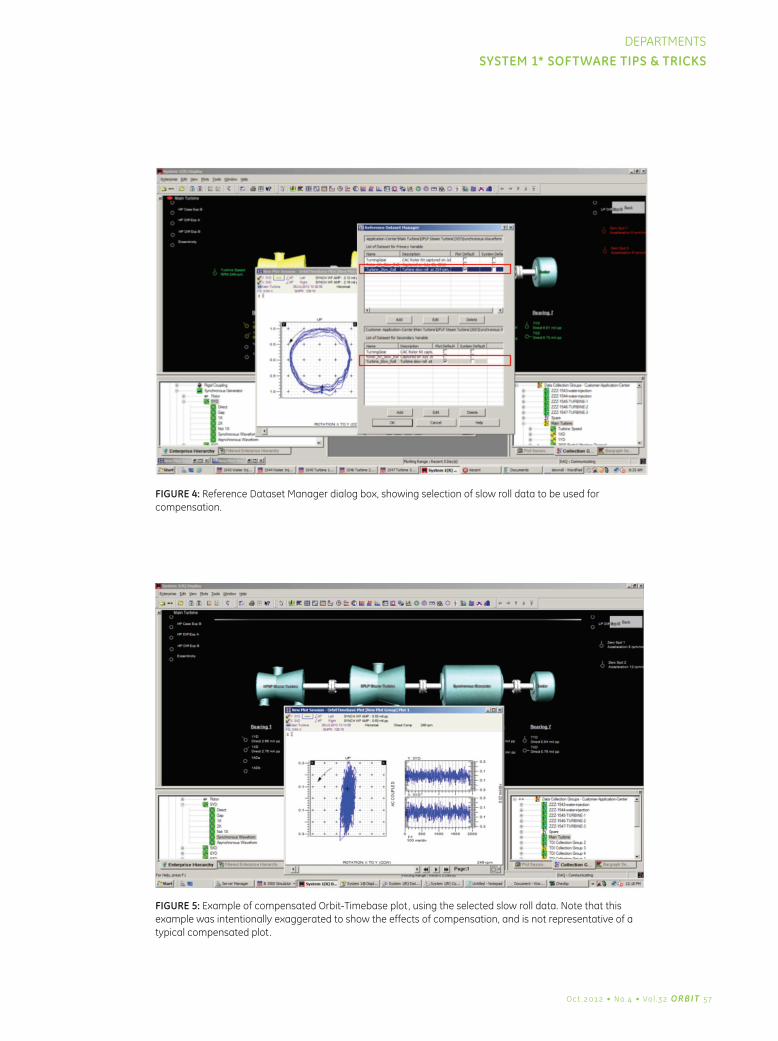
FIGURE 4: Reference Dataset Manager dialog box, showing selection of slow roll data to be used for compensation.
FIGURE 5: Example of compensated Orbit-Timebase plot, using the selected slow roll data. Note that this example was intentionally exaggerated to show the effects of compensation, and is not representative of a typical compensated plot.
Oct .2012 • No.4 • Vol .32 ORBIT 57
DEPARTMENTS
SYSTEM 1* SOFTWARE TIPS & TRICKS

Note: It is possible to obtain slow roll data from a historical transient (machine startup or
coast-down) file if the machine cannot be shut down to capture slow roll data while it is
running on the turning gear. These steps will be described in a future article
Using Slow Roll Data for Compensation
Open an Orbit Plot (Figure 3) for the machine of interest.
Right click in the plot and select Set Compensation, Select Reference Sample from
the shortcut menu. This will open the Reference Dataset Manager dialog (Figure 4).
In the “List of Dataset for Primary Variable” section, select the appropriate
reference sample, and select the Plot Default check box.
For paired and full spectrum plots, you can specify a Reference Dataset
for each primary (Y Probe) and secondary (X Probe) variable.
Click OK to apply your settings to the plot. The dialog box will
close and the plot will once again be visible (Figure 5).
ReferenceOrbit Vol. 27 No. 2, 2007. Maalouf, Mel, “Slow-Speed Vibration Signal Analysis.”
http://www.ge-mcs.com/download/orbit-archives/orbit_v27n207_slowroll.pdf
* Denotes a trademark of Bently Nevada, Inc., a wholly owned subsidiary of General Electric Company.
Copyright © 2012 General Electric Company. All rights reserved.
1
2
3
4
5
58 ORBIT Vol .32 • No.4 • Oct .2012
DEPARTMENTS
SYSTEM 1* SOFTWARE TIPS & TRICKS


comingattractionsWe will start the new year with a “back-to-basics” issues on Transducers. We invite you to join us in January for a discussion of this important topic.
Copyright © 2012 General Electric Company. All rights reserved.
GEA20093 (10/2012)
archivedorbitarticlesIf you have Internet access, you can search our digital back issues and download PDF files of articles that are interesting to you. From 2009 back to 1980, we have posted links to selected articles. But starting in 2010, every page of each issue is available – both as an online e-reader version, and a downloadable PDF file.
Note that with the JUL 2012 issue, we have started uploading a high-resolution file, rather than the low-resolution files that we posted previously. The smaller files download more quickly, but some of the finer details in graphics such as data plots are easier to see in the high-resolution files. We think it is worth a slightly longer download time to make the higher-quality file available.
Vist us today!
www.orbit-magazine.com


