Embed Size (px)
Citation preview

Text-independent speaker recognition using non-linear framelikelihood transformation
Konstantin P. Markov *, Seiichi Nakagawa
Department of Information and Computer Sciences, Toyohashi University of Technology, Toyohashi, 441-8122, Japan
Received 27 January 1997; received in revised form 3 November 1997; accepted 27 February 1998
Abstract
When the reference speakers are represented by Gaussian mixture model (GMM), the conventional approach is to
accumulate the frame likelihoods over the whole test utterance and compare the results as in speaker identi®cation or
apply a threshold as in speaker veri®cation. In this paper we describe a method, where frame likelihoods are trans-
formed into new scores according to some non-linear function prior to their accumulation. We have studied two fam-
ilies of such functions. First one, actually, performs likelihood normalization ± a technique widely used in speaker
veri®cation, but applied here at frame level. The second kind of functions transforms the likelihoods into weights ac-
cording to some criterion. We call this transformation weighting models rank (WMR). Both kinds of transformations
require frame likelihoods from all (or subset of all) reference models to be available. For this, every frame of the test
utterance is input to the required reference models in parallel and then the likelihood transformation is applied. The
new scores are further accumulated over the whole test utterance in order to obtain an utterance level score for a given
speaker model. We have found out that the normalization of these utterance scores also has the e�ect for speaker ver-
i®cation. The experiments using two databases ± TIMIT corpus and NTT database for speaker recognition ± showed
better speaker identi®cation rates and signi®cant reduction of speaker veri®cation equal error rates (EER) when the
frame likelihood transformation was used. Ó 1998 Elsevier Science B.V. All rights reserved.
ReÂsumeÂ
Quand les locuteurs de r�ef�erence sont repr�esent�es par un mod�ele de m�elange de gaussiennes, l'approche convention-
nelle est d'accumuler les probabilit�es de trame sur l'�enonc�e de test entier et de comparer les r�esultats pour l'identi®cation
du locuteur ou d'appliquer un seuil pour la v�eri®cation du locuteur. Dans cet article, nous d�ecrivons une m�ethode dans
laquelle les probabilit�es de trame sont transform�ees, avant d'etre somm�ees, en de nouveaux scores, suivant une certaine
fonction non-lin�eaire. Nous avons �etudi�e deux familles de fonctions. La premi�ere e�ectue de fait une normalisation des
probabilit�es ± une technique largement utilis�ee en v�eri®cation du locuteur ±, mais qui est appliqu�ee ici au niveau des�etats. Le deuxi�eme type de fonctions transforme les probabilit�es en poids, suivant un certain crit�ere. Nous appelons
cette transformation ``Weighting Models Rank'' (WMR). Les deux types de transformations requi�erent de pouvoir dis-
poser de tous (ou d'un sous-ensemble de tous) les mod�eles de r�ef�erence. Pour obtenir ceci, chaque trame de l'�enonc�ed'entr�ee est incorpor�ee en parall�ele dans les mod�eles de r�ef�erence requis, puis la transformation des probabilit�es est
appliqu�ee. Les nouveaux scores sont ensuite accumul�es sur l'ensemble de l'�enonc�e pour obtenir un score de l'�enonc�epour un mod�ele de locuteur donn�e. Nous avons trouv�e que la normalisation de ces scores d'�enonc�es est �egalement
Speech Communication 24 (1998) 193±209
* Corresponding author. Tel.: +81 532 44 6777; fax: +81 532
44 6777.
0167-6393/98/$19.00 Ó 1998 Elsevier Science B.V. All rights reserved.
PII: S 0 1 6 7 - 6 3 9 3 ( 9 8 ) 0 0 0 1 0 - 7

e�cace pour la v�eri®cation du locuteur. Des exp�eriences ont �et�e men�ees sur deux bases de donn�ees ± TIMIT et la base
de donn�ees de NTT pour la reconnaissance du locuteur. Les r�esultats montrent des taux d'identi®cation du locuteur
plus �elev�es et une r�eduction notable du taux d'�egale erreur (EER) en v�eri®cation du locuteur quand les transformations
des probabilit�es de trames sont utilis�ees. Ó 1998 Elsevier Science B.V. All rights reserved.
Keywords: Speaker identi®cation; Speaker veri®cation; Likelihood normalization; Frame level normalization
1. Introduction
Speaker recognition has been a research topicfor many years and various types of speaker mod-els have been studied. Hidden Markov models(HMM) have become the most popular statisticaltool for this task. The best results have been ob-tained using continuous HMM (CHMM) formodeling the speaker characteristics (Savic andGupta, 1990; Furui, 1991; Rosenberg et al.,1991, 1994; Matsui and Furui, 1992). For thetext-independent task, where the temporal se-quence modeling capability of the HMM is not re-quired, one state CHMM, also called a Gaussianmixture model (GMM), has been widely used asa speaker model (Tseng et al., 1992; Reynoldsand Rose, 1995; Gish and Schmidt, 1994; Bimbotet al., 1995; Matsui and Furui, 1995). In accor-dance with (Matsui and Furui, 1992) our previousstudy (Markov and Nakagawa, 1995) showed thatGMM can perform even better than CHMM withmulti-states.
The objective of the speaker identi®cation is to®nd a speaker model ki given the set of referencemodels K � fk1; . . . ; kNg and sequence of test vec-tors (or frames) X � fx1; . . . ; xTg which gives themaximum a posteriori probability P �kjX �. This re-quires the calculation of all P �kjjX �; j � 1; . . . ;N ;and ®nding the maximum among them. In speakerveri®cation, only the claimant speaker's model kc
is used and P �kcjX � is compared with a predeter-mined threshold in order to accept or reject X asbeing uttered from the claimant speaker.
In most of the tasks, it is possible to use the like-lihood p�X jk� instead of P �kjX � which does not re-quire prior probabilities P �k� to be known.Another simplifying assumption is that the se-quence of vectors, X ; are independent and identic-ally distributed random variables. This allows toexpress p�X jk� as (Duda and Hart, 1973)
p�X jk� �YT
t�1
p�xtjk�; �1�
where p�xtjk� is the likelihood of single frame xt giv-en model k. This is a fundamental equation of sta-tistical theory and is widely used in speechrecognition. Generally speaking, p�X jk� is an utter-ance level score of X given model k obtained fromframe level scores p�xtjk� using Eq. (1). Obviously,another ways of de®ning such scores can exist.
Our approach is based on the following de®ni-tion of the utterance level score:
Sc�X jk� �YT
t�1
Sc�xtjk� �YT
t�1
f �p�xtjk��; �2�
where f � � is some function of frame likelihoodsp�xtjk� that transforms them into new scoresSc�xtjk�. Actually, when this function is of the typef �x� � x, Eq. (2) becomes equivalent to Eq. (1).As it will be discussed in Section 6.1 any lineartype of f � � does not lead to reduction of the rec-ognition errors. That is why we have considerednon-linear likelihood transformations.
The ®rst family of such functions we have ex-perimented with essentially performs likelihoodnormalization, but now applied at the frame level.The likelihood normalization approach has beensuccessfully used at the utterance level for speakerveri®cation (Reynolds, 1995a; Rosenberg et al.,1992; Matsui and Furui, 1995; Higgins et al.,1991) but is usually not used for speaker identi®-cation purposes. This is simply because, as shownin Section 6.2, when applied only once at theutterance level likelihoods, it is a meaninglessoperation. Gish and Schmidt (1994) have shownthat when the speaker scores are computed overrelatively short time intervals (segments of the ut-terances) likelihood normalization may be success-ful. In their system each speaker is represented bymultiple uni-modal Gaussian models (a special
194 K.P. Markov, S. Nakagawa / Speech Communication 24 (1998) 193±209

case of a GMM) trained on data from di�erent ses-sions, and only the best model's score for eachspeaker over a given segment is taken into ac-count. The segment scores are further normalizedin order to obtain meaningful comparison betweensegments. Our method, however, di�ers from thisstudy in two main points. First, in our system eachspeaker is represented by only one GMM and, sec-ond, likelihood normalization is done on eachframe instead of short time intervals.
The second family of likelihood transformationsconverts the frame likelihood p�xtjk� into one of aset of predetermined weights wj; j � 1; . . . ;N . Thistype of transformation requires likelihoods fromall reference models p�xtjkj� given the current frameto be calculated and sorted. Here we introduce thevariable rk called rank of the model, which corre-sponds to the position of its likelihood in the sortedlist and is an integer number ranging from 1 to N .Weights are function of the ranks rk,
w�rk� � g�rk�; �3�where g� � is some function of integer argument.Obviously, we can calculate all possible weightsw in advance knowing the form of g� � and thenumber of reference speakers N . Since weightsand models ranks are involved in this type of like-lihood transformation, we call it the weightingmodels rank (WMR) technique.
The rest of the paper is organized as follows.Section 2 gives brief description of the GMM weused. Section 3 provides details of speaker identi®-cation and veri®cation tasks. Section 4 explains indetail our likelihood transformation approach.Section 5 describes our speech databases and sum-marizes our experimental results. In Section 6 wepresent some discussions and analysis of our meth-od. Finally, we draw some conclusions in Section 7.
2. Gaussian mixture model
A GMM is a weighted sum of M componentdensities and is given by the form (Reynolds andRose, 1995)
p�xjk� �XM
i�1
cibi�x�; �4�
where x is a d-dimensional random vector,bi�x�; i � 1; . . . ;M , is the component density andci; i � 1; . . . ;M , is the mixture weight. Each com-ponent density is a d-variate Gaussian functionof the form
bi�x�
� 1
�2p�d=2jRij1=2exp ÿ 1
2�xÿ li�TRÿ1
i �xÿ li�� �
;
�5�with mean vector li and covariance matrix Ri. Themixture weights satisfy the constraint thatXM
i�1
ci � 1: �6�
The complete Gaussian mixture model is pa-rameterized by the mean vectors, covariance ma-trices and mixture weights from all componentdensities. These parameters are collectively repre-sented by the notation
k � ci; li;Rif g; i � 1; . . . ;M : �7�In our speaker recognition system, each speaker
is represented by such a GMM and is referred to byhis/her model k. GMM parameters are estimatedusing the standard maximum likelihood estimation(MLE) method via the expectation maximization(EM) algorithm (Dempster et al., 1979).
For a sequence of T test vectors X � x1; x2;. . . ; xT , the standard approach is to calculate theGMM likelihood as in Eq. (1) which can be writ-ten in the log domain as
L�X jk� � log p�X jk� �XT
t�1
log p�xtjk�: �8�
3. Speaker recognition tasks
3.1. Speaker identi®cation
Given a sample of a speech utterance, speakeridenti®cation is to decide to whom of a group ofN known speakers this utterance belongs. In theclosed set problem, it is assured that it belongs toone of the registered speakers.
K.P. Markov, S. Nakagawa / Speech Communication 24 (1998) 193±209 195

As mentioned in Section 1, in the identi®cationtask, the aim is to ®nd the speaker i� whose modelki� maximizes a posteriori probabilityP �kijX �; 16 i6N ; which according to the Bayes'rule is
P �kijX � � p�X jki�P �ki�p�X � : �9�
Furthermore, due to lack of prior knowledge, weassume equal-likely speaker models. That is, theprior probabilities P �ki� are set equal:
P �ki� � 1
N; 16 i6N : �10�
The term p�X � is actually the unconditional likeli-hood of the occurrence of the utterance X and isthe same for all speakers. Therefore,maxi p�X jki� will maximize a posteriori probabili-ty and the identi®cation decision can be simpli®edto
i� � arg maxi
p�X jki�; �11�
where i� is the identi®ed speaker.Usually, a speaker identi®cation system consists
of collection of reference speaker models ki, front-end analysis and decision modules. The digitizedspeech utterance S�n� is transformed into a se-quence of feature vectors X and after that the like-lihoods p�X jki�, corresponding to each of thespeaker models, are calculated. The best one is de-termined in the decision module and identi®es theunknown speaker.
Since our likelihood transformation method re-quires frame likelihoods from all reference to beavailable for each frame, the structure of thespeaker identi®cation system has to be modi®ed.Fig. 1 shows the structure of our speaker identi®-cation system (Markov and Nakagawa, 1996b).In this system, input speech is analyzed and trans-formed into a feature vector sequence by Front-end Analysis block and then each test vector xt isfed to all reference speaker models in parallel.The ith speaker dependent GMM produces likeli-hood p�xtjki�; i � 1; 2; . . . ;N ; and all these likeli-hoods are passed in the so called LikelihoodTransformation and Accumulation block, wherethey are transformed (according to the chosentransformation function) and accumulated for
t � 1; 2; . . . ; T to form the utterance level scoresSc�X jki�. The speaker identi®cation is accom-plished by comparing these scores in the DecisionLogic block and determining the best one. The un-known speaker is classi®ed as the speaker, whosemodel has the best score.
3.2. Speaker veri®cation
Speaker veri®cation is a binary decision prob-lem where it has to be decided whether the speechutterance belongs to the claimant speaker or not.In the classical approaches, this decision is doneby comparing the utterance score of the claimantspeaker's model with some threshold determinedat the training phase. The problem with this meth-od is that the absolute value of the utterance scoredoes not depend only on the speaker model used,but also on the lexical content of the speech and,therefore, a stable threshold cannot be set. One so-lution to this problem is to apply a likelihood nor-malization technique which has proven tosigni®cantly improve veri®cation performance(Higgins et al., 1991; Rosenberg et al., 1992; Rey-nolds, 1995a; Matsui and Furui, 1995).
The general approach is to apply a likelihoodratio test (Fukunaga, 1990) to the input utteranceX � x1; x2; . . . ; xT using the claimant speaker mod-el kc;
l�X � � p�X jkc�p�X jkc� ; �12�
where kc is a model representing all other possiblespeakers (impostors) and the prior probabilitiesP�kc� and P �kc� are assumed equal. The likelihood
Fig. 1. Block diagram of our speaker identi®cation system.
196 K.P. Markov, S. Nakagawa / Speech Communication 24 (1998) 193±209

p�X jkc� is directly computed from Eq. (1) assum-ing that the speaker model is a GMM type,
p�X jkc� �YT
t�1
p�xtjkc�: �13�
The likelihood P �X jkc� is usually approximatedusing a collection of background speaker models.With the set of B background speaker models,fk1; . . . ; kBg, the background speaker's likelihoodis computed as
p�X jkc� � 1
B
XB
b�1
p�X jkb�: �14�
In the special case when B � N , i.e. all referencespeakers including the claimed speaker act asbackground speakers and assuming thatP �kc� � P �kb�, a posteriori probability P �kcjX �scaled by the factor N approximates Eq. (12):
NP �kcjX � � P�kc�p�X jkc�1N p�X � � P �kc�p�X jkc�
1N
PNb�1 p�X jkb�P �kb�
� p�X jkc�1N
PNb�1 p�X jkb�
� l�X �: �15�
In this case, using likelihood ratio test is equivalentto the speaker veri®cation method based on a pos-teriori probability as reported in (Matsui and Fur-ui, 1993).
Fig. 2 shows the structure of our speaker veri®-cation system. After the input speech signal istransformed into a sequence of feature vectors,frame likelihoods from the claimant speaker modeland the background speaker models are calculated,further transformed and accumulated in the Likeli-hood Transformation and Accumulation block as
in the speaker identi®cation system. Then, usingthe claimant speaker score Sc�X jkc� and the back-ground speaker scores, the likelihood ratio l�X � iscalculated. This is an utterance level normalizationand is the same as the likelihood normalizationused in the conventional speaker veri®cation sys-tems. It is needed since the score Sc�X jkc� as wellas p�X jkc� depends on the lexical content of the testutterance. l�X � is compared with the threshold Hand the decision is made according to the compar-ison result. Note that the background speaker setsfor the frame normalization and for the utterancenormalization need not be the same. We can choosedi�erent sets and use the combined backgroundspeaker set picking up only those scores which arenecessary for the current type of normalization.
Setting of the threshold very much a�ects theperformance of the veri®cation system. For exam-ple, if the threshold is set high, a true speaker canbe rejected. If it is too low, an impostor speakercould be accepted. These kinds of veri®cation er-rors are measured in terms of false rejection (FR)and false acceptance (FA) rates. These error ratesgive us the estimate of the two kinds of errors giv-en the threshold. Usually, veri®cation performanceis measured in terms of equal error rate (EER)(Matsui and Furui, 1995; Reynolds, 1995a). In thisapproach, the threshold is set such that FA andFR are equal. This is found by sorting true testscores and impostor test scores together and locat-ing that point (or threshold) in the sorted listwhere the percent of impostor tests above thispoint is equal to the percent of the true tests belowthis point. Often the available test data per speakerare very few (especially the true tests) and setting aspeaker dependent threshold would give resultswith low statistical signi®cance. That is why, forsmall databases, a global threshold (same for allspeakers) is used. In this case, true tests and impos-tor tests from all speakers are sorted together andthen the threshold is located. It has to be notedthat FA and FR are discrete functions of thethreshold and the step from one point to the nextone depends on the number of true tests for FRand impostor tests for FA. Obviously, FA andFR will intersect in one point if the number of truetests is equal to the number of impostor tests.However, in the leaving-one-out test scheme, thereFig. 2. Block diagram of our speaker veri®cation system.
K.P. Markov, S. Nakagawa / Speech Communication 24 (1998) 193±209 197

are always much more impostor than true tests. Inthis case, using the above algorithm for locatingthe threshold we will ®nd the point where FRand FA are most close, but not equal. Some re-searches accept the EER as the FA at this point(Reynolds, 1995a). We have done detailed analysisof this situation which shows that more precise es-timation of the EER can be obtained by linear ap-proximation of FR and FA functions.
4. Frame likelihood transformations
4.1. Likelihood normalization
As we stated in Section 1, the ®rst family offrame likelihood transformation functions per-forms the essentially likelihood normalization.
Given a single frame likelihood p�xtjki� from theith speaker model, the likelihood transformation isdone using the following general function form:
f �p�xtjki�� � p�xtjki�1B
PBb�1 p�xtjkb�
; �16�
where p�xtjkb� are the frame likelihoods from thebackground speaker models given the same framext. Di�erent choices of the background speaker setgive di�erent transformation functions. Note thatthe above likelihood transformation approximatesthe likelihood ratio, as described in the previoussection, but for a single frame. Thus, we transformthe frame likelihood into a kind of con®dencemeasure. Similar approach has been used for utter-ance veri®cation purposes in speech recognition(Lleida and Rose, 1996).
Utterance level score, in this case, is obtained byinserting Eq. (16) into Eq. (2). For speaker i in thelog domain we have
log Sc�X jki�
�XT
t�1
log p�xtjki� ÿ log1
B
XB
b�1
p�xtjkb� ! !
; �17�
�XT
t�1
log p�xtjki� ÿXT
t�1
log1
B
XB
b�1
p�xtjkb� !
: �18�
It is easy to recognize that the ®rst term ofEq. (18) is the standard L�X jk� from Eq. (8). The
second term represents a correction consisting oflikelihoods from the background speakers.
As in the utterance level likelihood normaliza-tion, here also arises the problem of choosing theproper background speaker set. In the closed setspeaker identi®cation task, however, we are re-stricted to choose from available set of N speakers.Given the speaker model i, we have experimentedwith the following background speaker sets:· All others: the background speaker set consists
of all registered speakers, except the speaker i.· Top M speakers: since the likelihoods from all
speaker models for the current vector xt areavailable, it is possible to determine the speakermodels, which have the M maximum likelihoodsand the background speaker set in this case con-sists of these M speakers (excluding speaker i).Obviously, the top M speakers will change fromframe to frame.
· Cohort speakers: the background speaker setconsists of K acoustically closest speakers tothe speaker i. The cohort speakers are deter-mined on the training data in advance and thisprocedure is described in (Rosenberg et al.,1992).
4.2. Weighting models rank
This type of frame likelihood transformation incontrast to the normalization approach describedin the previous section is new and is not basedon any known techniques. The main idea is totransform the frame likelihood p�xjk� into a weightw which does not depend on the absolute value ofthis likelihood, but depends on its relative positionwith respect to the likelihoods from all otherspeaker models.
The WMR transformation is accomplishedusing the following two steps.
Step 1. For each test vector xt; t � 1; 2; . . . ; T ,calculate all likelihoods p�xtjki�; i � 1; . . . ;N ;and sort them in a decreasing order. This isthe same as making an N-best list of models.The model with the highest likelihood is at thetop of this list and the model with the lowestlikelihood ± at the bottom. We can also say thateach model has a rank, rk, which corresponds tothe position of the model in this list and is an
198 K.P. Markov, S. Nakagawa / Speech Communication 24 (1998) 193±209

integer ranging from 1 to N . The weight w is de-®ned as a function of rk,
w�rk� � g�rk�: �19�The relations between ranks, weights and mod-els are shown in Table 1. Actually, it is not nec-essary to calculate g�rk� each time. Since itdepends on rk which values are 1; 2; . . . ;N , wecan have all possible weights calculated priorto any experiments.Step 2. For each model ki, ®nd its rank rki , i.e.its place in the N-best list, and instead of thelikelihood p�xtjki� use the corresponding weightwt�rki� as a model's frame score.
Utterance level score Sc�X jki� is calculated bysumming up (in the log domain) all weights fort � 1; . . . ; T :
log Sc�X jki� �XT
t�1
wt�rki�; �20�
where wt�rki� is the weight of the model i with rankrki at time t.
In accordance with Eq. (2), now we can de®nethe WMR type likelihood transformation functionas
f �p�xtjk�� � exp�wt�rk��: �21�Obviously, in this technique, the most impor-
tant issue is what types of function g� � to use.Previously we have experimented with followingthree typical functions (Markov and Nakagawa,1996a):
g exp �rk� � exp�Aÿ Brk�; rk � 1; . . . ;N ; �22�glin�rk� � Aÿ Brk; rk � 1; . . . ;N ; �23�gsig�rk� � A
exp Brk � 1; rk � 1; . . . ;N ; �24�
where A and B are parameters which we choose tobe such that g�1� � N . Graphically these threefunctions are shown in Fig. 3. The reasons ofchoosing these functions and more detailed analy-sis of the WMR transformation performance arepresented in Section 6.3.
Table 1
N-best list of speaker models
Rank r Weight w�r� Model
1 w�1� Model kl (max. likelihood)
2 w�2� Model kj
. . . . . . . . .
m w�m� Model kk
. . . . . . . . .
N w�N� Model kp (min. likelihood)
Fig. 3. Weights as functions of the model rank.
K.P. Markov, S. Nakagawa / Speech Communication 24 (1998) 193±209 199
5. Experiments
We evaluated our speaker recognition systemusing several types of GMMs with both full anddiagonal covariance matrices. As a baseline sys-tem, we used the conventional maximum likeli-hood testing approach based on Eq. (1) or Eq. (8).
5.1. Databases and speech analysis
We used two databases ± NTT database andTIMIT corpus for the experiments.
The NTT database consists of recordings of 35speakers (22 males and 13 females) collected in ®vesessions over 10 months (August 1990, September1990, December 1990, March 1991 and June 1991)in a sound proof room (Matsui and Furui, 1992).For training the models, ®ve same sentences forall speakers and ®ve di�erent sentences for eachspeaker, from one session (August 1990) wereused. Five other sentences from the other four ses-sions uttered at normal, fast and slow speeds andsame for each of the speakers and for each of thesessions were used as test data. Average durationof the sentences is about 4 s. The input speechwas sampled at 12 kHz. 14 cepstrum coe�cientswere calculated by the 14th order LPC analysisat every 8 ms with a window of 21.33 ms. Thenthese coe�cients were further transformed into10 mel-cepstrum (cep) and 10 regressive (Dcep) co-e�cients. Each session's mel-cepstrum vectorswere mean normalized by mean subtraction and si-lence parts were removed.
The well known TIMIT database, consisting of6300 sentences (630 speakers ´ 10 sentences), wasalso used in evaluation experiments. Eight sentenc-es ± one SA (equal for all speakers), ®ve SX (equalfor groups of speakers) and two SI (di�erent foreach speaker) from each speaker were used fortraining and the remaining two (one SA and oneSI) sentences for testing. The speech was ®rstdown-sampled to 12 kHz and then the same anal-ysis was performed as for the NTT database, ex-cept that cepstrum vectors were not meannormalized and silence was not removed. For theTIMIT database, the cepstral mean normalizationis not necessary because the training and testingconditions are the same. Removing the silence
events, however, has been reported to slightly de-grade the identi®cation performance (Reynolds,1995b).
5.2. Speaker identi®cation experiments
Since we had a limited amount of training data± about 20±30 s of speech, for both databases, wewere restricted in the number of model's parame-ters we could reliably estimate. That is why themodels with full covariance matrix have 4 and 8mixtures (and 16 mixtures for TIMIT database)and models with diagonal covariance matrix ± 32and 64 mixtures.
Cepstral and delta cepstral vectors are treatedas separate feature streams. Therefore, frame like-lihood transformations are performed indepen-dently on each feature frame. The combination isdone at utterance level by summing the utterancescores from the two types of features:
Sccomb�X jk� � Sccep�X jk� � ScDcep�X jk�: �25�
5.2.1. NTT database resultsTable 2 shows the identi®cation rates, averaged
over all test sessions, using frame likelihood nor-malization with the three types of backgroundspeaker sets ± All others, Top M with M � 10and Cohort and WMR transformation results. Co-hort size is set to B � 5. Three separate experi-ments were done for each type of the testutterance speeds (speaking rate) ± normal, slowand fast. In the table, the parts marked with ``Nor-mal speed'', ``Slow speed'' and ``Fast speed'' showthe identi®cation rates in these three cases. Notethat the speaker models were trained only withnormal speed utterances. The column ``Modeltype'' shows the GMM structure. ``4 mix. full''means a GMM with 4 mixture densities with fullcovariance matrices and ``32 mix. diag.'' ± GMMwith 32 mixture densities with diagonal covariancematrices. The results in the ``cep'' rows present theidenti®cation rates when only 10-dimensional mel-cepstral feature vectors are used. Adding the ceps-tral derivative (Dcep) as a separate feature streamresulted in higher identi®cation rates shown inthe ``cep� Dcep'' rows. Table 2 shows that ourframe likelihood transformation techniques give
200 K.P. Markov, S. Nakagawa / Speech Communication 24 (1998) 193±209

better results than the baseline system. All types ofthe background speaker set give comparable id-enti®cation rates. However, the more importantresult is that our methods are much better thanthe baseline at the ``Slow'' and ``Fast'' utterancespeeds compared to the ``Normal'' speed. This factindicates that the proposed types of frame likeli-hood transformation are more robust against vari-ations of the speaking rate.
In the column ``WMR'', we present the exact re-sults only for the case of exponential relationshipbetween weights and ranks, since the other two ±linear and sigmoidal were performing worse. It isnoted that an identi®cation rate of 97.3% is thebest on this database (for comparison see (Matsuiand Furui, 1992) with 95.6%) and is achieved usingWMR technique and GMM with eight full covari-ance matrix mixtures.
In order to assess the signi®cance of the im-provements achieved by our methods, we haveperformed a statistical signi®cance test on our bestresults (WMR technique with eight mixture, fullcovariance matrix GMM) using sign test method-ology described in (Nakagawa and Takagi, 1994;Siegel, 1956). Using combined results of the allthree test speeds, our proposed method showedthe superiority over the baseline with a signi®cancerisk of 0.1% for the case when only cepstral fea-tures were used and 4.4% for the cepstral + Dceps-tral features case.
5.2.2. TIMIT database resultsTable 3 summarizes the results on TIMIT data-
base. Identi®cation rates for both the SA and SItest utterances are presented separately, becausethese are quite di�erent types of sentences. SA is
Table 2
Identi®cation rate (%) using GMM models and frame likelihood transformation techniques (NTT database)
Likelihood normalization
Model type Feature All others Top 10 Cohort WMR Baseline
Normal speed
4 mix. full cep 92.8 92.7 92.4 92.4 92.3
cep + Dcep 94.6 94.8 94.8 95.2 94.1
8 mix. full cep 96.5 96.5 96.2 96.6 96.1
cep + Dcep 97.0 97.0 97.0 97.3 97.0
32 mix. diag. cep 95.5 95.5 95.2 95.0 95.0
cep + Dcep 95.8 95.8 96.3 95.3 96.0
64 mix. diag. cep 95.2 95.2 94.9 96.2 94.5
cep + Dcep 95.7 95.7 95.9 95.8 95.4
Slow speed
4 mix. full cep 89.0 89.2 89.4 90.3 88.6
cep + Dcep 91.6 91.6 92.4 91.0 90.8
8 mix. full cep 92.0 92.0 92.7 93.9 91.3
cep + Dcep 93.4 93.6 93.8 94.3 93.0
32 mix. diag. cep 92.7 92.7 92.6 92.5 92.4
cep + Dcep 92.6 92.6 93.0 92.6 92.3
64 mix. diag. cep 90.9 90.9 92.0 91.4 90.0
cep + Dcep 91.6 91.5 91.7 91.9 91.0
Fast speed
4 mix. full cep 90.9 90.7 91.2 89.9 90.4
cep + Dcep 91.7 91.8 92.3 91.9 91.0
8 mix. full cep 94.3 94.3 93.6 94.1 93.4
cep + Dcep 94.6 94.5 94.3 94.8 94.0
32 mix. diag. cep 92.6 92.6 93.2 91.4 91.7
cep + Dcep 92.0 92.0 92.0 90.5 91.7
64 mix. diag. cep 92.0 92.0 92.6 92.0 91.4
cep + Dcep 92.3 92.3 91.9 92.4 91.4
K.P. Markov, S. Nakagawa / Speech Communication 24 (1998) 193±209 201

the same for all speakers while SI is di�erent foreach speaker and, therefore, identi®cation ratesfor SA are signi®cantly higher.
TIMIT database is a popular database and oftenis used for speaker recognition experiments. Anidenti®cation rate of 99.5% was reported in (Rey-nolds, 1995b) when GMM with 32 diagonal co-variance matrices were used. We should notice,however, that our front-end speech analysis is quitedi�erent from (Reynolds, 1995b) where 16 kHz sam-pling rate and 30 cepstral coe�cients were used.
In average, the performance of our likelihoodtransformation approach is comparable to thebaseline and in some cases is slightly better. Notethat the best result of 98.1% for TIMIT databaseis achieved using WMR approach as for theNTT database, but this time using GMM with16 full covariance matrix mixtures. The reason isthat from the TIMIT data silence was not removedand, thus, several of the GMM mixtures are neces-sary for modeling the silence. Since silences wereremoved from the NTT data, less mixtures wereneeded for the best performance.
5.3. Speaker veri®cation experiments
5.3.1. NTT database resultsIn these experiments, each of the 35 speakers
was acting as ``customer'' and all others as ``im-postors''. Thus, rotating through all speakers wehad 35 evaluation sets. Table 4 presents the num-ber of customer and impostor tests used for eachrecording session as well as the total number oftests.
For the speaker veri®cation, as stated above, itis proven that the utterance level likelihood nor-malization signi®cantly improves the systems per-formance. In our experiments, we have combinedour frame likelihood transformation techniqueswith the sentence level normalization. This isachieved by using the sentence level scores(Eq. (2)) obtained from the transformed framelikelihoods and normalizing them in the sameway as in the conventional veri®cation systems.Baseline results were also obtained using sentencelevel normalization of the accumulated frame like-lihoods. For this normalization we used the same
Table 3
Identi®cation rates (%) using GMMs (TIMIT database)
Likelihood normalization
Mod. type Feature All others Top 20 Cohort WMR Baseline
SA test
4 mix. full cep 94.0 94.1 93.5 89.2 93.8
cep + Dcep 94.8 94.9 94.9 89.8 94.6
8 mix. full cep 97.0 97.0 97.1 97.1 96.8
cep + Dcep 97.3 97.3 97.6 95.7 97.3
16 mix. full cep 97.6 97.6 97.8 97.6 97.6
cep + Dcep 96.8 96.8 97.2 98.1 96.8
32 mix. diag. cep 95.2 95.2 95.1 94.4 95.4
cep + Dcep 94.9 94.9 95.2 94.1 94.9
64 mix. diag. cep 94.3 94.3 94.3 95.6 94.3
cep + Dcep 94.0 93.8 94.3 94.6 93.8
SI test
4 mix. full cep 90.0 90.0 90.6 87.3 90.2
cep + Dcep 91.1 91.4 91.1 87.0 91.1
8 mix. full cep 93.7 93.7 93.5 94.4 93.7
cep + Dcep 94.1 94.1 94.8 93.0 94.0
16 mix. full cep 95.4 95.4 95.8 96.7 95.2
cep + Dcep 93.8 93.8 94.0 95.1 93.3
32 mix. diag. cep 92.2 92.1 93.0 94.6 92.4
cep + Dcep 92.1 92.1 92.9 91.4 91.7
64 mix. diag. cep 91.4 91.4 92.5 94.4 91.0
cep + Dcep 89.8 89.8 91.4 91.6 89.8
202 K.P. Markov, S. Nakagawa / Speech Communication 24 (1998) 193±209
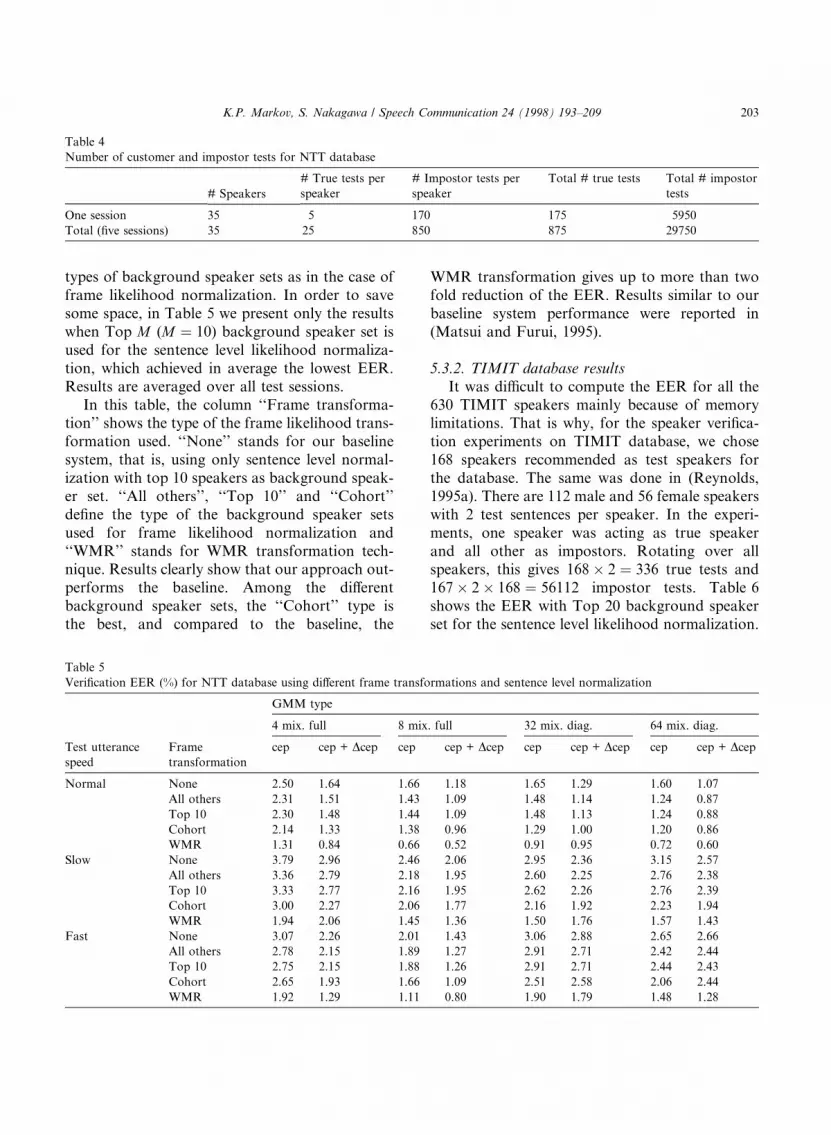
types of background speaker sets as in the case offrame likelihood normalization. In order to savesome space, in Table 5 we present only the resultswhen Top M (M � 10) background speaker set isused for the sentence level likelihood normaliza-tion, which achieved in average the lowest EER.Results are averaged over all test sessions.
In this table, the column ``Frame transforma-tion'' shows the type of the frame likelihood trans-formation used. ``None'' stands for our baselinesystem, that is, using only sentence level normal-ization with top 10 speakers as background speak-er set. ``All others'', ``Top 10'' and ``Cohort''de®ne the type of the background speaker setsused for frame likelihood normalization and``WMR'' stands for WMR transformation tech-nique. Results clearly show that our approach out-performs the baseline. Among the di�erentbackground speaker sets, the ``Cohort'' type isthe best, and compared to the baseline, the
WMR transformation gives up to more than twofold reduction of the EER. Results similar to ourbaseline system performance were reported in(Matsui and Furui, 1995).
5.3.2. TIMIT database resultsIt was di�cult to compute the EER for all the
630 TIMIT speakers mainly because of memorylimitations. That is why, for the speaker veri®ca-tion experiments on TIMIT database, we chose168 speakers recommended as test speakers forthe database. The same was done in (Reynolds,1995a). There are 112 male and 56 female speakerswith 2 test sentences per speaker. In the experi-ments, one speaker was acting as true speakerand all other as impostors. Rotating over allspeakers, this gives 168� 2 � 336 true tests and167� 2� 168 � 56112 impostor tests. Table 6shows the EER with Top 20 background speakerset for the sentence level likelihood normalization.
Table 5
Veri®cation EER (%) for NTT database using di�erent frame transformations and sentence level normalization
GMM type
4 mix. full 8 mix. full 32 mix. diag. 64 mix. diag.
Test utterance
speed
Frame
transformation
cep cep + Dcep cep cep + Dcep cep cep + Dcep cep cep + Dcep
Normal None 2.50 1.64 1.66 1.18 1.65 1.29 1.60 1.07
All others 2.31 1.51 1.43 1.09 1.48 1.14 1.24 0.87
Top 10 2.30 1.48 1.44 1.09 1.48 1.13 1.24 0.88
Cohort 2.14 1.33 1.38 0.96 1.29 1.00 1.20 0.86
WMR 1.31 0.84 0.66 0.52 0.91 0.95 0.72 0.60
Slow None 3.79 2.96 2.46 2.06 2.95 2.36 3.15 2.57
All others 3.36 2.79 2.18 1.95 2.60 2.25 2.76 2.38
Top 10 3.33 2.77 2.16 1.95 2.62 2.26 2.76 2.39
Cohort 3.00 2.27 2.06 1.77 2.16 1.92 2.23 1.94
WMR 1.94 2.06 1.45 1.36 1.50 1.76 1.57 1.43
Fast None 3.07 2.26 2.01 1.43 3.06 2.88 2.65 2.66
All others 2.78 2.15 1.89 1.27 2.91 2.71 2.42 2.44
Top 10 2.75 2.15 1.88 1.26 2.91 2.71 2.44 2.43
Cohort 2.65 1.93 1.66 1.09 2.51 2.58 2.06 2.44
WMR 1.92 1.29 1.11 0.80 1.90 1.79 1.48 1.28
Table 4
Number of customer and impostor tests for NTT database
# True tests per
speaker
# Impostor tests per
speaker
Total # true tests Total # impostor
tests# Speakers
One session 35 5 170 175 5950
Total (®ve sessions) 35 25 850 875 29750
K.P. Markov, S. Nakagawa / Speech Communication 24 (1998) 193±209 203

In TIMIT database, the test and train condi-tions are the same which is big simpli®cation forthe task and, consequently, it is more di�cult tooutperform the baseline performance. This is evi-dent from the results of ``All others'' and ``Top20'' background speaker sets which in contrast tothe multi-session NTT database are the same asthe baseline. The ``Cohort'' is slightly better, andonly WMR signi®cantly reduces the EER and weobtained 0.09% ERR. For comparison, the bestEER reported in (Reynolds, 1995a) is 0.24% ob-tained using cohort type utterance level likelihoodnormalization.
Using a common set of true speakers and im-postors, as in these experiments, i.e. a closed setproblem, does not allow us to assess the perfor-mance of the speaker veri®cation system in a realveri®cation scenario. This is because in the realworld application the system will have knowledgeonly about the true speakers and neither the num-ber of impostors nor their features can be knownahead of time. In contrary, in the above experi-ments, impostors are implicitly assumed to beknown to the system.
In order to simulate a real veri®cation task (anopen set problem), we performed a second set ofexperiments where the same 168 TIMIT testspeakers were acting as true speakers and all other462 train speakers served as impostors. This makes336 true tests and 924 impostor tests. In the openset task, we also have to address the problem ofchoosing the veri®cation threshold. Calculatingthe EER in this case is not the best choice sinceit uses a posteriori threshold. Setting the thresholdis a challenging problem which still has not beensolved (Matsui et al., 1996).
Table 7 summarizes the results of the open setexperiments in terms of both EER and a ®xedthreshold set to the value of the EER thresholdcalculated in the ®rst set of experiments (thosefrom Table 6). As it is apparent from the table,in terms of EER both our methods ± frame levellikelihood normalization with cohort backgroundspeakers and WMR technique, are better thanthe baseline system. Results using a ®xed thresholdshow that in this case only WMR gives signi®cant-ly lower false acceptance rate with almost the samenumber of false rejection errors (0.3% FR corre-sponds to one rejection of a true test).
6. Discussion
6.1. Linear versus non-linear frame likelihoodtransformation
When considering the type of the likelihoodtransformation function f � � of Eq. (2), it is veryimportant to choose the right one. Since it is notquite obvious why the linear type of f � � is not ap-propriate, below we prove that the linear transfor-mation of the frame likelihoods does not changethe recognition rate.
Consider the linear transformation functionf �x� � ax� b and the frame likelihood p�xtjki� ofith speaker model at time t. Then, the transformedlikelihood is
f �p�xtjki�� � ap�xtjki� � b: �26�
In the speaker identi®cation task, we are interestedin the model iH which gives the best score. For the
Table 6
Veri®cation EER (%) for TIMIT database
GMM type
4 mix. full 8 mix. full 16 mix. full 32 mix. diag. 64 mix. diag.
Frame transformation cep cep + Dcep cep cep + Dcep cep cep + Dcep cep cep + Dcep cep cep + Dcep
None 0.72 0.61 0.43 0.46 0.40 0.46 0.59 0.66 0.57 0.76
All others 0.71 0.60 0.42 0.45 0.39 0.45 0.58 0.65 0.57 0.76
Top 20 0.71 0.60 0.42 0.45 0.39 0.45 0.58 0.65 0.57 0.76
Cohort 0.67 0.56 0.38 0.41 0.35 0.40 0.51 0.58 0.53 0.70
WMR 0.48 0.39 0.16 0.15 0.16 0.19 0.09 0.13 0.24 0.19
Sentence level normalization ± Top 20.
204 K.P. Markov, S. Nakagawa / Speech Communication 24 (1998) 193±209

standard maximum likelihood approach based onEq. (1), it is
iH � arg maxi
YT
t�1
p�xtjki�: �27�
When the frame likelihoods are linearly trans-formed, the above equation becomes
iH � arg maxi
YT
t�1
�ap�xtjki� � b�
� arg maxi
aTYT
t�1
p�xtjki� � ba
� �� arg max
i
YT
t�1
p�xtjki� � ba
� �� arg max
i
YT
t�1
p�xtjki�; �28�
which shows that whether the frame likelihoodsare linearly transformed or not, the identi®edspeaker is the same and, therefore, that the lineartype of f � � does not change the identi®cation rate.
In the speaker veri®cation task, the EER, asusually computed from the sorted list of all thetrue and impostor utterance scores, may changeonly if after the frame likelihood transformationat least two scores (one true and one impostorscore) change their positions in this sorted list. Inother words, if for any two models ktrue and kimp,their utterance likelihoods are related as
p�X jktrue� < p�X jkimp� or p�X jktrue� > p�X jkimp��29�
and the corresponding utterance scores obtainedfrom the transformed frame likelihoods changethe above inequalities, i.e.,
Sc�X jktrue� > Sc�X jkimp�or Sc�X jktrue� < Sc�X jkimp� �30�only then the EER may change.
Let us now consider the linear transformation.Obviously, if for any i and j
p�X jki� �YT
t�1
p�xtjki� > p�X jkj� �YT
t�1
p�xtjkj�; �31�
then the corresponding scores will preserve the in-equality
Sc�X jki� �YT
t�1
�ap�xtjki� � b� > Sc�X jkj�
�YT
t�1
�ap�xtjkj� � b�; �32�
which means the linear transformation of theframe likelihoods would not change the veri®ca-tion error rate.
From the above considerations follows thatonly non-linear type of transformation is capableof changing the speaker recognition rates.
Table 7
Veri®cation error rates (%) for TIMIT database ± open set problem
GMM type
4 mix. full 8 mix. full 16 mix. full 32 mix. diag. 64 mix. diag.
Frame transformation cep cep + Dcep cep cep + Dcep cep cep + Dcep cep cep + Dcep cep cep + Dcep
Equal error rate
None 1.15 1.25 0.61 0.70 1.01 1.12 0.98 1.17 1.13 1.12
Cohort 1.10 1.16 0.58 0.63 0.85 1.02 1.00 1.03 1.10 0.88
WMR 1.18 1.41 0.50 0.62 0.74 0.70 0.69 0.76 0.73 0.75
False rejection rate
None 0.90 0.60 0.60 0.60 0.60 0.60 0.60 0.60 0.90 0.90
Cohort 0.60 0.60 0.60 0.60 0.60 0.30 0.60 0.30 0.60 0.60
WMR 0.90 0.60 0.30 0.30 0.60 0.30 0.60 0.60 0.60 0.30
False acceptance rate
None 1.66 1.84 1.46 1.84 1.67 1.87 1.67 1.61 2.32 2.39
Cohort 1.68 1.88 1.52 2.03 1.71 1.99 1.61 1.52 2.16 2.49
WMR 1.52 1.63 0.83 1.08 1.17 1.05 1.08 1.07 1.31 1.05
Sentence level norm. ± Top 20.
K.P. Markov, S. Nakagawa / Speech Communication 24 (1998) 193±209 205

6.2. Frame versus utterance level likelihood normal-ization
It is well known that the likelihood normaliza-tion applied to utterance likelihoods does notchange the speaker identi®cation rate. Below weshow this fact and why applied at the frame levelit can be useful.
Consider, for example, the likelihood normal-ization using ``All others'' background speakerset (as the simplest case). Let us also denote, forsimplicity, the likelihoods from any two speakermodels i and j as pi and pj (it does not matterwhether these are frame or utterance likelihoods)and the corresponding normalized likelihoods asSci and Scj. Then we have
Sci � pi1
Nÿ1
Pb6�i pb
� pi
1Nÿ1�PN
b�1 pb ÿ pi�� pi
C ÿ piNÿ1
: �33�
The same holds for Scj:
Scj � pj
C ÿ pj
Nÿ1
: �34�
Since in the speaker recognition task we are inter-ested in their relation, then, if the likelihoods ratiois
pi
pj� k; �35�
the normalized likelihoods ratio becomes
Sci
Scj� pi�C ÿ pj
Nÿ1�
pj�C ÿ piNÿ1� � k
�N ÿ 1�C ÿ pj
�N ÿ 1�C ÿ kpj� k
Aÿ pj
Aÿ kpj;
�36�where A � �N ÿ 1�C.
Now, if k > 1, then
kAÿ pj
Aÿ kpj> k �37�
and if k < 1 then
kAÿ pj
Aÿ kpj< k: �38�
This means that this type of likelihood normaliza-tion gains the ratio between likelihoods, but doesnot invert the inequality. That is why, when it is
applied only once at utterance level, for speaker id-enti®cation task, it cannot change the identi®cat-ion rate (the same holds for the other types ofbackground speaker selection), because the speak-er with maximum utterance likelihood p�X jk� aftersuch normalization will still have the maximumnormalized likelihood Sc�X jk�.
Let us now consider the likelihood normaliza-tion when applied at frame level. For each framewe will have a gain (or loss) in the likelihood ratiowhich is accumulated over the whole utterance.Then, in the case when the target speaker i is mis-recognized with a similarly performing (havingsimilar utterance likelihood) speaker j because ofa small number of outlier frames, the loss acquiredfrom these outliers can become less than the gainfrom the majority of the frames. Thus, the targetspeaker utterance level score can become biggerand it will be correctly recognized.
6.3. Choosing the WMR weight function
The weight, as de®ned in Section 4.2, is a func-tion of the model's rank. In order to choose an ap-propriate function, it is necessary to acquire someadditional knowledge about the rank. Obviously,the rank of a given model is a random variablesince it depends on a random variable ± the mod-el's likelihood p�xtjk� (assuming xt is itself ran-dom). Then, we can gather some statistics of therank, which would give us insight of how to betterset the weights.
Our task is to improve the true speaker modelsperformance, because usually when a speaker ismisclassi®ed it is not due to a non-target speakerdoing well, but rather to true speaker's model do-ing poorly (Gish and Schmidt, 1994). That is whywe would be interested in probability of targetspeaker model having rank r as well as in probabil-ity of non-target speaker model having the samerank. In other words, we need to know the proba-bility density functions (pdf) of target and non-tar-get model ranks ± ftarget�r� and fnon-target�r�. Theycan be estimated easily on the training data.Fig. 4 shows these functions estimated using theNTT database and eight mixture GMM (cepstralfeature vectors only) in the linear and log do-mains.
206 K.P. Markov, S. Nakagawa / Speech Communication 24 (1998) 193±209

We can see that ftarget�r� is almost exponentialwhile fnon-target�r� is close to uniform. The samefunctions obtained using all other types of GMMhad a similar shape.
Generally, rank's pdf f �r� as well as the weightw�rk� is a function of the rank. And here naturallycomes the following question: What if we use theestimated probabilities P �r� � Pr�rktarget
� r� asweight-type scores (instead of conventional likeli-hoods) in our test? It is possible and we have donesuch an experiment. The obtained results were bet-ter than the baseline but worse that the WMR test.This is because the probability estimates are basedon the training data and we cannot expect goodgeneralization on unseen data (test data) of thisapproach. That is why, by correcting the shapeof ftarget�r�, i.e. by using a proper weight function,we could deal with this problem.
Since the weight w corresponds to log P�r�, weshould focus our attention on Fig. 4(b) in order tochoose a weight function. For the top 5±10 ranks,log ftarget�r� is close to exponential and after that itbecomes almost linear. Setting the weight to be anexponential function of the rank will approximatethe shape of log ftarget�r� for the top ranks. A lin-ear function will be an approximation for the othervalues of the rank. Our preliminary experiments(Markov and Nakagawa, 1996a) showed that lin-ear weight performs similarly or even worse thanthe baseline. It appears, that the most critical, inrecognition point of view, is the shape of theweight function for the top ranks. To verify this,we experimented with sigmoidal weight functionwhich is quite di�erent, especially, for the topranks. It performed the worst.
When we have decided what weight function touse, the next step is how to choose its parameters(recall Eqs. (22)±(24)). Let us ®rst ®nd the meanvalue of the weight for the target and non-targetspeakers. Weight mean can be expressed by theweight function and the rank pdf. The expectedvalue of a function of a random variable is (Pa-poulis, 1991)
Efg�x�g �Z1ÿ1
g�x�f �x� dx; �39�
where f �x� is the pdf of the random variable x andg�x� is a function of x. If x is of discrete type, theabove equation becomes
Efg�x�g �X
i
g�xi�Pr�x � xi�: �40�
Therefore, for the two means we have
mtarget �XN
r�1
g�r;H�Ptarget�r�; �41�
mnon-target �XN
r�1
g�r;H�Pnon-target�r�; �42�
where g�r;H� is the weight function with parame-ters H � fhig. Before going to determine the opti-mal value of each parameter hi, we have to knowwhether it is able to change the recognition rateor not. Obviously, if a change of some parameterhas the same e�ect on both target and non-targetspeaker scores (weights) the recognition rate willbe the same. However, we cannot examine thespeaker scores because they are not available prior
Fig. 4. Rank's pdf for target and non-target speaker models (NTT database, eight mix. GMM).
K.P. Markov, S. Nakagawa / Speech Communication 24 (1998) 193±209 207

to the recognition. But since the e�ect of the pa-rameter change on the means mtarget and mnon-target
is the same as on the scores, we can focus our anal-ysis on them. Now we can formulate our decisionon hi as: if any change of hi results in the same de-gree of change of mtarget with respect to the change ofmnon-target, then hi will have no e�ect on the recogni-tion rate. 1 Thus, we have to analyze the followingfunction:
J�hi� �@@hi
PNr�1 g�r;H�Ptarget�r�
@@hi
PNr�1 g�r;H�Pnon-target�r�
; �43�
and if J�hi� � const P 0 then hi will be of no inte-rest. In the other case, when J�hi� 6� const, we can®nd the optimal hi as one which maximizes the dif-ference between mtarget and mnon-target:
hopti � arg max
hi
XN
r�1
g�r;H�Ptarget�r�
ÿXN
r�1
g�r;H�Pnon-target�r�!; �44�
which is equivalent to
hopti � arg�J�hi� � 1�: �45�
It can be easily veri®ed that when the weight is alinear function of the rank (see Eq. (23)), thenJ�A� as well as J�B� is constant. Our experimentalresults con®rmed that the speaker recognition ratein this case does not depend on either A or B. Forthe exponential weight (see Eq. (22)), the analysisshows that only the parameter B can e�ect the rec-ognition rate, which is also experimentally veri®ed.
The expression under the big parentheses inEq. (44) can also be used as a measure of theweight function e�ectiveness with respect to therecognition rate. The bigger this di�erence is, thebetter recognition rate can be expected. For the ex-ample of Fig. 4, we calculated this di�erence forthe linear and exponential weight functions. Weobtained 0.39 and 0.45, respectively. It is also pos-sible to assess in the same way the e�ectiveness ofthe conventional log-likelihood score by ®rst aver-
aging (normalized) log-likelihoods for each rankand then using these averages as values of dis-cretely de®ned weight function. For this case weobtained 0.38 di�erence between target and non-target means, which is very close to that for the lin-ear weight function and far below from that forthe exponential weight function. This explainswhy the WMR test with exponential weight is su-perior to the conventional maximum likelihoodtest.
7. Conclusion
We have developed and experimented a non-lin-ear frame likelihood transformation method,which allowed as to apply successfully likelihoodnormalization technique for the speaker identi®-cation task. For the speaker veri®cation, the com-bination of frame and utterance level likelihoodnormalization was also successful. Another newtechnique, WMR transformation, was experiment-ed with as well. Both approaches showed better re-sults in the speaker identi®cation and speakerveri®cation compared to the standard accumulat-ed likelihood methods on both the TIMIT andNTT databases. The NTT database results indi-cate that our transformation techniques are robustagainst variations in the speaker voices as well asutterance speeds. The best speaker identi®cationrate of 97.3% and ERR of 0.52% are both achievedusing WMR technique. For the TIMIT database,the identi®cation rate of 98.1% is not the best everreported, but we attribute this to the fact that ourfront-end analysis was not optimized for this data-base. However, even in this case, we achieved ex-tremely low veri®cation EER of 0.09%.
We also have shown that any linear transforma-tion of the likelihoods at the frame level does nota�ect the performance of the speaker recognitionsystem.
The number of possible frame likelihood trans-formation techniques, for sure, is not limited tothose presented in this paper. There is a roomfor further research in this direction, for lookingfor new types of non-linear transformation func-tions as well as incorporating these techniques inthe process of GMM training.
1 It is not di�cult to prove this statement. We skip the proof
in order to save some space.
208 K.P. Markov, S. Nakagawa / Speech Communication 24 (1998) 193±209
References
Bimbot, F., Magrin-Chagnolleau, I., Mathan, L., 1995. Second-
order statistical measures for text-independent speaker
identi®cation. Speech Communication 17 (1±2), 177±192.
Dempster, A., Larid, N., Rubin, D., 1979. Maximum likelihood
estimation from incomplete data. Journal of the Royal
Statistical Society B 39 (1), 1±38.
Doddington, G., 1985. Speaker recognition ± Identifying people
by their voices. Proceedings of the IEEE 73 (11), 1651±1664.
Duda, R., Hart, P., 1973. Pattern Classi®cation and Scene
Analysis, Wiley, New York, p. 46.
Fukunaga, K., 1990. Introduction to Statistical Pattern Rec-
ognition, Academic Press, New York.
Furui, S., 1978. A study on personal characteristics in speech
sound, Ph.D. Thesis, University of Tokyo (in Japanese).
Furui, S., 1991. Speaker-dependent-feature extraction, recog-
nition and processing techniques. Speech Communication
10 (5±6), 505±520.
Gish, H., Schmidt, M., 1994. Text-independent speaker id-
enti®cation. IEEE Signal Processing Magazine, October,
pp. 18±32.
Higgins, A., Bahler, L., Porter, J., 1991. Speaker veri®cation
using randomized phrase prompting. Digital Signal Pro-
cessing 1, 89±106.
Linde, Y., Buzo, A., Gray, R.M., 1980. An algorithm for vector
quantizer design. IEEE Transactions on Communications
COM±28, 84±95.
Lleida, E., Rose, R., 1996. E�cient decoding and training
procedures for utterance veri®cation in continuous speech
recognition. In: Proceedings of ICASSP'96, pp. 507±510.
Markov, K., Nakagawa, S., 1995. Text-independent speaker
identi®cation on TIMIT database. In: Proceedings of the
Acoustical Society of Japan, March 1995, pp. 83±84.
Markov, K., Nakagawa, S., 1996a. Text-independent speaker
recognition system using frame level likelihood processing.
Technical Report of IEICE, SP96-17, June 1996, pp. 37±44.
Markov, K., Nakagawa, S., 1996b. Frame level likelihood
normalization for text-independent speaker identi®cation
using Gaussian mixture models. In: Proceedings of
ICSLP'96, pp. 1764±1767.
Matsui, T., Furui, S., 1992. Comparison of text-independent
speaker recognition methods using VQ-distortion and
discrete/continuous HMMs. In: Proceedings of ICASSP'92,
Vol. II, pp. 157±160.
Matsui, T., Furui, S., 1993. Concatenated phoneme models for
text-variable speaker recognition. In: Proceedings of IC-
ASSP'93, Vol. II, pp. 391±394.
Matsui, T., Furui, S., 1995. Likelihood normalization for
speaker veri®cation using a phoneme- and speaker-inde-
pendent model. Speech Communication 17 (1±2), 109±116.
Matsui, T., Nishitani, T., Furui, S., 1996. Robust methods of
updating model and a priori threshold in speaker veri®ca-
tion. In: Proceedings of ICASSP'96, Vol. I, pp. 97±100.
Nakagawa, S., Takagi, H. 1994. Statistical methods for
comparing pattern recognition performance algorithms
and comments on evaluating speech recognition. Journal
of the Acoustical Society of Japan 50 (10), 849±854 (in
Japanese).
Papoulis, A., 1991. Probability, Random Variables, and
Stochastic Processes, 3rd ed. McGraw-Hill, New York, p.
105.
Reynolds, D.A., 1995a. Speaker identi®cation and veri®cation
using Gaussian mixture speaker models. Speech Communi-
cation 17 (1±2), 91±108.
Reynolds, D.A., 1995b. Large population speaker identi®cation
using clean and telephone speech. IEEE Signal Processing
Letters 2 (3), 46±48.
Reynolds, D.A., Rose, R.C., 1995. Robust text-independent
speaker identi®cation using Gaussian mixture speaker
models. IEEE Transactions on Speech and Audio Process-
ing 3 (1), 72±83.
Rosenberg, A., Lee, C., Gokcen, S., 1991. Connected word
talker veri®cation using whole word Hidden Markov
Models. In: Proceedings of ICASSP'91, pp. 381±384.
Rosenberg, A., DeLong, J., Lee, C., Juang, B., Soong, F., 1992.
The use of cohort normalized scores for speaker veri®cation.
In: Proceedings of ICSLP'92, pp. 599-602.
Rosenberg, A., Lee, C., Soong, F., 1994. Cepstral channel
normalization techniques for HMM-based speaker veri®ca-
tion. In: Proceedings of ICSLP'94, pp. 1835±1838.
Savic, M., Gupta, S., 1990. Variable parameter speaker
veri®cation system based on Hidden Markov Modeling.
In: Proceedings of ICASSP'90, pp. 281±284.
Siegel, S., 1956. Nonparametric Statistics for the Behavioral
Sciences. McGraw-Hill, New York, pp. 68±75.
Soong, F.K., Rosenberg, A.E., Rabiner, L.R., Juang, B.H.,
1987. A vector quantization approach to speaker recogni-
tion. AT&T Technical Journal 66, 14±26.
Tishby, N.Z., 1991. On the application of mixture AR hidden
Markov models to text independent speaker recognition.
IEEE Transactions on Signal Processing 39, 563±570.
Tseng, B., Soong, F., Rosenberg, A., 1992. Continuous
probabilistic acoustic map for speaker recognition. In:
Proceedings of ICASSP'92, Vol. II, pp. 161±164.
K.P. Markov, S. Nakagawa / Speech Communication 24 (1998) 193±209 209