Embed Size (px)
Citation preview
Mycoscience (2006) 47:299–316 © The Mycological Society of Japan and Springer 2006DOI 10.1007/s10267-006-0320-x
REVIEW PAPER
Michal Sharon · Shiro Kuninaga · Mitsuro HyakumachiBaruch Sneh
The advancing identification and classification of Rhizoctonia spp. usingmolecular and biotechnological methods compared with the classicalanastomosis grouping
Received: July 13, 2006 / Accepted: August 28, 2006
Abstract Anamorphic classification of Rhizoctonia spp. hasbeen based on young cell nuclear numbers and hyphal fu-sion to anastomosis groups (AGs), in addition to theteleomorph classification. The widespread development ofmolecular biology techniques has added modern tools tosupport classification of organisms according to their genet-ics and evolutionary processes. These various methods havealso been used in recent years for classification of Rhizocto-nia. Data are continuously accumulating in the literatureand the sequences in databases, which are readily availablefor researchers in the network systems. In the present re-view, attempts were made to describe and compare theadvantages and disadvantages of the various methods forthe classification of Rhizoctonia spp. Currently, the rDNA-internal transcribed spacer (ITS) sequence analysis seemsto be the most appropriate method for classification ofRhizoctonia spp. Data of all the appropriate multinucleateRhizoctonia (MNR) accumulated in GenBank were ana-lyzed together in neighbor-joining (NJ) and maximum-parsimony (MP) trees supplemented with percent sequencesimilarity within and among AGs and subgroups. Gener-ally, the clusters of the isolate sequences were supportive ofthe AGs and subgroups based on hyphal fusion anastomo-sis. The review also indicates inaccuracies in designation ofsequences of some isolates deposited in GenBank. The re-view includes detailed analyses of the MNR groups andsubgroups, whereas complementary descriptions of thebinucleate Rhizoctonia (BNR), uninucleate Rhizoctonia(UNR), and comprehensive interrelationships among allthe currently available MNR, BNR, and UNR groups and
subgroups in GenBank are to be discussed in a subsequentreview article.
Introduction
Morphotaxonomic criteria, which continue to be valid, arenot always sufficiently accurate or convenient to taxono-mically define isolates of the form-genus Rhizoctonia.Classification of Rhizoctonia spp. was first based oncharacterization of the cell nuclear condition [multinucleate(MNR), binucleate (BNR), and uninucleate (UNR)] and theability of hyphae to anastomose with tester isolates of desig-nated anastomosis groups (AGs) (Sneh et al. 1991). Al-though the anastomosis method is accurate, valid, andcurrently used, it is sometimes impossible to determine towhich AG an isolate belongs by anastomosis, because cer-tain isolates do not anastomose with representatives of anyknown AG while some isolates have lost their capability toself-anastomose (Hyakumachi and Ui 1987). On the otherhand, isolates of certain AGs anastomose also with isolatesof more than one AG [e.g., AGs 2 (including BI), 3, 6, and 8](Sneh et al. 1991; Carling 1996). In addition, determinationof AGs by hyphal anastomosis requires meticulous micro-scopic experience, and it is a time-consuming procedure.Several molecular techniques have been found to simplifyand/or more accurately classify isolates of this form-genus.
The present review describes the advances in variousmolecular techniques for classification of Rhizoctonia spp.compared with the classical anastomosis grouping method.DNA sequences encoding ribosomal RNA genes, especiallythe internal transcribed spacer regions (ITS1 and ITS2)flanking the 5.8S subunit, have been very useful for evaluat-ing phylogenetic and taxonomic relationships and deter-mining genetic diversity in fungal species (Bruns et al.1991). Among the various molecular classification methodsused for classification of Rhizoctonia spp., the rDNA-ITSsequence analysis seems to be the currently most appropri-ate one. A comprehensive approach for the identificationand classification of Rhizoctonia spp. isolates is attempted
M. Sharon · B. Sneh (*)Department of Plant Sciences, The George S. Wise Faculty of LifeSciences, Tel Aviv University, Ramat Aviv, Israel 69978Tel. +972-3-6409842; Fax +972-3-6409380e-mail: [email protected]
S. KuninagaDepartment of Integrated Human Sciences, School of Dentistry,Health Sciences University of Hokkaido, Hokkaido, Japan
M. HyakumachiLaboratory of Plant Pathology, Faculty of Applied BiologicalSciences, Gifu University, Gifu, Japan
300
in the present review. It is based on rDNA-ITS sequencealignment analysis (by which the genetic relatedness of theisolates is exhibited by clustering of isolate sequences in atree), complemented with detailed percent sequence simi-larity within and among AGs and subgroups; these are com-pared with the anastomosis grouping method.
The review includes detailed analyses of the MNRgroups and subgroups, while complementary descriptionsof the BNR, UNR, and comprehensive interrelationshipsamong all currently available in GenBank MNR, BNR, andUNR groups and subgroups will be discussed in a subse-quent review article.
Comparison of molecular and biochemical methodsfor classification of Rhizoctonia spp.
The classic taxonomy of the anamorph “form-genus”Rhizoctonia, which includes three major groups: MNR(teleomorphs Thanatephorus and Waitea), BNR(teleomorphs Ceratobasidium and Tulasnella), and UNR(teleomorph Ceratobasidium) has been essentially based onhyphal fusion that divided Rhizoctonia spp. into the well-established anastomosis groups (AGs) and further into sub-groups. The introduction of polymerase chain reaction(PCR) and various molecular and biochemical tools in re-cent decades have confirmed the genetic relatedness valid-ity of the AGs and greatly advanced the accuracy of itsclassification. The variety of these methods have also beenused to develop rapid PCR-based diagnostic tools for accu-rate identification of the isolates to AGs and their sub-groups. Furthermore, studies on the genetic structure ofnatural Rhizoctonia spp. field populations using variousmolecular markers have been emerging in recent years.
The various molecular methods used for classification ofRhizoctonia spp. include isozyme analysis, total cellular
fatty acids analysis, electrophoretic karyotyping, DNA–DNA hybridization, DNA fingerprinting based on randomamplified polymorphic DNA (RAPD), amplified fragmentlength polymorphism (AFLP), repetitive probe, AT-richDNA restriction fragment length polymorphism (RFLP),single-copy nuclear RFLP, rDNA RFLP, and rDNA se-quence analysis. The various molecular methods differ intheir ease of use and their efficacy to determine geneticrelationships and diversity among the isolates. The geneticstudies of Rhizoctonia spp. using these various techniquesare reviewed with attempts to emphasize the advantagesand drawbacks of each of these methods (Table 1).
Biochemical methods
Isozyme analysis
Isozymes are defined as multiple molecular forms of a cer-tain enzyme, which are actually encoded by different allelesor numerous loci, scattered over the genome. Electro-phoretic separation of isozymes relies on the existence ofgenetic polymorphisms, resulting in amino acid substitu-tions that are responsible for the differences in relativemobilities among allelic forms on an electrophoretic gel.Isozyme analysis has potential use as (1) an indicator forgenetic diversity, as isozymes indicate high levels of varia-tion in closely related isolates within a fungal group orsubgroup, and as (2) markers for population biology ofRhizoctonia spp., because it enables simultaneous examina-tion of a large number of isolates. Isozyme analysis has beenused to determine relationships and diversity among iso-lates of different AGs and subgroups of MNR (Liu et al.1990; Liu and Sinclair 1992, 1993; Laroche et al. 1992) andof BNR (Damaj et al. 1993). Generally, isozyme electro-phoretic patterns provided good indications for genetic di-
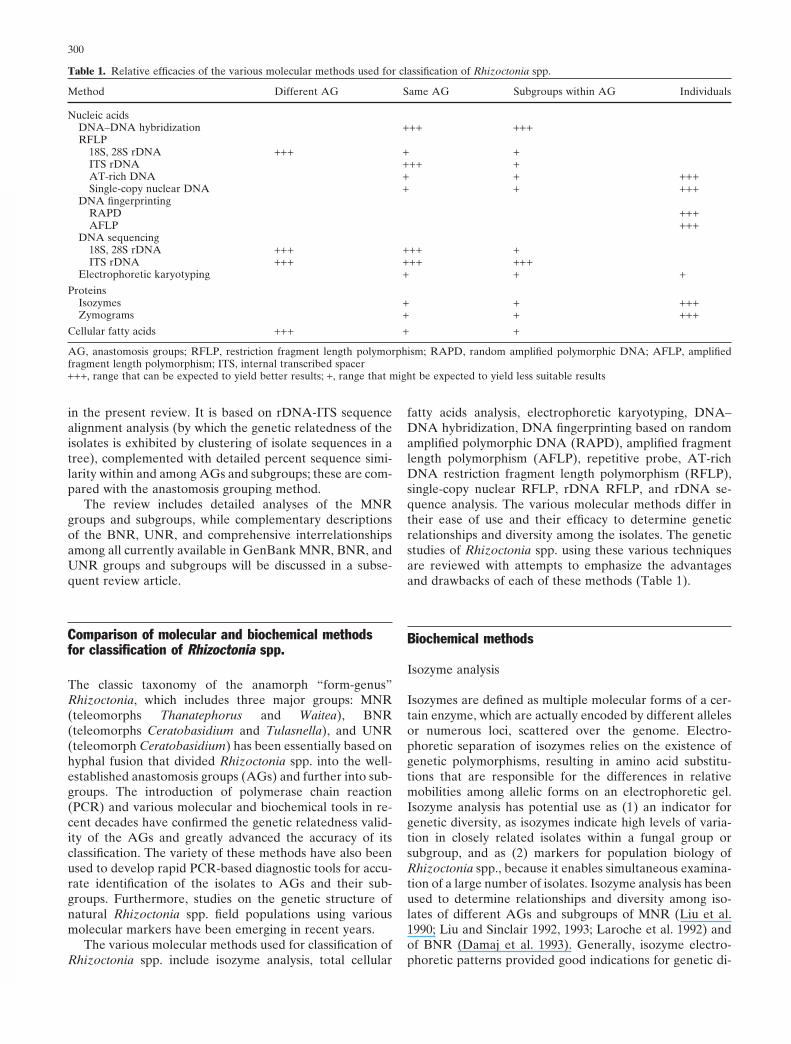
Table 1. Relative efficacies of the various molecular methods used for classification of Rhizoctonia spp.
Method Different AG Same AG Subgroups within AG Individuals
Nucleic acidsDNA–DNA hybridization +++ +++RFLP
18S, 28S rDNA +++ + +ITS rDNA +++ +AT-rich DNA + + +++Single-copy nuclear DNA + + +++
DNA fingerprintingRAPD +++AFLP +++
DNA sequencing18S, 28S rDNA +++ +++ +ITS rDNA +++ +++ +++
Electrophoretic karyotyping + + +Proteins
Isozymes + + +++Zymograms + + +++
Cellular fatty acids +++ + +
AG, anastomosis groups; RFLP, restriction fragment length polymorphism; RAPD, random amplified polymorphic DNA; AFLP, amplifiedfragment length polymorphism; ITS, internal transcribed spacer+++, range that can be expected to yield better results; +, range that might be expected to yield less suitable results
301
versities among AGs, within the subgroups, and recon-firmed the genetic basis of the AG concept. Based on 10enzyme systems, at least 6 subgroups within AG 1 and 5subgroups within AG 2 were distinguished (Liu and Sinclair1992, 1993). However, the use of isozyme analysis alone wasnot always sufficient for the identification of the previouslyknown AG 1 subgroups. Therefore, this method may pro-vide information about individual isolates with limitedvariations within a fungal population, although a largepopulation is required for determining the frequency ofdistribution of the particular alleles and locus.
Isozyme profiles were also used to differentiate betweenisolates of AG 3 and AG 9 from potato fields. In addition,cluster analysis of isozyme banding patterns could differen-tiate AG 3 isolates to subgroups (IIA, IIB, and IIC). TheCanadian and American isolates (subgroup IIC) weregrouped together, although they were genetically distantfrom those originating from Asia and Europe (subgroupIIB) (Laroche et al. 1992). These results were supported byCeresini et al. (2002), who suggested that AG 3 genotypesfrom the northern United States and Canada migrated intoNorth Carolina by introduction of infested seed potato tu-bers. Isozyme phenotypes supported the separation of BNRisolates into four genetically distinct groups (Damaj et al.1993). These groups are congruent with five of seven rDNAgroups identified by 28S rDNA RFLP patterns (Cubetaet al. 1991).
Rhizoctonia solani isolates are known to produce pectinesterases and polygalacturonases defined as a pecticzymogram. Analysis of the pectic zymogram is one of theapproaches for the detection of isozymes. This methodsuccessfully differentiated among AG 8 subgroups (Swee-tingham et al. 1986; Neate et al. 1988; Cruikshank 1990;MacNish and Sweetingham 1993; MacNish et al. 1993, 1994),AG 2 field isolates pathogenic to flower bulbs (Schneider etal. 1997) or to tobacco (Nicoletti et al. 1999), and AG 1-IAisolates from rice paddies (Banniza and Rutherford 2001).
At least five pectic zymogram-pattern groups were deter-mined among AG 8 isolates (ZG1-1–ZG1-5). Isolates of thesame ZG may originate from the same clone (C3 hyphalanastomosis reaction) or different clones (C2 reaction),whereas isolates between different ZGs produce a C2 reac-tion type (MacNish et al. 1994).
Using DNA fingerprinting, Matthew et al. (1995) indi-cated that many different clones may exist within each zy-mogram group of AG 8. The ZG method was successfullyused in studying AG 8 field isolate distribution patterns. ZGgroups could not be differentiated by hyphal fusion fre-quency (MacNish et al. 1994) or by rDNA-ITS sequenceanalysis (Kuninaga, unpublished data). The different ZGswere related to disease symptoms, and thus this methodcould also be useful for disease management caused by AG8 isolates (Sweetingham et al. 1986; Neate et al. 1988;MacNish and Sweetingham 1993). This method was alsogood for easy identification of AG 2-1 2t isolates (patho-genic to tulips at relatively cool temperatures) (Schneideret al. 1997).
Similarly, AG 1-IA isolates from one field were of thesame zymogram pattern, but had a variety of genomic
fingerprinting patterns generated by the SSR (simple se-quence repeats)-PCR method (Banniza and Rutherford2001), indicating that isolates of the same ZG are eitherclonal or very closely related. However, in the absence ofother genetic markers, pectic enzyme analysis may not besufficiently sensitive to discern a clone. The ZG methodmay serve as a good system to identify MNR AGs andsubgroups. Isolates of different AGs had different ZG pat-terns, and there were unique ZG patterns within each AG(Cruikshank 1990; MacNish et al. 1994; Banniza andRutherford 2001). However, still more isolates representingall the AGs should be tested to confirm that ZGs are limitedto the same AG and subgroup.
Fatty acids analysis
Fatty acid methyl ester (FAME) analysis had been rou-tinely used to characterize and differentiate closely relatedstrains in bacteria and yeast. This method is based on theanalysis and identification of FAME derivatives using gas-liquid chromatography coupled with a computer softwarepackage [Microbial Identification System; Microbial ID(MIDI), Newark, DE, USA]. A slightly modified MIDImethod was successfully used to characterize MNR AGs(Johnk and Jones 1992). Subgroups of the followingMNR AGs were differentiated with this method: AG 2(Johnk and Jones 1993; Matsumoto and Matsuyama1999), AG 3 (Johnk et al. 1993), and AG 4 (Johnk and Jones2001). However, AG 1-IA could not be differentiatedfrom AG 1-IB, although AG 1-IC isolates were distinct(Johnk and Jones 1994; Priyatmojo et al. 2001). FAMEprofiles coupled with another molecular method could dif-ferentiate AG 1 (the coffee necrotic leaf spot pathogen) asa new AG 1 subgroup named AG 1-ID (Priyatmojo et al.2001).
Whole-cell fatty acid analysis was used to characterizeand distinguish isolates of different R. solani AGs. How-ever, this method was not sufficiently accurate to distinguishbetween isolates of AG 4 and AG 7 (Baird et al. 2000).Clustal analysis of all fatty acids of isolates of three varietiesof Waitea (Rhizoctonia) circinata clearly separated theminto three distinct groups (Priyatmojo et al. 2002a). Thismethod was also used for the identification of additionalMNR and BNR AGs pathogenic to rice (Matsumoto et al.1996, 1997; Lanoiselet et al. 2005) and turfgrass (Priyatmojoet al. 2002b).
Several technical issues may be problematic when theuse of this method is considered. Cultural conditions such asculture age and temperature, which are critical parameters,are known to influence fatty acid composition. Uniformityof extraction protocol such as the saponification step, whichis initiated to break the fungal cell wall to expose the phos-pholipids bilayer membrane, is also critical. Currently, re-sults of fatty acid composition from different laboratoriesare inconsistent because of differences in cultural condi-tions and extraction procedures. Standardization of themethod may be required to obtain better comparative re-sults (Lanoiselet et al. 2005).
302
Electrophoretic karyotyping
Pulsed field gel electrophoresis (PFGE) is a method thatenables size separation of very large DNA fragments (up to12Mb). Application of PFGE to separate chromosomalDNA in agarose matrices is a powerful method for fungalgenomic research. It was initially used for separating Sac-charomyces cerevisiae chromosomes (Carle and Olson 1984;Schwartz and Cantor 1984) but was subsequently widelyused in many other fungi, including Rhizoctonia spp. (Wakoet al. 1991; Keijer et al. 1996). The first estimation of chro-mosome number and genome size of an AG 4 isolate wasreported by Wako et al. (1991). It was considered to have 6chromosomes, of 0.8–3.8Mb size range, and a total genomesize of 11Mb. In a subsequent study (Keijer et al. 1996), aconsiderable variation in karyotype among MNR isolates(of AGs 2-1, -3, and -4) was evident, and the chromosomenumber was at least 11. The chromosome size ranged from0.6 to 6Mb with an estimated genome size of 37–46Mb.Karyotypes were smaller within an AG than among theAGs, and there was no strict correlation between karyotypeand AGs. The consequent conclusion was that variation inkaryotype is reflected in the phenotypic variation of thefungi, with generally less diversity within an AG than be-tween AGs. Gross chromosomal rearrangements such asinsertion (e.g., by transposable elements), deletions, dupli-cation, and translocations, and the presence of B chromo-somes could be suggested as sources for karyotype variationin R. solani.
Conventional cytological studies indicated that six chro-mosomes are present in R. solani. The conventional cytol-ogy by light microscopy may be misleading because of theinaccuracy of fungal chromosome staining and their smallsize, resulting in lower estimated chromosome numbersthan those of PFGE for the same fungus. However, PFGEhas limitations in the resolution of large chromosomes(about <6Mb) as well as comigrating chromosomes of equalsize, which might lead to the underestimation of chromo-some number. Combination of PFGE with the Southernhybridization method is highly suitable for determining thelocalization of genetic markers in the chromosomes. Usingthis approach for chromosomal location of the rRNA genecluster in AG 3 isolates, the ribosomal repeats were locatedin a single chromosome, whereas in AG 2-1 and AG 4isolates the gene repeats were located in two different chro-mosomes (Keijer et al. 1996).
Analysis of genomic fingerprinting
RAPD (random amplified polymorphic DNA)
The RAPD analysis method is based on the use of singleshort oligonucleotide primers of arbitrary sequences foramplification of DNA segments distributed randomlythroughout the genome. It is a fast and simple techniquethat does not require any prior knowledge of the analyzedgenomes. The pattern of the amplified bands could be used
for genomic fingerprinting, and the polymorphisms inthe pattern of bands amplified from genetically distinctindividuals behaved as Mendelian genetic markers(Welsh and McClelland 1990; Williams et al. 1990). RAPDmarkers have been successfully used for the following appli-cations: (1) construction of genetic maps, (2) analysis ofpopulation genetic structure, (3) fingerprinting of individu-als, and (4) targeting markers to specific regions of thegenome.
The RAPD method successfully provided new geneticmarkers for genomic fingerprinting of several R. solaniAGs: AG 1 (Toda et al. 1998; Pascual et al. 2000), AG 2(Toda et al. 2004), AG 3 (Bounou et al. 1999), AG 8(Tommerup et al. 1995; Yang et al. 1995), and AG 9 (Yanget al. 1996). The technique has been also used to understandthe genetic relatedness of BNR AG-D (Nicolson and Parry1996), UNR (Lilja et al. 1996), and Rhizoctonia endophytes(Shan et al. 2002).
Using the RAPD-PCR method, with isolates of MNRAGs 1 and 8 from Australia and Japan, Duncan et al. (1993)demonstrated considerable polymorphism among R. solanipopulations even within the same geographical region andshowed that isolates from different geographical regionscould be differentiated. RAPD was also a very usefulmethod for rapid typing of MNR isolates (Toda et al.1999a). The genetic relatedness among 41 isolates belong-ing to 11 MNR AGs was assessed by the fragment patternanalysis of amplified genomic DNA by RAPD-, ERIC-(enterobacterial repetitive intergenic consensus), andREP- (repetitive extragenic palindromic) PCR. Most of theisolates were grouped according to their AGs or subgroupsby the RAPD, ERIC, and REP fingerprints. However,there was a significant high level of heterogeneity amongthe isolates of AGs 1-IC, 2, 3, and 4.
Despite its relatively easy use, the RAPD assay has sev-eral drawbacks that must be considered. Despite the reli-ability and reproducibility of RAPD patterns that wereexamined in standard reaction conditions (Tommerup et al.1995), the results from different laboratories may not al-ways be compatible. In addition, some analytical problemsare also associated with the RAPD method. RAPD hasonly two alleles (amplification or nonamplification) for eachamplicon locus. Individual bands are dominant and there-fore may not effectively distinguish homozygotes from het-erozygotes by the interpretation of DNA fingerprints fromRAPD patterns.
However, some of these limitations could be overcomevia conversion of RAPD amplicons into sequence-charac-terized amplified regions (SCARs). Several researchershave explored the use of informative RAPD markers togenerate SCAR primers. Specific primer sets have beenreported to develop a reliable and sensitive assay for thedetection of AG 4 and AG 8 isolates infecting wheat(Brisbane et al. 1995; Bounou et al. 1999), AG 2-2 LPisolates (Toda et al. 2004), and BNR AG-G isolates in soiland plant samples (Leclerc-Potvin et al. 1999).
303
AFLP (amplified fragment length polymorphism)
AFLP provides a novel and very powerful fingerprintingmethod for DNA from any origin or complexity. It is basedon selective PCR amplification of restriction fragmentsfrom a digest of the total genomic DNA. Typically, 50–100restriction fragments are amplified and detected on dena-turing polyacrylamide gels. AFLP is likely to be useful forDNA fingerprinting because a large number of loci can bescreened in one reaction (Vos et al. 1995).
Currently, AFLP fingerprinting was used only byCeresini et al. (2002) to evaluate the genetic diversity offield populations of AG 3 subgroups (PT and TB) inNorth Carolina, based on two independent criteria of AFLPmarkers and somatic compatibility. Each of the PT isolates(32) had distinct AFLP phenotypes, whereas 28 AFLPphenotypes were found among the TB isolates (36).Clones (somatically compatible of the same AFLP pheno-type) were identified only in the TB population, whereasno clones could be detected among isolates of the PTpopulation. In this study, based on a priori knowledgeabout the biology, ecology, and epidemiology of eachpathogen, the hypothesis that the TB populations aremore genetically diverse than the PT populations wasevaluated. However, the results rejected the hypothesis be-cause the TB isolates were represented by fewer AFLPphenotypes and somatic compatible groups than the PTisolates.
The main disadvantage of the AFLP markers is thatalleles cannot be easily recognized. Allelic fragments will bescored as independent although actually they are not, whichcould lead to an overestimation of variation. Nevertheless,AFLP analysis has significant potential as a tool for study-ing the population genetics of Rhizoctonia spp.
RFLP analysis
DNA fingerprints based on RFLPs have been widely usedin fungi. Multilocus minisatellite fingerprints based on hy-bridization of one probe to repetitive DNA sequences havegreater resolution for clone differentiation. Repetitiveprobes were developed for specific fingerprint patterns ofAG 8 (Matthew et al. 1995; Whisson et al. 1995) and AG 3isolates (Balali et al. 1996). This method is more reproduc-ible than RAPD but is technically more laborious. In addi-tion, RFLP analysis requires cloning, Southern blotting, andlabeling the probes, and relatively large amounts of DNAare required from each isolate.
Similar to the RAPD and AFLP markers, multilocusminisatellite fingerprints are also dominant markers thatlimit their potential use in population genetic analysis.Rosewich et al. (1999) developed this new approach using asingle-copy RFLP marker that could unambiguously distin-guish homozygotes from heterozygotes; it is more appropri-ate for elucidating the evolutionary processes. Using theseseven codominant markers, they studied the populationgenetics of AG 1-IA RAPD. Among 182 isolates of the AGcollected from six commercial fields in Texas, 36 multilocus
RFLP genotypes were identified. As there was no evidencefor population subdivision, all the isolates from the rice-growing regions in Texas were considered to be a part of asingle AG 1-IA population. However, four of the seven lociwere in Hardy–Weinberg equilibrium (HWE). In three loci,a significant departure from HWE was observed. They sug-gested that the loci not in HWE could be explained by arecent bottleneck in population size. The possible explana-tion was that the rice pathogen was evidently introducedfrom Asia in the recent past.
Codominant PCR-RFLP markers were used to detectindividual genotypes of AG 3-PT from five fields ofdifferent counties in North Carolina. Multilocus PCR-RFLP genotypes (MRG) were determined by combining aspecific PCR product and restriction enzymes for each ofseven polymorphic loci. The analyzed allelic informationfrom the seven single-locus PCR-RFLP markers yielded 32MGR groups from 104 isolates, indicating high levels ofgene flow among populations (Ceresini et al. 2002, 2003).Subsequently, this method was used to study the migrationof the AG 3-PT populations from potato seed productionsources (northern United States and eastern Canada) torecipient fields (North Carolina). Analysis of the molecularvariation indicated that only little variation in geno-types existed between the seed source and the recipientpopulations or between subpopulations within eachregion, suggesting that the AG 3-PT populations in therecipient country fields originated from the source countryfields.
These multilocus RFLP methods enable unambiguousscoring of isolates genotypes by enabling the distinction ofhomozygotes from heterozygotes. This method is highlyefficient as only small amounts of DNA are initially re-quired. A single-locus RFLP analysis is not likely to play animportant role in population genetics studies of Rhizoctoniaspp.
AT-rich RFLP
AT-DNA RFLPs are generated by digestion of totalDNA with HaeIII. This enzyme digests nuclear DNA tofragments <1 kb whereas AT-rich DNA is cleaved lessfrequently, resulting in discrete large MW bands. DNAfragments obtained by this method were presumed tobe mitochondrial in a number of fungi (Banniza et al.1999).
Distinct AT-DNA RFLP patterns were obtained for iso-lates belonging to different MNR AGs, whereas a lowervariability was evident for AG 1-IA isolates from variouscountries. Isolates obtained from one field experiment con-sisted of only one identical RFLP pattern, but varied intheir simple sequence repeat (SSR)-PCR, indicating thatthey are definitely not of one clone (Banniza and Ruther-ford 2001). These results suggest that the AT-rich DNARFLP method may be suitable for studying different MNRAGs but may not be sufficiently sensitive for distinguishingamong isolates or groups of isolates from different geo-graphical regions.
304
DNA–DNA hybridization
The genome size of R. solani based DNA–DNAreassociation kinetics and electrophoretic karyotypinganalysis is estimated to be about 28–46Mb, and the repe-titive sequences are considerably smaller (8%–17%)(Kuninaga 1996). Fungal genomes are considerably smallerthan those of higher plants and therefore, may be highlyappropriate for DNA hybridization studies. The DNA–DNA hybridization method using spectrophotometric orisotopic assays was performed in the mid-1980s on R. solani(Kuninaga and Yokosawa 1985; Vilgalys 1988). The firstclear demonstration that anastomosis grouping may be thebest indicator of the whole genomic DNA similarities inR. solani was confirmed by this method. DNA similaritiesamong isolates within the same AG were confirmed to be>80% whereas those of isolates among AGs were only<30% (Carling and Kuninaga 1990; Kuninaga 1996).DNA hybridization measures the average DNA similarityof cross-hybridizing sequences, which undoubtedly includesparalogous and orthologous genes. In R. solani, however,this method proved appropriate for determining thatAGs may clearly represent distinct biological species(Sneh et al. 1991; Kuninaga 1996, 2002). However, the hier-archy of AGs could not be resolved by comparingDNA hybridization similarity values because of low hybrid-ization levels among different AGs. More detailed hier-archical phylogenetic groupings of AGs and theirsubgroups were successfully obtained by the followingmore-appropriate methods, which have been introducedsince the early 1990s.
Analysis of ribosomal RNA genes
The readily available PCR primer sets (White et al. 1990)and fungal gene sequences in GenBank facilitated and en-hanced comparable fungal studies, including Rhizoctoniaspp., focused on rDNA analysis.
rDNA RFLP
In most fungi, rDNA includes a tandemly repeated array ofthe three rRNA genes separated by transcribed andnontranscribed spacers with different evolutionary rates. Ina haploid genome of the MNR AG 4 isolates the rRNAgenes are arrayed in about 59 repeated units (Cubeta et al.1996). The initial studies using RFLP analysis after hybrid-ization with an rDNA probe indicated that isolates withinR. solani AGs were characterized by one or more uniqueRFLP patterns (Vilgalys and Gonzalez 1990; Jabaji-Hare etal. 1990). In addition, considerable rDNA variations werefound even among isolates of the same subgroup in AGs 1and 2. On the other hand, the use of RFLP based on South-ern blotting had limited success. The length of mutations,comigration of nonhomologous fragments, and multiplerestriction sites render the use of RFLP patterns only
with probes less appropriate for estimation of geneticrelatedness.
The method based on rDNA-RFLP without hybridiza-tion with a probe provides more-detailed restriction analy-ses. This method includes digestion of PCR-amplifiedrDNA with a restriction enzyme, separation of the resultingDNA fragments according to their size by gel electrophore-sis, and a comparison of the restriction patterns.
PCR-generated rDNA-RFLP was first used for 28SrDNA of BNR (Cubeta et al. 1991). It was first performedin the rDNA-ITS region for MNR (Liu and Sinclair 1992,1993; Liu et al. 1993). The following RFLP studies wereconsiderable for MNR (Liu et al. 1995; Kanematsu andNaito 1995; Keijer et al. 1996; Julian et al. 1996; Schneider etal. 1997; Hyakumachi et al. 1998; Meyer et al. 1998; Nicolettiet al. 1999; Priyatmojo et al. 2001; Godoy-Lutz et al. 2003)and for BNR, using 28S rDNA (Mazzola 1997; Martin 2000)or rDNA-ITS (Sen et al. 1999; Toda et al. 1999b;Kasiamdari et al. 2002; Hyakumachi et al. 2005). PCR-generated rDNA RFLP analyses supported a genetic basisfor the classic anastomosis groups concept. Nevertheless,isolates within AGs are more genetically variable than pre-sumed. These polymorphism variations enabled the estab-lishments of new subgroups within the existing AGs such asin MNR: AG 2–3 (bean foliar blight pathogen), and AG 1-1D (coffee necrotic leaf spot pathogen) (Kanematsu andNaito 1995; Priyatmojo et al. 2001). Godoy-Lutz et al.(2003) provided additional genetically different typeswithin AG 1 and AG 2-2. Similarly, Toda et al. (1999b)differentiated BNR isolates of AG-D to AG-D-(I) (Rhizoc-tonia-patch and bentgrass winter-patch pathogens) and AGD-(II) (elephant-footprint pathogen) by RFLP analysis ofthe rDNA-ITS regions. However, as in RFLP analysis, anumber of fragment differences are used to estimate thedegree of nucleotide divergence, and the presence of inser-tions and deletions (“indels”) are potential sources for er-rors because a single length mutation may result in changesin more than one fragment.
RFLP banding pattern analysis of ITS regions indicatedat least 6 subgroups (1A–1F) in MNR AG 1 and 5 sub-groups in AG 2 (2A–2E; it was subsequently found by anas-tomosis that 2E actually belongs to AG 3) (Liu and Sinclair1992; Liu et al. 1993). Further construction of the ITSrDNA restriction maps for these 11 subgroups indicatedthat DNA length mutations, “indel” events of the shortpiece of DNA, were common among these isolates. It istherefore suggested that heterogeneous RFLP phenotypesdetected in these studies would be attributed to ITS lengthvariation, as many restriction sites are common in theseregions. The complexity of ITS restriction phenotypes weredemonstrated within the BNR AG-I (Sen et al. 1999). De-termination of relatedness of AG-I based solely on bandingpatterns might yield erroneous estimation and consequentlylead to inaccurate conclusions.
RFLP analysis of the 28S rDNA was effective for charac-terizing of BNR isolate to AGs (-Ba, -C, -D, -F, -H, -I, -J,and -K). However, AG-J isolates have been excluded fromRhizoctonia spp. because they have clamp connections(Cubeta et al. 1991). Variations in restriction patterns of
305
28S rDNA were observed, however, among isolates withineach of AGs -I, -J, and -Q (Mazzola 1997), as well as alsoamong isolates within each of AGs -A and -G (Martin2000). Although the 28S rDNA RFLP marker system isconsidered to be useful for identification of BNR AGs,caution should still be used when RFLP patterns generatedfrom a few restriction enzymes are interpreted.
Isolates of several MNR and BNR AGs are known toinclude indels of 400bp in their 28S rRNA subunit (Cubetaet al. 1991; Mazzola 1997; Meyer et al. 1998; Martin 2000).Based on their sequence analysis, it was confirmed that R.solani isolates have about 480-bp indels and that the pres-ence or absence of indels may not be obviously correlatedwith the corresponding AGs (Kuninaga, unpublished data).The presence of indels interferes with the accuracy of theconclusions drawn from the 28S rDNA RFLP analysismethod and its inferences.
rDNA sequence analysis
Most of the aforementioned drawbacks associated with therDNA RFLP method are avoided by the use of the rDNAsequence analysis method, which has been widely used forRhizoctonia spp. since the mid-1990s (Boysen et al. 1996;Kuninaga et al. 1997; Johanson et al. 1998; Boidin et al.1998; Salazar et al. 1999; 2000b; Kuninaga et al. 2000a,b;Pope and Carter 2001; Carling et al. 2002; Toda et al. 2004).Currently, the DNA sequence information seems to offerthe most accurate way for establishing the taxonomic andphylogenetic relationships for Rhizoctonia spp.
Generally the 5.8S region was found to be conserved inR. solani (Kuninaga et al. 1997), while some sequence varia-tions were found in this region among BNR AGs isolates(Kuninaga, unpublished data), On the other hand, highernucleotide sequence variations in both ITS1 and ITS2 werefound among isolates of different AGs and subgroups thanwithin AGs, as well as host range and other biological crite-ria (Kuninaga et al. 1997; Kuninaga 2002).
The genetic relatedness of R. solani AGs was compre-hensively studied by Kuninaga et al. (1997). A percent simi-larity higher than 96% of the ITS sequence was evident forisolates within an AG subgroup, 66%–100% for isolates ofdifferent subgroups within an AG, and 55%–96% for iso-lates among different AGs. AG 2 is highly heterogenic andincludes a considerable number of subgroups, which aresubdivided according to their morphology, virulence, nutri-tional requirements, and hyphal anastomosis frequency.Currently, subgroups 2-1, 2-2 IIIB, 2-2 IV, 2-2 LP, 2-3, 2-4,and 2-BI are included in AG 2 (Carling et al. 2002).Subgrouping of AG 2 using ITS sequence analysis was con-sistent with the above-listed subgroups (Salazar et al. 1999,2000a; Carling et al. 2002).
Similarly, the rDNA-ITS sequence analysis most accu-rately divided subgroups within AG 1 (Kuninaga et al. 1997;Toda et al. 2004), AG 3 (Kuninaga et al. 2000a), AG 4(Boysen et al. 1996; Kuninaga et al. 1997), and AGs 6 (Popeand Carter 2001). The mycorrhizal isolates belonging toAGs 6 and 12 were placed on separate clusters in the tree,
despite their functional similarities; these AGs are likely tohave a separate evolutionary background. In addition, AG6 isolates from the Southern Hemisphere (Australia andAfrica) were distinctly divided from the isolates of theNorthern Hemisphere (Japan and the United States), indi-cating that isolates from these geographically separate re-gions have evolved independently.
Combined analyses of the phylogenetic relationships ofBNR (Ceratobasidium) and MNR (Thanatephorus) by cla-distic analyses of ITS and 28S rDNA sequences revealed atotal of 31 genetically distinct groups (21 MNR and 10 BNRgroups), which corresponded well with previously recog-nized AGs and subgroups (Gonzalez et al. 2001). The phy-logenetic analysis further suggested that certain AGs arenot monophyletic and that there is a greater taxonomicsupport for AG subgroups than for AGs.
Fewer studies were reported on rDNA-ITS sequenceanalyses of BNR isolates than on MNR isolates (Gonzálezet al. 2002; Otero et al. 2002; Ma et al. 2003; Hyakumachi etal. 2005; Sharon et al., in preparation). Hyakumachi et al.(2005) reported on two new BNR AGs according to theirphylogenetic tree based on the rDNA-ITS sequence analy-sis: AG-T (the cut flower root and stem rot pathogen, AG-CUT) and AG-U (the miniature roses pathogen, AG-Min).The isolates of AG-T were subsequently found to actuallybelong to AG-A, indicating that AG-T had been in-accurately designated (Sharon, Sneh, Kuninaga, andHyakumachi, unpublished data). Pathogenic BNR isolatesof strawberries were identified by rDNA-ITS sequenceanalysis in consistent clades to AGs -A, -F, -G, -I, and -K(Sharon et al., in preparation).
Otero et al. (2002) studied endophytic BNR isolates us-ing ITS sequence analysis. Of these isolate sequences, twomain clades appeared on the phylogenetic tree. One (22 of26 isolates) was located close to AG-Q, while the other (2isolates) was close to AG-H. One of the other two isolateswas located in the AG-A clade. All the isolates from thisstudy except for one (jto 109) had a low percent (%) of ITSsequence similarity with that of previously recognized BNRAG (Kuninaga, unpublished data). Ma et al. (2003) com-pared ITS sequences of Epulorhiza (synonym, R. repens)type BNR isolates from orchids with database isolate se-quences. The ITS sequence identity ranged from 88% to100% among isolates of E. repens and from 98% to 100%among isolates of E. calendulina, whereas between thespecies it was only 18%–44%. No matching sequenceshave been found in the GenBank for E. repens andE. calendulina.
The above-described information indicates that addi-tional work with many more BNR isolates may identifyadditional new AGs and subgroups and provide significantsupport for the accuracy of phylogenetic analysis of rDNA-ITS sequences for BNR isolates.
A significant advantage in the use of rDNA sequenceanalysis is apparent from its applicability for constructingPCR primers for diagnostic purposes. Use of the ITS re-gions for the production of specific primers has proved to bea successful strategy for developing diagnostic assays forsubgroups within R. solani AGs (Kuninaga 2003).
306
Specific primers designed from unique regions within theITS regions have been developed for detection and identi-fication of Rhizoctonia spp. isolates: for the rice sheathdisease complex [(caused by R. solani, R. oryzae, and R.oryzae-sativae (Johanson et al. 1998)], as well as for differ-entiation of R. oryzae and AG 8 (wheat pathogens)(Mazzola et al. 1996). PCR primers developed for identifi-cation of MNR subgroups of AG 2 (2-1, 2-2 IIIB, 2-2 IV, 2-2 LP, 2-3, 2-4, and 2-BI) have led to the production ofdiagnostic primers for rapid and reliable identification ofthese seven subgroups (Salazar et al. 2000b; Carling et al.2002). Specific primer sets were also developed to differen-tiate between the two AG 3 subgroups, 3-PT and 3-TB(Kuninaga et al. 2000a; Matthew et al. 1995). Real-timePCR assays using TaqMan probes have been described forAG 3-PT from soil and on potato tubers (Lee et al. 2002).Specific PCR primers designed from the 28S rDNA regionwere successfully used for the identification of MNR sub-groups of AG 1 (-IA, -IB, and -IC) and AG 2 (2-1 and 2-2)(Matsumoto 2002).
The ITS-based specific PCR primers may be used in asimple assay for detection of the pathogen in plant materialin the absence of visual black scurf disease symptoms and insoil at a level of 0.5mg sclerotia/g soil (Lee et al. 2002).
Detailed classification of MNR isolates to AGs andsubgroups by rDNA-ITS sequence analysis
Cluster analyses based on rDNA-ITS sequence of represen-tatives of anastomosis groups and subgroups of Rhizoctoniaspp. isolates have been reported (Liu and Sinclair 1992;Kasimadri et al. 2002; Kuninaga et al. 1997; Salazar et al.2000a; Gonzalez et al. 2001; Carling et al. 2002; Toda et al.2004). Applications of rDNA-ITS sequence analysis areexpected to greatly advance our knowledge regardingRhizoctonia spp. taxonomy because it enables a direct com-parison of sequence data from different research groups.The publication of rDNA-ITS sequences and their deposi-tion in databases facilitate the identification and confirma-tion of AG affinities of new or existing Rhizoctonia spp.isolates without the need to actually use the various AG-representative isolates or the hyphal fusion procedure.However, with the accumulation of additional sequencedata, there are concerns regarding the existence of inaccu-rate data in the databases available in GenBank, such asmislabeled isolates and other errors introduced during se-quence analysis (as are subsequently described). Such er-rors have already been included in scientific publicationsand copied by researchers in their subsequent publications.When sequence data that are very difficult to align are used,specific caution should be taken to avoid inaccurate andmisleading conclusions.
In several publications, rDNA-ITS sequences of onlyone isolate per AG were used for cluster analysis (Gonzalezet al. 2001, 2002; Salazar et al. 2000). When the sequencewas from an incorrectly designated isolate as discussed bySharon et al. (in preparation), misinterpretation of the re-sults and wrong conclusions were drawn. In these publica-tions, there were no considerations in the discussion to
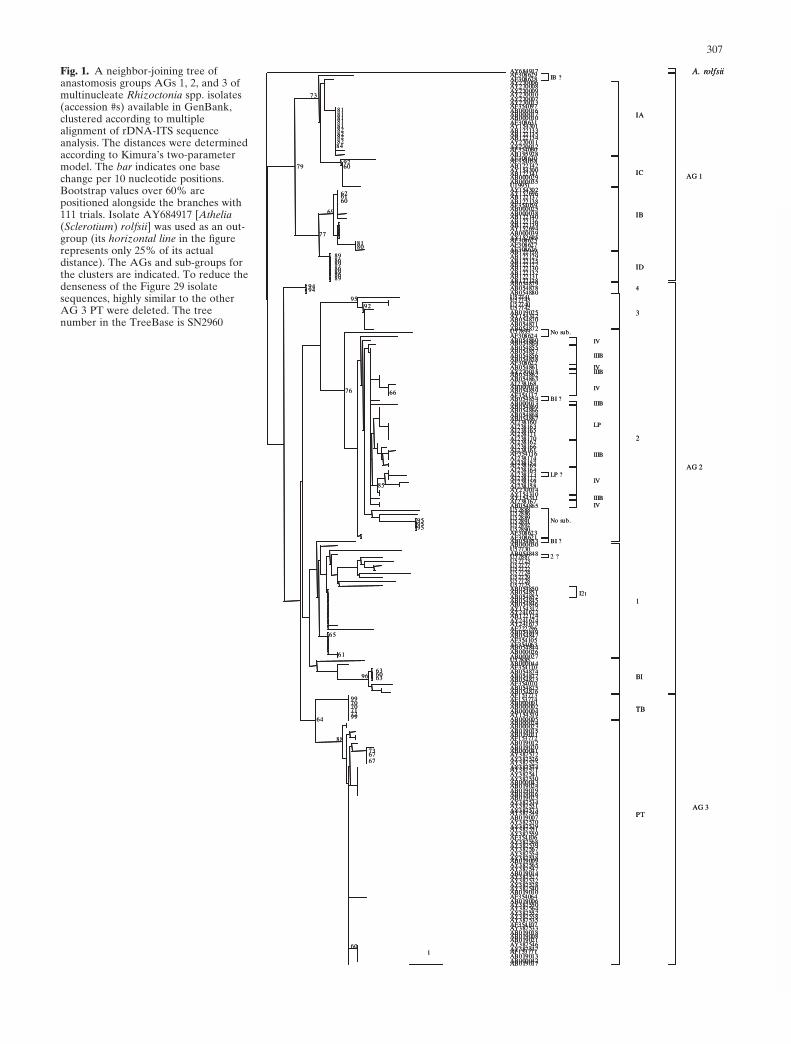
isolates or clusters that are located in unclear locations inthe trees. In addition, as a result of significant variations insequences of some isolates within AGs or subgroups, whichis defined in percent similarity, the use of several isolatesper group or subgroup and not only one isolate per group isexpected to increase the reliability of the analysis and toverify the location of the isolates in their correct separateclusters. Also, isolates of a certain subgroups are located indifferent subclusters in between other subgroups as in thecase of AGs 2 2-IIIB, 2 2-IV, and 2 2-LP (Carling et al. 2002;Fig. 1). Such diversity could not be observed using only oneor two isolates.
Currently, the rDNA-ITS sequences deposited inGenBank vary significantly; from longer rDNA-ITS se-quences of AG 2-2IV (isolate BC10) of about 678bp toshorter sequences of W. (R.) circinata of about 570bp.Multiple alignment containing ITS sequences lacking a sub-stantial portion of the start or the end resulted in an inaccu-rate analysis and therefore were omitted from thesummarized isolate sequences. To obtain a better standard-ization of the deposited rDNA-ITS sequences in GenBank,it is recommended to deposit only complete sequences;starting with the end of the conserved area of 18S (primersITS1-TCCGTAGGTGAACCTGCGG or ITS5-GGAAGTAAAAGTCGTAACAAGG) and ending at the begin-ning of the conserved area of the 28S region (primer ITS4-TCCTCCGCTTATTGATATGC).
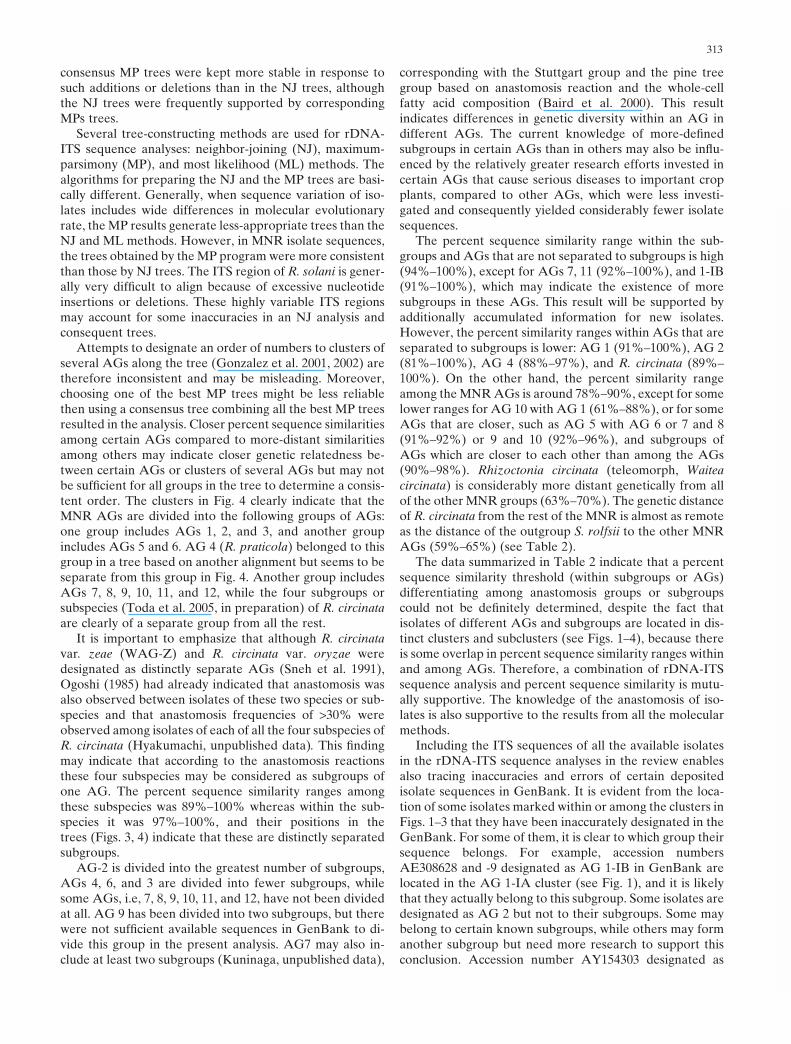
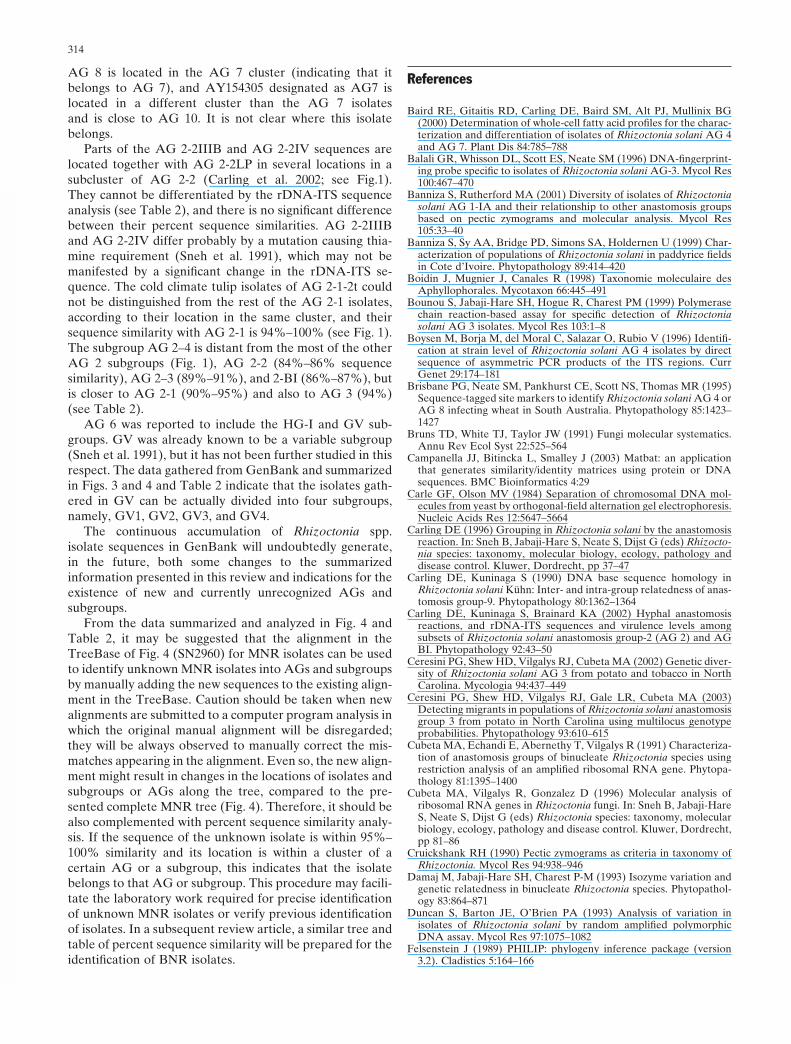
In the present review, the rDNA-ITS sequences of all theisolates designated to MNR AGs available in GenBank(during 2005) were initially retrieved and analyzed with theClustal W program from DDBJ (DNA Data Bank of Japan,Research Organization of Information and Systems,National Institute of Genetics, Shizuoka, Japan: http://www.ddbj.nig.ac.jp) for multiple alignment, and addition-ally manual multialignments were performed using theGenedoc program, version 2.5.000 (Nicholas et al. 1997).Manual alignment has to be meticulously performed, eventhough there may be more than one correct alignment. Theanastomosis grouping provides the researcher the frame-work for choosing the most appropriate manual alignment.The MP analysis frequently provides more than one accu-rate tree, and the researcher can either choose the mostappropriate tree according to past knowledge or create aconsensus tree based on all the most parsimonious trees. Asit was technically impossible to include all the availableMNR isolate sequences in one tree, three neighbor-joining(NJ) trees were initially prepared, using the Clustal W pro-gram at DDBJ. One tree included the AGs 1, 2, and 3 andtheir subgroups (see Fig. 1). The second tree included AGs4, 5, and 6 (Fig. 2), and the third tree included AGs 7, 8, 9,10, 11, 12, and R. circinata (Fig. 3). Representative isolates(distantly located in each clusters) from each AG and eachsubgroup were selected for the subsequent analysis of allthe MNR AGs together in one consensus maximum-parsimony (MP) tree (Fig. 4), using the programs “dna-pars,” followed by the consense program that generates aconsensus tree from all the best possible trees. Bootstrapvalues were calculated with the seqboot program using 1000replicates. “dnapars,” “consense,” and “seqboot” were all
307
AY684917AF308629AF308628AY270006AY270008AY270009AY270010AY270007AY270013AF354097AB000016AB000017AB000010AF308631AY154301AB122133AB122135AB122134AY270011AY270012AF354060AB195928AF308630AF354058AB122142AY154300AB122141AB000029AB000035U19951AY154302AY152696AB122137AB122138AF354059AB000025AB000038AB122140AB122136AB122139AY152694AB000039AY152695AF308625AF308627AF308626AB122126AB122129AB122125AB122127AB122130AB122132AB122131AB122128AB054879AB054878AB054880U57741U57743U57740U57742AB019025AY154312AB054870AB054871AB054872U57893AF308624AB054860AB054864AB054855AB054857AB054856AB054858AF308622AB054861AY270015AB054862AB054863AJ238168AB000014AB054859AF354117AB054854AB000013AB054869AB054866AB054868AB054867AJ238160AJ238163AJ238165AJ238171AJ238170AJ238162AJ238166AJ238161AF354116AJ238174AJ238157AJ238169AJ238164AJ238173AJ238172AJ238159AJ238158AY270014AY154310AY154311AJ238167AB054865U57888U57886U57889U57891U57892U57890AF308623AF308621AB054853AB000030U57730AB054848U57887U57723U57727U57722U57724U57729U57728U57725AB054850AB054851AB054852AB054845AB054846AY154317AY241672AB122124AY241674AY241673AF222796AB054849AB054847AF354105AF354063AB054844AB000026AB000027U57885AB000044AF354110AB054874AB054877AB054873AF354070AB054875AB054876AF153773AF153774AB000001AB000002AB000004AY154319AB000005AB000024AB000023AB019015AB019011AF153772AB019012AB019020AB000041AY387572AY387526AY387525AY387574AY387571AY387541AY387530AB000043AB019024AB019019AB019016AB019023AY387534AY387531AY387573AY387549AB019007AY387570AY387529AY387551AY387559AF354106AY387568AY387539AY387567AY387554AY387538AB019009AY387565AY387547AB019014AY387527AY387532AY387528AY387540AB019010AF354064AB019006AY387550AY387564AY387552AY387558AY387535AF354107AY387533AB019018AB019008AB019021AY387546AY387537AF153771AB019013AB000042AB019017
1
84828282828181818181
6092
73
606162
8081
69
89868986898689
77
79
9494
9295
66
85
959595
76
61
65
636063
96
997271707099
676773
60
88
64
A. rolfsiiIB ?
IA
IC
IB
4
ID
3
No sub.
IV
IIIB
IVIIIB
IV
BI ?IIIB
LP
IIIB
IVLP ?
IIIBIV
No sub.
BI ?
1
2 ?
I2t
BI
TB
PT
2
AG 3
AG 1
AG 2
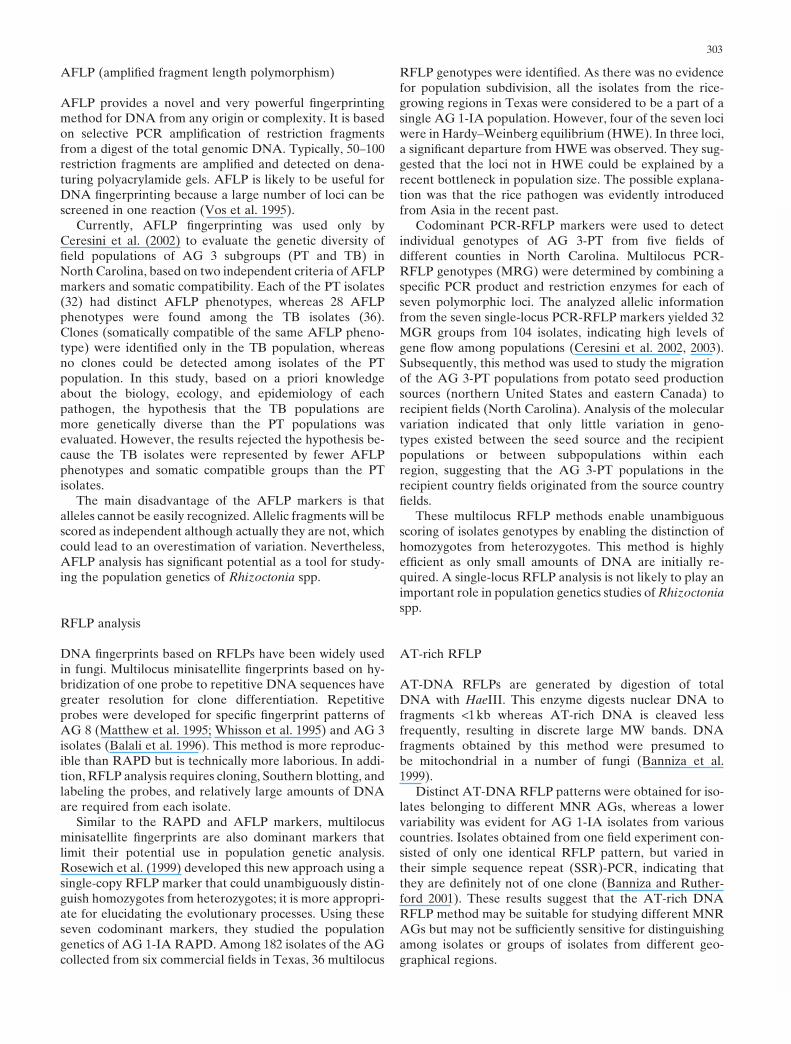
Fig. 1. A neighbor-joining tree ofanastomosis groups AGs 1, 2, and 3 ofmultinucleate Rhizoctonia spp. isolates(accession #s) available in GenBank,clustered according to multiplealignment of rDNA-ITS sequenceanalysis. The distances were determinedaccording to Kimura’s two-parametermodel. The bar indicates one basechange per 10 nucleotide positions.Bootstrap values over 60% arepositioned alongside the branches with111 trials. Isolate AY684917 [Athelia(Sclerotium) rolfsii] was used as an out-group (its horizontal line in the figurerepresents only 25% of its actualdistance). The AGs and sub-groups forthe clusters are indicated. To reduce thedenseness of the Figure 29 isolatesequences, highly similar to the otherAG 3 PT were deleted. The treenumber in the TreeBase is SN2960
308
0.1
AY684917AF153783AF153782AB000022AF153780AF153779
9998
98
AY154304AF354104AF354101
7074
AB000019AF354103AF354102AY154306
646489
AF153790AF153789AF153788
9972
AF153785AF153786AF153787AF153784
1009899
71
100
AF478452AB000021AF354113AF354112
8482
AF153777AY154314
69
AF153778AY545999
6574
100
99
97
AY152697AY154659AY152813AF354076AF354075AY152811AY152812AY154660AY154309DQ021449DQ102449AF354077
99999999999998989899
100
77
AY387543AB000007AB000015AB000012DQ102445AY154307AY387542AB122143AF478449AF478450AF478451DQ102446AY387544
9265736671667167716596
84
AY270001DQ102447DQ102448AB000031AB000028AB000018AY152699AY152700AY152702DQ021450AY152703
75
73
AY152705AY152704
8561
AY152698AY152701AY089956AY270004AY270002AY270003
60
72
AF222795AF354073AF222797AY154308AY270005AF222798AF153776AF153775AB000045AB000036AB000034AB000033AB000032AB000020AB000009AB000008AB000006AF354072AF354074AF222794
69
A. rolfsii
Gv1
Gv2
HG-I
Gv3
Gv4
AG 6
AG 5
HG-III
HG-I
HG-II
AG 4
25 % of length
0.1
AY684917AF153783AF153782AB000022AF153780AF153779
9998
98
AY154304AF354104AF354101
7074
AB000019AF354103AF354102AY154306
646489
AF153790AF153789AF153788
9972
AF153785AF153786AF153787AF153784
1009899
71
100
AF478452AB000021AF354113AF354112
8482
AF153777AY154314
69
AF153778AY545999
6574
100
99
97
AY152697AY154659AY152813AF354076AF354075AY152811AY152812AY154660AY154309DQ021449DQ102449AF354077
99999999999998989899
100
77
AY387543AB000007AB000015AB000012DQ102445AY154307AY387542AB122143AF478449AF478450AF478451DQ102446AY387544
9265736671667167716596
84
AY270001DQ102447DQ102448AB000031AB000028AB000018AY152699AY152700AY152702DQ021450AY152703
75
73
AY152705AY152704
8561
AY152698AY152701AY089956AY270004AY270002AY270003
60
72
AF222795AF354073AF222797AY154308AY270005AF222798AF153776AF153775AB000045AB000036AB000034AB000033AB000032AB000020AB000009AB000008AB000006AF354072AF354074AF222794
69
A. rolfsii
Gv1
Gv2
HG-I
Gv3
Gv4
AG 6
AG 5
HG-III
HG-I
HG-II
AG 4
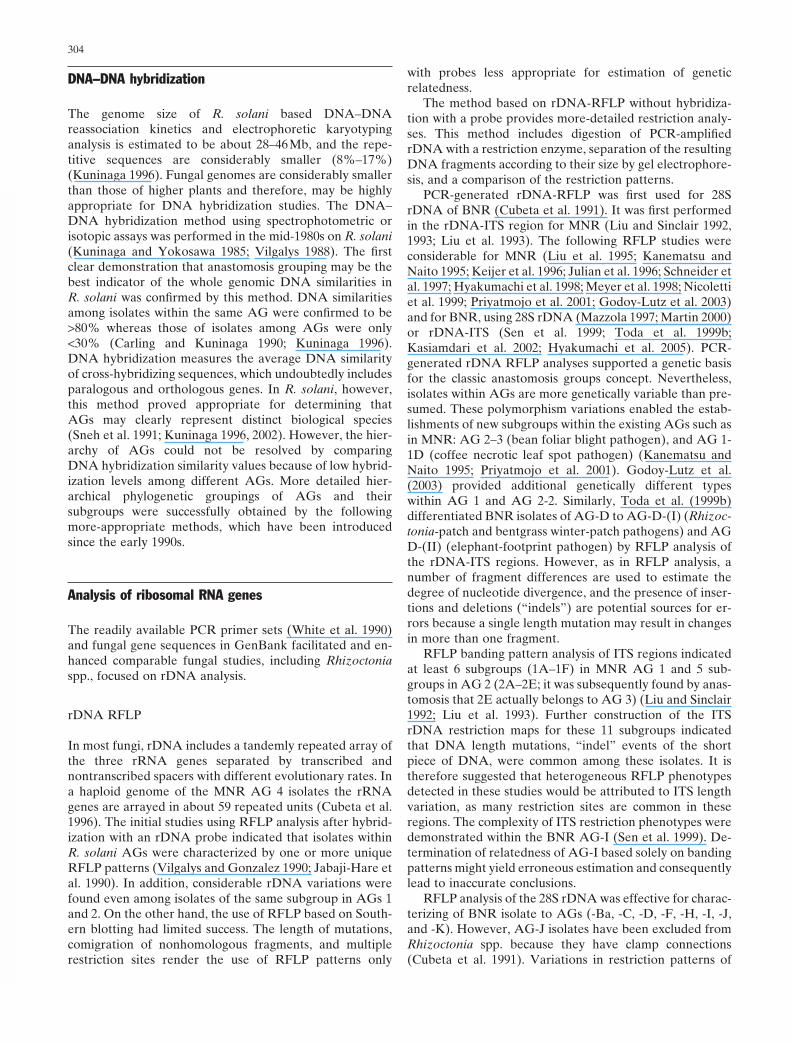
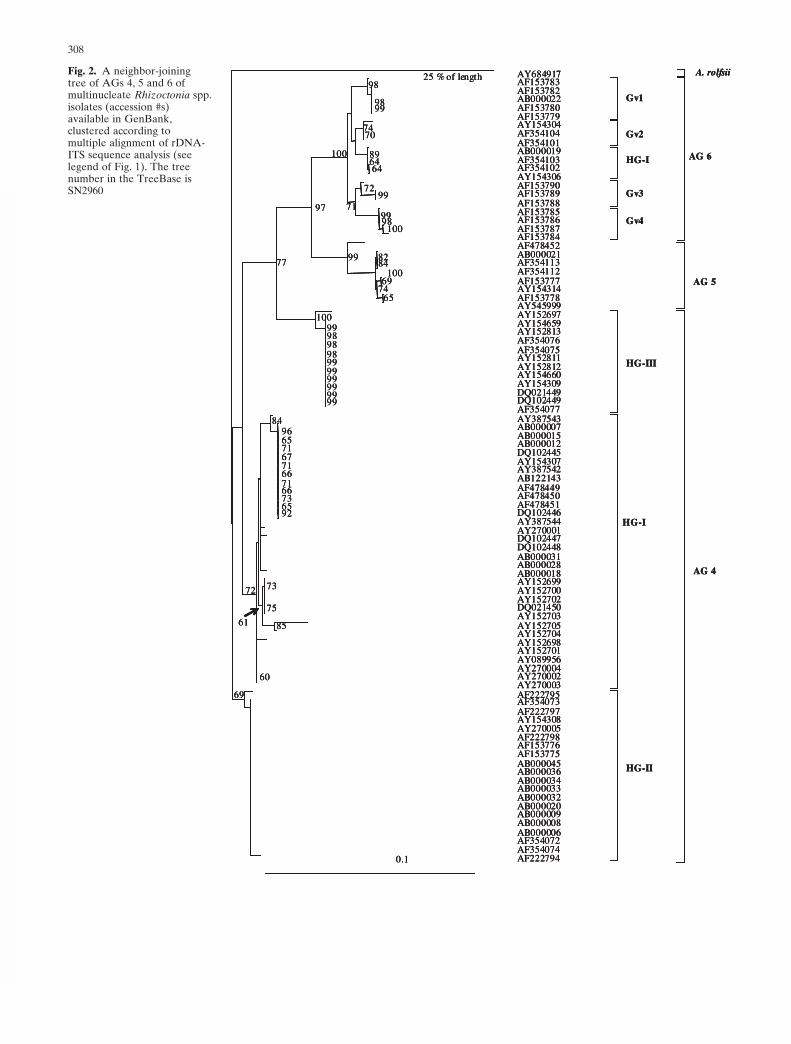
25 % of lengthFig. 2. A neighbor-joiningtree of AGs 4, 5 and 6 ofmultinucleate Rhizoctonia spp.isolates (accession #s)available in GenBank,clustered according tomultiple alignment of rDNA-ITS sequence analysis (seelegend of Fig. 1). The treenumber in the TreeBase isSN2960
309
A. rolfsii
zeaeagrostis
circinataoryzae
W. circinata
AG 11
AG 8
AG 8 ? AG 7
AG 12
0.1
AY684917AB213595AB213592AB213597AB213594AB213596AB213593100
656571
AB213567AB213569AB213572AB213570AB213576AB213573AB213568AB213575AB213578AB213574AB213577AB21357170
70706969828989898989
AB213579AB213580AB213585AF222799AB213582AB213583AB213584AB213586AB213587AB213581
6892
61
AB213588AJ000196AB213590AB213589100AB213591AJ000195
100
AF354114AB019027AY154313AF354115
7797
AF354079AF153802100
70
AF354066AF153797AF354067AF15379877
64
AB000011AF153799AF354068AF35406967
76
78
AF153794AF15379395AF354098AF354099AY154303AF354096AF153791AB000003AF354100
99
AF153804AF153806AF153805AF153803
85
AY154305AF354111AF35407199AF153800AF153801AY154318AB01902687
8493
AF354065AB000046AY154315AB000037AF354109AY15431670AF354108
6780
70
87
100
AG 7 ?
AG 10
AG 9
(25% of length) A. rolfsii
zeaeagrostis
circinataoryzae
W. circinata
AG 11
AG 8
AG 8 ? AG 7
AG 12
0.1
AY684917AB213595AB213592AB213597AB213594AB213596AB213593100
656571
AB213567AB213569AB213572AB213570AB213576AB213573AB213568AB213575AB213578AB213574AB213577AB21357170
70706969828989898989
AB213579AB213580AB213585AF222799AB213582AB213583AB213584AB213586AB213587AB213581
6892
61
AB213588AJ000196AB213590AB213589100AB213591AJ000195
100
AF354114AB019027AY154313AF354115
7797
AF354079AF153802100
70
AF354066AF153797AF354067AF15379877
64
AB000011AF153799AF354068AF35406967
76
78
AF153794AF15379395AF354098AF354099AY154303AF354096AF153791AB000003AF354100
99
AF153804AF153806AF153805AF153803
85
AY154305AF354111AF35407199AF153800AF153801AY154318AB01902687
8493
AF354065AB000046AY154315AB000037AF354109AY15431670AF354108
6780
70
87
100
AG 7 ?
AG 10
AG 9
A. rolfsii
zeaeagrostis
circinataoryzae
W. circinata
AG 11
AG 8
AG 8 ? AG 7
AG 12
0.1
AY684917AB213595AB213592AB213597AB213594AB213596AB213593100
656571
AB213567AB213569AB213572AB213570AB213576AB213573AB213568AB213575AB213578AB213574AB213577AB21357170
70706969828989898989
AB213579AB213580AB213585AF222799AB213582AB213583AB213584AB213586AB213587AB213581
6892
61
AB213588AJ000196AB213590AB213589100AB213591AJ000195
100
AF354114AB019027AY154313AF354115
7797
AF354079AF153802100
70
AF354066AF153797AF354067AF15379877
64
AB000011AF153799AF354068AF35406967
76
78
AF153794AF15379395AF354098AF354099AY154303AF354096AF153791AB000003AF354100
99
AF153804AF153806AF153805AF153803
85
AY154305AF354111AF35407199AF153800AF153801AY154318AB01902687
8493
AF354065AB000046AY154315AB000037AF354109AY15431670AF354108
6780
70
87
100
AG 7 ?
AG 10
AG 9
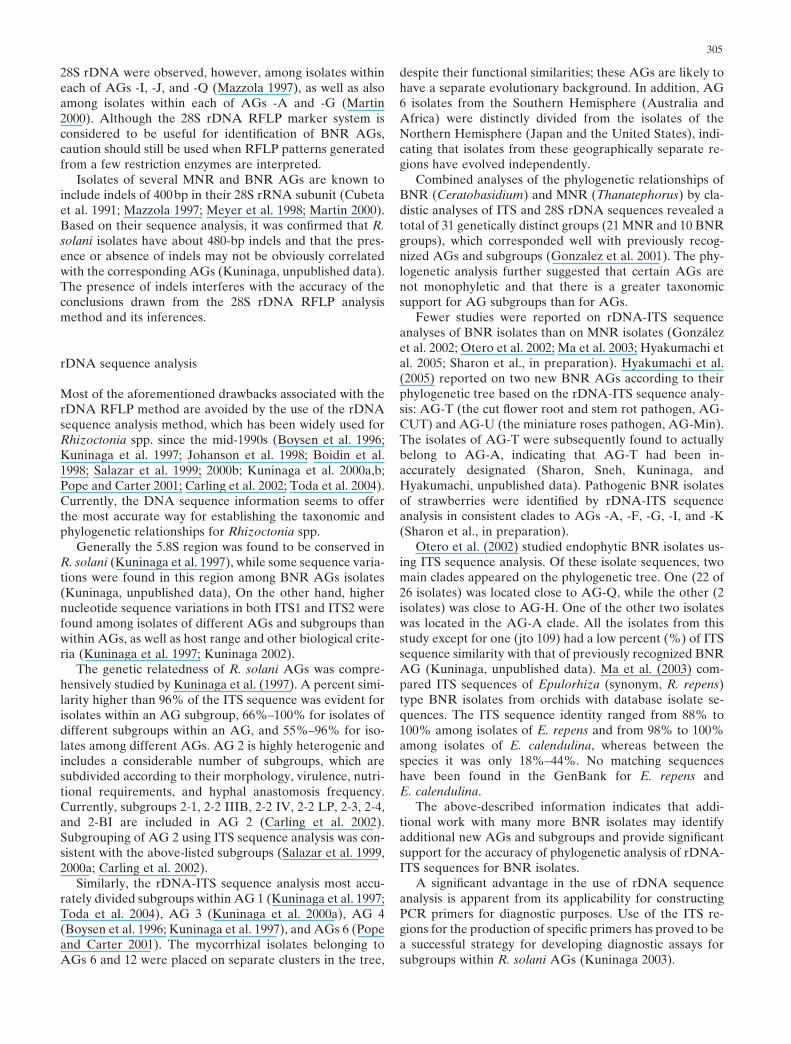
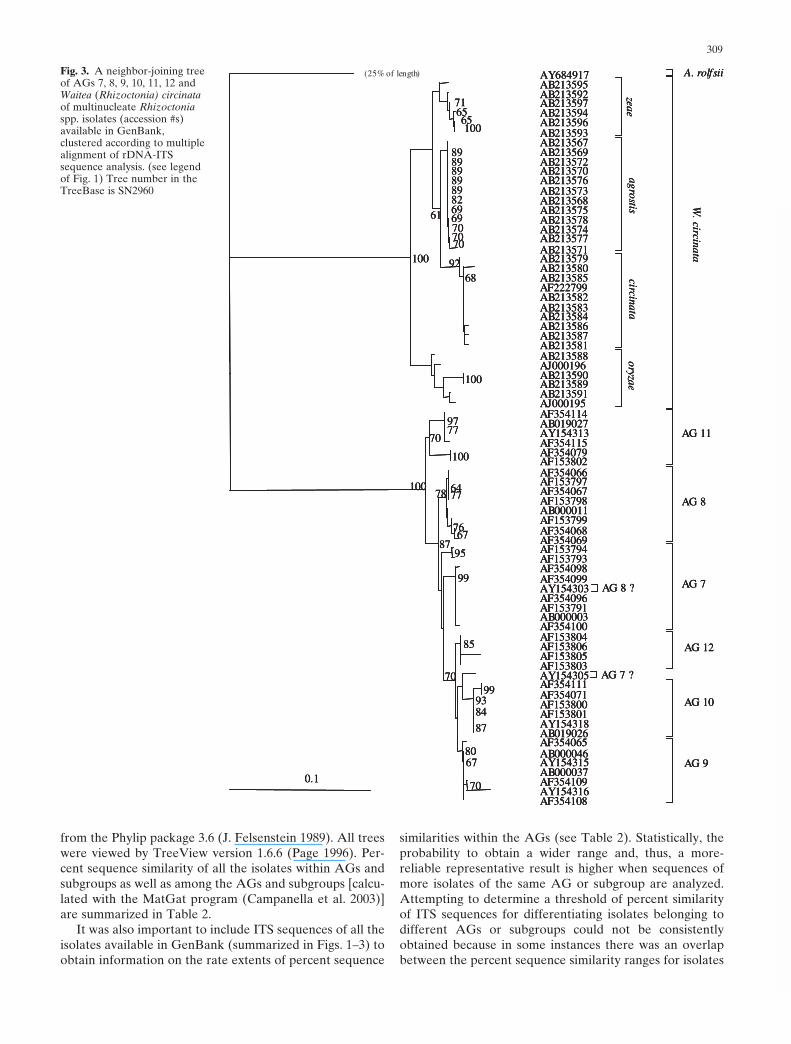
Fig. 3. A neighbor-joining treeof AGs 7, 8, 9, 10, 11, 12 andWaitea (Rhizoctonia) circinataof multinucleate Rhizoctoniaspp. isolates (accession #s)available in GenBank,clustered according to multiplealignment of rDNA-ITSsequence analysis. (see legendof Fig. 1) Tree number in theTreeBase is SN2960
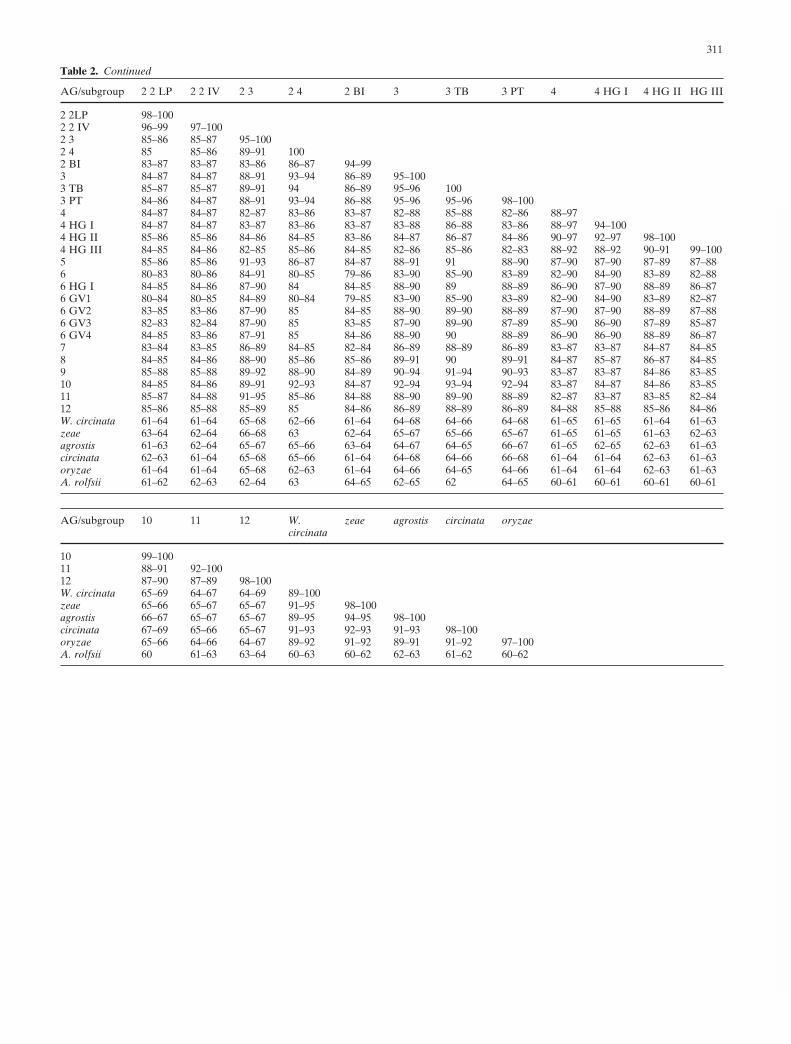
from the Phylip package 3.6 (J. Felsenstein 1989). All treeswere viewed by TreeView version 1.6.6 (Page 1996). Per-cent sequence similarity of all the isolates within AGs andsubgroups as well as among the AGs and subgroups [calcu-lated with the MatGat program (Campanella et al. 2003)]are summarized in Table 2.
It was also important to include ITS sequences of all theisolates available in GenBank (summarized in Figs. 1–3) toobtain information on the rate extents of percent sequence
similarities within the AGs (see Table 2). Statistically, theprobability to obtain a wider range and, thus, a more-reliable representative result is higher when sequences ofmore isolates of the same AG or subgroup are analyzed.Attempting to determine a threshold of percent similarityof ITS sequences for differentiating isolates belonging todifferent AGs or subgroups could not be consistentlyobtained because in some instances there was an overlapbetween the percent sequence similarity ranges for isolates
310
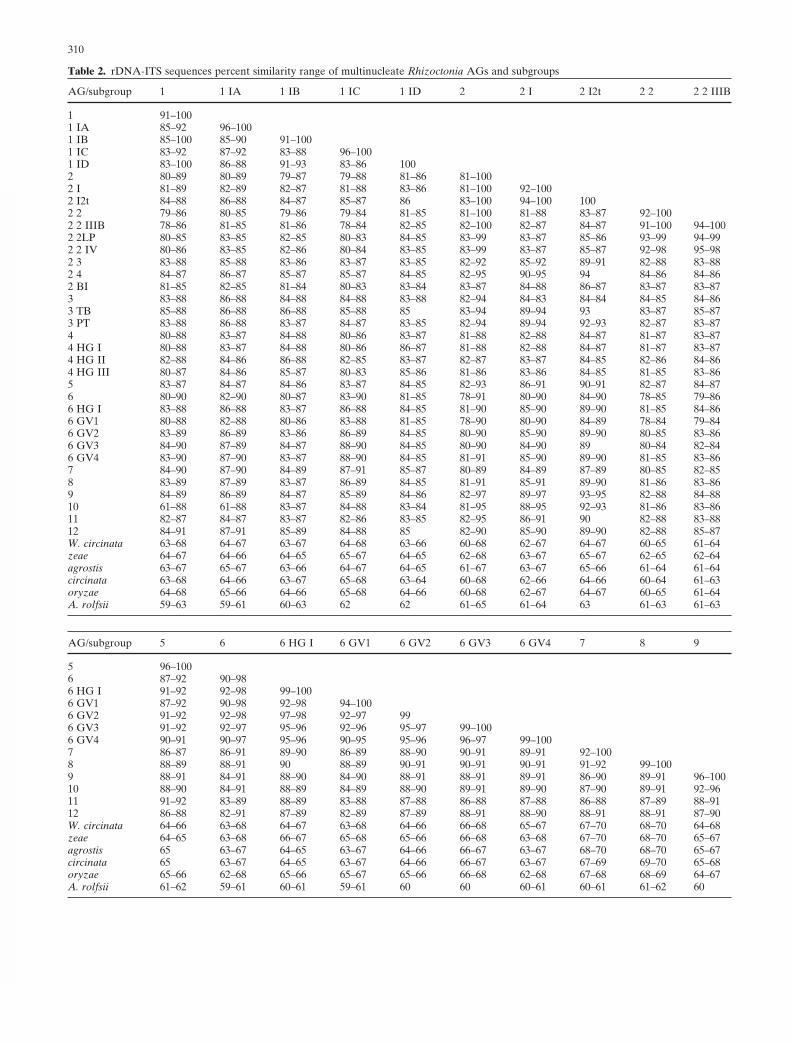
Table 2. rDNA-ITS sequences percent similarity range of multinucleate Rhizoctonia AGs and subgroups
AG/subgroup 1 1 IA 1 IB 1 IC 1 ID 2 2 I 2 I2t 2 2 2 2 IIIB
1 91–1001 IA 85–92 96–1001 IB 85–100 85–90 91–1001 IC 83–92 87–92 83–88 96–1001 ID 83–100 86–88 91–93 83–86 1002 80–89 80–89 79–87 79–88 81–86 81–1002 I 81–89 82–89 82–87 81–88 83–86 81–100 92–1002 I2t 84–88 86–88 84–87 85–87 86 83–100 94–100 1002 2 79–86 80–85 79–86 79–84 81–85 81–100 81–88 83–87 92–1002 2 IIIB 78–86 81–85 81–86 78–84 82–85 82–100 82–87 84–87 91–100 94–1002 2LP 80–85 83–85 82–85 80–83 84–85 83–99 83–87 85–86 93–99 94–992 2 IV 80–86 83–85 82–86 80–84 83–85 83–99 83–87 85–87 92–98 95–982 3 83–88 85–88 83–86 83–87 83–85 82–92 85–92 89–91 82–88 83–882 4 84–87 86–87 85–87 85–87 84–85 82–95 90–95 94 84–86 84–862 BI 81–85 82–85 81–84 80–83 83–84 83–87 84–88 86–87 83–87 83–873 83–88 86–88 84–88 84–88 83–88 82–94 84–83 84–84 84–85 84–863 TB 85–88 86–88 86–88 85–88 85 83–94 89–94 93 83–87 85–873 PT 83–88 86–88 83–87 84–87 83–85 82–94 89–94 92–93 82–87 83–874 80–88 83–87 84–88 80–86 83–87 81–88 82–88 84–87 81–87 83–874 HG I 80–88 83–87 84–88 80–86 86–87 81–88 82–88 84–87 81–87 83–874 HG II 82–88 84–86 86–88 82–85 83–87 82–87 83–87 84–85 82–86 84–864 HG III 80–87 84–86 85–87 80–83 85–86 81–86 83–86 84–85 81–85 83–865 83–87 84–87 84–86 83–87 84–85 82–93 86–91 90–91 82–87 84–876 80–90 82–90 80–87 83–90 81–85 78–91 80–90 84–90 78–85 79–866 HG I 83–88 86–88 83–87 86–88 84–85 81–90 85–90 89–90 81–85 84–866 GV1 80–88 82–88 80–86 83–88 81–85 78–90 80–90 84–89 78–84 79–846 GV2 83–89 86–89 83–86 86–89 84–85 80–90 85–90 89–90 80–85 83–866 GV3 84–90 87–89 84–87 88–90 84–85 80–90 84–90 89 80–84 82–846 GV4 83–90 87–90 83–87 88–90 84–85 81–91 85–90 89–90 81–85 83–867 84–90 87–90 84–89 87–91 85–87 80–89 84–89 87–89 80–85 82–858 83–89 87–89 83–87 86–89 84–85 81–91 85–91 89–90 81–86 83–869 84–89 86–89 84–87 85–89 84–86 82–97 89–97 93–95 82–88 84–8810 61–88 61–88 83–87 84–88 83–84 81–95 88–95 92–93 81–86 83–8611 82–87 84–87 83–87 82–86 83–85 82–95 86–91 90 82–88 83–8812 84–91 87–91 85–89 84–88 85 82–90 85–90 89–90 82–88 85–87W. circinata 63–68 64–67 63–67 64–68 63–66 60–68 62–67 64–67 60–65 61–64zeae 64–67 64–66 64–65 65–67 64–65 62–68 63–67 65–67 62–65 62–64agrostis 63–67 65–67 63–66 64–67 64–65 61–67 63–67 65–66 61–64 61–64circinata 63–68 64–66 63–67 65–68 63–64 60–68 62–66 64–66 60–64 61–63oryzae 64–68 65–66 64–66 65–68 64–66 60–68 62–67 64–67 60–65 61–64A. rolfsii 59–63 59–61 60–63 62 62 61–65 61–64 63 61–63 61–63
AG/subgroup 5 6 6 HG I 6 GV1 6 GV2 6 GV3 6 GV4 7 8 9
5 96–1006 87–92 90–986 HG I 91–92 92–98 99–1006 GV1 87–92 90–98 92–98 94–1006 GV2 91–92 92–98 97–98 92–97 996 GV3 91–92 92–97 95–96 92–96 95–97 99–1006 GV4 90–91 90–97 95–96 90–95 95–96 96–97 99–1007 86–87 86–91 89–90 86–89 88–90 90–91 89–91 92–1008 88–89 88–91 90 88–89 90–91 90–91 90–91 91–92 99–1009 88–91 84–91 88–90 84–90 88–91 88–91 89–91 86–90 89–91 96–10010 88–90 84–91 88–89 84–89 88–90 89–91 89–90 87–90 89–91 92–9611 91–92 83–89 88–89 83–88 87–88 86–88 87–88 86–88 87–89 88–9112 86–88 82–91 87–89 82–89 87–89 88–91 88–90 88–91 88–91 87–90W. circinata 64–66 63–68 64–67 63–68 64–66 66–68 65–67 67–70 68–70 64–68zeae 64–65 63–68 66–67 65–68 65–66 66–68 63–68 67–70 68–70 65–67agrostis 65 63–67 64–65 63–67 64–66 66–67 63–67 68–70 68–70 65–67circinata 65 63–67 64–65 63–67 64–66 66–67 63–67 67–69 69–70 65–68oryzae 65–66 62–68 65–66 65–67 65–66 66–68 62–68 67–68 68–69 64–67A. rolfsii 61–62 59–61 60–61 59–61 60 60 60–61 60–61 61–62 60
311
Table 2. Continued
AG/subgroup 2 2 LP 2 2 IV 2 3 2 4 2 BI 3 3 TB 3 PT 4 4 HG I 4 HG II HG III
2 2LP 98–1002 2 IV 96–99 97–1002 3 85–86 85–87 95–1002 4 85 85–86 89–91 1002 BI 83–87 83–87 83–86 86–87 94–993 84–87 84–87 88–91 93–94 86–89 95–1003 TB 85–87 85–87 89–91 94 86–89 95–96 1003 PT 84–86 84–87 88–91 93–94 86–88 95–96 95–96 98–1004 84–87 84–87 82–87 83–86 83–87 82–88 85–88 82–86 88–974 HG I 84–87 84–87 83–87 83–86 83–87 83–88 86–88 83–86 88–97 94–1004 HG II 85–86 85–86 84–86 84–85 83–86 84–87 86–87 84–86 90–97 92–97 98–1004 HG III 84–85 84–86 82–85 85–86 84–85 82–86 85–86 82–83 88–92 88–92 90–91 99–1005 85–86 85–86 91–93 86–87 84–87 88–91 91 88–90 87–90 87–90 87–89 87–886 80–83 80–86 84–91 80–85 79–86 83–90 85–90 83–89 82–90 84–90 83–89 82–886 HG I 84–85 84–86 87–90 84 84–85 88–90 89 88–89 86–90 87–90 88–89 86–876 GV1 80–84 80–85 84–89 80–84 79–85 83–90 85–90 83–89 82–90 84–90 83–89 82–876 GV2 83–85 83–86 87–90 85 84–85 88–90 89–90 88–89 87–90 87–90 88–89 87–886 GV3 82–83 82–84 87–90 85 83–85 87–90 89–90 87–89 85–90 86–90 87–89 85–876 GV4 84–85 83–86 87–91 85 84–86 88–90 90 88–89 86–90 86–90 88–89 86–877 83–84 83–85 86–89 84–85 82–84 86–89 88–89 86–89 83–87 83–87 84–87 84–858 84–85 84–86 88–90 85–86 85–86 89–91 90 89–91 84–87 85–87 86–87 84–859 85–88 85–88 89–92 88–90 84–89 90–94 91–94 90–93 83–87 83–87 84–86 83–8510 84–85 84–86 89–91 92–93 84–87 92–94 93–94 92–94 83–87 84–87 84–86 83–8511 85–87 84–88 91–95 85–86 84–88 88–90 89–90 88–89 82–87 83–87 83–85 82–8412 85–86 85–88 85–89 85 84–86 86–89 88–89 86–89 84–88 85–88 85–86 84–86W. circinata 61–64 61–64 65–68 62–66 61–64 64–68 64–66 64–68 61–65 61–65 61–64 61–63zeae 63–64 62–64 66–68 63 62–64 65–67 65–66 65–67 61–65 61–65 61–63 62–63agrostis 61–63 62–64 65–67 65–66 63–64 64–67 64–65 66–67 61–65 62–65 62–63 61–63circinata 62–63 61–64 65–68 65–66 61–64 64–68 64–66 66–68 61–64 61–64 62–63 61–63oryzae 61–64 61–64 65–68 62–63 61–64 64–66 64–65 64–66 61–64 61–64 62–63 61–63A. rolfsii 61–62 62–63 62–64 63 64–65 62–65 62 64–65 60–61 60–61 60–61 60–61
AG/subgroup 10 11 12 W. zeae agrostis circinata oryzaecircinata
10 99–10011 88–91 92–10012 87–90 87–89 98–100W. circinata 65–69 64–67 64–69 89–100zeae 65–66 65–67 65–67 91–95 98–100agrostis 66–67 65–67 65–67 89–95 94–95 98–100circinata 67–69 65–66 65–67 91–93 92–93 91–93 98–100oryzae 65–66 64–66 64–67 89–92 91–92 89–91 91–92 97–100A. rolfsii 60 61–63 63–64 60–63 60–62 62–63 61–62 60–62
312
1
AY684917AB213594AB213597
100
AB213575AB213577
10096
AB213582AB213581
10073
AJ000195AB213589
100
100
AF354108AF354065
100
AF354071AF153800
100100
AF153802AY154313
100
97
AF354068AF153797AB000011
82100
80
AF153804AF153805
100
60
AF354100AB000003
100
79
AB000007AY152704
99
AB000006AY154308
10099
AY154659DQ102449
10091
AF153788AF153790
77
AF153785AF153787
100
AY154304AF354104
67
AF153780AF153782
100
AF354102AB000019
9385
85
98
AF153778AF354113
100
AB054866AJ238163AJ238160
69100
AB000014AY270014AJ238164
7788
76
AF354116AJ238166
99
100
AB054873AB054875
100
AB054878AB054879AB054880
100
U57729AY154317AB054850AB054852
69100
91
U57740AB054871
100
AF153774AB000004
98
AB019023AB019017
100100
AB122139AF308626AB122130AB122128
10077
100
AB122142U19951
100
AY270010AB122133
10098
100
100
100
zeae
agrostis
circinata
oryzae
A. rolfsii
W. circinata
AG 9
AG 10
AG 11
AG 8
AG 12
AG 7
HG-I
HG-II
HG-III
AG 4
Gv3
Gv4
Gv2
Gv1
HG-I
AG 5
LP
IV
IIIB
BI
2
4
1-2t 1
3
AG 2
AG 6
TB
PTAG 3
IB
ID
IC
IA
AG 11
AY684917AB213594AB213597
100
AB213575AB213577
10096
AB213582AB213581
10073
AJ000195AB213589
100
100
AF354108AF354065
100
AF354071AF153800
100100
AF153802AY154313
100
97
AF354068AF153797AB000011
82100
80
AF153804AF153805
100
60
AF354100AB000003
100
79
AB000007AY152704
99
AB000006AY154308
10099
AY154659DQ102449
10091
AF153788AF153790
77
AF153785AF153787
100
AY154304AF354104
67
AF153780AF153782
100
AF354102AB000019
9385
85
98
AF153778AF354113
100
AB054866AJ238163AJ238160
69100
AB000014AY270014AJ238164
7788
76
AF354116AJ238166
99
100
AB054873AB054875
100
AB054878AB054879AB054880
100
U57729AY154317AB054850AB054852
69100
91
U57740AB054871
100
AF153774AB000004
98
AB019023AB019017
100100
AB122139
10077
100
100
10098
100
100
100
zeae
agrostis
circinata
oryzae
A. rolfsii
W. circinata
AG 9
AG 10
AG 11
AG 8
AG 12
AG 7
HG-I
HG-II
HG-III
AG 4
Gv3
Gv4
Gv2
Gv1
HG-I
AG 5
LP
IV
IIIB
BI
2
4
1-2t 1
3
AG 2
AG 6
TB
PTAG 3
IB
ID
IC
IA
AG 1
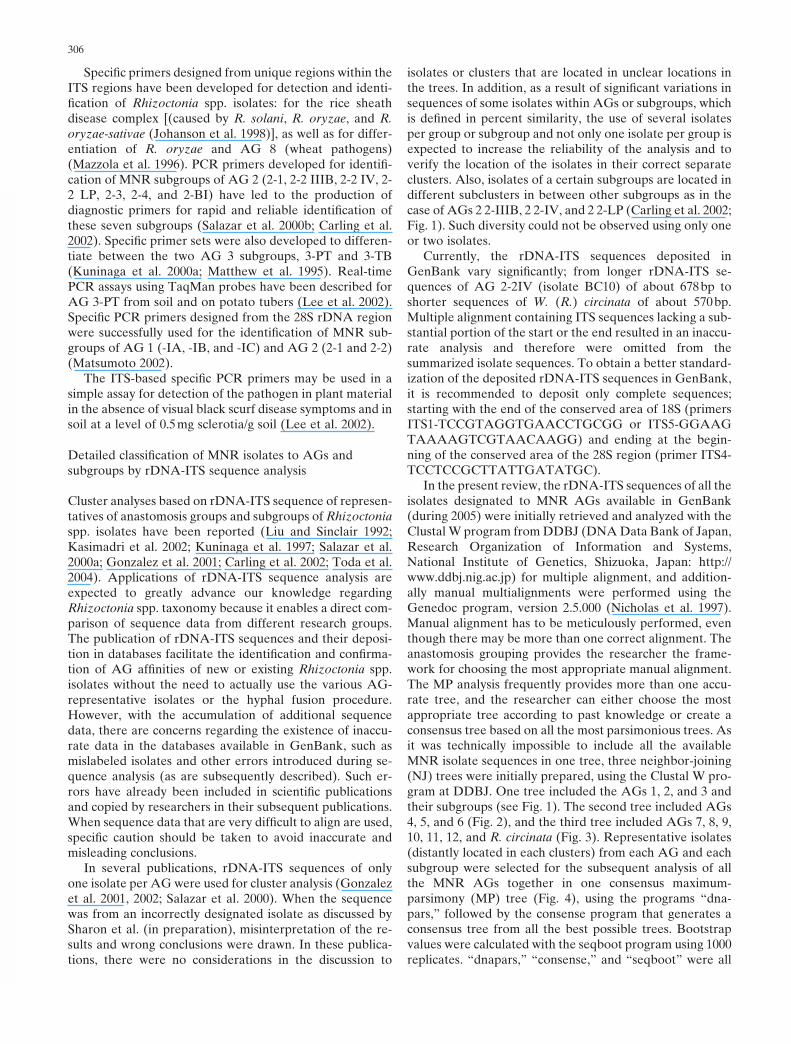
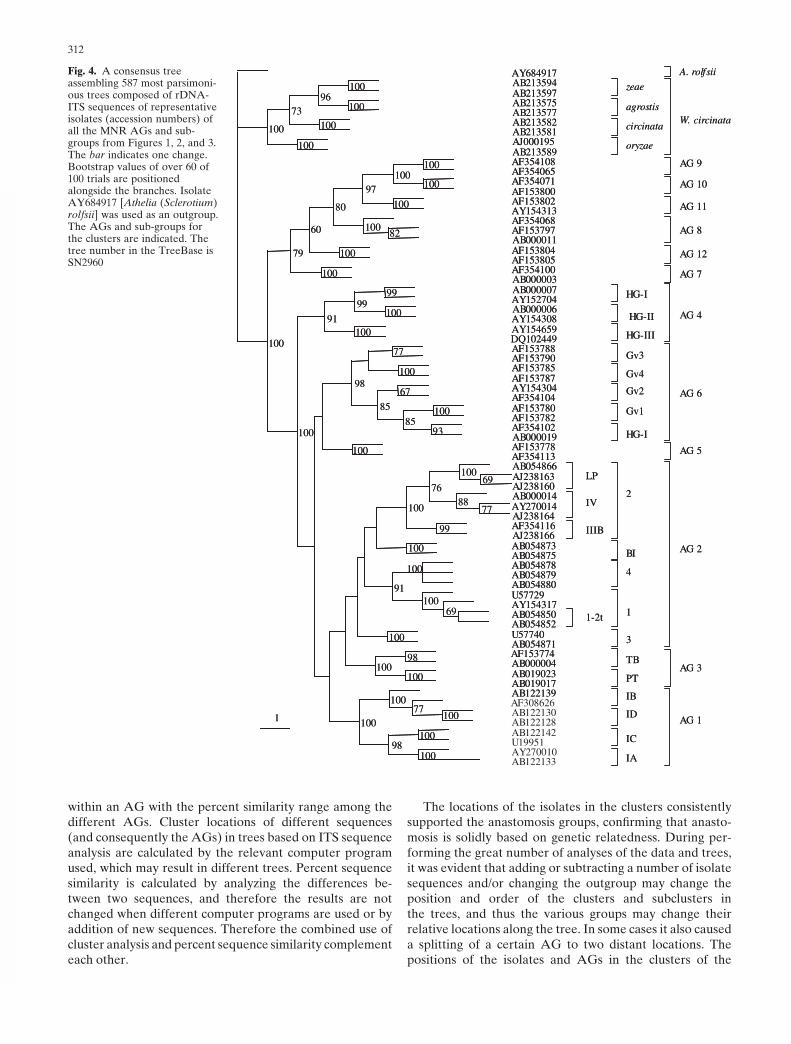
Fig. 4. A consensus treeassembling 587 most parsimoni-ous trees composed of rDNA-ITS sequences of representativeisolates (accession numbers) ofall the MNR AGs and sub-groups from Figures 1, 2, and 3.The bar indicates one change.Bootstrap values of over 60 of100 trials are positionedalongside the branches. IsolateAY684917 [Athelia (Sclerotium)rolfsii] was used as an outgroup.The AGs and sub-groups forthe clusters are indicated. Thetree number in the TreeBase isSN2960
within an AG with the percent similarity range among thedifferent AGs. Cluster locations of different sequences(and consequently the AGs) in trees based on ITS sequenceanalysis are calculated by the relevant computer programused, which may result in different trees. Percent sequencesimilarity is calculated by analyzing the differences be-tween two sequences, and therefore the results are notchanged when different computer programs are used or byaddition of new sequences. Therefore the combined use ofcluster analysis and percent sequence similarity complementeach other.
The locations of the isolates in the clusters consistentlysupported the anastomosis groups, confirming that anasto-mosis is solidly based on genetic relatedness. During per-forming the great number of analyses of the data and trees,it was evident that adding or subtracting a number of isolatesequences and/or changing the outgroup may change theposition and order of the clusters and subclusters inthe trees, and thus the various groups may change theirrelative locations along the tree. In some cases it also causeda splitting of a certain AG to two distant locations. Thepositions of the isolates and AGs in the clusters of the
313
consensus MP trees were kept more stable in response tosuch additions or deletions than in the NJ trees, althoughthe NJ trees were frequently supported by correspondingMPs trees.
Several tree-constructing methods are used for rDNA-ITS sequence analyses: neighbor-joining (NJ), maximum-parsimony (MP), and most likelihood (ML) methods. Thealgorithms for preparing the NJ and the MP trees are basi-cally different. Generally, when sequence variation of iso-lates includes wide differences in molecular evolutionaryrate, the MP results generate less-appropriate trees than theNJ and ML methods. However, in MNR isolate sequences,the trees obtained by the MP program were more consistentthan those by NJ trees. The ITS region of R. solani is gener-ally very difficult to align because of excessive nucleotideinsertions or deletions. These highly variable ITS regionsmay account for some inaccuracies in an NJ analysis andconsequent trees.
Attempts to designate an order of numbers to clusters ofseveral AGs along the tree (Gonzalez et al. 2001, 2002) aretherefore inconsistent and may be misleading. Moreover,choosing one of the best MP trees might be less reliablethen using a consensus tree combining all the best MP treesresulted in the analysis. Closer percent sequence similaritiesamong certain AGs compared to more-distant similaritiesamong others may indicate closer genetic relatedness be-tween certain AGs or clusters of several AGs but may notbe sufficient for all groups in the tree to determine a consis-tent order. The clusters in Fig. 4 clearly indicate that theMNR AGs are divided into the following groups of AGs:one group includes AGs 1, 2, and 3, and another groupincludes AGs 5 and 6. AG 4 (R. praticola) belonged to thisgroup in a tree based on another alignment but seems to beseparate from this group in Fig. 4. Another group includesAGs 7, 8, 9, 10, 11, and 12, while the four subgroups orsubspecies (Toda et al. 2005, in preparation) of R. circinataare clearly of a separate group from all the rest.
It is important to emphasize that although R. circinatavar. zeae (WAG-Z) and R. circinata var. oryzae weredesignated as distinctly separate AGs (Sneh et al. 1991),Ogoshi (1985) had already indicated that anastomosis wasalso observed between isolates of these two species or sub-species and that anastomosis frequencies of >30% wereobserved among isolates of each of all the four subspecies ofR. circinata (Hyakumachi, unpublished data). This findingmay indicate that according to the anastomosis reactionsthese four subspecies may be considered as subgroups ofone AG. The percent sequence similarity ranges amongthese subspecies was 89%–100% whereas within the sub-species it was 97%–100%, and their positions in thetrees (Figs. 3, 4) indicate that these are distinctly separatedsubgroups.
AG-2 is divided into the greatest number of subgroups,AGs 4, 6, and 3 are divided into fewer subgroups, whilesome AGs, i.e, 7, 8, 9, 10, 11, and 12, have not been dividedat all. AG 9 has been divided into two subgroups, but therewere not sufficient available sequences in GenBank to di-vide this group in the present analysis. AG7 may also in-clude at least two subgroups (Kuninaga, unpublished data),
corresponding with the Stuttgart group and the pine treegroup based on anastomosis reaction and the whole-cellfatty acid composition (Baird et al. 2000). This resultindicates differences in genetic diversity within an AG indifferent AGs. The current knowledge of more-definedsubgroups in certain AGs than in others may also be influ-enced by the relatively greater research efforts invested incertain AGs that cause serious diseases to important cropplants, compared to other AGs, which were less investi-gated and consequently yielded considerably fewer isolatesequences.
The percent sequence similarity range within the sub-groups and AGs that are not separated to subgroups is high(94%–100%), except for AGs 7, 11 (92%–100%), and 1-IB(91%–100%), which may indicate the existence of moresubgroups in these AGs. This result will be supported byadditionally accumulated information for new isolates.However, the percent similarity ranges within AGs that areseparated to subgroups is lower: AG 1 (91%–100%), AG 2(81%–100%), AG 4 (88%–97%), and R. circinata (89%–100%). On the other hand, the percent similarity rangeamong the MNR AGs is around 78%–90%, except for somelower ranges for AG 10 with AG 1 (61%–88%), or for someAGs that are closer, such as AG 5 with AG 6 or 7 and 8(91%–92%) or 9 and 10 (92%–96%), and subgroups ofAGs which are closer to each other than among the AGs(90%–98%). Rhizoctonia circinata (teleomorph, Waiteacircinata) is considerably more distant genetically from allof the other MNR groups (63%–70%). The genetic distanceof R. circinata from the rest of the MNR is almost as remoteas the distance of the outgroup S. rolfsii to the other MNRAGs (59%–65%) (see Table 2).
The data summarized in Table 2 indicate that a percentsequence similarity threshold (within subgroups or AGs)differentiating among anastomosis groups or subgroupscould not be definitely determined, despite the fact thatisolates of different AGs and subgroups are located in dis-tinct clusters and subclusters (see Figs. 1–4), because thereis some overlap in percent sequence similarity ranges withinand among AGs. Therefore, a combination of rDNA-ITSsequence analysis and percent sequence similarity is mutu-ally supportive. The knowledge of the anastomosis of iso-lates is also supportive to the results from all the molecularmethods.
Including the ITS sequences of all the available isolatesin the rDNA-ITS sequence analyses in the review enablesalso tracing inaccuracies and errors of certain depositedisolate sequences in GenBank. It is evident from the loca-tion of some isolates marked within or among the clusters inFigs. 1–3 that they have been inaccurately designated in theGenBank. For some of them, it is clear to which group theirsequence belongs. For example, accession numbersAE308628 and -9 designated as AG 1-IB in GenBank arelocated in the AG 1-IA cluster (see Fig. 1), and it is likelythat they actually belong to this subgroup. Some isolates aredesignated as AG 2 but not to their subgroups. Some maybelong to certain known subgroups, while others may formanother subgroup but need more research to support thisconclusion. Accession number AY154303 designated as
314
AG 8 is located in the AG 7 cluster (indicating that itbelongs to AG 7), and AY154305 designated as AG7 islocated in a different cluster than the AG 7 isolatesand is close to AG 10. It is not clear where this isolatebelongs.
Parts of the AG 2-2IIIB and AG 2-2IV sequences arelocated together with AG 2-2LP in several locations in asubcluster of AG 2-2 (Carling et al. 2002; see Fig.1).They cannot be differentiated by the rDNA-ITS sequenceanalysis (see Table 2), and there is no significant differencebetween their percent sequence similarities. AG 2-2IIIBand AG 2-2IV differ probably by a mutation causing thia-mine requirement (Sneh et al. 1991), which may not bemanifested by a significant change in the rDNA-ITS se-quence. The cold climate tulip isolates of AG 2-1-2t couldnot be distinguished from the rest of the AG 2-1 isolates,according to their location in the same cluster, and theirsequence similarity with AG 2-1 is 94%–100% (see Fig. 1).The subgroup AG 2–4 is distant from the most of the otherAG 2 subgroups (Fig. 1), AG 2-2 (84%–86% sequencesimilarity), AG 2–3 (89%–91%), and 2-BI (86%–87%), butis closer to AG 2-1 (90%–95%) and also to AG 3 (94%)(see Table 2).
AG 6 was reported to include the HG-I and GV sub-groups. GV was already known to be a variable subgroup(Sneh et al. 1991), but it has not been further studied in thisrespect. The data gathered from GenBank and summarizedin Figs. 3 and 4 and Table 2 indicate that the isolates gath-ered in GV can be actually divided into four subgroups,namely, GV1, GV2, GV3, and GV4.
The continuous accumulation of Rhizoctonia spp.isolate sequences in GenBank will undoubtedly generate,in the future, both some changes to the summarizedinformation presented in this review and indications for theexistence of new and currently unrecognized AGs andsubgroups.
From the data summarized and analyzed in Fig. 4 andTable 2, it may be suggested that the alignment in theTreeBase of Fig. 4 (SN2960) for MNR isolates can be usedto identify unknown MNR isolates into AGs and subgroupsby manually adding the new sequences to the existing align-ment in the TreeBase. Caution should be taken when newalignments are submitted to a computer program analysis inwhich the original manual alignment will be disregarded;they will be always observed to manually correct the mis-matches appearing in the alignment. Even so, the new align-ment might result in changes in the locations of isolates andsubgroups or AGs along the tree, compared to the pre-sented complete MNR tree (Fig. 4). Therefore, it should bealso complemented with percent sequence similarity analy-sis. If the sequence of the unknown isolate is within 95%–100% similarity and its location is within a cluster of acertain AG or a subgroup, this indicates that the isolatebelongs to that AG or subgroup. This procedure may facili-tate the laboratory work required for precise identificationof unknown MNR isolates or verify previous identificationof isolates. In a subsequent review article, a similar tree andtable of percent sequence similarity will be prepared for theidentification of BNR isolates.
References
Baird RE, Gitaitis RD, Carling DE, Baird SM, Alt PJ, Mullinix BG(2000) Determination of whole-cell fatty acid profiles for the charac-terization and differentiation of isolates of Rhizoctonia solani AG 4and AG 7. Plant Dis 84:785–788
Balali GR, Whisson DL, Scott ES, Neate SM (1996) DNA-fingerprint-ing probe specific to isolates of Rhizoctonia solani AG-3. Mycol Res100:467–470
Banniza S, Rutherford MA (2001) Diversity of isolates of Rhizoctoniasolani AG 1-IA and their relationship to other anastomosis groupsbased on pectic zymograms and molecular analysis. Mycol Res105:33–40
Banniza S, Sy AA, Bridge PD, Simons SA, Holdernen U (1999) Char-acterization of populations of Rhizoctonia solani in paddyrice fieldsin Cote d’Ivoire. Phytopathology 89:414–420
Boidin J, Mugnier J, Canales R (1998) Taxonomie moleculaire desAphyllophorales. Mycotaxon 66:445–491
Bounou S, Jabaji-Hare SH, Hogue R, Charest PM (1999) Polymerasechain reaction-based assay for specific detection of Rhizoctoniasolani AG 3 isolates. Mycol Res 103:1–8
Boysen M, Borja M, del Moral C, Salazar O, Rubio V (1996) Identifi-cation at strain level of Rhizoctonia solani AG 4 isolates by directsequence of asymmetric PCR products of the ITS regions. CurrGenet 29:174–181
Brisbane PG, Neate SM, Pankhurst CE, Scott NS, Thomas MR (1995)Sequence-tagged site markers to identify Rhizoctonia solani AG 4 orAG 8 infecting wheat in South Australia. Phytopathology 85:1423–1427
Bruns TD, White TJ, Taylor JW (1991) Fungi molecular systematics.Annu Rev Ecol Syst 22:525–564
Campanella JJ, Bitincka L, Smalley J (2003) Matbat: an applicationthat generates similarity/identity matrices using protein or DNAsequences. BMC Bioinformatics 4:29
Carle GF, Olson MV (1984) Separation of chromosomal DNA mol-ecules from yeast by orthogonal-field alternation gel electrophoresis.Nucleic Acids Res 12:5647–5664
Carling DE (1996) Grouping in Rhizoctonia solani by the anastomosisreaction. In: Sneh B, Jabaji-Hare S, Neate S, Dijst G (eds) Rhizocto-nia species: taxonomy, molecular biology, ecology, pathology anddisease control. Kluwer, Dordrecht, pp 37–47
Carling DE, Kuninaga S (1990) DNA base sequence homology inRhizoctonia solani Kühn: Inter- and intra-group relatedness of anas-tomosis group-9. Phytopathology 80:1362–1364
Carling DE, Kuninaga S, Brainard KA (2002) Hyphal anastomosisreactions, and rDNA-ITS sequences and virulence levels amongsubsets of Rhizoctonia solani anastomosis group-2 (AG 2) and AGBI. Phytopathology 92:43–50
Ceresini PG, Shew HD, Vilgalys RJ, Cubeta MA (2002) Genetic diver-sity of Rhizoctonia solani AG 3 from potato and tobacco in NorthCarolina. Mycologia 94:437–449
Ceresini PG, Shew HD, Vilgalys RJ, Gale LR, Cubeta MA (2003)Detecting migrants in populations of Rhizoctonia solani anastomosisgroup 3 from potato in North Carolina using multilocus genotypeprobabilities. Phytopathology 93:610–615
Cubeta MA, Echandi E, Abernethy T, Vilgalys R (1991) Characteriza-tion of anastomosis groups of binucleate Rhizoctonia species usingrestriction analysis of an amplified ribosomal RNA gene. Phytopa-thology 81:1395–1400
Cubeta MA, Vilgalys R, Gonzalez D (1996) Molecular analysis ofribosomal RNA genes in Rhizoctonia fungi. In: Sneh B, Jabaji-HareS, Neate S, Dijst G (eds) Rhizoctonia species: taxonomy, molecularbiology, ecology, pathology and disease control. Kluwer, Dordrecht,pp 81–86
Cruickshank RH (1990) Pectic zymograms as criteria in taxonomy ofRhizoctonia. Mycol Res 94:938–946
Damaj M, Jabaji-Hare SH, Charest P-M (1993) Isozyme variation andgenetic relatedness in binucleate Rhizoctonia species. Phytopathol-ogy 83:864–871
Duncan S, Barton JE, O’Brien PA (1993) Analysis of variation inisolates of Rhizoctonia solani by random amplified polymorphicDNA assay. Mycol Res 97:1075–1082
Felsenstein J (1989) PHILIP: phylogeny inference package (version3.2). Cladistics 5:164–166
315
Godoy-Lutz G, Steadman JR, Higgins B, Powers K (2003) Geneticvariation among isolates of the web blight pathogen of common beanbased on PCR-RFLP of the ITS-rDNA region. Plant Dis 87:766–771
Gonzalez D, Carling DE, Kuninaga S, Vilgalys R, Cubeta MA (2001)Ribosomal DNA systematics of Ceratobasidium and Thanatephoruswith Rhizoctonia anamorphs. Mycologia 93:1138–1150
González V, Salazar O, Julián MC, Acero J, Portal MA, Muñóz R,López-Córcoles H, Gómez-Acebo E, López-Fuster P, Rubio V(2002) Ceratobasidium albasitensis. A new Rhizoctonia-like fungusisolated in Spain. Persoonia 17:601–614
Hyakumachi M, Ui T (1987) Non self anastomosing isolates of Rhizoc-tonia solani obtained from fields of sugar beet monoculture. Trans BrMycol Soc 89:155–159
Hyakumachi M, Mushika T, Ogiso Y, Toda T, Kageyama K, Tsuge T(1998) Characterization of a new cultural type (LP) of Rhizoctoniasolani AG 2-2 isolated from warm-season turf grasses, and its geneticdifferentiation from other cultural types. Plant Pathol 47:1–9
Hyakumachi M, Priyatmojo A, Kubota M, Fukui H (2005) New anas-tomosis groups, AG-T and AG-U, of binucleate Rhizoctonia causingroot and stem rot of cut-flower and miniature roses. Phytopathology95:784–792
Jabaji-Hare SH, Meller Y, Gill S, Charest PM (1990) Investigation ofgenetic relatedness among anastomosis groups of Rhizoctonia solaniusing cloned DNA probes. Can J Plant Pathol 12:393–404
Johanson T, Turner HC, Mckay GJ, Brown AE (1998) A PCR-basedmethod to distinguish fungi of the rice sheath-blight complex,Rhizoctonia solani, R. oryzae and R. oryzae-sativae. FEMSMicrobiol Lett 162:289–294
Johnk JS, Jones RK (1992) Determination of whole-cell fatty acids inisolates of Rhizoctonia solani AG 1-IA. Phytopathology 82:68–72
Johnk JS, Jones RK (1993) Differentiation of populations of AG 2-2 ofRhizoctonia solani by analysis of cellular fatty acids. Phytopathology83:278–283
Johnk JS, Jones RK (1994) Comparison of whole-cell fatty acid compo-sitions in intraspecific groups of Rhizoctonia solani AG 1. Phytopa-thology 84:271–275
Johnk JS, Jones RK (2001) Differentiation of the homogeneous groupsof Rhizoctonia solani anastomosis group 4 by analysis of fatty acids.Phytopathology 91:821–830
Johnk JS, Jones RK, Shew HD, Carling DE (1993) Characterization ofpopulations of Rhizoctonia solani AG 3 from potato and tobacco.Phytopathology 83:854–85
Julian MC, Debets F, Keijer J (1996) Independence of sexual andvegetative incompatibility mechanisms of Thanatephorus cucumeris(Rhizoctonia solani) anastomosis group 1. Phytopathology 86:566–574
Kanematsu S, Naito S (1995) Genetic characterization of Rhizoctoniasolani AG 2-3 by analyzing restriction fragment length polymor-phisms of nuclear ribosomal DNA internal transcribed spacers. AnnPhytopathol Soc Jpn 61:18–21
Kasiamdari RS, Smith SE, Scott ES, Smith FA (2002) Identification ofbinucleate Rhizoctonia as a contaminant in pot cultures ofarbuscular mycorrhizal fungi and development of a PCR-basedmethod of detection. Mycol Res 106:1417–1426
Keijer J, Houterman PM, Dullemans AM, Korsman MG (1996) Het-erogeneity in electrophoretic karyotype within and between anasto-mosis groups of Rhizoctonia solani. Mycol Res 100:789–797
Kuninaga S (1996) DNA base sequence complementary analyses. In:Sneh B, Jabaji-Hare SH, Neate S, Dijst G (eds) Rhizoctonia species:taxonomy, molecular biology, ecology, pathology and disease con-trol. Kluwer, Dordrecht, pp 73–80
Kuninaga S (2002) Current situation of the taxonomy of the genusRhizoctonia and the Rhizoctonia species complex. Jpn J Phytopathol68:3–20
Kuninaga S (2003) Current situation of the taxonomy of Rhizoctoniasolani. Plant Prot Jpn 57:219–222
Kuninaga S, Yokosawa R (1985) DNA base sequence homology inRhizoctonia solani Kuhn. VI. Genetic relatedness among sevenanastomosis groups. Ann Phytopathol Soc Jpn 51:127–132
Kuninaga S, Natsuaki T, Takeuchi T, Yokosawa R (1997) Sequencevariation of the rDNA ITS regions within and between anastomosisgroups in Rhizoctonia solani. Curr Genet 32:237–247
Kuninaga S, Carling DE, Takeuchi T, Yokosawa R (2000a) Compari-son of rDNA-ITS sequences between potato and tobacco strains inRhizoctonia solani AG 3. J Gen Plant Pathol 66:2–11
Kuninaga S, Nicoletti R, Lahoz E, Naito S (2000b) A description of Nt-isolates of Rhizoctonia solani to anastomosis group 2-1 (AG 2-1) onaccount of rDNA-ITS sequence similarity. J Plant Pathol 82:61–64
Lanoiselet VM, Cother EJ, Cother, NJ, Ash GJ, Harper JDI (2005)Comparison of two total cellular fatty acid analysis protocols todifferentiate Rhizoctonia oryzae and R. oryzae-sativae. Mycologia97:77–83
Laroche JP, Jabaji-Hare SH, Charest P-M (1992) Differentiation oftwo anastomosis groups of Rhizoctonia solani by isozyme analysis.Phytopathology 82:1387–1393
Leclerc-Potvin C, Balmas V, Charest PM, Jabaji-Hare S (1999) Devel-opment of reliable molecular markers to detect non-pathogenicbinucleate Rhizoctonia isolates (AG-G) using PCR. Mycol Res103:1165–1172
Lee LG, Cullen DW, Sullivan L, Nicolson MJ (2002) Development ofconventional and quantitative real-time PCR assays for the detec-tion and identification of Rhizoctonia solani AG 3 in potato and soil.Plant Pathol 51:293–302
Lilja A, Hietala AM, Karjalainen R (1996) Identification of a uninucle-ate Rhizoctonia spp. by pathogenicity, hyphal anastomosis andRAPD analysis. Plant Pathol 45:997–1006
Liu Z, Sinclair JB (1992) Genetic diversity of Rhizoctonia solani anas-tomosis group 2. Phytopathology 82:778–787
Liu Z, Sinclair JB (1993) Differentiation of intraspecific groups withinanastomosis group 1 of Rhizoctonia solani using ribosomal DNAinternal transcribed spacer and isozyme comparisons. Can J PlantPathol 15:272–280
Liu Z, Nickrent DL, Sinclair JB (1990) Genetic relationships amongisolates of Rhizoctonia solani anastomosis group 2 based on isozymeanalysis. Ann J Plant Pathol 12:376–382
Liu ZL, Domier LL, Sinclair JB (1993) ISG-specific ribosomal DNApolymorphism of the Rhizoctonia solani species complex. Mycologia85:795–800
Liu ZL, Domier LL, Sinclair JB (1995) Polymorphism of genes codingfor nuclear 18S rRNA indicates genetic distinctiveness of anastomo-sis group 10 from other groups in the Rhizoctonia solani speciescomplex. Appl Environ Microbiol 61:2659–2664
Ma M, Tan TK, Wong SM (2003) Identification and molecular phylog-eny of Epulorhiza isolates from tropical orchids. Mycol Res107:1041–1049
MacNish GC, Sweetingham MW (1993) Evidence of stability of pecticzymogram groups within Rhizoctonia solani AG 8. Mycol Res97:1056–1058
MacNish GC, Carling DE, Brainard KA (1993) Characterizationof Rhizoctonia solani AG 8 from bare patches by pectic isozyme(zymogram) and anastomosis techniques. Phytopathology 83:922–927
MacNish GC, Carling DE, Sweetingham MW, Brainard KA (1994)Anastomosis group (AG) affinity of pectic isozyme (zymogram)groups (ZG) of Rhizoctonia solani from the Western Australiancereal-belt. Mycol Res 98:1369–1375
Martin FN (2000) Rhizoctonia spp. recovered from strawberry roots incentral coastal California. Phytopathology 90:345–353
Matsumoto M (2002) Trials of direct detection and identification ofRhizoctonia solani AG-1 and AG-2 subgroups using specificallyprimed PCR analysis. Mycoscience 43:185–189
Matsumoto M, Matsuyama N (1999) Grouping of isolates in AG 2 ofRhizoctonia solani by total cellular fatty acid analysis. Mycoscience40:35–39
Matsumoto M, Furuya N, Takanami Y, Matsuyama N (1996) A studyof fatty acid analysis as a new taxonomic tool for differentiatingRhizoctonia spp. J Fac Agric Kyushu Univ 40:279–286
Matsumoto M, Furuya N, Matsuyama N (1997) Characterization ofRhizoctonia spp., the causal agents of sheath diseases of rice plant,by total cellular fatty acid analysis. Ann Phytopathol Soc Jpn 63:149–154
Matthew J, Herdina S, Whisson D (1995) DNA probe specificto Rhizoctonia solani anastomosis group 8. Mycol Res 99:745–750
Mazzola M (1997). Identification and pathogenicity of Rhizoctonia spp.isolates from apple roots and orchard soils. Phytopathology 87:582–587
Mazzola M, Wong OT, Cook RJ (1996) Virulence of Rhizoctoniaoryzae and R. solani AG 8 on wheat and detection of R. oryzae inplant tissue by PCR. Phytopathology 86:354–360
316
Meyer L, Wehner FC, Nel LH, Carling DE (1998) Characterization ofthe crater disease strain of Rhizoctonia solani. Phytopathology88:366–371
Neate S, Cruickshank, RH, Rovira AD (1988) Pectic enzyme patternsof Rhizoctonia solani isolates from agricultural soils in South Austra-lia. Trans Br Mycol Soc 90:37–42
Nicholas KB, Nicholas HB, Deerfield DW (1997) GeneDoc: analysisand visualization of genetic variation. Embnew News 4:14–16
Nicholson P, Parry DW (1996) Development and use of a PCR assay todetect Rhizoctonia cerealis, the cause of sharp eyespot in wheat.Plant Pathol 45:872–883
Nicoletti R, Lahoz E, Kanematsu S, Naito S, Contillo R (1999)Characterization of a new subgroup within anastomosis group BI(AG BI) of Rhizoctonia solani recovered from tobacco fields. JPhytopathol 147:71–77
Ogoshi A (1985) The perfect state of R. oryzae and R. zeae, and theanastomosis groups of Waitea circinata. Trans Mycol Soc Jpn 26:189–198
Otero JT, Ackerman JD, Bayman P (2002) Diversity and host specific-ity of endophytic Rhizoctonia-like fungi from tropical orchids. Am JBot 89:1852–1858
Page RDM (1996) TREEVIEW: an application to display phylogenetictrees on personal computers. Comput Appl Biosci 12:357–358
Pascual CB, Toda T, Raymondo AD, Hyakumachi M (2000) Charac-terization by conventional techniques and PCR of Rhizoctoniasolani isolates causing banded leaf sheath blight in maize. PlantPathol 49:108–118
Pope EJ, Carter DA (2001) Phylogenetic placement and host specific-ity of mycorrhizal isolates belonging to AG 6 and AG 12 in theRhizoctonia solani species complex. Mycologia 93:712–719
Priyatmojo A, Escopalao VE, Tangonan NG, Pascual CB, Suga H,Kageyama K, Hyakumachi M (2001) Characterization of a new sub-group of Rhizoctonia solani anastomosis group 1 (AG 1-ID), causalagent of a necrotic leaf spot on coffee. Phytopathology 91:1054–1061
Priyatmojo A, Yamaguchi R, Carling DE, Kageyama K, HyakumachiM (2002a) Differentiation of three varieties of Rhizoctonia circinata;var. circinata, var. oryzae and var. zeae on the basis of cellular fattyacid composition. J Phytopathol 150:1–5
Priyatmojo A, Yamauchi R, Kageyama K, Hyakumachi M (2002b)Whole-cell fatty acid composition to characterize and differentiateisolates of Rhizoctonia species associated with turfgrass diseases inJpn. J Gen Plant Pathol 68:1–7
Rosewich UL, Pettway RE, McDonald BA, Kistler HC (1999) Highlevels of gene flow and heterozygote excess characterize Rhizoctoniasolani AG1-IA (Thanatephorus cucumeris) from Texas. FungalGenet Biol 28:148–150
Salazar O, Schneider JHM, Julian MC, Keijer J, Rubio V (1999) Phy-logenetic subgrouping of Rhizoctonia solani AG 2 isolates based onribosomal ITS sequences. Mycologia 91:459–467
Salazar O, Julian MC, Hyakumachi M, Rubio V (2000a) Phylogeneticgrouping of cultural types of Rhizoctonia solani AG 2-2 based onribosomal ITS sequences. Mycologia 92:505–509
Salazar O, Julian MC, Rubio V (2000b) Primer based on specificrDNA-ITS sequences for PCR detection of Rhizoctonia solani, R.solani AG 2 subgroups and ecological types, and binucleate Rhizoc-tonia. Mycol Res 104:281–285
Schneider JHM, Salazar O, Rubio V, Keijer J (1997) Identification ofRhizoctonia solani associated with field-grown tulips using ITSrDNA polymorphism and pectic zymograms. Eur J Plant Pathol103:607–622
Schwartz DC, Cantor CR (1984) Separation of yeast chromosomesizedDNAs by pulsed field gradient gel electrophoresis. Cell 37:67–75
Sen R, Hietala AM, Zelmer CD (1999) Common anastomosis andinternal transcribed spacer RFLP grouping in binucleate Rhizocto-
nia isolates representing root endophytes in Pinus sylvestris,Ceratorhiza spp. from orchid mycorhizas and a phytopathogenicanastomosis group. New Phytol 144:331–341
Shan XC, Liew ECY, Weatherhead MA, Hodgkins IJ (2002) Charac-terization and taxonomic placement of Rhizoctonia-like endophytesfrom orchid roots. Mycologia 94:230–239
Sneh B, Burpee L, Ogoshi A (1991) Identification of Rhizoctonia spe-cies. American Phytopathological Society Press, St. Paul, MN
Sweetingham MW, Cruickshank RH, Wong DH (1986) Pecticzymograms and the taxonomy and pathogenicity of theCeratobasidiaceae. Trans Br Mycol Soc 86:305–311
Toda T, Nasu H, Kageyama K, Hyakumachi M (1998) Genetic identi-fication of the web-blight fungus (Rhizoctonia solani AG 1) obtainedfrom European pear using RFLP pf rDNA–ITS and RAPD analysis.Res Bull Fac Agric Gifu Univ 63:1–9
Toda T, Hyakumachi M, Arora DK (1999a) Genetic relatednessamong and within different Rhizoctonia solani anastomosis groupsas assessed by RAPD, ERIC and REP-PCR. Microbiol Res 154:247–258
Toda T, Hyakumachi M, Suga H, Kageyama K, Tanaka A, Tani T(1999b) Differentiation of Rhizoctonia AG-D isolates from turfgrassinto subgroups I and II based on rDNA and RAPD analysis. Eur JPlant Pathol 105:835–846
Toda T, Mushika T, Hyakumachi M (2004) Development of specificPCR primers for the detection of Rhizoctonia solani AG 2-2 LP fromthe leaf sheaths exhibiting large-patch symptom on zoysia grass.FEMS Microbiol Lett 232:67–74
Toda T, Mushika T, Hayakawa T, Tanaka A, Tani T, Hyakumachi M(2005) “Brown-ring-patch” disease: a new disease on bentgrasscaused by Waitea circinata var. circinata. Plant Dis 89:536–542
Tommerup IC, Barton JE, O’Brien PA (1995) Reliability of RAPDfingerprinting of three basidiomycete fungi, Laccaria, Hydnangiumand Rhizoctonia. Mycol Res 99:179–186
Vilgalys R (1988) Genetic relatedness among anastomosis groups inRhizoctonia solani as measured by DNA/DNA hybridization. Phyto-pathology 78:698–702
Vilgalys R, Gonzalez D (1990) Ribosomal DNA restriction fragmentlength polymorphisms in Rhizoctonia solani. Phytopathology80:151–158
Vos P, Hoger R, Bleeker M, Reijans M, Van der Lee T, Hornes M,Frijters A, Pot J, Peleman J, Kuiper M, Zabeau M (1995) AFLP: anew technique for DNA fingerprinting. Nucleic Acids Res 23:4407–4414
Wako T, Ishikawa T, Hashiba T (1991) Unique DNA plasmid pRS64associated with chromosomal DNAs of the plant pathogenic fungusRhizoctonia solani. J Gen Microbiol 137:2817–2821
Welsh J, McClelland M (1990) Fingerprinting genomes using PCR witharbitrary primers. Nucleic Acids Res 19:303–306
Whisson DL, Herdina S, Francis L (1995) Detection of Rhizoctoniasolani AG 8 in soil using a specific DNA probe. Mycol Res 99:1299–1302
White TJ, Bruns TD, Lee S, Taylor JW (1990) Amplification and directsequencing of fungal ribosomal RNA genes for phylogenetics. In:Gelfand M, Sninsky JI White TJ (eds) PCR protocols: a guide tomethods and applications. Academic Press, New York, pp 315–322
Williams JGK, Kubelik AR, Livak KJ, Rafalski JA, Tingey SV (1990)DNA polymorphisms amplified by arbitrary primers are useful asgenetic markers. Nucleic Acids Res 18:6531–6535
Yang J, Kharbanda PD, Wang H, McAndrew DW (1996) Character-ization, virulence, and genetic variation of Rhizoctonia solani AG 9in Alberta. Plant Dis 80:513–518
Yang HA, Sivasithamparam K, Barton JE, O’Brien PA (1995) Charac-terization of cereal bare patch isolates of Rhizoctonia solani by ran-dom amplified polymorphic DNA analysis. Plant Pathol 44:811–818


