Embed Size (px)
Citation preview

ARTICLE
Received 23 Oct 2013 | Accepted 22 Apr 2014 | Published 23 May 2014
The Brassica oleracea genome reveals theasymmetrical evolution of polyploid genomesShengyi Liu1,*, Yumei Liu2,*, Xinhua Yang3,*, Chaobo Tong1,*, David Edwards4,*, Isobel A.P. Parkin5,*, Meixia Zhao1,6,
Jianxin Ma6, Jingyin Yu1, Shunmou Huang1, Xiyin Wang7,8, Junyi Wang3, Kun Lu9, Zhiyuan Fang2, Ian Bancroft10,
Tae-Jin Yang11, Qiong Hu1, Xinfa Wang1, Zhen Yue3, Haojie Li12, Linfeng Yang3, Jian Wu2, Qing Zhou3, Wanxin Wang2,
Graham J. King13, J. Chris Pires14, Changxin Lu3, Zhangyan Wu3, Perumal Sampath11, Zhuo Wang3, Hui Guo7, Shengkai Pan3,
Limei Yang2, Jiumeng Min3, Dong Zhang7, Dianchuan Jin8, Wanshun Li3, Harry Belcram15, Jinxing Tu16, Mei Guan17,
Cunkou Qi18, Dezhi Du19, Jiana Li9, Liangcai Jiang12, Jacqueline Batley20, Andrew G. Sharpe21, Beom-Seok Park22,
Pradeep Ruperao4, Feng Cheng2, Nomar Espinosa Waminal11,23, Yin Huang3, Caihua Dong1, Li Wang8, Jingping Li7,
Zhiyong Hu1, Mu Zhuang2, Yi Huang1, Junyan Huang1, Jiaqin Shi1, Desheng Mei1, Jing Liu1, Tae-Ho Lee7, Jinpeng Wang8,
Huizhe Jin7, Zaiyun Li16, Xun Li17, Jiefu Zhang18, Lu Xiao19, Yongming Zhou16, Zhongsong Liu17, Xuequn Liu24, Rui Qin24,
Xu Tang7, Wenbin Liu3, Yupeng Wang7, Yangyong Zhang2, Jonghoon Lee11, Hyun Hee Kim23, France Denoeud25,26, Xun Xu3,
Xinming Liang3, Wei Hua1, Xiaowu Wang2, Jun Wang3,27,28,29, Boulos Chalhoub15 & Andrew H. Paterson7
Polyploidization has provided much genetic variation for plant adaptive evolution, but the mechanisms by which the
molecular evolution of polyploid genomes establishes genetic architecture underlying species differentiation are
unclear. Brassica is an ideal model to increase knowledge of polyploid evolution. Here we describe a draft genome
sequence of Brassica oleracea, comparing it with that of its sister species B. rapa to reveal numerous chromosome
rearrangements and asymmetrical gene loss in duplicated genomic blocks, asymmetrical amplification of transpo-
sable elements, differential gene co-retention for specific pathways and variation in gene expression, including
alternative splicing, among a large number of paralogous and orthologous genes. Genes related to the production of
anticancer phytochemicals and morphological variations illustrate consequences of genome duplication and gene
divergence, imparting biochemical and morphological variation to B. oleracea. This study provides insights into Brassica
genome evolution and will underpin research into the many important crops in this genus.
DOI: 10.1038/ncomms4930 OPEN
1 The Key Laboratory of Biology and Genetic Improvement of Oil Crops, The Ministry of Agriculture of PRC, Oil Crops Research Institute, Chinese Academy of Agricultural Sciences, Wuhan 430062,
China. 2 The Key Laboratory of Biology and Genetic Improvement of Horticultural Crops, The Ministry of Agriculture, Institute of Vegetables and Flowers, Chinese Academy of Agricultural Sciences, Beijing
10081, China. 3 Beijing Genome Institute-Shenzhen, Shenzhen 518083, China. 4 Australian Centre for Plant Functional Genomics, School of Agriculture and Food Sciences, University of Queensland,
Brisbane, Queensland 4072, Australia. 5 Agriculture and Agri-Food Canada, Saskatoon, Saskatchewan, Canada S7N OX2. 6 Department of Agronomy, Purdue University, WSLR Building B018, West
Lafayette, Indiana 47907, USA. 7 Plant Genome Mapping Laboratory, University of Georgia, Athens, Georgia 30605, USA. 8 Center for Genomics and Computational Biology, School of Life Sciences, and
School of Sciences, Hebei United University, Tangshan 063000, China. 9 College of Agronomy and Biotechnology, Southwest University, BeiBei District, Chongqing 400715, China. 10 Centre for Novel
Agricultural Products (CNAP), Department of Biology, University of York, Wentworth Way, Heslington, York YO10 5DD, UK. 11 Department of Plant Sciences, Plant Genomics and Breeding Institute and
Research Institute for Agriculture and Life Sciences, College of Agriculture & Life Sciences, Seoul National University, Seoul 151-921, Republic of Korea. 12 Sichuan Academy of Agricultural Sciences,
Chengdu 610066, China. 13 Southern Cross Plant Science, Southern Cross University, Lismore, New South Wales 2480, Australia. 14 Bond Life Sciences Center, University of Missouri, Columbia, Missouri
65211-7310, USA. 15 Organization and Evolution of Plant Genomes, Unite de Recherche en Genomique Vegetale, Unite Mixte de Recherche 1165 (Institut National de Recherche Agronomique, Centre
National de la Recherche Scientifique, Universite Evry Val d’Essonne), Evry 91057, France. 16 National Key Laboratory of Crop Genetic Improvement, Huazhong Agricultural University, Wuhan 430070,
China. 17 College of Agronomy, Hunan Agricultural University, Changsha 410128, China. 18 Jiangsu Academy of Agricultural Sciences, Nanjing 210014, China. 19 Qinghai Academy of Agriculture and
Forestry Sciences, National Key Laboratory Breeding Base for Innovation and Utilization of Plateau Crop Germplasm, Xining 810016, China. 20 Australian Research Council Centre of Excellence for
Integrative Legume Research, University of Queensland, Brisbane, Queensland 4072, Australia. 21 National Research Council Canada, Saskatoon, Saskatchewan, Canada S7N 0W9. 22 The Agricultural
Genome Center, National Academy of Agricultural Science, RDA, 126 Suin-Ro, Suwon 441-707, Republic of Korea. 23 Department of Life Science, Plant Biotechnology Institute, Sahmyook University, Seoul
139-742, Republic of Korea. 24 School of Life Sciences, South-Central University for Nationality, Wuhan 430074, China. 25 Commissariat a l’Energie Atomique (CEA), Genoscope, Institut de Genomique,
BP5706 Evry 91057, France. 26 Centre National de Recherche Scientifique (CNRS), Universite d’Evry, UMR 8030, CP5706, Evry 91057, France. 27 Department of Biology, University of Copenhagen, Ole
Maaløes Vej 5, 2200, Copenhagen, Denmark. 28 King Abdulaziz University, Jeddah, 21589, Saudi Arabia. 29 Department of Medicine and State Key Laboratory of Pharmaceutical Biotechnology, University
of Hong Kong, 21 Sassoon Road, Hong Kong. * These are joint first authors. Correspondence and requests for materials should be addressed to S.L. (email: [email protected]).
NATURE COMMUNICATIONS | 5:3930 | DOI: 10.1038/ncomms4930 | www.nature.com/naturecommunications 1
& 2014 Macmillan Publishers Limited. All rights reserved.

B rassica oleracea comprises many important vegetable cropsincluding cauliflower, broccoli, cabbages, Brussels sprouts,kohlrabi and kales. The species demonstrates extreme
morphological diversity and crop forms, with various membersgrown for their leaves, flowers and stems. About 76 million tonsof Brassica vegetables were produced in 2010, with a value of14.85 billion dollars (http://faostat.fao.org/). Most B. oleraceacrops are high in protein1 and carotenoids2, and contain diverseglucosinolates (GSLs) that function as unique phytochemicals forplant defence against fungal and bacterial pathogens3 and onconsumption have been shown to have potent anticancerproperties4–6.
B. oleracea is a member of the family Brassicaceae (B338genera and 3,709 species)7 and one of three diploid Brassicaspecies in the classical triangle of U8 that also includes diploidsB. rapa (AA) and B. nigra (BB) and allotetraploids B. juncea(AABB), B. napus (AACC) and B. carinata (BBCC). Theseallotetraploid species are important oilseed crops, accountingfor 12% of world edible oil production (http://faostat.fao.org/). Asthe origin and relationship between these species is clear, thetiming and nature of the evolutionary events associated withBrassica divergence and speciation can be revealed by inter-specific genome comparison. Each of the Brassica genomesretains evidence of recursive whole-genome duplication (WGD)events9,10 (Supplementary Fig. 1) and have undergone aBrassiceae-lineage-specific whole-genome triplication (WGT)11,12
since their divergence from the Arabidopsis lineage. These eventswere followed by diploidization that involved substantial genomereshuffling and gene losses11–15. Because of this, Brassica speciesare a model for the study of polyploid genome evolution(Supplementary Fig. 2), mechanisms of duplicated gene loss,
neo- and sub-functionalization, and associated impact onmorphological diversity and species differentiation.
We report a draft genome sequence of B. oleracea and itscomprehensive genomic comparison with the genome of sisterspecies B. rapa, which diverged from a common ancestor B4MYA. These data provide insights into the dynamics of Brassicagenome evolution and divergence, and serve as importantresources for Brassica vegetable and oilseed crop breeding.Furthermore, this genome will support studies of the large rangeof morphological variation found within B. oleracea, whichincludes sexually compatible crops such as cabbages, cauliflowerand broccoli that are important for their economic, nutritionaland potent anticancer value.
ResultsB. oleracea genome assembly and annotation. Complementingthe sequencing of the smaller B. rapa genome11, a draft genomeassembly of B. oleracea var. capitata line 02–12 was produced byinterleaving Illumina, Roche 454 and Sanger sequence data. Thisassembly represents 85% of the estimated 630 Mb genome, andincludes 498% of the gene space (Supplementary Methods,Supplementary Tables 1–3, 7 and 8 and Supplementary Fig. 3).The assembly was anchored to a new genetic map16 to producenine pseudo-chromosomes that account for 72% of the assembly,and validated by comparison with a B. oleracea physical map17,a high-density B. napus genetic map18 and complete BACsequences (Supplementary Figs 4–9 and Supplementary Tables 4and 5). For comparative analyses, identical genome annotationpipelines were used for annotation of protein-coding genes andtransposable elements (TEs) for B. oleracea and B. rapa.
Table 1 | Summary of genome assembly and annotation of B. oleracea.
B. oleracea genome assembly
N90 N50 Longest Total size
Contig size (bp) 3,527 26,828 199,461 502,114,421Contig number 22,669 5,425
Total number(42 kb): 27,351Scaffold size (bp) 258,906 1,457,055 8,788,225 539,907,250Scaffold number 388 224 Anchored to chr. 72%
Total number(42 kb): 1,809
B. oleracea genome annotation
B. oleracea
In the assembly In WG short reads*
Size (bp) Copy numberw % assemblyz
Retrotransposon 105,755,173 108,948 22.13 23.60DNA transposon 79,675,583 170,500 16.67 12.71Total 185,430,756 279,448 38.80 36.31
Gene models Gene space coveredy Annotated Supported by ESTs
Protein-coding genes 45,758 98% 91.6% 99.0%
Average transcript length Average coding length No. of average exons No. of alternative splicing variants
1,762 bp 1,037 bp 4.6 30,932
Non-coding RNA miRNA tRNA rRNA snRNA
Copy number 336 1,425 553 1,442Average length (bp) 119 75 166 110
*WG, whole genome, 20� coverage reads were randomly sampled from all the genomic short reads libraries.wThe copy number of TEs was from the RepeatMasker results.zThe ungapped regions were used to detect the percentage of TEs in the assembly. TE sizes are from the ungapped regions of B. oleracea 477,847,347 bp.yEstimated by public Brassica ESTs and RNA-seq data.
ARTICLE NATURE COMMUNICATIONS | DOI: 10.1038/ncomms4930
2 NATURE COMMUNICATIONS | 5:3930 | DOI: 10.1038/ncomms4930 | www.nature.com/naturecommunications
& 2014 Macmillan Publishers Limited. All rights reserved.
A total of 45,758 protein-coding genes were predicted, with amean transcript length of 1,761 bp, a mean coding lengthof 1,037 bp, and a mean of 4.55 exons per gene (Table 1,Supplementary Methods, Supplementary Table 6 andSupplementary Fig. 10), similar to A. thaliana19 and B. rapa11.Publicly available ESTs, together with RNA sequencing (RNA-seq) data generated in this study, support 94% of predicted genemodels (Supplementary Tables 7 and 8), and 91.6% of predictedgenes have a match in at least one public protein database(Supplementary Tables 9 and 10, and Supplementary Fig. 11). Ofthe 45,758 predicted genes, 13,032 produce alternative splicing(AS) variants with intron retention and exon skipping(Supplementary Table 11). Genome annotation also predicted3,756 non-coding RNAs (miRNA, tRNA, rRNA and snRNA)(Supplementary Table 12).
A combination of structure-based analyses and homology-based comparisons resulted in the identification of 13,382 TEswith clearly identified terminal boundaries, including 5,107retrotransposons and 8,275 DNA transposons (SupplementaryMethods, Supplementary Fig. 12 and Supplementary Table 13).These elements together with numerous truncated elements or TEremnants make up 38.80% of the assembled portion of theB. oleracea genome, whereas TEs account for only 21.47% of theB. rapa genome assembly. Copia (11.64%) and gypsy (7.84%)retroelements are the major constituents of the repetitive fraction,and are unevenly distributed across each chromosome, withretrotransposons predominantly found in pericentromeric orheterochromatic regions (Supplementary Fig. 13) in B. oleracea.
Tentative physical positions of some of the centromeres weredetermined based on homologue and phylogenetic analysis of thecentromere-specific 76 bp tandem repeats CentBo-1 and CentBo-2 and copia-type retrotransposon (CentCRBo) (SupplementaryTable 14 and Supplementary Figs 14–17). The distribution of 45Sand 5S rDNA sequences were also visualized by fluorescent in situhybridization (Supplementary Figs 18 and 19), leading to apredicted karyotype ideogram for B. oleracea (SupplementaryFig. 20). An extra-centromeric locus with colocalized centromericsatellite repeat CentBo-1 and the centromeric retrotransposonCRBo-1 was observed on the long arm of chromosome 6(Supplementary Figs 18–20). A comprehensive database for thegenome information is accessible at http://www.ocri-genomic-s.org/bolbase/index.html.
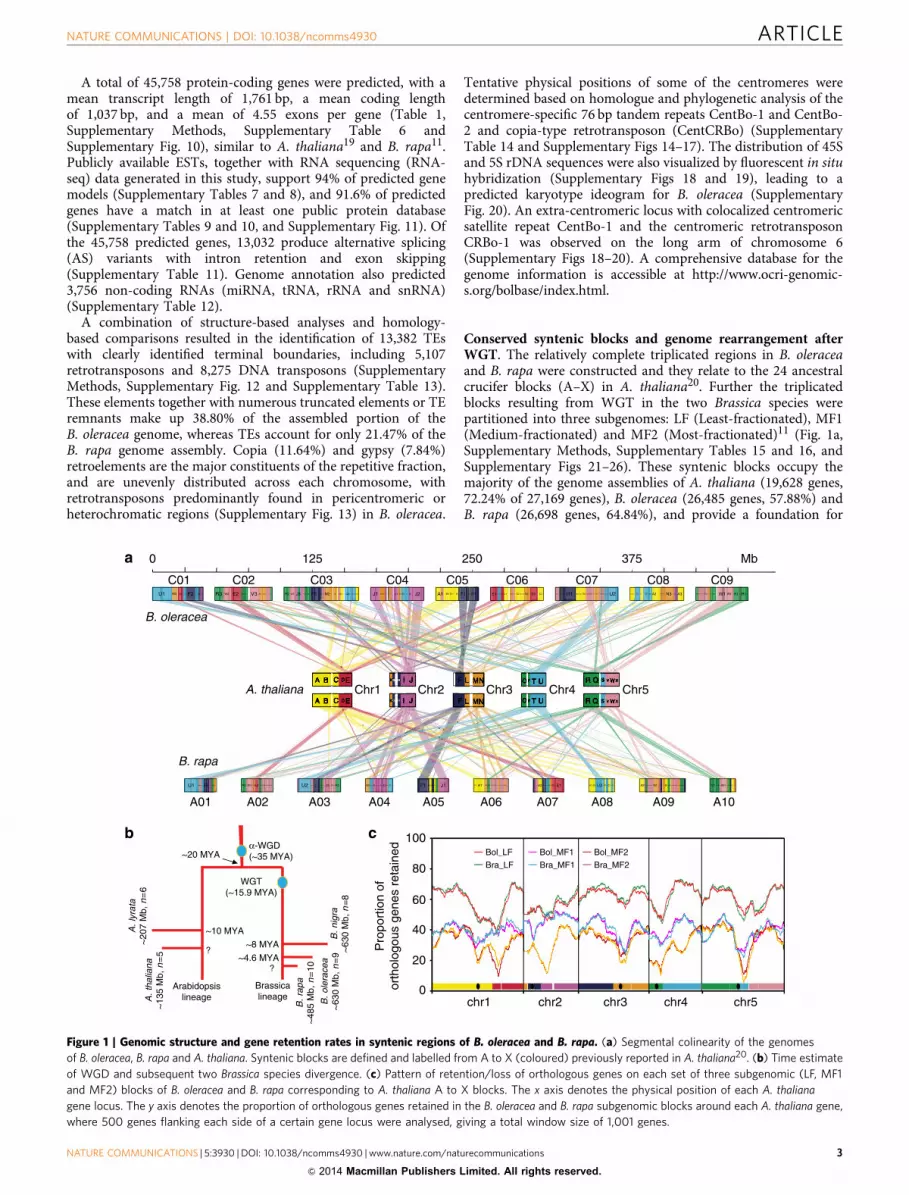
Conserved syntenic blocks and genome rearrangement afterWGT. The relatively complete triplicated regions in B. oleraceaand B. rapa were constructed and they relate to the 24 ancestralcrucifer blocks (A–X) in A. thaliana20. Further the triplicatedblocks resulting from WGT in the two Brassica species werepartitioned into three subgenomes: LF (Least-fractionated), MF1(Medium-fractionated) and MF2 (Most-fractionated)11 (Fig. 1a,Supplementary Methods, Supplementary Tables 15 and 16, andSupplementary Figs 21–26). These syntenic blocks occupy themajority of the genome assemblies of A. thaliana (19,628 genes,72.24% of 27,169 genes), B. oleracea (26,485 genes, 57.88%) andB. rapa (26,698 genes, 64.84%), and provide a foundation for
0
20
40
60
80
100
Pro
port
ion
ofor
thol
ogou
s ge
nes
reta
ined
chr1 chr2 chr3 chr4 chr5
Bol_LF
Bra_LF
Mb0a
b c
125 250 375
U1
C01 C02 C03 C04 C05 C06 C07 C08 C09
Chr1 Chr2 Chr3 Chr4 Chr5
A01 A02 A03 A04 A05 A06 A07 A08 A09 A10
B. oleracea
B. rapa
A. thaliana
~4.6 MYA
α-WGD(~35 MYA)
WGT(~15.9 MYA)
?
A. t
halia
na~
135
Mb,
n=
5
B. r
apa
~48
5 M
b, n
=10
B. o
lera
cea
~63
0 M
b, n
=9
B. n
igra
~63
0 M
b, n
=8
~8 MYA
~20 MYA
~10 MYAA. l
yrat
a~
207
Mb,
n=
6
Arabidopsislineage
Brassicalineage
?
Bol_MF1
Bra_MF1
Bol_MF2
Bra_MF2
Figure 1 | Genomic structure and gene retention rates in syntenic regions of B. oleracea and B. rapa. (a) Segmental colinearity of the genomes
of B. oleracea, B. rapa and A. thaliana. Syntenic blocks are defined and labelled from A to X (coloured) previously reported in A. thaliana20. (b) Time estimate
of WGD and subsequent two Brassica species divergence. (c) Pattern of retention/loss of orthologous genes on each set of three subgenomic (LF, MF1
and MF2) blocks of B. oleracea and B. rapa corresponding to A. thaliana A to X blocks. The x axis denotes the physical position of each A. thaliana
gene locus. The y axis denotes the proportion of orthologous genes retained in the B. oleracea and B. rapa subgenomic blocks around each A. thaliana gene,
where 500 genes flanking each side of a certain gene locus were analysed, giving a total window size of 1,001 genes.
NATURE COMMUNICATIONS | DOI: 10.1038/ncomms4930 ARTICLE
NATURE COMMUNICATIONS | 5:3930 | DOI: 10.1038/ncomms4930 | www.nature.com/naturecommunications 3
& 2014 Macmillan Publishers Limited. All rights reserved.

comparative analyses of chromosomal rearrangement, gene lossand divergence of retained paralogues after WGT. Massive geneloss occurred in an asymmetrical and reciprocal fashion in thethree subgenomes of each species and was largely completedbefore the B. oleracea–B. rapa divergence (Fig. 1c, SupplementaryTables 17–19 and Supplementary Figs 25–27). The timing of thisevolutionary process was supported by the estimated timing ofWGT B15.9 million years ago (MYA), and species divergenceB4.6 MYA, based on synonymous substitution (Ks) rates ofgenes located in the blocks (Fig. 1b and Supplementary Table 20).Gene loss occurred mainly through small deletions that maybe caused by illegitimate recombination21,22 (SupplementaryFig. 27), consistent with observations in other plant genomes.
Abundant genome rearrangement following WGT and sub-sequent Brassica species divergence resulted in complex mosaicsof triplicated ancestral genomic blocks in the A and C genomes(Fig. 1a and Supplementary Fig. 28). At least 19 major, andnumerous fine-scale, chromosome rearrangements occurred,which differentiate the two Brassica species (SupplementaryFig. 29). This is in agreement with previous comparative studiesbased on chromosome painting12,23 and genetic mapping24,25.The extensive chromosome reshuffling in Brassica is in contrastto that observed in other taxa, such as the highly syntenictomato–potato and pear–apple genomes, each with longerdivergence times and less genome rearrangement26,27. Thisdifference may be a consequence of mesopolyploidy in Brassica.
Greater TEs accumulation in B. oleracea than B. rapa. Bothretro- (22.13%) and DNA (16.67%) TEs appear to be greateramplified in B. oleracea relative to B. rapa (9.43 and 12.04%)(Fig. 2a and Supplementary Table 13). We constructed 1,362gap-free contig-contig syntenic regions by clustering orthologousB. rapa—B. oleracea genes using MCscan (Supplementary Figs 29and 30). The B. oleracea TE length (34.03% of the 259.6M) is 3.4times greater than that of the syntenic B. rapa regions (16.73% ofthe 155.0M) (Fig. 2c, Supplementary Tables 21 and 22, andSupplementary Fig. 31). Phylogenetic analysis revealed thatB. oleracea has both more LTR retrotransposon (LTR-RT) families,and more members in most families than B. rapa (Fig. 2d andSupplementary Figs 12, 32 and 33). Furthermore, two new lineagesof LTR-RTs, Brassica Copia Retrotransposon and Brassica GypsyRetrotransposon, were defined in both Brassica species(Supplementary Fig. 33). Analysis of LTR insertion time revealedthat B98% of B. oleracea intact LTR-RTs amplified continuouslyover the B4 million years (MY) since the B. oleracea–B. rapa split,whereas B68% of B. rapa intact LTR-RTs amplified rapidly withinthe last 1 MY, predominantly in the recent 0.2 MY (Fig. 2b andSupplementary Fig. 34). Hence, LTR-RTs expanded more in theintergenic space of euchromatic regions in B. oleracea than B. rapa.This agrees with previous observations based on comparisonof BAC sequences between the A and C genomes28. As aconsequence of continuous TE amplification over the last 4 MY,the genome size of B. oleracea is B30% larger than that of B. rapa
Copia
Mb4036322824201612840–3
–2
–1
0
1
2
C08
log
(Bol
/Bra
)
3
B. oleracea
Num
ber
of in
tact
LT
R
0.1
0
5
10
15
20
25
30
In B
ol a
ssem
bly
In B
ra a
ssem
bly
In B
ol b
lock
In B
ra b
lock
In B
ol a
ssem
bly
In B
ra a
ssem
bly
In B
ol b
lock
In B
ra b
lock
TE size (×10M bp)
Leng
th o
r nu
mbe
r
Retro-transposon DNA transposon Total
A08 A09A07
A06
A05 A07
00 1 2 3 4 5 6
50
100
150
200
250
Age of LTRs (MYA)
Bol copia
Bra copiaBol gyspyBra gyspyBol allBra all
B. rapa
TE copy number (×10,000)
Figure 2 | TE comparison analyses in B. oleracea and B. rapa. (a) TE copy number and total length in each assembly and B. oleracea–B. rapa
syntenic blocks. (b) The number of intact LTR (Copia-like and Gypsy-like) birthed at different times (million years ago, MYA) in the syntenic regions of
B. oleracea and B. rapa. (c) The comparison of TE distribution and composition in B. oleracea–B. rapa syntenic blocks along B. oleracea chromosomes.
We divided B. oleracea–B. rapa syntenic region into non-overlapping sliding 200 kb windows to compare TE contents. For each window, the ratio log10
(B. oleracea/B. rapa) was calculated for total syntenic block length (blue line), LTR length (purple line), gene length (yellow point), exons length (red point)
and intron length (green point). If B. oleracea 4 B. rapa in absolute length of TE composition in a compared window, the dot or line is above the line
y¼0. The corresponding B. rapa chromosome segments along B. oleracea C08 were indicated by coloured bars. All other B. oleracea chromosomes are
showed in Supplementary Fig. 31. (d) Phylogeny of the Copia-like elements as an example of LTR-RTs of the syntenic regions in B. rapa and B. oleracea.
The neighbor-joining (NJ) trees were generated based on the conserved RT domain nucleotide sequences using the Kimura two-parameter method68
in MEGA4 (ref. 69).
ARTICLE NATURE COMMUNICATIONS | DOI: 10.1038/ncomms4930
4 NATURE COMMUNICATIONS | 5:3930 | DOI: 10.1038/ncomms4930 | www.nature.com/naturecommunications
& 2014 Macmillan Publishers Limited. All rights reserved.

although the two genomes share the same ploidy and are largelycollinear.
Species-specific genes and tandemly duplicated genes. Whilethe genomes of B. oleracea and B. rapa are highly similar in termsof total gene clusters/sequences and the gene number in eachcluster, there are also a large number of species-specific genes inthe two species. A total of 66.5% (34,237 genes) of B. oleraceagenes and 74.9% (34,324) of B. rapa genes were clustered intoOrthoMCL groups (Supplementary Table 23 and SupplementaryFig. 35). We identified 9,832 B. oleracea-specific and 5,735B. rapa-specific genes, of which 77% were supported by geneexpression and/or a clear Arabidopsis homologue (SupplementaryTable 24). Of them, 490% of these specific genes were validatedfor their absence in the counterpart genomes by reciprocalmapping of raw clean reads (Supplementary Tables 25 and 26).Most Brassica-specific genes are randomly distributed along thechromosomes (Supplementary Figs 36 and 37). More than 80% ofthe species-specific genes were surrounded by non-specific genes(Supplementary Fig. 38), suggesting that deletion of individualgenes may be the major mechanism underlying gene loss and thedifference in gene numbers between B. oleracea and B. rapa.
Tandem duplication produces clusters of duplicated genes andcontributes to the expansion of gene families29. We identified1,825, 2,111 and 1,554 gene clusters containing 4,365, 5,181 and4,170 tandemly duplicated genes in B. oleracea, B. rapa and
A. thaliana, respectively (Fig. 3a, Supplementary Tables 27 and 28and Supplementary Fig. 39). The wide range of sequencedivergence of tandem gene pairs in each species suggests thattandemgene duplication occurred continuously throughout theevolutionary history of these species, rather than in discretebursts (Supplementary Figs 40 and 41). Their continuous andasymmetrical occurrence after species divergence resulted in 522,697 and 815 species-specific tandem clusters in the threegenomes. The frequency of tandem duplication is independentof the total gene content, suggesting that genome triplication hasnot inhibited its occurrence. Tandemly duplicated genes arepreferentially enriched for gene ontology (GO) categories relatedto defence response and pathways related to secondarymetabolism such as indole alkaloid biosynthesis and tropane,piperidine and pyridine alkaloid biosynthesis (Fig. 3b,Supplementary Tables 29–32 and Supplementary Fig. 42). Over44.0 and 51.9% of the NBS-encoding resistance genes aretandemly duplicated in B. oleracea and B. rapa, respectively(Supplementary Table 33).
Biased loss and retention of genes after WGT/WGD. Followingpolyploidization, reversion of gene numbers towards diploidlevels through gene loss has been widely observed in plants30.However, in Brassica this only appears to be true for collineargenes in the conserved syntenic regions, with a loss of B60%
815
378
208 153
522
187695
421
0
10
20
30
40
50
60
Num
ber
of m
aps
No. of genes with 2 or 3 paralogs / no. of totalgenes in individual maps
B. oleracea
B. rapa
A. thaliana
A. thaliana 1,554
B. rapa 2,111 B. oleracea 1,825
697
359
659
396
0
5
10
15
20
25
30
35
40
45a
c
b
Num
ber
of m
aps
Tandem gene number/the total genenumber in individual maps
B. oleraceaB. rapaA. thaliana
00–
0.1
0.1–
0.2
0.2–
0.3
0.3–
0.4
0.4–
0.5
0.5–
0.6
0.6–
0.7
0.7–
0.8
0.8–
0.9
0.9–
1.0
00–
0.1
0.1–
0.2
0.2–
0.3
0.3–
0.4
0.4–
0.5
0.5–
0.6
0.6–
0.7
0.7–
0.8
0.8–
0.9
0.9–
1.0
E
H+
d
NADH
1.6.99.3104-88-54 1.6.99.5
49-45-24
1.6.5.361-51-47
NAD+
UQ UQ
Complex VComplex I Complex III
Cytc
Complex II Complex IV
1.10.2.29-8-5
Succinate
1.3.99.117-12-16
1.3.5.110-10-12
Fumarate
1.9.3.15-2-6
H2O
H2O
ADP
Pi
ATP
PPi
3.6.1.116-15-8
3.6.3.615-15-11
O2
COX102-2-1 COX11
3-3-1COX153-1-1
COX172-2-2
Cytochrome c oxidase
E/B/A
Cytc
Cytc
Cytc
e–
e–
e–
e–
H+
H+ H+ H+
H+
H+
H+
Figure 3 | The duplicated genes derived from tandem duplication and whole-genome duplications in Brassica genomes. (a) A Venn diagram
showing shared and specific tandem duplication events in A. thaliana, B. rapa and B. oleracea. (b,c) Distribution of tandem genes and WGT/WGD-derived
paralogues in the KEGG pathway maps in B. oleracea (bol), B. rapa (bra) and A. thaliana (ath). For each KEGG pathway map, the proportion of the number of
duplicated genes or paralogues to the total genes was calculated (x axis) and the number of maps whose tandem gene proportion fell in a range
was shown on the y axis. (d) Oxidative phosphorylation pathway enriched by WGT-derived paralogous genes in the Brassica genomes. The gene copy
number for each KO enzyme in B. oleracea, B. rapa and A. thaliana were shown (dash-connected) under the KO enzyme number.
NATURE COMMUNICATIONS | DOI: 10.1038/ncomms4930 ARTICLE
NATURE COMMUNICATIONS | 5:3930 | DOI: 10.1038/ncomms4930 | www.nature.com/naturecommunications 5
& 2014 Macmillan Publishers Limited. All rights reserved.

of the predicted post-triplication gene set, nearly restoring thepre-triplication gene number. This is reflected in an overallretention rate of 1.2-fold of A. thaliana orthologous genes incorresponding syntenic regions (Fig. 1c and SupplementaryTable 18). In contrast, in terms of genes that have no collineargene in A. thaliana and either Brassica species (hereafter callednon-collinear genes), gene retention rates is 2.5-fold theA. thaliana gene number in B. oleracea and 1.9-fold in B. rapa,both significantly higher than the expected rates (P value o2.2e–16;Supplementary Table 34). For these retained genes, the numbers ofthe genes that are common in the two Brassica species are 11,746 inB. oleracea and 10,411 in B. rapa. Most of these genes are supportedby expression and/or the presence of an Arabidopsis homologue(Supplementary Table 35). More than 61% of these genes havehomologues present as collinear genes and 16% also are homologousto other non-collinear genes, indicating gene movement fromtriplicated syntenic regions and being similar to observations in A.thaliana, where half of the genes are nonsyntenic within rosids31.This suggests that the breakdown of the triplicated syntenicrelationship has not only prevented gene loss and a move towardspre-triplication gene numbers but has also maintained a higher genedensity, and thus maintained WGT-derived genes for speciesevolution.
The presence of a large number of the retained paralogousgenes in the syntenic regions led us to examine whether genes insome functional categories have preferentially been over-retained,as observed in other plants29. The results indicate thatWGT-produced paralogous genes are over-retained in GOcategories associated with regulation of metabolic and bio-synthetic processes, RNA metabolism and transcription factors(Supplementary Table 36 and Supplementary Figs 43–45), andthe two Brassica species exhibit similar patterns of gene categoryretention. From a study of KEGG pathways, we also found thatWGT-produced Brassica paralogous genes contribute 40–60% oftotal genes for 90% of KEGG pathways (Fig. 3c andSupplementary Fig. 43), and are functionally enriched inprimary or core metabolic processes such as oxidativephosphorylation, carbon fixation, photosynthesis, circadianrhythm32 and lipid metabolism (Supplementary Tables 36 and37 and Supplementary Figs 43–45). Notably, the pathwaysassociated with energy metabolism have been enhanced in bothBrassica species. For instance, in the oxidative phosphorylationpathway, there are 161 genes in A. thaliana, but 241 in B. oleraceaand 208 in B. rapa. The majority (143/241 and 142/208) of theseBrassica genes are multiple paralogues residing in the triplicatedsyntenic regions, and more than half of these paralogueshave been retained as three copies, significantly higher thanobserved for other genes in the triplication regions (Fig. 3d andSupplementary Fig. 43).
Phylogenetic analyses show that WGT led to an expansion ofgenes involved in auxin functioning (AUX, IAA, GH3, PIN,SAUR, TAA, TIR, TPL and YUCCA), morphology specification(TCP), and flowering time control (FLC, CO, VRN1, LFY,AP1 and GI) (Supplementary Table 38 and SupplementaryFigs 46–61), and that most Arabidopsis genes in these familieshave two or three orthologs in Brassica species. These WGT-produced duplicated genes may provide important sources ofevolutionary innovation33 and contribute to the extrememorphological diversity in Brassica species.
Divergence of duplicated genes in the Brassica genomes. Thelargest genetic foundation for plant genome evolution and newspecies formation is the differentiation of retained paralogous andorthologous genes. Around 38% (4,302/11,493) of all paralogousgene pairs in B. oleracea and B36% (4,089/11,448) in B. rapa
have different predicted exon numbers (Supplementary Data 1,Supplementary Tables 39 and 40 and Supplementary Fig. 62).There are 6,571 orthologous gene pairs with different exonnumbers, accounting for 27.6% of total gene pairs (23,823). Someparalogous or orthologous pairs have high Ks values and lowsequence similarity (Supplementary Fig. 63), indicating sequencedifferentiation. Of these paralogous genes, some offer appreciableopportunity for non-reciprocal DNA exchanges (gene conver-sion). About 8% of the 4,296 homologous quartets in B. rapa andB. oleracea have been affected by gene conversion (Fig. 4a,Supplementary Table 41 and Supplementary Fig. 64) and aboutone-sixth (53) of converted genes were inferred to have experi-enced independent conversion events in both Brassica species, aparallelism sometimes observed in other plants11,34. Around40–44% of conversion events involved paralogues in the less-fractionated subgenomes LF in both species, substantially higherthan the other two subgenomes (Supplementary Table 41). Thisfinding suggests that gene conversion is related to homologousgene density, which determines the likelihood of illegitimaterecombination.
Analysis of RNA-seq data generated from callus, root, leaf,stem, flower and silique of B. oleracea and B. rapa suggests that440% of WGT paralogous gene pairs are differentially expressedin these species (Fig. 4b and Supplementary Fig. 65), suggestingpotential subfunctionalization of these genes. In both species, ageneral trend of expression differentiation was alpha-WGDparalogous genes (B46%) 4 WGT paralogous genes (B42%)4 tandemly duplicated genes (B35%) (Fig. 4b, SupplementaryFig. 66 and Supplementary Tables 42 and 43). Different tissuesharbour approximately the same number of differentiallyexpressed duplicates, but this number was slightly higher inflower tissue. The expression level of genes in the LF subgenomewas significantly higher than corresponding syntenic genes in themore fractionated subgenomes (MF1 and MF2) while noexpression dominance relationship was observed between thesubgenomes MF1 and MF2 (Fig. 4c, Supplementary Table 44 andSupplementary Fig. 67). Duplicated transcription factor genepairs showed less differentiated expression (B38%) than theexpected ratio at the genome-wide level (Fig. 4d andSupplementary Table 45), while paralogues with GO categoriesrelated to membrane, catalytic activity and defence responseexhibited a higher ratio of differentiated expression (Fig. 4e andSupplementary Table 46). Of B. oleracea–B. rapa orthologousgene pairs (23,823 in total), B42% were differentially expressedacross all tissues (Supplementary Tables 42 and 43).
Furthermore, many paralogues generate different transcripts,resulting in expression differentiation. Analysis of AS variants ofparalogous gene pairs that have identical numbers of exonsdemonstrated that these variants (either different variants ordifferential expression of the same variants) cause 420% and444% of such paralogous genes to be differentially expressed inB. oleracea and B. rapa, respectively (Fig. 4f and SupplementaryTable 47). For orthologous gene pairs of B. oleracea and B. rapa,35.5% (8,467) of gene pairs showed differential expression due toAS variation. When only counting intron retention and exonskipping, 9.3% (2,215) of gene pairs differ. Divergence in ASvariants of gene pairs presents an important layer of generegulation, as reported35–38, and thus provides a genetic basis forspecies evolution and new species formation.
Unique GSLs metabolism pathways. GSLs and hydrolysis pro-ducts have been of long-standing interest due to their role in plantdefence and anticancer properties. Compared with B. rapa andB. napus, B. oleracea has the greatest GSL profile diversity, withwide qualitative and quantitative variation39,40. We identified 101
ARTICLE NATURE COMMUNICATIONS | DOI: 10.1038/ncomms4930
6 NATURE COMMUNICATIONS | 5:3930 | DOI: 10.1038/ncomms4930 | www.nature.com/naturecommunications
& 2014 Macmillan Publishers Limited. All rights reserved.

and 105 GSL biosynthesis genes in B. rapa and B. oleracea,respectively, and 22 GSL catabolism genes in each species (Fig. 5a,Supplementary Table 48 and Supplementary Data 2). In the GSLbiosynthesis and catabolism pathways, tandem genes (41.4%,40.7% and 33.9% in A. thaliana, B. oleracea and B. rapa,respectively) were present in a much higher proportion than the
genome-wide average (Supplementary Table 32). The observedvariation of GSL profiles is mainly attributed to the duplicationof two genes, methylthioalkylmalate (MAM) synthase and2-oxoglutarate-dependent dioxygenase (AOP).
In Arabidopsis, the MAM family contains three tandemlyduplicated and functionally diverse members (MAM1, MAM2
All AS
0
10
20
30
40
50
60
70
Per
cent
(%
)
Ratio to total gene pairs with sameexon numberRatio to total gene pairs
C01
C02C03a
c
e f
d
b
C04
C05
C06
C07C08
C09
0
10
20
30
40
50
60
Per
cent
age
(%)
of d
iffer
entia
lly e
xpre
ssed
dupl
icat
ed g
ene
pairs
Tissues
Bol Braa - WGD
WGT
TDLo
g- e
xpre
ssio
n va
lue
LF
** **** **10
8
6
4
2
0
–2
–4
Flower
Total pairs(background)
Sequence-specific DNA bindingtranscription factor activity
Total TFs pairs
GO total pairs(background)
Regulation of transcription,DNA-dependent
454035302520151050
****
****
****
Leaf
Percentage (%) of differentially expressedduplicated gene pairs
C,R,St,F,SiC,R,St,F,Si
St,F,Si
C,R,St,F,Si
C,R,St,F,Si
C,R,St,F,Si
0
GO total pairs
Catalytic activity
Anchored toplasma membrane
DNA repair
Electron carrier activity
Transmembrane transport
Flavonoid biosynthetic process
Regulation ofdefense response
Percentage (%) of differentially expressedduplicated gene pairs
80
Amino acid transmembranetransporter activity
LL
LL **
** C,St,F,SiC,St,F,Si
LL **
**R,St,F
C,R
****
RR C,L
St,L,F
F
RR
****
****
****
**
F
St
LL
C,SiC,St
C,St,F
Si
F,SiSt
Bol
Bol
B. oleracea B. rapa
Bra
SiFLStRCSiFLStRCSiFLStRC
604020
Bol-BraBol BraBol-BraBol Bra
AS (IRES)
Bra
MF2MF1
Figure 4 | Divergence of Brassica paralogous and orthologous genes in B. oleracea and B. rapa. (a) Genome-wide gene conversion in B. oleracea.
The conversion in B. rapa is showed in Supplementary Fig. 64. (b) The ratio of differentially expressed duplicated gene pairs derived from different
duplications: alpha whole-genome duplication (a-WGD), Brassiceae-lineage WGT, tandem duplication (TD). Bol, B. oleracea; Bra, B. rapa. C: callus; R: root;
St: stem; L: leaf; F: flower; Si: silique. The differentially expressed duplicated gene pairs were defined as fold change 42 and false discovery rate (FDR)
o0.05 or gene pair where expression was detected for only one gene within gene pairs (FDR o0.05). (c) Box and whisker plots for differentiated
expression for three subgenomes (LF, MF1 and MF2) in flower tissue of B. oleracea and B. rapa. For the other tissues, see Supplementary Fig. 67. (d) The
duplicated gene pairs belonging to transcription factors (TFs) and its related GO terms contain a significantly lower ratio of differentially expressed
duplicated gene pairs than the average at the genome-wide level in leaf (values given) and other tissues (values not presented) (Supplementary Table 45).
(e) The GO terms (left) in which the duplicated gene pairs contain a significantly higher ratio of differentially expressed duplicated gene pairs than the
average ratio at the genome-wide level in leaf and other tissues (Supplementary Table 46). Values from one tissue were presented and the other tissues
were indicated with abbreviated letters to the right if expression in these tissues is significantly higher. (f) Expression variation caused by divergence
(either different variants or differential expression of the same variants) of alternative splicing (AS) variants in WGT paralogous gene pairs with identical
numbers of exons and in Bol–Bra orthologous gene pairs. IRES denotes types of intron retention and exon skipping.
NATURE COMMUNICATIONS | DOI: 10.1038/ncomms4930 ARTICLE
NATURE COMMUNICATIONS | 5:3930 | DOI: 10.1038/ncomms4930 | www.nature.com/naturecommunications 7
& 2014 Macmillan Publishers Limited. All rights reserved.

and MAM3), and functional analysis demonstrated that MAM2(absent in ecotype Columbia) and MAM1 catalyses thecondensation reaction of the first and the first two elongationcycles for the synthesis of dominant 3 and 4 carbon (C) side-chain aliphatic GSLs, respectively40,41, while MAM3 is assumedto contribute to the production of all GSL chain lengths42. InB. rapa and B. oleracea, MAM1/MAM2 genes experiencedindependent tandem duplication to produce 6 and 5 orthologsrespectively (Fig. 5b,c). The main GSLs in B. oleracea are 4C and3C GSLs (progoitrin, gluconapin, glucoraphanin and sinigrin)43,while those in B. rapa are 4C and 5C GSLs (gluconapin andglucobrassicanapin)39 (Fig. 5a). Based on the results of expressionand phylogenetic analyses, we found a pair of genes Bol017070and Bra013007, which are the only orthologous genes showinghigh expression in B. oleracea but silenced in B. rapa (Fig. 5a).
This expression difference most likely leads to greateraccumulation of the 3C GSL anticancer precursor sinigrin inB. oleracea. Meanwhile, the expression level of MAM3 in B. rapais much higher than in B. oleracea, explaining the accumulationof 5C GSL glucobrassicanapin in B. rapa. Other genes affectingspecific anticancer GLS products are AOPs. Previously, researchhas reported four gene loci involved in the side-chainmodifications of aliphatic GSLs in Arabidopsis. Two tandemlyduplicated genes AOP2 and AOP3 catalyse the formation ofalkenyl and hydroxyalkyl GSLs, respectively. When both AOPsare non-functional, the plant accumulates the precursormethylsulfinyl alkyl GSL. We identified three AOP2 genes inB. oleracea (Fig. 5d), but two are non-functional due to thepresence of premature stop codons. In contrast, all three AOP2copies are functional in B. rapa44. No AOP3 homologue has been
Methionine
Typtophan
2-keto acid
Chain elongatedmethionine
Aldoxime
aci-nitro compound
S-alkyl-thiohydroximate
Thiohydroximate
Desulpho-GSL
Indole-3-acetaldoxime
S-indol-thiohydroximate
Thiohydroximate
Desulpho-GSL
1OHI3M
1MOI3M
4OHI3M
4MOI3M4BTEY
(gluconapin)
4OHB(progoitrin)
3MTP(glucoibervirin)
Aglucone
NitrileEpithionitrile
Thiocyanate
Aliphatic GSLs Indolic GSLs
MAM
AOP Bol030626Bol030627Bra000847Bra034181Bra034182AtAOP1Bra000848Bra018992
AtAOP3AtAOP2BolAOP2BolAOP2-m1Bra018521BolAOP2-m2Bra034180
Bra029355Bol020647Bol020646Bra029356AtMAM2AtMAM1Bra021947Bol037823Bra013007Bol017070AtMAM3Bra013011Bol017071Bra013009Bra018524Bol016496
AtIPMS2AtIPMS1
BCAT4 [1, 2, 2]
MAM1/2 [2, 6, 5]MAM3 [1, 1, 1]
CYP79F1 [1, 1, 1]CYP79F2 [1, 0, 0]
CYP83A1 [1, 2, 2]
GGP1 [1, 3, 3]SUR1 [1, 2, 4]
UGT74B1 [1, 1, 1]UGT74C1 [1, 2, 2]
ST5b [1, 2, 2]ST5c [1, 1, 1]
AOP2 [1, 3, 3 (2)]
GS-OH [1, 3, 2]
CYP79B2 [1, 3, 3]CYP79B3 [1, 1, 1]
CYP83B1 [1, 2, 1]
GGP1 [1, 3, 3]SUR1 [1, 2, 4]
UGT74B1 [1, 1, 1]
ST5a [1, 2, 2]
CYP81F4 [1, 2, 3]
GSTF9 [1, 2, 4]GSTF10 [1, 1, 1]
CYP81F1 [1, 2, 4]CYP81F2 [1, 3, 3]CYP81F3 [1, 1, 1]
IGMT1 [1, 3, 2]IGMT2 [1, 2, 1]
PEN2 [1, 2, 1]
GSTF11 [1, 1, 1] GSTF20 [1, 1, 1]
ST5b [1, 2, 2]ST5c [1, 1, 1]
AOP2 [1,3,3 (2)]
ESP [1, 2, 5]TFP
ESP [1, 2, 5]NSPs [2, 3, 2]TFP
TFP
IGMT1 [1, 3, 2]IGMT2 [1, 2, 1]
TGGs [4, 6, 4]
4MTB(glucoerucin)
I3M(glucobrassicin)
4MSOB(glucoraphanin)
3MSOP(glucoiberin)
3PREY(sinigrin)
Isothiocyanatesulphoraphane, iberin,
erucin, AITC, I3C, DIM
BreakdownBreakdown
BiosynthesisBiosynthesis
98
2,000 bp1,0000
93
40
36
33
100
96
59
68
54
9847
100
100
100
93
100
100
100
66
99
6461
74
57
55
BolAOP2-m1
BolAOP2-m2
BolAOP2
1-aci-nitro-2-indolyl-ethane
Figure 5 | Whole-genome-wide comparison of genes involved in glucosinolate metabolism pathways in B. oleracea and its relatives. (a) Aliphatic
and indolic GSL biosynthesis and catabolism pathways in A. thaliana, B. oleracea and B. rapa. The copy number of GSL biosynthetic genes in A. thaliana,
B. rapa and B. oleracea are listed in square brackets, respectively. Potential anticancer substances/precursors are highlighted in blue bold. Two important
amino acid chain elongation and side-chain modification loci MAMs and AOP2 are highlighted in red bold, within the number in the green bracket
representing the number of non-functional genes. (b,c) The neighbour-joining (NJ) trees of MAM and AOP genes were generated based on the aligned
coding sequences and 100 bootstrap repeats. The silenced genes are indicated by red hollow circle, expressed functional genes are represented by red solid
disc and green rectangle. In A. thaliana ecotype Columbia there are just MAM1 and MAM3. (d) Three B. oleracea AOP2 loci among which are one functional
AOP2 and two mutated AOP2. 1MOI3M: 1-methoxyindol-3-ylmethyl GSL; 1OHI3M: 1-hydroxyindol-3-ylmethyl GSL; 3MSOP: 3-methylsulfinylpropyl
GSL; 3MTP: 3-methylthiopropyl GSL; 3PREY: 2-Propenyl GSL; 4BTEY: 3-butenyl GSL; 4MOI3M: 4-methoxyindol-3-ylmethyl GSL; 4OHB, 4-hydroxybutyl
GSL; 4OHI3M: 4-hydroxyindol-3-ylmethyl GSL; 4MSOB: 4-methylsulfinylbutyl GSL; 4MTB, 4-methylthiobutyl GSL; AITC: allyl isothiocyanate;
I3C: indole-3-carbinol; I3M: indolyl-3-methyl GSL; DIM: 3,30-diindolymethane; MAM: methylthioalkylmalate; AOP: 2-oxoglutarate-dependent dioxygenase.
ARTICLE NATURE COMMUNICATIONS | DOI: 10.1038/ncomms4930
8 NATURE COMMUNICATIONS | 5:3930 | DOI: 10.1038/ncomms4930 | www.nature.com/naturecommunications
& 2014 Macmillan Publishers Limited. All rights reserved.

identified in Brassica. This analysis supports GSL content surveysand explains why glucoraphanin is abundant in B. oleracea, butnot in B. rapa.
DiscussionThe Brassica genomes experienced WGT11,12,25 followed bymassive gene loss and frequent reshuffling of triplicated genomicblocks. Analysis of retained or lost genes following triplicationidentified over-retention of genes for metabolic pathways such asoxidative phosphorylation, carbon fixation, photosynthesis andcircadian rhythm32, which may contribute to polyploid vigour45.Fewer lost genes were observed in the less-fractionated sub-genome, possibly due to expression dominance as reported inmaize46.
Gene expression analysis revealed extensive divergence and ASvariants between duplicate genes. This subfunctionalization orneofunctionalization of duplicated genes provides genetic noveltyand a basis for species evolution and new species formation. Forexample, TF genes that are considered to be conserved still havemore than 38% of paralogous pairs showing differentialexpression across tissues although this percentage is lower thanthe average from all duplicated genes. Gene expression variationmay contribute to an increased complexity of regulatory networksafter polyploidization.
The multi-layered asymmetrical evolution of the Brassicagenomes revealed in this study suggests mechanisms of polyploidgenome evolution underlying speciation. Asymmetrical geneloss between the Brassica subgenomes, the asymmetricalamplification of TEs and tandem duplications, preferentialenrichment of genes for certain pathways or functional categories,and divergence in DNA sequence and expression, includingalternative splicing among a large number of paralogousand orthologous genes, together shape a route for genomeevolution after polyploidization. A molecular model of polyploidgenome evolution through these asymmetrical mechanisms issummarized in Supplementary Fig. 2. The additional informationof accessible large datasets and resource was provided inSupplementary Table 49.
In summary, the B. oleracea genomic sequence, its features incomparison with its relatives, and the genome evolutionmechanisms revealed, provide a fundamental resource for thegenetic improvement of important traits, including componentsof GSLs for anticancer pharmaceuticals. The genome sequencehas also laid a foundation for investigation of the tremendousrange of morphological variation in B. oleracea as well assupporting genome analysis of the important allotetraploid cropB. napus (canola or rapeseed).
MethodsSample preparation and genome sequencing. A B. oleracea sp. capitatahomozygous line 02–12 with elite agronomic characters and widely used as aparent in hybrid breeding was used for the reference genome sequencing(Supplementary Methods). The seedlings of plants were collected and genomicDNA was extracted from leaves with a standard CTAB extraction method. IlluminaGenome Analyser whole-genome shotgun sequencing combined with GS FLXTitanium sequencing technology was used to achieve a B. oleracea draft genome.We constructed a total of 35 paired-end sequencing libraries with insertion sizes of180 base pairs (bp), 200 bp, 350 bp, 500 bp, 650 bp, 800 bp, 2 kb, 5 kb, 10 kb and20 kb following a standard protocol provided by Illumina (SupplementaryMethods). Sequencing was performed using Illumina Genome Analyser IIaccording to the manufacturer’s standard protocol.
Genome assembly and validation. We took a series of checking and filteringmeasures on reads following the Illumina-Pipeline, and low-quality reads, adaptorsequences and duplicates were removed (Supplementary Methods). The reads afterthe above filtering and correction steps were used to perform assembly includingcontig construction, scaffold construction and gap filling using SOAPdenovo1.04(http://soap.genomics.org.cn/) (Supplementary Methods). Finally, we used 20-kb-span paired-end data generated from the 454 platform and 105-kb-span BAC-end
data downloaded from NCBI (http://www.ncbi.nlm.nih.gov/nucgss?term=BOT01)to extend scaffold length (Supplementary Methods). The B. oleracea genome sizewas estimated using the distribution curve of 17-mer frequency (SupplementaryMethods).
To anchor the assembled scaffolds onto pseudo-chromosomes, we developed agenetic map using a double haploid population with 165 lines derived from a F1cross between two homozygous lines 02–12 (sequenced) and 0188 (re-sequenced).The genetic map contains 1,227 simple sequence repeat markers and singlenucleotide polymorphism markers in nine linkage groups, which span a total of1,180.2 cM with an average of 0.96 cM between the adjacent loci16. To positionthese markers to the scaffolds, marker primers were compared with the scaffoldsequences using e-PCR (parameters -n2 -g1 –d 400–800), with the best-scoringmatch chosen in case of multiple matches.
We validated the B. oleracea genome assembly by comparing it with thepublished physical map constructed using 73,728 BAC clones (http://lulu.pgml.uga.edu/fpc/WebAGCoL/brassica/WebFPC/)17 and a genetic map fromB. napus18 (Supplementary Methods). Eleven Sanger-sequenced B. oleracea BACsequences were used to assess the assembled genome using MUMmer-3.22(http://mummer.sourceforge.net/) (Supplementary Methods).
Gene prediction and annotation. Gene prediction was performed on the genomesequence after pre-masking for TEs (Supplementary Methods). Gene predictionwas processed with the following steps: (i) De novo gene prediction usedAUGUSTUS47 and GlimmerHMM48 with parameters trained from A. thalianagenes. (ii) For homologue prediction, we mapped the protein sequences fromA. thaliana, O. sativa, C. papaya, V. vinifera and P. trichocarpa to the B. oleraceagenome using tblastn with an E-value cutoff of 10� 5, and used GeneWise (Version2.2.0)49 for gene annotation. (iii) For EST-aided annotation, the Brassica ESTsfrom NCBI were aligned to the B. oleracea genome using BLAT (identity Z0.95,coverage Z0.90) and further assembled using PASA50. Finally, all the predictionswere combined using GLEAN51 to produce the consensus gene sets.
Functional annotation of B. oleracea genes was based on comparison withSwissProt, TrEMBL, Interproscan and KEGG proteins databases. The tRNA geneswere identified by tRNAscan-SE using default parameters52. Then rRNAs werecompared with the genome using blastn. Other non-coding RNAs, includingmiRNA, snRNA, were identified using INFERNAL53 by comparison with the Rfamdatabase.
TE annotation. LTR-RTs were initially identified using the LTR_STRUC54
programme, and then manually annotated and checked based on structurecharacteristics and sequence homology. Refined intact elements were then used toidentify other intact elements and solo LTRs55. All the LTR-RTs with clearboundaries and insertion sites were classified into superfamilies (Copia-like, Gypsy-like and Unclassified retroelements) and families relying on the internal proteinsequence, 50 , 30 LTRs, primer-binding site and polypurine tracts. Non-LTR-RTs(Long interspersed nuclear element, LINE and Short interspersed nuclear element,SINE) and DNA transposons (Tc1-Mariner, hAT, Mutator, Pong, PIF-Harbinger,CACTA and miniature inverted repeat TE) were identified using conserved proteindomains of reverse transposase or transposase as queries to search against theassembled genome using tblastn. Further upstream and downstream sequences ofthe candidate matches were compared with each other to define their boundariesand structure56. Helitron elements were identified by the HelSearch 1.0programme57 and manually inspected. All the TE categories were identifiedaccording to the criteria described previously58. Typical elements of each categorywere selected and mixed together as a database for RepeatMasker59 analysis.Around 20� coverage of shotgun reads randomly sampled from the two Brassicagenomes were masked by the same TE data set to confirm the differentaccumulation of TEs between the two genomes.
Syntenic block construction of B. oleracea and its relatives. We used the samestrategy as described in the B. rapa genome paper11 to construct syntenic blocksbetween species (Supplementary Methods). The all-against-all blastp comparison(E-value r 1e–5) provided the gene pairs for syntenic clustering determined byMCScan (MATCH_SCORE: 50, MATCH_SIZE: 5, GAP_SCORE: –3, E_VALUE:1E–05). As applied in B. rapa11, we assigned and partitioned multiple B. oleracea orB. rapa chromosomal segments that matched the same A. thaliana segment (‘A toX’ numbering system in A. thaliana22) into three subgenomes: LF, MF1 and MF2.
OrthoMCL clustering. To identify and estimate the number of potentialorthologous gene families between B. oleracea, B. rapa, A. thaliana, C. papaya,P. trichocarpa, V. vinifera, S. bicolor and O. sativa, and also between B. oleracea andB. rapa, we applied the OrthoMCL pipeline60 using standard settings (blastpE value o1� 10� 5 and inflation factor ¼ 1.5) to compute the all-against-allsimilarities.
Phylogenetic analysis of gene families. We performed comparative analysis oftrait-related gene families. Genes from grape, papaya and Arabidopsis weredownloaded from the GenoScope database (http://www.genoscope.cns.fr/externe/
NATURE COMMUNICATIONS | DOI: 10.1038/ncomms4930 ARTICLE
NATURE COMMUNICATIONS | 5:3930 | DOI: 10.1038/ncomms4930 | www.nature.com/naturecommunications 9
& 2014 Macmillan Publishers Limited. All rights reserved.

GenomeBrowser/Vitis/), the Hawaii Papaya Genome Project (http://asgpb.mhpc-c.hawaii.edu/papaya/), and the Arabidopsis Information Resource (http://www.arabidopsis.org/). Previously reported Arabidopsis and Brassica genesequences were downloaded from TAIR (http://www.arabidopsis.org/) and BRAD(http://brassicadb.org/brad/). The protein sequences of the genes were used todetermine homologues in grape, papaya, Arabidopsis, B. oleracea and B. rapa byperforming blast comparisons with an E-value 1e–10. The Clustal61 programs wereused for multiple sequence alignment. Alignment of the small family of GI geneswas performed using MEGA562 to conduct neighbour-joining analysis with defaultparameters and subjected to careful manual checks to remove highly divergentsequences from further analysis. While for other genes, often found in families oftens of genes, the phylogenetic analysis were performed by PhyML63, which canaccommodate quite divergent sequences by implementing a maximal likelihoodapproach with initial analysis based on neighbour-joining method. During theseanalyses, we constructed trees using both CDS and protein sequence, and theprotein-derived tree was used to show the phylogeny if not much incongruity wasfound. Bootstrapping was performed using 100 repetitive samplings for each genefamily. All the inferred trees were displayed using MEGA5 (ref. 62). The multiplesequence alignment of these families was provided as Supplementary Data 3.
Differential expression of duplicated genes across tissues. RNA-seq readswere mapped to their respective locations on the reference genome using Tophat64.Uniquely aligned read counts were calculated for each gene for each tissue sample.We performed the exact conditional test of two Poisson rates on read counts ofduplicated genes to test the differential expression of duplicated genes, according tothe method applied in soybean65,66. For each duplicated gene pair (for example,genes A and B), read counts and gene length were denoted as Ea and La for gene A,and Eb and Lb for gene B, respectively. The read counts of the genes A and B wereassumed to follow the Poisson distributions with rates lA¼Ra� La andlB¼Rb� Lb. Under the null hypothesis of equal expression of the genes A and B,that is, Ra¼Rb, the conditional distribution of Ea given EaþEb¼ k follows abinomial distribution with success probability P¼ la/(laþlb)¼ La/(Laþ Lb).The P values were computed and further adjusted to maintain the false discoveryrate at 0.05 across gene pairs using the Benjamini–Hochberg method67.
Statistical analysis. The average number of all retained orthologues in the threesubgenomes was used to estimate the expected retained gene number in each block,and used together with the observed retained gene number, for the gene retentiondisparity statistics using the w2 test. In the GO, IPR (Interproscan) or KEGGenrichment analyses of WGT or tandem genes, the w2 test (N45) or the Fisher’sexact test (Nr5) was used to detect significant differences between the proportionof (WGT or tandem) genes observed in each child GO, IPR or KEGG categories,and the expected overall proportion of (WGT or tandem) genes in the wholegenome. Correlation of the gene numbers of WGT-derived paralogous genes withtandem genes in 938 GO terms was tested by Pearson correlation coefficients(Supplementary Figure 68). The Benjamini–Hochberg false discovery rate wasperformed to adjust the P values67.
References1. U.S. Department of Agriculture, Agricultural Research Service. USDA National
Nutrient Database for Standard Reference, Release 26-Vegetables andVegetable Products (2013).
2. Kopsell, D. A. & Kopsell, D. E. Accumulation and bioavailability of dietarycarotenoids in vegetable crops. Trends Plant Sci. 11, 499–507 (2006).
3. Halkier, B. A. & Gershenzon, J. Biology and biochemistry of glucosinolates.Annu. Rev. Plant Biol. 57, 303–333 (2006).
4. Khwaja, F. S., Wynne, S., Posey, I. & Djakiew, D. 3,3’-diindolylmethaneinduction of p75NTR-dependent cell death via the p38 mitogen-activatedprotein kinase pathway in prostate cancer cells. Cancer Prev. Res. (Phila) 2,566–571 (2009).
5. Li, Y. et al. Sulforaphane, a dietary component of broccoli/broccoli sprouts,inhibits breast cancer stem cells. Clin. Cancer Res. 16, 2580–2590 (2010).
6. Higdon, J. V., Delage, B., Williams, D. E. & Dashwood, R. H. Cruciferousvegetables and human cancer risk: epidemiologic evidence and mechanisticbasis. Pharmacol Res. 55, 224–236 (2007).
7. Warwick, S. I., Francis, A. & Al-Shehbaz, I. A. Brassicaceae: species checklistand database on CD-Rom. Pl. Syst. Evol. 259, 249–258 (2006).
8. Nagaharu, U. Genome analysis in Brassica with special reference to theexperimental formation of B. napus and peculiar mode of fertilication. Jap.J. Bot. 7, 389–452 (1935).
9. Bowers, J. E., Chapman, B. A., Rong, J. & Paterson, A. H. Unravellingangiosperm genome evolution by phylogenetic analysis of chromosomalduplication events. Nature 422, 433–438 (2003).
10. Jiao, Y. et al. Ancestral polyploidy in seed plants and angiosperms. Nature 473,97–100 (2011).
11. Wang, X. et al. The genome of the mesopolyploid crop species Brassica rapa.Nat. Genet. 43, 1035–1039 (2011).
12. Lysak, M. A., Koch, M. A., Pecinka, A. & Schubert, I. Chromosome triplicationfound across the tribe Brassiceae. Genome Res. 15, 516–525 (2005).
13. Cheng, F. et al. Deciphering the diploid ancestral genome of the MesohexaploidBrassica rapa. Plant Cell 25, 1541–1554 (2013).
14. Town, C. D. et al. Comparative genomics of Brassica oleracea and Arabidopsisthaliana reveal gene loss, fragmentation, and dispersal after polyploidy. PlantCell 18, 1348–1359 (2006).
15. Mun, J. H. et al. Genome-wide comparative analysis of the Brassica rapa genespace reveals genome shrinkage and differential loss of duplicated genes afterwhole genome triplication. Genome Biol. 10, R111 (2009).
16. Wang, W. et al. Construction and analysis of a high-density genetic linkage mapin cabbage (Brassica oleracea L. var. capitata). BMC Genomics 13, 523 (2012).
17. Wang, X. et al. A physical map of Brassica oleracea shows complexity ofchromosomal changes following recursive paleopolyploidizations. BMCGenomics 12, 470 (2011).
18. Bancroft, I. et al. Dissecting the genome of the polyploid crop oilseed rape bytranscriptome sequencing. Nat. Biotechnol. 29, 762–766 (2011).
19. Arabidopsis Genome and Initiative. Analysis of the genome sequence of theflowering plant Arabidopsis thaliana. Nature 408, 796–815 (2000).
20. Schranz, M. E., Lysak, M. A. & Mitchell-Olds, T. The ABC’s of comparativegenomics in the Brassicaceae: building blocks of crucifer genomes. Trends PlantSci. 11, 535–542 (2006).
21. Woodhouse, M. R. et al. Following tetraploidy in maize, a short deletionmechanism removed genes preferentially from one of the two homologs. PLoSBiol. 8, e1000409 (2010).
22. Devos, K. M., Brown, J. K. & Bennetzen, J. L. Genome size reduction throughillegitimate recombination counteracts genome expansion in Arabidopsis.Genome Res. 12, 1075–1079 (2002).
23. Lysak, M. A., Cheung, K., Kitschke, M. & Bures, P. Ancestral chromosomalblocks are triplicated in Brassiceae species with varying chromosome numberand genome size. Plant Physiol. 145, 402–410 (2007).
24. Panjabi, P. et al. Comparative mapping of Brassica juncea and Arabidopsisthaliana using Intron Polymorphism (IP) markers: homoeologousrelationships, diversification and evolution of the A, B and C Brassica genomes.BMC Genomics 9, 113 (2008).
25. Parkin, I. A. et al. Segmental structure of the Brassica napus genome based oncomparative analysis with Arabidopsis thaliana. Genetics 171, 765–781 (2005).
26. Wu, J. et al. The genome of the pear (Pyrus bretschneideri Rehd.). Genome Res.23, 396–408 (2012).
27. The Tomato Genome Consortium. The tomato genome sequence providesinsights into fleshy fruit evolution. Nature 485, 635–641 (2012).
28. Cheung, F. et al. Comparative analysis between homoeologous genomesegments of Brassica napus and its progenitor species reveals extensivesequence-level divergence. Plant Cell 21, 1912–1928 (2009).
29. Freeling, M. Bias in plant gene content following different sorts of duplication:tandem, whole-genome, segmental, or by transposition. Annu. Rev. Plant Biol.60, 433–453 (2009).
30. Sankoff, D., Zheng, C. & Zhu, Q. The collapse of gene complement followingwhole genome duplication. BMC Genomics 11, 313 (2010).
31. Woodhouse, M. R., Tang, H. & Freeling, M. Different gene families inArabidopsis thaliana transposed in different epochs and at different frequenciesthroughout the rosids. Plant Cell 23, 4241–4253 (2011).
32. Lou, P. et al. Preferential retention of circadian clock genes duringdiploidization following whole genome triplication in Brassica rapa. Plant Cell24, 2415–2426 (2012).
33. Doyle, J. J. et al. Evolutionary genetics of genome merger and doubling inplants. Annu. Rev. Genet. 42, 443–461 (2008).
34. Wang, X., Tang, H. & Paterson, A. H. Seventy million years of concertedevolution of a homoeologous chromosome pair, in parallel, in major Poaceaelineages. Plant Cell 23, 27–37 (2011).
35. Syed, N. H., Kalyna, M., Marquez, Y., Barta, A. & Brown, J. W. Alternativesplicing in plants--coming of age. Trends Plant Sci. 17, 616–623 (2012).
36. Gabut, M. et al. An alternative splicing switch regulates embryonic stem cellpluripotency and reprogramming. Cell 147, 132–146 (2011).
37. Zhang, P. G., Huang, S. Z., Pin, A. L. & Adams, K. L. Extensive divergence inalternative splicing patterns after gene and genome duplication during theevolutionary history of Arabidopsis. Mol. Biol. Evol. 27, 1686–1697 (2010).
38. Filichkin, S. A. et al. Genome-wide mapping of alternative splicing inArabidopsis thaliana. Genome Res. 20, 45–58 (2010).
39. Yang, B. & Quiros, C. F. Survey of glucosinolate variation in leaves of Brassicarapa crops. Genet. Res. Crop Evol. 57, 1079–1089 (2010).
40. Benderoth, M., Pfalz, M. & Kroymann, J. Methylthioalkylmalate synthases:genetics, ecology and evolution. Phytochem. Rev. 8, 255–268 (2009).
41. Benderoth, M. et al. Positive selection driving diversification in plant secondarymetabolism. Proc. Natl. Acad. Sci. USA 103, 9118–9123 (2006).
42. Textor, S., de Kraker, J. W., Hause, B., Gershenzon, J. & Tokuhisa, J. G. MAM3catalyses the formation of all aliphatic glucosinolate chain lengths inArabidopsis. Plant Physiol. 144, 60–71 (2007).
ARTICLE NATURE COMMUNICATIONS | DOI: 10.1038/ncomms4930
10 NATURE COMMUNICATIONS | 5:3930 | DOI: 10.1038/ncomms4930 | www.nature.com/naturecommunications
& 2014 Macmillan Publishers Limited. All rights reserved.
43. Volden, J. et al. Processing (blanching, boiling, steaming) effects on the contentof glucosinolates and antioxidant related parameters in cauliflower (Brassicaoleracea L. ssp. botrytis). LWT Food Sci. Technol. 42, 63–73 (2009).
44. Wang, H. et al. Glucosinolate biosynthetic genes in Brassica rapa. Gene 487,135–142 (2011).
45. Chen, Z. J. Molecular mechanisms of polyploidy and hybrid vigour. TrendsPlant Sci. 15, 57–71 (2010).
46. Schnable, J. C., Springer, N. M. & Freeling, M. Differentiation of the maizesubgenomes by genome dominance and both ancient and ongoing gene loss.Proc. Natl. Acad. Sci. USA 108, 4069–4074 (2011).
47. Stanke, M., Steinkamp, R., Waack, S. & Morgenstern, B. AUGUSTUS: a webserver for gene finding in eukaryotes. Nucleic Acids Res. 32, W309–W312 (2004).
48. Majoros, W. H., Pertea, M. & Salzberg, S. L. TigrScan and GlimmerHMM: twoopen source ab initio eukaryotic gene-finders. Bioinformatics 20, 2878–2879(2004).
49. Birney, E., Clamp, M. & Durbin, R. GeneWise and Genomewise. Genome Res.14, 988–995 (2004).
50. Xu, Y., Wang, X., Yang, J., Vaynberg, J. & Qin, J. PASA—a program forautomated protein NMR backbone signal assignment by pattern-filteringapproach. J. Biomol. NMR 34, 41–56 (2006).
51. Elsik, C. G. et al. Creating a honey bee consensus gene set. Genome Biol. 8, R13(2007).
52. Lowe, T. M. & Eddy, S. R. tRNAscan-SE: a program for improved detection oftransfer RNA genes in genomic sequence. Nucleic Acids Res. 25, 955–964(1997).
53. Nawrocki, E. P., Kolbe, D. L. & Eddy, S. R. Infernal 1.0: inference of RNAalignments. Bioinformatics 25, 1335–1337 (2009).
54. McCarthy, E. M. & McDonald, J. F. LTR_STRUC: a novel search andidentification program for LTR retrotransposons. Bioinformatics 19, 362–367(2003).
55. Ma, J., Devos, K. M. & Bennetzen, J. L. Analyses of LTR-retrotransposonstructures reveal recent and rapid genomic DNA loss in rice. Genome Res. 14,860–869 (2004).
56. Holligan, D., Zhang, X., Jiang, N., Pritham, E. J. & Wessler, S. R. Thetransposable element landscape of the model legume Lotus japonicus. Genetics174, 2215–2228 (2006).
57. Yang, L. & Bennetzen, J. L. Structure-based discovery and description ofplant and animal Helitrons. Proc. Natl Acad. Sci. USA 106, 12832–12837(2009).
58. Wicker, T. et al. A unified classification system for eukaryotic transposableelements. Nat. Rev. Genet. 8, 973–982 (2007).
59. Smit, A., Hubley, R. & Green, P. RepeatMasker. http://www.repeatmasker.org.60. Li, L., Stoeckert, Jr C. J. & Roos, D. S. OrthoMCL: identification of ortholog
groups for eukaryotic genomes. Genome Res. 13, 2178–2189 (2003).61. Larkin, M. A. et al. Clustal W and Clustal X version 2.0. Bioinformatics 23,
2947–2948 (2007).62. Tamura, K. et al. MEGA5: molecular evolutionary genetics analysis using
maximum likelihood, evolutionary distance, and maximum parsimonymethods. Mol. Biol. Evol. 28, 2731–2739 (2011).
63. Guindon, S., Delsuc, F., Dufayard, J. F. & Gascuel, O. Estimating maximumlikelihood phylogenies with PhyML. Methods Mol. Biol. 537, 113–137 (2009).
64. Trapnell, C. et al. Differential gene and transcript expression analysis of RNA-seq experiments with TopHat and Cufflinks. Nat. Protoc. 7, 562–578 (2012).
65. Roulin, A. et al. The fate of duplicated genes in a polyploid plant genome. PlantJ. 73, 143–153 (2012).
66. Gu, K., Ng, H. K., Tang, M. L. & Schucany, W. R. Testing the ratio of twopoisson rates. Biom. J. 50, 283–298 (2008).
67. Benjamini, Y. & Hochberg, Y. Controlling the false discovery rate: a practicaland powerful approach to multiple testing. J. Roy. Statist. Soc. Ser. 57, 289–300(1995).
68. Kimura, M. A simple method for estimating evolutionary rates of basesubstitutions through comparative studies of nucleotide sequences. J. Mol. Evol.16, 111–120 (1980).
69. Tamura, K., Dudley, J., Nei, M. & Kumar, S. MEGA4: Molecular EvolutionaryGenetics Analysis (MEGA) software version 4.0. Mol. Biol. Evol. 24, 1596–1599(2007).
AcknowledgementsThis work was supported by the National Basic Research Program of China(2011CB109300, 2012CB113906, 2012CB723007 and 2006CB101600), the NationalNatural Science Foundation of China (3067134, 30671119 and 31301039), theNational High Technology Research and Development Program (2013AA102602,2012AA100105 and 2012AA100104), the China Agriculture Research System (CARS-13and CARS-25-A), the Core Research Budget of the Non-profit Governmental ResearchInstitution (1610172010005), the Special Fund for Agro-scientific Research in the PublicInterest (201103016), China–Australia collaboration project (2010DFA31730), UKBiotechnology and Biological Sciences Research Council (BB/E017363/1), the AustralianResearch Council (LP0882095, LP0883462, DP0985953 and LP110100200), theNext-Generation BioGreen 21 Program (PJ008944 and PJ008202), and the US NationalScience Foundation (IOS 0638418, DBI 0849896, MCB 1021718).
Author contributionsI.B., B.C., D.E., Q.H., W.H., G.J.K., S.L., Y.L., J. Ma, A.H.P., J.C.P., I.A.P.P., JunW.,XiaowuW., XiyinW. and T.-J.Y. are principal investigators (alphabetic order). B.C., W.H.,A.H.P., JunW. and XiaowuW. are equally contributing senior authors. S.L., J.W., W.H.,X.X. and Z.Y. planned and managed the project. S.L., C.T., A.H.P. and D.E., X.Y. andM.Z. wrote this manuscript and I.B., J. Ma., G.J.K., J.C.P., B.C., T.-J.Y., I.A.P.P., XiyinW.,XiaowuW., K.L., Y.L., J.B. and A.G.S. made revision or edits or comments. J.W. (leader),W.H. (co-leader), JunW., L.Y., and Z.Y. performed DNA sequencing. L.Y. (leader), W.H.(co-leader), S.H., J.W., S.L. and J.Y. conducted genomic sequence assembly. S.H. (leader),XiyinW. (co-leader), J.Min, I.B., W.H., J.B., D.E., P.R., S.L., J.S., Y.L. and W.W. conductedscaffold anchoring to linkage maps and assembly validation. X.Y. (leader), J.Y. (co-leader), S.L., Q.Z., S.H. and J. Min performed annotation. C.T. (leader), Wanshun L.,W.H., Y.L., C.L., W.W., J. Wu, S.L., C.D. and M.Z. performed transcriptome sequencing.S.L. conceived analysis of comparison and evolution. S.L. (leader), C.T., X.Y., Zhan-gyanW., C.L., S.H., J. Ma, J.Y., M.Z., Zhuo W., Q.Z., S.P., I.A.P.P., A.G.S., L.Y., I.B., G.J.K.,J.C.P., XiaowuW., B.C., F.C., YinH., WenbinL. and X.Liang performed analysis ofcomparative genomics and evolution. J. Ma (leader), M.Z., Q.Z., C.T., S.L., B.C., S.H.,H.B., C.L. and JianaL. conducted TE analysis. XiyinW. (leader), J.Y., T.-J.Y., Zhan-gyanW., L.W., J. Li, T.-H.L., JinpengW., H.J., X.T., X.L., M.G. and L.J. conducted genefamily analysis. K.L. (leader), J.Y., S.L., C.T., H.L., H.G., S.P., D.Z., Z.F., Q.H., Xnfa W.,C.Q., D.D., Z.H., Y.H., J.H., D.M., J.L., Z. Li, J.Z., L.X., Y.Zhou., Z.L. and Y.Zhangconducted trait-related gene analysis. A.H.P. (leader), XiyinW., D.J., Y.W. and T.-H.L.conducted gene conversion analysis. T.-J. Y. (leader), M.Z., P.S., B.-S.P., J.Ma, N.E.W.,R.Q., X.L., J.Lee and H.H.K. conducted centromere analysis. C.T. (leader), S.L., X.Y., S.H.,C.L., Zhangyan W., Q.Z., J.Y., J.T. and J.B. conducted tandemly duplicated gene analysis.ZhangyanW. and J.Y. performed data submission.
Additional informationAccession codes: Genome sequence data for B. oleracea have been deposited in theDDBJ/EMBL/GenBank nucleotide core database under the accession codeAOIX00000000. Transcriptome sequence data for B. rapa and B. oleracea have beendeposited in the DDBJ/EMBL/GenBank Sequence Read Archive (SRA) under theaccession codes GSE43245 and GSE42891 respectively.
Supplementary Information accompanies this paper at http://www.nature.com/naturecommunications
Competing financial interests: The authors declare no competing financial interests.
Reprints and permission information is available online at http://npg.nature.com/reprintsandpermissions/
How to cite this article: Liu, S. et al. The Brassica oleracea genome revealsthe asymmetrical evolution of polyploid genomes. Nat. Commun. 5:3930doi: 10.1038/ncomms4930 (2014).
This work is licensed under a Creative Commons Attribution-NonCommercial-ShareAlike 3.0 Unported License. The images or
other third party material in this article are included in the article’s Creative Commonslicense, unless indicated otherwise in the credit line; if the material is not included underthe Creative Commons license, users will need to obtain permission from the licenseholder to reproduce the material. To view a copy of this license, visit http://creativecommons.org/licenses/by-nc-sa/3.0/
NATURE COMMUNICATIONS | DOI: 10.1038/ncomms4930 ARTICLE
NATURE COMMUNICATIONS | 5:3930 | DOI: 10.1038/ncomms4930 | www.nature.com/naturecommunications 11
& 2014 Macmillan Publishers Limited. All rights reserved.


