Embed Size (px)
Citation preview
THECAREERASPIRATIONSANDDEVELOPMENTOF
GOVERNMENTSECONDARYSCHOOLASSISTANT
PRINCIPALSINVICTORIA,AUSTRALIA.
Kenneth Henry Thompson
(ORCID 0000-0001-6292-6595)
Doctor of Education
May 2019
Diploma of Social Science, Diploma of Education, Bachelor of Arts, Post Graduate
Diploma (Applied Psychology), Master of Educational Psychology (Melb), Master of
Education (Melb).
Melbourne Graduate School of Education
“Submitted in partial fulfilment of the requirements for the Degree of Doctor of
Education”.

iii
Abstract
In the context of international concerns about the possible lack of quality candidates for
the top leadership positions in schools, this study focuses on those a heartbeat away
from the top job, that is, assistant principals. It examines the career intentions and
professional development of 48 assistant principals in government secondary schools in
a defined geographical region in the state of Victoria, Australia. A mixed methods and
cross sectional approach are taken to investigate the key research questions: What are
the leadership aspirations and career intentions of Assistant principals in Government
Secondary Schools? What development opportunities do they engage in? How effective
are they and what impact do they have? What is their own job satisfaction and how do
they rate the job satisfaction of principals in general? How do they rate their own
preparedness for the principalship? How strategic is the school-based planning for
leadership succession? What would need to change to increase their interest in the
principalship? Consistent with similar studies, only a minority of participants intended
to apply for principal positions and the interest could be conditional. Those who were
interested in the role were attracted to the dynamic nature of the role, whereas those
who did not intend to apply were mindful of matters such as the stress and time
demands of the role. There was a willingness to lead challenging schools among those
willing to lead. The research also found that relatively few participants were
undertaking the professional development available through the region and state.
However, there were more levels of participation in a broader range of programs offered
by a range of organisations. The most effective forms of professional development
were identified and discussed with in house and/ or planned activities being seen as
more effective than unplanned and /or external programs being judged as less effective.
While some schools were taking a relatively strategic approach to staff development,
most had room to improve by better rewarding and recognising staff members and being
able to replace sudden vacancies, as well as providing stretch assignments to develop
particular employees, to name some examples. Assistant principals were found to be
relatively satisfied with their jobs. The most common thing that needed to change to
change the mind of those not seeking the principalship was for the department to be
more supportive of principals. Unlike a previous study, no link was found between the
iv
perception assistant principals have of the job satisfaction of principals on the one hand
and their career intentions. Participants provided a long list of opportunities that would
help prepare them for principal leadership as well as hindrances. But a feeling of
preparedness was quite a different thing to being willing. Less than half of the
participants linked their career development needs to their professional development
plans, whereas almost all linked their professional development plans to the school
strategic plan. Recommendations for future research, including a re-testing of key
assumptions that are currently made. Further research recommendations were also
made in areas such as: the predictive reliability of career intentions, the impact of
professional learning and any link between preparedness for the principalship and career
intentions. Recommendations for future practice included working with researchers on
the research priorities.

v
Dedication
This work is dedicated to my mother, Florence May Fitzgibbon (nee Milligan), the
wisest, kindest and most all round intelligent person I have known, who does so much
good and no harm. Without her love, belief and support I would not have believed I
could have finished secondary school let alone complete a doctorate through such a long
and trying time. Mum, this one is for you! My respect, love and gratitude to you is
infinite.

vi
Declaration
This thesis does not contain material which has been accepted for any other degree in
any university. To the best of my knowledge and belief, this thesis contains no material
previously published or written by any other person, except where due reference is
given in the text.
Signature: ...................................................
Date: ...................................................

vii
Acknowledgements
In any doctoral work, the academic supervisor plays a key mentoring role. I am very
grateful for the expert mentoring from my supervisor, Dr David Gurr. David has offered
wise counsel and encouragement throughout this research project, which has been a
necessary constituent in every phase of the inquiry, especially the last phase where his
expertise and support was crucial, especially in the last stages. His own work and that
which he has done with other students, most notably Dr Kathy Lacey, has been an
inspiration to me.
This doctoral work has been a slow and stop start affair for me, and I would like to
acknowledge the sheer inspiration of previous mentors Professors Brian Caldwell and
Hedley Beare.
My mother, Florence May Milligan and her parents Gordon Lawrence Milligan and
Louise May Batson have been the inspirations of my life. They are and were such good
people who have believed in me always. I am wholly in their debt and wish to dedicate
this work to their lives and legacies.
Many friends and colleagues have been very supportive with this work. None has been
more of a support than Nancy Sandilands, who helped with so many tasks I find
difficult to stick at, such as data entry. She has been a total inspiration throughout the
project. Friends and colleagues have been constant encouragement, this especially
applies to those assistant principal colleagues I have had the privilege to work with.
This research has depended on colleagues being willing to give up their time and share
their insights as participants. So many people have given me their time, so generously. I
am so grateful for their trust and wisdom. I wish I could acknowledge the participants
by name, but the need for confidentiality prevents this.
Over my career as an education practitioner and my parallel development as
educationalist and academic there are those who have offered me both profound
knowledge and also encouragement at just the right time to keep me going. My science
teacher in year 9 at the Warrnambool North Technical School, Cyril Hayward is always
remembered as is the PE teacher Joe Matek. At Warrnambool Institute of Advanced
Education their academics such as where people like Tony Baker, Tony Loquet, Bruce
Morris, Bruce McKenzie, Frank Bosch, Pat Varley, Ron Howland, David Mc Kay,
viii
Doug Stewart, Santo Sarantakos. At Caulfield Institute of Technology there was Colin
Cameron, the first to suggest I could do postgraduate work, Arthur Crook and Russell
Langley. At the University of Melbourne Emeritus Professor Brian Caldwell, Emeritus
Professor Hedley Beare, Dr. Lawrie Drysdale, Dr. Rod Fawns, Associate Professor
Erica Frydenberg. International mentors and colleagues Professor Brent Davies,
Professor John West-Burnham, Professor David Marsh, Professor Gib Henschke, Mr.
Barry Niedergang, David Triggs, Colin Kay, Dr John Versey and Dr Eric Tope.
I wish to acknowledge all those researchers and others whom I have read and listened to
in the course of the research. I admire their work and contribution to knowledge in this
important field.
I wish to acknowledge the Victorian Department of Education and Early Childhood
Development (DEECD) which supported me in undertaking this research and also
opening the DEECD up to scrutiny. I also appreciate the support of the Dean of the
Melbourne Graduate School of Education, Professor Field Rickard who took me on
with this research.
To all the librarians at the University of Melbourne and all the BONUS libraries, thank
you so much for your support.
To my doctoral student colleagues, a very big thanks you for your friendship, empathy
and encouragement.
Sincere appreciation for invaluable support to Minn Stewart for formatting the master
document and Karlien Kok for her work in editing, cross referencing tables, quotes and
adding to the Endnote bibliography to meet all requirements during and especially late
in the drafting process.

ix
Preface
Sections of this thesis have appeared in abridged form in published as follows:
Thompson, Ken (2010) “How strategic is the school-based planning for leadership
succession? International Studies in Educational Administration Vol.38, No. 1, pp 98-
113.
x
TableofContents
Abstract .................................................................................................................... III
Dedication ................................................................................................................. V Declaration ............................................................................................................... VI
Acknowledgements ............................................................................................... VII Preface ..................................................................................................................... IX
Table of Contents ...................................................................................................... X List of Tables ......................................................................................................... XV List of Figures ....................................................................................................... XIX
List of third party copyright material .................................................................... XX
Chapter One ........................................................................................... 1
Introduction .............................................................................................................. 1
Background to the study ....................................................................................... 1
The candidate ........................................................................................................... 2
Statement of the problem ......................................................................................... 2
Purpose of the Study ................................................................................................ 3
Significance of the study .......................................................................................... 3
Chapter Two Context of the Study ....................................................... 4
Introduction .............................................................................................................. 4
Australian education system .................................................................................... 4
Victorian Government/ State School / Public education System ............................. 5
Regions ................................................................................................................. 5
School Staffing Structures .................................................................................... 6
Location of this study ........................................................................................... 6
Relevant Conceptual Frameworks in the Victorian State Government School System ...................................................................................................... 7
Principles of Effective Professional Development ............................................. 13
Conclusion ............................................................................................................. 14
Chapter Three Literature Review ...................................................... 16
Introduction ............................................................................................................ 16
Shortage of suitable candidates for the principalship? ....................................... 16
xi
The assistant principal role ................................................................................. 18
The assistant principal role and the career of an individual ............................... 19
Professional Development of APs ......................................................................... 21
International overview ........................................................................................ 21
Quality PD .......................................................................................................... 22
Preparation for principalship: Some major international studies ....................... 28
Australia ............................................................................................................. 34
Victoria ............................................................................................................... 35
Development of Assistant principals ..................................................................... 37
Grow your own ................................................................................................... 40
Job satisfaction ....................................................................................................... 44
Measurement of job satisfaction in education .................................................... 49
Succession planning ............................................................................................... 53
The need for succession planning ...................................................................... 53
What is succession planning? ............................................................................. 55
Conclusion ............................................................................................................. 58
Chapter Four Methodology ................................................................. 60
Introduction ............................................................................................................ 60
Definition of mixed methods research ................................................................... 60
Why choose a mixed methods design? .................................................................. 60
Research Strategies ................................................................................................ 64
Challenges in using this design and how they were addressed .............................. 68
Design of the mixed methods Study ...................................................................... 69
Limitations of the Study ......................................................................................... 69
Delimits of the study .............................................................................................. 70
Assumptions ........................................................................................................... 71
The Questionnaire .................................................................................................. 71
Purpose of the questionnaire .............................................................................. 71
Reasons for choosing a questionnaire ................................................................ 72
Instruments Used ................................................................................................ 72
The Combined Instrument Questionnaire. ............................................................. 80
Trialling of the questionnaire ............................................................................. 80
Interviews ............................................................................................................... 81
Transcriptions ..................................................................................................... 81
xii
Choosing CAQDAS and NVIVO ...................................................................... 82
Mixed methods data analysis procedures .............................................................. 83
Quantitative Analysis ......................................................................................... 83
Specific data analysis. ........................................................................................ 84
Qualitative Data Analysis ................................................................................... 84
Validity approaches in both quantitative and qualitative research. ....................... 86
Reliability and Validity ...................................................................................... 86
Project Approvals ................................................................................................... 89
University Ethics approval ................................................................................. 89
Department of Education and Early Childhood Development Approval .......... 90
Study Population .................................................................................................... 90
The timeline for administering the survey ............................................................. 92
Process for maximizing response. .......................................................................... 92
Response rate formula ........................................................................................ 92
Advantages of self-administered questionnaire ................................................. 94
Response rates achieved to participation in the study ........................................ 95
Summary ................................................................................................................ 95
Chapter Five Results ............................................................................ 97
Introduction ............................................................................................................ 97
The Population Frame and the Participants. .......................................................... 97
Participants and Non-Participants .......................................................................... 98
Gender .............................................................................................................. 101
Age * Gender ................................................................................................... 103
Years to retirement ........................................................................................... 103
Years as an Assistant Principal ........................................................................ 103
Country of birth of self, mother and father ...................................................... 105
Assistant Principal Portfolio Responsibilities .................................................. 105
Their Schools .................................................................................................... 107
Enrolments at participants’ schools .................................................................. 107
Enrolment Trends in participants’ schools ....................................................... 109
Equity, advantage/ disadvantage. The Student Family Occupation Index (SFO) ................................................................................................................ 109
Staffing in the school of participants ................................................................ 110
Number of assistant principals in participants’ schools ................................... 110
xiii
Number of teachers in participants’ schools .................................................... 111
Support and Other staff in participants’ schools .............................................. 112
Research question one: “What are the leadership aspirations and career intentions of assistant principals in Government Secondary Schools?” ................................... 112
General Comments about the Principalship (Qualitative) ................................ 113
Career aspirations / intentions in relation to the principalship survey results (quantitative) ......................................................................................... 115
Reasons for applying for the position .............................................................. 118
Reasons for not wanting to become a principal ............................................... 127
What type of schools are you willing to lead? ................................................. 137
Research question two: Participating in Professional Development: What development opportunities do they engage in? How effective are they and what impact do they have? ........................................................................................... 150
Central Programs .............................................................................................. 150
Regional Programs ........................................................................................... 155
Other Programs ................................................................................................ 158
Effectiveness of Professional Development Programs .................................... 164
Central Programs .............................................................................................. 165
Regionally provided programs ......................................................................... 170
Within School Programs .................................................................................. 172
Summary of observations about the type of professional development undertaken and the usefulness of that professional development. ................... 175
Research question three: Job Satisfaction: What is their own satisfaction and how do they perceive the satisfaction of principals in general? ....................................... 176
Minnesota Satisfaction Questionnaire (MSQ) ................................................. 176
Reliability in this study of the MSQ and MSQ (modified) .............................. 177
Job Satisfaction of Assistant Principals ........................................................... 178
Assistant Principals Perception of Principals Job Satisfaction as measured by the MSQ (Short form) (modified) ............................................... 184
Assistant Principal Perceptions of Principal Job Satisfaction General ............ 186
Participants’ self rating of their own job satisfaction compared with their perception of principals’ job satisfaction. ........................................................ 188
Compare Assistant Principal Job Satisfaction with their perceptions of principal job satisfaction. ................................................................................. 191
Assistant Principals career aspirations and their perception of principals’ job satisfaction. ................................................................................................. 193
Research question four: Preparedness for the principalship: How do they rate their own preparedness for the principalship? .............................................................. 196
xiv
How well prepared (quantitative data) ............................................................. 196
Preparedness (Qualitative) ............................................................................... 199
Triangulation .................................................................................................... 202
What has helped preparedness for the principalship? ...................................... 203
What hindered preparation for principalship? .................................................. 207
Preparedness * Career Intention ....................................................................... 211
Sources of Inspiration ....................................................................................... 213
Professional Development Plan Priorities (Sergiovanni Domains) ................. 216
Research question five: Succession Planning: How strategic is the school-based planning for leadership succession? ..................................................................... 218
In school development program ....................................................................... 218
Employee Development Program (Rothwell) individual scores ...................... 221
Programs Offered ............................................................................................. 223
Succession planning in the school .................................................................... 229
Professional Development Planning and Career Planning ............................... 230
Link Between Professional Development Plan and the School Strategic Plan. .................................................................................................................. 231
Research question six: What would need to change to increase interest in the principalship? (Qualitative) ................................................................................. 232
Conclusion ........................................................................................................... 236
Chapter Six Summary, Discussion and Conclusions ...................... 239
Introduction .......................................................................................................... 239
Chapter 6 Discussion .......................................................................... 239
Introduction .......................................................................................................... 239
Research question 1: What are the leadership aspirations and career intentions of Assistant Principals in Government Secondary Schools? ........... 240
Research question 2: What development opportunities do they engage in? How effective are they and what impact do they have? ............................. 242
Research question 3: What is their own job satisfaction and how do they rate the job satisfaction of principals in general? ............................................. 245
Research question 4: How do they rate their own preparedness for the principalship? ................................................................................................... 246
Research question 5: How strategic is the school-based planning for leadership succession? ...................................................................................... 248
Research question 6: What would need to change to increase their interest in the principalship? ............................................................................ 250
xv
Conclusion and Recommendations for further research and practice .............. 254
Recommendations for future research .............................................................. 255
Recommendations for future practice .............................................................. 256
References ........................................................................................... 258
Thesis Attachments ............................................................................ 273
ListofTables
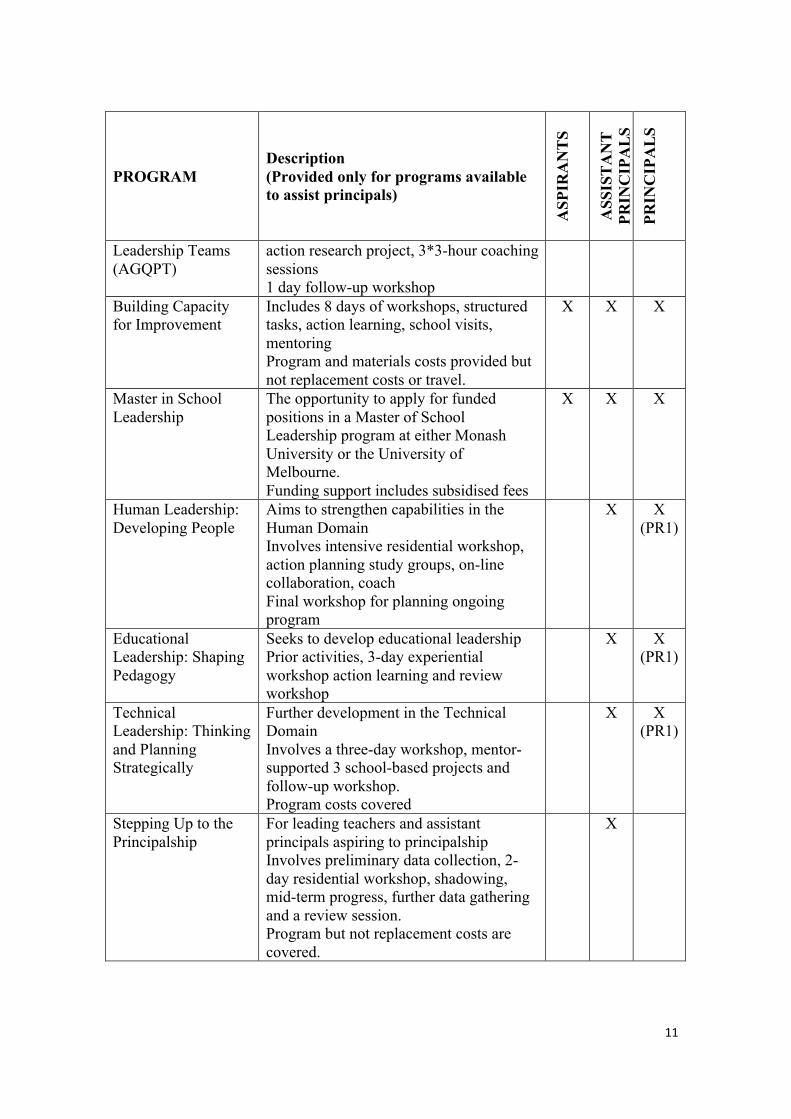
Table 1 List of Leadership Programs from the state office for government school aspirants and leaders, indicating who is eligible to apply. .......... 10
Table 2 State-wide regionally run programs available to assistant principals .......... 12
Table 3 Joyce and Showers Level of Impact ....................................................... 25
Table 4 Joyce and Showers Components of Training ......................................... 25
Table 5 Training components, their combinations and impact on job performance based on Joyce and Showers (1988) .................................. 28
Table 6 Key ideas in succession planning and management ............................... 57
Table 7 Mixed Methods design as related to the Research Questions of the study ........................................................................................................ 65
Table 8 Minnesota Satisfaction Questionnaire (short form) items indicating which items comprise the scales ............................................................. 77
Table 9 Comparison on Like School Group (LSG) of; schools in the populations frame, schools where principal agreed to participation, schools where assistant principals agree, and schools not in the study. ..................................................................................................... 100
Table 10 Participants’ ages in categories ............................................................. 102
Table 11 Categories of assistant principal portfolios sorted in order of frequency .............................................................................................. 107
Table 12 Participants’ school enrolment in bands of 500 .................................... 108
Table 13 Participants’ school enrolment in bands of 250 .................................... 108
Table 14 Frequency of the Student Family Occupation Index of participants’ schools. ................................................................................................. 110
Table 15 Frequencies of number of assistant principals in participants’ schools. ................................................................................................. 110
xvi
Table 16 Descriptive statistics of number of assistant principals in participants’ schools ............................................................................. 111
Table 17 Descriptive statistics of number of teachers, support staff and ‘other’ staff in participants’ schools ..................................................... 112
Table 18 Coded nodes of responses to the interview question “Are there any comments you wish to make seeking the principalship?” showing valence and weightings*number of sources. ........................................ 114
Table 19 Career intentions of participating assistant principals .......................... 116
Table 20 Career intentions of the participants in relation to their willingness to apply for a principal position ............................................................ 117
Table 21 Frequency of responses to the questionnaire regarding reasons for wanting to be a principal (in order of frequency of endorsement, highest to lowest, not in original order presented to participants). N=29 (27 participants who were unsure or willing, plus 2 who gave no indication) ........................................................................................ 119
Table 22 Frequencies of coded nodes in response to interview question regarding reasons why participants might want to become a principal. ............................................................................................... 122
Table 23 Ranking of quantitative ranking of categories compared with the qualitative categories and their rankings (for quantitative n =29) ........ 126
Table 24 Frequencies of reasons participants do not want to become principals sorted from highest endorsement to lowest (n = 22 valid responses) ............................................................................................. 128
Table 25 "Other" reasons given for not wanting to be a principal ....................... 130
Table 26 Summary coded nodes from interview giving participants’ reasons given for not seeking the principalship. ................................................ 131
Table 27 Summary of coded nodes from interview giving reasons given for not seeking the principalship, sorted by themes. .................................. 133
Table 28 Tallies of responses to “What type of schools are you willing to lead?” .................................................................................................... 138
Table 29 Summary of responses to interview question “Are there any comments you would like to make about the types of schools you would be willing to lead?” showing codes, number of sources, percentages of codes and themes. ......................................................... 140
Table 30 Summary of responses to the question “What else do you wish to do if you are not seeking a principalship?” .......................................... 145
Table 31 Summary of responses to the interview question “Are there any comments you wish to make about other career options you are considering?” ........................................................................................ 147
Table 32 Comparison of career intentions obtained by questionnaire and interview. Also includes data from MORI survey ................................ 149
xvii
Table 33 Summary of responses to the question “Which of the following centrally organised professional development programs have you participated in, in your role as assistant principal during the past 3 years? .................................................................................................... 152
Table 34 “Other” centrally organised activities reported by participants that they have participated in. ...................................................................... 153
Table 35 Participation in and usefulness of centrally organised programs, and for each one participated in, how useful they were. ...................... 154
Table 36 Summary of responses to the question “Which of the following regionally organised professional development programs have you participated in, in your role as assistant principal during the past 3 years? For each one you have participated in, how useful were they to you as a school leader?” (n = 48) ..................................................... 156
Table 37 Participation in and usefulness of “other” regionally organised programs ............................................................................................... 157
Table 38 Participation in and usefulness of “other” professional development programs ............................................................................................... 159
Table 39 Summary of providers of 'other' professional development program undertaken by participants .................................................................... 164
Table 40 Centrally provided programs showing mentoring/coaching/shadowing support as per program descriptions compared with participant reports .................................... 167
Table 41 Professional Learning Programs: Participants’ perceptions of dimensions of leadership covered, methods of learning used and impact of the program. .......................................................................... 168
Table 42 Regional programs: Participants’ perceptions of dimensions of leadership covered, methods of learning used and impact of the program. ................................................................................................ 170
Table 43 Summary of Suggestions of in-school experiences that are likely to prepare an Assistant Principal for the principalship. ............................ 174
Table 44 Cronbach's Alpha coefficient of reliability calculated for general, intrinsic and extrinsic satisfaction in this study for both the MSQ (short form) and MSQ (short form modified) ....................................... 178
Table 45 Summary of responses of participants to the MSQ (Short form) (n=48 except for item 17 where the n=47 ............................................. 179
Table 46 Descriptive data on MSQ (Short Form) by participants. ...................... 181
Table 47 Summary of MSQ (Short Form), items ranked by average score, sorted by lowest to highest. .................................................................. 183
Table 48 Summary of responses of participants to the MSQ (Short form) modified version aimed to measure the perception assistant principals have of the job satisfaction of principals. (n=47, 1 missing) ................................................................................................. 184
xviii
Table 49 Summary statistics of the responses of participants to the MSQ (Short form) modified version aimed to measure the perception assistant principals have of the job satisfaction of principals. (n = 47) ......................................................................................................... 186
Table 50 Summary of MSQ (Short Form) modified version aimed to measure the perceptions assistant principals have of principals’ job satisfaction, items ranked by average score, sorted by lowest to highest. .................................................................................................. 188
Table 51 Summary of comparison of ranking of each item of the MSQ (Short form) and the MSQ (Short form) modified showing the difference between rankings. ................................................................ 190
Table 52 Comparison of assistant principal self rating on MSQ and their perception of principal satisfaction on the MSQ. Items in order from lowest (least satisfaction) to highest (most satisfied) .................. 191
Table 53 Correlation between assistant principal career aspirations and their perceptions of principal job satisfaction ............................................... 195
Table 54 Summary of responses to interview question “In general terms, how well prepared do you feel you are to take up a principalship?” Includes responses from MORI study for comparison ......................... 197
Table 55 Participants views of how well they were prepared for their existing position and the principalship. .............................................................. 198
Table 56 Summary of qualitative responses to preparedness for the principalship ......................................................................................... 199
Table 57 Triangulation of questionnaire data and interview data with respect to preparedness for the principalship .................................................... 203
Table 58 What has helped preparedness for the principalship: summary of interview responses? ............................................................................. 204
Table 59 What has helped prepare for the principalship? Themes from qualitative data ...................................................................................... 206
Table 60 What has hindered preparedness for the principalship: summary of interview responses? ............................................................................. 208
Table 61 What has hindered preparation for the principalship? Themes ............ 210
Table 62 Career aspiration / intentions by feeling of preparedness ..................... 212
Table 63 Career intentions (three category model) by preparedness ................... 213
Table 64 The main sources to which participant assistant principals look for inspiration and ideas about their work and practice as a school leader sorted in order of “Valid % Yes”, n = 48 for this study. ............ 216
Table 65 The performance priorities of participating assistant principals, in order of frequency, categorised using the Sergiovanni Domains ......... 217
Table 66 Summary of responses to (Rothwell 2005 p 5-6) “Self-Assessment Questionnaire About Your Organisation’s Employee Development
xix
Program”. Showing valid responses; ‘no’, ‘sometimes’, ‘yes’ and associated percentage responses. Sorted in order from most to least endorsements. ....................................................................................... 220
Table 67 Rothwell et al (Rothwell et al., 2005) “Self-Assessment Questionnaire About Your Organisation’s Employee Development Program” individual participant’s total scores. .................................... 222
Table 68 Rothwell (Rothwell et al., 2005, pp. 5-6) “Self-Assessment Questionnaire About Your Organisation’s Employee Development Program” individual participants total score categorised as recommended by Rothwell ................................................................... 223
Table 69 Summary participants’ responses to the “Methods of Grooming Individuals for Advancement” (Rothwell, 2001) Items sorted by frequency of ‘yes’ responses. ............................................................... 224
Table 70 Responses to the question how effective each approach has been. Note that only those who indicated a particular method was practiced at their school were asked to rate the methods effectiveness. ........................................................................................ 226
Table 71 Responses to the question how effective each approach has been. Note that only those who indicated a particular method was practiced at their school were asked to rate the methods effectiveness. Approaches have been ordered by mean score, highest to low ........................................................................................ 228
Table 72 Summary of participant’s rating of their school’s approach to succession planning (n=45) .................................................................. 229
Table 73 Summary of coded responses to the interview question “How closely is your professional development plan related to your career plan?” n = 46 ......................................................................................... 231
Table 74 Summary of coded responses to the interview question “How closely is your professional development plan related to the School Strategic Plan?” .................................................................................... 231
Table 75 Summary of responses to the question “What things that would need to change to increase interest your interest in the principalship?” ...................................................................................... 234
Table 76 Themes arising from responses to the question “What things that would need to change to increase interest your interest in the principalship?” ...................................................................................... 235
xx
ListofFigures
Figure 1 Sammons, et al. 1995 model of Effective Schools as adopted by the DEECD Blueprint (Source: Department of Education and Early Childhood Development, 2008a) .............................................................. 7
Figure 2 Years as an assistant principal in current school ....................................... 104
Figure 3 Comparing summary of suggested actions to reduce shortage of aspirants from the Australian literature, compared with the actions suggested by participants in this study to increase their interest in the principalship. ................................................................................... 254
Listofthirdpartycopyrightmaterial
Permission has been granted by the Minnesota Satisfaction Questionnaire (MSQ)
publishers to use both the published MSQ and modified MSQ with the addition of the
following phrase letter “Copyright 1977, Vocational Psychology Research, University
of Minnesota, Reproduced by permission”.
1
ChapterOne
Introduction
Backgroundtothestudy
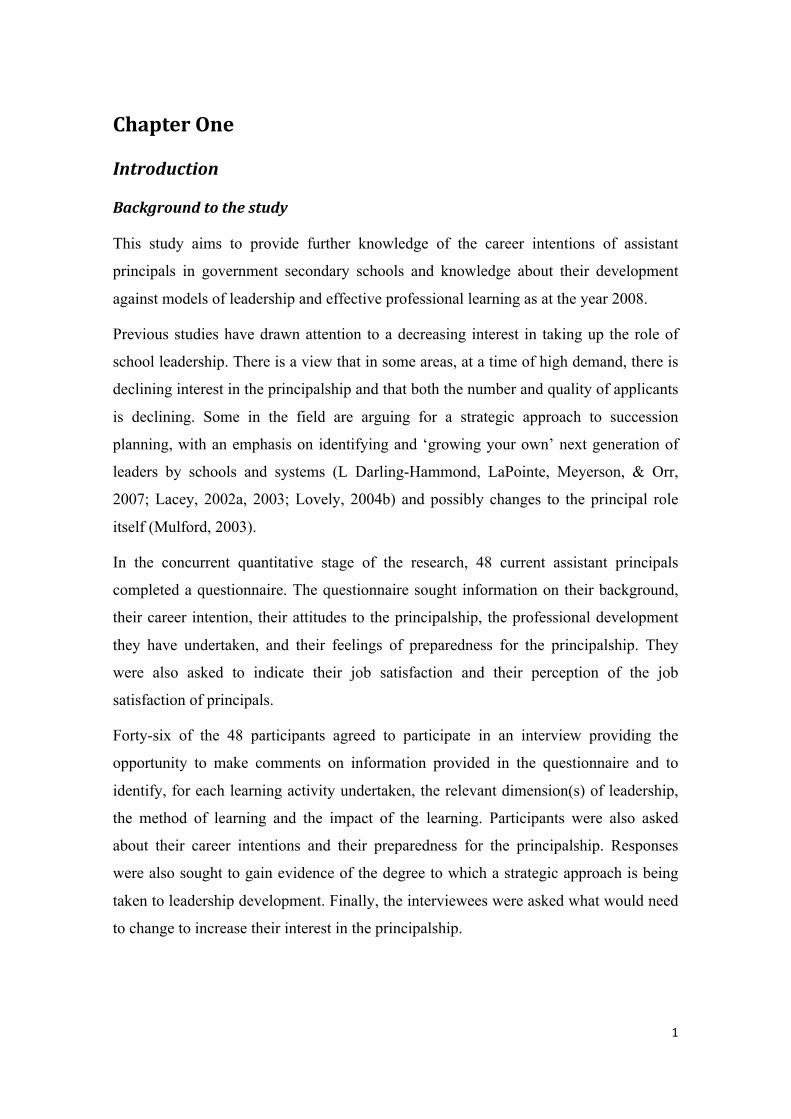
This study aims to provide further knowledge of the career intentions of assistant
principals in government secondary schools and knowledge about their development
against models of leadership and effective professional learning as at the year 2008.
Previous studies have drawn attention to a decreasing interest in taking up the role of
school leadership. There is a view that in some areas, at a time of high demand, there is
declining interest in the principalship and that both the number and quality of applicants
is declining. Some in the field are arguing for a strategic approach to succession
planning, with an emphasis on identifying and ‘growing your own’ next generation of
leaders by schools and systems (L Darling-Hammond, LaPointe, Meyerson, & Orr,
2007; Lacey, 2002a, 2003; Lovely, 2004b) and possibly changes to the principal role
itself (Mulford, 2003).
In the concurrent quantitative stage of the research, 48 current assistant principals
completed a questionnaire. The questionnaire sought information on their background,
their career intention, their attitudes to the principalship, the professional development
they have undertaken, and their feelings of preparedness for the principalship. They
were also asked to indicate their job satisfaction and their perception of the job
satisfaction of principals.
Forty-six of the 48 participants agreed to participate in an interview providing the
opportunity to make comments on information provided in the questionnaire and to
identify, for each learning activity undertaken, the relevant dimension(s) of leadership,
the method of learning and the impact of the learning. Participants were also asked
about their career intentions and their preparedness for the principalship. Responses
were also sought to gain evidence of the degree to which a strategic approach is being
taken to leadership development. Finally, the interviewees were asked what would need
to change to increase their interest in the principalship.
2
It is hoped that the project, in response to priorities raised in the research literature, will
provide new knowledge upon which to base improved development for progression to
the principalship, at least in the geographic location at which the study was undertaken.
Thecandidate
The researcher has a long working life in education (over 40 years), spending some
eight years as a secondary humanities teacher, a year in central policy development, and
several years in regional consultancy and then more than 14 years in the principalship of
two large urban secondary schools in challenging circumstances and a pathways school
for secondary-age Indigenous students. The researcher’s time as a principal was marked
by innovation, strong school international and local community links, and a research-
oriented approach. In addition the researcher has been the founding chairman of the
Hume City Council Global Learning Village Committee, internationally acknowledged
for its innovative approaches to social inclusion through learning.
The conduct of this research was interrupted by the diagnosis of a serious medical
condition. Surgical treatments resulted in a physical disability. The condition was
managed over a period of years, including major surgeries, invasive therapy, and long
rehabilitation amid the continuing escalation of the condition over time. These
circumstances explain the gap in time between the original literature review and data
gathering in the year 2008, and the submission of the thesis in 2018, a year of
significant continuing treatment. The literature and context section of the thesis are as at
2008, but are updated in the discussion chapter.
Statementoftheproblem
There is a view that, at a time of elevated demand for school leaders, there has been a
reduction in the number of suitable candidates applying for principal positions, leaving
positions unfilled or inadequately filled. There is a view that insufficient assistant
principals wish to become principals. Some research indicates that this problem is not in
all constituencies (For example Howson, 1998, 2007, 2008; Roza, Celio, Harvey, &
Wishon, 2003). There are calls for each constituency to examine its own circumstances
and consciously ‘grow their own’ leaders (For example Lovely, 2004b).
3
PurposeoftheStudy
The research questions for this investigation are:
• What are the leadership aspirations and career intentions of assistant
principals in government secondary schools?
• What development opportunities do they engage in? How effective are they
and what impact do they have?
• What is their own job satisfaction and how do they rate the job satisfaction of
principals in general?
• How do they rate their own preparedness for the principalship?
• How strategic is the school-based planning for leadership succession?
• What would need to change to increase their interest in the principalship?
Significanceofthestudy
This project aims to provide new knowledge and advice about the effective succession
of assistant principals to the principalship and recommend approaches to the effective
development of the leadership potential of assistant principals. The development of
leaders in secondary schools, especially those in challenging circumstances, is vital. The
role of assistant principal is a significant one in its own right, and also as a potential
pathway to the principalship. This research will contribute new knowledge in the area of
assistant principal development. It will provide new insights about leadership
development, particularly at the school level. It may also give impetus for reform of the
leadership of schools towards models that are more attractive to people who aspire to
school leadership.
4
ChapterTwoContextoftheStudy
Introduction
This chapter aims to provide the reader with a very brief and focused description of the
context of this study, as at year 2008 when the study was conducted. It first briefly gives
an idea of the size of Australian school system, and the state of Victoria within that. It
briefly describes the structure of schooling in the state of Victoria, with an emphasis on
the government school system. The regional context and the geographical location of
this study are briefly explained along with the notion of socioeconomic disadvantage.
The key policy settings and conceptual frameworks relating to school improvement and
leadership development in the state / public school system of Victoria as at 2008 are
outlined. Programs for leadership development in place at the time of the study,
especially those for assistant principals are explained. Some outcomes of an OECD
examination of leadership development in the Victorian government sector are reported.
Australianeducationsystem
Australia is a federation of six states (Western Australia, South Australia, Queensland,
New South Wales, Tasmania, Victoria) and two territories (Australian Capital Territory,
Northern Territory). While the national commonwealth government provides some
funds for education, it is the states that carry the key responsibilities for running public
(state/government) school systems. This study is located in Victoria.
In Australia there are broadly three categories of schools; government schools,
independent schools and catholic schools. Government schools are totally funded by
government, except for some small ultimately voluntary contributions schools seek
from parents. Independent schools are supported with funding from the state and federal
government, but rely heavily on compulsory fees from parents. Catholic schools also
receive government funding and charge fees to parents.
The government systems across Australia are quite different in many ways, and
although all systems have been through restructuring over a period of time (e.g.
Harman, Beare, & Berkeley, 1991, p. 29), Victoria is a relatively highly devolved
5
system where significant responsibilities are handled at the school level (Caldwell &
Hayward, 1998; OECD, 2006).
VictorianGovernment/StateSchool/PubliceducationSystem
Most schools in the state government school system can be classified as primary schools
(grade preparatory to 6), special schools (catering for those young people with
disabilities not integrated into regular schools) and secondary schools (years 7 to 12).
However, there are a number of schools that cater for all school-age groups (grade
preparatory to 12), preparatory to years 8 or 9, a few that enrol students in years 7
through 10, and a small number that cater for only years 11 and 12. Most schools are
coeducational, although some secondary schools are single sex schools. There are also
schools that provide for special populations, such as a distance education facility for
itinerant students and those who live in isolated locations, English language facilities for
new arrivals to the country, specialist centres for young people experiencing difficulties
at school and a growing number of specialist curriculum schools in learning areas such
as science, sport and music. There are two select entry schools that have students from
years 9 to 12 only.
As reported in February 2009, regarding school data from 2008, the state of Victoria
had 2282 schools, including 1608 primary schools, 215 primary/secondary schools, 358
secondary schools, 97 special schools and 4 language schools. The largest number of
schools is in the public/government sector with 1574, with 486 in the Catholic sector
and 222 in the Independent sector. There were 223,423 secondary students in the public
school system and 250 government secondary schools. In the public sector there were
1201 primary schools, 53 primary-secondary schools, 253 secondary schools, 76 special
schools and 4 language schools (Australian Bureau of Statistics, 2009).
Regions
As at 2008, Public schools in Victoria were located in nine geographic regions (which
have since been restructured to four regions), three regions in the metropolitan capital
city Melbourne and five regions in rural areas. Communities and their schools located
within regions vary in nature on characteristics such as socioeconomic background and
6
rurality. Educational outcomes vary from region to region, but also within regions. The
number of government schools in each government region as at 2008 varied from 130 to
250 (Department of Education and Early Childhood Development, 2009g, p. 9) In the
geographic region in which this study took place, in the public schools sector in 2008,
there were 143 primary schools, 7 primary-secondary schools, 37 secondary schools, 11
special schools and 1 specialist language school (Department of Education and Early
Childhood Development, 2009h).
SchoolStaffingStructures
The structure and staffing of schools is decided (within very broad state-wide
guidelines, school budgets and industrial agreements), at the school level through a
consultative management process, enabling schools to develop a staffing profile to meet
their particular needs and priorities. This local decision-making includes the number,
classification and duties of Assistant Principals. Some schools can and do decide to
have no assistant principals, and others have several. Generally speaking, however, the
number of assistant principals in a school is usually related to the size of the school.
Budgets are driven substantially by student numbers, the socioeconomic family
background of the students, the location of the school, specific needs of the students
(e.g. disabled students) and funding related to specific government initiatives.
Locationofthisstudy
This study focuses on assistant principals in public/state/government secondary schools
in one defined geographical administrative region. This area is generally considered to
be serving a disadvantaged community, although there is a pocket of schools in the
highest socioeconomic category. In Victorian schools, disadvantage is based on the
occupational categories of the parents of students in the schools. The level of
disadvantage is computed as an index score, which acts as a weighting factor in a range
of budget input items (see Chapter 4 Methodology for more details of the Student
Family Occupation Index (SFO)).
7
RelevantConceptualFrameworksintheVictorianStateGovernmentSchool
System
Blueprint for government schools
In 2003, then Minister for Education in the state of Victoria, Lynne Kosky, after a broad
consultation process, launched the Blueprint for Government Schools (Kosky, 2003).
This document outlined a plan for the development of the state government schools.
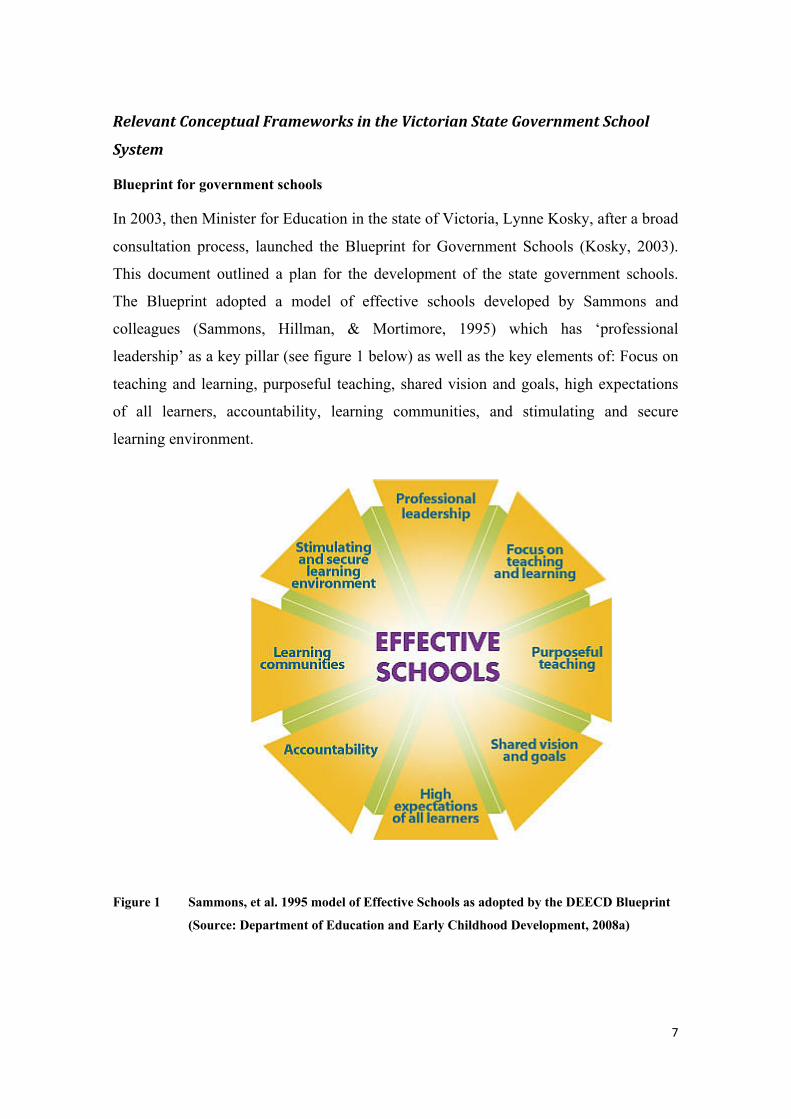
The Blueprint adopted a model of effective schools developed by Sammons and
colleagues (Sammons, Hillman, & Mortimore, 1995) which has ‘professional
leadership’ as a key pillar (see figure 1 below) as well as the key elements of: Focus on
teaching and learning, purposeful teaching, shared vision and goals, high expectations
of all learners, accountability, learning communities, and stimulating and secure
learning environment.
Figure 1 Sammons, et al. 1995 model of Effective Schools as adopted by the DEECD Blueprint
(Source: Department of Education and Early Childhood Development, 2008a)
8
A departmental support document “Professional Learning in Effective Schools: The
Seven Principles of Highly Effective Professional Learning” (Department of Education
& Training, 2005), citing the work of Sergiovanni (1984), Elmore (2000) and Stoll
(2004) gives insight into this school system’s view of leadership when it is written “An
extensive research base supports the view that leadership is the most important element
of an effective school.” (p. 7). This document puts the view that,
“Effective leaders articulate the types of improvement required to achieve
agreed goals… engage their staff in professional discourse… have an
explicit vision of effective teaching and learning… create organisational
conditions that are conducive for teachers to continually improve their
teaching practice… provide professional learning opportunities for teachers
to develop… continuously evaluate the impact of professional learning on
the basis of the effect it has on student achievement” (p. 7).
The document goes on to put the view that leadership needs to be displayed by all staff
(p. 8).
The state department of education approach to leadership development is based on the
early work of Sergiovanni (Beatty & Gurr, 2009; Dodds, 2007; P. Matthews, Moorman,
& Nusche, 2007a; Sergiovanni, 1984) and his five leadership forces of technical,
human, educational, symbolic, and cultural (Sergiovanni, 1984, 2006). These forces are
further developed by the department in its “Developmental Learning Framework for
School Leaders” (Department of Education Victoria, 2007) upon which the
development of school leaders has been based. The framework is structured around
Sergiovanni’s ‘domains’ of leadership, namely Technical, Human, Cultural,
Educational and Symbolic (p. 4). The framework is intended to guide the development
of leaders and enables individuals “…to set directions for their professional learning
over the long term that are appropriate to their individual development and career
stages.” (p. 3). These domains are further developed with three capabilities associated
with each and proficiency levels articulated (p. 4 ff). This framework is consistently
used across leadership development (p. 12) and selection (p. 16) with individual
leader’s performance and development plans being structured consistent with the
9
framework, and candidates applications for principal class (principal and assistant
principal positions) being structured using the framework (p. 11). This all appears
consistent with the Sergiovanni domains of leadership (Sergiovanni, 1984) except
perhaps for the inclusion of strategic leadership by department within the Technical
Domain as one of the capabilities (p. 5) (Beatty, 2008).
Opportunities provided within the Framework (Programs)
The Leadership Framework has also been used to develop a suite of professional
learning programs for aspiring leaders and those who already hold leadership positions
(Department of Education and Early Childhood Development, 2007). There were 21
main programs for 2008. The programs were developed for school staff members at
various stages of their leadership careers, including those who have been teaching for
five years or more and have leadership aspirations, heads of small schools, assistant
principals, and new and experienced principals.
The programs employ a variety of learning contexts, including: course work, university
places, research opportunities, short courses, collegiate networks, mentoring and being
mentored, work shadowing, online collaboration, use of assessment tools and associated
feedback, action research and learning, and teamwork.
By program title, they appear to be designed to cover some of the key domains of the
Sergiovanni model, namely Technical Leadership, Educational Leadership and Human
Leadership.
Funding for the programs comes predominantly from the department, however some
funding comes from the Commonwealth Government and schools often are required to
cover some or all staff replacement costs and travel costs for participants from their
schools. There is a range of programs offered to different categories of aspirants
(Department of Education and Early Childhood Development, 2009c; Department of
Education Victoria, 2007). The programs available to aspirants, assistant principals and
principals, at state-wide level are listed in table 1.

10
Table 1 List of Leadership Programs from the state office for government school aspirants
and leaders, indicating who is eligible to apply.
PROGRAM Description (Provided only for programs available to assist principals)
ASP
IRA
NT
S
ASS
IST
AN
T
PRIN
CIP
AL
S PR
INC
IPA
LS
Preparing for Leadership
X
Leading for Student Learning (AGQTP)
X
Leadership in Effective Schools
Focus on strategic thinking and change theory Briefing with principal, preliminary assessment activities, four days of workshops, coaching around school-based project, email contact with coach. Program costs covered
X X
Leading Professional Learning
A short course in “Leading Professional Learning” Includes elements of reading, data gathering, planning for particip ant’s schools, peer learning groups with a mentor, and access to a website to share ideas. Program costs covered, including 2 replacement days
X X
Scholarships for Postgraduate Study
Available to support postgraduate (not PHD) course fees Funded in high priority areas
X X
Eleanor Davis School Leadership Program
Mentoring program. Open to female teachers and assistant principals Involves preparatory reading and assessment activities, seminars and induction, eight days work shadowing, school-based project and implementation plan
X X
Leading across Effective Small Schools
2-day forum, action learning project, 2 follow-up forum days, website access and experienced mentor
X X X
Building the Capacity of School
As a member of a team 3 day residential workshop, school-based
X X X
11
PROGRAM Description (Provided only for programs available to assist principals)
ASP
IRA
NT
S
ASS
IST
AN
T
PRIN
CIP
AL
S PR
INC
IPA
LS
Leadership Teams (AGQPT)
action research project, 3*3-hour coaching sessions 1 day follow-up workshop
Building Capacity for Improvement
Includes 8 days of workshops, structured tasks, action learning, school visits, mentoring Program and materials costs provided but not replacement costs or travel.
X X X
Master in School Leadership
The opportunity to apply for funded positions in a Master of School Leadership program at either Monash University or the University of Melbourne. Funding support includes subsidised fees
X X X
Human Leadership: Developing People
Aims to strengthen capabilities in the Human Domain Involves intensive residential workshop, action planning study groups, on-line collaboration, coach Final workshop for planning ongoing program
X X (PR1)
Educational Leadership: Shaping Pedagogy
Seeks to develop educational leadership Prior activities, 3-day experiential workshop action learning and review workshop
X X (PR1)
Technical Leadership: Thinking and Planning Strategically
Further development in the Technical Domain Involves a three-day workshop, mentor-supported 3 school-based projects and follow-up workshop. Program costs covered
X X (PR1)
Stepping Up to the Principalship
For leading teachers and assistant principals aspiring to principalship Involves preliminary data collection, 2-day residential workshop, shadowing, mid-term progress, further data gathering and a review session. Program but not replacement costs are covered.
X

12
PROGRAM Description (Provided only for programs available to assist principals)
ASP
IRA
NT
S
ASS
IST
AN
T
PRIN
CIP
AL
S PR
INC
IPA
LS
Mentoring for First Time Principals
X
Coaching to Enhance the Capabilities of Experienced Principals
X
Building the capacity of Principals of Small Schools
X
Source: Summarised from DEECD Webpage
http://www.education.vic.gov.au/proflearning/schoolleadership/program/leadpl.htm
accessed 05/05/2007.
Note: Details provided only for programs for assistant principals
Regional Programs
There are also programs run through regional offices which are targeted at school
personnel including assistant principals. The “Dollars and Sense” program focuses on
the school level budgeting processes and “Bricks and Mortar” focuses on the facilities
management of a school. Both of these programs focus on the ‘Technical’ domain.
Table 2 State-wide regionally run programs available to assistant principals
REGIONAL PROGRAMS
Dollars and Sense: Financial management program
Bricks and Mortar: Facilities Management Program
Other programs (as at 2008)
A wide range of programs to support leadership development are available through a
range of national and state organisations, as well as private provider organisations. The
department outsources the running of at least some of these programs to other
13
organisations, both commercial and not-for-profit, such as the Teacher Learning
Network, which was associated with the Australian Education Union, and the
principals’ associations.
PrinciplesofEffectiveProfessionalDevelopment
Integrated into the performance and development arrangements for school staff is the
notion of effective professional learning where those principles are: “Focused on
student outcomes; Focussed on and embedded in practice; Informed by the best
available research on effective learning and teaching; Collaborative , Involving
reflection and feedback; Evidence based and data driven to guide improvement and to
measure impact; Ongoing, supported and fully integrated into the culture and operations
of the system –schools, networks, regions and the centre; An individual and collective
responsibility at all levels of the system.” Methods and ways of learning seen as highly
effective included in the model are listed as, “Collegiate Groups, Action Research
Project, School Improvement Strategies, Study Groups, Case Discussions; Critical
Friend; Mentoring; Coaching; Workshops/ Seminars; Accredited Courses; Structured
Professional Reading; Personal Professional Reading; School Visits; Peer observation.”
(adapted from Department of Education and Early Childhood Development, 2008b, p.
10)
While various forms of data are gathered in relation to the effectiveness of these state,
regional and other formal professional development programs, it is not usually readily
available. One exception to this is the program “Technical Leadership: Thinking and
Planning Strategically.” Run for the department by the Australian Council for
Educational Research on whose website is a summary evaluation report and some
comments from participants about the impact of the program on their leadership
aspirations (Australian Council for Educational Research, 2008a, 2008b). Data is not
available about the numbers of people who undertake these various programs except for
a department online brochure for the new Bastow Institute which claims that
(Department of Education and Early Childhood Development, 2009a) more than 7000
participants have participated in the suite of programs.
14
The OECD undertook a review of Victoria’s leadership development program (P.
Matthews et al., 2007a) as a case study forming part of a larger international study. The
report, notwithstanding its limited scope and depth (for example, a small panel visited
Victoria for only four days and met limited numbers of selected key figures in school
education) came to a conclusion that the “quality of the systemic approach to school
improvement in Victoria has been excellent since the Blueprint was published by the
Government in 2003.” (P. Matthews, Moorman, & Nusche, 2007b, p. 28). The report
commented on the cohesivness of the view of school leadership using the Sergiovanni
model and how this linked to the recruitment, training, development, and appraisal of
school leaders.
A second Blueprint was launched in 2008 by a new minister, Bronwyn Pike
(Department of Education and Early Childhood Development, 2008a; Pike, 2008) wich
maintain a priority of leadership and leadership development. Through the
establishment of institute for leadership development (p. 35) which is in the early stages
of development (www.education.vic.gov.au/proflearning/bastowinstitute/default.htm).
The leadership development approaches include: Principal performance and
development, principal selection, accelerated development program for high potential
leaders (including the Master in School Leadership program), mentoring for first time
principals, coaching to enhance the capabilities of experienced principals, a
development program for high performing principals and the establishment of local
administrative bureaus. (Department of Education and Early Childhood Development,
2009b). It also links with school development process, namely the school strategic
planning process which in turn is closely linked, through the Sergiovanni model, with
principal selection and application processes.
Conclusion
This chapter aimed at providing a context for the study by describing the system in
which this research was undertaken. The description is selective, limited to the aspects
thought most relevant to enhance the understanding of the study. After a brief national
overview, this chapter explained the structure of schooling in the state of Victoria,
especially the public education sector. Overarching approaches to school and leadership

15
development, as at 2008, in the public sector were described. The approaches to
leadership development were described, providing details of opportunities available to
assistant principals in particular. The conclusions of a brief OECD examination of the
Victorian state education approach to leadership development are reported.
16
ChapterThreeLiteratureReview
Introduction
This chapter reviews selected literature related to the career intentions and development
of assistant principals. The review covers the reported shortage of those aspiring to the
principalship across the world and also in Australia. Some responses and proposed
remedies to the shortage are also reported. The literature available on aspirations for
leadership, specifically relating to assistant principals is reviewed. This is followed by a
report of incentives and disincentives to progress to the principalship. Previously
reported research on the role of job satisfaction, including a discussion of how it may be
measured is outlined. The literature on succession planning and school-based
development of Assistant Principals is discussed, as well as professional learning for
those in this key role. A selected coverage of models of school leadership follows.
Literature is cited that will help locate this study. The chapter concludes with a
summary of the literature.
Shortageofsuitablecandidatesfortheprincipalship?
Since around the mid 1990s there has been growing concerns around the world about a
perceived decline in the number and perhaps even the quality of those willing to apply
for the principalship. Early reports (Howson, 1998) emerged from ground breaking
research in the UK that monitored the number of Headteacher positions that were re-
advertised. Around the same time similar concerns were emerging in the USA
(Anonymous, 1999; Barker, 1996; Forsyth et al., 1998; Hammond, Muffs, & Sciascia,
2001; Livingston, 1998; Malone & Caddell, 2000; McAdams, 1998; Yerkes &
Guaglianone, 1998). A search in the year 2000 by his author did not reveal any attention
to this matter in Australia. In 2003 a special issue of the Australian Journal of Education
focussed on the shortage of applicants (Gronn, 2003b). Countries revealing concerns
included Scotland (Draper & McMichael, 2003), Canada (Williams, 2003) USA
(Pounder, Galvin, & Shepherd, 2003) , New Zealand (Brooking, Collins, Court, &
O'Neill, 2003). Interestingly, both Singapore and Hong Kong (Walker, Stott, & Cheng,
17
2003) did not report shortages, for very different reasons; Hong Kong because of its
local arrangements and Singapore because of its highly centralised system.
The research indicates a range of possible reasons for the declining interest in the role
and even conflicting reports, which seem to be explained by the reported shortage
impacting in different locations in different ways. In Australia researchers have
identified a range of factors that might be at play at any one place at any one time. They
include; fewer applicants (Barty, Thomson, Blackmore, & Sachs, 2005; Canavan, 2001;
d'Arbon, 2006; Lacey & Gronn, 2004; Starr, 2007; Wubberling, 2008) , rejected
applicants , individual factors (Barty et al., 2005; Lacey, 2001), disengagement (Gronn
& Rawlings-Sanaei, 2003), the attractiveness of the aspirants current role (Cranston,
Tromans, & Reugebrink, 2004; Lacey, 2002a), perceptions of the principal role (Lacey
& Gronn, 2005; Starr, 2007) , the view that the principal role is too demanding
(Cranston et al., 2004; Lacey & Gronn, 2005; Starr, 2007; Thomson & Blackmore,
2004), the different career expectations of younger people (Lacey, 2002b; Lacey &
Gronn, 2004), perspective differences on the desirability of the role (Lacey, 2002a), the
male culture of the principalship (Lacey, 2002b; Neidhart & Carlin, 2003), impact of
the role on personal life (Cranston et al., 2004; d'Arbon, Duignan, & Duncan, 2002;
Gronn & Lacey, 2004a; Lacey, 2002a, 2002b; Lacey & Gronn, 2005; Neidhart &
Carlin, 2003; Starr, 2007), conditions of the job (Starr, 2007), accountability (Cranston
et al., 2004; d'Arbon et al., 2002; Neidhart & Carlin, 2003; Starr, 2007), the principal
role itself (Barty et al., 2005; Lacey & Gronn, 2005; Starr, 2007; Thomson &
Blackmore, 2004; Woolley, 1999), inadequate preparation (d'Arbon et al., 2002; Lacey,
2002b; Lacey & Gronn, 2004, 2005; Neidhart & Carlin, 2003; Starr, 2007), what would
be lost (d'Arbon et al., 2002; Lacey, 2002a; Lacey & Gronn, 2005; Neidhart & Carlin,
2003), happy in their current role (Cranston et al., 2004; Lacey & Gronn, 2005), issues
related to particular schools (Barty et al., 2005; Woolley, 1999), location of the school
(Barty et al., 2005; Lacey & Gronn, 2004, 2005), lack of career planning (Gronn &
Lacey, 2004b; Lacey & Gronn, 2005), lack of succession planning (Lacey, 2002b), lack
of confidence in the selection process (Barty et al., 2005; d'Arbon et al., 2002; Lacey,
2002b; Lacey & Gronn, 2004, 2005; Neidhart & Carlin, 2003; Starr, 2007).
18
Also from the Australian literature emerge suggestions to address the issue. They
include: systematic succession planning (d'Arbon, 2006; Lacey, 2001, 2002b, n.d.;
Woolley, 1999), encourage leadership aspirations (Lacey, 2002b), re-thinking the
principalship (d'Arbon et al., 2002; Lacey & Gronn, 2005; Starr, 2007), re-thinking
accountability (Starr, 2007), new models of shared leadership (d'Arbon et al., 2002;
Lacey, 2002a; Lacey & Gronn, 2005), better communicate aspects of the principal role
(d'Arbon et al., 2002; Starr, 2007), review of the selection process (d'Arbon et al., 2002;
Gronn & Lacey, 2004b; Lacey, 2002b; Lacey & Gronn, 2005), stronger focus on career
planning (Gronn & Lacey, 2004b; Lacey, 2002b), retention of existing leaders (Lacey,
2002b; Lacey & Gronn, 2005; K. B. McKenzie et al., 2008), greater support within the
school including opportunity to do acting roles (Lacey & Gronn, 2004, 2005), establish
leadership standards and performance review systems (Starr, 2007), change of
government and department policy and program development processes (Starr, 2007),
more support from the department (Lacey & Gronn, 2005; Teasdale-Smith, 2007), think
differently (d'Arbon et al., 2002), availability of preferred support (Lacey & Gronn,
2005; Teasdale-Smith, 2007). It should be noted that the above factors may contribute
to a principal shortage in any location, and the suggestions to address any shortage
probably vary from place to place and time to time as the solutions will likely be
context sensitive; the research is not strong enough to suggest anything more.
Theassistantprincipalrole
Harris et al. (2003) conclude that the assistant principal role is more about maintenance
rather than development, and assistant principals are seen as managers rather than
leaders, with their capacity for leadership not fully realised. Lashway (2006) talks of the
assistant principal as a ‘special case’ of development and occupying a “unique rung on
the leadership ladder” (p. 124), outlining some of the dilemmas facing assistant
principals such as: incumbents have high levels of responsibility and accountability, but
often not the ultimate authority in such areas as student management, event
management and supervision; the role might contain too much variety with the daily
tasks often dictated by daily events and the latest requirements of the principal; the
incumbent needs to balance the interests of the school, principal and teachers all at once.
19
Taking a case study research approach, Marshall and colleagues (C. Marshall, 1993; C.
Marshall, Mitchell, Gross, & Scott, 1992) found that only some assistant principals had
job descriptions, and usually there are many other duties as directed. There can be
overnight callouts for building problems and bus problems. They might have high
profile roles like school announcements. They solve problems before they get to the
principal, they induct new principals. They counsel, listen and support those who are
struggling. If they are from a minority group, they are an especially important role
model. Almost all manage discipline in some form. The effectiveness of teamwork
among administrators is important and assistant principal seems to like fully delegated
responsibility and authority. The job involves high levels of interaction with students
individually, with their family and in various locations around the school such as
cafeteria, walkways, and playground. Some interact with families and students across
the community (C. Marshall, 1993). One district had APS on the job an average of 71
hours per week (C. Marshall, 1993, p. 19). The complexity of the role is in part
described by this passage. “Bull-headed yet avoiding controversy; caring about young
people by disciplining them; searching for ‘fair’ solutions to dilemmas, yet often
making snap judgments. Career APs are complex and sometimes contradictory
individuals” (C. Marshall, 1993, p. 35).
In a study of public secondary school assistant principals in the Australian state of
Queensland, Cranston et al. (2004) found that comparing what they would view as their
‘real’ week with their ‘ideal’ week, participants would like to spend more time on
strategic and educational/ curriculum leadership, and less time on management/
administration, student issues, staffing issues and operational matters.
Theassistantprincipalroleandthecareerofanindividual
An assistant principal can be on one of several tracks (Donnelly, 1999; Lashway, 2006).
Some wish to become principals, some wish to be career assistant principals at their
current school, some are looking to assistant principal positions elsewhere, some wish
to work elsewhere in education, some are looking for a different career, and some wish
to become principals but feel thwarted and have thus far failed to snare a principalship.
It is argued that the professional development plans may vary according to which broad
20
category an assistant principal is in (Lashway, 2006). Careers decisions can be
influenced by a range of factors including superannuation entitlements (Donnelly,
1999).
Those who are career assistant principals do this for a variety of reasons including,
wanting to stay in touch with students and keeping the chance of a work-life balance
and wanting to avoid the stress and political issues of more senior roles (C. Marshall,
1993). These assistant principals may wish to focus their development on their
specialised areas, whereas someone heading for the principalship may wish to focus on
broader leadership skills, and understandings, broader educational and organisational
matters, and the process of applying for the principalship.
While it is a challenge for assistant principals to manage the roles they are given well,
unless they find ways to develop and exhibit leadership, they may be seen as more
suited to the assistant principal role than the principal role (Lashway, 2006). All of these
challenges may be greater for women and those from ethnic backgrounds, both of which
are under-represented in senior roles in schools (Harris et al., 2003, p. 3).
Lashway (2006) describes four phases of principal’s careers, namely recruitment into
the profession, preparation, induction and lifelong professional development and that
this can be a useful framework to consider the professional development of assistant
principals. This is similar to the stages of socialisation described by Gronn (1999) and
the three stages of socialisaiton described by Matthews and Crow (2003) : testing
competence, reflecting on the role, and abandoning old roles.
Harris et al. (2003) concluded that assistant and deputy principals often experience a
lack of professional support and that the lack of professional development opportunities
curtails their preparation for headship and being more effective and less underutilised in
their current role. Leadership responsibilities lead to higher levels of job satisfaction. (p.
3), and a stronger emphasis on leadership can also raise satisfaction (Cranston et al.,
2004). It is therefore argued that further opportunities need to be made available, the
nature of which might vary for those who see themselves as a career assistant or deputy
headteacher versus those who are aspiring to headteacher positions (Harris et al., 2003).
21
Some research seems to indicate that in some circumstances being an assistant principal
may not provide a good preparation for the principalship. It is argued that assistant
principals need direct opportunities to experience being leaders and targeted
professional development (Harris et al., 2003). Some researchers from the USA indicate
that limits to the assistant principal role restrain the preparation for the principalship (L.
J. Matthews & Crow, 2003). It is important for an assistant principal to in some way
access “…managerial tasks such as budgeting and facilities management…custodian…
and cafeteria…micropolitics of the school and district…community…special
education…ESL…bilingual…programs” and innovation (L. J. Matthews & Crow,
2003, pp. 278-279). Another way Lashway believes the role of assistant principal could
be productively redeveloped. “Ultimately, meeting the career-development needs of
assistant principals may depend on the districts’ ability to redesign the role of assistant
principal in a way that elicits the development of the full spectrum of leadership skills.”
(Lashway, 2006, p. 125)
Harris et al (2003) and Matthews & Crow (2003) suggest that assistant principals are
primed to make a greater contribution to their schools.
“The assistant principalship is a critical leadership role that can help change
schools. We encourage you to imagine your role as assistant principal in
innovative ways. Schools can be more effective learning environments for
students if more innovative images can be fostered and mentored.” (L. J.
Matthews & Crow, 2003, pp. 279-280).
ProfessionalDevelopmentofAPs
Internationaloverview
A useful way to set the context for this professional development discussion is an
international review conducted by Mulford in 2003 for the OECD entitled “School
leaders: Changing roles and impact on teacher and school effectiveness”.
22
Mulford concludes that there is a need for the systematic training of school leaders, but
found little evidence or planned preparation for the role. He argued for a structured
approach, taking
“…into account factors such as the stages of leadership (intending leaders,
inductees, early career and mid and late career) and dimensions of the
programme. These dimensions should include the content chosen (what,
who, on what basis), delivery mode used (who, where, how, when) and,
measurements of success” (Mulford, 2003, p. 3).
A review of research around the world shows that programs differ on the classifications
of centralisation versus devolution, degree of hands on learning, degree of maintenance
versus transforming the system, and a focus on human versus system requirements.
Some systems have training systems organised from the head office, some have
mandated credential programs and others are highly devolved to schools (Mulford,
2003).
QualityPD
Three ways to consider the quality of PD programs are described here.
Gusky and colleagues
Guskey and Sparks (1991) advocate a comprehensive approach in considering the
quality of professional development programs. They were talking in terms of
professional development being evaluated on the basis of impact on student learning.
They suggest that there is an array of factors that need to be considered because the link
between development programs and learning improvement may be indirect.
Improvement in a variety of student outcomes is important. But also is the quality of the
professional development program, including pre-training and follow-up. The quality of
the professional development includes those approaches that form components that may
increase the chances of the training having an impact by changing practice. (See
discussion of the work of Joyce and Showers to follow). The quality of content is
important, especially the extent to which the methods being proposed are well verified
through research. An environment of collaboration, trust and positive attitudes is
23
important if professional development is to be effective. Guskey and Sparks (1991)
argue that all these matters need to be attended to if programs are to be effective and
evaluations need to address all these matters. Professional development needs to aim at
improvement in student learning and therefore evaluation of programs should see
change in staff member participants, change in aspects of the organisation and change in
students learning using a variety of outcome measures.
In examining this connection between professional development and student learning
Guskey makes the point that it is difficult to prove that one particular PD program has a
direct impact when organisations such as schools often have many programs and
influences potentially having an impact on students all at once (Guskey, 2000, pp. 86-
87). Some methods of gathering proof could be pre and post testing or random
assignment of ‘treatment’ to groups might be ways to do this (Guskey, 2000, p. 87).
Guskey (2000) makes the distinction of evidence versus proof when evaluating
professional development activities. To get close to ‘proof’ requires control of all
variables and a tight experimental design. This is not available in most cases. What is
able to be gathered is evidence. In this case it is evidence based on participants’
opinions after the fact, with limitations as to the reliability of such information. It is
hoped that the tight structure of responses, confidentiality, and information provided
will enable responses to be accurate. “But in the absence of proof, you can collect very
good ‘evidence’ about whether or not professional development is contributing to
specific gains in student learning” (Guskey, 2000, p. 87).
Guskey proposes that there are advantages in an integrated design for professional
development programming that has a district-wide and site-based perspective. He
argues that there are perspectives and economies of scale at the district level and
opportunities for school to school interaction, whereas the individual school context
needs to be taken into consideration.
Kirkpatrick Model
As part of a ten step process of developing training programs, Kirkpatrick (1998)
suggests four levels of evaluating, namely; reaction, learning, behaviour and results. He
argues that all four levels of evaluation are important. Reaction is usually considered as
24
a measure of participant satisfaction, often taken at the end of the session(s). Learning
includes improvements participants make in attitude, knowledge and skills as a result of
the program. Behaviour examines the extent to which the behaviour of participants has
changed in ways advocated by the program. Of course, some of this change will depend
on how facilitating the workplace environment is and the view taken about the proposed
change. The results are the improvements made as a result of implementing what the
training program advocates. The evaluation of each of these levels presents challenges,
with reaction likely the most common level used.
Joyce and Showers Model
Joyce and Showers (1980) undertook a two year study reviewing “ … more than 200
studies in which researchers investigated the effectiveness of various kinds of training
methods.” (p. 380). They were looking for the components of training teachers that
would maximise the impact on teacher practice. Based on this research they developed a
model. In doing so they noted the difference between making minor adjustments to
current practice compared with making major changes to an approach of practice, which
involves changes in a practitioners own cognitions, a change in their behaviour, learn
new techniques, and those we work with have adjustments to make too (p. 380)
Joyce and Showers (1980) identified levels of impact of training and components of
training – see Table 3.
“Whether we teach ourselves or whether we learn from a training agent, the
outcomes of training can be classified into several levels of impact
awareness, the acquisition of concepts or organised knowledge, the learning
of principles and skills, and the ability to apply those principles and skills in
problem-solving activities” (p. 380).
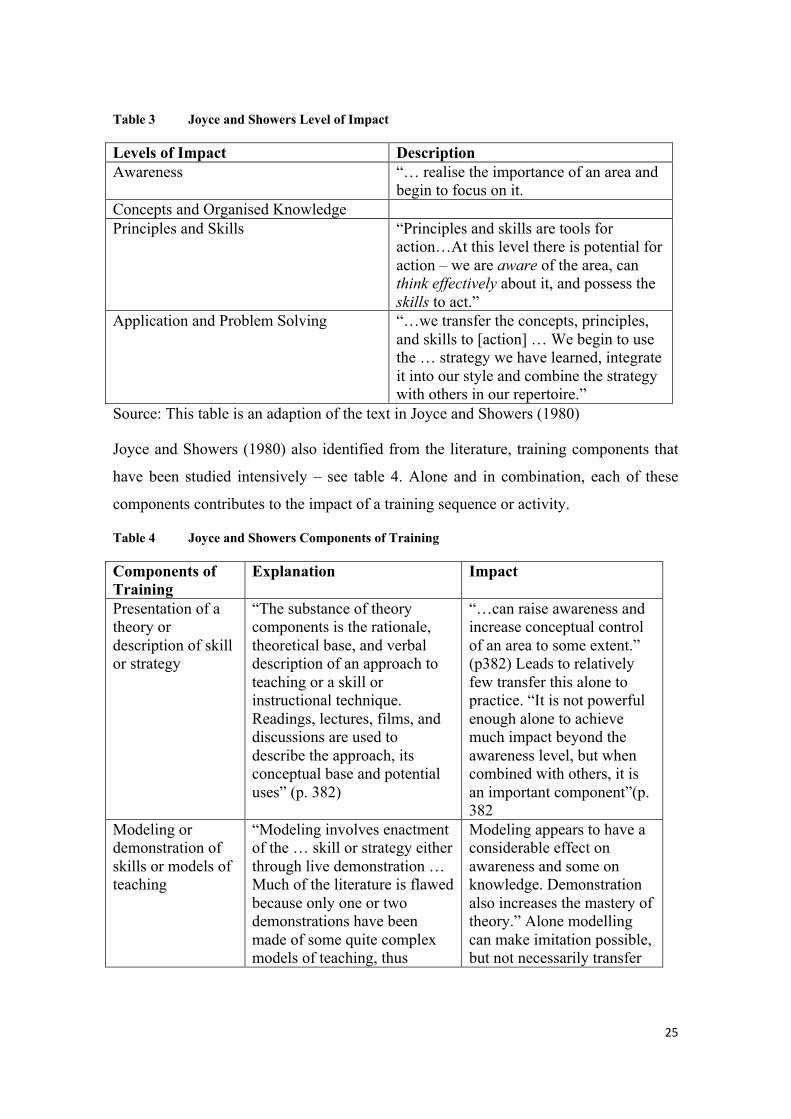
25
Table 3 Joyce and Showers Level of Impact
Levels of Impact Description Awareness “… realise the importance of an area and
begin to focus on it. Concepts and Organised Knowledge Principles and Skills “Principles and skills are tools for
action…At this level there is potential for action – we are aware of the area, can think effectively about it, and possess the skills to act.”
Application and Problem Solving “…we transfer the concepts, principles, and skills to [action] … We begin to use the … strategy we have learned, integrate it into our style and combine the strategy with others in our repertoire.”
Source: This table is an adaption of the text in Joyce and Showers (1980)
Joyce and Showers (1980) also identified from the literature, training components that
have been studied intensively – see table 4. Alone and in combination, each of these
components contributes to the impact of a training sequence or activity.
Table 4 Joyce and Showers Components of Training
Components of Training
Explanation Impact
Presentation of a theory or description of skill or strategy
“The substance of theory components is the rationale, theoretical base, and verbal description of an approach to teaching or a skill or instructional technique. Readings, lectures, films, and discussions are used to describe the approach, its conceptual base and potential uses” (p. 382)
“…can raise awareness and increase conceptual control of an area to some extent.” (p382) Leads to relatively few transfer this alone to practice. “It is not powerful enough alone to achieve much impact beyond the awareness level, but when combined with others, it is an important component”(p. 382
Modeling or demonstration of skills or models of teaching
“Modeling involves enactment of the … skill or strategy either through live demonstration … Much of the literature is flawed because only one or two demonstrations have been made of some quite complex models of teaching, thus
Modeling appears to have a considerable effect on awareness and some on knowledge. Demonstration also increases the mastery of theory.” Alone modelling can make imitation possible, but not necessarily transfer
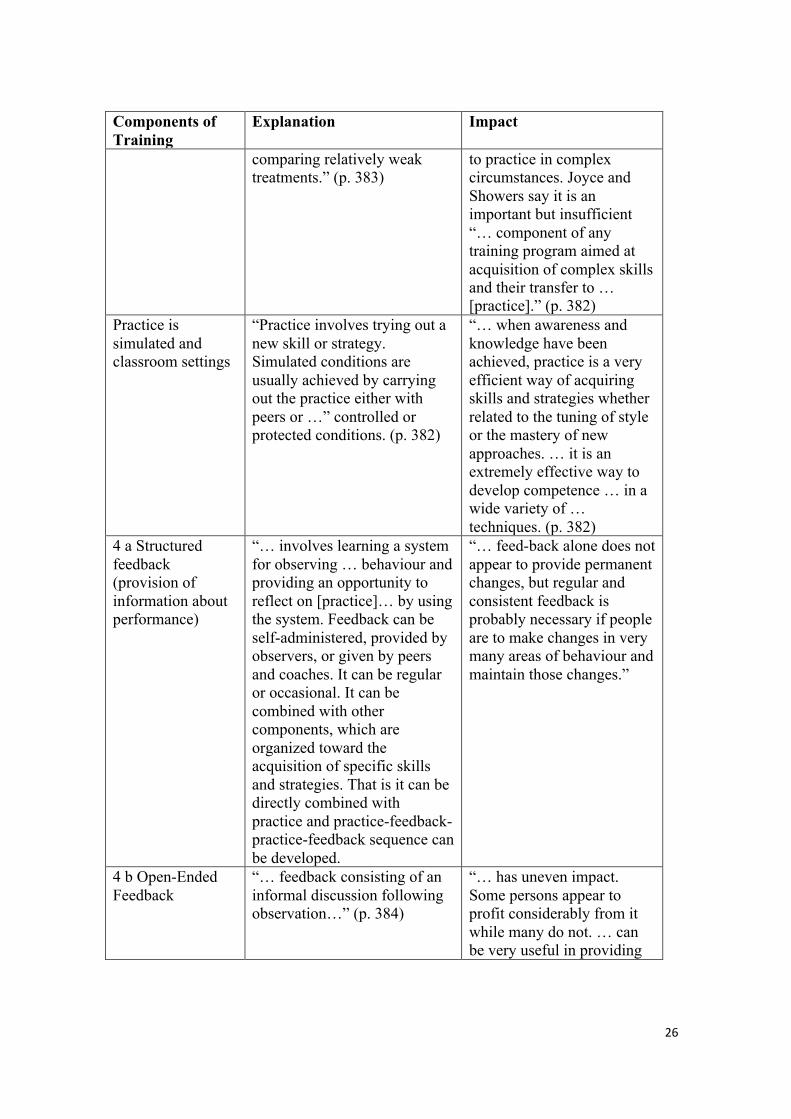
26
Components of Training
Explanation Impact
comparing relatively weak treatments.” (p. 383)
to practice in complex circumstances. Joyce and Showers say it is an important but insufficient “… component of any training program aimed at acquisition of complex skills and their transfer to … [practice].” (p. 382)
Practice is simulated and classroom settings
“Practice involves trying out a new skill or strategy. Simulated conditions are usually achieved by carrying out the practice either with peers or …” controlled or protected conditions. (p. 382)
“… when awareness and knowledge have been achieved, practice is a very efficient way of acquiring skills and strategies whether related to the tuning of style or the mastery of new approaches. … it is an extremely effective way to develop competence … in a wide variety of … techniques. (p. 382)
4 a Structured feedback (provision of information about performance)
“… involves learning a system for observing … behaviour and providing an opportunity to reflect on [practice]… by using the system. Feedback can be self-administered, provided by observers, or given by peers and coaches. It can be regular or occasional. It can be combined with other components, which are organized toward the acquisition of specific skills and strategies. That is it can be directly combined with practice and practice-feedback-practice-feedback sequence can be developed.
“… feed-back alone does not appear to provide permanent changes, but regular and consistent feedback is probably necessary if people are to make changes in very many areas of behaviour and maintain those changes.”
4 b Open-Ended Feedback
“… feedback consisting of an informal discussion following observation…” (p. 384)
“… has uneven impact. Some persons appear to profit considerably from it while many do not. … can be very useful in providing
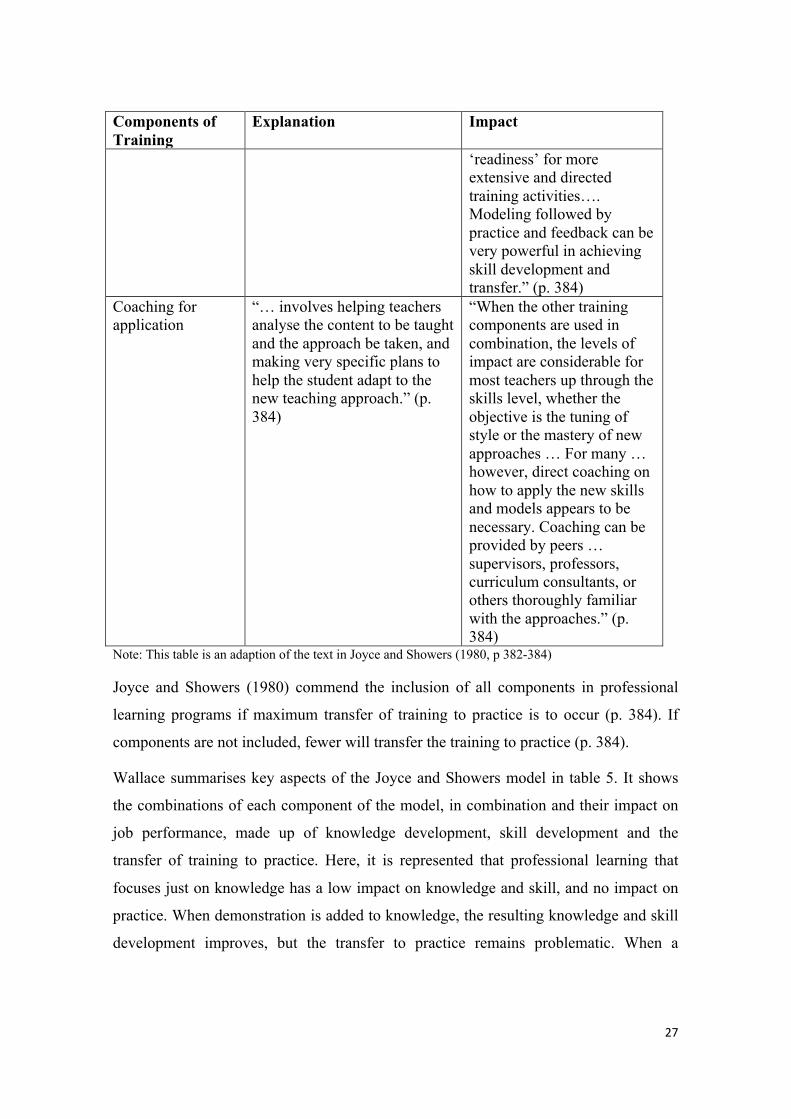
27
Components of Training
Explanation Impact
‘readiness’ for more extensive and directed training activities…. Modeling followed by practice and feedback can be very powerful in achieving skill development and transfer.” (p. 384)
Coaching for application
“… involves helping teachers analyse the content to be taught and the approach be taken, and making very specific plans to help the student adapt to the new teaching approach.” (p. 384)
“When the other training components are used in combination, the levels of impact are considerable for most teachers up through the skills level, whether the objective is the tuning of style or the mastery of new approaches … For many … however, direct coaching on how to apply the new skills and models appears to be necessary. Coaching can be provided by peers … supervisors, professors, curriculum consultants, or others thoroughly familiar with the approaches.” (p. 384)
Note: This table is an adaption of the text in Joyce and Showers (1980, p 382-384)
Joyce and Showers (1980) commend the inclusion of all components in professional
learning programs if maximum transfer of training to practice is to occur (p. 384). If
components are not included, fewer will transfer the training to practice (p. 384).
Wallace summarises key aspects of the Joyce and Showers model in table 5. It shows
the combinations of each component of the model, in combination and their impact on
job performance, made up of knowledge development, skill development and the
transfer of training to practice. Here, it is represented that professional learning that
focuses just on knowledge has a low impact on knowledge and skill, and no impact on
practice. When demonstration is added to knowledge, the resulting knowledge and skill
development improves, but the transfer to practice remains problematic. When a
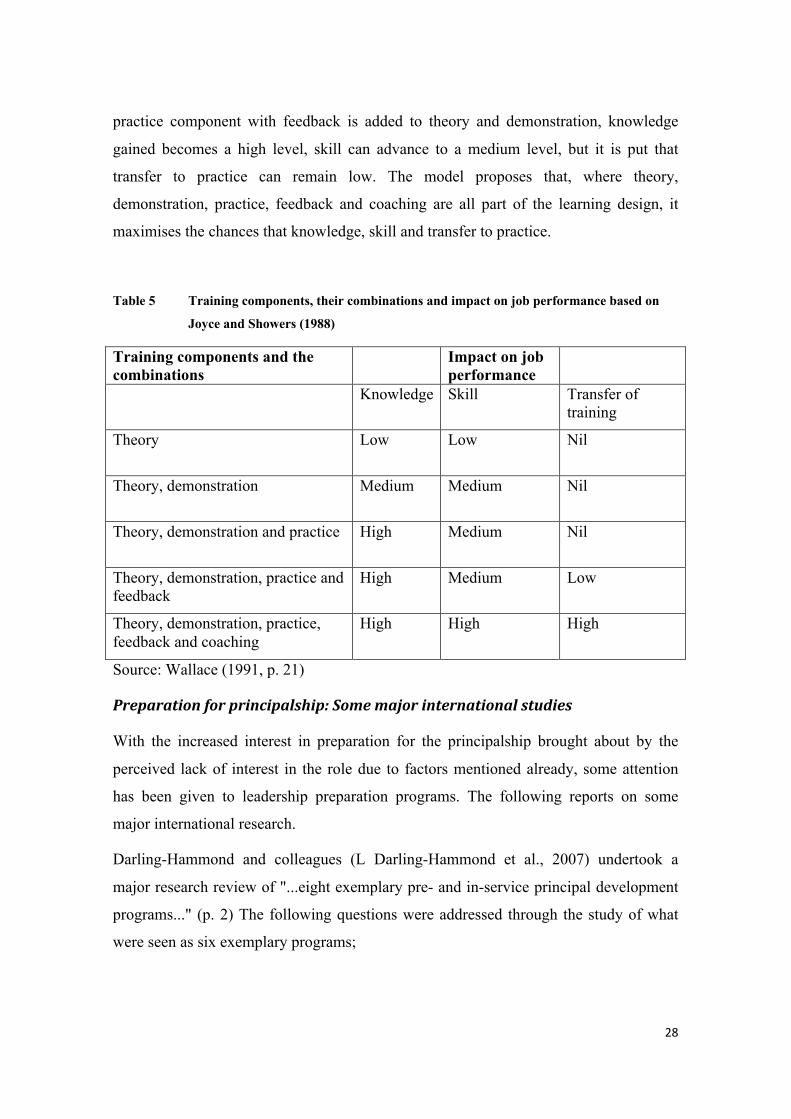
28
practice component with feedback is added to theory and demonstration, knowledge
gained becomes a high level, skill can advance to a medium level, but it is put that
transfer to practice can remain low. The model proposes that, where theory,
demonstration, practice, feedback and coaching are all part of the learning design, it
maximises the chances that knowledge, skill and transfer to practice.
Table 5 Training components, their combinations and impact on job performance based on
Joyce and Showers (1988)
Training components and the combinations
Impact on job performance
Knowledge Skill Transfer of training
Theory Low Low Nil
Theory, demonstration Medium Medium Nil
Theory, demonstration and practice High Medium Nil
Theory, demonstration, practice and feedback
High Medium Low
Theory, demonstration, practice, feedback and coaching
High High High
Source: Wallace (1991, p. 21)
Preparationforprincipalship:Somemajorinternationalstudies
With the increased interest in preparation for the principalship brought about by the
perceived lack of interest in the role due to factors mentioned already, some attention
has been given to leadership preparation programs. The following reports on some
major international research.
Darling-Hammond and colleagues (L Darling-Hammond et al., 2007) undertook a
major research review of "...eight exemplary pre- and in-service principal development
programs..." (p. 2) The following questions were addressed through the study of what
were seen as six exemplary programs;
29
"... whether some programs are more reliably effective in producing strong
leaders, and if so, why and how? What program components and design
features do effective programs share? How much do these programs cost?
How are they supported and constrained by policies and funding streams?"
(p. 1).
The researchers gathered and triangulated data from a number of sources for each
program. These programs were all organised from beyond an individual school, either
through a university or school district, but usually involved collaborative arrangements
across organisations.
The following features of exemplary pre- service programs were common;
• "A comprehensive and coherent curriculum aligned with state and professional
standards, which emphasize instructional leadership;
• A philosophy and curriculum emphasizing leadership of instruction and school
improvement;
• Active student-centred instruction that integrates theory and practice and
stimulates reflection. Instructional strategies include problem-based learning;
action research; field-based projects; journal writing; and portfolios that feature
substantial use of feedback and assessment by peers, faculty and the candidates
themselves;
• Faculty who are knowledgeable in their subject areas, including both university
professors and practitioners experienced in school administration;
• Social and professional support in the form of a cohort structure and formalized
mentoring and advising by expert principals;
• Vigorous, targeted recruitment and selection to seek out expert teachers with
leadership potential; and
• Well-designed and supervised administrative internships that allow candidates to
engage in leadership responsibilities for substantial periods of time under the
tutelage of expert veterans" (p. 6)
30
Darling-Hammond et al. (2007) note the strong benefits of developing a collegial cohort
in programs (p. 6) and also that selection processes can lead to the outcome where
"... graduates were significantly more likely than members of the
comparison group to be female and members of a racial/ethnic minority
group. They were also much more likely to have strong and relevant
teaching experience, having frequently serving as coaches for other
teachers, department chairs, and team leaders. These candidates were
committed to their communities and capable of becoming instructionally
grounded, transformative leaders" (p. 7).
The internship was seen to be vital in leaders learning how to apply complex processes
(p. 7).
With respect to In-service professional development programs three features were seen
to be common in the exemplary programs, namely;
"A learning continuum that operated systematically from pre-service
preparation through induction and continuing careers and included using
mature and retired principals as mentors;
Leadership learning that is organized around a model of leadership and
grounded in practice, including analyses of classroom practice, supervision,
and professional development using on-the-job observations connected to
readings and discussions; and
Collegial networks, such as principals' networks, study groups, and
mentoring or peer coaching, that offer communities of practice and support
for problem-solving" (pp. 8-9).
Darling-Hammond et al. (2007) contend that effective programs can be created for
aspiring and appointed leaders that will greatly assist in preparing for school success (p.
9). Indeed, they contend that, in comparison to a national random sample of principals,
participants in the exemplary programs with the features cited above, “feel significantly
better prepared for virtually every aspect of principal practice" (p. 9) and, "have more
positive attitudes about the principalship and are more likely to plan to stay in the job,
31
despite working in more challenging urban environments" (p. 9). Graduates of pre-
service programs self-rated as significantly better prepared for vital aspects of the
leadership of learning and management of a school (p. 10).
Ingredients for program success included effective program leaders (p. 13), excellent
partnerships among key organisations such as the schools, universities and school
districts (p. 16) and substantial financial support, including for high cost strategies such
as internships (p. 16-17).
Darling Hammond et al (2007) found that
'... policy levers states use to support and sustain the recruitment and development of
school leaders include: The use of standards, accreditation, and assessment to guide
program change and stimulate participation in professional learning; the creation of
strategies that support candidate recruitment and access to high-quality training; and, the
development of state and local infrastructures for ongoing professional learning." (p.
18).
In considering the implications of their research for policy and practice, Darling-
Hammond et al. (2007) advocate an active selection process for these programs and
support for participant salaries (p. 20), programs should have a strong framework and
close links between theory and field work on instructional leadership (pp. 20 - 21),
strong partnerships between university providers and school systems, (pp. 21) the
drawing together of all elements of the program through a leadership model, (pp. 21-22)
and the provision of sufficient resources, especially for methods such as internships and
mentoring (p. 22).
In their overall conclusions, Darling-Hammond et al. (2007) believe that pre- and in-
service programs can support the development of school leaders in helpful ways (p. 23).
They say while there are common elements in exemplary programs, there are many
ways to establish these programs (p. 23). They argue that there is some evidence that
systems are moving to establish these programs more commonly and for all the effort
this will take, benefits will be seen in improved teaching for all students (p. 23).
32
Cowie and Crawford (2007) undertook research as part of the International Study of
Principal Preparation in relation to professional development needs of the system, for
example succession, and school improvement, and also the needs of the individual
educators. Although Cowie and Crawford (2007) in these comments highlight the
attraction of educators to the principalship and preparing them for it via appropriate
experiences, there is also a need to sustain and grow incumbents.
Reports from various locations around the world show that leadership programs cater
for a range of administrators, including those in-post and potential aspirants, with some
involving other leaders in the school system. Program structures vary from being
academic leadership programs run by universities covering a wide range of knowledge,
to those that are aligned to the achievement of mandated leadership standards and also
learning of instrumental skills and knowledge. A wide range of teaching and learning
strategies are employed, including formal testing, didactic teaching, case study and
simulated conditions, reflective discussion, reading tasks, work-based projects, online
learning. Delivery of the project can involve university, academics, administrators
currently in the field, system administrators and combinations of serving principals,
academics and administrators. Programs are delivered in a variety of ways, including
distance learning (often online), school-based experience, reading, face to face
interaction and independent work, or various combinations of these. The ISPP project,
as at 2008, did not have strong evidence about whether or not these preparation
programs actually make a difference to beginning principals (Cowie & Crawford,
2007).
Levine (2005a) undertook a study that involved surveys of deans, chairs, faculty, alumni
and school principals. The sample was of 28 schools of education were the subject of
case studies. Levine argued the US has the large task of re-skilling current principals
and developing their successors. Education faculties have continued their programs in
the face of new challenges and these challenges go unmet. He found that schools of
education differ a great deal. With respect to new providers of education leadership
programs, Levine (2005) says,
33
“The new providers have not been any more systematic about evaluating
their performance than have the education programs they seek to replace.
The poignant anecdote remains the most often presented “evidence” of
success. Testimonials abound, but no systematic research exists to
demonstrate that these new programs are any more or less successful than
the traditional versions. Because the alternative programs were not a focus
of this project, it is not possible to evaluate them based on the nine standards
of quality outlined in Part I. At this point, we know that alternative
programs are different than those at universities. But we have no idea
whether they are better or worse” (Levine, 2005, p. 52).
The study included 5469 education faculty (40 % response rate), 15468 past education
students (34% response rate) and 1800 principals (41 % response rate).
“The most commonly cited weaknesses: Educational administration scholarship is
atheoretical and immature; it neglects to ask important questions; it is overwhelmingly
engaged in non-empirical research; and it is disconnected from practice.” (Levine, 2005,
p. 44). Levine concluded that overall the university schools of education are not
successful in providing relevant and useful training.
Bush and Glover (2003) reviewed leadership programs around the world and noted
strong commonalities (p. 3). They highlight the value of "…work-based learning, action
learning, mentoring, coaching, diagnostics and portfolios" (p. 3) where work-based
projects might be in-house activities such as "...'stretch assignments', job rotation,
shadowing and internship". They also suggest supportive evidence is also existent for
activities such as peer support and networking and formal leadership programmes. (p. 3)
They cite Crow’s ideas as highlighting a distinction between preparation for a
leadership role ("professional socialisation") and orientation to the particular
organisation in which a role will occur ("organisational socialisation") (p. 3).
Bush and Glover (2003) propose several recommendations for leadership development.
Looking at these recommendations from the point of view of developing assistant
principals towards the principalship, the following points can be made: leadership
development should begin in the school using planned supportive processes that inform
34
principal aspirants of the context in which they will lead and manage with an emphasis
on instructional leadership. This process approach to learning could be parallel with
formal content input with the two linked through projects. In school, leadership
development should be widespread through widely distributed leadership roles.
"Underpinning these precepts is the recognition that leaders are 'made not born'.
Developing leadership potential is vital for the continuing success of schools and the
education system. This requires an active leadership development policy for each school
and local authority." (p. 4). The authors also put the view that there is much to be done
to work out ways of ascertaining the needs of leaders and the relative effectiveness of
different approaches to leadership development. (pp. 4 - 5)
Australia
McKenzie, Mulford and Anderson (2007) approached their nation-wide study of the
principalship and development suggesting that across Australia there is a problem in the
supply of principals including filling the roles and finding aspirants. They suggested the
negative aspects of the role get the most publicity but the high level of satisfaction
reported by practising principals is not as well known. Formally, applicants for principal
posts in most systems only require teacher qualifications (unlike the USA and UK
which had certification processes as at 2008). However, those interested in leadership
often undertake other study, being prominent in postgraduate courses in universities.
Across the nation, “Most school systems have now developed a leadership continuum
framework that traces the ‘leadership journey’ from aspirations through to beginning in
leadership roles, consolidation and growth…” (McKenzie et al., 2007, p. 53). McKenzie
et al. found that systems have often involved government professional bodies,
academics and others in the development of school leaders. Delivery of programs also
involves a range of arrangements, including collaborations including independent
actions of departments, universities, professional associations and even individual
schools or school leaders. In a development that may see Australia following
international trends, a new organisation, Teaching Australia, has responsibility for
professional development and has developed a program for experienced principals to
encourage them to take on levels of system leadership. McKenzie et al. (2007) found
35
that most concentration of programs seems to be on appointment, in induction programs
for appointees. Some programs are evident of underrepresented groups such as women
and Indigenous educators with a tendency to acknowledge community leadership and
professional learning teams.
McKenzie et al. (2007) advocate the drawing on research to ensure leadership standard
frameworks draw from strong evidence and be continually evaluated, that appropriate
attention is given to capability and competency that meets the needs of individual and
system requirements and better research evidence about how programs impact of leader
growth and performance.
Victoria
As at 2008, In Victoria, the department had set out principles that it believed
underpinned effective professional development (Department of Education & Training,
2005). While the guidelines mention teacher professional development, many of the
same principles apply to leadership learning. The stated aim of the department was to
develop a culture of continual learning embedded around improving practice.
Summarised, the seven principles are that professional learning:
• Take into account the outcomes desired for school students
• Focus on practice
• Are informed by research
• Involves working with others and receiving feedback
• Includes data gathering to influence further work
• Professional learning is a continuous way of professional life within the school
and connected to a similar culture across networks and the system
• Learning goals should be shared across the system, at all levels (Department of
Education & Training, 2005).
In 2007 the Parliament of Victoria initiated an inquiry into effective professional
development for teachers (Howard et al., 2009) (and leaders) attracted 93 public written
36
submissions (http://www.parliament.vic.gov.au/component/content/article/37-
inquiry/168-submissions accessed March 02 2014) from a wide range of sources. These
included universities, representative bodies, unions, professional associations,
commercial interests, individuals with experience in providing professional learning
programs, and interstate organisations and individuals with an interest topic.
The report is summarised shortly but some key ideas from just a handful of the
submissions included matters such as professional learning being inquiry based,
connected to real work, well supported (e.g. with modeling and coaching), customised
(Australian Education Union, 2007), relevant to its location (Emmitt, 2007), rigorous
(Australian College of Educators, 2008), and emanating from site-based initiatives (B.
Armstrong, 2007a). Cole (2008), consistent with his own earlier work (Cole, 2004), was
broadly consistent with the (Howard et al., 2009) view that participation in professional
development activities did not necessarily mean that professional learning would occur
and that improved practice would be an outcome. Consistent with others Johnson (2007)
advocates a process well-supported with an external coach, and well organised in-house
approach to professional learning and improving practice, team based and having the
elements of the Joyce and Showers model outlined elsewhere in this chapter.
The submissions did reflect their author’s particular interest, but combined, they provide
a very rich source of evidence and opinion about the development of educators.
The committee received a submission highlighting the likely acceleration of retirements
from principal ranks and therefore the need to develop existing principals and also the
need to prepare the next generation of school leaders and therefore making leadership
development programs to staff across the levels. The committee noted the existence of
mandated qualifications as preconditions for appointment to the principalship in
counties such as Scotland, England, Wales and Canada. The Committee commended the
newly emerging Bastow leadership institute being established in Victoria.
The Committee found that school leadership development was a priority of some sort in
each state of Australia, and there were many offerings of many types available.
37
The committee heard evidence that lecture style learning was less preferred and less
effective than delivery modes which engage teachers in action. This is likely to also
apply to assistant principals. Members heard that in-school professional learning was
the most prevalent form of learning and this was often through consultation with
colleagues or built around the actual practice, with reflection and discussion with
colleagues. Learning from practice and learning from colleagues (as peers and / or
mentors) rated relatively highly as preferred ways of learning. Networking across
schools either in person or electronically was seen to be of value. External consultants
and coaches, under certain conditions, can be of great value to promote professional
learning. Other methods and inputs to teacher learning included; joint research projects,
having a professional resident in the school for a period of time, reading related to
professional matters, off-school-site activities as networks, with professional, university
courses associations, placements in industry all had some potential benefits.
DevelopmentofAssistantprincipals
There is a group of scholars who, although acknowledging the context of school and
system needs, look at these from an individual’s perspective
Donnelly (1991, pp. 165-171) comments on the need for deputy principals to seek
professional development support for the tasks at hand. Then, depending on whether
they wish to stay a deputy head or move into headship, or even into other alternatives
such as adviser positions. Each route would require different preparation (e.g.
principalship- including applications, interview skills). Donnelly encourages all deputy
principals to consider their future and to plan their development needs accordingly. (p.
166)
Mason (2007) acknowledges that while the assistant principal role can vary from
location to location, he advocates organising professional development around
standards, in this case (USA) the six ISLLC standards, arguing that the standards cover
the broad elements of school leadership and that some constituencies organise
professional development offering around these standards. (p. 2)
38
Mason advocates each assistant principal seeking out a mentor (preferably of choice).
Also important, according to Mason is the working out the role and responsibility / job
description with the principal, clarifying the role with respect to aspects of instruction,
discipline, staff development, district issues, projects, events extra-curricular program,
staff appraisal, staff management, staff meetings, and committees. It is recommended
on-the-job activities for professional learning are made available for the assistant
principal and possible future roles includes the conducting of staff meetings, staff
evaluations, attend Board meetings (USA), involvement in such things as testing,
special education, graduation and other ceremonies and community events, school
development and improvement processes, student bodies and keep up to date with ICT.
The mentoring process should focus on the ISLLC standards and also be organised
around goals, case discussions from the work of the assistant principal, as well as
informal sharing, network building. Other PD areas reflect a view of what assistant
principal duties entail, for example, learning to document interactions with others,
dealing with student behaviour and classroom management, special learning needs,
attendance, court and legal matters, meetings with parents, matters.
A survey of 100 assistant principals (Weller & Weller, 2002) from diverse geographic
locations in the USA found that assistant principals believed that areas which leadership
courses provided inadequate learning include motivation, conflict resolution, connecting
learning programs to real life, teamwork, improving teaching and micropolitics. (p. 13)
The book covers material on understanding the informal organisation with a dose of
micropolitics, working with the community including adverse events, interpersonal
communication skills, improving instruction, improving professional development for
staff.
Weller and Weller advocate for careful assessment of staff development needs,
including individual and professional. To be effective professional development Weller
and Weller say it needs to be planned and organised, be well resourced including
follow-up, be practical and useful, relate to the participants’ work, have a robust theory
and be based on participant input into the planning process. Further, it should be based
on adult learning principles, often be team-based, use quality principles for continuous
39
improvement. Goal setting can be useful. Evaluation of programs should consider pre
and post program assessment and can also include observation checklists, portfolios
Marshall, a scholar with a long time interest in the assistant principalship (C. Marshall,
1992, 1993, 1990; C. Marshall & al, 1993; C. Marshall & Hooley, 2006; C. Marshall et
al., 1992; M. Marshall, 2004) has also found through this work that targeted
professional development activities are reported by career assistant principals as being
most helpful (C. Marshall, 1993) . In terms of valued sources of professional learning,
professional associations appear helpful including their advocacy for and acceptance of
assistant principals and their role and accept assistant principals as members.
Universities were not mentioned much, neither were superintendents, however district
support is valued.
The Department of Industry and Commerce of the Australian Government in advice to
small business (Department of Industry and Commerce, 1977) an Australian
Government report reminder of the often overlooked reality that "Regardless of the
person or persons concerned, the time will come when, through dismissal, retirement,
resignation or death, each will leave the business. Management Succession is the filling
of these vacant managerial positions in some orderly, efficient and predetermined
manner, ensuring smooth continuity of control of the business." (p. 2).
The document raises the vulnerability of organisations that rely on senior managers who
are approaching retirement, with transfer of knowledge before they depart being an
important factor. (p. 6) The authors note that sometimes senior people are reluctant to
prepare for their own departure by training a successor. A plan that takes into account
existing arrangements, potential aspirants and those who may depart in the foreseeable
future with plans for replacement then being developed (pp. 6 -7). Although focussed on
small business, the authors propose some strategies for developing successors that may
be relevant to secondary school settings such as: "On the job training, special
assignments, job rotation, attendance at courses, seminars, trade displays, etc. and
periodical appraisal of performance." (p. 7). Mentoring-type arrangements are
advocated where "Executives given responsibility for the training of their subordinates
will be expected to delegate responsibility and authority to their assistants and share
40
with them, as much as possible, the process of decision-making and contact with
customers, suppliers, competitors and advisors." (p. 7). The creation of a pool of
possible future executives is alluded to. The issue of a lack of suitable internal aspirants
may mean that an external appointment may need to be made to 'understudy the retiring
executive for a period prior to departure'. (p. 7).
Growyourown
In response to the perceived shortage of those willing to become school leaders and
consistent with calls for succession planning, has been the call for localised ‘grow your
own’ approaches to ensuring there are sufficient high quality applicant for the
principalship (Allen & Stacey, 1989; D. Fink & Brayman, 2006; Hartle & Thomas,
2003; Lashway, 2003, 2006; Lovely, 1999, 2004a, 2004b; Normore, 2004, 2006, 2007;
Petzko et al., 2002), although some believe the shortage cannot be cured by a district
only approach when it comes to issues such as gender under-representation and other
minority representation (Sherman, 2005). For some, the expected shortage was and is a
wonderful opportunity to appoint new leaders suited to future demands, but training
programs are inadequate and only work-based programs can prepare potential
candidates for the nature and speed of the work, bridging disharmony, very heavy
person to person communication demands and many very challenging aspects of the
role (Mark Anderson, 1989). As with succession planning, much of the literature comes
from business (e.g. Adair, 2005; Byham, Smith, & Paese, 2002; Charan, Noel, &
Drotter, 2001)
Light (2005, pp. 191-193) describes how a grow your own program of leadership
development can increase the likelihood of a ready supply of leaders in waiting to match
organisational needs. Light cites the work of the RAND corporation work with the
military saying there is a need to have a large enough pool of candidates with strengths
in both leadership and management so that there is a good choice to fill the roles as they
come up. Light argues that future leaders need to be prepared for the future and the
company’s future. (p. 193)
Much of the work of the RAND company in this field is classified and not available due
to its military nature (Light, 2005, p. 192). However, Light does cite the RAND work
41
with global organisations in the "government, nonprofit, and business..." sectors as
highlighting the need to develop futures thinking in future leaders. Light quotes the
RAND work, without referencing it, saying that many organisations studied by RAND
do not have the broad range of skills needed to be effective globally. Light says
"Organizations are desperate for leaders with general cognitive strengths
such as problem-solving and analytical ability, strong interpersonal and
relationship skills, tolerance of ambiguity and adaptability, and personal
traits such as character, self-reliance, and dependability. Specialized skills
are less in demand ... Operating knowledge can be continually acquired as
long as the learning skills and openness to ideas exist" (p 194).
Without providing evidence, Kotter (1998, p. 50) makes the claim that "... the on-the-
job experiences of most people actually seem to undermine the development of
attributes needed for leadership." Even without evidence, the statement is a prompt for
organisations such as schools to be careful for this not to be the case. It does prompt the
explicit thinking about how this might occur.
As a cautionary tale, Ciampa and Watkins (2001) describe circumstances where the
relationships between successor and incumbent can be counter-productive and fail,
leading to the successor’s departure. But there may also be less obvious ways an
organisation undermines rather than develops leadership.
In a strong endorsement of leadership development within an organisation, Kotter
(1998, p. 53) asserts that "Institutionalizing a leadership-centred culture is the ultimate
act of leadership." He advocates making future promotion of existing leaders to be
based to some extent on their ability to develop leaders (p. 53). He views it as important
to start providing early career challenges that provide opportunities "... actually try to
lead, to take a risk, and to learn from failures." (p. 50). Kotter says that later in a career
opportunities are needed to help broaden potential leader’s experiences. He argues that
decentralised organizations provide opportunities to '... test and stretch...' (p. 52) for on
the job learning, as do organizations committed to innovation. (pp. 51-52).
42
In answer to the question “What’s Driving People Away from the Principalship?”
consistent with Light’s comments from business, Lovely (2004b) is clear that leaders
need to be prepared for new environments. Lovely (2004b) argues that in the
principalship, “benevolent dictators’ of the past are past are being replaced by the
instructional maestros of the future.” (p. 8). To guide this she cites new standards that
have been written for new leadership and puts the view that “…to compete in the
domestic marketplace, deliberate efforts must be established to recruit, select, train, and
inspire this new brand of principal.” (p. 8).
Consistent with Lovely’s views, Johnson-Taylor and Martin (2007) outline strategies
that build principals from assistant principals. The authors highlight the “alarming
shortage of qualified aspiring administrators to meet the current and future need for
school leaders” (p. 23) and the obligations of principals to support assistant principals to
prepare for the principalship. They believe that a narrowing of assistant principal
responsibilities makes that preparation more difficult. The authors interviewed ten
principals who are “building the bench” and distilled several recommended strategies.
Perhaps controversially and questionably, the first recommendation Johnson-Taylor and
Martin (2007) make is to enquire about the career goals of applicants for assistant
principal positions and not to hire career assistant principals. The second is to hire
assistant principals who are strong on instruction and get out into classrooms to model
and support the development of good practice. Once hired, it is recommended to get
work with the assistant principal to ensure there are common approaches through
modeling and coaching, also doing activities together. It is also recommended that
assistant principals are involved in all aspects of running the school from instructional
leadership to budgeting to dealing with parents. Opportunities for genuine leadership
need to be provided. Regular meetings of principals and assistant principals are
important, where there is a detailed debriefs on the key events and issues and that
reflective practice is encouraged. The authors make the suggestion that the assistant
principals are able to attend one or two professional development conferences. The
quantum might seem modest but the principle is the same. The encouragement of
development in a variety of ways is important. Finally, the authors suggest becoming an
43
advocate and marketing agent for the assistant principal who is ready for the
principalship. The authors note that although the school the assistant principal
eventually leads might be very different, the lessons learned in their current school are
likely to be very valuable.
Operating from the school level, Hix, Wall and Frieler (2003) highlight the possible
practice and benefits of “growing your own” school leaders in a high school. Hix claims
a remarkable succession, preparing leaders for his own and other schools. He argues the
process can start in the first year of teachers college. The opportunities include a
reported link with the University of Northern Colorado set up by the district to offer a
master’s degree in educational administration.
Hix et al. (2003) aim to develop leaders in the school that complement rather than
replicate the strengths of the current principal. They encourage principal aspirants to
give up free time to get involved in activities. He believes that authority needs to
accompany responsibility and seeks to delegate accordingly. Planning is essential and
delegations are worked out at the beginning of each year, weekly meetings are held and
evaluation plays a key role. The team shares the less desirable roles and supervision at
evening activities. Sharing the limelight is also important. Aspirants are encouraged to
join professional networks, and get involved in conferences, even as presenters, locally
and beyond. The benefits of this approach include fully utilising the talents of aspiring
staff members, providing aspirants with the opportunity to find out if they are indeed
suitable for administrative leadership roles, providing the principal with more support
allowing him to focus on planning, promoting leadership in a positive way. However,
care would need to be taken in developing clones of existing principals (Gronn &
Lacey, 2006)
This section of the literature has argued that there are approaches to professional
learning that will maximise the benefits of training. While it can be challenging to
always provide proof of the link between training and student learning outcomes,
evidence of the benefits of training can be gathered in a variety of ways. The efforts to
develop the assistant principalship may start with the assistant principal selection
process, but once selected individuals need access to well-supported real life leadership
44
experiences and other high quality opportunities at the district level and beyond. At
least at the district level, but more likely on a state level and beyond, researching
succession needs and comprehensive succession program development (see elsewhere
in this review) needs to be undertaken focussed on developing school leaders for the
future. The more local ‘grow your own’ approach is entirely consistent with succession
planning and management approaches, in fact, they may be one in the same thing – an
analysis of this is beyond the scope of this project.
Jobsatisfaction
The initial prompt to include job satisfaction in this study was from the findings of
Lacey (2002a, p. 68) in which she concluded that the interest of teachers in seeking the
principalship was influenced by the perception they had of the job satisfaction of
principals. There have been key studies of job satisfaction in Victorian schools as it
relates to leaders or leadership aspirations that are worth describing here.
The first is by Lacey, the second study is by Gronn and Lacey, the third study is by
McKenzie and colleagues, the fourth by Sturmfels and the fifth study is by Muller and
Saulwick.
Lacey (2002a) undertook a major study in the state of Victoria, Australia to explore the
aspiration teachers have for principal class (that is, assistant principal and principal)
positions. Aspects of this study are reported elsewhere. Part of the study was to explore
the job satisfaction of school personnel and how that might impact on career aspirations.
Lacey used a mixed methods approach, using both questionnaire and focus groups to
explore many of her research questions, including job satisfaction and career intentions.
A key finding was that potential aspirants are influenced by their perceptions of the job
satisfaction of principals. Further, she found that the assistant principal role was seen as
satisfying by more potential aspirants. An important finding is that “… the view by
principals that the sources of dissatisfaction were extrinsic, visible and well known to
other members of staff, whilst the sources of job satisfaction were intrinsic, invisible
and unknown to most teachers” (Lacey, 2002a, p. 11). This point was reinforced by
45
Gronn and Lacey (2004b). Also reported was that the job satisfaction of assistant
principals exceeded that of principals and teachers, with the high levels of satisfaction in
assistant principal roles that were negotiated school by school. For many, the assistant
principal role was seen as attractive as it does not carry the ultimate accountability.
Lacey and Gronn (2005) explored a range of issues to do with career intentions,
including the role of job satisfaction. They combined methods of focus groups,
questionnaires and interviews. A range of important findings were reported, including
that,
“Assistant/deputy principals have high levels of job satisfaction. In the
short term, these people will only seek promotion to principal positions if
they perceive the role to provide them with increased job satisfaction, the
selection process becomes less onerous and experiences gained outside the
school and/or education system are valued” (2005, p. 7).
A further related finding was the role job satisfaction seemed to be playing in the loss of
wise and knowledgeable principals. “The key reasons cited for taking retirement or
resigning their position were job intensity, escalating responsibilities and role
expectations, deteriorating health caused by stress, and diminishing job satisfaction” (p.
44). This possible impact of this is a greater number of vacancies and fewer people
willing to fill them.
McKenzie et al. (McKenzie, 2008; McKenzie et al., 2007) conducted a national online
survey of 13,112 teachers and leaders, including 1393 secondary leaders. This study
reported high levels of satisfaction,
“Around 90% of school leaders are satisfied or very satisfied with their job.
The greatest levels of satisfaction were in relation to working relationships
with colleagues and parents, and influencing student learning and
development. The only aspect in which more than half were dissatisfied was
the balance between work and private life” (p. xviii).
46
The researchers provided a list of 16 statements thought to represent aspects of the
principal role (p. 148). Respondents were asked to indicate how satisfied or dissatisfied
they felt with each aspect.
For some years the department of education has required each school to conduct staff,
parent and student opinion surveys as part of the accountability requirements. The staff
survey purports to gather data on the factors including, staff well-being, school climate,
student behaviour, teaching and learning. Completion of these surveys is not
compulsory. The results are provided to each school and considered to be confidential
and were not available for this research project.
http://www.eduweb.vic.gov.au/edulibrary/public/account/operate/guidetostaffsurvey.pdf
accessed 11 January 2011. Recent research (Sturmfels, 2009) has questioned the
validity of these surveys.
In 2004, a report commissioned by the state government was published (Muller &
Saulwick, 2004). This study used a mixed methods approach and study focused on the
well-being of principals and assistant principals. It reported separately on the assistant
principal data.
One of the research methods in the overall strategy was focus groups with assistant
principals in secondary schools.
A reading of focus group comments (Muller & Saulwick, 2004, pp. 54-61 Appendix 2 -
Focus Groups) leaves this reader with the impression that secondary school assistant
principals: Feel their jobs are very worthwhile, feel very over-stretched, work under
great strain, work many hours over time each day and the weekends and holidays, feel
overwhelmed by the accountability requirements of the department, feel unsupported by
the department, feel stressed, feel the job has a negative impact on their family lives,
and feel the job impacts negatively on their health.
From the quantitative data, there were strong similarities when comparing the data from
principals and assistant principals. The following observations can be made when
examining the detailed data on assistant principal responses. It should be noted that,
unlike the qualitative data which reported on secondary school assistant principals
47
separately, the quantitative data aggregates assistant principal responses from primary,
secondary and special schools together. However, where there were major differences
between sectors, the authors appear to have reported them in their comments. It is
therefore assumed that where there were no comments reported to the contrary, assistant
principal responses are similar across all sectors. (Muller & Saulwick, 2004, pp. 52 -
101 Appendix 3: Full Survey Results) Assistant principals enjoy making a difference to
the lives of student (p. 54), they get great satisfaction from their work (p. 54), they
commit heavily to their work and for most this is a strong influence on their lives.
Assistant principals want to get things right (p. 54). They do not like what is seen as an
unnecessary administrative work (p. 54). The demands of the job lead to fatigue and
creates problems achieving a satisfactory work life balance and can impact negatively
on personal relationships (p. 55).
Over a third of assistant principals had a diagnosed health problem related to work,
compared with principals of nearly 50 percent who have these problems. The conditions
include headaches, digestive, cardiovascular and nervous conditions (pp. 58-59).
Assistant principals rate their job as stressful at a similar level to principals and for most
the stress levels are getting worse (pp. 62-63). Assistant principals prefer to lead but are
mostly seen as managers, which is interestingly similar to principals (p. 65). They
believe “…they spend too much time on student management and accountability…”,
too little time on “…planning, community liaison and leadership…” but sufficient time
is spent on “…staff management and accountability…”. Some of the reasons for the
tasks taking longer than desired is a lack of skills to do the tasks. Areas for additional
training, gathered under categories, are “…organisational and time management skills…
dealing with difficult people and situations, and with underperforming staff…[u]nder
the heading of ‘general management’ the biggest call by far is for accountancy and
financial management skills…[and] conflict resolution skills.” The needs expressed by
principals in the study are reported to be similar (Muller & Saulwick, 2004, pp. 66-72).
The majority of assistant principals regard themselves as being able to delegate and
prioritise their work and they self-report being effective at sharing information with the
school council and staff (pp. 71 – 75).
48
Similarly to principals, assistant principals wanted the department to; “Provide
additional welfare personnel, Provide PD/ mentoring for principals, Increase staff, give
schools more responsibility for staffing, reduce paperwork, clarify the role of school
council.” (p. 76).
Fewer assistant principals (32%) support devolution (site-based management) compared
with principals (60%). However, where the principals and assistant principals have been
in post for more than 10 years, and therefore would have experienced the centralised
system, two thirds of assistant principals prefer devolution compared with 90% of
principals (p. 77). From their point of view, the Global Budget would be adequate if the
department did not make additional demands (pp. 78 – 79).
The researchers report from the quantitative and qualitative data, from principals and
assistant principals, the following departmental action that would reduce workloads:
“Consolidate/reduce documents, increase ancillary staff, take account of individual
school characteristics, enhance data-recording, recognise the demands it makes on
school time and funds, recognise value-added in performance standards, additional PD
on our report-writing and data interpretation.” (pp. 84 – 85, 35 - 6) Items that would
provide more support were: “Provide more staff, Improve funding, Be in touch with
what is happening in schools, Provide welfare officers, Reduce paperwork, Give
recognition, Improve two-way communication.” (p. 87). As noted by the researchers,
only some of these items involve more funding.
Lacey’s (2002a) research used Herberg’s two-factor motivation model. Herzberg
developed his theory in analysing the responses on 200 engineers and accountants who
were asked when they felt best the most satisfaction at work and most dissatisfied. The
responses that produced satisfaction seemed to be about the work, and dissatisfaction
seemed to mostly come from the work environment seemed to be mostly seen as
sources of dissatisfaction. The former were labelled ‘motivators’ and the latter ‘hygiene’
factors. Herzberg proposed that successful attention to the ‘hygiene factors’ could
reduce dissatisfaction, but could not increase satisfaction. Effective attention to
‘motivator factors’ could improve satisfaction, but not reduce dissatisfaction (Herzberg,
Mausner, & Snyderman, 1959). The motivators or satisfiers are found in the work itself
49
and include achievement, recognition, work itself, responsibility and advancement.
Dissatisfiers are found in the work environment and include salary, possibility of
growth, interpersonal relations with subordinates, status, interpersonal relations with
supervisors, interpersonal relations with peers, supervision-technical, company policy
and administration, working conditions, personal life and job security. Studies in
education seem to confirm the existence of two factors in job satisfaction, motivators
and hygiene factors. Sergiovanni (1967) sought to test Herzberg’s model with teachers.
His study confirmed Herzberg’s two factor theory of ‘intrinsic’ and ‘extrinsic’
motivators on separate continuums. He also confirmed that the satisfaction of work for
teachers, like other workers, relate to the work itself and dissatisfaction tends to be
related to the broader conditions of work.
Measurementofjobsatisfactionineducation
In a review that covers the measurement of job satisfaction Locke (1976, p. 1334 ff)
provides evidence of several methods being used, namely rating scales, observation of
behaviour gaining an indication of what subjects in a study would tend to do,
interviews, focusing on critical incidents and what he calls logical validity, where any
inconsistencies with subjects’ responses are explored and the meaning of and clarifying
these. Locke suggests a valid approach would integrate all sources of evidence.
The most common approach to measuring job satisfaction is by the use of
questionnaires (Rafferty & Griffin, 2009). As indicated earlier, Locke (1976) argued for
a range of approaches to measuring job satisfaction. Approaches to measurement are
based on a theoretical position. In their review of job satisfaction in organisational
research Rafferty and Griffin (2009) identify the Job Descriptive Index (JDI), the
Minnesota Satisfaction Questionnaire (MSQ), the Michigan Organizational Assessment
Questionnaire, and Brayford and Rothe’s Overall Job Satisfaction measure. The first
two are reported to have good reliability, with the latter two having adequate reliability
(Rafferty & Griffin, 2009, p. 204). The MSQ has a short form of 20 items, the Michigan
Organizational Assessment Questionnaire has three items related to job satisfaction the
Overall Job Satisfaction has 18 items with a six item short version (Rafferty & Griffin,
2009, p. 204) Studies reviewed since 2000 showed that of these instruments, the MSQ
50
was the least used, the JDI the second least used. In the review 40 different measures,
with many custom made for the particular study, were used in 84 studies (Rafferty &
Griffin, 2009, p. 205).
Despite some concerns, the MSQ has been used in education studies. Dorminy and
Brown (1982) used the MSQ short form in a study of assistant principal job satisfaction
in the state of Georgia, USA. The aim of their study was to see what leadership
behaviours in principals led to higher levels of satisfaction in assistant principals. Of all
the behaviours measured, it was the considerate behaviour by their school principals
that seemed to lead to higher levels of job satisfaction in assistant principals.
Biographical variables of the assistant principals, school size, and years in the job were
not significantly correlated to job satisfaction.
Chen, Blendinger and McGrath (2000) used the MSQ short form in a study of the job
satisfaction of high school assistant principals in Georgia, USA. Almost half of the 245
in the sample returned the survey. The findings were that there was a mild but not
statistically significant tendency for job satisfaction to be higher in longer serving
assistant principals than those in the job for a shorter time. The results of this study
showed no statistically significant relationship between school size and job satisfaction.
The findings also revealed a high level of job satisfaction,
“over 75% of the respondents rated 17 of the 20 statements on the MSQ as
either ‘satisfied’ or ‘very satisfied’. Only three items received a lower
response. The only statement that received less than 50% positive rating was
the one addressing salary and amount of work expected” (p. 4).
General, Intrinsic and Extrinsic satisfaction were all high, with the latter slightly less
positive.
The MSQ short form has been used in a study of assistant principals in Florida (Taylor,
2007). This study involved 128 assistant principal participants (60% response rate to
invitations) from seven counties in Florida USA. This study achieved an Alpha
reliability of .91 for general satisfaction items, .85 for the intrinsic satisfaction sub scale
and .78 for the extrinsic satisfaction items. Taylor found that three quarters of assistant
51
principals experienced positive levels of satisfaction with a mean general satisfaction
rating of 3.85 (on a scale from 1.0 to 5.0). Compensation was the only area where the
majority of respondents were not satisfied. The mean score for Intrinsic satisfaction
subscale items was 3.9 (on a scale from 1 to 5) (p. 105). The only item not receiving a
majority of satisfied responses was “The chance to tell people what to do”, where
42.19% of responses were “Neither” (p. 107). The mean rating for extrinsic satisfaction
subscale items was 3.75 (on a scale from 1 to 5). There was no statistical relationship
between general, intrinsic or extrinsic satisfaction on the one hand, with any of school
size, tenure, age or gender (p. 133). A significant positive correlation was found
between schools grade (a measure of the school’s test scores) and both general
satisfaction and intrinsic satisfaction (p. 133).
Funderberg and Kapes (1997) compared the job satisfaction of business educators in
secondary schools and community/technical college in Arkansas. They used the MSQ
short form to measure satisfaction achieving an Alpha reliability of 0.88 for the general
satisfaction scale. Their study recommended policy makers pay more attention to
extrinsic facets such as pay and working conditions in order to improve retention of
educators.
Armstrong (2004) also undertook an investigation of the job satisfaction of assistant
principals in Texas using the MSQ (short form). This study focussed on the duties of
assistant principals and their general job satisfaction as measured by the MSQ. One
hundred and twenty three participants (41% response rate) scored a mean of 3.78 on the
general scale, meaning they were satisfied with their jobs. The study noted the shifts in
duties of assistant principals in the context of devolution to site-based management.
Armstrong recommended: further study of assistant principal job satisfaction and duties;
that assistant principals should have a variety of task opportunities within the role; that
rotation of roles for assistant principals may better prepare them for the principalship;
research on the job satisfaction of assistant principals should include qualitative
techniques allowing for more data close to the work to be generated.
Sutter (1996; 1994) used the MSQ as a measure of job satisfaction, but did not make
clear if he used short form or long form (Only a brief article about Sutter’s work has
52
been located. It has not been possible to locate Sutter’s thesis online. An initiative to
contact him sadly revealed he passed away in late 2011). He also used the Hoppock Job
Satisfaction measure and Super and Thompson’s Adult Career Concerns Inventory as
well as demographic data for 335 male and 81 female secondary school assistant
principals from Ohio (M. Sutter, 1996), .01 significance level selected for reporting.
Positive correlations were noted between job satisfaction and: Feelings of
accomplishment; belief about opportunities for advancement; feeling that talent was
being used well; aspiration to become a principal, that is those who aspired to the
principalship had a higher level of measured satisfaction than those who wanted to stay
in the assistant principal role. Positive correlations were noted between career
satisfaction and: belief that there would be opportunities for advancement within their
current school system; belief that they were accomplishing a great deal; gender with
females reported higher levels than men; positive views of school district policies.
The MSQ (short form) was also used by Waskiewicz (1999) in a study that investigated
the variable that contributed to the job satisfaction of 291 secondary assistant principals
in Virginia USA. General satisfaction scale mean was 3.86 (on a 5 point scale where 4=
‘agree’), with means of 4.02 for the items on the intrinsic job satisfaction subscale and
3.48 for the extrinsic job satisfaction subscale. Sixty percent of the responses to intrinsic
sub scale items were marked satisfied or very satisfied compared with 47% for the
general satisfaction scale and 38.1% for the extrinsic sub scale items (p. 78). Therefore
intrinsic satisfaction was rated higher than extrinsic satisfaction by these participants.
Of interest is that the general scale and both subscales were significantly correlated with
a measure of life satisfaction (p. 81).
Stemple (2004) used the MSQ long form in his study of the job satisfaction of principals
in Virginia. While his use of the MSQ (Long Form) revealed some interesting results
some participants believed that it was too long to complete, that the questions were
repetitive and, on its own, did not get the heart of some areas of dissatisfaction
experienced by principals (pp. 50-51).
From this brief review, it seems that the MSQ was commonly used in studies of
assistant principals designed with job satisfaction as a key variable.
53
A systematic review of instruments measuring job satisfaction (van Saane, Sluiter,
Verbeek, & Frings-Dresen, 2003) compared the validity and reliability of twenty-nine
instruments, including the MSQ. The MSQ was reported to have acceptable reliability
(.81) but no data regarding validity was confirmed and the MSQ was not included in the
list of seven instruments that met the reviewers’ criteria. However, Weiss et al. claim
construct and concurrent validity of the short and long version drawing on a range of
studies (Weiss, Dawis, England, & Lofquist, 1967, p. 16 ff) was not reported by van
Saane et. al. (2003).
Hirschfield (2000) was prompted to study the validity of the MSQ (short form) based on
criticism that Weiss was implying the validity of the short form of the MSQ based on
studies using the long form of the questionnaire. The Hirschfeld study confirmed the
validity of the intrinsic and extrinsic subscales.
Considering that the field of job satisfaction is complex and in a period of development
and, given the intent and also the practical considerations of the current research project,
it was decided to use the MSQ short form as the measure of job satisfaction. It has been
well established, it has acceptable validity and reliability, and it is economical in time
and is relatively easy to use. Another characteristic was that it was straight forward to
modify for the purpose of seeking information on assistant principal participants’
perceptions of the job satisfaction of principals. Also in its favour was the cooperation
of the publishers to allow the modification of the instrument for this study. A drawback
for its use was the lack of a norm group for assistant principals. Given that the MSQ,
especially the short form version has been used in several studies of assistant principals,
beyond this current study there may be value in comparing the results across studies.
Successionplanning
Theneedforsuccessionplanning
Lacey (Lacey, 2002a, 2002b) reported a lack of succession planning and recommended
the establishment of succession planning within education in the state. As one of several
key early authors in the field (e.g. Rothwell, 2000, 2001, 2007, 2008; Rothwell et al.,
2005; Rothwell & Kazanas, 1993, 1999, 2004) albeit from a business perspective,
54
Rothwell (2001) describes the context in which succession planning has emerged in
business as being a worldwide crisis of organisations struggling to meet the
expectations of constituents, the diminished loyalty of employees following downsizing
practices and the demographics of an aging workforce. He alerted to the high retirement
rates of older senior executives and the loss of knowledge and skill that will result. This,
he argues is a reason to focus on succession planning. He also referred to a past reliance
on seniority as a mechanism for filling vacancies as they arise.
In the 2001 second edition of his book, “Effective Succession Planning: Ensuring
Leadership Continuity and Building Talent from Within” William Rothwell, an
academic with a business background paints a picture of a “…crisis of leadership’ cites
his own previous work about a ‘chronic crisis of governance – that is, the pervasive
incapacity of organizations to cope with the expectations of their constituents- is now an
overwhelming factor worldwide.” (2001 pxvii) He tells of a current scenario created by
the downsizing of the 1990’s, introduction of employment contracts meaning that
“Employee loyalty is a relic of the past…” (p. xvii). He also cites the changing
demographics where many organisations will lose a large percentage of their leadership
in the coming years, and the impact that will have combined with the downsizing will
have.
“Amid the twofold pressures of pending retirements to senior executive ranks and the
increasing value of intellectual capital and knowledge management, it is more necessary
than ever before for organizations to plan for leadership continuity and employee
advancement at all levels.” (Rothwell, 2001, p. xvii). Rothwell argues that this longer
term view is not common, because in the past labour was plentiful and organisations
could over-staff as a way of having sufficient people to take up vacancies, and that
seniority was often the criteria that placed people in promotion positions.
Writers in the education field also documented reasons for a possible impending
shortage of suitable leaders. For example Fink and Brayman (2006) write of the
disenchantment of high stakes accountability and the impending very high numbers of
retirements due to the age profile of principals are key reasons to enact succession
55
planning. The reasons for a shortage of school leaders are discussed in detail elsewhere
in this chapter.
Whatissuccessionplanning?
Some of the earlier writing discussed succession as the socialisation process that occurs
once a new incumbent takes over a leadership role (e.g. Hart, 1993). However, others
take a more comprehensive view. Also from education, Fink (2008) cites the U.S.
National Academy of Public Administration as defining succession management as “...a
deliberate and systematic effort to project leadership requirements, identify a pool of
high potential candidates, develop leadership competencies in those candidates through
intentional learning experiences, and then select leaders from among the pool of
potential leaders.” Fink goes on to say, “In simple terms, succession management
connects the identification, recruitment, preparation, selection, induction and ongoing
support of leaders throughout their careers.” (p. 12).
Rothwell (2001) argues that succession must have a planning and management aspect
and needs to be a forward-looking active process, not reacting as circumstances occur.
He says “… organizations must take proactive steps to plan for future talent needs at all
levels and implement programs designed to ensure the right people are available for the
right jobs in the right places and at the right times to meet organizational requirements.”
(Rothwell, 2001, pp. xix-xx).
Wolfe (1996) defines succession planning as “A defined program that an organization
systematizes continuity for all key positions by developing activities that will build
personnel talent from within” (p. 4). This definition emphasises the importance of the
program being organised and the focus on developing an organisations own people.
Wolfe emphasises that such a process is not just for senior management positions, she
believes it should apply to all positions.
“A[n] [Succession Planning and Management Program] is thus a deliberate and
systematic effort by an organization to ensure leadership continuity in key positions,
retain and develop intellectual and knowledge capital for the future, and encourage
individual advancement.” (p. 6)
56
Rothwell (2001) separates succession planning, from succession management (p. 6) but
believes the two should be paired. He defines succession planning and management “…
any effort designed to ensure the continued effective performance of an organization,
division, department of work group by making provision for the development,
replacement and strategic application of key people over time.” (p. 6). This definition
adds acknowledgment of the purpose of succession planning, namely to maintain the
effectiveness of an organisation. It also emphasises the development of people and
implies it is about growing internal people. It is in his definition of the succession
planning and management program that Rothwell emphasises the planned nature of the
approach. He defines the succession planning and management program as “… a
deliberate and systematic effort by an organization to ensure leadership continuity in
key positions, retain and develop intellectual and knowledge capital for the future, and
encourage individual advancement.” (Rothwell, 2001, p. 6 & 29)
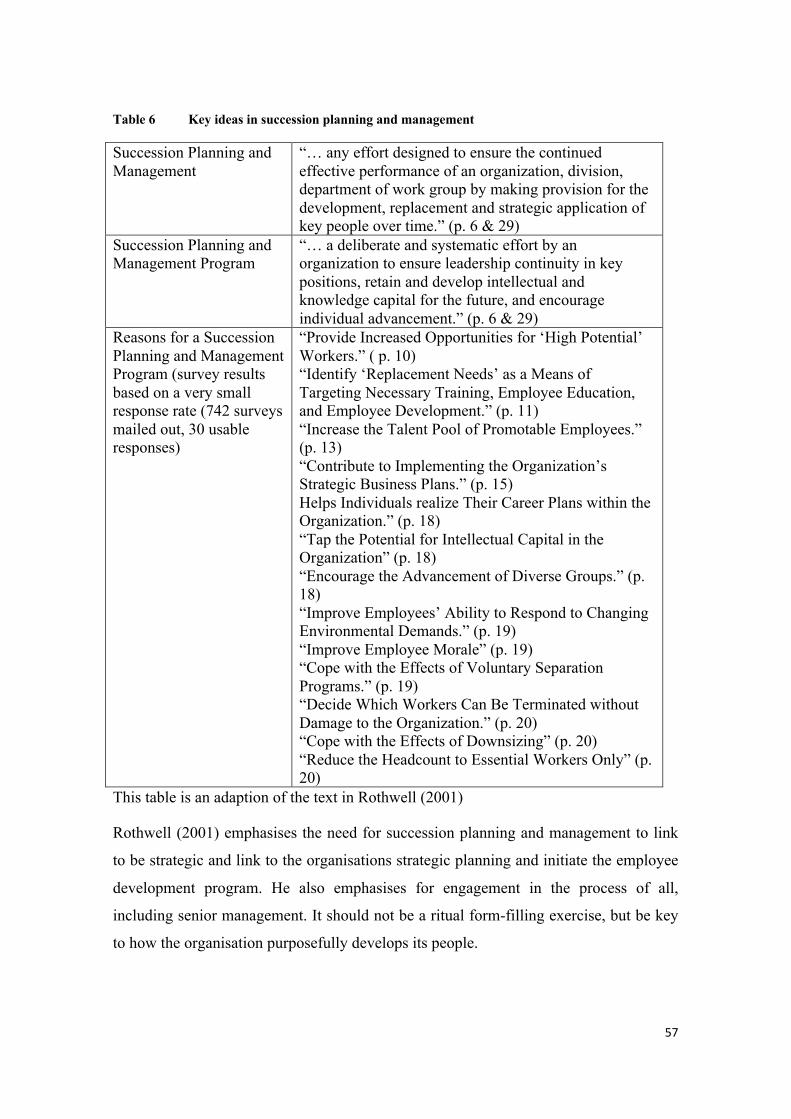
57
Table 6 Key ideas in succession planning and management
Succession Planning and Management
“… any effort designed to ensure the continued effective performance of an organization, division, department of work group by making provision for the development, replacement and strategic application of key people over time.” (p. 6 & 29)
Succession Planning and Management Program
“… a deliberate and systematic effort by an organization to ensure leadership continuity in key positions, retain and develop intellectual and knowledge capital for the future, and encourage individual advancement.” (p. 6 & 29)
Reasons for a Succession Planning and Management Program (survey results based on a very small response rate (742 surveys mailed out, 30 usable responses)
“Provide Increased Opportunities for ‘High Potential’ Workers.” ( p. 10) “Identify ‘Replacement Needs’ as a Means of Targeting Necessary Training, Employee Education, and Employee Development.” (p. 11) “Increase the Talent Pool of Promotable Employees.” (p. 13) “Contribute to Implementing the Organization’s Strategic Business Plans.” (p. 15) Helps Individuals realize Their Career Plans within the Organization.” (p. 18) “Tap the Potential for Intellectual Capital in the Organization” (p. 18) “Encourage the Advancement of Diverse Groups.” (p. 18) “Improve Employees’ Ability to Respond to Changing Environmental Demands.” (p. 19) “Improve Employee Morale” (p. 19) “Cope with the Effects of Voluntary Separation Programs.” (p. 19) “Decide Which Workers Can Be Terminated without Damage to the Organization.” (p. 20) “Cope with the Effects of Downsizing” (p. 20) “Reduce the Headcount to Essential Workers Only” (p. 20)
This table is an adaption of the text in Rothwell (2001)
Rothwell (2001) emphasises the need for succession planning and management to link
to be strategic and link to the organisations strategic planning and initiate the employee
development program. He also emphasises for engagement in the process of all,
including senior management. It should not be a ritual form-filling exercise, but be key
to how the organisation purposefully develops its people.
58
Conclusion
This chapter commenced by reviewing international and Australian literature related to
the shortage of suitable candidates for the principalship. It reported the reasons for a
perceived declining interest and what circumstances might increase interest. Incumbents
in the assistant principal role are seen as prime potential candidates for the
principalship, justifying a focus of research on the role, career and development of
assistant principals.
The effective development of assistant principals begs the question about what quality
professional learning and development is. The literature reviewed indicated that
effective professional development will show impact and that it is possible to identify
the training components necessary to maximise the impact of professional learning.
Some international and Australian studies and inquiries have produced ideas about the
organisation and management of effective professional development for school
leadership and other roles with some clear but not fully tested principles emerging.
Included in the argument is the almost unanimous view of the high value of on-the-job
training.
Emerging from earlier research, the link between job satisfaction of principals and the
attractiveness of the position was reported this prompted consideration of the concept of
job satisfaction, and how it might be measured to test this earlier research findings.
59
The optimal movement of people into leadership roles in organisations is generally
referred to as succession planning and management, a concept which is defined and
briefly described in this chapter.
Having reviewed the key literature related to each of the research questions, this formed
the background to decide on a methodology to investigate the questions, including the
research strategy, acknowledging limitations, setting delimits, acknowledging
assumptions, choosing and describing the instruments to be used, planning the analysis
and consideration of validity and reliability. All these matters are reported in the next
chapter which is focussed on methodology.
60
ChapterFourMethodology
Introduction
The purpose of this chapter is to outline the mixed method, cross sectional methodology
chosen, provide justification for the methods chosen and to acknowledge the limits and
delimits of the study. Each data gathering instrument used is explained and attention is
paid to the validity and reliability of the quantitative data gathering. The method of
gathering and analysing the qualitative data is also described. The process for gaining
project approval is outlined, including Ethics approval, permission to approach schools,
permission to approach assistant principals and gaining assistant principal's consent.
The population frame and response rates are reported.
Definition of mixed methods research
This study has taken a mixed method, cross sectional approach to investigation.
Creswell, a leading scholar in research methodology, explains this approach as follows;
“Mixed methods research is an approach to inquiry that combines or
associates both qualitative and quantitative forms. It involves philosophical
assumptions, the use of qualitative and quantitative approaches, and the
mixing of both approaches in a study. This it is more than collecting and
analysing both kinds of data; it also involves the use of both approaches in
tandem so that the overall strength of a study is greater than either
qualitative or quantitative research” (Creswell, 2009, pp. 24-25).
Why choose a mixed methods design?
After reviewing the relevant literature (see chapter 3) and the contributions that both
quantitative and qualitative data can make to understanding, when used separately and
in combination, it was concluded that using the mixed methods approaches was likely to
produce three types of knowledge in relation to the research problem and research
61
questions. Firstly, the deductive/quantitative approach would show the extent to which
participants’ experiences align with the current knowledge. For example, this group of
participants may endorse some of the known reasons for not applying for the
principalship and not endorse other reasons. What if there are reasons that are yet to be
identified? An inductive/qualitative approach will provide the opportunity to identify
new issues put forward by participants. Further mixed methods, where used, provide the
opportunity to triangulate the study making it more robust (Creswell, 2009, p. 4).
The potential benefits of a mixed methods approach to these research questions are
several. A quantitative approach will, especially using existing instruments previously
applied to other settings, provide an opportunity to measure participants’ responses
against recent thinking about the question. Further, it would enable the direct
comparison of the results from one location to another. This is a so-called deductive
approach, where theory generates hypotheses, then data collection, then findings
confirm or reject the hypothesis answer and then revise the theory (Bryman, 2008, p.
10).
A qualitative approach is most likely to generate data that might find new matters that
will generate new theory (Bryman, 2008, p. 11).
It is unlikely that the taking of just a quantitative approach or only a qualitative
approach would provide the best possible understanding of the research questions of
this study. We seek, to some extent, to understand both the ‘what’ and ‘why’ of these
questions.
“A mixed methods design is useful when either the quantitative or qualitative approach
by itself is inadequate to best understand the research problem or the strengths of both
quantitative and qualitative research can provide the best understanding.” (Creswell,
2009, p. 18)
Creswell points out that one’s own experience can influence the method chosen for a
study (2009, p. 19). This researcher has a preference for the mixed methods approach.
Having been a school principal for many years he has tended always to want to dig
beyond the data counts and to know why a particular pattern is showing in numerical
62
data. The view taken is that many educators are similar in that they may have more trust
in survey data and interview data combined than they have in just one form of data.
The research may appeal to a larger audience and perhaps have greater influence by
appealing to those who prefer one approach or the other and those who also prefer a
combined approach.
A cross sectional approach was taken for this study. Cross sectional research is defined
as that which collects data at one point in time (Creswell, 2008, p. 389). A strong case
can be mounted that a longitudinal approach to studying the career development of
assistant principals would yield results of tremendous value. This is agreed. Even in the
short time since the data was gathered for this research to one year later, interesting
career moves occurred for participants and not always consistent with their stated career
intentions. A longitudinal study is recommended in further research, but was not
possible given time limitations of this study and the brief data collection phase. Within
the cross sectional category of study of survey research, this study seeks responses on
the attitudes and practices of participants. In a sense this data will highlight community
needs and also provide an evaluation of existing practices, but these are not the focus.
(Creswell, 2009, p. 390).
This author’s own professional experience has led to the view that reports can be more
informative and persuasive if containing both data forms. An earlier study in the field
by Lacey (2009) employed mixed methods to good effect and appears to have had a
strong influence on the Department of Education’s leadership program development.
This author’s own world view is closer to the ‘pragmatic’ perspective, wanting to
contribute to thinking on this real-world issue in ways that will both assess the situation
in a particular location and also perhaps also contribute new knowledge in some way, or
at least point to possible new knowledge that may or may not be generalisable. Each
major view (post positivist, social constructivist, advocacy and participatory and
pragmatic) (Creswell, 2009, p. 11) have contributions to make. Hardy and Bryman
(2009) point out the ‘schism’ seen to exist by some between qualitative and quantitative
approaches. While acknowledging the differences in quantitative and qualitative
63
approaches they point out the value of different perspectives (p. 1) and indeed the
commonalities of both approaches, namely,
“Both are concerned with data reduction … answering research questions …
relating data analysis to the research literature … Both treat frequency as a
springboard for analysis …seek to ensure that deliberate distortion does not
occur … argue the importance of transparency … must address the question
of error…” (p. 1)
Also on the qualitative/ quantitative debate, Miles and Huberman (1994) assert “But at
the bottom, we have to face the fact that numbers and words are both needed if we are
to understand the world.” (p. 40). They go on to say,
“We believe that the quantitative-qualitative argument is essentially
unproductive … The question … is not whether the two sets of data and
associated methods can be linked during study design, but whether it should
be done, how it will be done, and for what purposes” (p. 41).
There are an increasing number of books on mixed methods design that demonstrate the
effectiveness of using both quantitative and qualitative methods together in the one
study (e.g. Bryman, 2006; Bryman, 2008; Caracelli & Greene, 1997; Creswell, 2008,
2009; Creswell & Plano Clark, 2007; DeCuir-Gunby, 2008; Plano Clark & Creswell,
2008; Powell, Mihalas, Onwuegbuzie, Suldo, & Daley, 2008). There are some issues
yet to be resolved, such as sample size (Creswell & Plano Clark, 2007) however there
are numerous research projects that use mixed methods that seem to be very useful.
The position taken for this study is that a mixed methods approach is the best way to
find out how a local cohort of assistant principals compares with variables that are
known, and to identify what might be new about this group. The cross sectional design
is one of convenience so that the project can fit into a practical timeframe.
The use of both quantitative and qualitative approaches, in combination, has the
potential to offer more than if just one approach was taken.
64
Research Strategies
The research strategies chosen for the study are a survey research approach, and both a
sequential and concurrent mixed methods approach.
As explained by Creswell, (2009) “Sequential mixed methods procedures are those in
which the researcher seeks to elaborate on or expand one method with another.” (p. 14).
Further Creswell explains,
“Concurrent mixed methods procedures are those in which the researcher
converges or merges quantitative and qualitative data in order to provide a
comprehensive analysis of the research problem. In this design, the
investigator collects both forms of data at the same time and then integrates
the information in the interpretation of the overall results…” (Creswell,
2009, p. 14).
Table 7 below summarises the approach taken for each research question. For
descriptive data, a quantitative method (survey) was used. For the question “What are
the leadership aspirations and career intentions of assistant principals in government
secondary schools?”, both quantitative and qualitative data were collected. For the
questions, “What development opportunities do they engage in? How effective are they
and what impact do they have?” quantitative data was gathered via both survey
questionnaire and interview. For the question “What is their own job satisfaction and
how do they rate the job satisfaction of principals in general?” quantitative data was
gathered. For the question “How do they rate their own preparedness for the
principalship?” both quantitative and qualitative data was gathered. For the research
question “How strategic is the school-based planning for leadership succession?” both
quantitative and qualitative data was gathered. For the research question “What would
need to change to increase their interest in the principalship?” qualitative data only was
gathered.
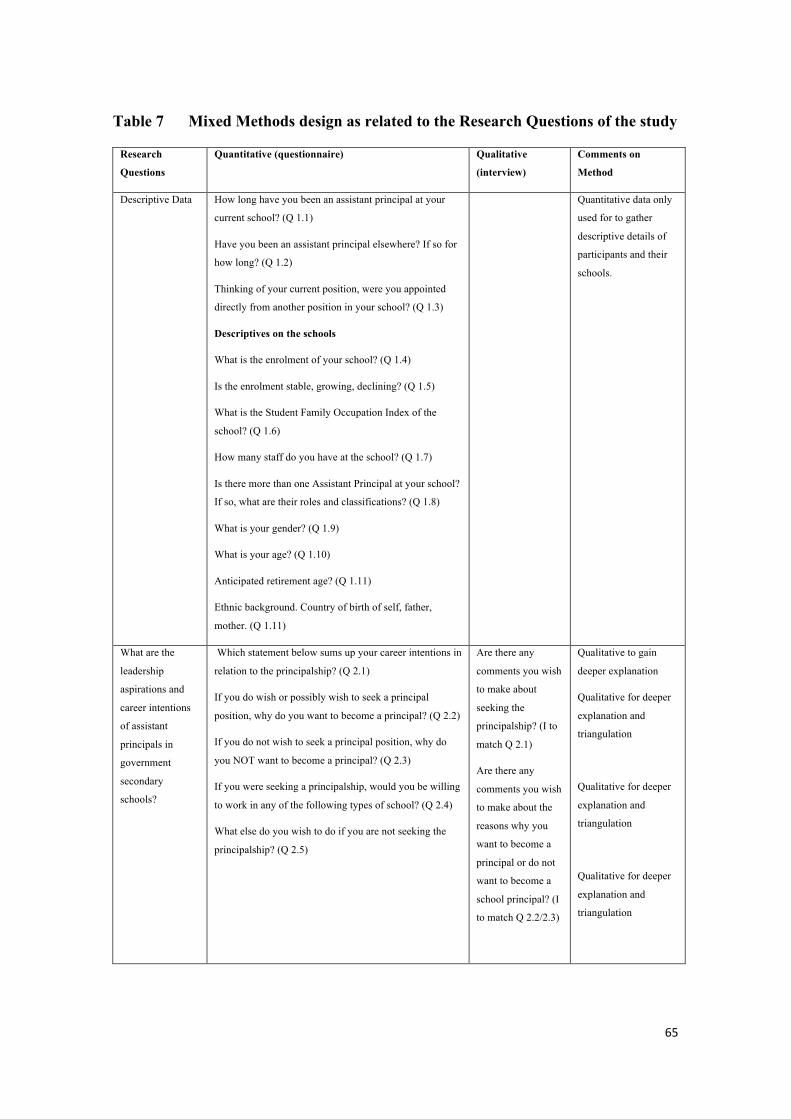
65
Table 7 Mixed Methods design as related to the Research Questions of the study
Research
Questions
Quantitative (questionnaire) Qualitative
(interview)
Comments on
Method
Descriptive Data How long have you been an assistant principal at your
current school? (Q 1.1)
Have you been an assistant principal elsewhere? If so for
how long? (Q 1.2)
Thinking of your current position, were you appointed
directly from another position in your school? (Q 1.3)
Descriptives on the schools
What is the enrolment of your school? (Q 1.4)
Is the enrolment stable, growing, declining? (Q 1.5)
What is the Student Family Occupation Index of the
school? (Q 1.6)
How many staff do you have at the school? (Q 1.7)
Is there more than one Assistant Principal at your school?
If so, what are their roles and classifications? (Q 1.8)
What is your gender? (Q 1.9)
What is your age? (Q 1.10)
Anticipated retirement age? (Q 1.11)
Ethnic background. Country of birth of self, father,
mother. (Q 1.11)
Quantitative data only
used for to gather
descriptive details of
participants and their
schools.
What are the
leadership
aspirations and
career intentions
of assistant
principals in
government
secondary
schools?
Which statement below sums up your career intentions in
relation to the principalship? (Q 2.1)
If you do wish or possibly wish to seek a principal
position, why do you want to become a principal? (Q 2.2)
If you do not wish to seek a principal position, why do
you NOT want to become a principal? (Q 2.3)
If you were seeking a principalship, would you be willing
to work in any of the following types of school? (Q 2.4)
What else do you wish to do if you are not seeking the
principalship? (Q 2.5)
Are there any
comments you wish
to make about
seeking the
principalship? (I to
match Q 2.1)
Are there any
comments you wish
to make about the
reasons why you
want to become a
principal or do not
want to become a
school principal? (I
to match Q 2.2/2.3)
Qualitative to gain
deeper explanation
Qualitative for deeper
explanation and
triangulation
Qualitative for deeper
explanation and
triangulation
Qualitative for deeper
explanation and
triangulation
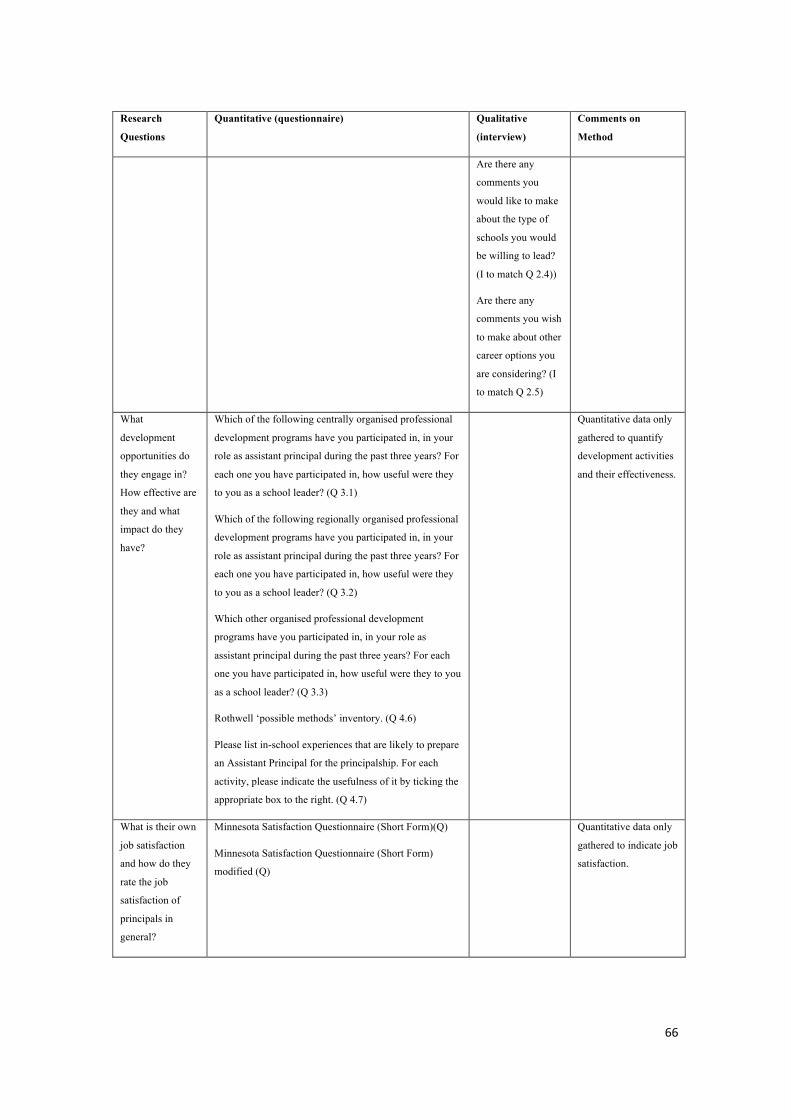
66
Research
Questions
Quantitative (questionnaire) Qualitative
(interview)
Comments on
Method
Are there any
comments you
would like to make
about the type of
schools you would
be willing to lead?
(I to match Q 2.4))
Are there any
comments you wish
to make about other
career options you
are considering? (I
to match Q 2.5)
What
development
opportunities do
they engage in?
How effective are
they and what
impact do they
have?
Which of the following centrally organised professional
development programs have you participated in, in your
role as assistant principal during the past three years? For
each one you have participated in, how useful were they
to you as a school leader? (Q 3.1)
Which of the following regionally organised professional
development programs have you participated in, in your
role as assistant principal during the past three years? For
each one you have participated in, how useful were they
to you as a school leader? (Q 3.2)
Which other organised professional development
programs have you participated in, in your role as
assistant principal during the past three years? For each
one you have participated in, how useful were they to you
as a school leader? (Q 3.3)
Rothwell ‘possible methods’ inventory. (Q 4.6)
Please list in-school experiences that are likely to prepare
an Assistant Principal for the principalship. For each
activity, please indicate the usefulness of it by ticking the
appropriate box to the right. (Q 4.7)
Quantitative data only
gathered to quantify
development activities
and their effectiveness.
What is their own
job satisfaction
and how do they
rate the job
satisfaction of
principals in
general?
Minnesota Satisfaction Questionnaire (Short Form)(Q)
Minnesota Satisfaction Questionnaire (Short Form)
modified (Q)
Quantitative data only
gathered to indicate job
satisfaction.
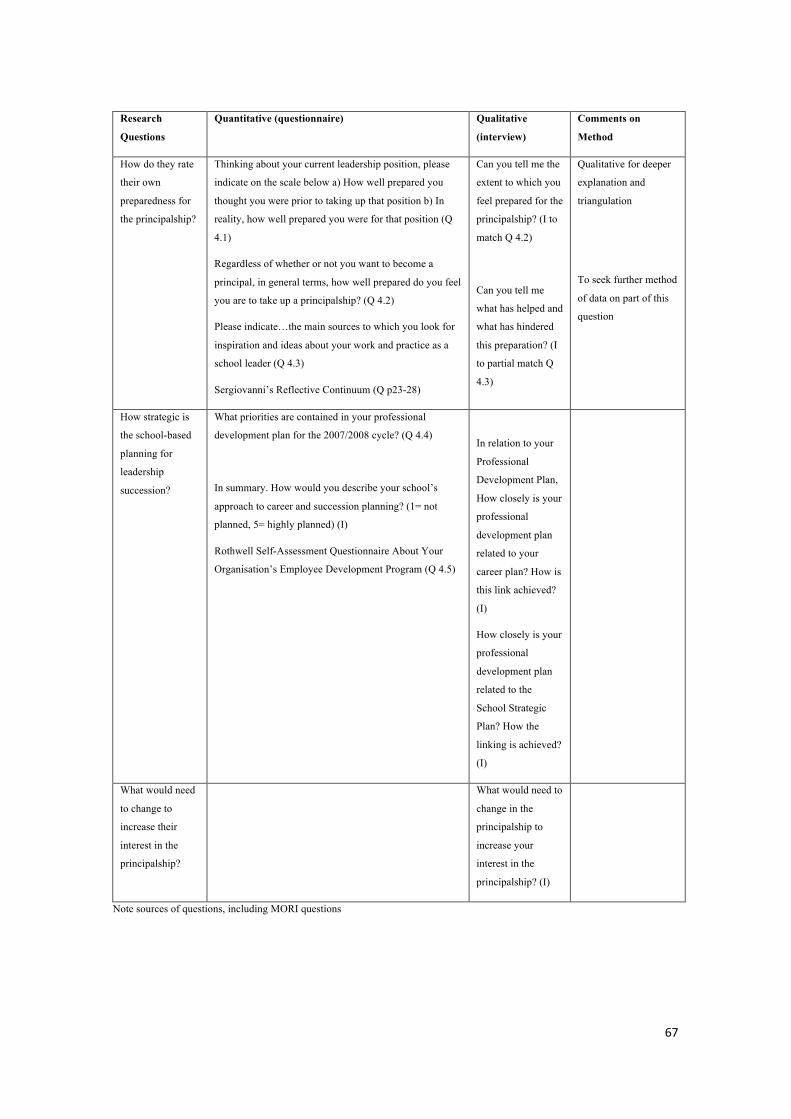
67
Research
Questions
Quantitative (questionnaire) Qualitative
(interview)
Comments on
Method
How do they rate
their own
preparedness for
the principalship?
Thinking about your current leadership position, please
indicate on the scale below a) How well prepared you
thought you were prior to taking up that position b) In
reality, how well prepared you were for that position (Q
4.1)
Regardless of whether or not you want to become a
principal, in general terms, how well prepared do you feel
you are to take up a principalship? (Q 4.2)
Please indicate…the main sources to which you look for
inspiration and ideas about your work and practice as a
school leader (Q 4.3)
Sergiovanni’s Reflective Continuum (Q p23-28)
Can you tell me the
extent to which you
feel prepared for the
principalship? (I to
match Q 4.2)
Can you tell me
what has helped and
what has hindered
this preparation? (I
to partial match Q
4.3)
Qualitative for deeper
explanation and
triangulation
To seek further method
of data on part of this
question
How strategic is
the school-based
planning for
leadership
succession?
What priorities are contained in your professional
development plan for the 2007/2008 cycle? (Q 4.4)
In summary. How would you describe your school’s
approach to career and succession planning? (1= not
planned, 5= highly planned) (I)
Rothwell Self-Assessment Questionnaire About Your
Organisation’s Employee Development Program (Q 4.5)
In relation to your
Professional
Development Plan,
How closely is your
professional
development plan
related to your
career plan? How is
this link achieved?
(I)
How closely is your
professional
development plan
related to the
School Strategic
Plan? How the
linking is achieved?
(I)
What would need
to change to
increase their
interest in the
principalship?
What would need to
change in the
principalship to
increase your
interest in the
principalship? (I)
Note sources of questions, including MORI questions
68
Challenges in using this design and how they were addressed
There are a number of broad challenges that were apparent in planning for a mixed
methods design, and those that have become more apparent as the research has been
undertaken. One of the major challenges in using a mixed methods design is the
researcher needs to know both approaches and then how to combine them to maximum
benefit. It has certainly been a challenge to learn both approaches to a sufficient level of
depth to make the research meaningful. Proficiency in the design of a survey, data
collection and analysis and reporting encompasses a series of highly developed skills.
Designing interviews, conducting them, then preparing and analysing, then reporting on
the data also requires an array of skills, some the same, some different and some
complementary to the survey approach. To then combine all this meaningfully requires
a further set of skills. This learning was well supported by workshop programs run
through the University of Melbourne’s School of Graduate Studies and the Melbourne
Graduate of Education Melbourne Education Research Institute. The availability of
software through the University was also helpful as was the project supervisor and the
statistical consultant at the Statistical Consulting Centre at the University. It did take
considerably more time to learn the techniques separately, learn the different software
(SPSS and NVIVO), understand and embrace the paradigm differences and similarities,
and then put it all into action. It has been a very time consuming but rewarding process,
having provided a context for richer, broader and deeper understanding of research and
also providing a richer research apprenticeship through this doctoral project.
The word limit of a professional doctorate is constraining, and reporting on mixed
methods does make the word limit more challenging to achieve.
“For the mixed methods researcher, the project will take extra time because of the need
to collect and analyse both qualitative and quantitative data.” (Creswell, 2009, p. 19) It
has been helpful that the relevant university authorities understand the additional work
that is required to undertake a mixed methods study and shown helpful flexibility.
There is a risk that a mixed methods approach will be asking too much of potential
participants and put them off participating. In this case the commitment was to complete
a questionnaire that would take about 30 minutes to complete, and then an interview.
69
The hope was that the potential participants would see the project as worthwhile enough
to invest that time. The response rate to this study attracted sufficient responses to make
the study worthwhile.
Deciding upon and achieving a sufficient number of participants were both challenges
in this mixed methods research. Working with a number of participants that would
produce usable results for the quantitative data, but allow sufficient resources to identify
at least key points from the qualitative data, was a key consideration in the design of the
study. In this study there was no sampling attempted. The goal was to invite all within
the population frame to participate.
Design of the mixed methods Study
Predominantly this study is a concurrent mixed methods design, that is to say the design
collects both quantitative and qualitative data at roughly the same time. There are some
questions for which only quantitative data was gathered, some for which only
qualitative data is gathered and some for which both qualitative and quantitative data is
gathered. In some instances the quantitative and qualitative data are compared in a
triangulation design.
Limitations of the Study
According to Lunenburg and Irby, “Limitations of a study are not under the control of
the researcher. Limitations are factors that may have an effect on the interpretation of
the findings or on the generalizability of the results.” (Lunenburg & Irby, 2008, p. 133)
Like all research that uses participant self-report, the accuracy of results depends on the
authenticity of responses from participants. It is hoped that the relevance of the research
aims and the undertaking of the researcher and supervisor to provide anonymity is
sufficient for participants to be frank and authentic with their responses.
The results may only generalisable to the whole geographic area to the extent that the
views expressed by the participants also represent the views of non-participants. Some
70
effort was made to compare the schools of participants and non-participants but little
data was available to the researcher to make this comparison.
It is hoped that the broad investigative approach being undertaken in this research is
widely generalisable to other regions and districts. With this particular field of
investigation, exploring issues such as career intentions, job satisfaction, career
development and succession planning, each location will need to find its own answers.
Data from one particular school or region may not apply to a different school or region,
and certainly national and international data may not apply, although the issues raised
by such research may apply but should be confirmed by local investigation.
Delimitsofthestudy
According to Lunenburg and Irby, "Delimitations are self-imposed boundaries set by
the researcher on the purpose and scope of the study.” (Lunenburg & Irby, 2008, p. 134)
This study depends on the authenticity and accuracy of responses from participants to
the questionnaire and interview questions. The researchers did not seek to verify any of
the responses either by third party evidence or confirmation of transcripts.
The research depends on the commitment of the participants to provide authentic and
complete responses.
The study intends to provide important data from a particular category of schools
(government secondary colleges) in a defined geographic location. The view is that one
must understand the problems of interest at the local level. There are dangers in making
assumptions that a small sample study in a different system or country apply beyond
that context. Therefore the particularities of the data reported for example, the levels of
job satisfaction among the participating assistant principals, may only be relevant to the
participants in this study and decision makers in this constituency at this time. What
may be generalisable to other regions is the value in investigating the local
circumstances relating to the research questions of this study.
71
The study is a cross sectional design, that is to say the data collected at one time
(Michelle Anderson et al., 2008 p. 122). There is an argument that leadership
development is something that develops over time (Gronn, 2003a). It will be
recommended that much would be gained by longitudinal studies in this field as such an
approach would add much to knowledge in relation to the research questions raised in
this study.
Assumptions
The methodology of the research makes some assumptions. First, it is assumed that the
participants have sufficient English language skills to participate in the questionnaire
and interview. It is also assumed that they have sufficient self-awareness and insight to
respond to the issues. It is further assumed that participants accept the terms of
confidentiality and provide sincere and honest responses. Further, it is assumed that
these responses reflect reality.
The Questionnaire
Most of the quantitative data was gathered by postal questionnaire (see attachment 1).
The questionnaire is divided into several sections: 1. Background (participant, school)
2. Your Career Intentions. 3.0 Professional Development 4. Preparedness 5. Minnesota
Satisfaction Questionnaire (for self, for perception of principals' satisfaction) The
questions had a variety of formats and response styles. The responses were tallied and
reported. Some inter-correlations were also undertaken, however, with such a small data
pool there were often not enough observations in cells to enable statistical tests to be
applied.
Purposeofthequestionnaire
The purpose of this questionnaire is aimed at producing knowledge about the career
aspirations and development of assistant principals in a defined geographical location. It
72
is intended that the responses from the sample will be generalisable to the population of
that geographical location. It may be that the results will be generalisable to populations
beyond the population as defined in this study, but this is not an intention.
In terms of generalisabilty, it is intended that the methodology may provoke other
geographic areas finding out about the career intentions and development of its own
assistant principals, and the implications for succession planning.
Reasonsforchoosingaquestionnaire
This survey took the form of a self-administered questionnaire. In the context of a cross
sectional design (Creswell, 2008, pp. 389 - 391), that is with data collection “… at one
point in time.” (p. 389). The questionnaire facilitated the collection of self-report data
on the attitudes and views of the participants, their behaviours in the recent past and
their intentions. A mailed questionnaire is a way of gathering the data sought in a
relatively efficient way. The participants can complete the items in their own time and
place. It does not require the researcher to travel to a range of locations.
InstrumentsUsed
This section of the chapter examines the instruments used in this study. Creswell (2008)
encourages researchers to look for existing instruments to use and modify, rather than
developing new instruments (p. 177). To this end a search was undertaken for literature
that reports on research addressing similar questions to the research questions in this
study. In this case, several existing instruments were available and met the needs of the
research. These instruments were:
Rothwell “Methods of Grooming Individuals for Advancement” (Rothwell, 2001)
Rothwell “Self-Assessment Questionnaire About Your Organization’s Employee
Development Program.” (Rothwell et al., 2005)
The Minnesota Satisfaction Questionnaire (Weiss et al., 1967)
The MORI study instrument (Stevens, Brown, Knibbs, & Smith, 2005)
73
Neidhart and Carlin (Neidhart & Carlin, 2003)
Lacey and Gronn (Lacey & Gronn, 2005)
The questionnaire for this study (see attachment 1) is an amalgam of each of these
instruments, or at least the relevant sections or items. Each of these instruments is
described in the following pages.
Rothwell “Methods of Grooming Individuals for Advancement”
In searching for an indicator of the degree to which participants’ schools were engaged
in effective development programs, the literature was reviewed for an existing
instrument that might provide that insight. The literature on schools did not reveal a
suitable instrument. In reviewing the wider literature further an instrument published by
Rothwell (2001) provided that means. The instrument, “Methods of Grooming
Individuals for Advancement” (pp. 232 -233) provided twelve categories of methods
organisations could use to develop staff members and a means by which respondents
could rate the effectiveness of each method. In his book, Rothwell provides advice
about each method with respect to how to use the strategy and when it is appropriate
and inappropriate to use each method. The categories of activities had face validity and
the methods for categorising responses were conventional and straightforward. No
statistical data is provided regarding the instrument, however Rothwell does provide the
results of its application to a small sample of 12 participants.
Rothwell “Self-Assessment Questionnaire About Your Organization’s Employee
Development Program.”
Rothwell et al. after making a case for the need for career and succession planning
invite readers to reflect on their organisation’s development program by using a further
instrument (Rothwell et al., 2005, pp. 5-6) namely the “Self-Assessment Questionnaire
About Your Organization’s Employee Development Program.” This instrument lists 15
components of an effective succession planning program. Participants are invited to
indicate if their organisation does each of these components by responding ‘Yes’, ‘No’,
74
or ‘Sometimes’. Rothwell has devised a scoring system that allows for a rating of the
organisation into one of three categories. This instrument has high face validity but no
statistical data is provided on validity or reliability (personal communication with
William Rothwell on November 5th, 2008).
The Minnesota Satisfaction Questionnaire
Lacey (2002a) argued that the aspirations of possible future principals are impacted
upon by their perceptions of the job satisfaction of current principals. One of the key
research questions for this research relates to the perception participants have of the job
satisfaction of principals. To explore this, a measure of job satisfaction was sought. To
find such an instrument, the psychological test suppliers in Australia were approached,
but had no inventory that would meet that need. A search for literature on the job
satisfaction of assistant principals revealed several studies (see literature review). These
studies used one of several established instruments for the measurement of job
satisfaction. Some studies developed bespoke instrumentation. Based on the advice of
Creswell (2008) it was again decided to see if an existing instrument would meet the
needs of this study. The Minnesota Satisfaction Questionnaire, including the long and
short forms, had been successfully used in previous studies of assistant principals.
The Minnesota Satisfaction Questionnaire (MSQ) was developed during a continuing
research program known as the Minnesota Studies in Vocational Rehabilitation
focussed on adjustment to work (Weiss et al., 1967, p. v). One outcome of the research
was a questionnaire that measured work satisfaction. The argument for such an
"individualised measure is useful ... [is that] two individuals may express the same
amount of general satisfaction with their work but for entirely different reasons." (Weiss
et al., 1967, p. vi).
Twenty different aspects of the individual/ work are measured by items in the MSQ,
which can be considered as a whole scale measuring general satisfaction and intrinsic
and extrinsic satisfaction. Both forms can be completed quite quickly, “…15-20 minutes
for the long form, 5 minutes for the short form; it is easy to read (5th grade reading
75
level); meets acceptable standards for reliability; and shows evidence of validity."
(Weiss et al., 1967, p. vi).
The test developers recommend the long form is used if at all possible, given the greater
extent of information it provides over the short form (Weiss et al., 1967, p. vii). In this
study the short form has been used, in part because the short form was used in some
previous studies of assistant principals (L. Armstrong, 2004; Chen, 2000; Dorminy &
Brown, 1982; M. R. Sutter, 1994; Taylor, 2007; Waskiewicz, 1999) and because
participants in this study are being asked to complete other questions important to the
study and it was thought wise to be wise to keep the total request for the questionnaire
to approximately 30 minutes.
The use of percentile scores of an appropriate norm group is recommended by Weiss.
Unfortunately, of the norms available for the MSQ (short form), none seem close
enough to the role of assistant principal to be of use. If a relevant normed group was
available, then scores could be grouped in to high (75th percentile and higher), low (25th
percentile and below, and average (25th to 75th percentile) (Weiss et al., 1967, p. vii)
The manual indicates that "The MSQ may be administered by mail, if proper controls
are used, or in an interview setting." (Weiss et al., 1967, p. vii). In this study it was
administered by mail. According to Weiss (1967, p. 2 ff) the MSQ is self administering
and no time limit applies.
The MSQ was developed to be useful for rehabilitation purposes, based on the theory
that “ ...work adjustment depends on how well an individual’s abilities correspond to
the ability requirements in work, and how well his needs correspond to the reinforcers
available in the work environment.” (Weiss et al., 1967, p. v). This may indicate that it
could usefully be used for development purposes.
The short version of the MSQ has three scales “…Intrinsic Satisfaction, Extrinsic
Satisfaction, and General Satisfaction.” (Weiss et al., 1967, p. 2). The “…short form of
the MSQ was developed by choosing 20 representative items, one from each scale [of
the longer version of the scale]. The items chosen were those which correlated the
highest with their respective scales.” (Weiss et al., 1967, p. 13).

76
Weiss (Weiss et al., 1967, p. 4) defines ‘general’, ‘intrinsic’ and ‘extrinsic’ satisfaction
through the items that make up each scale, which are shown on table 8 below.
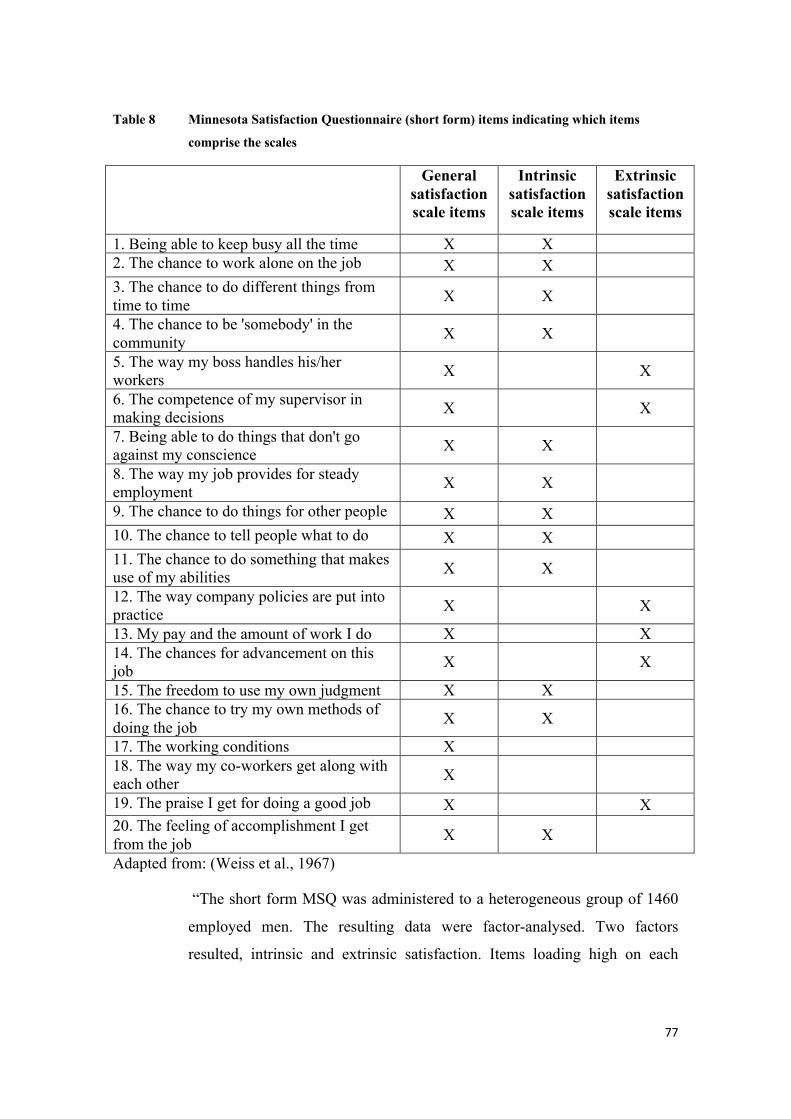
77
Table 8 Minnesota Satisfaction Questionnaire (short form) items indicating which items
comprise the scales
General satisfaction scale items
Intrinsic satisfaction scale items
Extrinsic satisfaction scale items
1. Being able to keep busy all the time X X 2. The chance to work alone on the job X X 3. The chance to do different things from time to time X X
4. The chance to be 'somebody' in the community X X
5. The way my boss handles his/her workers X X
6. The competence of my supervisor in making decisions X X
7. Being able to do things that don't go against my conscience X X
8. The way my job provides for steady employment X X
9. The chance to do things for other people X X 10. The chance to tell people what to do X X 11. The chance to do something that makes use of my abilities X X
12. The way company policies are put into practice X X
13. My pay and the amount of work I do X X 14. The chances for advancement on this job X X
15. The freedom to use my own judgment X X 16. The chance to try my own methods of doing the job X X
17. The working conditions X 18. The way my co-workers get along with each other X
19. The praise I get for doing a good job X X 20. The feeling of accomplishment I get from the job X X
Adapted from: (Weiss et al., 1967)
“The short form MSQ was administered to a heterogeneous group of 1460
employed men. The resulting data were factor-analysed. Two factors
resulted, intrinsic and extrinsic satisfaction. Items loading high on each
78
factor were taken to constitute a scale. In addition, all 20 items were scored
as one scale. The short form MSQ, therefore, can be scored on three scales:
intrinsic satisfaction, extrinsic satisfaction and general satisfaction” (Weiss
et al., 1967, p. 13)
Weiss et al. (1967, p. 23) report that the reliability coefficients for the short form MSQ
are generally high. No data is available of the stability of the measures except through
the relative stability of the general satisfaction of the long form.
The validity of the short form rests on that inferred from the longer form of the scale,
the differences among occupational groups and the relationship with the theory
underpinning the MSQ scales (Weiss et al., 1967, pp. 24-25).
While there are norms for teachers and managers for the long form of the (Weiss et al.,
1967, pp. 37-90), the only groups for which there are norms for the short form are
assemblers, clerks, engineers, janitors and maintenance men, machinists and salesmen.
(pp. 112-119) none of these groups would seem to be an ideal fit for assistant principals.
In addition, all members of the norm groups for the short version MSQ, except for
electrical assemblers, are male (pp. 112-119). For these reasons it was decided not to
use the norms for interpreting the results from the MSQ.
Modified MSQ
It is intended to use the MSQ short form in two ways. The first is to come up with a
general estimate of the job satisfaction of the assistant principal participants in the
study. The satisfaction scores can be looked at against the career intentions of the
participants.
Lacey (2002a) suggests that the intention of aspirants to pursue the principalship
depends to some extent on their perceptions of the job satisfaction of currently serving
principals. To pursue this idea, a modified version of the MSQ (short version) has been
developed (see attachment 1), asking assistant principal participants to respond to the
MSQ (short form items) as they perceive the views of serving principals generally, not
just their own principal. Permission has been granted by the MSQ publishers to use the
79
modified MSQ with the addition of the following phrase letter “Copyright 1977,
Vocational Psychology Research, University of Minnesota, Reproduced by permission”.
To adapt the MSQ to this new purpose, the instructions and some items needed re-
wording. The new wording was trialled by four experienced assistant principals and was
found to be fit for purpose. The validity of the revised scale relies on its face validity
and the reliability implied from the original scale. Future research should test these
assumptions.
MORI
In searching for a suitable instrument for the gathering of data around career aspirations
of assistant principals, several studies, including a study undertaken for the Department
for Education and Skills by the MORI Social Research Institute in the UK addressed
many specific questions related to the broad research questions for this research. There
were three phases of the MORI study; an examination of the literature, a postal
questionnaire and a gathering of qualitative data through an electronic bulletin board
(Stevens et al., 2005, p. 5). The MORI had conducted a survey of headteachers and
aspirants in 2001 and then refined the survey further for the 2004 follow-up study (p.
15). In examining the questionnaire, there were several questions which related directly
to the research questions of this study. The benefit of using questions from the MORI
questionnaire was that they were already field tested, and that it made possible the
comparison of local data with the UK study if desired. However, they were still subject
to a pilot of a small number of assistant principals here and some were modified to
localise the terminology used.
The MORI postal questionnaire gained response rates from deputy/assistant
headteachers of 45% (227) and 44% (446). The reliability of the survey was reported at
the 95% confidence levels were + or – 3% (Stevens et al., 2005, pp. 23-24). The validity
of the survey instrument is not reported, so it seems that there is reliance on the face
validity of the items.
80
Neidhart and Carlin
Drawing on a study conducted in the U.K. (James & Whiting, 1998), Neidhart and
Carlin (2003) undertook a study of the career intentions of educators in Catholic
schools. In this study they used a question and classification system of career intentions
that were especially relevant to this study. These questions became question 2.1 in the
current study (see questionnaire, attachment1). This study had acceptable levels of
reliability (Cronbach’s Alpha =.74 - .91) and procedures checking accuracy and
completeness of interview notes with participants to warrant validity were in place.
Lacey and Gronn
In a study of teacher career aspirations, after outlining the known major reasons for
disinterest in progressing to the principalship, Lacey and Gronn (2005) asked
participants what changes would need to occur for them to reconsider the principalship
and what would encourage them to apply. This was a line of inquiry of interest to this
study and so, drawing on the Lacey and Gronn study, participants were asked the
following question at interview, “What would need to change in the principalship to
increase you interest in the principalship?” (see attachment 2)
TheCombinedInstrumentQuestionnaire.
Triallingofthequestionnaire
The first draft questionnaire developed for this study was trialled with three recently (as
at 2008) retired assistant principals with varying lengths of experience and a current
acting assistant principal. Feedback was sought on the clarity of the questions and
instructions and the length of time it tool to answer the questions. After the feedback
was provided modifications were made and then the new version was given to the same
four people. Feedback again informed the development of the questions, especially
where the language of the MORI survey items needed to be localised. Feedback on the
81
time taken to answer questions was about 30 minutes from three, and somewhat longer
for one.
The questionnaire was then submitted to the University of Melbourne Human Ethics
Advisory Committee and the Department of Education and Early Childhood
Development Research Committee for approval and feedback. Both bodies provided
some feedback that led to further adjustments and to the final version of the
questionnaire.
Interviews
Semi-structured interviews were conducted using the interview protocol (attachment 2).
This protocol was also submitted to the University of Melbourne Human Ethics
Advisory Committee and the Department of Education and Early Childhood
Development Research Committee for approval, which was forthcoming.
On arrival at the interview site there was often some brief general talk to establish
rapport. On some occasions it was necessary to re-phrase the questions as written in the
interview protocol in response to the context or the circumstances of the particular
interviewee. However, as substantiated by the recordings and transcripts, the questions
were asked in the manner outlined in the protocol.
Interviews were recorded using a Sanyo digital recorder with a backup analogue
recorder used in case of fault. This interviewer also took notes during the interview on a
note sheet.
Transcriptions
Working with a transcript is not working with the original data. Converting speech into
text takes the interview out of context and filters the spoken word through the
transcriber (Bazeley, 2007). Much is lost in transcription, such as the tone of voice and
nonverbal behaviour of the interviewee.
82
Professional transcription companies were used to source professional transcribers.
Three companies were used, each of which had an established business with teams of
trained personnel. There were some minor variations in document format from company
to company. Because it was of no direct relevance to the research questions, transcribers
were instructed not to include “umms and arrrs” in the transcripts. Interruptions and
other key ‘events’ in the interview were noted in the transcripts. Where there was a
phrase or word that was unclear, this was noted along with a reference to the exact time
on the recording that this occurred. The researcher reviewed the transcripts, watching
for accuracy. The transcripts were found to have very few errors. While there is advice
that the transcripts should be transcribed by the researcher to gain a closer familiarity
with the data (Bazeley, 2007, p. 44). This candidate does not possess sufficient
keyboard skills to transcribe many hours of interview tapes in a timely manner.
In this research, full transcripts, minus minor ‘umms and arrs’ were produced,
grammatical errors in speech were not corrected, interruptions were noted, digressions
were included (Bazeley, 2007, pp. 44-45).
There was one interview where both main and backup recorders missed recording a
small section of the interview. In this case, the summary notes, written
contemporaneously, were used.
The transcripts were uploaded to NVivo software as per the program instructions, with
each transcript defined as a case.
ChoosingCAQDASandNVIVO
In approaching the task of analysing the qualitative data, several decisions needed to be
made. An early decision was the choice of manual methods versus computer assisted
software programs, commonly referred to as CAQDAS (Computer Assisted Qualitative
Data Analysis). Lewins and Silver (2007) provide an over view of seven such software
programs (p. 241 ff), and in depth analysis of the workings of three programs, namely
ATLAS.ti5, MAXqda2 and NVivo7 (p. 16 ff). The general benefits of using CAQDAS
are that they have the potential to assist with the data management process and record
83
keeping. They can assist with tasks such as the retrieval of text, management of text,
coding of text, theory and model building (Lewins & Silver, 2007, p. 6). They can be an
efficient way to keep records of the analysis and to keep documents well-ordered and
accessible.
While the CAQDAS involve cost and there is much to learn before they can be used
effectively and support for learning their use is patchy, it was decided to use this
manner of analysing the data. The next decision was which CAQDAS product to use.
As indicated by Lewins and Silver (2007) there are a range of common and unique
features of the software packages. After listening to practicing researchers and reading
references related to the locally developed NVivo software (e.g. Bazeley, 2007; Bazeley
& Richards, 2000; Richards, 1999), it was decided to use the NVivo product. Among
the key reasons for this preference was that workshops were run on its use at the
University of Melbourne and it is a locally developed product, with support readily
available.
Qualitative data was collected through semi structured interviews. Interview questions
were framed to gather data relevant to the research questions for the study. In some
cases the questions were designed to parallel the questionnaire, thus giving an
opportunity to triangulate the two sets of data.
Mixedmethodsdataanalysisprocedures
QuantitativeAnalysis
As shown in Table 7, some research questions were addressed with quantitative data
alone, some with only qualitative data and others with both quantitative and qualitative
data.
With respect to quantitative data, data was entered into SPSS software as the
questionnaires were returned. Two people were involved in entering the data, one
reading out the codes and watching the data entry screen, and the other entering the data
via a computer keyboard.
84
Once the data was entered, spot checks for accuracy were undertaken. Further
recommended data screening checks for both categorical and continuous variable were
undertaken and errors corrected (Pallant, 2007, pp. 43-49). Throughout the data
analysis, the researcher looked for any further aberrant data.
Specificdataanalysis.
Much of the data analysis is confined to descriptively presenting tallies of responses. In
some cases it was illustrative to create categories and describe the patterns in the data.
Some data was categorised to protect the anonymity of participants and their schools
and also to provide a broader view.
Attempts to use more inferential data analysis were hampered in most instances with the
frequencies in cells being below the number required under the assumptions of the
statistical procedures. Where relevant and possible, inferential statistics were computed
and reported.
However, the data in description provides many insights into the thinking of assistant
principals in relation to the research questions.
QualitativeDataAnalysis
Qualitative data was gained in both the questionnaire and the interviews.
The qualitative data collected in the questionnaire were responses to open ended
questions. These ranges from asking for ‘other’ responses at the end of a list of option to
asking a question to which participants responded with their own answer, for example,
participants were asked to provide a list of their portfolio responsibilities. With open
ended responses, where there were sufficient responses, they were listed and categories
developed by looking through the lists several times. Individual responses were then
allocated to a category (Pallant, 2007, pp. 8-9).
With respect to the interview data, once the data was transcribed it was loaded into the
NVivo software and coded.
85
For interview questions for which quantitative data had already been gathered, the
categories from the questionnaire were used as a starting point (Miles & Huberman,
1994, p. 58). The origin of these categories/codes was in previous research and
conceptual models. Most were from the MORI surveys where categories had developed
from the literature. However the data was not ‘forced’ into these codes. As the coding
process proceeded, ideas were being put by participants that were not within the
established list and so new categories were established. The coding process was
dynamic, with new codes emerging, others being redefined. The existing codes,
however, were not changed as part of the methodology was to find out the extent to
which existing categories from existing models applied to the participants in this study.
In some cases, data gathered confirmed existing categories, in other cases there was no
data that matched these pre-existing codes. In still further cases there was data that
generated new codes.
The descriptive coding generated a list of codes. Some codes were endorsed by a
relatively large number of participants, others by relatively few or even just one. This
posed a series of issues. Normally the researcher would then progress to analytical
coding, combining like items, looking for patterns and themes (Miles & Huberman,
1994, p. 69 ff). Pattern coding, as it is called, has the advantage of reducing the
potentially many descriptive codes into a smaller number of constructs that may better
enable relationships of these constructs to emerge. In a sense, because some of the codes
had already come from the research literature, they are already broad constructs. Some
of the new codes emerging from the data were endorsed by a relatively large number of
participants and were a construct on their own. Others have been endorsed by just one
person, they did not fit into another code, and to combine them into a broader construct
such as ‘other’ would lose their information. There was a reluctance to lose any
meaningfully different data through pattern coding as for the individuals, these could be
‘make or break’ issues in their career intentions and career decisions. If the aim of the
research is to elucidate matters at a local level, then it was deemed important not to
obscure individual issues through the coding process.
86
It is understood that this is potential for criticism, but it is emerging that the journey to
the principalship is an individual journey. The subtlety of individual circumstances is a
potentially powerful determinants for that individual either for others who choose or
don’t choose them or for themselves.
Validityapproachesinbothquantitativeandqualitativeresearch.
ReliabilityandValidity
The quantitative approaches and qualitative approaches have different ways of looking
at confirming that the results are ‘good’ or closer to the truth than common sense (Miles
& Huberman, 1994). The positivist approach examines validity and reliability (De
Vaus, 1995; Lunenburg & Irby, 2008) and the naturalistic inquirers focus on terms such
as dependability, confirmability and credibility (Miles & Huberman, 1994).
Validity
“Validity is the degree to which an instrument measures the what it purports to
measure” (Lunenburg & Irby, 2008, p. 181). Content validity is apparent when a scale
measures what it sets out to measure, and this can be judged by experts. In this study the
items from the MORI study came from the literature and also had been used in 2001.
The items in the MSQ have been through the validation process described in the
methodology section. The item from Neidhart and Carlin (2003) had been used by
James and Whiting (1998) in a previous study. The items in the MSQ modified form
had been approved by Dr David Weiss, the developer of the MSQ . All items were
reviewed by the project supervisor and by three experienced assistant principals and a
serving assistant principal, all serving as experts.
Criterion related validity, both concurrent and predictive did not seem relevant to this
study, although it would be interesting to see if any items, sub scales or scales has
predictive power with respect to career intentions. This would take a future longitudinal
study to achieve this purpose.
87
To some extent this study depends on the face validity of some parts of the instruments.
While the concept of face validity has its critics (Nevo, 1985; Secolsky, 1987) if items
and scales have higher face validity it may help evoke interest in potential participants,
help gain the support of authorities and help gain interest in the results (Nevo, 1985, pp.
287-288). Nevo (1985) suggests a process that formalises asking raters to evaluate items
or the scale. Raters could be drawn from the target population, potential users of the test
or the community. These ratings would be completed using a Likert-type scale. Such a
process was not followed for this study, although it may have been valuable. This study
relied on the previous research on those items, the panel of four experienced assistant
principals who reviewed the questionnaire twice, the University of Melbourne Ethics
panel approved the project and the instruments, and the department of education
approval process involves the review of the instruments by people with expertise in the
area of the research. The thesis supervisor also examined proposed questions. Overall
then, the validity of the questionnaire is based on the face validity of the items. Many of
the items have been used successfully and evaluated through their use in previous
studies. Prior to their use in this study they were scrutinised by three experienced
recently retired assistant principals and one serving assistant principal and items
modified to ensure they had meaning in the context of this project.
The validity of the Minnesota Satisfaction Questionnaire has been established by the
instrument developers. Details of the validity of the MSQ (long form) has been reported
(Weiss et al., 1967) including construct validity (p. 16), group differences (concurrent
validity) (p. 18) and factor structure (content validity) (p. 22). Validity of the MSQ
(short-form) is reported with concurrent validity (group differences) (p. 24), construct
validity (p. 25) and scale intercorrelations (p. 26). For this study the face validity of the
modified version of the MSQ is supported by the approval given to use the modified
instrument by the instrument developers, and the review by four experienced assistant
principals.
As Lunenburg and Irby (2008) proffer, several studies are needed to confirm the validity
of an instrument, so several studies might address this matter further in the future.
88
Reliability
The design of this study made it impractical for the use of a test-retest reliability
procedure. There are currently no equivalent forms of the scales to utilise. Split-half
reliability was not possible as it was not possible to split any of the instruments into
equivalent halves. Inter-rater reliability of the quantitative instruments was not
applicable in this design. A Cronbach’s alpha coefficient was calculated for the scales
and sub scales.
Reliability of the MSQ (long-form) is reported (Weiss et al., 1967) in terms of internal
consistency (p. 13), stability (p. 14). Reliability of the MSQ (short-form) is reported
with respect to internal consistency (p. 23) and stability (p. 24).
Truthfulness
It is imperative that researchers can verify the truthfulness of their work. It needs to be
demonstrably credible. The generally accepted criteria for judging research of validity,
reliability, generalisability and objectivity can be a challenge to prove in qualitative
research. There is a debate as to whether qualitative research should adhere to or
abandon these criteria (Denscombe, 2007, p. 297).
Whilst acknowledging this author’s interest in the topic of this research, efforts to be
objective, broadly following Denscombe’s (2003, 2007) advice included;
• Making clear the background of the researcher and interest in the subject matter
• Making clear how the research was conducted and how each decision was made.
• The use and adherence to the questionnaire
• The use of and adherence to an interview protocol for the semi structured
interview
• The audio recording of each interview, independent transcription, the following
of protocols for coding the data, the availability of the coding on the Nvivo
software makes it confirmable, the initial coding against already established
models all add to the objectivity
• The scrutiny of a supervisor, conferring about and examining coding at key
points in time
89
• The transparent reporting of the data
In terms of reliability, the question has been posed as to whether the same results would
have been obtained if someone else conducted the research. It cannot be completely
certain that precisely the same results would be achieved but the aims of the research
has been made explicit, the steps undertaken in the research have been made clear and
thinking behind decisions has been made explicit (Denscombe, 2007, p. 296 ff).
In other indicators as recommended (Denscombe, 2003, p. 274) an effort has been made
between over generalising the data and acknowledging the importance of low incidence
responses to those who have made them. Data that did not fit the existing models was
not ignored but reported as adding to existing knowledge. Triangulation of some data
has been an explicit part of this study and the results reported.
In essence, this study is not focussed on producing generalisable results. Indeed the
results might well be unique to this setting. Perhaps the study might demonstrate a
methodology that could be used by another region, perhaps some of the new issues
raised by this population might be included in a study of another context. The answers
that emerge could be similar in ways, buts but also could be different.
ProjectApprovals
UniversityEthicsapproval
All research involving human participants at the University of Melbourne requires the
approval of the Human Ethics Advisory group. This check comprises a check for ethical
standards and also technical standards. The research proposal to the Ethics Committee
was submitted on January 29, 2008 and final approval recorded on March 28, 2008. The
submission included a description of the project, aims, justification, details of the tasks
participants would be asked to do, plans to monitor the project, details of participants
and their recruitment, the plain language statement to be provided to potential
participants, a copy of the participant consent form, details of the participant
information will be kept confidential, data storage and protection and exposure of any
90
potential conflict of interest. Copies of all questions to be given and asked of assistant
principal participants were also provided to the Human Research Advisory Committee.
DepartmentofEducationandEarlyChildhoodDevelopmentApproval
Approval from the Department of Education and Early Childhood Development
(DEECD) is necessary for all proposed research as part of higher degrees. To gain
departmental approval the researchers provided a summary of the project, including an
overall justification for the methodology, including data analysis, all instruments and
materials to be used and all questions that would be asked, and procedures for gaining
consent. An application was lodged and after some feedback and minor amendments,
approval was received.
Researchers are required to provide a Plain Language Statement, as well as consent
procedures to be used in the study need to be clear, a consent form, and a plan for the
support for participants if needed must also be submitted.
The form of the DEECD approval is permission to approach the principals of schools.
Consent of the principal to approach assistant principals is needed before assistant
principals can be invited to participate. If the principal permits assistant principals to be
invited to participate, the invitation to each assistant principal includes a plain language
statement and a consent form. After some time, to save time, the letter and consent form
and questionnaire materials were sent to assistant principals in one package.
Study Population
Creswell (2008, p. 393) applies the following definition to survey research:
“The Population is the group of individuals having one characteristic that distinguishes
them from other groups.”
“The Target Population or Sampling Frame is the actual list of sampling units from
which the sample is selected.”
91
“The Sample is the group of participants in a study selected from the target population
from which the researcher generalizes to the target population”
The prime source document for defining the population was an official schools
directory from the Department of Education and Early Childhood Development. This
directory does not appear in the bibliography due to the need to keep participating
school details confidential. Given that there is a range of reasons why details in the
directories change, they are not always accurate at a given point in time. However the
directory was assumed to be accurate unless field work revealed the information not to
be accurate. Where this was found to be the case, then the actual known details from the
field were used.
There were forty-six schools in the defined geographic area listed in the departmental
directory as having secondary enrolments. Of these, seven schools were eliminated from
the population frame, six because they have no assistant principal positions and one
because of a very close association this researcher had with the school over an extended
period of time. This left thirty-nine schools in the population frame, with these schools
having a total of 79 assistant principal positions.
Consent to invite the assistant principals to participate in the study was sought from the
principals of the 39 schools. Thirty principals (76.9% of 39) gave their consent, these
schools having 59 assistant principal positions.
No sampling strategy was devised as all of the 59 assistant principals were invited to
participate in the study and 48 agreed (81.4% of 59). Two of these participants agreed
only to complete the survey, and were unwilling to be interviewed.
The forty eight participants represents 60.8% of assistant principals in the population
frame and 81.4% of the schools where the principal gave consent for assistant principals
to be invited to participate.
92
The timeline for administering the survey
The questionnaires were sent out and most completed and returned between May 2008
and August 2008. This appeared to be sufficient time for most participants to respond
and still have responses emanating from the same external conditions, thus avoiding the
impact of some responding in one external context and others in another, for example,
avoiding the impact of some responding following a major announcement on school
resourcing which are typically made in September.
Process for maximizing response.
There is a literature that guides researchers towards practices that may maximize
response rates (e.g. Bryman, 2008; Don A Dillman, 1991; Don A. Dillman, 2006;
Groves et al., 2004) While it is reported that different people will respond differently to
each approach to maximising their likelihood to be involved, the so-called “leverage
salience theory” (Groves et al., 2004, p. 189), there is still evidence from these sources
and many other publications outlining a range of strategies that researchers can consider
in the quest to maximize response rates in response to maximizing the robustness of the
results.
Responserateformula
Response rate =
number of usable questionnairestotal sample - unsuitable or uncontactable numbers of the sample x 100
(Bryman, 2008, p. 181)
To improve the maximize the response rate both to consent and to return the
questionnaire once the consent was achieved, the following measures were taken as
advised by key authors in the field (e.g. Bryman, 2008, pp. 220-224; Don A Dillman,
1991; Don A. Dillman, 2006; Leeuw, Hox, Dillman, & European Association of
Methodology., 2008).
93
The covering letter was written in a manner that was aimed to be clear to read and
highlighted importance of the research. Confidentiality was assured, within the limits
that it could in a study with a relatively small sample.
A stamped and self-addressed envelope was provided with each mailing.
Both principals and, where principals had given consent, assistant principals were
followed up three times via mail and or the school’s published email address. Records
were kept of each contact and response. Some literature recommends that people
refusing to participate be followed up in different ways (Groves et al., 2004, p. 191).
Several methods of request were made, namely post, email and some telephone follow-
up. It was considered that still further requests would have created ill-will, and also
resources for follow-ups were limited. Statistical adjustments for non-response as
suggested by some (e.g. Groves et al., 2004, p. 191) were not made, however the very
limited known characteristics of non-respondents were reported (see results chapter).
The design of the questionnaire was kept as open and easy to follow as possible. The
response formats of the pre-existing surveys (cited above) were used in the draft and
only very minor modifications seemed necessary based on the feedback of the four
assistant principals who trialled the questionnaire, the Ethics committee and the
DEECD review. There were 28 pages and several instruments. Feedback from most of
the assistant principals in the trial was that the task of completing the questionnaire was
interesting and took about 30 minutes. Although taking note of the research on the
inverse relationship between survey length and survey completion (Groves et al., 2004,
p. 193) a calculated risk was taken that the project would generate sufficient
commitment of support to carry the motivation of the participants to complete and
return the instrument.
One question, (viz. asking participants to provide feedback on the presence of
dimensions and also the methods and impact present in the professional development
activities they had undertaken) questions 3.1, 3.2, 3.3, 3.4 of interview), which was
thought to be difficult to explain clearly and potentially somewhat tedious to answer
was held over for the interview (see attachment 2).
94
Open ended questions in the questionnaire were kept to a minimum, with the interview
used to ask more of this style of question. The questionnaire was printed on both sides
to reduce the bulky appearance. Each piece of correspondence was personalized with
names and addresses. The presentation of documents was kept open and uncluttered.
Response sets to the survey was kept as simple as possible. Questions and answers were
kept together. Some researchers in this field have made an effort to seek endorsement or
sponsorship for the research (Lacey, 2002b) in the belief that such endorsement will
legitimise the research and improve response rates (Groves et al., 2004, p. 192) In this
case, it was believed that the research coming from the university would be sufficient
endorsement and that seeking and citing the endorsement of the government department
may have a negative impact on response rates. Seeking the endorsement of the
principals’ associations and unions was also considered, but it was decided that the
credibility of the university and the researchers along with the topic itself, would give
the best chance of maximizing response rates.
With respect to interviews the introductory remarks for the interviewer, while scripted,
were flexibly and responsively made, aimed at maximizing participant engagement with
the task (Groves et al., 2004, p. 193).
It is believed that the use of all these strategies did much to achieve an acceptable
response rate. It is hoped that the non-response was not caused by issues related to the
key research questions, thus potentially harming the quality of results (Groves et al.,
2004, p. 195). It is difficult to ascertain what might be the variable impact of non-
response on the variables
Advantagesofself-administeredquestionnaire
As indicated by Bryman (2008, p. 277 ff) the advantages of the self-administered postal
survey compared to an interview are the comparatively low cost, speed of
administration, concurrent administration, there is no bias variability from interviewers,
and the participant can complete the answers at a time convenient to themselves. On the
other hand interviews have the opportunity for flexibility with the interviewer able to
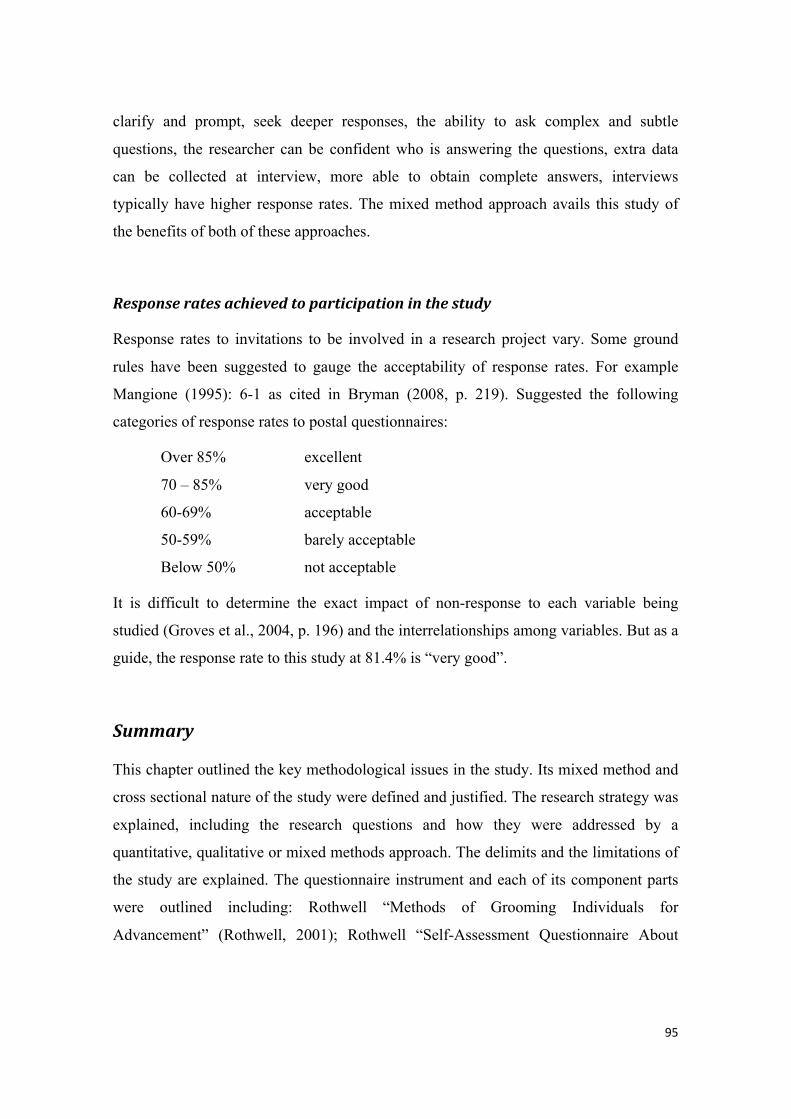
95
clarify and prompt, seek deeper responses, the ability to ask complex and subtle
questions, the researcher can be confident who is answering the questions, extra data
can be collected at interview, more able to obtain complete answers, interviews
typically have higher response rates. The mixed method approach avails this study of
the benefits of both of these approaches.
Responseratesachievedtoparticipationinthestudy
Response rates to invitations to be involved in a research project vary. Some ground
rules have been suggested to gauge the acceptability of response rates. For example
Mangione (1995): 6-1 as cited in Bryman (2008, p. 219). Suggested the following
categories of response rates to postal questionnaires:
Over 85% excellent
70 – 85% very good
60-69% acceptable
50-59% barely acceptable
Below 50% not acceptable
It is difficult to determine the exact impact of non-response to each variable being
studied (Groves et al., 2004, p. 196) and the interrelationships among variables. But as a
guide, the response rate to this study at 81.4% is “very good”.
Summary
This chapter outlined the key methodological issues in the study. Its mixed method and
cross sectional nature of the study were defined and justified. The research strategy was
explained, including the research questions and how they were addressed by a
quantitative, qualitative or mixed methods approach. The delimits and the limitations of
the study are explained. The questionnaire instrument and each of its component parts
were outlined including: Rothwell “Methods of Grooming Individuals for
Advancement” (Rothwell, 2001); Rothwell “Self-Assessment Questionnaire About
96
Your Organization’s Employee Development Program.” (Rothwell et al., 2005), The
Minnesota Satisfaction Questionnaire (Weiss et al., 1967), the Minnesota Satisfaction
Questionnaire modified forthis study, the MORI study instrument (Stevens et al., 2005),
Neidhart and Carlin (2003) and Lacey and Gronn (2005).
The process of interviewing was explained, as were the way the interview data was
gathered, recorded and stored.
The quantitative data analysis was outlined, including the limitations on analysis
imposed by the numbers of participants. Reliability and validity and truthfulness issues
were addressed.
The qualitative data analysis was explained, including the use of computerised analysis.
Issues of validity, reliability and truthfulness were discussed.
Approval received from the University of Melbourne Ethics Committees and the
Department of Education was confirmed. The target population for the study was
defined and how they were invited to participate was explained, as was the process for
maximising responses. The response rate calculations were reported.
97
ChapterFiveResults
Introduction
The purpose of this mixed method cross sectional study was to investigate the career
aspirations and development of government secondary school assistant principals in a
selected geographic area, as at 2008. The results reported in this chapter, after basic
descriptive data is reported, are organised around the key research questions, namely;
• What are the leadership aspirations and career intentions of assistant principals
in government secondary schools?
• What development opportunities do they engage in? How effective are they and
what impact do they have?
• What is their own job satisfaction and how do they rate the job satisfaction of
principals in general?
• How do they rate their own preparedness for the principalship?
• How strategic is the school-based planning for leadership succession?
• What would need to change to increase their interest in the principalship?
The Population Frame and the Participants.
There were 46 schools in the defined geographic area listed in the official education
department directory as having secondary enrolments. Of these, seven schools were
eliminated from the population frame (six because they had no assistant principal
position and one because of a close association with this researcher), leaving 39 schools
in the population frame, with these schools having 79 assistant principal positions.
Thirty principals (76.9% of 39) gave their consent to invite their assistant principals to
participate, these schools having 59 assistant principal positions.
98
Each of the 59 assistant principals was invited to participate and 48 agreed (81.4% of
59). Two of these participants agreed only to complete the survey questionnaire, being
unwilling to be interviewed.
The 48 participants represent 60.8% of assistant principals in the population frame, and
81.4% of assistant principals in the schools where the principal gave consent for
assistant principals to be invited to participate.
ParticipantsandNon-Participants
No sampling was conducted for this study, as all in the population frame were invited to
participate in the study.
One way of making a judgment about the adequacy of the sample is to compare the
characteristics of the population against the characteristics of those who agree to
participate in the study or alternatively to compare respondents with non-respondents
Creswell (2009). In this study, little is known about the characteristics of the population.
One characteristic that is known is the gender of those occupying assistant principal
positions. In all schools in the population frame, there are 35 (44.3%) male and 44
(55.7%) female assistant principals. Among the participants there are 21 (43.75%) male
and 27 (56.25%) female assistant principals, and this closely reflects the population.
Among the school characteristics that are known is the so called ‘Like Schools Group’
(LSG), a categorisation of disadvantage taking into account socioeconomic and
language factors (Department of Education and Early Childhood Development, 2009d).
table 9 below profiles the schools in the population frame and the participants’ schools
as well as those schools from which there was no participant.
In the population frame of 39 schools, 16 schools (41%) are from LSG 9, the most
disadvantaged group. Six (15.4%) of the schools were in categories 1 (the least
disadvantaged schools) and six were in category 5, a moderately disadvantaged school
category.
99
The schools where the principals gave consent for their assistant principals to be invited
to participate in the study, approximately conforms to the profile of the population
frame, with LSG 1 schools (least disadvantaged) slightly over-represented (20.0%) and
LSG 9 schools (most disadvantaged) under-represented (33.3%).
The schools where assistant principals agreed to participate shows (comparatively) over
representation of LSG 1 schools (22.2%) and under representation of LSG 9 schools
(29.6%).
Of the 12 schools not represented in the study, 8 (66.7%) are LSG 9 schools.
It can be concluded therefore that the participants over-represent LSG 1 schools (the
least disadvantaged) and under-represent LSG 9 schools (the most disadvantaged).
Cross tabulating LSG and career intentions yields too many cells not meeting the
criteria (5 observations per cell) for analysis. This makes it difficult to estimate what
impact the representation of like school groups may have on the results of the study.
Nevertheless, the sample is acceptable with 60.8% of secondary schools in the region
represented, and the number of schools from LSG 9 representing 20% schools in the
region. There is a large group of LSG 9 schools in the study, giving confidence that
these schools are well represented.
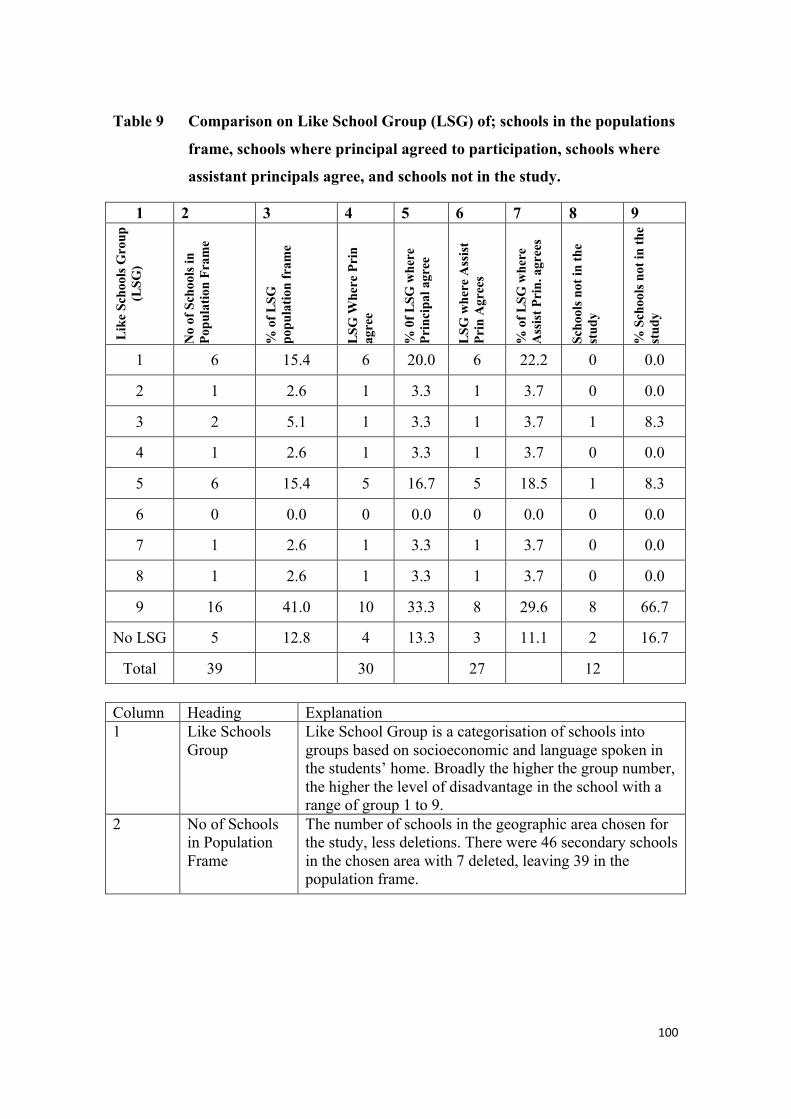
100
Table 9 Comparison on Like School Group (LSG) of; schools in the populations
frame, schools where principal agreed to participation, schools where
assistant principals agree, and schools not in the study.
1 2 3 4 5 6 7 8 9
Like
Sch
ools
Gro
up
(LSG
)
No
of S
choo
ls in
Po
pula
tion
Fram
e
% o
f LSG
po
pula
tion
fram
e
LSG
Whe
r e P
rin
agre
e
% 0
f LSG
whe
re
Prin
cipa
l agr
ee
LSG
whe
re A
ssis
t Pr
in A
gree
s
% o
f LSG
whe
re
Ass
ist P
rin.
agr
ees
Scho
ols n
ot in
the
stud
y
% S
choo
ls n
ot in
the
stud
y
1 6 15.4 6 20.0 6 22.2 0 0.0
2 1 2.6 1 3.3 1 3.7 0 0.0
3 2 5.1 1 3.3 1 3.7 1 8.3
4 1 2.6 1 3.3 1 3.7 0 0.0
5 6 15.4 5 16.7 5 18.5 1 8.3
6 0 0.0 0 0.0 0 0.0 0 0.0
7 1 2.6 1 3.3 1 3.7 0 0.0
8 1 2.6 1 3.3 1 3.7 0 0.0
9 16 41.0 10 33.3 8 29.6 8 66.7
No LSG 5 12.8 4 13.3 3 11.1 2 16.7
Total 39 30 27 12 Column Heading Explanation 1 Like Schools
Group Like School Group is a categorisation of schools into groups based on socioeconomic and language spoken in the students’ home. Broadly the higher the group number, the higher the level of disadvantage in the school with a range of group 1 to 9.
2 No of Schools in Population Frame
The number of schools in the geographic area chosen for the study, less deletions. There were 46 secondary schools in the chosen area with 7 deleted, leaving 39 in the population frame.
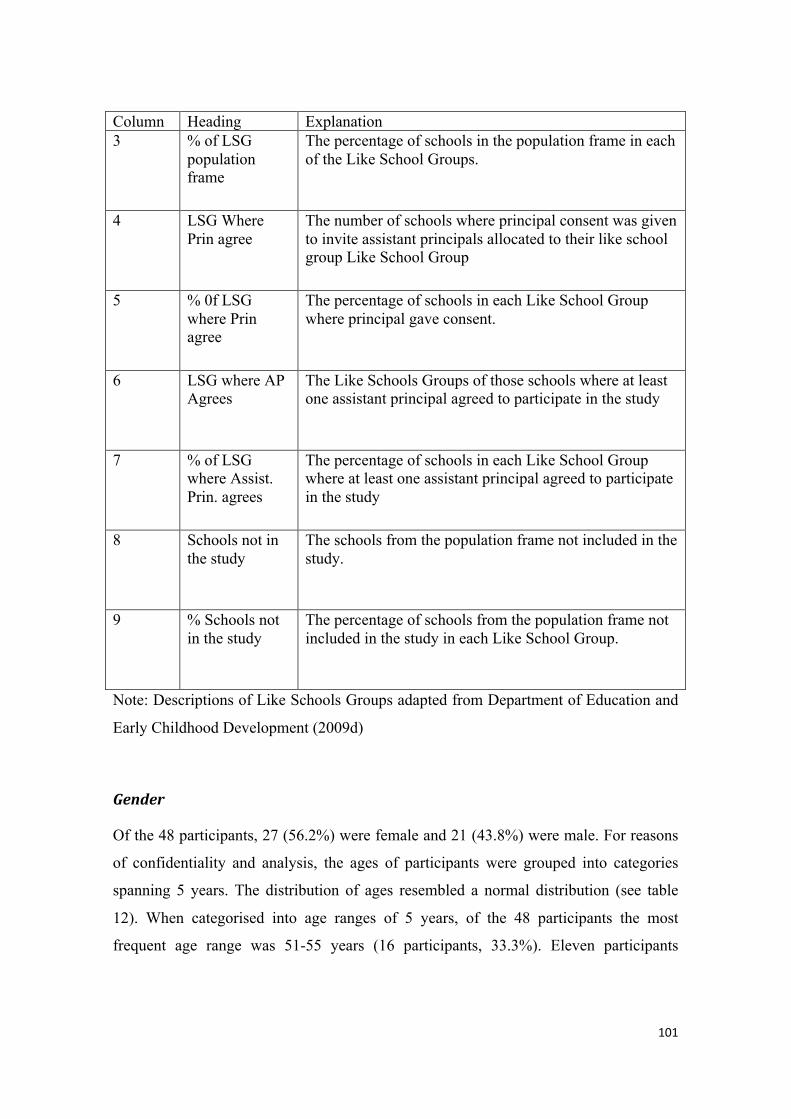
101
Column Heading Explanation 3 % of LSG
population frame
The percentage of schools in the population frame in each of the Like School Groups.
4 LSG Where Prin agree
The number of schools where principal consent was given to invite assistant principals allocated to their like school group Like School Group
5 % 0f LSG where Prin agree
The percentage of schools in each Like School Group where principal gave consent.
6 LSG where AP Agrees
The Like Schools Groups of those schools where at least one assistant principal agreed to participate in the study
7 % of LSG where Assist. Prin. agrees
The percentage of schools in each Like School Group where at least one assistant principal agreed to participate in the study
8 Schools not in the study
The schools from the population frame not included in the study.
9 % Schools not in the study
The percentage of schools from the population frame not included in the study in each Like School Group.
Note: Descriptions of Like Schools Groups adapted from Department of Education and
Early Childhood Development (2009d)
Gender
Of the 48 participants, 27 (56.2%) were female and 21 (43.8%) were male. For reasons
of confidentiality and analysis, the ages of participants were grouped into categories
spanning 5 years. The distribution of ages resembled a normal distribution (see table
12). When categorised into age ranges of 5 years, of the 48 participants the most
frequent age range was 51-55 years (16 participants, 33.3%). Eleven participants
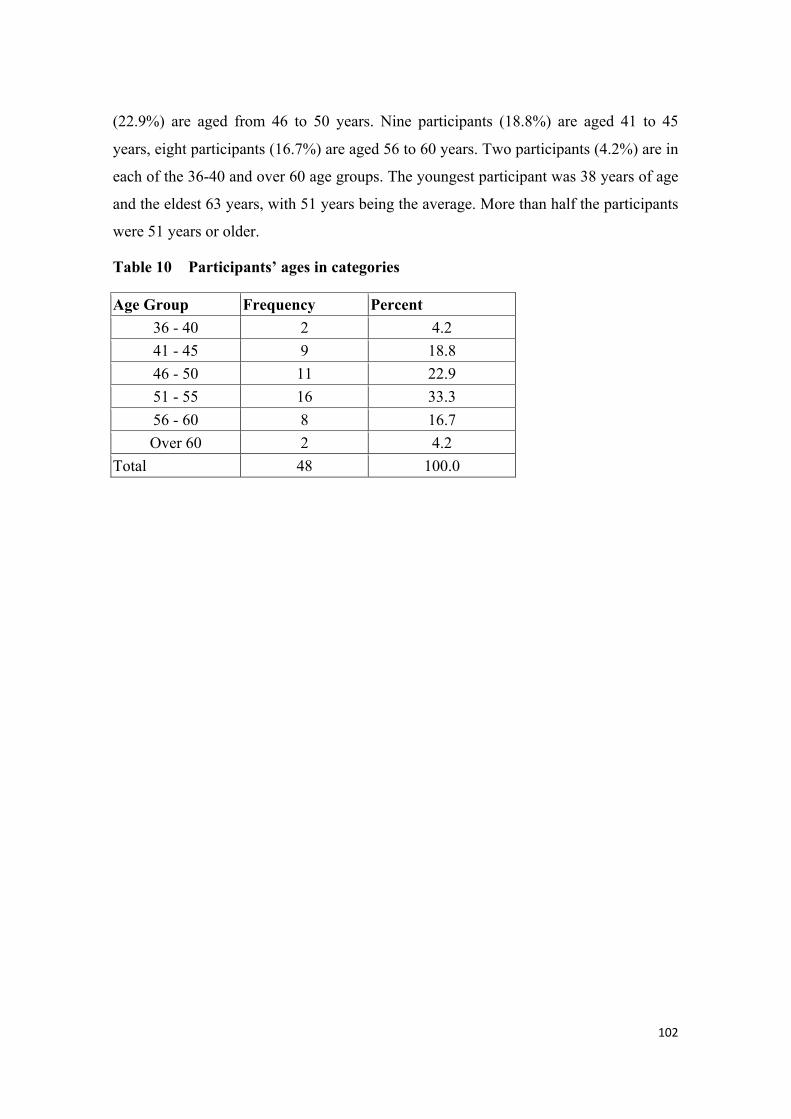
102
(22.9%) are aged from 46 to 50 years. Nine participants (18.8%) are aged 41 to 45
years, eight participants (16.7%) are aged 56 to 60 years. Two participants (4.2%) are in
each of the 36-40 and over 60 age groups. The youngest participant was 38 years of age
and the eldest 63 years, with 51 years being the average. More than half the participants
were 51 years or older.
Table 10 Participants’ ages in categories
Age Group Frequency Percent 36 - 40 2 4.2 41 - 45 9 18.8 46 - 50 11 22.9 51 - 55 16 33.3 56 - 60 8 16.7 Over 60 2 4.2
Total 48 100.0
103
Age*Gender
The age of females ranged from 44 years of age to 63 years, while the ages of males
ranged from 38 to 59. The average age for females (51.7 years) was slightly higher than
that for males (50.1 years)
Yearstoretirement
Forty five of the 48 participants provided a retirement age and therefore an indication of
how many years it was to their retirement. Years to retirement calculated as 0 for those
for whom retirement was imminent. Twenty-five years was the longest anticipated time
to retirement of the participants with an average of 8.4 years to retirement across those
participants who provided this data.
The mean years to retirement for males (9.6 years) was more than two years longer than
for women (7.5 years) with the range of responses for men being 5 years longer than for
women (men 25 years, women 20 years)
YearsasanAssistantPrincipal
Years assistant principal at current school
Participants were asked to indicate for how long they had been an assistant principal at
their current school. Responses indicated that the experience of participants ranged from
one month to 19 years, with a mean of 4.797 years, a mode of seven years and a median
of four years.
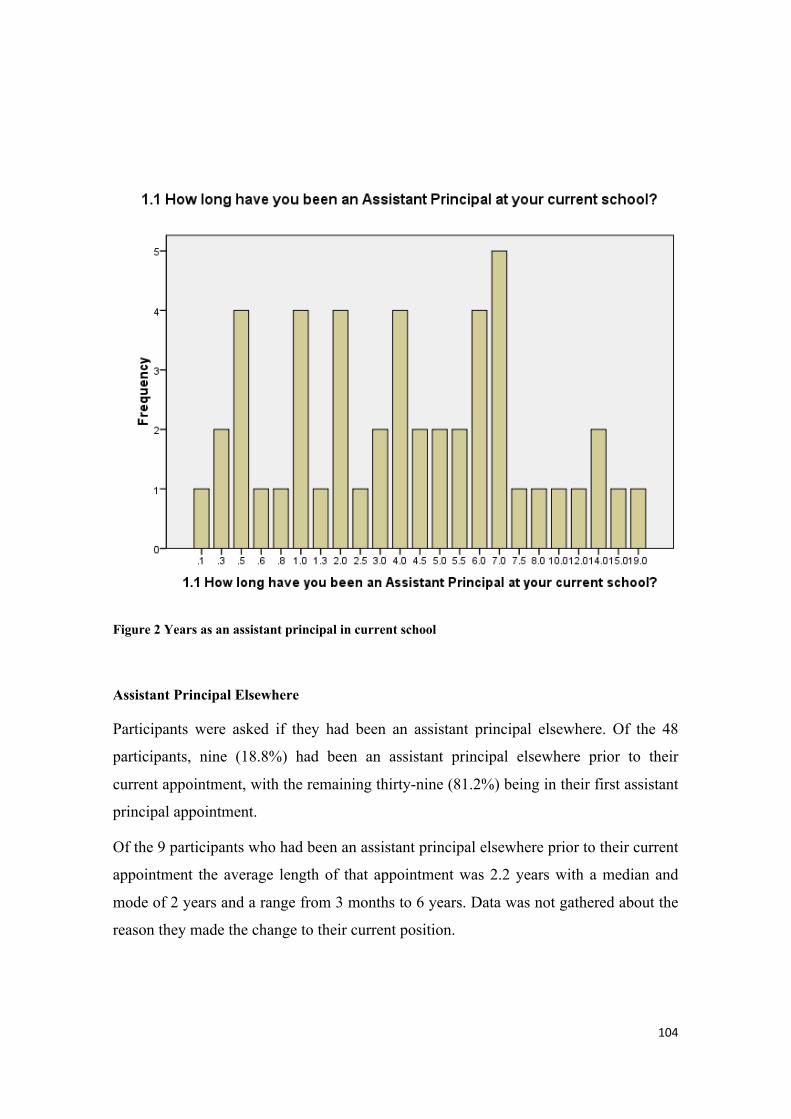
104
Figure 2 Years as an assistant principal in current school
Assistant Principal Elsewhere
Participants were asked if they had been an assistant principal elsewhere. Of the 48
participants, nine (18.8%) had been an assistant principal elsewhere prior to their
current appointment, with the remaining thirty-nine (81.2%) being in their first assistant
principal appointment.
Of the 9 participants who had been an assistant principal elsewhere prior to their current
appointment the average length of that appointment was 2.2 years with a median and
mode of 2 years and a range from 3 months to 6 years. Data was not gathered about the
reason they made the change to their current position.
105
Assistant Principal from within current school
Participants were asked “Thinking of your current position, were you appointed directly
from another position in your school?” Thirty-eight (79.2%) of participants were in
another position in their current school prior to being appointed to their current assistant
principalship. This indicates that the vast majority of assistant principals are
appointments of internal candidates, which may be an indicator of a level of effective
succession planning of staff within their schools to the assistant principal position(s).
Alternatively, it may also indicate a relatively low probability of a candidate from
beyond the school being appointed to an assistant principal position.
Countryofbirthofself,motherandfather
Participants were asked in which country they were born and in which country each of
their parents were born. Forty participants (83.3%) were born in Australia. For 77% of
participants at least 1 parent was born in Australia.
Data is not available to indicate if this is typical of either the teaching profession, the
teaching profession in the geographic area in which this study was taken, or of the
population frame for this study.
AssistantPrincipalPortfolioResponsibilities
In the questionnaire, participants were invited to list their key portfolio areas of their
role.
All but 9 of the participants provided details of their portfolio responsibilities. The
responses to this should be viewed as indicative only as guidance defining a ‘portfolio’
was not provided to participants, nor was any attempt made to define the term
‘portfolio’.
The portfolio responsibilities as provided by the participants were recorded in a table
column. Thirty-nine participants reported 162 portfolios. Individual responses ranged
106
from 1 portfolio to 7, plus 1 response listing 13 portfolio responsibility areas. Using a
process recommended by Pallant (2007, pp. 13-14), responses were grouped into
broader categories. These broader categories were tallied. (see table 11).
Nineteen broad categories emerged by grouping like portfolios together. The most
frequent portfolio reported by the assistant principals who responded to this item was
human resources (31) followed by curriculum programs (23). Student management (16)
and operations (15) follow in frequency. Sub school leadership (13) was the next most
frequent response. With responses of less than ten are the categories of student welfare
and development (9), resource management / facilities (8), planning (7), information
and communication technology (6). The remaining portfolios have relatively few
mentions, namely; resource management / finance (3), enrolments (2), resource
management (2), events (1), innovation (1), international students (1), parent complaints
(1), research (1), school council (1).
It is interesting to note that there is little mention of portfolios traditionally associated
with assistant principals, such as bus/ transport timetables and rosters.
This may show a shift in responsibilities of assistant principals who are often regarded
as looking after ‘bins and buses’ in a school. Lacey (2009) also discussed what she
believed was a change in the roles undertaken by assistant principals. Assistant
principals in this study report many different types of involvement and responsibilities.

107
Table 11 Categories of assistant principal portfolios sorted in order of
frequency
Category Frequency Human resources 31 Curriculum programs 23 Student management 16 Operations 15 Sub school leadership 13 Not given 9 Student welfare and development 9 Resource management /facilities 8 Planning 7 Information and Communication Technology 6 Resource management/ finance 3 Enrolments 2 Resource management 2 Events 1 Innovation 1 International students 1 Parent complaints 1 Research 1 School council 1
TheirSchools
Participants were asked details about their school. This data was gathered and is
presented by participant, not by school. This means that the number of participants from
each of the schools acts as a weighting to the summary statistics.
Enrolmentsatparticipants’schools
The mean of the enrolments of each participant’s school was 1001 students, with a
median of 974.5 and a wide range of 1674.
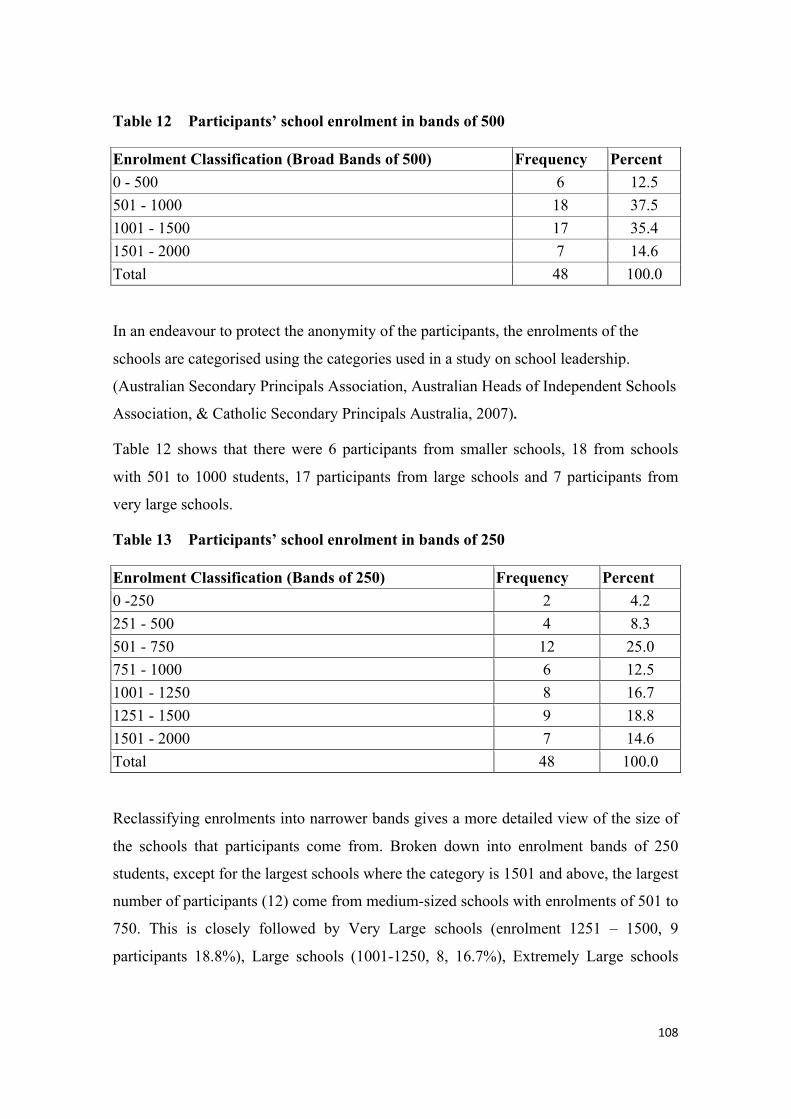
108
Table 12 Participants’ school enrolment in bands of 500
Enrolment Classification (Broad Bands of 500) Frequency Percent 0 - 500 6 12.5 501 - 1000 18 37.5 1001 - 1500 17 35.4 1501 - 2000 7 14.6 Total 48 100.0
In an endeavour to protect the anonymity of the participants, the enrolments of the
schools are categorised using the categories used in a study on school leadership.
(Australian Secondary Principals Association, Australian Heads of Independent Schools
Association, & Catholic Secondary Principals Australia, 2007).
Table 12 shows that there were 6 participants from smaller schools, 18 from schools
with 501 to 1000 students, 17 participants from large schools and 7 participants from
very large schools.
Table 13 Participants’ school enrolment in bands of 250
Enrolment Classification (Bands of 250) Frequency Percent 0 -250 2 4.2 251 - 500 4 8.3 501 - 750 12 25.0 751 - 1000 6 12.5 1001 - 1250 8 16.7 1251 - 1500 9 18.8 1501 - 2000 7 14.6 Total 48 100.0
Reclassifying enrolments into narrower bands gives a more detailed view of the size of
the schools that participants come from. Broken down into enrolment bands of 250
students, except for the largest schools where the category is 1501 and above, the largest
number of participants (12) come from medium-sized schools with enrolments of 501 to
750. This is closely followed by Very Large schools (enrolment 1251 – 1500, 9
participants 18.8%), Large schools (1001-1250, 8, 16.7%), Extremely Large schools
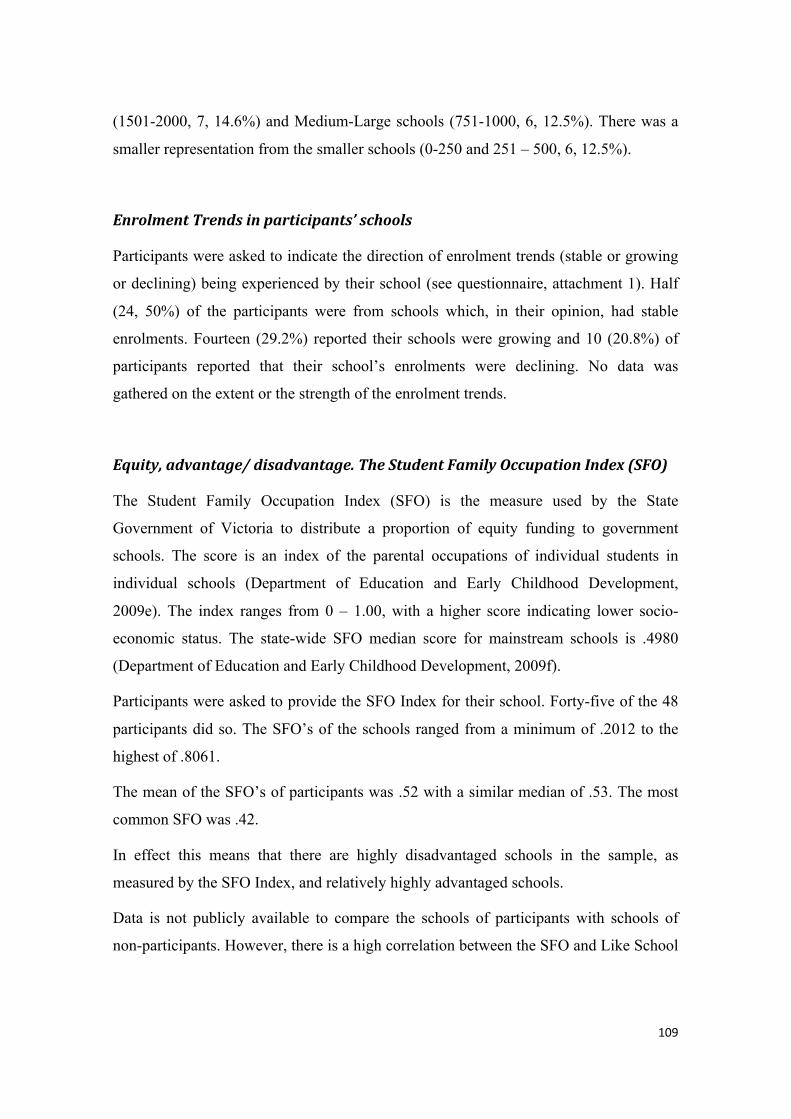
109
(1501-2000, 7, 14.6%) and Medium-Large schools (751-1000, 6, 12.5%). There was a
smaller representation from the smaller schools (0-250 and 251 – 500, 6, 12.5%).
EnrolmentTrendsinparticipants’schools
Participants were asked to indicate the direction of enrolment trends (stable or growing
or declining) being experienced by their school (see questionnaire, attachment 1). Half
(24, 50%) of the participants were from schools which, in their opinion, had stable
enrolments. Fourteen (29.2%) reported their schools were growing and 10 (20.8%) of
participants reported that their school’s enrolments were declining. No data was
gathered on the extent or the strength of the enrolment trends.
Equity,advantage/disadvantage.TheStudentFamilyOccupationIndex(SFO)
The Student Family Occupation Index (SFO) is the measure used by the State
Government of Victoria to distribute a proportion of equity funding to government
schools. The score is an index of the parental occupations of individual students in
individual schools (Department of Education and Early Childhood Development,
2009e). The index ranges from 0 – 1.00, with a higher score indicating lower socio-
economic status. The state-wide SFO median score for mainstream schools is .4980
(Department of Education and Early Childhood Development, 2009f).
Participants were asked to provide the SFO Index for their school. Forty-five of the 48
participants did so. The SFO’s of the schools ranged from a minimum of .2012 to the
highest of .8061.
The mean of the SFO’s of participants was .52 with a similar median of .53. The most
common SFO was .42.
In effect this means that there are highly disadvantaged schools in the sample, as
measured by the SFO Index, and relatively highly advantaged schools.
Data is not publicly available to compare the schools of participants with schools of
non-participants. However, there is a high correlation between the SFO and Like School
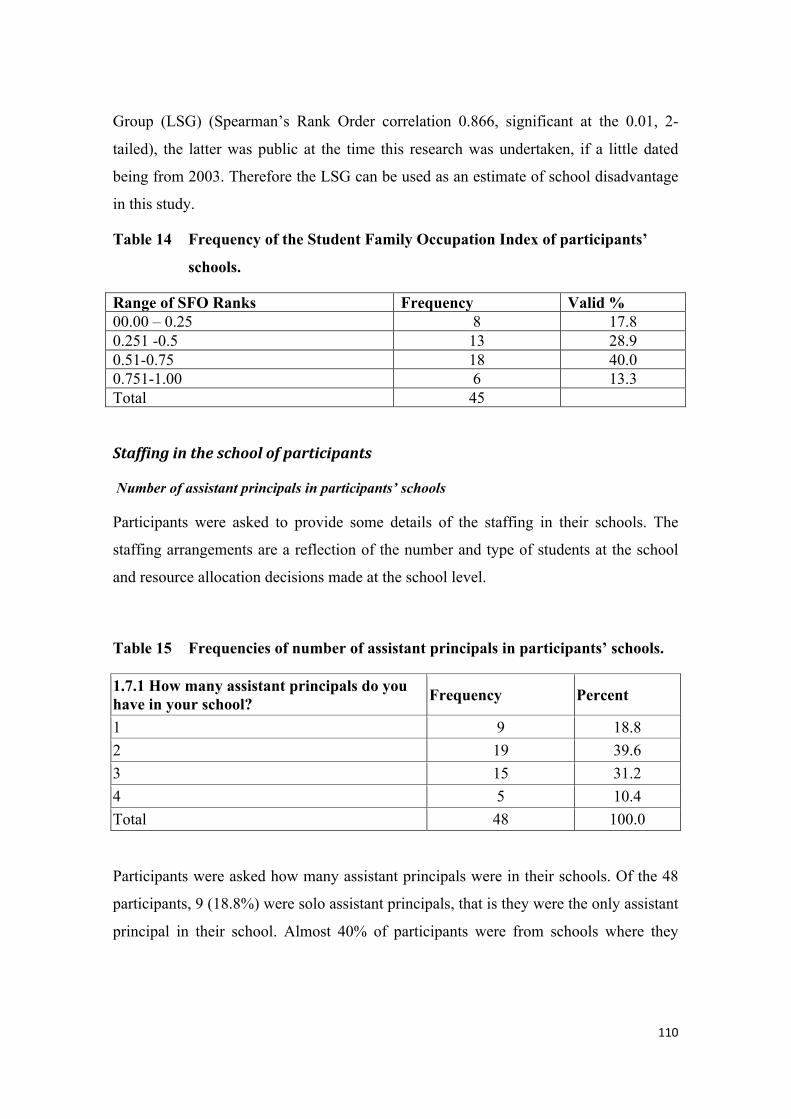
110
Group (LSG) (Spearman’s Rank Order correlation 0.866, significant at the 0.01, 2-
tailed), the latter was public at the time this research was undertaken, if a little dated
being from 2003. Therefore the LSG can be used as an estimate of school disadvantage
in this study.
Table 14 Frequency of the Student Family Occupation Index of participants’
schools.
Range of SFO Ranks Frequency Valid % 00.00 – 0.25 8 17.8 0.251 -0.5 13 28.9 0.51-0.75 18 40.0 0.751-1.00 6 13.3 Total 45
Staffingintheschoolofparticipants
Number of assistant principals in participants’ schools
Participants were asked to provide some details of the staffing in their schools. The
staffing arrangements are a reflection of the number and type of students at the school
and resource allocation decisions made at the school level.
Table 15 Frequencies of number of assistant principals in participants’ schools.
1.7.1 How many assistant principals do you have in your school? Frequency Percent
1 9 18.8 2 19 39.6 3 15 31.2 4 5 10.4 Total 48 100.0
Participants were asked how many assistant principals were in their schools. Of the 48
participants, 9 (18.8%) were solo assistant principals, that is they were the only assistant
principal in their school. Almost 40% of participants were from schools where they
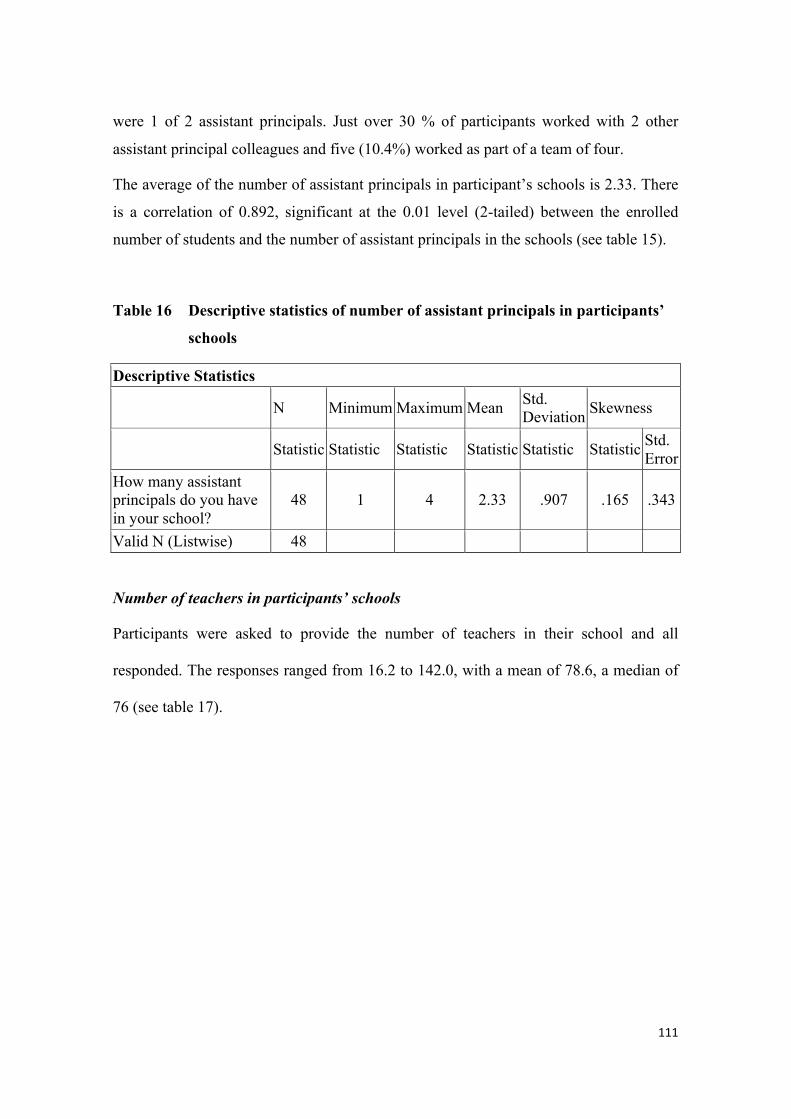
111
were 1 of 2 assistant principals. Just over 30 % of participants worked with 2 other
assistant principal colleagues and five (10.4%) worked as part of a team of four.
The average of the number of assistant principals in participant’s schools is 2.33. There
is a correlation of 0.892, significant at the 0.01 level (2-tailed) between the enrolled
number of students and the number of assistant principals in the schools (see table 15).
Table 16 Descriptive statistics of number of assistant principals in participants’
schools
Descriptive Statistics
N Minimum Maximum Mean Std. Deviation Skewness
Statistic Statistic Statistic Statistic Statistic Statistic Std. Error
How many assistant principals do you have in your school?
48 1 4 2.33 .907 .165 .343
Valid N (Listwise) 48
Number of teachers in participants’ schools
Participants were asked to provide the number of teachers in their school and all
responded. The responses ranged from 16.2 to 142.0, with a mean of 78.6, a median of
76 (see table 17).

112
Table 17 Descriptive statistics of number of teachers, support staff and ‘other’
staff in participants’ schools
Descriptive Statistics
N Minimum Maximum Mean Std. Deviation
How many Teachers do you have in your school?
48 16.20 142.00 78.5717 34.1
How many School Support Staff do you have in your school?
48 3.8 35.0 19.8 7.7
How many Other Staff do you have in your school?
48 0 30 1.4 4.5
Support and Other staff in participants’ schools
The participants were also asked how many “School Support Officers (SSO) and
“Other” staff in schools. SSO is a designated category of employees SSO’s cover an
increasingly wide range of roles, but data was only collected on raw numbers from
participants. The category of ‘other’ was intended to catch any other support staff who
were employed through arrangements other than as an SSO, for example contract staff
employed through agencies and companies. The categories were not precisely defined
so the results should only be considered broadly as indicative. The average number of
support staff in the schools was almost 20 and ‘other’ 1.4, although the range was from
0 to 30.
Researchquestionone:“Whataretheleadershipaspirationsand
careerintentionsofassistantprincipalsinGovernmentSecondary
Schools?”
A key research question for this project is “What are the leadership aspirations and
career intentions of assistant principals in Government Secondary Schools?” Data on
this question was gathered by both a paper-based postal questionnaire and also by
interview.
113
GeneralCommentsaboutthePrincipalship(Qualitative)
As an initial / introductory question in the interview, participants were asked “Are there
any comments you wish to make about seeking the principalship?” Transcripts of the
responses to this question were coded for meaning.
The most common items were negative to the principalship, the first node of responses
suggesting that the position was unworkable (see table 18) and the second that
“Personal circumstances meant not applying.”
Among the next most frequent was a qualified positive, “Yes, but still on the learning
journey” and “Keen but some doubts”.
Across all responses (unweighted) two were clearly positive (+), 14 negative (-), 5 were
both positive and negative (+/-) and 7 were neither positive nor negative (unclear) (?).
+ = 2 clearly positive
-= 14 negative
+/-= 5 both positive and negative
? = 7 neither positive or negative (unclear)
Using the number of sources as a weighting, the negative score totalled 38 (weighted)
against the positive 10 (weighted). Ambivalent items summed to nine (weighted), and
items that gave no indication gave a weighted summation at ten (see table 18).
The overall sentiment in response to this opening question is negative in terms of
interest in the principalship. This coincides in broad terms with the quantitative data
(see table 18) that 78.3% of respondents are either uncertain or unwilling in relation to
the principalship.
The nodes in table 18 are the result of descriptive coding. The broad range of responses
seems indicative of the wide range of motivations assistant principal participants with
regards to the principalship.
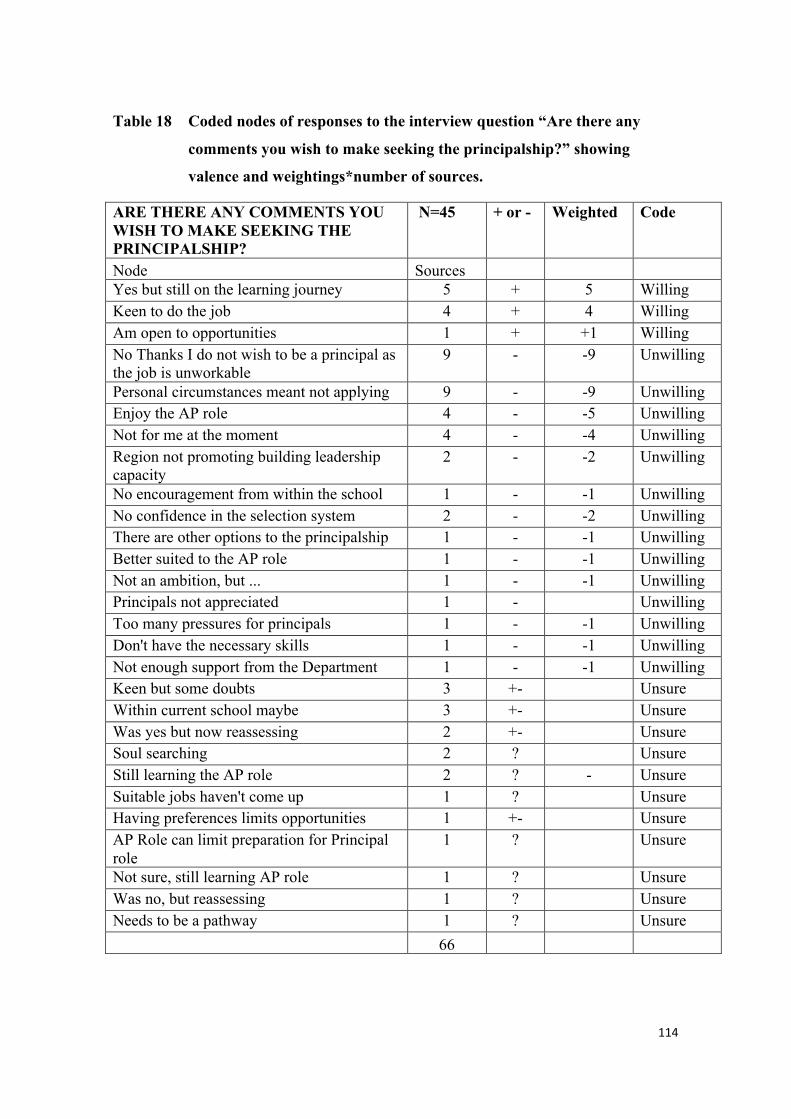
114
Table 18 Coded nodes of responses to the interview question “Are there any
comments you wish to make seeking the principalship?” showing
valence and weightings*number of sources.
ARE THERE ANY COMMENTS YOU WISH TO MAKE SEEKING THE PRINCIPALSHIP?
N=45 + or - Weighted Code
Node Sources Yes but still on the learning journey 5 + 5 Willing Keen to do the job 4 + 4 Willing Am open to opportunities 1 + +1 Willing No Thanks I do not wish to be a principal as the job is unworkable
9 - -9 Unwilling
Personal circumstances meant not applying 9 - -9 Unwilling Enjoy the AP role 4 - -5 Unwilling Not for me at the moment 4 - -4 Unwilling Region not promoting building leadership capacity
2 - -2 Unwilling
No encouragement from within the school 1 - -1 Unwilling No confidence in the selection system 2 - -2 Unwilling There are other options to the principalship 1 - -1 Unwilling Better suited to the AP role 1 - -1 Unwilling Not an ambition, but ... 1 - -1 Unwilling Principals not appreciated 1 - Unwilling Too many pressures for principals 1 - -1 Unwilling Don't have the necessary skills 1 - -1 Unwilling Not enough support from the Department 1 - -1 Unwilling Keen but some doubts 3 +- Unsure Within current school maybe 3 +- Unsure Was yes but now reassessing 2 +- Unsure Soul searching 2 ? Unsure Still learning the AP role 2 ? - Unsure Suitable jobs haven't come up 1 ? Unsure Having preferences limits opportunities 1 +- Unsure AP Role can limit preparation for Principal role
1 ? Unsure
Not sure, still learning AP role 1 ? Unsure Was no, but reassessing 1 ? Unsure Needs to be a pathway 1 ? Unsure 66
115
Using the response categories from James and Whiting (1998) and Neidhart and Carlin
(2003), responses were allocated to the themes of Unwilling, Unsure and Willing (see
column 5, table 18). Using the number of sources as a weighting, Unwilling= 14 codes
* 38 sources = 570 (73.4% of weighted scores), Unsure = 11 codes* 18 sources = 176
(22.7% of weighted scores) and Willing =3 codes* 10 sources = 30 (3.9%of weighted
scores). Responses to the broad opening question therefore revealed an unwilling
sentiment when it came to assistant principals considering the principalship. The broad
nature of this question was followed up with more specific questions about the career
intentions of the participants. (see later in this chapter).
Careeraspirations/intentionsinrelationtotheprincipalshipsurveyresults
(quantitative)
In the survey, the 48 participants were asked to indicate their career intention in relation
to the principalship by endorsing one of six options provided (Using options from
Neidhart and Carlin 2003). There were 46 responses to this item (see table 19).
The most frequent response (18 participants and 39.1% of valid responses) was “I have
never applied and do not intend applying”. One respondent (2.2%) had applied in the
past, but indicated that s/he will not do so in the future.
Of the 46 respondents to this question, 3 (6.2% of valid responses) were actively
seeking the principalship. A further 10 (20.8%) indicated they “… would apply but only
if in a suitable location”. Seven respondents (14.6%) have applied for principal jobs
previously, but may not apply again. The same number (7, 14.6%) have not applied but
may do so. (see table 19).
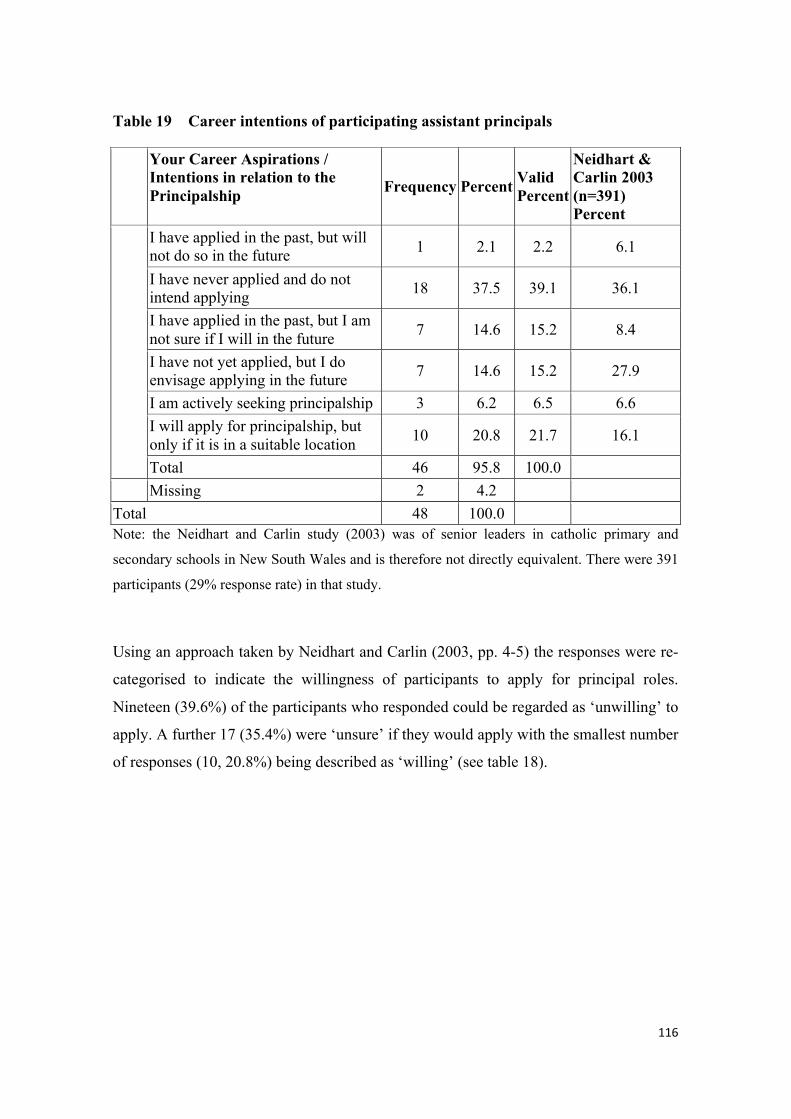
116
Table 19 Career intentions of participating assistant principals
Your Career Aspirations / Intentions in relation to the Principalship Frequency Percent Valid
Percent
Neidhart & Carlin 2003 (n=391) Percent
I have applied in the past, but will not do so in the future 1 2.1 2.2 6.1
I have never applied and do not intend applying 18 37.5 39.1 36.1
I have applied in the past, but I am not sure if I will in the future 7 14.6 15.2 8.4
I have not yet applied, but I do envisage applying in the future 7 14.6 15.2 27.9
I am actively seeking principalship 3 6.2 6.5 6.6 I will apply for principalship, but only if it is in a suitable location 10 20.8 21.7 16.1
Total 46 95.8 100.0 Missing 2 4.2 Total 48 100.0 Note: the Neidhart and Carlin study (2003) was of senior leaders in catholic primary and
secondary schools in New South Wales and is therefore not directly equivalent. There were 391
participants (29% response rate) in that study.
Using an approach taken by Neidhart and Carlin (2003, pp. 4-5) the responses were re-
categorised to indicate the willingness of participants to apply for principal roles.
Nineteen (39.6%) of the participants who responded could be regarded as ‘unwilling’ to
apply. A further 17 (35.4%) were ‘unsure’ if they would apply with the smallest number
of responses (10, 20.8%) being described as ‘willing’ (see table 18).
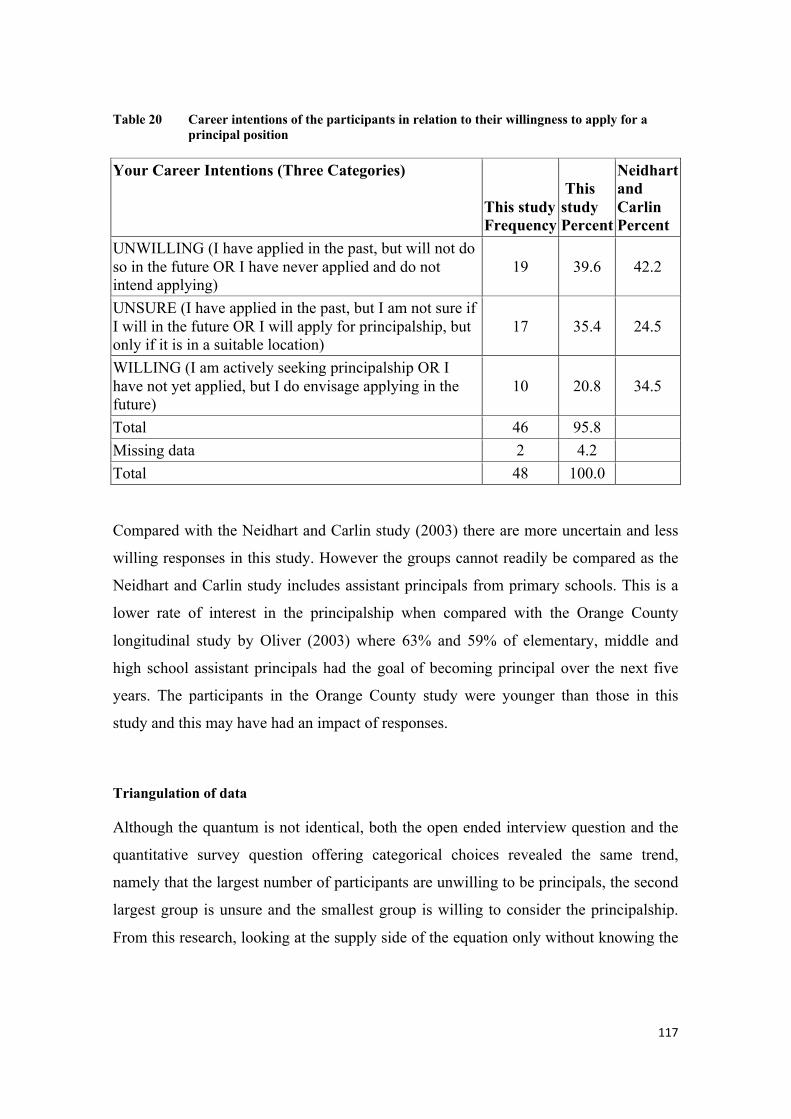
117
Table 20 Career intentions of the participants in relation to their willingness to apply for a principal position
Your Career Intentions (Three Categories)
This study Frequency
This study Percent
Neidhart and Carlin Percent
UNWILLING (I have applied in the past, but will not do so in the future OR I have never applied and do not intend applying)
19 39.6 42.2
UNSURE (I have applied in the past, but I am not sure if I will in the future OR I will apply for principalship, but only if it is in a suitable location)
17 35.4 24.5
WILLING (I am actively seeking principalship OR I have not yet applied, but I do envisage applying in the future)
10 20.8 34.5
Total 46 95.8 Missing data 2 4.2 Total 48 100.0
Compared with the Neidhart and Carlin study (2003) there are more uncertain and less
willing responses in this study. However the groups cannot readily be compared as the
Neidhart and Carlin study includes assistant principals from primary schools. This is a
lower rate of interest in the principalship when compared with the Orange County
longitudinal study by Oliver (2003) where 63% and 59% of elementary, middle and
high school assistant principals had the goal of becoming principal over the next five
years. The participants in the Orange County study were younger than those in this
study and this may have had an impact of responses.
Triangulation of data
Although the quantum is not identical, both the open ended interview question and the
quantitative survey question offering categorical choices revealed the same trend,
namely that the largest number of participants are unwilling to be principals, the second
largest group is unsure and the smallest group is willing to consider the principalship.
From this research, looking at the supply side of the equation only without knowing the
118
likely demand, it is difficult to tell if the level of interest is indeed sufficient to fill the
likely vacancies. This data does not give an indication if those who are interested in
seeking the principalship have the necessary attributes to successfully fulfil the role.
The data gives no basis for predicting if intentions will actually be fulfilled as there can
be a range of unpredictable circumstances that can influence career development, intent
and progression (Bright, Pryor, Chan, & Rijanto, 2009; McKenzie, Kos, Walker, &
Hong, 2008; Pryor & Bright, 2007).
Reasonsforapplyingfortheposition
Adapted from the MORI (Stevens et al., 2005) research, participants were asked by
questionnaire (see attachment 1), “If you do wish or possibly wish to seek a principal
position, why do you want to become a principal? Eighteen options were provided plus
four “other” and a “Don’t know” category. Consistent with the instructions from the
MORI study, participants were asked to tick no more than five of the options. Those
participants who had no intention of applying for a principal position were not required
to respond to this item.
Twenty-nine participants responded to this item. Twenty seven participants expressed a
possible interest in the principalship and two participants did not state a career intention.
Given this expression of ambivalence in the questionnaire and interview, the responses
of these two participants were included in the responses to this question, as well as the
responses for those questions relating to those who did not want to pursue the
principalship.
The level of agreement for the items provided ranged from 18 (62.1% of valid
responses) to zero responses (see table 21 below). Those items gaining endorsement
from over 50% of the valid responses were “Job satisfaction/sense of personal
achievement” (18 endorsements, 62.1% of valid responders), “Role is dynamic and
varied/is not routine” (16, 55.2%) and “Building shared values” (15, 51.7%).
Items gaining 50% to 25% endorsement were; “Passionate belief in the role” (13,
44.8%), “Rising to new challenges” (13, 44.8%), “Changing school culture” (12,
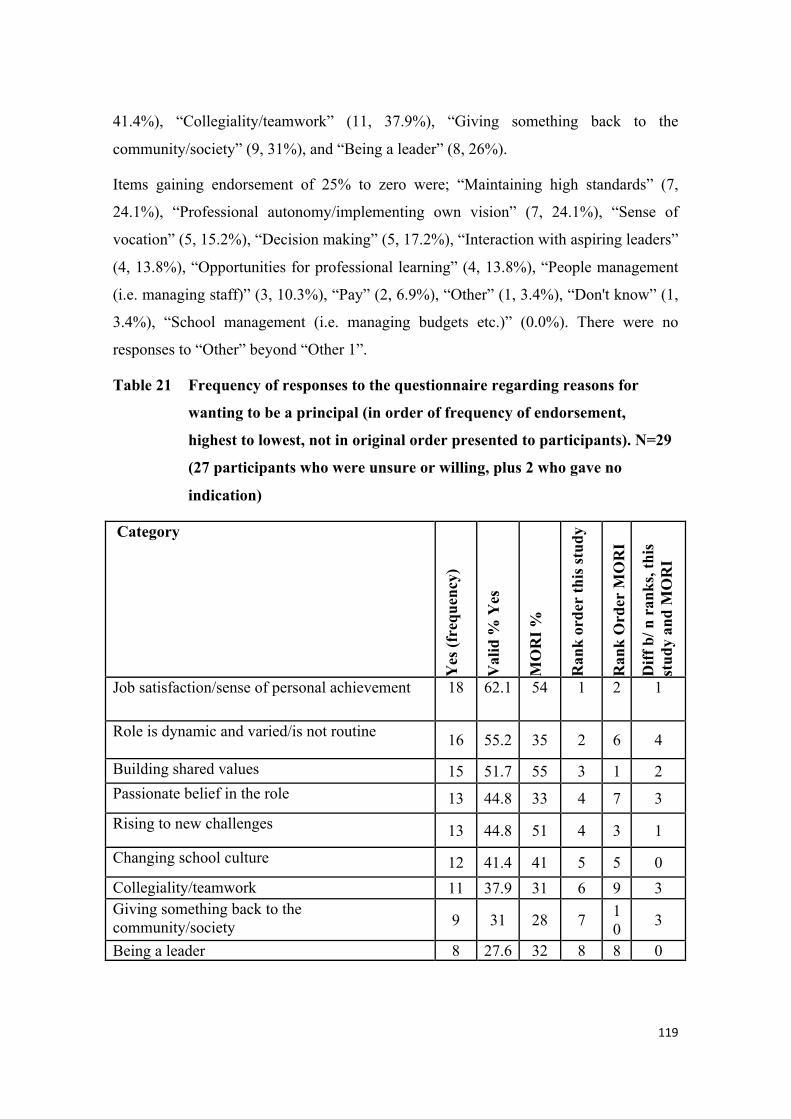
119
41.4%), “Collegiality/teamwork” (11, 37.9%), “Giving something back to the
community/society” (9, 31%), and “Being a leader” (8, 26%).
Items gaining endorsement of 25% to zero were; “Maintaining high standards” (7,
24.1%), “Professional autonomy/implementing own vision” (7, 24.1%), “Sense of
vocation” (5, 15.2%), “Decision making” (5, 17.2%), “Interaction with aspiring leaders”
(4, 13.8%), “Opportunities for professional learning” (4, 13.8%), “People management
(i.e. managing staff)” (3, 10.3%), “Pay” (2, 6.9%), “Other” (1, 3.4%), “Don't know” (1,
3.4%), “School management (i.e. managing budgets etc.)” (0.0%). There were no
responses to “Other” beyond “Other 1”.
Table 21 Frequency of responses to the questionnaire regarding reasons for
wanting to be a principal (in order of frequency of endorsement,
highest to lowest, not in original order presented to participants). N=29
(27 participants who were unsure or willing, plus 2 who gave no
indication)
Category
Yes
(fre
quen
cy)
Val
id %
Yes
MO
RI %
Ran
k or
der
this
stud
y
Ran
k O
rder
MO
RI
Diff
b/ n
ran
ks, t
his
stud
y an
d M
OR
I Job satisfaction/sense of personal achievement 18 62.1 54 1 2 1
Role is dynamic and varied/is not routine 16 55.2 35 2 6 4
Building shared values 15 51.7 55 3 1 2 Passionate belief in the role 13 44.8 33 4 7 3 Rising to new challenges 13 44.8 51 4 3 1
Changing school culture 12 41.4 41 5 5 0 Collegiality/teamwork 11 37.9 31 6 9 3 Giving something back to the community/society 9 31 28 7 1
0 3
Being a leader 8 27.6 32 8 8 0
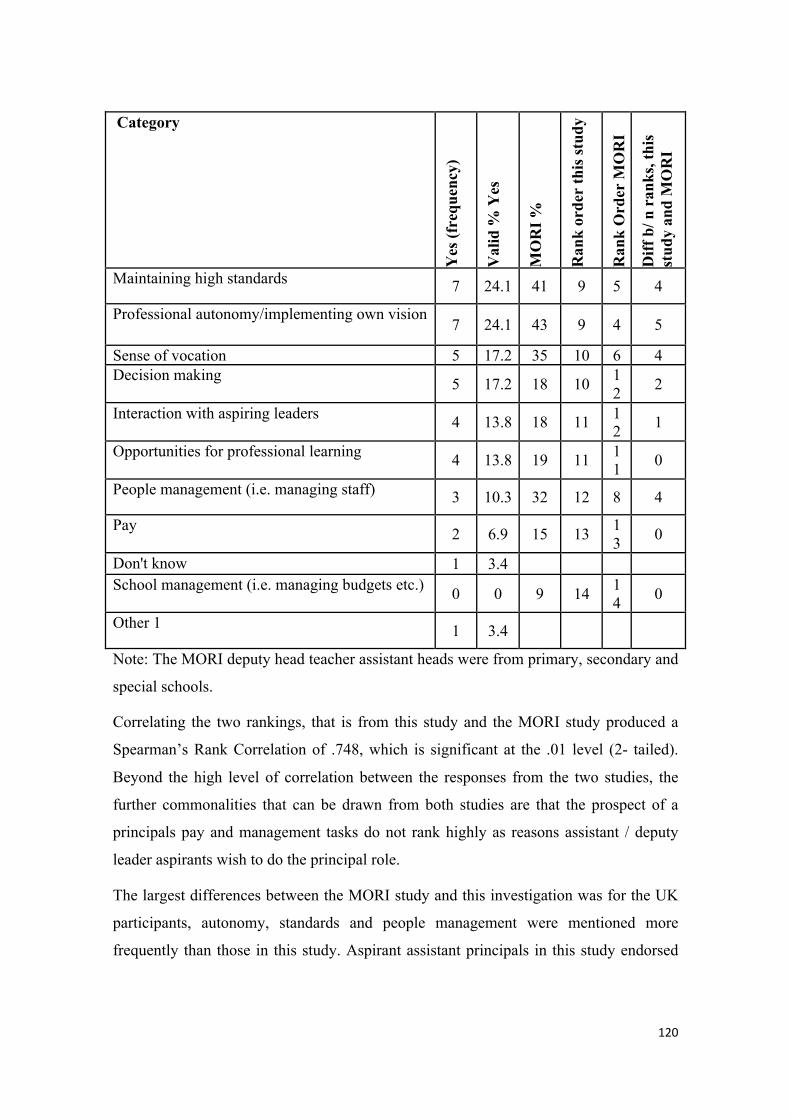
120
Category
Yes
(fre
quen
cy)
Val
id %
Yes
MO
RI %
Ran
k or
der
this
stud
y
Ran
k O
rder
MO
RI
Diff
b/ n
ran
ks, t
his
stud
y an
d M
OR
I
Maintaining high standards 7 24.1 41 9 5 4
Professional autonomy/implementing own vision 7 24.1 43 9 4 5
Sense of vocation 5 17.2 35 10 6 4 Decision making 5 17.2 18 10 1
2 2
Interaction with aspiring leaders 4 13.8 18 11 12 1
Opportunities for professional learning 4 13.8 19 11 11 0
People management (i.e. managing staff) 3 10.3 32 12 8 4
Pay 2 6.9 15 13 13 0
Don't know 1 3.4 School management (i.e. managing budgets etc.) 0 0 9 14 1
4 0
Other 1 1 3.4
Note: The MORI deputy head teacher assistant heads were from primary, secondary and
special schools.
Correlating the two rankings, that is from this study and the MORI study produced a
Spearman’s Rank Correlation of .748, which is significant at the .01 level (2- tailed).
Beyond the high level of correlation between the responses from the two studies, the
further commonalities that can be drawn from both studies are that the prospect of a
principals pay and management tasks do not rank highly as reasons assistant / deputy
leader aspirants wish to do the principal role.
The largest differences between the MORI study and this investigation was for the UK
participants, autonomy, standards and people management were mentioned more
frequently than those in this study. Aspirant assistant principals in this study endorsed
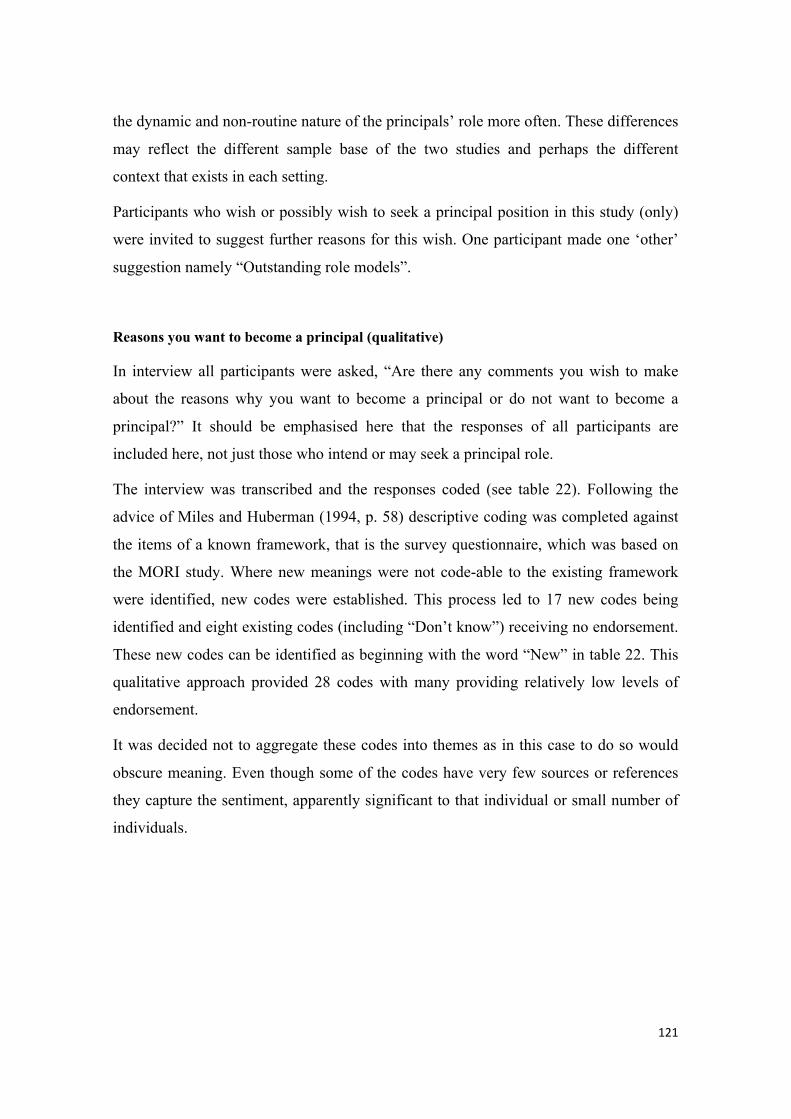
121
the dynamic and non-routine nature of the principals’ role more often. These differences
may reflect the different sample base of the two studies and perhaps the different
context that exists in each setting.
Participants who wish or possibly wish to seek a principal position in this study (only)
were invited to suggest further reasons for this wish. One participant made one ‘other’
suggestion namely “Outstanding role models”.
Reasons you want to become a principal (qualitative)
In interview all participants were asked, “Are there any comments you wish to make
about the reasons why you want to become a principal or do not want to become a
principal?” It should be emphasised here that the responses of all participants are
included here, not just those who intend or may seek a principal role.
The interview was transcribed and the responses coded (see table 22). Following the
advice of Miles and Huberman (1994, p. 58) descriptive coding was completed against
the items of a known framework, that is the survey questionnaire, which was based on
the MORI study. Where new meanings were not code-able to the existing framework
were identified, new codes were established. This process led to 17 new codes being
identified and eight existing codes (including “Don’t know”) receiving no endorsement.
These new codes can be identified as beginning with the word “New” in table 22. This
qualitative approach provided 28 codes with many providing relatively low levels of
endorsement.
It was decided not to aggregate these codes into themes as in this case to do so would
obscure meaning. Even though some of the codes have very few sources or references
they capture the sentiment, apparently significant to that individual or small number of
individuals.
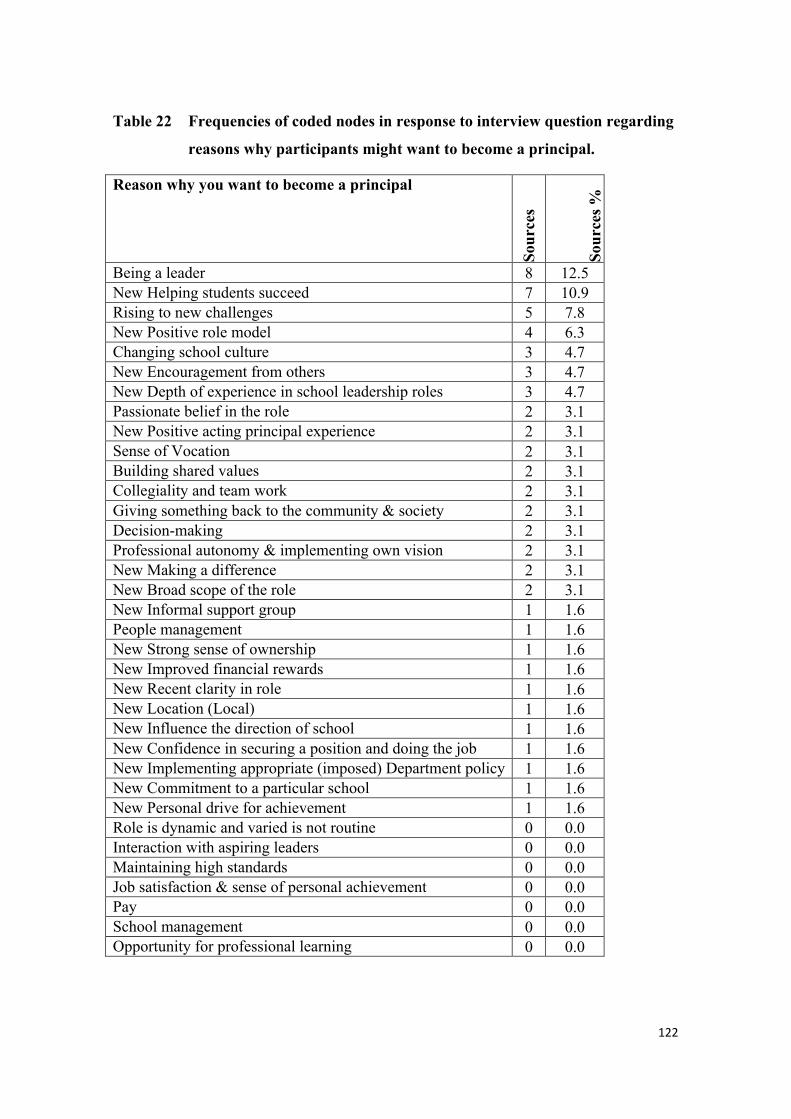
122
Table 22 Frequencies of coded nodes in response to interview question regarding
reasons why participants might want to become a principal.
Reason why you want to become a principal
Sour
ces
Sour
ces %
Being a leader 8 12.5 New Helping students succeed 7 10.9 Rising to new challenges 5 7.8 New Positive role model 4 6.3 Changing school culture 3 4.7 New Encouragement from others 3 4.7 New Depth of experience in school leadership roles 3 4.7 Passionate belief in the role 2 3.1 New Positive acting principal experience 2 3.1 Sense of Vocation 2 3.1 Building shared values 2 3.1 Collegiality and team work 2 3.1 Giving something back to the community & society 2 3.1 Decision-making 2 3.1 Professional autonomy & implementing own vision 2 3.1 New Making a difference 2 3.1 New Broad scope of the role 2 3.1 New Informal support group 1 1.6 People management 1 1.6 New Strong sense of ownership 1 1.6 New Improved financial rewards 1 1.6 New Recent clarity in role 1 1.6 New Location (Local) 1 1.6 New Influence the direction of school 1 1.6 New Confidence in securing a position and doing the job 1 1.6 New Implementing appropriate (imposed) Department policy 1 1.6 New Commitment to a particular school 1 1.6 New Personal drive for achievement 1 1.6 Role is dynamic and varied is not routine 0 0.0 Interaction with aspiring leaders 0 0.0 Maintaining high standards 0 0.0 Job satisfaction & sense of personal achievement 0 0.0 Pay 0 0.0 School management 0 0.0 Opportunity for professional learning 0 0.0
123
Reason why you want to become a principal
Sour
ces
Sour
ces %
Don't know 0 0.0 Total 64 100.0
The new and existing (from the MORI study) codes that were most strongly endorsed
were ‘Being a leader’ (8 sources, 12.5% of sources), ‘Helping students succeed’ (new)
(7, 10.9%), ‘Rising to new challenges’ (5, 7.8%), and ‘Positive role model’ (4, 6.3%).
Comments forming the ‘Being a leader’ node included those that indicated an
enjoyment of leadership (Female 2, Female 15) and the excitement of leading (Male
13). Comments about leading change (Female 41), being in charge (Female 46),
directing, having the final say (Female 15), not being restricted (Male 6) also make up
the responses. Personal ambition to “… go as far as I can…” has meaning for one
respondent (male 19).
A new category emerging from this qualitative data was “Helping students succeed”.
Some comments coded to this node included comments consistent with maximising
learning outcomes (Female 1, female 41), observing students succeed (male 2), adding
value (Female 17) making a difference (Male 40, Female 35) and developing aspirations
in young people (Male 21)
Comments that define the ‘Rising to new challenges’ node (5 sources, 7.8%) represents
thoughts of being ready to rise to new challenges (Male 2, Male 45), knowing how
challenging the principal role is but seeking it anyway (Male 43), but also a sense of
moving up from the restrictions of the assistant principalship (Female 27)
Another new category emerging from the qualitative data was “Positive role model” (4
sources, 6.3%). Comments made in relation to this highlight having good principals to
work with who show it is possible to do the job successfully (Female 4), who are
encouraging and good role models (Female 35) and who work well and closely with
their assistant principal (Female 15).
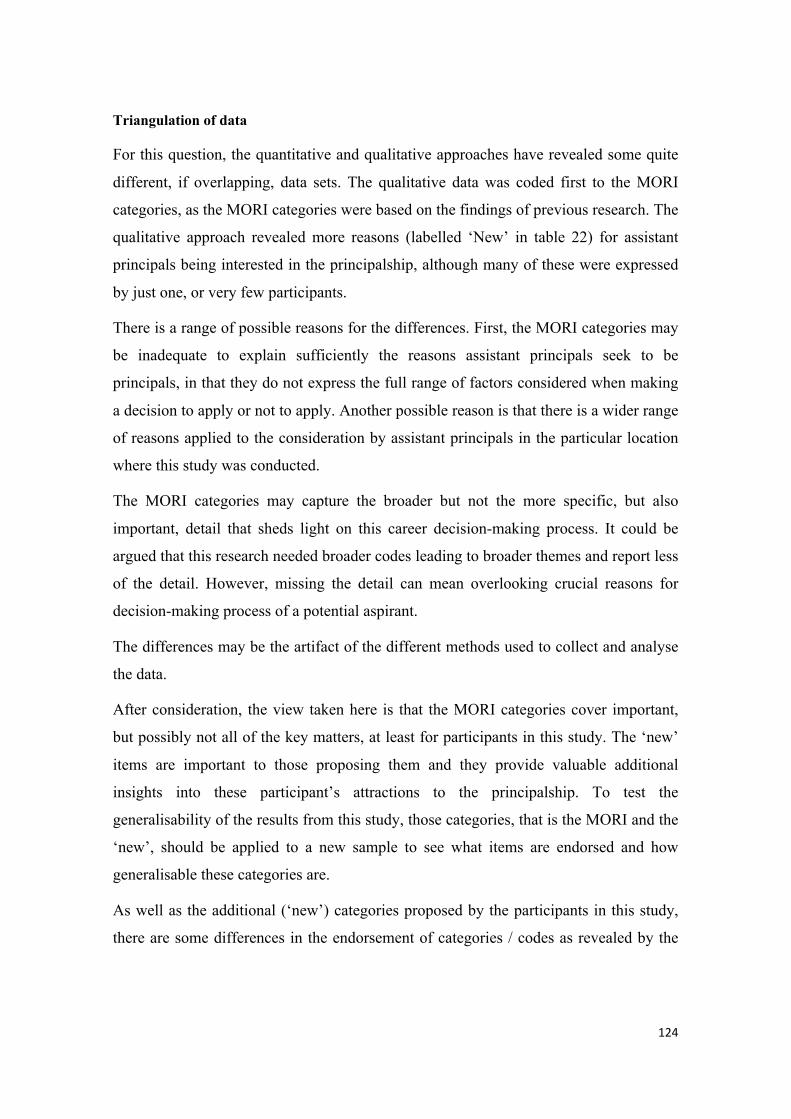
124
Triangulation of data
For this question, the quantitative and qualitative approaches have revealed some quite
different, if overlapping, data sets. The qualitative data was coded first to the MORI
categories, as the MORI categories were based on the findings of previous research. The
qualitative approach revealed more reasons (labelled ‘New’ in table 22) for assistant
principals being interested in the principalship, although many of these were expressed
by just one, or very few participants.
There is a range of possible reasons for the differences. First, the MORI categories may
be inadequate to explain sufficiently the reasons assistant principals seek to be
principals, in that they do not express the full range of factors considered when making
a decision to apply or not to apply. Another possible reason is that there is a wider range
of reasons applied to the consideration by assistant principals in the particular location
where this study was conducted.
The MORI categories may capture the broader but not the more specific, but also
important, detail that sheds light on this career decision-making process. It could be
argued that this research needed broader codes leading to broader themes and report less
of the detail. However, missing the detail can mean overlooking crucial reasons for
decision-making process of a potential aspirant.
The differences may be the artifact of the different methods used to collect and analyse
the data.
After consideration, the view taken here is that the MORI categories cover important,
but possibly not all of the key matters, at least for participants in this study. The ‘new’
items are important to those proposing them and they provide valuable additional
insights into these participant’s attractions to the principalship. To test the
generalisability of the results from this study, those categories, that is the MORI and the
‘new’, should be applied to a new sample to see what items are endorsed and how
generalisable these categories are.
As well as the additional (‘new’) categories proposed by the participants in this study,
there are some differences in the endorsement of categories / codes as revealed by the
125
quantitative and qualitative methods. For example, MORI items most endorsed in the
quantitative data gathering “Job satisfaction / sense of personal achievement’ and ‘Role
is dynamic and varied, not routine’ were not as specifically raised in response to open
ended questions in the interviews. The highest ranked item from the qualitative question
was ranked eighth in the quantitative endorsements.
It might be that the methods create such differences in data sets, for example the
limiting of respondents to just five categories may have an impact.
The qualitative data comes from all interviewees, whereas the quantitative data comes
from just 27 participants who expressed interest or possible interest in the principalship
plus the two who had expressed no career intention. This may create a difference in the
results.
Whatever the reasons for the differences, there is scope for further research on these
matters.
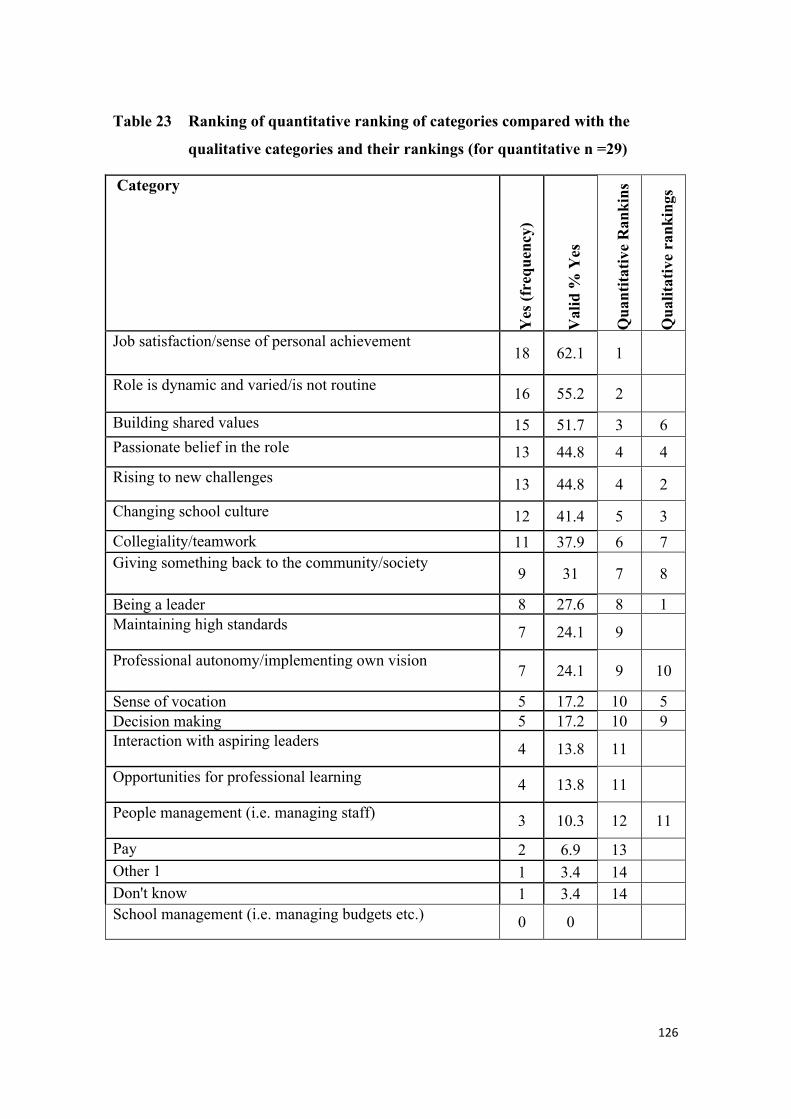
126
Table 23 Ranking of quantitative ranking of categories compared with the
qualitative categories and their rankings (for quantitative n =29)
Category
Yes
(fre
quen
cy)
Val
id %
Yes
Qua
ntita
tive
Ran
kins
Qua
litat
ive
rank
ings
Job satisfaction/sense of personal achievement 18 62.1 1
Role is dynamic and varied/is not routine 16 55.2 2
Building shared values 15 51.7 3 6 Passionate belief in the role 13 44.8 4 4 Rising to new challenges 13 44.8 4 2
Changing school culture 12 41.4 5 3 Collegiality/teamwork 11 37.9 6 7 Giving something back to the community/society
9 31 7 8
Being a leader 8 27.6 8 1 Maintaining high standards 7 24.1 9
Professional autonomy/implementing own vision 7 24.1 9 10
Sense of vocation 5 17.2 10 5 Decision making 5 17.2 10 9 Interaction with aspiring leaders 4 13.8 11
Opportunities for professional learning 4 13.8 11
People management (i.e. managing staff) 3 10.3 12 11
Pay 2 6.9 13 Other 1 1 3.4 14 Don't know 1 3.4 14 School management (i.e. managing budgets etc.) 0 0
127
Reasonsfornotwantingtobecomeaprincipal
Reasons for not wanting to become a principal; Quantitative results
Participants who did not wish to apply for a principal position were asked to indicate
reasons from a list adapted from the MORI study (Stevens et al., 2005). Participants
were asked, “If you do not wish to seek a principal position, why do you NOT want to
become a principal?” Participants who intend to apply or may apply were not required
to complete this item. Participants were invited to endorse up to 5 of 16 options, plus
“Other” and “Don’t know” categories.
The items that were endorsed by most relevant participants was “Stress” (12, 54.4% of
valid responses) and “Other”. Next most endorsed item was “personal priorities/
commitments (e.g. family) (10, 45.5%).
Next most frequently mentioned item was “Other”. Where participants recorded a
specific “other” response it is noted below, see table 23.
Next in frequency was “Administrative demands” and “Responsibility” (7, 31.8%),
“Not an ambition” (5, 22.7%),
At four responses (18.2%) were items “External influence, e.g. from the region,
DEECD”, “Financial responsibilities”, “Less contact with students”, Less involvement
with teaching”, and “Other 2.3.2”.
Three participants (13.6%) only ticked, “Low status/negative media image of the
profession”, and “Isolation” (3, 13.6%), “Problems with recruitment/retention” attracted
2 (2, 9.1%) endorsements.
One (4.5%) respondent endorsed each of the items “Measures of accountability”, “Lack
of strategic leadership by the school council”, “Limited opportunities for new
challenges and new goals”, and “Don’t know 2.3”.
No respondent endorsed “Changes in policies”.
Comparing the responses of participants in this study and those of the MORI
participants, stress was the prime reason for not wanting to become a principal in both
studies. For participants in both studies “Personal priorities/commitments (e.g. family)”
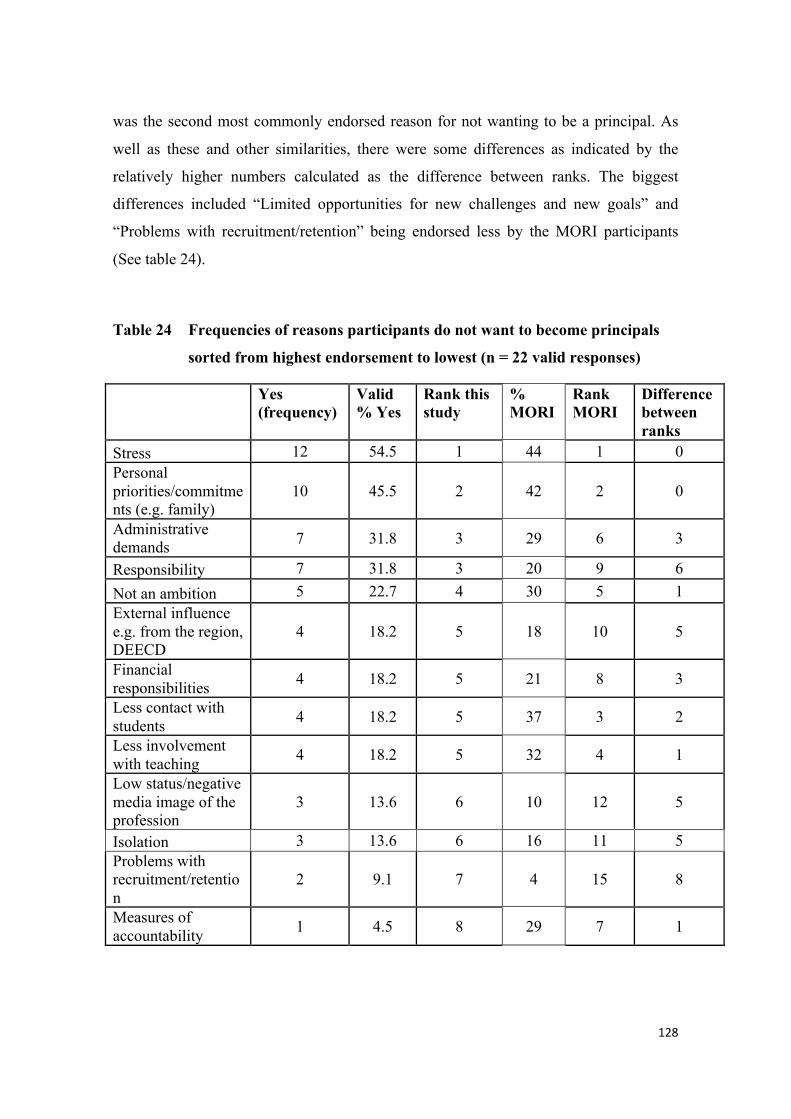
128
was the second most commonly endorsed reason for not wanting to be a principal. As
well as these and other similarities, there were some differences as indicated by the
relatively higher numbers calculated as the difference between ranks. The biggest
differences included “Limited opportunities for new challenges and new goals” and
“Problems with recruitment/retention” being endorsed less by the MORI participants
(See table 24).
Table 24 Frequencies of reasons participants do not want to become principals
sorted from highest endorsement to lowest (n = 22 valid responses)
Yes (frequency)
Valid % Yes
Rank this study
% MORI
Rank MORI
Difference between ranks
Stress 12 54.5 1 44 1 0 Personal priorities/commitments (e.g. family)
10 45.5 2 42 2 0
Administrative demands 7 31.8 3 29 6 3
Responsibility 7 31.8 3 20 9 6 Not an ambition 5 22.7 4 30 5 1 External influence e.g. from the region, DEECD
4 18.2 5 18 10 5
Financial responsibilities 4 18.2 5 21 8 3
Less contact with students 4 18.2 5 37 3 2
Less involvement with teaching 4 18.2 5 32 4 1
Low status/negative media image of the profession
3 13.6 6 10 12 5
Isolation 3 13.6 6 16 11 5 Problems with recruitment/retention
2 9.1 7 4 15 8
Measures of accountability 1 4.5 8 29 7 1
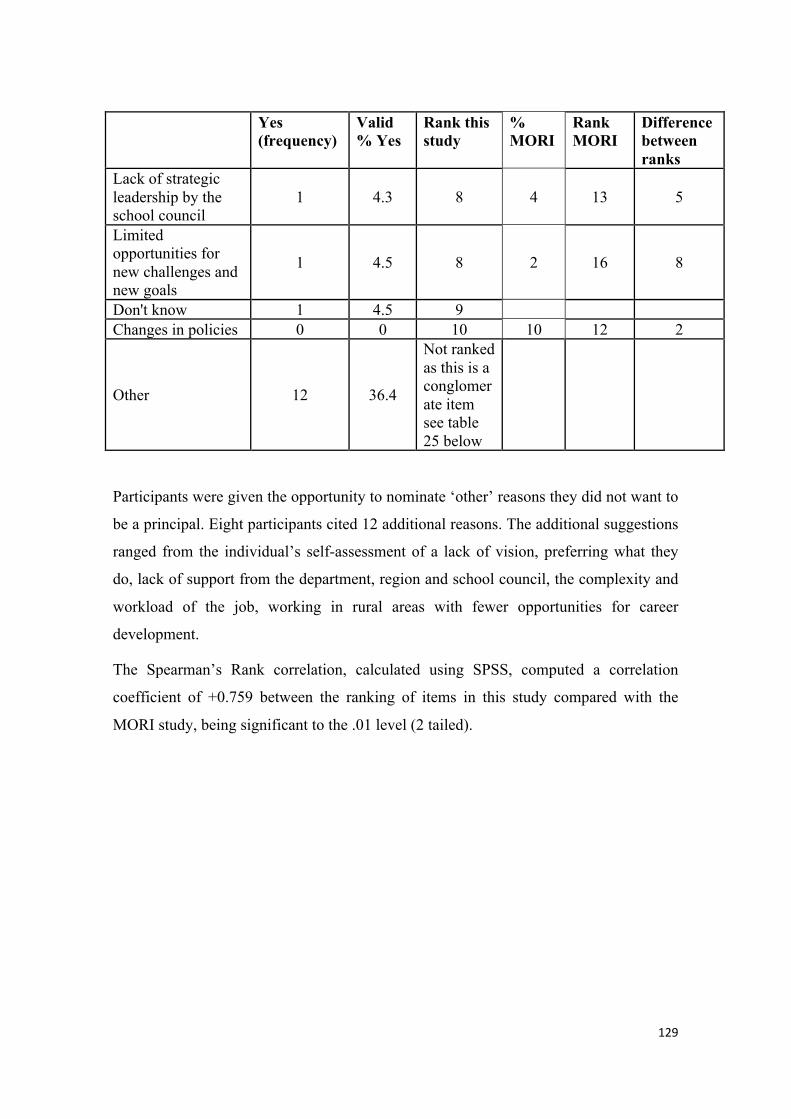
129
Yes (frequency)
Valid % Yes
Rank this study
% MORI
Rank MORI
Difference between ranks
Lack of strategic leadership by the school council
1 4.3 8 4 13 5
Limited opportunities for new challenges and new goals
1 4.5 8 2 16 8
Don't know 1 4.5 9 Changes in policies 0 0 10 10 12 2
Other 12 36.4
Not ranked as this is a conglomerate item see table 25 below
Participants were given the opportunity to nominate ‘other’ reasons they did not want to
be a principal. Eight participants cited 12 additional reasons. The additional suggestions
ranged from the individual’s self-assessment of a lack of vision, preferring what they
do, lack of support from the department, region and school council, the complexity and
workload of the job, working in rural areas with fewer opportunities for career
development.
The Spearman’s Rank correlation, calculated using SPSS, computed a correlation
coefficient of +0.759 between the ranking of items in this study compared with the
MORI study, being significant to the .01 level (2 tailed).
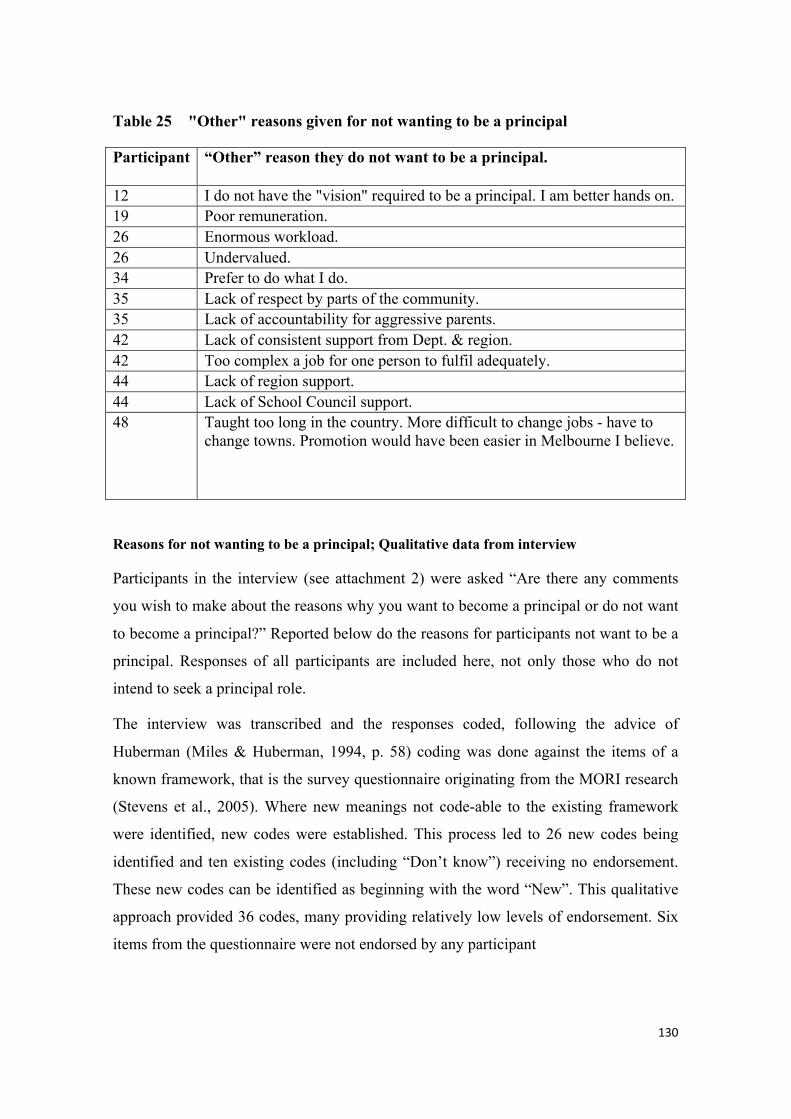
130
Table 25 "Other" reasons given for not wanting to be a principal
Participant “Other” reason they do not want to be a principal.
12 I do not have the "vision" required to be a principal. I am better hands on. 19 Poor remuneration. 26 Enormous workload. 26 Undervalued. 34 Prefer to do what I do. 35 Lack of respect by parts of the community. 35 Lack of accountability for aggressive parents. 42 Lack of consistent support from Dept. & region. 42 Too complex a job for one person to fulfil adequately. 44 Lack of region support. 44 Lack of School Council support. 48 Taught too long in the country. More difficult to change jobs - have to
change towns. Promotion would have been easier in Melbourne I believe.
Reasons for not wanting to be a principal; Qualitative data from interview
Participants in the interview (see attachment 2) were asked “Are there any comments
you wish to make about the reasons why you want to become a principal or do not want
to become a principal?” Reported below do the reasons for participants not want to be a
principal. Responses of all participants are included here, not only those who do not
intend to seek a principal role.
The interview was transcribed and the responses coded, following the advice of
Huberman (Miles & Huberman, 1994, p. 58) coding was done against the items of a
known framework, that is the survey questionnaire originating from the MORI research
(Stevens et al., 2005). Where new meanings not code-able to the existing framework
were identified, new codes were established. This process led to 26 new codes being
identified and ten existing codes (including “Don’t know”) receiving no endorsement.
These new codes can be identified as beginning with the word “New”. This qualitative
approach provided 36 codes, many providing relatively low levels of endorsement. Six
items from the questionnaire were not endorsed by any participant
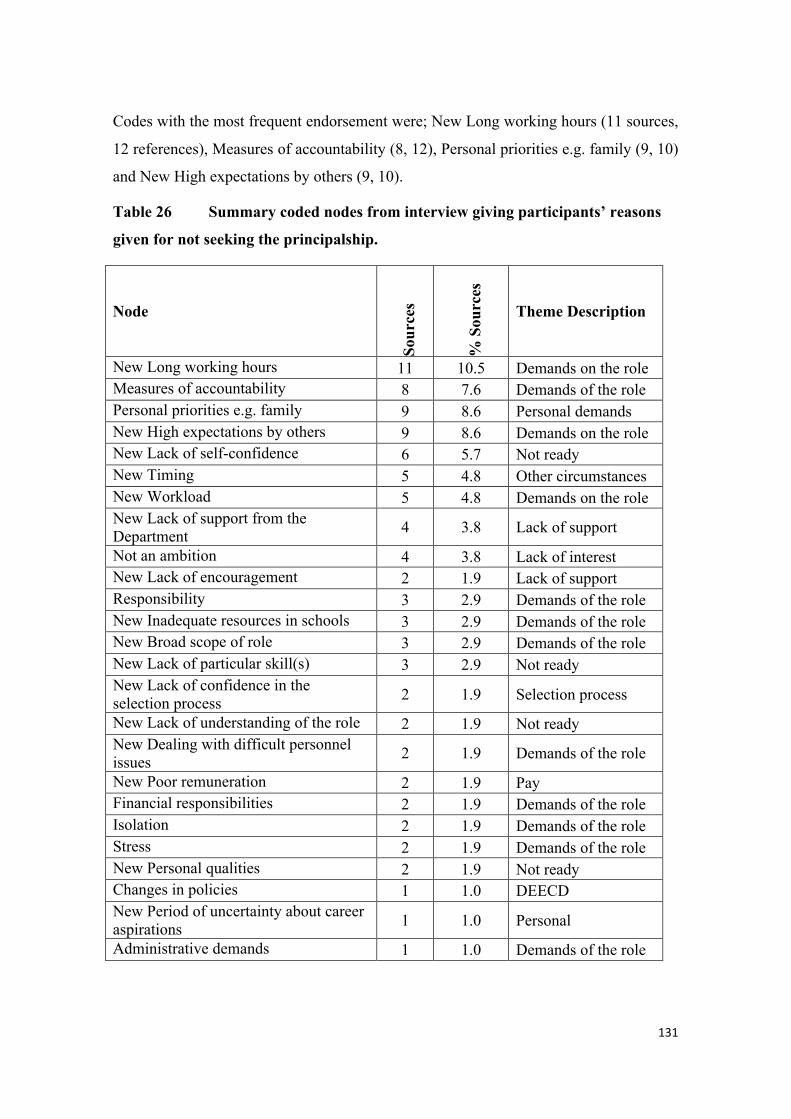
131
Codes with the most frequent endorsement were; New Long working hours (11 sources,
12 references), Measures of accountability (8, 12), Personal priorities e.g. family (9, 10)
and New High expectations by others (9, 10).
Table 26 Summary coded nodes from interview giving participants’ reasons
given for not seeking the principalship.
Node
Sour
ces
% S
ourc
es
Theme Description
New Long working hours 11 10.5 Demands on the role Measures of accountability 8 7.6 Demands of the role Personal priorities e.g. family 9 8.6 Personal demands New High expectations by others 9 8.6 Demands on the role New Lack of self-confidence 6 5.7 Not ready New Timing 5 4.8 Other circumstances New Workload 5 4.8 Demands on the role New Lack of support from the Department 4 3.8 Lack of support
Not an ambition 4 3.8 Lack of interest New Lack of encouragement 2 1.9 Lack of support Responsibility 3 2.9 Demands of the role New Inadequate resources in schools 3 2.9 Demands of the role New Broad scope of role 3 2.9 Demands of the role New Lack of particular skill(s) 3 2.9 Not ready New Lack of confidence in the selection process 2 1.9 Selection process
New Lack of understanding of the role 2 1.9 Not ready New Dealing with difficult personnel issues 2 1.9 Demands of the role
New Poor remuneration 2 1.9 Pay Financial responsibilities 2 1.9 Demands of the role Isolation 2 1.9 Demands of the role Stress 2 1.9 Demands of the role New Personal qualities 2 1.9 Not ready Changes in policies 1 1.0 DEECD New Period of uncertainty about career aspirations 1 1.0 Personal
Administrative demands 1 1.0 Demands of the role
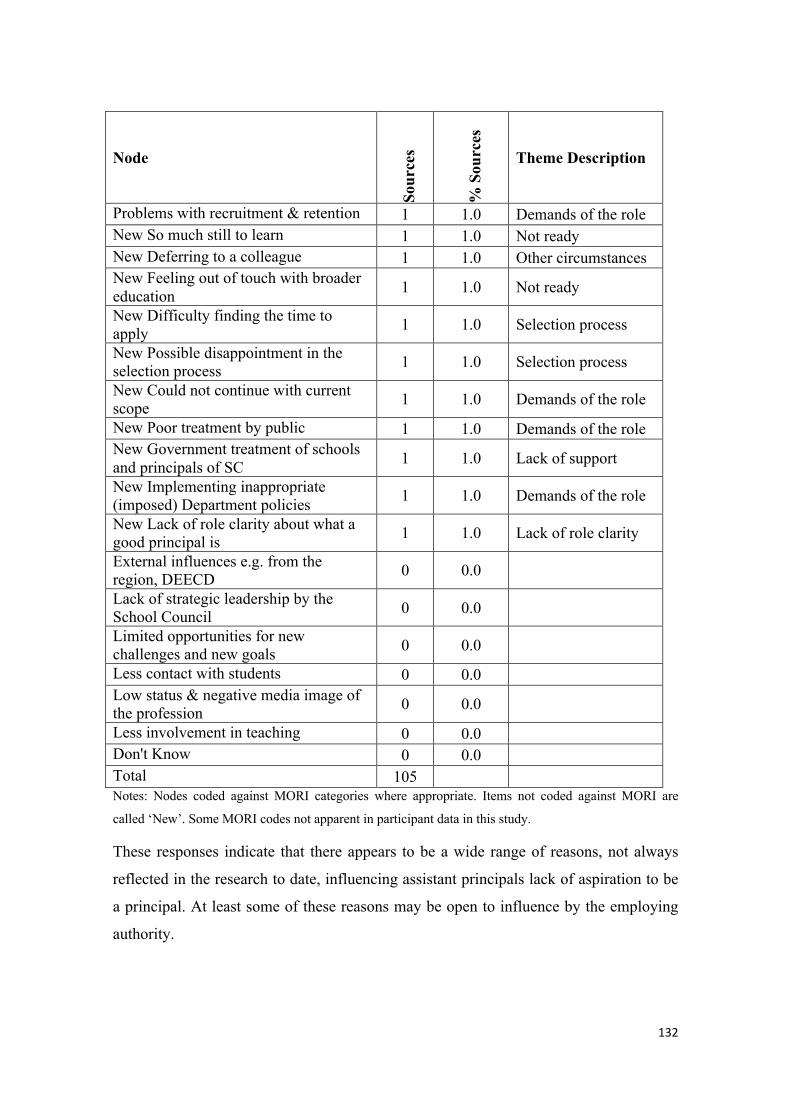
132
Node
Sour
ces
% S
ourc
es
Theme Description
Problems with recruitment & retention 1 1.0 Demands of the role New So much still to learn 1 1.0 Not ready New Deferring to a colleague 1 1.0 Other circumstances New Feeling out of touch with broader education 1 1.0 Not ready
New Difficulty finding the time to apply 1 1.0 Selection process
New Possible disappointment in the selection process 1 1.0 Selection process
New Could not continue with current scope 1 1.0 Demands of the role
New Poor treatment by public 1 1.0 Demands of the role New Government treatment of schools and principals of SC 1 1.0 Lack of support
New Implementing inappropriate (imposed) Department policies 1 1.0 Demands of the role
New Lack of role clarity about what a good principal is 1 1.0 Lack of role clarity
External influences e.g. from the region, DEECD 0 0.0
Lack of strategic leadership by the School Council 0 0.0
Limited opportunities for new challenges and new goals 0 0.0
Less contact with students 0 0.0 Low status & negative media image of the profession 0 0.0
Less involvement in teaching 0 0.0 Don't Know 0 0.0 Total 105 Notes: Nodes coded against MORI categories where appropriate. Items not coded against MORI are
called ‘New’. Some MORI codes not apparent in participant data in this study.
These responses indicate that there appears to be a wide range of reasons, not always
reflected in the research to date, influencing assistant principals lack of aspiration to be
a principal. At least some of these reasons may be open to influence by the employing
authority.
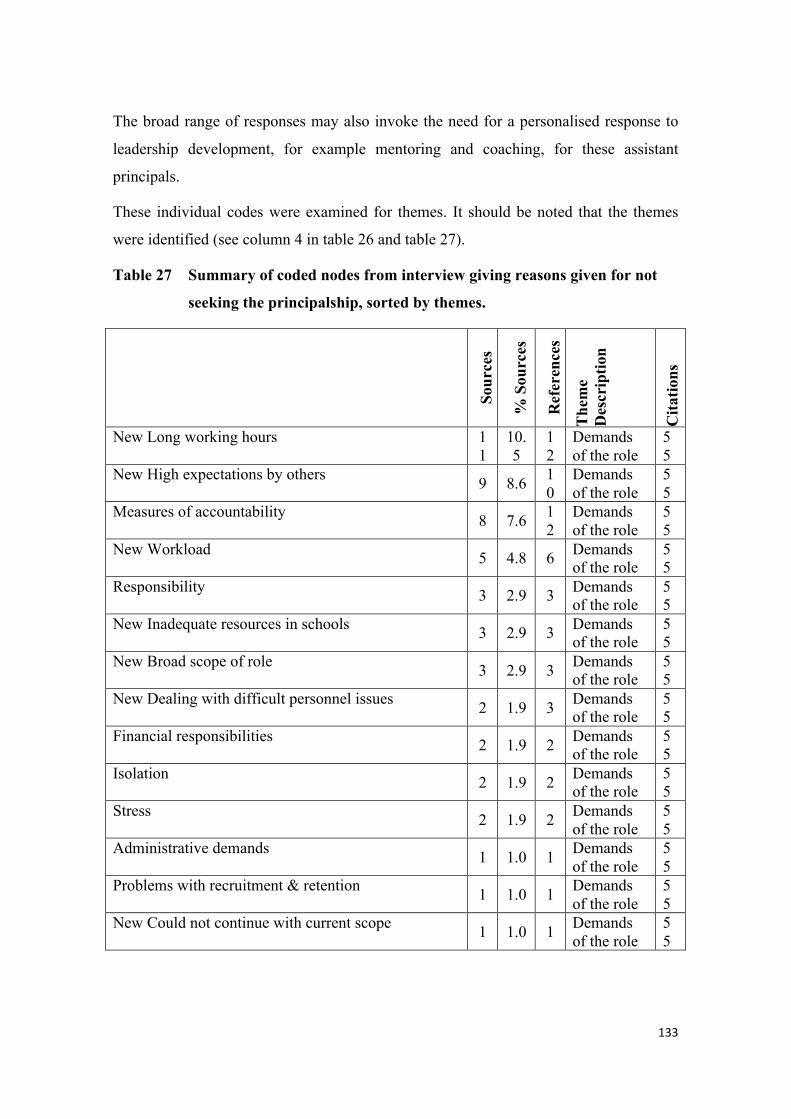
133
The broad range of responses may also invoke the need for a personalised response to
leadership development, for example mentoring and coaching, for these assistant
principals.
These individual codes were examined for themes. It should be noted that the themes
were identified (see column 4 in table 26 and table 27).
Table 27 Summary of coded nodes from interview giving reasons given for not
seeking the principalship, sorted by themes.
Sour
ces
% S
ourc
es
Ref
eren
ces
The
me
Des
crip
tion
Cita
tions
New Long working hours 11
10.5
12
Demands of the role
55
New High expectations by others 9 8.6 10
Demands of the role
55
Measures of accountability 8 7.6 12
Demands of the role
55
New Workload 5 4.8 6 Demands of the role
55
Responsibility 3 2.9 3 Demands of the role
55
New Inadequate resources in schools 3 2.9 3 Demands of the role
55
New Broad scope of role 3 2.9 3 Demands of the role
55
New Dealing with difficult personnel issues 2 1.9 3 Demands of the role
55
Financial responsibilities 2 1.9 2 Demands of the role
55
Isolation 2 1.9 2 Demands of the role
55
Stress 2 1.9 2 Demands of the role
55
Administrative demands 1 1.0 1 Demands of the role
55
Problems with recruitment & retention 1 1.0 1 Demands of the role
55
New Could not continue with current scope 1 1.0 1 Demands of the role
55
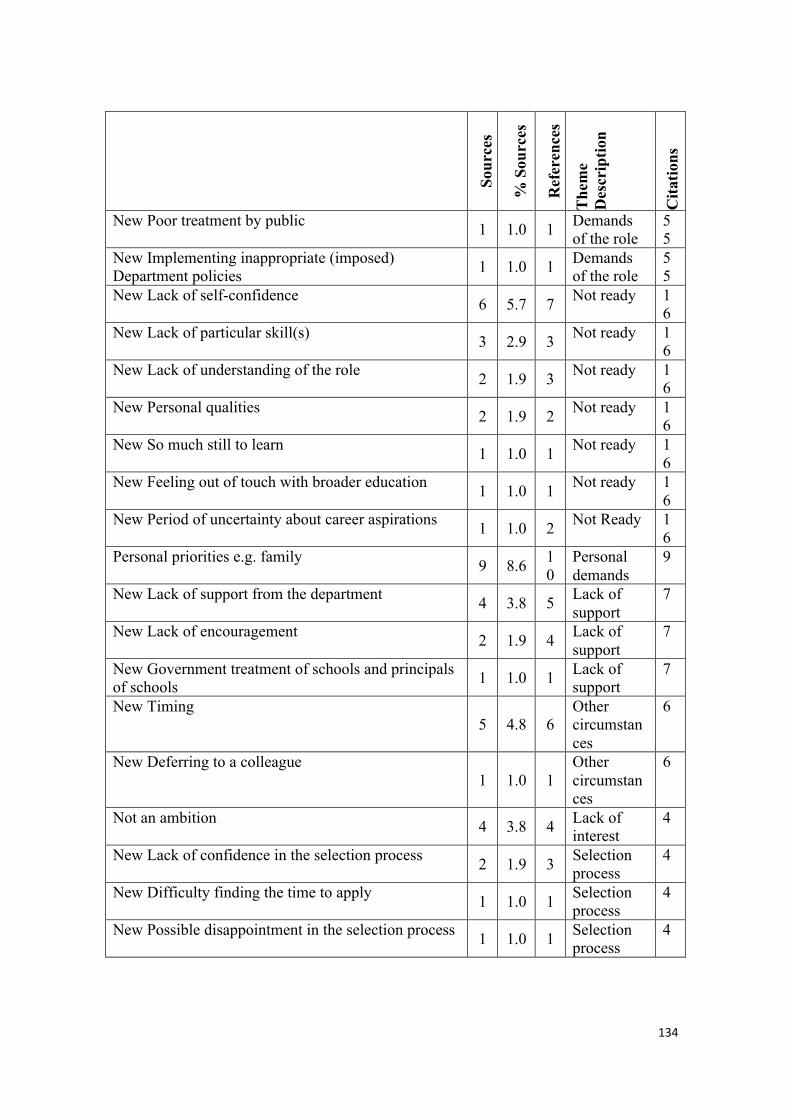
134
Sour
ces
% S
ourc
es
Ref
eren
ces
The
me
Des
crip
tion
Cita
tions
New Poor treatment by public 1 1.0 1 Demands of the role
55
New Implementing inappropriate (imposed) Department policies 1 1.0 1 Demands
of the role 55
New Lack of self-confidence 6 5.7 7 Not ready 16
New Lack of particular skill(s) 3 2.9 3 Not ready 16
New Lack of understanding of the role 2 1.9 3 Not ready 16
New Personal qualities 2 1.9 2 Not ready 16
New So much still to learn 1 1.0 1 Not ready 16
New Feeling out of touch with broader education 1 1.0 1 Not ready 16
New Period of uncertainty about career aspirations 1 1.0 2 Not Ready 16
Personal priorities e.g. family 9 8.6 10
Personal demands
9
New Lack of support from the department 4 3.8 5 Lack of support
7
New Lack of encouragement 2 1.9 4 Lack of support
7
New Government treatment of schools and principals of schools 1 1.0 1 Lack of
support 7
New Timing 5 4.8 6
Other circumstances
6
New Deferring to a colleague 1 1.0 1
Other circumstances
6
Not an ambition 4 3.8 4 Lack of interest
4
New Lack of confidence in the selection process 2 1.9 3 Selection process
4
New Difficulty finding the time to apply 1 1.0 1 Selection process
4
New Possible disappointment in the selection process 1 1.0 1 Selection process
4
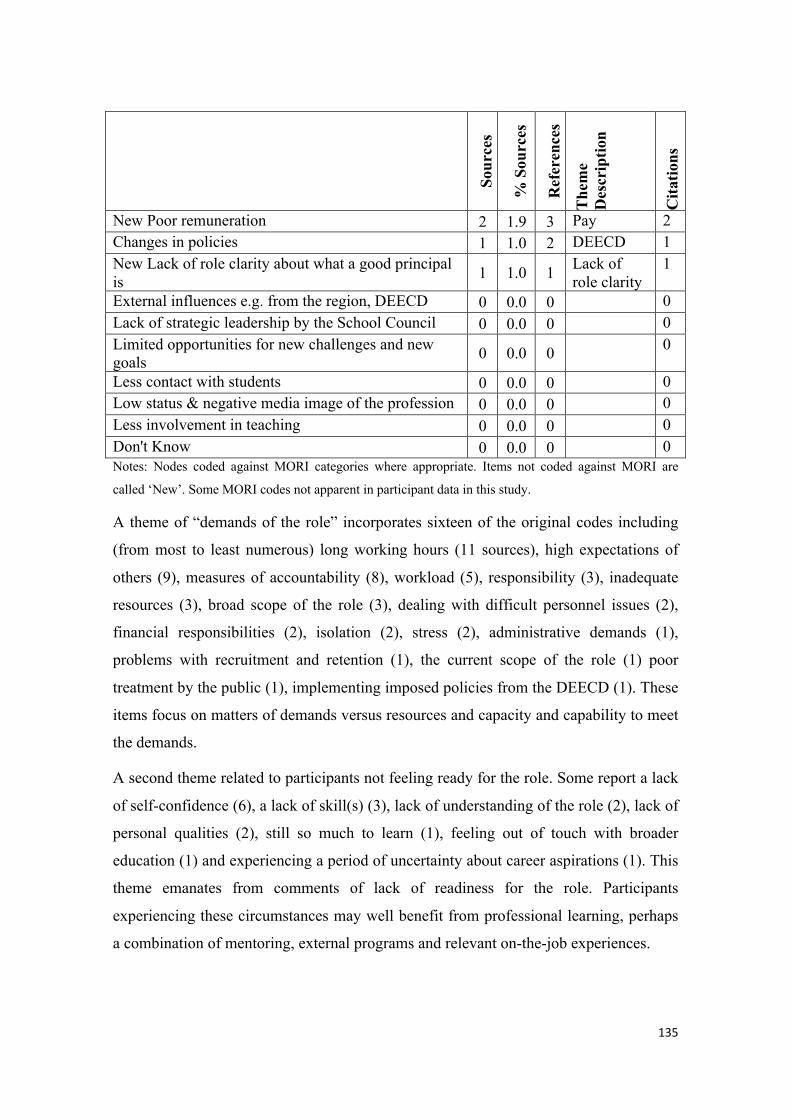
135
Sour
ces
% S
ourc
es
Ref
eren
ces
The
me
Des
crip
tion
Cita
tions
New Poor remuneration 2 1.9 3 Pay 2 Changes in policies 1 1.0 2 DEECD 1 New Lack of role clarity about what a good principal is 1 1.0 1 Lack of
role clarity 1
External influences e.g. from the region, DEECD 0 0.0 0 0 Lack of strategic leadership by the School Council 0 0.0 0 0 Limited opportunities for new challenges and new goals 0 0.0 0 0
Less contact with students 0 0.0 0 0 Low status & negative media image of the profession 0 0.0 0 0 Less involvement in teaching 0 0.0 0 0 Don't Know 0 0.0 0 0 Notes: Nodes coded against MORI categories where appropriate. Items not coded against MORI are
called ‘New’. Some MORI codes not apparent in participant data in this study.
A theme of “demands of the role” incorporates sixteen of the original codes including
(from most to least numerous) long working hours (11 sources), high expectations of
others (9), measures of accountability (8), workload (5), responsibility (3), inadequate
resources (3), broad scope of the role (3), dealing with difficult personnel issues (2),
financial responsibilities (2), isolation (2), stress (2), administrative demands (1),
problems with recruitment and retention (1), the current scope of the role (1) poor
treatment by the public (1), implementing imposed policies from the DEECD (1). These
items focus on matters of demands versus resources and capacity and capability to meet
the demands.
A second theme related to participants not feeling ready for the role. Some report a lack
of self-confidence (6), a lack of skill(s) (3), lack of understanding of the role (2), lack of
personal qualities (2), still so much to learn (1), feeling out of touch with broader
education (1) and experiencing a period of uncertainty about career aspirations (1). This
theme emanates from comments of lack of readiness for the role. Participants
experiencing these circumstances may well benefit from professional learning, perhaps
a combination of mentoring, external programs and relevant on-the-job experiences.
136
A third theme relates to a lack of support from the department (4), lack of
encouragement (2), and the government's treatment of schools and principals (1). This
theme seems to capture a perceived lack of support for the role of principal.
A fourth theme relates to the selection process. Two participants commented on a lack
of confidence in the selection process (2), others commented on the difficulty in finding
the time to apply for a principal position (1) and possible disappointment in the
selection process (1).
For some there were ‘other circumstances’. Some (5) report that timing was a reason for
them not pursuing the principalship and one ‘deferring to a colleague’ was a reason not
to apply (1).
Poor remuneration was mentioned by two participants as a reason not to apply. Four
participants indicated the principalship was not an ambition of theirs.
Items in the MORI survey not detected in the interview data were: External influences
e.g. from region, education department; and lack of strategic direction from the School
Council.
Triangulation of Method.
As reported earlier, the interview revealed a range of ‘new’ (additional to those covered
by the MORI study) reasons for not seeking the principalship. Based on initial
descriptive coding, 25 new codes were revealed above and beyond the 16 codes on the
MORI survey. Many of the new codes were posed by individuals. Although small in
number, some were endorsed at least as frequently as the MORI categories, which have
emerged from a review of earlier literature. Codes do allow themselves to be organised
into themes as described.
137
Whattypeofschoolsareyouwillingtolead?
What type of schools are you willing to lead? (Quantitative)
In the questionnaire (attachment 1) all participants were invited to indicate the type of
school they would be willing to lead. Specifically, the question to them was “If you
were seeking a principalship, would you be willing to work in any of the following
types of school?” Participants were invited to tick as many of the 15 types of schools
(these were categories from the MORI study, with terminology localised during a small
pilot of the questionnaire) as they would be prepared to lead. All 48 participants
responded to this question.
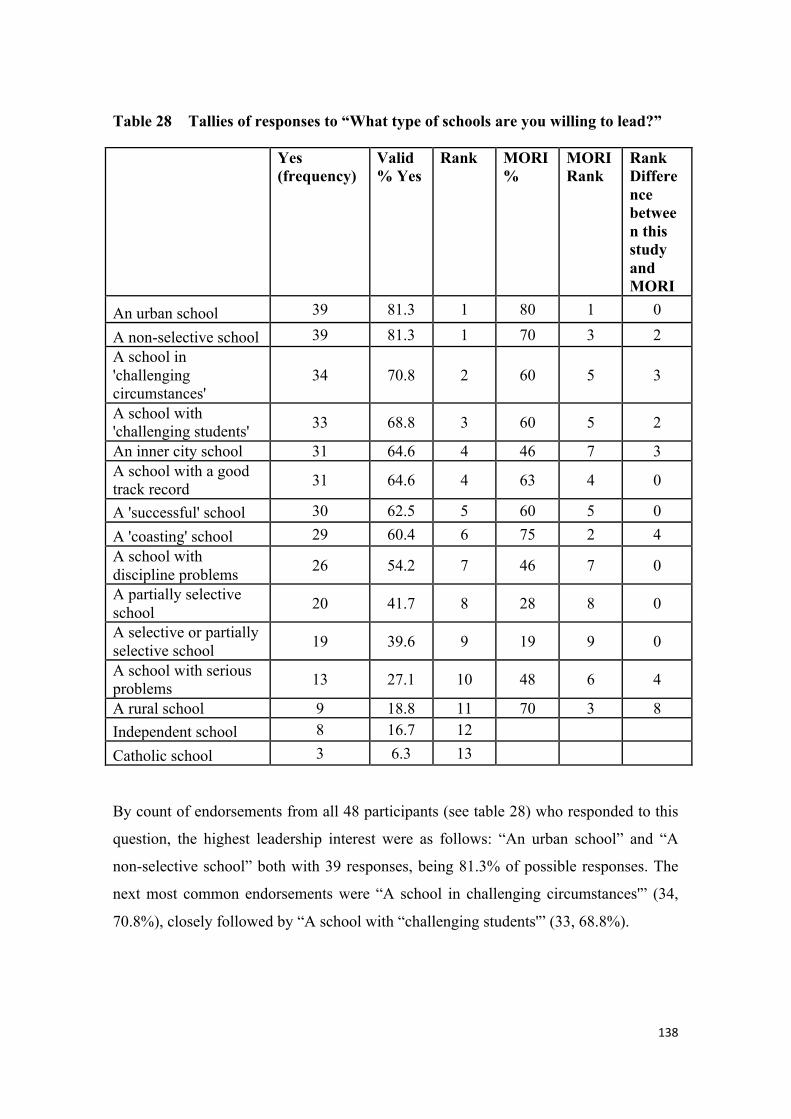
138
Table 28 Tallies of responses to “What type of schools are you willing to lead?”
Yes (frequency)
Valid % Yes
Rank MORI %
MORI Rank
Rank Difference between this study and MORI
An urban school 39 81.3 1 80 1 0
A non-selective school 39 81.3 1 70 3 2 A school in 'challenging circumstances'
34 70.8 2 60 5 3
A school with 'challenging students' 33 68.8 3 60 5 2
An inner city school 31 64.6 4 46 7 3 A school with a good track record 31 64.6 4 63 4 0
A 'successful' school 30 62.5 5 60 5 0 A 'coasting' school 29 60.4 6 75 2 4 A school with discipline problems 26 54.2 7 46 7 0
A partially selective school 20 41.7 8 28 8 0
A selective or partially selective school 19 39.6 9 19 9 0
A school with serious problems 13 27.1 10 48 6 4
A rural school 9 18.8 11 70 3 8 Independent school 8 16.7 12 Catholic school 3 6.3 13
By count of endorsements from all 48 participants (see table 28) who responded to this
question, the highest leadership interest were as follows: “An urban school” and “A
non-selective school” both with 39 responses, being 81.3% of possible responses. The
next most common endorsements were “A school in challenging circumstances'” (34,
70.8%), closely followed by “A school with “challenging students'” (33, 68.8%).
139
Two school types scored equally, namely “An inner city school” (31, 64.6%) and “A
school with a good track record” (31, 64.6%), followed by “A ‘successful’ school” (30,
62.5%), and a “A ‘coasting’ school’” (29, 60.4%).
A majority of respondents (26, 54.2%) indicated a willingness to work in “A school
with discipline problems”.
Less than half of respondents showed willingness to lead “A partially selective school”
(20, 41.7%) and “A selective or partially selective school” (19, 39.6%)
Just over a quarter (13, 27.1%) of respondents indicated a willingness to lead “A school
with serious problems”.
The least preferred types of schools were for Catholic School (3, 6.3%), Independent
School (8, 16.7%) and Rural School (9, 18.8%).
Spearman’s Rank Correlation between this study and the MORI study of +0.639 is
significant at the 0.05 level, 2-tailed. The largest difference was that rural schools were
more popular with the MORI deputy headteachers. This may be because this current
study included only assistant principals from urban schools, whereas the MORI study
included participants from non-metropolitan areas.
Types of School you would be willing to lead (qualitative)
In interview, 46 of the 48 participants were asked “Are there any comments you would
like to make about the types of schools you would be willing to lead?” In interview,
answers were given, transcribed and coded. The categories used in the survey were used
as the starting point for coding, as recommended by Miles and Huberman (Miles &
Huberman, 1994). Where these codes did not explain what the interviewees were
saying, new codes were established. The list of codes in the column second from the left
of table 28 are both the codes from the MORI research (Stevens et al., 2005) and new
codes generated by the interviews in this research. All of these new codes can be
identified as they begin with the word “New”.
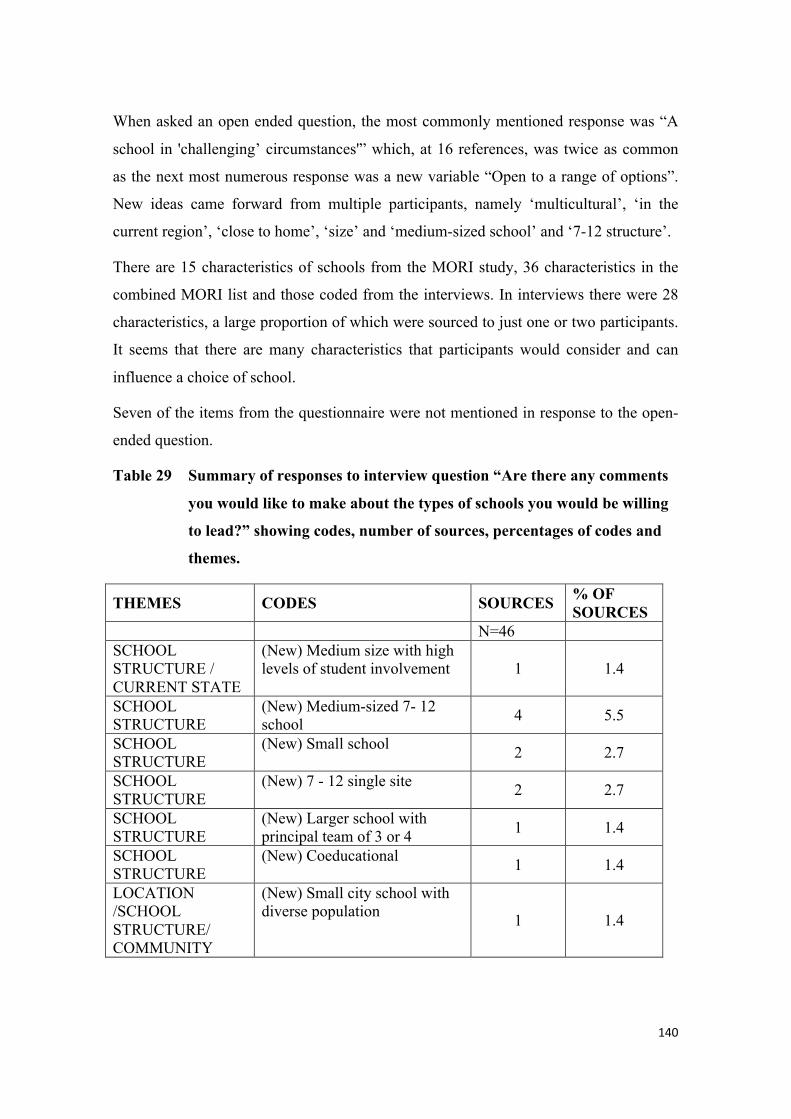
140
When asked an open ended question, the most commonly mentioned response was “A
school in 'challenging’ circumstances'” which, at 16 references, was twice as common
as the next most numerous response was a new variable “Open to a range of options”.
New ideas came forward from multiple participants, namely ‘multicultural’, ‘in the
current region’, ‘close to home’, ‘size’ and ‘medium-sized school’ and ‘7-12 structure’.
There are 15 characteristics of schools from the MORI study, 36 characteristics in the
combined MORI list and those coded from the interviews. In interviews there were 28
characteristics, a large proportion of which were sourced to just one or two participants.
It seems that there are many characteristics that participants would consider and can
influence a choice of school.
Seven of the items from the questionnaire were not mentioned in response to the open-
ended question.
Table 29 Summary of responses to interview question “Are there any comments
you would like to make about the types of schools you would be willing
to lead?” showing codes, number of sources, percentages of codes and
themes.
THEMES CODES SOURCES % OF SOURCES
N=46 SCHOOL STRUCTURE / CURRENT STATE
(New) Medium size with high levels of student involvement 1 1.4
SCHOOL STRUCTURE
(New) Medium-sized 7- 12 school 4 5.5
SCHOOL STRUCTURE
(New) Small school 2 2.7
SCHOOL STRUCTURE
(New) 7 - 12 single site 2 2.7
SCHOOL STRUCTURE
(New) Larger school with principal team of 3 or 4 1 1.4
SCHOOL STRUCTURE
(New) Coeducational 1 1.4
LOCATION /SCHOOL STRUCTURE/ COMMUNITY
(New) Small city school with diverse population 1 1.4
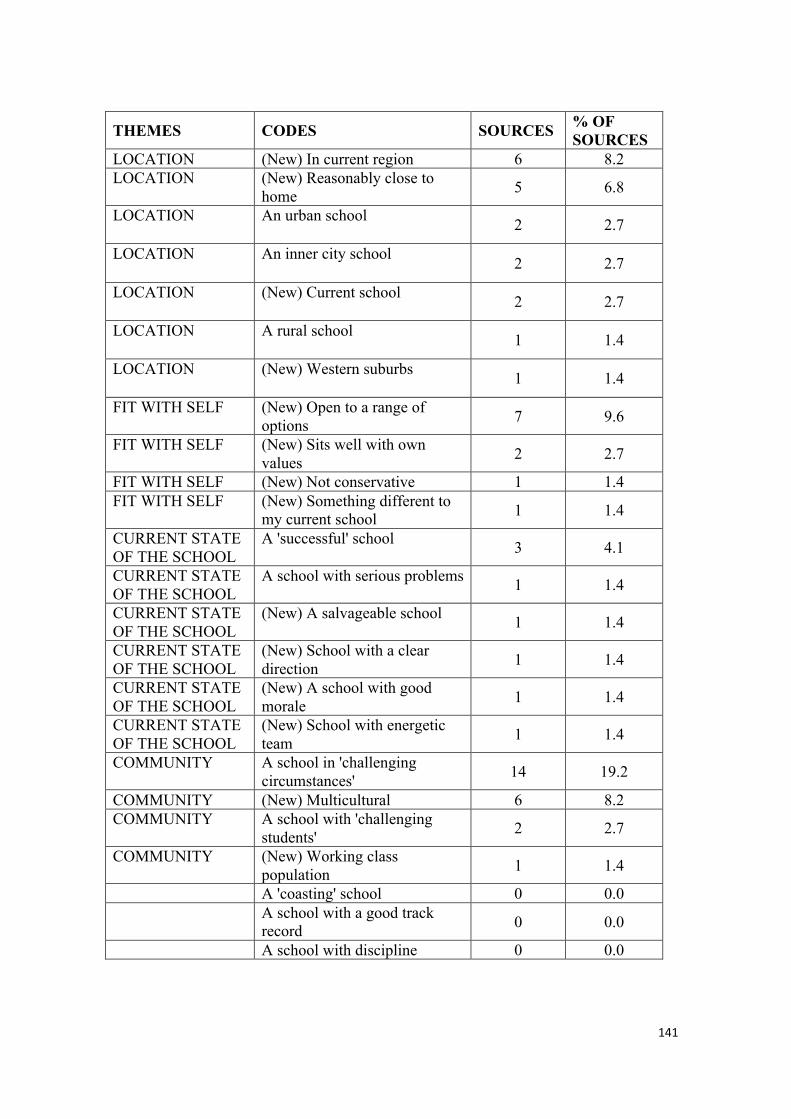
141
THEMES CODES SOURCES % OF SOURCES
LOCATION (New) In current region 6 8.2 LOCATION (New) Reasonably close to
home 5 6.8
LOCATION An urban school 2 2.7
LOCATION An inner city school 2 2.7
LOCATION (New) Current school 2 2.7
LOCATION A rural school 1 1.4
LOCATION (New) Western suburbs 1 1.4
FIT WITH SELF (New) Open to a range of options 7 9.6
FIT WITH SELF (New) Sits well with own values 2 2.7
FIT WITH SELF (New) Not conservative 1 1.4 FIT WITH SELF (New) Something different to
my current school 1 1.4
CURRENT STATE OF THE SCHOOL
A 'successful' school 3 4.1
CURRENT STATE OF THE SCHOOL
A school with serious problems 1 1.4
CURRENT STATE OF THE SCHOOL
(New) A salvageable school 1 1.4
CURRENT STATE OF THE SCHOOL
(New) School with a clear direction 1 1.4
CURRENT STATE OF THE SCHOOL
(New) A school with good morale 1 1.4
CURRENT STATE OF THE SCHOOL
(New) School with energetic team 1 1.4
COMMUNITY A school in 'challenging circumstances' 14 19.2
COMMUNITY (New) Multicultural 6 8.2 COMMUNITY A school with 'challenging
students' 2 2.7
COMMUNITY (New) Working class population 1 1.4
A 'coasting' school 0 0.0 A school with a good track
record 0 0.0
A school with discipline 0 0.0
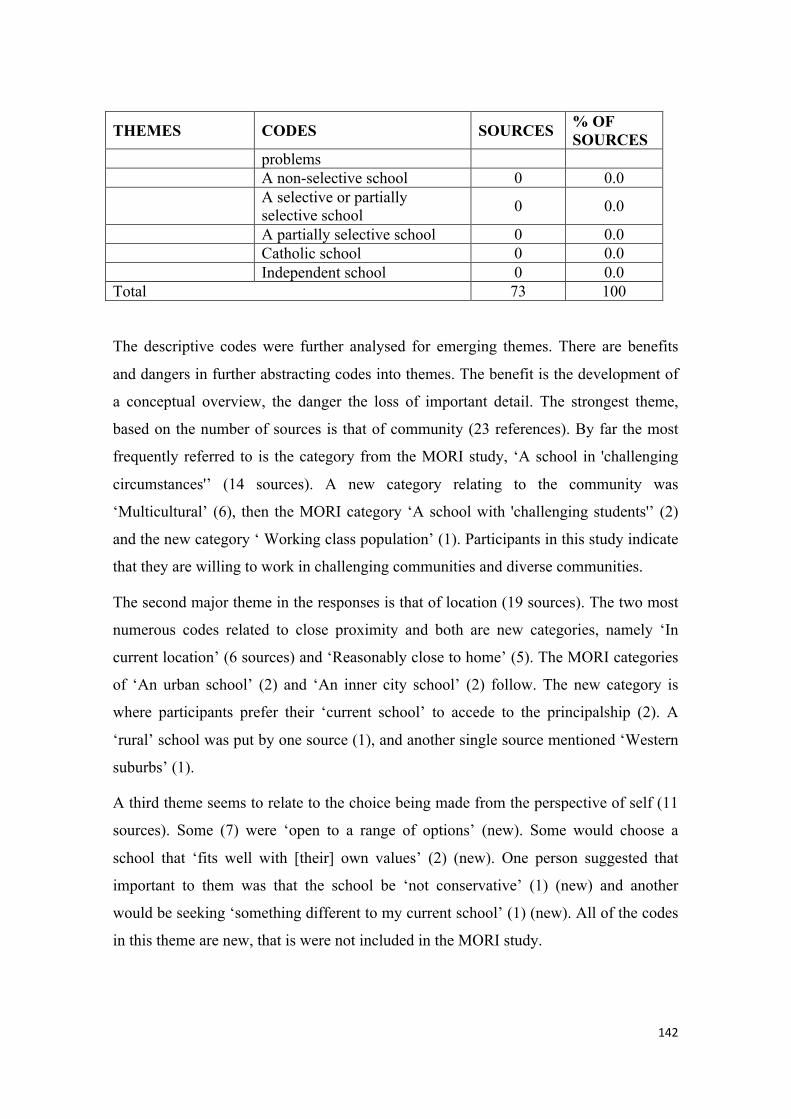
142
THEMES CODES SOURCES % OF SOURCES
problems A non-selective school 0 0.0 A selective or partially
selective school 0 0.0
A partially selective school 0 0.0 Catholic school 0 0.0 Independent school 0 0.0 Total 73 100
The descriptive codes were further analysed for emerging themes. There are benefits
and dangers in further abstracting codes into themes. The benefit is the development of
a conceptual overview, the danger the loss of important detail. The strongest theme,
based on the number of sources is that of community (23 references). By far the most
frequently referred to is the category from the MORI study, ‘A school in 'challenging
circumstances'’ (14 sources). A new category relating to the community was
‘Multicultural’ (6), then the MORI category ‘A school with 'challenging students'’ (2)
and the new category ‘ Working class population’ (1). Participants in this study indicate
that they are willing to work in challenging communities and diverse communities.
The second major theme in the responses is that of location (19 sources). The two most
numerous codes related to close proximity and both are new categories, namely ‘In
current location’ (6 sources) and ‘Reasonably close to home’ (5). The MORI categories
of ‘An urban school’ (2) and ‘An inner city school’ (2) follow. The new category is
where participants prefer their ‘current school’ to accede to the principalship (2). A
‘rural’ school was put by one source (1), and another single source mentioned ‘Western
suburbs’ (1).
A third theme seems to relate to the choice being made from the perspective of self (11
sources). Some (7) were ‘open to a range of options’ (new). Some would choose a
school that ‘fits well with [their] own values’ (2) (new). One person suggested that
important to them was that the school be ‘not conservative’ (1) (new) and another
would be seeking ‘something different to my current school’ (1) (new). All of the codes
in this theme are new, that is were not included in the MORI study.
143
All codes making up the fourth theme, school structure (10 sources), were not addressed
in the MORI categories. Considerations from participants relating to the structure of a
school they would be prepared to lead were; ‘medium-sized 7-12 school’ (4), ‘small
school’ (2), ‘7-12 single site’ (2), ‘larger school with principal team of 3 or 4’ (1), and
‘coeducational’ (1).
The fifth theme extracted from the descriptive codes is the current state of the school (8
sources). There is a mix of specific preferences within this theme, including four
considerations not in the MORI study. Nodes included in this theme are as follows; ‘a
successful school’ (3) (MORI), ‘a school with serious problems’ (1) (MORI), ‘a
salvageable school’ (1) (new), a ‘school with a clear direction’ (1) (new), a ‘school with
good morale’ (1) (new), and a ‘school with an energetic team’ (1) (new). This theme
reinforces that potential leaders look for different things in schools they may lead.
There are combinations of these individual themes and nodes, examples of which are a
combination of school structure and current state, namely ‘medium size school with
high levels of student involvement’ (1), and combination of three themes of location,
school structure and community (1) namely, Small city school with diverse population
(1).
In producing these themes I am still left with the view than the data at the descriptive
code level is vital to address this problem being investigated in this research, that is
understanding what turns out to be the numerous and diverse factors that related to these
research questions.
For participants in this study, there are a much larger number of school characteristics
than are reported in the MORI study to impact on willingness to apply than accounted
for in the MORI s research.
Other career options (quantitative)
In the postal questionnaire (see attachment 1), participants were asked “What else do
you wish to do if you are not seeking a principalship?” Seven options were given based
144
on the MORI research (Stevens et al., 2005) plus an “Other” where participants were
asked to explain. Participants were invited to tick all of the options that applied. Forty-
four participants responded to this question.
By far the most frequent response was for the respondents to “Remain as an assistant
principal in my current school” with 33 responses, 75% of valid responses. This item
had almost twice as many endorsements as the next most popular item which is “Seek a
role as assistant principal or similar position in another school” (17, 38.6%). The option
to “Take up a career outside of education” was close behind in endorsements (16,
36.4%). Next in frequency came “Retirement/ early retirement” (12, 27.3%), “Take up a
regional position” (11, 25.0%), “Become a consultant/trainer” (9, 20.5%), “Change to a
career in further or higher education e.g. lecturer, academic researcher” (5, 11.4%).
Three comments were made under the “Other” option, namely “perhaps work overseas”
(participant 12), “go back to university” (participant 14), and “return to teaching role”
(participant 40). The latter, though only mentioned once, may represent another
category of response to this question which could be included in future research.
Responses of the MORI deputy principals, despite quite a different population were
similar, with remaining in current school as an assistant principal / deputy head teacher
the most common response. However the Spearman’s rank correlation of +0.757
indicates a significant difference in the ranks at the .05 level (2 tailed).
Compared with the assistant principals of elementary, middle and high schools in
Orange County where 25% wanted to remain in their current role (Oliver, 2003), a far
greater proportion in this study wish to stay in their current role. In the Orange county
study 18% wanted to saw district positions as options and other options accounted for
just 14% of respondents. Participants in the Orange County study were over all younger
than those in this study, and this age difference may have had an impact.
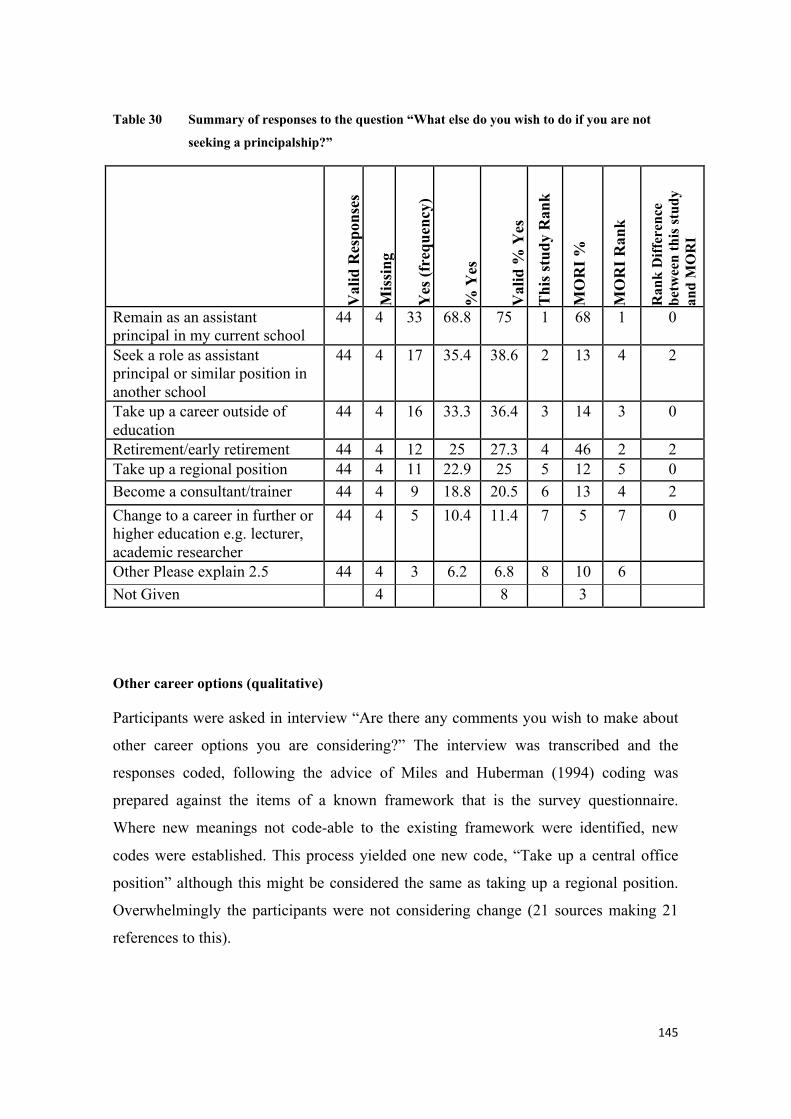
145
Table 30 Summary of responses to the question “What else do you wish to do if you are not
seeking a principalship?”
Val
id R
espo
nses
Mis
sing
Yes
(fre
quen
cy)
% Y
es
Val
id %
Yes
T
his s
tudy
Ran
k
MO
RI %
MO
RI R
ank
Ran
k D
iffer
ence
be
twee
n th
is st
udy
and
MO
RI
Remain as an assistant principal in my current school
44 4 33 68.8 75 1 68 1 0
Seek a role as assistant principal or similar position in another school
44 4 17 35.4 38.6 2 13 4 2
Take up a career outside of education
44 4 16 33.3 36.4 3 14 3 0
Retirement/early retirement 44 4 12 25 27.3 4 46 2 2 Take up a regional position 44 4 11 22.9 25 5 12 5 0 Become a consultant/trainer 44 4 9 18.8 20.5 6 13 4 2 Change to a career in further or higher education e.g. lecturer, academic researcher
44 4 5 10.4 11.4 7 5 7 0
Other Please explain 2.5 44 4 3 6.2 6.8 8 10 6 Not Given 4 8 3
Other career options (qualitative)
Participants were asked in interview “Are there any comments you wish to make about
other career options you are considering?” The interview was transcribed and the
responses coded, following the advice of Miles and Huberman (1994) coding was
prepared against the items of a known framework that is the survey questionnaire.
Where new meanings not code-able to the existing framework were identified, new
codes were established. This process yielded one new code, “Take up a central office
position” although this might be considered the same as taking up a regional position.
Overwhelmingly the participants were not considering change (21 sources making 21
references to this).
146
By far the largest number of respondents indicate they would remain as an assistant
principal in their own school. This node represents those who enjoy what they are doing
and are not considering anything else (Female 47, Female 46, Male 43, Male 40,
Female 39, Male 29, Male 25, Female 26, Female 16, Female 18, Female 20, Female 1,
Female 3, Female 8, Female 9, Female 15, Female 16, Female 18, Female 35, Male 42,
Male 32). Some have done other things in their careers and came or come back to
teaching after doing different jobs (Male 40, Female 15, Female 18). For some age
(Male 42) and accrued benefits (Female 39) are incentives to stay. For these
respondents, they clearly enjoy what they are doing and intend to stay doing it.
At half the frequency of “Not considering change” was the option to take up a career
outside of education (9 sources). There were a wide variety of potential next careers
talked about by those for whom a career outside of education was a thought. Some of
the possibilities included; becoming a tour guide (Female 4), working in a welfare
agency (Female 5) emergency management or working in the Ombudsman’s office
(Male 6), industrial relations and personnel (Male 14), bookshop and café owner
(Female 17), sport management or property development (Male 19), running a florist
shop (Female 28), building on current causal work with the electoral office (Male 44),
and one was “… open to whatever life throws at me” (Female 48).
Some were already dabbling in their possible future as a consultant or trainer (e.g.
Female 4, Male 44), some had worked in their field of interest before (e.g. Male 06,
Male 14, Male 19) and others were ‘dreaming’ of other work they might do (Female 17,
Female 28).
With approximately equal frequency of mention were “Take up a regional position” (5
sources), “Take up a central office position” (5 sources),”Change to a career in further
or higher education e.g. lecturer, academic researcher” (5 sources), “Seek a role as
assistant principal or similar position in another school” (5 sources)
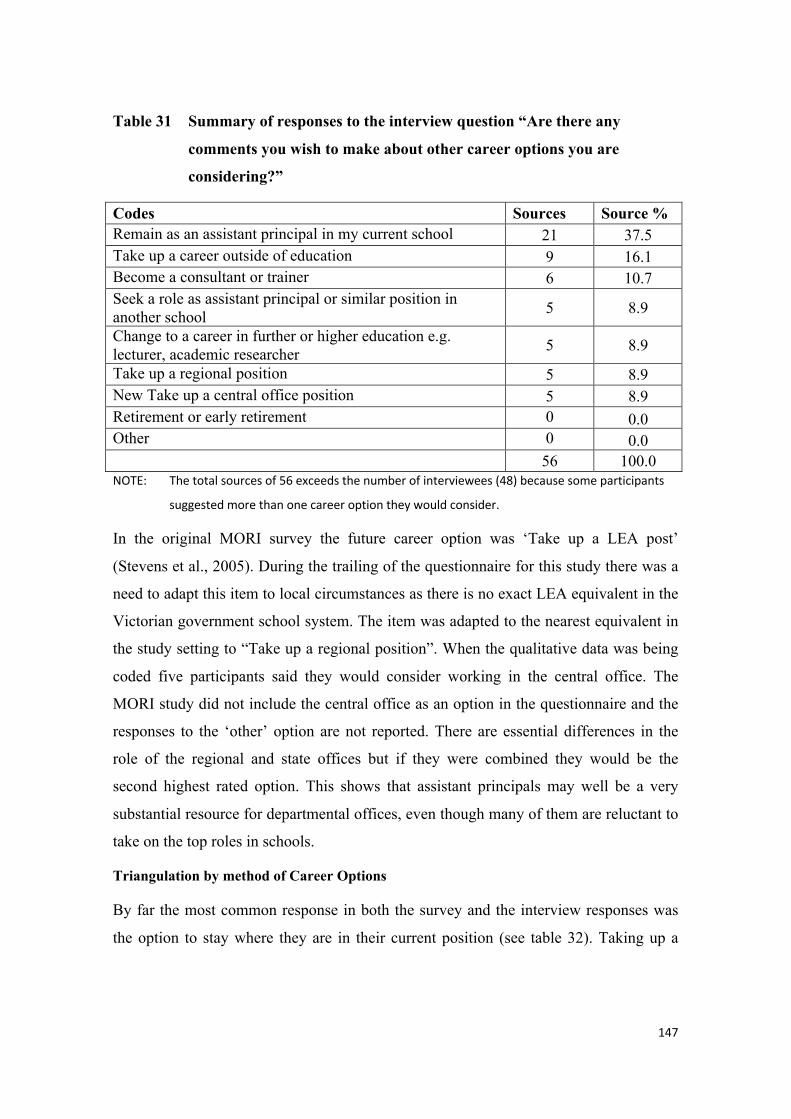
147
Table 31 Summary of responses to the interview question “Are there any
comments you wish to make about other career options you are
considering?”
Codes Sources Source % Remain as an assistant principal in my current school 21 37.5 Take up a career outside of education 9 16.1 Become a consultant or trainer 6 10.7 Seek a role as assistant principal or similar position in another school 5 8.9
Change to a career in further or higher education e.g. lecturer, academic researcher 5 8.9
Take up a regional position 5 8.9 New Take up a central office position 5 8.9 Retirement or early retirement 0 0.0 Other 0 0.0 56 100.0 NOTE: The total sources of 56 exceeds the number of interviewees (48) because some participants
suggested more than one career option they would consider.
In the original MORI survey the future career option was ‘Take up a LEA post’
(Stevens et al., 2005). During the trailing of the questionnaire for this study there was a
need to adapt this item to local circumstances as there is no exact LEA equivalent in the
Victorian government school system. The item was adapted to the nearest equivalent in
the study setting to “Take up a regional position”. When the qualitative data was being
coded five participants said they would consider working in the central office. The
MORI study did not include the central office as an option in the questionnaire and the
responses to the ‘other’ option are not reported. There are essential differences in the
role of the regional and state offices but if they were combined they would be the
second highest rated option. This shows that assistant principals may well be a very
substantial resource for departmental offices, even though many of them are reluctant to
take on the top roles in schools.
Triangulation by method of Career Options
By far the most common response in both the survey and the interview responses was
the option to stay where they are in their current position (see table 32). Taking up a
148
career outside of education was mentioned. The seeking of a similar role in another
school seems a more prominent response to the surveys than the interview questions.
Although Retirement/ early retirement were a consideration in survey responses for
27.3% of valid responses, that option was not mentioned in interview.
Caution must be taken in comparing the results of this and the MORI study. The MORI
study reports on assistant principals from both primary and secondary schools and there
can be differences between these groups, for example the MORI report shows
difference e.g. “… middle leaders in primary schools are more likely to want to remain
in the same post (73%) than secondary school middle leaders (42%)” (Stevens et al.,
2005, p. 56). This question on the questionnaire reported answers only from those who
did not want to be principals in the MORI study.
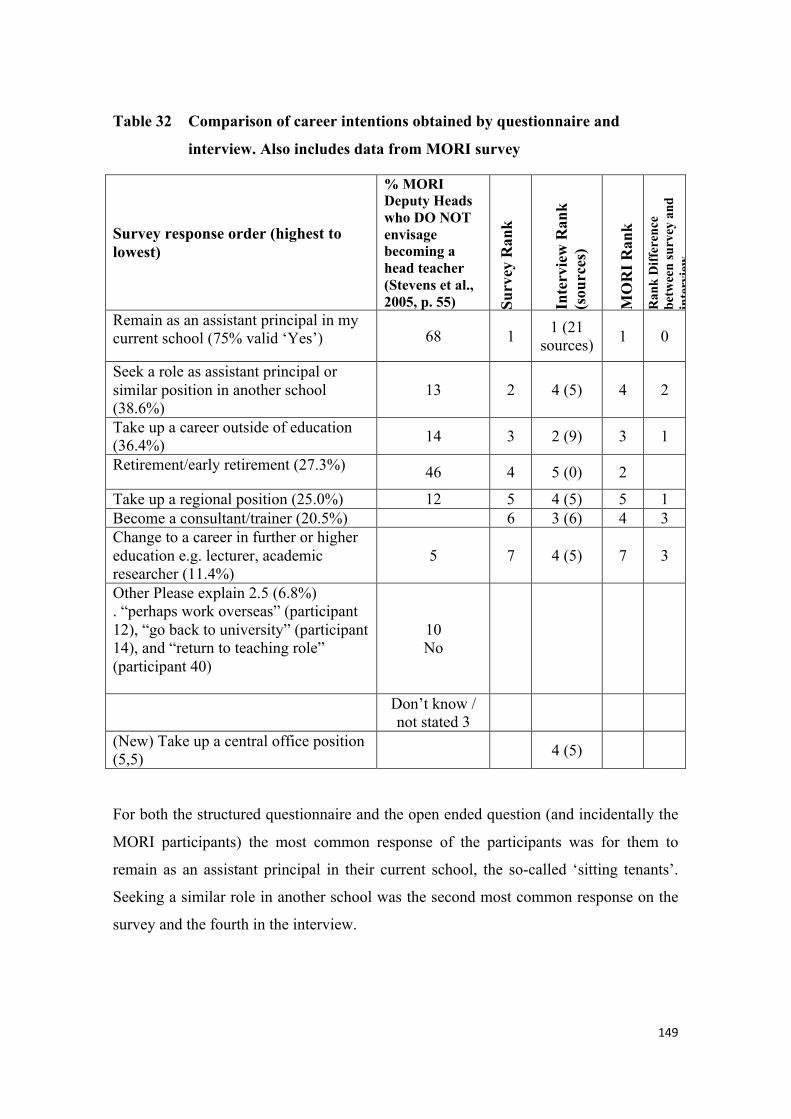
149
Table 32 Comparison of career intentions obtained by questionnaire and
interview. Also includes data from MORI survey
Survey response order (highest to lowest)
% MORI Deputy Heads who DO NOT envisage becoming a head teacher (Stevens et al., 2005, p. 55) Su
rvey
Ran
k
Inte
rvie
w R
ank
(sou
rces
)
MO
RI R
ank
Ran
k D
iffer
ence
be
twee
n su
rvey
and
in
terv
iew
Remain as an assistant principal in my current school (75% valid ‘Yes’) 68 1 1 (21
sources) 1 0
Seek a role as assistant principal or similar position in another school (38.6%)
13 2 4 (5) 4 2
Take up a career outside of education (36.4%) 14 3 2 (9) 3 1
Retirement/early retirement (27.3%) 46 4 5 (0) 2
Take up a regional position (25.0%) 12 5 4 (5) 5 1 Become a consultant/trainer (20.5%) 6 3 (6) 4 3 Change to a career in further or higher education e.g. lecturer, academic researcher (11.4%)
5 7 4 (5) 7 3
Other Please explain 2.5 (6.8%) . “perhaps work overseas” (participant 12), “go back to university” (participant 14), and “return to teaching role” (participant 40)
10 No
Don’t know / not stated 3
(New) Take up a central office position (5,5) 4 (5)
For both the structured questionnaire and the open ended question (and incidentally the
MORI participants) the most common response of the participants was for them to
remain as an assistant principal in their current school, the so-called ‘sitting tenants’.
Seeking a similar role in another school was the second most common response on the
survey and the fourth in the interview.
150
Researchquestiontwo:ParticipatinginProfessionalDevelopment:
Whatdevelopmentopportunitiesdotheyengagein?Howeffective
aretheyandwhatimpactdotheyhave?
One of the key areas of this study is to examine the development of assistant principals.
Specifically the research questions related to development are: What development
opportunities do they engage in? How effective are they and what impact do they have?
To answer these questions, on the questionnaire, participants were asked to indicate
which professional development programs they had attended in the last three years and
how effective they found them to be.
For the central and regional programs provided by the department of education, the
participants were given a list of the official programs available at the time (mid 2008)
and for the year previous (which were the same) (Department of Education and Early
Childhood Development, 2007, 2008c) and asked to tick boxes beside the program title.
CentralPrograms
In the survey, participants were provided with a list of programs offered by the central
office of the department of education (Department of Education and Early Childhood
Development, 2007, 2008c). They were then asked “Which of the following centrally
organised professional development programs have you participated in, in your role as
assistant principal during the past 3 years? For each program you have participated in,
how useful were they to you as a school leader?”
All 48 respondents to the questionnaire responded to this item (see table 33 for a
summary of responses).
Interpretation of this data is, to some extent, relative to the expectations one comes to
the data with. With the OECD reporting high levels of participation in the Victorian
leadership programs (P. Matthews et al., 2007a) one might expect high rates of
participation in these program by assistant principals. Reported across the state is that
3000 participants undertook one of nineteen programs over 2004-2007 (P. Matthews et
151
al., 2007b, p. 20). This seems impressive, however this includes principals, assistant
principals and aspirants across 19 programs, some of which are only for principals.
Participants in central programs for 2007 were; Leading Effective Small Schools (82)
Leading Effective Schools (97), Prepare for Leadership (75), Lead Professional
Learning (72), Scholarships for Postgraduate study (40), Human Leadership (75),
Educational Leadership (59), Technical Leadership (68) and Stepping Up to the
Principalship (104). Over the four year from 2004-2007 307 participated on the Master
in School Leadership program and 124 in the Eleanor Davis mentoring program (P.
Matthews et al., 2007b, p. 18).
In this study, the highest rate of participation and the only one to reach double figures in
central programs “Stepping Up to the Principalship” and also “Building the Capacity of
School Leadership Teams (AGQTP)” (9 participants). The next programs undertaken
most frequently among participants was for “Leading in Effective Schools” (8
participants). Four assistant principals in this study reported as having participated in
Educational Leadership: Shaping Pedagogy”, Master in School Leadership” and
Teacher Professional Leave”.
The “Leading Professional Learning” and “Eleanor Davis School Leadership Program”
(for women only wanting to be a principal within the next 3 years) tallied four
participants and three participants underwent the “Technical Leadership: Thinking and
Planning Strategically” and two the “Human Leadership: Developing People” program.
One participant attended the “Leading across Effective Small Schools”. The only
program that attracted no participants was the “Scholarships for Postgraduate Study”.
There is likely to be a number of factors impacting on the number of participants.
Informally the researcher was told by a department official that there are quotas for each
region on the number of places available in each program. These quotas are not made
public and were not made available to this researcher. Second may be the desirability of
the program to assistant principals. Thirdly, the influence of the principal and her/his
willingness for the assistant principal to participate would be a factor. Communication
of the availability of the programs may be an issue. There may be many other inhibiting
factors such as the current workload of the assistant principal, family considerations,

152
health, indeed many of the factors that inhibit assistant principals from seeking the
principalship may also impact here. Because the question was not asked, any attempt to
explain participation rates is speculative. The numbers of participants in this research
seems to be lower than what might be expected. It is not possible to say anything about
the level of participation of assistant principals who are not participating in the study.
Table 33 Summary of responses to the question “Which of the following centrally
organised professional development programs have you participated in,
in your role as assistant principal during the past 3 years?
Program Title
Number of respondents who did participate in each program, (n=48)
Percentage of respondents who did participate in each program.
Stepping up to the Principalship 9 18.75
Building the Capacity of School Leadership Teams (AGQTP) 9 18.75
Leading in Effective Schools 8 16.6
Master in School Leadership 5 10.4
Educational Leadership: Shaping Pedagogy 4 8.3
Leading Professional Learning 4 8.3
Eleanor Davis School Leadership Program 4 8.3
Human Leadership: Developing People 2 4.2
Technical Leadership: Thinking and Planning Strategically 2 4.2
Teacher Professional Leave 1 2.1
Leading across Effective Small Schools 1 2.1
Scholarships for Post Graduate Study 0 0
Other 3.1 7 14.6
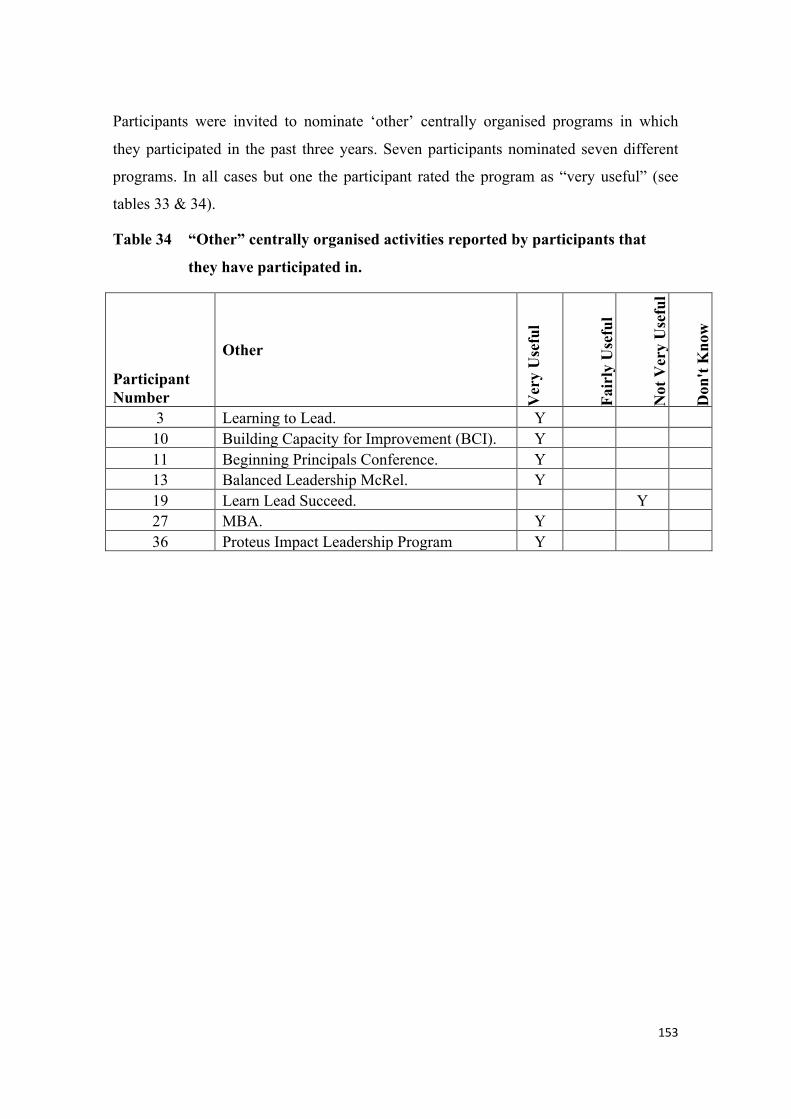
153
Participants were invited to nominate ‘other’ centrally organised programs in which
they participated in the past three years. Seven participants nominated seven different
programs. In all cases but one the participant rated the program as “very useful” (see
tables 33 & 34).
Table 34 “Other” centrally organised activities reported by participants that
they have participated in.
Participant Number
Other
Ver
y U
sefu
l
Fair
ly U
sefu
l
Not
Ver
y U
sefu
l
Don
't K
now
3 Learning to Lead. Y 10 Building Capacity for Improvement (BCI). Y 11 Beginning Principals Conference. Y 13 Balanced Leadership McRel. Y 19 Learn Lead Succeed. Y 27 MBA. Y 36 Proteus Impact Leadership Program Y
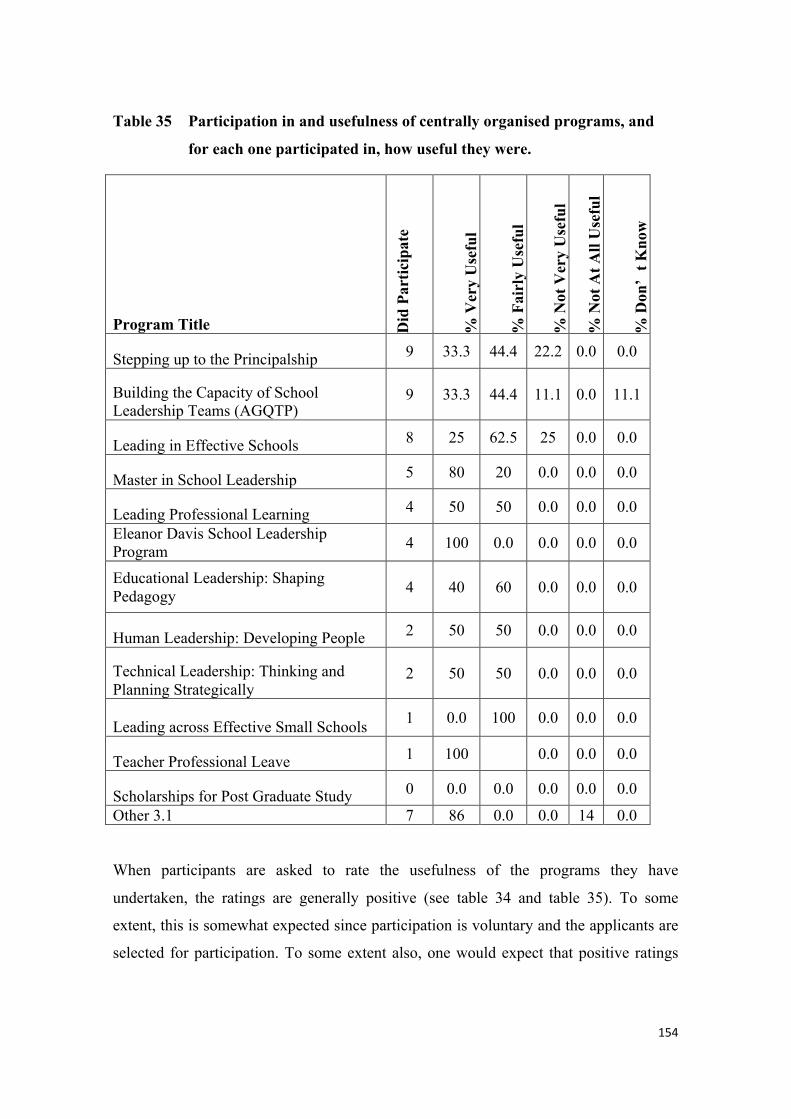
154
Table 35 Participation in and usefulness of centrally organised programs, and
for each one participated in, how useful they were.
Program Title Did
Par
ticip
ate
% V
ery
Use
ful
% F
airl
y U
sefu
l
% N
ot V
ery
Use
ful
% N
ot A
t All
Use
ful
% D
on’
t Kno
w
Stepping up to the Principalship 9 33.3 44.4 22.2 0.0 0.0
Building the Capacity of School Leadership Teams (AGQTP)
9 33.3 44.4 11.1 0.0 11.1
Leading in Effective Schools 8 25 62.5 25 0.0 0.0
Master in School Leadership 5 80 20 0.0 0.0 0.0
Leading Professional Learning 4 50 50 0.0 0.0 0.0
Eleanor Davis School Leadership Program 4 100 0.0 0.0 0.0 0.0
Educational Leadership: Shaping Pedagogy 4 40 60 0.0 0.0 0.0
Human Leadership: Developing People 2 50 50 0.0 0.0 0.0
Technical Leadership: Thinking and Planning Strategically
2 50 50 0.0 0.0 0.0
Leading across Effective Small Schools 1 0.0 100 0.0 0.0 0.0
Teacher Professional Leave 1 100 0.0 0.0 0.0
Scholarships for Post Graduate Study 0 0.0 0.0 0.0 0.0 0.0
Other 3.1 7 86 0.0 0.0 14 0.0
When participants are asked to rate the usefulness of the programs they have
undertaken, the ratings are generally positive (see table 34 and table 35). To some
extent, this is somewhat expected since participation is voluntary and the applicants are
selected for participation. To some extent also, one would expect that positive ratings
155
would also reflect positive sentiments about the programs. Based on the responses
summarised in the table, some broad comments can be made. There were no major
central programs where a response of “Not at all useful” was given. There were three
programs for which at least one respondent endorsed the “Not very useful” response
(viz. Leading Effective Schools, Stepping Up to the Principalship, Building the
Capacity of School Leadership Teams).
One major department program endorsed by all four participants was the Eleanor Davis
School Leadership program, a mentoring program for women aspirants. The remaining
programs in order strength of the percentage endorsement as for usefulness were:
Teacher Professional Leave (100% very useful, but one participant); Master in School
Leadership (80% very useful, 20% fairly useful); Leading Professional Learning (50%,
50%); Human Leadership (50%, 50%); Educational Leadership Shaping Pedagogy
(40%, 60%); Technical Leadership (50% very useful, 50% fairly useful); Building the
Capacity of School Leadership Teams AGQPT (33.3%, 44.4%); Stepping Up to the
Principalship (33.3%, 44.4%); Leading Effective Schools (25% very useful, 62.5%
fairly useful); and Leading across Effective Small Schools (100% fairly useful).
RegionalPrograms
In the survey, participants were provided with a list of programs offered by the regional
office of the department of education (Department of Education and Early Childhood
Development, 2010a, 2010b). They were then asked “Which of the following regionally
organised professional development programs have you participated in, in your role as
assistant principal during the past 3 years? For each one you have participated in, how
useful were they to you as a school leader?”
All 48 participants responded to this question.
Of the two key regional leadership programs, the Dollars and Sense financial
management program was attended by 33 survey participants who all found it to be at
least fairly useful. The facilities management program, Bricks and Mortar, was attended
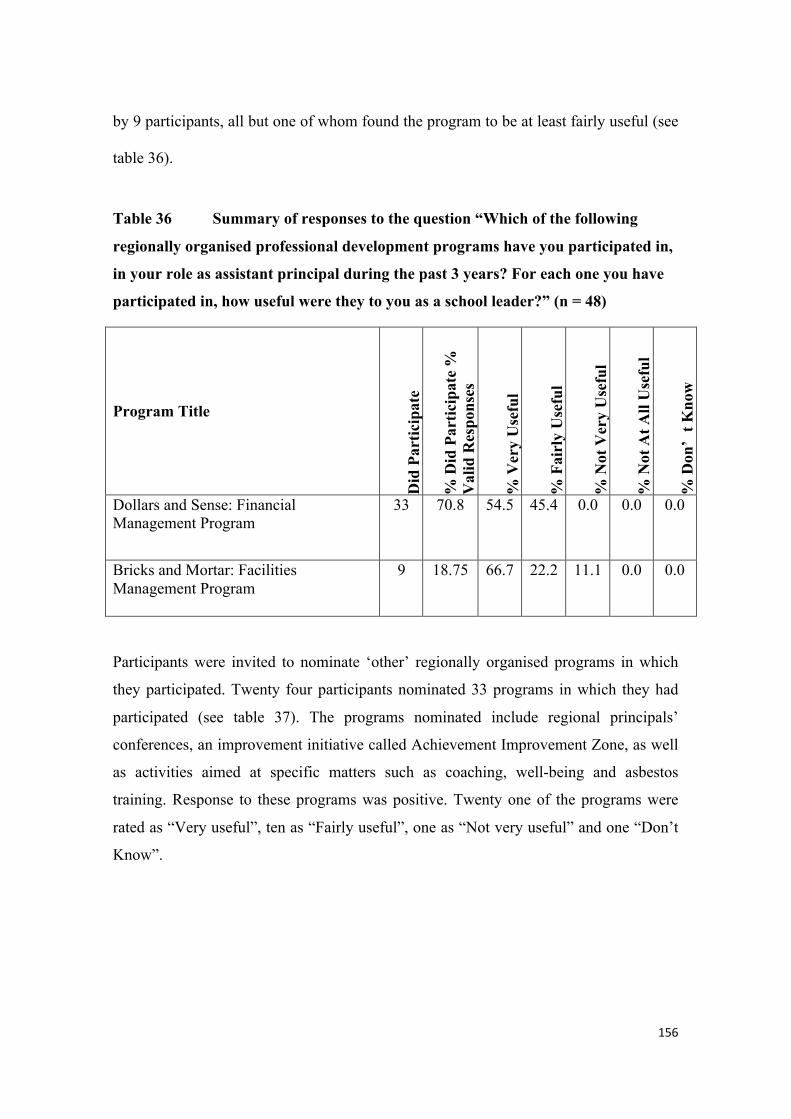
156
by 9 participants, all but one of whom found the program to be at least fairly useful (see
table 36).
Table 36 Summary of responses to the question “Which of the following
regionally organised professional development programs have you participated in,
in your role as assistant principal during the past 3 years? For each one you have
participated in, how useful were they to you as a school leader?” (n = 48)
Program Title D
id P
artic
ipat
e
% D
id P
artic
ipat
e %
V
alid
Res
pons
es
% V
ery
Use
ful
% F
airl
y U
sefu
l
% N
ot V
ery
Use
ful
% N
ot A
t All
Use
ful
% D
on’
t Kno
w
Dollars and Sense: Financial Management Program
33 70.8 54.5 45.4 0.0 0.0 0.0
Bricks and Mortar: Facilities Management Program
9 18.75 66.7 22.2 11.1 0.0 0.0
Participants were invited to nominate ‘other’ regionally organised programs in which
they participated. Twenty four participants nominated 33 programs in which they had
participated (see table 37). The programs nominated include regional principals’
conferences, an improvement initiative called Achievement Improvement Zone, as well
as activities aimed at specific matters such as coaching, well-being and asbestos
training. Response to these programs was positive. Twenty one of the programs were
rated as “Very useful”, ten as “Fairly useful”, one as “Not very useful” and one “Don’t
Know”.
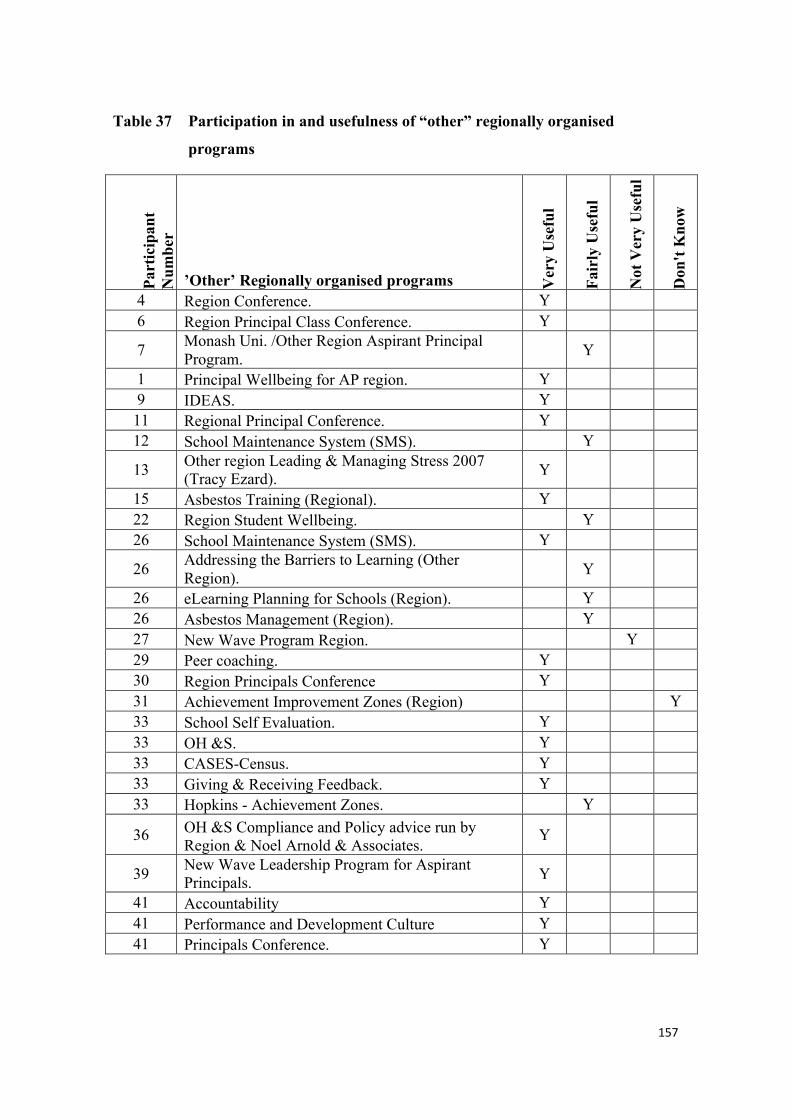
157
Table 37 Participation in and usefulness of “other” regionally organised
programs Pa
rtic
ipan
t N
umbe
r
’Other’ Regionally organised programs Ver
y U
sefu
l
Fair
ly U
sefu
l
Not
Ver
y U
sefu
l
Don
't K
now
4 Region Conference. Y 6 Region Principal Class Conference. Y
7 Monash Uni. /Other Region Aspirant Principal Program. Y
1 Principal Wellbeing for AP region. Y 9 IDEAS. Y 11 Regional Principal Conference. Y 12 School Maintenance System (SMS). Y
13 Other region Leading & Managing Stress 2007 (Tracy Ezard). Y
15 Asbestos Training (Regional). Y 22 Region Student Wellbeing. Y 26 School Maintenance System (SMS). Y
26 Addressing the Barriers to Learning (Other Region). Y
26 eLearning Planning for Schools (Region). Y 26 Asbestos Management (Region). Y 27 New Wave Program Region. Y 29 Peer coaching. Y 30 Region Principals Conference Y 31 Achievement Improvement Zones (Region) Y 33 School Self Evaluation. Y 33 OH &S. Y 33 CASES-Census. Y 33 Giving & Receiving Feedback. Y 33 Hopkins - Achievement Zones. Y
36 OH &S Compliance and Policy advice run by Region & Noel Arnold & Associates. Y
39 New Wave Leadership Program for Aspirant Principals. Y
41 Accountability Y 41 Performance and Development Culture Y 41 Principals Conference. Y
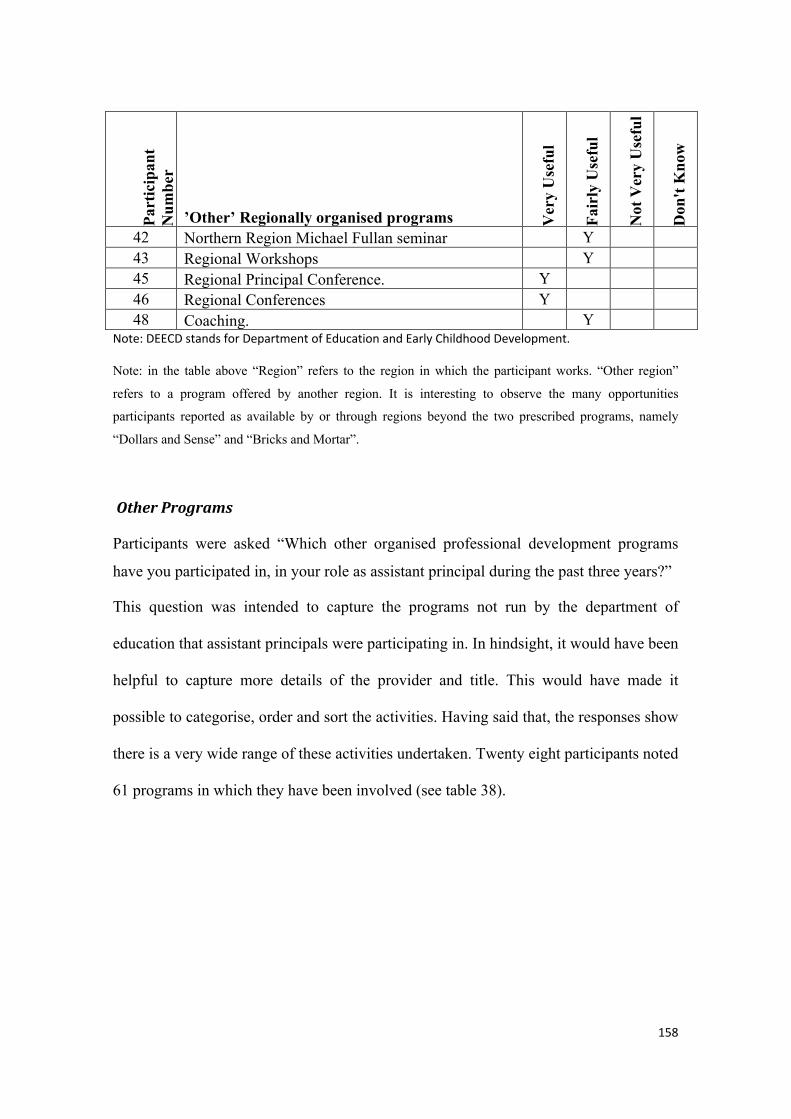
158
Part
icip
ant
Num
ber
’Other’ Regionally organised programs Ver
y U
sefu
l
Fair
ly U
sefu
l
Not
Ver
y U
sefu
l
Don
't K
now
42 Northern Region Michael Fullan seminar Y 43 Regional Workshops Y 45 Regional Principal Conference. Y 46 Regional Conferences Y 48 Coaching. Y
Note: DEECD stands for Department of Education and Early Childhood Development.
Note: in the table above “Region” refers to the region in which the participant works. “Other region”
refers to a program offered by another region. It is interesting to observe the many opportunities
participants reported as available by or through regions beyond the two prescribed programs, namely
“Dollars and Sense” and “Bricks and Mortar”.
OtherPrograms
Participants were asked “Which other organised professional development programs
have you participated in, in your role as assistant principal during the past three years?”
This question was intended to capture the programs not run by the department of
education that assistant principals were participating in. In hindsight, it would have been
helpful to capture more details of the provider and title. This would have made it
possible to categorise, order and sort the activities. Having said that, the responses show
there is a very wide range of these activities undertaken. Twenty eight participants noted
61 programs in which they have been involved (see table 38).
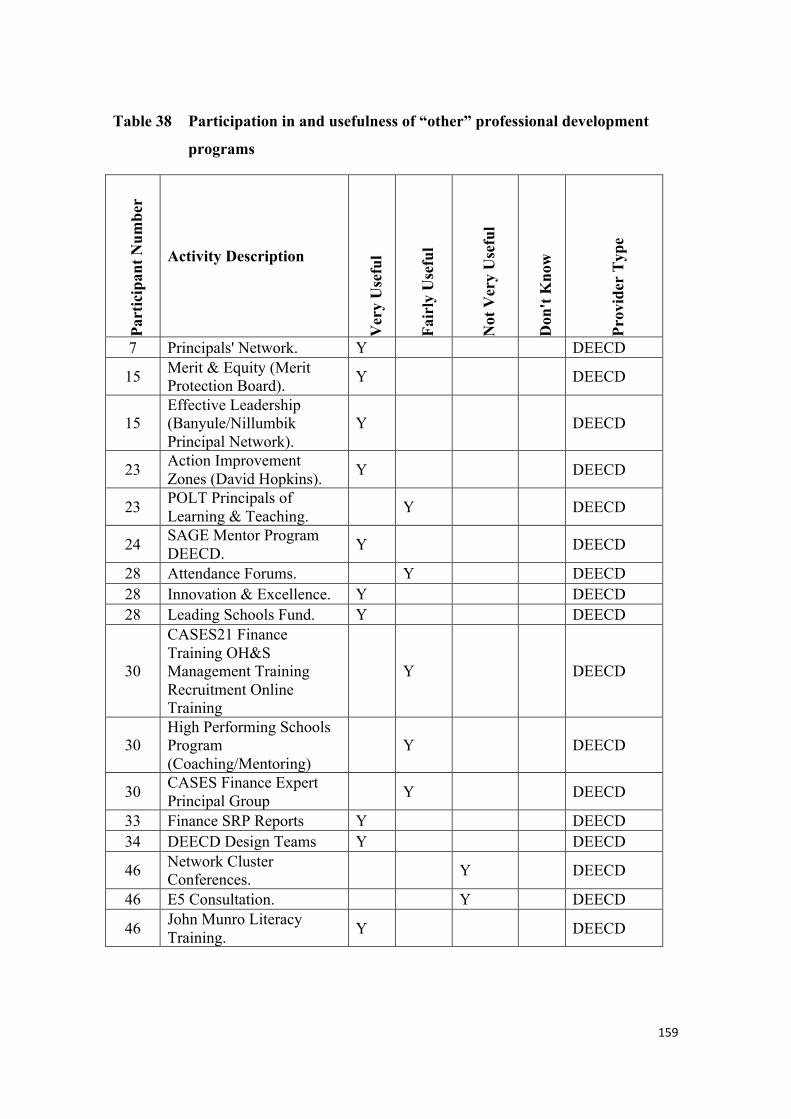
159
Table 38 Participation in and usefulness of “other” professional development
programs Pa
rtic
ipan
t Num
ber
Activity Description
Ver
y U
sefu
l
Fair
ly U
sefu
l
Not
Ver
y U
sefu
l
Don
't K
now
Prov
ider
Typ
e
7 Principals' Network. Y DEECD
15 Merit & Equity (Merit Protection Board). Y DEECD
15 Effective Leadership (Banyule/Nillumbik Principal Network).
Y DEECD
23 Action Improvement Zones (David Hopkins). Y DEECD
23 POLT Principals of Learning & Teaching. Y DEECD
24 SAGE Mentor Program DEECD. Y DEECD
28 Attendance Forums. Y DEECD 28 Innovation & Excellence. Y DEECD 28 Leading Schools Fund. Y DEECD
30
CASES21 Finance Training OH&S Management Training Recruitment Online Training
Y DEECD
30 High Performing Schools Program (Coaching/Mentoring)
Y DEECD
30 CASES Finance Expert Principal Group Y DEECD
33 Finance SRP Reports Y DEECD 34 DEECD Design Teams Y DEECD
46 Network Cluster Conferences. Y DEECD
46 E5 Consultation. Y DEECD
46 John Munro Literacy Training. Y DEECD
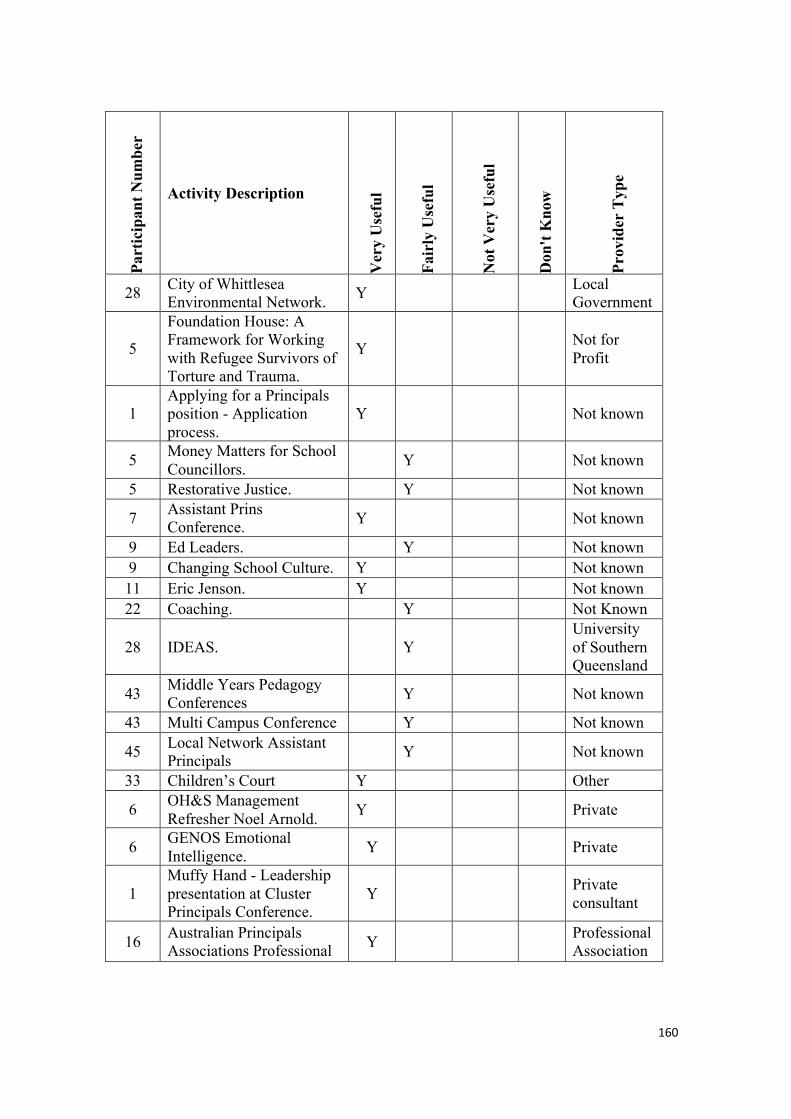
160
Part
icip
ant N
umbe
r
Activity Description
Ver
y U
sefu
l
Fair
ly U
sefu
l
Not
Ver
y U
sefu
l
Don
't K
now
Prov
ider
Typ
e
28 City of Whittlesea Environmental Network. Y Local
Government
5
Foundation House: A Framework for Working with Refugee Survivors of Torture and Trauma.
Y Not for Profit
1 Applying for a Principals position - Application process.
Y Not known
5 Money Matters for School Councillors. Y Not known
5 Restorative Justice. Y Not known
7 Assistant Prins Conference. Y Not known
9 Ed Leaders. Y Not known 9 Changing School Culture. Y Not known 11 Eric Jenson. Y Not known 22 Coaching. Y Not Known
28 IDEAS. Y University of Southern Queensland
43 Middle Years Pedagogy Conferences Y Not known
43 Multi Campus Conference Y Not known
45 Local Network Assistant Principals Y Not known
33 Children’s Court Y Other
6 OH&S Management Refresher Noel Arnold. Y Private
6 GENOS Emotional Intelligence. Y Private
1 Muffy Hand - Leadership presentation at Cluster Principals Conference.
Y Private consultant
16 Australian Principals Associations Professional Y Professional
Association
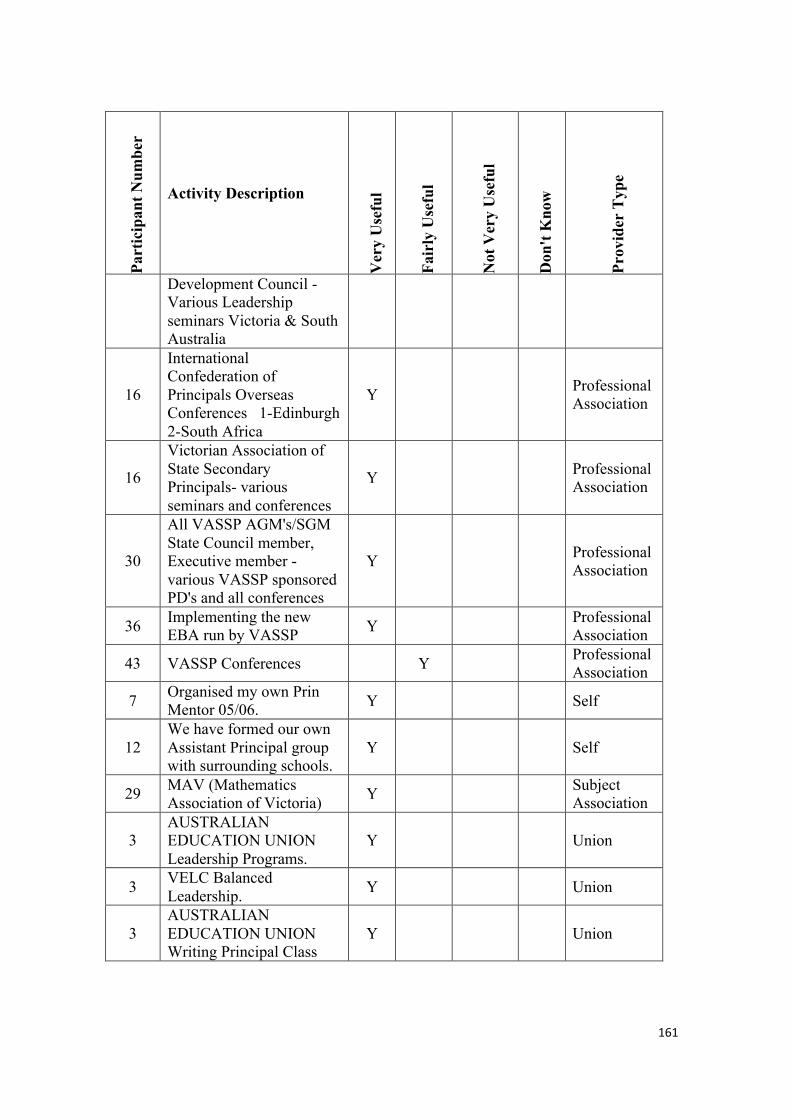
161
Part
icip
ant N
umbe
r
Activity Description
Ver
y U
sefu
l
Fair
ly U
sefu
l
Not
Ver
y U
sefu
l
Don
't K
now
Prov
ider
Typ
e
Development Council - Various Leadership seminars Victoria & South Australia
16
International Confederation of Principals Overseas Conferences 1-Edinburgh 2-South Africa
Y Professional Association
16
Victorian Association of State Secondary Principals- various seminars and conferences
Y Professional Association
30
All VASSP AGM's/SGM State Council member, Executive member - various VASSP sponsored PD's and all conferences
Y Professional Association
36 Implementing the new EBA run by VASSP Y Professional
Association
43 VASSP Conferences Y Professional Association
7 Organised my own Prin Mentor 05/06. Y Self
12 We have formed our own Assistant Principal group with surrounding schools.
Y Self
29 MAV (Mathematics Association of Victoria) Y Subject
Association
3 AUSTRALIAN EDUCATION UNION Leadership Programs.
Y Union
3 VELC Balanced Leadership. Y Union
3 AUSTRALIAN EDUCATION UNION Writing Principal Class
Y Union
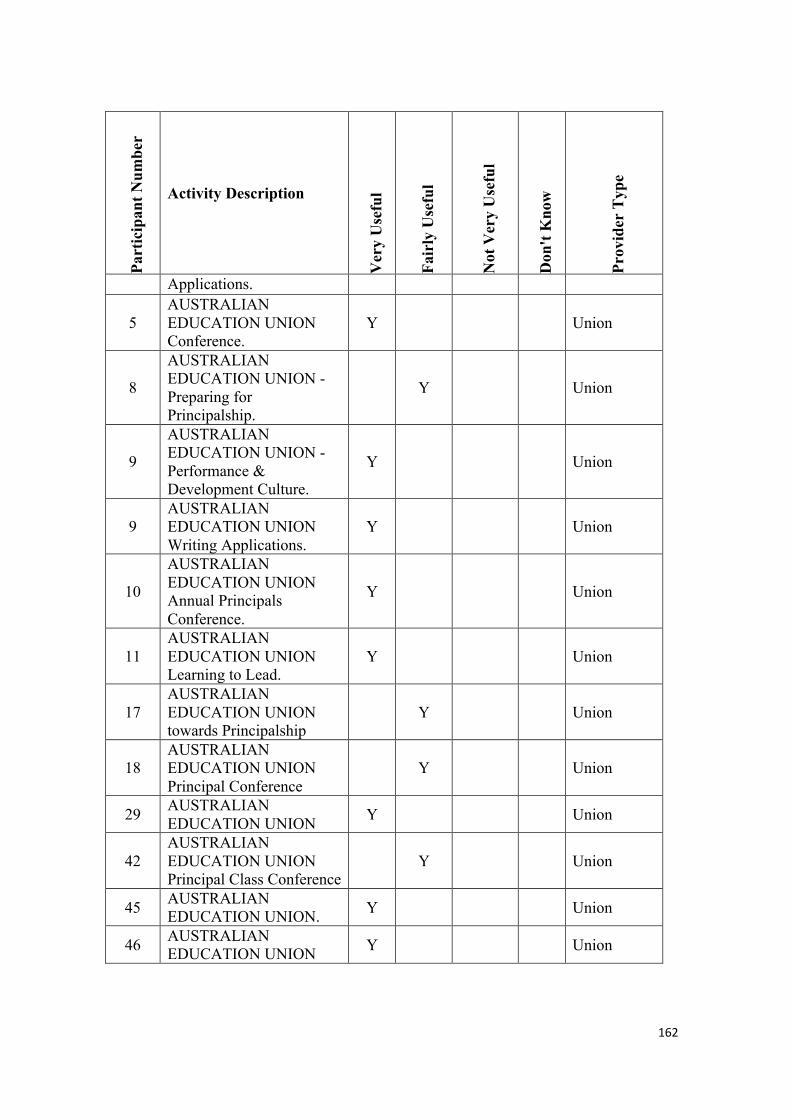
162
Part
icip
ant N
umbe
r
Activity Description
Ver
y U
sefu
l
Fair
ly U
sefu
l
Not
Ver
y U
sefu
l
Don
't K
now
Prov
ider
Typ
e
Applications.
5 AUSTRALIAN EDUCATION UNION Conference.
Y Union
8
AUSTRALIAN EDUCATION UNION - Preparing for Principalship.
Y Union
9
AUSTRALIAN EDUCATION UNION - Performance & Development Culture.
Y Union
9 AUSTRALIAN EDUCATION UNION Writing Applications.
Y Union
10
AUSTRALIAN EDUCATION UNION Annual Principals Conference.
Y Union
11 AUSTRALIAN EDUCATION UNION Learning to Lead.
Y Union
17 AUSTRALIAN EDUCATION UNION towards Principalship
Y Union
18 AUSTRALIAN EDUCATION UNION Principal Conference
Y Union
29 AUSTRALIAN EDUCATION UNION Y Union
42 AUSTRALIAN EDUCATION UNION Principal Class Conference
Y Union
45 AUSTRALIAN EDUCATION UNION. Y Union
46 AUSTRALIAN EDUCATION UNION Y Union
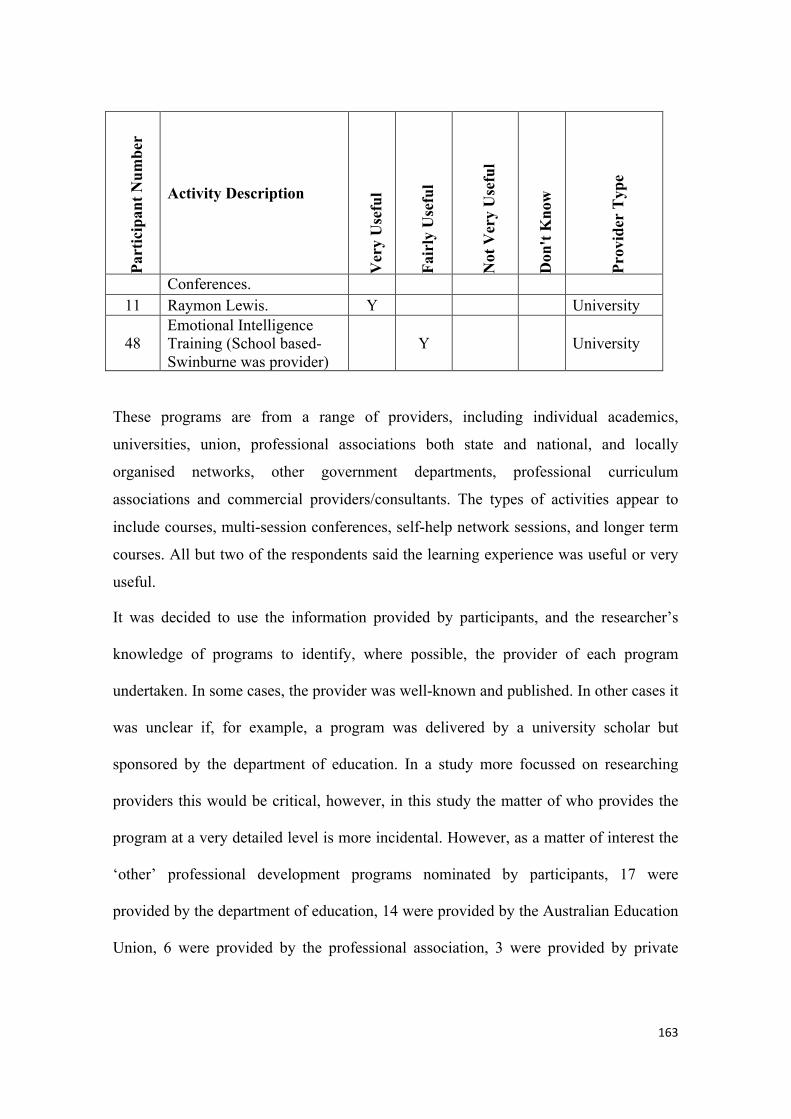
163
Part
icip
ant N
umbe
r
Activity Description
Ver
y U
sefu
l
Fair
ly U
sefu
l
Not
Ver
y U
sefu
l
Don
't K
now
Prov
ider
Typ
e
Conferences. 11 Raymon Lewis. Y University
48 Emotional Intelligence Training (School based-Swinburne was provider)
Y University
These programs are from a range of providers, including individual academics,
universities, union, professional associations both state and national, and locally
organised networks, other government departments, professional curriculum
associations and commercial providers/consultants. The types of activities appear to
include courses, multi-session conferences, self-help network sessions, and longer term
courses. All but two of the respondents said the learning experience was useful or very
useful.
It was decided to use the information provided by participants, and the researcher’s
knowledge of programs to identify, where possible, the provider of each program
undertaken. In some cases, the provider was well-known and published. In other cases it
was unclear if, for example, a program was delivered by a university scholar but
sponsored by the department of education. In a study more focussed on researching
providers this would be critical, however, in this study the matter of who provides the
program at a very detailed level is more incidental. However, as a matter of interest the
‘other’ professional development programs nominated by participants, 17 were
provided by the department of education, 14 were provided by the Australian Education
Union, 6 were provided by the professional association, 3 were provided by private
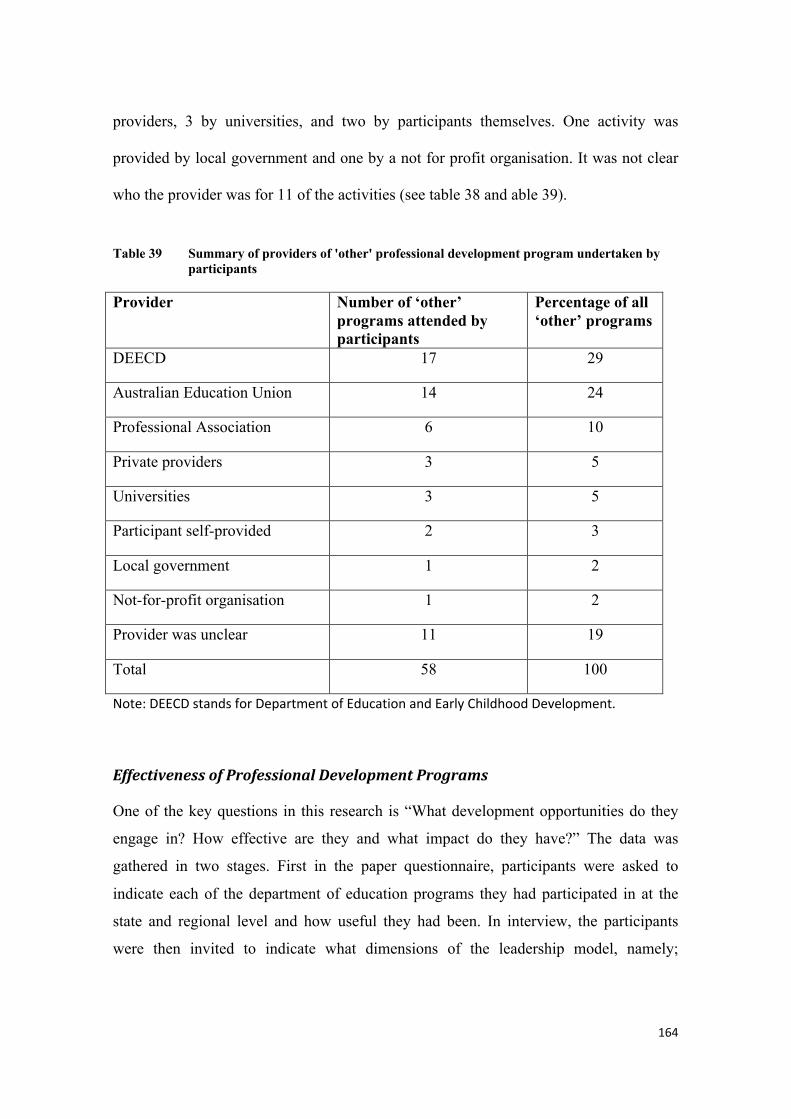
164
providers, 3 by universities, and two by participants themselves. One activity was
provided by local government and one by a not for profit organisation. It was not clear
who the provider was for 11 of the activities (see table 38 and able 39).
Table 39 Summary of providers of 'other' professional development program undertaken by participants
Provider Number of ‘other’ programs attended by participants
Percentage of all ‘other’ programs
DEECD 17 29
Australian Education Union 14 24
Professional Association 6 10
Private providers 3 5
Universities 3 5
Participant self-provided 2 3
Local government 1 2
Not-for-profit organisation 1 2
Provider was unclear 11 19
Total 58 100
Note: DEECD stands for Department of Education and Early Childhood Development.
EffectivenessofProfessionalDevelopmentPrograms
One of the key questions in this research is “What development opportunities do they
engage in? How effective are they and what impact do they have?” The data was
gathered in two stages. First in the paper questionnaire, participants were asked to
indicate each of the department of education programs they had participated in at the
state and regional level and how useful they had been. In interview, the participants
were then invited to indicate what dimensions of the leadership model, namely;
165
technical, structural, human resource, political, symbolic, educational, cultural,
strategic, personal attributes and skills, community and communication, were present in
the programs they undertook. (Please note these dimensions were developed as part of a
yet unpublished Delphi study involving and a group of international educators). As an
indication of the effectiveness of the professional development program, participants
were asked to indicate what methods were used in the program delivery, with methods
based on the Joyce and Showers model (Joyce & Showers, 1980). Third, participants
were invited to indicate what impact the program had had on them and their work, again
using the framework of Joyce and Showers (1980).
The intention of gathering this data was to gain an insight into the coverage, the quality
and the impact of the programs, from a program participant’s point of view. In each
case, program by program, participants were given a definition of each of the leadership
dimensions, each of the methods and each of the types of impact. They were asked to
consider the programs they had undertaken. They or the interviewer simply ticked the
particular dimension, method and impact if they, from their memory, deemed a
particular dimension, method and impact to be present in that program.
CentralPrograms
In making sense of the data, some key observations are made (see table 40). Very few
participants in this study have undertaken some of the professional development
programs. The number of participants ranges from 0 to 28. The second observation is
that there is not unanimous agreement about what dimensions, methods and impacts are
present in the different programs, as reported by participants. If the definition of
consensus is broad agreement and a majority ("Macquarie Essential Dictionary," 2006),
not unanimous agreement, then conclusions can be reached about the presence of
dimensions, methods and impacts. However the lack of unanimity is interesting and
worthy of further research.
Even so, it is clear that a key issue is that the experience of each program may be
different for different participants. This could be for a variety of reasons. These may

166
include; the knowledge, perspective and other prior predispositions each participant
brings to the program, the options taken up within the program, e.g. offers of follow up
support may be taken or by some, not others, or created by some even when not offered.
To explore this a little further it is interesting to take as an example, one method of
delivery offered in some of the programs, that of coaching for application.
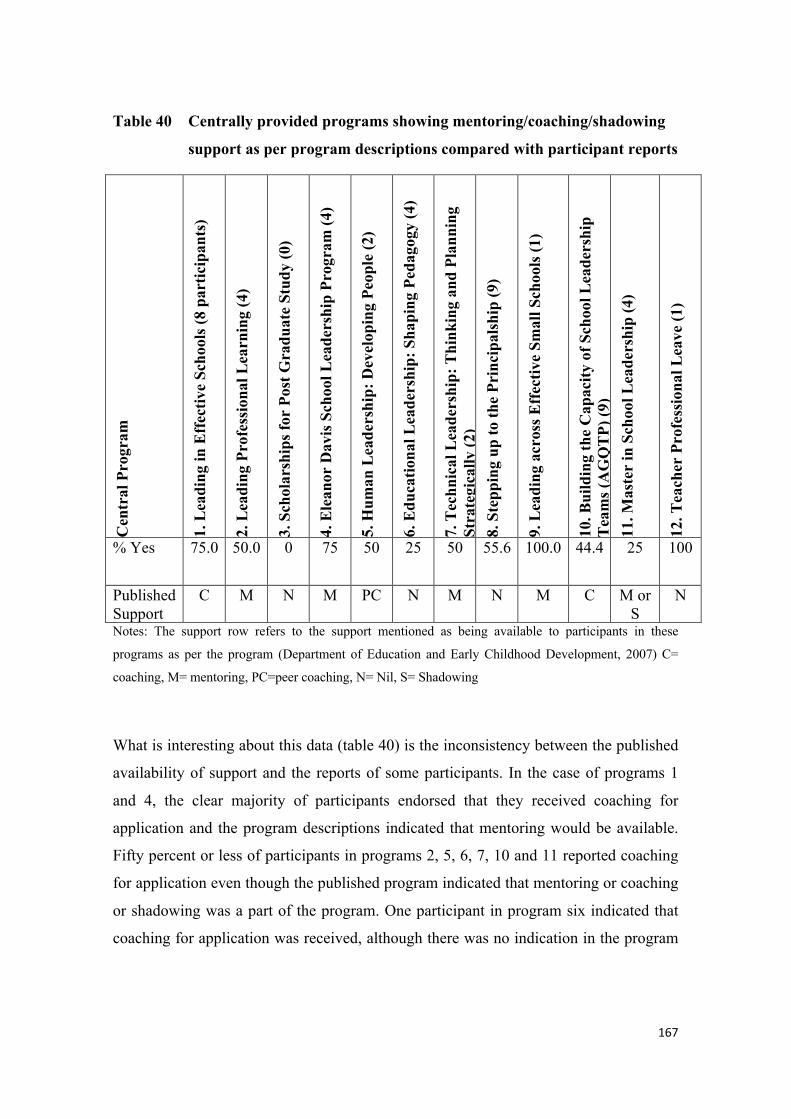
167
Table 40 Centrally provided programs showing mentoring/coaching/shadowing
support as per program descriptions compared with participant reports
Cen
tral
Pro
gram
1. L
eadi
ng in
Eff
ectiv
e Sc
hool
s (8
part
icip
ants
)
2. L
eadi
ng P
rofe
ssio
nal L
earn
ing
(4)
3. S
chol
arsh
ips f
or P
ost G
radu
ate
Stud
y (0
)
4. E
lean
or D
avis
Sch
ool L
eade
rshi
p Pr
ogra
m (4
)
5. H
uman
Lea
ders
hip:
Dev
elop
ing
Peop
le (2
)
6. E
duca
tiona
l Lea
ders
hip:
Sha
ping
Ped
agog
y (4
)
7. T
echn
ical
Lea
ders
hip:
Thi
nkin
g an
d Pl
anni
ng
Stra
tegi
cally
(2)
8. S
tepp
ing
up to
the
Prin
cipa
lshi
p (9
)
9. L
eadi
ng a
cros
s Eff
ectiv
e Sm
all S
choo
ls (1
)
10. B
uild
ing
the
Cap
acity
of S
choo
l Lea
ders
hip
Tea
ms (
AG
QT
P) (9
) 11
. Mas
ter
in S
choo
l Lea
ders
hip
(4)
12. T
each
er P
rofe
ssio
nal L
eave
(1)
% Yes 75.0 50.0 0 75 50 25 50 55.6 100.0 44.4 25 100
Published Support
C M N M PC N M N M C M or S
N
Notes: The support row refers to the support mentioned as being available to participants in these
programs as per the program (Department of Education and Early Childhood Development, 2007) C=
coaching, M= mentoring, PC=peer coaching, N= Nil, S= Shadowing
What is interesting about this data (table 40) is the inconsistency between the published
availability of support and the reports of some participants. In the case of programs 1
and 4, the clear majority of participants endorsed that they received coaching for
application and the program descriptions indicated that mentoring would be available.
Fifty percent or less of participants in programs 2, 5, 6, 7, 10 and 11 reported coaching
for application even though the published program indicated that mentoring or coaching
or shadowing was a part of the program. One participant in program six indicated that
coaching for application was received, although there was no indication in the program
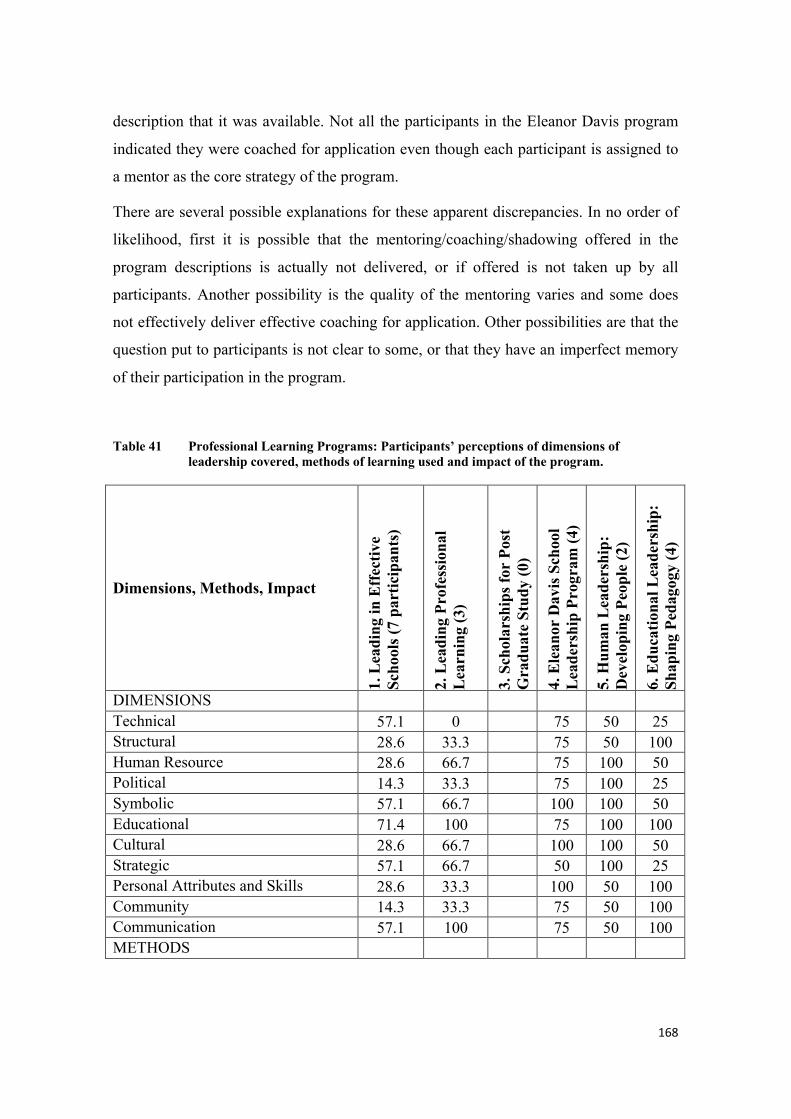
168
description that it was available. Not all the participants in the Eleanor Davis program
indicated they were coached for application even though each participant is assigned to
a mentor as the core strategy of the program.
There are several possible explanations for these apparent discrepancies. In no order of
likelihood, first it is possible that the mentoring/coaching/shadowing offered in the
program descriptions is actually not delivered, or if offered is not taken up by all
participants. Another possibility is the quality of the mentoring varies and some does
not effectively deliver effective coaching for application. Other possibilities are that the
question put to participants is not clear to some, or that they have an imperfect memory
of their participation in the program.
Table 41 Professional Learning Programs: Participants’ perceptions of dimensions of leadership covered, methods of learning used and impact of the program.
Dimensions, Methods, Impact
1. L
eadi
ng in
Eff
ectiv
e Sc
hool
s (7
part
icip
ants
)
2. L
eadi
ng P
rofe
ssio
nal
Lea
rnin
g (3
)
3. S
chol
arsh
ips f
or P
ost
Gra
duat
e St
udy
(0)
4. E
lean
or D
avis
Sch
ool
Lea
ders
hip
Prog
ram
(4)
5. H
uman
Lea
ders
hip:
D
evel
opin
g Pe
ople
(2)
6. E
duca
tiona
l Lea
ders
hip:
Sh
apin
g Pe
dago
gy (4
)
DIMENSIONS Technical 57.1 0 75 50 25 Structural 28.6 33.3 75 50 100 Human Resource 28.6 66.7 75 100 50 Political 14.3 33.3 75 100 25 Symbolic 57.1 66.7 100 100 50 Educational 71.4 100 75 100 100 Cultural 28.6 66.7 100 100 50 Strategic 57.1 66.7 50 100 25 Personal Attributes and Skills 28.6 33.3 100 50 100 Community 14.3 33.3 75 50 100 Communication 57.1 100 75 50 100 METHODS
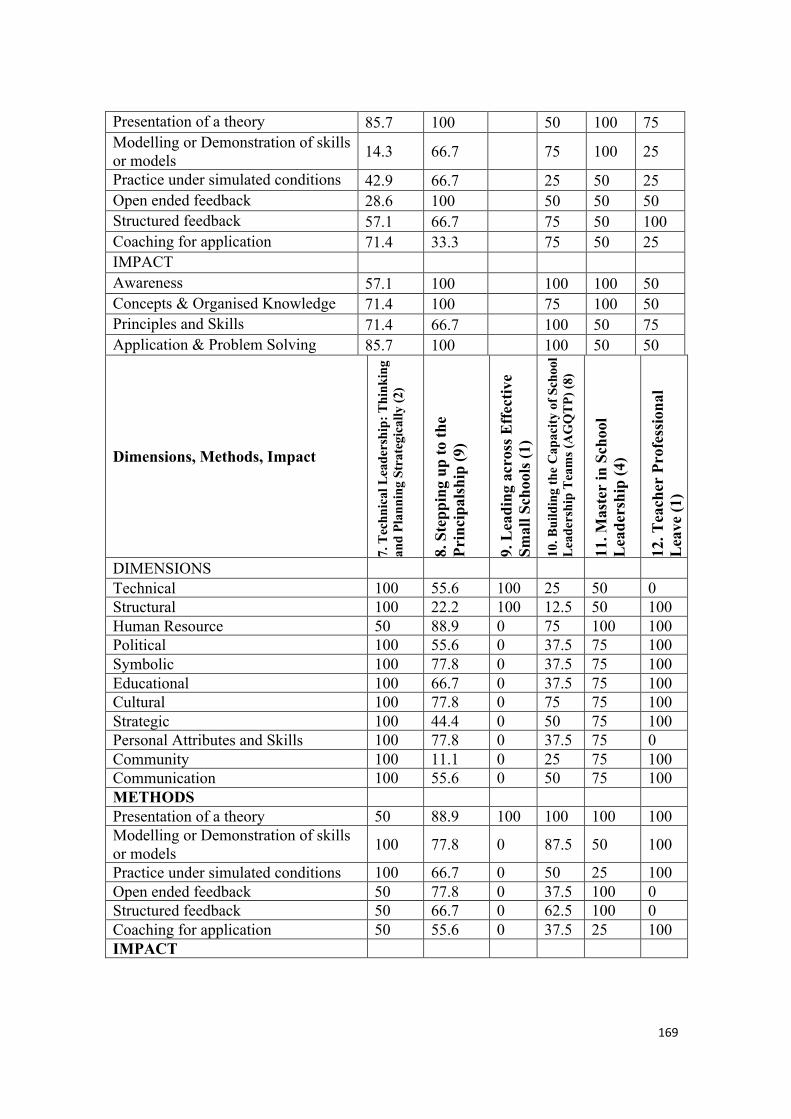
169
Presentation of a theory 85.7 100 50 100 75 Modelling or Demonstration of skills or models 14.3 66.7 75 100 25
Practice under simulated conditions 42.9 66.7 25 50 25 Open ended feedback 28.6 100 50 50 50 Structured feedback 57.1 66.7 75 50 100 Coaching for application 71.4 33.3 75 50 25 IMPACT Awareness 57.1 100 100 100 50 Concepts & Organised Knowledge 71.4 100 75 100 50 Principles and Skills 71.4 66.7 100 50 75 Application & Problem Solving 85.7 100 100 50 50
Dimensions, Methods, Impact
7. T
echn
ical
Lea
ders
hip:
Thi
nkin
g an
d Pl
anni
ng S
trat
egic
ally
(2)
8. S
tepp
ing
up to
the
Prin
cipa
lshi
p (9
)
9. L
e adi
ng a
cros
s Eff
ectiv
e Sm
all S
choo
ls (1
)
10. B
uild
ing
the
Cap
acity
of S
choo
l Le
ader
ship
Tea
ms (
AG
QTP
) (8)
11. M
aste
r in
Sch
ool
Lea
ders
hip
(4)
12. T
each
er P
rofe
ssio
nal
Lea
ve (1
)
DIMENSIONS Technical 100 55.6 100 25 50 0 Structural 100 22.2 100 12.5 50 100 Human Resource 50 88.9 0 75 100 100 Political 100 55.6 0 37.5 75 100 Symbolic 100 77.8 0 37.5 75 100 Educational 100 66.7 0 37.5 75 100 Cultural 100 77.8 0 75 75 100 Strategic 100 44.4 0 50 75 100 Personal Attributes and Skills 100 77.8 0 37.5 75 0 Community 100 11.1 0 25 75 100 Communication 100 55.6 0 50 75 100 METHODS Presentation of a theory 50 88.9 100 100 100 100 Modelling or Demonstration of skills or models 100 77.8 0 87.5 50 100
Practice under simulated conditions 100 66.7 0 50 25 100 Open ended feedback 50 77.8 0 37.5 100 0 Structured feedback 50 66.7 0 62.5 100 0 Coaching for application 50 55.6 0 37.5 25 100 IMPACT
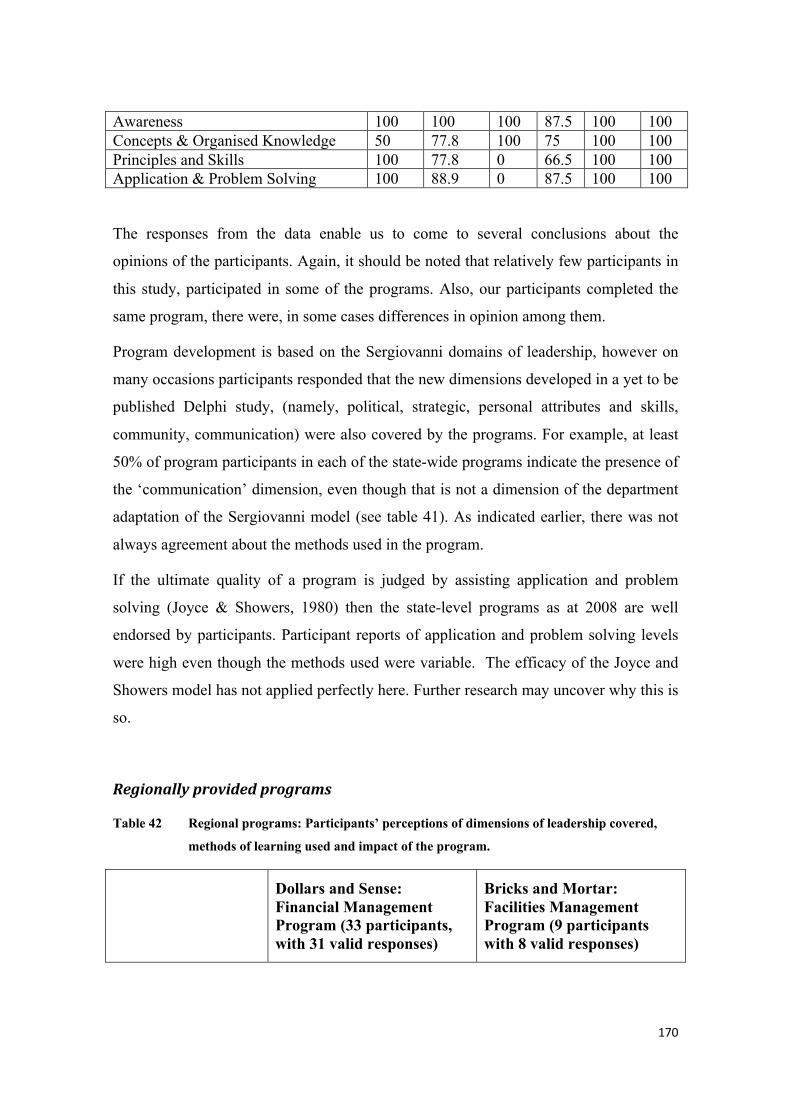
170
Awareness 100 100 100 87.5 100 100 Concepts & Organised Knowledge 50 77.8 100 75 100 100 Principles and Skills 100 77.8 0 66.5 100 100 Application & Problem Solving 100 88.9 0 87.5 100 100
The responses from the data enable us to come to several conclusions about the
opinions of the participants. Again, it should be noted that relatively few participants in
this study, participated in some of the programs. Also, our participants completed the
same program, there were, in some cases differences in opinion among them.
Program development is based on the Sergiovanni domains of leadership, however on
many occasions participants responded that the new dimensions developed in a yet to be
published Delphi study, (namely, political, strategic, personal attributes and skills,
community, communication) were also covered by the programs. For example, at least
50% of program participants in each of the state-wide programs indicate the presence of
the ‘communication’ dimension, even though that is not a dimension of the department
adaptation of the Sergiovanni model (see table 41). As indicated earlier, there was not
always agreement about the methods used in the program.
If the ultimate quality of a program is judged by assisting application and problem
solving (Joyce & Showers, 1980) then the state-level programs as at 2008 are well
endorsed by participants. Participant reports of application and problem solving levels
were high even though the methods used were variable. The efficacy of the Joyce and
Showers model has not applied perfectly here. Further research may uncover why this is
so.
Regionallyprovidedprograms
Table 42 Regional programs: Participants’ perceptions of dimensions of leadership covered,
methods of learning used and impact of the program.
Dollars and Sense: Financial Management Program (33 participants, with 31 valid responses)
Bricks and Mortar: Facilities Management Program (9 participants with 8 valid responses)
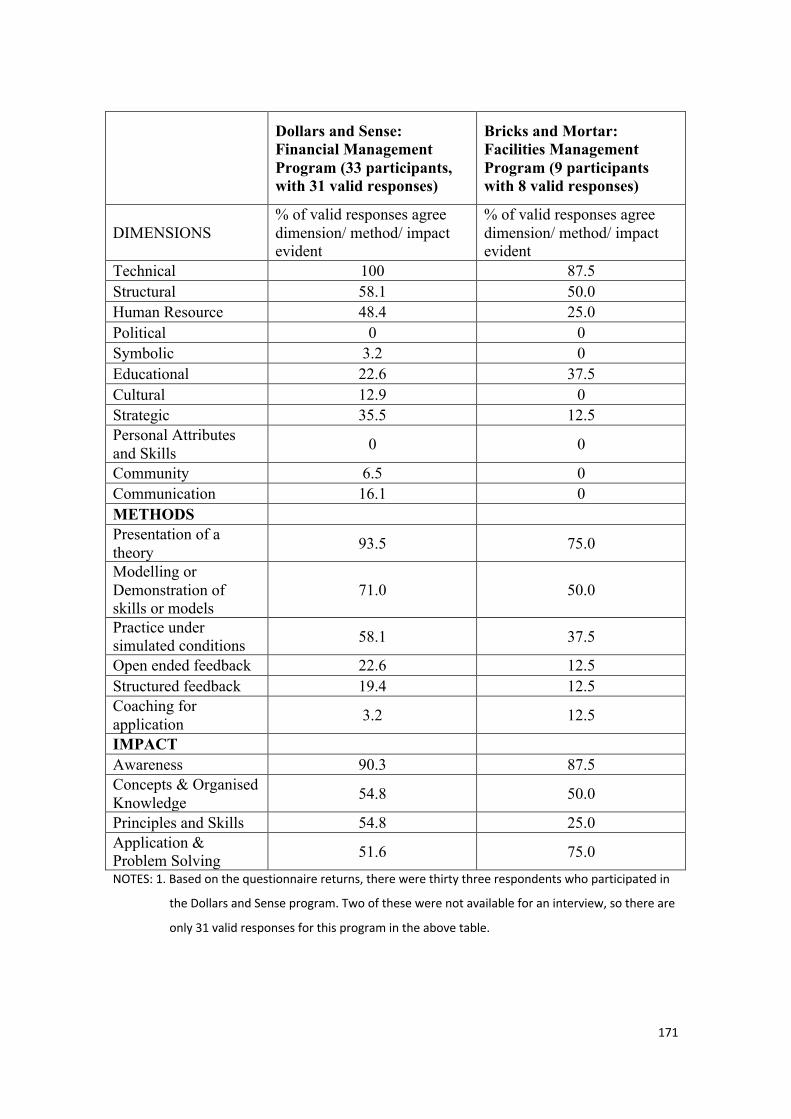
171
Dollars and Sense: Financial Management Program (33 participants, with 31 valid responses)
Bricks and Mortar: Facilities Management Program (9 participants with 8 valid responses)
DIMENSIONS % of valid responses agree dimension/ method/ impact evident
% of valid responses agree dimension/ method/ impact evident
Technical 100 87.5 Structural 58.1 50.0 Human Resource 48.4 25.0 Political 0 0 Symbolic 3.2 0 Educational 22.6 37.5 Cultural 12.9 0 Strategic 35.5 12.5 Personal Attributes and Skills 0 0
Community 6.5 0 Communication 16.1 0 METHODS Presentation of a theory 93.5 75.0
Modelling or Demonstration of skills or models
71.0 50.0
Practice under simulated conditions 58.1 37.5
Open ended feedback 22.6 12.5 Structured feedback 19.4 12.5 Coaching for application 3.2 12.5
IMPACT Awareness 90.3 87.5 Concepts & Organised Knowledge 54.8 50.0
Principles and Skills 54.8 25.0 Application & Problem Solving 51.6 75.0 NOTES: 1. Based on the questionnaire returns, there were thirty three respondents who participated in
the Dollars and Sense program. Two of these were not available for an interview, so there are
only 31 valid responses for this program in the above table.
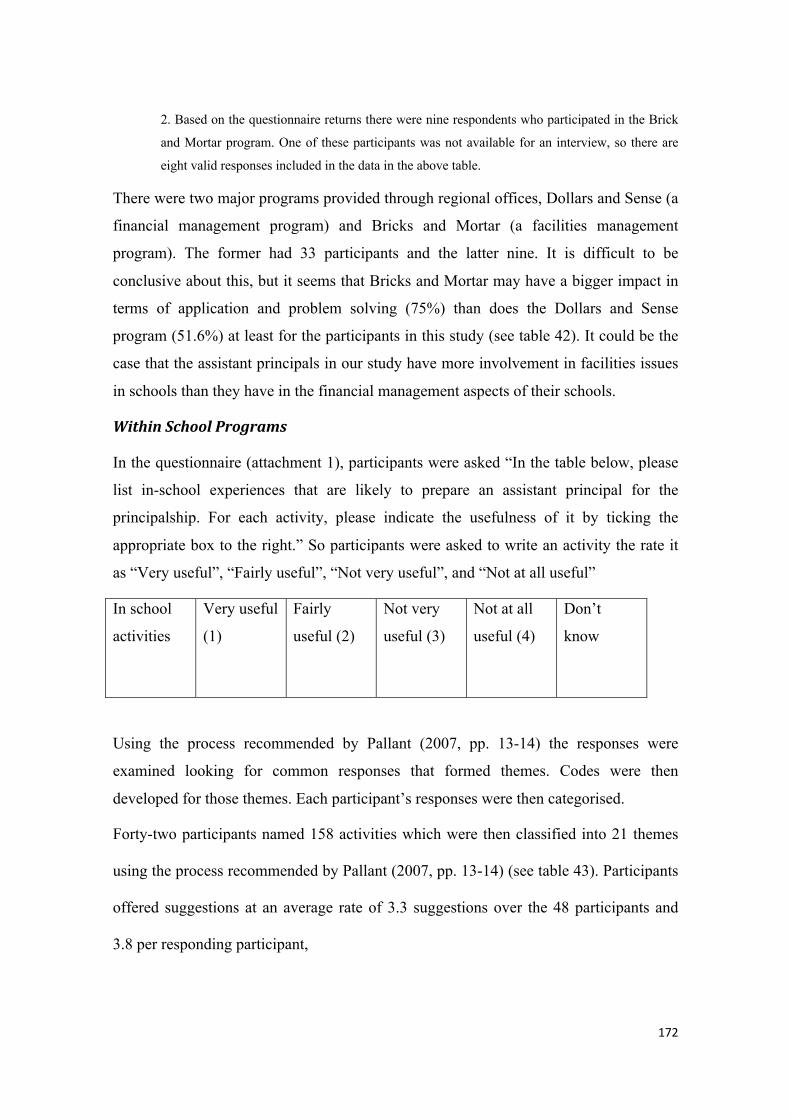
172
2. Based on the questionnaire returns there were nine respondents who participated in the Brick
and Mortar program. One of these participants was not available for an interview, so there are
eight valid responses included in the data in the above table.
There were two major programs provided through regional offices, Dollars and Sense (a
financial management program) and Bricks and Mortar (a facilities management
program). The former had 33 participants and the latter nine. It is difficult to be
conclusive about this, but it seems that Bricks and Mortar may have a bigger impact in
terms of application and problem solving (75%) than does the Dollars and Sense
program (51.6%) at least for the participants in this study (see table 42). It could be the
case that the assistant principals in our study have more involvement in facilities issues
in schools than they have in the financial management aspects of their schools.
WithinSchoolPrograms
In the questionnaire (attachment 1), participants were asked “In the table below, please
list in-school experiences that are likely to prepare an assistant principal for the
principalship. For each activity, please indicate the usefulness of it by ticking the
appropriate box to the right.” So participants were asked to write an activity the rate it
as “Very useful”, “Fairly useful”, “Not very useful”, and “Not at all useful”
In school
activities
Very useful
(1)
Fairly
useful (2)
Not very
useful (3)
Not at all
useful (4)
Don’t
know
Using the process recommended by Pallant (2007, pp. 13-14) the responses were
examined looking for common responses that formed themes. Codes were then
developed for those themes. Each participant’s responses were then categorised.
Forty-two participants named 158 activities which were then classified into 21 themes
using the process recommended by Pallant (2007, pp. 13-14) (see table 43). Participants
offered suggestions at an average rate of 3.3 suggestions over the 48 participants and
3.8 per responding participant,
173
The most commonly mentioned activity was that of actually leading a project (proposed
29 times). A variety of projects were suggested. The second most common activity was
a wide variety of committee membership, including school council (26). Acting in the
role of principal was seen to be valuable by 17 participants. Being mentored by a
principal was suggested by 12 participants and shadowing by 11. At the same frequency
was participation in external networks (8), specific professional development (8) and the
way the principal team operates (8). Experience in people management and project
management were both put forward by seven participants.
Gaining experience in community relations was suggested by four respondents, as was
the opportunity for job rotation and also the operation of an extended leadership team.
Helping others with their work, and so learning about it was proposed by three
participants, as was participation in professional development. Doing the leadership
work was suggested by two participants. Mentioned by one participant was gaining
broad experience, data analysis and planning, involvement in events, the gaining of
knowledge and participation in decision-making.

174
Table 43 Summary of Suggestions of in-school experiences that are likely to
prepare an Assistant Principal for the principalship.
Within School Activities No. of Mentions Summary Description of Theme
13 Lead 29 The experience of leading a project or area of the school
4 Committee 26 Committee membership, including school council
1 Acting 17 Acting in the principal role 2 Being Mentored 12 Being mentored by an experienced person 21 Shadowing 11 Work shadowing principal or other leader
9 External Networks 8 Involvement with networks beyond the school
17 Professional Development (specific) 8 Professional development specific to
particular roles in leadership/management 19 Principal Team 8 The principal team as a team
18 People Management 7 Direct experience of people management, especially challenging situations.
20 Project 7 Undertaking/involvement with defined projects
5 Community Relations 4 Relating to the broader school community and stakeholders
11 Job Rotation 4 Learning by doing a broad range of jobs
15 Leadership Team 4 Being an active participant in the school leadership team
10 Helping with the Work 3 Learning key areas by assisting with the work of others
14 Professional Development 3 Undertaking appropriate professional
development
7 Doing the Work 2 Dealing with day to day issues with staff and students
3 Broad Experience 1
6 Data Analysis and Planning 1 Using data to plan
8 Events 1 Participation in events to interact widely
12 Knowledge 1 Being aware of key policies and procedures
16 Participation in Decision Making 1 Participation in decision making on key
management issues
Total number of activities suggested 158
175
Ratings of the usefulness of the suggested within school activities were predominantly
the highest category ‘very useful’ (130, 82.3%) with 25 (15.8%) rated as ‘fairly useful’.
One rating of ‘Don’t know’ (0.6%) was recorded and two (1.3%) where a suggestion
was made but not rating for them was offered. The average rating was 1.1, close to
‘very useful’.
Summaryofobservationsaboutthetypeofprofessionaldevelopment
undertakenandtheusefulnessofthatprofessionaldevelopment.
From the self-report responses of the participants, some observations can be made.
State-wide programs:
Each of the state-wide programs, except one, had the participation of the assistant
principals in this study. However, participation rates seem to be relatively low, but this
could be for a range of reasons not related to their interest or willingness, for example
example quotas may impede participation. The reason behind any patterns of the
participation of assistant principals in professional development programs might be the
subject of further research. The response to programs by participants tends to be
positive.
According to the self reports of participants against the Joyce and Showers model
elements, the formal programs offered tend to have a positive impact on practice for
most of those who participate.
Regional programs:
Of the formal regional programs available, the financial management program is the
best attended. According to the self reports of participants against the Joyce and
Showers model elements, the two formal programs offered at regional level tend to have
a positive impact on practice for most of those who participate. There are a number of
176
other programs offered at regional level in addition to the two formally offered state-
wide through regions.
Other programs:
Assistant principals in this study undertake a wide range of professional development
programs on a wide range of topics in a variety of formats offered by a wide range of
providers. These programs are seen as useful by almost all who participate in them.
Within school programs:
Assistant principals in this study recommend a wide range of in-school activities as
useful in preparing an assistant principal for the principalship.
The most commonly mentioned within school activities mentioned were; leading a
project or area of the school (29 mentions), committee and council membership (26),
acting in the principal role (17), being mentored (12), and shadowing (11).Sixteen other
in-school strategies were suggested.
Researchquestionthree:JobSatisfaction:Whatistheirownsatisfactionandhowdotheyperceivethesatisfactionofprincipalsingeneral?This section of the results report findings in relation to the research question, “What is
their own satisfaction and how do they perceive the satisfaction of principals in
general”?
MinnesotaSatisfactionQuestionnaire(MSQ)
Participants were invited to complete the Minnesota Satisfaction Questionnaire (MSQ)
(Short Form) in two ways. First, they were asked to complete the standard MSQ (short
177
form) in the standard way, that is, as it applied to them. Second, they were asked to
complete a modified MSQ (short form) as they believed it applied to principals in
general. The aim was to measure the job satisfaction of assistant principals and compare
this with the assistant principals’ perceptions of principals’ job satisfaction. This was in
part to follow up the finding that assistant principals’ aspiration to the principalship is
linked to their perception of how satisfied principals are with their job (Lacey, 2002a). It
also provided the opportunity to explore any relationship between assistant principal job
satisfaction and their career intention.
Interpretation of MSQ for Assistant Principals.
Weiss, Dawis, England, & Lofquist (1967, p. 113) recommend ways of interpreting the
MSQ scores. First there is the comparison of participants’ raw scores with the norms of
an appropriate group. Here the MSQ (short form) presents a difficulty because there are
so few norm groups and no assistant principal normed group, with the closest group
possibly being Engineers. It was decided not to use the normed scores available. A
second suggested method of interpretation (Weiss et al., 1967, pp. 4-5) is “to interpret
raw scores from all scales by ranking them. These rankings indicate areas of relatively
greater or lesser satisfaction.” As a further aide to interpretation, especially where
individual follow-up is contemplated, Weiss and colleagues advise that,
“… a percentile score of 75 or higher is ordinarily taken to represent a high
degree of satisfaction; a percentile score of 25 or lower would represent a
low level of satisfaction; and, scores in the middle range of percentiles (26
to 74) would indicate average satisfaction.” (Weiss et al., 1967, pp. 4-5)
This analysis using percentile scores was not undertaken, given the lack of data from a
suitable normed group.
ReliabilityinthisstudyoftheMSQandMSQ(modified)
Cronbach’s Alpha reliability was calculated for the MSQ and the MSQ (modified
version) using SPSS software. In this study, the reliability of the MSQ general
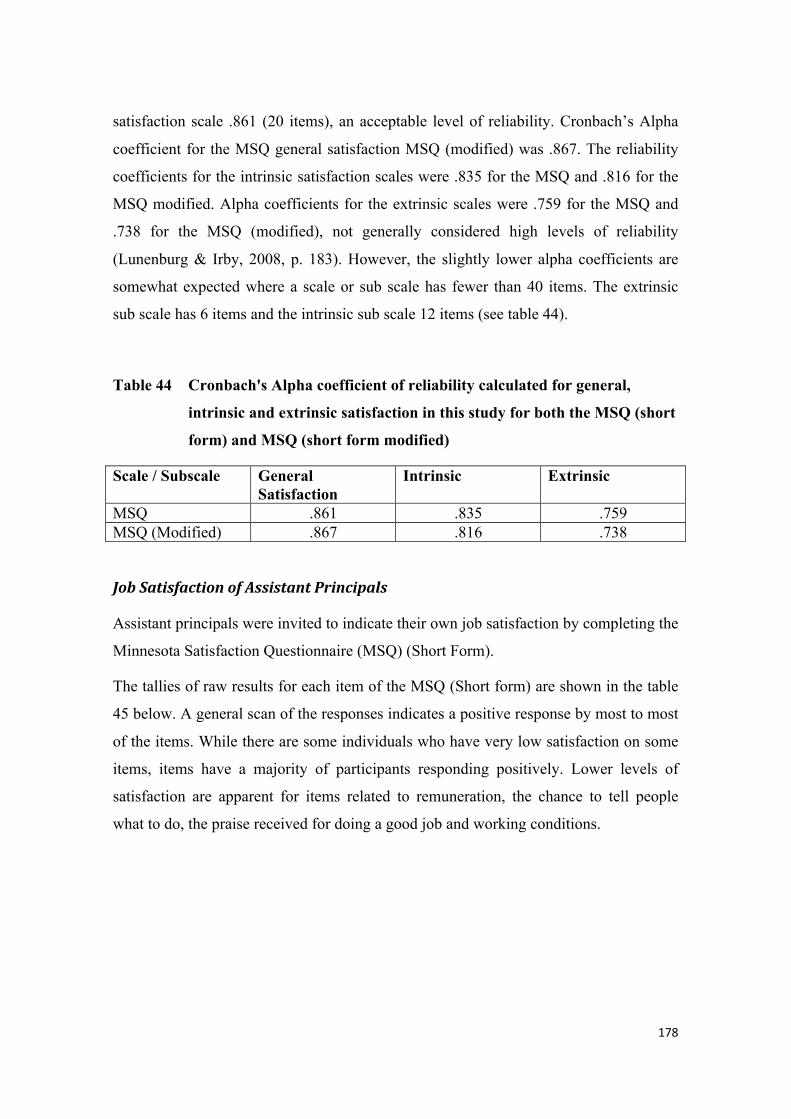
178
satisfaction scale .861 (20 items), an acceptable level of reliability. Cronbach’s Alpha
coefficient for the MSQ general satisfaction MSQ (modified) was .867. The reliability
coefficients for the intrinsic satisfaction scales were .835 for the MSQ and .816 for the
MSQ modified. Alpha coefficients for the extrinsic scales were .759 for the MSQ and
.738 for the MSQ (modified), not generally considered high levels of reliability
(Lunenburg & Irby, 2008, p. 183). However, the slightly lower alpha coefficients are
somewhat expected where a scale or sub scale has fewer than 40 items. The extrinsic
sub scale has 6 items and the intrinsic sub scale 12 items (see table 44).
Table 44 Cronbach's Alpha coefficient of reliability calculated for general,
intrinsic and extrinsic satisfaction in this study for both the MSQ (short
form) and MSQ (short form modified)
Scale / Subscale General Satisfaction
Intrinsic Extrinsic
MSQ .861 .835 .759 MSQ (Modified) .867 .816 .738
JobSatisfactionofAssistantPrincipals
Assistant principals were invited to indicate their own job satisfaction by completing the
Minnesota Satisfaction Questionnaire (MSQ) (Short Form).
The tallies of raw results for each item of the MSQ (Short form) are shown in the table
45 below. A general scan of the responses indicates a positive response by most to most
of the items. While there are some individuals who have very low satisfaction on some
items, items have a majority of participants responding positively. Lower levels of
satisfaction are apparent for items related to remuneration, the chance to tell people
what to do, the praise received for doing a good job and working conditions.
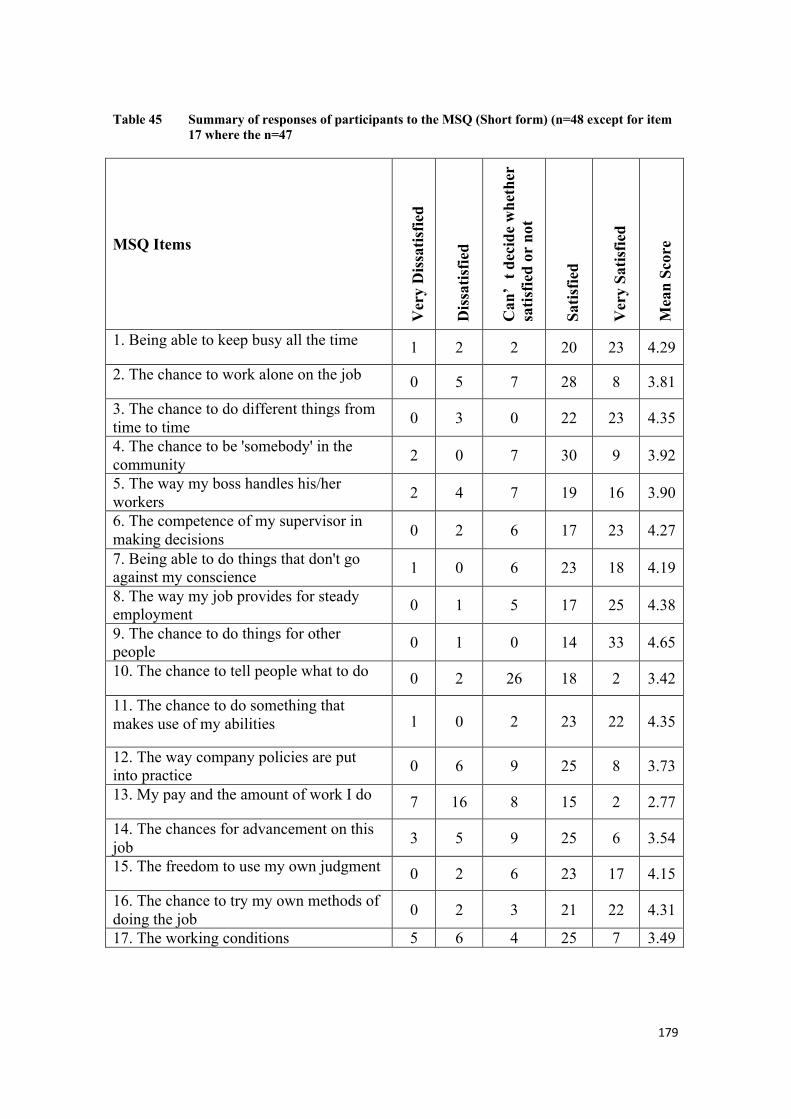
179
Table 45 Summary of responses of participants to the MSQ (Short form) (n=48 except for item 17 where the n=47
MSQ Items
Ver
y D
issa
tisfie
d
Dis
satis
fied
Can
’t d
ecid
e w
heth
er
satis
fied
or n
ot
Satis
fied
Ver
y Sa
tisfie
d
Mea
n Sc
ore
1. Being able to keep busy all the time 1 2 2 20 23 4.29
2. The chance to work alone on the job 0 5 7 28 8 3.81
3. The chance to do different things from time to time 0 3 0 22 23 4.35
4. The chance to be 'somebody' in the community 2 0 7 30 9 3.92
5. The way my boss handles his/her workers 2 4 7 19 16 3.90
6. The competence of my supervisor in making decisions 0 2 6 17 23 4.27
7. Being able to do things that don't go against my conscience 1 0 6 23 18 4.19
8. The way my job provides for steady employment 0 1 5 17 25 4.38
9. The chance to do things for other people 0 1 0 14 33 4.65
10. The chance to tell people what to do 0 2 26 18 2 3.42
11. The chance to do something that makes use of my abilities 1 0 2 23 22 4.35
12. The way company policies are put into practice 0 6 9 25 8 3.73
13. My pay and the amount of work I do 7 16 8 15 2 2.77
14. The chances for advancement on this job 3 5 9 25 6 3.54
15. The freedom to use my own judgment 0 2 6 23 17 4.15
16. The chance to try my own methods of doing the job 0 2 3 21 22 4.31
17. The working conditions 5 6 4 25 7 3.49
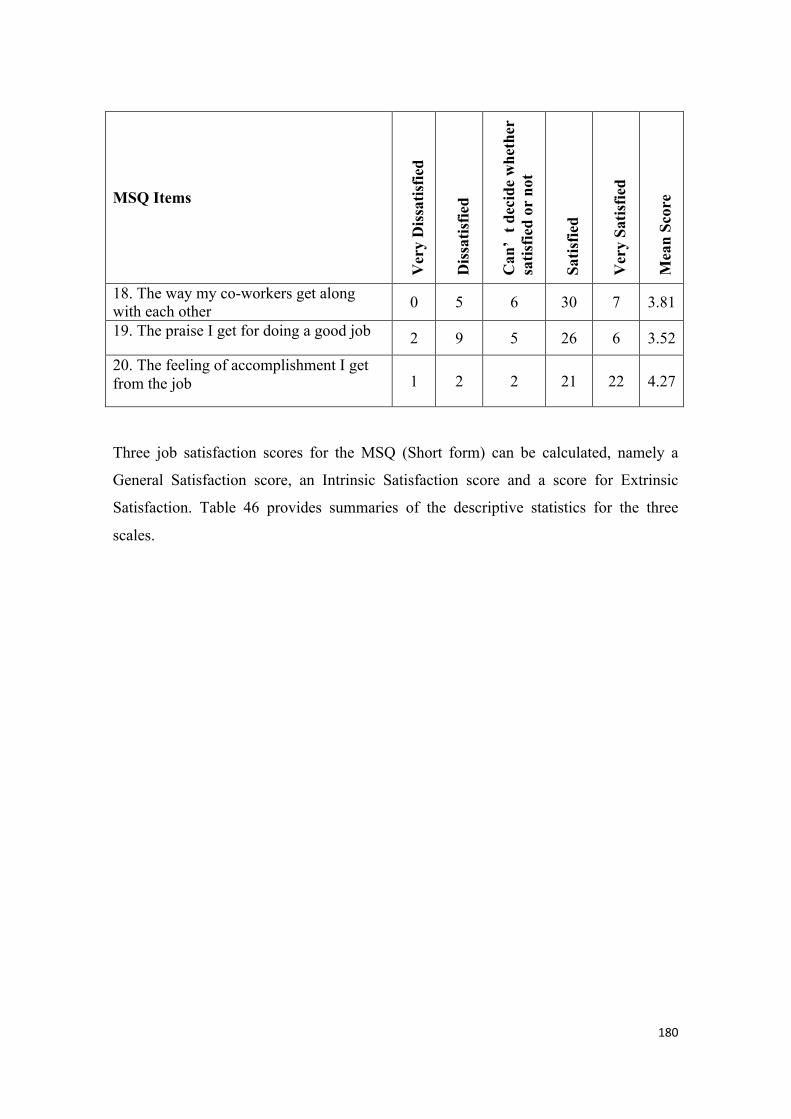
180
MSQ Items
Ver
y D
issa
tisfie
d
Dis
satis
fied
Can
’t d
ecid
e w
heth
er
satis
fied
or n
ot
Satis
fied
Ver
y Sa
tisfie
d
Mea
n Sc
ore
18. The way my co-workers get along with each other 0 5 6 30 7 3.81
19. The praise I get for doing a good job 2 9 5 26 6 3.52
20. The feeling of accomplishment I get from the job 1 2 2 21 22 4.27
Three job satisfaction scores for the MSQ (Short form) can be calculated, namely a
General Satisfaction score, an Intrinsic Satisfaction score and a score for Extrinsic
Satisfaction. Table 46 provides summaries of the descriptive statistics for the three
scales.
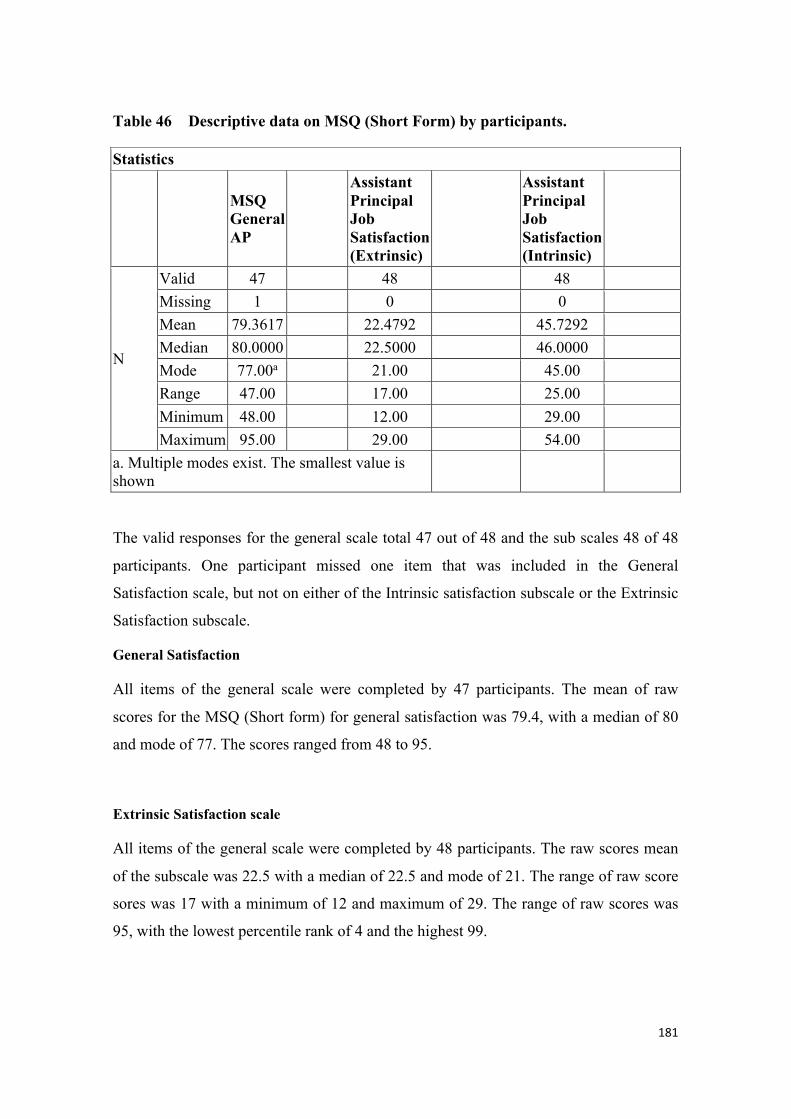
181
Table 46 Descriptive data on MSQ (Short Form) by participants.
Statistics
MSQ General AP
Assistant Principal Job Satisfaction (Extrinsic)
Assistant Principal Job Satisfaction (Intrinsic)
N
Valid 47 48 48 Missing 1 0 0 Mean 79.3617 22.4792 45.7292 Median 80.0000 22.5000 46.0000 Mode 77.00a 21.00 45.00 Range 47.00 17.00 25.00 Minimum 48.00 12.00 29.00 Maximum 95.00 29.00 54.00
a. Multiple modes exist. The smallest value is shown
The valid responses for the general scale total 47 out of 48 and the sub scales 48 of 48
participants. One participant missed one item that was included in the General
Satisfaction scale, but not on either of the Intrinsic satisfaction subscale or the Extrinsic
Satisfaction subscale.
General Satisfaction
All items of the general scale were completed by 47 participants. The mean of raw
scores for the MSQ (Short form) for general satisfaction was 79.4, with a median of 80
and mode of 77. The scores ranged from 48 to 95.
Extrinsic Satisfaction scale
All items of the general scale were completed by 48 participants. The raw scores mean
of the subscale was 22.5 with a median of 22.5 and mode of 21. The range of raw score
sores was 17 with a minimum of 12 and maximum of 29. The range of raw scores was
95, with the lowest percentile rank of 4 and the highest 99.
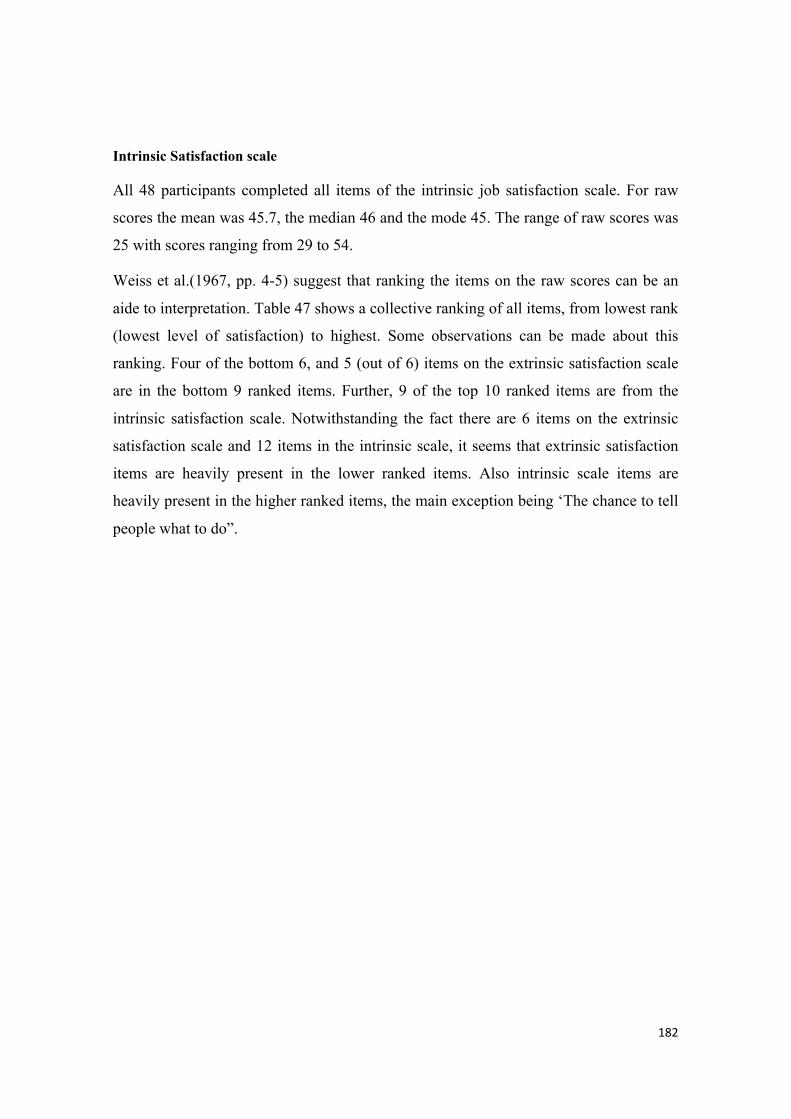
182
Intrinsic Satisfaction scale
All 48 participants completed all items of the intrinsic job satisfaction scale. For raw
scores the mean was 45.7, the median 46 and the mode 45. The range of raw scores was
25 with scores ranging from 29 to 54.
Weiss et al.(1967, pp. 4-5) suggest that ranking the items on the raw scores can be an
aide to interpretation. Table 47 shows a collective ranking of all items, from lowest rank
(lowest level of satisfaction) to highest. Some observations can be made about this
ranking. Four of the bottom 6, and 5 (out of 6) items on the extrinsic satisfaction scale
are in the bottom 9 ranked items. Further, 9 of the top 10 ranked items are from the
intrinsic satisfaction scale. Notwithstanding the fact there are 6 items on the extrinsic
satisfaction scale and 12 items in the intrinsic scale, it seems that extrinsic satisfaction
items are heavily present in the lower ranked items. Also intrinsic scale items are
heavily present in the higher ranked items, the main exception being ‘The chance to tell
people what to do”.
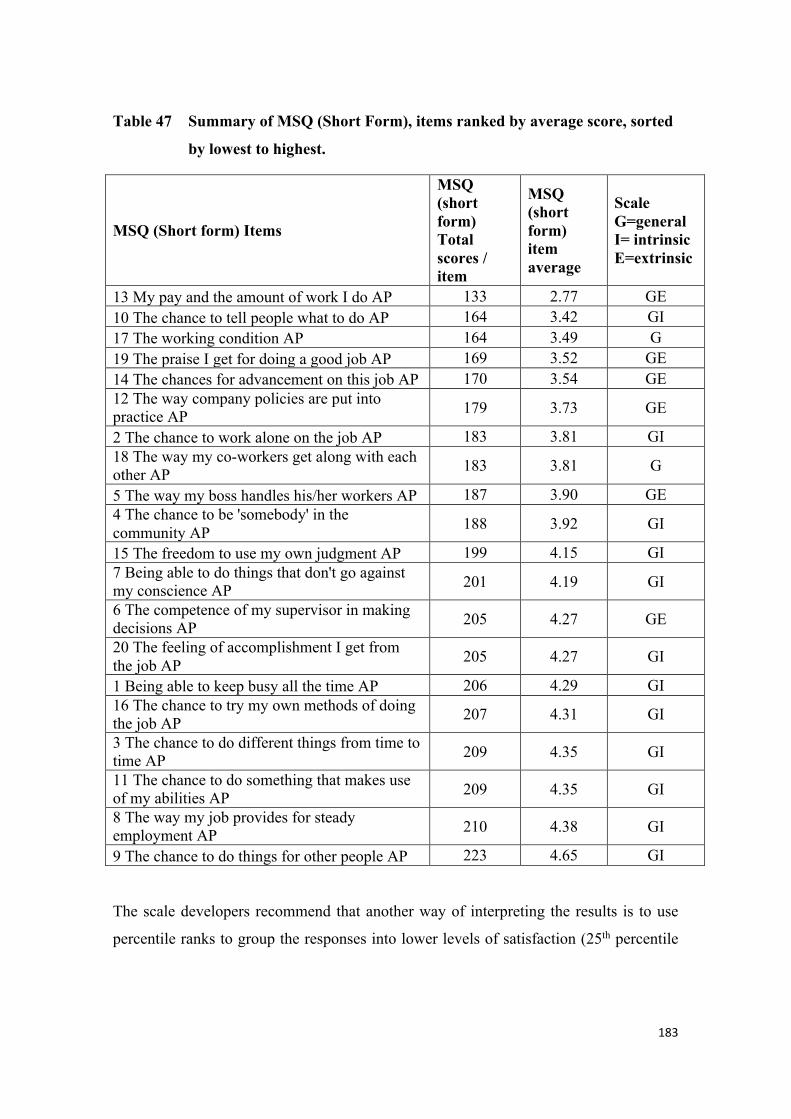
183
Table 47 Summary of MSQ (Short Form), items ranked by average score, sorted
by lowest to highest.
MSQ (Short form) Items
MSQ (short form) Total scores / item
MSQ (short form) item average
Scale G=general I= intrinsic E=extrinsic
13 My pay and the amount of work I do AP 133 2.77 GE 10 The chance to tell people what to do AP 164 3.42 GI 17 The working condition AP 164 3.49 G 19 The praise I get for doing a good job AP 169 3.52 GE 14 The chances for advancement on this job AP 170 3.54 GE 12 The way company policies are put into practice AP 179 3.73 GE
2 The chance to work alone on the job AP 183 3.81 GI 18 The way my co-workers get along with each other AP 183 3.81 G
5 The way my boss handles his/her workers AP 187 3.90 GE 4 The chance to be 'somebody' in the community AP 188 3.92 GI
15 The freedom to use my own judgment AP 199 4.15 GI 7 Being able to do things that don't go against my conscience AP 201 4.19 GI
6 The competence of my supervisor in making decisions AP 205 4.27 GE
20 The feeling of accomplishment I get from the job AP 205 4.27 GI
1 Being able to keep busy all the time AP 206 4.29 GI 16 The chance to try my own methods of doing the job AP 207 4.31 GI
3 The chance to do different things from time to time AP 209 4.35 GI
11 The chance to do something that makes use of my abilities AP 209 4.35 GI
8 The way my job provides for steady employment AP 210 4.38 GI
9 The chance to do things for other people AP 223 4.65 GI
The scale developers recommend that another way of interpreting the results is to use
percentile ranks to group the responses into lower levels of satisfaction (25th percentile
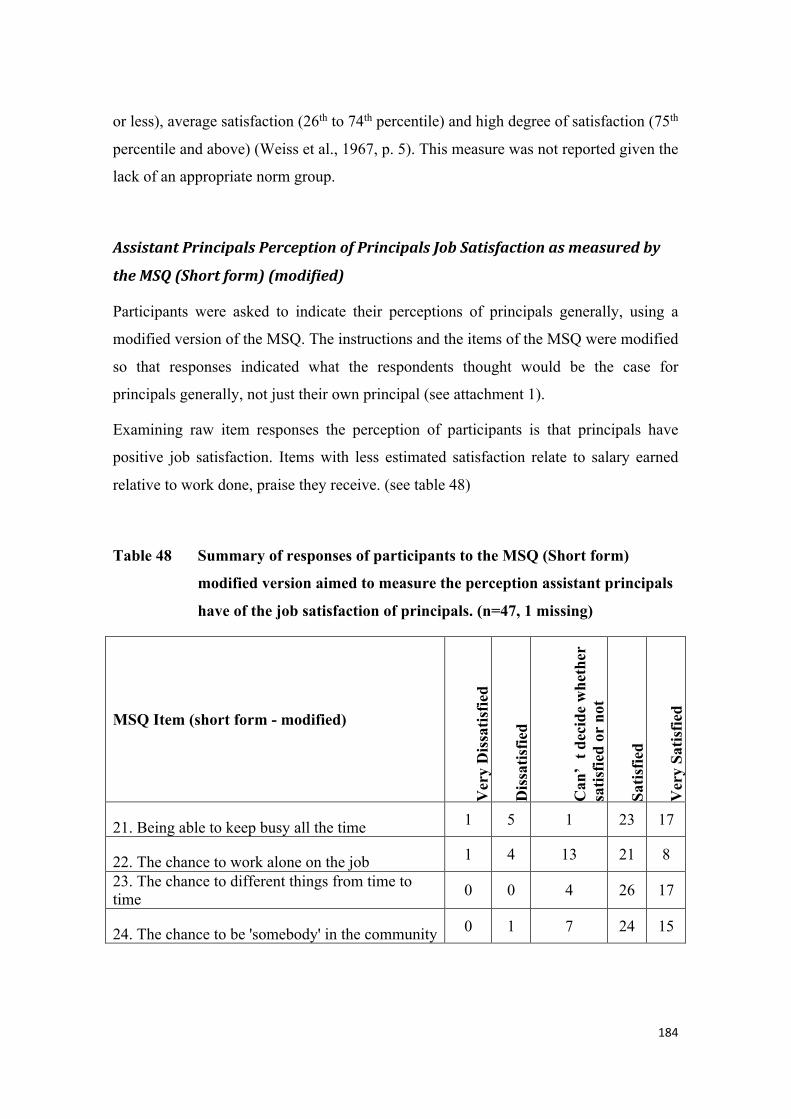
184
or less), average satisfaction (26th to 74th percentile) and high degree of satisfaction (75th
percentile and above) (Weiss et al., 1967, p. 5). This measure was not reported given the
lack of an appropriate norm group.
AssistantPrincipalsPerceptionofPrincipalsJobSatisfactionasmeasuredby
theMSQ(Shortform)(modified)
Participants were asked to indicate their perceptions of principals generally, using a
modified version of the MSQ. The instructions and the items of the MSQ were modified
so that responses indicated what the respondents thought would be the case for
principals generally, not just their own principal (see attachment 1).
Examining raw item responses the perception of participants is that principals have
positive job satisfaction. Items with less estimated satisfaction relate to salary earned
relative to work done, praise they receive. (see table 48)
Table 48 Summary of responses of participants to the MSQ (Short form)
modified version aimed to measure the perception assistant principals
have of the job satisfaction of principals. (n=47, 1 missing)
MSQ Item (short form - modified)
Ver
y D
issa
tisfie
d
Dis
satis
fied
Can
’t d
ecid
e w
heth
er
satis
fied
or n
ot
Satis
fied
Ver
y Sa
tisfie
d
21. Being able to keep busy all the time 1 5 1 23 17
22. The chance to work alone on the job 1 4 13 21 8
23. The chance to different things from time to time 0 0 4 26 17
24. The chance to be 'somebody' in the community 0 1 7 24 15
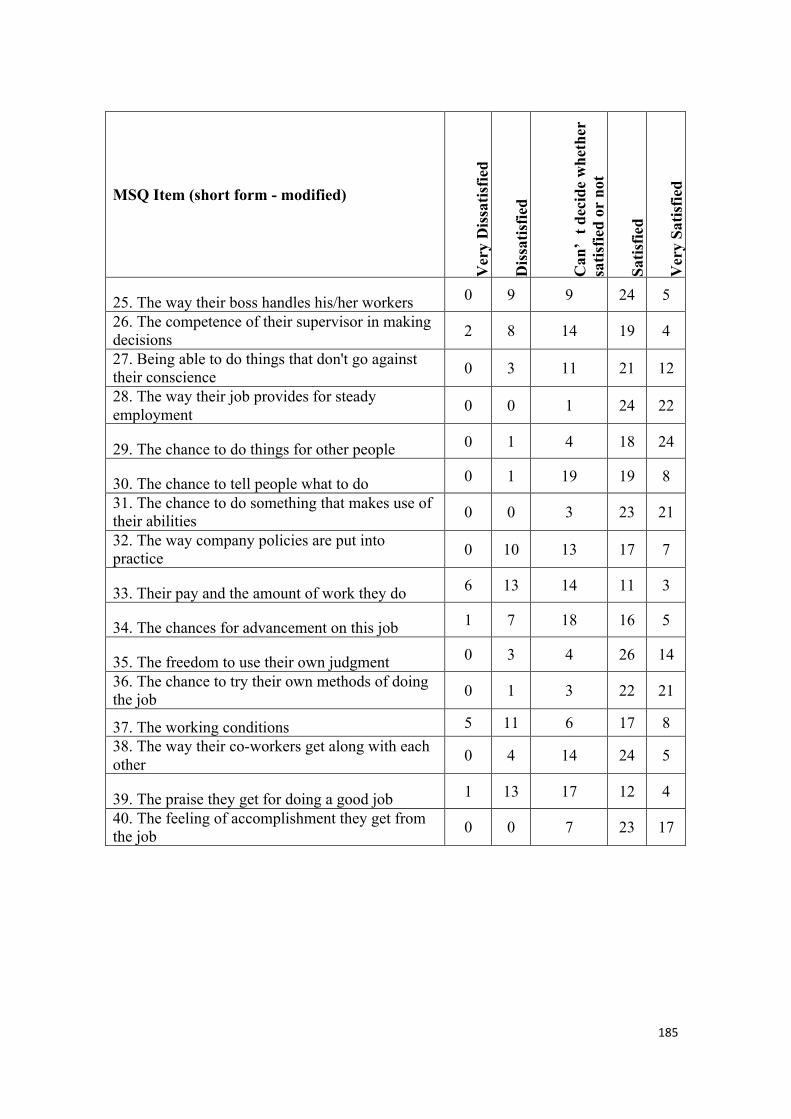
185
MSQ Item (short form - modified)
Ver
y D
issa
tisfie
d
Dis
satis
fied
Can
’t d
ecid
e w
heth
er
satis
fied
or n
ot
Satis
fied
Ver
y Sa
tisfie
d
25. The way their boss handles his/her workers 0 9 9 24 5
26. The competence of their supervisor in making decisions 2 8 14 19 4
27. Being able to do things that don't go against their conscience 0 3 11 21 12
28. The way their job provides for steady employment 0 0 1 24 22
29. The chance to do things for other people 0 1 4 18 24
30. The chance to tell people what to do 0 1 19 19 8
31. The chance to do something that makes use of their abilities 0 0 3 23 21
32. The way company policies are put into practice 0 10 13 17 7
33. Their pay and the amount of work they do 6 13 14 11 3
34. The chances for advancement on this job 1 7 18 16 5
35. The freedom to use their own judgment 0 3 4 26 14
36. The chance to try their own methods of doing the job 0 1 3 22 21
37. The working conditions 5 11 6 17 8 38. The way their co-workers get along with each other 0 4 14 24 5
39. The praise they get for doing a good job 1 13 17 12 4
40. The feeling of accomplishment they get from the job 0 0 7 23 17
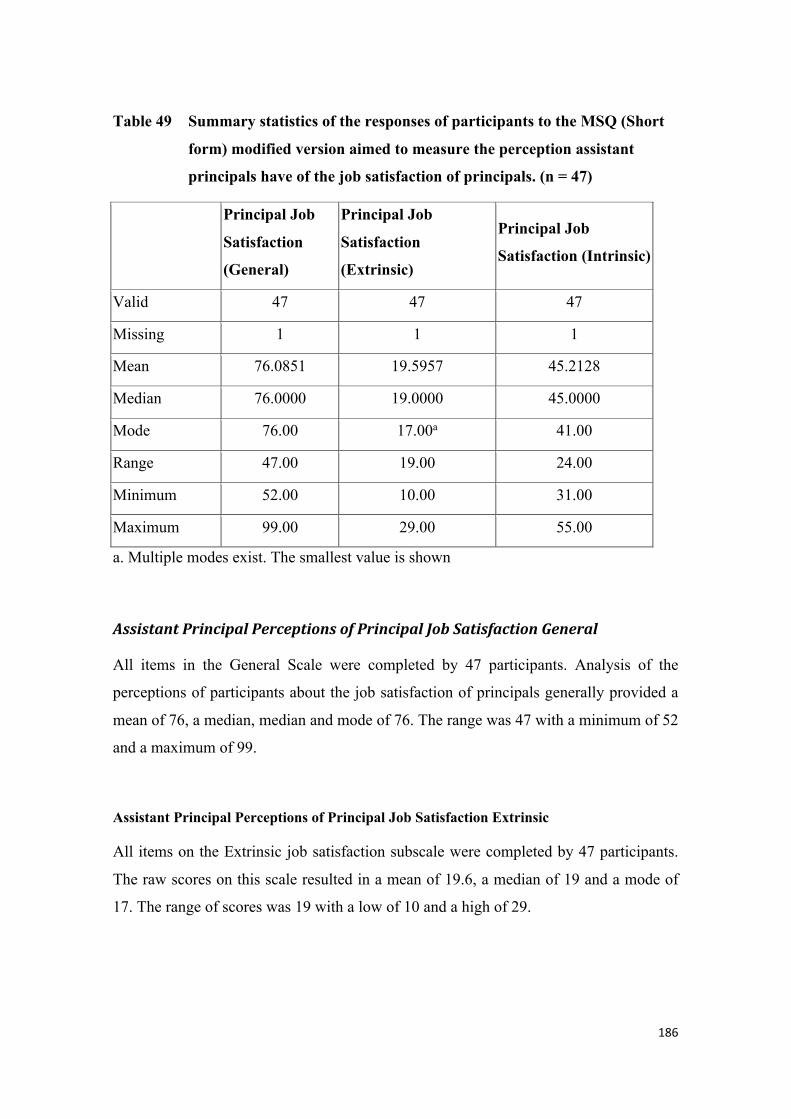
186
Table 49 Summary statistics of the responses of participants to the MSQ (Short
form) modified version aimed to measure the perception assistant
principals have of the job satisfaction of principals. (n = 47)
Principal Job
Satisfaction
(General)
Principal Job
Satisfaction
(Extrinsic)
Principal Job
Satisfaction (Intrinsic)
Valid 47 47 47
Missing 1 1 1
Mean 76.0851 19.5957 45.2128
Median 76.0000 19.0000 45.0000
Mode 76.00 17.00a 41.00
Range 47.00 19.00 24.00
Minimum 52.00 10.00 31.00
Maximum 99.00 29.00 55.00
a. Multiple modes exist. The smallest value is shown
AssistantPrincipalPerceptionsofPrincipalJobSatisfactionGeneral
All items in the General Scale were completed by 47 participants. Analysis of the
perceptions of participants about the job satisfaction of principals generally provided a
mean of 76, a median, median and mode of 76. The range was 47 with a minimum of 52
and a maximum of 99.
Assistant Principal Perceptions of Principal Job Satisfaction Extrinsic
All items on the Extrinsic job satisfaction subscale were completed by 47 participants.
The raw scores on this scale resulted in a mean of 19.6, a median of 19 and a mode of
17. The range of scores was 19 with a low of 10 and a high of 29.
187
Assistant Principal Perceptions of Principal Job Satisfaction Intrinsic
All items on the Intrinsic job satisfaction subscale were completed by 47 participants.
Analysis of the raw score responses revealed a mean of 45.2, a median of 42 and a
mode of 41. The range of responses was 24, with the lowest raw score being 31 and the
highest 55
Assistant Principal Perceptions of principal job satisfaction items ranked
Weiss et. al.,(1967, pp. 4-5) suggest that an aid to interpretation is the ranking of items
using raw scores. Table 50 below provides a summary of the items ranked from lowest
to highest mean weighted responses.
This display of the data highlights several key points. First, participants rated all six
items in external satisfaction in the bottom seven rankings. All intrinsic satisfaction
scale items rank above all extrinsic items. Therefore assistant principals see lower levels
of satisfaction as being external to the principals themselves, namely, pay, praise,
working conditions, competence of supervisors, opportunities for advancement, policy
implementation, and handling by their boss.
Participants perceive higher levels of satisfaction of principals generally in intrinsic
satisfaction, when compared with extrinsic satisfaction.
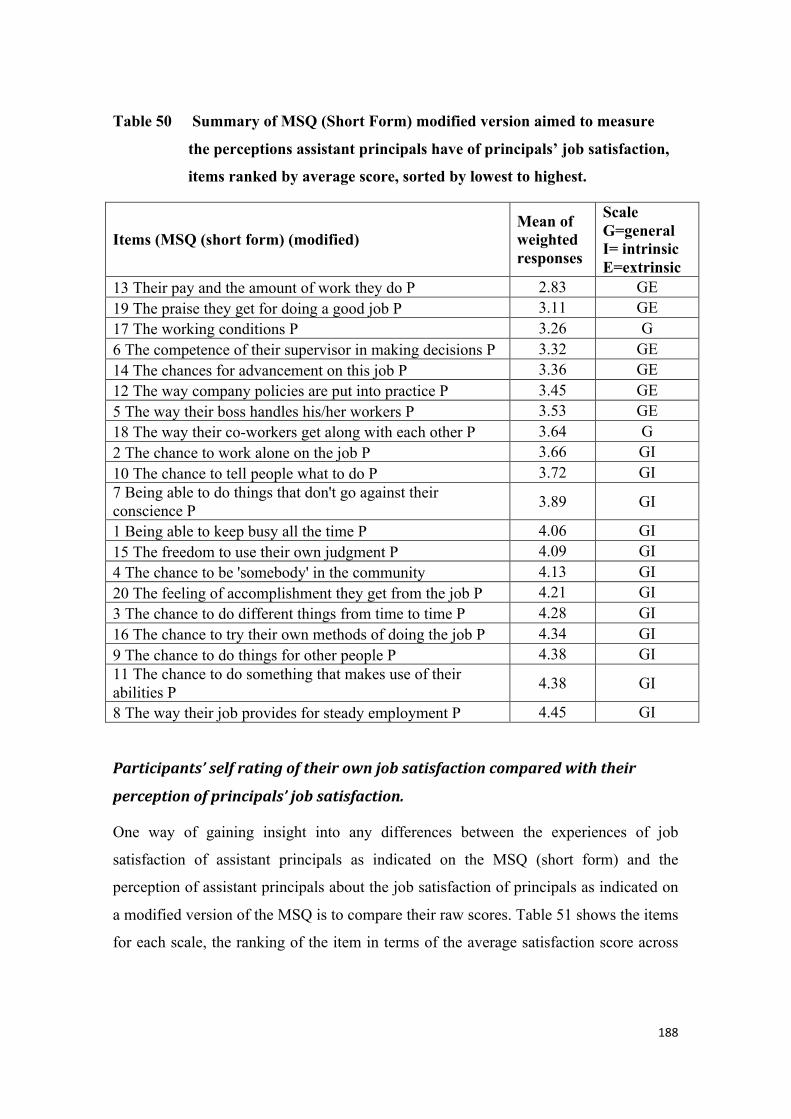
188
Table 50 Summary of MSQ (Short Form) modified version aimed to measure
the perceptions assistant principals have of principals’ job satisfaction,
items ranked by average score, sorted by lowest to highest.
Items (MSQ (short form) (modified) Mean of weighted responses
Scale G=general I= intrinsic E=extrinsic
13 Their pay and the amount of work they do P 2.83 GE 19 The praise they get for doing a good job P 3.11 GE 17 The working conditions P 3.26 G 6 The competence of their supervisor in making decisions P 3.32 GE 14 The chances for advancement on this job P 3.36 GE 12 The way company policies are put into practice P 3.45 GE 5 The way their boss handles his/her workers P 3.53 GE 18 The way their co-workers get along with each other P 3.64 G 2 The chance to work alone on the job P 3.66 GI 10 The chance to tell people what to do P 3.72 GI 7 Being able to do things that don't go against their conscience P 3.89 GI
1 Being able to keep busy all the time P 4.06 GI 15 The freedom to use their own judgment P 4.09 GI 4 The chance to be 'somebody' in the community 4.13 GI 20 The feeling of accomplishment they get from the job P 4.21 GI 3 The chance to do different things from time to time P 4.28 GI 16 The chance to try their own methods of doing the job P 4.34 GI 9 The chance to do things for other people P 4.38 GI 11 The chance to do something that makes use of their abilities P 4.38 GI
8 The way their job provides for steady employment P 4.45 GI
Participants’selfratingoftheirownjobsatisfactioncomparedwiththeir
perceptionofprincipals’jobsatisfaction.
One way of gaining insight into any differences between the experiences of job
satisfaction of assistant principals as indicated on the MSQ (short form) and the
perception of assistant principals about the job satisfaction of principals as indicated on
a modified version of the MSQ is to compare their raw scores. Table 51 shows the items
for each scale, the ranking of the item in terms of the average satisfaction score across
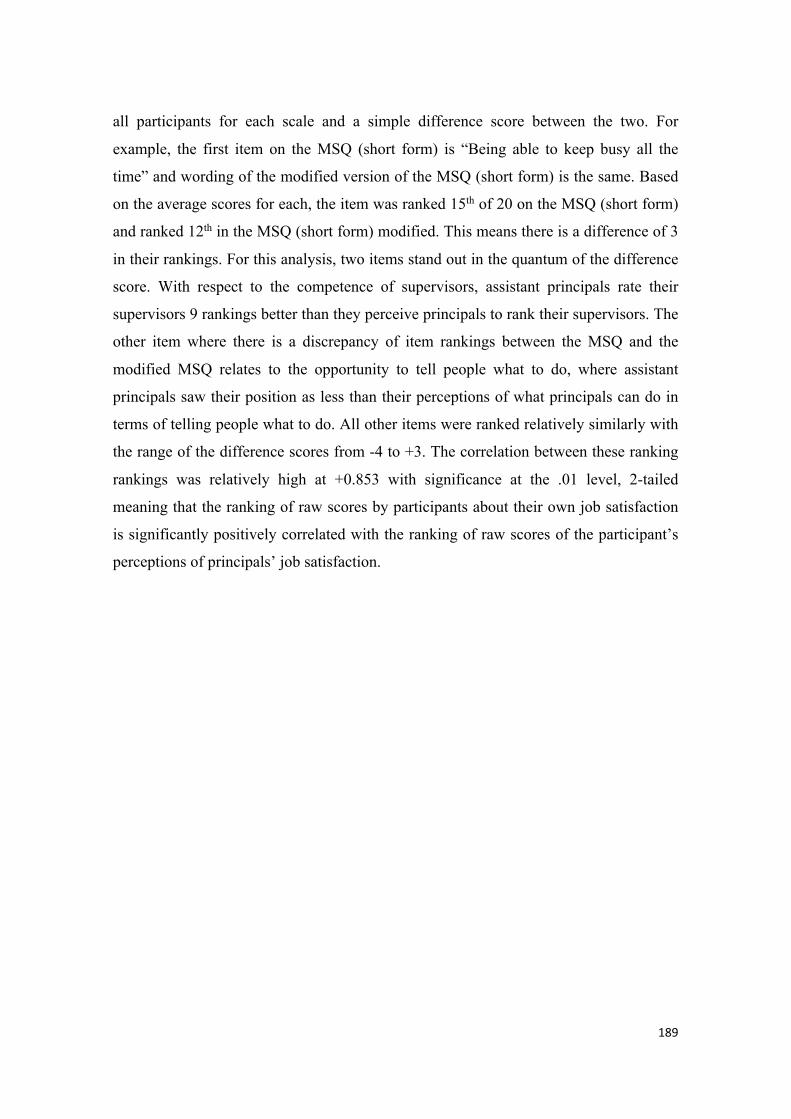
189
all participants for each scale and a simple difference score between the two. For
example, the first item on the MSQ (short form) is “Being able to keep busy all the
time” and wording of the modified version of the MSQ (short form) is the same. Based
on the average scores for each, the item was ranked 15th of 20 on the MSQ (short form)
and ranked 12th in the MSQ (short form) modified. This means there is a difference of 3
in their rankings. For this analysis, two items stand out in the quantum of the difference
score. With respect to the competence of supervisors, assistant principals rate their
supervisors 9 rankings better than they perceive principals to rank their supervisors. The
other item where there is a discrepancy of item rankings between the MSQ and the
modified MSQ relates to the opportunity to tell people what to do, where assistant
principals saw their position as less than their perceptions of what principals can do in
terms of telling people what to do. All other items were ranked relatively similarly with
the range of the difference scores from -4 to +3. The correlation between these ranking
rankings was relatively high at +0.853 with significance at the .01 level, 2-tailed
meaning that the ranking of raw scores by participants about their own job satisfaction
is significantly positively correlated with the ranking of raw scores of the participant’s
perceptions of principals’ job satisfaction.
190
Table 51 Summary of comparison of ranking of each item of the MSQ (Short
form) and the MSQ (Short form) modified showing the difference
between rankings.
MSQ (short form) items as administered to participating assistant principals
MSQ (short form) (modified) as administered to participating assistant principals seeking their views on principal job satisfaction
Ran
king
AP
Ran
king
P
Diff
eren
ce
Scal
e G
= ge
nera
l I =
intr
insic
E=
ext
rins
ic
1. Being able to keep busy all the time
21. Being able to keep busy all the time 15 12 3 GI
2. The chance to work alone on the job
22. The chance to work alone on the job 7 9 -2 GI
3. The chance to do different things from time to time
23. The chance to different things from time to time 17 16 1 GI
4. The chance to be 'somebody' in the community
24. The chance to be 'somebody' in the community 10 14 -4
GI
5. The way my boss handles his/her workers
25. The way their boss handles his/her workers 9 7 2 GE
6. The competence of my supervisor in making decisions
26. The competence of their supervisor in making decisions 13 4 9
GE
7. Being able to do things that don't go against my conscience
27. Being able to do things that don't go against their conscience 12 11 1
GI
8. The way my job provides for steady employment
28. The way their job provides for steady employment 19 20 -1
GI
9. The chance to do things for other people
29. The chance to do things for other people 20 18 2 GI
10. The chance to tell people what to do
30. The chance to tell people what to do 2 10 -8 GI
11. The chance to do something that makes use of my abilities
31. The chance to do something that makes use of their abilities 18 19 -1
GI
12. The way company policies are put into practice
32. The way company policies are put into practice 6 6 0 GE
13. My pay and the amount of work I do
33. Their pay and the amount of work they do 1 1 0 GE
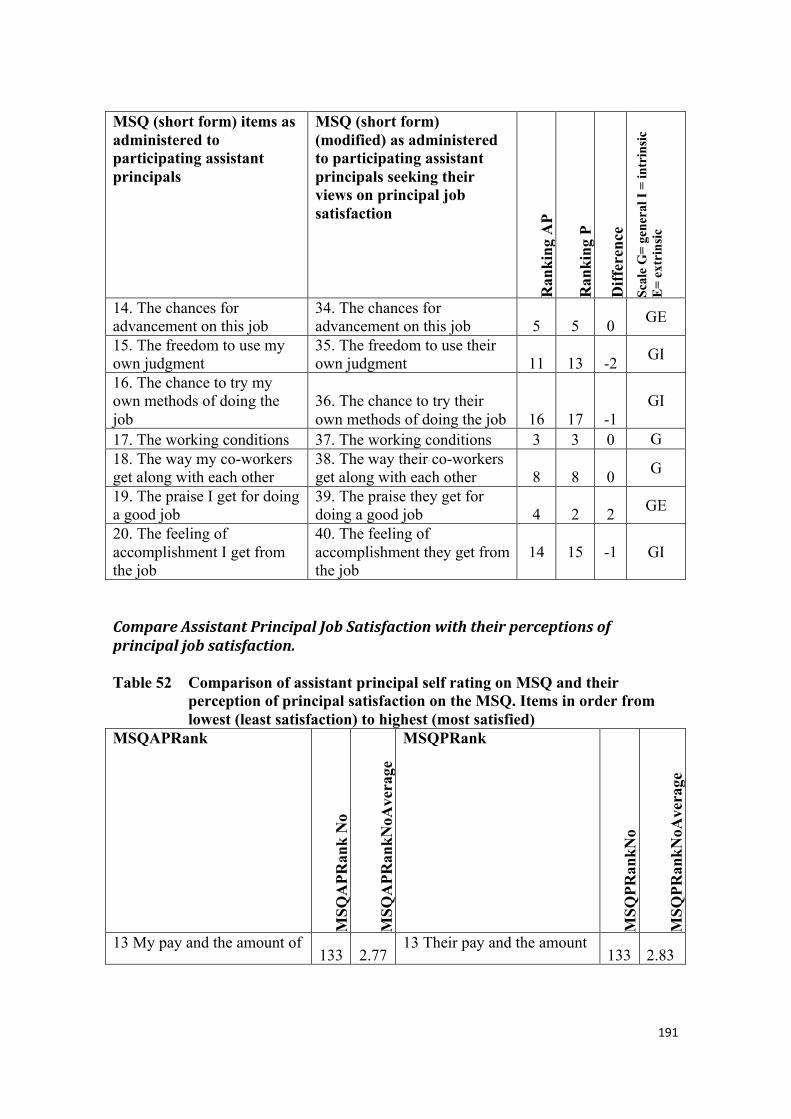
191
MSQ (short form) items as administered to participating assistant principals
MSQ (short form) (modified) as administered to participating assistant principals seeking their views on principal job satisfaction
Ran
king
AP
Ran
king
P
Diff
eren
ce
Scal
e G
= ge
nera
l I =
intr
insic
E=
ext
rins
ic
14. The chances for advancement on this job
34. The chances for advancement on this job 5 5 0 GE
15. The freedom to use my own judgment
35. The freedom to use their own judgment 11 13 -2 GI
16. The chance to try my own methods of doing the job
36. The chance to try their own methods of doing the job 16 17 -1
GI
17. The working conditions 37. The working conditions 3 3 0 G 18. The way my co-workers get along with each other
38. The way their co-workers get along with each other 8 8 0 G
19. The praise I get for doing a good job
39. The praise they get for doing a good job 4 2 2 GE
20. The feeling of accomplishment I get from the job
40. The feeling of accomplishment they get from the job
14 15 -1 GI
CompareAssistantPrincipalJobSatisfactionwiththeirperceptionsofprincipaljobsatisfaction.Table 52 Comparison of assistant principal self rating on MSQ and their
perception of principal satisfaction on the MSQ. Items in order from lowest (least satisfaction) to highest (most satisfied)
MSQAPRank
MSQ
APR
ank
No
MSQ
APR
ankN
oAve
rage
MSQPRank
MSQ
PRan
kNo
MSQ
PRan
kNoA
vera
ge
13 My pay and the amount of 133 2.77
13 Their pay and the amount 133 2.83
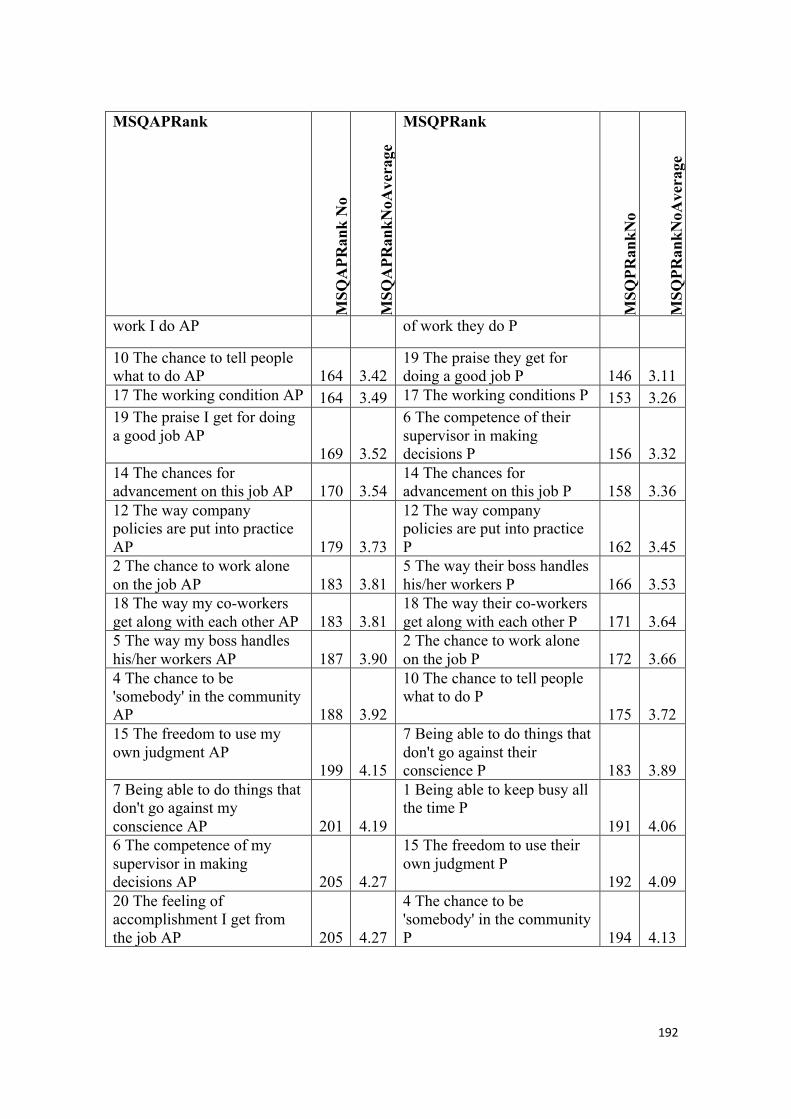
192
MSQAPRank
MSQ
APR
ank
No
MSQ
APR
ankN
oAve
rage
MSQPRank
MSQ
PRan
kNo
MSQ
PRan
kNoA
vera
ge
work I do AP of work they do P
10 The chance to tell people what to do AP 164 3.42
19 The praise they get for doing a good job P 146 3.11
17 The working condition AP 164 3.49 17 The working conditions P 153 3.26 19 The praise I get for doing a good job AP
169 3.52
6 The competence of their supervisor in making decisions P 156 3.32
14 The chances for advancement on this job AP 170 3.54
14 The chances for advancement on this job P 158 3.36
12 The way company policies are put into practice AP 179 3.73
12 The way company policies are put into practice P 162 3.45
2 The chance to work alone on the job AP 183 3.81
5 The way their boss handles his/her workers P 166 3.53
18 The way my co-workers get along with each other AP 183 3.81
18 The way their co-workers get along with each other P 171 3.64
5 The way my boss handles his/her workers AP 187 3.90
2 The chance to work alone on the job P 172 3.66
4 The chance to be 'somebody' in the community AP 188 3.92
10 The chance to tell people what to do P
175 3.72 15 The freedom to use my own judgment AP
199 4.15
7 Being able to do things that don't go against their conscience P 183 3.89
7 Being able to do things that don't go against my conscience AP 201 4.19
1 Being able to keep busy all the time P
191 4.06 6 The competence of my supervisor in making decisions AP 205 4.27
15 The freedom to use their own judgment P
192 4.09 20 The feeling of accomplishment I get from the job AP 205 4.27
4 The chance to be 'somebody' in the community P 194 4.13
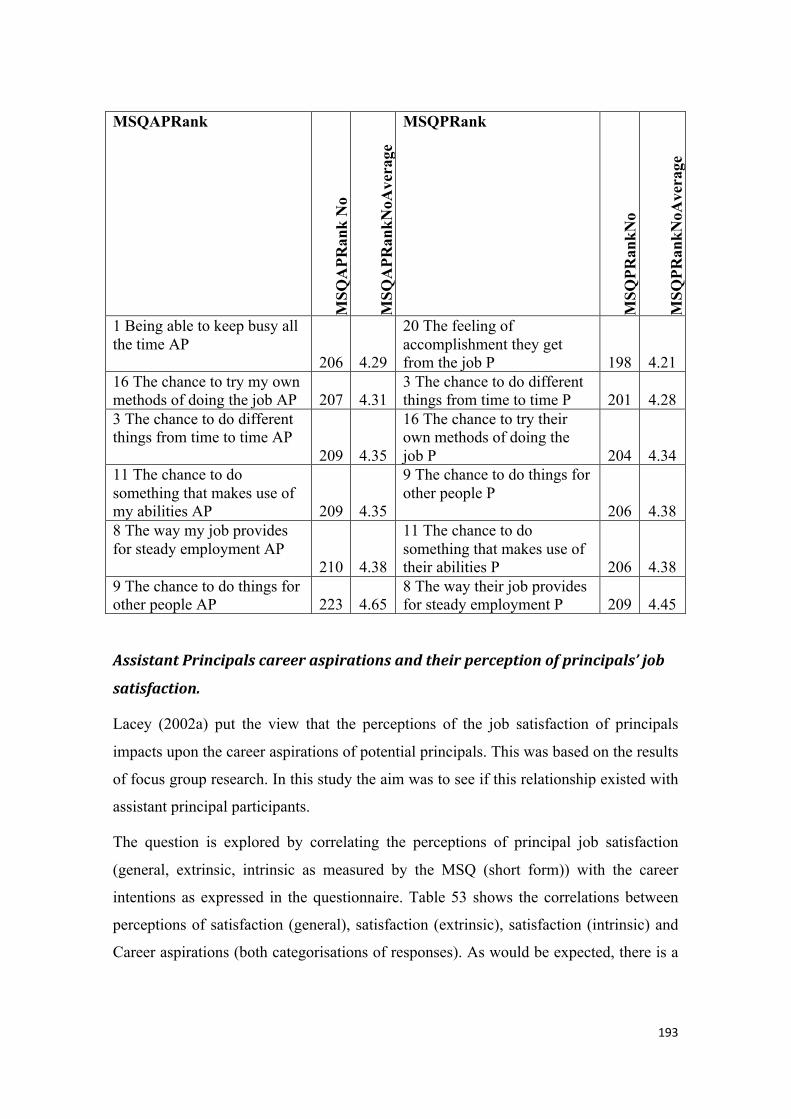
193
MSQAPRank
MSQ
APR
ank
No
MSQ
APR
ankN
oAve
rage
MSQPRank
MSQ
PRan
kNo
MSQ
PRan
kNoA
vera
ge
1 Being able to keep busy all the time AP
206 4.29
20 The feeling of accomplishment they get from the job P 198 4.21
16 The chance to try my own methods of doing the job AP 207 4.31
3 The chance to do different things from time to time P 201 4.28
3 The chance to do different things from time to time AP
209 4.35
16 The chance to try their own methods of doing the job P 204 4.34
11 The chance to do something that makes use of my abilities AP 209 4.35
9 The chance to do things for other people P
206 4.38 8 The way my job provides for steady employment AP
210 4.38
11 The chance to do something that makes use of their abilities P 206 4.38
9 The chance to do things for other people AP 223 4.65
8 The way their job provides for steady employment P 209 4.45
AssistantPrincipalscareeraspirationsandtheirperceptionofprincipals’job
satisfaction.
Lacey (2002a) put the view that the perceptions of the job satisfaction of principals
impacts upon the career aspirations of potential principals. This was based on the results
of focus group research. In this study the aim was to see if this relationship existed with
assistant principal participants.
The question is explored by correlating the perceptions of principal job satisfaction
(general, extrinsic, intrinsic as measured by the MSQ (short form)) with the career
intentions as expressed in the questionnaire. Table 53 shows the correlations between
perceptions of satisfaction (general), satisfaction (extrinsic), satisfaction (intrinsic) and
Career aspirations (both categorisations of responses). As would be expected, there is a

194
significant correlation between the scales of job satisfaction. However, there is no
statistically significant correlation between any scale of job satisfaction (that is assistant
principals’ perceptions of principal’s job satisfaction) and the career intentions of
assistant principals. Also, there is no significant correlation between the job satisfaction
of assistant principals and their career intentions. This is inconsistent with Lacey’s
finding. For our participants, there is more to their career intentions than he perceived
job satisfaction of principals.
This is not to say the Lacey is wrong in all cases. It is to say that her view does not seem
to hold in this situation. This outcome reinforces the view that each constituency needs
to explore and research these questions for itself. Indeed the phrase is emerging that if
you are to ‘grow your own’ you need to ‘know your own’.
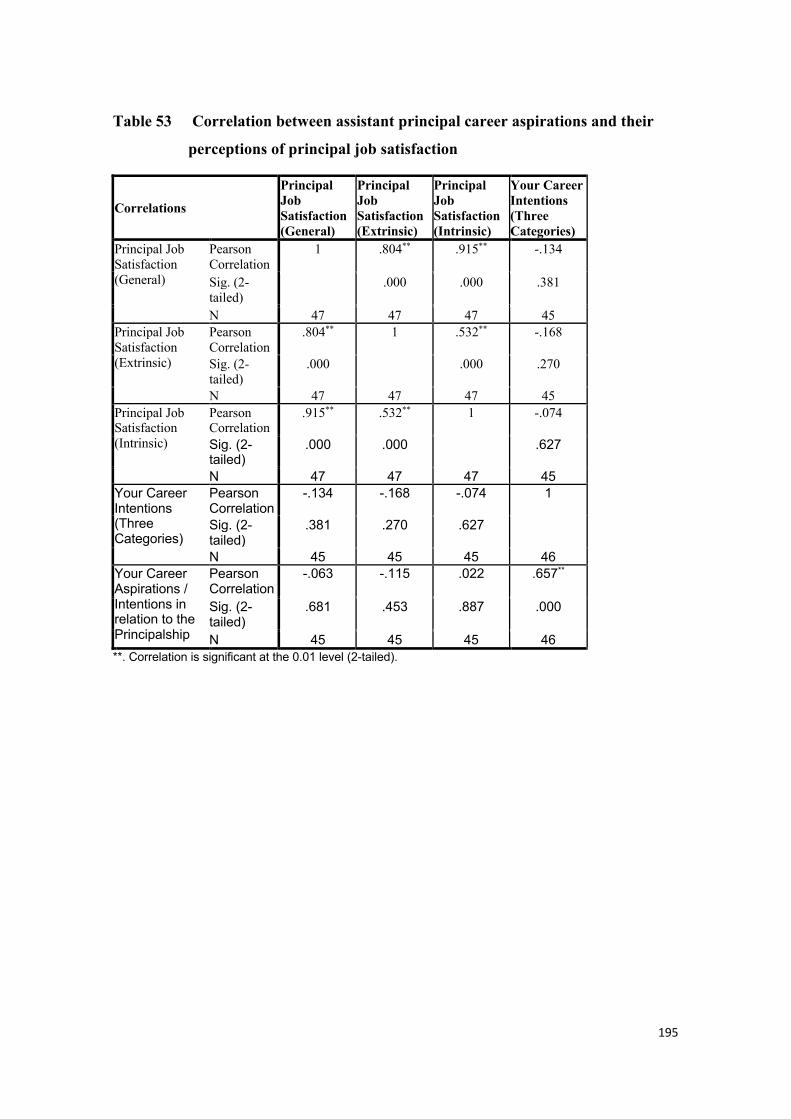
195
Table 53 Correlation between assistant principal career aspirations and their
perceptions of principal job satisfaction
Correlations
Principal Job Satisfaction (General)
Principal Job Satisfaction (Extrinsic)
Principal Job Satisfaction (Intrinsic)
Your Career Intentions (Three Categories)
Principal Job Satisfaction (General)
Pearson Correlation
1 .804** .915** -.134
Sig. (2-tailed) .000 .000 .381
N 47 47 47 45 Principal Job Satisfaction (Extrinsic)
Pearson Correlation
.804** 1 .532** -.168
Sig. (2-tailed)
.000 .000 .270
N 47 47 47 45 Principal Job Satisfaction (Intrinsic)
Pearson Correlation
.915** .532** 1 -.074
Sig. (2-tailed)
.000 .000 .627
N 47 47 47 45 Your Career Intentions (Three Categories)
Pearson Correlation
-.134 -.168 -.074 1
Sig. (2-tailed)
.381 .270 .627
N 45 45 45 46 Your Career Aspirations / Intentions in relation to the Principalship
Pearson Correlation
-.063 -.115 .022 .657**
Sig. (2-tailed)
.681 .453 .887 .000
N 45 45 45 46 **. Correlation is significant at the 0.01 level (2-tailed).
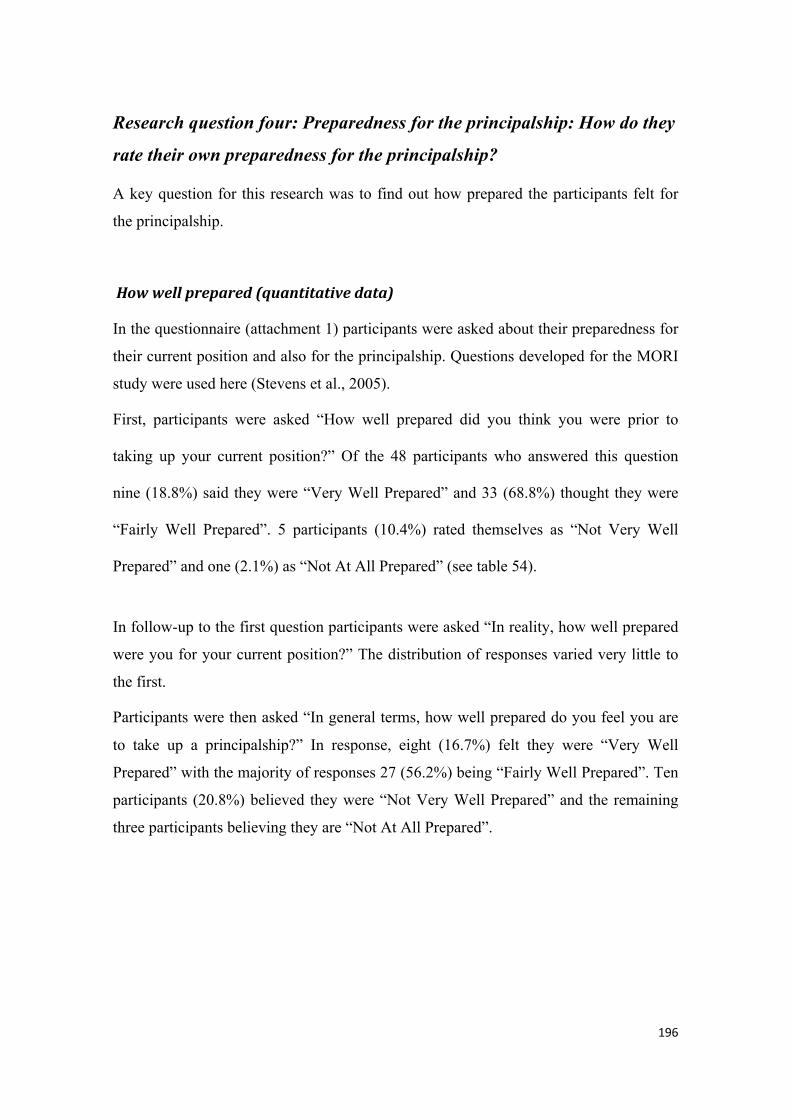
196
Research question four: Preparedness for the principalship: How do they
rate their own preparedness for the principalship?
A key question for this research was to find out how prepared the participants felt for
the principalship.
Howwellprepared(quantitativedata)
In the questionnaire (attachment 1) participants were asked about their preparedness for
their current position and also for the principalship. Questions developed for the MORI
study were used here (Stevens et al., 2005).
First, participants were asked “How well prepared did you think you were prior to
taking up your current position?” Of the 48 participants who answered this question
nine (18.8%) said they were “Very Well Prepared” and 33 (68.8%) thought they were
“Fairly Well Prepared”. 5 participants (10.4%) rated themselves as “Not Very Well
Prepared” and one (2.1%) as “Not At All Prepared” (see table 54).
In follow-up to the first question participants were asked “In reality, how well prepared
were you for your current position?” The distribution of responses varied very little to
the first.
Participants were then asked “In general terms, how well prepared do you feel you are
to take up a principalship?” In response, eight (16.7%) felt they were “Very Well
Prepared” with the majority of responses 27 (56.2%) being “Fairly Well Prepared”. Ten
participants (20.8%) believed they were “Not Very Well Prepared” and the remaining
three participants believing they are “Not At All Prepared”.
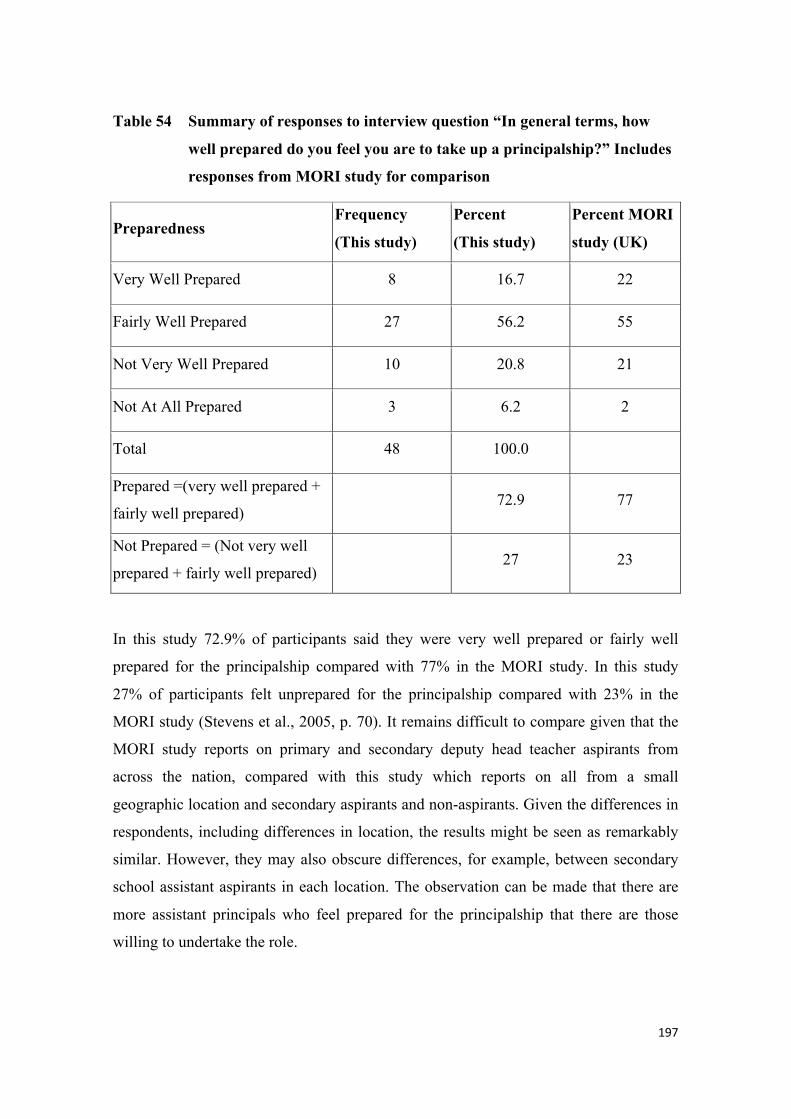
197
Table 54 Summary of responses to interview question “In general terms, how
well prepared do you feel you are to take up a principalship?” Includes
responses from MORI study for comparison
Preparedness Frequency
(This study)
Percent
(This study)
Percent MORI
study (UK)
Very Well Prepared 8 16.7 22
Fairly Well Prepared 27 56.2 55
Not Very Well Prepared 10 20.8 21
Not At All Prepared 3 6.2 2
Total 48 100.0
Prepared =(very well prepared +
fairly well prepared) 72.9 77
Not Prepared = (Not very well
prepared + fairly well prepared) 27 23
In this study 72.9% of participants said they were very well prepared or fairly well
prepared for the principalship compared with 77% in the MORI study. In this study
27% of participants felt unprepared for the principalship compared with 23% in the
MORI study (Stevens et al., 2005, p. 70). It remains difficult to compare given that the
MORI study reports on primary and secondary deputy head teacher aspirants from
across the nation, compared with this study which reports on all from a small
geographic location and secondary aspirants and non-aspirants. Given the differences in
respondents, including differences in location, the results might be seen as remarkably
similar. However, they may also obscure differences, for example, between secondary
school assistant aspirants in each location. The observation can be made that there are
more assistant principals who feel prepared for the principalship that there are those
willing to undertake the role.
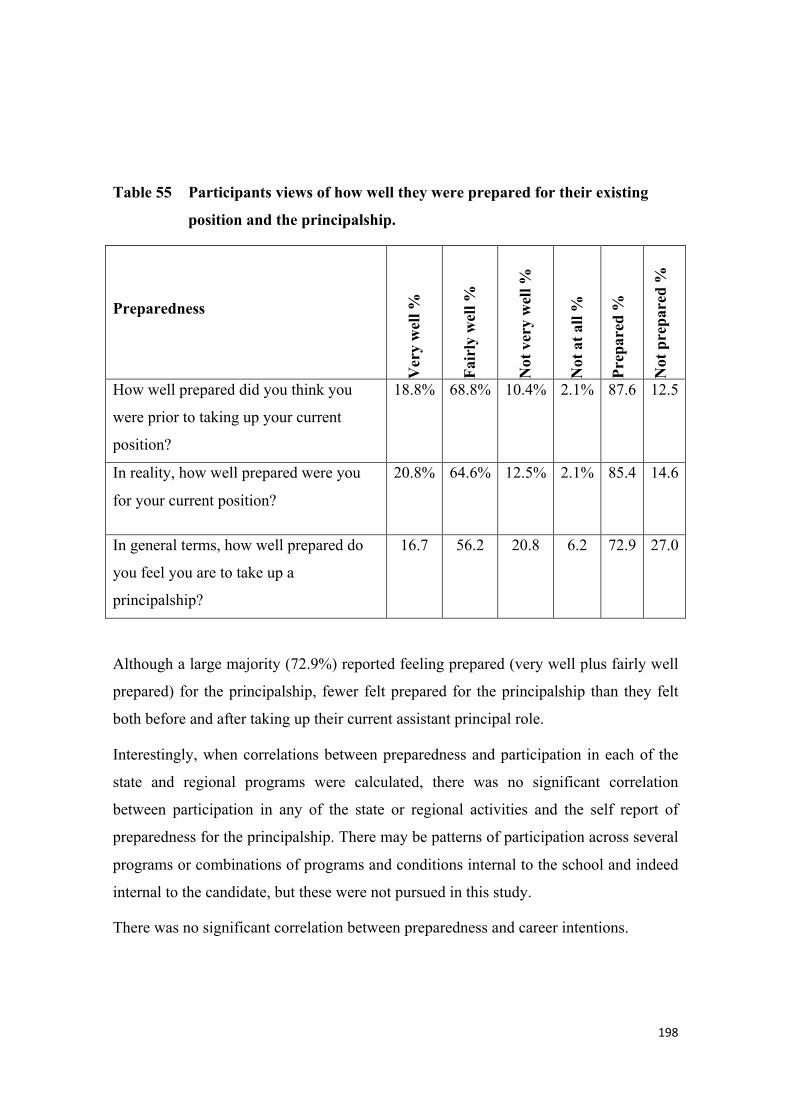
198
Table 55 Participants views of how well they were prepared for their existing
position and the principalship.
Preparedness
Ver
y w
ell %
Fair
ly w
ell %
Not
ver
y w
ell %
Not
at a
ll %
Prep
ared
%
Not
pre
pare
d %
How well prepared did you think you
were prior to taking up your current
position?
18.8% 68.8% 10.4% 2.1% 87.6 12.5
In reality, how well prepared were you
for your current position?
20.8% 64.6% 12.5% 2.1% 85.4 14.6
In general terms, how well prepared do
you feel you are to take up a
principalship?
16.7 56.2 20.8 6.2 72.9 27.0
Although a large majority (72.9%) reported feeling prepared (very well plus fairly well
prepared) for the principalship, fewer felt prepared for the principalship than they felt
both before and after taking up their current assistant principal role.
Interestingly, when correlations between preparedness and participation in each of the
state and regional programs were calculated, there was no significant correlation
between participation in any of the state or regional activities and the self report of
preparedness for the principalship. There may be patterns of participation across several
programs or combinations of programs and conditions internal to the school and indeed
internal to the candidate, but these were not pursued in this study.
There was no significant correlation between preparedness and career intentions.
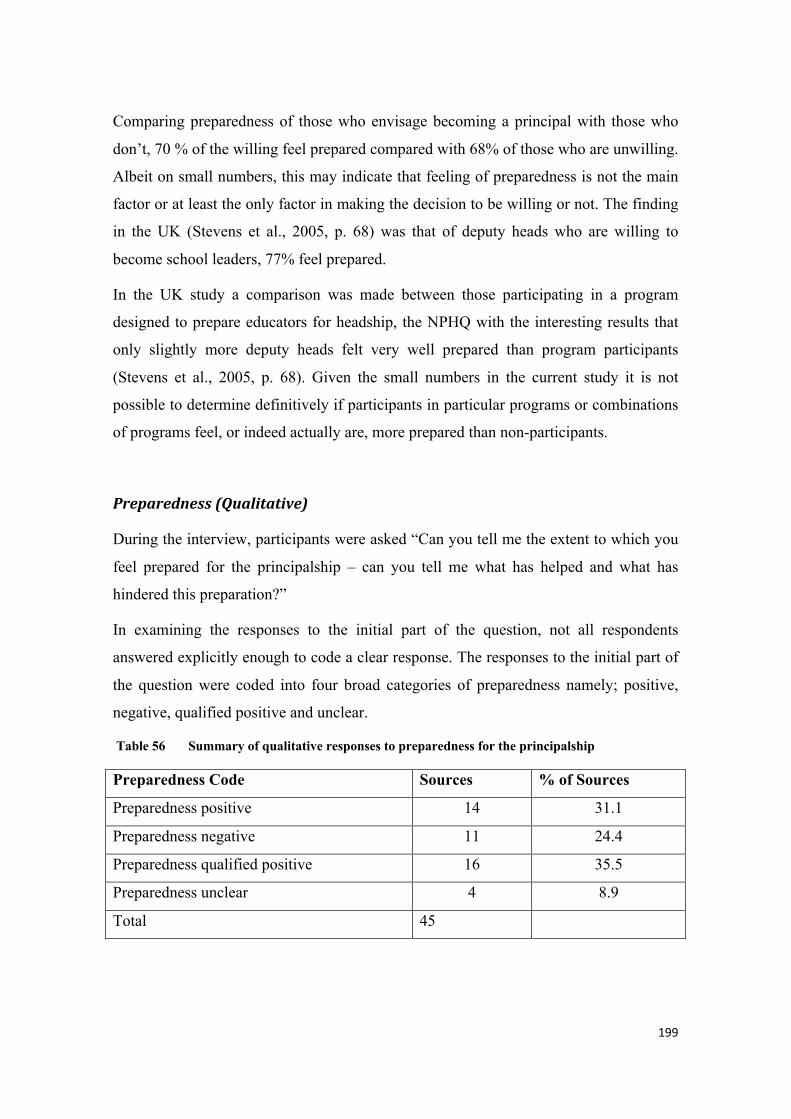
199
Comparing preparedness of those who envisage becoming a principal with those who
don’t, 70 % of the willing feel prepared compared with 68% of those who are unwilling.
Albeit on small numbers, this may indicate that feeling of preparedness is not the main
factor or at least the only factor in making the decision to be willing or not. The finding
in the UK (Stevens et al., 2005, p. 68) was that of deputy heads who are willing to
become school leaders, 77% feel prepared.
In the UK study a comparison was made between those participating in a program
designed to prepare educators for headship, the NPHQ with the interesting results that
only slightly more deputy heads felt very well prepared than program participants
(Stevens et al., 2005, p. 68). Given the small numbers in the current study it is not
possible to determine definitively if participants in particular programs or combinations
of programs feel, or indeed actually are, more prepared than non-participants.
Preparedness(Qualitative)
During the interview, participants were asked “Can you tell me the extent to which you
feel prepared for the principalship – can you tell me what has helped and what has
hindered this preparation?”
In examining the responses to the initial part of the question, not all respondents
answered explicitly enough to code a clear response. The responses to the initial part of
the question were coded into four broad categories of preparedness namely; positive,
negative, qualified positive and unclear.
Table 56 Summary of qualitative responses to preparedness for the principalship
Preparedness Code Sources % of Sources
Preparedness positive 14 31.1
Preparedness negative 11 24.4
Preparedness qualified positive 16 35.5
Preparedness unclear 4 8.9
Total 45
200
Preparedness Positive.
Fourteen participants (31.1%) responded positively when asked the extent to which they
felt prepared for the principalship in the interview. Most qualified their preparedness
acknowledging they had more to learn, but that they could learn on the job. Examples
include:
“To the extent I’m prepared, I think I’ve probably got my learner’s permit, I’m pretty
sure I’m ready to go.” (participant 7)
“Yes, I do feel prepared and in areas that I would feel lacking I’d feel that I’ve got a
support network that I could get you know I’ve got supportive colleagues and so I
would know where to find the answers. So nothing would ever happen that I could
think, oh no I can’t do that.” (participant 12)
“Very much, yeah, very prepared. And I know there are things that I will learn while
I’m on the job that I don’t know now…” (participant 21).
For some, the confidence came from the length of time in the assistant principal role
and working with different leaders. (participants 6, 11, 17, 45, 47) For one, that fact that
his family had grown up meant that he was more able to tackle the principal role
(participant 6).
Preparedness negative
Eleven participants (24.4%) were clearly negative about their preparedness for the
principalship. Some were especially clear, but for different reasons. One interesting
comment was that on arrival at a new school. “I think up until the start of this year I
thought I was actually quite prepared, but it’s been an eye opening experience for me
coming from a struggling school with I guess a principal team that’s in highly reactive
mode, and now I am in a team that’s in proactive mode … For me now I have a greater
understanding of what the role entails and a greater understanding of the skills I’ve got
and haven’t got to be able to do that job… I felt confident that I could’ve taken that on
but now I feel less confident because I’m more aware of I guess deficiencies I have.”
(participant 13)
201
Some felt they needed more time to prepare for the role, including more practical
experience, gather more expertise in particular areas, for example finances, or public
relations.
Similar to participant 28, participant 44 felt that he was prepared but, following a
disappointment, no longer felt prepared.
One participant was clear, “I feel entirely unprepared for it.” (participant 40).
Preparedness unclear
Four participants (8.9%) (8, 14, 19, 41) were unable to give a clear indication of their
preparedness. These participants haven’t decided at all if they were ready. The clearest
of the comments was “It depends on what week actually…”. (participant 14)
Preparedness qualified positive
These sixteen participants (35.5%) qualified their positive response in a range of ways.
One felt prepared except for one area of leadership. “In lots of ways I feel very
prepared…I guess the one area, as I’ve said before, was technical leadership that I felt
there was a deficit to some degree. But also the exposure to maybe some of the latest
jargon.” (participant 01).
Another felt prepared, but needing of more experience. “Probably as prepared as I can
be without spending longer in this sort of role in dealing with a greater variety of
situations and issues.” This participant felt that greater experience would provide further
confidence (participant 3).
Another felt prepared, based on time as acting principal, but preferred the assistant
principal role (participant 4).
For another, she felt prepared in her current setting, but not for other settings
(participant 5). A further participant felt technically competent “but I probably don’t
have in-context experience and I think that’s the issue that blockers can be.” (participant
27).
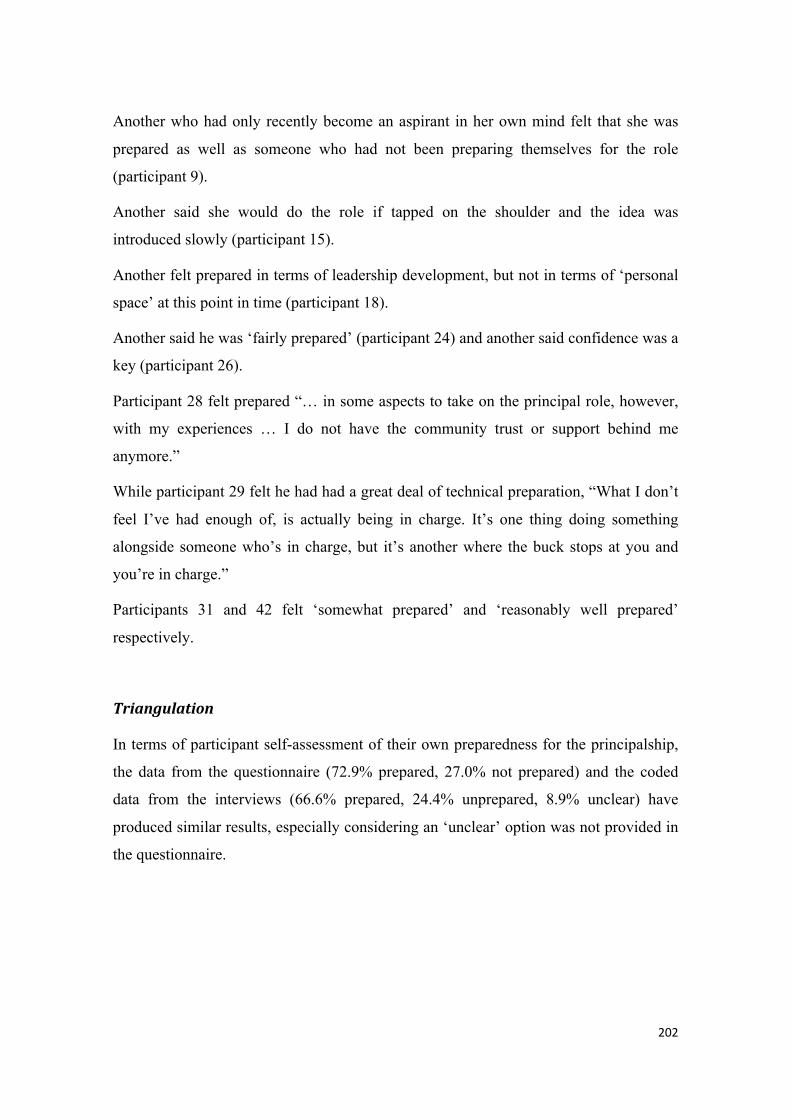
202
Another who had only recently become an aspirant in her own mind felt that she was
prepared as well as someone who had not been preparing themselves for the role
(participant 9).
Another said she would do the role if tapped on the shoulder and the idea was
introduced slowly (participant 15).
Another felt prepared in terms of leadership development, but not in terms of ‘personal
space’ at this point in time (participant 18).
Another said he was ‘fairly prepared’ (participant 24) and another said confidence was a
key (participant 26).
Participant 28 felt prepared “… in some aspects to take on the principal role, however,
with my experiences … I do not have the community trust or support behind me
anymore.”
While participant 29 felt he had had a great deal of technical preparation, “What I don’t
feel I’ve had enough of, is actually being in charge. It’s one thing doing something
alongside someone who’s in charge, but it’s another where the buck stops at you and
you’re in charge.”
Participants 31 and 42 felt ‘somewhat prepared’ and ‘reasonably well prepared’
respectively.
Triangulation
In terms of participant self-assessment of their own preparedness for the principalship,
the data from the questionnaire (72.9% prepared, 27.0% not prepared) and the coded
data from the interviews (66.6% prepared, 24.4% unprepared, 8.9% unclear) have
produced similar results, especially considering an ‘unclear’ option was not provided in
the questionnaire.
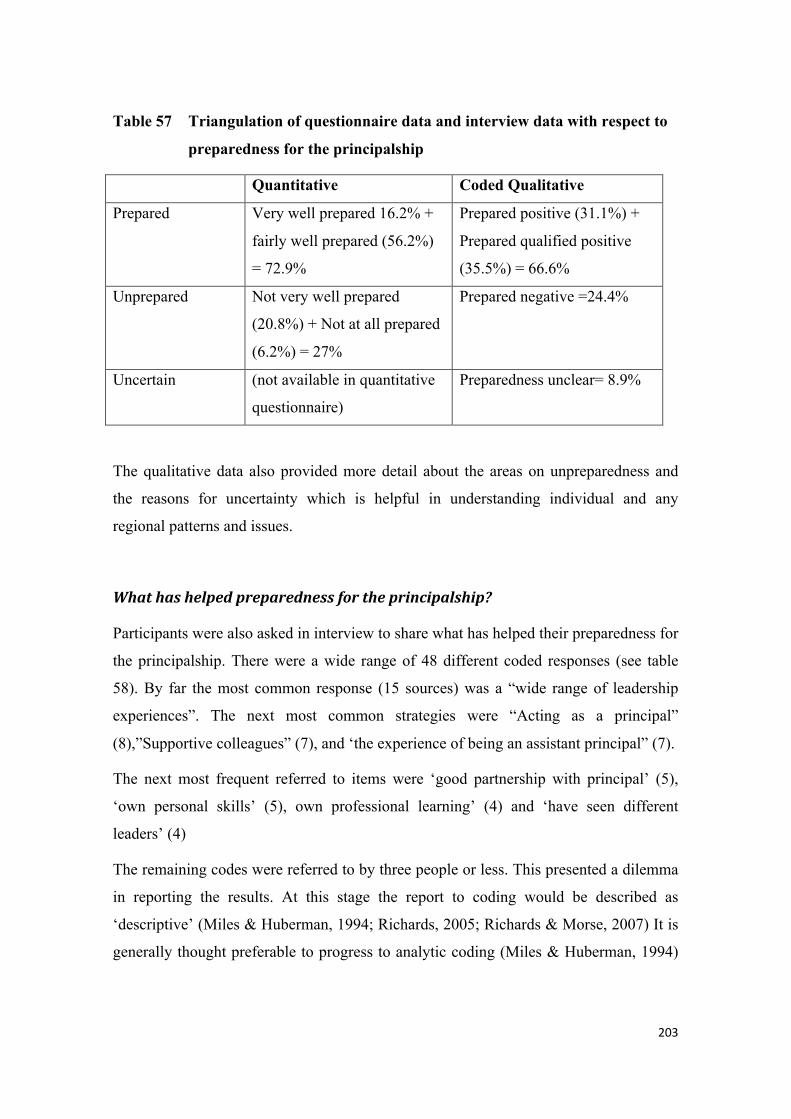
203
Table 57 Triangulation of questionnaire data and interview data with respect to
preparedness for the principalship
Quantitative Coded Qualitative
Prepared Very well prepared 16.2% +
fairly well prepared (56.2%)
= 72.9%
Prepared positive (31.1%) +
Prepared qualified positive
(35.5%) = 66.6%
Unprepared Not very well prepared
(20.8%) + Not at all prepared
(6.2%) = 27%
Prepared negative =24.4%
Uncertain (not available in quantitative
questionnaire)
Preparedness unclear= 8.9%
The qualitative data also provided more detail about the areas on unpreparedness and
the reasons for uncertainty which is helpful in understanding individual and any
regional patterns and issues.
Whathashelpedpreparednessfortheprincipalship?
Participants were also asked in interview to share what has helped their preparedness for
the principalship. There were a wide range of 48 different coded responses (see table
58). By far the most common response (15 sources) was a “wide range of leadership
experiences”. The next most common strategies were “Acting as a principal”
(8),”Supportive colleagues” (7), and ‘the experience of being an assistant principal” (7).
The next most frequent referred to items were ‘good partnership with principal’ (5),
‘own personal skills’ (5), own professional learning’ (4) and ‘have seen different
leaders’ (4)
The remaining codes were referred to by three people or less. This presented a dilemma
in reporting the results. At this stage the report to coding would be described as
‘descriptive’ (Miles & Huberman, 1994; Richards, 2005; Richards & Morse, 2007) It is
generally thought preferable to progress to analytic coding (Miles & Huberman, 1994)
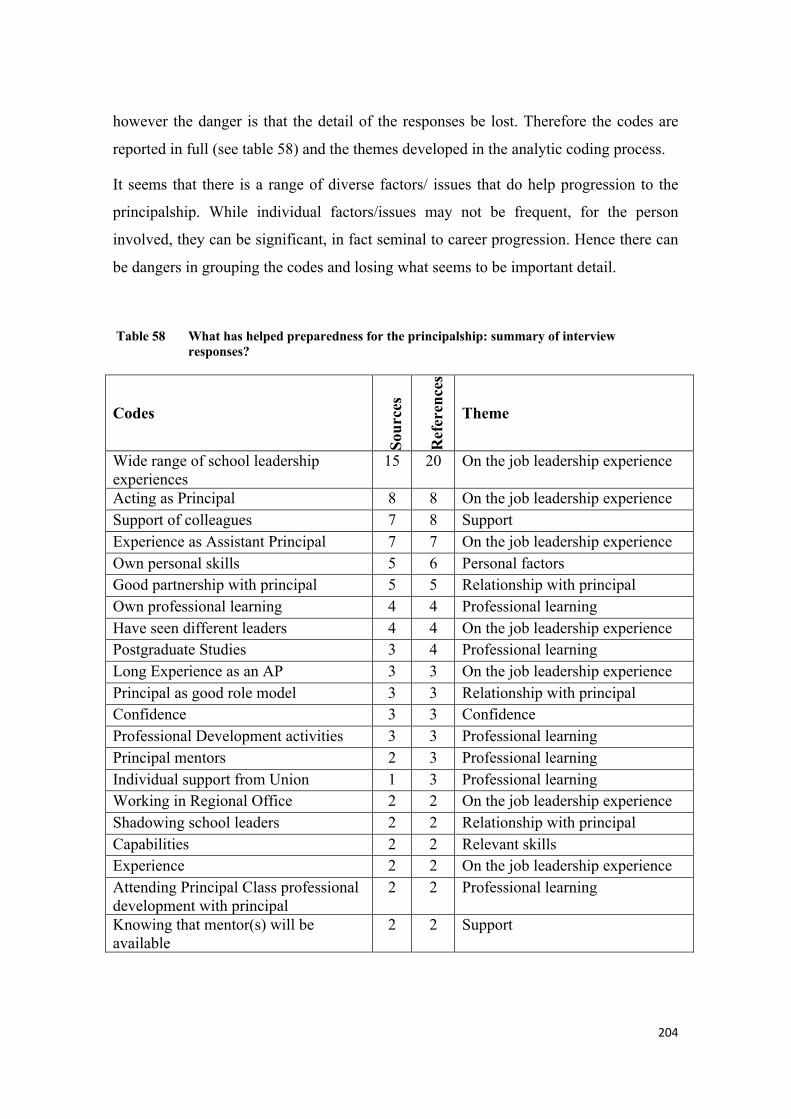
204
however the danger is that the detail of the responses be lost. Therefore the codes are
reported in full (see table 58) and the themes developed in the analytic coding process.
It seems that there is a range of diverse factors/ issues that do help progression to the
principalship. While individual factors/issues may not be frequent, for the person
involved, they can be significant, in fact seminal to career progression. Hence there can
be dangers in grouping the codes and losing what seems to be important detail.
Table 58 What has helped preparedness for the principalship: summary of interview responses?
Codes So
urce
s
Ref
eren
ces
Theme
Wide range of school leadership experiences
15 20 On the job leadership experience
Acting as Principal 8 8 On the job leadership experience Support of colleagues 7 8 Support Experience as Assistant Principal 7 7 On the job leadership experience Own personal skills 5 6 Personal factors Good partnership with principal 5 5 Relationship with principal Own professional learning 4 4 Professional learning Have seen different leaders 4 4 On the job leadership experience Postgraduate Studies 3 4 Professional learning Long Experience as an AP 3 3 On the job leadership experience Principal as good role model 3 3 Relationship with principal Confidence 3 3 Confidence Professional Development activities 3 3 Professional learning Principal mentors 2 3 Professional learning Individual support from Union 1 3 Professional learning Working in Regional Office 2 2 On the job leadership experience Shadowing school leaders 2 2 Relationship with principal Capabilities 2 2 Relevant skills Experience 2 2 On the job leadership experience Attending Principal Class professional development with principal
2 2 Professional learning
Knowing that mentor(s) will be available
2 2 Support
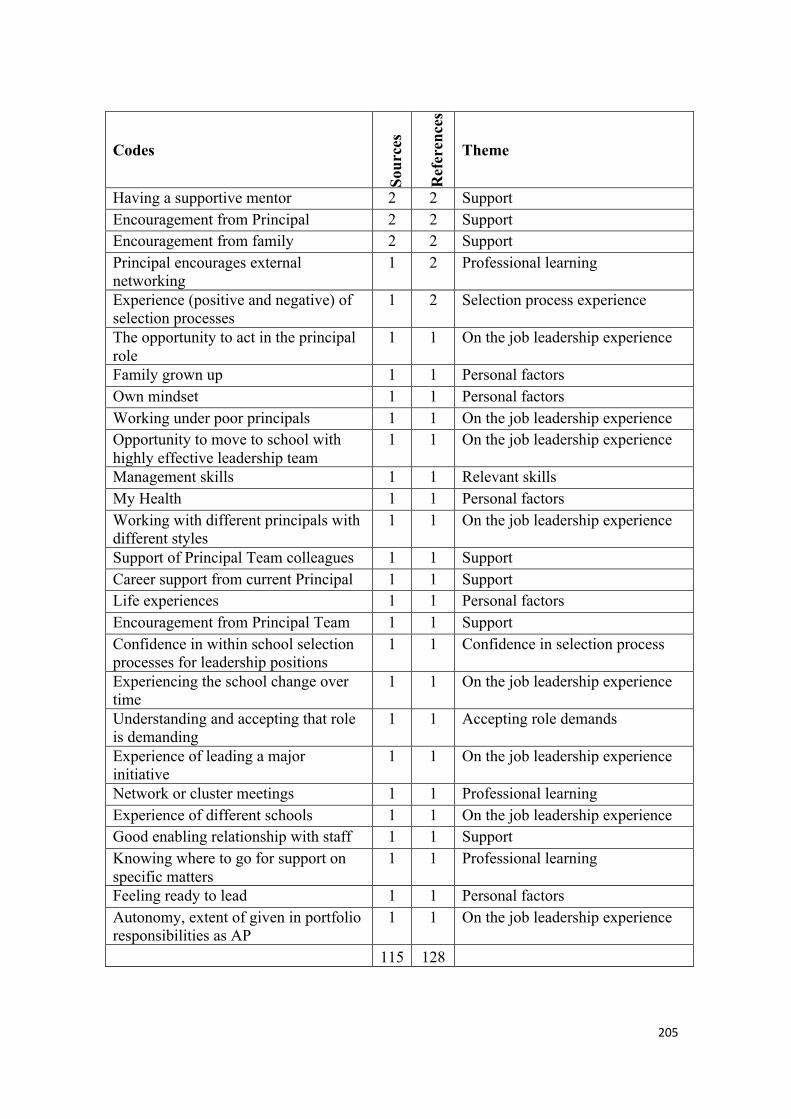
205
Codes
Sour
ces
Ref
eren
ces
Theme
Having a supportive mentor 2 2 Support Encouragement from Principal 2 2 Support Encouragement from family 2 2 Support Principal encourages external networking
1 2 Professional learning
Experience (positive and negative) of selection processes
1 2 Selection process experience
The opportunity to act in the principal role
1 1 On the job leadership experience
Family grown up 1 1 Personal factors Own mindset 1 1 Personal factors Working under poor principals 1 1 On the job leadership experience Opportunity to move to school with highly effective leadership team
1 1 On the job leadership experience
Management skills 1 1 Relevant skills My Health 1 1 Personal factors Working with different principals with different styles
1 1 On the job leadership experience
Support of Principal Team colleagues 1 1 Support Career support from current Principal 1 1 Support Life experiences 1 1 Personal factors Encouragement from Principal Team 1 1 Support Confidence in within school selection processes for leadership positions
1 1 Confidence in selection process
Experiencing the school change over time
1 1 On the job leadership experience
Understanding and accepting that role is demanding
1 1 Accepting role demands
Experience of leading a major initiative
1 1 On the job leadership experience
Network or cluster meetings 1 1 Professional learning Experience of different schools 1 1 On the job leadership experience Good enabling relationship with staff 1 1 Support Knowing where to go for support on specific matters
1 1 Professional learning
Feeling ready to lead 1 1 Personal factors Autonomy, extent of given in portfolio responsibilities as AP
1 1 On the job leadership experience
115 128
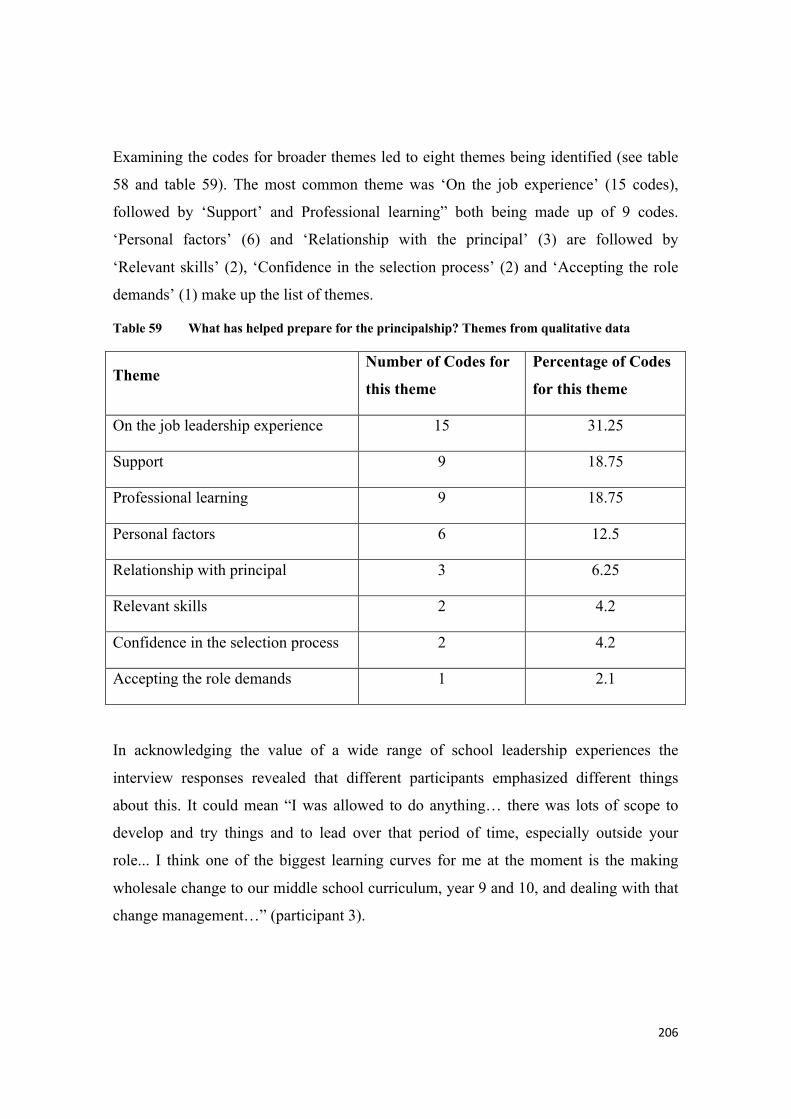
206
Examining the codes for broader themes led to eight themes being identified (see table
58 and table 59). The most common theme was ‘On the job experience’ (15 codes),
followed by ‘Support’ and Professional learning” both being made up of 9 codes.
‘Personal factors’ (6) and ‘Relationship with the principal’ (3) are followed by
‘Relevant skills’ (2), ‘Confidence in the selection process’ (2) and ‘Accepting the role
demands’ (1) make up the list of themes.
Table 59 What has helped prepare for the principalship? Themes from qualitative data
Theme Number of Codes for
this theme
Percentage of Codes
for this theme
On the job leadership experience 15 31.25
Support 9 18.75
Professional learning 9 18.75
Personal factors 6 12.5
Relationship with principal 3 6.25
Relevant skills 2 4.2
Confidence in the selection process 2 4.2
Accepting the role demands 1 2.1
In acknowledging the value of a wide range of school leadership experiences the
interview responses revealed that different participants emphasized different things
about this. It could mean “I was allowed to do anything… there was lots of scope to
develop and try things and to lead over that period of time, especially outside your
role... I think one of the biggest learning curves for me at the moment is the making
wholesale change to our middle school curriculum, year 9 and 10, and dealing with that
change management…” (participant 3).
207
“I think my experience of all the roles within the school, I think, has helped me.”
(participants 15)
“…I’ve worked on the school’s budget, I do most of the staffing of the school, I’ve been
on school council, I’ve worked with small parent groups, Rock Eisteddfod,
dadedadedadeda. I get involved with the kids. I’ve had a broad range of experience… in
leading curriculum here… I’ve led various areas of the school, so I’m pretty much
prepared.” (participant 16)
“And the reason I feel confident is because I have worked in leadership in schools for a
while, I’ve had many experiences thrown at me in terms of dealing with students,
parents, the community and I felt I could deal with all those situations in a reasonable
positive manner.” (participant 17)
“Writing newsletters, responding to angry parents, talking to community people and
managing relationships within the staff.” (participant 17)
Whathinderedpreparationforprincipalship?
Participants were asked at the interview what had hindered their preparation for the
principalship. Their responses were recorded, transcribed and then coded.
By far the most frequent response was “Perceived lack of knowledge in a particular
area” (16 sources). The next most common coding was ‘Insufficient confidence’ (7)
followed by ‘Personal circumstances’ (4), ‘Preoccupied with AP duties’ (4),
‘confidence’ (3), “The burdens and pressures of the principal role’ (3) and ‘lack of
opportunities to go out of the school’ (3). (see table 60)
All remaining codes have one or two references. For each of the interviewees, the issue
or factor they mentioned was important to them. For example ‘Lack of desire for the
role’ was mentioned by only one source, but that lack of desire was profoundly
important to that person (see table 60).
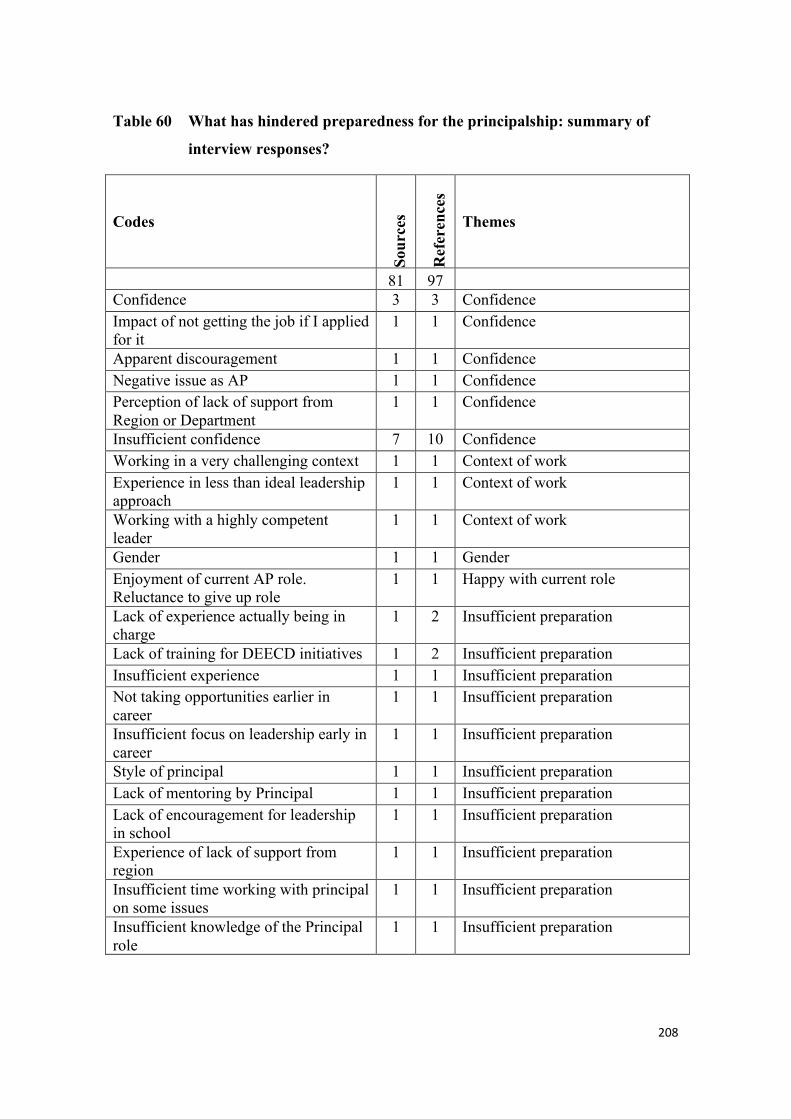
208
Table 60 What has hindered preparedness for the principalship: summary of
interview responses?
Codes
Sour
ces
Ref
eren
ces
Themes
81 97 Confidence 3 3 Confidence Impact of not getting the job if I applied for it
1 1 Confidence
Apparent discouragement 1 1 Confidence Negative issue as AP 1 1 Confidence Perception of lack of support from Region or Department
1 1 Confidence
Insufficient confidence 7 10 Confidence Working in a very challenging context 1 1 Context of work Experience in less than ideal leadership approach
1 1 Context of work
Working with a highly competent leader
1 1 Context of work
Gender 1 1 Gender Enjoyment of current AP role. Reluctance to give up role
1 1 Happy with current role
Lack of experience actually being in charge
1 2 Insufficient preparation
Lack of training for DEECD initiatives 1 2 Insufficient preparation Insufficient experience 1 1 Insufficient preparation Not taking opportunities earlier in career
1 1 Insufficient preparation
Insufficient focus on leadership early in career
1 1 Insufficient preparation
Style of principal 1 1 Insufficient preparation Lack of mentoring by Principal 1 1 Insufficient preparation Lack of encouragement for leadership in school
1 1 Insufficient preparation
Experience of lack of support from region
1 1 Insufficient preparation
Insufficient time working with principal on some issues
1 1 Insufficient preparation
Insufficient knowledge of the Principal role
1 1 Insufficient preparation
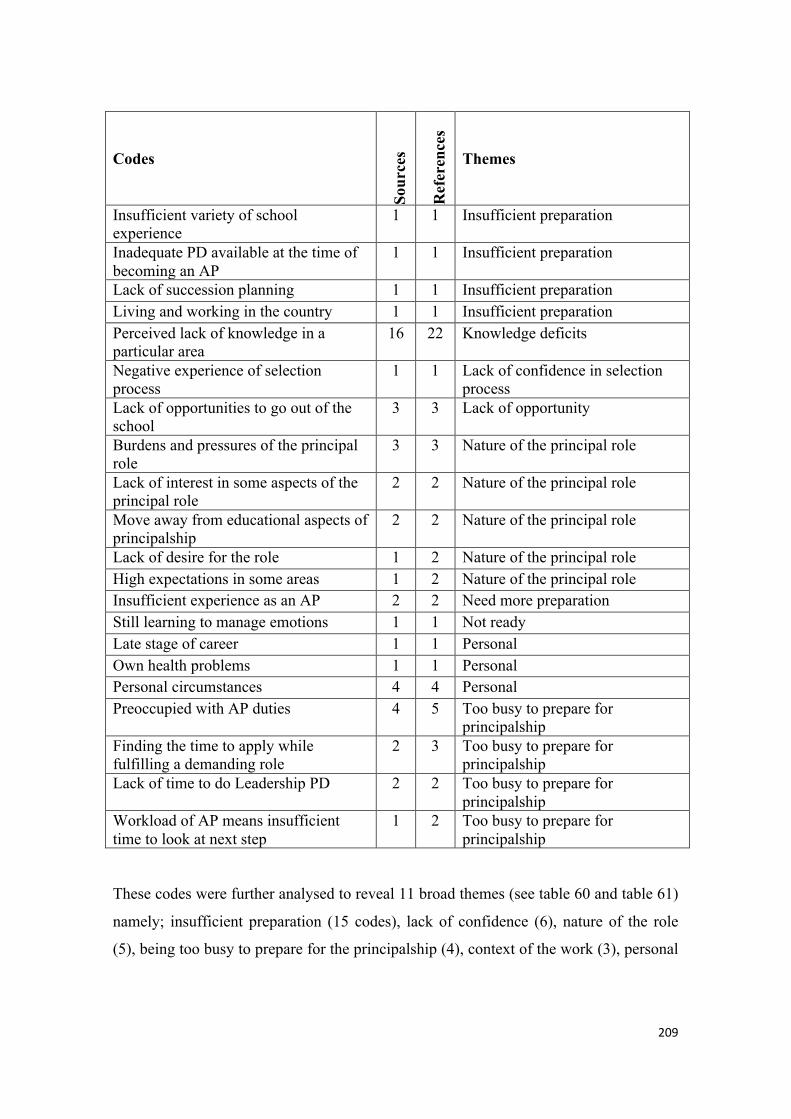
209
Codes
Sour
ces
Ref
eren
ces
Themes
Insufficient variety of school experience
1 1 Insufficient preparation
Inadequate PD available at the time of becoming an AP
1 1 Insufficient preparation
Lack of succession planning 1 1 Insufficient preparation Living and working in the country 1 1 Insufficient preparation Perceived lack of knowledge in a particular area
16 22 Knowledge deficits
Negative experience of selection process
1 1 Lack of confidence in selection process
Lack of opportunities to go out of the school
3 3 Lack of opportunity
Burdens and pressures of the principal role
3 3 Nature of the principal role
Lack of interest in some aspects of the principal role
2 2 Nature of the principal role
Move away from educational aspects of principalship
2 2 Nature of the principal role
Lack of desire for the role 1 2 Nature of the principal role High expectations in some areas 1 2 Nature of the principal role Insufficient experience as an AP 2 2 Need more preparation Still learning to manage emotions 1 1 Not ready Late stage of career 1 1 Personal Own health problems 1 1 Personal Personal circumstances 4 4 Personal Preoccupied with AP duties 4 5 Too busy to prepare for
principalship Finding the time to apply while fulfilling a demanding role
2 3 Too busy to prepare for principalship
Lack of time to do Leadership PD 2 2 Too busy to prepare for principalship
Workload of AP means insufficient time to look at next step
1 2 Too busy to prepare for principalship
These codes were further analysed to reveal 11 broad themes (see table 60 and table 61)
namely; insufficient preparation (15 codes), lack of confidence (6), nature of the role
(5), being too busy to prepare for the principalship (4), context of the work (3), personal
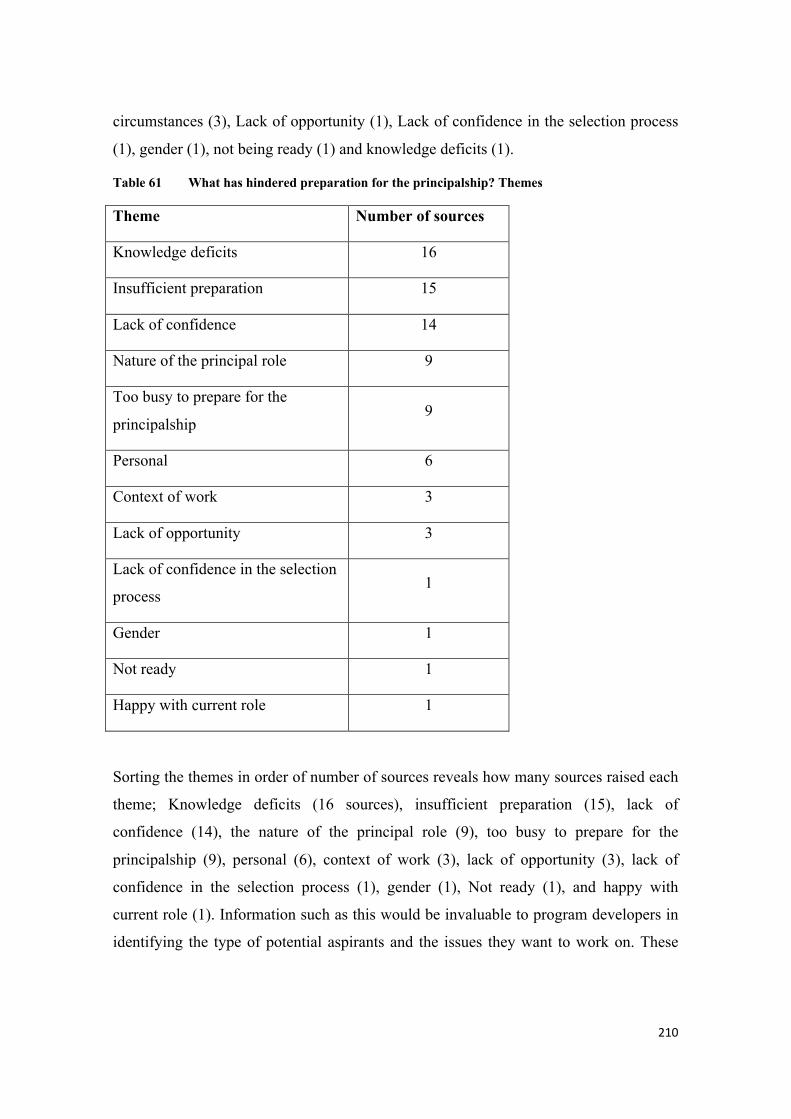
210
circumstances (3), Lack of opportunity (1), Lack of confidence in the selection process
(1), gender (1), not being ready (1) and knowledge deficits (1).
Table 61 What has hindered preparation for the principalship? Themes
Theme Number of sources
Knowledge deficits 16
Insufficient preparation 15
Lack of confidence 14
Nature of the principal role 9
Too busy to prepare for the
principalship 9
Personal 6
Context of work 3
Lack of opportunity 3
Lack of confidence in the selection
process 1
Gender 1
Not ready 1
Happy with current role 1
Sorting the themes in order of number of sources reveals how many sources raised each
theme; Knowledge deficits (16 sources), insufficient preparation (15), lack of
confidence (14), the nature of the principal role (9), too busy to prepare for the
principalship (9), personal (6), context of work (3), lack of opportunity (3), lack of
confidence in the selection process (1), gender (1), Not ready (1), and happy with
current role (1). Information such as this would be invaluable to program developers in
identifying the type of potential aspirants and the issues they want to work on. These

211
themes also resemble some of the themes from the Australian list of reasons why
potential aspirants are not pursuing the principalship.
It would be useful to apply this list to a group of assistant principals and ask them how
strongly each variable applied in their own thinking about their career.
Preparedness*CareerIntention
An interesting view is to look at the career intentions of participants in relation to their
feeling of preparedness. Table 62 shows that there are 13 participants who feel
prepared, but fairly well prepared, but who will not apply for the principalship.
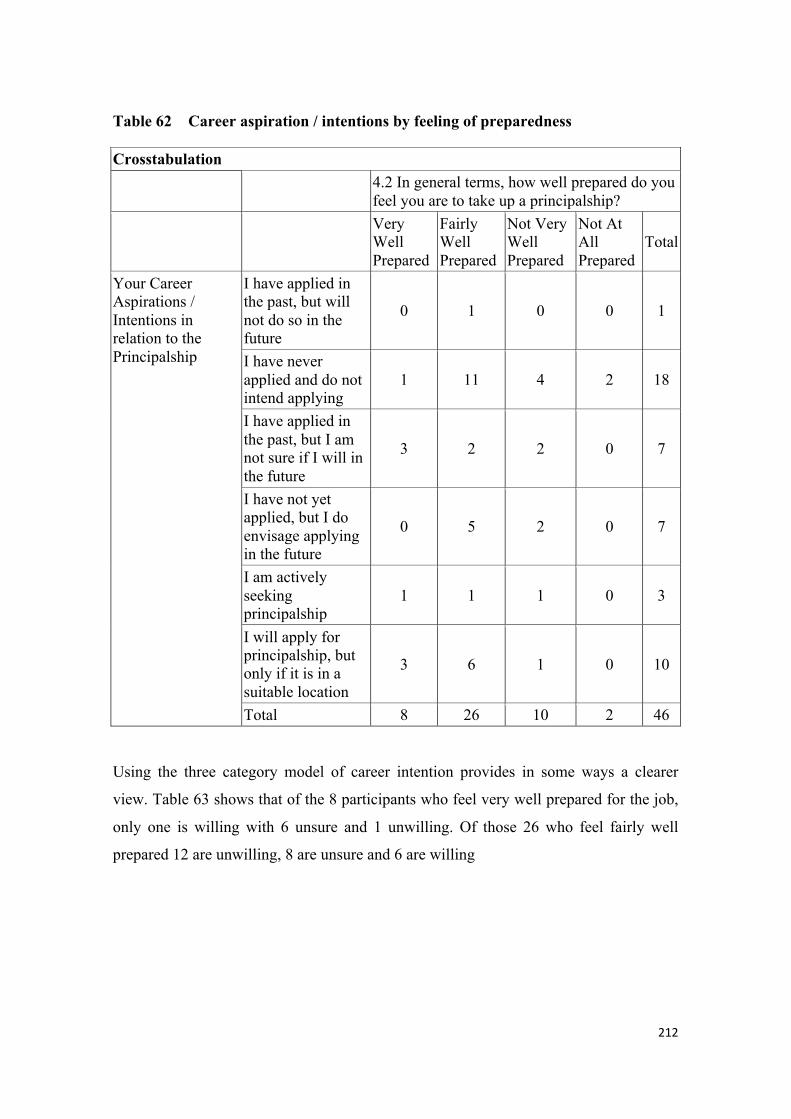
212
Table 62 Career aspiration / intentions by feeling of preparedness
Crosstabulation
4.2 In general terms, how well prepared do you feel you are to take up a principalship?
Very Well Prepared
Fairly Well Prepared
Not Very Well Prepared
Not At All Prepared
Total
Your Career Aspirations / Intentions in relation to the Principalship
I have applied in the past, but will not do so in the future
0 1 0 0 1
I have never applied and do not intend applying
1 11 4 2 18
I have applied in the past, but I am not sure if I will in the future
3 2 2 0 7
I have not yet applied, but I do envisage applying in the future
0 5 2 0 7
I am actively seeking principalship
1 1 1 0 3
I will apply for principalship, but only if it is in a suitable location
3 6 1 0 10
Total 8 26 10 2 46
Using the three category model of career intention provides in some ways a clearer
view. Table 63 shows that of the 8 participants who feel very well prepared for the job,
only one is willing with 6 unsure and 1 unwilling. Of those 26 who feel fairly well
prepared 12 are unwilling, 8 are unsure and 6 are willing
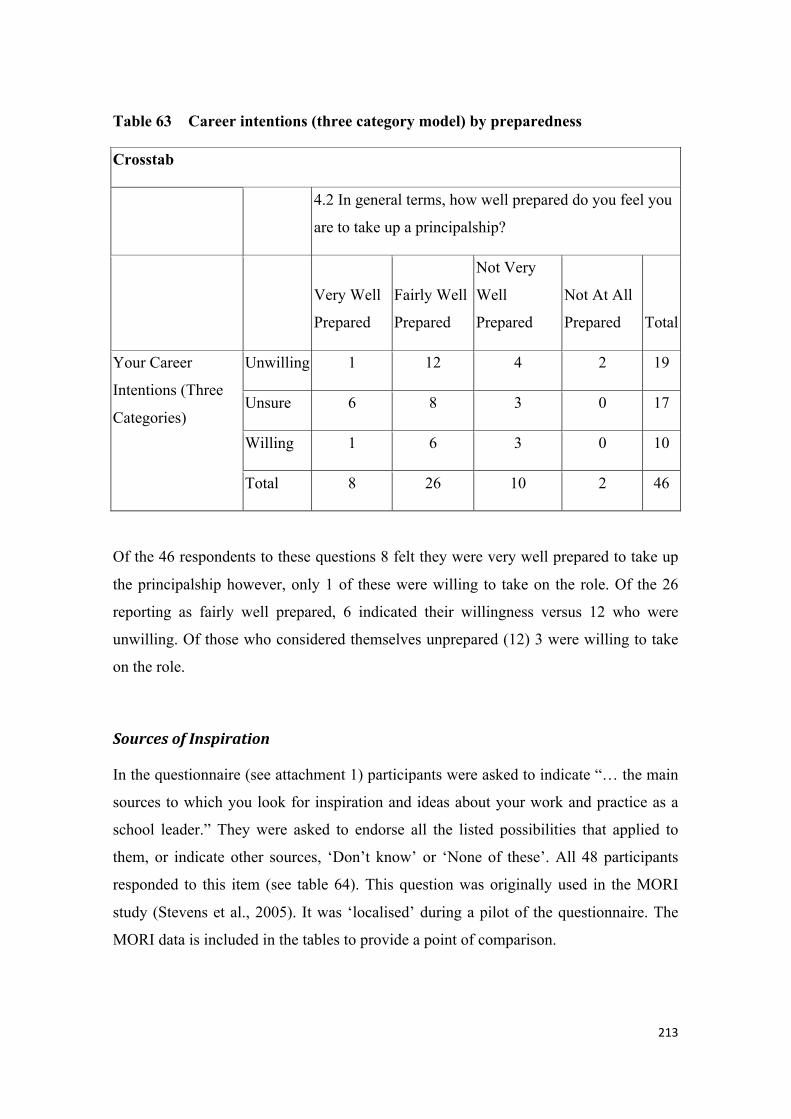
213
Table 63 Career intentions (three category model) by preparedness
Crosstab
4.2 In general terms, how well prepared do you feel you
are to take up a principalship?
Very Well
Prepared
Fairly Well
Prepared
Not Very
Well
Prepared
Not At All
Prepared Total
Your Career
Intentions (Three
Categories)
Unwilling 1 12 4 2 19
Unsure 6 8 3 0 17
Willing 1 6 3 0 10
Total 8 26 10 2 46
Of the 46 respondents to these questions 8 felt they were very well prepared to take up
the principalship however, only 1 of these were willing to take on the role. Of the 26
reporting as fairly well prepared, 6 indicated their willingness versus 12 who were
unwilling. Of those who considered themselves unprepared (12) 3 were willing to take
on the role.
SourcesofInspiration
In the questionnaire (see attachment 1) participants were asked to indicate “… the main
sources to which you look for inspiration and ideas about your work and practice as a
school leader.” They were asked to endorse all the listed possibilities that applied to
them, or indicate other sources, ‘Don’t know’ or ‘None of these’. All 48 participants
responded to this item (see table 64). This question was originally used in the MORI
study (Stevens et al., 2005). It was ‘localised’ during a pilot of the questionnaire. The
MORI data is included in the tables to provide a point of comparison.
214
The highest number of endorsements as sources of inspiration were; “Principals you
have worked for” (35 endorsements, 72.9% of possible valid respondents),
“Conferences/seminars” (34, 70.8%), “Other school leaders” (33, 68.8%),” Books,
newspapers and other publications (education, business, government)” (32, 66.7%),
“Other Assistant Principals” (30, 62.5%). Three of these top five choices are school
based leaders.
In the middle range of frequency of responses were: “Mentors (education)” (24, 50%),
“Senior management team” (24, 50%), “The Department of Education and Early
Childhood Development” (19, 39.6%), “Professional associations” (15, 31.3%),
“Internet, intranet CD ROMS” (14, 29.2%), “Ideas from other countries” (13, 27.1%)
Endorsed ten or fewer times were: “Regional office” (10, 20.8%), “Universities” (9,
18.8%), “Mentors (business)” (6, 12.5%), “Business sector” (6, 12.5%), “School
council” (3, 6.3%), “Subject associations” (3, 6.3%), “Other government departments”
(1, 2.1%).
The relatively low score for regions coincides with respondent comments regarding the
regions that contributed heavily to the “more supportive Department” node in response
to the question that sought information on what would need to change to encourage
respondents to take on the principalship. It may be surprising universities and subject
associations rate at such a low level.
There were 4 “Other” sources of inspiration cited by individual respondents. Mentioned
were: “Research papers”, “Personal drive”, “Family”, and “Other teachers”.
Two participants (4.2%) indicated that they “Don’t know” their sources of inspiration.
One participant (2.1%) indicated that “None of these” sources, as listed in the
questionnaire, were relevant to her/him.
Notwithstanding the differences in the makeup of the participants in this study and the
MORI study, there are some interesting similarities between the results. For example,
the top five ranked items were the same, albeit in a different order, with those items
being ‘Principals you have worked for’, ‘Conferences/ seminars’, publications and
‘Other Assistant Principals’. The first ten ranked items were very similar with the
215
exception of ‘Mentors (education)’, being ranked higher in this study (rank 6) compared
with the MORI study (rank 12). The rest of the items were ranked relatively similarly
with the possible exception of ‘Regional office’ which was ranked 11th in this study and
6th in the MORI study, showing that the MORI participants valued their regional office
support (known as the Local Education Authority (L.E.A.) more than participants from
this study value support from their regional office (see table 64).
However, despite this eyeball analysis, the Spearman’s rho correlation coefficient of
.362 calculated between the ranking of items in this study and the ranking of items in
the MORI study calculated between the two studies on was not statistically significant.
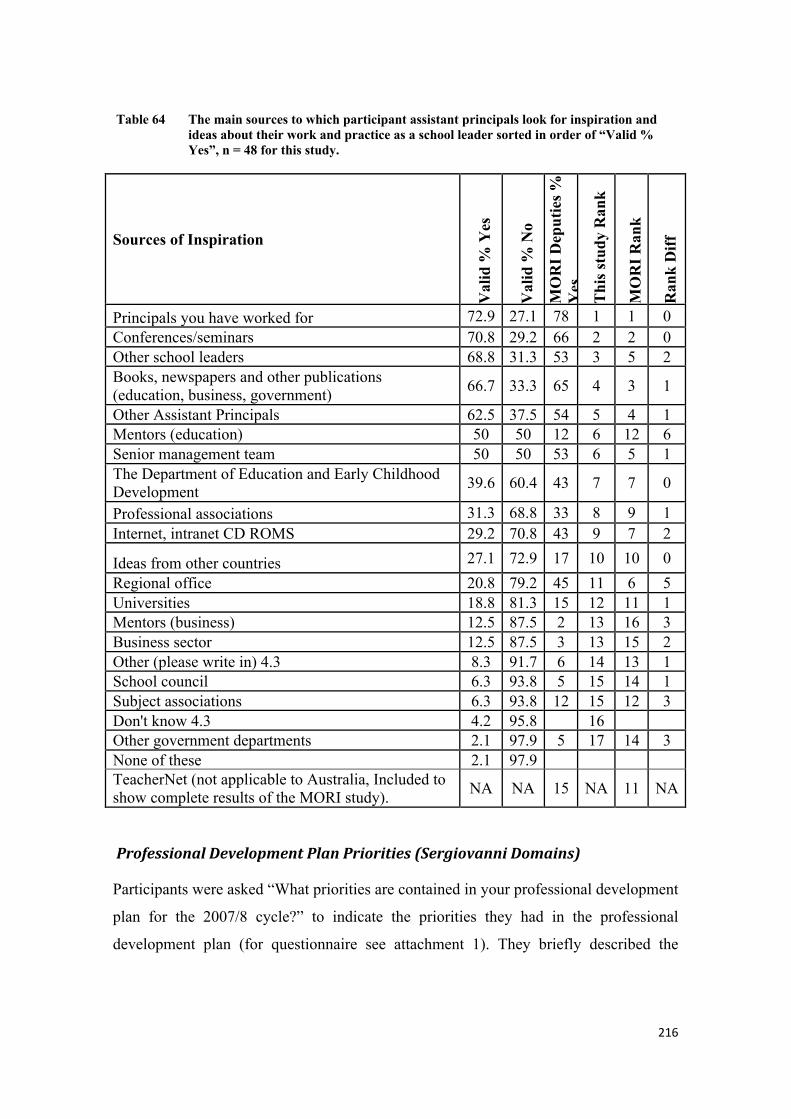
216
Table 64 The main sources to which participant assistant principals look for inspiration and ideas about their work and practice as a school leader sorted in order of “Valid % Yes”, n = 48 for this study.
Sources of Inspiration
Val
id %
Yes
Val
id %
No
MO
RI D
eput
ies %
Y
es
Thi
s stu
dy R
ank
MO
RI R
ank
Ran
k D
iff
Principals you have worked for 72.9 27.1 78 1 1 0 Conferences/seminars 70.8 29.2 66 2 2 0 Other school leaders 68.8 31.3 53 3 5 2 Books, newspapers and other publications (education, business, government) 66.7 33.3 65 4 3 1
Other Assistant Principals 62.5 37.5 54 5 4 1 Mentors (education) 50 50 12 6 12 6 Senior management team 50 50 53 6 5 1 The Department of Education and Early Childhood Development 39.6 60.4 43 7 7 0
Professional associations 31.3 68.8 33 8 9 1 Internet, intranet CD ROMS 29.2 70.8 43 9 7 2
Ideas from other countries 27.1 72.9 17 10 10 0 Regional office 20.8 79.2 45 11 6 5 Universities 18.8 81.3 15 12 11 1 Mentors (business) 12.5 87.5 2 13 16 3 Business sector 12.5 87.5 3 13 15 2 Other (please write in) 4.3 8.3 91.7 6 14 13 1 School council 6.3 93.8 5 15 14 1 Subject associations 6.3 93.8 12 15 12 3 Don't know 4.3 4.2 95.8 16 Other government departments 2.1 97.9 5 17 14 3 None of these 2.1 97.9 TeacherNet (not applicable to Australia, Included to show complete results of the MORI study). NA NA 15 NA 11 NA
ProfessionalDevelopmentPlanPriorities(SergiovanniDomains)
Participants were asked “What priorities are contained in your professional development
plan for the 2007/8 cycle?” to indicate the priorities they had in the professional
development plan (for questionnaire see attachment 1). They briefly described the
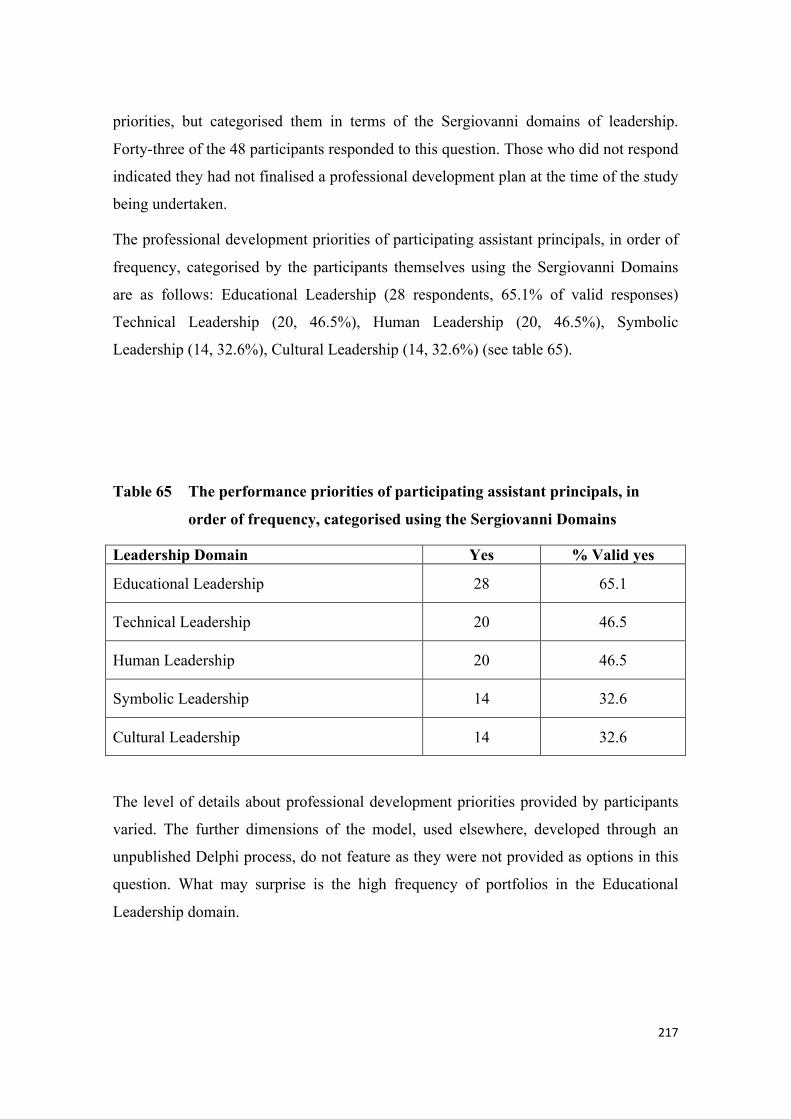
217
priorities, but categorised them in terms of the Sergiovanni domains of leadership.
Forty-three of the 48 participants responded to this question. Those who did not respond
indicated they had not finalised a professional development plan at the time of the study
being undertaken.
The professional development priorities of participating assistant principals, in order of
frequency, categorised by the participants themselves using the Sergiovanni Domains
are as follows: Educational Leadership (28 respondents, 65.1% of valid responses)
Technical Leadership (20, 46.5%), Human Leadership (20, 46.5%), Symbolic
Leadership (14, 32.6%), Cultural Leadership (14, 32.6%) (see table 65).
Table 65 The performance priorities of participating assistant principals, in
order of frequency, categorised using the Sergiovanni Domains
Leadership Domain Yes % Valid yes
Educational Leadership 28 65.1
Technical Leadership 20 46.5
Human Leadership 20 46.5
Symbolic Leadership 14 32.6
Cultural Leadership 14 32.6
The level of details about professional development priorities provided by participants
varied. The further dimensions of the model, used elsewhere, developed through an
unpublished Delphi process, do not feature as they were not provided as options in this
question. What may surprise is the high frequency of portfolios in the Educational
Leadership domain.
218
Research question five: Succession Planning: How strategic is the
school-based planning for leadership succession?
A key research question for this study is to examine how strategic the school-based
planning for succession is. Two instruments were used to gather quantitative data on
this question and in an interview a question was also asked. First data is reported on the
assistant principal perceptions of in-house development programs, followed by data on
the types of programs offered and their effectiveness. Thirdly the results of the
interview question are reported and then correlated with the responses regarding the in-
house development program.
Inschooldevelopmentprogram
Using the Rothwell (Rothwell et al., 2005, pp. 5-6) “Self-Assessment Questionnaire
About Your Organisation’s Employee Development Program”, participants were
provided with 15 activities that organisations engage in to develop their employees.
They were asked to indicate if their school engaged in each activity, by endorsing each
as either ‘Yes’, ‘Sometimes’ or ‘No’. Five of the items were responded to by all 48
participants, while the remaining ten items were responded to by 47 participants (see
table 66).
A very high percentage (43 participants, 89.6% of valid responses) believe their school
“Makes appropriate investments in education, training, and other developmental
opportunities to help employees build their competencies.” Four respondents (8.3%)
suggested their school did this ‘sometimes’ and one respondent indicated her/his school
did not do this.
219
In terms of workforce planning, 39 of 48 participants (81.3%) believe their school,
“Makes an effort to plan for workforce needs in advance for reasons such as promotions
and retirements.”
Items earning an endorsement as ‘yes’ from seventy to eighty percent of respondents
were:
1. Monitors head count on a regular basis to measure and track workforce requirements.
(36, 76.6% of valid responses)
5. Makes appropriate investments in individual development programs for employees at
all levels. (36, 75%)
7. Encourages employees to take control of their learning so they will possess the
necessary skills to be employable throughout their working life. (34, 70.8%)
Gaining a lower level of endorsement of 60 to 70 percent ‘yes’ were the following:
12. Creates a workplace climate that allows and encourages employees to become more
involved with or engaged in their work (31, 66%).
6. Provides adequate opportunities for career advancement that take into account
supervisory and managerial needs (29, 60.4%).
Gaining an endorsement of ‘yes’ from 40% to 60% were:
2. Monitors employee turnover to track any unusual "spikes" that could result from
either or internal factors (28, 59.6%).
15. Consistently provides employees with opportunities to become part of the talent
pool from which leadership positions are drawn (27, 57.4%).
8. Provides flexibility, facilities, services, and programs to enhance employee
satisfaction and commitment to the organization (26, 55.3%).
9. Makes flexible use of the workforce - such as putting the right employees in the right
roles according to their skills or using "virtual teams" to focus on the right talent for
specific tasks (22, 46.8%).
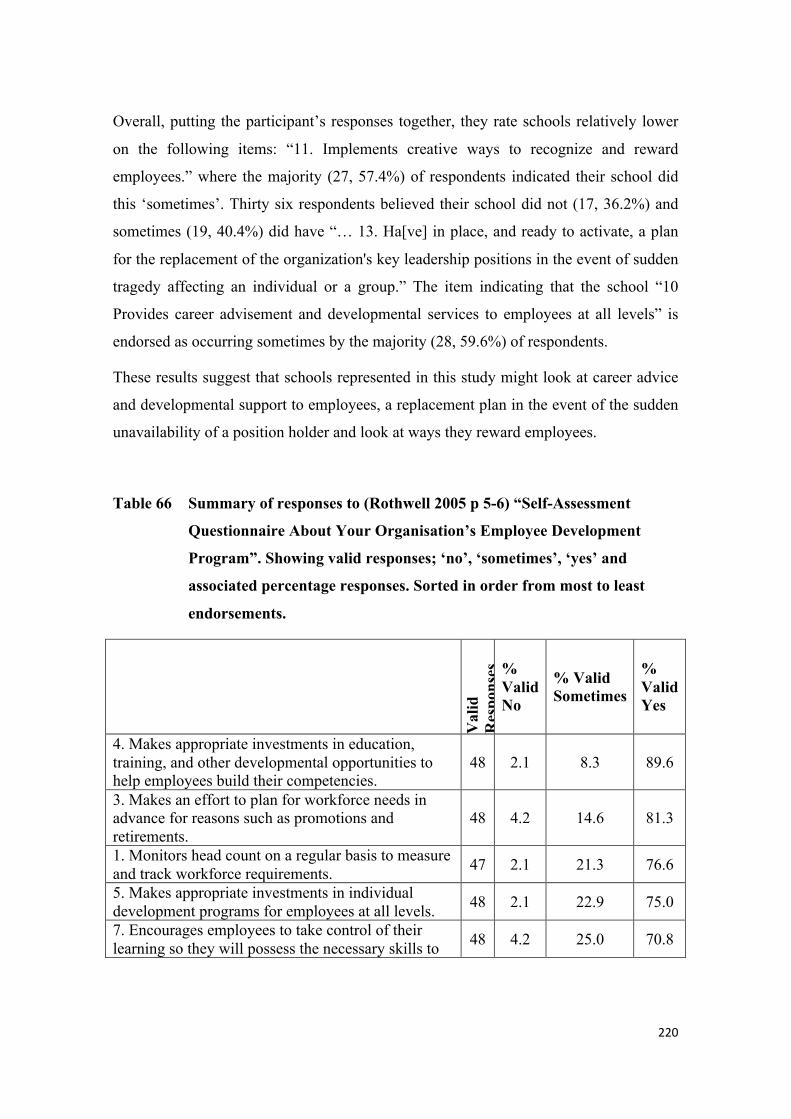
220
Overall, putting the participant’s responses together, they rate schools relatively lower
on the following items: “11. Implements creative ways to recognize and reward
employees.” where the majority (27, 57.4%) of respondents indicated their school did
this ‘sometimes’. Thirty six respondents believed their school did not (17, 36.2%) and
sometimes (19, 40.4%) did have “… 13. Ha[ve] in place, and ready to activate, a plan
for the replacement of the organization's key leadership positions in the event of sudden
tragedy affecting an individual or a group.” The item indicating that the school “10
Provides career advisement and developmental services to employees at all levels” is
endorsed as occurring sometimes by the majority (28, 59.6%) of respondents.
These results suggest that schools represented in this study might look at career advice
and developmental support to employees, a replacement plan in the event of the sudden
unavailability of a position holder and look at ways they reward employees.
Table 66 Summary of responses to (Rothwell 2005 p 5-6) “Self-Assessment
Questionnaire About Your Organisation’s Employee Development
Program”. Showing valid responses; ‘no’, ‘sometimes’, ‘yes’ and
associated percentage responses. Sorted in order from most to least
endorsements.
Val
id
Res
pons
es %
Valid No
% Valid Sometimes
% Valid Yes
4. Makes appropriate investments in education, training, and other developmental opportunities to help employees build their competencies.
48 2.1 8.3 89.6
3. Makes an effort to plan for workforce needs in advance for reasons such as promotions and retirements.
48 4.2 14.6 81.3
1. Monitors head count on a regular basis to measure and track workforce requirements. 47 2.1 21.3 76.6
5. Makes appropriate investments in individual development programs for employees at all levels. 48 2.1 22.9 75.0
7. Encourages employees to take control of their learning so they will possess the necessary skills to 48 4.2 25.0 70.8
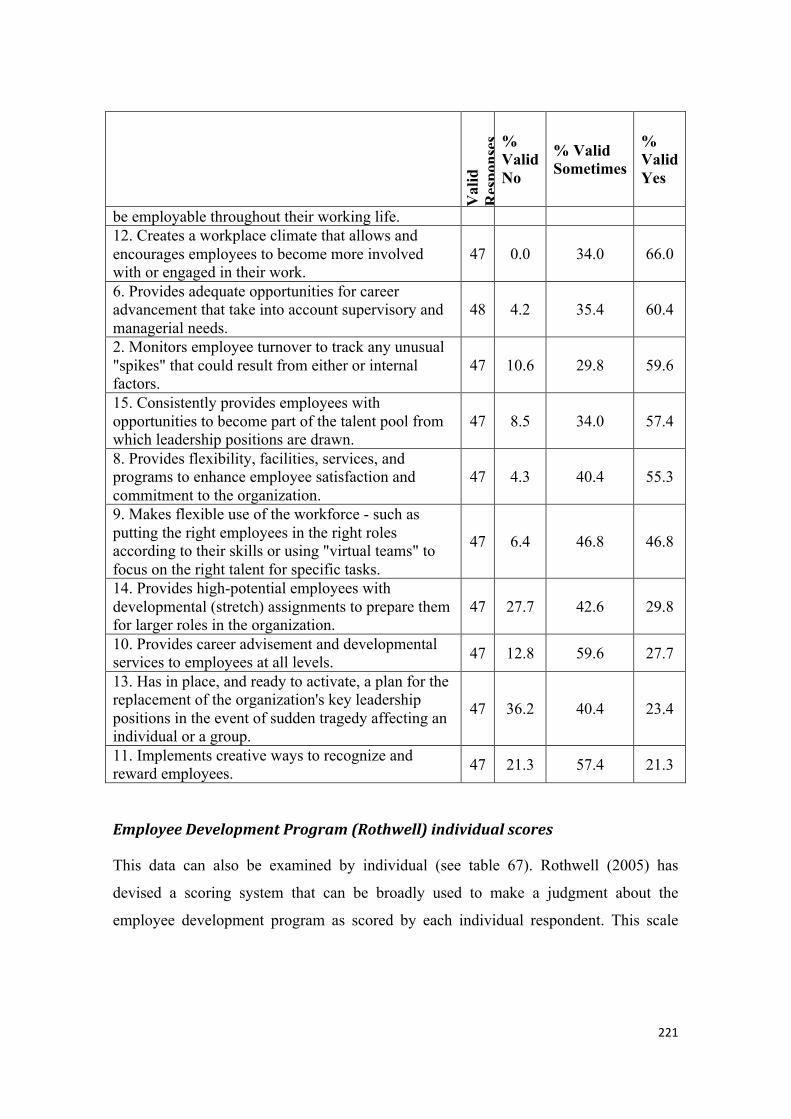
221
Val
id
Res
pons
es %
Valid No
% Valid Sometimes
% Valid Yes
be employable throughout their working life. 12. Creates a workplace climate that allows and encourages employees to become more involved with or engaged in their work.
47 0.0 34.0 66.0
6. Provides adequate opportunities for career advancement that take into account supervisory and managerial needs.
48 4.2 35.4 60.4
2. Monitors employee turnover to track any unusual "spikes" that could result from either or internal factors.
47 10.6 29.8 59.6
15. Consistently provides employees with opportunities to become part of the talent pool from which leadership positions are drawn.
47 8.5 34.0 57.4
8. Provides flexibility, facilities, services, and programs to enhance employee satisfaction and commitment to the organization.
47 4.3 40.4 55.3
9. Makes flexible use of the workforce - such as putting the right employees in the right roles according to their skills or using "virtual teams" to focus on the right talent for specific tasks.
47 6.4 46.8 46.8
14. Provides high-potential employees with developmental (stretch) assignments to prepare them for larger roles in the organization.
47 27.7 42.6 29.8
10. Provides career advisement and developmental services to employees at all levels. 47 12.8 59.6 27.7
13. Has in place, and ready to activate, a plan for the replacement of the organization's key leadership positions in the event of sudden tragedy affecting an individual or a group.
47 36.2 40.4 23.4
11. Implements creative ways to recognize and reward employees. 47 21.3 57.4 21.3
EmployeeDevelopmentProgram(Rothwell)individualscores
This data can also be examined by individual (see table 67). Rothwell (2005) has
devised a scoring system that can be broadly used to make a judgment about the
employee development program as scored by each individual respondent. This scale
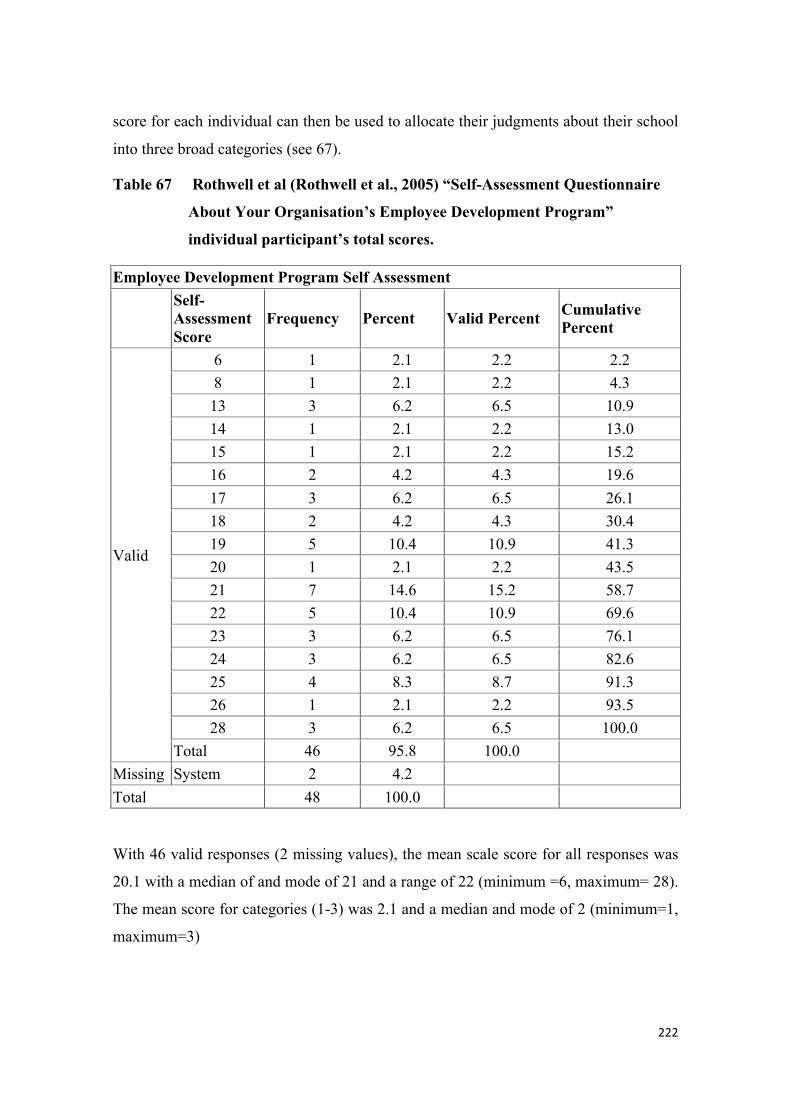
222
score for each individual can then be used to allocate their judgments about their school
into three broad categories (see 67).
Table 67 Rothwell et al (Rothwell et al., 2005) “Self-Assessment Questionnaire
About Your Organisation’s Employee Development Program”
individual participant’s total scores.
Employee Development Program Self Assessment
Self-Assessment Score
Frequency Percent Valid Percent Cumulative Percent
Valid
6 1 2.1 2.2 2.2 8 1 2.1 2.2 4.3 13 3 6.2 6.5 10.9 14 1 2.1 2.2 13.0 15 1 2.1 2.2 15.2 16 2 4.2 4.3 19.6 17 3 6.2 6.5 26.1 18 2 4.2 4.3 30.4 19 5 10.4 10.9 41.3 20 1 2.1 2.2 43.5 21 7 14.6 15.2 58.7 22 5 10.4 10.9 69.6 23 3 6.2 6.5 76.1 24 3 6.2 6.5 82.6 25 4 8.3 8.7 91.3 26 1 2.1 2.2 93.5 28 3 6.2 6.5 100.0
Total 46 95.8 100.0 Missing System 2 4.2 Total 48 100.0
With 46 valid responses (2 missing values), the mean scale score for all responses was
20.1 with a median of and mode of 21 and a range of 22 (minimum =6, maximum= 28).
The mean score for categories (1-3) was 2.1 and a median and mode of 2 (minimum=1,
maximum=3)

223
Rothwell provides a scoring system with the scale that provides a guide to the progress
of organisations in their employee development programs as shown in table 68.
Table 68 Rothwell (Rothwell et al., 2005, pp. 5-6) “Self-Assessment
Questionnaire About Your Organisation’s Employee Development
Program” individual participants total score categorised as
recommended by Rothwell
Employee Development Program Self-Assessment (Rothwell et al 2005) Category Frequency Percent
Valid Percent
Pull out all the stops! Begin immediate improvements...(14 points out of 30 or below)
6 12.5 13.0
More work needs to be done (15 to 23 points out of 30) 29 60.4 63.0
"...on the right track..."(24 to 30 points out of 30) 11 22.9 23.9
Total 46 95.8 100.0 Missing 2 4.2 Total 48 100.0
Using this broad analysis, 6 (13% valid percent) of the respondents believed their
school scored 14 points or below, indicating that significant work was needed. The bulk
of respondents (29, 63%) scoring led to their school being categorised as needing more
work. Eleven (23.9%) of the participants rated their school to a level that indicates, in
terms of this measure, their school is “… on the right track…”.
This broad analysis indicates that all schools have more work to do with getting a
succession planning approach in place, with some doing far less than others currently.
ProgramsOffered
Another way of gaining an overview of development activities occurring in the schools
of participants is to examine the types of activities used to develop leadership. Rothwell
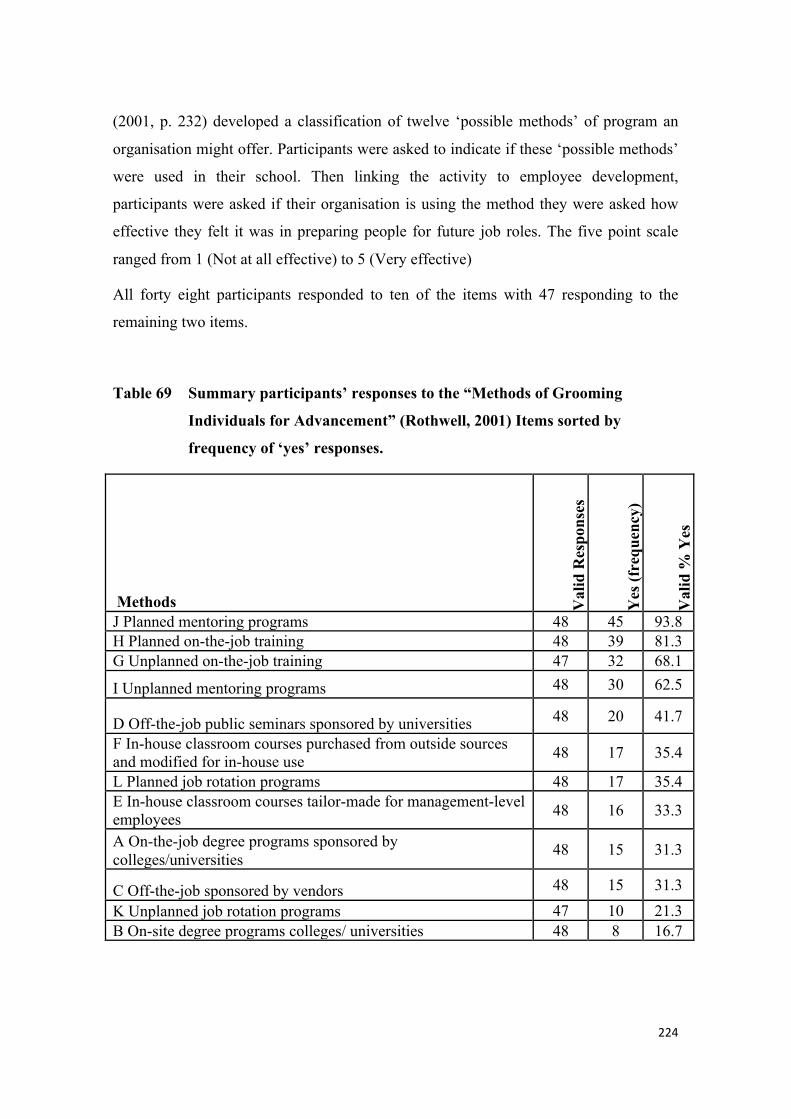
224
(2001, p. 232) developed a classification of twelve ‘possible methods’ of program an
organisation might offer. Participants were asked to indicate if these ‘possible methods’
were used in their school. Then linking the activity to employee development,
participants were asked if their organisation is using the method they were asked how
effective they felt it was in preparing people for future job roles. The five point scale
ranged from 1 (Not at all effective) to 5 (Very effective)
All forty eight participants responded to ten of the items with 47 responding to the
remaining two items.
Table 69 Summary participants’ responses to the “Methods of Grooming
Individuals for Advancement” (Rothwell, 2001) Items sorted by
frequency of ‘yes’ responses.
Methods Val
id R
espo
nses
Yes
(fre
quen
cy)
Val
id %
Yes
J Planned mentoring programs 48 45 93.8 H Planned on-the-job training 48 39 81.3 G Unplanned on-the-job training 47 32 68.1
I Unplanned mentoring programs 48 30 62.5
D Off-the-job public seminars sponsored by universities 48 20 41.7
F In-house classroom courses purchased from outside sources and modified for in-house use 48 17 35.4
L Planned job rotation programs 48 17 35.4 E In-house classroom courses tailor-made for management-level employees 48 16 33.3
A On-the-job degree programs sponsored by colleges/universities 48 15 31.3
C Off-the-job sponsored by vendors 48 15 31.3 K Unplanned job rotation programs 47 10 21.3 B On-site degree programs colleges/ universities 48 8 16.7
225
The most frequently used method in their school as reported by the participants was “J
Planned mentoring programs” with forty-five of the 48 (93.8% of valid responses)
respondents indicating that this method was used at their school. This may reflect the
recent requirement for highly planned mentoring programs for graduate teachers, as part
of the registration processes required by the Victorian Institute of Teaching (Victorian
Institute of Teaching, 2010)
The next most frequently used method in their school as reported by the participants
was “H Planned on-the-job training” with 39 of the 48 (81.3% of valid responses)
respondents indicating that this method was used at their school.
Reported methods as existing in their schools by 30 or more participants were: “G
Unplanned on-the-job training (32, 68.1%) and “I Unplanned mentoring programs (30,
62.5%).
The remaining programs were reported to exist in schools by 20 or less participants.
They are: “D Off-the-job public seminars sponsored by universities” (20, 41.7%), “F In-
house classroom courses purchased from outside sources and modified for in-house
use” (17, 35.4%), “L Planned job rotation programs” (17, 35.4%), “E In-house
classroom courses tailor-made for management-level employees” (16, 33.3%), “A On-
the-job degree programs sponsored by colleges/universities” (15, 31.3%), “K
Unplanned job rotation programs” (10, 21.3%) and “B On-site degree programs
colleges/ universities” (8, 16.7%).
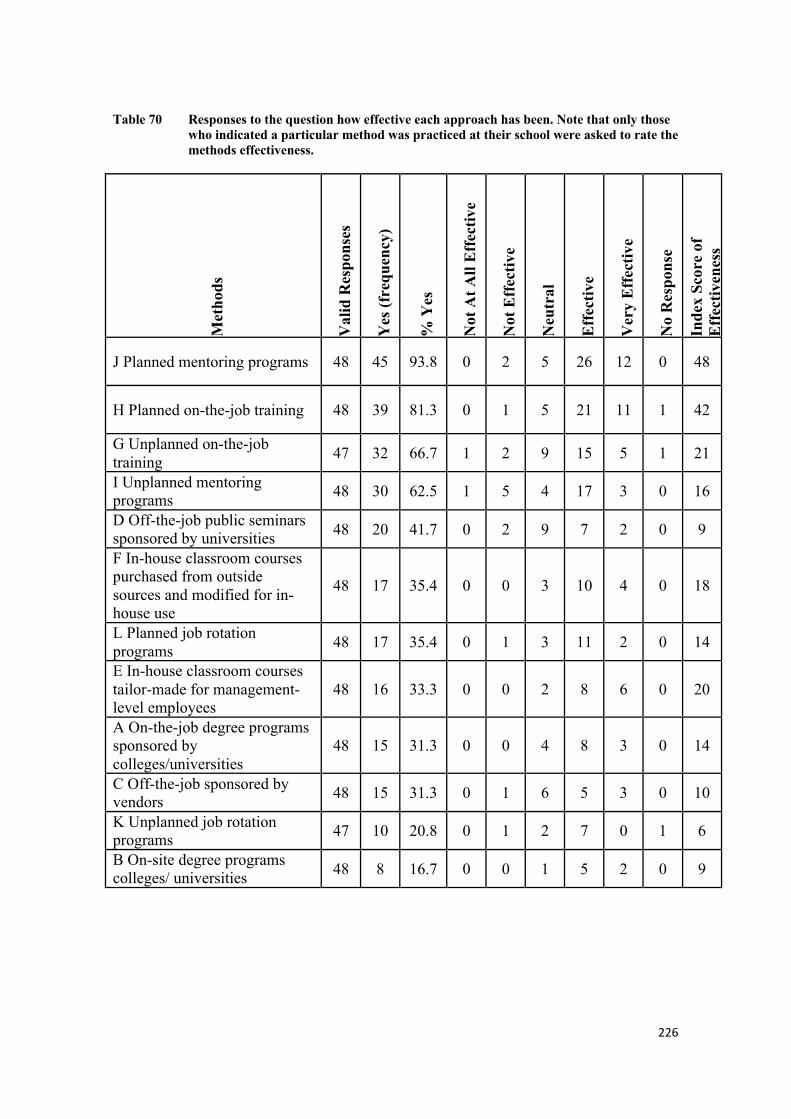
226
Table 70 Responses to the question how effective each approach has been. Note that only those who indicated a particular method was practiced at their school were asked to rate the methods effectiveness.
Met
hods
Val
id R
espo
nses
Yes
(fre
quen
cy)
% Y
es
Not
At A
ll E
ffec
tive
Not
Eff
ectiv
e
Neu
tral
Eff
ectiv
e
Ver
y E
ffec
tive
No
Res
pons
e
Inde
x Sc
ore
of
Eff
ectiv
enes
s
J Planned mentoring programs 48 45 93.8 0 2 5 26 12 0 48
H Planned on-the-job training 48 39 81.3 0 1 5 21 11 1 42
G Unplanned on-the-job training 47 32 66.7 1 2 9 15 5 1 21
I Unplanned mentoring programs 48 30 62.5 1 5 4 17 3 0 16
D Off-the-job public seminars sponsored by universities 48 20 41.7 0 2 9 7 2 0 9
F In-house classroom courses purchased from outside sources and modified for in-house use
48 17 35.4 0 0 3 10 4 0 18
L Planned job rotation programs 48 17 35.4 0 1 3 11 2 0 14
E In-house classroom courses tailor-made for management-level employees
48 16 33.3 0 0 2 8 6 0 20
A On-the-job degree programs sponsored by colleges/universities
48 15 31.3 0 0 4 8 3 0 14
C Off-the-job sponsored by vendors 48 15 31.3 0 1 6 5 3 0 10
K Unplanned job rotation programs 47 10 20.8 0 1 2 7 0 1 6
B On-site degree programs colleges/ universities 48 8 16.7 0 0 1 5 2 0 9
227
Participants were asked to rate the effectiveness of the program types they had
experienced (see table 69 and table 70). A mean score of these ratings was calculated
using the weighting of -2, -1, 0, +1, +2. Table 71 below lists the methods of professional
development in order of the means and therefore, as measured by the scale, in order of
the participants rating of effectiveness.
The higher ranked items for effectiveness by mean were: “E In-house classroom courses
tailor-made for management-level employees” (mean rating = 1.25), “B On-site degree
programs colleges/ universities”(1.13), “H Planned on-the-job training” (1.08), “J
Planned mentoring programs” (1.07), “F In-house classroom courses purchased from
outside sources and modified for in-house use” (1.06), “A On-the-job degree programs
sponsored by colleges/universities” (0.93), “L Planned job rotation programs” (0.82).
The lower ranked items were: “C Off-the-job sponsored by vendors” (0.67), “G
Unplanned on-the-job training” (0.66), “K Unplanned job rotation programs” (0.60), “I
Unplanned mentoring programs (0.53), “D Off-the-job public seminars sponsored by
universities” (0.45).
From this it can be seen that all of the top seven rated methods for effectiveness had the
characteristic of being in-house and / or planned. The five bottom ranked methods for
effectiveness all have the characteristic of being unplanned and / or off-site.
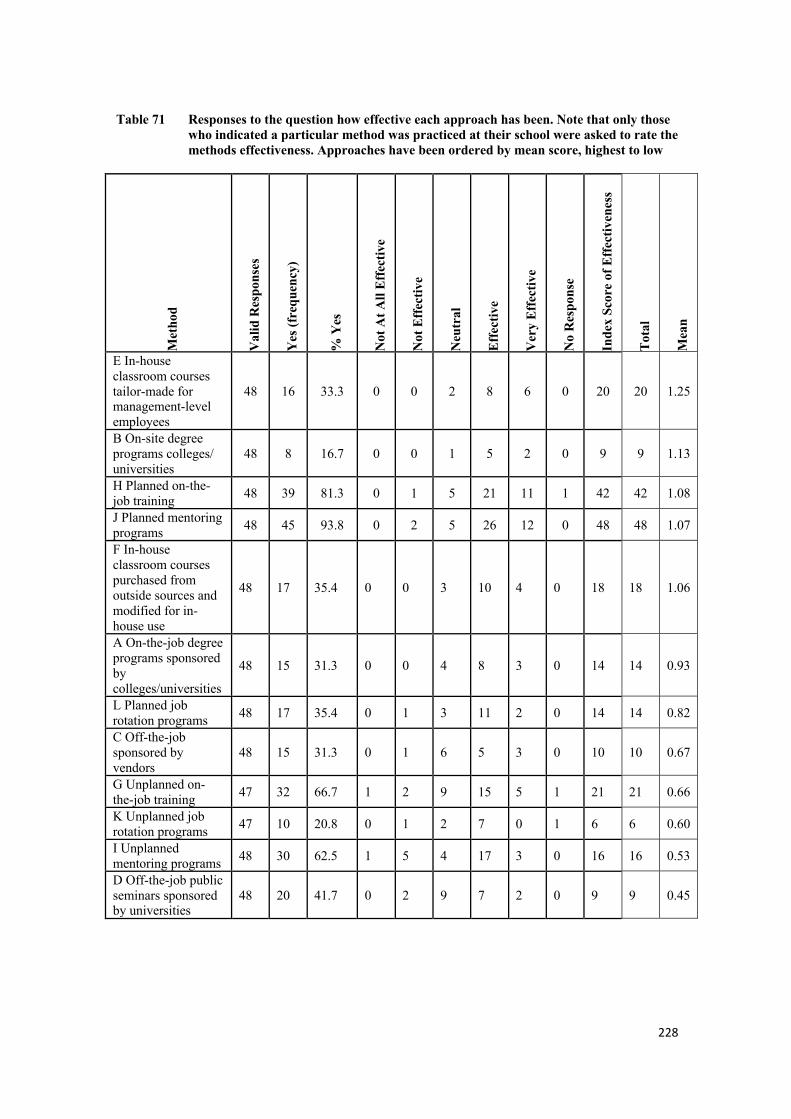
228
Table 71 Responses to the question how effective each approach has been. Note that only those who indicated a particular method was practiced at their school were asked to rate the methods effectiveness. Approaches have been ordered by mean score, highest to low
Met
hod
Val
id R
espo
nses
Yes
(fre
quen
cy)
% Y
es
Not
At A
ll Ef
fect
ive
Not
Effe
ctiv
e
Neu
tral
Effe
ctiv
e
Ver
y Ef
fect
ive
No
Res
pons
e
Inde
x Sc
ore
of E
ffect
iven
ess
Tota
l
Mea
n
E In-house classroom courses tailor-made for management-level employees
48 16 33.3 0 0 2 8 6 0 20 20 1.25
B On-site degree programs colleges/ universities
48 8 16.7 0 0 1 5 2 0 9 9 1.13
H Planned on-the-job training 48 39 81.3 0 1 5 21 11 1 42 42 1.08
J Planned mentoring programs 48 45 93.8 0 2 5 26 12 0 48 48 1.07
F In-house classroom courses purchased from outside sources and modified for in-house use
48 17 35.4 0 0 3 10 4 0 18 18 1.06
A On-the-job degree programs sponsored by colleges/universities
48 15 31.3 0 0 4 8 3 0 14 14 0.93
L Planned job rotation programs 48 17 35.4 0 1 3 11 2 0 14 14 0.82
C Off-the-job sponsored by vendors
48 15 31.3 0 1 6 5 3 0 10 10 0.67
G Unplanned on-the-job training 47 32 66.7 1 2 9 15 5 1 21 21 0.66
K Unplanned job rotation programs 47 10 20.8 0 1 2 7 0 1 6 6 0.60
I Unplanned mentoring programs 48 30 62.5 1 5 4 17 3 0 16 16 0.53
D Off-the-job public seminars sponsored by universities
48 20 41.7 0 2 9 7 2 0 9 9 0.45
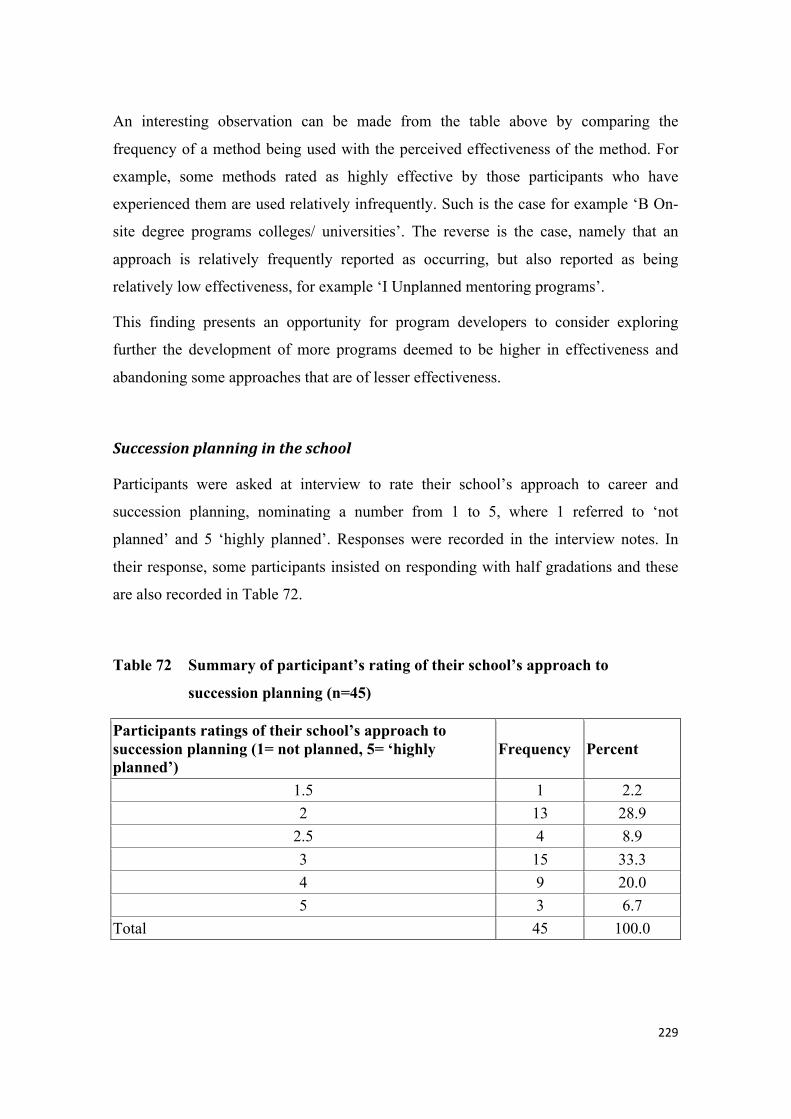
229
An interesting observation can be made from the table above by comparing the
frequency of a method being used with the perceived effectiveness of the method. For
example, some methods rated as highly effective by those participants who have
experienced them are used relatively infrequently. Such is the case for example ‘B On-
site degree programs colleges/ universities’. The reverse is the case, namely that an
approach is relatively frequently reported as occurring, but also reported as being
relatively low effectiveness, for example ‘I Unplanned mentoring programs’.
This finding presents an opportunity for program developers to consider exploring
further the development of more programs deemed to be higher in effectiveness and
abandoning some approaches that are of lesser effectiveness.
Successionplanningintheschool
Participants were asked at interview to rate their school’s approach to career and
succession planning, nominating a number from 1 to 5, where 1 referred to ‘not
planned’ and 5 ‘highly planned’. Responses were recorded in the interview notes. In
their response, some participants insisted on responding with half gradations and these
are also recorded in Table 72.
Table 72 Summary of participant’s rating of their school’s approach to
succession planning (n=45)
Participants ratings of their school’s approach to succession planning (1= not planned, 5= ‘highly planned’)
Frequency Percent
1.5 1 2.2 2 13 28.9
2.5 4 8.9 3 15 33.3 4 9 20.0 5 3 6.7
Total 45 100.0
230
Forty five participants provided a response to this question. Three (6.7% of valid
responses) participants rated their schools efforts to be a 5, highly planned. Nine (20%)
participants rated their schools efforts at 4. The largest number of participants (15,
33.3%) rated their school in the middle of the scale at rating 3. Four participants (8.9%)
rated the school at 2.5, thirteen (28.9%) and rating two and one (2.2%) participant rated
their school as 1.5. No participant rated their school at “1”. Thirty three participants
(73.3%) rated the school at the middle ranking of 3 or less. (see table 72). The mean
rating was 2.97.
These ratings by participants were correlated with their rating of the Employee
development program, both in raw score and in categorical form (3 categories as
provided by Rothwell (Rothwell et al., 2005). The less formal rating by participants,
that is 1 to 5, was found to correlate significantly at the .01 level (2-tailed) with the
Rothwell scale (raw score) and at the .05 level with the Rothwell three category scale
(2-tailed). These results add to the validity of responses (parallel measures) and may
indicate that the simple open ended question delivers valid indications of the level of a
strategic approach that is taken in their schools.
Professional Development Planning and Career Planning
As a contribution to answering the research question how strategic the professional
development planning is for participants, they were asked about their professional
development planning in relation to their career plans and the school strategic plan.
In interview, participants were asked “How closely is your professional development
plan related to your career plan?” The verbatim responses were coded for meaning as
either ‘yes’ or ‘no’.
Sixty three percent of respondents indicated that there was no link between their
professional development plan and their career plan (see table 73).

231
Table 73 Summary of coded responses to the interview question “How closely is your professional development plan related to your career plan?” n = 46
Response Frequency Percent Yes 17 37.0 No 29 63.0 Total 46 100.0
Although the annual Performance and Development Plan does allow for professional
development priorities linked to the school strategic plan and another to the assistant
principals own career plan (Department of Education and Early Childhood
Development, 2010c) most assistant principals reported that they didn’t take up the
opportunity to link their professional development plan with their career plans.
Link Between Professional Development Plan and the School Strategic Plan.
In interview, participants were asked “How closely is your professional development
plan related to the School Strategic Plan?” The responses were coded as either ‘yes’ or
‘no’.
Thirty seven (90.2 percent of valid responses) indicated a link between the School
Strategic Plan and their career plan (see table 74).
Table 74 Summary of coded responses to the interview question “How closely is
your professional development plan related to the School Strategic
Plan?”
Response Frequency Percent Yes 37 90.2 No 4 9.8 Total 41 100.0 Note: the frequency = 41 because 5 participant’s schools had no current School Strategic Plan.
The annual Performance and Development Plan does allow for professional
development priorities linked to the School Strategic Plan and another to the assistant
principals own career plan. However, almost 2.5 times more participants reported a link
232
between their professional development plan and the School Strategic Plan than
reported a link between their professional development plan and their career plan.
Researchquestionsix:Whatwouldneedtochangetoincrease
interestintheprincipalship?(Qualitative)
Participants available for interview (46 out of 48) were asked “What things that would
need to change to increase interest your interest in the principalship?” The most
frequent response was summarised by the code “More supportive Department” (8
sources, 11 references). The next most mentioned item was “Improved salary package
(6, 6) and then “Manage the symbolic expectations of principal.” There were then a
range of responses relating broadly to issues such as workload, recognition and support
(see table 75).
More supportive department
Comments noted a lack of support (Female 5, Male 7, Male 8) especially for principals
“having a hard time of it… It seems some regions seem to be quite antagonistic…”
(Male 8). Particular mention was made of the unsupportive way parent complaints about
schools were handled (Female 3), a lack of continuity of support (Female 5). One
participant commented on the increased transfer of responsibilities to schools from the
central office (Male 6).
One provided a lengthy commentary on the “… the lack of support or perceived support
from the region, the region is kind of different. But there’s no encouragement, there’s
no, you know, like our SEO would come spasmodically and be insignificant and, you
know, I don’t know. I mean they’re supposed to be working as a team and working for
people in the area and I just don’t think that that, you know, you just think well what’s
the point really? When the people that you’re working for don’t value the school, don’t
value you as an individual, don’t encourage you as an individual to move forward…
Yep. But human support, you know, and recognition of the good things that happen at
the school as opposed to the continual criticism. … And to be very specific about
233
something like that, there’s no significant, like in year 9 we’ve had about, I don’t know,
up to 10 enrolments from [another nearby] School because they misbehave, they kick
‘em out and they’ve got too many. And we work with kids for hours and work out
programs and strategies by which to keep kids here and that sort of thing. There’s no
recognition of any of that.” (Male 44)
Suggestions made were “… We need more professionals that can support principals
when they have difficult situations to manage…” (Female 9). Further, it was suggested
that senior education officers get to know and nurture assistant principals (Female 12).
Improved salary package
Participants here believe that the salary of principals does not match the requirements of
the role (Male 30, Male 43) and one has seen a principal move out of the role to gain
employment at half the work and twice the pay (Female 17). Some believe that an
improvement in salary is necessary to attract people to the role (Male 43, Male 6,
Female 17, Male 7) perhaps with performance incentives linked to student learning
(Male 6).
Manage symbolic expectations of principals
This node represents participants' responses concerning the very high expectation for
principals to beat all of the many events and meetings held in a school (Female 1,
Female 3) because of the expectations that go with being the school’s figurehead, an
image that should be diminished (Female 31)
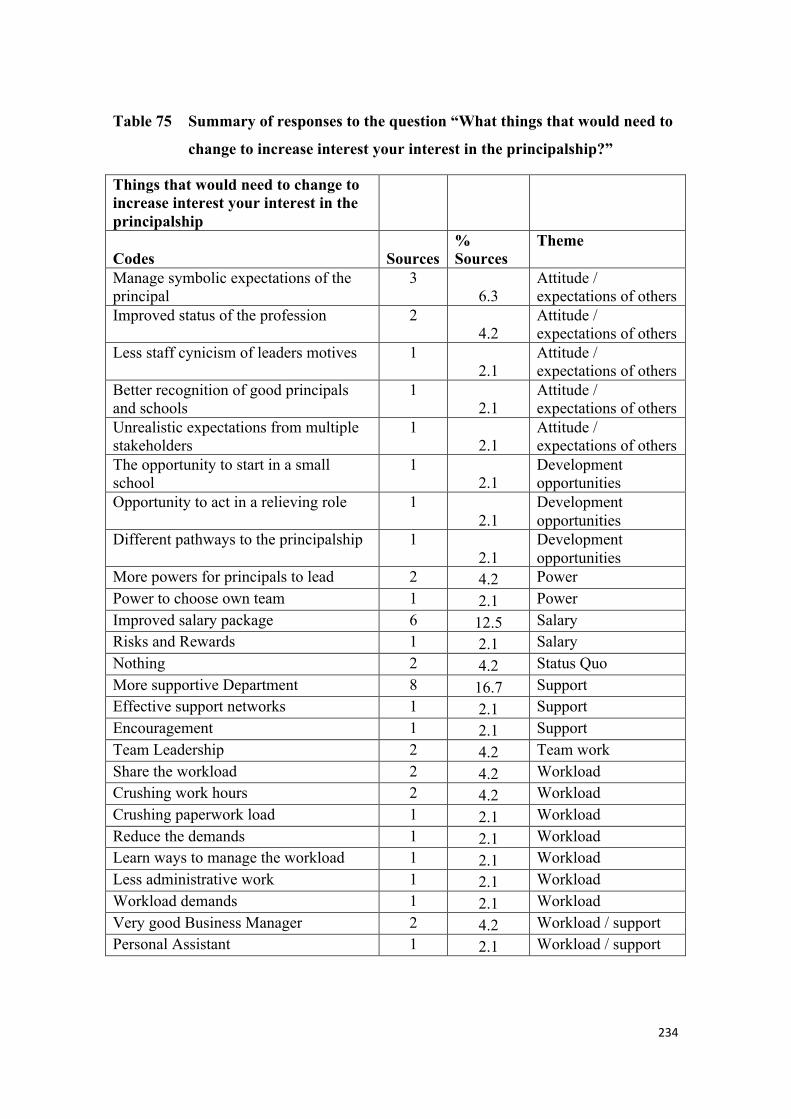
234
Table 75 Summary of responses to the question “What things that would need to
change to increase interest your interest in the principalship?”
Things that would need to change to increase interest your interest in the principalship
Codes Sources % Sources
Theme
Manage symbolic expectations of the principal
3 6.3
Attitude / expectations of others
Improved status of the profession 2 4.2
Attitude / expectations of others
Less staff cynicism of leaders motives 1 2.1
Attitude / expectations of others
Better recognition of good principals and schools
1 2.1
Attitude / expectations of others
Unrealistic expectations from multiple stakeholders
1 2.1
Attitude / expectations of others
The opportunity to start in a small school
1 2.1
Development opportunities
Opportunity to act in a relieving role 1 2.1
Development opportunities
Different pathways to the principalship 1 2.1
Development opportunities
More powers for principals to lead 2 4.2 Power Power to choose own team 1 2.1 Power Improved salary package 6 12.5 Salary Risks and Rewards 1 2.1 Salary Nothing 2 4.2 Status Quo More supportive Department 8 16.7 Support Effective support networks 1 2.1 Support Encouragement 1 2.1 Support Team Leadership 2 4.2 Team work Share the workload 2 4.2 Workload Crushing work hours 2 4.2 Workload Crushing paperwork load 1 2.1 Workload Reduce the demands 1 2.1 Workload Learn ways to manage the workload 1 2.1 Workload Less administrative work 1 2.1 Workload Workload demands 1 2.1 Workload Very good Business Manager 2 4.2 Workload / support Personal Assistant 1 2.1 Workload / support
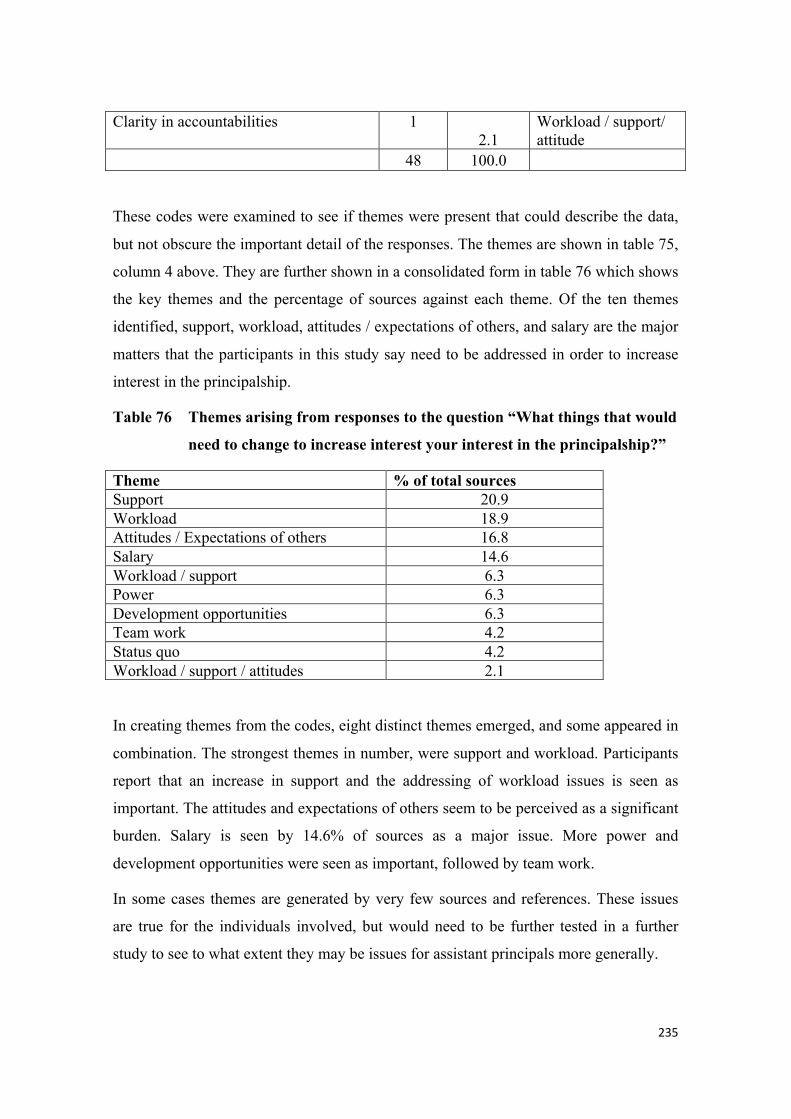
235
Clarity in accountabilities 1 2.1
Workload / support/ attitude
48 100.0
These codes were examined to see if themes were present that could describe the data,
but not obscure the important detail of the responses. The themes are shown in table 75,
column 4 above. They are further shown in a consolidated form in table 76 which shows
the key themes and the percentage of sources against each theme. Of the ten themes
identified, support, workload, attitudes / expectations of others, and salary are the major
matters that the participants in this study say need to be addressed in order to increase
interest in the principalship.
Table 76 Themes arising from responses to the question “What things that would
need to change to increase interest your interest in the principalship?”
Theme % of total sources Support 20.9 Workload 18.9 Attitudes / Expectations of others 16.8 Salary 14.6 Workload / support 6.3 Power 6.3 Development opportunities 6.3 Team work 4.2 Status quo 4.2 Workload / support / attitudes 2.1
In creating themes from the codes, eight distinct themes emerged, and some appeared in
combination. The strongest themes in number, were support and workload. Participants
report that an increase in support and the addressing of workload issues is seen as
important. The attitudes and expectations of others seem to be perceived as a significant
burden. Salary is seen by 14.6% of sources as a major issue. More power and
development opportunities were seen as important, followed by team work.
In some cases themes are generated by very few sources and references. These issues
are true for the individuals involved, but would need to be further tested in a further
study to see to what extent they may be issues for assistant principals more generally.
236
Conclusion
This chapter presented the results in relation to the key research questions.
The study included 48 assistant principals which represented 60.8% of the population
frame, which was representative of the gender of the population, but under-represented
the number of disadvantaged schools in the population. Participants were aged from 38
to 63 years of age and had been assistant principals from 1 month to 19 years in their
current schools. Seventy nine percent of participants were appointed from positions
within their current school and 83.3% were born in Australia. Almost 73% of
participants came from schools with medium or large student populations. Over seventy
percent of participants were in schools with 2 or 3 assistant principal positions. Across
participants they carried out a broad range of portfolio responsibilities with Human
Resources the most common.
Just over 20% of participants were willing to become principals, but only 3 of the 48
actively seeking the principalship at the time of the study. From the questionnaire, for
most the reasons those who wanted to be a principal was for the job satisfaction and a
sense of personal achievement, the dynamic nature of the role and the opportunity to
build shared values. The interviews highlighted the opportunities for principals to help
students succeed and the influence of positive role models. The reasons for those not
wanting to be principals included the perceived stress of the role and the potential
impact on personal priorities. A high proportion of participants were willing to lead
schools that would present challenges. Key considerations were community, location,
self considerations and school structure.
In considering their career options, most participants wanted to remain as assistant
principals in their current school.
Although participation in professional development seems extensive when reported
from a state-wide point of view, this cohort of principals seemed to have low rates of
participation in central and regional department professional development activities.
However, those who undertook those programs found them useful. The majority of
participants said the programs provided knowledge they could apply to their work and
237
use for problem solving. Participants did attend a wide range of programs offered by
unions and professional associations as well as private providers.
Participants referred to a range of in-school experiences that can help prepare assistant
principals for the principalship, the most commonly mentioned of which were the
experience of leading and committee membership.
Almost 73% of participants felt very or fairly well prepared to tackle the principalship, a
much higher level than those who are willing to take on the role. On-the -job
experiences were the most commonly referred to ways that participants had prepared
themselves for the principalship. The most common hindrance was insufficient
preparation and a perceived lack of knowledge in particular areas. Interestingly, in this
study, there was no correlation between career aspiration and preparedness for the role.
In the opinion of participants, While 22.9% of participants’ schools were judged to be
on the right track with succession planning, sixty percent needed to do more and another
12.5% needed to take urgent action. While training that was planned and/or on the job
was seen as the most effective, they were not always the most frequently available
programs.
Most participants felt that there was no link between their professional learning plan and
their career plan. However the majority felt there was a link between their professional
development plan and the school strategic plan.
Most participants have high levels of job satisfaction and generally they perceive that
principals also have relatively high levels of job satisfaction. Their pay relative to the
amount of the work they do is the matter of least satisfaction for assistant principals.
Intrinsic satisfaction was judged higher than extrinsic satisfaction. Pay relative to the
amount of work they do was perceived to be the area of least satisfaction in principals
too. The major difference between assistant principals' perceptions of their own
satisfaction and their perceptions of principals’ satisfaction were that principals gained
less satisfaction from the way their boss handles workers, and assistant principals had
less chance to tell people what to do. In this study there was no correlation between the
238
assistant principals’ perceptions of principals’ job satisfaction, with assistant principals’
own career intentions suggesting?
The most common things that would need to change to increase participants interest in
the principalship were; a more supportive education department, improved salary
package, and managing the expectations of principals. Issues that needed to be
addressed included support, workload, attitudes and expectations held by others, and
salary.
The following chapter is a discussion of the findings reported in this chapter in relation
to the literature.
239
ChapterSixSummary,DiscussionandConclusions
IntroductionThe purpose of this final chapter is to provide a summary of answers to the research
questions and connect appropriate research literature, and to consider implications for
further research and practice. To remind the reader the research questions are:
• What are the leadership aspirations and career intentions of assistant
principals in government secondary schools?
• What development opportunities do they engage in? How effective are they
and what impact do they have?
• What is their own job satisfaction and how do they rate the job satisfaction of
principals in general?
• How do they rate their own preparedness for the principalship?
• How strategic is the school-based planning for leadership succession?
• What would need to change to increase their interest in the principalship?
Chapter 6 Discussion
Introduction
The purpose of this final chapter is to provide a summary of answers to the research
questions and connect appropriate research literature, and to consider implications for
further research and practice. To remind the reader the research questions are:
• What are the leadership aspirations and career intentions of assistant
principals in government secondary schools?
• What development opportunities do they engage in? How effective are they
and what impact do they have?
240
• What is their own job satisfaction and how do they rate the job satisfaction of
principals in general?
• How do they rate their own preparedness for the principalship?
• How strategic is the school-based planning for leadership succession?
• What would need to change to increase their interest in the principalship?
Research question 1: What are the leadership aspirations and career intentions of
Assistant Principals in Government Secondary Schools?
When the question about intention to apply for the principalship was raised with
participants, in both the survey and interviews, the unwilling and the uncertain
outnumber the willing at least four to one. In a study of Australian Catholic primary and
secondary schools (Neidhart & Carlin, 2003) the tendency was the same, but at a more
favourable ratio of two unwilling and uncertain to one willing. More recently,
(McKenzie, Rowley, Weldon, & Murphy, 2011) reported that 76% of secondary
assistant principals were unwilling or unsure, and only 24% of them were willing to
apply for a principal role within the following three years. In 2014 the results reported
approximately 34% prepared to apply and 64% unsure or definitely not (McKenzie,
Weldon, Rowley, Murphy, & McMillan, 2014) So studies at a local level and over time
at a national level report similar tendencies.
When inquiring about the reasons, the ‘willing’ wished to pursue the principalship
because of job satisfaction, the dynamic nature of and belief in the role and its
challenging nature achieve highest endorsement in this cohort. This is, overall, very
comparable to a similar study involving both primary and secondary deputy head
teachers in the UK (Stevens et al., 2005) . However, given the opportunity to respond
in an open ended way, the participants in this study highlighted further issues of
importance to them such as helping students succeed, and they acknowledge principals
who have influenced them to pursue the role. In all, seventeen new categories were
generated by asking an open-ended question providing a new richness of data and useful
detail. This indicates there is more to know about this question and encourages more
open-ended inquiry.
241
Participants who do not want to pursue the principalship most frequently point to the
stress and demands of the role and the impact on their personal responsibilities. When
the responses in this study were ranked and the rankings were compared with another
study (Stevens et al., 2005) with the result being a statistically significant positive
correlation. When asked in an open ended way, participants shared new (when
compared against the MORI model; (Stevens et al., 2005) more and nuanced reasons
for their lack of interest. These reasons cover a wide range of matters related to the
demands of the role, the lack of readiness, personal demands, lack of support and the
selection process. As mentioned in the literature review, some of these disincentives
have been previously identified in Australian literature from a range of different studies
and methodologies.
When asked to nominate the type of schools they were willing to lead, the assistant
principals in this study showed a preparedness to work in more challenging schools,
perhaps because they worked in an area with a range of disadvantaged schools. Very
few of these assistant principals preferred independent or Catholic schools, perhaps
because they had already had a significant stake in the government system, personally
and professionally and in this relatively disadvantaged area. This is important because
some international studies have put the view that harder to fill positions are in more
challenging areas and certain school types, especially faith-based schools (e.g. Howson,
2010). When given an open opportunity to describe the type of school they wanted to
work in, compared to the MORI study categories, participants in this study collectively
provided a range of more detailed descriptions of schools providing a list of school
characteristics that are meaningful to them. These more detailed school types can be
grouped around; school structures, location, current school state, community and fit
with self. The MORI choices include issues of location, current state of the school, but
do not take account of different school structures, community and candidate/school fit
explicitly. Again the participants in this study, who are potential aspirants, are showing
they consider matters in much more detail than the literature indicates to date. Further,
the asking of open ended questions elicited this more detailed data and understanding.
242
The career options of participants in this study are broadly similar to a comparable
international study (Stevens et al., 2005) in that most participants want to keep doing
what they are doing where they are doing it, but not all (Oliver, 2003). Second
preference for the participants was to seek a similar role in another school, whereas in
the MORI group it was to retire. A qualitative approach to this question within this
study yielded just one new potential destination, being the central office, and confirmed
the preference that most participants are currently satisfied with the role and location
they find themselves in.
Although there seems to be not a lot of available detailed data on the supply and
demand, key educators such as the President of a national body for educational leaders
(J. Watterson, 2014) write about a shortage and need to develop new leaders. The new
Australian Institute for Teaching and School Leadership documents also refer or allude
to a potential shortage (Australian Institute for Teaching and School Leadership, 2015;
B. Watterson, 2015).
Thompson (2013) who undertook a similar research project to this, but in primary
schools in part of the state of Victoria, concluded that, while the number of applicants
for principal vacancies had decreased, there was still sufficient interest to adequately fill
the principal vacancies that were arising. Our study does not generate the data to come
to such a conclusion, we do not have data on actual applications generated by our
participants’ career intentions, nor do we have data on the demand, that is the vacancies
to be filled or further still how adequately they were filled. Such research would be
useful and would best be carried out with access to selection panel reports and
members.
Research question 2: What development opportunities do they
engagein?Howeffectivearetheyandwhatimpactdotheyhave?
One of the key areas of this study was to examine the development of assistant
principals. Specifically the research questions related to development are: What
development opportunities do they engage in? How effective are they and what impact
243
do they have? The research focussed on systemic central and regional professional
learning programs. Compared to other research about the system at the time (P.
Matthews et al., 2007a, 2007b) which indicated high levels of participation in
professional learning programs, in the current study participation rates were not high,
except for one regional program focussed on financial management. Most participants
had only completed a few programs over the preceding three years. Participants were
not asked in detail about the reasons for their choices in professional development,
although from answers to a later questions, most chose in relation to their school
strategic plan priorities rather than their own individual professional learning needs and
priorities. Informally, it is understood that program quotas may play a role in limiting
participation. What was more of interest was the range of programs accessed,
departmental and non-departmental (47), and the range of providers (eight
organisations), plus another 11 programs undertaken by 19 participants where the
provider was unclear from the data collected.
Generally, programs were found to be useful by those undertaking them. When
undertaking programs, participants were able to identify the leadership dimensions
addressed, the methods used and the levels of impact achieved, although there was not
always unanimous agreement among participants about these.
Assistant principal participants in this study nominated a range of in-house activities
that are likely to prepare an assistant principal for the principalship, with actually
leading a project or area of the school, membership of school committees, acting in the
principal role and being mentored, being the most endorsed. This is consistent with
professional learning that draws from and is embedded in the local workplace (e.g. Bush
& Glover, 2003; Cowie & Crawford, 2007; L Darling-Hammond et al., 2007; L.
Darling-Hammond, LaPointe, Meyerson, Orr, & Cohen, 2007; Department of Education
and Early Childhood Development, 2008b; Donnelly, 1991; Hix et al., 2003; Johnson-
Taylor & Martin, 2007; LaPointe, Darling-Hammond, & Meyerson, 2007).
From previous literature, it seems that leadership professional development tends to
operate in an overall framework (e.g. Department of Education & Training, 2005;
Mason, 2007), including programs targeted at career stages (e.g. Gronn, 1999; L. J.
244
Matthews & Crow, 2003; Mulford, 2003) and using methods that include the key
elements of the Joyce and Showers model. The programs include elements such as
mentoring, work-embedded projects.
The movement to improve efforts in leadership development seems to be promoted by
concerns about supply quality and quantity, and includes calculations of likely demand
based on the number of current principals, their overall age profile, estimates of
retirement and retention rates. In Australia, all this prompts planning around what
leadership preparation is desired against what standards, for what purposes, matched to
whose needs, using what methods for what impact (e.g. Australian Institute for
Teaching and School Leadership, 2015, 2017; Jensen, Hunter, Ginnivan, & Sonneman,
2015; Jensen, Hunter, Lambert, & Clark, 2015; B. Watterson, 2015).
Watterson (2015) reviewed the principal leadership development environment as at
2015. Watterson’s description makes, and gives rise to, the following observations.
Since 2008 in Australia there has been development of programs for aspiring principals
in almost all states. These programs tend to incorporate relatively small groups,
mentoring and coaching, face-to-face and residential settings, online action learning,
peer learning, and internship/shadowing. The programs are focused on the aspirant as a
leader, the emerging expectations of the experience of understanding leadership in
learning, leading change and leading a community. The teaching methods try to
integrate theory and practice (Praxis). Self-nomination remains a dominant way to
access the programs. While impact is high in the rhetoric, and this is essential, it is early
days in the thinking about this as impact relies on participant feedback and employment
outcomes, rather than improvement in student learning. Programs continue to be run by
a range of providers, including sector systems, professional organisations, commercial
providers and research organisations. Watterson suggests that the motivation for
principal associations towards this activity remains the perceived shortage of applicants
for principal vacancies and contributing to developing leaders for the future. The focus
on these programs may not give due emphasis to the less formal but highly efficacious
means of developing leaders. This last point is emphasised when looking at a list ten of
programs nationally (B. Watterson, 2015, pp. 10-11), with AITSL reporting “There are
245
as few as 10 principal preparation programs in Australia that specifically focus on
developing aspiring leaders for the principalship” (Australian Institute for Teaching and
School Leadership, 2015, p. 1). It is important not to undervalue the leadership
development occurring in every school and by many organisations beyond the state
authority-driven programs, although this is often not captured in the research.
Principal preparation initiatives are occurring in various countries around the world.
(e.g.Gurr & Drysdale, 2017). Of particular note is the field research funded by the
Wallace Foundation in the USA, focusing on building partnerships between school,
school districts and universities to build productive leadership development pipelines
(e.g. Mendels, 2017; Turnbull, Riley, Arcaira, Anderson, & MacFarlane, 2013; Wallace
Foundation, 2018; Wang et al., 2018). In the UK, the work of the National College for
School Leadership continues, albeit in a different form, with different organisational
arrangements and somewhat less prolific.
Researchquestion3:Whatistheirownjobsatisfactionandhowdotheyratethejobsatisfactionofprincipalsingeneral?
Using the MSQ, consistent with other studies cited that used this questionnaire (e.g.
Chen et al., 2000; Taylor, 2007; Waskiewicz, 1999), assistant principals in this study
report relatively high levels of job satisfaction. Their intrinsic satisfaction was higher
than the extrinsic factors. Items in this study relating to dissatisfaction are pay, the
opportunity to instruct people, and working conditions, with these being consistent with
the findings of similar studies (e.g. Chen et al., 2000; Taylor, 2007).
Using a modified version of the MSQ, assistant principals rated the perceived job
satisfaction of principals as similar to their own with the exception of the competence of
supervisors (that is, they perceive their principal to be a better supervisor than they
perceive principals’ bosses to be), and the chance to tell people what to do, especially in
regard to teaching and learning They also perceived principals as getting relatively little
praise for doing a good job, and they rated the working conditions of principals
246
relatively lowly. The chances to advance in the job and policy implementation both
received relatively low ratings.
Contrary to the finding of Lacey (2002a) thesis, this study did not find a correlation
between assistant principal’s perception of the job satisfaction of principals, and their
own career intentions. It is possible that the perceived job satisfaction of principals does
influence the career intentions of assistant principals, but along with other influences all
of which vary for each individual over time.
Consistent with the findings of Lacey (2002a), the higher levels of satisfaction were in
the less visible intrinsic facets of the job, rather than those facets of the job that were
extrinsic and more visible to others which were often perceived as less satisfying. Lacey
calls for principals to share with others, especially potential aspirants, those less visible
rewards and sources of satisfaction to counter what is the more visible, less satisfying
facets of the role.
In more recent years there has been a new and important emphasis on principal health
and wellbeing. In Australia, annual sponsored surveys have highlighted key aspects of
the working life of school leaders (Riley, 2013a, 2013b, 2014a, 2014b, 2015a, 2015b,
2017a, 2017b, 2018). They have also provided a voice for these matters in the public
domain through associated media articles (e.g. Riley, 2013c). The professional bodies
sponsoring this research have used the research to put a credible case to improve the
working lives of school leaders which has led to the establishment of promising official
investigations and initiatives including system changes (Victorian Government
Department of Education and Training, 2016, 2017, 2018).
Researchquestion4:Howdotheyratetheirownpreparednessfortheprincipalship?
Using a quantitative approach, 73% of participants felt they were well or fairly well
prepared for the principalship, with 27% feeling not prepared. When asked an open
ended question at interview, those who felt prepared (31%) added qualifying comments
,as did those who did not feel prepared (24.4%), adding much richness and some
247
unexpected reasoning to their ratings. Two additional categories of potential aspirants
emerged, namely those who were really unclear and those that did not have a stable and
firmly formed view about the issue. Another group was inclined to be positive, but there
were significant qualifications to this, and they varied from person to person. These
results were quite similar to the MORI results (Stevens et al., 2005).
Participants in this study revealed a long listing of opportunities that had helped their
preparedness, headed by on-the-job leadership experience, support, professional
learning and personal factors. The list was long with many low incidence ideas that,
although mentioned by one or few, are potentially of relevance to many. Open-ended
responses also produced a list of hindrances to their preparedness with key themes of
knowledge deficits, insufficient preparation, lack of confidence, the nature of the
principal role and being too busy to prepare an application being the most numerous
mentioned.
The importance of the on-the-job experience was consistent with the literature as are
some of the hindrances. It may emerge that some of the things that help prepare for the
principalship can also be on the same continuum as those things that hinder (refer to
Tables 59 and 61): the nature of the principal role was reported as a hindrance, but
acceptance of the nature of the principal role was an important help to one participant;
the selection process was a source of confidence for som, but sapped the confidence of
others; personal factors were noted as a help and a hindrance; for some, the on the job
experience was positive in terms of preparation, however some reported as being too
busy to do this. These observations are consistent with cautions from the literature that
on the job experiences can undermine rather than develop an aspirant (Kotter, 1998),
may have no effect (Cole, 2004, 2008; Howard et al., 2009), or an unknown effect
(Levine, 2005b).
In this study, preparedness and willingness do not go hand in hand when it comes to the
aspirations for the principalship. Of the eight participants who felt well prepared, only
one was willing to apply for a principalship, and of the 26 who felt fairly well prepared,
only six were willing. So there is much more to being willing than just being prepared.
248
On this basis, just improving preparedness will not necessarily improve the number
willing to apply.
There are some indicators of useful areas for future research. For example, those who
inspire our participants included people they have worked for, professional development
activities and other school leaders, including colleague assistant principals. The
education department and universities were rated somewhat less frequently. Educational
leadership heads the areas for priority in the cohorts professional development plans,
followed by technical leadership, human leadership, symbolic leadership and cultural
leadership. As mentioned above, there are efforts in Australia (e.g. B. Watterson, 2015)
and around the world (Gurr & Drysdale, 2017) to deliver more effective and
coordinated support for developing leaders and school systems.
Researchquestion5:Howstrategicistheschool-basedplanningforleadershipsuccession?
Using information provided by participants, matched against a set of criteria, suggests
about one-fifth of schools are running effective employee development programs,
however over 60% of the schools need to improve, and 13% are doing little and are
advised to get started! These findings were confirmed by the open-ended questions.
In the view of participants, program types offered in the school are not always the most
effective, and the most effective program types (in-house and planned) are not always
offered. It would be interesting to see what change has occurred in the intervening ten
years. Professional learning providers could consider having more in-house and planned
professional learning and less off-site and unplanned activities. This would be
consistent with the advice of a range of experienced authorities in the area of
professional learning (e.g. B. Armstrong, 2007b; Cole, 2004, 2008; Emmitt, 2007;
Johnson, 2007)
About a third of participants had linked their professional development plans to their
career plans, whereas 90% had linked their professional development plan to their
school strategic plan. This would seem to be another area for potential research and
249
action should similar circumstances exist today. While priorities of a school plan are
important and staff members, especially senior staff members like assistant principals,
need to be equipped to lead and support them, an individual’s growth and development
will have its own priorities that will ideally be addressed through the professional
development plan, especially if that development meets individual needs and the wider
succession planning priorities of the school and the system.
The issue of succession planning was raised in Victorian education in the early 2000s
(Lacey, 2001, 2002a, 2002b). At that time, there was a reported lack of succession
planning and management, even though some schools had begun workforce planning, to
replace staff members who left for a variety of reasons. Following on from Lacey’s
research, several years later the framework for leadership development included specific
advice on the school-based succession planning and management (Department of
Education, 2007). Currently there is specific advice on succession planning for non-
school locations within the Victorian department
(https://www.education.vic.gov.au/hrweb/workm/Pages/successplanNSCH.aspx) and
the Bastow Institute has a well-developed program for the development of leaders,
including assistant principals, with programs containing e.g. school embedded projects,
internship and mentoring (https://www.bastow.vic.edu.au/professional-
learning/course?eventtemplate=27-unlocking-potential-principal-preparation). So, with
the data for this study being collected six years after Lacey’s research, there may be
cause for some optimism that approximately one-fifth are travelling well and 60% have
started by 2008. However, it begs the question to ask what is happening with succession
planning in schools now. This would be a worthy stocktake to conduct, as there appears
to be no published research available to report on this.
Also, as mentioned above, although the more recently emerging formal national and
state professional learning institutes are working to develop programs that coordinate
efforts, use best practice methods and link all players, including local school-based
efforts, it is important to keep firmly in mind the importance of embedding activities
into the actual work of leaders and the eventual goal of identifiable positive impact on
student learning.
250
Researchquestion6:Whatwouldneedtochangetoincreasetheirinterestintheprincipalship?
Participants in this study indicated a range of changes they would want to see to see to
increase their interest in the principalship. Most commonly they would need to see a
more supportive department. Improved salary is important to some and it will be
recalled that there was relatively low satisfaction with pay expressed on the MSQ.
Managing the expectations others have of principals is another major matter. Overall the
factors that potential aspirants would need to improve their interest include: support,
workload, attitudes and expectations of others, salary, workload support, more power,
development opportunities and team work.
Looking in more essential detail, the results from this study do overlap the summary of
relevant Australian literature of suggested changes to address the perceived shortage
(see section “Shortage of suitable candidates for the principalship?” in chapter three).
Some ideas shared by participants in this study matched the ideas from the literature,
but as has occurred elsewhere in this study, sometimes our participants have not
endorsed the literature, in some aspects they have, but they have also added further key
considerations. Figure 5 below compares and contrasts the findings of this study
reported in Table 75 & 76, with the summary this aspect of the literature in chapter
three. In Figure 5 the suggestions from the literature are represented by the shaded
boxes, they being; new models of shared leadership, re-thinking accountability,
rethinking the principalship, encourage leadership aspirations, better communicate
aspects of the principals role, review the selection processes, systematic succession
planning, availability of preferred support, think differently, more support from the
department, change of government and department policy and program development
processes, retention of existing leaders, stronger focus on career planning. Overlayed
onto those ideas are the responses from participants from this study, which can be found
in Table 75 & 76. Where there was clear overlap between the literature and this study,
the box is shaded (indicating, in this Figure, it is from the literature) and also
horizontally hatched (indicating, in this Figure, it is from both this research and the
251
Australian literature). It is noted that where there was some uncertainty about the
equivalence of ideas from the literature summary and this study, the boxes are left
unfilled. This indicates that the following broad themes were indicated from participants
in this study, but not the summary of Australian literature: manage the expectations by
others of the principal; more power; reduce the workload, teamwork; more development
opportunities; improved salary packaging; more support; more supportive department.
Each of these themes is defined by the nodes/codes that link to it.
It might be argued that there is in fact overlap between the literature and our findings
that is not acknowledged, for example, “more support from the department” and “more
supportive department” (see figure 5), but the view taken here is that this needs to be
established, given the definition of the theme via the coded responses to our interview
question.
All this shows there is more work to be done in confirming, identifying, defining,
exploring then usefully using knowledge about what needs to change, especially from
the perspective of potential aspirants.

252
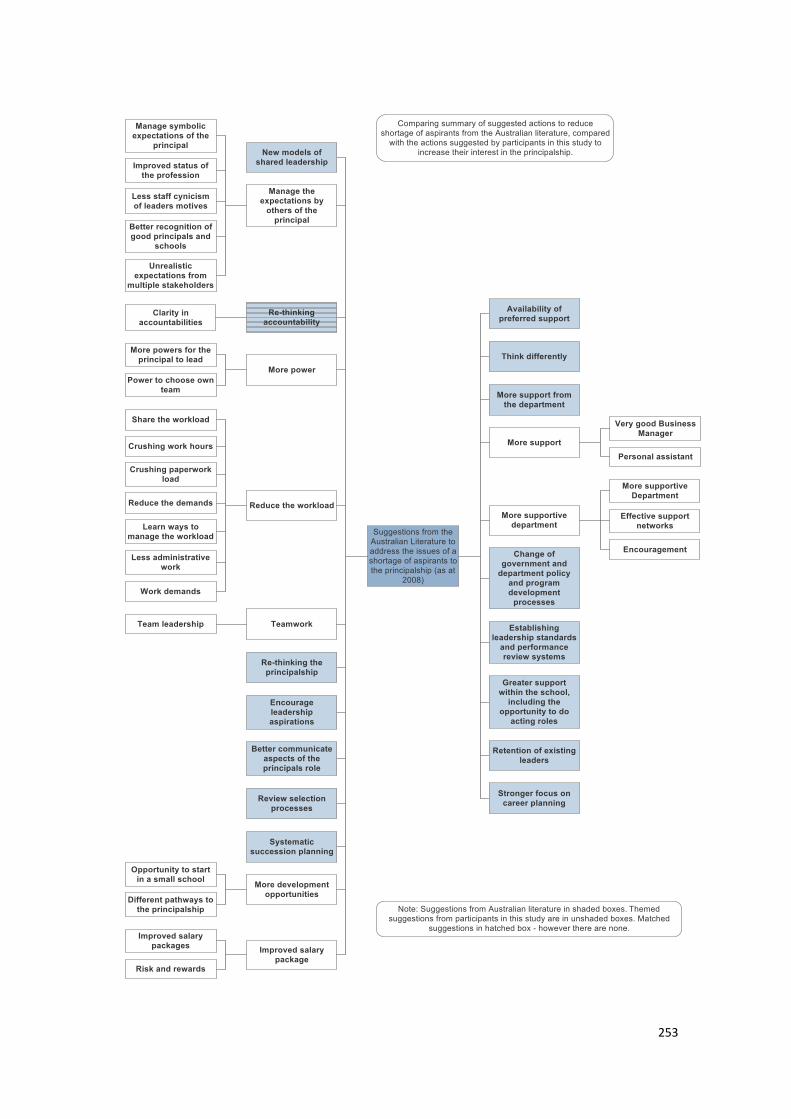
253
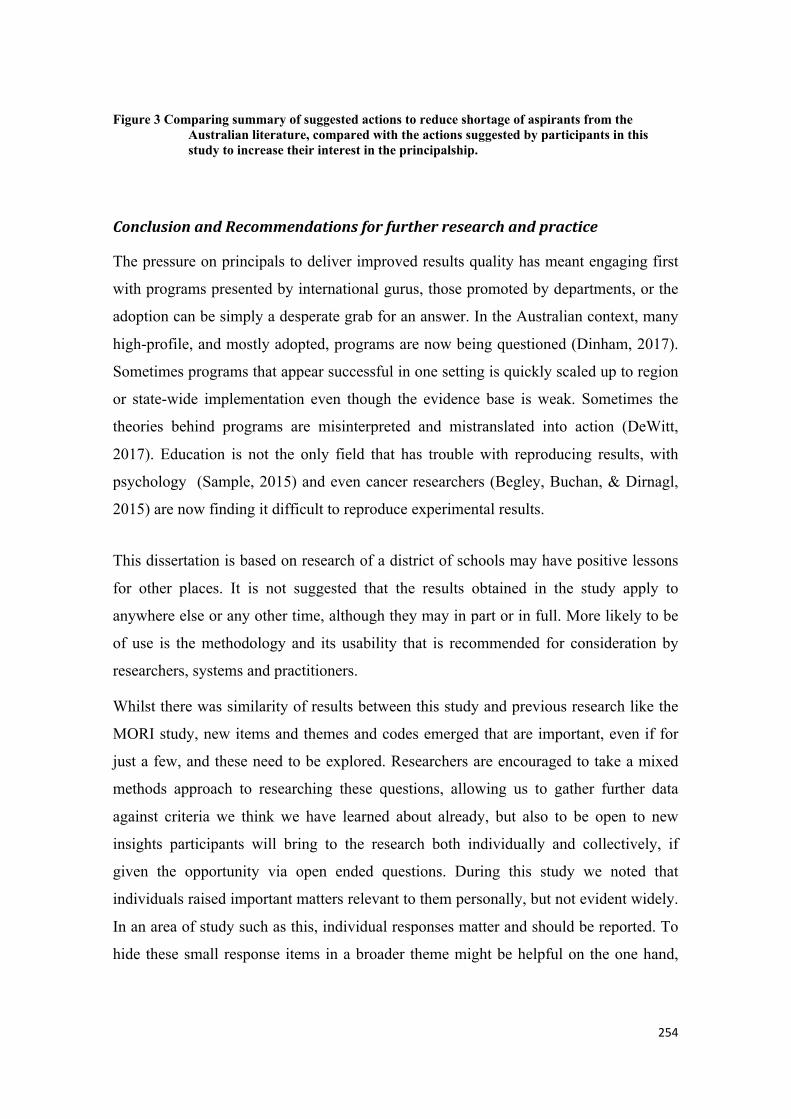
254
Figure 3 Comparing summary of suggested actions to reduce shortage of aspirants from the Australian literature, compared with the actions suggested by participants in this study to increase their interest in the principalship.
ConclusionandRecommendationsforfurtherresearchandpractice
The pressure on principals to deliver improved results quality has meant engaging first
with programs presented by international gurus, those promoted by departments, or the
adoption can be simply a desperate grab for an answer. In the Australian context, many
high-profile, and mostly adopted, programs are now being questioned (Dinham, 2017).
Sometimes programs that appear successful in one setting is quickly scaled up to region
or state-wide implementation even though the evidence base is weak. Sometimes the
theories behind programs are misinterpreted and mistranslated into action (DeWitt,
2017). Education is not the only field that has trouble with reproducing results, with
psychology (Sample, 2015) and even cancer researchers (Begley, Buchan, & Dirnagl,
2015) are now finding it difficult to reproduce experimental results.
This dissertation is based on research of a district of schools may have positive lessons
for other places. It is not suggested that the results obtained in the study apply to
anywhere else or any other time, although they may in part or in full. More likely to be
of use is the methodology and its usability that is recommended for consideration by
researchers, systems and practitioners.
Whilst there was similarity of results between this study and previous research like the
MORI study, new items and themes and codes emerged that are important, even if for
just a few, and these need to be explored. Researchers are encouraged to take a mixed
methods approach to researching these questions, allowing us to gather further data
against criteria we think we have learned about already, but also to be open to new
insights participants will bring to the research both individually and collectively, if
given the opportunity via open ended questions. During this study we noted that
individuals raised important matters relevant to them personally, but not evident widely.
In an area of study such as this, individual responses matter and should be reported. To
hide these small response items in a broader theme might be helpful on the one hand,
255
but could also obscure necessary and helpful detail in reporting the findings. There has
been a strong sense in conducting this research that pattern coding/themes risk being
more obscuring that enlightening.
Work on the impact of professional development on student learning remains important
work in this field. It will need to question and re-establish assumptions currently held,
or otherwise. At its best this will involve qualitative and quantitative research, and also
longitudinal models.
The general conclusion of all this is to accept that we are at a point in history, that there
is no reason to over-claim the state of knowledge, assume nothing, be patient as we
build knowledge over time with increasing confidence, and accept that we might be
entirely wrong.
Recommendationsforfutureresearch
I will address this around each of the broad research questions.
While career intentions of assistant principals are of interest, the issues regarding the
extent to which they predict future action needs much further exploratory research over
time. Understanding how people become school leaders, and the variables involved, are
too complex for quick answers, and dedicated research over time, maybe decades, is
needed. Further work needs to be done in producing a highly nuanced model that brings
together a prediction of local demand for leaders and likely supply, and any gap and
necessary action to appropriately fill the gap.
This research has demonstrated that we can get educators to tell us what professional
learning they have been involved in and what dimensions, methods and components for
impact have been present. But this remains a proxy for knowing if there is any real
impact. Pursuing truths about impact is the ‘holy grail’ of this work. Participants in this
research have given us many clues about what might be more productive methods of
professional learning, and which can be tested, even if that testing takes time. The
256
relatively rapid adoption of approaches such as professional standards, and particular
strategies such as mentoring, should not mean they avoid scrutiny and having their
validity tested through research. Current assumptions need to be tested and retested in a
variety of ways, and the strength of each link in the knowledge chain should not be
assumed.
Similar to the mysteries of if and how career intentions become reality, the mysteries of
preparedness and career intentions need further light and clarity. All aspects such as
how preparedness can be and is assessed, the reliability of those assessments,
maximising the benefits of things that help, and minimising hindrances, or turning
hindrances into helpful influences can all be the focus of productive research.
In the light of the emerging influential work in organisational health and wellbeing,
there is scope to question and focus on the value that further research on job satisfaction
can play.
Recommendationsforfuturepractice
My recommendations for practice are similar to the recommendations above. I advise
politicians and bureaucrats and practitioners to provide the encouragement and
resources of major funding and time for this research to be undertaken, including long
term large scale longitudinal methods, and that they fully and patiently engage in the
research and commit to a direction the research takes them.

257
258
References
Adair, J. E. (2005). How to grow leaders: The seven key principals of effective leadership development. London: Kogan Page Limited.
Allen, B., & Stacey, M. H. (1989). Developing instructional leaders for the future. The Clearing House, 62(8), 2. doi:10.1080/00098655.1989.10114094
Anderson, M. (1989). Training and selecting school leaders (pp. 34). Eugene, Oregon: ERIC Clearing house on Educational Management.
Anderson, M., Gronn, P., Ingvarson, L., Jackson, A., Kleinhenz, E., McKenzie, P., . . . Thornton, N. (2008). OECD Improving school leadership activity. Australia: Country background report. Retrieved from Canberra:
Anonymous. (1999). In hiring principals, schools face another struggle. Techniques: Making Education & Career Connections, 74(6), 1/2. Retrieved from https://ezp.lib.unimelb.edu.au/login?url=http://search.ebscohost.com/login.aspx?direct=true&db=tfh&AN=2454935&site=ehost-live
Armstrong, B. (2007a). Submission to parliamentary inquiry: Effective strategies for teacher professional learning (pp. 5). Melbourne: Victorian Parliament Education and Training Committee.
Armstrong, B. (2007b). Submission to the education and training committee, Victorian Parliament: Parliamentary inquiry into effective strategies for teacher professional learning. Melbourne.
Armstrong, L. (2004). The secondary assistant principal in the state of Texas: Duties and satisfaction. (Doctor of Education), University of Houston, Houston.
Australian Bureau of Statistics. (2009). Schools 2008. Retrieved from Canberra: www.abs.gov.au
Australian College of Educators. (2008). Submission to the Parliamant of Victoria Education and Training Committee (pp. 5). Melbourne: Parliament of Victoria Education and Training Committee.
Australian Council for Educational Research. (2008a, 28/07/2009). Technical Leadership: Thinking and Planning Strategically. 2008 evaluation survey summary. Retrieved from http://www.acer.edu.au/leadership-centre/tlc.html
Australian Council for Educational Research. (2008b, 28/07/2009). Technical Leadership: Thinking and planning strategically. Ways in which leadership aspirations changed. Retrieved from http://www.acer.edu.au/leadership-centre/tlc.html
Australian Education Union. (2007). Submission to the Education and Training Committee, Victorian Parliament: Parliamentary inquiry into effective strategies for teacher professional learning (pp. 19). Melbopurne: Victorian Parliament Education and Training Committee’s Inquiry into Effective Strategies for Teacher Professional Learning.
Australian Institute for Teaching and School Leadership. (2015). Preparing future leaders fact sheet. Retrieved from https://www.aitsl.edu.au/tools-resources/resource/preparing-future-leaders-fact-sheet
259
Australian Institute for Teaching and School Leadership. (2017). Leading for impact: Australian guidelines for school leadership development. Retrieved from Melbourne, Australia: https://www.aitsl.edu.au/lead-develop/build-leadership-in-Australian-schools/leading-for-impact-online
Australian Secondary Principals Association, Australian Heads of Independent Schools Association, & Catholic Secondary Principals Australia. (2007). "Making a difference .... counting the cost". Retrieved from
Barker, S. L. (1996). Market trends in school administration: The case in Washington state. Viewpoints. doi:ERIC Document ED 401 611
Barty, K., Thomson, P., Blackmore, J., & Sachs, J. (2005). Unpacking the issues: Researching the shortage of school principals in two states in Australia. Australian Educational Researcher, 32(3), 1-18.
Bazeley, P. (2007). Qualitative data analysis with NVivo. Los Angeles ; London: SAGE.
Bazeley, P., & Richards, L. (2000). The NVivo qualitative project book. London ; Thousand Oaks, Calif.: SAGE Publications.
Beatty, B. (2008). The hard work of human leadership: Courage, counter-intuition and the commitment to connectedness. In B. Beatty & P. Riley (Eds.), Willing to lead. Human leadersgip: Developing people (pp. 82). Melbourne: Department of Education and Early Childhood Development.
Beatty, B., & Gurr, D. (Eds.). (2009). Willing to Lead: Master in School Leadership. Melbourne: Department of Education and Early Childhood Development.
Begley, C. G., Buchan, A. M., & Dirnagl, U. (2015). Robust research: Institutions must do their part for reproducibility. Nature, 525(7567), 25-27. doi:10.1038/525025a
Bright, J. E. H., Pryor, R. G. L., Chan, E. W. M., & Rijanto, J. (2009). Chance events in career development: Influence, control and multiplicity. Journal of Vocational Behavior, 75, 12.
Brooking, K., Collins, G., Court, M., & O'Neill, J. (2003). Getting below the surface of the principal recruitment 'crisis' in New Zealand primary schools. Retrieved from http://www.questia.com/googleScholar.qst?docId=5001983604
Bryman, A. (2006). Mixed methods. London: SAGE. Bryman, A. (2008). Social research methods (3rd ed.). Oxford ; New York: Oxford
University Press. Bush, T., & Glover, D. (2003). School leadership: Evidence and beliefs (summary
report). Retrieved from Nottingham (UK): Byham, W. C., Smith, A. B., & Paese, M. J. (2002). Grow your own leaders: How to
identify, develop, and retain leadership talent. Upper Saddle River, NJ: Prentice Hall.
Caldwell, B., & Hayward, D. (1998). The future of schools. London: Falmer Press. Canavan, K. (2001). SOS! Leaders wanted for schools. The Catholic Weekly, 3.
Retrieved from http://www.catholicweekly.com.au/01/jul/1/story_11.html Caracelli, V. J., & Greene, J. C. (1997). Advances in mixed-method evaluation : The
challenges and benefits of integrating diverse paradigms. San Fancisco, Calif.: Jossey-Bass.
Charan, R., Noel, J. L., & Drotter, S. J. (2001). The leadership pipeline : how to build the leadership-powered company. San Francisco: Jossey-Bass.
260
Chen, K.-L. (2000). Job satisfaction among high school assistant principals in the state of Mississippi. (Doctor of Philosophy in Education), Mississippi State University. Retrieved from http://proquest.umi.com.ezp.lib.unimelb.edu.au/pqdweb?did=731962771&sid=3&Fmt=2&clientId=14623&RQT=309&VName=PQD
Chen, K.-L., Blendinger, J., & McGrath, V. (2000). Job satisfaction among high school assistant principals. Paper presented at the Annual Meeting of the Mid-South Educational Research Association, Bowling Green, KY.
Ciampa, D., & Watkins, M. (2001). The Successor's Dilemma. In H. B. Review (Ed.), Harvard Business Review on What Makes a Leader (pp. 25). Boston: Harvard Business School Publishing.
Cole, P. (2004). Professional development : A great way to avoid change. Jolimont, Vic.: Incorporated Association of Registered Teachers of Victoria.,.
Cole, P. (2008). Submission to the Education and Training Committee, Victorian Parliament: Parliamentary inquiry into effective strategies for teacher professional learning. Melbourne Retrieved from http://www.parliament.vic.gov.au/images/stories/committees/etc/PL_Submissions/cole270308.pdf.
Cowie, M., & Crawford, M. (2007). Principal preparation: Still an act on faith? School Leadership and Management, 27(2), 18.
Cranston, N., Tromans, C., & Reugebrink, M. (2004). Forgotten leaders: What do we know about the deputy principalship in secondary schools? International Journal of leadership in Education, 7(3), 225-242.
Creswell, J. W. (2008). Educational research : Planning, conducting, and evaluating quantitative and qualitative research (3rd ed.). Upper Saddle River, N.J.: Pearson Merrill Prentice Hall.
Creswell, J. W. (2009). Research design : Qualitative, quantitative, and mixed methods approaches (3rd ed.). Thousand Oaks, Calif.: Sage Publications.
Creswell, J. W., & Plano Clark, V. L. (2007). Designing and conducting mixed methods research. Thousand Oaks, Calif.: SAGE Publications.
d'Arbon, T. (2006). Career aspirations of potential applicants for principals of catholic schools: An Australian perspective. Catholic education: A journal of inquiry & practice, 10(1), 15.
d'Arbon, T., Duignan, P., & Duncan, D. (2002). Planning for future leadership of schools: An Australian study. Journal of Educational Administration, 40(5), 18.
Darling-Hammond, L., LaPointe, M., Meyerson, D., & Orr, M. (2007). Preparing school leaders for a changing world: Executive summary. Retrieved from Stanford, California:
Darling-Hammond, L., LaPointe, M., Meyerson, D., Orr, M. T., & Cohen, C. (2007). Preparing School Leaders for a Changing World: Lessons from Exemplary Leadership Development Programs. Retrieved from Stanford, CA: http://seli.stanford.edu or http://srnleads.org
De Vaus, D. A. (1995). Surveys in social research (4th ed.). North Sydney: Allen & Unwin.
261
DeCuir-Gunby, J. T. (2008). Mixed methods research in the social sciences. In J. Osborne (Ed.), Best practices in quantitative methods (pp. 12). Thousand Oaks, California: Sage Publications Inc.
Denscombe, M. (2003). The good research guide for small-scale social research projects (2nd ed.). Maidenhead, England ; Philadelphia, Pa.: Open University Press.
Denscombe, M. (2007). The good research guide : For small-scale social research projects (3rd ed.). Maidenhead, England ; New York: Open University Press.
Department of Education. (2007). The Developmental Learning Framework for School Leaders. Department of Education.
Department of Education & Training. (2005). Professional learning in effective schools: The seven principles of highly effective professional learning. Melbourne: Department of Education & Training Retrieved from http://www.eduweb.vic.gov.au/edulibrary/public/teachlearn/teacher/ProfLearningInEffectiveSchools.pdf.
Department of Education and Early Childhood Development. (2007). Learning to Lead Effective Schools: professional learning for current and aspirant leaders. Retrieved from http://www.eduweb.vic.gov.au/edulibrary/public/staffdev/schlead/LTLES_handbook07_v2_p2.pdf
Department of Education and Early Childhood Development. (2008a). Blueprint for Education and Early Childhood Development. Retrieved from http://www.eduweb.vic.gov.au/edulibrary/public/commrel/policy/Blueprint2008/blueprint-final-2008.pdf
Department of Education and Early Childhood Development. (2008b). Guidelines for Principal Class Performance and Development 2008. Retrieved from http://www.eduweb.vic.gov.au/edulibrary/public/teachlearn/leader/pcpd-guidelines-v1-20080219adobe.pdf.
Department of Education and Early Childhood Development. (2008c). Learning to lead effective schools: Professional learning for current and aspirant leaders. Melbourne: Department of Education and Early Childhood Development,.
Department of Education and Early Childhood Development. (2009a). Bastow Institute of Educational Leadership. Retrieved from http://www.education.vic.gov.au/proflearning/bastowinstitute/default.htm
Department of Education and Early Childhood Development. (2009b). Flagship strategy 3: Building leadership capacity. Retrieved from http://www.education.vic.gov.au/about/directions/blueprint1/fs3.htm#1
Department of Education and Early Childhood Development. (2009c). Learning to lead effective schools. Melbourne. Australia: Department of Education and Early Childhood Development.
Department of Education and Early Childhood Development. (2009d, January 30 2009). Like school groups. Retrieved from http://www.education.vic.gov.au/management/schoolimprovement/performancedata/schoolgroups.htm
Department of Education and Early Childhood Development. (2009e, January 27, 2009). Percentile/SFO Comparison Charts. Retrieved from
262
http://www.education.vic.gov.au/management/schoolimprovement/performancedata/charts.htm
Department of Education and Early Childhood Development. (2009f, September 15, 2009). Student Family Occupation Prep-12. Retrieved from http://www.education.vic.gov.au/management/srp/budget/ref011/
Department of Education and Early Childhood Development. (2009g). Summary Statisitics for Victorian Schools July 2009. Retrieved from Melbourne, Australia: http://www.education.vic.gov.au/about/publications/newsinfo/default.htm
Department of Education and Early Childhood Development. (2009h). Summary Statistics Victorian Schools. February 2009. Retrieved from Melbourne, Australia:
Department of Education and Early Childhood Development. (2010a, February 12, 2010). Bricks and mortar: Facilities management programs. Retrieved from http://www.education.vic.gov.au/proflearning/regional/faciliti.htm
Department of Education and Early Childhood Development. (2010b, March 19, 2010). Dollars and sense: Financial management for school leaders. Retrieved from http://www.education.vic.gov.au/proflearning/regional/dlrsens.htm
Department of Education and Early Childhood Development. (2010c, April 28, 2010). Principal class performance and development. Retrieved from http://www.education.vic.gov.au/proflearning/schoolleadership/principalpd.htm
Department of Education Victoria. (2007). The Developmental Learning Framework for School Leaders. Retrieved from Melbourne:
Department of Industry and Commerce. (1977). Planning for management succession. Australian government publishing service.
DeWitt, P. (2017). Misinterpreting the Growth Mindset: Why We're Doing Students a Disservice [Web log post]. Retrieved from http://blogs.edweek.org/edweek/finding_common_ground/2017/06/misinterpreting_the_growth_mindset_why_were_doing_students_a_disservice.html
Dillman, D. A. (1991). The Design and Administration of Mail Surveys. Annual Review of Sociology, 17, 25.
Dillman, D. A. (2006). Mail and Internet surveys : the tailored design method (Updated ed.). Hoboken, NJ: John Wiley.
Dinham, S. (2017). The lack of an evidence base for teaching and learning; fads, myths, legends, ideology and wishful thinking. Professional Voice, 11(3), 9.
Dodds, R. (2007, October 25). [Correspondence: Reply to request for information from Raylene Dodds, Assistant General Manager, Department of Education and Early Childhood Development].
Donnelly, J. (1991). A handbook for deputy heads in schools. London: Kogan Page Limited.
Donnelly, J. (1999). A handbook for deputy heads in schools (2nd ed.). London: Kogan Page.
Dorminy, F., & Brown, S. (1982). Job satisfaction of high school assistant principals. Perceptual and Motor Skills, 55(2), 4.
Draper, J., & McMichael, P. (2003). The rocky road to headship. Australian Journal of Education, 47(2), 12.
263
Elmore, R. (2000). Building a new structure for school leadership, 40. Retrieved from http://www.shankerinstitute.org/Downloads/building.pdf
Emmitt, M. (2007). A response to the parliament of Victorian Education and Training Committee regarding the parliamentary inquiry into effective strategies for teacher professional learning (pp. 3). Melbourne: Parliament of Victoria Education and Training Committee.
Fink, D. (2008). Identifying future leaders with potential. Principal Matters(74), 4. Fink, D., & Brayman, C. (2006). School leadership succession and the challenges of
change. Educational Administration Quarterly, 42(1), 62-89. Forsyth, J. M., Protheroe, N., O'Neil, G. R., Geraci, J., Terhanian, G., Malach, C., . . .
Edelstein, K. (1998). Is there a shortage of qualified candidates for openings in the principalship? Retrieved from Arlington, VA: www.naesp.org/client_files/shortage-98.pdf
Funderberg, D. L., & Kapes, J. T. (1997). Work values and job satisfaction of Arkansas business educators in secondary systems and community/technical colleges. Paper presented at the Annual Meeting of the Southwest Educational Research Association, Austin, Texas. http://www.eric.ed.gov/PDFS/ED404494.pdf
Gronn, P. (1999). The making of educational leaders. London: Cassell. Gronn, P. (2003a). The new work of educational leaders : Changing leadership practice
in an era of school reform. London: Paul Chapman. Gronn, P. (2003b). Special issue: Principal recruitment introduction by the guest editor:
A matter of principals. Australian Journal of Education, 47(2), 3. Gronn, P., & Lacey, K. (2004a). Positioning oneself for leadership: Feelings of
vulnerability among aspirant school principals. School Leadership & Management, 24(4), 405 - 424.
Gronn, P., & Lacey, K. (2004b). The principal puzzle. Teacher, 34-37. Gronn, P., & Lacey, K. (2006). Cloning their own: Aspirant principals and the school-
based selection game. Australian Journal of Education, 50(2), 102. Gronn, P., & Rawlings-Sanaei, F. (2003). Principal recruitment in a climate of
leadership disengagement. Australian Journal of Education, 47(2), 172. Groves, R. M., Fowler, F. J., Couper, M. P., Lepkowski, J. M., Singer, E., &
Tourangeau, R. (2004). Survey methodology. Hoboken, NJ: John Wiley. Gurr, D., & Drysdale, L. (2017). Bastow Aspiring Leadership Accreditation Delphi
Report. Melbourne Graduate School of Education. Melbourne, Australia. Guskey, T. R. (2000). Evaluating professional development. Thousand Oaks, Calif.:
Corwin Press, Inc. Guskey, T. R., & Sparks, D. (1991). What to consider when evaluating staff
development. Educational Leadership, 49(3), 4. Hammond, J., Muffs, M., & Sciascia, S. (2001). The leadership crisis: Is it for real?
Principal, 81(2), 28-29. Hardy, M., & Bryman, A. (2009). Introduction: Common threads among techniques of
data analysis. In M. Hardy & A. Bryman (Eds.), The Handbook of Data Analysis (pp. 13). London: SAGE Publications Ltd.
Harman, G., Beare, H., & Berkeley, G. (1991). Restructuring school management: recent administrative reorganisation of public school governance in Australia. Canberra: Australian College of Education.
264
Harris, A., Muijs, D., & Crawford, M. (2003). Deputy and assistant heads: Building leadership potential. Retrieved from Nottingham:
Hart, A. W. (1993). Principal succession : Establishing leadership in schools. Albany: State University of New York Press.
Hartle, F., & Thomas, K. (2003). Growing tomorrow's school leaders: The challenge (full report). Retrieved from Nottingham:
Herzberg, F., Mausner, B., & Snyderman, B. B. (1959). The motivation to work (Second ed.). New York: John Wiley & Sons.
Hirschfeld, R. R. (2000). Does revising the intrinsic and extrinsic subscales of the Minnesota satisfaction questionnaire short form make a difference? Educational and Psychological Measurement, 60(2), 16.
Hix, B., Wall, S., & Frieler, J. (2003). From the Ground Up: Growing Your Own Principals. Principal Leadership, 3(6), 4. doi:Pro Quest ID 288930001
Howard, G., Kotsiros, N., Dixon, M., Elasmar, N., Finn, B., Hall, P., . . . Herbert, S. (2009). Inquiry into effective strategies for teacher professional learning. (169). Melbourne: Victorian Government Printer Retrieved from http://www.parliament.wa.gov.au/intranet/libpages.nsf/WebFiles/Whats+new+other+parls+Vic+teacher+learning/$FILE/vic+teacher+learning.pdf.
Howson, J. (1998). Annual survey: Senior staff in schools fourth report. Retrieved from Howson, J. (2007). Thirteenth annual report. The state of the labour market for senior
staff in schools in England and Wales 2006-2007. Retrieved from Oxford: Howson, J. (2008). 14th Annual report. The state of the labour market for senior staff in
schools in England and Wales. Retrieved from London: Howson, J. (2010). 25th Annual survey of senior staff appointments in schools across
England and Wales. Retrieved from London: http://www.naht.org.uk/EasySiteWeb/getresource.axd?AssetID=18390
James, C., & Whiting, D. (1998). The career perspectives of deputy headteachers. Educational Management Administration and Leadership, 26(4), 353 - 362. doi:10.1177/0263211X98264002
Jensen, B., Hunter, A., Ginnivan, L., & Sonneman, J. (2015). Evaluating you principal preparation programs: Research Report. Retrieved from Melbourne: https://www.aitsl.edu.au/docs/default-source/default-document-library/60398-evaluating-your-school-principal-preparation-programs_v15-final.pdf?sfvrsn=90a9ec3c_0
Jensen, B., Hunter, A., Lambert, T., & Clark, A. (2015). Aspiring principal preparation. Retrieved from Melbourne: https://www.aitsl.edu.au/tools-resources/resource/insights---aspiring-principal-preparation
Johnson-Taylor, C., & Martin, M. B. (2007). Next in line: Assistant principals for the principalship. Principal Leadership, 7(8), 4.
Johnson, N. (2007). Submission to the Education and Training Committee, Victorian Parliament: Parliamentary inquiry into effective strategies for teacher professional learning. Melbourne: Education and Training Committee, Victorian Parliament: Parliamentary Inquiry into Effective Strategies for Teacher Professional Learning Retrieved from http://www.parliament.vic.gov.au/images/stories/committees/etc/PL_Submissions/johnson270308.pdf.
265
Joyce, B., & Showers, B. (1980). Improving Inservice Training: The Messages of Research. Educational Leadership, 6.
Kirkpatrick, D. (1998). Evaluating training programs: the four levels (Second ed.). San Francisco: Berrett-Koehler Publishers, Inc.
Kosky, L. (2003). Blueprint for government schools. Minister's foreword. Retrieved from http://www.sofweb.vic.edu.au/edulibrary/public/teachlearn/student/Foreward_Blueprint.pdf
Kotter, J. P. (1998). What leaders really do. In H. B. Review (Ed.), Harvard Business Review on Leadership (pp. 37 - 60). Boston: Harvard Business School Press.
Lacey, K. (2001). Succession planning in education. Hot Topics(4), 2. Lacey, K. (2002a). Factors that impact on principal-class leadership aspirations.
(Thesis (Ph D )), University of Melbourne, Dept. of Education Policy and Management, 2003. Retrieved from http://eprints.unimelb.edu.au/archive/00000811/
Lacey, K. (2002b). Understanding principal class leadership aspirations: Policy and planning implications. Retrieved from Melbourne:
Lacey, K. (2003). Succession planning in education. Leading and Managing, 9(2), 192 - 195.
Lacey, K. (n.d.). Succession planning for school leadership. Retrieved from http://www.beecoswebengine.org/servlet/Web?s=1575738p=ARTICLES_BTLShoe
Lacey, K., & Gronn, P. (2004). Aspiring to the principalship? Retrieved from Clayton, Victoria:
Lacey, K., & Gronn, P. (2005). 'I'd rather drive a different bus'. Retrieved from Clayton, Victoria: http://qtu.asn.au/gronnreport.pdf
LaPointe, M., Darling-Hammond, L., & Meyerson, D. (Eds.). (2007). Preparing school leaders for a changing world: Case studies of exemplary programs. Stanford: Stanford Educational Leadership Instiute.
Lashway, L. (2003). Finding leaders for hard-to-staff schools Clearinghouse on educational policy and management (pp. 8): ERIC Digest.
Lashway, L. (2006). Developing School Leaders. In S. C. Smith & P. K. Piele (Eds.), School Leadership. Handbook for Excellence in Student Learning (pp. 486). Thousand Oaks. California: Corwin Press.
Leeuw, E. D. d., Hox, J. J., Dillman, D. A., & European Association of Methodology. (2008). International handbook of survey methodology. New York: Lawrence Erlbaum Associates.
Levine, A. (2005a). Educating school leaders. Retrieved from Washington DC: http://www.edschools.org/pdf/Final313.pdf
Levine, A. (2005b). EDUCATING SCHOOL LEADERS. Retrieved from Lewins, A., & Silver, C. (2007). Using software in qualitative research : a step-by-step
guide. Los Angeles ; London: SAGE. Light, P. C. (2005). The Four Pillars of High Performance: How Robust Organizationa
Achieve Extraordinary Results. New York: McGraw-Hill. Livingston, M. (1998). Career paths: Selected attitudes of new rural school
administrators. Education(3), 371.
266
Locke, E. A. (1976). Nature and causes of job satisfaction. In M. D. Dunnette (Ed.), Handbook of industrial and organizational psychology (pp. 1297 - 1349). Chicago: Rand McNally College Publishing Company.
Lovely, S. (1999). Developing leaders from within. Educational Leadership, 29(1). Lovely, S. (2004a). Leadership forecasting: the development and selection of school
leaders starts with the end in mind by considering future vacancies, both known and unknown. Leadership, 34(1), 17.
Lovely, S. (2004b). Staffing the principalship: Finding, coaching, and mentoring school leaders. Alexandria VA: Association for Supervision and Curriculum Development (ASCD), 1703 North Beauregard Street, Alexandria, VA 22311. Tel: 800-933-2723 (Toll Free); e-mail: [email protected].
Lunenburg, F. C., & Irby, B. J. (2008). Writing a Successful Thesis or Dissertation. Thousand Oaks, California: Corwin Press.
Macquarie Essential Dictionary. (2006) (4th ed., Vols. 1). Sydney: Macquarie Dictionary Publishers Pty Ltd.
Malone, B. C., & Caddell, T. A. (2000). A crisis in leadership. Where are tomorrow's principals? The Clearing House, 73(3), 3.
Marshall, C. (1992). The assistant principal : Leadership choices and challenges. Newbury Park, Calif.: Corwin Press.
Marshall, C. (1993). The unsung role of the career assistant principal. Reston, Va: Nathional Association of Secondary School Principals.
Marshall, C. (Ed.) (1990). The role of the assistant principal. Bloomington, IN: Phi Delta Kappan.
Marshall, C., & al, e. (1993). Caring as career: An alternative model for education administration. Paper presented at the Annual Meeting of the American Educational Research Association, Atlanta, GA.
Marshall, C., & Hooley, R. M. (2006). The assistant principal : Leadership choices and challenges (2nd ed.). Thousand Oaks, Calif.: Corwin Press.
Marshall, C., Mitchell, B., Gross, R., & Scott, D. (1992). The assistant principalship: A career position or a stepping- stone to the principalship? NASSP Bulletin, 76(540), 80-88. doi:10.1177/019263659207654014
Marshall, M. (2004). Headteachers must nurture next generation of school leaders. Education (14637073)(159), 4.
Mason, C. (2007). An assistant principal's guide ... into the fire. How to prepare for and survive the position. Lanham, Maryland: Rowman & Littlefield Education.
Matthews, L. J., & Crow, G. (2003). Being and becoming a principal. Boston: Allyn and Bacon.
Matthews, P., Moorman, H., & Nusche, D. (2007a). School leadership development strategies: Building leadership capacity in Victoria, Australia. Retrieved from Paris:
Matthews, P., Moorman, H., & Nusche, D. (2007b). System-wide leadership development in Victoria. Retrieved from http://www.oecd.org/dataoecd/22/6/39632354.pdf
McAdams, R. P. (1998). Who'll run the schools? The coming administrator shortage. The American School Board Journal, 28(8), 3.
267
McKenzie, K. B., Christman, D. E., Hernandez, F., Fierro, E., Capper, C. A., Dantley, M., . . . Scheurich, J. J. (2008). From the Field: A Proposal for Educating Leaders for Social Justice. Educational Administration Quarterly, 44(1), 28.
McKenzie, P. (2008). Leadership. Is there a looming shortage? Professional Educator, 7(4), 6.
McKenzie, P., Kos, J., Walker, M., & Hong, J. (2008). Staff in Australia's schools 2007. Retrieved from Canberra:
McKenzie, P., Mulford, B., & Anderson, M. (2007). School leadership and learning: An Australian overview. Paper presented at the Annual Conference of the Australian Council for Educational Research, Melbourne.
McKenzie, P., Rowley, G., Weldon, P., & Murphy, M. (2011). Staff in Australia's schools 2010: Main report of the survey. Retrieved from Melbourne, Australia:
McKenzie, P., Weldon, P., Rowley, G., Murphy, M., & McMillan, J. (2014). Staff in Australia's schools 2013: Main report of the survey. Retrieved from Melbourne, Australia:
Mendels, P. (2017). Perpsective: Building Principal Pipelines: A Job That Urban Districts Can Do. Retrieved from New York, NY: https://www.wallacefoundation.org/knowledge-center/pages/perspective-building-principal-pipelines-update.aspx
Miles, M. B., & Huberman, A. M. (1994). Qualitative data analysis : an expanded sourcebook (2nd ed.). Thousand Oaks: Sage Publications.
Mulford, B. (2003). School leaders: Changing roles and impact on teacher and school effectiveness Retrieved from http://www.oecd.org/dataoecd/61/61/2635399.pdf
Muller, D., & Saulwick, I. (2004). The privilege and the price: A study of principal class workload and its impact on health and wellbeing final report. Retrieved from Melbourne, Australia:
Neidhart, H., & Carlin, P. (2003). To apply or not to apply: Incentives and disincentives of principalship. Paper presented at the Hawaii International Conference on Social Sciences, Hawaii.
Nevo, B. (1985). Face validity revisited. Journal of Educational Measurement, 22(4), 7. Normore, A. H. (2004). Socializing school administrators to meet leadership challenges
that doom all but the most heroic and talented leaders to failure. International Journal of leadership in Education, 7(2), 107-125.
Normore, A. H. (2006). Leadership recruitment and selection in school districts: Trends and issues. The Journal of Educational Thought, 40(1), 41.
Normore, A. H. (2007). A continuum approach for developing leaders in an urban district. Journal of Research on Leadership Education, 2(3), 45.
OECD. (2006). Schooling for Tomorrow Australia (Victoria): Using Future Thinking tools to build school an system thinking and leadership, May 2006. Retrieved from http://www.oecd.org/dataoecd/57/42/41256259.pdf
Oliver, R. (2003). Assistant principal job satisfaction and desire to become principals. Education Leadership Review, 4(2), 9. doi:ERIC# EJ671422
Pallant, J. (2007). SPSS survival manual : a step-by-step guide to data analysis using SPSS for Windows (Version 15) (3rd ed.). Crows Nest, N.S.W.: Allen & Unwin.
268
Petzko, V. N., Clark, D. C., Valentine, J. W., Hackmann, D. G., Norn, J. R., & Lucas, S. E. (2002). Leaders and leadership in middle level schools. NASSP Bulletin, 86(631), 13. doi:10.1177/019263650208663102
Pike, B. (2008). Blueprint for early childhood development and school reform: School reform discussion paper. Department of Education and Early Childhood Development - Victoria
Plano Clark, V. L., & Creswell, J. W. (2008). The mixed methods reader. Thousand Oaks, California: Sage Publications Inc.
Pounder, D., Galvin, P., & Shepherd, P. (2003). An analysis of the United States educational administrator shortage. Australian Journal of Education, 47(2), 13.
Powell, H., Mihalas, S., Onwuegbuzie, A. J., Suldo, S., & Daley, C. E. (2008). Mixed methods research in school psychology: A mixed methods investigation of trends in the literature. Psychology in the Schools, 45(4), 19.
Pryor, R. G. L., & Bright, J. E. H. (2007). Applying chaos theory to careers: Attraction and attractors. Journal of Vocational Behavior, 71(3), 21. doi:10.1016/j.jvb.2007.05.002.
Rafferty, A. E., & Griffin, M. A. (2009). Job satisfaction in organizational research. In D. A. Buchanan & A. Bryman (Eds.), The Sage handbook of organizational research methods (pp. 196 - 212). Los Angeles ; London: SAGE.
Richards, L. (1999). Using NVivo in qualitative research. Thousand Oaks, Calif. ; London: SAGE.
Richards, L. (2005). Handling qualitative data : a practical guide. London: Sage. Richards, L., & Morse, J. M. (2007). Readme first for a user's guide to qualitative
methods (2nd ed.). Thousand Oaks: Sage Publications. Riley, P. (2013a). The Australian Principal Health and Wellbeing Survey 2011 Data
Executive Summary Final Report. Retrieved from Clayton, Australia: https://www.principalhealth.org/au/reports.php
Riley, P. (2013b). The Australian Principal Health and Wellbeing Survey 2011 Data Final Report. Retrieved from Clayton, Australia: https://www.principalhealth.org/au/reports.php
Riley, P. (2013c). Bullies, threats and violence: who would want to be a school principal? The Conversation. Retrieved from https://theconversation.com/bullies-threats-and-violence-who-would-want-to-be-a-school-principal-16263
Riley, P. (2014a). Australian Principal Occupational Health, Safety & Wellbeing Survey 2011 – 2014 Data. Retrieved from Fitzroy, Australia: https://www.principalhealth.org/au/reports.php
Riley, P. (2014b). Australian Principal Occupational Health, Safety & Wellbeing Survey EXECUTIVE SUMMARY 2011 – 2014 Data. Retrieved from Fitzroy, Australia: https://www.principalhealth.org/au/reports.php
Riley, P. (2015a). The Australian Principal Occupational Health, Safety and Wellbeing Survey 2015. Retrieved from Fitzroy, Australia: https://www.principalhealth.org/au/reports.php
Riley, P. (2015b). The Australian Principal Occupational Health, Safety and Wellbeing Survey 2015 Executive Summary. Retrieved from Fitzroy, Australia: https://www.principalhealth.org/au/reports.php
269
Riley, P. (2017a). The Australian Principal Occupational Health, Safety and Wellbeing Survey 2016 Data. Retrieved from Fitzroy, Australia: https://www.principalhealth.org/au/reports.php
Riley, P. (2017b). The Australian Principal Occupational Health, Safety and Wellbeing Survey Executive Summary 2016 Data. Retrieved from Fitzroy, Australia: https://www.principalhealth.org/au/reports.php
Riley, P. (2018). The Australian Principal Occupational Health, Safety and Wellbeing Survey 2017 Data. Retrieved from Fitzroy, Australia: https://www.principalhealth.org/au/reports.php
Rothwell, W. J. (2000). Effective succession planning: Ensuring leadership continuity and building talent from within: AMACOM.
Rothwell, W. J. (2001). Effective succession planning. Ensuring leadership continuity and building talent from within (Second ed.). New York: AMACOM.
Rothwell, W. J. (2007). Ten key steps to effective succession planning. Halogen Blog, (March 14 2007), 1. Retrieved from http://www.hologensoftware.com/print/blog/halogen_03140704.php
Rothwell, W. J. (2008). Next Generation Talent Management. A Global Challenge. HRM Review, 7.
Rothwell, W. J., Jackson, R. D., Knight, S. C., Lindholm, J. E., Wang, W. A., & Payne, T. D. (2005). Career planning and succession management. Developing your organization's talent-for today and tomorrow. Westport, Connecticut, USA: Praeger.
Rothwell, W. J., & Kazanas, H. C. (1993). The complete AMA guide to management development : training, education, development. New York: AMACOM, American Management Association.
Rothwell, W. J., & Kazanas, H. C. (1999). Building in-house leadership and management development programs : their creation, management, and continuous improvement. Westport, Conn. : Quorum Books.
Rothwell, W. J., & Kazanas, H. C. (2004). Improving on-the-job training. How to establish and operate a comprehensive OJT program (Second ed.). San Francisco: Pfeiffer (John Wiley & Sons, Inc.).
Roza, M., Celio, M. B., Harvey, J., & Wishon, S. (2003). A matter of definition: Is there truly a shortage of school principals? Retrieved from
Sammons, P., Hillman, J., & Mortimore, P. (1995). Key characteristics of effective schools: A review of school effectiveness research, np. Retrieved from www.le.ac.uk/education/ESI/doc1f.html
Sample, I. (2015). Study delivers bleak verdict on validity of psychology experiment results. The Guardian. Retrieved from https://www.theguardian.com/science/2015/aug/27/study-delivers-bleak-verdict-on-validity-of-psychology-experiment-results
Secolsky, C. (1987). On the Direct Measurement of Face Validity: A Comment on Nevo. Journal of Educational Measurement, 24(1), 82-83.
Sergiovanni, T. J. (1967). Factors which affect satisfaction and dissatisfaction of teachers. The Journal of Educational Administration, v(1), 17.
Sergiovanni, T. J. (1984). Leadership and excellence in schooling. Educational Leadership, 41(5), 10.
270
Sergiovanni, T. J. (2006). The principalship : A reflective practice perspective (5th ed.). Boston: Pearson/Allyn and Bacon.
Sherman, W. (2005). Preserving the status quo or renegotiating leadership: Women's experiences with a district-based aspiring leaders program. Educational Administration Quarterly, 41(5), 34.
Starr, K. (2007). Principals consider the leadership supply problem. Leadership in focus, 7(Spring 2007), 4.
Stemple, J. D. (2004). Job satisfaction of high school principals in Virginia. (Doctor of Education), Virginia Polytechnic Institute and State University, Blacksburg, Virginia. Retrieved from http://scholar.lib.vt.edu.theses/available/etd-04252004-104719/unrestricted/Stempleetd[1].pdf
Stevens, J., Brown, J., Knibbs, S., & Smith, J. (2005). Follow-up research into the state of school leadership in England (RR 633). Retrieved from London:
Stoll, L. (2004). Leadership learning : designing a connected strategy. Jolimont, Vic.: Incorporated Association of Registered Teachers of Victoria.
Sturmfels, M. S. (2009). A qualitative study of staff stress, morale and well-being in Victorian government Schools. (Doctor of Education), University of Melbourne, Melbourne.
Sutter, M. (1996). What do we know about the job and career satisfaction of secondary school assistant principals? NASSP Bulletin, 80(579), 6.
Sutter, M. R. (1994). Job and career satisfaction of secondary school assistant principals. (Ph.D. Dissertation), Kent State University, Ohio, United States of America. Retrieved from http://proquest.umi.com.ezp.lib.unimelb.edu.au/pqdweb?did=742469811&sid=1&Fmt=2&clientId=14623&RQT=309&VName=PQD Available from Proquest 742469811 database.
Taylor, J. R. (2007). Job satisfaction among high school assistant principals in seven Florida counties. (Doctor of Education), University of South Florida, Tampa, Florida.
Teasdale-Smith, W. (2007). We don't need another hero. Principal Matters(70), 2. Thompson, M. (2013). Primary principal pathways: a road less travelled. (D.Ed.),
University of Melbourne, Melbourne, Australia. Thomson, P., & Blackmore, J. (2004). Beyond the power of one: Redesigning the work
of school principals. Annual Conference, Australian Association ofResearch in Education. http://www.aare.edu.au/04pap/tho04214.pdf
Turnbull, B. J., Riley, D. L., Arcaira, E. R., Anderson, L. M., & MacFarlane, J. R. (2013). Six Districts Begin the Principal Pipeline Initiative. Retrieved from New York, NY: https://www.wallacefoundation.org/knowledge-center/pages/six-districts-begin-the-principal-pipeline-initiative.aspx
van Saane, N., Sluiter, J. K., Verbeek, J. A. H. M., & Frings-Dresen, M. H. W. (2003). Reliability and validity of instruments measuring job satisfaction- A systematic review. Occupational Medicine, 53, 10. doi:10.1093/occmed/kqg038
Victorian Government Department of Education and Training. (2016). Parent complaints policy (interim): Resolving parent issues and concerns. Retrieved from East Melbourne, Australia:
271
https://www.education.vic.gov.au/school/principals/spag/community/Pages/parentcomplaints.aspx
Victorian Government Department of Education and Training. (2017). Principal Health and Wellbeing Strategy Discussion Paper. Retrieved from East Melbourne, Australia: https://www.education.vic.gov.au/hrweb/safetyhw/Pages/PrincipalHWB.aspx
Victorian Government Department of Education and Training. (2018). Principal Health and Wellbeing Strategy 2018-2021. Retrieved from East Melbourne, Australia: https://www.education.vic.gov.au/hrweb/safetyhw/Pages/PrincipalHWB.aspx
Victorian Institute of Teaching. (2010, May 7, 2010). Supporting provisionally registered teachers program. Retrieved from http://www.vit.vic.edu.au/content.asp?Document_ID=119
Walker, A., Stott, K., & Cheng, Y. C. (2003). Principal supply and quality demands : A tale of two Asia-Pacific city states. Australian Journal of Education, 47(2), 197-208.
Wallace Foundation (Producer). (2018, March 14). Episode 5: States Can Play a Role in Building Principal Pipelines [Audio podcast]. Retrieved from https://www.wallacefoundation.org/knowledge-center/pages/podcast-principal-pipelines-episode-5-states-can-play-a-role-in-building-principal-pipelines.aspx
Wallace, M. (1991). School-centred management training. London: P. Chapman Pub. Wang, E. L., Gates, S. M., Herman, R., Mean, M., Perera, R., Tsai, T., . . . Andrew, M.
(2018). Launching a Redesign of University Principal Preparation Programs: Partners Collaborate for Change. Retrieved from New York, NY: https://www.wallacefoundation.org/knowledge-center/pages/launching-redesign-university-principal-preparation-programs.aspx
Waskiewicz, S. P. (1999). Variables that contribute to job satisfaction of secondary school assistant principals. (Doctor of Education), Virginia Polytechnic Institute and State University, Blacksburg, Virginia. Retrieved from http://scholar.lib.vt.edu/thesis/available/etd-041999-142711/unrestricted/Waskiewicz.final.pdf
Watterson, B. (2015). Environmental scan: Principal preparation programs. Retrieved from Melbourne: https://www.aitsl.edu.au/tools-resources/resource/insights---environmental-scan-principal-preparation-programs
Watterson, J. (2014). From the president. Australian Educational Leader, 36(3), 1. Weiss, D. J., Dawis, R. V., England, G. W., & Lofquist, L. H. (1967). Manual for the
Minnesota Satisfaction Questionnaire (pp. 119): University of Minnesota. Weller, D. L., & Weller, S. J. (2002). The assistant principal: essentials for effective
school leadership. Thousand Oaks, California: Corwin Press. Williams, T. R. (2003). Ontario's principal scarcity: Yesterday's abdicated policy
responsibility-today's unrecognised challenge. Australian Journal of Education, 47(2), 13.
Wolfe, R. L. (1996). Systematic succession planning. Building leadership from within. Menlo Park, California: Crisp Publications, Inc.
Woolley, T. (1999). Shortage in school leadership applicants. . In P. Martin (Ed.), Where will they come from? (pp. 1). Canberra: Australian Secondary Principals' Association (ASPA).

272
Wubberling, F. (2008). SEO, ARD & RD Response to numbers of PCO applications. Australian Principals' Federation. Melbourne.
Yerkes, D. M., & Guaglianone, C. L. (1998). Where have all the high school administrators gone? Thrust for Educational Leadership, 28(2), 6.

273
ThesisAttachments
TableofContents
Attachment 1: Survey Questionnaire ....................................................................... 274
Attachment 2: Interview protocol ............................................................................ 299
274
Attachment 1: Survey Questionnaire
CAREER ASPIRATIONS AND DEVELOPMENT OF ASSISTANT PRINCIPALS IN VICTORIAN
GOVERNMENT SECONDARY SCHOOLS
(NAME)
ASSISTANT PRINCIPAL
(SCHOOL NAME)
(STREET NAME)
(TOWN / SUBURB)
(POSTCODE)
Thankyou for agreeing to be part of this research into the career aspirations and development
of Assistant Principals in Victorian Government Secondary Schools.
The information from this study should be of relevance and interest to school systems
internationally. The findings of the study will be available to you in summary form.
Completion of the questionnaire should take up to 30 minutes. There are a number of parts to
the questionnaire and you are asked to complete each section.
275
The information collected through this survey and follow-up interview will remain confidential
as already indicated to you, and only used for research purposes.
If you have any questions, please contact Ken Thompson or David Gurr using our contact
details below. Following receipt of your completed questionnaire, we may soon be in contact
with you to arrange a mutually convenient time for interview.
Ken Thompson,
DEd candidate, Visiting Fellow, Centre for Organisational Learning and Leadership, The
University of Melbourne, Australia, 3010. Tel: +61 407105078. Email:
Dr David Gurr
Senior Lecturer, Centre for Organisational Learning and Leadership, The University of
Melbourne, Australia, 3010. Tel: +61 407105078. Email: [email protected]
PLEASE COMPLETE ALL SECTIONS OF THIS QUESTIONNAIRE AND RETURN IT IN THE REPLY
PAID ADDRESSED ENVELOPE PROVIDED. IT WOULD BE GREATLY APPRECIATED IF YOU
WOULD POST THE COMPLETED QUESTIONNAIRE BY _________. (DATE)

276
QUESTIONS FOR ASSISTANT PRINCIPALS
Questions for Research
Background
About you
1.1 How long have you been an assistant principal at your current school? ____ years (Please
write in number of years)
1.2 Have you been an assistant principal elsewhere? Yes/ No (please circle applicable)
If so for how long? ____ years (please enter number of years)
1.3 Thinking of your current position, were you appointed directly from another position in
your school (please tick one box only)
Yes
No
About your school
1.4 What is the enrolment of your school? _________students (please enter number of
students)
1.5 Is the enrolment: stable / growing / declining? (please circle applicable)
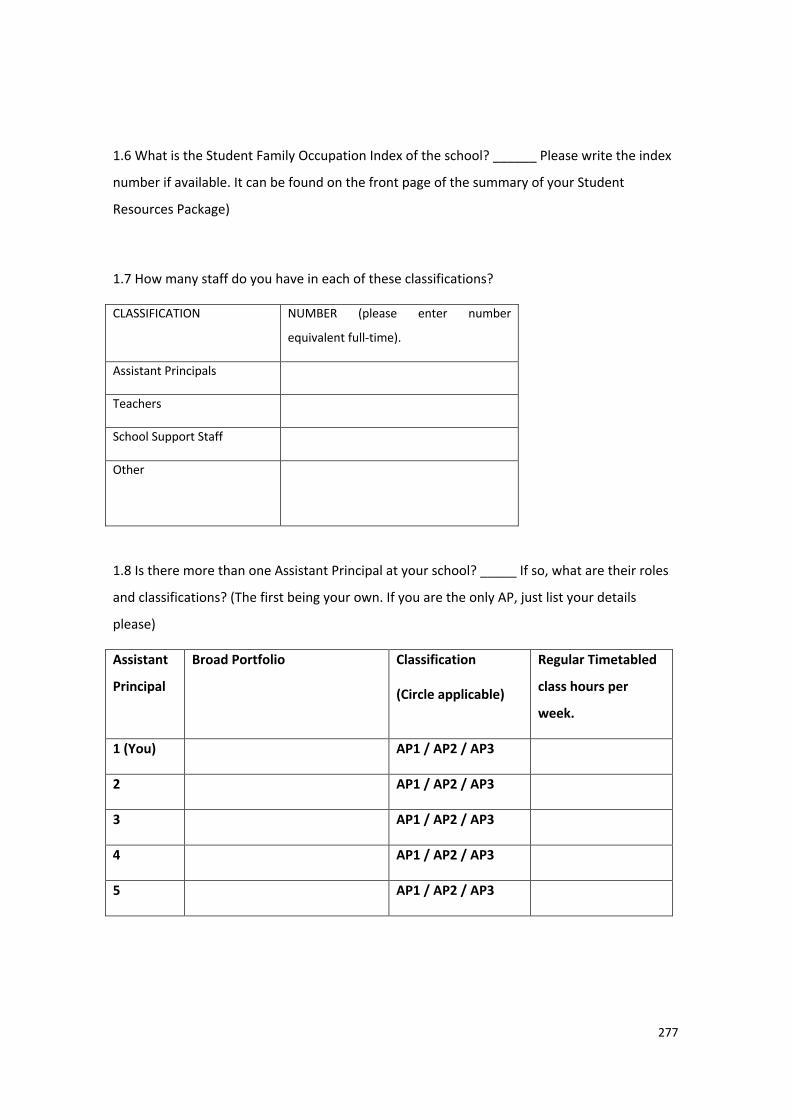
277
1.6 What is the Student Family Occupation Index of the school? ______ Please write the index
number if available. It can be found on the front page of the summary of your Student
Resources Package)
1.7 How many staff do you have in each of these classifications?
CLASSIFICATION NUMBER (please enter number
equivalent full-time).
Assistant Principals
Teachers
School Support Staff
Other
1.8 Is there more than one Assistant Principal at your school? _____ If so, what are their roles
and classifications? (The first being your own. If you are the only AP, just list your details
please)
Assistant
Principal
Broad Portfolio Classification
(Circle applicable)
Regular Timetabled
class hours per
week.
1 (You) AP1 / AP2 / AP3
2 AP1 / AP2 / AP3
3 AP1 / AP2 / AP3
4 AP1 / AP2 / AP3
5 AP1 / AP2 / AP3

278
1.9 What is your gender?
Gender Tick Applicable
Male
Female
1.10 What is your age? Please enter age in years into box
1.11 Anticipated retirement age? ______ years (please enter age)
1.12 Ethnic background:
In which country were you born? __________________________ (name of country)
In which country was your father born? _______________________(name of country).
In which country was your mother born? _______________________(name of country).
2.0 YOUR CAREER INTENTION
Your Career Aspirations / Intentions in relation to the Principalship
2.1 Which statement below sums up your career intentions in relation to the Principalship?
Please tick next to the statement that best expresses your current position.
I have applied in the past, but will not do so in the future

279
I have never applied, and do not intend applying
I have applied in the past, but I am not sure if I will in the future
I have not applied yet, but I do envisage applying in the future
I am actively seeking principalship
I will apply for principalship, but only if it is in a suitable location
Attitudes to the Principalship
2.2 If you do wish or possibly wish to seek a principal position, why do you want to become a
principal? (Please tick up to 5 only) Note: If you have no intention of seeking a principal
position, go directly to item 2.3
Sense of vocation
Role is dynamic and varied/is not routine
Interaction with aspiring leaders
Changing school culture
Building shared values
Collegiality/teamwork
Maintaining high standards
Being a leader
Giving something back to the community/society
Job satisfaction/sense of personal achievement
Passionate belief in the role
Pay
Rising to new challenges
Decision making
Professional autonomy/implementing own vision
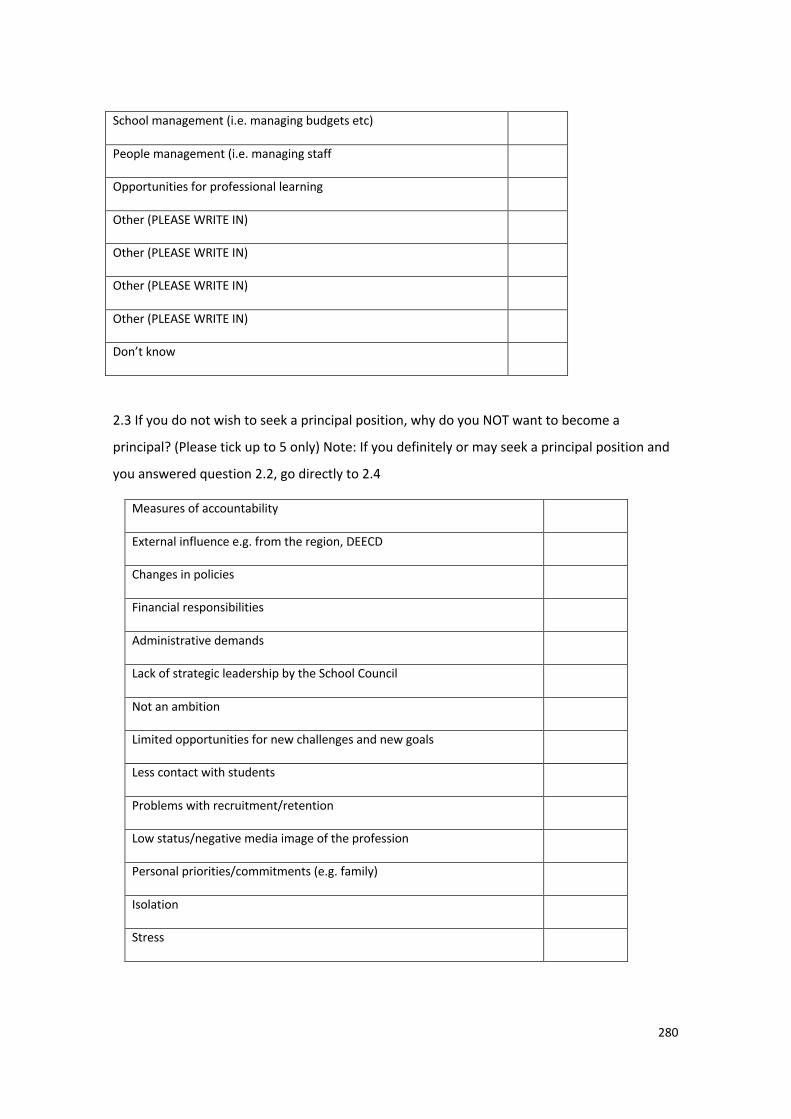
280
School management (i.e. managing budgets etc)
People management (i.e. managing staff
Opportunities for professional learning
Other (PLEASE WRITE IN)
Other (PLEASE WRITE IN)
Other (PLEASE WRITE IN)
Other (PLEASE WRITE IN)
Don’t know
2.3 If you do not wish to seek a principal position, why do you NOT want to become a
principal? (Please tick up to 5 only) Note: If you definitely or may seek a principal position and
you answered question 2.2, go directly to 2.4
Measures of accountability
External influence e.g. from the region, DEECD
Changes in policies
Financial responsibilities
Administrative demands
Lack of strategic leadership by the School Council
Not an ambition
Limited opportunities for new challenges and new goals
Less contact with students
Problems with recruitment/retention
Low status/negative media image of the profession
Personal priorities/commitments (e.g. family)
Isolation
Stress

281
Responsibility
Less involvement with teaching
Other (please write in)
Other (please write in)
Other (please write in)
Don’t know
All participants in the study are asked to respond to this question.
2.4 If you were seeking a principalship, would you be willing to work in any of the following
types of school?
(Tick as many as apply)
A school in ‘challenging circumstances’
A school with serious problems
A ‘successful’ school
A ‘coasting’ school
An urban school
A rural school
An inner city school
A school with a good track record
A school with ‘challenging students’
A school with discipline problems
A non-selective school
A selective or partially selective school
A partially selective school
Catholic School

282
Independent School
2.5 What else do you wish to do if you are not seeking a principalship?
(Please tick all that apply)
Remain as an assistant principal in my current school
Seek a role as assistant principal or similar position in
another school
Change to a career in further or higher education eg
lecturer, academic researcher
Take up a regional position
Become a consultant / trainer
Take up a career out side of education
Retirement / early retirement
Other Please explain
3.0 Professional Development
3.1 Which of the following centrally organised professional development programs have you
participated in, in your role as assistant principal during the past three years?
For each one you have participated in, how useful were they to you as a school leader?
For each of the programs that you participated in, please tick one of very useful, fairly useful,
not very useful, not at all useful, don’t know
Central Programs for Assistant Principals
& Aspirants
Very
useful
Fairly
useful
Not
very
useful
Not at
all
useful
Don’t
Know
Leading in Effective Schools
Leading Professional Learning
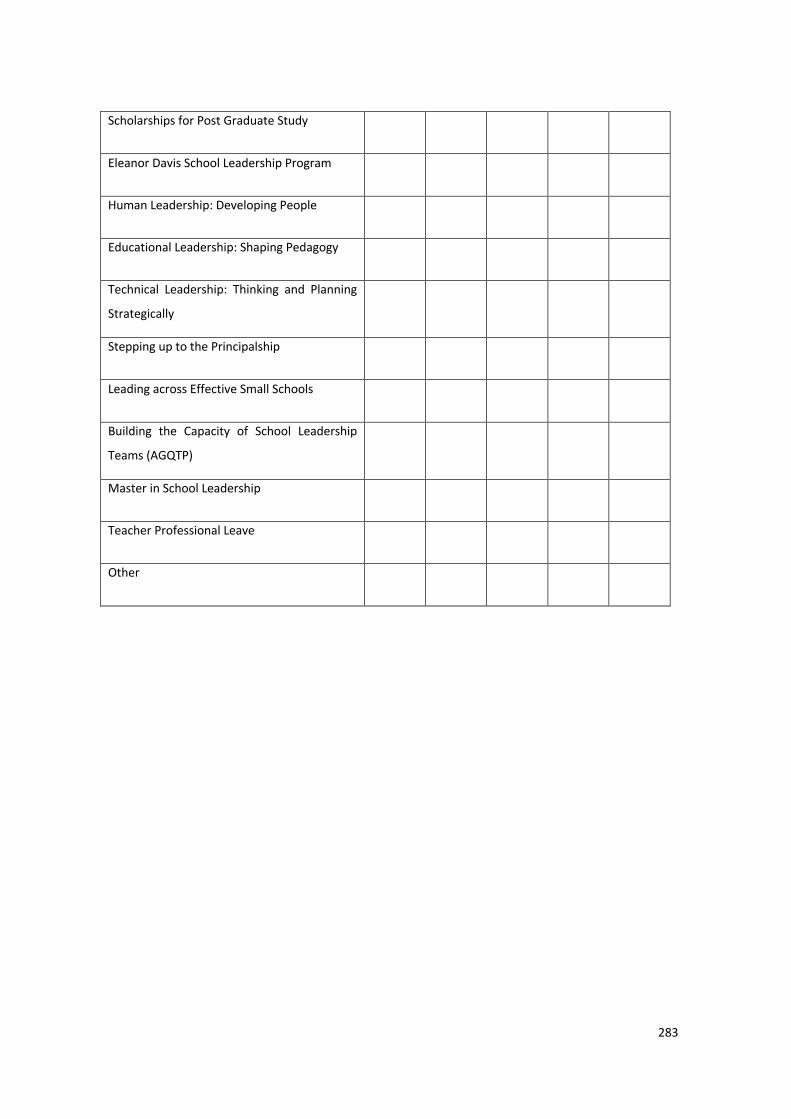
283
Scholarships for Post Graduate Study
Eleanor Davis School Leadership Program
Human Leadership: Developing People
Educational Leadership: Shaping Pedagogy
Technical Leadership: Thinking and Planning
Strategically
Stepping up to the Principalship
Leading across Effective Small Schools
Building the Capacity of School Leadership
Teams (AGQTP)
Master in School Leadership
Teacher Professional Leave
Other

284
3.2 Which of the following regionally organised professional development programs have you
participated in, in your role as assistant principal during the past three years?
For each one you have participated in, how useful were they to you as a school leader?
For each of the programs that you participated in, please tick one of very useful, fairly useful, not very
useful, not at all useful, don’t know
Regional Programs for Assistant Principals Very
useful
Fairly
useful
Not very
useful
Not at all
useful
Don’t
Know
Dollars and Sense: Financial Management
Program
Bricks and Mortar: Facilities Management
Program
Other
3.3 Which other organised professional development programs have you participated in, in your role as
an assistant principal during the past three years? For each of the programs that you participated in,
please tick one of very useful, fairly useful, not very useful, not at all useful, don’t know
Other programs eg Union, Private provider,
Professional Association
(Please write in program and sponsor)
Very
useful
Fairly useful Not very
useful
Not at all
useful
Don’t
Know

285
4.0 Preparedness
4.1 Thinking about your current leadership position, please indicate on the scale below.
How well prepared you thought you were prior to taking up that position
In reality, how well prepared you were for that position
Please tick one box only per statement
V e r y w e l l p r e p a r e d F a i r l y w e l l p r e p a r e d N o t v e r y w e l l p r e p a r e d N o t a t a l l p r e p a r e d D o n ’ t K n o w
How well prepared did you think you
were prior to taking up your current
position?
In reality, how well prepared were you
for your current position?
4.2 Regardless of whether or not you want to become a principal, in general terms, how well
prepared do you feel you are to take up a principalship?
Please tick one box only
V e r y w e l l p r e p a r e d F a i r l y w e l l p r e p a r e d N o t v e r y w e l l p r e p a r e d N o t a t a l l p r e p a r e d D o n ’ t k n o w
In general terms, how well prepared do
you feel you are to take up a
principalship?
4.3 Sources of Inspiration
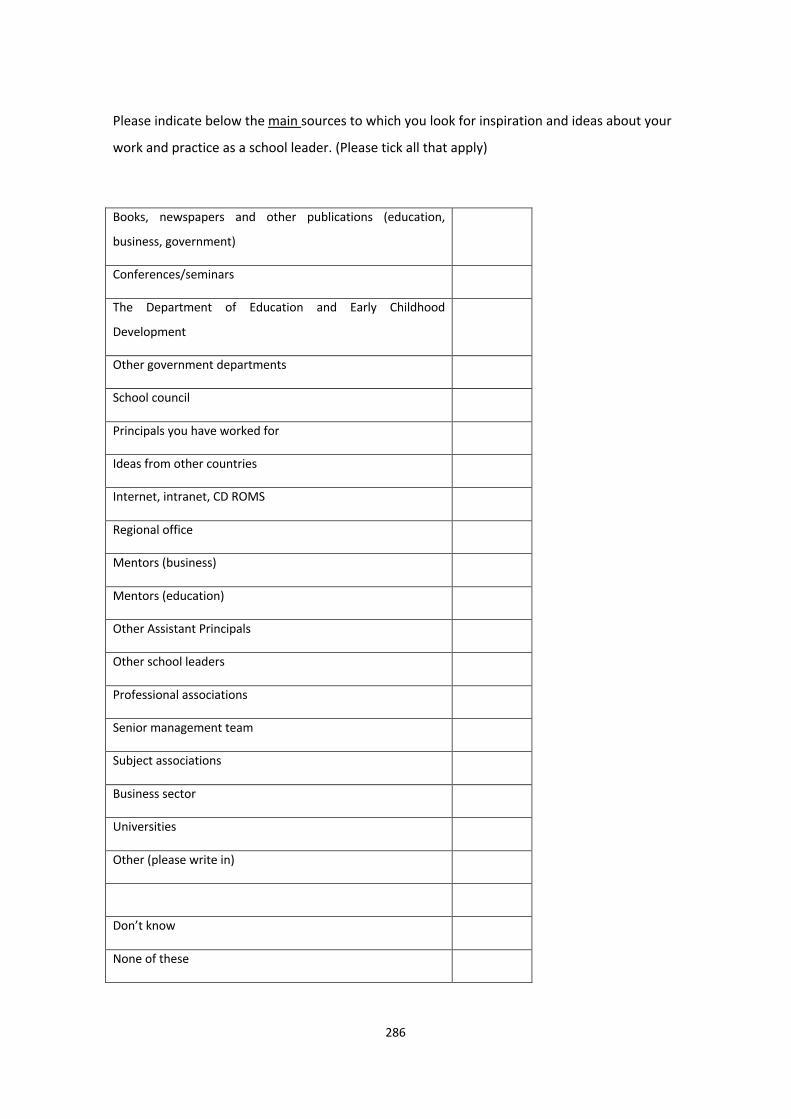
286
Please indicate below the main sources to which you look for inspiration and ideas about your
work and practice as a school leader. (Please tick all that apply)
Books, newspapers and other publications (education,
business, government)
Conferences/seminars
The Department of Education and Early Childhood
Development
Other government departments
School council
Principals you have worked for
Ideas from other countries
Internet, intranet, CD ROMS
Regional office
Mentors (business)
Mentors (education)
Other Assistant Principals
Other school leaders
Professional associations
Senior management team
Subject associations
Business sector
Universities
Other (please write in)
Don’t know
None of these

287
4.4 What priorities are contained in your professional development plan for the 2007/ 08
cycle?
Please list each priority in column 1
Please indicate the associated leadership domain(s) in column 2 (see list of domains below)
Please briefly describe the learning methods you have chosen in column 3.
Priority Learning
Focus on your plan
Sergiovanni
Leadership
Domain(s) (see list
of domains below)
Learning method
1
2
3
4
5
6
Sergiovanni Domains
Technical Leadership
Human Leadership
Educational Leadership
Symbolic Leadership
Cultural Leadership

288
4.5 Self-Assessment Questionnaire About Your Organisation’s [schools’s] Employee
Development Program”
Directions: Read each item below. Then, place a tick in the appropriate column: Yes,
Sometimes, or No
My Organization: Yes Sometimes No
1. Monitors head count of staff members on a regular basis to
measure and track workforce requirements.
2. Monitors employee turnover to track any unusual “spikes”
that could result from either or internal factors.
3. Makes an effort to plan for workforce needs in advance for
reasons such as promotions and retirements.
4. Makes appropriate investments in education, training, and
other developmental opportunities to help employees build
their competencies.
5. Makes appropriate investments in individual development
programs for employees at all levels.
6. Provides adequate opportunities for career advancement that
take into account supervisory and managerial needs.
7. Encourages employees to take control of their learning so
they will possess the necessary skills to be employable
throughout their working life.
8. Provides flexibility, facilities, services, and programs to
enhance employee satisfaction and commitment to the
organization.
9. Makes flexible use of the workforce- such as putting the right
employees in the right roles according to their skills or using
“virtual teams” to focus on the right talent for specific tasks.
10. Provides career advice and developmental services to
employees at all levels.
11. Implements creative ways to recognize and reward
employees.

289
12. Creates a workplace climate that allows and encourages
employees to become more involved with or engaged in their
work.
13. Has in place, and ready to activate, a plan for the
replacement of the organization’s key leadership positions in the
event of sudden tragedy affecting an individual or a group.
14. Provides high-potential employees with developmental
(stretch) assignments to prepare them for larger roles in the
organization.
15. Consistently provides employees with opportunities to
become part of the talent pool from which leadership positions
are drawn
4.6 In the table below, please indicate the ‘possible methods’ that take place in your
organization [school] by circling with ‘yes or ‘no’ and then, if they exist at your school, how
effective the method is in developing people to assume future responsibilities.
Possible Methods by Which to
Develop Individuals
Is Your
Organization
[school] Using
This Method
to Develop
People?
How Effective Do You Feel This Method Is for
Developing People to Assume Future Job
Responsibilities?
Not at all effective Very
effective
A. On-the-job degree programs
sponsored by colleges /
universities
Yes No 1 2 3 4 5
B On-site degree programs
colleges / universities
Yes No 1 2 3 4 5
C Off-the-job sponsored by
vendors
Yes No 1 2 3 4 5
D Off-the-job public seminars
sponsored by universities
Yes No 1 2 3 4 5
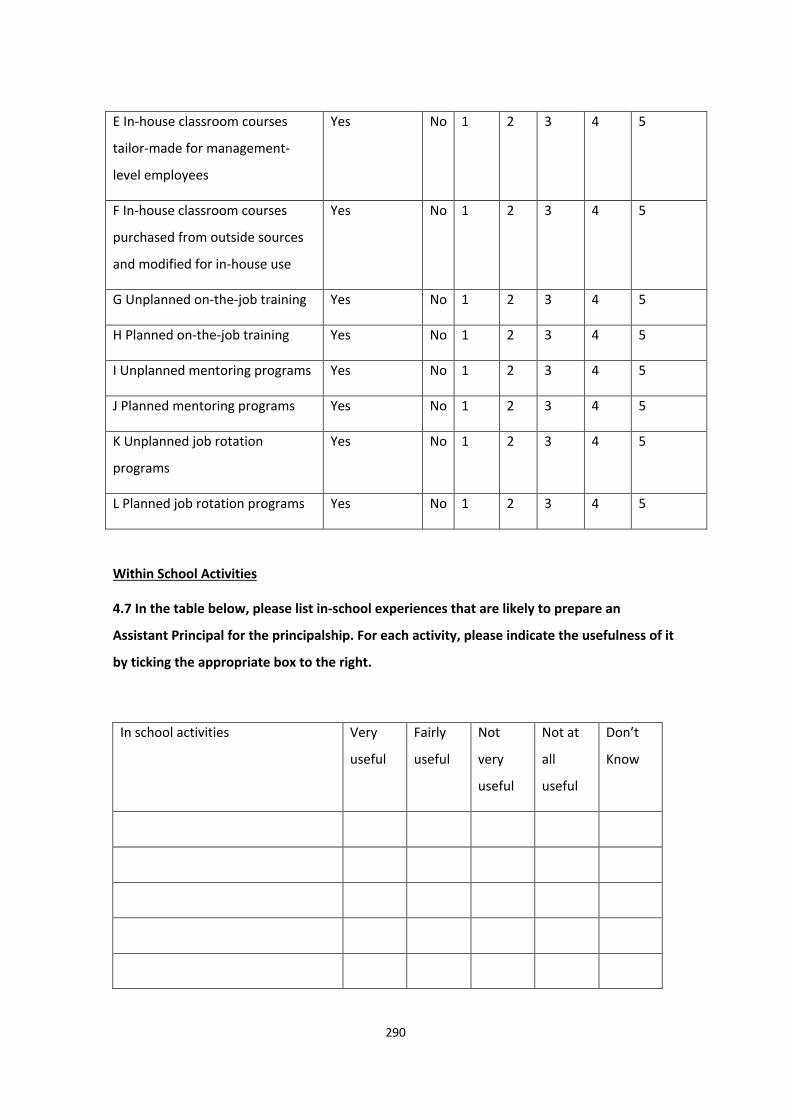
290
E In-house classroom courses
tailor-made for management-
level employees
Yes No 1 2 3 4 5
F In-house classroom courses
purchased from outside sources
and modified for in-house use
Yes No 1 2 3 4 5
G Unplanned on-the-job training Yes No 1 2 3 4 5
H Planned on-the-job training Yes No 1 2 3 4 5
I Unplanned mentoring programs Yes No 1 2 3 4 5
J Planned mentoring programs Yes No 1 2 3 4 5
K Unplanned job rotation
programs
Yes No 1 2 3 4 5
L Planned job rotation programs Yes No 1 2 3 4 5
Within School Activities
4.7 In the table below, please list in-school experiences that are likely to prepare an
Assistant Principal for the principalship. For each activity, please indicate the usefulness of it
by ticking the appropriate box to the right.
In school activities Very
useful
Fairly
useful
Not
very
useful
Not at
all
useful
Don’t
Know
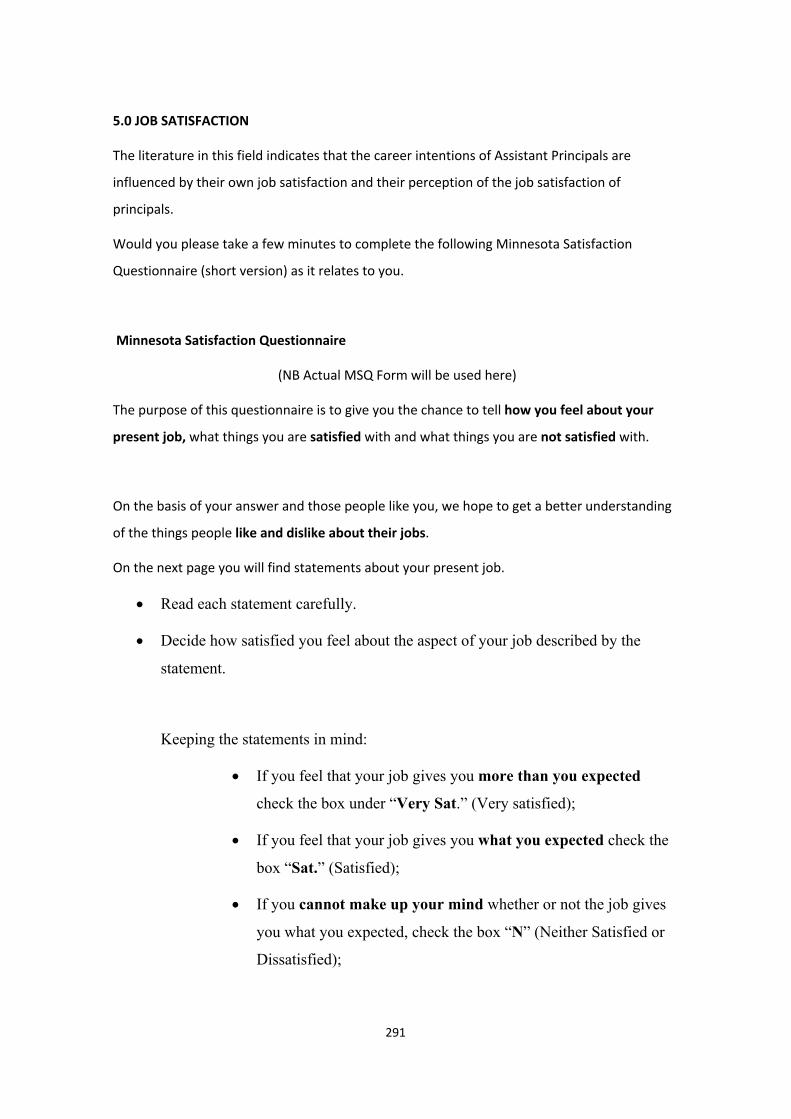
291
5.0 JOB SATISFACTION
The literature in this field indicates that the career intentions of Assistant Principals are
influenced by their own job satisfaction and their perception of the job satisfaction of
principals.
Would you please take a few minutes to complete the following Minnesota Satisfaction
Questionnaire (short version) as it relates to you.
Minnesota Satisfaction Questionnaire
(NB Actual MSQ Form will be used here)
The purpose of this questionnaire is to give you the chance to tell how you feel about your
present job, what things you are satisfied with and what things you are not satisfied with.
On the basis of your answer and those people like you, we hope to get a better understanding
of the things people like and dislike about their jobs.
On the next page you will find statements about your present job.
• Read each statement carefully.
• Decide how satisfied you feel about the aspect of your job described by the
statement.
Keeping the statements in mind:
• If you feel that your job gives you more than you expected
check the box under “Very Sat.” (Very satisfied);
• If you feel that your job gives you what you expected check the
box “Sat.” (Satisfied);
• If you cannot make up your mind whether or not the job gives
you what you expected, check the box “N” (Neither Satisfied or
Dissatisfied);

292
• If you feel that your job gives you less than you expected, check
the box under “Dissat.” (Dissatisfied);
• If you feel that your job gives you much less than you expected,
check the box under “Very Dissat.” (Very Dissatisfied)
Remember: Keep the statement in mind when deciding how satisfied you feel about that
aspect of your job.
Do this for all statements. Please answer every item.
Be frank and honest. Give a picture of your feelings about your present job.
Ask yourself: How satisfied am I with this aspect of my job?
Very Sat. means that I am very satisfied with this aspect of my job.
Sat. means that I am satisfied with this aspect of my job.
N means I can’t decide whether I am satisfied or not with this aspect of my job.
Dissat. means I am dissatisfied with this aspect of my job.
Very Dissat. means that I am very dissatisfied with this aspect of my job
_________________________________________________________________________
On my present job, this is how I feel about …
Very
Diss
at
Diss
at
N
Sat
Very
Sat
Being able to keep busy all the time
The chance to work alone on the job
The chance to do different things from time to time
The chance to be ‘somebody’ in the community

293
On my present job, this is how I feel about …
Very
Diss
at
Diss
at
N
Sat
Very
Sat
The way my boss handles his/her workers
The competence of my supervisor in making
decisions
Being able to do things that don’t go against my
conscience
The way my job provides for steady employment
The chance to do things for other people
The chance to tell people what to do
The chance to do something that makes use of my
abilities
The way company policies are put into practice
My pay and the amount of work I do
The chances for advancement on this job
The freedom to use my own judgement
The chance to try my own methods of doing the job
The working conditions
The way my co-workers get along with each other

294
On my present job, this is how I feel about …
Very
Diss
at
Diss
at
N
Sat
Very
Sat
The praise I get for doing a good job
The feeling of accomplishment I get from the job
Would you please take a few minutes to complete the Minnesota Satisfaction Questionnaire
(Short Version – modified) as it relates to your perceptions of the job satisfaction of
principals generally. (including but not only your own principal).
(see next 2 pages)

295
Minnesota Satisfaction Questionnaire (modified version)*
The purpose of this questionnaire is to give you the chance to tell how you believe that
school principals (generally, not just the principal at your school) feel about their
job, what things they are satisfied with and what things they are not satisfied with.
On the basis of your answer and those people like you, we hope to get a better
understanding of the things people perceive that principals like and dislike about their
jobs.
On the next page you will find statements about your present job.
• Read each statement carefully.
• Decide how satisfied you believe that principals feel about the aspect of their job
described by the statement.
Keeping the statements in mind:
• If your feel that their job gives them more than they expected
check the box under “Very Sat.” (Very satisfied);
• If you feel that their job gives them what they expected check
the box “Sat.” (Satisfied);
• If you cannot make up your mind whether or not the job gives
principals what they expected, check the box “N” (Neither
Satisfied or Dissatisfied);
• If you feel that principal’s job gives them less than they
expected, check the box under “Dissat.” (Dissatisfied);
• If you feel that principal’s job gives them much less than they
expected, check the box under “Very Dissat.” (Very
Dissatisfied)

296
Remember: Keep the statement in mind when deciding how satisfied principals feel
about that aspect of their job.
Do this for all statements. Please answer every item.
Be frank and honest. Give a picture of your perceptions feelings about their principal
job.
*Copyright 1977, Vocational Psychology Research, University of Minnesota.
Reproduced by permission..

297
As yourself: How satisfied you believe that principals are with this aspect of their job?
Very Sat. means that they are very satisfied with this aspect of are job.
Sat. means that they are satisfied with this aspect of their job.
N means I can’t decide whether they are satisfied or not with this aspect of their job.
Dissat. means they are dissatisfied with this aspect of their job.
Very Dissat. means that they are very dissatisfied with this aspect of their job
_________________________________________________________________________
On their present job, this is how I perceive
principals to feel about …
Very
Dissat
Dissat N Sat Very
Sat
Being able to keep busy all the time
The chance to work alone on the job
The chance to do different things from time to time
The chance to be ‘somebody’ in the community
The way their boss handles his/her workers
The competence of their supervisor in making decisions
Being able to do things that don’t go against their
conscience
The way their job provides for steady employment
The chance to do things for other people
The chance to tell people what to do
The chance to do something that makes use of their
abilities
The way company policies are put into practice
Their pay and the amount of work they do
The chances for advancement on this job
The freedom to use their own judgement
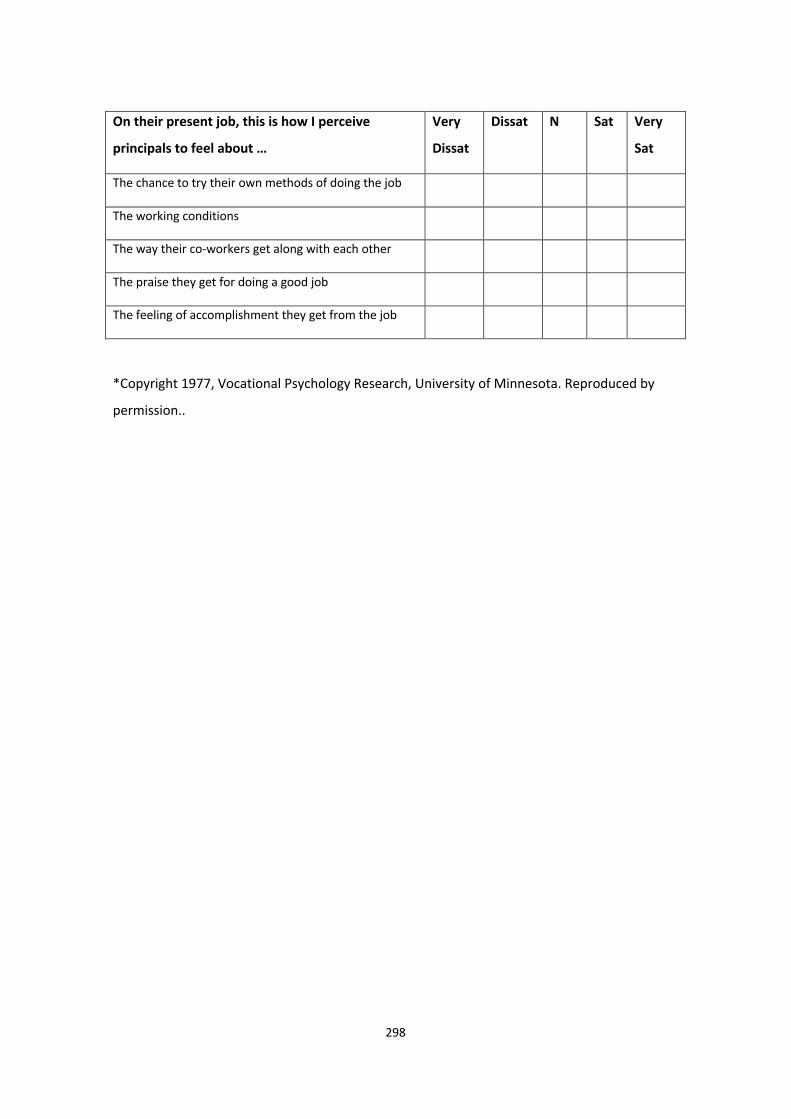
298
On their present job, this is how I perceive
principals to feel about …
Very
Dissat
Dissat N Sat Very
Sat
The chance to try their own methods of doing the job
The working conditions
The way their co-workers get along with each other
The praise they get for doing a good job
The feeling of accomplishment they get from the job
*Copyright 1977, Vocational Psychology Research, University of Minnesota. Reproduced by
permission..

299
Attachment 2: Interview protocol
INTERVIEW PROTOCOL
Thank you for completing the preliminary information through the questionnaire. The purpose of the interview is to follow up on some of the information you provided and to seek any comments you wish to make about the issues being addressed by this study.
2.0 YOUR CAREER INTENTIONS
2.1 Are there any comments you wish to make about seeking the principalship?
2.2 / 2.3 Are there any comments you wish to make about the reasons why you want to become a principal or do not want to become a school principal?
2.4 Are there any comments you would like to make about the type of schools you would be willing to lead?
2.5 Are there any comments you wish to make about other career options you are considering?
3.0 PROFESSIONAL DEVELOPMENT
(I will work through activity to identify the relevant Domain / dimension, Method and Impact.)
3.1 Looking at each of the CENTRAL programs that you have participated in during the last three years;
Can you identify the domains of leadership that were addressed by them?

300
Can you identify the methods used in the programs?
Can you identify the impact they have had on your work?
3.2 Looking at each of the REGIONAL programs that you have participated in during the last three years;
Can you identify the domains of leadership that were addressed by them?
Can you identify the methods used in the programs?
Can you identify the impact they have had on your work?
3.3 Looking at each of the OTHER EXTERNALLY organised (to the school) programs that you have participated in during the last three years;
Can you identify the domains of leadership that were addressed by them?
Can you identify the methods used in the programs?
Can you identify the impact they have had on your work?
3.4 Looking at each of the within school programs that you have participated in during the last three years;
Can you identify the domains of leadership that were addressed by them?

301
Can you identify the methods used in the programs?
Can you identify the impact they have had on your work?
4.0 PREPAREDNESS
Can you tell me the extent to which you feel prepared for the principalship?
Can you tell me what has helped and what has hindered this preparation?
In relation to your Professional Development Plan
How closely is your professional development plan related to your career plan?
How is this link achieved?
How closely is your professional development plan related to the School Strategic Plan?

302
How is the linking achieved?
What would need to change in the principalship to increase your interest in the principalship?
In summary. How would you describe your school’s approach to career and succession planning?
Not planned, 1 …………………………………………………………………….highly planned 5

Minerva Access is the Institutional Repository of The University of Melbourne
Author/s:Thompson, Kenneth Henry
Title:The career aspirations and development of government secondary school assistantprincipals in Victoria, Australia
Date:2019
Persistent Link:http://hdl.handle.net/11343/224111
Terms and Conditions:Terms and Conditions: Copyright in works deposited in Minerva Access is retained by thecopyright owner. The work may not be altered without permission from the copyright owner.Readers may only download, print and save electronic copies of whole works for their ownpersonal non-commercial use. Any use that exceeds these limits requires permission fromthe copyright owner. Attribution is essential when quoting or paraphrasing from these works.