Embed Size (px)
Citation preview

The Cayman Islands’
System of National Accounts Report 2020
FEBRUARY 2021
T H E E C O N O M I C S A N D S T A T I S T I C S O F F I C E


SYSTEM OF NATIONAL ACCOUNTS REPORT 2020
Economics and Statistics Office
TABLE OF CONTENTS Page
ACKNOWLEDGEMENT .................................................................................................. i
ABBREVIATIONS AND ACRONYMS ............................................................................... ii
1. EXECUTIVE SUMMARY ............................................................................................ 1
2. INTRODUCTION ....................................................................................................... 4
2.1 Importance of the SNA ............................................................................................. 4
2.2 Key data sources ...................................................................................................... 5
2.3 Valuation of Gross Domestic Product (GDP) ............................................................ 5
2.4 Improvement in methodology ................................................................................. 5
3. GROSS DOMESTIC PRODUCT ESTIMATES-THE PRODUCTION APPROACH .................. 6
3.1 Overview of GDP at purchasers’ prices .................................................................... 6
3.2 GDP by industrial origin ........................................................................................... 9
3.3 GDP rates of growth by industry ............................................................................ 10
3.3.1 Goods-producing industries ............................................................................. 11
3.3.2 Service-producing industries ............................................................................ 12
3.4 Contribution to growth in GDP by industry ........................................................... 16
3.5 Share of GDP by industry ....................................................................................... 17
3.6 Industry GDP at current prices ............................................................................... 20
3.7 Detailed value added by industry .......................................................................... 21
3.8 Implicit price index by industry .............................................................................. 23
3.9 Production and cost components of value-added by industry .............................. 24
3.10 Gross National Product (GNP) .............................................................................. 25
3.11 GNI, GNDI, Gross National Savings & Net Lending .............................................. 26
4. GROSS DOMESTIC PRODUCT ESTIMATES-THE INCOME APPROACH ........................ 28
4.1 GDP and rate of growth of GDP at purchasers’ prices by income ......................... 28
4.2 Income Share of GDP at purchasers’ prices ........................................................... 29
4.3 Income components of GDP at purchasers’ prices ................................................ 30
4.3.1 Compensation of employees (COE) .................................................................. 30
4.3.2 Operating surplus/mixed-income .................................................................... 32
4.3.3 Consumption of fixed capital ........................................................................... 33
4.3.4 Taxes less subsidies on production and imports .............................................. 34
5. GROSS DOMESTIC PRODUCT ESTIMATES-THE EXPENDITURE APPROACH ................ 35
5.1 Introduction ........................................................................................................... 35

SYSTEM OF NATIONAL ACCOUNTS REPORT 2020
Economics and Statistics Office
5.2 GDP by expenditure (GDPE) ................................................................................... 35
5.3 GDPE rates of growth by component .................................................................... 38
5.4 Contribution to GDPE by component .................................................................... 39
5.5 Expenditure components of GDP ........................................................................... 40
5.5.1 Household final consumption expenditure (HFCE) ........................................... 40
5.5.2 Government final consumption expenditure (GFCE)........................................ 41
5.5.3 Final consumption expenditure of NPISH ......................................................... 41
5.5.4 Gross fixed capital formation (GFCF) ............................................................... 42
5.5.5 Changes in inventories ..................................................................................... 44
5.5.6 Net export of goods and services (X-M) ........................................................... 44
APPENDIX 1: KEY CONCEPTS AND DEFINITIONS ......................................................... 47
APPENDIX 2: IMPLEMENTATION OF THE CAYMAN ISLANDS’ SNA ............................... 58
APPENDIX 3: GDP REBASING ..................................................................................... 61
APPENDIX 4: INTERNATIONAL STANDARD INDUSTRIAL CLASSIFICATION of ALL ECONOMIC ACTIVITIES (Revision 4) ........................................................................... 64

SYSTEM OF NATIONAL ACCOUNTS REPORT 2020
Economics and Statistics Office i
ACKNOWLEDGEMENT The estimation of the Gross Domestic Product is dependent on a wide range of data gathered from administrative records and a specially designed survey – the Annual National Accounts Survey (ANAS). This data gathering involves the participation of a large number of individuals, organizations, and institutions. The Economics and Statistics Office (ESO) acknowledges the assistance and cooperation of all those individuals, government departments and agencies, non-governmental organizations, and the private sector that supplied the relevant data utilized in the composition of this report. The ESO anticipates,
with sincere gratitude, the continued support and cooperation of these individuals and
entities. This report was produced by the System of National Accounts (SNA) Unit of the ESO. Some fieldwork assistance was provided by the Survey Staff of the Social Statistics Unit of the ESO. The External Sector Statistics (ESS) Unit provided vital assistance with the trade in services data utilized in the GDP by expenditure. The general support and effort of the ESO staff are acknowledged and greatly appreciated.

SYSTEM OF NATIONAL ACCOUNTS REPORT 2020
Economics and Statistics Office ii
ABBREVIATIONS AND ACRONYMS ANAS Annual National Accounts Survey BOP Balance of Payments BR Business Register CARTAC Caribbean Regional Technical Assistance Centre CFC Consumption of Fixed Capital CIMA Cayman Islands Monetary Authority CI$ Cayman Islands Dollars COE Compensation of Employees CPI Consumer Price Index
ECLAC Economic Commission for Latin America and the Caribbean
ESO Economics and Statistics Office ESS External Sector Statistics FCE Final Consumption Expenditure FISIM Financial Intermediation Services Indirectly Measured GCF Gross Capital Formation GDP Gross Domestic Product GDPE Gross Domestic Product by Expenditure GDPI Gross Domestic Product by Income GDPP Gross Domestic Product by Production GFCE Government Final Consumption Expenditure
GNDI Gross National Disposable Income GNI Gross National Income GNP Gross National Product GO Gross Output GVA Gross Value Added HBS Household Budget Survey HFCE Household Final Consumption Expenditure IC Intermediate Consumption IPI Implicit Price Index ISIC International Standard Industrial Classification of Economic Activity LFS Labour Force Survey NPISH Non-Profit Institutions Serving Households
PPI Producer Price Index ROW Rest of the World SITC Standard International Trade Classification SNA System of National Accounts SUT Supply & Use Tables TTM Trade & Transport Margin WIP Work in Progress

SYSTEM OF NATIONAL ACCOUNTS REPORT 2020
Economics and Statistics Office 1 1
1. EXECUTIVE SUMMARY 1.1 The Cayman Islands’ System of National Accounts Report 2020 presents the gross
domestic product (GDP) estimates for the period 2016–2020. The estimates were calculated using all three approaches to calculating GDP, i.e. the production approach, the income approach, and the expenditure approach.
1.2 Nominal (current) purchasers’ price GDP for the Cayman Islands declined to
CI$4,674.0 million, and an estimated per capita nominal GDP of CI$71,953.7. 1.3 Real GDP at purchasers’ price (i.e. GDP at constant 2015 prices or GDP adjusted for
inflation) stood at CI$4,269.4 million in 2020. The corresponding per capita real GDP
for 2020 was estimated at CI$65,725.4. 1.4 The Cayman Islands’ economy contracted in 2020, reversing nine consecutive years
of economic expansion. The economy declined by 5.7 percent in 2020 after posting a positive economic outturn of 1.2 in 2011 and 2012, 1.3 percent in 2013, 2.7 percent in 2014, 2.8 percent in 2015, 3.2 percent in 2016 and 2017, 4.3 percent in 2018, and 3.9 percent in 2019. The economic contraction was broad-based, with 14 of the 18 industries declining in 2020.
1.5 The five largest contributors to the 5.7 percent decline in real purchasers’ price GDP
in 2020 (i.e. the percent change weighted by the share of GDP) are: (i) hotel & restaurant services (-2.9%); (ii) transport & storage (-1.4%); (iii) net taxes on products (-1.1%); (iv) professional, scientific & technical activities which consists mainly of legal and accounting services (0.9%); and (v) other services (-0.7%).
1.6 The industries posting the six largest change in constant price GDP in 2020, are: (i) hotel & restaurant services (-53.2%); (ii) transport & storage (-42.3%); (iii) other services (-24.6%); (iv) administrative & support services activities which consists mainly of security, janitorial, landscaping and car rental services (-7.7%); (v) manufacturing (-7.1%); and (vi) professional, scientific & technical activities which consists mainly of legal and accounting services (7.0%). The growth in financial & insurance services slowed to 1.0 percent in 2020, from 2.5 percent and 2.4 percent
in 2019 and 2018, respectively.
1.7 The 5-year geometric average growth rate (2016-2020) showed average annual constant price GDP growth of 1.7 percent for the total economy. Notwithstanding the pandemic-induced shocks in 2020, 15 of 18 industries posted positive average growth rates over the review period, with 12 industries registering growth rates higher than the economy average (3.5%). The highest average expansion over the

SYSTEM OF NATIONAL ACCOUNTS REPORT 2020
Economics and Statistics Office 2 2
period was recorded by human health & social work services (5.8%); with the remaining top ten performers being professional, scientific & technical activities (4.2%); construction activities (4.2%); public administration & defence (4.0%); education services (3.9%); wholesale & retail trade (3.4%); manufacturing (2.8%); agriculture & fishing activities (2.8%); mining & quarrying (2.7%); and water supply, sewerage & waste management (2.3%). Financial & insurance services expanded by an average rate of 2.0 percent over the period. Negative average growth rates were posted by hotel & restaurant services (-10.3%); transport & storage activities (-8.3%), and other services (-1.4%).
1.8 After annual declines in share since 2014, financial & insurance services increased
its share of constant price GDP in 2020 to 32.6 percent from 30.5 percent in 2019. The other industries making up the top seven in terms of share of GDP in 2020 are (i) professional, scientific & technical activities, which comprises primarily of legal and accounting services (14.6%); (ii) real estate activities (8.6%); (iii) wholesale & retail trade (6.6%); (iv) public administration & defense, which consists primarily of central government operations (5.8%); (v) construction services (4.1%); and (vi) human health & social work (4.1%). These top seven industries all increased their shares of GDP in 2020 compared to 2019.
1.9 All income components of GDP declined in 2020 compared to 2019, except for
consumption of fixed capital which increased by 6 percent to $277.5 million. The
largest decline was posted by taxes (less subsidies) on production and imports, which declined by 12.0 percent to CI$602.2 million. This was followed by operating surplus/mixed-income, which declined by 11.2 percent to CI$1,634.6 million, while compensation of employees declined by 0.3 percent to CI$2,159.6 million.
1.10 Total compensation of employees as a share of GDP increased above 46 percent in
2020 for the first time since 2016, growing to 46.2 percent compared to 43.7 percent in 2019 and 44.8 percent in 2018. Total operating surplus/mixed-income declined to 35.0 percent of GDP in 2020, down from the 37.2 percent realized in 2019. The share of consumption of fixed capital grew to 5.9 percent in 2020 from 5.3 percent in 2019, after declining from 5.5 percent in 2018. The share of net taxes on production and imports continued to decline in 2020, contracting to 12.9
percent from 13.8 percent in 2019 and 14.3 percent in 2018.
1.11 The expenditure of resident households on goods and services, as measured by nominal Household Final Consumption Expenditure (HFCE), declined by 4.7 percent to CI$2,516.7 million in 2020. The final consumption expenditure of government grew by 8.2 percent in 2020 to reach CI$527.6 million, while that for non-profit institutions serving households declined by 6.5 percent to CI$31.1 million.

SYSTEM OF NATIONAL ACCOUNTS REPORT 2020
Economics and Statistics Office 3 3
Investment in capital goods and buildings (as measured by nominal Gross Fixed Capital Formation-GFCF) expanded to CI$885.5 million in 2020, an increase of 11.1 percent. Total exports of goods and services contracted to CI$2,544.2 million after declining by 20.2 percent in 2020. Imports of goods and services also declined in 2020 reaching CI$2,066.2 million. The value of net exports (i.e. exports less imports) declined for a third consecutive year to reach CI$478.0 million in 2020 from CI$936.8 million in 2019, and CI$979.3 million in 2018 as the decline in exports outstripped the decline in imports exports. Net exports declined by a significant 49.0 percent in 2020.
1.12 The share of final consumption expenditure in nominal GDPE jumped to 69.1
percent in 2020, from 64.4 percent in 2019. The second-largest share was posted by gross fixed capital formation (19.9%), which increased in share from 16.3 percent in 2019. The share of net exports contracted significantly in 2020 to 10.7 percent from 19.1 percent in 2019. This resulted in net export sliding to the third-largest share of nominal GDPE from its second place in 2019. The share of changes in inventories increased year over year to 0.3 percent in 2020 when compared to 0.2 percent in 2019.
1.13 Gross National Product (GNP) - which adds investment income earned by residents from investments abroad and subtracts the investment income paid to foreigners from their investments within the Cayman Islands – declined to CI$3,499.2 million
in 2020. The 5.8 percent decline in GNP in 2020 resulted from the declines in nominal GDP (-5.6%) and net investment income (i.e. investment income earned abroad less investment income paid abroad), which declined by 5.2 percent.

SYSTEM OF NATIONAL ACCOUNTS REPORT 2020
Economics and Statistics Office 4 4
2. INTRODUCTION 2.1 Importance of the SNA The SNA is a system of accounts that is used globally to measure the economic performance of countries and jurisdictions using accepted international standards issued by the United Nations and the International Monetary Fund (among others). In the context of the Cayman Islands, its main uses are to:
a. Comply with the Public Management & Finance Act (2013 Revision), which requires
the reporting of gross domestic product in the Strategic Policy Statement.
Governments, in general, use the SNA statistics as key indicators for evaluating the
potential and actual macro-economic impact and sustainability of fiscal policies. b. Provide data that can assist government departments, local businesses, and non-
government organizations in preparing business plans or determining the level of assistance to businesses. These statistics help determine the “buying power” or the size of the local market, the potential growth of the market, and alternative sectors for investment.
c. Comply with data requirements of foreign investors and creditors. For example, data from the SNA are required for inclusion in official borrowing documents (i.e.,
Offering Memorandum or Private Placement Memorandum). These statistics are necessary for assessing the worthiness of the jurisdiction as an investment site and/or the worthiness of its entities as borrowers.
d. Comply with data requirements of international credit rating agencies, which
provide credit ratings for the Cayman Islands Government and private entities which borrow from the global financial market.
e. Provide necessary data for the conduct of economic impact assessments of
hurricanes and other disasters, which are required by funding and other donor agencies. As pointed out by previous teams from the Economics Commission for Latin America and the Caribbean (ECLAC), the GDP statistics by sector for Cayman
are necessary for calculating the economic impact of disasters in each sector and, therefore, the approximate amount of resources required for the reconstruction of these sectors.
f. Provide data necessary for government departments and business associations to
monitor the economic performance and contribution of their respective sectors.

SYSTEM OF NATIONAL ACCOUNTS REPORT 2020
Economics and Statistics Office 5 5
2.2 Key data sources The SNA estimates contained in this report are based on the Annual National Accounts Survey (ANAS) conducted among all relevant establishments included in the ESO Business Register. The survey was conducted during the period April to June 2021. It should be noted that all information provided via the survey is treated with the strictest of confidence as per Sections 8 and 18 of the Statistics Act (2016 Revision). Information from the survey is supplemented by secondary data provided by various government ministries, departments and statutory authorities, including the Cayman Islands Monetary Authority (CIMA), Department of Agriculture, Public Transport Unit, Health Services Authority, and other informal interviews with industry sources.
As in any survey, the response rate to the ANAS is mainly a function of the appreciation and understanding of the respondents on how the data will be used. It is hoped that this report will be an instrument to demonstrate the potential uses of the SNA to the business sector, business associations and those providing services to the businesses in the Cayman Islands. 2.3 Valuation of Gross Domestic Product (GDP) Some tables are presented at both basic and purchasers’ (i.e. market) prices. The main difference between basic and purchasers’ price is the taxes less subsidies (net taxes) on
products. Taxes on products are taxes on goods and services that become payable when the goods are produced, sold, imported, or otherwise disposed of by their producer. The tax may be a specific amount of money per unit or a specified percentage of the value of the goods or services. The following are the categories of this type of tax:
a. Taxes and duties on imports b. Other taxes on products excluding taxes and duties on import (e.g. hotel
occupancy tax). 2.4 Improvement in methodology The System of National Accounts (SNA) - as practised globally by official statistical agencies - is ever-evolving, and as such, from time to time, there will be adjustments in the methodology used to derive the estimates. This includes refinement of the estimation process, availability of new and improved data sources, etc. Given the constant improvement following updated SNA standards, the GDP series for the Cayman Islands included in this report benefits from improvements in, and refinements of, the data sources and methodology in the compilation process.

SYSTEM OF NATIONAL ACCOUNTS REPORT 2020
Economics and Statistics Office 6 6
3. GROSS DOMESTIC PRODUCT ESTIMATES-THE PRODUCTION APPROACH 3.1 Overview of GDP at purchasers’ prices The Cayman Islands’ System of National Accounts Report 2020 presents the gross domestic product (GDP) estimates for the period 2016-2020.1 The GDP for the Cayman Islands is compiled using all three approaches to measuring GDP. The primary estimates are compiled using the production approach (GDPP) supplemented with the income approach (GDPI). The third approach - GDP by expenditure (GDPE) - is only available for data years 2015 onwards. The production approach to estimating GDP is obtained by summing the value-added of all industries within the economy (i.e. the gross value of outputs minus the value of intermediate consumption). The income approach is obtained by summing the income earned by the factors of production, i.e. compensation of employees, consumption of fixed capital, taxes less subsidies on production and imports, and operating surplus/mixed-income. The expenditure approach sums the expenditures on final goods and services, capital investments by business, and net exports of goods and services (i.e. exports minus imports). This section takes a detailed look at GDPP (the main calculation methodology used in the SNA for the Cayman Islands) through the presentation of a series of tables and graphs showing the 2020 estimates of GDP by industry. GDPI and GDPE will be examined in detail in Sections 4 and 5, respectively. After nine consecutive years of economic expansion, the economy of the Cayman Islands contracted in 2020 as the economy grappled with the impact of the COVID-19 related global restrictions. The total value of goods and services produced in 2020 - as reflected by real GDP at purchasers’ price – declined by 5.7 percent, after growing by 3.9 percent in 2019 and 4.3 percent in 2018. The last period of economic decline for the Cayman economy (before 2020) was in 2010 when the economy shrunk by 2.7 percent as it recovered from the global financial crisis at that time. The economic downturn in 2020 represents the second-highest rate of annual decline in real GDP recorded for the Cayman economy (for the directly calculated GDP series)2, with the worst decline being posted in 2009 (-7.2%). The performance in 2020 resulted in an average annual expansion of 1.7 percent for the five years 2016-2020. Both the service industries and the goods-producing industries had negative outturn in 2020, posting declines of 5.0 percent and 2.6 percent, respectively. The decline in services
1GDP by income components and GDP by expenditure are provided for the period 2015-2020. 2The calculated GDP series started in 2006. Prior to 2006 GDP estimates for the Cayman Islands were
derived using indicators, not direct calculations.

SYSTEM OF NATIONAL ACCOUNTS REPORT 2020
Economics and Statistics Office 7 7
Table 1: Cayman Islands Main GDP Aggregates and Per Capita Indicators
Main Aggregates (CI$'000) 2016 2017 2018R
2019R 2020
GDP (Current Basic Prices) 3,867,947.6 4,077,746.6 4,329,196.2 4,670,022.3 4,455,289.6
GDP (Constant Basic 2015 Prices) 3,825,759.5 3,950,849.7 4,094,112.4 4,268,130.5 4,062,407.7
GDP (Current Purchasers' Prices) 4,091,085.5 4,305,217.2 4,608,463.6 4,952,792.8 4,673,970.7
GDP (Constant Purchasers' 2015 Prices) 4,050,576.0 4,179,548.2 4,357,900.7 4,526,685.5 4,269,389.8
Mean Population ('000) 61.331 63.115 64.420 66.248 64.958
Per Capita Indicators (CI$) 2016 2017 2018R
2019R 2020
GDP (Current Basic Prices) 63,066.8 64,608.2 67,202.7 70,493.0 68,587.2
GDP (Constant Basic 2015 Prices) 62,378.9 62,597.6 63,553.4 64,426.6 62,539.0
GDP (Current Purchasers' Prices) 66,705.0 68,212.3 71,537.8 74,761.4 71,953.7
GDP (Constant Purchasers' 2015 Prices) 66,044.5 66,221.2 67,648.3 68,329.4 65,725.4
Notes:
1. GDP at basic price excludes net taxes on goods and services
2. GDP at purchasers' price includes net taxes on goods and services
3. Mean population refers to the mid-year population
R-revised
was broad-based, with 10 of these 14 industries posting reduced output in 2020. The top-five largest declines in the services industries were posted by hotel & restaurant services (-53.2%); transport & storage (-42.3%); other services (-24.6%)3; administrative & support service activities (-7.7%); and water supply, sewerage & waste management (-5.5%). The four service industries posting increased output in 2020 were professional, scientific & technical activities (7.0%); human health & social work (6.3%); public administration & defense (3.6%); and financial & insurance services (1.0%). All goods-producing industries contracted in 2020 led by manufacturing (-7.1%); mining & quarrying activities (-6.6%); agriculture & fishing (-1.5%); and construction services (-1.4%). Table 1 shows the total value of domestic output for the years 2016 to 2020. Domestic output relates to all entities that have a physical presence in the Cayman Islands; therefore, for the most part, they exclude entities registered in the Cayman Islands but have no physical presence in the country. The table shows the current and constant (i.e. inflation-adjusted) price estimates of GDP valued in both basic and purchasers’ prices. The table also shows the per capita indicator relating to the respective GDP aggregates.
3The other services industry is dominated by diving, snorkeling & related watersport activities. It also
includes the activities of hairdressers, barbers, wedding planners, dry cleaners, churches, spas, etc.

SYSTEM OF NATIONAL ACCOUNTS REPORT 2020
Economics and Statistics Office 8 8
The 5.7 percent decline in the overall real (purchasers’ price) GDP4 resulted in a 3.8 percent decline in the real GDP per capita as the estimated mid-year population declined by 1.9 percent. The decline in the inflation-adjusted per capita GDP (at purchasers’ prices) in 2020 reversed the growths posted for the three previous years. Real GDP per capita declined to CI$65,725.4 in 2020 from CI$68,329.4 in 2019 and CI$67,648.3 in 2018. Figure 1 below shows the comparative growth rates of GDP at current and constant purchasers’ prices for the period 2009-2020.5 The graph reflects the contraction in the economy in 2020 as measured by GDP at constant prices/real GDP after nine consecutive years of economic growth. Real GDP declined by 5.7 percent in 2020, the largest economic contraction posted since the 7.2 percent decline posted in 2009. Current price
GDP/nominal GDP in 2020 declined at a marginally lower rate than real GDP, reflecting the increase in the general price level of goods and services. GDP at current prices declined by 5.6 percent in 2020, reversing the 7.5 percent increase recorded in 2019.
4Real GDP refers to GDP at constant (2015) prices, i.e. the inflation-adjusted GDP. 5The entire calculated GDP series runs from 2006-2020, therefore the growth rate series would then be
2007-2019. The GDP estimates up to 2005 are based on an indicator method and not direct calculations.

SYSTEM OF NATIONAL ACCOUNTS REPORT 2020
Economics and Statistics Office 9 9
CAYMAN ISLANDS GDP BY INDUSTRIAL ORIGIN CAYMAN ISLANDS GDP BY INDUSTRIAL ORIGIN
TABLE 2: GDP AT CONSTANT BASIC & PURCHASERS' PRICES, 2015=100 (CI$'000) TABLE ?: GDP AT CONSTANT BASIC PRICES, 2015=100 (CI$' 000)
INDUSTRY 2016 2017 2018R 2019R 2020
01 Agriculture & Fishing 15,248.3 16,414.4 16,578.4 17,306.0 17,042.3
02 Mining & Quarrying 9,039.0 9,178.6 9,676.4 10,506.1 9,818.0
03 Manufacturing 35,240.9 36,116.6 38,837.7 40,272.2 37,431.8
04 Electricity, Gas & Air Conditioning Supply 58,794.9 60,136.1 60,913.2 65,186.1 62,267.0
05 Water Supply, Sewerage & Waste Management 36,265.6 37,769.0 39,697.2 40,817.6 38,593.1
06 Construction 148,018.7 151,605.4 160,721.9 176,737.7 174,219.8
07 Wholesale & Retail Trade 252,355.8 261,236.3 275,479.7 291,693.1 282,703.1
08 Transport & Storage 140,561.5 143,700.3 148,675.4 154,436.4 89,157.4
09 Hotels & Restaurants 203,886.3 214,061.1 234,936.5 250,968.2 117,451.6
10 Information & Communication 112,259.9 114,390.2 114,145.3 119,905.8 115,039.7
11 Financial & Insurance Services 1,282,392.8 1,312,607.4 1,344,684.7 1,378,857.4 1,392,446.5
12 Real Estate Activities 353,667.4 361,981.4 369,574.2 379,084.1 367,686.6
13 Professional, Scientific & Technical Activities 524,542.0 546,269.4 565,573.3 583,527.9 624,232.2
14 Administrative & Support Service Activities 101,805.1 106,145.4 110,296.8 114,809.3 105,971.8
15 Public Administration & Defense 207,760.9 215,009.1 222,314.6 237,964.9 246,614.9
16 Education Services 93,377.9 97,566.1 101,595.1 109,168.1 107,520.9
17 Human Health & Social Work 138,677.2 148,167.0 156,669.9 163,069.2 173,372.1
18 Other Services 111,865.3 118,495.8 123,741.9 133,820.2 100,839.0
GDP at Constant Basic (2015) Prices 3,825,759.5 3,950,849.7 4,094,112.4 4,268,130.5 4,062,407.7
Add: Taxes Less Subsidies on Products 224,816.5 228,698.6 263,788.3 258,555.0 206,982.1
GDP at Constant Purchasers' (2015) Prices 4,050,576.0 4,179,548.2 4,357,900.7 4,526,685.5 4,269,389.8
R-revised
3.2 GDP by industrial origin The estimated real GDP (at purchasers’ prices) for the Cayman Islands declined to CI$4,269.4 million in 2020 from CI$4,526.7 million in 2019. The contraction in the economy was broad-based, with 14 of the 18 industries posting a decline in activity. The industries with the highest levels of decline in 2020 were the tourism supporting industries, i.e. hotel & restaurant services, transport & storage, and other services6. Positive economic outturn was posted by professional, scientific & technical activities, human health & social work services, public administration & defense, and financial & insurance services. Table 2 below provides a breakdown of real GDP by industry in purchasers’ prices.
6 The other services industry is dominated by diving, snorkeling & related watersport activities. It also
includes the activities of hairdressers, barbers, wedding planners, dry cleaners, churches, spas, etc.

SYSTEM OF NATIONAL ACCOUNTS REPORT 2020
Economics and Statistics Office 10 10
CAYMAN ISLANDS GDP BY INDUSTRIAL ORIGIN CAYMAN ISLANDS GDP BY INDUSTRIAL ORIGIN
TABLE 3: RATE OF GROWTH OF GDP AT CONSTANT BASIC & PURCHASERS' PRICES, 2015=100 TABLE 4: RATE OF GROWTH OF GDP AT CONSTANT PRICES, 2007=100
INDUSTRY 2016 2017 2018R 2019R 20205-Year
Average
Goods Producing Industries 4.7% 2.8% 5.9% 8.4% -2.6% 3.8%
01 Agriculture & Fishing 2.6% 7.6% 1.0% 4.4% -1.5% 2.8%
02 Mining & Quarrying 5.1% 1.5% 5.4% 8.6% -6.6% 2.7%
03 Manufacturing 8.1% 2.5% 7.5% 3.7% -7.1% 2.8%
06 Construction 4.1% 2.4% 6.0% 10.0% -1.4% 4.2%
Service Producing Industries 2.7% 3.3% 3.5% 4.0% -5.0% 1.7%
04 Electricity, Gas & Air Conditioning Supply 3.1% 2.3% 1.3% 7.0% -4.5% 1.8%
05 Water Supply, Sewerage & Waste Management 5.1% 4.1% 5.1% 2.8% -5.5% 2.3%
07 Wholesale & Retail Trade 5.4% 3.5% 5.5% 5.9% -3.1% 3.4%
08 Transport & Storage 2.0% 2.2% 3.5% 3.9% -42.3% -8.3%
09 Hotels & Restaurants 0.8% 5.0% 9.8% 6.8% -53.2% -10.3%
10 Information & Communication 2.7% 1.9% -0.2% 5.0% -4.1% 1.0%
11 Financial & Insurance Services 1.5% 2.4% 2.4% 2.5% 1.0% 2.0%
12 Real Estate Activities 3.3% 2.4% 2.1% 2.6% -3.0% 1.4%
13 Professional, Scientific & Technical Activities 3.4% 4.1% 3.5% 3.2% 7.0% 4.2%
14 Administrative & Support Service Activities 3.5% 4.3% 3.9% 4.1% -7.7% 1.5%
15 Public Administration & Defense 2.7% 3.5% 3.4% 7.0% 3.6% 4.0%
16 Education Services 5.2% 4.5% 4.1% 7.5% -1.5% 3.9%
17 Human Health & Social Work 6.2% 6.8% 5.7% 4.1% 6.3% 5.8%
18 Other Services 3.4% 5.9% 4.4% 8.1% -24.6% -1.4%
GDP at Constant Basic (2015) Prices 2.8% 3.3% 3.6% 4.3% -4.8% 1.8%
Taxes Less Subsidies on Products 10.7% 1.7% 15.3% -2.0% -19.9% 0.4%
GDP at Constant Purchasers' (2015) Prices 3.2% 3.2% 4.3% 3.9% -5.7% 1.7%
R-revised
Note: Average growth rate represents the geometric mean of the annual growth rates.
3.3 GDP rates of growth by industry Table 3 shows the growth rate of real GDP disaggregated by industry. The local economy posted a decline of 5.7 percent in 2020, yielding a 5-year (2016-2020) average growth rate of 1.7 percent. The economic downturn in 2020 resulted from the reduced output in both the goods-producing (-2.6%) and service-producing industries (-5.0%). All goods-producing industries recorded lower levels of activity in 2020 when compared to 2019 but still maintained a higher five-year annual average growth rate (3.8%) than the service-producing industries (1.7%). Despite the higher rate of decline in the services-producing industries in 2020 compared to goods-producing industries, the only industries
to post positive performances in 2020 were service-related.

SYSTEM OF NATIONAL ACCOUNTS REPORT 2020
Economics and Statistics Office 11 11
3.3.1 Goods-producing industries The goods-producing industries registered a decline in 2020, ending eight consecutive years of growth. Lower levels of activity were recorded for all industries, with the group registering a drop of 2.6 percent in 2020, after the 8.4 percent growth in 2019. The activities of agriculture & fishing decreased by 1.5 percent in 2020, following the 4.4 percent growth recorded in 2019. This decline resulted in a five-year annual average growth rate of 2.8 percent. The decrease in 2020 was due to the reduced activity in the sub-groups services relating to the farming of animals and capture fishing.
Mining & quarrying activities declined by 6.6 percent in 2020 when compared to 2019.
The reduction led to the industry recording a five-year annual average growth rate of 2.7 percent. The lower output in mining & quarrying came against the backdrop of the decline in the imports of construction aggregate, which decreased by 8.4 percent in 2020 (346,992 tons in 2020 from 378,615 tons in 2019).7 The manufacturing industry recorded the fifth largest (absolute) change in activity in 2020 after declining by 7.1 percent. This resulted in a five-year annual average growth rate of 2.8 percent. The reduced output in 2020 was widespread as all subgroups posted a decline.
The value-added of construction activities declined by 1.4 percent, reversing the 10.0 percent growth in 2019. This represents the first decline in economic activity since 2011. This contraction in 2020 resulted in a five-year annual average growth rate of
4.2 percent, which represented the highest average among the goods-producing industries over a similar period. The lower output level in 2020 is attributed to the reduced activity in the building installation sub-industry, which declined by 15.8 percent. The decline in the industry was tempered by the growth in building construction (6.9%) and road construction (4.9%).
7Source: https://www.caymanport.com/wp-content/uploads/cargo_stats.pdf

SYSTEM OF NATIONAL ACCOUNTS REPORT 2020
Economics and Statistics Office 12 12
3.3.2 Service-producing industries In 2020, the service-producing industries contracted by 5.0 percent, reversing nine consecutive years of expansion. The decline in 2020 resulted in a five-year annual average growth of 1.7 percent. The reduction in 2020 was broad-based, driven by lower levels of activity in all but four (4) industries, led primarily by the tourism-supporting activities of hotels & restaurants, transport & storage, and other services. The decrease of 4.5 percent in the electricity, gas & air conditioning supply industry represents the first decline in activity since 2012. The industry posted a five-year annual average growth of 1.8 percent. The reduction was partly influenced by a 3.5 percent
decrease in electricity consumption, which fell to 644,317 megawatt-hours (Mwhrs) in
2020 from 667,639 Mwhrs in 2019. The decrease in electricity consumption results from the decline in commercial electricity consumption, notwithstanding the increase in residential consumption. Activity in the water supply, sewerage & waste management industry fell by 5.5 percent in 2020, resulting in a five-year annual average increase of 2.3 percent. This decline is primarily due to the 5.2 percent contraction in water supply services underpinned by the reduction in the consumption of desalinated water from 2,058.6 million US gallons in 2019 to 1,951.6 million US gallons in 2020.
Wholesale & retail trade registered a decline of 3.1 percent in 2020, resulting in a five-year annual average growth rate of 3.4 percent. The reduced performance of the industry was influenced by a decline in aggregate demand related to the 5.9 percent decrease in the year-end population, which moved to 65,786 in 2020 from 69,914 in 2019. Transport & storage activities declined by 42.3 percent in 2020 amid the travel restrictions stemming from the global pandemic. The severe contraction in 2020 yielded a five-year annual average decrease of 8.3 percent; one of only two industries with a negative five-year average growth rate. The industry was severely impacted by the global travel restrictions and the attendant impact on tourism activities, which manifested in severe contractions in passenger air transport activities (-35.9%); sea transport (-62.0%); land transport services which include tourism-dependent taxi and tour services (-42.5%);
and transport supporting services (-44.3%). All subgroups within the transport services sub-industry posted declines in 2020. The decline in the industry was somewhat mitigated by the expansion in post and courier services which grew by 13.3 percent in 2020. The hotel & restaurant industry declined by 53.2 percent in 2020, representing the first decline since 2009 as the industry contended with the fallout from the cessation in tourism activity amidst the global pandemic. The industry posted the largest decline in

SYSTEM OF NATIONAL ACCOUNTS REPORT 2020
Economics and Statistics Office 13 13
activity for 2020. The decline in the industry was largely due to the 75.8 percent decline in stay-over visitors, which fell to 121.8 thousand in 2020 from 502.7 thousand in 2019. Accommodation services declined by 61.3 percent in 2020, after growing by
8.6 percent in 2019. The fallout from the decline in stay-over visitors was marginally mitigated by an increase in local utilization. Restaurant services contracted by 31.4 percent in 2020, reversing the 2.2 percent growth posted in 2019. Figure 3 illustrates the continued positive relationship between real GDP for the hotels & restaurants industry and the stay-over (air arrival) visitors (i.e. real GDP and visitor arrivals are trending in a similar direction). However, it should be noted that while both maintain a positive relationship, other underlying factors influence the movements in GDP for the hotels & restaurants industry.
Information & communication activities decreased by 4.1 percent in 2020 when compared to 2019. The decline resulted in a five-year annual average growth rate of 1.0 percent. The performance of the industry was negatively impacted by the 23.7 percent decline in the broadcasting sub-industry. There was a 2.7 percent and 2.9 percent increase in the telecommunication services, and computer & related services sub-industries respectively. Despite the widespread decline in economic activity in 2020, the financial & insurance services industry posted another year of expansion, growing by 1.0 percent. The industry continued to show consistent growth with a five-year annual average growth rate of 2.0 percent. The performance of the industry was broad-based, with all sub-industries
expanding in 2020 except for other financial services (-0.9%). The increased activity in the industry emanated from the growth in insurance and pension funding services (2.8%) and banking institutions which are the largest sub-industry (0.6%). The growth in the industry was weakened by the decline in other financial services8(-0.9%). Figure 4 provides a graphical display of the sector’s performance over the period 2009-2020.
8Other financial services include credit unions, building societies, remittance services, property trusts
services, securities dealing, securities brokerage, etc.

SYSTEM OF NATIONAL ACCOUNTS REPORT 2020
Economics and Statistics Office 14 14
Real estate activities recorded a decline of 3.0 percent in 2020, which resulted in a five-year annual average growth rate of 1.4 percent. The decline was broad-based with decreases in other real estate activities9 (-8.1%), renting of commercial buildings (-7.7%), renting of residential buildings (-3.3%), and operations of owner-occupied dwellings (-0.2%). The unfavourable performance of other real estate activities reflects the 9 percent decrease in the total value of property transfers in the Cayman Islands in 2020 (from
CI$862.2 million in 2019 to CI$784.5 million in 2020). The professional, scientific & technical activities industry withstood the impact of the global pandemic, growing by 7.0 percent in 2020. The industry recorded a five-year annual average growth rate of 4.2 percent, resulting from continued expansion since 2009. The 4.2 percent five-year average change represents the second-highest for the economy in 2020. The 2020 performance was most significantly impacted by the increase in the value-added of accounting services (11.5%) and legal services (7.6%). Administrative & support service activities declined by 7.7 percent in 2020. The decline in 2020 led to a five-year annual average growth rate of 1.5 percent. The performance of the industry was driven by reduced activity in car rental services (-41.7%), landscaping
activities (-4.8%), and building cleaning activities (-3.1%). Security services grew by 2.7 percent. Public administration & defence activities recorded a growth of 3.6 percent in 2020, albeit lower than the 7.0 percent recorded in 2019. This resulted in a five-year annual average growth rate of 4.0 percent. The expansion in public administration services may
9Other real estate activities include real estate agents and brokers and property managers.

SYSTEM OF NATIONAL ACCOUNTS REPORT 2020
Economics and Statistics Office 15 15
be attributed (in part) to the increase in the number of core government employees. Personnel costs increased by 17.0 percent, moving to CI$386.8 million in 2020, from CI$330.6 million in 2019. Education services posted a decline of 1.5 percent in 2020, after eight consecutive years of growth. The decline in 2020 resulted in a five-year annual average growth rate of 3.9 percent. The lower output levels resulted from the 8.4 percent decline in private education services while public education services expanded by 4.4 percent. The human health & social work industry continued its upward trend, growing by 6.3 percent in 2020, outpacing the 4.1 percent posted in 2019. The performance in 2020
resulted in a five-year annual average growth of 5.8 percent; the highest for the economy in 2020. The continued improvement in the performance of both private and public health services positively impacted the performance of the industry. In 2020, amidst the global pandemic, private health services continued to be the main driver of growth, expanding by 9.1 percent, while public health services grew by 3.2 percent. The value-added of other services recorded a decline of 24.6 percent in 2020. All sub-industries within the industry declined, with the main contributor being water sport activities (-68.4). The decrease in the output of water sports activities was due to the 71.7 percent decrease in total visitors to the island in 2020 compared to 2019, as tourist-related activities grounded to a halt due to the global pandemic. The activities of private
households with employed persons declined by 12.1 percent. In summary, the Cayman Islands’ economy recorded its second-lowest annual growth rate for the directly calculated GDP series in 2020 (-5.7%).10 The decrease in activity in 2020 represents a reversal of the 3.9 percent posted in 2019, 4.3 percent in 2018, and 3.2 percent in 2017. This decline led to a five-year annual average growth rate of 1.7 percent for the local economy. Domestic economic activity was hampered by the general decline in the aggregate demand for goods and services associated with the fallout from the COVID-19 pandemic. The global travel restrictions, border closures, and public health measures implemented to combat the spread of the virus severely impacted tourist-related activities. The pandemic led to a decline in the resident population, stay-over visitors, and cruise visitors. The sustained growth in financial & insurance services,
professional, scientific & technical activities, and human health & social work services helped to mitigate the impact of the pandemic on the local economy.
10The calculated GDP series started in 2006. Prior to 2006 GDP estimates for the Cayman Islands were
derived using indicators, not direct calculations.

SYSTEM OF NATIONAL ACCOUNTS REPORT 2020
Economics and Statistics Office 16 16
CAYMAN ISLANDS GDP BY INDUSTRIAL ORIGIN
TABLE 4: INDUSTRY CONTRIBUTION TO GROWTH IN GDP AT CONSTANT PURCHASERS' PRICES, 2015=100
INDUSTRY 2016 2017 2018 2019 2020
Goods Producing Industries 0.2% 0.1% 0.3% 0.4% -0.1%
01 Agriculture & Fishing 0.01% 0.03% 0.00% 0.02% -0.01%
02 Mining & Quarrying 0.01% 0.00% 0.01% 0.02% -0.02%
03 Manufacturing 0.07% 0.02% 0.07% 0.03% -0.06%
06 Construction 0.15% 0.09% 0.22% 0.37% -0.06%
Service Producing Industries 2.4% 2.9% 3.1% 3.6% -4.4%
04 Electricity, Gas & Air Conditioning Supply 0.04% 0.03% 0.02% 0.10% -0.06%
05 Water Supply, Sewerage & Waste Management 0.05% 0.04% 0.05% 0.03% -0.05%
07 Wholesale & Retail Trade 0.33% 0.22% 0.34% 0.37% -0.20%
08 Transport & Storage 0.07% 0.08% 0.12% 0.13% -1.44%
09 Hotels & Restaurants 0.04% 0.25% 0.50% 0.37% -2.95%
10 Information & Communication 0.08% 0.05% -0.01% 0.13% -0.11%
11 Financial & Insurance Services 0.47% 0.75% 0.77% 0.78% 0.30%
12 Real Estate Activities 0.29% 0.21% 0.18% 0.22% -0.25%
13 Professional, Scientific & Technical Activities 0.44% 0.54% 0.46% 0.41% 0.90%
14 Administrative & Support Service Activities 0.09% 0.11% 0.10% 0.10% -0.20%
15 Public Administration & Defense 0.14% 0.18% 0.17% 0.36% 0.19%
16 Education Services 0.12% 0.10% 0.10% 0.17% -0.04%
17 Human Health & Social Work 0.21% 0.23% 0.20% 0.15% 0.23%
18 Other Services 0.09% 0.16% 0.13% 0.23% -0.73%
GDP at Constant Basic (2015) Prices 2.7% 3.1% 3.4% 4.0% -4.5%
Taxes Less Subsidies on Products 0.55% 0.10% 0.84% -0.12% -1.14%
GDP at Constant Purchasers' (2015) Prices 3.2% 3.2% 4.3% 3.9% -5.7%
3.4 Contribution to growth in GDP by industry The impact of the COVID-19 related travel restrictions significantly impacted tourism-dependent services in 2020 as visitor arrivals declined significantly. The largest declines in economic activity in 2020 was recorded by hotel & restaurant services (-53.2%); transport & storage services (-42.3%); and other services (-24.6%). The contribution to growth in GDP shows the weighted impact of the industry level changes to the overall change in GDP. The industry changes in GDP are weighted by their contribution to GDP to present a more comprehensive examination of the impact on the change in GDP. Thus, contributions to growth reflect two effects: the speed with which a
component changes and the relative importance of the component in total GDP. Table 4 reveals that of the 5.7 percent decline in real GDP in 2020, hotel & restaurant services was responsible for -2.95 percent; transport & storage services for -1.44 percent; net taxes on products for -1.14%; and professional, scientific & technical activities for 0.9 percent.

SYSTEM OF NATIONAL ACCOUNTS REPORT 2020
Economics and Statistics Office 17 17
CAYMAN ISLANDS GDP BY INDUSTRIAL ORIGIN
TABLE 5: INDUSTRY SHARE OF GDP AT CONSTANT PURCHASERS' PRICES, 2015=100
INDUSTRY 2016 2017 2018R 2019R 2020
Goods Producing Industries 5.1% 5.1% 5.2% 5.4% 5.6%
01 Agriculture & Fishing 0.4% 0.4% 0.4% 0.4% 0.4%
02 Mining & Quarrying 0.2% 0.2% 0.2% 0.2% 0.2%
03 Manufacturing 0.9% 0.9% 0.9% 0.9% 0.9%
06 Construction 3.7% 3.6% 3.7% 3.9% 4.1%
Service Producing Industries 89.3% 89.4% 88.8% 88.9% 89.6%
04 Electricity, Gas & Air Conditioning Supply 1.5% 1.4% 1.4% 1.4% 1.5%
05 Water Supply, Sewerage & Waste Management 0.9% 0.9% 0.9% 0.9% 0.9%
07 Wholesale & Retail Trade 6.2% 6.3% 6.3% 6.4% 6.6%
08 Transport & Storage 3.5% 3.4% 3.4% 3.4% 2.1%
09 Hotels & Restaurants 5.0% 5.1% 5.4% 5.5% 2.8%
10 Information & Communication 2.8% 2.7% 2.6% 2.6% 2.7%
11 Financial & Insurance Services 31.7% 31.4% 30.9% 30.5% 32.6%
12 Real Estate Activities 8.7% 8.7% 8.5% 8.4% 8.6%
13 Professional, Scientific & Technical Activities 12.9% 13.1% 13.0% 12.9% 14.6%
14 Administrative & Support Service Activities 2.5% 2.5% 2.5% 2.5% 2.5%
15 Public Administration & Defense 5.1% 5.1% 5.1% 5.3% 5.8%
16 Education Services 2.3% 2.3% 2.3% 2.4% 2.5%
17 Human Health & Social Work 3.4% 3.5% 3.6% 3.6% 4.1%
18 Other Services 2.8% 2.8% 2.8% 3.0% 2.4%
GDP at Constant Basic (2015) Prices 94.4% 94.5% 93.9% 94.3% 95.2%
Taxes Less Subsidies on Products 5.6% 5.5% 6.1% 5.7% 4.8%
GDP at Constant Purchasers' (2015) Prices 100.0% 100.0% 100.0% 100.0% 100.0%
R-revised
3.5 Share of GDP by industry Table 5 shows the industries classified as goods-producing and service-producing. In 2020, there was an increase in the combined share of the goods-producing industries, which moved to 5.6 percent from 5.4 percent in 2019. The increase resulted from the increase in the share of construction, which increased to 4.1 percent from 3.9 percent in 2019. The share of the services-producing industries increased in 2020, moving to 89.6 percent from 88.9 percent in 2019. The service-producing industries that increased their share of real GDP in 2020 are financial & insurance services, professional, scientific & technical activities, public administration & defense, human health & social work, real estate activities, wholesale & retail trade, education services, information & communication,
and electricity, gas & air conditioning. These increases were offset by the declines in the shares of hotels & restaurants, transport & storage, and other services.

SYSTEM OF NATIONAL ACCOUNTS REPORT 2020
Economics and Statistics Office 18 18
CAYMAN ISLANDS GDP BY INDUSTRIAL ORIGIN
2016 2017 2018 2019 2020 2016 2017 2018 2019 2020
1 1 1 1 1 Financial & Insurance Services 31.7 31.4 30.9 30.5 32.6
2 2 2 2 2 Professional, Scientific & Technical Activities 12.9 13.1 13.0 12.9 14.6
3 3 3 3 3 Real Estate Activities 8.7 8.7 8.5 8.4 8.6
4 4 4 4 4 Wholesale & Retail Trade 6.2 6.3 6.3 6.4 6.6
5 5 6 6 5 Public Administration & Defense 5.1 5.1 5.1 5.3 5.8
7 7 7 7 6 Construction 3.7 3.6 3.7 3.9 4.1
9 8 8 8 7 Human Health & Social Work 3.4 3.5 3.6 3.6 4.1
6 6 5 5 8 Hotels & Restaurants 5.0 5.1 5.4 5.5 2.8
10 11 11 11 9 Information & Communication 2.8 2.7 2.6 2.6 2.7
13 13 13 13 10 Education Services 2.3 2.3 2.3 2.4 2.5
12 12 12 12 11 Administrative & Support Service Activities 2.5 2.5 2.5 2.5 2.5
11 10 10 10 12 Other Services 2.8 2.8 2.8 3.0 2.4
8 9 9 9 13 Transport & Storage 3.5 3.4 3.4 3.4 2.1
14 14 14 14 14 Electricity, Gas & Air Conditioning Supply 1.5 1.4 1.4 1.4 1.5
15 15 15 15 15 Water Supply, Sewerage & Waste Management 0.9 0.9 0.9 0.9 0.9
16 16 16 16 16 Manufacturing 0.9 0.9 0.9 0.9 0.9
17 17 17 17 17 Agriculture & Fishing 0.4 0.4 0.4 0.4 0.4
18 18 18 18 18 Mining & Quarrying 0.2 0.2 0.2 0.2 0.2
GDP at Constant Basic (2015) Prices 94.4 94.5 93.9 94.3 95.2
Add: Taxes Less Subsidies on Products 5.6 5.5 6.1 5.7 4.8
GDP at Constant Purchasers' (2015) Prices 100.0 100.0 100.0 100.0 100.0
INDUSTRY
TABLE 6: INDUSTRY SHARE OF GDP AT CONSTANT PURCHASERS' PRICES, 2015=100
Ranking % Share of GDP
An examination of the share of the various industries in the domestic economy is useful in discerning their relative ranking. Table 6 below shows the share of the eighteen (18) industries as well as their ranking over the period under review. The rankings reflect the relative importance of the industry (as it pertains to their direct share of real GDP) to the Cayman Islands’ economy. There were several changes in the relative ranking of the industries in 2020 compared to 2019, as the global pandemic disproportionately impacted the various industries. These changes were observed between rankings five (5) through thirteen (13), with the tourist-dependent industries of hotels & restaurants, transport & storage and other services posting the most significant drop in the rankings. Transport & storage activities fell four places from 9th in 2019 to 13th in 2020. Hotel & restaurant services fell three places from 5th to 8th, while other services fell two places from 10th to
12th place. Thirteen (13) of the eighteen (18) industries registered a change in their share of real GDP in 2020, with ten increasing their share and three decreasing their share.

SYSTEM OF NATIONAL ACCOUNTS REPORT 2020
Economics and Statistics Office 19 19
The share of financial & insurance services grew in 2020 as the industry consolidated its dominance as the industry with the largest share of real GDP for the Cayman Islands. The contribution of the industry increased to 32.6 percent in 2020, up from the 30.5 percent share in 2019. This represents a turnaround after seven consecutive years of declining share. The increase of 2.1 percentage points in 2020 occurred as the industry exhibited some resilience to the global pandemic as other industries experienced the negative of the exogenous shock to the Cayman economy. The share of the professional, scientific & technical activities industry increased by 1.7 percentage points, with its share moving to 14.6 percent, from 12.9 percent in 2019. This increase saw the industry maintain its position of the second-largest share of real GDP.
Other noteworthy shares of real GDP in 2020 came from real estate activities, wholesale & retail trade, public administration & defence, construction and human health & social work. Real estate activities increased to 8.6 percent in 2020, up from 8.4 percent in 2019. There was an increase in the share of wholesale & retail trade in 2020 when compared to 2019, moving to 6.6 percent of real GDP from 6.4 percent. Public administration also increased, moving to 5.8 percent from the 5.3 percent posted in 2019. Despite the decline in construction activities, the industry improved to sixth place from seventh as it increased its share from 3.9 percent to 4.1 percent. Human health also moved up one place from eighth to seventh with an increase in share from 3.6 percent in 2019 to 4.1 percent in 2020.
The tourism-dependent industries posted notable declines in their share of real GDP in 2020. The share of hotel & restaurant services declined significantly from 5.5 percent in 2019 to 2.8 percent in 2020. Transport & storage activities also lost share in 2020, declining from 3.4 percent to 2.1 percent. Other services declined in share from 3.0 percent in 2019 to 2.4 percent in 2020.

SYSTEM OF NATIONAL ACCOUNTS REPORT 2020
Economics and Statistics Office 20 20
CAYMAN ISLANDS GDP BY INDUSTRIAL ORIGIN CAYMAN ISLANDS GDP BY INDUSTRIAL ORIGIN
TABLE 7: GDP AT CURRENT BASIC & PURCHASERS' PRICES (CI$'000) TABLE : GDP AT CURRENT BASIC PRICES (CI$' 000)
INDUSTRY 2016 2017 2018R 2019R 2020
01 Agriculture & Fishing 16,342.2 18,009.4 18,829.6 20,514.7 20,659.5
02 Mining & Quarrying 9,742.1 9,800.7 10,353.7 11,839.5 11,517.3
03 Manufacturing 35,170.4 36,556.8 41,066.8 44,245.2 42,504.9
04 Electricity, Gas & Air Conditioning Supply 63,528.8 62,011.1 69,149.3 74,566.7 72,168.2
05 Water Supply, Sewerage & Waste Management 36,533.2 38,448.9 40,593.0 42,950.9 38,478.4
06 Construction 153,016.6 162,892.1 180,526.7 207,724.0 207,256.6
07 Wholesale & Retail Trade 248,672.8 261,591.6 278,027.3 297,629.2 274,459.1
08 Transport & Storage 141,825.2 146,950.9 153,723.6 163,770.3 95,370.5
09 Hotels & Restaurants 212,028.2 226,897.4 257,802.7 293,882.9 149,401.1
10 Information & Communication 115,055.0 120,751.6 119,799.7 132,286.0 124,713.4
11 Financial & Insurance Services 1,286,911.3 1,358,253.8 1,438,627.6 1,484,691.4 1,483,255.0
12 Real Estate Activities 353,873.5 366,347.7 369,674.2 429,947.9 426,635.3
13 Professional, Scientific & Technical Activities 532,806.7 566,912.7 601,573.2 646,004.9 687,929.5
14 Administrative & Support Service Activities 103,105.3 108,960.7 115,760.6 123,004.9 113,709.1
15 Public Administration & Defense 213,321.9 227,211.3 241,180.4 267,758.9 291,560.5
16 Education Services 94,517.4 99,203.1 105,707.3 119,610.4 119,296.4
17 Human Health & Social Work 139,289.9 147,670.2 160,414.2 167,861.7 190,480.6
18 Other Services 112,207.0 119,276.7 126,386.3 141,732.9 105,894.3
GDP at Current Basic Prices 3,867,947.6 4,077,746.6 4,329,196.2 4,670,022.3 4,455,289.6
Add: Taxes Less Subsidies on Products 223,137.9 227,470.6 279,267.4 282,770.5 218,681.1
GDP at Current Purchasers' Prices 4,091,085.5 4,305,217.2 4,608,463.6 4,952,792.8 4,673,970.7
R-revised
3.6 Industry GDP at current prices

SYSTEM OF NATIONAL ACCOUNTS REPORT 2020
Economics and Statistics Office 21 21
TABLE 8: DETAILED VALUE ADDED BY INDUSTRY CURRENT/NOMINAL (CI$'000) CONSTANT/REAL (CI$'000) IMPLICIT DEFLATOR
AGRICULTURE & FISHING 16,342.2 18,009.4 18,829.6 20,514.7 20,659.5 15,248.3 16,414.4 16,578.4 17,306.0 17,042.3
Growing of Agricultural Crops 13,382.5 14,538.3 14,999.6 15,990.8 16,708.0 12,645.7 13,724.6 13,801.7 14,448.4 14,529.0
Farming of Animals 1,057.2 1,275.8 1,396.9 1,535.3 1,601.1 1,051.8 1,112.5 1,123.1 1,120.9 1,073.9
Capture Fishing 1,902.4 2,195.3 2,433.2 2,988.7 2,350.3 1,550.8 1,577.4 1,653.5 1,736.6 1,439.4
MINING & QUARRYING 9,742.1 9,800.7 10,353.7 11,839.5 11,517.3 9,039.0 9,178.6 9,676.4 10,506.1 9,818.0
Quarrying incl. Stone, Sand and Gravel 9,742.1 9,800.7 10,353.7 11,839.5 11,517.3 9,039.0 9,178.6 9,676.4 10,506.1 9,818.0
MANUFACTURING 35,170.4 36,556.8 41,066.8 44,245.2 42,504.9 35,240.9 36,116.6 38,837.7 40,272.2 37,431.8
Food Products, Beverages and Tobacco Products 9,094.6 9,561.6 10,360.7 11,225.1 11,281.5 8,955.1 9,136.4 9,590.9 10,404.7 10,279.6
Builders' Carpentry and Joinery, incl. Furniture and Rubber and
Plastic Product 3,121.4 3,259.5 3,669.8 4,147.8 3,280.2 3,133.5 3,139.9 3,334.3 3,522.3 2,761.0
Non-Metallic Mineral Products (incl. Glass and Glass
Products, Concrete, Cement) 12,021.1 12,442.1 15,042.7 15,801.9 16,542.2 12,001.7 12,676.3 14,062.7 14,051.9 14,043.4
Basic Metals, Fabricated Metal Products, Machinery &
Equipment 4,168.4 4,412.1 4,735.5 5,126.6 4,721.1 4,191.8 4,099.9 4,341.0 4,342.8 3,987.4
Other Manufacturing Goods n.e.c. 6,764.9 6,881.6 7,258.2 7,943.7 6,680.0 6,958.8 7,064.1 7,508.9 7,950.6 6,360.3
ELECTRICITY, GAS & AIR CONDITIONING SUPPLY 63,528.8 62,011.1 69,149.3 74,566.7 72,168.2 58,794.9 60,136.1 60,913.2 65,186.1 62,267.0
Production, Collection and Distribution of Electricity and the
Manufacture of Ice 63,528.8 62,011.1 69,149.3 74,566.7 72,168.2 58,794.9 60,136.1 60,913.2 65,186.1 62,267.0
WATER SUPPLY, SEWERAGE & WASTE MANAGEMENT 36,533.2 38,448.9 40,593.0 42,950.9 38,478.4 36,265.6 37,769.0 39,697.2 40,817.6 38,593.1
Water Collection, Treatment and Distribution, Sewerage and
Waste Collection 36,533.2 38,448.9 40,593.0 42,950.9 38,478.4 36,265.6 37,769.0 39,697.2 40,817.6 38,593.1
CONSTRUCTION 153,016.6 162,892.1 180,526.7 207,724.0 207,256.6 148,018.7 151,605.4 160,721.9 176,737.7 174,219.8
Construction (incl building installation, building completion, etc.) 153,016.6 162,892.1 180,526.7 207,724.0 207,256.6 148,018.7 151,605.4 160,721.9 176,737.7 174,219.8
WHOLESALE & RETAIL TRADE 248,672.8 261,591.6 278,027.3 297,629.2 274,459.1 252,355.8 261,236.3 275,479.7 291,693.1 282,703.1
Wholesale & Retail Trade 248,672.8 261,591.6 278,027.3 297,629.2 274,459.1 252,355.8 261,236.3 275,479.7 291,693.1 282,703.1
TRANSPORT & STORAGE 141,825.2 146,950.9 153,723.6 163,770.3 95,370.5 140,561.5 143,700.3 148,675.4 154,436.4 89,157.4
Transport 66,120.7 65,387.7 66,737.9 72,539.1 41,934.9 64,176.9 64,433.2 67,061.5 70,584.3 38,775.8
Supporting Activities for Transport (incl Cargo) 67,680.7 72,538.8 77,782.0 81,744.0 43,299.3 68,327.2 70,571.5 72,708.3 75,034.6 40,660.6
Post and Courier Activities 8,023.8 9,024.4 9,203.7 9,487.3 10,136.4 8,057.4 8,695.6 8,905.6 8,817.4 9,721.0
HOTELS & RESTAURANTS 212,028.2 226,897.4 257,802.7 293,882.9 149,401.1 203,886.3 214,061.1 234,936.5 250,968.2 117,451.6
Hotels & Other Short-Term Accommodations Activities 150,455.2 162,718.2 186,787.2 217,559.2 98,630.3 143,408.3 152,368.0 168,646.2 183,214.4 70,950.4
Restaurants, Bars & Other Food Service Activities 61,573.0 64,179.1 71,015.5 76,323.7 50,770.8 60,478.0 61,693.1 66,290.3 67,753.8 46,501.1
INFORMATION & COMMUNICATION 115,055.0 120,751.6 119,799.7 132,286.0 124,713.4 112,259.9 114,390.2 114,145.3 119,905.8 115,039.7
Motion Picture Projection, Radio & TV Programming and
Broadcasting and Telecommunications Activities 86,424.6 93,073.6 91,341.2 101,619.8 95,995.5 83,224.7 86,452.1 85,685.6 90,718.8 88,994.5
Publishing, Printing and Computer & Data Processing Services 28,630.4 27,678.0 28,458.5 30,666.2 28,717.9 29,035.2 27,938.1 28,459.7 29,187.0 26,045.2
2019R2018RINDUSTRY 2016 2017 2020 2018R2019R 202020172016
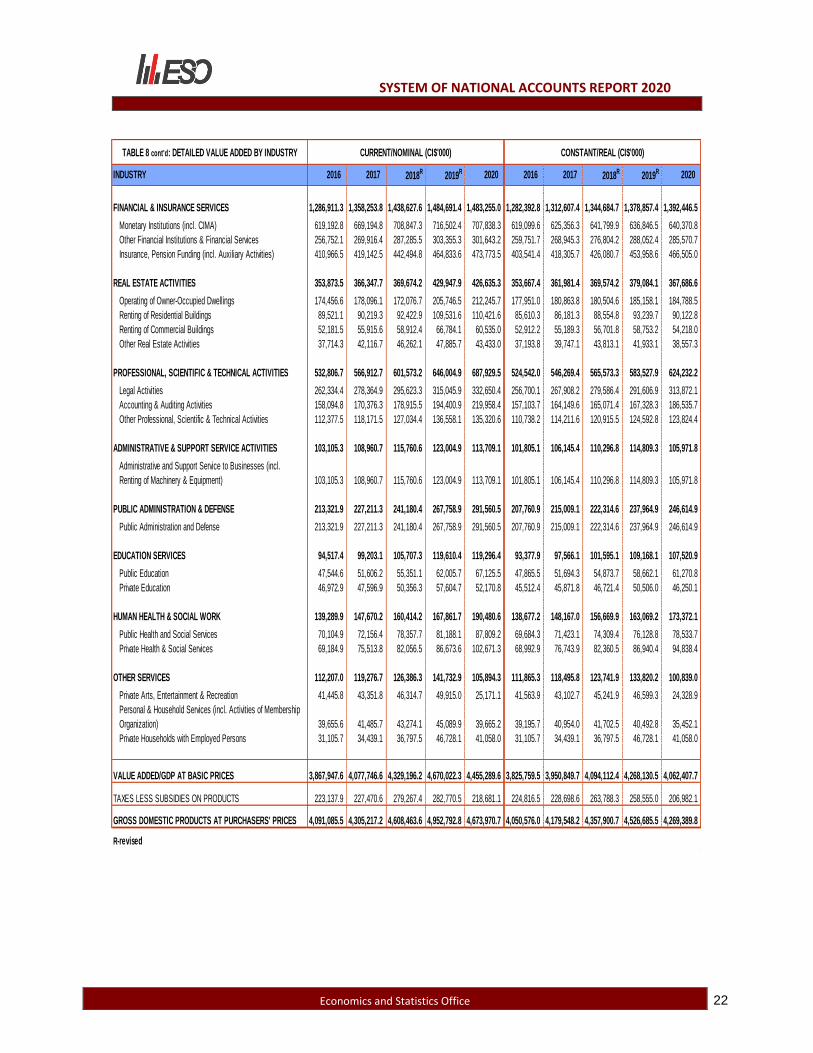
3.7 Detailed value added by industry
SYSTEM OF NATIONAL ACCOUNTS REPORT 2020
Economics and Statistics Office 22 22
TABLE 8 cont'd: DETAILED VALUE ADDED BY INDUSTRY CURRENT/NOMINAL (CI$'000) CONSTANT/REAL (CI$'000)
FINANCIAL & INSURANCE SERVICES 1,286,911.3 1,358,253.8 1,438,627.6 1,484,691.4 1,483,255.0 1,282,392.8 1,312,607.4 1,344,684.7 1,378,857.4 1,392,446.5
Monetary Institutions (incl. CIMA) 619,192.8 669,194.8 708,847.3 716,502.4 707,838.3 619,099.6 625,356.3 641,799.9 636,846.5 640,370.8
Other Financial Institutions & Financial Services 256,752.1 269,916.4 287,285.5 303,355.3 301,643.2 259,751.7 268,945.3 276,804.2 288,052.4 285,570.7
Insurance, Pension Funding (incl. Auxiliary Activities) 410,966.5 419,142.5 442,494.8 464,833.6 473,773.5 403,541.4 418,305.7 426,080.7 453,958.6 466,505.0
REAL ESTATE ACTIVITIES 353,873.5 366,347.7 369,674.2 429,947.9 426,635.3 353,667.4 361,981.4 369,574.2 379,084.1 367,686.6
Operating of Owner-Occupied Dwellings 174,456.6 178,096.1 172,076.7 205,746.5 212,245.7 177,951.0 180,863.8 180,504.6 185,158.1 184,788.5
Renting of Residential Buildings 89,521.1 90,219.3 92,422.9 109,531.6 110,421.6 85,610.3 86,181.3 88,554.8 93,239.7 90,122.8
Renting of Commercial Buildings 52,181.5 55,915.6 58,912.4 66,784.1 60,535.0 52,912.2 55,189.3 56,701.8 58,753.2 54,218.0
Other Real Estate Activities 37,714.3 42,116.7 46,262.1 47,885.7 43,433.0 37,193.8 39,747.1 43,813.1 41,933.1 38,557.3
PROFESSIONAL, SCIENTIFIC & TECHNICAL ACTIVITIES 532,806.7 566,912.7 601,573.2 646,004.9 687,929.5 524,542.0 546,269.4 565,573.3 583,527.9 624,232.2
Legal Activities 262,334.4 278,364.9 295,623.3 315,045.9 332,650.4 256,700.1 267,908.2 279,586.4 291,606.9 313,872.1
Accounting & Auditing Activities 158,094.8 170,376.3 178,915.5 194,400.9 219,958.4 157,103.7 164,149.6 165,071.4 167,328.3 186,535.7
Other Professional, Scientific & Technical Activities 112,377.5 118,171.5 127,034.4 136,558.1 135,320.6 110,738.2 114,211.6 120,915.5 124,592.8 123,824.4
ADMINISTRATIVE & SUPPORT SERVICE ACTIVITIES 103,105.3 108,960.7 115,760.6 123,004.9 113,709.1 101,805.1 106,145.4 110,296.8 114,809.3 105,971.8
Administrative and Support Service to Businesses (incl.
Renting of Machinery & Equipment) 103,105.3 108,960.7 115,760.6 123,004.9 113,709.1 101,805.1 106,145.4 110,296.8 114,809.3 105,971.8
PUBLIC ADMINISTRATION & DEFENSE 213,321.9 227,211.3 241,180.4 267,758.9 291,560.5 207,760.9 215,009.1 222,314.6 237,964.9 246,614.9
Public Administration and Defense 213,321.9 227,211.3 241,180.4 267,758.9 291,560.5 207,760.9 215,009.1 222,314.6 237,964.9 246,614.9
EDUCATION SERVICES 94,517.4 99,203.1 105,707.3 119,610.4 119,296.4 93,377.9 97,566.1 101,595.1 109,168.1 107,520.9
Public Education 47,544.6 51,606.2 55,351.1 62,005.7 67,125.5 47,865.5 51,694.3 54,873.7 58,662.1 61,270.8
Private Education 46,972.9 47,596.9 50,356.3 57,604.7 52,170.8 45,512.4 45,871.8 46,721.4 50,506.0 46,250.1
HUMAN HEALTH & SOCIAL WORK 139,289.9 147,670.2 160,414.2 167,861.7 190,480.6 138,677.2 148,167.0 156,669.9 163,069.2 173,372.1
Public Health and Social Services 70,104.9 72,156.4 78,357.7 81,188.1 87,809.2 69,684.3 71,423.1 74,309.4 76,128.8 78,533.7
Private Health & Social Services 69,184.9 75,513.8 82,056.5 86,673.6 102,671.3 68,992.9 76,743.9 82,360.5 86,940.4 94,838.4
OTHER SERVICES 112,207.0 119,276.7 126,386.3 141,732.9 105,894.3 111,865.3 118,495.8 123,741.9 133,820.2 100,839.0
Private Arts, Entertainment & Recreation 41,445.8 43,351.8 46,314.7 49,915.0 25,171.1 41,563.9 43,102.7 45,241.9 46,599.3 24,328.9
Personal & Household Services (incl. Activities of Membership
Organization) 39,655.6 41,485.7 43,274.1 45,089.9 39,665.2 39,195.7 40,954.0 41,702.5 40,492.8 35,452.1
Private Households with Employed Persons 31,105.7 34,439.1 36,797.5 46,728.1 41,058.0 31,105.7 34,439.1 36,797.5 46,728.1 41,058.0
VALUE ADDED/GDP AT BASIC PRICES 3,867,947.6 4,077,746.6 4,329,196.2 4,670,022.3 4,455,289.6 3,825,759.5 3,950,849.7 4,094,112.4 4,268,130.5 4,062,407.7
TAXES LESS SUBSIDIES ON PRODUCTS 223,137.9 227,470.6 279,267.4 282,770.5 218,681.1 224,816.5 228,698.6 263,788.3 258,555.0 206,982.1
GROSS DOMESTIC PRODUCTS AT PURCHASERS' PRICES 4,091,085.5 4,305,217.2 4,608,463.6 4,952,792.8 4,673,970.7 4,050,576.0 4,179,548.2 4,357,900.7 4,526,685.5 4,269,389.8
R-revised
2019RINDUSTRY 2016 2017 2018R 2020 2018R2019R 202020172016

SYSTEM OF NATIONAL ACCOUNTS REPORT 2020
Economics and Statistics Office 23 23
CAYMAN ISLANDS GROSS DOMESTIC (GDP) TABLES
TABLE 9: GDP IMPLICIT PRICE INDEX (IPI), 2015=100
INDUSTRY 2013 2014 2015 2016 2017 2018 2019 2020
01 Agriculture & Fishing 93.2 93.6 100.0 107.2 109.7 113.6 118.5 121.2
02 Mining & Quarrying 96.6 99.7 100.0 107.8 106.8 107.0 112.7 117.3
03 Manufacturing 94.3 98.4 100.0 99.8 101.2 105.7 109.9 113.6
04 Electricity, Gas & Air Conditioning Supply 98.9 94.3 100.0 108.1 103.1 113.5 114.4 115.9
05 Water Supply, Sewerage & Waste Management 96.9 98.2 100.0 100.7 101.8 102.3 105.2 99.7
06 Construction 97.8 99.8 100.0 103.4 107.4 112.3 117.5 119.0
07 Wholesale & Retail Trade 96.5 98.5 100.0 98.5 100.1 100.9 102.0 97.1
08 Transport & Storage 92.2 96.1 100.0 100.9 102.3 103.4 106.0 107.0
09 Hotels & Restaurants 89.6 94.1 100.0 104.0 106.0 109.7 117.1 127.2
10 Information & Communication 94.2 97.7 100.0 102.5 105.6 105.0 110.3 108.4
11 Financial & Insurance Services 98.4 100.0 100.0 100.4 103.5 107.0 107.7 106.5
12 Real Estate Activities 102.9 102.7 100.0 100.1 101.2 100.0 113.4 116.0
13 Professional, Scientific & Technical Activities 99.5 100.3 100.0 101.6 103.8 106.4 110.7 110.2
14 Administrative & Support Service Activities 99.0 99.9 100.0 101.3 102.7 105.0 107.1 107.3
15 Public Administration & Defense 94.0 95.5 100.0 102.7 105.7 108.5 112.5 118.2
16 Education Services 98.2 99.1 100.0 101.2 101.7 104.0 109.6 111.0
17 Human Health & Social Work 97.2 98.6 100.0 100.4 99.7 102.4 102.9 109.9
18 Other Services 97.2 100.0 100.0 100.3 100.7 102.1 105.9 105.0
GDP Implicit Deflator at Basic Prices 98.2 99.6 100.0 101.1 103.2 105.7 109.4 109.7
Add: Taxes Less Subsidies on Products 109.1 102.0 100.0 99.3 99.5 105.9 109.4 105.7
GDP Implicit Deflator at Purchasers' Prices 98.8 99.7 100.0 101.0 103.0 105.7 109.4 109.5
GDP IPI (Basic Prices) percentage change 1.3% 1.4% 0.4% 1.1% 2.1% 2.5% 3.5% 0.2%
GDP IPI (Purchasers' Prices) percentage change 1.4% 0.9% 0.3% 1.0% 2.0% 2.7% 3.5% 0.1%
CPI percentage change 2.2% 1.2% -2.3% -0.7% 2.0% 3.0% 6.0% 1.0%
3.8 Implicit price index by industry The GDP Implicit Price Index (IPI) is an indicator of price inflation calculated by dividing the current price GDP (nominal GDP) by the constant price GDP (real GDP). This index measures the implicit prices of all the final goods and services produced in the local economy. It is used to gauge the inflationary tendency in the economy, similar to the Consumer Price Index (CPI) and the Producer Price Index (PPI). The IPI is derived indirectly from the estimates of GDP in constant and current prices, unlike the CPI or PPI, which are derived directly from the collected price data for the items included in the index. Table 9 below shows the IPI by industry for the Cayman Islands for the period 2013-2020.
The IPI by industry provides information on the inflationary tendency at the industry level. The IPI for the base year (in this case, 2015) is equal to 100. Economy-wide inflation (as measured by the purchasers’ price GDP IPI) increased by 0.1 percent in 2020, a slowing from 3.5 percent in 2019. Inflation (as measured by the CPI) increased by 1.0 percent in 2020.

SYSTEM OF NATIONAL ACCOUNTS REPORT 2020
Economics and Statistics Office 24 24
CAYMAN ISLANDS GDP BY INDUSTRIAL ORIGIN CAYMAN ISLANDS GDP BY INDUSTRIAL ORIGIN
TABLE 10: PRODUCTION AND COST COMPONENTS OF VALUE ADDED AT CURRENT BASIC & PURCHASERS' PRICES 2020 (CI$'000) TABLE ?: GDP CONTRIBUTION AT CURRENT BASIC PRICES
INDUSTRYGross Value
Added1, 1a, 1b
Gross
Output
Intermediate
Consumption
Compensation
of Employees
Operating
Surplus/Mixed
Income
Consumption
of Fixed
Capital2
Taxes less
Subsidies on
Production
01 Agriculture & Fishing 20,659.5 29,490.7 8,831.2 7,991.8 11,429.0 789.2 449.4
02 Mining & Quarrying 11,517.3 24,425.8 12,908.5 7,257.3 2,038.3 1,836.7 384.9
03 Manufacturing 42,504.9 104,999.9 62,495.0 22,904.3 15,803.2 2,834.3 963.1
04 Electricity, Gas & Air Conditioning Supply 72,168.2 160,643.1 88,474.9 15,354.8 21,483.0 32,838.0 2,492.5
05 Water Supply, Sewerage & Waste Management 38,478.4 62,874.2 24,395.8 18,393.5 11,478.6 7,928.6 677.7
06 Construction 207,256.6 702,107.5 494,850.9 154,099.0 34,982.7 5,492.3 12,682.4
07 Wholesale & Retail Trade 274,459.1 435,598.0 161,139.0 144,321.5 90,344.1 26,430.7 13,362.8
08 Transport & Storage 95,370.5 183,689.2 88,318.6 95,757.1 -22,296.3 19,563.9 2,345.9
09 Hotels & Restaurants 149,401.1 345,315.1 195,914.0 117,941.2 20,752.5 5,446.5 5,260.8
10 Information & Communication 124,713.4 206,489.8 81,776.4 50,978.1 43,165.4 18,757.1 11,812.7
11 Financial & Insurance Services 1,483,255.0 2,793,540.1 1,310,285.1 391,197.9 810,361.7 37,222.9 244,472.5
12 Real Estate Activities 426,635.3 731,976.1 305,340.8 55,680.9 312,239.8 57,052.4 1,662.2
13 Professional, Scientific & Technical Activities 687,929.5 933,280.0 245,350.5 421,811.8 182,878.2 7,742.8 75,496.7
14 Administrative & Support Service Activities 113,709.1 154,386.3 40,677.2 82,926.5 19,372.0 7,011.7 4,399.0
15 Public Administration & Defense 291,560.5 400,927.9 109,367.4 269,597.2 0.0 21,682.8 280.6
16 Education Services 119,296.4 154,538.1 35,241.7 107,570.8 324.7 10,889.6 511.4
17 Human Health & Social Work 190,480.6 276,346.1 85,865.5 142,169.4 35,836.9 8,862.2 3,612.2
18 Other Services 105,894.3 160,062.9 54,168.5 53,664.0 44,435.8 5,138.2 2,656.4
Total 4,455,289.6 7,860,690.6 3,405,401.0 2,159,617.0 1,634,629.8 277,519.8 383,523.1
GDP at Current Basic Prices/Total 4,455,289.6 4,455,289.6
Add: Taxes Less Subsidies on Products 218,681.1
GDP at Current Purchasers' Prices 4,673,970.7
Notes
1. Discrepancies between the total and the sum of the components are due to rounding
1a. Gross Value Added (Production) = Gross Output - Intermediate Consumption
1b. Gross Value Added (Income) = Compensation of Employees + Operating Surplus/Mixed income + Consumption of Fixed Capital + Taxes less Subsidies on Production
2. Accounting depreciation is used as a proxy for Consumption of Fixed Capital
Production Components Cost/Income Components
3.9 Production and cost components of value-added by industry Table 10 below shows the production components (gross value added, gross output and intermediate consumption) and cost/income components (compensation of employees, consumption of fixed capital, operating surplus and other net taxes on production) by industry. Gross output is defined as the total value of goods and services produced by an establishment (in essence, sales). Gross output can be used by businesses to gauge their market share in a particular industry. Intermediate consumption refers to the goods and services used up in the production process, excluding fixed assets as its consumption is recorded as consumption of fixed capital. The gross value added is the excess of the gross output over the intermediate consumption. GDP via the production approach is the sum
of the value-added of all entities operating in the economy. GDP via the income approach is calculated as the sum of the compensation of employees, operating surplus/mixed-income, consumption of fixed capital, and taxes on production and imports less subsidies on production and imports.

SYSTEM OF NATIONAL ACCOUNTS REPORT 2020
Economics and Statistics Office 25 25
CAYMAN ISLANDS SYSTEM OF NATIONAL ACCOUNTS AGGREGATES
TABLE 11: GROSS NATIONAL PRODUCT AT CURRENT PURCHASERS' PRICES (CI$'000)
Item Description 2015 2016 2017 2018 2019 2020
GROSS DOMESTIC PRODUCT (GDP)1 3,923,457.0 4,091,085.5 4,305,217.2 4,608,463.6 4,952,792.8 4,673,970.7
PlusProperty Income from the rest of the world: 2,004,522.3 1,774,762.3 2,148,393.6 3,544,331.4 3,588,896.7 1,728,767.2
Foreign direct investment income received224,595.8 29,887.1 72,996.9 32,258.1 28,321.3 -4,278.0
Portfolio & other investment income received31,979,926.5 1,744,875.3 2,075,396.6 3,512,073.3 3,560,575.4 1,733,045.2
LessProperty Income paid to the rest of the world: 3,580,987.5 3,253,848.2 3,549,899.5 4,896,078.6 4,828,365.2 2,903,581.6
Foreign direct investment income paid 1,241,178.8 1,477,282.7 1,168,988.9 2,214,466.3 2,182,394.1 1,292,218.3
Portfolio & other investment income paid 2,339,808.7 1,776,565.4 2,380,910.6 2,681,612.3 2,645,971.1 1,611,363.3
GROSS NATIONAL PRODUCT (GNP)12,346,991.8 2,611,999.6 2,903,711.2 3,256,716.5 3,713,324.3 3,499,156.4
Notes:
1. GDP & GNP at current purchasers' prices.
2. Foreign direct investment represents investments holdings or ownership of 10% of more.
3. Portfolio investment represents investments holdings or ownership of less than 10%.
3.10 Gross National Product (GNP) Gross National Product (GNP) refers to the total value of all goods and services produced by a country’s residents and businesses, regardless of where production takes place. Most of the production of resident entities normally takes place in the jurisdiction; however, some production may take place abroad. In addition, some primary income generated within the country may go to non-residents. Whereas GDP accounts for the value of goods and services produced within the country, GNP estimates the total output of a country’s residents regardless of their location. It is calculated by adjusting the GDP for the net flows (inflows minus outflows) in investment income. GNP is derived as GDP plus any income earned by residents in foreign investments (income received from the rest of the
world), minus the income earned inside the country by foreign residents (income paid to the rest of the world). GNP for the Cayman Islands declined by 5.8 percent in 2020 to CI$3,499.2 million, from CI$3,713.3 million in 2019. The decline in GNP was marginally higher than the decline in the nominal GDP (-5.6%) as the decrease in property income received from the rest of the world (-51.8%) outpaced the decrease in the income paid to the rest of the world (-39.9%).

SYSTEM OF NATIONAL ACCOUNTS REPORT 2020
Economics and Statistics Office 26 26
CAYMAN ISLANDS SYSTEM OF NATIONAL ACCOUNTS AGGREGATES
TABLE 12: NATIONAL INCOME, NATIONAL DISPOSABLE INCOME, SAVINGS & NET LENDING (CI$'000)
Item Description 2015 2016 2017 2018 2019 2020
GROSS DOMESTIC PRODUCT (GDP) 3,923,457.0 4,091,085.5 4,305,217.2 4,608,463.6 4,952,792.8 4,673,970.7
Plus Net Property Income from/to the rest of the world: -1,576,465.2 -1,479,085.9 -1,401,506.0 -1,351,747.2 -1,239,468.5 -1,174,814.3
plus Property income received from the rest of the world 2,004,522.3 1,774,762.3 2,148,393.6 3,544,331.4 3,588,896.7 1,728,767.2
less Property income paid to the rest of the world 3,580,987.5 3,253,848.2 3,549,899.5 4,896,078.6 4,828,365.2 2,903,581.6
Plus Net Compensation of Employees from/to the rest of
the world:-19,496.2 -26,191.3 -20,007.2 -39,595.6 -42,223.3 -31,698.2
plus Compensation of employees received from the rest of
the world 3,556.5 3,480.2 3,739.4 5,176.4 5,020.2 2,196.3
less Compensation of employees paid to the rest of the world 23,052.8 29,671.5 23,746.6 44,772.0 47,243.5 33,894.5
GROSS NATIONAL INCOME (GNI) 2,327,495.6 2,585,808.3 2,883,704.0 3,217,120.9 3,671,101.0 3,467,458.1
Plus Net Current Transfers from/to the rest of the world: -202,638.1 -398,484.8 -622,461.4 -582,623.9 -476,023.1 -383,483.4
plus Current transfers received from the rest of the world 353,589.5 361,492.3 1,811,186.7 1,321,538.5 1,374,397.7 1,321,288.6
less Current transfers paid to the rest of the world 556,227.6 759,977.1 2,433,648.0 1,904,162.3 1,850,420.7 1,704,772.0
GROSS NATIONAL DISPOSABLE INCOME (GNDI) 2,124,857.5 2,187,323.6 2,261,242.7 2,634,497.0 3,195,077.9 3,083,974.7
Final Consumption Expenditures 2,483,963.6 2,603,872.5 2,688,409.7 2,874,677.6 3,162,077.4 3,075,401.5
GROSS NATIONAL SAVINGS -359,106.1 -416,548.9 -427,167.0 -240,180.6 33,000.5 8,573.2
Plus Net Capital Transfers from/to the rest of the world: -1,724.4 -1,313.5 -1,261.1 615.7 -370.3 -1,106.3
plus Capital transfers received from the rest of the world 8.7 0.0 20.3 1,972.7 928.3 40.3
less Capital transfers paid to the rest of the world 1,733.1 1,313.5 1,281.3 1,357.0 1,298.6 1,146.6
Less Gross Capital Formation: 540,245.2 563,092.2 617,585.5 735,296.3 809,290.6 898,377.9
Gross fixed capital formation 538,113.1 560,227.8 606,110.3 729,523.2 797,621.0 885,832.3
Changes in inventories 2,132.0 2,864.4 11,475.2 5,773.1 11,669.6 12,545.6
NET LENDING(+)/NET BRORROWING(-) -901,075.7 -980,954.7 -1,046,013.6 -974,861.2 -776,660.3 -890,911.0
3.11 GNI, GNDI, Gross National Savings & Net Lending11 Gross National Income (GNI) refers to the aggregate value of the gross balances of primary income for all sectors in the economy. GNI is derived by adjusting the GNP for the net compensation of employees. Net compensation of employees is income earned from abroad by Cayman residents minus compensation paid to individuals abroad. Gross National Disposable Income (GNDI) measures income available to the total economy for final consumption and gross saving. GNDI is derived as GNI plus the inflow of current transfers minus outflows of current transfers (e.g. remittances). Gross Saving represents the excess of current income over current expenditure. It comprises households, businesses, and government savings and is derived by subtracting final consumption
expenditure from GNDI. Net lending represents the net resources that the total economy makes available to the rest of the world (if it is positive) or receives from the rest of the world (if it is negative).
11 GNI-Gross National Income = GDP + Net Property Income + Net Compensation from abroad. GNDI-Gross National Disposable Income = GNI + Net Current Transfers

SYSTEM OF NATIONAL ACCOUNTS REPORT 2020
Economics and Statistics Office 27 27
GNI declined by 5.5 percent in 2020 to reach CI$3,467.5 million on the back of the 5.2 percent decline in the net outflow of property income and the 24.9 percent decline in net compensation of employees. The excess of the outflow of property income over the inflows (i.e. net outflows) declined over the entire data period, 2016 (-6.2%), 2017 (-5.2%), 2018 (-3.6%), 2019 (-8.3%), and 2020 (-5.2%). The continuous decline in net outflows of property income contributes to the growth in GNI over the period (see Figure 5 below). Compensation from the rest of the world contracted by 56.3 percent in 2020 to reach CI$2.2 million, while compensation paid abroad declined 28.3 percent to reach CI$33.9 million.
Gross National Disposable Income (GNDI) for the Cayman Islands was estimated as CI$ 3,084.0 million in 2020, after contracting by 3.5 percent. This represents a decline in the income available to fund final consumption and savings. Inflows on current transfers decreased by 3.9 percent to reach CI$1,321.3 million in 2020, while outflows of transfers shrunk by 7.9 percent to reach CI$1,704.8 million.12 Gross national savings shrunk to CI$8.6 million after declining by 74 percent in 2020. Notwithstanding the significant decline, gross national savings remained positive in 2020 after first becoming positive in 2019.
With the slowing of economic activity in 2020, net borrowing increased to CI$890.9 million after growing by 14.7 percent. The Cayman Islands remains a net borrower, primarily due to fund capital investments which bode well for the long-term growth of the economy.
12 Current transfers are transactions where the originator does not receive a something of economic value in return, e.g. workers’ remittances, donations, tax payments, foreign aid, and grants.
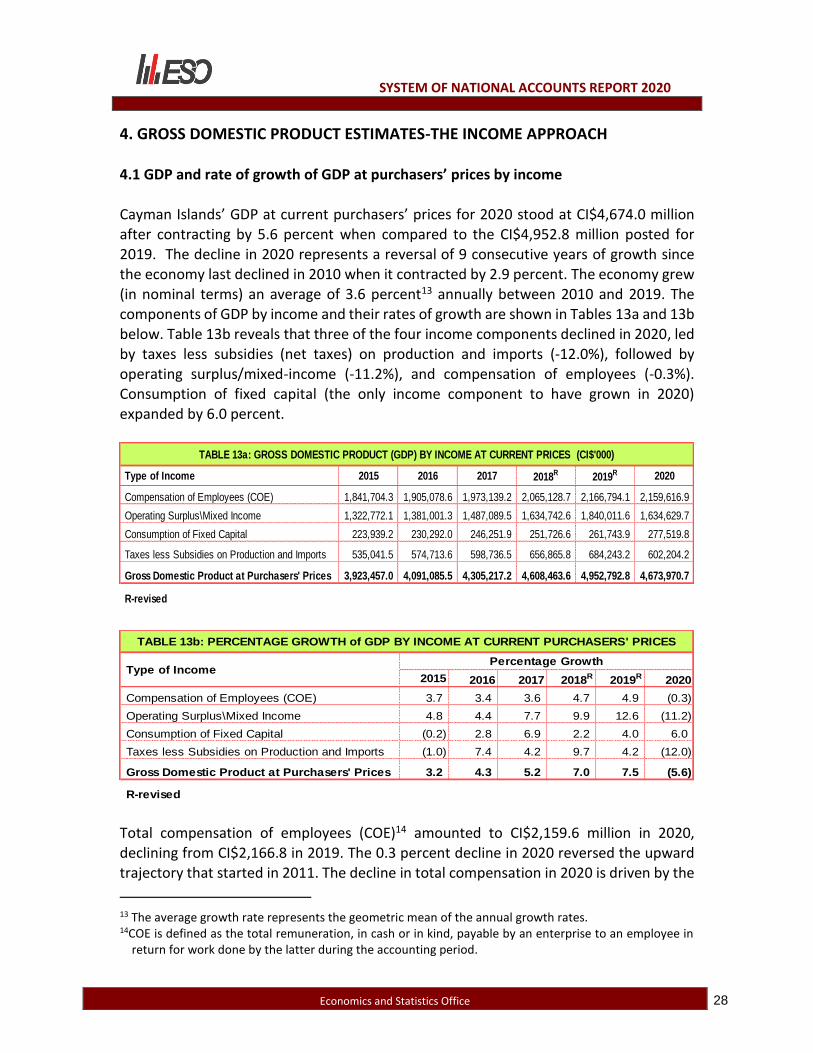
SYSTEM OF NATIONAL ACCOUNTS REPORT 2020
Economics and Statistics Office 28 28
TABLE 13b: PERCENTAGE GROWTH of GDP BY INCOME AT CURRENT PURCHASERS' PRICES
2015 2016 2017 2018R 2019R 2020
Compensation of Employees (COE) 3.7 3.4 3.6 4.7 4.9 (0.3)
Operating Surplus\Mixed Income 4.8 4.4 7.7 9.9 12.6 (11.2)
Consumption of Fixed Capital (0.2) 2.8 6.9 2.2 4.0 6.0
Taxes less Subsidies on Production and Imports (1.0) 7.4 4.2 9.7 4.2 (12.0)
Gross Domestic Product at Purchasers' Prices 3.2 4.3 5.2 7.0 7.5 (5.6)
R-revised
Type of IncomePercentage Growth
TABLE 13a: GROSS DOMESTIC PRODUCT (GDP) BY INCOME AT CURRENT PRICES (CI$'000) TABLE 14: PERCENTAGE SHARE of GDP BY INCOME AT CURRENT PRICES
Type of Income 2015 2016 2017 2018R 2019R 2020
Compensation of Employees (COE) 1,841,704.3 1,905,078.6 1,973,139.2 2,065,128.7 2,166,794.1 2,159,616.9
Operating Surplus\Mixed Income 1,322,772.1 1,381,001.3 1,487,089.5 1,634,742.6 1,840,011.6 1,634,629.7
Consumption of Fixed Capital 223,939.2 230,292.0 246,251.9 251,726.6 261,743.9 277,519.8
Taxes less Subsidies on Production and Imports 535,041.5 574,713.6 598,736.5 656,865.8 684,243.2 602,204.2
Gross Domestic Product at Purchasers' Prices 3,923,457.0 4,091,085.5 4,305,217.2 4,608,463.6 4,952,792.8 4,673,970.7
R-revised
4. GROSS DOMESTIC PRODUCT ESTIMATES-THE INCOME APPROACH 4.1 GDP and rate of growth of GDP at purchasers’ prices by income Cayman Islands’ GDP at current purchasers’ prices for 2020 stood at CI$4,674.0 million after contracting by 5.6 percent when compared to the CI$4,952.8 million posted for 2019. The decline in 2020 represents a reversal of 9 consecutive years of growth since the economy last declined in 2010 when it contracted by 2.9 percent. The economy grew (in nominal terms) an average of 3.6 percent13 annually between 2010 and 2019. The components of GDP by income and their rates of growth are shown in Tables 13a and 13b below. Table 13b reveals that three of the four income components declined in 2020, led
by taxes less subsidies (net taxes) on production and imports (-12.0%), followed by
operating surplus/mixed-income (-11.2%), and compensation of employees (-0.3%). Consumption of fixed capital (the only income component to have grown in 2020) expanded by 6.0 percent.
Total compensation of employees (COE)14 amounted to CI$2,159.6 million in 2020, declining from CI$2,166.8 in 2019. The 0.3 percent decline in 2020 reversed the upward trajectory that started in 2011. The decline in total compensation in 2020 is driven by the
13 The average growth rate represents the geometric mean of the annual growth rates. 14COE is defined as the total remuneration, in cash or in kind, payable by an enterprise to an employee in
return for work done by the latter during the accounting period.

SYSTEM OF NATIONAL ACCOUNTS REPORT 2020
Economics and Statistics Office 29 29
TABLE 14: PERCENTAGE SHARE of GDP BY INCOME AT CURRENT PRICES
Type of Income 2015 2016 2017 2018R 2019R 2020
Compensation of Employees (COE) 46.9 46.6 45.8 44.8 43.7 46.2
Operating Surplus\Mixed Income 33.7 33.8 34.5 35.5 37.2 35.0
Consumption of Fixed Capital 5.7 5.6 5.7 5.5 5.3 5.9
Taxes less Subsidies on Production and Imports 13.6 14.0 13.9 14.3 13.8 12.9
Gross Domestic Product at Purchasers' Prices 100.0 100.0 100.0 100.0 100.0 100.0
R-revised
12.1 percent increase in the number of employed persons, which moved to 41,664 from 47,394 in 2019.15 The largest decline in total compensation was experienced in the hotel & restaurant industry. The most significant increases were posted in public education services, public administration, and public health & social work activities. Operating surplus/mixed-income16 registered the second-largest decline in 2020, contracting by 11.2 percent after growing by 12.6 percent in 2019. This reversed six consecutive years of improved performance going back to 2014. The higher rate of decline in operating surplus compared to the decline in COE suggests that businesses absorbed part of the losses from the general reduction in economic activity in 2020 without proportionately reducing their compensation.
Consumption of fixed capital17 was the only income component posting an increase in 2020, growing by 6.0 percent, continuing on the 4.0 percent and 2.2 percent growth posted in 2019 and 2018, respectively. Taxes (less subsidies) on production and imports18 registered the most significant decline in 2020 (12.0%). The decline in taxes, coupled with increases in subsidies to mitigate the impact of the global pandemic were all contributing factors. The decline in revenues from import duties and tourist accommodation charges contributed significantly to the overall decline.
4.2 Income Share of GDP at purchasers’ prices The share of COE increased to 46.2 percent in 2020, flipping four consecutive years of declining shares of GDP. The 2020 share of COE represents the highest posted share since
15Table 10.01b Compendium of Statistics 2020 (pg. 95) 16Operating Surplus is the measure of the surplus accruing from production. Mixed-income is a combination
of operating surplus and implicit remuneration for work done by owner. 17Consumption of fixed capital is the decline, during the course of the accounting period, in the current
value of the stock of fixed and intangible assets owned and used by a producer as a result of physical deterioration, normal obsolescence or normal accidental damage.
18This includes import duties, hotel occupancy tax, business and professional licences, building permit fees, property tax, stamp duties, etc.

SYSTEM OF NATIONAL ACCOUNTS REPORT 2020
Economics and Statistics Office 30 30
TABLE 15: COMPENSATION OF EMPLOYEES (CI$'000)
INDUSTRY 2015 2016 2017 2018R 2019R 2020
Agriculture & Fishing 6,877.7 7,367.7 7,464.6 7,707.6 8,161.5 7,991.8
Mining & Quarrying 6,030.6 6,327.1 6,777.0 7,252.2 7,720.4 7,257.3
Manufacturing 20,277.1 21,718.1 21,406.8 22,928.5 23,944.1 22,904.3
Electricity, Gas & Air Conditioning Supply 12,141.6 12,355.3 12,405.3 16,342.3 16,967.2 15,354.8
Water Supply, Sewerage & Waste Management 14,763.9 14,974.5 14,868.8 16,116.0 16,992.2 18,393.5
Construction 121,868.7 125,492.2 126,616.4 133,238.2 152,652.5 154,099.0
Wholesale & Retail Trade 118,789.2 124,110.8 129,781.2 136,936.6 143,688.9 144,321.5
Transport & Storage 86,370.6 92,581.9 94,588.7 96,216.2 99,796.9 95,757.1
Hotels & Restaurants 127,738.2 132,622.0 138,794.4 153,094.1 161,785.2 117,941.2
Information & Communication 49,037.7 50,744.2 52,881.7 51,088.8 53,306.7 50,978.1
Financial & Insurance Services 340,654.6 350,914.8 358,936.1 372,076.1 381,410.8 391,197.9
Real Estate Activities 47,894.4 49,469.3 51,364.0 53,365.8 55,617.9 55,680.9
Professional, Scientific & Technical Activities 378,599.9 383,544.0 400,715.7 405,266.2 406,106.4 421,811.8
Administrative & Support Service Activities 73,293.7 75,975.8 78,591.8 82,433.0 85,769.8 82,926.5
Public Administration & Defense 187,529.1 197,934.4 209,815.9 223,652.9 248,282.1 269,597.2
Education Services 81,671.9 85,647.0 88,026.6 93,727.4 103,642.7 107,570.8
Health and Social Work 111,927.5 114,804.6 119,348.0 129,937.1 134,443.4 142,169.4
Other Services 56,238.0 58,495.0 60,756.3 63,749.8 66,505.6 53,664.0
TOTAL 1,841,704.3 1,905,078.6 1,973,139.2 2,065,128.7 2,166,794.1 2,159,616.9
R-revised
the 46.6 percent posted in 2016. The increased share stems from the decline in GDP, outpacing the reduction in COE. The share of operating surplus/mixed-income declined to 35.0 percent of GDP in 2020, from 37.2 percent in 2019. This component posted the second-highest rate of decline in 2020 (11.2%), falling to CI$1,634.6 million from CI$1,840.0 million in 2019 (see Table 13a). The share of net taxes continued the decline started in 2019, contracting to 12.9 percent of GDP in 2020, from 13.8 percent in 2019. Net taxes on production and imports reached CI$602.2 million in 2020, from CI$684.2 million in 2019.
Consumption of fixed capital, the smallest of the income components, was the only component to register growth in 2020. It increased its share of GDP to 5.9 percent in 2020, from 5.3 percent in 2019 on the back of a 6.0 percent increase to CI$277.5 million from CI$261.7 million in 2019. 4.3 Income components of GDP at purchasers’ prices 4.3.1 Compensation of employees (COE) Table 15 below shows the breakdown of total compensation by industry in the Cayman Islands for the period 2015-2020.

SYSTEM OF NATIONAL ACCOUNTS REPORT 2020
Economics and Statistics Office 31 31
The distribution of total compensation in the Cayman Islands was dominated by the following three industries in 2020:
Professional, scientific & technical activities (mainly legal and accounting services) with CI$421.8 million or 19.5 percent of total compensation, an increase on the 18.7 percent in 2019;
The financial & insurance services industry with CI$391.2 million in compensation or
18.1 percent of the total compensation, up from the 17.6 percent in 2019, and 18.0 percent posted in 2018; and
Public administration & defense with CI$269.6 million or 12.5 percent of total
compensation. This represents an increase in share from 11.5 percent in 2019 and
10.8 percent in 2018.
The three above-mentioned industries accounted for 50.1 percent of the total compensation generated in the Cayman Islands in 2020, the highest level to date. This reverses two consecutive years of declining share compared to 47.8 percent in 2019, and 48.5 percent in 2018. Public administration & defense experienced the largest gain in share, moving from 11.5 percent in 2019 to 12.5 percent in 2019. The most significant decline in share was posted by the hotel & restaurant services, which declined to 5.5 percent in 2020, from 7.5 percent in 2019.

SYSTEM OF NATIONAL ACCOUNTS REPORT 2020
Economics and Statistics Office 32 32
TABLE 16: OPERATING SURPLUS AND MIXED INCOME (CI$'000)
INDUSTRY 2015 2016 2017 2018R 2019R 2020
Agriculture & Fishing 7,005.1 7,950.3 9,464.9 9,999.9 11,130.5 11,429.0
Mining & Quarrying 752.9 1,547.1 964.3 1,048.0 2,173.9 2,038.3
Manufacturing 8,886.7 10,133.9 11,662.2 14,631.7 16,518.3 15,803.2
Electricity, Gas & Air Conditioning Supply 20,892.2 24,248.5 21,633.8 21,585.6 23,999.2 21,483.0
Water Supply, Sewerage & Waste Management 14,079.1 15,360.8 15,477.2 16,351.2 16,973.7 11,478.6
Construction 8,600.5 15,201.8 21,547.9 30,631.2 36,514.9 34,982.7
Wholesale & Retail Trade 85,775.3 88,028.1 93,832.9 102,958.3 115,093.1 90,344.1
Transport & Storage 38,499.1 35,507.7 36,684.1 39,036.2 43,865.1 (22,296.3)
Hotels & Restaurants 62,072.3 66,543.4 74,897.3 91,639.7 119,822.2 20,752.5
Information & Communication 28,375.2 32,953.5 33,818.9 37,467.8 46,317.7 43,165.4
Financial & Insurance Services 672,031.4 674,713.5 731,891.0 793,991.4 818,137.4 810,361.7
Real Estate Activities 242,007.3 251,271.2 258,999.2 261,187.6 318,263.6 312,239.8
Professional, Scientific & Technical Activities 65,783.4 80,116.8 89,811.3 118,800.9 153,930.6 182,878.2
Administrative & Support Service Activities 14,854.4 16,267.1 18,586.9 21,365.1 25,015.2 19,372.0
Public Administration & Defense - - - - - -
Education Services 622.7 2,352.4 1,385.7 1,381.7 4,708.1 324.7
Health and Social Work 7,775.2 14,037.4 17,046.0 19,112.6 21,370.8 35,836.9
Other Services 44,759.2 44,767.7 49,385.9 53,553.8 66,177.3 44,435.8
TOTAL 1,322,772.1 1,381,001.3 1,487,089.5 1,634,742.6 1,840,011.6 1,634,629.7
R-revised
4.3.2 Operating surplus/mixed-income
The operating surplus/mixed-income for financial & insurance services declined in 2020 but remained the largest share of the total at CI$810.4 million. The second-largest share was recorded by the real estate activities (CI$312.2 million), followed by professional, scientific & technical activities (CI$182.9 million). There was a significant decline in the operating surplus for hotel & restaurant services which contracted to CI$20.8 million in 2020, from CI$119.8 million in 2019. Transport & storage activities posted a negative operating surplus/mixed-income in 2020.

SYSTEM OF NATIONAL ACCOUNTS REPORT 2020
Economics and Statistics Office 33 33
TABLE 17: CONSUMPTION OF FIXED CAPITAL (CI$'000)
INDUSTRY 2015 2016 2017 2018R 2019R 2020
Agriculture & Fishing 634.5 661.6 685.1 706.5 788.2 789.2
Mining & Quarrying 1,462.7 1,482.4 1,633.3 1,647.8 1,578.0 1,836.7
Manufacturing 2,496.7 2,405.6 2,535.5 2,500.6 2,653.3 2,834.3
Electricity, Gas & Air Conditioning Supply 22,220.8 25,029.7 26,226.4 29,060.9 31,088.7 32,838.0
Water Supply, Sewerage & Waste Management 5,071.2 5,573.8 7,452.0 7,543.7 8,289.1 7,928.6
Construction 3,417.4 3,551.3 4,044.5 4,506.1 5,014.9 5,492.3
Wholesale & Retail Trade 23,666.2 23,869.6 24,280.7 24,567.6 24,899.4 26,430.7
Transport & Storage 11,223.5 11,601.3 13,314.5 15,766.8 17,093.9 19,563.9
Hotels & Restaurants 5,619.1 5,554.9 5,568.4 5,550.4 5,740.4 5,446.5
Information & Communication 20,364.2 19,157.0 20,812.8 19,654.3 19,488.6 18,757.1
Financial & Insurance Services 27,286.6 28,421.0 29,857.9 31,360.7 31,720.3 37,222.9
Real Estate Activities 51,023.4 51,545.6 54,328.6 53,357.0 54,298.3 57,052.4
Professional, Scientific & Technical Activities 10,510.4 10,514.1 8,653.7 7,235.0 7,579.2 7,742.8
Administrative & Support Service Activities 5,905.6 6,123.3 6,450.6 6,789.8 7,111.9 7,011.7
Public Administration & Defense 14,667.0 15,253.4 17,197.0 17,274.0 19,245.3 21,682.8
Education Services 6,070.2 6,096.7 9,343.5 10,106.4 10,761.8 10,889.6
Health and Social Work 8,122.5 7,551.8 7,909.7 8,098.1 8,493.6 8,862.2
Other Services 4,177.4 5,899.2 5,958.0 6,001.0 5,899.2 5,138.2
TOTAL 223,939.2 230,292.0 246,251.9 251,726.6 261,743.9 277,519.8
R-revised
4.3.3 Consumption of fixed capital
As presented in Table 17 above, the largest share of consumption of fixed capital (i.e. depreciation) in 2020 occurred in real estate services (CI$57.1 million) due to the level of fixed assets involved in the activity. This is followed by financial & insurance services (CI$37.2 million), electricity, gas & air conditioning supply services (CI$32.8 million), wholesale and retail trade activities (CI$26.4 million), and public administration & defense activities (CI$21.7 million). The share of depreciation for electricity services and information and communication services is disproportionately large relative to their share of GDP because of the capital-intensive nature of these activities.

SYSTEM OF NATIONAL ACCOUNTS REPORT 2020
Economics and Statistics Office 34 34
TABLE 18: TAXES less SUBSIDIES ON PRODUCTION AND IMPORTS (CI$'000)
INDUSTRY 2015 2016 2017 2018R 2019R 2020
Other Taxes less Subsidies on Production 331,888.9 351,575.7 371,265.9 377,598.3 401,472.7 383,523.1
Agriculture & Fishing 340.6 362.6 394.9 415.7 434.5 449.4
Mining & Quarrying 357.0 385.5 426.1 405.9 367.2 384.9
Manufacturing 947.2 912.9 952.3 1,006.1 1,129.5 963.1
Electricity, Gas & Air Conditioning Supply 1,790.7 1,895.3 1,745.6 2,160.5 2,511.6 2,492.5
Water Supply, Sewerage & Waste Management 577.3 624.1 651.0 582.1 696.0 677.7
Construction 8,244.7 8,771.4 10,683.3 12,151.2 13,541.6 12,682.4
Wholesale & Retail Trade 11,143.1 12,664.3 13,696.8 13,564.9 13,947.9 13,362.8
Transport & Storage 1,708.2 2,134.4 2,363.7 2,704.3 3,014.5 2,345.9
Hotels & Restaurants 6,829.5 7,307.9 7,637.3 7,518.4 6,535.2 5,260.8
Information & Communication 11,522.2 12,200.3 13,238.3 11,588.7 13,173.1 11,812.7
Financial & Insurance Services 223,914.9 232,862.1 237,568.8 241,199.5 253,422.9 244,472.5
Real Estate Activities 1,498.2 1,587.4 1,655.8 1,763.8 1,768.1 1,662.2
Professional, Scientific & Technical Activities 52,386.7 58,631.9 67,732.0 70,271.2 78,388.7 75,496.7
Administrative & Support Service Activities 4,351.6 4,739.1 5,331.5 5,172.7 5,108.0 4,399.0
Public Administration & Defense 199.4 134.1 198.4 253.5 231.5 280.6
Education Services 393.3 421.2 447.3 491.8 497.9 511.4
Health and Social Work 2,708.5 2,896.1 3,366.6 3,266.3 3,554.0 3,612.2
Other Services 2,976.0 3,045.2 3,176.4 3,081.9 3,150.7 2,656.4
Taxes less Subsidies on Products 203,152.6 223,137.9 227,470.6 279,267.4 282,770.5 218,681.1
TOTAL 535,041.5 574,713.6 598,736.5 656,865.8 684,243.2 602,204.2
R-revised
4.3.4 Taxes less subsidies on production and imports
Table 18 shows two data sets:
1. Other taxes on production net of other subsidies on production charged to industries; and
2. Taxes net of subsidies charged to buyers of products and imports. There was an increase in the share of other taxes less subsidies on production (i.e. net
other taxes on production) in total taxes in 2020, resulting from a smaller decline in this component (-4.5%) than that posted for taxes less subsidies on products (-22.7%). The share of net other taxes on production increased to 63.7 percent of the total in 2020 from 58.7 percent in 2019. The value of net taxes on production contracted to CI$383.5 million in 2020 from CI$401.5 million in 2019. This decline is due in part to reduced revenue generated from financial service licences, and work permit fees.

SYSTEM OF NATIONAL ACCOUNTS REPORT 2020
Economics and Statistics Office 35 35
The industry breakdown of net other taxes on production shows that financial and insurance services accounted for 63.7 percent of the total in 2020, increasing from 63.1 percent in 2019. This represents the largest increase in the share of net other taxes on production of all industries. The largest decline in share was posted by hotel & restaurant services, moving to 1.4 percent in 2020 from 1.6 percent in 2019. The increase in the share of financial & insurance services in 2020 solidifies the industry as a significant revenue generator for the government.
5. GROSS DOMESTIC PRODUCT ESTIMATES-THE EXPENDITURE APPROACH
5.1 Introduction
GDP by expenditure (GDPE) constitutes all final expenditures by households and government, investments, and exports minus imports. In other words, GDPE measures GDP as the sum of the final purchases of goods and services. Added to final purchases is the value of exports, which represents goods and services produced domestically and sold to non-resident households and businesses. Imports are subtracted as they represent goods and services produced by other economies. GDPE represents the third approach to calculating GDP in the Cayman Islands, adding to the other two approaches, i.e. GDP by the production approach (GDPP) and GDP by the income approach (GDPI), as presented earlier in Chapters 3 and 4. See Appendix A1.5 for a more detailed explanation of GDPE
and the compilation methodology. 5.2 GDP by expenditure (GDPE) The estimated nominal GDP (calculated using the expenditure approach) for the Cayman Islands declined to CI$4,459.6 million in 2020 from the CI$4,904.6 million recorded for 2019. This reverses the expansion recorded for the four previous years, CI$4,589.2 million in 2018, CI$4,347.3 million in 2017, CI$4,100.2 million in 2016, and CI$3923.5 million in 2015. Two components of GDPE declined in the period, namely final consumption expenditure (FCE) and net exports. However, gross fixed capital formation (GFCF) expanded for the fifth consecutive year, and changes in inventories increased for the second successive year.
Table 19 below presents a detailed disaggregation of the components of nominal GDPE. The largest expenditure component - Household Final Consumption Expenditure (HFCE) - contributed CI$2,519.0 million to nominal GDPE in 2020. Gross fixed capital formation contributed the second-largest share (CI$885.8 million), followed by general government (CI$527.6 million), Net exports (CI$483.6 million), final consumption expenditure of non-
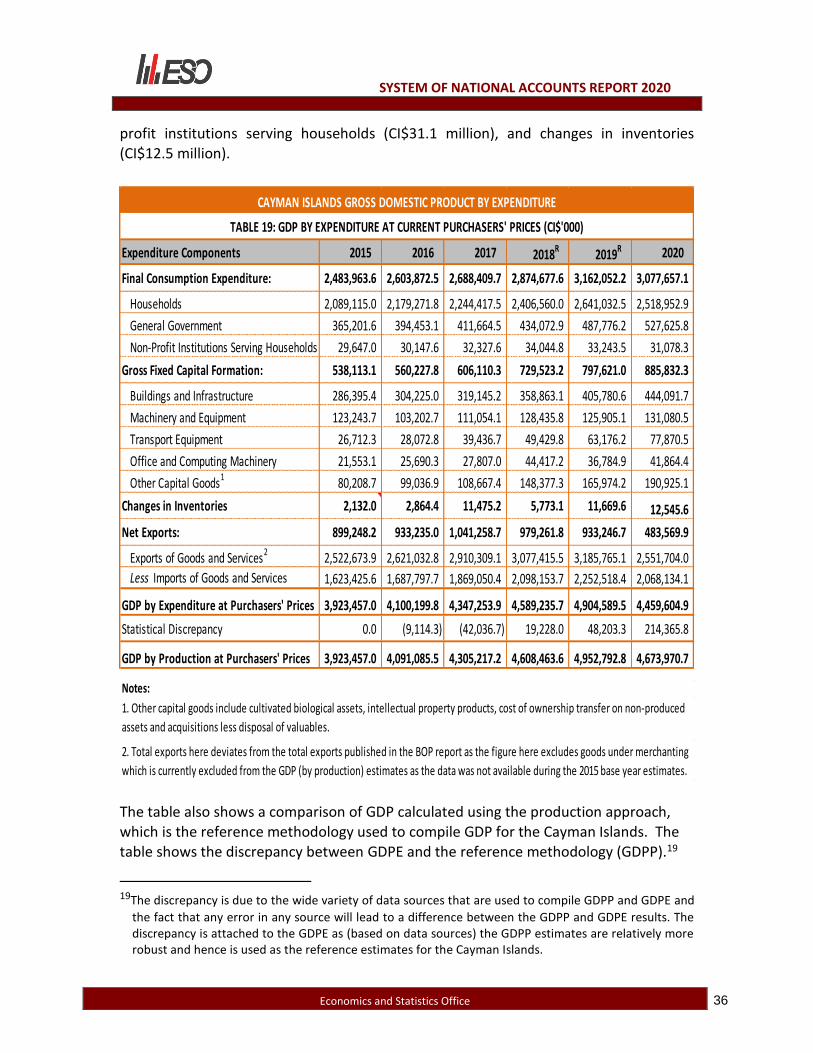
SYSTEM OF NATIONAL ACCOUNTS REPORT 2020
Economics and Statistics Office 36 36
CAYMAN ISLANDS GROSS DOMESTIC PRODUCT BY EXPENDITURE
TABLE 19: GDP BY EXPENDITURE AT CURRENT PURCHASERS' PRICES (CI$'000)
Expenditure Components 2015 2016 2017 2018R
2019R 2020
Final Consumption Expenditure: 2,483,963.6 2,603,872.5 2,688,409.7 2,874,677.6 3,162,052.2 3,077,657.1
Households 2,089,115.0 2,179,271.8 2,244,417.5 2,406,560.0 2,641,032.5 2,518,952.9
General Government 365,201.6 394,453.1 411,664.5 434,072.9 487,776.2 527,625.8
Non-Profit Institutions Serving Households 29,647.0 30,147.6 32,327.6 34,044.8 33,243.5 31,078.3
Gross Fixed Capital Formation: 538,113.1 560,227.8 606,110.3 729,523.2 797,621.0 885,832.3
Buildings and Infrastructure 286,395.4 304,225.0 319,145.2 358,863.1 405,780.6 444,091.7
Machinery and Equipment 123,243.7 103,202.7 111,054.1 128,435.8 125,905.1 131,080.5
Transport Equipment 26,712.3 28,072.8 39,436.7 49,429.8 63,176.2 77,870.5
Office and Computing Machinery 21,553.1 25,690.3 27,807.0 44,417.2 36,784.9 41,864.4
Other Capital Goods1 80,208.7 99,036.9 108,667.4 148,377.3 165,974.2 190,925.1
Changes in Inventories 2,132.0 2,864.4 11,475.2 5,773.1 11,669.6 12,545.6
Net Exports: 899,248.2 933,235.0 1,041,258.7 979,261.8 933,246.7 483,569.9
Exports of Goods and Services2 2,522,673.9 2,621,032.8 2,910,309.1 3,077,415.5 3,185,765.1 2,551,704.0
Less Imports of Goods and Services 1,623,425.6 1,687,797.7 1,869,050.4 2,098,153.7 2,252,518.4 2,068,134.1
GDP by Expenditure at Purchasers' Prices 3,923,457.0 4,100,199.8 4,347,253.9 4,589,235.7 4,904,589.5 4,459,604.9
Statistical Discrepancy 0.0 (9,114.3) (42,036.7) 19,228.0 48,203.3 214,365.8
GDP by Production at Purchasers' Prices 3,923,457.0 4,091,085.5 4,305,217.2 4,608,463.6 4,952,792.8 4,673,970.7
Notes:
1. Other capital goods include cultivated biological assets, intellectual property products, cost of ownership transfer on non-produced
assets and acquisitions less disposal of valuables.
2. Total exports here deviates from the total exports published in the BOP report as the figure here excludes goods under merchanting
which is currently excluded from the GDP (by production) estimates as the data was not available during the 2015 base year estimates.
profit institutions serving households (CI$31.1 million), and changes in inventories (CI$12.5 million).
The table also shows a comparison of GDP calculated using the production approach, which is the reference methodology used to compile GDP for the Cayman Islands. The table shows the discrepancy between GDPE and the reference methodology (GDPP).19
19The discrepancy is due to the wide variety of data sources that are used to compile GDPP and GDPE and
the fact that any error in any source will lead to a difference between the GDPP and GDPE results. The discrepancy is attached to the GDPE as (based on data sources) the GDPP estimates are relatively more robust and hence is used as the reference estimates for the Cayman Islands.

SYSTEM OF NATIONAL ACCOUNTS REPORT 2020
Economics and Statistics Office 37 37
CAYMAN ISLANDS GROSS DOMESTIC PRODUCT BY EXPENDITURE
TABLE 20: GDP BY EXPENDITURE AT CONSTANT PURCHASERS' PRICES, 2015=100 (CI$'000)
Expenditure Components 2015 2016 2017 2018R
2019R 2020
Final Consumption Expenditure: 2,483,963.6 2,601,781.7 2,646,232.0 2,773,398.5 2,928,058.9 2,771,927.1
Households 2,089,115.0 2,183,000.0 2,217,221.0 2,339,796.6 2,461,446.4 2,286,555.8
General Government 365,201.6 388,739.6 397,150.5 401,934.2 436,561.1 457,967.0
Non-Profit Institutions Serving Households 29,647.0 30,042.1 31,860.5 31,667.7 30,051.4 27,404.2
Gross Fixed Capital Formation: 538,113.1 568,801.7 596,672.6 701,743.1 734,365.5 789,013.4
Buildings and Infrastructure 286,395.4 302,935.5 309,162.5 332,367.1 358,651.4 383,402.3
Machinery and Equipment 123,243.7 104,774.6 112,783.6 128,513.9 125,394.3 130,000.0
Transport Equipment 26,712.3 28,300.0 39,734.4 49,380.7 63,025.1 77,743.5
Office and Computing Machinery 21,553.1 28,327.0 32,934.9 53,745.3 46,224.5 55,672.7
Other Capital Goods1 80,208.7 104,464.6 102,057.3 137,736.1 141,070.2 142,194.9
Changes in Inventories 2,132.0 2,764.9 10,814.4 5,430.8 9,858.4 10,985.1
Net Exports: 899,248.2 879,303.1 905,983.8 854,317.9 788,988.7 510,950.2
Exports of Goods and Services 2,522,673.9 2,556,608.5 2,715,148.6 2,837,400.2 2,857,825.3 2,334,447.7
Less Imports of Goods and Services 1,623,425.6 1,677,305.4 1,809,164.8 1,983,082.3 2,068,836.6 1,823,497.5
GDP by Expenditure at Purchasers' Prices 3,923,457.0 4,052,651.4 4,159,702.9 4,334,890.3 4,461,271.5 4,082,875.8
Statistical Descrepancy 0.0 (2,075.4) 19,845.3 23,010.3 65,414.0 186,514.0
GDP by Production at Purchasers' Prices 3,923,457.0 4,050,576.0 4,179,548.2 4,357,900.7 4,526,685.5 4,269,389.8
Notes:
1. Other capital goods include cultivated biological assets, intellectual property products, cost of ownership transfer on non produced
assets and acquisitions less disposal of valuables.
Table 20 shows the estimated values of expenditure on real (inflation-adjusted) GDP, which declined to CI$4,082.9 million in 2020 from CI$4,461.3 million in 2019, CI$4,334.9 million in 2018, CI$4,159.7 million in 2017, CI$4,052.7 million in 2016 and CI$3,923.5 million in 2015. Household final consumption expenditure was estimated at CI$2,286.6 million in 2020, gross fixed capital formation (CI$789.0 million), net exports (CI$511.0 million), final consumption expenditure of general government (CI$458.0 million), final consumption expenditure of non-profit institution serving households (CI$27.4 million), and changes in inventories (CI$11.0 million).

SYSTEM OF NATIONAL ACCOUNTS REPORT 2020
Economics and Statistics Office 38 38
CAYMAN ISLANDS GROSS DOMESTIC PRODUCT BY EXPENDITURE
TABLE 21: RATE OF GROWTH OF GDP BY EXPENDITURE AT CURRENT PRICES (CI$'000)
2016 2017 2018R
2019R 2020
Final Consumption Expenditure: 4.8 3.2 6.9 10.0 (2.7)
Households (HFCE) 4.3 3.0 7.2 9.7 (4.6)
General Government 8.0 4.4 5.4 12.4 8.2
Non-Profit Institutions Serving Households 1.7 7.2 5.3 (2.4) (6.5)
Gross Fixed Capital Formation (GFCF) 4.1 8.2 20.4 9.3 11.1
Changes in Inventories 34.4 300.6 (49.7) 102.1 7.5
Net Exports 3.8 11.6 (6.0) (4.7) (48.2)
Exports of Goods and Services 3.9 11.0 5.7 3.5 (19.9)
Less Imports of Goods and Services 4.0 10.7 12.3 7.4 (8.2)
Expenditure ComponentsPercentage Growth
CAYMAN ISLANDS GROSS DOMESTIC PRODUCT BY EXPENDITURE
TABLE 22: RATE OF GROWTH OF GDP BY EXPENDITURE AT CONSTANT PRICES, 2015=100 (CI$'000)
2016 2017 2018R
2019R 2020
Final Consumption Expenditure: 4.7 1.7 4.8 5.6 (5.3)
Households (HFCE) 4.5 1.6 5.5 5.2 (7.1)
General Government 6.4 2.2 1.2 8.6 4.9
Non-Profit Institutions Serving Households 1.3 6.1 (0.6) (5.1) (8.8)
Gross Fixed Capital Formation (GFCF) 5.7 4.9 17.6 4.6 7.4
Changes in Inventories 29.7 291.1 (49.8) 81.5 11.4
Net Exports (2.2) 3.0 (5.7) (7.6) (35.2)
Exports of Goods and Services 1.3 6.2 4.5 0.7 (18.3)Less Imports of Goods and Services 3.3 7.9 9.6 4.3 (11.9)
Expenditure ComponentsPercentage Growth
5.3 GDPE rates of growth by component Table 21 shows the growth in the nominal values of the expenditure components of GDP. All components declined in 2020 except for the final consumption of general government, gross fixed capital formation, and changes in inventory. The performance in 2020 resulted from a reduction in HFCE (4.6%), final consumption expenditure of NPISH (6.5%) and net exports (48.2%). Counterbalancing the declines were growth in the final consumption expenditure of general government (8.2%), GFCF (11.1%), and changes in inventories (7.5%).
The growth rates of the expenditure component of GDP in real (inflation-adjusted) terms are shown in Table 22. There were declines posted in HFCE (7.1%), final consumption expenditure of non-profit institutions serving households (8.8%) and net exports (35.2%). The declines were tempered by growth in the final consumption expenditure of general government (4.9%), GFCF (7.4%), and changes in inventory (11.4%).

SYSTEM OF NATIONAL ACCOUNTS REPORT 2020
Economics and Statistics Office 39 39
CAYMAN ISLANDS GROSS DOMESTIC PRODUCT BY EXPENDITURE CAYMAN ISLANDS GROSS DOMESTIC PRODUCT BY EXPENDITURE
TABLE 23: PERCENTAGE SHARE OF GDPE AT CURRENT PRICES (CI$'000) TABLE ??: PERCENTAGE SHARE OF GDPE AT CONSTANT PRICES (CI$'000)
Expenditure Components 2015 2016 2017 2018R
2019R 2020
Final Consumption Expenditure (FCE): 63.3 63.5 61.8 62.6 64.5 69.0
Households (HFCE) 53.2 53.2 51.6 52.4 53.8 56.5
General Government and NPISH 10.1 10.4 10.2 10.2 10.6 12.5
Gross Fixed Capital Formation (GFCF) 13.7 13.7 13.9 15.9 16.3 19.9
Changes in Inventories 0.1 0.1 0.3 0.1 0.2 0.3
Net Exports 22.9 22.8 24.0 21.3 19.0 10.8
GDP by Expenditure at Purchasers' Prices 100.0 100.0 100.0 100.0 100.0 100.0
5.4 Contribution to GDPE by component Table 23 shows the contributions of the individual expenditure components to the overall nominal GDPE.
The table shows the continued dominance of HFCE as the main contributor to nominal GDPE in 2020 as seen in Figure 6. FCE increased its share by a further 4.5 percentage points to 69.0 percent in 2020 from 64.5 percent share in 2019, further
increasing its dominance in the category. This also represents the highest share ever recorded for this component over the six years, outstripping the previous highest of 64.5 percent in 2019. In 2020, GFCF registered its highest share (19.9%) as it moved up to becoming the second-largest contributor in terms of relative ranking. This followed the previous high of 16.3
percent in 2019 and 15.9 percent in 2018. The increase also represents the fourth consecutive year of increasing share, after posting 13.9 percent in 2017 and 13.7 percent in both 2016 and 2015. The marked decline in net exports to 10.8 percent in 2020 from 19.0 percent in 2019 led to the component falling to third place in terms of share of nominal GDP. The decline in share in 2020 represents the largest one–year change in share for any component over the six-year data period and is the third consecutive year of decline. The contribution of the aggregate of final consumption expenditure of general

SYSTEM OF NATIONAL ACCOUNTS REPORT 2020
Economics and Statistics Office 40 40
government and NPISH also registered its highest share in 2020 (12.5%), following the 10.6 percent in 2019, 10.2 percent in 2018 and 2017, 10.4 percent in 2016, and 10.1 percent in 2015. Figure 6 provides a graphical display of the share of the expenditure components of nominal GDP for 2020. 5.5 Expenditure components of GDP This section provides a detailed examination of the performance of the individual expenditure components on GDP. 5.5.1 Household final consumption expenditure (HFCE)
HFCE consists of expenditures incurred by resident households on the consumption of goods and services, whether that expenditure is incurred within the economic territory or abroad. Figure 7 shows a disaggregation of nominal HFCE on goods and services. The graph shows minor changes in the split between expenditure on goods versus expenditure on services. For 2020,
Cayman resident households purchased a total of CI$800.1 million in goods. This represents an increase on the CI$797.7 million in 2019, CI$697.0 million in 2018, CI$607.5 million in 2017, CI$577.7 million in 2016 and CI$523.0 million in 2015. Food & non-alcoholic beverage purchases continue to dominate household expenditure on goods, followed by clothing & footwear,
and transport. The share of expenditure on goods increased for a sixth consecutive year to reach 31.8 percent of total HFCE in 2020. The growth in 2020 adds to the shares posted in 2019 (30.2%), 2018 (29.0%), 2017 (27.1%), 2016 (26.5%), and 2015 (25.0%).

SYSTEM OF NATIONAL ACCOUNTS REPORT 2020
Economics and Statistics Office 41 41
The consumption of Cayman residents on services contracted to CI$1718.8 million in services in 2020 compared to CI$1,843.4 million in 2019. This follows on the CI$1,709.6 million in 2018, CI$1,636.9 million in 2017, CI$1,601.6 million in 2016, and CI$1,566.1 million in 2015. Expenditure on services was dominated by actual & imputed rent, financial & insurance services, medical services, hotel & restaurant services, and transport services. Notwithstanding a decline in its share in 2020 - somewhat attributable to the impact on aggregate demand resulting from the pandemic - the purchase of services dominated the composition of HFCE, accounting for 68.2 percent in 2020. This is lower than the 69.8 percent in 2019 and shows the continued contraction in share from 71.0 percent in 2018,
72.9 percent in 2017, 73.5 percent in 2016, and 75.0 percent in 2015. 5.5.2 Government final consumption expenditure (GFCE) GFCE is derived as the output of general government less any sales of goods and services by the government. It includes government purchases of goods and services from businesses and distributed as social transfers to households. In nominal terms, GFCE continues its year-on-year increase to reach CI$527.6 million in 2020, following CI$487.8 million in 2019. This adds to the CI$434.1 million in 2018, CI$411.7 million in 2017, CI$394.5 million in 2016, and CI$365.2 million in 2015.20
5.5.3 Final consumption expenditure of NPISH Non-profit institutions serving households (NPISH) are private, voluntary, non-market producers who provide goods or services to households for free or at prices below market prices. Similar to GFCE, the FCE of NPISH is derived as the output of these entities less any sales of goods and services and is compiled from their production accounts from the GDPP compilation. In 2020, final consumption expenditure of NPISH further declined to CI$31.1 million following the fall in 2019, CI$33.2 million from the CI$34.0 million in 2018. Preceding the declines since 2018 were consistent growth since 2015 (CI$29.6 million), 2016 (CI$30.1
million), and 2017 (CI$32.3 million).20
20See Table 19

SYSTEM OF NATIONAL ACCOUNTS REPORT 2020
Economics and Statistics Office 42 42
CAYMAN ISLANDS GROSS DOMESTIC PRODUCT BY EXPENDITURE
TABLE 24: GROSS FIXED CAPITAL FORMATION BY TYPE AT CURRENT PRICES (CI$'000)
Expenditure Component 2015 2016 2017 2018 2019 2020
Gross Fixed Capital Formation: 538,113.1 560,227.8 606,110.3 729,523.2 797,621.0 885,832.3
Buildings and Infrastructure 286,395.4 304,225.0 319,145.2 358,863.1 405,780.6 444,091.7
Machinery and Equipment 123,243.7 103,202.7 111,054.1 128,435.8 125,905.1 131,080.5
Transport Equipment 26,712.3 28,072.8 39,436.7 49,429.8 63,176.2 77,870.5
Office and Computing Machinery 21,553.1 25,690.3 27,807.0 44,417.2 36,784.9 41,864.4
Other Capital Goods180,208.7 99,036.9 108,667.4 148,377.3 165,974.2 190,925.1
Notes:1. Other capital goods include cultivated biological assets, intellectual property products, cost of ownership transfer
on non produced assets and acquisitions less disposal of valuables.
5.5.4 Gross fixed capital formation (GFCF) Gross fixed capital formation (GFCF) relates to the addition less disposal of fixed assets. For businesses and government, fixed assets are those used repeatedly or continuously in the production process over multiple accounting periods. For households, fixed assets relate to additions to the stock of residential buildings and major improvements to the existing stock. Figure 8 presents the growth in GFCF in both nominal and real terms for 2016 to 2020. The graph shows the current price of GFCF
increasing year on year.
Nominal GFCF grew in 2020 by 11.1 percent, an acceleration on the 9.3 percent growth posted in 2019 after slowing from the 20.4 percent growth in 2018. The positive performance increased the current price GFCF to CI$885.8 million in 2020 from CI$797.6 million in 2019 and CI$729.5 million in 2018.
Table 24 and Figure 9 provide a disaggregation of GFCF by type and shows the value of the components and their contribution to total GFCF. It disaggregates GFCF into buildings & other infrastructure, machinery & equipment, transport equipment, office & computing machinery, and other capital goods.

SYSTEM OF NATIONAL ACCOUNTS REPORT 2020
Economics and Statistics Office 43 43
Despite a decline in share to 50.1 percent in 2020 from 50.9 percent in 2019, buildings & infrastructure continues to be the largest component of GFCF. Notwithstanding the decline in share in share, the addition to the stock of buildings & infrastructure increased to CI$444.1 in 2020 from CI$405.8 million in 2019, CI$358.9 million (49.2%) in 2018,
CI$319.1 million (52.7%) in 2017, CI$304.2 million (54.3%) in 2016, and CI$286.4 million (53.2%) in 2015. The value of the addition to the stock of machinery & equipment (compiled from merchandise imports data) amounted to CI$131.1 million in 2020. This adds to the CI$125.9 million in 2019, CI$128.4 million in 2018, CI$111.1 million in 2017, CI$103.2 million in 2016, and CI$123.2 million in 2015. Machinery and equipment maintained its third place in the ranking despite the continued decline in share over the period. The share of machinery & equipment reached 14.8 percent in 2020 from 15.8 percent in 2019 and 17.6 percent in 2018, having slipped from second place in 2017 at 18.3 percent. This followed the 18.4 percent in 2016 and 22.9 percent in 2015.
The value of transport equipment in GFCF represents expenditure by businesses on this type of asset. The component maintained its fourth-place ranking in 2020 after recording a value of CI$77.9 million (8.8%), representing an increase on the CI$63.2 million (7.9%) in 2019. This follows the CI$49.4 million (6.8%) in 2018, CI$39.4 million (6.5%) in 2017, CI$28.1 million (5.0%) in 2016, and CI$26.7 million (5.0%) in 2015. The share of GFCF for office & computing machinery remained in fifth place despite a

SYSTEM OF NATIONAL ACCOUNTS REPORT 2020
Economics and Statistics Office 44 44
CAYMAN ISLANDS GROSS DOMESTIC PRODUCT BY EXPENDITURE
TABLE 25: EXPORT & IMPORTS AT CURRENT PRICES (CI$'000)
Expenditure Components 2015 2016 2017 2018 2019R 2020
Net Exports: 899,248.2 933,235.0 1,041,258.7 979,261.8 933,246.7 483,569.9
Exports of Goods and Services 2,522,673.9 2,621,032.8 2,910,309.1 3,077,415.5 3,185,765.1 2,551,704.0
Exports of Goods1
163,739.2 177,337.9 167,016.4 184,267.5 199,610.8 61,425.3
Exports of Services 2,358,934.7 2,443,694.8 2,743,292.8 2,893,147.9 2,986,154.3 2,490,278.7
Imports of Goods and Services 1,623,425.6 1,687,797.7 1,869,050.4 2,098,153.7 2,252,518.4 2,068,134.1
Imports of Goods 821,029.3 852,621.8 914,762.1 1,042,810.2 1,189,705.1 1,114,351.0
Imports of Services 802,396.3 835,175.9 954,288.4 1,055,343.5 1,062,813.2 953,783.1
Notes:
1. Exports of goods here deviates from the figure published in the BOP report as the figure here excludes goods under
merchanting which is currently excluded from the GDP by production estimates as the data was not included in the 2015
base year estimates due to unavailable at the time.
marginal increase to 4.7 percent in 2020, from 4.6 percent in 2019, following from the high of 6.1 percent in 2018. The expansion in share resulted in a value of CI$41.9 million in 2020 compared to CI$ 36.8 million in 2019. The CI$44.4 million (6.1%) in 2018 remains the highest outturn over the past six years for the office and machinery component. This follows CI$27.8 million (4.6%) in 2017, CI$25.7 million (4.6%) in 2016 and CI$21.6 million (4.0%) in 2015. Other capital goods increased their relative share to 21.6% (CI$190.9 million) in 2020 compared to 20.8 percent (CI$166.0 million) in 2019, reflecting the continued increase since 2015. This component posted a value of CI$148.4 million (20.3%) in 2018, CI$108.7 million (17.9 %) in 2017, CI$99.0 million (17.7%) in 2016, and CI$80.2 million (14.9%) in
2015. 5.5.5 Changes in inventories The derivation of the value of changes in inventories is based on estimates of stock changes (of goods produced or purchased) reported by businesses on the annual business survey. The nominal value of changes in inventories was estimated at CI$12.5 million in 2020 from CI$11.7 million in 2019, CI$5.8 million in 2018, CI$11.5 million in 2017, CI$2.9 million in 2016, and CI$2.1 million in 2015.21 5.5.6 Net export of goods and services (X-M)
Net export refers to exports less imports of goods and services. Imports and exports have opposite effects on GDP; exports add to GDP, and imports subtract from GDP.
21See Table 19
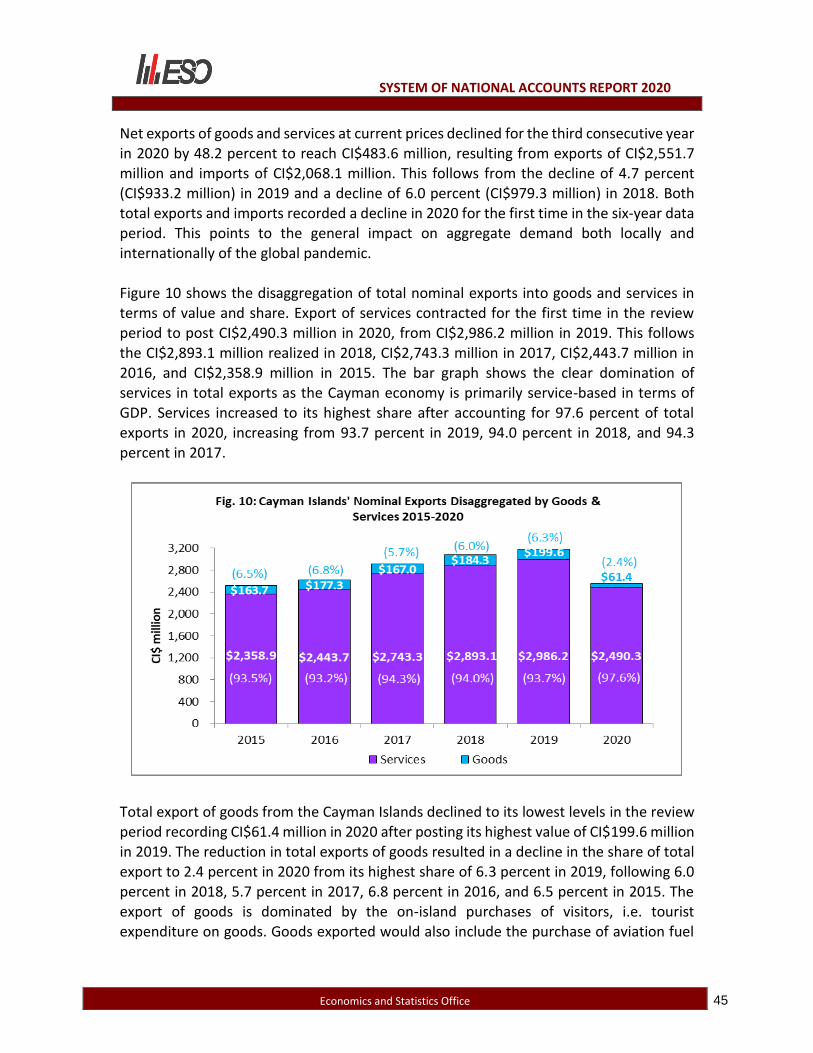
SYSTEM OF NATIONAL ACCOUNTS REPORT 2020
Economics and Statistics Office 45 45
Net exports of goods and services at current prices declined for the third consecutive year in 2020 by 48.2 percent to reach CI$483.6 million, resulting from exports of CI$2,551.7 million and imports of CI$2,068.1 million. This follows from the decline of 4.7 percent (CI$933.2 million) in 2019 and a decline of 6.0 percent (CI$979.3 million) in 2018. Both total exports and imports recorded a decline in 2020 for the first time in the six-year data period. This points to the general impact on aggregate demand both locally and internationally of the global pandemic. Figure 10 shows the disaggregation of total nominal exports into goods and services in terms of value and share. Export of services contracted for the first time in the review period to post CI$2,490.3 million in 2020, from CI$2,986.2 million in 2019. This follows
the CI$2,893.1 million realized in 2018, CI$2,743.3 million in 2017, CI$2,443.7 million in 2016, and CI$2,358.9 million in 2015. The bar graph shows the clear domination of services in total exports as the Cayman economy is primarily service-based in terms of GDP. Services increased to its highest share after accounting for 97.6 percent of total exports in 2020, increasing from 93.7 percent in 2019, 94.0 percent in 2018, and 94.3 percent in 2017.
Total export of goods from the Cayman Islands declined to its lowest levels in the review period recording CI$61.4 million in 2020 after posting its highest value of CI$199.6 million in 2019. The reduction in total exports of goods resulted in a decline in the share of total export to 2.4 percent in 2020 from its highest share of 6.3 percent in 2019, following 6.0 percent in 2018, 5.7 percent in 2017, 6.8 percent in 2016, and 6.5 percent in 2015. The export of goods is dominated by the on-island purchases of visitors, i.e. tourist expenditure on goods. Goods exported would also include the purchase of aviation fuel

SYSTEM OF NATIONAL ACCOUNTS REPORT 2020
Economics and Statistics Office 46 46
(from local suppliers) by foreign airlines. The significant fall in visitor arrivals from the travel restrictions in response to the global pandemic explains the decline in the total export of goods. The disaggregation of total imports into goods and services reflects an equal split when compared to total exports. Total imports declined by 8.2 percent, contracting to CI$2,068.1 million in 2020 from CI$2,252.5 million recorded in 2019. The fall in imports in 2020 was influenced mainly by the fall in imports of services, which declined by 10.3 percent while import of goods declined by 6.3 percent. Services accounted for 46.1 percent of imports in 2020, representing a decline in share
from 47.2 percent in 2019. This represents the third consecutive year of decline in the share of imports after declining to 50.3 percent in 2018 and 47.2 percent in 2019. Cayman Islands’ resident individuals and companies imported CI$953.8 million in services in 2020, CI$1,062.8 million in 2019, CI$1,055.3 million in 2018, CI$954.3 million in 2017, CI$835.2 million in 2016, and CI$802.4 million in 2015.
The share of goods in total imports increased to its highest level at 53.9 percent in 2020. This represents the third consecutive increase in share after moving to 52.8 percent in 2019 and 49.7 percent in 2018. The increase in the share of goods imports in total imports in 2020 results from the growth in goods imports as the service imports declined. The importation of all goods aggregated to CI$1,114.4 million in 2020 from CI$1,189.7 million in 2019, CI$1,042.8 in 2018, and CI$914.8 in 2017.

SYSTEM OF NATIONAL ACCOUNTS REPORT 2020
Economics and Statistics Office 47 47
APPENDIX 1: KEY CONCEPTS AND DEFINITIONS A1.1 Classifications in the National Accounts The main building blocks in the system of national accounts are classifications. These are used in different ways and situations throughout the system. The system of national accounts involves a large number of economic transactions in goods and services that are undertaken by a number of economic agents. The function of the national accounts is to organize and group the basic units of transactions to provide meaningful information. The classification system also guarantees comparability over time and internationally.
The Cayman Islands’ national accounts use the International Standard Industrial
Classification of all Economic Activities (ISIC) for the classifications of industries, as follows (see also Appendix 3):
i. Agriculture, Forestry and Fishing ii. Mining and Quarrying iii. Manufacturing iv. Electricity, Gas, Steam and Air Conditioning Supply v. Water Supply; Sewerage, Waste Management and Remediation Activities vi. Construction vii. Wholesale and Retail Trade; Repair of Motor Vehicles and Motorcycles
viii. Transport and Storage ix. Accommodation and Food Service Activities x. Information and Communication xi. Financial and Insurance Activities xii. Real Estate Activities xiii. Professional, Scientific and Technical Activities xiv. Administrative and Support Service Activities xv. Public Administration and Defense; Compulsory Social Security xvi. Education xvii. Health and Social Work xviii. Other Services
It should be noted that establishments owned or controlled by the government are excluded from the industry “Public Administration and Defense” using the following criteria:
(a) if the prices they charge for the goods and services they produce are economically significant;
(b) if they are operated and managed like a corporation; and

SYSTEM OF NATIONAL ACCOUNTS REPORT 2020
Economics and Statistics Office 48 48
(c) if they have a complete set of accounts such that their operating surplus, savings, assets and liabilities can be separately identified and measured. These establishments are included in the industries in which their principal activity falls.
A1.2 Measuring Gross Domestic Product (GDP) using the Production Approach This approach calculates GDP as the sum of the value added of all industries in the economy. This is the difference between gross output (essentially sales) of producers and the value of their intermediate inputs. Intermediate inputs refer to goods and services that are used up in the production process, excluding fixed assets whose consumption is recorded as consumption of fixed capital, i.e. purchases of commodities that are used up
in the production of other commodities:
Gross Output – Intermediate Input = Value Added The production account for industries allows for the compilation of GDP using the production approach. It records the production of goods and services as defined by the production boundary. The output generated from the production process is recorded as a resource on the left-hand side of the ‘T’ account, and the inputs used up in the production process is recorded as a use on the right-hand side of the account. The value added is the balancing item for this account.
Production Account of a Producer
Uses (Debit) Resources (Credit)
Intermediate consumption 30 Gross Output 100 Market 95
For own final use 5 Other non-market 0
Gross Value Added 70
A1.2.1 Valuation of output, intermediate consumption and value added Output can be valued at either basic or producers’ prices. The SNA 2008 recommends basic prices for the valuation of output; intermediate consumption should be valued at
purchasers’ price. GDP estimates in this report are presented in both basic prices and purchaser’s (market) prices. The main difference between basic and purchasers’ price is the taxes less subsidies (or net taxes) on products. A tax on a product is a tax that is payable per unit of some good or service. The tax may be a specific amount of money per unit or a specified percentage of the value of the goods or services. In the Cayman Islands, taxes on products

SYSTEM OF NATIONAL ACCOUNTS REPORT 2020
Economics and Statistics Office 49 49
are primarily taxes and duties on imports, stamp duty and other taxes on product, excluding taxes and duties on imports (e.g. hotel occupancy tax). Basic price is defined as the amount receivable by the producer from the purchase of a unit of good or service less any tax payable, plus any subsidy receivable as a consequence of its production or sale. Separately invoiced transport charges by the producer are excluded. Producer’s price (net of all valued tax (VAT)) is the amount receivable by the producer from the purchase of a unit of good or service less any VAT invoiced to the purchaser. Separately invoiced transport charges by the producer are excluded.
Purchaser’s value is the amount paid by the purchaser, excluding any deductible VAT but includes any transport charges paid separately by the purchaser for the delivery of the goods. The above three concepts are related as follows:
Basic Price plus taxes on product excluding VAT less subsidies on product
Equals Producer’s Price plus trade and transport margins
plus non- deductible VAT
Equals Purchaser’s Price
It should be noted that in the Cayman Islands, there is no VAT; hence, producers’ prices is the same as purchasers’ price if there are no trade and transport margins. A1.3 Measuring Gross Domestic Product at Constant Prices The change in GDP results from the contribution of (i) the quantity of goods and services produced and (ii) the price at which these goods and services are sold. GDP at current prices reflects both these contributions as the production of the period is measured at the prices at that period. GDP at constant prices, on the other hand, reflects only the
change in quantities produced. This indicator measures the production of the period at the prices of another period referred to as the base year. GDP at constant price is a measure of the real growth which takes place within an economy. The rate of change of GDP at constant prices from period to period is often used to assess the economic performance of a country as it shows only the change in the volume of goods and services produced as the price effect is removed. In theory,

SYSTEM OF NATIONAL ACCOUNTS REPORT 2020
Economics and Statistics Office 50 50
correcting for inflation refers to the process of revaluing current production using the average prices prevailing in the base year as follows:
GDP at current prices = tt iceQuantity Pr
(Current quantities of goods and services produced multiplied by their current prices)
GDP at constant prices = 0Pr iceQuantityt
(Current quantities of goods and services produced multiplied by their prices in a year chosen as the base year)22.
Movement in GDP at constant prices over time indicates whether the economy is growing or is in decline. An increase in GDP at constant prices means that output is growing faster than the rate of inflation, and hence the economy is considered to be growing. The reverse would be true for a fall in GDP at constant prices. The explanation given above is an oversimplification of the actual computation but is necessary to convey what the process is intended to accomplish. The final estimates of GDP contain different components, which all have to be adjusted for inflation. Even though the process of deflation varies depending on the industry, the process always entails the compilation of indices. The deflation process can be effected by either directly deflating the current price estimates with a price index (usually the CPI) or by extrapolating the base year estimates by a volume index.23 The two approaches might
also be used simultaneously. The process recommended by the SNA to estimate GDP at constant prices is to deflate both gross output and intermediate consumption separately and then subtract the latter from the former. The recommendation is that estimations be made for both gross output and intermediate consumption at constant prices; taking the difference would yield GDP at constant prices. This is referred to as double deflation, though intuitively appealing, it is difficult to apply in practice as it requires detailed data of good quality on price indicators for both gross output and intermediate inputs. The alternative to double deflation is the use of a single indicator to extrapolate the GDP
at constant prices or deflate GDP at current prices. Although single indicators are unsuitable in industries where the relationship between value-added, gross output and intermediate consumption vary significantly from one year to the other, they are less
22 The current base year for the Cayman Islands System of National Accounts is 2015. 23 In the base year the current and constant estimates are the same.

SYSTEM OF NATIONAL ACCOUNTS REPORT 2020
Economics and Statistics Office 51 51
sensitive to errors in other industries and hence extensively used.24 The single indicator method was the method of choice for the Cayman Islands and hence is discussed below in more detail. The single indicator method used in the Cayman Islands is the extrapolation of base year value added by a volume index of gross output. Where relevant quantity data were available, the volume index was calculated directly. In the absence of quantity data, the volume index was calculated indirectly by deflating gross output at current prices by the appropriate price index from the CPI. This approach tends to be the most frequently used single indicator and is based on the assumption that the ratio of value added to gross output in current prices remains unchanged at constant prices. This assumption might
hold in the short run but becomes progressively less relevant in the long run; hence periodic rebasing of the constant price estimates is recommended. Another single indicator approach is the deflation of current value added by a price index of gross output. SNA defines a price index as “an average of the proportionate changes in the prices of a specified set of goods or services between two periods of time.” This approach is referred to as single deflation because only the current value added is deflated and not the gross output and the intermediate consumption. The ideal price index for this approach would be one based on wholesale or producer prices. However, these types of indices are not always available; as a result, indices based on retail or consumer prices (e.g. CPI) are used. The disadvantage with using the CPI (in this case) is
that the CPI relates specifically to price movements of goods and services purchased by households for consumption and should not be used as a deflator for gross output destined for non-household consumption. Extrapolation of value added by a volume index of employment is another single indicator method employed in the Cayman Islands System of National Accounts. This method entails the use of proxy indicators of gross output, such as hours worked or numbers employed to extrapolate gross value added in the base year. These proxy indicators are most often used in services industries where it is difficult to specify direct volume measures. The weakness of this method is that it assumes constant labour productivity between the base year and subsequent years. This assumption inevitably leads to mismatches between employment and gross output hence the necessity for frequent
revisions. According to the accepted convention, where this method is employed an explicit assumption should be made about growth in labour productivity of about 1% per year.
24The agriculture industry is one such industry where the relationship between gross output, intermediate
consumption and valued added vary significantly from one year to another due to disease, weather conditions, etc.

SYSTEM OF NATIONAL ACCOUNTS REPORT 2020
Economics and Statistics Office 52 52
Material input is another proxy indicator that can be used to extrapolate base year gross value added. This volume index should comprise of the most important material inputs to the production process. This method is usually employed in industries with heterogeneous output (e.g. construction, garment manufacturing, manufacturing of bakery products, etc.). This method also necessitates frequent rebasing to account for changes in the ratio of gross output to value added and inputs. A1.4 Measuring Gross Domestic Product (GDP) using the Income Approach The income approach measures GDP as the sum of all income accruing to the factors of production. With this approach, GDP is calculated as the sum of the compensation of
employees, operating surplus/mixed-income, consumption of fixed capital and taxes on production and imports less subsidies on production and imports. GDP = Compensation of Employees
+ Consumption of Fixed Capital + Operating Surplus + Taxes on production and imports - Subsidies on production and imports
The definitions employed in the calculation of each of the above components are discussed below.
A1.4.1 Compensation of employees (COE) This is defined as the total remuneration (in cash and kind) paid by employers to employees for work done during the accounting period. Compensation consists of two components:
1. Gross wages and salaries 2. Employers’ social contributions
A1.4.1a Gross wages and salaries This is defined to include all payments that employees receive in respect of their work.
Included are: (a) Commissions, tips, bonuses and gratuities; (b) Allowances such as housing, uniform and travelling; (c) Wages paid during vacation and sick leave; (d) Overtime payments; and (e) Wages and salaries in kind.

SYSTEM OF NATIONAL ACCOUNTS REPORT 2020
Economics and Statistics Office 53 53
The following items are among the consumption goods and services provided by the employer to the employee without charge or at a markedly reduced cost, which are of clear and direct benefit to the employees as consumers and are therefore included as part of wages and salaries:
(a) Meal and drinks; (b) Housing services that can be used by all members of the household; (c) Uniforms that employees choose to wear frequently outside of the workplace as
well as at work; (d) Sports, recreation and holiday facilities for employees and their families; (e) Transportation to and from work, car parking; and (f) Nurseries for the children of employees.
A1.4.1b Employers’ social contribution This includes contributions paid by employers on behalf of their employees to social security schemes, private pension funds and insurance schemes. These are geared towards providing benefits for the employees if circumstances affect their ability to earn income, such as sickness, accidents, redundancy, retirement, etc. These social contributions may be actual or imputed.
Employers’ actual social contributions - These consist of social contributions paid directly by employers for the benefit of their employees to social security funds,
insurance enterprises or other instituted units responsible for the administration and management of social insurance schemes.
Employers’ imputed social contributions - Some employers provide social benefits directly to their employees or dependents out of their resources without the use of an insurance enterprise or special pension fund. In this case, an amount equal in value to the amount of social contributions that would be needed to secure the
entitlement should therefore be imputed. A1.4.2 Consumption of fixed capital This is the cost of production associated with the decline in the value of fixed assets used
in the production process. It can be viewed in general terms as the replacement cost of the fixed assets used up in the process of production. The SNA recommends that this be valued using the actual or estimated prices of fixed assets prevailing at the time the production takes place but not the prices at the time the fixed asset was originally acquired. However, in the case of the Cayman Islands, depreciation is used as a proxy for the consumption of fixed capital.

SYSTEM OF NATIONAL ACCOUNTS REPORT 2020
Economics and Statistics Office 54 54
A1.4.3 Taxes on production and imports Taxes are compulsory, unrequited payments made to the government by other institutional units. Taxes are said to be unrequited because the government does not directly provide a specific good or service in return for the payments made. There are two types of taxes on production and imports:
1. Taxes on products are taxes on goods and services that become payable when the goods are produced, sold, imported or otherwise disposed of by their producers. The following are categories of this type of tax:
a) Taxes and duties on import
b) Other taxes on products excluding taxes and duties on imports (e.g. hotel occupancy tax).
2. Other taxes on production are all taxes excluding taxes on products that
establishments incur as a result of engaging in production (e.g. business and professional licences, property tax, building permit fees, etc.).
A1.4.4 Subsidies on production and imports Subsidies are current unrequited transfers that government makes to resident producers and importers. These transfers or payments are based on the levels of production and/or
the quantity and value of goods and services produced, imported or sold. Subsidies are seen as negative taxation as producers receive them rather than pay them. There are two types of subsidies on production and imports:
1. Subsidies on products - subsidies payable per unit of a good or service, e.g. fertilizer sold to farmers;
2. Other subsidies on production - subsidies excluding subsidies on products that are paid to resident establishments as a result of engaging in production.
A1.4.5 Operating surplus/mixed-income Operating surplus/mixed-income is the income accruing to the production process before deducting interest charges, rent or property incomes payable. It is equivalent to the
excess of the value added over the sum of the compensation of employers, net taxes on production, and allowances for the consumption of fixed capital, i.e.: Operating Surplus = Gross Value Added – (Compensation of Employees + net Taxes on Production and Imports + allowance for the Consumption of Fixed Capital)

SYSTEM OF NATIONAL ACCOUNTS REPORT 2020
Economics and Statistics Office 55 55
A1.5 Measuring Gross Domestic Product (GDP) using the Expenditure Approach GDP by expenditure (GDPE) is the third approach to calculating GDP in the Cayman Islands, along with the Production and Income approach. GDPE measures GDP as the sum of the final purchases of goods and services. Added to final purchases is the value of exports as they represent goods and services produced domestically and sold to non-resident households and businesses. Imports are subtracted as they represent goods and services produced by other economies. The expenditure approach is a method of measuring GDP by calculating all spending throughout the economy. A more detailed explanation shows GDPE as the sum of (a)
household and government spending on goods and services; (b) investment in fixed capital (construction of buildings & other infrastructure, machinery and equipment); (c) changes in inventories; and (d) exports less imports of goods and services following the
economic formula: GDPE = C + G + I + (X-M), where C represents the consumption
expenditure by households (HFCE), G is the consumption expenditure by government (GFCE), “I” represents gross capital formation plus changes in inventories (GCF), X is the value of exports, and M is the value of Imports. The individual components/subgroups comprising GDPE are Final Consumption Expenditure, Gross Fixed Capital Formation, Changes in Inventory and Net Exports. A1.5.1 Household final consumption expenditure (HFCE)
HFCE consists of expenditures incurred by resident households on the consumption of goods and services, whether that expenditure is incurred within the economic territory or abroad. Technically, this includes purchases of consumer goods and services, the value of barter transactions, goods and services received in kind, and goods and services produced and consumed by the same household (e.g. a farmer consuming some of the agricultural products he produced or a dressmaker making a dress for herself). HFCE excludes expenditure on fixed assets in the form of dwellings and on valuables as these are included in capital formation.25 For the Cayman Islands, HFCE is estimated using data from a combination of Import data and domestic data collected through the annual business survey. Data collected through
sources mentioned above are used to extrapolate the 2015 benchmark estimates, which were compiled from the Household Budget Survey (HBS) in 2015. The HBS was conducted over the 12 months from January to December 2015. The data from this survey were
25Valuables are produced goods of considerable value that are not used primarily for purposes of
production or consumption but are held as stores of value over time. HFCE includes household expenditure on other fixed assets (other than dwelling and valuables) like motor vehicles, furniture, major appliances, etc.

SYSTEM OF NATIONAL ACCOUNTS REPORT 2020
Economics and Statistics Office 56 56
classified according to the Classification of Individual Consumption According to Purpose (COICOP). A1.5.2 Government final consumption expenditure (GFCE) GFCE is derived as the output of general government less any sales of goods and services by government. It includes government purchases of goods and services from businesses and distributed as social transfers to households. GFCE includes both collective and individual consumption expenditure by government. Individual consumption expenditure includes goods and services provided by government where the benefits can be assigned to individual households or units (e.g. education, health, etc.). Collective consumption
refers to goods and services whose benefits are not easily assigned to individual units (e.g. public security, street lighting, etc.). GFCE is derived (with some adjustments) from the production accounts of general government from the compilation of GDPP. A1.5.3 Final consumption expenditure of NPISH Non-profit institutions serving households (NPISH) are private, voluntary, non-market producers who provide goods or services to households for free or at prices below market prices. These are separate legal entities with their main resources (apart from those derived from occasional sales) being derived from voluntary contributions in cash or in-kind from households in their capacity as consumers, from payments made by general
governments, etc. Examples include churches and religious societies, sports and other clubs, trade unions, etc. Similar to GFCE, the FCE of NPISH is derived as the output of these entities less any sales of goods and services and is compiled from their production accounts from the GDPP compilation. A1.5.4 Gross fixed capital formation (GFCF) GFCF is measured by the total value of the producers’ acquisitions, less disposals of fixed assets. It includes investment in fixed capital by households, businesses and government. GFCF relates to the addition to the available stock of fixed assets and not the change in ownership of the existing stock. That is, the value of building & infrastructure in GFCF represents the addition (in the reporting period) to the existing stock and is not the actual
value of the total stock of building & infrastructure as of the end of the period. Business GFCF includes the construction of new commercial buildings, major improvements to the existing stock, acquisition less disposal of machinery & equipment, and investment in intangible fixed assets (e.g. computer software, research & development, etc.). GFCF for government includes investment in assets such as roads, schools, hospitals, etc. The machinery & equipment portion of GFCF is compiled using imports of these types of goods

SYSTEM OF NATIONAL ACCOUNTS REPORT 2020
Economics and Statistics Office 57 57
as there is no domestic production. For households, GFCF relates to any addition to the stock of residential buildings and major improvements to the existing stock. A1.5.5 Changes in inventories Simply put, the change in inventory is the amount companies add to the inventories of the goods they plan to sell and materials used in the production process. It is calculated as the difference between the closing stocks and opening stocks during the accounting period. Positive changes in inventories add to GDP, while negative changes reduce GDP. The underlining concept is that businesses will increase inventories to address an increase in the demand for a certain good. That increase in demand positively contributes to GDP.
On the other hand, businesses will reduce inventories when the demand for goods declines; the decline in demand reduces GDP. The change in inventories for the Cayman Islands is based on estimates of stock changes reported by businesses in the annual business survey. A1.5.6 Net export of goods and services (X-M)
Net export refers to exports less imports of goods and services. Imports and exports have opposite effects on GDP. Exports add to GDP, and imports subtract from GDP. Exports consist of sales of domestically produced goods and services to non-residents. Imports consist of the purchase of goods and services by residents from non-resident producers.
Data on the export and import of goods is derived from external trade statistics, while the data on the export and import of services is gleaned from the BOP data produced by the ESO.

SYSTEM OF NATIONAL ACCOUNTS REPORT 2020
Economics and Statistics Office 58 58
APPENDIX 2: IMPLEMENTATION OF THE CAYMAN ISLANDS’ SNA A2.1 Introduction This section provides an overview of the work done in developing the System of National Accounts for the Cayman Islands. It examines the classification system employed in delineating institutional units into specific industries. This is fundamental to the measurement of output and value added by industry. The section also examines the main sources of data used in compiling the estimates. The Annual National Accounts Survey was the main data source and was supplemented by data from government accounts and other administrative sources. The section concludes by examining the estimation
techniques employed in deriving gross value added by industry at current and constant
prices. A2.2 Coverage of industries As indicated in Appendix 1, all active business units were classified according to the International Standard Industrial Classification (ISIC) Revision 4, which is the industrial classification scheme recommended by the SNA 2008 manual.26 In accordance with SNA 2008 and ISIC guidelines, business units were assigned codes based on their principal economic activity.27 The ISIC Revision 4 was adapted to accommodate a more detailed dis-aggregation of economic activity. For the most part, estimation and analysis were
done at the product group level (5-digit ISIC code). However, some estimation had to be done at the class level (4-digit code) due to data constraints. The concept of GDP for the economy as a whole is that it should measure the total GVA for all producers resident in the economy. The overall estimate of Cayman Islands’ GDP comprises the value added of 18 industries as classified using ISIC Rev. 4. The data shown are the most recent estimates of GDP and include any revisions (to previously published data) due to revised figures obtained from businesses during the most recent Annual National Accounts Survey. In general, figures for the most recent year are to be regarded as preliminary.
26The System of National Accounts Manual 2008 (SNA 2008) is the manual that guides the compilation of
GDP estimates. It outlines the internationally accepted methodologies and rules that govern the derivation of estimates of GDP. Relevant aspects of SNA 2008 have been incorporated in the Cayman Islands’ National Accounts.
27The principal activity of a business is the activity whose value added exceeds that of any other activity carried out by the business.

SYSTEM OF NATIONAL ACCOUNTS REPORT 2020
Economics and Statistics Office 59 59
A2.3 Data sources Gross value added at current and constant prices was compiled using data from a variety of primary and/or secondary sources. Primary sources relate to data collected and compiled by the Economics and Statistics Office (ESO). The main source of primary data was the Annual National Accounts Survey. Other primary data sources were the consumer price index (CPI), Labour Force Survey (LFS), Survey of Living Conditions (SLC) and the Household Budget Survey (HBS). Secondary data sources (i.e. sources external to the ESO) consist mostly of administrative records and data generated as by-products of the administrative process. Revenue and expenditure accounts of government and statutory agencies, merchandise trade data, and specified data from the Cayman Islands Monetary
Authority (CIMA) comprised the main secondary data sources. The Annual National Accounts Survey is designed primarily to collect information from active business units on their income and expenditure. Questionnaires are hand-delivered to business units on Grand Cayman (entities for whom a physical address was available) and mailed to those in Cayman Brac and Little Cayman. The survey was administered to all relevant establishments in ESO’s Business Register. Data on government ministries and departments were obtained from government accounting reports. The consumer price index (CPI) was predominantly used in computing gross value added at constant 2015 prices. The CPI is used in two ways: (1) gross output (at current prices)
of some industries is deflated by a relevant price index of CPI items, or groups of items to derive the inflation-adjusted gross output (gross output at constant prices). The series of gross output constant is then used to formulate a volume index which is then used to extrapolate base year gross value added to derive gross value added (at constant prices). (2) The gross value added (at current prices) of some activities are deflated directly by a relevant price index of CPI items, or groups of items to derive gross value added (at constant prices). This method is utilized in the absence of relevant volume indicators. The CPI was also used in estimating the current price gross value added of owner-occupied dwellings and fishing industries. The government accounts comprise a voluminous amount of data that had to be classified, partitioned and adjusted to suit national accounts purposes. Revenue and
expenditure data were gathered from the government database and then exported to Excel, where it was adjusted for national accounts purposes. The database allows for the generation of reports based on cost centres. Through this process, public administration was identified. Additionally, revenue was classified into three groups: taxes (customs duties, property tax, hotel occupancy tax, cruise ship departure tax, stamp duty, etc.), sales of goods and services (work permits, departmental sales, etc.) and other revenue (interest, fines and forfeitures, etc.).

SYSTEM OF NATIONAL ACCOUNTS REPORT 2020
Economics and Statistics Office 60 60
A2.4 Revision policy To improve the System of National Accounts, revisions are undertaken periodically. New and revised data from regular surveys, administrative records, audited financial statements from companies, public sector accounts, etc., are incorporated into the system as they become available. The previous two year’s estimates are revised (as necessary) when current-year estimates are being generated except at the completion of a rebasing process where the entire GDP series might be revised.

SYSTEM OF NATIONAL ACCOUNTS REPORT 2020
Economics and Statistics Office 61 61
APPENDIX 3: GDP REBASING A3.1 Introduction At its most basic, rebasing is the process of replacing the old base year of the GDP series with a more recent year. This is necessary to adequately capture the continuous structural changes as the economy evolves. The rebasing of the Cayman Islands’ GDP series resulted in the real GDP now being expressed in 2015 prices instead of 2007 prices. The rebasing exercise resulted in greater alignment with the latest SNA methodological standards (SNA 2008), inclusion of stockpiled revisions, improvement in coverage, data sources, methodology, and ultimately more robust national accounts data for the Cayman Islands.
A3.2 GDP rebasing explained The change in GDP results from the contribution of two main effects: the quantity of goods and services produced and the price at which these goods and services are sold. GDP at current prices reflects both these contributions as the production during the period is measured at the prices in that period. GDP at constant prices (real GDP), on the other hand, reflects only the change in quantities produced by keeping the price level constant at base year levels. Thus, real GDP provides a more complete picture of changes in the actual production level of the country as it excludes the changes due to price movements. Since real GDP measures the production of the current period using the price
level in the base year, the selection of the specific base year is imperative. Rebasing allows for the change of the base year of the GDP series, which should be done every 5-10 years as per international best-practice. The base year selected should be a “normal” year, i.e. devoid of any sharp economic changes, which would cause drastic or abnormal fluctuations in prices. Ideally, the base year that is chosen would be one in which there are virtually no sharp fluctuations in prices or major changes in underlying economic conditions, e.g. a year without a major natural disaster. A3.3 Reasons to rebase the GDP
An economy changes over time. There are continuous changes in consumption patterns, technology, production techniques, available goods and services, etc. These continuous changes mean that the base year price structure and weights become less representative of the current economic situation as time passes. Therefore it is necessary to update the base period to reflect these changes and maintain the accuracy and relevance of the estimates of real GDP. Rebasing enables the national accounts to capture the real picture of the economy by taking account of factors such as relative price movements and

SYSTEM OF NATIONAL ACCOUNTS REPORT 2020
Economics and Statistics Office 62 62
structural changes in production and consumption patterns, which over time may contribute to an under or overestimation of GDP. The rebasing process also provides an opportunity to incorporate (in the GDP series) methodological and compilation changes, pertinent international recommendations, new and more relevant data sources, changes to product and industry classifications, stockpiled revisions, etc. A3.4 Rebasing methodology There are two main methods used to complete the rebasing process, i.e. with or without
linking (connecting the new base year series to the old base year series), or annual rebasing using chain-linking to connect the two series. Periodic rebasing without linking involves extrapolation for the entire GDP series at the most detailed level using price indicators based on the new base year prices. The detailed volume series can then be aggregated to compile the new real GDP series with the price structure of the new base year. This approach results in an additive (i.e., components of GDP sum up to total GDP) real GDP series, but the historical growth rates are revised for the entire series. This approach is not recommended as it may lead to a loss of confidence in the GDP estimates as the historical growth rates are revised whenever the series is rebased.
An improvement on the previous methodology involves extrapolation from the new base year onwards at the most detailed level, then aggregating up to the total GDP using the price structure of the new base year. The series before the new base year is generated using the price structure from the previous base year. This results in an additive real GDP series, and there is no revision of the historical growth rates as in the preceding approach. However, this approach leads to inconsistency in the real GDP series due to the use of different base year prices. This inconsistency results in a break in the GDP series, which coincides with the change in the base year, i.e. there is a break every time the series is rebased. These breaks in the GDP series make it difficult for researchers to do time-series analyses using the GDP series.
Joining the new base year GDP series with the old base year series remedies the problem with the break in the data series. The process of joining the two series is referred to as linking. With linking, the total GDP series and its components are extrapolated backwards (from the new base year) at the most detailed level possible using the real growth rates of GDP and its components. It is important to note that the backward extrapolation is done separately for the total GDP and its components. The real growth rates used in this case are those derived from the old base year series. This method yields consistent

SYSTEM OF NATIONAL ACCOUNTS REPORT 2020
Economics and Statistics Office 63 63
volume measures of GDP as the entire series is expressed in terms of the prices of the current base year. Since the old growth rates are used to extrapolate backward, the old growth rates are preserved, and there is no revision to the historical growth rates, which maintains confidence in the GDP series. Despite the major advantages of this rebasing approach, the disadvantage is that the GDP series before the base year will not be additive (i.e., components of GDP will not sum up to total GDP) as the total GDP series and its components were extrapolated separately. This is the approach used in rebasing the Cayman Islands’ GDP due to the advantage of preserving the historical growth rates of real GDP while yielding consistent volume measures of GDP. These advantages outweigh the downside of the non-additivity of the GDP series before the new base year.
Annual chain-linking is the approach recommended by SNA 2008, but it is computationally difficult and demands additional resources. According to SNA 2008, “the computing requirements of deriving annual chain indices………should not be attempted without adequate, tailored software” (2008 SNA 15.94b, p. 306). The details of the chain-linking methodology are beyond the scope of this report. However, at its most basic, chain-linking involves annual updating of the base year weights to derive real GDP growth rates calculated using weights, which are more representative than those under periodic rebasing.
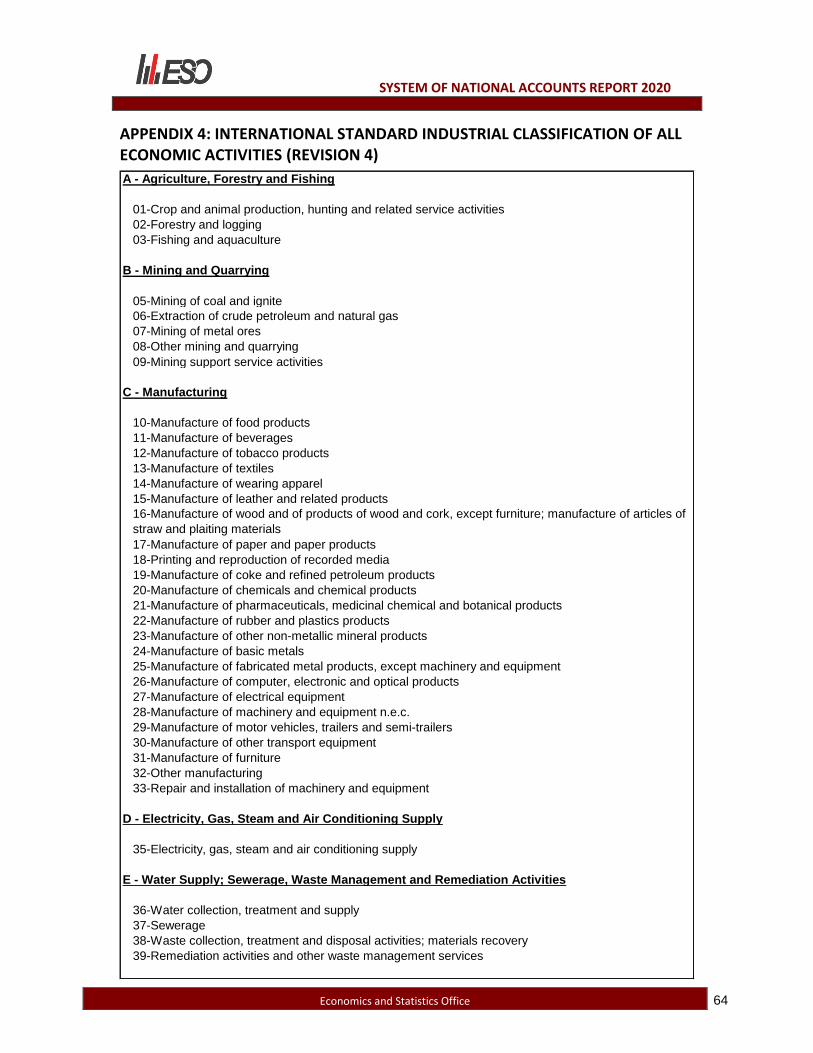
SYSTEM OF NATIONAL ACCOUNTS REPORT 2020
Economics and Statistics Office 64 64
A - Agriculture, Forestry and Fishing
01-Crop and animal production, hunting and related service activities
02-Forestry and logging
03-Fishing and aquaculture
B - Mining and Quarrying
05-Mining of coal and ignite
06-Extraction of crude petroleum and natural gas
07-Mining of metal ores
08-Other mining and quarrying
09-Mining support service activities
C - Manufacturing
10-Manufacture of food products
11-Manufacture of beverages
12-Manufacture of tobacco products
13-Manufacture of textiles
14-Manufacture of wearing apparel
15-Manufacture of leather and related products
16-Manufacture of wood and of products of wood and cork, except furniture; manufacture of articles of
straw and plaiting materials
17-Manufacture of paper and paper products
18-Printing and reproduction of recorded media
19-Manufacture of coke and refined petroleum products
20-Manufacture of chemicals and chemical products
21-Manufacture of pharmaceuticals, medicinal chemical and botanical products
22-Manufacture of rubber and plastics products
23-Manufacture of other non-metallic mineral products
24-Manufacture of basic metals
25-Manufacture of fabricated metal products, except machinery and equipment
26-Manufacture of computer, electronic and optical products
27-Manufacture of electrical equipment
28-Manufacture of machinery and equipment n.e.c.
29-Manufacture of motor vehicles, trailers and semi-trailers
30-Manufacture of other transport equipment
31-Manufacture of furniture
32-Other manufacturing
33-Repair and installation of machinery and equipment
D - Electricity, Gas, Steam and Air Conditioning Supply
35-Electricity, gas, steam and air conditioning supply
E - Water Supply; Sewerage, Waste Management and Remediation Activities
36-Water collection, treatment and supply
37-Sewerage
38-Waste collection, treatment and disposal activities; materials recovery
39-Remediation activities and other waste management services
APPENDIX 4: INTERNATIONAL STANDARD INDUSTRIAL CLASSIFICATION OF ALL ECONOMIC ACTIVITIES (REVISION 4)

SYSTEM OF NATIONAL ACCOUNTS REPORT 2020
Economics and Statistics Office 65 65
F - Construction
41-Construction of buildings
42-Civil engineering
43-Specialized construction activities
G - Wholesale and Retail Trade; Repair of Motor Vehicles and Motorcycles
45-Wholesale and retail trade and repair of motor vehicles and motorcycles
46-Wholesale trade, except of motor vehicles and motorcycles
47-Retail trade, except of motor vehicles and motorcycles
H - Transportation and storage
49-Land transport and transport via pipelines
50-Water transport
51-Air transport
52-Warehousing and support activities for transportation
53-Postal and courier activities
I - Accommodation and Food Service Activities
55-Accommodation
56-Food and beverage service activities
J - Information and Communication
58-Publishing activities59-Motion picture, video and television programme production, sound recording and music publishing
activities
60-Programming and broadcasting activities
61-Telecommunications
62-Computer programming, consultancy and related activities
63-Information service activities
K - Financial and Insurance Activities
64-Financial service activities, except insurance and pension funding
65-Insurance, reinsurance and pension funding, except compulsory social security
66-Activities auxiliary to financial service and insurance activities
L - Real Estate Activities
68-Real estate activities

SYSTEM OF NATIONAL ACCOUNTS REPORT 2020
Economics and Statistics Office 66 66
M - Professional, Scientific and Technical Activities
69-Legal and accounting activities
70-Activities of head offices; management consultancy activities
71-Architectural and engineering activities; technical testing and analysis
72-Scientific research and development
73-Advertising and market research
74-Other professional, scientific and technical activities
75-Veterinary activities
N - Administrative and Support Service Activities
77-Rental and leasing activities
78-Employment activities
79-Travel agency, tour operator, reservation service and related activities
80-Security and investigation activities
81-Services to buildings and landscape activities
82-Office administrative, office support and other business support activities
O - Public Administration and Defence; Compulsory Social Security
84-Public administration and defence; compulsory social security
P - Education
85-Education
Q - Human Health and Social Work Activities
86-Human health activities
87-Residential care activities
88-Social work activities without accommodation
R - Arts, Entertainment and Recreation
90-Creative, arts and entertainment activities
91-Libraries, archives, museums and other cultural activities
92-Gambling and betting activities
93-Sports activities and amusement and recreation activities
S - Other Service Activities
94-Activities of membership organizations
95-Repair of computers and personal and household goods
96-Other personal service activities
T - Activities of Households as Employers; Undifferentiated Goods-and Services-Producing
Activities of Households for Own Use
97-Activities of households as employers of domestic personnel
98-Undifferentiated goods- and services-producing activities of private households for own use
U - Activities of Extraterritorial Organizations and Bodies
99-Activities of extraterritorial organizations and bodies


