Embed Size (px)
Citation preview

Examining the value of education for student success—in career and life.
SPONSORED BY:

You want to help your students reach their full potential. That means sending authentic communications and providing insightful advice, clear academic plans, and appropriate interventions. And it means easy access—anytime, anywhere—to the information they need to see what needs to be done.
We provide modern technology solutions that help students navigate campus processes, communicate with faculty, and get the support they need to stay on track and graduate. It’s been our total focus for more than 40 years. Our passion speaks for itself: today we serve 2,400 institutions and 18 million students in 40 countries around the globe.
Visit ellucian.com/success to learn more about how our award-winning software can help you help your students succeed.
Higher educationhappens here.
Technology solutions designed for today’s modern student

Education Under Review is based on a survey by Maguire Associates and was written by Robert Kelchan, an assistant professor at Seton Hall University, and edited by Karin Meadows, an assistant editor at The Chronicle of Higher Education, Inc. The report is sponsored by Ellucian. The Chronicle is fully responsible for the report’s editorial content. Copyright 2016.
Table of Contents
Executive Summary 4
Introduction 6
The Value of a Degree 9
Student Loan Debt 13
Accountability 16
Student Outcomes 19
Career Preparation 24
Conclusion and Methodology 30
E D U C A T I O N U N D E R R E V I E W
03

Executive Summary
With tuition prices continuing to climb and middle-class America’s earnings stagnant for more than a decade,
colleges and universities continue to face pressure from government, governing boards, students and their families to provide proof of the value of a bachelor’s degree. Students historically have had little more to go on than anecdotal information when it came to the jobs and earnings they could expect upon graduation from a specific college or university.
But the launch of the U.S. Department of Education’s College Scorecard in the fall of 2015 has changed that, bringing for the first time transparency to the financial cost of getting a degree at thousands of American public and private colleges and universities. Students and families once armed with only college admissions and graduation rates to weigh one of life’s biggest financial decisions now have at their fingertips for virtually every two- and four-year institution in the country tuition and housing costs, median student loan debt and repayment rates, and median earnings of former students.
Economics and high unemployment among graduates after the Great Recession of 2008 have led to the onset of a shift in age-old thinking that college is meant to equip students for life, not careers. While academic leaders at many colleges and universities admit that their priorities continue to be academic preparation to ensure success and retention and graduation rates, colleges are adapting their majors and coursework based on employment sector predictions and regional job needs, a strategy with the potential to benefit students while increasing enrollment in a competitive admissions environment.
“I believe postsecondary education is at an inflection point,” said Mark Schneider, a vice president and Institute Fellow at the American Institutes for Research and a former National Center for Education Statistics commissioner. “Most of them (colleges and universities) savor much more traditional kinds of things like decision making, analytical skills, communications, but then they engage in all of these activities that are increasingly career oriented. They actually are saying career readiness is very important.”
External forces are changing the way colleges and universities are being evaluated by their consumers, bringing on widespread debate about the role of postsecondary institutions in ensuring graduates are not only intellectually well-rounded and armed with critical thinking skills and a love of learning when they get to the finish line, but that they are also employable and on the path to careers even before graduation. In the coming months and years, colleges and universities, in order to stay competitive, plan to gather more information about their graduates’ earnings and employment, grow their internship programs, experiential learning and career skills readiness programs, and adjust their curriculums to meet workforce needs.

STUDENT DEBTMost respondents agreed that $20,000 in debt for a bachelor’s degree is reasonable, although average debt burden among graduates hovers between $30,000 and $35,000. Although about 40 percent said students should be able to repay their debt within five years, College Scorecard data reveal that 30 percent of students had not paid the first $1 toward student loan principal within seven years of leaving college.
VALUE OF DEGREEWhile 62 percent of respondents stated that their college provides an excellent value for the price students and families pay, only 13 percent say they believe the higher-education system as a whole provides an excellent value. The meaning of the “value” of a degree is changing, with a greater focus on job skills growing at all university types.
STUDENT OUTCOMESPressure to improve student outcomes come from a variety of sources, including students, parents, trustees, legislators and employers. Discussion of the need for increased career services to improve job preparation has risen over the past three years, with the most intense new discussions occurring at private four-year colleges.
ACCOUNTABILITY About one-half of respondents said their institution should be at least somewhat responsible for the amount of loan debt students incur during their college careers and 35 percent agreed that colleges should be held accountable for their graduates’ career success. Just one in four respondents said prospective students should take into account College Scorecard earnings data when choosing a college.
CAREER PREPARATIONOverall, college officials say they believe their students are prepared for a job search, but academic leaders from associate’s degree institutions were less confident than their four-year college counterparts. Senior academic leaders named the internship as the number one indicator graduates would land a first job, but many said their institutions need to do more to create internships for students. Institutions frequently are evaluating the workforce needs of various employment sectors, tweaking academic offerings to reflect those needs.
HighlightsIn the fall of 2015, The Chronicle of Higher Education conducted a survey of more than 500 senior academic officers at two- and four-year colleges with a focus on the value of a college education, accountability views regarding student outcomes like employment and earnings, and the indicators these leaders believe illustrate proof of their value to students and their families. Among the highlights of the survey:
TOC»
E D U C A T I O N U N D E R R E V I E W
05

College Scorecard data — and the proliferation of new college rankings
based on earnings — is changing public discussion about what determines the
value of a degree.
Introduction

A college degree is such a large monetary investment that those who help fund the multi-billion-dollar enterprise that is American
higher education—students and their families, all levels of government and private donors—are clamoring for more information about how graduates are faring financially and in their career.
In 2015, the U.S. Department of Education, as part of President Obama’s efforts to hold colleges accountable for cost, value and quality, gave the public a new tool for comparing key indicators of the cost and value of institutions across the country to help students choose an institution that is well-suited to meet their needs, priced affordably, and is consistent with their educational and career goals.
College Scorecard data and the proliferation of new college rankings based on earnings is changing public discussion about what determines the value of a degree. Yet, a survey by The Chronicle of Higher Education
of chief academic officers at two- and four-year colleges reveals these university leaders overwhelmingly do not think prospective students and their families should use salary outcomes data in making their college choices.
While the College Scorecard data is interesting, first job salaries are not reflective of how much graduates will earn over the course of their careers, particularly those graduates holding liberal arts degrees, said Colorado State University Provost Rick Miranda. A large body of research shows the price of a college education generally pays off for students in the long run, and the value of a degree in the U.S. is still unparalleled, Miranda said.
“The ability to get a good job, salary rates, the unemployment rate among college graduates when recessions hit all of these speak to the value of a degree. The cost has risen but it is a great investment, the value will continue to grow as the years go by and you get more experience in whatever field you are working in,” Miranda said.
For students and their families, however, the value proposition may have changed in recent years due to rising tuition prices. Since 2005, tuition and fees have increased about 25 percent faster than inflation at four-year colleges and 40 percent faster at two-year colleges. At the same time, student debt has risen to an average of $33,000 per graduate. Because of the increased focus on student debt and earnings, many institutions are being forced to evaluate whether the future success of graduates depends on teaching students specific job skills related to their future professions, providing them with less tangible outcomes like a lifelong love of learning or both.
University leaders overwhelmingly do not think prospective students and their families should use salary outcomes data in making their college choices.
TOC»
E D U C A T I O N U N D E R R E V I E W
07

FIGURE 1THE EXTENT TO WHICH STUDENT SUCCESS REMAINS A PRIORITY OVER JOB AND CAREER PREPARATION FOR CHIEF ACADEMIC OFFICERS
Academic preparation of students
33%
26%
19%
27%
34%
20%
Job and career preparation for graduates
Retention and graduation rates
P R I VATE P U B L I C
Two- and four-year colleges are paying close attention to employment projections and industry needs, adding majors in high-demand fields that can prepare students for today’s jobs while giving the college a competitive edge in recruiting students. However, academic preparedness to guarantee student success and strengthen or maintain retention and graduation rates continue to be more of a focus than job and career preparation for graduates (See Figure 1).
At the country’s largest associate’s degree-granting institution, Miami-Dade College in Florida, employment rates for graduates, at 89 percent, are
soaring. Provost for Academic and Student Affairs Lenore P. Rodicio said the institution, while focused on student academic success, is paying more attention to job skills than four years ago. While 60 percent of the college’s more than 160,000 students intend to transfer to a four-year university, the institution has strong workforce programs in its nursing, engineering, education and other professional colleges, including advisory boards made up of potential employers and industry experts who can speak to the needs of Miami-Dade employers. The institution has recently added cyber security and data analytics tracks to its existing
IT degree-granting programs, offers baccalaureate degrees to 5 percent of graduates, and provides short-term certificates in multiple areas of study so employees can get quick training.
This report describes the results of a survey of senior level academic officers in American colleges and universities from public and private two- and four-year colleges. The survey, conducted in November 2015, sought respondents’ perceptions on the role of higher education in student outcomes, institutional performance in career preparation and the reporting of student outcomes.
TOC»
E D U C A T I O N U N D E R R E V I E W
08

The Value of a DegreeOnce a year, the College Board publishes Education Pays, a report that documents the ways “in which both individuals and society as a whole benefit from increased levels of education.” Despite its focus on the dual role that higher education often plays in the lives of individuals, the College Board report largely is dominated by the economic returns from higher education.
Median student debt at graduation and how
much graduates earn in first jobs are now factors for students and families
in deciding which college to attend.

FIGURE 2THE EXTENT TO WHICH COLLEGES AND UNIVERSITIES SAY THEY ARE RESPONSIBLE FOR ENSURING VARIOUS STUDENT OUTCOMES ARE ACHIEVED
The definition of the value of a college degree is growing. Institutions of higher learning continue to hold on strongly to the belief that their priorities
are to arm graduates with strong intellectual and critical thinking skills and a lifetime appreciation for learning (See Figure 2). But students
and their families are beginning to influence this age-old thinking by taking a close look at median student debt at graduation and how much graduates earn in first jobs to determine which college a student ultimately attends.
Intellectual well-roundedness and an appreciation for lifelong learning are priorities at colleges and universities over student debt.
Is intellectually well-rounded
Has defined a professional goal
and a plan to achieve that goal
Has a job whose salary will enable the graduate to pay off college debt within
five years
Has an appreciation for the value of lifelong learning
Is actively involved in civic or volunteer
activity
Has reasonable or no higher education debt
68%47%
42%
56%57%
30%
7%7%9%
1% 9%10%4%4%
10%
30%
37%
41%
31%39%
60%
N OT AT A L L R E S P O N S I B L E S O M E W H AT R E S P O N S I B L EN OT TO O R E S P O N S I B L E V E RY R E S P O N S I B L E
TOC»
E D U C A T I O N U N D E R R E V I E W
10

FIGURE 3THE VALUE INSTITUTION PROVIDES STUDENTS AND THEIR FAMILIES/PERFORMANCE OF U.S. HIGHER EDUCATION
63%
62%
VALUE
PERFORMANCE
3%
13%
35%
23%
1%
Sixty-two percent of chief academic officers surveyed by The Chronicle rated the value their institution provides to students and their families today as “excellent” and
35 percent rated the value as “good.” At the same time, just 13 percent of those from baccalaureate institutions rated the performance of the U.S. higher education system
as “excellent,” with 63 percent rating the system as “good” and 23 percent as “poor” (See Figure 3).
E X C E L L E NT FA I RG O O D P O O R
TOC»
E D U C A T I O N U N D E R R E V I E W
11

FIGURE 4IS THE BACHELOR’S DEGREE WORTH MORE OR LESS IN TODAY’S JOB MARKET VERSUS FIVE YEARS AGO?
A lot more
10
20
30
40
50
60%
About the sameMore Less A lot less
B A C C A L A U R E ATE S P E C I A L F O C U SD O CTO R A L/ R E S E A R C H A S S O C I ATE SM A STE R S
10%
7% 6%
1% 0% 1% 1% 0%2%
4%
21%
32% 31%
13%
20%
55%
37%
46%
42%
29%
43%
47%
14%
22%
16%
In general, respondents were split as to whether a bachelor’s degree is worth more now than five years ago. While more respondents at four-year colleges said that the bachelor’s degree had gained value in the past five years, the opposite was true at
two-year colleges. Just 14 percent of respondents at two-year colleges were as confident in the value of a bachelor’s degree, with 45 percent saying the bachelor’s degree has lost value (See Figure 4).
Forty-five percent of two-year college chief academic officers say they believe the bachelor’s degree has lost value over the past five years.
TOC»
E D U C A T I O N U N D E R R E V I E W
12

Student loan debt has tripled over the past decade in the U.S. to
$1.2 trillion.
Student loan debt

FIGURE 5OPINIONS VARY ON WHAT CONSTITUTES REASONABLE STUDENT LOAN DEBT
One criticism of American higher education is the sharp increase in student loan debt, which has tripled in the past decade to $1.2 trillion. The
survey asked chief academic officers what constitutes reasonable debt for new graduates, as well as how long it should take students to repay their debt.
Forty-four percent of public college respondents and 34 percent of
those at private colleges said graduates should ideally have $20,000 in student loan debt or less, substantially less than the average $33,000 loan tab the typical bachelor’s degree recipient has at graduation. Thirty-one percent of four-year private college chief academic officers said $30,000 or less in student debt is OK (See Figure 5). Students who attend private college do tend to have higher average debt burdens.
Most polled say students should be able to repay all college loan debt within 10 years.
$0
10
20
30
40
50%
$20,000 or below
$10,000 or below
$30,000 or below
$40,000 or below
$50,000 or below
$100,000 or below
2%0% 0%
2%3%
9%
13%12%
42%
22%
37%
40%
29%
39%
13%12%
18%
3%
9%
2%
16%
0% 0%1%
3%2%
1%
4% 4%
46%
35%
31%
25%
11%11%
B A C C A L A U R E ATE S P E C I A L F O C U SD O CTO R A L/ R E S E A R C H A S S O C I ATE SM A STE R S
TOC»
E D U C A T I O N U N D E R R E V I E W
14

Nearly all polled say they believe graduates should be able to repay their debt within 10 years of
graduation, the standard repayment period for federal student loans (See Figure 6). About 30 percent of
students have not paid $1 toward their student loan debt principal seven years after leaving college.
FIGURE 6STUDENT DEBT REPAYMENT TIME EXPECTATIONS BY COLLEGE SECTOR
Within six months
10
20
30
40
50
60
70%
Longer than one year but within
two years
Longer than six months but within one year
Longer than two years but within
five years
Longer than five years but within
10 years
More than 10 years
Don’t know
0%1%0%1%0%2%3%
0%1%2% 2%
10%
4%4%
1%
4%4%
1%
3%
1%2%
1%1%
3%
6%
31%
44%
33%
37%
30%
58%
38%
60%
52%
60%
B A C C A L A U R E ATE S P E C I A L F O C U SD O CTO R A L/ R E S E A R C H A S S O C I ATE SM A STE R S
TOC»
E D U C A T I O N U N D E R R E V I E W
15

Many academic officers are hesitant
to place as much importance on
student financial outcomes as on
academic outcomes.
Accountability
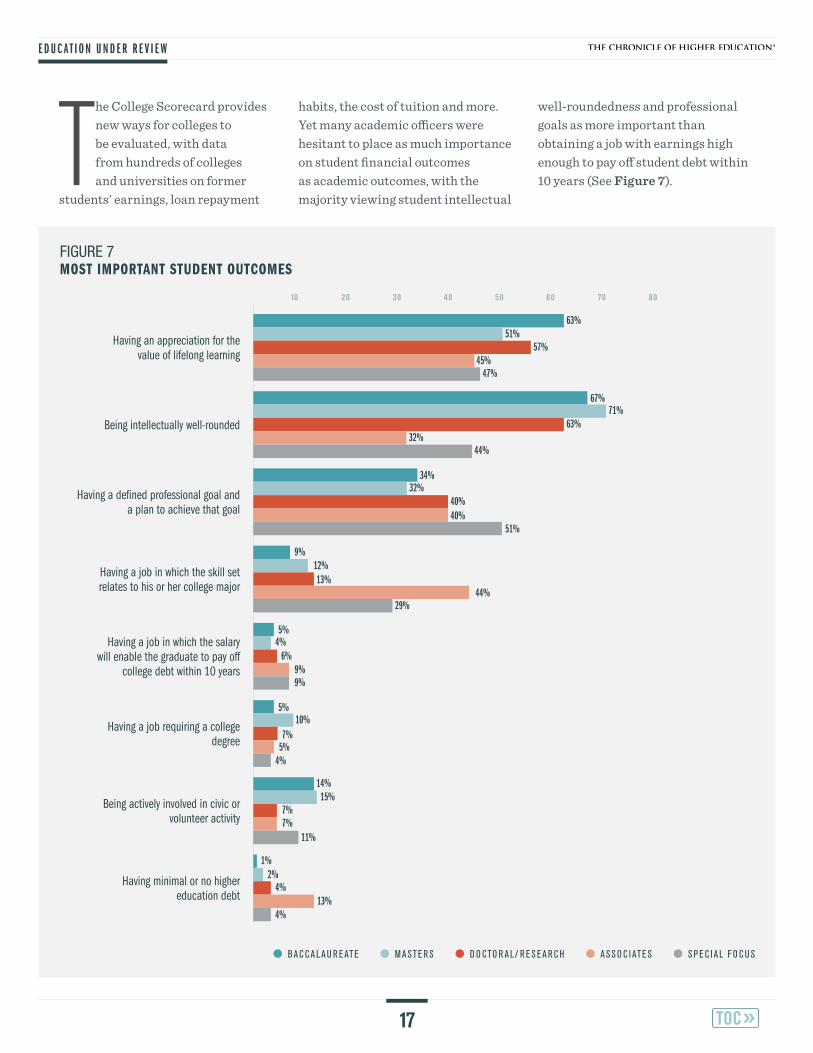
FIGURE 7MOST IMPORTANT STUDENT OUTCOMES
The College Scorecard provides new ways for colleges to be evaluated, with data from hundreds of colleges and universities on former
students’ earnings, loan repayment
habits, the cost of tuition and more. Yet many academic officers were hesitant to place as much importance on student financial outcomes as academic outcomes, with the majority viewing student intellectual
well-roundedness and professional goals as more important than obtaining a job with earnings high enough to pay off student debt within 10 years (See Figure 7).
10 40 5020 30 60 70 80
Having an appreciation for the value of lifelong learning
Being intellectually well-rounded
Having a defined professional goal and a plan to achieve that goal
Having a job in which the skill set relates to his or her college major
Having a job in which the salary will enable the graduate to pay off
college debt within 10 years
Having a job requiring a college degree
Being actively involved in civic or volunteer activity
Having minimal or no higher education debt
63%51%
57%45%
71%63%
34%32%
51%
9%
13%12%
29%
5%
6%4%
9%9%
5%10%
7%5%
14%15%
11%
1%2%
4%13%
4%
7%7%
4%
44%
40%40%
47%
67%
32%44%
B A C C A L A U R E ATE S P E C I A L F O C U SD O CTO R A L/ R E S E A R C H A S S O C I ATE SM A STE R S
TOC»
E D U C A T I O N U N D E R R E V I E W
17

Only about one in four chief academic officers said that students should use salary outcomes data in making college choice decisions (See Figure 8). However, a vast majority of respondents stated that
both job and graduate institution placement rates are at least a somewhat effective way for the public to assess a college’s performance (See Figure 9).
FIGURE 8SHOULD STUDENTS MAKE COLLEGE DECISIONS BASED ON COLLEGE SCORECARD SALARY OUTCOMES?
FIGURE 9INDICATORS TO USE IN ASSESSING A COLLEGE’S PERFORMANCE
74%
26%YES
NO
Academic preparation of students
Job and career preparation for graduates
Retention and graduation rates Managing institutional enrollments
10
20
30
40%
B A C C A L A U R E ATE S P E C I A L F O C U SD O CTO R A L/ R E S E A R C H A S S O C I ATE SM A STE R S
Only about one in four chief academic officers said students should use salary outcomes data in making college choice decisions.
36%
25%
30%31%32%
23%
33%33%31%
27%25%
22%18%18%18% 17%
20%20%20%22%
TOC»
E D U C A T I O N U N D E R R E V I E W
18

Introduction The fallout from the global financial crisis was somewhat slow to reach higher education. By the time the housing market crashed in the fall of 2008, colleges had already welcomed their freshman class for the academic year. The following year, many colleges were forced to either raise their discount rates or lower their expectations for enrollment. For the most part, however, college and university leaders were able to manage the crisis, assuming that the economy would turn around, as it had after past downturns.
Private four-year colleges face more pressure to
address career preparation from parents and
prospective students, while employers put more
pressure on two-year colleges.
Student Outcomes

10 40 5020 30 60 70 80 90%
FIGURE 10COLLEGES FACE VARYING DEGREES OF CAREER PREPARATION PRESSURES FROM STAKEHOLDERS
Colleges are under duress to address career preparation from a number of sources (See Figure 10). Approximately one-half of respondents
reported feeling “great” or “very great” pressure from prospective students and families, governing boards, parents, government
agencies, employers and current students. The three lowest sources of stress came from accrediting bodies, alumni and faculty. Private four-year colleges faced more pressure from parents and prospective students, while employers put more pressure on two-year colleges.
75 percent of four-year college chief academic officers said their students were at least “prepared” or “well prepared” to look for a job. Those at two-year institutions weren’t as confident.
Other
Accrediting agency
Prospective students & families
Current graduate students
Members of your governing board
Alumni
Parents of current students
Faculty members
Government agencies
Employers
Current undergraduates
80%71%
70%
61%
64%
37%
34%
51%
28%
32%
27%
15%
54%
45%
61%
57%
31%
32%
21%
12%
14%
49%
P R I VATE P U B L I C
TOC»
E D U C A T I O N U N D E R R E V I E W
20

10
20
30
40
50%
The discussion around preparing graduates for jobs has increased over the past three years.
Although colleges may not want to be valued based on their students’ employment outcomes (some colleges are now subject to gainful employment regulations), they are paying more attention to career development.
Eighty-one percent of respondents reported their college had “more” or “a lot more” discussion of career development than just three years ago (See Figure 11).
FIGURE 11COLLEGES AND UNIVERSITIES ARE DISCUSSING JOB PREP FOR GRADUATIONS MORE THAN THREE YEARS AGO
A lot more
44%
37%
19%
0% 0%
33%
46%
21%
0% 0%
About the sameMore Less A lot less
P R I VATE P U B L I C
TOC»
E D U C A T I O N U N D E R R E V I E W
21

Many respondents say their students are prepared or well prepared for a job search. At four-year colleges, 75 percent of chief academic officers said their students were at least “prepared” or “well prepared”
to look for a job. But those at two-year institutions weren’t as confident, with 35 percent saying its students are “unprepared” to “very unprepared” (See Figure 12).
FIGURE 12CONFIDENCE THAT GRADUATES ARE PREPARED FOR A JOB SEARCH
Baccalaureate Doctoral/research Special focusMasters Associates
1%
61%
15%
24%
2%
56%
24%
19% 19%
69%
12%
18%
2%
38%
40%
2%
10%1%
55%
33%
2%
V E RY W E L L P R E PA R E D V E RY U N P R E PA R E DP R E PA R E DW E L L P R E PA R E D U N P R E PA R E D
The discussion around preparing graduates for jobs has increased over the past three years.
TOC»
E D U C A T I O N U N D E R R E V I E W
22

10 40 5020 30 60 70 80 90%
While respondents from two-year colleges were evenly split on whether colleges should focus on a broad education compared to job training,
an overwhelming percentage of respondents from four-year colleges indicated a focus on broad education is best (See Figure 13).
FIGURE 13ROLE OF COLLEGES AND UNIVERSITIES IN CAREER PREPARATION
Experiential learning is an increasingly important feature of
college/university curricula
Career preparation is a responsibility that cuts across the college/university
A college or university should take future labor force demand
into consideration when planning curricular and co-curricular offerings
Colleges and universities should provide a broad education not career-
specific training
The quality of the academic program and the quality of career preparation
are not separable
Students entering college/university today are driven equally by successful
outcomes and the quality of the academic program
Colleges and universities should be held accountable for career success
of their students
A college or university whose graduates are not satisfied with their
careers is not doing its job
91%
89%
72%
90%
70%
51%
57%
53%
57%
64%
33%
36%
26%
24%
86%
85%
P R I VATE P U B L I C
TOC»
E D U C A T I O N U N D E R R E V I E W
23

The internship ranked No. 1 as the
most important factor in graduates securing a first job,
with relevance of coursework
ranking second.
Career preparation

FIGURE 14FACTORS CONTRIBUTING TO NEW GRADUATES’ SUCCESS IN THE JOB MARKET
Chief academic officers overwhelmingly identified the internship as the most important factor in new graduates securing a job, far
more important across all sectors than coursework, and major or institutional prestige (See Figure 14).
However, respondents said they need to do more to develop opportunities for internships and other direct work experience and can do a better job of cultivating relationships with employers (See Figure 15).
Colleges and universities need to do more to develop internship and direct work experience opportunities for students.
Internships Relevance of coursework
College major Employment during college
University rank and prestige
College GPA Extra-curricular activities
Volunteer experience
0
10
20
30
40
80
90%
50
60
70
81%
45%
23%
13%
6%
11%10%
5%
TOC»
E D U C A T I O N U N D E R R E V I E W
25

FIGURE 15BIGGEST CONCERNS ABOUT COLLEGE OR UNIVERSITY’S PREPARATION OF STUDENTS FOR CAREERS
We do not have enough information about the success of our students
post graduation
We need to develop more opportunities for internships and
other direct work experience
We need to do more to cultivate relationships with employers
Faculty members need to become more engaged in
campus efforts to help prepare students for the workplace
The focus on quantitative data about outcomes distracts students from
understanding the deeper value of the institution
It is hard to define “success“ relative to student outcomes
Our curriculum does not provide enough experiential learning
opportunities (e.g., extended projects, working in teams, etc.)
Our career services office is “siloed” —it needs to collaborate more with
other constituencies on campus
10 3020 40 50%
36%
36%
18%17%
9%18%
19%13%
9%
9%
9%10%
22%
22%
10%
47%
46%40%
40%
30%
28%
31%
26%15%
7%
18%13%
12%
22%27%
25%
25%
20%16%
30%
27%29%
33%
40%
42%
B A C C A L A U R E ATE S P E C I A L F O C U SD O CTO R A L/ R E S E A R C H A S S O C I ATE SM A STE R S
TOC»
E D U C A T I O N U N D E R R E V I E W
26

10 40 5020 30 60 70 80 90 100%
Asked how much they agree or disagree with statements about the role of colleges and universities in career development, 95 percent at four-year public colleges said experiential learning is an
increasingly important feature of college curricula. Few respondents from all sectors agreed with the statement that a college whose graduates are not satisfied with their careers is not doing its job.
Associate’s degree-granting institutions and public institutions felt a larger responsibility to align academics to the demands of the labor market (See Figure 16).
FIGURE 16THE EXTENT TO WHICH CHIEF ACADEMIC OFFICERS AGREE WITH INSTITUTION’S ROLE IN CAREER DEVELOPMENT
Experiential learning is an increasingly important feature of
college/university curricula
Career preparation is a responsibility that cuts across the college/university
A college or university should take future labor force demand into
consideration when planning curricular and co-curricular offerings
Colleges and universities should provide a broad education not
career-specific training
The quality of the academic program and the quality of career
preparation are not separable
Students entering college/university today are driven equally
by successful outcomes and the quality of the academic program
Colleges and universities should be held accountable for the career
success of their students
A college or university whose graduates are not satisfied with their careers is not doing its job
94%93%
84%87%
85%75%
70%82%
80%
73%
78%63%
58%
56%
46%64%
69%60%
54%54%
52%56%
34%31%
31%
24%20%
30%27%
29%
40%39%
58%
38%
76%94%
89%
89%
90%84%
B A C C A L A U R E ATE S P E C I A L F O C U SD O CTO R A L/ R E S E A R C H A S S O C I ATE SM A STE R S
TOC»
E D U C A T I O N U N D E R R E V I E W
27
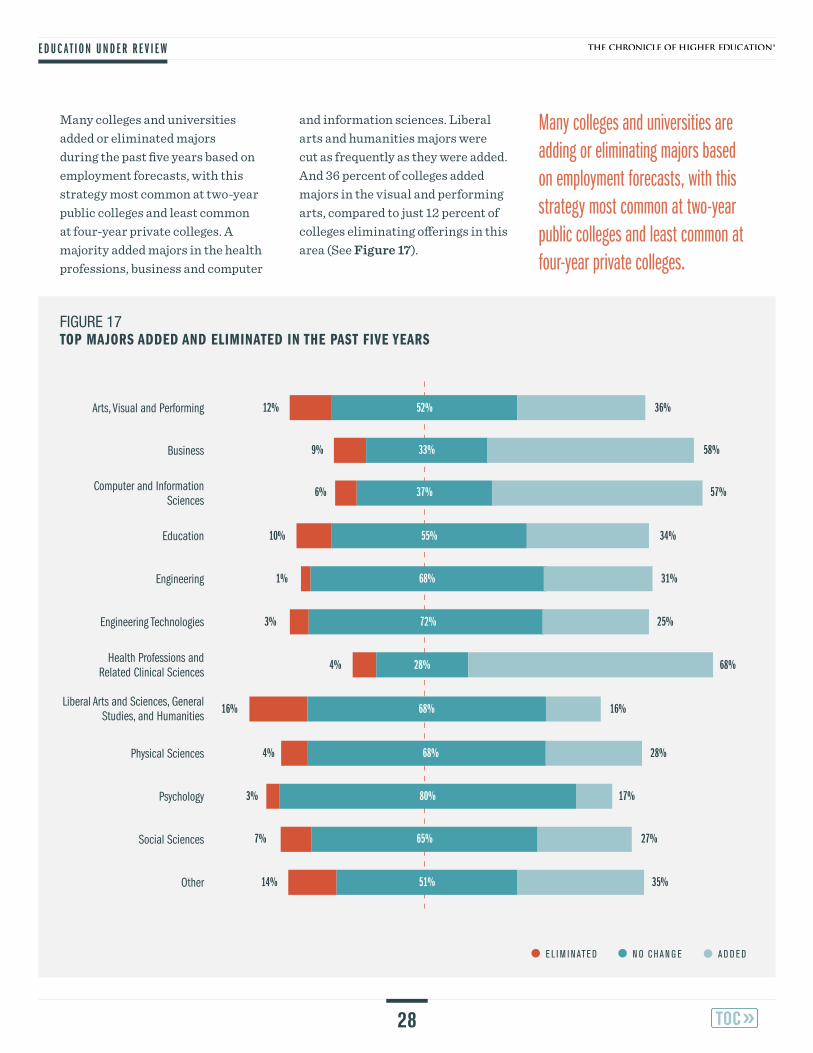
Many colleges and universities added or eliminated majors during the past five years based on employment forecasts, with this strategy most common at two-year public colleges and least common at four-year private colleges. A majority added majors in the health professions, business and computer
and information sciences. Liberal arts and humanities majors were cut as frequently as they were added. And 36 percent of colleges added majors in the visual and performing arts, compared to just 12 percent of colleges eliminating offerings in this area (See Figure 17).
FIGURE 17TOP MAJORS ADDED AND ELIMINATED IN THE PAST FIVE YEARS
Arts, Visual and Performing
Engineering Technologies
Psychology
Education
Liberal Arts and Sciences, General Studies, and Humanities
Other
Computer and Information Sciences
Health Professions and Related Clinical Sciences
Social Sciences
Engineering
Physical Sciences
Business
Many colleges and universities are adding or eliminating majors based on employment forecasts, with this strategy most common at two-year public colleges and least common at four-year private colleges.
N O C H A N G EE L I M I N ATE D A D D E D
52%
33%
37%
55%
68%
72%
28%
68%
68%
80%
65%
51%
12%
9%
6%
10%
1%
3%
4%
16%
4%
3%
7%
14%
36%
58%
57%
34%
31%
25%
68%
16%
28%
17%
27%
35%
TOC»
E D U C A T I O N U N D E R R E V I E W
28

The vast majority of colleges offer career counseling and internship placement assistance, but there is disparity in the volume of alumni mentoring programs between two- and four-year colleges, with just 9 percent of two-year colleges having
a program compared to nearly 50 percent of four-year colleges (See Figure 18). A majority of colleges reported having data on alumni outcomes through a combination of alumni surveys, information from career services, and feedback from
employers. Alumni surveys were the most common source of information at four-year colleges, while employer feedback was most common at two-year colleges (See Figure 19).
FIGURE 18CAREER PREP OFFERINGS
“Basics of Business” course
Career counseling
Assigned alumni mentoring program
Supported development of a post-graduation professional plan
FIGURE 19ALUMNI EMPLOYMENT IS DATA COLLECTED FROM MULTIPLE SOURCES
Data from periodic alumni surveys
Feedback from employers (including surveys)
Statistics provided by Career Services from their own follow-up efforts
Other
40
50
60
70
80
90
100%
B A C C A L A U R E ATE S P E C I A L F O C U SD O CTO R A L/ R E S E A R C H A S S O C I ATE SM A STE R S
Institutionally arranged internship or co-op programs
N OT O F F E R E D O F F E R E D , O PT I O N A L O F F E R E D , M A N D ATO RY
86%
81%
45%
73%
50%
2%
4%
53%
23%
50%
12%
15%
2%
4%
1%
89%
47%
69%
80%81%
50%53%
69%66%
77%
63%
75%
58%60%
51%
100%
64%
100%
78%75%
TOC»
E D U C A T I O N U N D E R R E V I E W
29

Conclusion
Colleges are facing intense pressure to demonstrate their value to students, their families and the public after decades
of rising tuition prices. The release of college and university data on earnings and student loan repayment rates has only heightened that pressure, as college costs, graduation outcomes and student debt levels can be compared on a national basis for the first time. Although a majority of academic officials surveyed by The Chronicle did not think students and their families should choose a college based on future earnings of graduates, it is inevitable that colleges will be judged by these employment-related outcomes.
Colleges and universities are caught in a fundamental tension between focusing on general skills that prepare students for
any career after college—such as critical thinking and problem solving—and specific skills that are needed for a given job that is in demand today. The survey
indicated that four-year colleges have generally chosen to focus on general skills, while two-year colleges tend to focus more on job-specific skills. Yet four-year colleges and universities are increasingly working to provide students with job opportunities in their chosen majors of work through internships and co-op experiences.
Colleges are responding to labor market projections by either adding or eliminating majors, with far more colleges adding than eliminating fields of study. Much of the growth in majors has occurred in more vocational fields, such as business, information technology and health care and these programs have the potential to help colleges meet their enrollment and revenue targets.
Most colleges offer career counseling and internship placement assistance, but there is disparity in the volume of alumni mentoring programs between two- and four-year colleges, with just 9 percent of two-year colleges having a program compared to nearly 50 percent of four-year colleges.
Colleges and universities are caught in a fundamental tension between focusing on general skills and job-specific skills.
MethodologyThe results discussed in this report are based on a survey of academic vice presidents, deans, and executive directors at public and private degree-granting colleges and universities in the United States. Of the 5,436 academic officials invited to complete the survey in November 2015, 506 did so—reflecting a 9.3 percent response rate. These 506 individuals reflect responses from 466 colleges, and responses are not weighted to reflect multiple responses from the same institution
Education Under Review is based on a survey by Maguire Associates and was written by Robert Kelchan, an assistant professor at Seton Hall University, and edited by Karin Meadows, an assistant editor at The Chronicle of Higher Education, Inc. The report is sponsored by Ellucian. The Chronicle is fully responsible for the report’s editorial content. Copyright 2016. TOC»

Technology solutions designed for today’s modern student
Higher educationhappens here.
Student success starts with keeping students in school and on track. So we’ve developed a solution that helps you streamline the admissions operations while providing an engaging, personalized web experience for prospective students.
Ellucian Recruiter™ is a comprehensive solution that supports the entire recruiting and admissions lifecycle. It provides powerful features designed to help your institution find the best prospects, engage them more successfully, improve enrollment results—and manage the recruitment cycle more efficiently and effectively. Just one of the reasons more than 2,400 institutions around the globe rely on us to help them reach their goals.
Visit ellucian.com/success to learn more about how our award-winning software can help you help your students succeed.

1255 Twenty-Third Street, N.W. Washington, D.C. 20037
(202) 466-1000 | Chronicle.com
Copyright ©2016
© 2016 by The Chronicle of Higher Education, Inc. All rights reserved. This material may not be reproduced without prior written permission of The Chronicle. For permission requests, contact us at [email protected].
SPONSORED BY:


