Embed Size (px)
Citation preview
REPORT FROM OFFICE OF THE CITY ADMINISTRATIVE OFFICER
Date: August 03, 2012
To: The City Council, The Mayor
CAO File No. 0110-00800-0000 Council File No. 09-0600-8159,
12-0692 Council District: 9
From: Miguel A Santana, City Administrative Office~ 1/. ~ Reference: Three-Year Plan to Fiscal Sustainability (C.F. No. 09-0600-S159)
Subject: LOS ANGELES CONVENTION CENTER PROPOSAL FOR AN ENHANCED GOVERNANCE STRUCTURE AND REQUEST FOR AUTHORITY TO RELEASE A REQUEST FOR PROPOSAL FOR OPERATING MANAGEMENT SERVICES
EXECUTIVE SUMMARY
On January 29, 2010 the City Administrative Officer (CAD) released its Three Year Plan to Fiscal Sustainability, in which the proposal to privatize the management and operations of the Los Angeles Convention Center (LACC) was first discussed. This Office has submitted several status reports to the Trade and Commerce Committee since then dated July 16, 2010 and May 11, 2011 (C.F. No. 10-0922) (Attachment 1). Based on our findings, the CAD has concluded that in order for the LACC to compete as a top tier facility within the convention industry, the City must accomplish three things: (1) enhance the governance structure of the LACC; (2) adopt an alternative structure for operating management services; and (3) expand the City's hotel room supply to 5,000 rooms within a ~ mile radius of the LACC.
The CAD recommends the adoption of an oversight structure similar to some of the country's top tier convention centers, by enhancing the existing powers of the LACC Commission to instead operate as a Board of Commissioners (Board) that would advise the Mayor and Council on all policies related to tourism, marketing and the LACC. The Board woutd have oversight and control of the LACC and services provided by the Los Angeles Tourism and Convention Board (LATCB), formerly known as LA Inc., which would ensure a common mission and goal for bringing convention business to the City.
The common mission and goal of any top tier convention center is to bring convention business to the City for the purposes of attracting out of town visitors that will generate spending and hotel occupancy, which in turn benefits the General Fund. However, in the last several years the City's competing focus has been generating sufficient operating revenue, which does not directly benefit the City's General Fund but rather the LACC's special fund. Booking priorities have shifted at times compromising citywide conventions that generate an out of town attendance, for non-citywide shows such as local trade and consumer shows. In a study commissioned by KPMG, KNN Public Finance and Crossroads Consulting Services, the number of citywide events to, non-citywide events was compared to competing regional convention centers in Anaheim, San Francisco and San Diego. According to the data collected, in 2010-11 only 11 percent (or 145,368) of LACC's total attendees were from citywide conventions, in comparison to competing facilities whose total attendees from citywide conventions were closer to 60 percent. Although the Auto Show is a unique event that
CAO File No.
0110-00800-0000 PAGE
2
accounts for a large percent of the LACC's total attendance, there appears to be an opportunity to significantly increase the number of convention attendees at the LACC with various operational and policy changes. Taking into consideration the cyclical nature of citywide convention business from year to year in terms of number of events and attendees, it is recommended that the City establish a goal of hosting between 400,000 and 425,000 citywide convention attendees - an increase of approximately 290% --by 2020. Revising applicable policies and shifting the overall mix of event activity to host more citywide conventions will directly result in higher economic and fiscal benefits to the City and the State. In general the goal estimate is based on the following assumptions:
• Historical, lost and future bookings tracked by LATCB;
• Enhanced governance structure;
• New convention center management structure;
• Expanding the convention quality hotel supply to 5,000 rooms within a 'Y2 mile radius;
• Changes in the booking policy allowing LA TCB a larger booking window and remaining grandfathered exceptions that will increase available dates during prime convention months; and,
• Maintaining the discount policy in order to be consistent with competitors and industry standards.
The CAO recommends creating a Chief Executive Officer (CEO) position to oversee and manage the day-to-day business and issues that may arise with LACC operations and to facilitate a positive working relationship between the LACC and the LATCB. The CEO would also serve as a liaison to the Mayor and the City Council (Council), while reporting to the Board with updates related to the progress of LACC operations.
The CAO recommends an alternative structure for management and operations of the LACC and that the CAO be authorized to release a Request for Proposal for LACC management and operations. The CAO will report back by the fall of this calendar year with a recommendation for a private management firm, with anticipation that the City will fully transition to a private management model by July 1, 2013. The LACC has a total of 113 full-time employees, 12 of which are positions unique to the LACC including: (1) Event Services Manager, (7) Event Services Coordinators, (1) Marketing Manager and (3) Senior Sales Representative positions. The goal is to maintain as many of the general classifications by moving employees to comparable positions within the City. Employees filling positions unique to the LACC will be provided the option to be retained by the new contractor under similar circumstances established by the City's Service Contractor Worker Retention Ordinance, which requires the successful contractor, employed by the City, to offer employment and retain for a 90-day period the employees who worked for at least 12 months with the terminated contractor.
Aside from structural changes, the CAO also recommends changes to operating policies that will make the LACC a competitive, top tier convention destination. This includes amending the existing
CAO File No. PAGE
0110-00800-0000 3
Booking Policy by reducing the booking window from 24 months to 12 months. It also includes eliminating grandfathered exceptions, which currently allows the LACC to book non-citywide conventions beyond the 24 month booking window, including the Auto Show and the Gift Show. The CAO recommends adopting the Discount Policy currently in use, as the City's official Discount Policy and recommends making the necessary changes in the Los Angeles Administrative Code. Also, if necessary, the goals of the LATCB contract should be reviewed to be made consistent with proposals that may be adopted by the Council.
INTRODUCTION
The City Administrative Officer (CAO) has released several reports focusing on the City's long term plan for improving its fiscal condition including the "Three-Year Plan to Fiscal Sustainability" (C.F. No. 09-0600-S159) dated January 29, 2010 and the "Opportunity to Redefine and Strengthen Los Angeles City Government" (C.F. No.1 0-0600-S61) dated March 18, 2011 that resulted in the City Council adopting the following policy strategies: (1) Responsible Management and Fiscal Practices; (2) Focus of Core Services; (3) Alternative Service Delivery Models (Alternative Model); and (4) Maintaining a Sustainable Workforce.
The framework defined for addressing the fiscal crises was aimed at reducing the size and ongoing cost of the City's workforce, organizing City government to maximize service levels and strengthening the Reserve Fund. Pursuant to this plan, this Office was instructed to present a proposal for an Alternative Model for the Los Angeles Convention Center (LACC) to allow for more flexibility and efficiency, while reducing the City's General Fund burden. While the City chooses to segregate LACC revenue into a special fund, the LACC is a General Fund asset. The CAO believes that a new governance structure will maximize that asset. For 2010-11, the General Fund paid for LACC debt service and a portion of related costs for a total of $41.3 million. Debt service is a General Fund obligation. Remaining costs, including operating costs, were paid for with LACC operating revenues for a total of $26 million. The total cost for operating the Convention Center amounts to $67.3 million.
In developing an Alternative Model, two issue areas were analyzed: (1) identifying the gaps within the City's convention and hospitality industry that prevent it from being a top tier convention destination; and (2) steps the City can take to make it competitive among top convention destinations. The CAO commissioned KPMG, KNN Public Finance and Crossroads Consulting Services (Phase One Advisors) to prepare a comparative analysis (Attachment 2) among regional convention centers of LACC's operating finances. This Office also commissioned Peralta Garcia Solutions and Crossroads Consulting Services (Phase Two Advisors) to perform a comparative analysis (Attachment 3) among regional and national convention centers to identify factors impacting the competitiveness of the LACC, and to propose recommendations for changes the City can make to enhance its current governance structure.
The Phase Two Advisors identified the fo"lIowing as factors impacting the LACC's competitiveness in the industry:
.. Significant investments have been made to the area surrounding the LACC including the Staples Center, LA Live, the JW Marriott and Ritz Carlton hotels, while the LACC has undergone little change in capital improvements, management, governance and marketing;
CAO File No.
0110-00800-0000 PAGE
4
• The convention industry has undergone significant changes making it a highly competitive marketplace;
411 Successful convention centers have undergone capital improvements, and changes to its business structure and strategies;
., Fewer hotel rooms within Yz mile to the LACC relative to peers;
lit Limited on-going and day-to-day collaboration between stakeholders; and
It Lack of a streamlined governance structure that impacts accountability, flexibility and results.
There are changes the City can make today that would improve the competitiveness of the LACC in the convention marketplace assuming no capital improvements are made to the facility. First, the City must streamline its goals and objectives for the LACC to improve its business model by enhancing its government structure. The CAD is recommending the creation of a Board of Commissioners (Board) that would be tasked with implementing the Mayor and Council's policies, directing and managing the LACC on matters related to bookings, operations and finances, and overseeing the LA TCB contract on matters related to tourism and bookings.
Second, it is recommended that LACC operations be managed by a third party management firm. According to our Phase Two Advisors, as convention centers become more performance based, municipalities have started shifting operations to private management firms. Most recently, the McCormick Place in Chicago, the largest sized convention center in the country and Cobo Hall in Detroit, a facility of equivalent size to the LACC, hired private management firms to oversee its facility operations. Privatizing management is a clear indication that the LACC is committed to improving its competitiveness in the marketplace. Attachment 4 is an organizational chart that provides a visual description of the relationship between the Board, the private management firm and its place within the City's existing structure.
Third, it is recommended that the LACC's operating policies be made current with the industry standard. The CAD has included a revised Booking Policy (Attachment 5) and has provided recommendations to change the Administrative Code to address the Discount Policy. It is also recommended, that if necessary, the goals of the LATCB contract be made consistent with the outlined proposal.
ENHANCED GOVERNANCE MODEL
Board of Commissioners
Currently, the LACC and the LA TCB report to two separate City offices. The General Manager of the LACC reports to the Mayor and advises the Council on matters that require legislative action. The CAD administers the City's agreement with the LA TCB. The LA TCB is an independent non-profit corporation the City contracts with to market Los Angeles as a convention, meetings and leisure travel destination, and receives an amount equivalent to one percent of the Transient Occupancy
CAO File No.
0110-00800-0000 PAGE
5
Tax (TOT). It is typical for cities to contract with destination marketing organizations, such as the LATCB and to have a separate convention center management body. However, in the case of the City, the two entities report to separate offices. The lack of a streamlined governance structure has resulted in poor accountability, conflicting objectives and sporadic collaboration.
The LACC currently has a five member advisory commission (Commission) that advises and consults with the General Manager on the operation and maintenance of the LACC. However the Commission has neither direct oversight nor authority over the LACC operations. There is also the Los Angeles Convention and Exhibition Center Authority (Authority), which was established pursuant to a Joint Exercise of Powers Agreement between the City and the County of Los Angeles to assist with the financing, acquisition, and construction of convention and exhibition facilities located within the boundaries of the City. The Authority consists of 15 members, 10 of whom are appointed by the Mayor and approved by the Council and five of whom are appointed by the County Board of Supervisors. The Authority has no oversight of the LACC's day-to-day operations and has no funding obligations to the LACC.
Similar to the cities of Chicago, Detroit, Denver, and Atlantic City, the CAO is recommending streamlining its governance model by placing the LACC under the control and management of the Board (see Attachment 4). The CAO is also recommending that the Board have oversight of the LATCB contract. The Board will advise the Mayor and Council on all policies related to tourism, and marketing Los Angeles. By streamlining the governance structure and requiring the LACC and LATCB to report to one entity, it ensures that the City is operating towards one mission, which is making the LACC a top tier convention destination. The Board will have public meetings and will be required to meet at least once a month. Other duties will include but are not limited to providing annual review of the City's marketing plan, budgets and related matters to ensure they are in conformance with the City's operating policies. Board Members shall be appointed by the Mayor, subject to the confirmation by the Council by majority vote. Board Member term limits should overlap Mayoral term limits to ensure continuity in policy and operations. It is recommended that the Board consist of 9 to 13 volunteer members, which would include representatives from labor, film, legal, hospitality, hotels and private development sectors. The CAO recommends enhancing the role of the current Commission to reflect the Board as just described. The CAO is making no recommendation that would impact the role of the Authority.
It is recommended that the City create a CEO position, to operate in a full-iime capacity, to serve as a representative of the Board and to act as a liaison to the Mayor, the Council and City departments. The CEO will be appointed by the Mayor and approved by the Council as a City employee with an exempt status. The CEO is specifically charged with leading and maximizing the LACC asset, by attracting new conventions, meetings and hotel room nights to generate TOT revenues and economic benefit. The CEO will have direct oversight of the LACC and the LA TCB contract. The following includes, but is not limited to, the CEO's day-to-day duties and responsibilities:
4& Coordinate and participate in Board meetings; 1& Implement instruction received by the Board; 1& Communicate daily with the LACC and LA TCB, administer booking conflicts and execute
decisions that are consistent with the City's policies for tourism and convention business; 1& Build, develop and maintain relationships with firms, agencies and stakeholders;
CAO File No.
0110-00800-0000 PAGE
6
• Provide financial oversight, initiate and direct financial programs to fund new and continuing improvements;
CD Shepherd acquisition of new business for LACC and hotels; CD Collaborate with hospitality stakeholders to assist in new business acquisition; and, CD Collaborate with and on behalf of the Mayor and Council to manage and resolve city-wide
issues related to the tourism and convention business.
Alternative Operational Management
There are three types of service delivery models or management structures most common for convention center facilities in the United States including, (1) a municipal management structure similar to Los Angeles; (2) an independent public authority; and (3) a third party private management firm. Among the 26 larger convention centers in the United States, 27 percent are managed by municipalities, 35 percent by independent authorities and 31 percent by private management companies. The remaining seven percent is a miscellaneous category in which the facility is managed by either the local destination marketing organization or a non-profit corporation.
The Phase One Advisors prepared a comparative analysis of LACC's operating finances with its regional competitors, including Anaheim, San Diego, and San Francisco. The comparative analysis includes an overview of the LACC's finances and recommends a management model that would:
• Allow more flexibility and efficiency with LACC operations; 411 Maximize the City's competitive position as a major convention destination; and, 411 Reduce the City's General Fund subsidy.
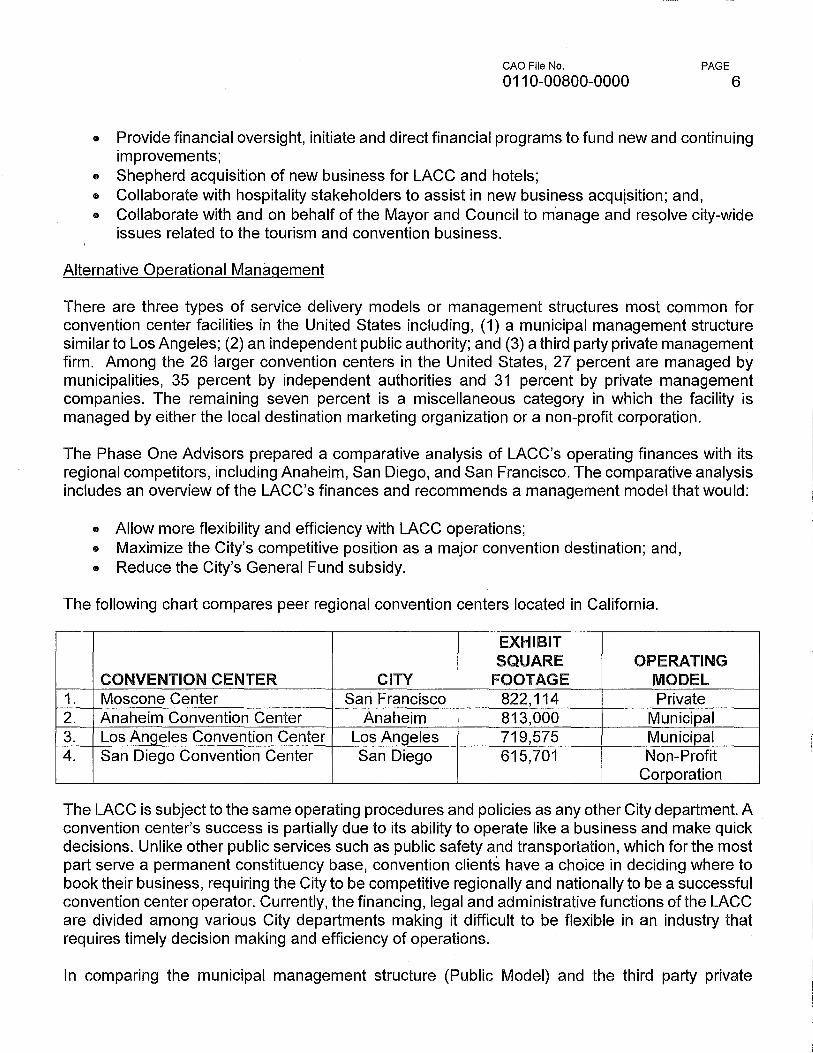
The following chart compares peer regional convention centers located in California.
EXHIBIT SQUARE OPERATING
CONVENTION CENTER CITY FOOTAGE MODEL 1. Moscone Center San Francisco 822,114 Private 2. Anaheim Convention Center Anaheim 813,000 Municipal 3. Los Angeles Convention Center Los Angeles 719,575 Municipal 4. San Diego Convention Center San Diego 615,701 Non-Profit
Corporation
The LACC is subject to the same operating procedures and policies as any other City department. A convention center's success is partially due to its ability to operate like a business and make quick decisions. Unlike other public services such as public safety and transportation, which for the most part serve a permanent constituency base, convention clients have a choice in deciding where to book their business, requiring the City to be competitive regionally and nationally to be a successful convention center operator. Currently, the financing, legal and administrative functions of the LACC are divided among various City departments making it difficult to be flexible in an industry that requires timely decision making and efficiency of operations.
In comparing the municipal management structure (Public Model) and the third party private
CAO File No.
0110-00800-0000 PAGE
7
management structure (Private Model) the Phase One Advisors concluded that the Private Model had the potential to reduce General Fund costs by approximately $2 million to $6 million for the first year of operation, resulting in a total potential savings of $14 million to $37 million over a five-year period. Any revenue or savings generated from privatization should be reinvested into the LACC to support capital improvement costs and/or to reduce the debt service obligation.
The financial advisors considered market results at other convention centers, peer operating data, input from various convention center facility operators and other industry research. Although these assumptions are based on estimates and will be validated upon bid submissions, cost saving opportunities may exist in the following areas: (1) additional revenues; (2) reductions in staff expenses; (3) reductions in benefit costs; and (4) reductions in operating expenses. Under the Private Model, labor costs would decrease as a result of reducing the number of full-time equivalents, the cost of intermittent employees, and related costs. Second, the operator under the Private Model is not subject to City pension and health care costs. Third, there may be cost saving opportunities through reduced operating, contractual and supply expenses. Private operators have the resources to provide certain ancillary services in-house which creates potential for generating more revenue at reduced costs. If adopted, then savings generated from privatization should be reinvested into the LACC to reduce debt service costs or to address capital improvements.
Other advantages identified under the Private Model include:
It Capability to rotate events through other existing facilities managed by the selected contractor;
It Less civil service constraints on matters such as hiring, contract approvals, negotiations, and general procurement activities;
It Provides operating autonomy; • Potential funding partner; It Experienced staff from similar sized markets/venues familiar with the competitive
environment; III Budget certainty for the City; III Performance incentives potentially available to staff; and III Contractual obligations and incentives tied to public policy directives.
2010-11 LACC Breakdown of Citywide Revenues and Expenses
The LACC's total annual operating cost for 2010-11 was approximately $75.8 million consisting of $22.2 million for direct appropriations, $48.1 million for debt service, and $8.1 million for related costs and various City services. Of the $75.8 million in costs, $49.8 million is paid through the General Fund, while the remaining cost is paid through LACC revenues, $26 million. Since the construction and expansion of the LACC, the Council has taken several actions that have resulted in an annual dedication of 3.5 percent of TOT revenues ($36.3 million) and an additional $5 million called the Booking Policy Offset Fee 1 to pay for LACC costs. It was assumed that this annual General Fund appropriation and LACC operating revenues would be sufficient to cover all LACC costs. However this has not been the case. As a result, the City has had to provide a supplemental General Fund amount, which for 2010-11 amounted to $8.5 million. The following chart breaks down this information:
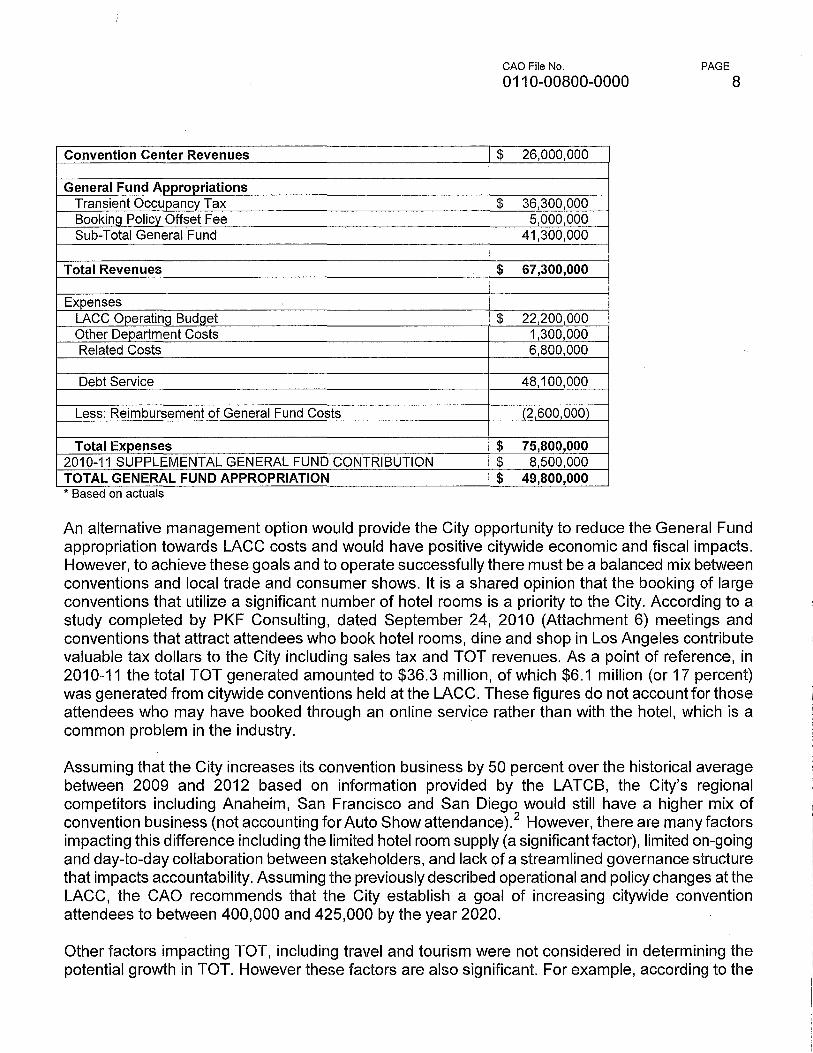
Convention Center Revenues
General Fund Appropriations Transient Occupancy Tax Bookinq Policy Offset Fee Sub-Total General Fund
Total Revenues
Expenses LACC Operating Budget Other Department Costs Related Costs
Debt Service
Less: Reimbursement of General Fund Costs
Total Expenses 2010-11 SUPPLEMENTAL GENERAL FUND CONTRIBUTION TOTAL GENERAL FUND APPROPRIATION * Based on actuals
CAO File No.
0110-00800-0000
$ 26,000,000
$ 36,300,000 5,000,000
41,300,000
$ 67,300,000
$ 22,200,000 1,300,000 6,800,000
48,100,000
(2,600,000)
$ 75,800,000 $ 8,500,000 $ 49,800,000
PAGE
8
An alternative management option would provide the City opportunity to reduce the General Fund appropriation towards LACC costs and would have positive citywide economic and fiscal impacts. However, to achieve these goals and to operate successfully there must be a balanced mix between conventions and local trade and consumer shows. It is a shared opinion that the booking of large conventions that utilize a significant number of hotel rooms is a priority to the City. According to a study completed by PKF Consulting, dated September 24, 2010 (Attachment 6) meetings and conventions that attract attendees who book hotel rooms, dine and shop in Los Angeles contribute valuable tax dollars to the City including sales tax and TOT revenues. As a point of reference, in 2010-11 the total TOT generated amounted to $36.3 million, of which $6.1 million (or 17 percent) was generated from citywide conventions held at the LACC. These figures do not account for those attendees who may have booked through an online service rather than with the hotel, which is a common problem in the industry.
Assuming that the City increases its convention business by 50 percent over the historical average between 2009 and 2012 based on information provided by the LATCB, the City's regional competitors including Anaheim, San Francisco and San Diego would still have a higher mix of convention business (not accounting for Auto Show attendance).2 However, there are many factors impacting this difference including the limited hotel room supply (a significant factor), limited on-going and day-to-day collaboration between stakeholders, and lack of a streamlined governance structure that impacts accountability. Assuming the previously described operational and policy changes at the LACC, the CAO recommends that the City establish a goal of increasing citywide convention attendees to between 400,000 and 425,000 by the year 2020.
Other factors impacting TOT, including travel and tourism were not considered in determining the potential growth in TOT. However these factors are also significant. For example, according to the
CAO File No.
0110-00800-0000 PAGE
9
2012-13 Economic Forecast and Industry Outlook report prepared by the Los Angeles County Economic Development Corporation (Attachment 7), Los Angeles County hosted a record of 26.9 million visitors in 2011. Further, more international travelers (5.9 million) arrived in Los Angeles last year, which is an increase of 6.7 percent compared with 2010. The PKF Consulting Study also stated that:
According to Destination Marketing Association International, each citywide roomnight generates an economic impact of $894 to the City of Los Angeles. This can be compared to the average consumer or trade show which typically attracts local day visitors who are estimated by the LAEDC to contribute an economic impact of approximately $43 per attendees.
Again, as a point of reference, the total number of room nights for 2010-11, according to the LATCB, was approximately 235,054, which was determined based on the number of room blocks utilized for each citywide event. When using $894 as the economic impact calculator, the economic impact is approximately $210 million. If convention room nights were increased by approximately 50 percent, the estimated economic impact could have amounted to $315 million. As stated earlier, the room nights estimate is conservative and does not account for those attendees who may have booked through an online service rather than with the hotel directly. Also, the current economic impact calculator has been revised from $894 to $1,300.
While it is difficult to measure and project the potential growth in TOT and the general economic impact of citywide conventions, it is clear that conventions and their attendee spending is more valuable to the City than trade and consumer shows. This Office believes that a change in operations management will further enforce the LACC's competitiveness within the convention marketplace. Through focused and aggressive sales and marketing efforts of the LATCB and facility management, combined with implementation of recommended operating policy changes, the goal of increasing convention business by 50 percent is realistic and achievable.
The CAO requests approval to release a Request for Proposal (RFP) (Attachment 8), anticipated for release in August 2012. The RFP seeks to contract with a private operator that will perform the dayto-day operations and management of the facility in accordance with the City's Booking and Discount policies. The private operator will work directly with the CEO and the LA TCB in managing bookings and coordinating operations.
Proposed Convention Center Renovation and Downtown Event Center Project
On August 9,2011, the City Council adopted a Memorandum of Understanding (MOU) that outlines a development model in response to a proposal presented by the Anschutz Entertainment Group (AEG), to develop a 70,000-seat event center in Downtown Los Angeles (Event Center Project), immediately adjacent to the Staples Center on land currently occupied by the West Hall of the LACC. The MOU is a non-binding framework that will guide discussions on the Definitive Agreements, and the contractual documents that would implement the Event Center Project. The Event Center Project includes the construction of the New Hall and parking garages located on Cherry Street and Bond Street, followed by demolition of the West Hall and construction of the event center. The Event Center, also known as Farmers Field, would host a National Football League (NFL) team, concerts,
CAO File No.
0110-00800-0000 PAGE
10
and other sports and entertainment events. The CEO and the private management firm would be active participants on matters that involve, but are not limited to, facility design, operations and management, coordination and policy.
The Event Center Project presents LACC with the opportunity for positive change and improvement. Currently, the City is undergoing negotiations and preparing for the construction of the New Hall at the LACC. Regardless of the proposed Event Center, the decision for considering an alternative management structure should not be postponed. On the contrary, it is advisable that this matter be considered by the Council as soon as possible. The most opportune time to change management would be in advance of the construction of the New Hall, so that any new management team would be well positioned to participate in the negotiating and development phase. It is not uncommon for convention centers to undergo construction and capital improvement periods. The private management firms currently in the market have experience in pre-opening services including consulting on design, planning, development, and construction. Such firms also have experience operating convention centers undergoing such improvements.
OPERATING POLICIES
The Booking and Discount Policies are operating policies that address how the LACC and LA TCB should manage bookings for the City. On May 8,2012, the Council adopted Motion Perry/Zine (C.F. No. 12-0692), which instructed the CAD to report back on the status of the Convention Center Booking Policy with recommendations on how the City can more effectively attract national and international convention business (C.F. No. 12-0692)(Attachment 9). The CAO recommends the following changes to the Booking Policy:
(1) Reducing the booking window from 24 to 12 months; and
(2) Eliminating grandfathered exceptions that authorized the LACC to license the Auto Show and the Gift Show up to ten years in advance.
The CAO is also recommending changes to the Discount Policy (Attachment 10) by amending Administrative Code Section 8.149.1 (Section 8.149.1) to reflect current operating practices. Currently, Section 8.149.1 requires that the City cap the total reductions or waivers granted to licensees for use of the LACC at $845,000 during each fiscal year. However, since 2002 no cap has been enforced due to a Council action that limited the discount amount per event to an amount less than the actual TOT generated from that event. The CAO recommends codifying this policy as part of Section 8.149.1.
Booking Policy
Convention centers are loss leaders. They may not generate sufficient operating revenue to fully cover operating expenses; however, public entities invest in convention centers as a measure of stimulating the local economy through the generation of tax revenues. In 1993, the City expanded the LACC in anticipation of spurring business for hotels and the local hospitality industry. However, during the early 1990's the City struggled through a series of natural and manmade disasters that included earthquake, fire, flood and civil unrest. When the expanded facility reopened, Los Angeles
CAO File No. PAGE
0110-00800-0000 11
was perceived as an unattractive destination. As a result, the City became more relianton local trade and consumer shows versus citywide events. Citywide events are defined as conventions or large tradeshows that generate overnight visitors or "heads-in-beds" and visitor spending, which in turn generate TOT and other citywide revenues. More specifically, citywide events are multi-day convention and exhibition events utilizing more than the available LACC convention or exhibition space and generating bookings of not less than 3,000 total room nights with 1,500 room nights on peak and use of at least three hotels. Local shows are defined as consumer and trade shows that draw a local attendance but generate little citywide revenues including TOT.
Budgetary restraints and generating sufficient revenue to increase the LACC's bottom line has also been a factor in LACC's mission to invest in the booking of local shows. Although citywide conventions have always been a priority according to the City's adopted Booking Policy, the City has a disproportionately higher number of local shows to citywide events in comparison to regional competitors such as Anaheim, San Francisco, and San Diego. In the last 20 years, Downtown has undergone a transformation through the opening of Staples, LA Live, the JW Marriot, the Ritz Carlton, various housing development projects, restaurants, and personal and professional services. In the Downtown Los Angeles Demographic Study 2011 prepared by the Downtown Center Business Improvement District (Attachment 11) the Downtown area has experienced "an extraordinary commercial and residential renaissance" over the last ten years. This includes 45,000 residents, 500,000+ weekday employees and more than 10 million annual non-local visitors.
The City must readjust its efforts and take advantage of the surrounding changes and development by utilizing the LACC to make it a more competitive convention destination and by making hotel occupancy, or "heads-in-beds" a priority. The CAO recommends doing so as follows:
(1) Shortening the Booking Window
It is typical for a convention center to have a booking policy when there are two separate entities booking events for the same facility, such as the LACC and the LA TCB. According to the current Booking Policy, the LACC books events such as local shows within a 24-month window and can book several non-convention events such as the Auto Show, and the Gift Show up to 10 years in advance. The LATCB, which is responsible for booking citywide events, books events 24-months and beyond. However, current trends reflect that convention centers are receiving more short term requests for citywide events. Shortening the window period would provide the LA TCB flexibility to address short term demands.
(2) Removing "Grandfathered" Exceptions
There are certain non-convention events that have been grandfathered into the current Booking Policy that exempts the LACC from the booking window and allows these events to be licensed ten years out. Currently, this includes the Auto Show and the Gift Show. Booked events are non-binding whereas licensed events, if canceled, result in a financial penalty. We feel that it is no longer in the City's best interest to license any non-convention show ten years into the future. Given the discussions involving the Proposed Downtown Convention Center and Event Center Project, the City must be flexible in resolving potential booking conflicts resulting from NFL or other Farmers Field events, which have shorter term booking periods.
CAO File No.
0110-00800-0000 PAGE
12
The City has already lost convention business as a result of the existing Booking Policy. Most recently, the American Film Market booked with Santa Monica's Civic Auditorium because the City was unable to accommodate the request as a result of an existing Auto Show booking. The American Film Market was interested in committing to a 25-year booking (2013-2037), which if licensed was anticipated to generate 15,950 room nights per year or approximately 400,000 total room nights over the course of 25 years, for a potential of $12.6 million in TOT and a local economic impact of approximately $358 million. This Office believes that the proposal for an enhanced governance model could have played a significant role in otherwise securing this booking. In this case, the Board would have provided guidance and reinforced the City's policy that citywide conventions are a priority and the CEO would have worked with the LATCB in negotiating potential resolutions to accommodate the Auto Show while securing the needs of the American Film Market.
The Auto Show is the largest single revenue contributor for the LACC. It is approximately 10 days in length, however it consumes the entire month of November to account for move-in and move-out periods and all of LACC facility space. The Auto Show may generate a comparable amount of room nights to the average citywide event, however conventions do so over a much shorter period of time typically occupying the facility for a week. According to the PKF Consulting Study Auto Show executives have an interest to license the show in November for the next 10 years to ensure show dates during a competitive time on the international auto show calendar. The Auto Show is an important source of business to the LACC, however licensing so far into the future inhibits the City's flexibility in booking additional conventions. The month of November is critical to the convention marketplace because it is the last marketable month in the calendar year for booking an event before .the holiday season begins, which typically consumes all of December and trickles into the beginning part of January. Convention centers are often dark during this period. It is also common for tourism and hotel occupancy to slow down during the holiday season, which is why hoteliers have expressed concern about licensing the Auto Show too far in advance. It is not suggested that the Auto Show be removed from the calendar when there is a potential to book convention business. On the contrary, given its significant contribution in revenue the City has incentive to work with the Auto Show. However, if there is th.e opportunity to book additional convention business during November by adjusting the Auto Show calendar by a week or two, hotels and the City's General Fund could benefit from new business during a sluggish period.
Discount Policy
The Discount Policy is a marketing tool that authorizes the City to offer rental discount rates as an incentive for citywide conventions to book at the LACC. In an attempt to provide a competitive sales advantage to the City, a rental discount policy was adopted in 1992. The City's Discount Policy authorizes the LA TCB to offer a discount of up to 100 percent of the rental cost to potential national convention clients. The proposed discount must be exceeded by TOT revenues for that event. The policy protects the City's interests, while the goal of stimulating the local economy by attracting outof-town conventions is advanced. According to industry experts, it is typical for convention centers to operate as "loss leaders". Meaning, it is common to offer a discount on rates as an incentive to book an event that has a positive economic impact. Per the Discount Policy, after each event, an audit is
CAO File No. PAGE
0110-00800-0000 13
petformed by an independent consulting firm to compare the actual amount of TOT generated to the discount amount. If the discount amount exceeds TOT revenue, the client is required to pay the LACC an amount equivalent to the difference.
Currently, the Code caps the total value of discounts offered annually at $845,000. It is recommended that the current Discount Policy be codified by amending Section 8.149.1.
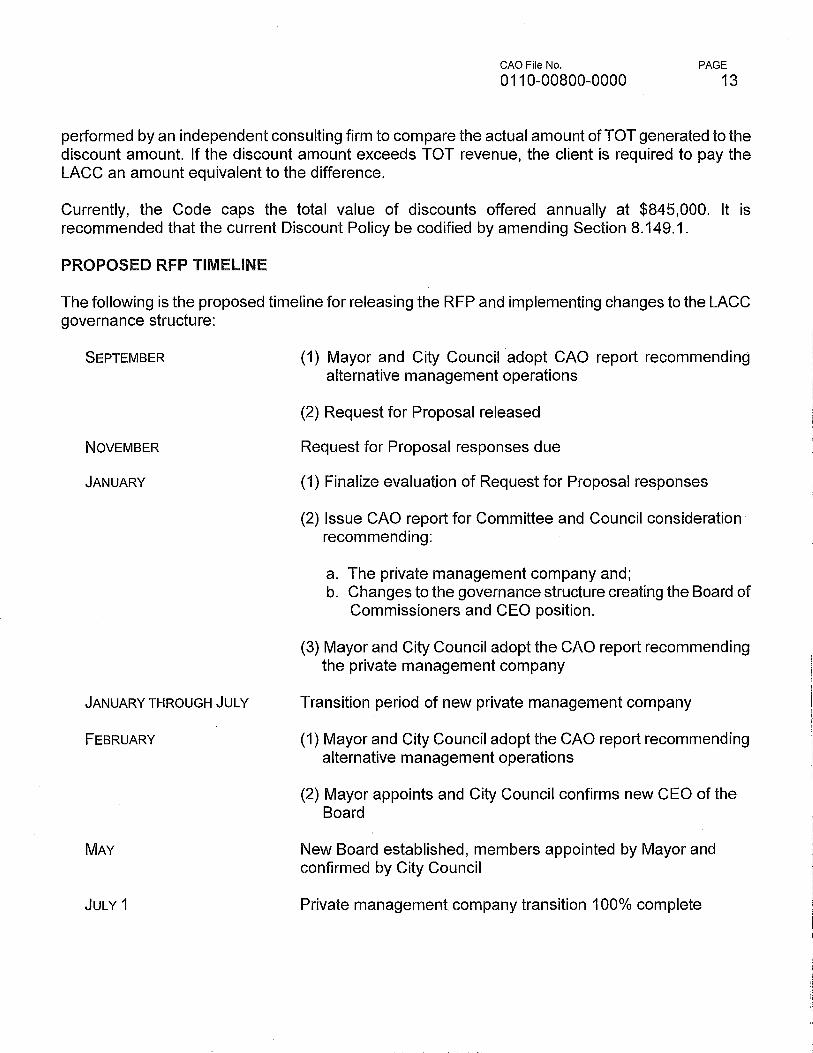
PROPOSED RFP TIMELINE
The following is the proposed timeline for releasing the RFP and implementing changes to the LACC governance structure:
SEPTEMBER
NOVEMBER
JANUARY
JANUARY THROUGH JULY
FEBRUARY
MAY
JULY 1
(1) Mayor and City Council adopt CAO report recommending alternative management operations
(2) Request for Proposal released
Request for Proposal responses due
(1) Finalize evaluation of Request for Proposal responses
(2) Issue CAO report for Committee and Council consideration· recommending:
a. The private management company and; b. Changes to the governance structure creating the Board of
Commissioners and CEO position.
(3) Mayor and City Council adopt the CAO report recommending the private management company
Transition period of new private management company
(1) Mayor and City Council adopt the CAO report recommending alternative management operations
(2) Mayor appoints and City Council confirms new CEO of the Board
New Board established, members appointed by Mayor and confirmed by City Council
Private management company transition 100% complete
CAO File No. PAGE
0110-00800-0000 14
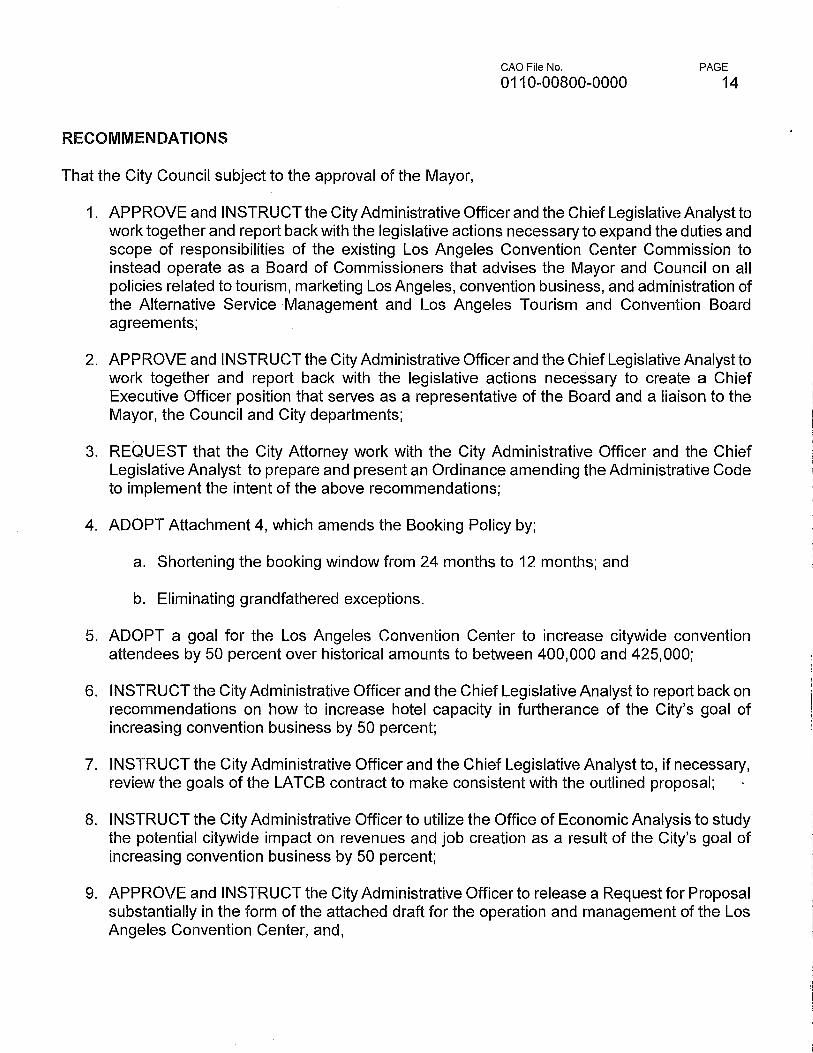
RECOMMENDATIONS
That the City Council subject to the approval of the Mayor,
1. APPROVE and INSTRUCT the City Administrative Officer and the Chief Legislative Analyst to work together and report back with the legislative actions necessary to expand the duties and scope of responsibilities of the existing Los Angeles Convention Center Commission to instead operate as a Board of Commissioners that advises the Mayor and Council on all policies related to tourism, marketing Los Angeles, convention business, and administration of the Alternative Service Management and Los Angeles Tourism and Convention Board ag reements;
2. APPROVE and INSTRUCT the City Administrative Officer and the Chief Legislative Analyst to work together and report back with the legislative actions necessary to create a Chief Executive Officer position that serves as a representative of the Board and a liaison to the Mayor, the Council and City departments;
3. REQUEST that the City Attorney work with the City Administrative Officer and the Chief Legislative Analyst to prepare and present an Ordinance amending the Administrative Code to implement the intent of the above recommendations;
4. ADOPT Attachment 4, which amends the Booking Policy by;
a. Shortening the booking window from 24 months to 12 months; and
b. Eliminating grandfathered exceptions.
5. ADOPT a goal for the Los Angeles Convention Center to increase citywide convention attendees by 50 percent over historical amounts to between 400,000 and 425,000;
6. INSTRUCT the City Administrative Officer and the Chief Legislative Analyst to report back on recommendations on how to increase hotel capacity in furtherance of the City's goal of increasing convention business by 50 percent;
7. INSTRUCT the City Administrative Officer and the Chief Legislative Analyst to, if necessary, review the goals of the LA TCB contract to make consistent with the outlined proposal;
8. INSTRUCT the City Administrative Officer to utilize the Office of Economic Analysis to study the potential citywide impact on revenues and job creation as a result of the City's goal of increasing convention business by 50 percent;
9. APPROVE and INSTRUCT the City Administrative Officer to release a Request for Proposal substantially in the form of the attached draft for the operation and management of the Los Angeles Convention Center, and,
CAOFile No.
0110-00800-0000 PAGE
15
10. INSTRUCT the City Administrative Officer to report back and present recommendations on a private management firm for Mayor and Council consideration upon conclusion of the Request for Proposal Process.
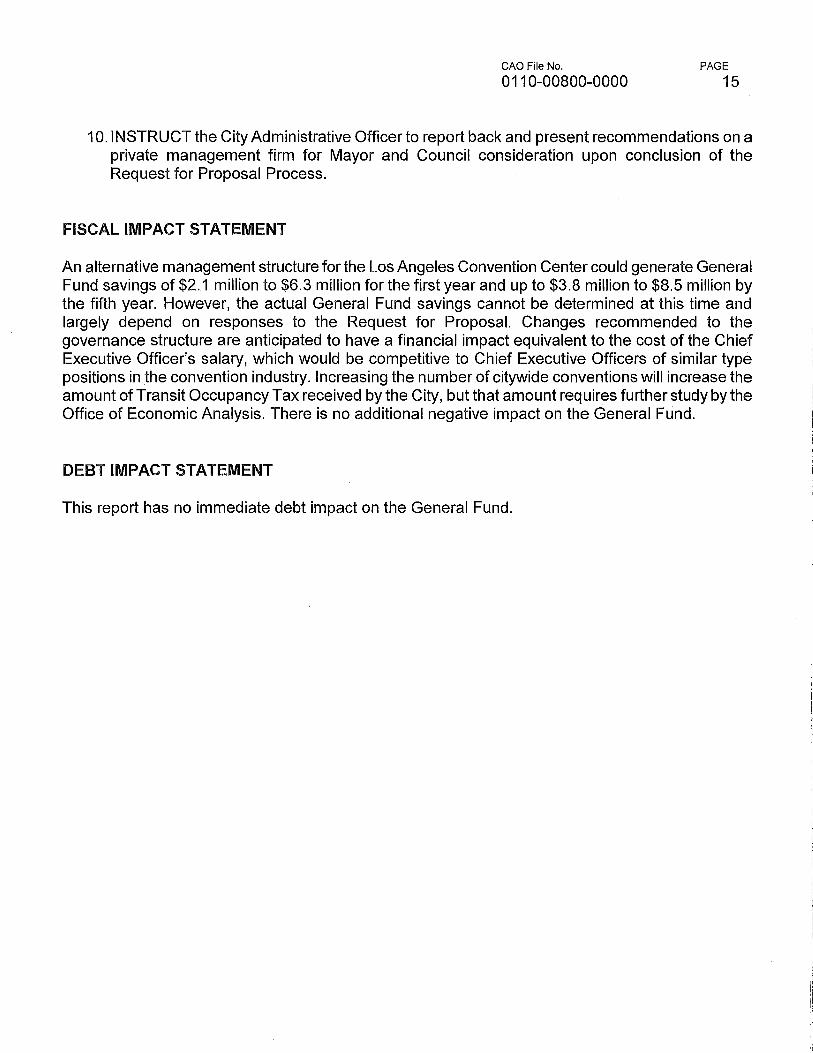
FISCAL IMPACT STATEMENT
An alternative management structure for the Los Angeles Convention Center could generate General Fund savings of $2.1 million to $6.3 million for the first year and up to $3.8 million to $8.5 million by the fifth year. However, the actual General Fund savings cannot be determined at this time and largely depend on responses to the Request for Proposal. Changes recommended to the governance structure are anticipated to have a financial impact equivalent to the cost of the Chief Executive Officer's salary, which would be competitive to Chief Executive Officers of similar type positions in the convention industry. Increasing the number of citywide conventions will increase the amount of Transit Occupancy Tax received by the City, but that amount requires further study by the Office of Economic Analysis. There is no additional negative impact on the General Fund.
DEBT IMPACT STATEMENT
This report has no immediate debt impact on the General Fund.
FINDINGS
1. BACKGROUND
CAO FileNo.
0110-00800-0000 PAGE
16
The LACC facility is a General Fund asset whose purpose is to stimulate the local economy from tourism and visitor spending in the region. In return, the City benefits from Transient Occupancy Tax (TOT) and other tax revenues. The debt service for the LACC is paid from the General Fund.
Debt was first issued in 1968 to build the Convention Center. The original facility was financed by increasing TOT from four to five percent. In 1985, the Council approved the expansion of the facility and authorized an increase in TOT from 10 to 11 percent to finance expansion costs. The TOT was subsequently increased by an additional 1.5 percent to offset increased construction costs. Currently, a total of 3.5 percent of taxable hotel sales is allocated to offset debt service costs used to fund the construction of the Convention Center Expansion.
2. FACILITY
The publicly-owned and operated LACC originally opened in 1971. By 1980, the increased overall demand resulted in a high level of facility usage. Several major shows outgrew the 234,000 square feet of exhibition space, meeting rooms and 3,000 parking spaces. A significant expansion of the convention facility was completed in 1993. The expansion added a new exhibition hall, two levels of meeting room space, the concourse facility, and parking spaces. In 1999, the Staples Center was constructed by demolishing the North Hall which eliminated 100,000 square feet of exhibit space. Today, the LACC contains approximately 867,000 square feet of functional exhibit hall and meeting room space. Among the 26 major convention facilities surveyed, the LACC ranks 1 ih in available exhibit square footage space.
3. REQUEST FOR PROPOSAL
A draft Request for Proposal (RFP) is attached and addresses some of the key issues:
• Achieve the greatest possible financial returns, consistent with other City objectives, including maximizing the generation of incremental hotel room nights and TOT; Manage day-to-day operations of the LACC in a cost efficient, high quality and effective manner;
.. Manage operational expenses within the annual operating budget approved by the Board;
.. Develop and implement innovative initiatives to penetrate new markets, attract new events and promote the LACC to enhance usage and occupancy at the LACC within current booking policies; Work daily with the CEO on operational matters including booking matters that include the LATCB; Report to the CEO and make presentations to the Board when requested on operational matters at the LACC; Work cooperatively with the LA TCB in attracting citywide events to the LACC to better compete in the national marketplace;
CAO File No.
0110-00800-0000 PAGE
17
Support the joint objectives of the LACC and LA TCB to generate incremental hotel room nights; and Identify and implement initiatives to enhance LACC revenues, while ensuring that the LACC remains economically competitive with other convention centers.
6. ALTERNATIVE SERVICE MANAGEMENT AGREEMENT
The following is a breakdown of the key duties and responsibilities that will be identified under the ASM agreement.
City Responsibility under the ASM Agreement
18 The Board and CEO will represent the City and its interests on behalf of the Mayor and Council;
• Fund the annual debt service for the LACC through the annual City budget process; • Monitor the selected proposer's performance on a regular basis through quarterly reports and
periodic audits by the City Controller to review the performance and finances; 411 Review and forward annual reports from the selected proposer to the Mayor and Council; • Approve agreements necessary for the operations of the LACC, as set forth in the
Agreement; III Oversee capital repair and replacement efforts; and • Approve pricing, policies and other arrangements necessary for the operations of the
LACC.
Selected Proposer Responsibility under the ASM Agreement
Under the terms of the proposed ASM Agreement, the selected proposer must be willing and able to commit to the key responsibilities that include but are not limited to:
18 Manage day-to-day functions and operations of the LACC, which shall be in accordance with the policies approved by the City;
• Provide recommendations to the City on all rental rates, fees, and charges for services; • Establish an effective system of communication that encourages linkages and collaborative
efforts between the LACC and other segments of the hospitality industry, including the LA TCB, the Los Angeles hotel industry and other visitor industry segments;
411 Administer, negotiate and execute agreements with service providers, subcontractors, and licensees. The selected proposer shall work with the City Attorney in developing a standard license agreement. Agreements that may have a private business use impact shall be reviewed by the City's Bond Counsel. The City's Risk Manager shall determine the insurance requirements;
411 Assume LACC information technology functions, and maintain systems in state-of-the-art condition; and
411 Constantly endeavor to improve the operation of the LACC and to provide the efficient and high quality customer service, minimizing operating costs, increasing the quality of
CAO File No.
0110-00800-0000 PAGE
18
maintenance and security, and maximizing gross receipts without negatively impacting exhibitor or show manager costs.
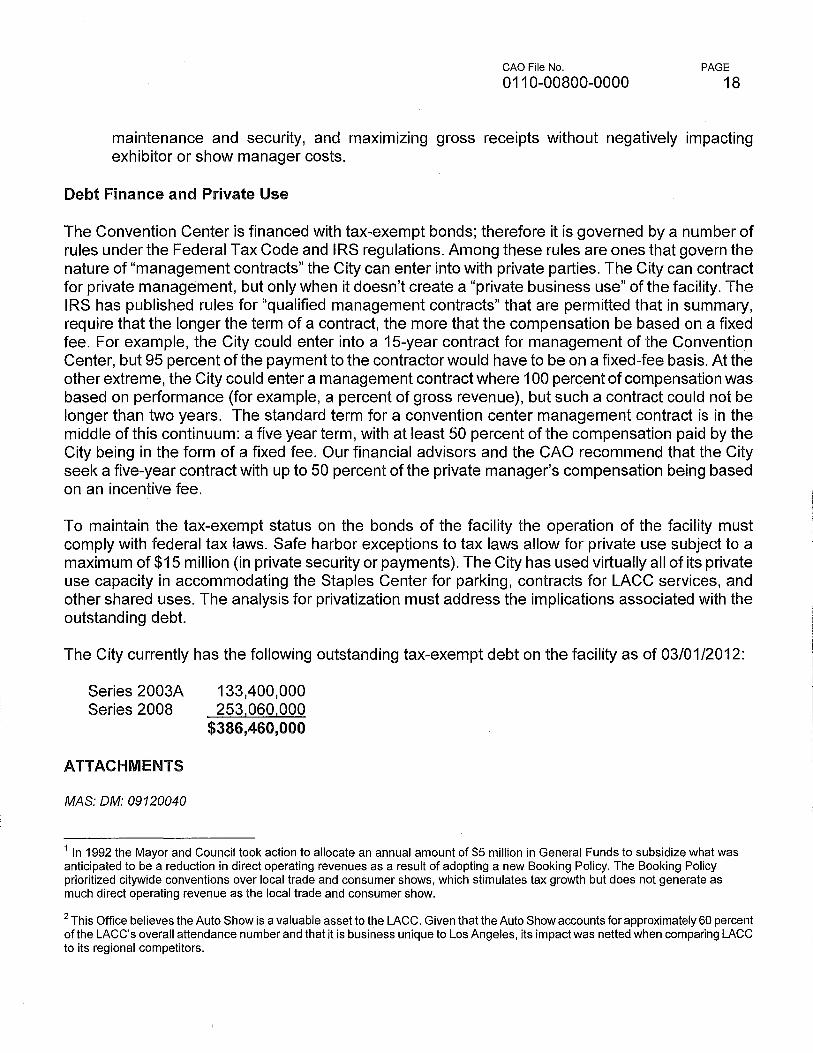
Debt Finance and Private Use
The Convention Center is financed with tax-exempt bonds; therefore it is governed by a number of rules under the Federal Tax Code and IRS regulations. Among these rules are ones that govern the nature of "management contracts" the City can enter into with private parties. The City can contract for private management, but only when it doesn't create a "private business use" of the facility. The IRS has published rules for "qualified management contracts" that are permitted that in summary, require that the longer the term of a contract, the more that the compensation be based on a fixed fee. For example, the City could enter into a 15-year contract for management of the Convention Center, but 95 percent of the payment to the contractor would have to be on a fixed-fee basis. At the other extreme, the City could enter a management contract where 100 percent of compensation was based on performance (for example, a percent of gross revenue), but such a contract could not be longer than two years. The standard term for a convention center management contract is in the middle of this continuum: a five year term, with at least 50 percent of the compensation paid by the City being in the form of a fixed fee. Our financial advisors and the CAO recommend that the City seek a five-year contract with up to 50 percent of the private manager's compensation being based on an incentive fee.
To maintain the tax-exempt status on the bonds of the facility the operation of the facility must comply with federal tax laws. Safe harbor exceptions to tax laws allow for private use subject to a maximum of $15 million (in private security or payments). The City has used virtually all of its private use capacity in accommodating the Staples Center for parking, contracts for LACC services, and other shared uses. The analysis for privatization must address the implications associated with the outstanding debt.
The City currently has the following outstanding tax-exempt debt on the facility as of 03/01/2012:
Series 2003A Series 2008
ATTACHMENTS
MAS: OM: 09120040
133,400,000 253,060,000
$386,460,000
1 In 1992 the Mayor and Council took action to allocate an annual amount of $5 million in General Funds to subsidize what was anticipated to be a reduction in direct operating revenues as a result of adopting a new Booking Policy. The Booking Policy prioritized citywide conventions over local trade and consumer shows, which stimulates tax growth but does not generate as much direct operating revenue as the local trade and consumer show.
2 This Office believes the Auto Show is a valuable asset to the LACC. Given that the Auto Show accounts for approximately 60 percent of the LACC's overall attendance number and that it is business unique to Los Angeles, its impact was netted when comparing LACC to its regional competitors.

ATTACHMENT 1
COUNCIL FILE NO.1 0-0922 CAO REPORTS DATED JULY 16,2010 AND MAY 11,2011
REPORT FROM
Date:
To:
From:
Subject:
OFFICE OF THE CITY ADMINISTRATIVE;OFFICER
July 16, 2010
The Trade, Commerce and Tourism Committee
Miguel A. Santana, City Administrative Officer t CAO File No. 0110-00800-0000
Council File No. 10-0922
Convention Center Three Year Plan Proposal - Status Update
This Office was instructed to report back to your Committee regarding several items including recommendations concerning the Food and Beverage Concessions agreement and the Three Year Plan proposal to identify alternative business models for operating the Convention Center facility (facility).
Currently, ARAMARK Sports and Entertainment SeNices, LLC. manages and operates food and beverage seNices at the facility. On December 1, 2009 the Council authorized the execution of the second amendment with ARAMARK, which extended the existing term (January 1, 2000 through December 31, 2009) for an additional six-month period through June 30, 2010. Additionally, the second amendment included an option to extend the agreement term on a month-to-month basis until the RFP process for selecting a contractor had been completed.
This Office was instructed to evaluate the feasibility of identifying alternative potential business models for operating the facility. It is recommended that the Department delay the selection of a new contractor to manage and operate food and beverage seNices until Council takes final action on this proposal. It is further recommended that the existing contract with ARAMARK be continued on a month-to-month basis. The Convention Center reports that ARAMARK would agree to a ten percent reduction in its management fee agreement, which amounts to an annual savings of approximately $52,500 or $4,375 per month. As we continue the process for identifying an alternative
_. business model, it is the position of this Office that it is in the City's' best interest to withhold from entering into a long term agreement with a new vendor.
The goal for identifying a potential alternative business model is to allow more flexibility and efficiency with Convention Center operations and to maximize the City's competitive position as a major convention destination. Further, this Office has been tasked with reviewing and recommending an alternative business model that would reduce General Fund costs associated with owning and operating the facility. If an alternative model for operating the facility is recommended, the goal would be to have identified a new operator by the end of the 2010-11 Fiscal Year. The Request for Proposal (RFP) for identifying a new operator would be scheduled for release by October 2010. Council authorized this Office to develop and release the proposed RFP as part of the January 2009 Three-Year Plan to Fiscal Sustainabifity Report. However, prior to release of the RFP this Office will report back to Council with a status update.
RECOMMENDATION:
That the Council:
PAGE
2
(1) Authorize the General Managerofthe Los Angeles Convention Center (Convention Center) to continue a month to month agreement, subject to review by the City Attorney as to form, with ARAMARK sports and Entertainment Services, LLC. (ARAMARK)·for food and beverage services until Council takes final action on the proposal to identify an alternative business model for operating the Convention Center facility;
(2) Instruct the Convention Center to negotiate and identify contract savings from the existing food and beverage services contract with ARAMARK; and
(3) Instruct the Convention Center to consult with the City Attorney on a course of action that would address the existing Food and Beverage Request for Proposal evaluation process.
FISCAL IMPACT STATEMENT:
The recommendation above has no additional impact on the General Fund and is in compliance with the City's Financial Policies in that ongoing revenues will be used to support ongoing expenditures for this program.
MAS: DM: 09110021
REPORT FROM
,OFFICE OF THE CITY ADMINISTRATIVE OFFICER
Date:
To:
From:
Subject:
SUMMARY
May 11 f 2011
The Trade, Commerce and Tourism Committee
CAO File No. 01'10-00800-0000
Council File No. 10-0922
Miguel A. Santana, City Administrative Officer~ C. -~ Convention Center Food and Beverage Services Contract
On August 4, 2010, the Trade, Commerce and Tourism Committee continued the City Administrative Officer report, which recommended a month-to-month extension of the agreement with ARAMARK Sports and Entertainment Services, LLC. (Contractor) until the City Council takes final action on the alternative management proposal for the Convention Center facility (C.F. 10-0922).
This Office is completing a report for Council consideration and approval concerning release of a Request for Proposal (RFP) for private management of the Los Angeles Convention Center (Convention Center). If approved, the RFP would be released in 60-90 days. In order to ensure continuity of service during this period, it is recommended that the Convention Center be authorized to extend the agreement term with the Contractor for an additional year upon the date of execution, including an option to extend on a month-tomonth basis thereafter.
The Contractor provides food and beverage services for the Conve,ntion Center through a month-to-month contract and receives a management fee that is paid in 12 monthly installments. In addition, the Contractor is paid an incentive fee at the conclusion of each agreement year, which Is based on a percentage of the annual amount of gross receipts greater than $10 million. The original contract term is January 1, 2000 through December 31, 2004. The First Amendment extended the term thrO!lgh December 31, 2009. The Second Amendment extended the term through June 3D', 2010 with a month-to-month option thereafter.
RECOMMENDATION:
That the City Council authorize the General Manager ofth6~ Convention Center, subject to the review of the City Attorney, to 'j:lxtend the existing agreement between Convention Center and ARAMARK Sports and Entertainment Services, LLC. for food and beverage services for a one year term upon th·~ date of execution, with an option to extend month to
month thereafter, until the City Council takes final action on the alternative management proposal for the Convention Center.
FISCAL IMPACT STATEMENT:
The recommendation has no impact on the General Fund and is in compliance with the City's Financial Policies in that ~pecial fund revenues will be used to support ongoing expenditures for this program.
MAS: OM: 09110234H
PAGE 2
ATTACHMENT 2
KPMG, KNN PUBLIC FINANCE AND CROSSROADS CONSULTING SERVICES FINANCIAL COMPARATIVE ANALYSIS
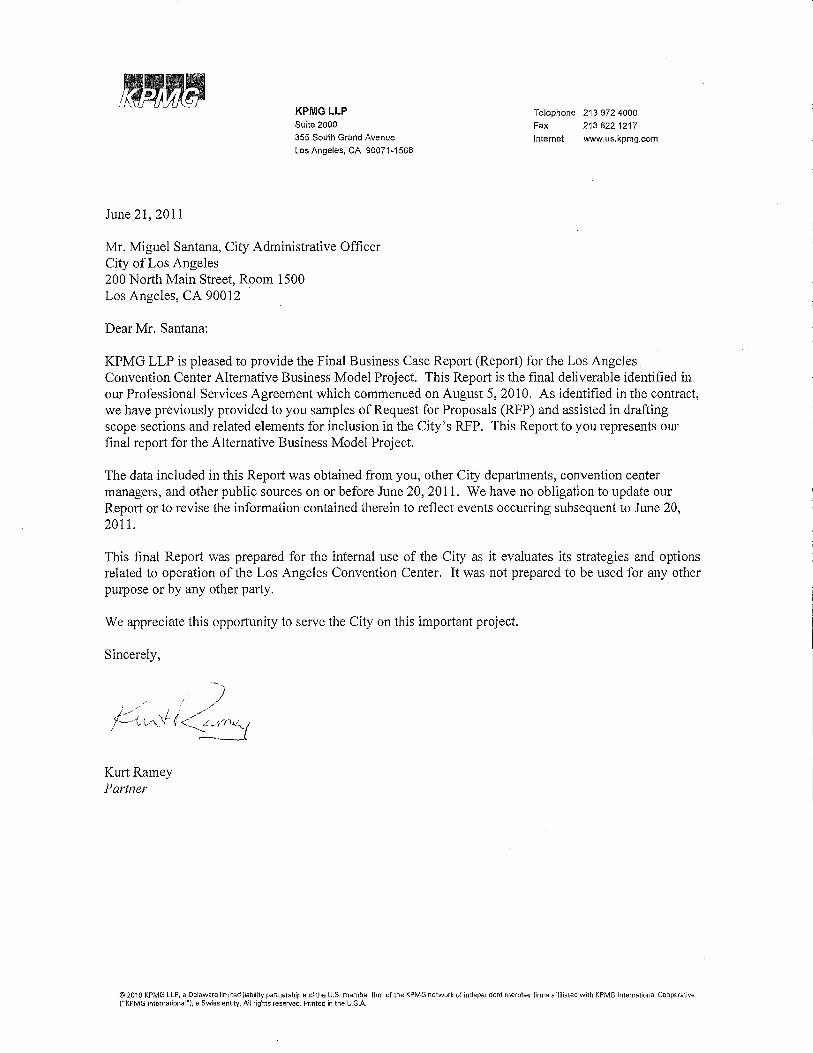
June 21,2011
KPMG LLP Suite 2000
355 South Grand Avenue
Los Angeles. CA 90071-1568
Mr. Miguel Santana, City Administrative Officer City of Los Angeles 200 North Main Street, Room 1500 Los Angeles, CA 90012
Dear Mr. Santana:
Telephone 213 972 4000
Fax 2136221217
Internet www.us.kpmg.com
KPMG LLP is pleased to provide the Final Business Case Report (Report) for the Los Angeles Convention Center Alternative Business Model Project. This Report is the final deliverable identified in our Professional Services Agreement which commenced on August 5, 2010. As identified in the contract, we have previously provided to you samples of Request for Proposals (RFP) and assisted in drafting scope sections and related elements for inclusion in the City's RFP. This RepOli to you represents our final report for the Alternative Business Model Project.
The data included in this Report was obtained from you, other City departments, convention center managers, and other public sources on or before June 20, 2011. We have no obligation to update our Report or to revise the information contained therein to reflect events occurring subsequent to June 20, 2011.
This final Report was prepared for the internal use of the City as it evaluates its strategies and options related to operation of the Los Angeles Convention Center. It was not prepared to be used for any other purpose or by any other pmiy.
We appreciate this opportunity to serve the City on this important project.
Sincerely,
. ,/ -; ,j.//' ,I) /
/"---.{ "",","t, \ <~
Kurt RaIlley Partner
© 2010 KPMG LLP, a Delaware limited liability partnership and the U.S. member firm of the KPMG network of independent member firms af1i1iated with KPMG International Cooperative ("KPMG International"), a Swiss entity. AU rights reserved. Printed in the U.S.A.
· ". ...' ..,',
Biusi'ness"·~Case.· Repprt, Co I"'Ite nts, "', i?age,.'" , ". " "",' . '. ' " " " '.,. . '::, , '. '.'" " ,. '.' c ':,"
Project Summary 2
Background 8 i
Assessment 16
Options Analysis 34
Next Steps 50
1
BUSINESS CASE REPORT - June 20, 2011
Project Overview and Objectives
@ The Office of the City Administrative Officer ("CAO") has been instructed by the City to develop one or more recommendations on alternative business and/or management models for the operation of the Los Angeles Convention Center ("LACC") facility.
@ The purpose of identifying potential alternative business models is to:
@ Reduce General Fund costs associated with the LACC;
@ Allow more flexibility and efficiency with LACC operations; and
@ Maximize the City's competitive position as a major convention destination.
Analysis Objectives
@ KPMG LLP ("KPMG") with assistance from Crossroads Consulting Services ({{Crossroads") and KNN Public Finance ("KNN"), was retained by the CAO to review current operations and financial information, assess the opportunities associated with alternative business models and develop a report including recommendations.
BUSINESS CASE REPORT - June 20, 2011
3
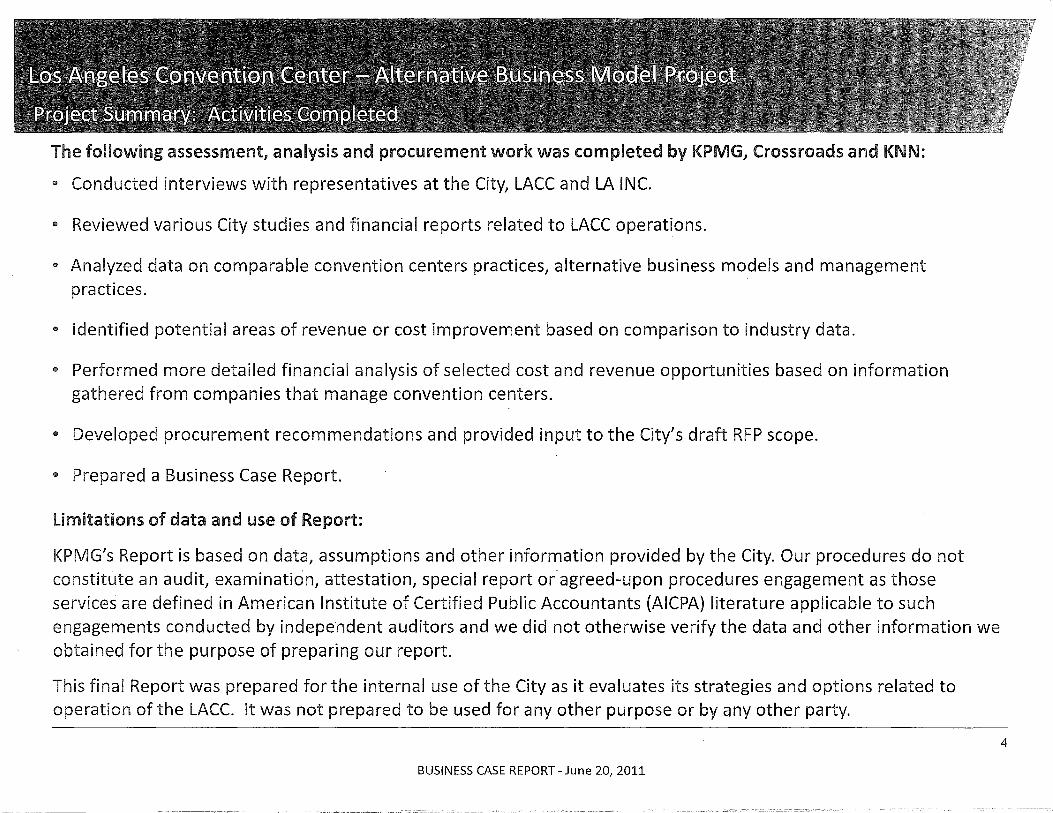
The following assessment, analysis and procurement work was completed by KPMG, Crossroads and KNN:
.. Conducted interviews with representatives at the City, LACC and LA INe.
II Reviewed various City studies and financial reports related to LACC operations.
.. Analyzed data on comparable convention centers practices, alternative business models and management practices.
.. Identified potential areas of revenue or cost improvement based on comparison to industry data.
.. Performed more detailed financial analysis of selected cost and revenue opportunities based on information gathered from companies that manage convention centers.
.. Developed procurement recommendations and provided input to the City's draft RFP scope.
.. Prepared a Business Case Report.
limitations of data and use of Report:
KPMG's Report is based on data,assumptions and other information provided by the City. Our procedures do not constitute an audit, examination, attestation, special report or"agreed-upon procedures engagement as those services are defined in American Institute of Certified Public Accountants (AICPA) literature applicable to such engagements conducted by independent auditors and we did not otherwise verify the data and other information we obtained for the purpose of preparing our report.
This final Report was prepared for the internal use of the City as it evaluates its strategies and options related to operation of the LACe. It was not prepared to be used for any other purpose or by any other party.
BUSINESS CASE REPORT - June 20, 2011
4
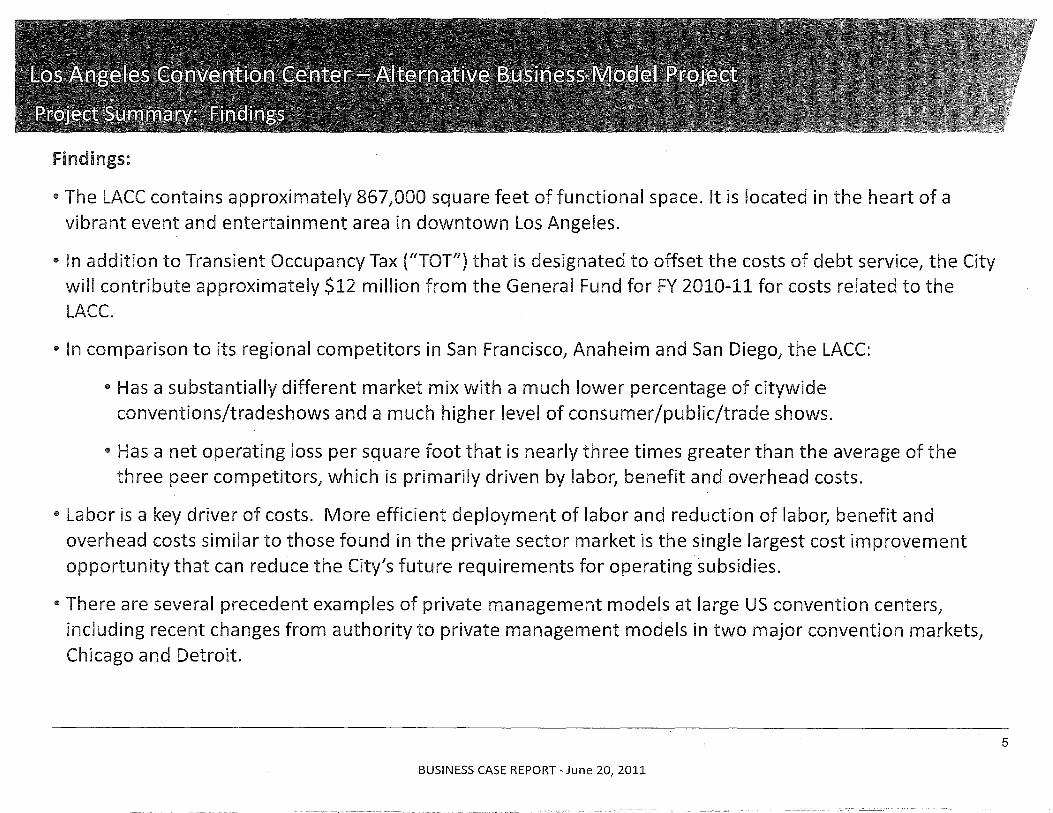
Findings:
II The LACC contains approximately 867,000 square feet of functional space. It is located in the heart of a vibrant event and entertainment area in downtown Los Angeles.
II In addition to Transient Occupancy Tax (IITOT") that is designated to offset the costs of debt service, the City will contribute approximately $12 million from the General Fund for FY 2010-11 for costs related to the LACe.
II In comparison to its regional competitors in San Francisco, Anaheim and San Diego, the LACC:
II Has a substantially different market mix with a much lower percentage of citywide
conventions/tradeshows and a much higher level of consumer/public/trade shows.
II Has a net operating loss per square foot that is nearly three times greater than the average of the three peer competitors, which is primarily driven by labor, benefit and overhead costs.
II Labor is a key driver of costs. More efficient deployment of labor and reduction of labor, benefit and overhead costs similar to those found in the private sector market is the single largest cost improvement opportunity that can reduce the City's future requirements for operatingsubsidies.
II There are several precedent examples of private management models at large US convention centers, including recent changes from authority to private management models in two major convention markets, Chicago and Detroit.
BUSINESS CASE REPORT - June 20, 2011
5
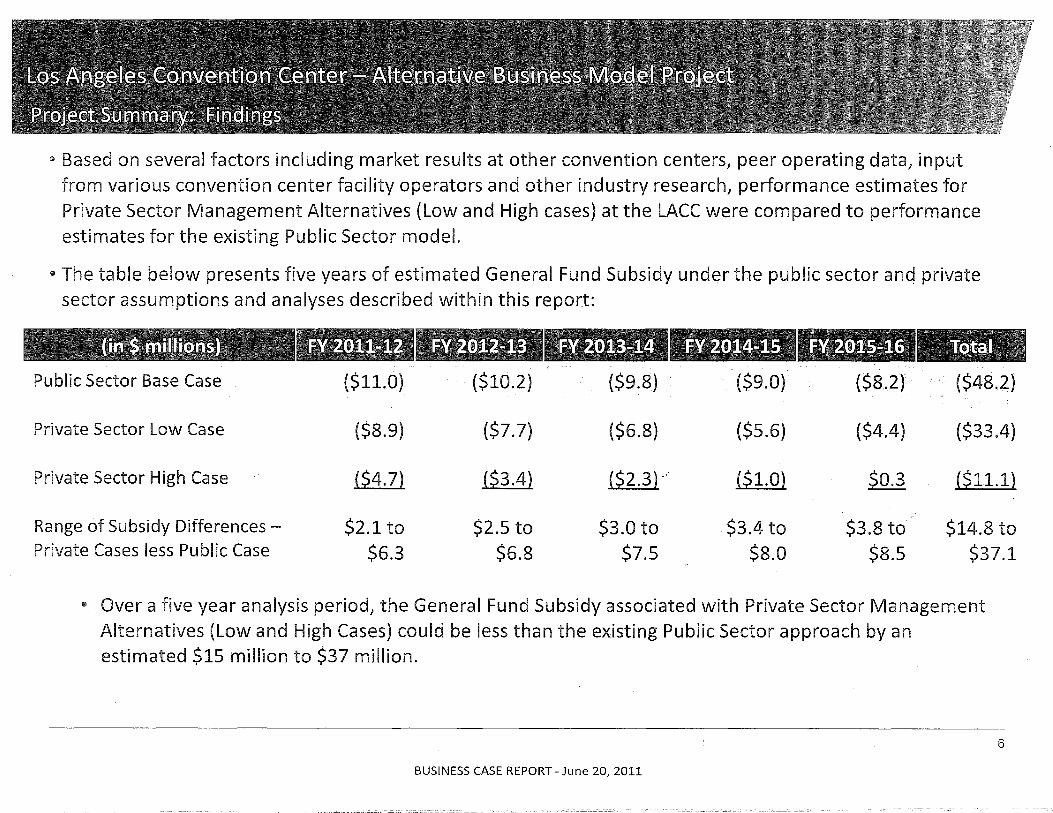
OIl Based on several factors including market results at other convention centers, peer operating data, input from various convention center facility operators and other industry research, performance estimates for Private Sector Management Alternatives (Low and High cases) at the LACC were compared to performance estimates for the existing Public Sector model.
OIl The table below presents five years of estimated General Fund Subsidy under the public sector and private sector assumptions and analyses described within this report:
Public Sector Base Case ($11.0) ($10.2) ($9.8) ($9.0) ($8.2) ($48.2)
Private Sector Low Case ($8.9) ($7.7) ($6.8) ($5.6) ($4.4) ($33.4)
Private Sector High Case ($4.7) ($3.4) ($2.3) -,' ($1.0) $0.3 ($11.1)
Range of Subsidy Differences - $2.1 to $2.5 to $3.0 to $3.4 to $3.8 to $14.8 to Private Cases less Public Case $6.3 $6.8 $7.5 $8.0 $8.5 $37.1
OIl Over a five year analysis period, the General Fund Subsidy associated with Private Sector Management Alternatives (Low and High Cases) could be less than the existing Public Sector approach by an estimated $15 million to $37 million.
6
BUSINESS CASE REPORT - June 20, 2011
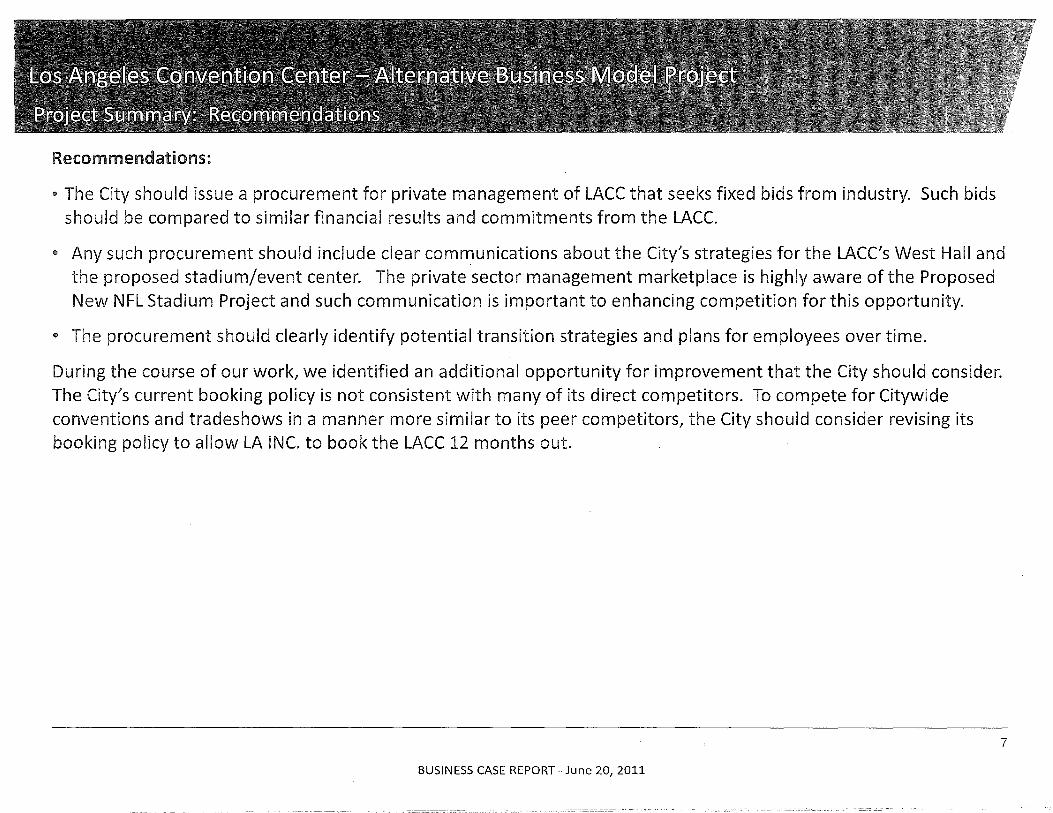
Recommendations:
• The City should issue a procurement for private management of LACC that seeks fixed bids from industry. Such bids should be compared to similar financial results and commitments from the LACe.
e Any such procurement should include clear communications about the City's strategies for the LACC's West Hall and the proposed stadium/event center. The private sector management marketplace is highly aware of the Proposed New NFL Stadium Project and such communication is important to enhancing competition for this opportunity.
e The procurement should clearly identify potential transition strategies and plans for employees over time.
During the course of our work, we identified an additional opportunity for improvement that the City should consider. The City's current booking policy is not consistent with many of its direct competitors. To compete for Citywide conventions and tradeshows in a manner more similar to its peer competitors, the City should consider revising its booking policy to allow LA INe. to book the LACC 12 months out.
7
BUSINESS CASE REPORT - June 20, 2011
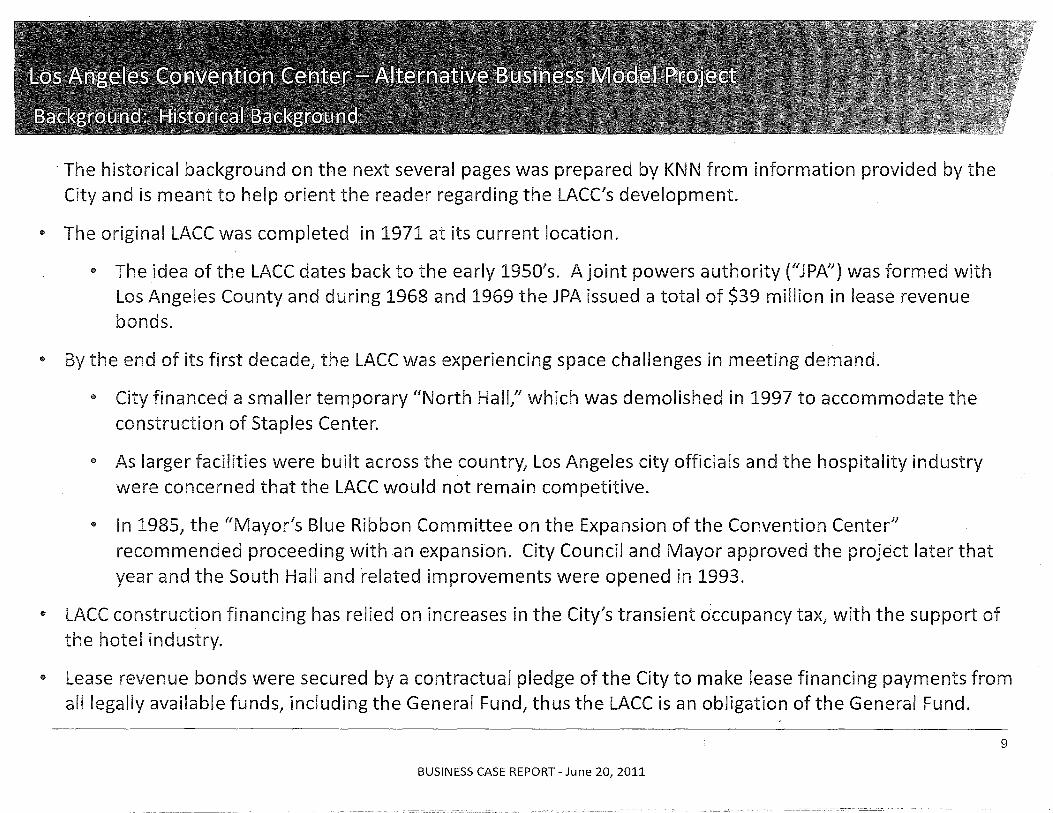
· The historical background on the next several pages was prepared by KNN from information provided by the City and is meant to help orient the reader regarding the LACC's development.
$ The original LACC was completed in 1971 at its current location.
$ The idea of the LACC dates back to the early 1950's. A joint powers authority ("JPAIJ) was formed with Los Angeles County and during 1968 and 1969 the JPA issued a total of $39 million in lease revenue bonds.
• By the end of its first decade, the LACC was experiencing space challenges in meeting demand.
@ City financed a smaller temporary {{North Hall/' which was demolished in 1997 to accommodate the construction of Staples Center.
• As larger facilities were built across the country, Los Angeles city officials and the hospitality industry were concerned that the LACC would not remain competitive.
$ In 1985, the "Mayor's Blue Ribbon Committee on the Expansion of the Convention Center" recommended proceeding with an expansion. City Council and Mayor approved the project later that year and the South Hall and related improvements were opened in 1993.
• LACC construction financing has relied on increases in the City's transient occupancy tax, with the support of the hotel industry.
• Lease revenue bonds were secured by a contractual pledge of the City to make lease financing payments from all legally available funds, including the General Fund, thus the LACC is an obligation of the General Fund.
9
BUSINESS CASE REPORT - June 20, 2011
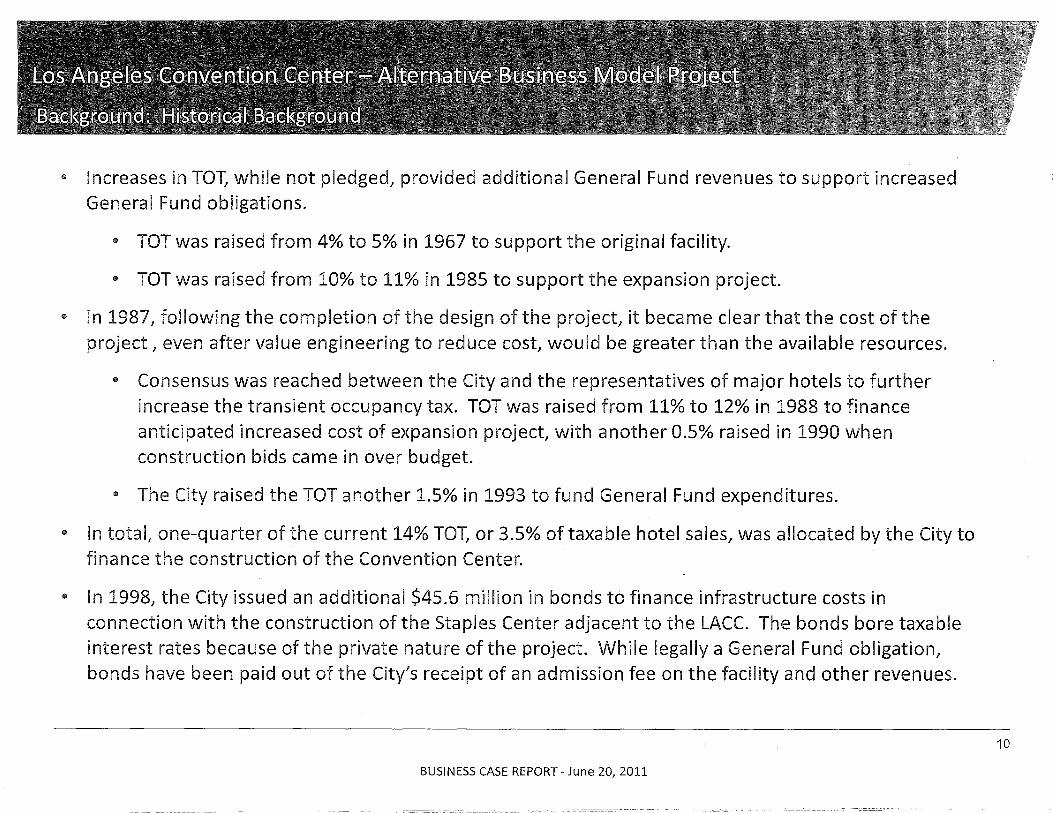
GIl Increases in TOT, while not pledged, provided additional General Fund revenues to support increased General Fund obligations.
GIl TOT was raised from 4% to 5% in 1967 to support the original facility.
GIl TOT was raised from 10% to 11% in 1985 to support the expansion project.
GIl In 1987, following the completion of the design of the project, it became clear that the cost of the project, even after value engineering to reduce cost, would be greater than the available resources.
4& Consensus was reached between the City and the representatives of major hotels to further increase the transient occupancy tax. TOT was raised from 11% to 12% in 1988 to finance anticipated increased cost of expansion project, with another 0.5% raised in 1990 when construction bids came in over budget.
4& The City raised the TOT another 1.5% in 1993 to fund General Fund expenditures.
4& In totat one-quarter of the current 14% TOT, or 3.5% of taxable hotel sales, was allocated by the City to finance the construction of the Convention Center.
GIl In 1998, the City issued an additional $45.6 million in bonds to finance infrastructure costs in connection with the construction of the Staples Center adjacent to the LACe. The bonds bore taxable interest rates because of the private nature of the project. While legally a General Fund obligation, bonds have been paid out of the City's receipt of an admission fee on the facility and other revenues.
BUSINESS CASE REPORT - June 20, 2011
10
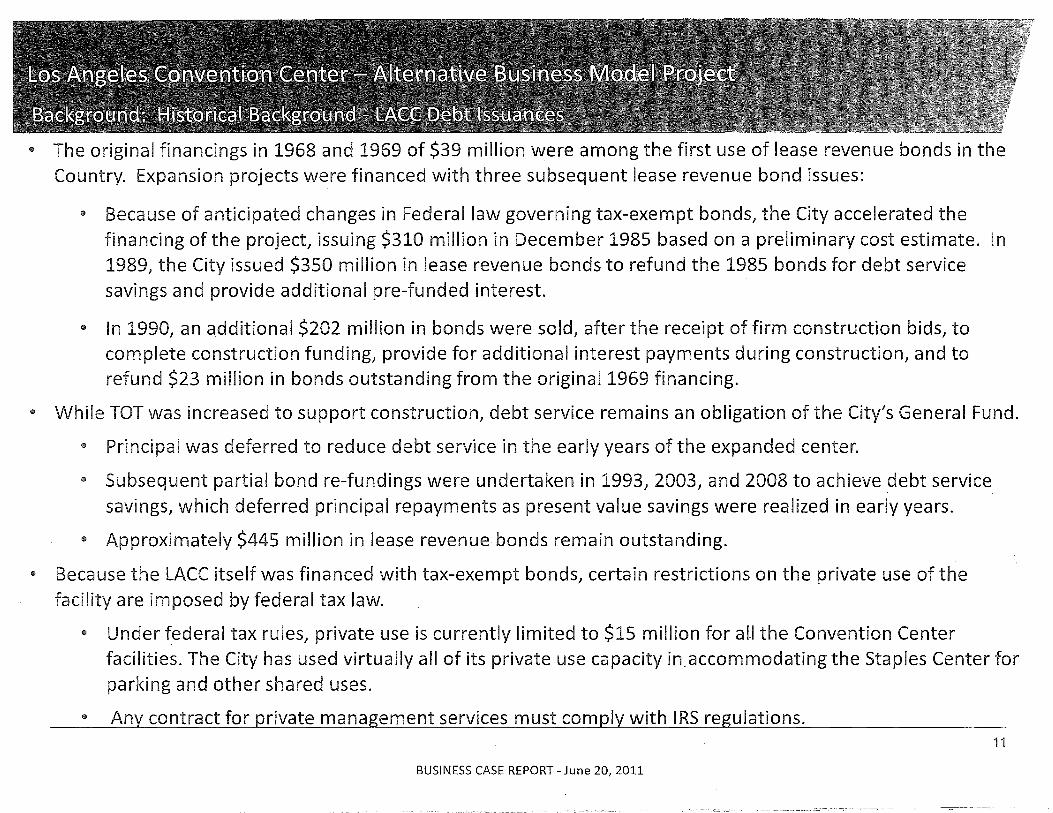
e The original financings in 1968 and 1969 of $39 million were among the first use of lease revenue bonds in the Country. Expansion projects were financed with three subsequent lease revenue bond issues:
e Because of anticipated changes in Federal law governing tax-exempt bonds, the City accelerated the financing of the project, issuing $310 million in December 1985 based on a preliminary cost estimate. In 1989, the City issued $350 million in lease revenue bonds to refund the 1985 bonds for debt service savings and provide additional pre-funded interest.
e In 1990, an additional $202 million in bonds were sold, after the receipt of firm construction bids, to complete construction funding, provide for additional interest payments during construction, and to refund $23 million in bonds outstanding from the original 1969 financing.
o While TOT was increased to support construction, debt service remains an obligation of the City's General Fund.
s Principal was deferred to reduce debt service in the early years of the expanded center.
s Subsequent partial bond re-fundings were undertaken in 1993, 2003, and 2008 to achieve .debt service savings, which deferred principal repayments as present value savings were realized in early years.
s Approximately $445 million in lease revenue bonds remain outstanding.
o Because the LACC itself was financed with tax-exempt bonds, certain restrictions on the private use of the facility are imposed by federal tax law.
<II Under federal tax rules, private use is currently limited to $15 million for aU the Convention Center facilities. The City has used virtually all of its private use capacity in. accommodating the Staples Center for parking and other shared uses.
o Any contract for private management services must comply with IRS regulations. 11
BUSINESS CASE REPORT - June 20, 2011
9 Today, the LACC contains approximately 720,000 square feet of exhibit hall space and approximately 147,000 square feet of meeting room space, totaling approximately 867,000 square feet of functional space. It is located in the heart of a vibrant event and entertainment area in downtown Los Angeles.
9 Staples Center, a world-class arena and home of four professional sports franchises which is adjacent to the LACC, opened in 1999.
9 L.A. LIVE, which is adjacent to the LACC, opened in 2008 and has significantly enhanced the restaurants and entertainment options proximate to the LACe.
9 The JW Marriott and Ritz Carlton hotels at LA Live opened in 2010 and added significant new hotel supply proximate to the LACe.
e Convention Center Industry Mission Statements - The mission statement is a critical element in any facility's operation because it dictates the booking policy, which can directly drive utilization and financial performance. As with any publicly owned facility, the goals and objectives may change over time with changes in leadership. Clearly defining a mission statement that reflects primary goals can allow a facility to set forth an operating and marketing strategy that is consistent and long-term in implementation.
9 LACC Mission Statement - The LACC's mission is to serve the City by enhancing its prominence as the only destination of choice for citywide conventions, exhibitions, trade shows and high profile events; to perform as an economic and jobs engine for the region through primary and secondary client spending; to support the promotion of the arts, sciences, humanities and education; and to effectively leverage the assets of the Sport and Entertainment District as a solid business partner and corporate citizen.
BUSINESS CASE REPORT - June 20, 2011
-,- --------------
12
CD Convention Center Industry Booking Policies - For any convention facility to be successful it is important for the booking policy to appropriately support and implement the mission statement through its prioritization of events. For instance, some events that generate economic impact to the community may not result in positive financial performance for the facility, particularly given the competitiveness among public assembly facilities. Irrespective of the management approach in place, a well-defined mission statement and booking policy can help reduce the potential for perceived differences in the facility's role by various stakeholders.
LACC Booking Policy
CD LA INC., the Los Angeles Convention and Visitors Bureau, is a private, nonprofit SOl(c)(6} business association contracted by the City of Los Angeles. As the City's official visitor promotion organization, LA INC's primary purpose is to enhance the economy of the City by promoting the City as a site for business meetings, conventions, trade shows and as a destination for leisure travelers.
CD Generally, LA INC is responsible for booking events at the LACC that fall outside of 24 months with some specific exceptions.
CD LACC can book up to six (6) non-convention events up to 10 years in advance under terms agreed to by both LACC and LA Inc. and under certain conditions.
BUSINESS CASE REPORT - June 20, 2011
13
., Convention Center Industry Discount Policies - Given the competitiveness of the convention center industry and current economic conditions that create a buyer's market, it is a common practice among comparable facilities to offer discounts and/or rental abatement for citywide convention and tradeshow activity in order to drive economic and fiscal benefits such as TOT. Discounts and/or abatements are typically tied to the number of estimated hotel room nights which will be booked in relation to the event .
., City of Los Angeles Discount Policy - The City currently has a discount policy in place that allows LA INC. to offer reductions in rental rates to conventions and tradeshows as an incentive to hold their events at the LACC. LA INC. may offer discounts of up to 100% of LACC space rental costs to prospective clients subject to the limitation that the amount discounted may not exceed the amount of TOT revenues that the event produces for the City. Discounts must be approved by the General Manager, and approved as to policy compliance by the CAO. Exceptions can be made for certain events such as meetings of national and regional industry-wide travel associations subject to approval of the LACC and CAO. The discount policy is intended to give LA INC. an additional marketing tool so that it can successfully sell Los Angeles and the LACC as a destination for conventions and tradeshows.
BUSINESS CASE REPORT - June 20, 2011
--------_.-
14
It In many communities, the primary role of a convention center is to attract out-of-town visitors that generate hotel room nights and tourist or transient occupancy tax revenues.
It The convention and tourism industries have been negatively affected by recent general economic conditions and TOT revenues have generally suffered on a national basis.
It Economic conditions combined with the significant supply of space and declining or stagnant demand have led to a perceived buyer's market in the convention center industry. In response to shifts in demand, some larger convention centers and hotels have repositioned themselves to aggressively pursue convention and meeting activity that was historically hosted by mid-level facilities.
'" The expectations for convention centers to be financially viable, while simultaneously making financial concessions such as discounting rental rates, is not necessarily compatible. This is further complicated by the fact that as in Los Angeles, many convention centers are owned and operated by public entities and marketed by independent non-profit organizations. As such, the destination marketing organization ("DMOJl) and the convention center operator may differ in their missions and performance evaluations based on dissimilar, and in some cases competing, operating objectives.
e Research and analysis conducted for this engagement as well as commentary from City, LACC and LA INC. representatives indicate that the LACC and the LA INC. face similar issues in their marketplace.
'" The City is considering whether modifications to the LACC's current business model could create competitive advantages, enhance operational efficiencies and reduce general fund costs associated with the LACC.
BUSINESS CASE REPORT - June 20, 2011
15
A convention center's management team is generally responsible for overseeing the day-to-day operations of a convention center facility including implementing the mission statement and operating policies. The management structure selected for a facility is important because it typically impacts all aspects of operations including short-term marketing, utilization, financial operations and overall operating efficiency of the facility.
The most common management structures at convention centers in the U.S. are:
€I Municipal management such as a City departmental structure;
€I Independent public authority; or
• A third party private management company that specializes in operating similar facilities
To assist the City in its evaluation of alternative business models for the LACC, this section of the report: highlights financial performance results related to the LACC and other convention centers*; profiles management structures at larger convention centers in the U.S. as well as the relative advantages and disadvantages of each option; and compares performance measures between the LACC and selected convention centers.
* The financial data on pages 18 and 21-26 was presented to the City in September 2010, and it has been updated for purposes of this report.
BUSINESS CASE REPORT - June 20, 2011
17
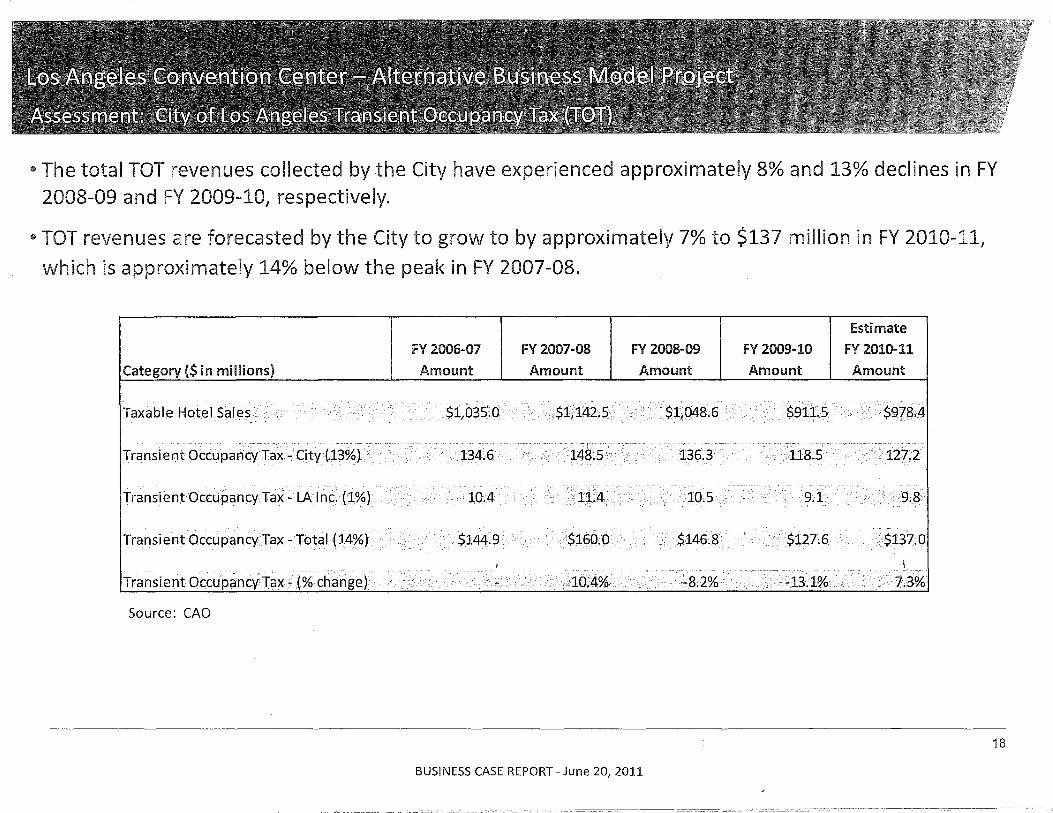
® The total TOT revenues collected by the City have experienced approximately 8% and 13% declines in FY 2008-09 and FY 2009-10, respectively.
e TOT revenues are forecasted by the City to grow to by approximately 7% to $137 million in FY 2010-11,
which is approximately 14% below the peak in FY 2007-08.
Estimate
FY 2006-07 FY 2007-08 FY 2008-09 FY 2009-10 FY 2010-11
Category ($ in millions) Amount Amount Amount Amount Amount
Taxable Hotel Sales '$lj035.0 $1,142.5 - . $1,048.6 $911.5 $978.4
Transient Occupancy Tax -City (13%) 134.6 -148.5 136.3 118.5 127.2
Transient OccupancyTax -: LAlnc. (1%) lOA --11.4 10.5 9~1_ 9.8
Transient Occupancy Tax- Total (14%) $144.9 $160~0 $146.8 $127;6 $137.0
\
Transient Occupancy Tax - (% change) 10.4% -8.2% -13.1% 7.3%
Source: CAO
BUSINESS CASE REPORT - June 20, 2011
----------~"--~,.~
18
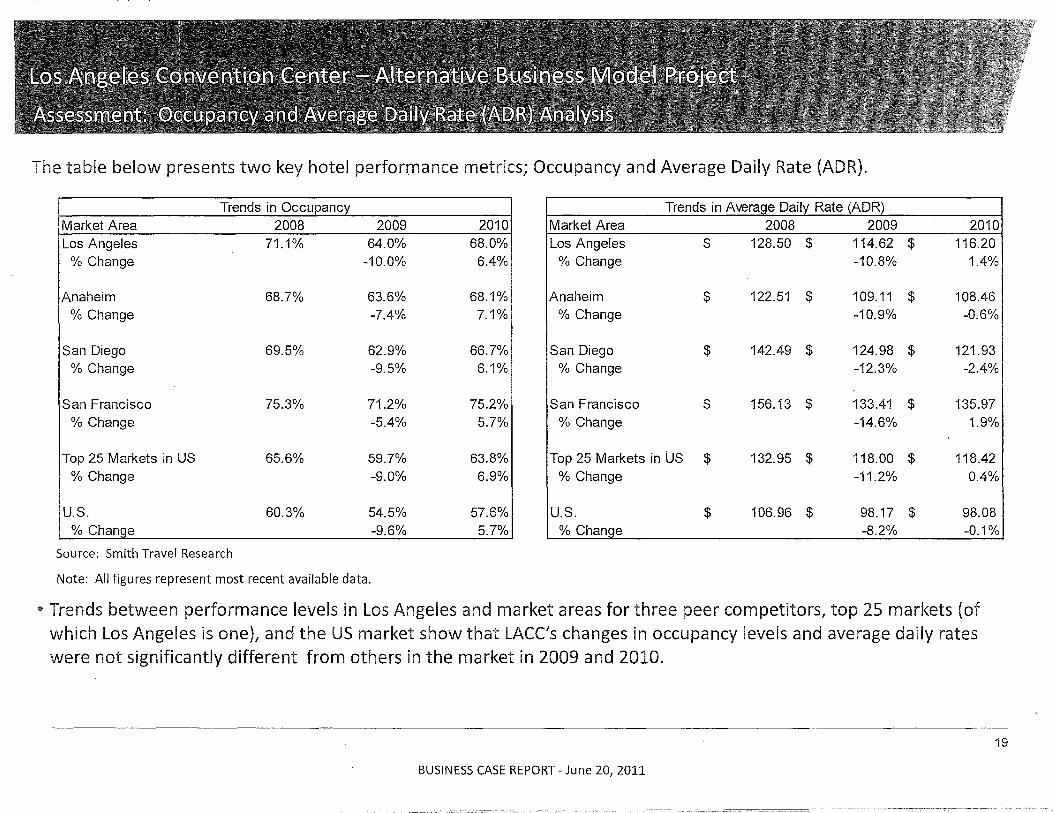
The table below presents two key hotel performance metrics; Occupancy and Average Daily Rate (ADR).
Trends in Occupanc Trends in Average Daily Rate (ADR) Market Area 2008 2009 2010 Market Area 2008 2009 2010 Los Angeles 71.1% 64.0% 68.0% Los Angeles $ 128.50 $ 114.62 $ 116.20
% Change -10.0% 6.4% % Change -10.8% 1.4%
Anaheim 68.7% 63.6% 68.1% Anaheim $ 122.51 $ 109.11 $ 108.46 % Change -7.4% 7.1% % Change -10.9% -0.6%
San Diego 69.5% 62.9% 66.7% San Diego $ 142.49 $ 124.98 $ 121.93 % Change -9.5% 6.1% % Change -12.3% -2.4%
San Francisco 75.3% 71.2% 75.2% San Francisco $ 156.13 $ 133.41 $ 135.97 % Change -5.4% 5.7% % Change -14.6% 1.9%
Top 25 Markets in US 65.6% 59.7% 63.8% Top 25 Markets in US $ 132.95 $ 118.00 $ 118.42 !
% Change -9.0% 6.9% % Change -11.2% 0.4%
U.S. 60.3% 54.5% 57.6% U.S. $ 106.96 $ 98.17 $ 98.08 % Change -9.6% 5.7% % Change -8.2% -0.1%
Source: Smith Travel Research
Note: All figures represent most recent available data .
.. Trends between performance levels in Los Angeles and market areas for three peer competitors, top 25 markets (of which Los Angeles is oneL and the US market show that LACe's changes in occupancy levels and average daily rates were not significantly different from others in the market in 2009 and 2010.
19
BUSINESS CASE REPORT - June 20, 2011
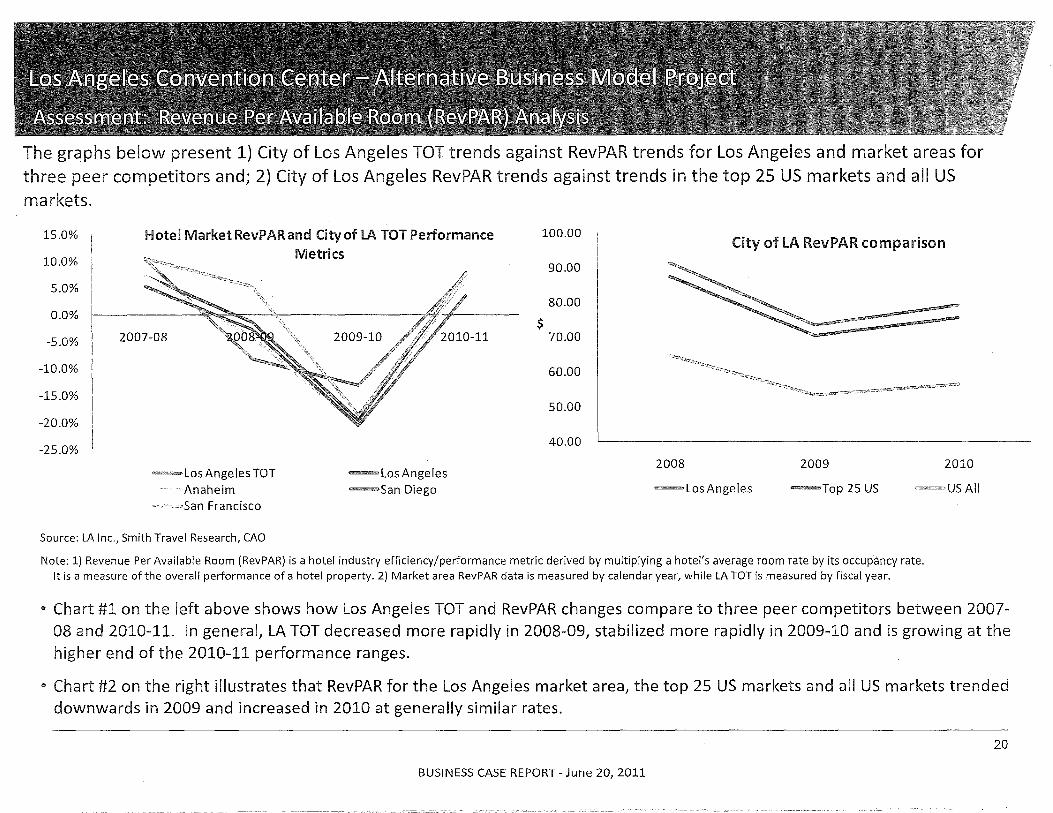
The graphs below present 1) City of Los Angeles TOT trends against RevPAR trends for Los Angeles and market areas for three peer competitors and; 2) City of Los Angeles RevPAR trends against trends in the top 25 US markets and all US markets.
15.0% Hotel Market RevPARand City of LA TOT Performance
10.0% Metrics
5.0%
0.0%
-5.0% 2007-08
-10.0%
-15.0%
-20.0%
-25.0%
~=LosAngelesTOT -Los Angeles Anaheim -San Diego
--~c-~San Francisco
Source: LA Inc., Smith Travel Research, CAO
100.00
90.00
80.00
$ 70.00
60.00
50.00
40.00
City of LA RevPAR comparison
2008
-Los Angeles
2009
-Top 25US
2010
~-'"--~-~ US A II
Note: 1) Revenue Per Available Room (RevPAR) is a hotel industry efficiency/performance metric derived by multiplying a hotel's average room rate by its occupancy rate. It is a measure of the overall performance of a hotel property. 2) Market area RevPAR data is measured by calendar year, while LA TOT is measured by fiscal year .
.. Chart #1 on the left above shows how Los Angeles TOT and RevPAR changes compare to three peer competitors between 2007-08 and 2010-11. In general, LA TOT decreased more rapidly in 2008-09, stabilized more rapidly in 2009-10 and is growing at the higher end of the 2010-11 performance ranges.
" Chart #2 on the right illustrates that RevPAR for the Los Angeles market area, the top 25 US markets and all US markets trended downwards in 2009 and increased in 2010 at generally similar rates.
20
BUSINESS CASE REPORT - June 20, 2011
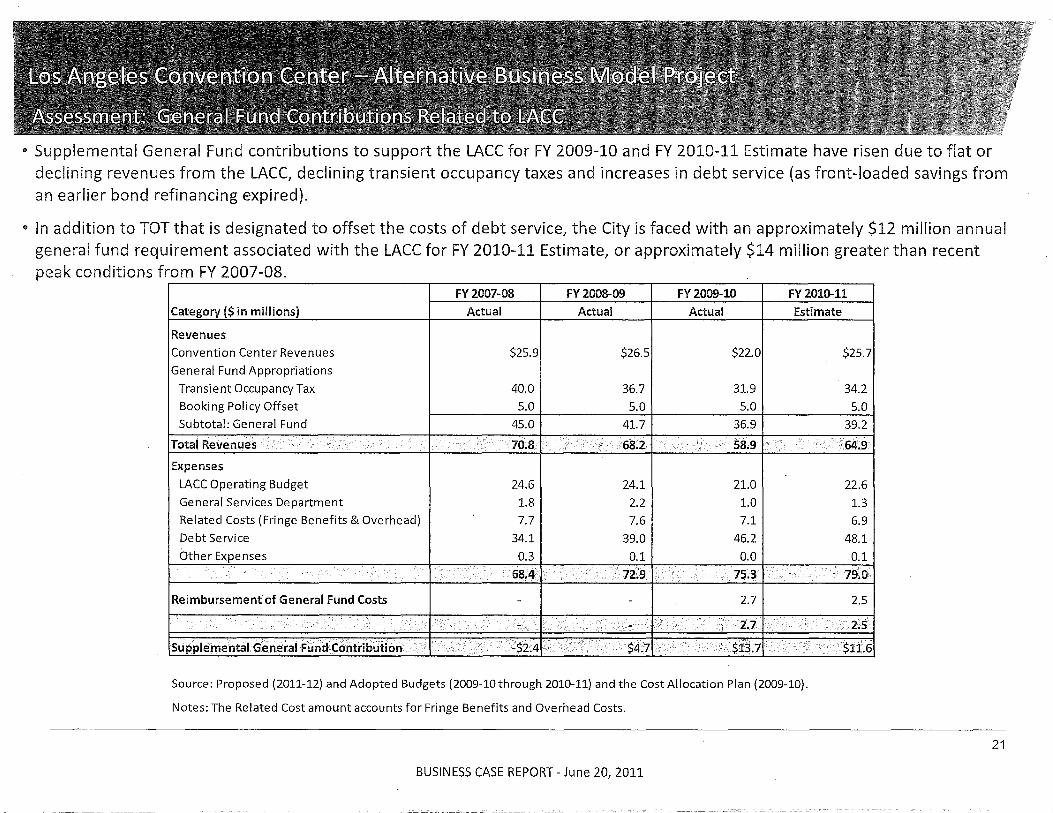
" Supplemental General Fund contributions to support the LACC for FY 2009-10 and FY 2010-11 Estimate have risen due to flat or declining revenues from the LACC, declining transient occupancy taxes and increases in debt service (as front-loaded savings from an earlier bond refinancing expired).
" In addition to TOT that is designated to offset the costs of debt service, the City is faced with an approximately $12 million annual general fund requirement associated with the LACC for FY 2010-11 Estimate, or approximately $14 million greater than recent peak conditions from FY 2007-08.
FY 2007-08 FY2008-09 FY 2009-10 FY2010-11
Category ($ in millions) Actual Actual Actual Estimate
Revenues
Convention Center Revenues $25.9 $26.5 $22.0 $25.7
General Fund Appropriations
Transient Occupancy Tax 40.0 36.7 31.9 34.2
Booking Policy Offset 5.0 5.0 5.0 5.0
Subtotal: General Fund 45.0 41.7 36.9 39.2
Total Revenues " 70.8 " 68.2' 58.9 64.9
Expenses
LACC Operating Budget 24.6 24.1 21.0 22.6
General Services Department 1.8 2.2 1.0 1.3
Related Costs (Fringe Benefits & Overhead) 7.7 7.6 7.1 6.9
Debt Service 34.1 39.0 46.2 48.1
Other Expenses 0.3 0.1 0.0 0.1 ',' 68.,4 72:9 ',' 7S.3 ,,' ' 79~O
Reimbursemenfof General Fund Costs - - 2.7 2.5
" - - ' '" '1..7 2.5,
~upplemental General Fund Contribution "$2.4 $4.7 $13.7 ,
$11.6
Source: Proposed (2011-12) and Adopted Budgets (2009-10 through 2010-11) and the Cost Allocation Plan (2009-10).
Notes: The Related Cost amount accounts for Fringe Benefits and Overhead Costs.
BUSINESS CASE REPORT - June 20, 2011
,
I
21
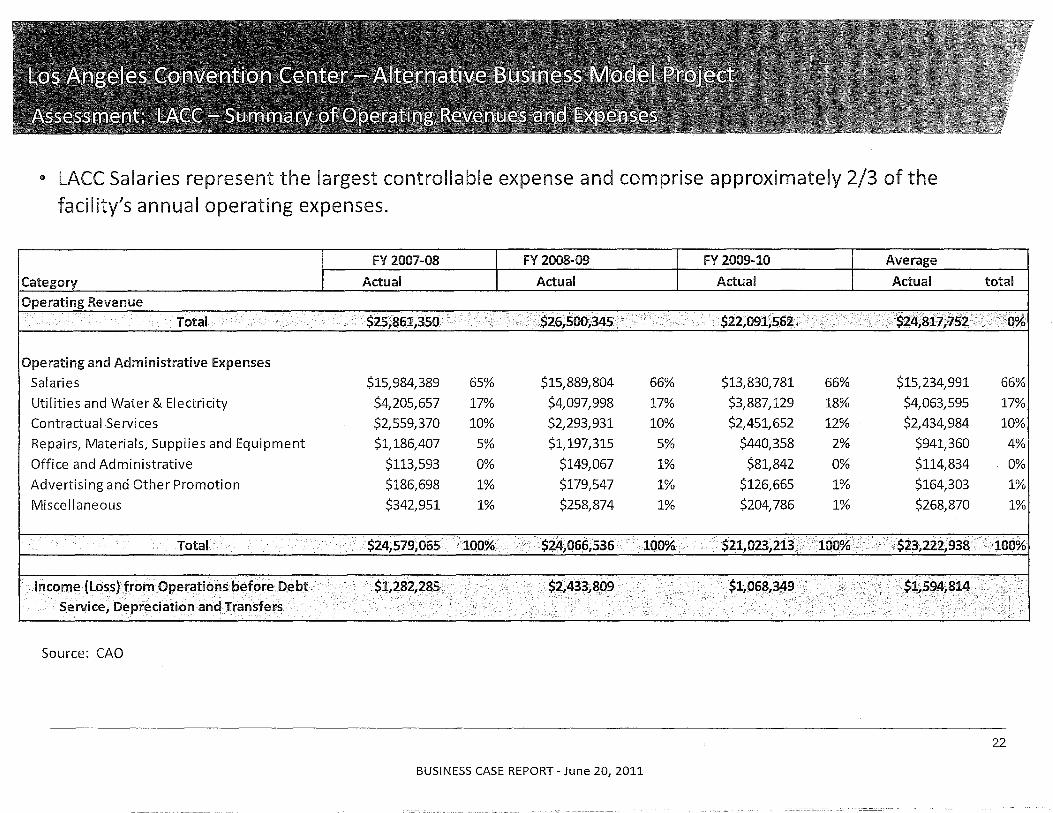
" LACC Salaries represent the largest controllable expense and comprise approximately 2/3 of the facility's annual operating expenses.
FY 2007-08 FY 2008-09 FY 2009-10 Average
Category Actual Actual Actual Actual
Operating Revenue
Total $25,861,350 . $26;500,345 . .. ,
$22,O91~562 ·$24,817;752···
Operating and Administrative Expenses
Salaries $15,984,389 65% $15,889,804 66% $13,830,781 66% $15,234,991
Utilities and Water & Electricity $4,205,657 17% $4,097,998 17% $3,887,129 18% $4,063,595
Contractual Services $2,559,370 10% $2,293,931 10% $2,451,652 12% $2,434,984
Repairs, Materials, Supplies and Equipment $1,186,407 5% $1,197,315 5% $440,358 2% $941,360
Office and Administrative $113,593 0% $149,067 1% $81,842 0% $114,834
Advertising and Other Promotion $186,698 1% $179,547 1% $126,665 1% $164,303
Miscellaneous $342,951 1% $258,874 1% $204,786 1% $268,870
Total $24,579,065 100% $24,06",536 100% $21,023,213 100%' $23,222;938 .,
Income (loss) from Operations before Debt $1,282,285 $2,433,809 $1,068,349 $1,,594~814
Service, Depreciation and Transfers
Source: CAO
BUSINESS CASE REPORT - June 20, 2011
I
total
I
0%1
66%
17%
10%
4%
0%
1%
1%
100%
22
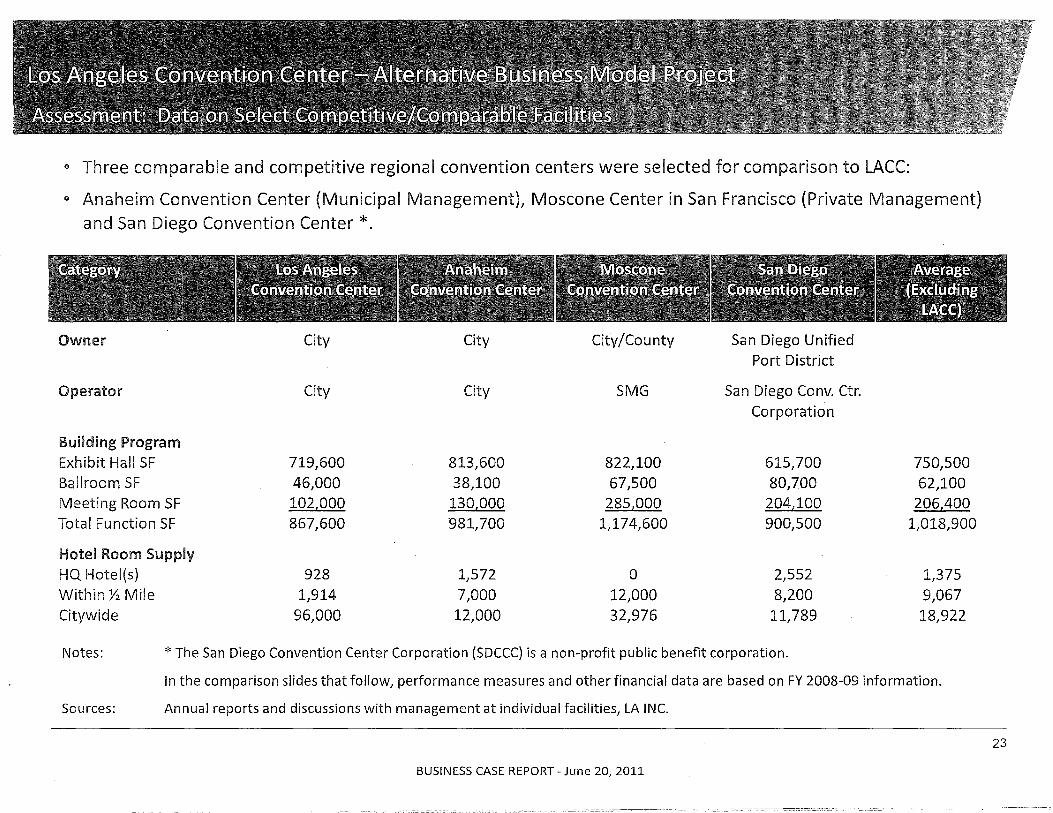
" Three comparable and competitive regional convention centers were selected for comparison to LACC:
" Anaheim Convention Center (Municipal Management), Moscone Center in San Francisco {Private Management} and San Diego Convention Center *.
Owner
Operator
Building Program Exhibit Hall SF Ballroom SF Meeting Room SF Total Function SF
Hotel Room Supply HQ Hotel(s) Within Y2 Mile Citywide
City
City
719,600 46,000 102£000 867,600
928 1,914
96,000
City
City
813,600 38,100 130,000 981JOO
1,572 7,000 12,000
City/County
SMG
822,100 67,500
285£000 1,174,600
0 12,000 32,976
San Diego Unified Port District
San Diego Conv. Ctr. Corporation
615,700 80JOO 204,100 900,500
2,552 8,200
I1J89
Notes: * The San Diego Convention Center Corporation (SDCCC) is a non-profit public benefit corporation.
750,500 62,100
206,400 1,018,900
1,375 9,067 18,922
Sources:
In the comparison slides that follow, performance measures and other financial data are based on FY 2008-09 information.
Annual reports and discussions with management at individual facilities, LA INC.
BUSINESS CASE REPORT - June 20, 2011
23
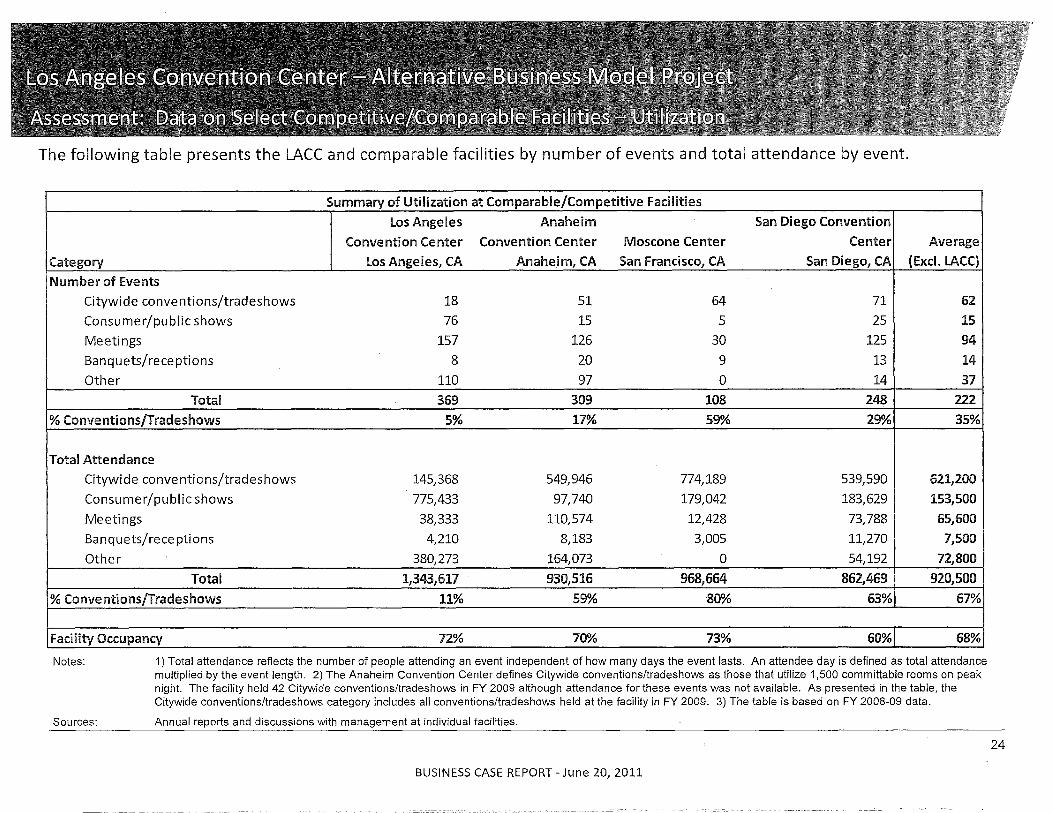
The following table presents the LACC and comparable facilities by number of events and total attendance by event.
~.
Summary of Utilization at Comparable/Competitive Facilities
los Angeles Anaheim , San Diego Convention
Convention Center Convention Center Moscone Center Center Average
Category los Angeles, CA Anaheim, CA San Francisco, CA San Diego, CA (Excl. LACe)
Number of Events
Citywide conventions/tradeshows 18 51 64 71 62
Consumer/public shows 76 15 5 25 15
Meetings 157 126 30 125 94
Banquets/receptions 8 20 9 13 14
Other 110 97 0 14 37
Total 369 309 108 248 222
% Conventions/Tradeshows 5% 17% 59% 29% 35%
Total Attendance
Citywide conventions/tradeshows 145,368 549,946 774,189 539,590 621,200
Consumer/public shows 775,433 97,740 179,042 183,629 153,500
Meetings 38,333 110,574 12,428 73,788 65,600
Banquets/rece ptions 4,210 8,183 3,005 11,270 7,500
Other 380,273 164,073 0 54,192 72,800
Total 1,343,617 930,516 968,664 862,469 920,500
% Conventions/Tradeshows 11% 59% 80% 63% 67%
Facility Occupancy 72% 70% 73% 60% 68% -~ --- --_ .. - --- ----
Notes: 1) Total attendance reflects the number of people attending an event independent of how many days the event lasts. An attendee day is defined as total attendance multiplied by the event length. 2) The Anaheim Convention Center defines Citywide conventions/tradeshows as those that utilize 1,500 committable rooms on peak night. The facility held 42 Citywide conventions/tradeshows in FY 2009 although attendance for these events was not available. As presented in the table, the Citywide conventions/tradeshows category includes all conventions/tradeshows held at the facility in FY 2009. 3) The table is based on FY 2008-09 data.
Sources: Annual reports and discussions with management at individual facilities.
BUSINESS CASE REPORT - June 20, 2011
24
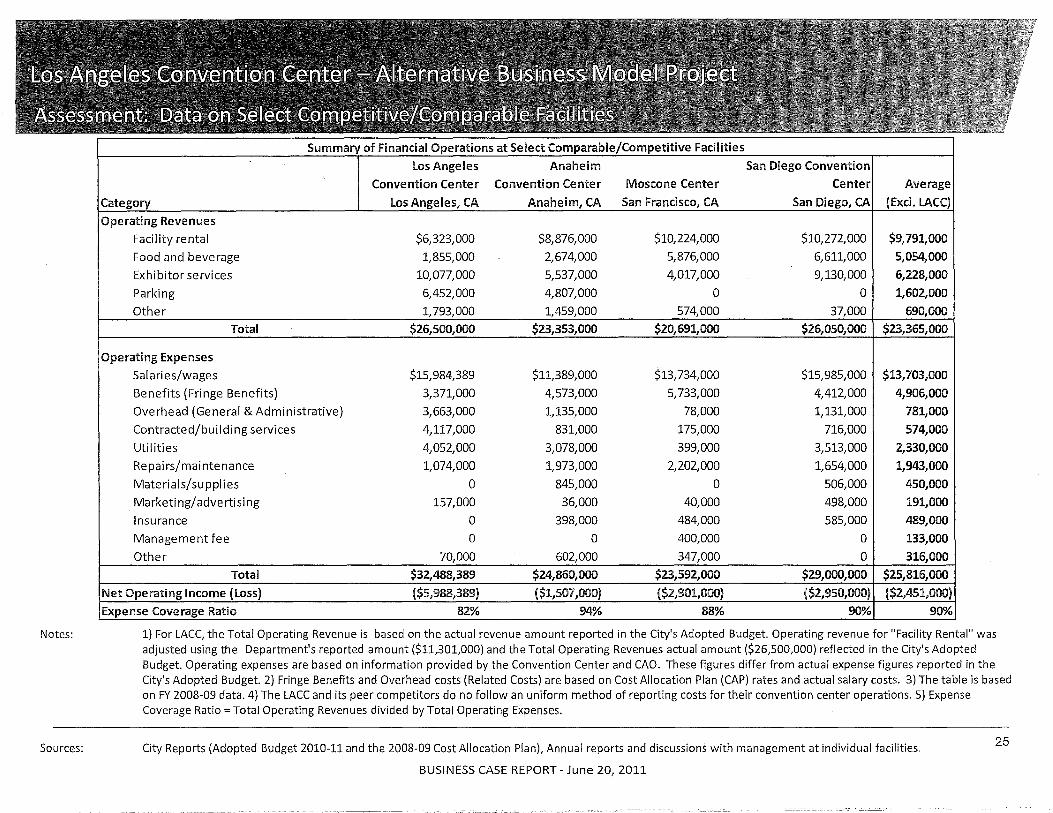
Notes:
Sources:
Summary of Financial Operations at Select Comparable/Competitive Facilities
Los Angeles Anaheim San Diego Convention
Convention Center Convention Center Moscone Center center/ Average
Category Los Angeles, CA Anaheim, CA San Francisco, CA San Diego, CA (Excl. LACe)
Operating Revenues
Facility rental $6,323,000 $8,876,000 $10,224,000 $10,272,000 $9,791,000
Food and beverage 1,855,000 2,674,000 5,876,000 6,611,000 5,054,000
Exhibitor services 10,077,000 5,537,000 4,017,000 9,130,000 6,228,000
Parking 6,452,000 4,807,000 0 0 1,602,000
Other 1,793,000 1,459,000 574,000 37,000 690,000
Total $26,500,000 $23,353,000 $20,691,000 $26,050,000 $23,365,000
Operating Expenses
Sal ari es/wages $15,984,389 $11,389,000 $13,734,000 $15,985,000 $13,703,000
Benefits (Fringe Benefits) 3,371,000 4,573,000 5,733,000 4,412,000 4,906,000
Overhead (General & Administrative) 3,663,000 1,135,000 78,000 1,131,000 781,000
Contracted/building services 4,117,000 831,000 175,000 716,000 574,000
Utilities 4,052,000 3,078,000 399,000 3,513,000 2,330,000
Repairs/maintenance 1,074,000 1,973,000 2,202,000 1,654,000 1,943,000
Materials/supplies 0 845,000 0 506,000 450,000
Marketing/advertising 157,000 36,000 40,000 498,000 191,000
Insurance 0 398,000 484,000 585,000 489,000
Managementfee 0 0 400,000 0 133,000
Other 70,000 602,000 347,000 0 316,000
Total $32,488,389 $24,860,000 $23,592,000 $29,000,000 $25,816,000
Net Operating income (loss) ($5,988,389) ($1,507,000) ($2,901,000) ($2,950,000) ($2,451,OOO)
Expense Coverage Ratio 82% 94% 88% 90% 90%
1) For LACC, the Total Operating Revenue is based on the actual revenue amount reported in the City'S Adopted Budget. Operating revenue for "Facility Rental" was adjusted using the Department's reported amount ($11,301,000) and the Total Operating Revenues actual amount ($26,500,000) reflected in the City's Adopted Budget. Operating expenses are based on information provided by the Convention Center and CAO. These figures differ from actual expense figures reported in the City's Adopted Budget. 2) Fringe Benefits and Overhead costs (Related Costs) are based on Cost Allocation Plan (CAP) rates and actual salary costs. 3) The table is based on FY 2008-09 data. 4) The LACC and its peer competitors do no follow an uniform method of reporting costs for their convention center operations. 5) Expense Coverage Ratio = Total Operating Revenues divided by Total Operating Expenses.
City Reports (Adopted Budget 2010-11 and the 2008-09 Cost Allocation Plan), Annual reports and discussions with management at individual facilities. 25
BUSINESS CASE REPORT - June 20, 2011
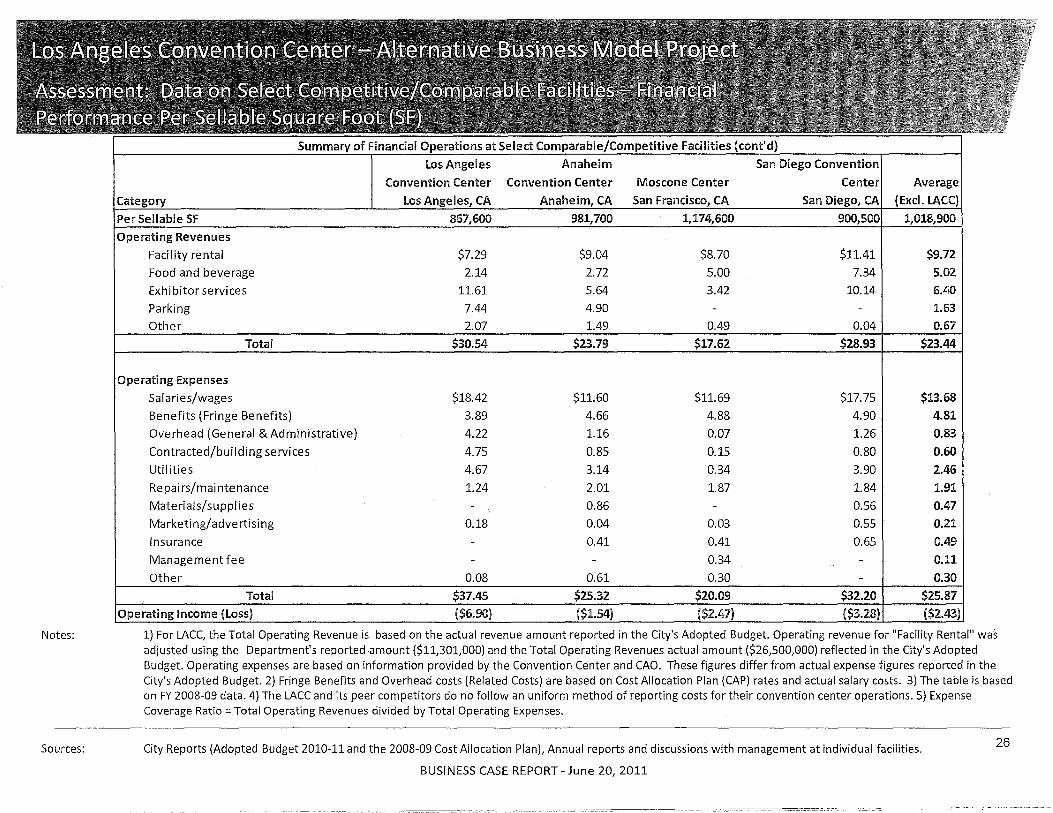
Notes:
Sources:
Convention Center Convention Center
los Angeles, CA Anahe
lable SF 867,600 9
Operating Revenues
Facility rental $7.29 $9.04 $8.70 $11.41 $9.72
Food and beverage 2.14 2.72 5.00 7.34 5.02
Exhibitor services 11.61 5.64 3.42 10.14 6.40
Parking 7.44 4.90 1.63
Other 2.07 1.49 0.49 0.04 0.67
Operating Expenses
Sal ari es/wages $18.42 $11.60 $11.69 $17.75 $13.68
Benefits (Fringe Benefits) 3.89 4.66 4.88 4.90 4.81
Overhead (General & Administrative) 4.22 1.16 0.07 1.26 0.83
Contracted/building services 4.75 0.85 0.15 0.80 0.60
Utilities 4.67 3.14 0.34 3.90 2.46
Repairs/maintenance 1.24 2.01 1.87 1.84 1.91
Materials/supplies 0.86 0.56 0.47
Marketing/advertising 0.18 0.04 0.03 0.55 0.21
Insurance 0.41 0.41 0.65 0.49
Management fee 0.34 0.11
Other 0.08 0.61 0.30 0.30
1) For LACC, the Total Operating Revenue is based on the actual revenue amount reported in the City'S Adopted Budget. Operating revenue for "Facility Rental" was adjusted using the Department's reported amount ($11,301,000) and the Total Operating Revenues actual amount ($26,500,000) reflected in the City's Adopted Budget. Operating expenses are based on information provided by the Convention Center and CAO. These figures differ from actual expense figures reported in the City's Adopted Budget. 2) Fringe Benefits and Overhead costs (Related Costs) are based on Cost Allocation Plan (CAP) rates and actual salary costs. 3) The table is based on FY 2008-09 data. 4) The LACC and its peer competitors do no follow an uniform method of reporting costs for their convention center operations. 5) Expense Coverage Ratio = Total Operating Revenues divided by Total Operating Expenses.
City Reports (Adopted Budget 2010-11 and the 2008-09 Cost Allocation Plan), Annual reports and discussions with management at individual facilities. 26
BUSINESS CASE REPORT - June 20, 2011
In comparison to its regional competitors in Anaheim, San Diego and San Francisco, the LACC:
QI Is somewhat smaller overall than the three peer competitors, notably in meeting room space.
QI Has a substantially different market mix with a much lower percentage of citywide conventions/tradeshows and a much higher level of consumer/public/trade shows.
QI Generates higher operating revenues and has higher total operating expenses, which include higher combined costs for labor, benefits and overhead costs. The LACC's expense coverage ratio trails the average of the three peer competitors.
$ Has a net operating loss per square foot that is nearly three times greater than the average of the three peer competitors.
@ Has about 1,900 hotel rooms within Yz mile of the convention center, while the three peer competitors range between 7,000 to 121 000 hotel rooms within the same distance.
These high level statistics support a market understanding that was confirmed by both local convention center stakeholders and industry resources:
19 The LACC appears to focus on the trade show market.
19 Other facilities, with different hotel resources available to them, have been more successful at attracting major citywide conventions that generate room nights and TOT.
BUSINESS CASE REPORT - June 20, 2011
27
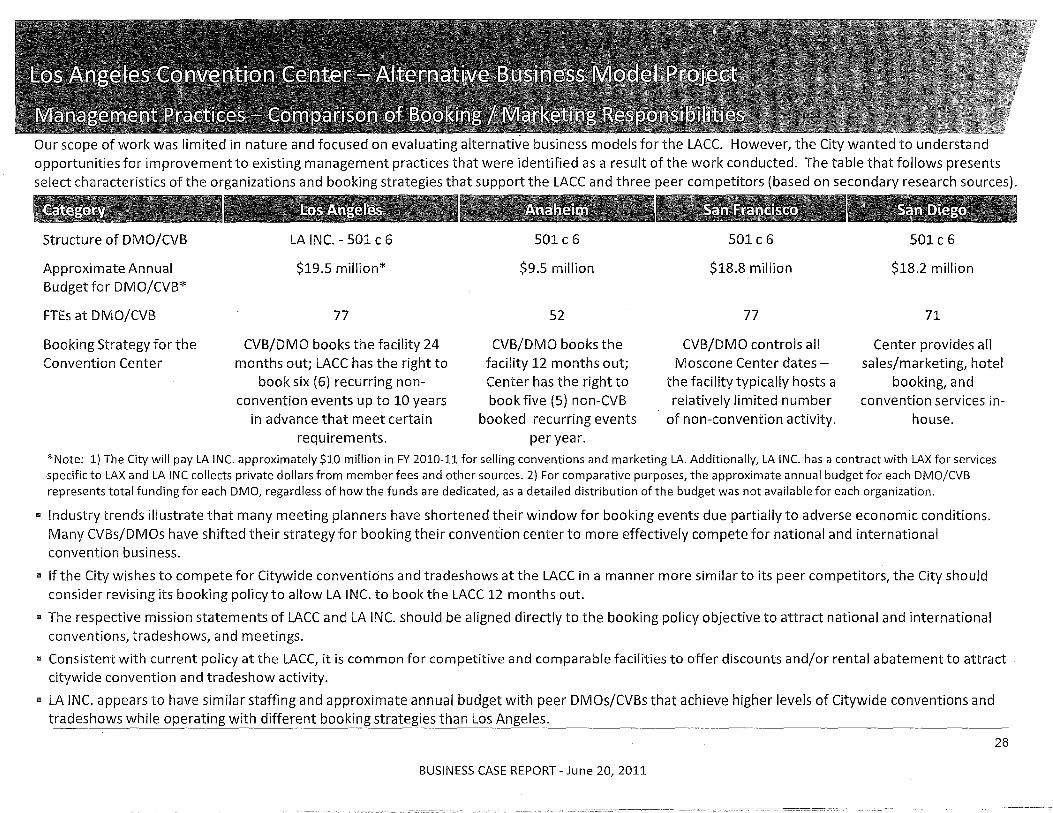
Our scope of work was limited in nature and focused on evaluating alternative business models for the LACC. However, the City wanted to understand opportunities for improvement to existing management practices that were identified as a result of the work conducted. The table that follows presents select characteristics of the organizations and booking strategies that support the LACC and three peer competitors (based on secondary research sources).
Structure of DMO/CVB LA INC. - 501 c 6 501 c 6 501 c 6 501 c 6
Approximate Annual $19.5 million* $9.5 million $18.8 million $18.2 million Budget for DMO/CVB*
FTEs at DMO/CVB 77 52 77 71
Booking Strategy for the CVB/DMO books the facility 24 CVB/DMO books the CVB/DMO controls all Center provides all Convention Center months out; LACC has the right to facility 12 months out; Moscone Center dates- sales/marketing, hotel
book six (6) recurring non- Center has the right to the facility typically hosts a booking, and convention events up to 10 years book five (5) non-CVB relatively limited number convention services in-
in advance that meet certain booked recurring events of non-convention activity. house. requirements. per year.
*Note: 1) The City will pay LA INC. approximately $10 million in FY 2010-11 for selling conventions and marketing LA. Additionally, LA INC. has a contract with LAX for services specific to LAX and LA INC collects private dollars from member fees and other sources. 2) For comparative purposes, the approximate annual budget for each DMO/CVB represents total funding for each DMO, regardless of how the funds are dedicated, as a detailed distribution of the budget was not available for each organization.
II Industry trends illustrate that many meeting planners have shortened their window for booking events due partially to adverse economic conditions. Many CVBs/DMOs have shifted their strategy for booking their convention center to more effectively compete for national and international convention business.
'" if the City wishes to compete for Citywide conventions and tradeshows at the LACC in a manner more similar to its peer competitors, the City should consider revising its booking policy to allow LA iNC. to book the LACC 12 months out .
.. The respective mission statements of LACC and LA INC. should be aligned directly to the booking policy objective to attract national and international conventions, tradeshows, and meetings.
" Consistent with current policy at the LACC, it is common for competitive and comparable facilities to offer discounts and/or rental abatement to attract citywide convention and tradeshow activity.
II LA INC. appears to have similar staffing and approximate annual budget with peer DMOs/CVBs that achieve higher levels of Citywide conventions and tradeshows while operating with different booking strategies than Los Angeles.
BUSINESS CASE REPORT - June 20, 2011
28
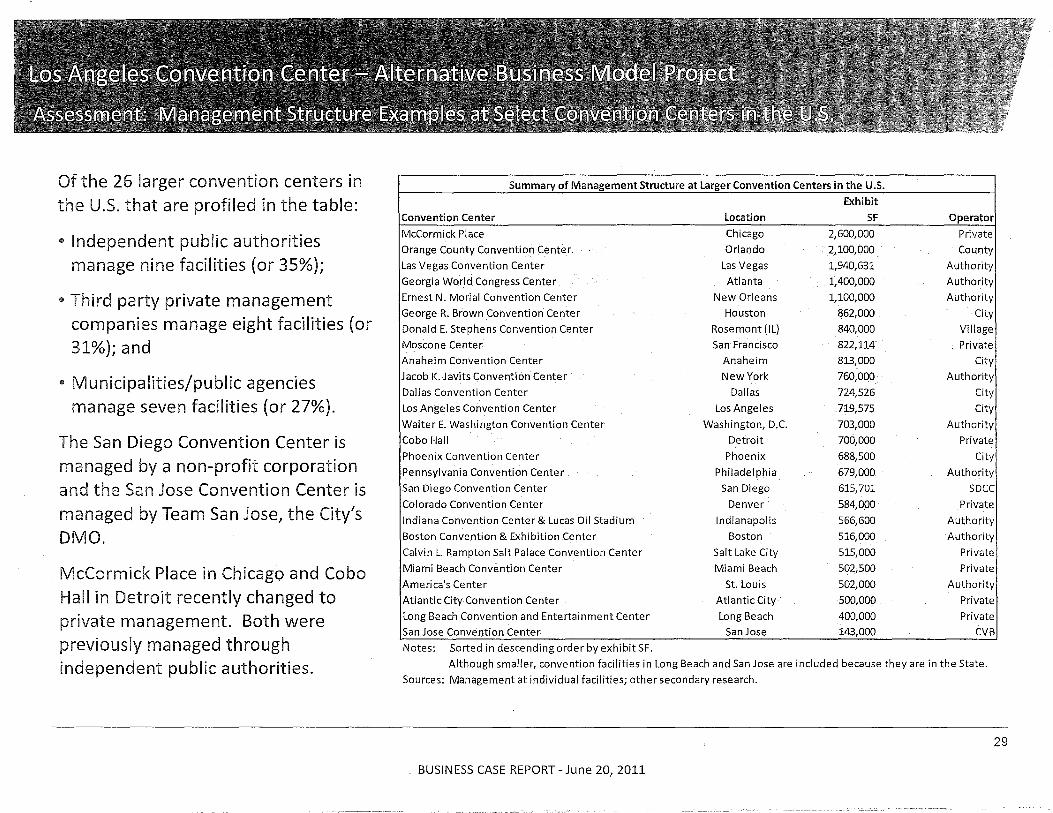
Of the 26 larger convention centers in the u.s. that are profiled in the table:
co Independent public authorities manage nine facilities (or 35%);
., Third party private management companies manage eight facilities (or 31%); and
co Municipalities/public agencies manage seven facilities (or 27%).
The San Diego Convention Center is managed by a non-profit corporation and the San Jose Convention Center is managed by Team San Jose, the City's DMO.
McCormick Place in Chicago and Cobo Hall in Detroit recently changed to private management. Both were previously managed through independent public authorities.
Summary of Management Structure at Larger Convention Centers in the u.S.
Exhibit
Convention Center Location SF Operator
McCormick Place Chicago 2,600,000 Private
Orange County Convention Center Orlando 2,100,000 County
Las Vegas Convention Center Las Vegas 1,940,631 Authority
Georgia World Congress Center Atlanta 1,400,000 Authority
Ernest N. Morial Convention Center New Orleans 1,100,000 Authority
George R. Brown Convention Center Houston 862,000 City
Donald E. Stephens Convention Center Rosemont (ILl 840,000 Village
Moscone Center San Francisco 822,114 Private
Anaheim Convention Center Anaheim 813,000 City
Jacob K. Javits Convention Center New York 760,000 Authority
Dallas Convention Center Dallas 724,526 City
Los Angeles Convention Center Los Angeles 719,575 City
Walter E. Washington Convention Center Washington, D.C. 703,000 Authority
Cobo Hall Detroit 700,000 Private
Phoenix Convention Center Phoenix 688,500 City
Pennsylvania Convention Center Philadelphia 679,000 Authority
San Diego Convention Center San Diego 615,701 SDCC
Colorado Convention Center Denver 584,000 Private
Indiana Convention Center & Lucas Oil Stadium Indianapolis 566,600 Authority
Boston Convention & Exhibition Center Boston 516,000 Authority
Calvin L. Rampton Salt Palace Convention Center Salt Lake City 515,000 Private
Miami Beach Convention Center Miami Beach 502,500 Private
America's Center St. Louis 502,000 Authority
Atlantic City Convention Center Atlantic City 500,000 Private
Long Beach Convention and Entertainment Center Long Beach 400,000 Private
San Jose Convention Center San Jose 143,000 CVB
Notes: Sorted in descending order by exhibit SF.
Although smaller, convention facilities in Long Beach and San Jose are included because they are in the State.
Sources: Management at individual facilities; other secondary research.
29
. BUSINESS CASE REPORT - June 20, 2011
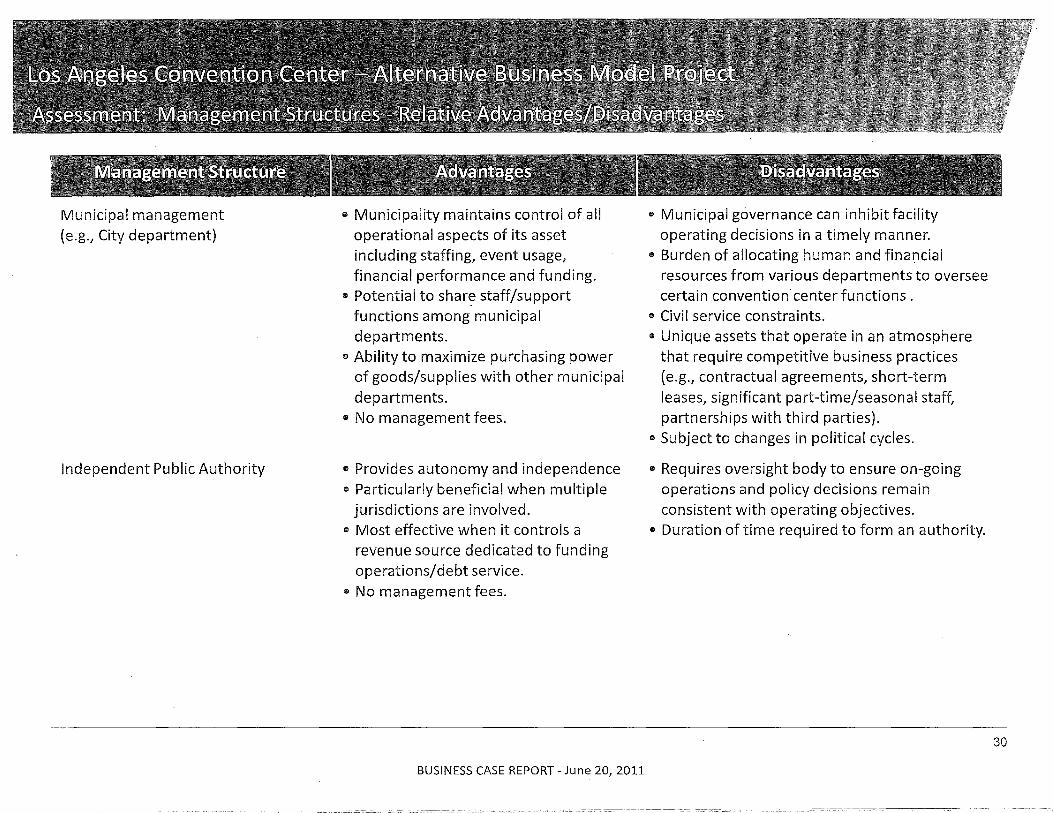
Municipal management (e.g., City department)
Independent Public Authority
OlD Municipality maintains control of all operational aspects of its asset including staffing, event usage, financial performance and funding.
OlD Potential to share staff/support functions among municipal departments.
OlD Ability to maximize purchasing power of goods/supplies with other municipal departments.
OlD No management fees.
OlD Provides autonomy and independence OlD Particularly beneficial when mUltiple
jurisdictions are involved. OlD Most effective when it controls a
revenue source dedicated to funding operations/debt service.
OlD No management fees.
BUSINESS CASE REPORT - June 20, 2011
e Municipal governance can inhibit facility operating decisions in a timely manner.
OlD Burden of allocating human and financial resources from various departments to oversee certain convention" center functions.
" Civil service constraints. e Unique assets that operate in an atmosphere
that require competitive business practices (e.g., contractual agreements, short-term leases, significant part-time/seasonal staff, partnerships with third parties).
OlD Subject to changes in political cycles.
OlD Requires oversight body to ensure on-going operations and policy decisions remain consistent with operating objectives.
e Duration of time required to form an authority.
30
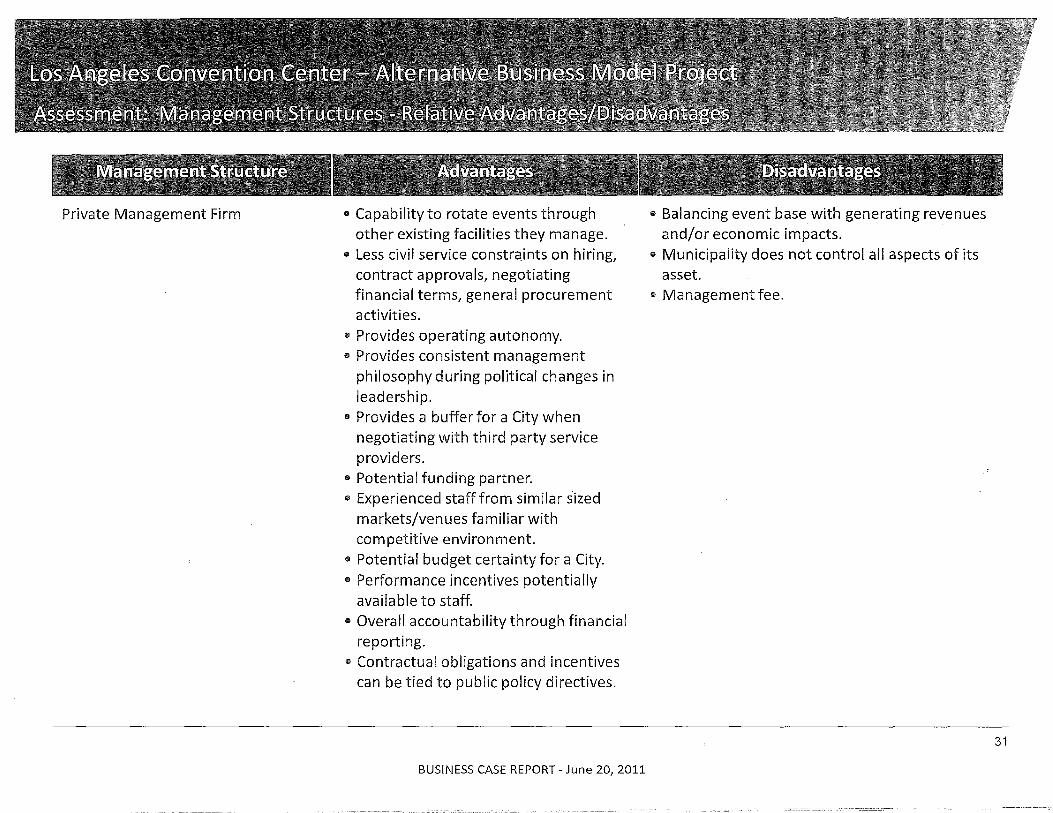
Private Management Firm CI Capability to rotate events through other existing facilities they manage.
CI Less civil service constrajnts on hiring, contract approvals, negotiating financial terms, general procurement activities.
CI Provides operating autonomy. CI Provides consistent management
philosophy during political changes in leadership.
III Provides a buffer for a City when negotiating with third party service providers.
III Potential funding partner. CI Experienced staff from similar sized
markets/venues familiar with competitive environment.
III Potential budget certainty for a City. III Performance incentives potentially
available to staff. II Overall accountability through financial
reporting. CI Contractual obligations and incentives
can be tied to public policy directives.
BUSINESS CASE REPORT - June 20, 2011
III Balancing event base with generating revenues and/or economic impacts.
CI Municipality does not control all aspects of its asset.
Ii) Management fee.
31
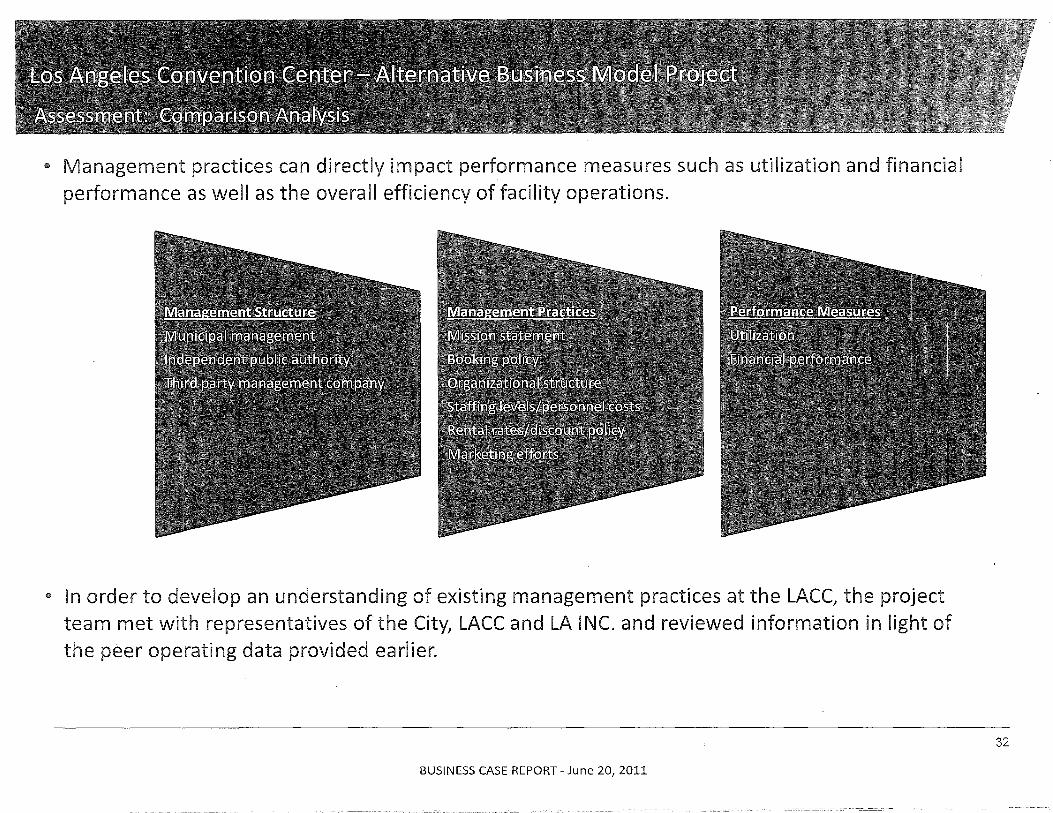
• Management practices can directly impact performance measures such as utilization and financial performance as well as the overall efficiency of facility operations.
• In order to develop an understanding of existing management practices at the LACC, the project team met with representatives of the City, LACC and LA INC. and reviewed information in light of the peer operating data provided earlier.
BUSINESS CASE REPORT - June 20, 2011
32
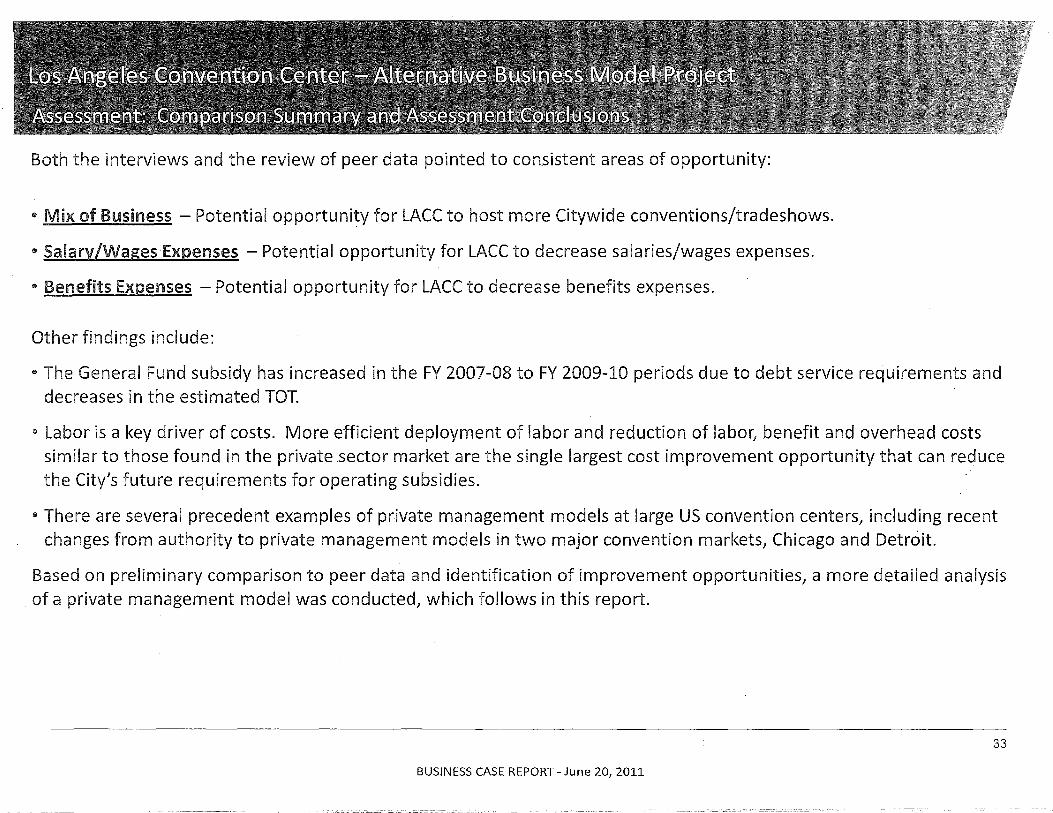
Both the interviews and the review of peer data pointed to consistent areas of opportunity:
.. Mix of Business - Potential opportunity for LACC to host more Citywide conventions/tradeshows .
.. Salary/Wages Expenses - Potential opportunity for LACC to decrease salaries/wages expenses .
.. Benefits Expenses - Potential opportunity for LACC to decrease benefits expenses.
Other findings include:
.. The General Fund subsidy has increased in the FY 2007-08 to FY 2009-10 periods due to debt service requirements and decreases in the estimated TOT .
.. Labor is a key driver of costs. More efficient deployment of labor and reduction of labor, benefit and overhead costs similar to those found in the private sector market are the single largest cost improvement opportunity that can reduce the City's future requirements for operating subsidies .
.. There are several precedent examples of private management models at large US convention centers, including recent changes from authority to private management models in two major convention markets, Chicago and Detroit.
Based on preliminary comparison to peer data and identification of improvement opportunities, a more detailed analysis of a private management model was conducted, which follows in this report.
33
BUSINESS CASE REPORT - June 20, 2011
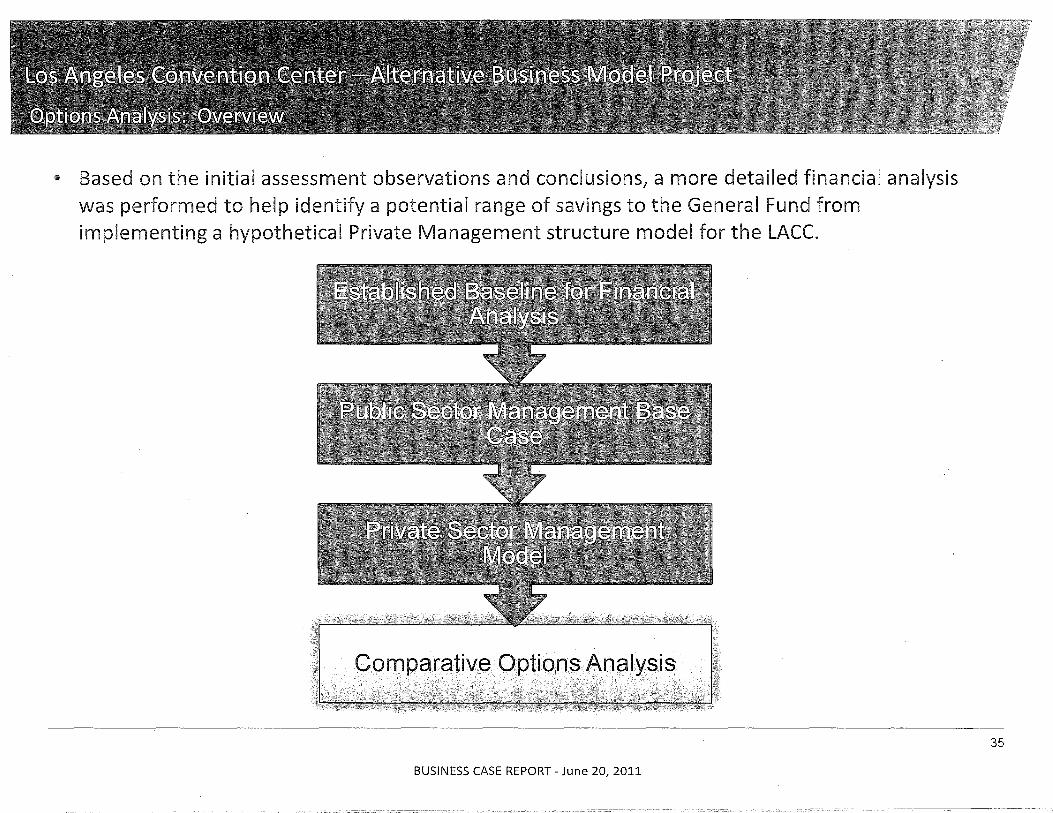
III Based on the initial assessment observations and conclusions, a more detailed financial analysis was performed to help identify a potential range of savings to the General Fund from implementing a hypothetical Private Management structure model for the LAce.
BUSINESS CASE REPORT - June 20, 2011
35
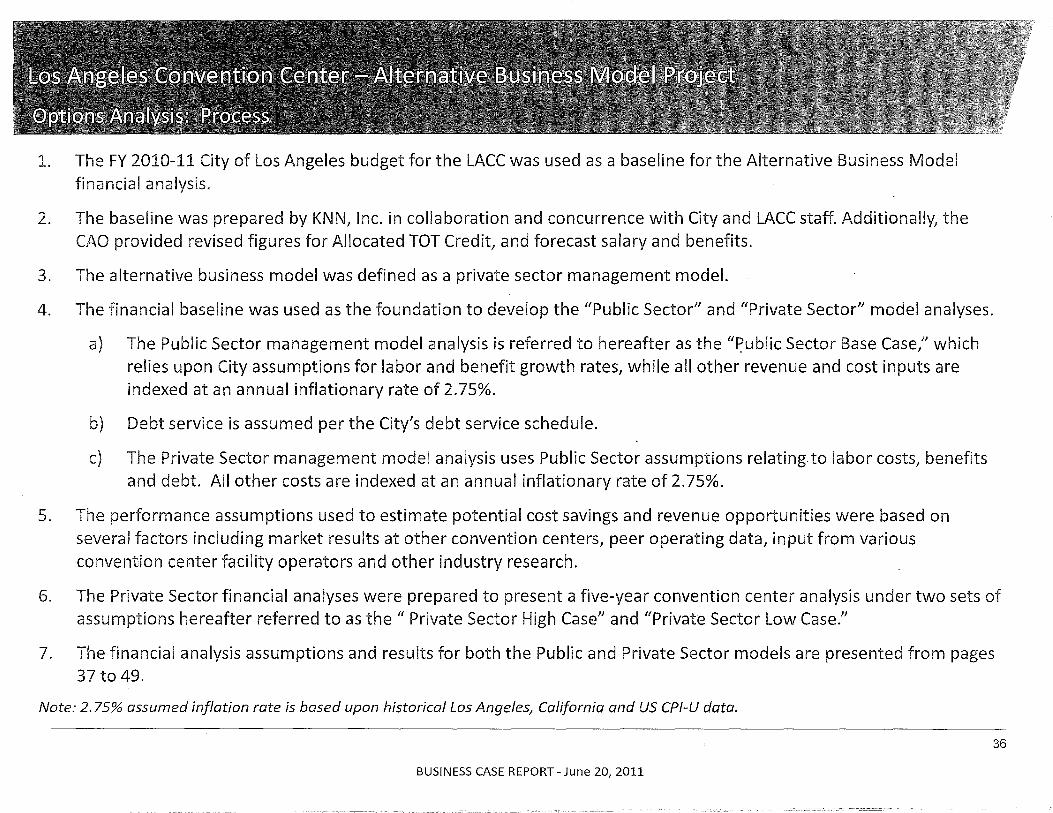
1. The FY 2010-11 City of Los Angeles budget for the LACC was used as a baseline for the Alternative Business Model financial analysis.
2. The baseline was prepared by KNN, Inc. in collaboration and concurrence with City and LACC staff. Additionally, the CAO provided revised figures for Allocated TOT Credit, and forecast salary and benefits.
3. The alternative business model was defined as a private sector management model.
4. The financial baseline was used as the foundation to develop the {{Public Sectorll and ({Private Sector" model analyses.
a) The Public Sector management model analysis is referred to hereafter as the ({~ublic Sector Base Case," which relies upon City assumptions for labor and benefit growth rates, while all other revenue and cost inputs are indexed at an annual inflationary rate of 2.75%.
b) Debt service is assumed per the City's debt service schedule.
c) The Private Sector management model analysis uses Public Sector assumptions relating to labor costs, benefits and debt. All other costs are indexed at an annual inflationary rate of 2.75%.
5. The performance assumptions used to estimate potential cost savings and revenue opportunities were based on several factors including market results at other convention centers, peer operating data, input from various convention center facility operators and other industry research.
6. The Private Sector financial analyses were prepared to present a five-year convention center analysis under two sets of assumptions hereafter referred to as the (( Private Sector High Case" and {[Private Sector Low Case."
7. The financial analysis assumptions and results for both the Public and Private Sector models are presented from pages 37 to 49.
Note: 2.75% assumed inflation rate is based upon historical Los Ange/es/ California and US CPI-U data.
36
BUSINESS CASE REPORT - June 20, 2011
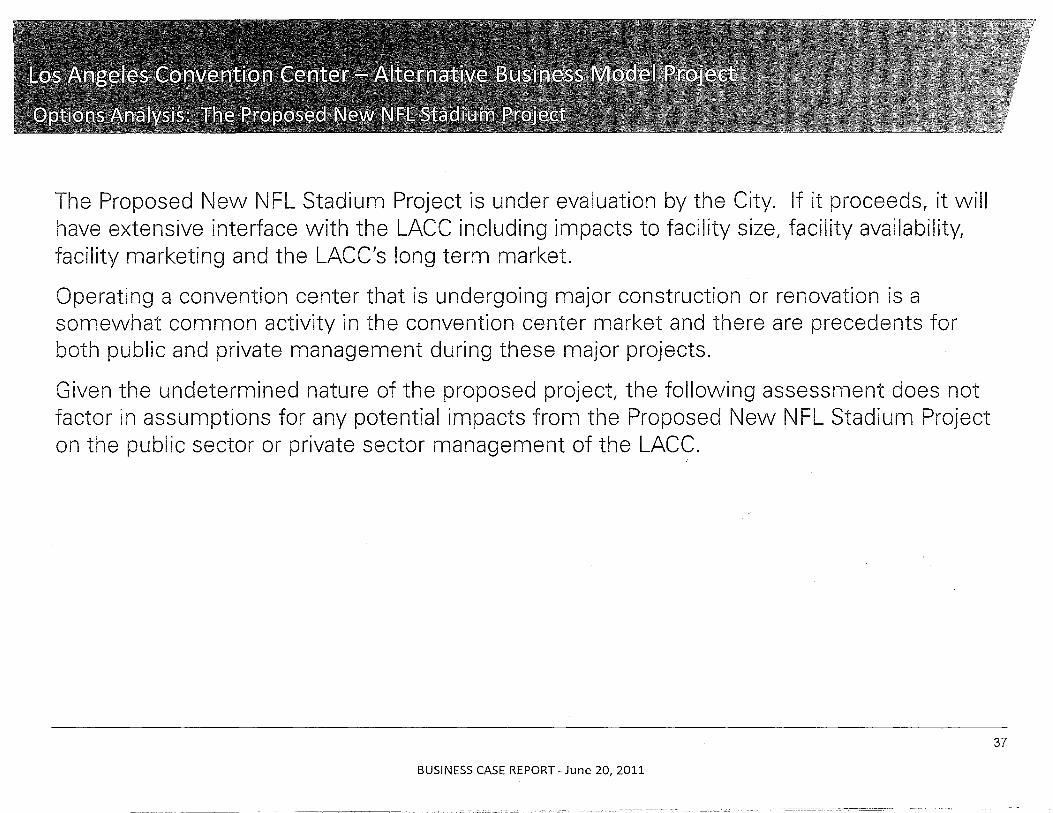
The Proposed New NFL Stadium Project is under evaluation by the City. If it proceeds, it will have extensive interface with the LACC including impacts to facility sizer facility availability, facility marketing and the LACC's long term market.
Operating a convention center that is undergoing major construction or renovation is a somewhat common activity in the convention center market and there are precedents for both public and private management during these major projects.
Given the undetermined nature of the proposed project, the following assessment does not factor in assumptions for any potential impacts from the Proposed New NFL Stadium Project on the public sector or private sector management of the LACC.
BUSINESS CASE REPORT - June 20, 2011
37
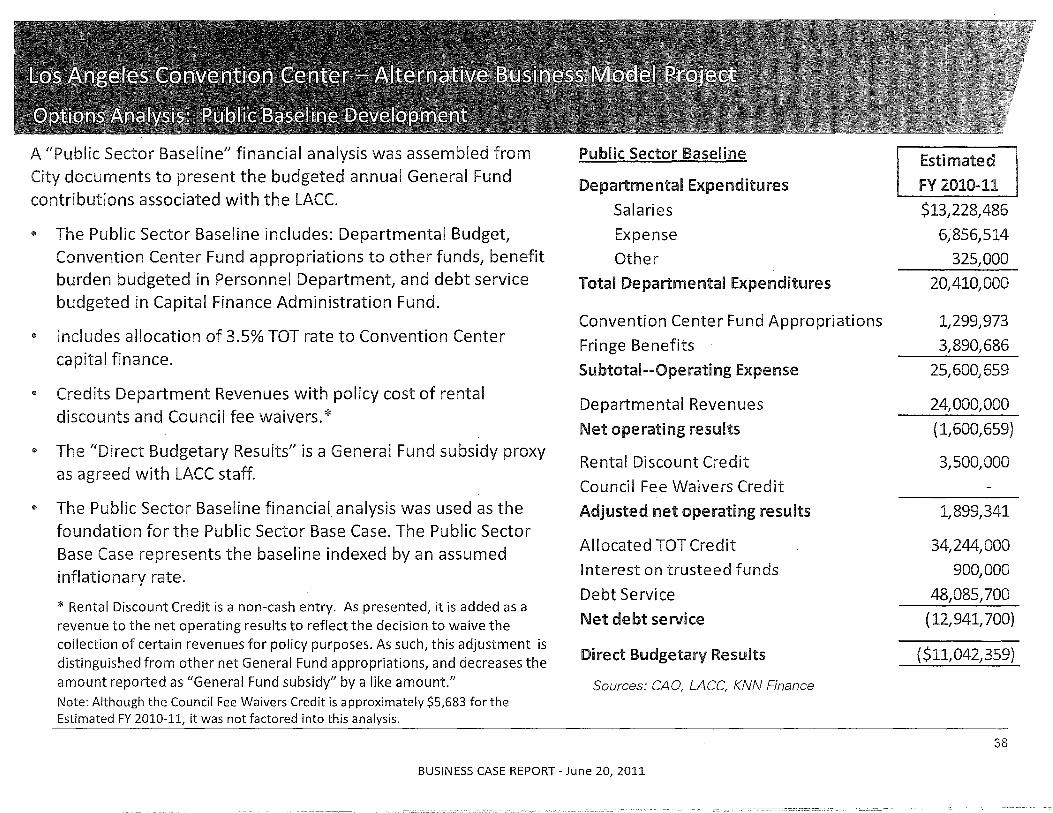
A "Public Sector Baseline" financial analysis was assembled from City documents to present the budgeted annual General Fund contributions associated with the LACe.
e The Public Sector Baseline includes: Departmental Budget, Convention Center Fund appropriations to other funds, benefit burden budgeted in Personnel Department, and debt service budgeted in Capital Finance Administration Fund.
e Includes allocation of 3.5% TOT rate to Convention Center capital finance.
e Credits Department Revenues with policy cost of rental discounts and Council fee waivers. *
<& The "Direct Budgetary Results" is a General Fund subsidy proxy as agreed with LACC staff.
e The Public Sector Baseline financial, analysis was used as the foundation for the Public Sector Base Case. The Public Sector Base Case represents the baseline indexed by an assumed inflationary rate.
* Rental Discount Credit is a non-cash entry. As presented, it is added as a revenue to the net operating results to reflect the decision to waive the collection of certain revenues for policy purposes. As such, this adjustment is distinguished from other net General Fund appropriations, and decreases the amount reported as "General Fund subsidy" by a like amount." Note: Although the Council Fee Waivers Credit is approximately $5,683 for the Estimated FY 2010-11, it was not factored into this analysis.
Public Sector Baseline
Departmental Expenditures
Salaries
Expense
Other
Total Departmental Expenditures
Convention Center Fund Appropriations
Fri nge Be nefits
Subtotal--Operating Expense
Departmental Revenues
Net operating results
Rental Discount Credit
Council Fee Waivers Credit
Adjusted net operating results
Allocated TOT Credit
Interest on trusteed funds
Debt Service
Net debt service
Direct Budgetary Results
Sources: CAD, LACC, KNN Finance
BUSINESS CASE REPORT - June 20, 2011
Estimated
FY 2010-11
$13,228,486
6;856,514
325,000
20,410,000
1,299,973
3,890,686
25,600,659
24,000,000
(1,600,659)
3,500,000
1,899,341
34,244,000
900,000
48,085,700
(12,941,700)
($11,042,359)
38
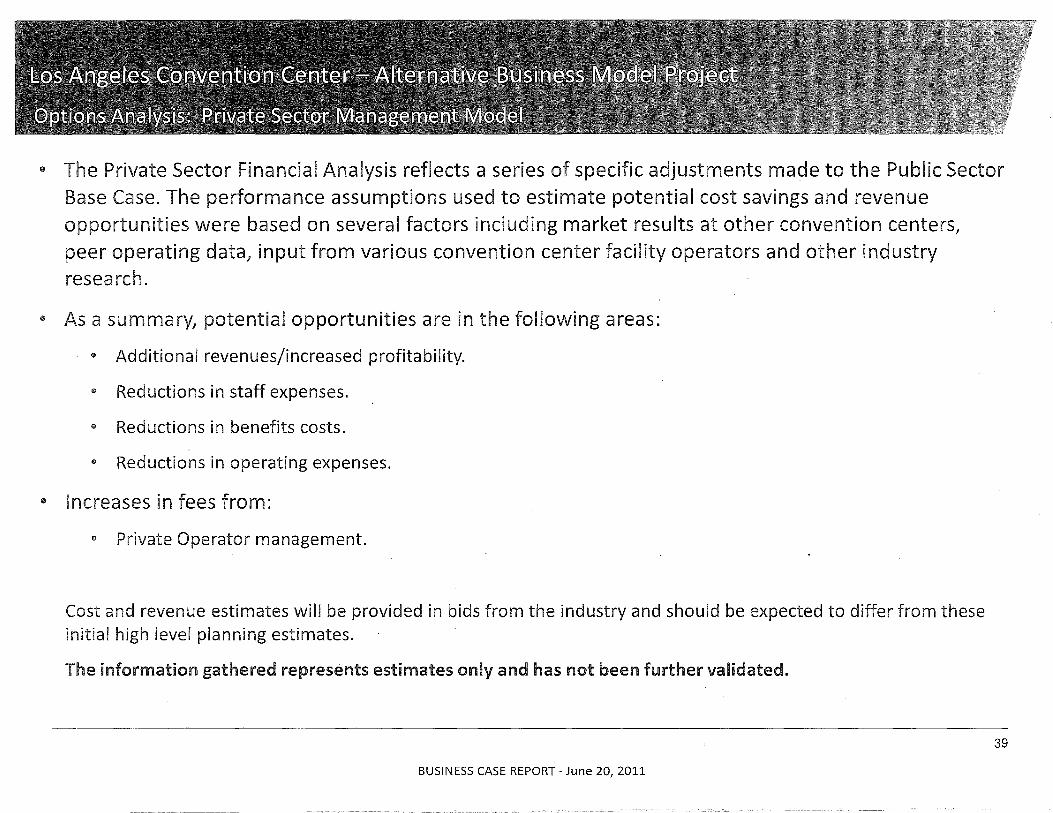
G The Private Sector Financial Analysis reflects a series of specific adjustments made to the Public Sector Base Case. The performance assumptions used to estimate potential cost savings and revenue opportunities were based on several factors including market results at other convention centers} peer operating data, input from various convention center facility operators and other industry research.
• As a summary, potential opportunities are in the following areas:
El Additional revenues/increased profitability.
El Reductions in staff expenses.
El Reductions in benefits costs.
El Reductions in operating expenses.
G Increases in fees from:
c> Private Operator management.
Cost and revenue estimates will be provided in bids from the industry and should be expected to differ from these initial high level planning estimates.
The information gathered represents estimates only and has not been further validated.
BUSINESS CASE REPORT - June 20, 2011
39
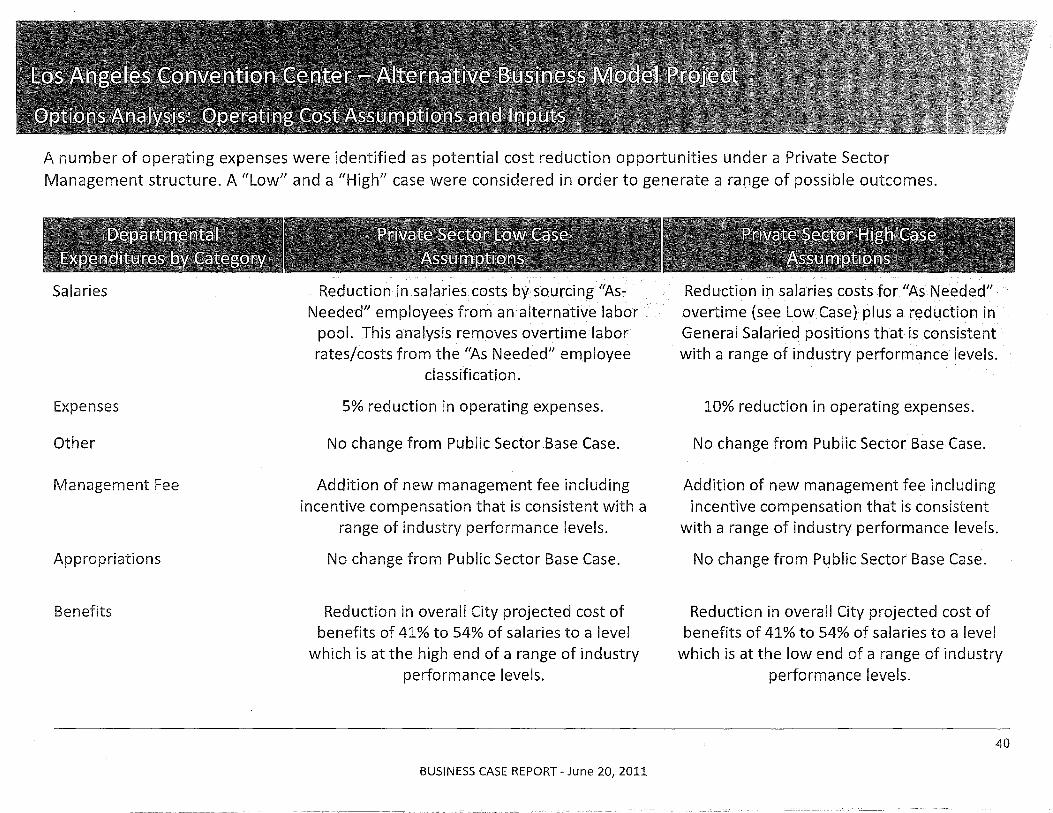
A number of operating expenses were identified as potential cost reduction opportunities under a Private Sector Management structure. A {{low" and a "High" case were considered in order to generate a range of possible outcomes.
Salaries
Expenses
Other
Management Fee
Appropriations
Benefits
Reduction in salaries costs bysourcing{{AsNeeded" employees from an alternative labor
pool. This analysis removes overtime labor rates/costs from the {{As Needed" employee
classification.
5% reduction in operating expenses.
No change from Public Sector Base Case.
Addition of new management fee including incentive compensation that is consistent with a
range of industry performance levels.
No change from Public Sector Base Case.
Reduction in overall City projected cost of benefits of 41% to 54% of salaries to a level
which is at the high end of a range of industry performance levels.
BUSINESS CASE REPORT - June 20, 2011
Reduction in salaries costs for {{As Needed" overtime (see Low Case) plus a reduction in General Salaried positions that is consistent with a range of industry performance levels.
10% reduction in operating expenses.
No change from Public Sector Base Case.
Addition of new management fee including incentive compensation that is consistent
with a range of industry performance levels.
No change from Public Sector Base Case.
Reduction in overall City projected cost of benefits of 41% to 54% of salaries to a level
which is at the low end of a range of industry performance levels.
40
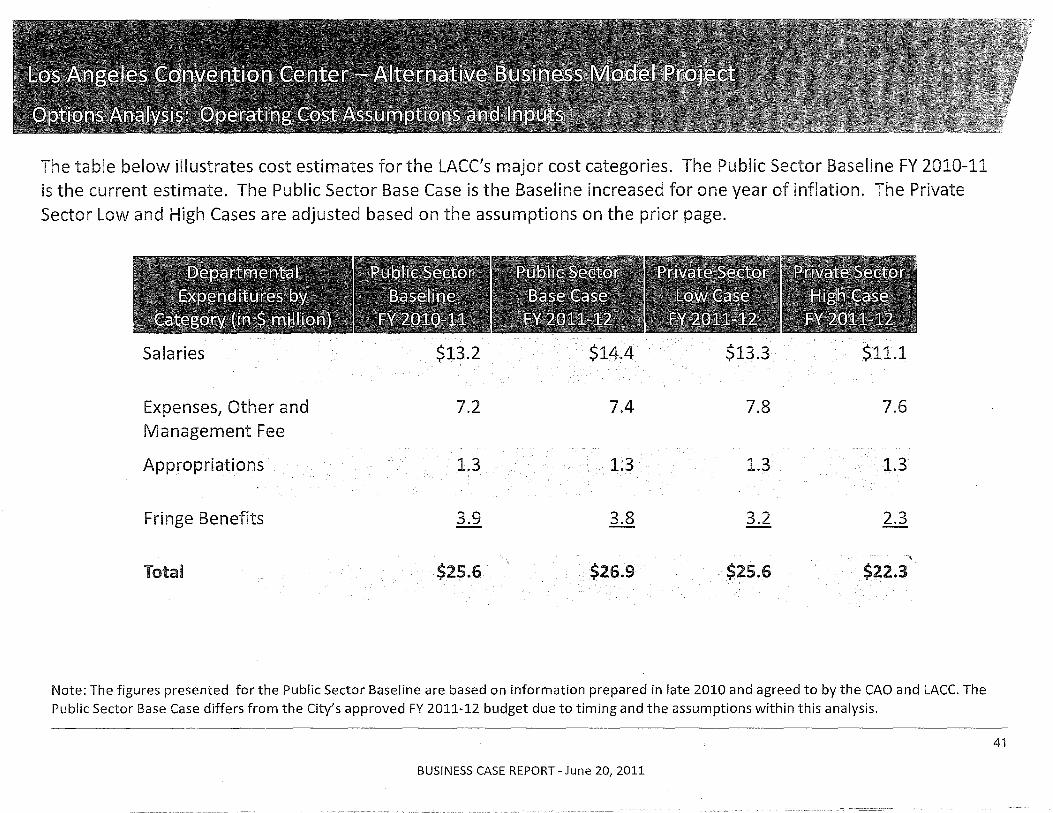
The table below illustrates cost estimates for the LACe's major cost categories. The Public Sector Baseline FY 2010-11 is the current estimate. The Public Sector Base Case is the Baseline increased for one year of inflation. The Private Sector Low and High Cases are adjusted based on the assumptions on the prior page.
Salaries $13.2 $14.4 $13.3 $11.1
Expenses, Other and 7.2 7.4 7.8 7.6 Management Fee
Appropriations 1.3 1.3 1.3 1.3
Fringe Benefits 3.9 3.8 3.2 2.3
"~"
Total $25.6 $26.9 $25.6 $22.3
Note: The figures presented for the Public Sector Baseline are based on information prepared in late 2010 and agreed to by the CAO and LACe. The Public Sector Base Case differs from the City's approved FY 2011-12 budget due to timing and the assumptions within this analysis.
BUSINESS CASE REPORT - June 20, 2011
41
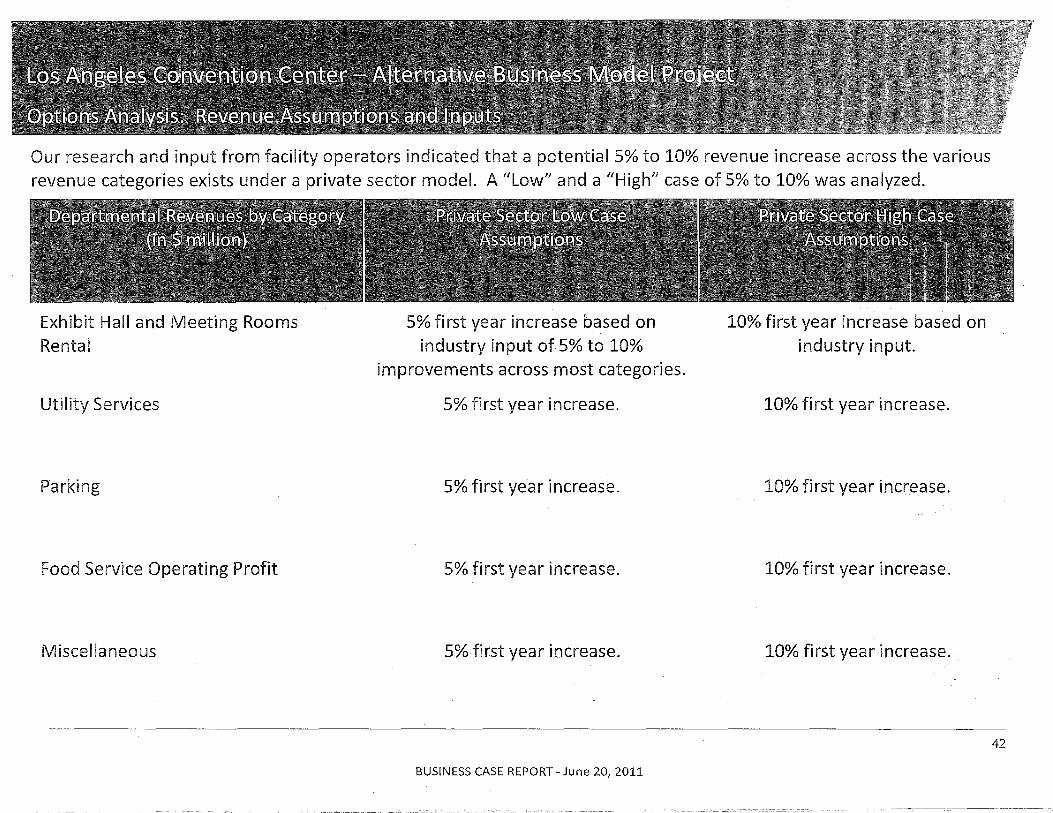
Our research and input from facility operators indicated that a potential 5% to 10% revenue increase across the various revenue categories exists under a private sector model. A /{Low" and a {[High" case of 5% to 10% was analyzed.
Exhibit Hall and Meeting Rooms Rental
Utility Services
Parking
Food Service Operating Profit
Miscellaneous
~--- ~---.-.----,.-------
5% first year increase based on industry input of 5% to 10%
improvements across most categories.
5% first year increase.
5% first year increase.
5% first year increase.
5% first year increase.
BUSINESS CASE REPORT - June 20, 2011
10% first year increase based on industry input.
10% first year increase.
10% first year increase.
10% first year increase.
10% first year increase.
42
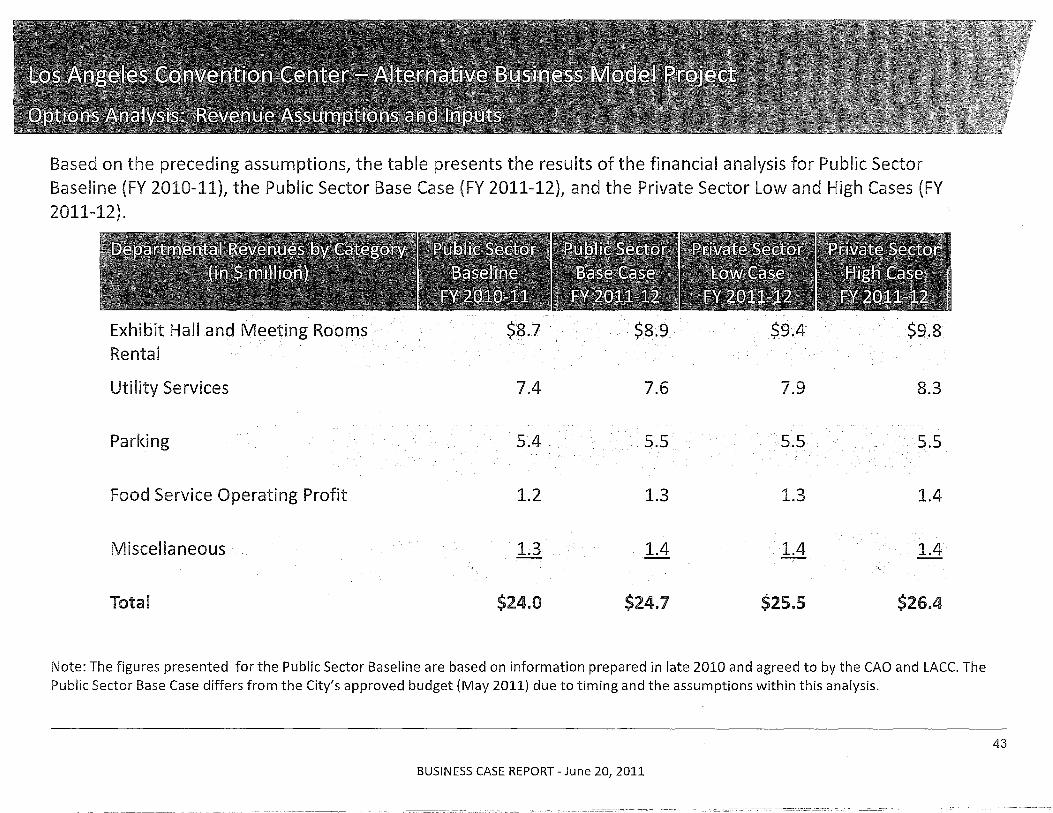
Based on the preceding assumptions, the table presents the results of the financial analysis for Public Sector Baseline (FY 2010-11), the Public Sector Base Case (FY 2011-12), and the Private Sector Low and High Cases (FY 2011-12).
Exhibit Hall and Meeting Rooms $8.7 $8.9 $9.4 $9.8 Rental
Utility Services 7.4 7.6 7.9 8.3
Parking 5.4 5.5 5.5 5.5
Food Service Operating Profit 1.2 1.3 1.3 1.4
Miscellaneous 1.3 1.4 1.4 1.4
Total $24.0 $24.7 $25.5 $26.4
Note: The figures presented for the Public Sector Baseline are based on information prepared in late 2010 and agreed to by the CAO and LACe. The Public Sector Base Case differs from the City's approved budget (May 2011) due to timing and the assumptions within this analysis.
BUSINESS CASE REPORT - June 20, 2011
43
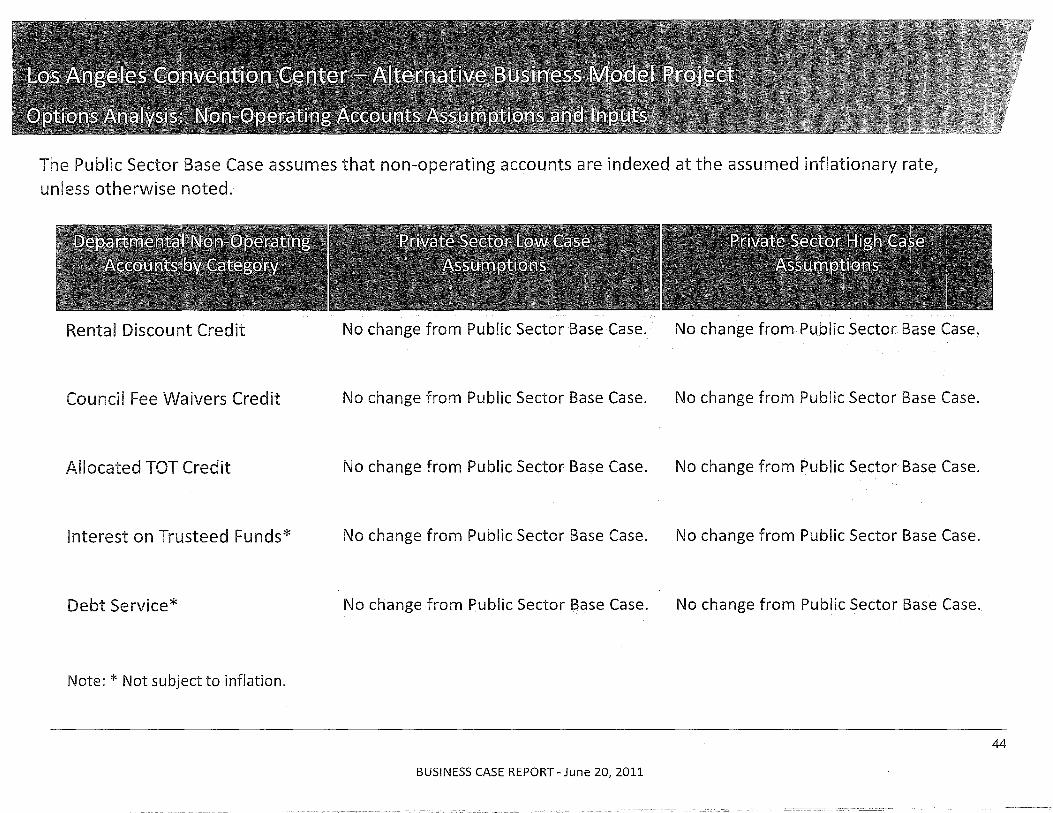
The Public Sector Base Case assumes that non-operating accounts are indexed at the assumed inflationary rate, unless otherwise noted.
Rental Discount Credit No change from Public Sector Base Case. No change from Public Sector Base Case.
Council Fee Waivers Credit No change from Public Sector Base Case. No change from Public Sector Base Case.
Allocated TOT Credit No change from Public Sector Base Case. No change from Public Sector Base Case.
interest on Trusteed Funds* No change from Public Sector Base Case. No change from Public Sector Base Case.
Debt Service* No change from Public Sector Base Case. No change from Public Sector Base Case.
Note: * Not subject to inflation.
BUSINESS CASE REPORT - June 20, 2011
44
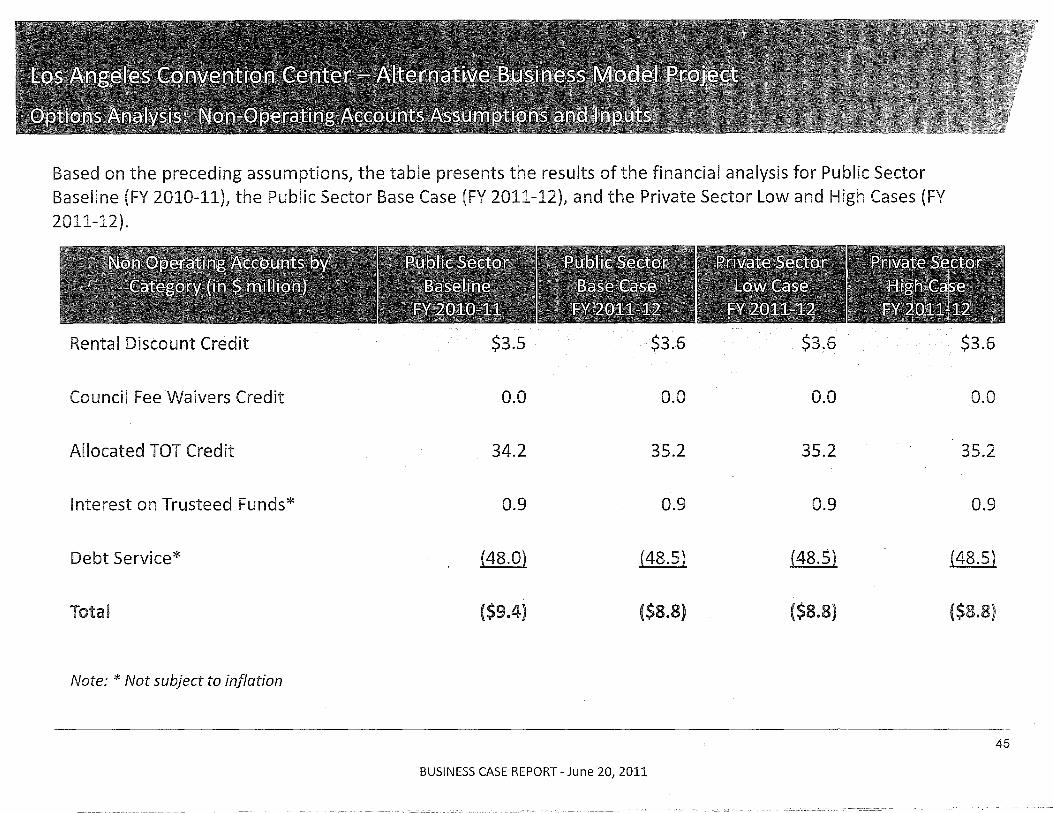
Based on the preceding assumptions, the table presents the results of the financial analysis for Public Sector Baseline (FY 2010-11L the Public Sector Base Case (FY 2011-12), and the Private Sector low and High Cases (FY 2011-12).
Rental Discount Credit $3.5 $3.6 $3.6
Council Fee Waivers Credit 0.0 0.0 0.0
Allocated TOT Credit 34.2 35.2 35.2
interest on Trusteed Funds* 0.9 0.9 0.9
Debt Service* (48.0) (48.5) (48.5)
Total ($9.4) ($8.8) ($8.8)
Note: * Not subject to inflation
BUSINESS CASE REPORT - June 20, 2011
$3.6
0.0
35.2
0.9
118.5)
($a.8)
45
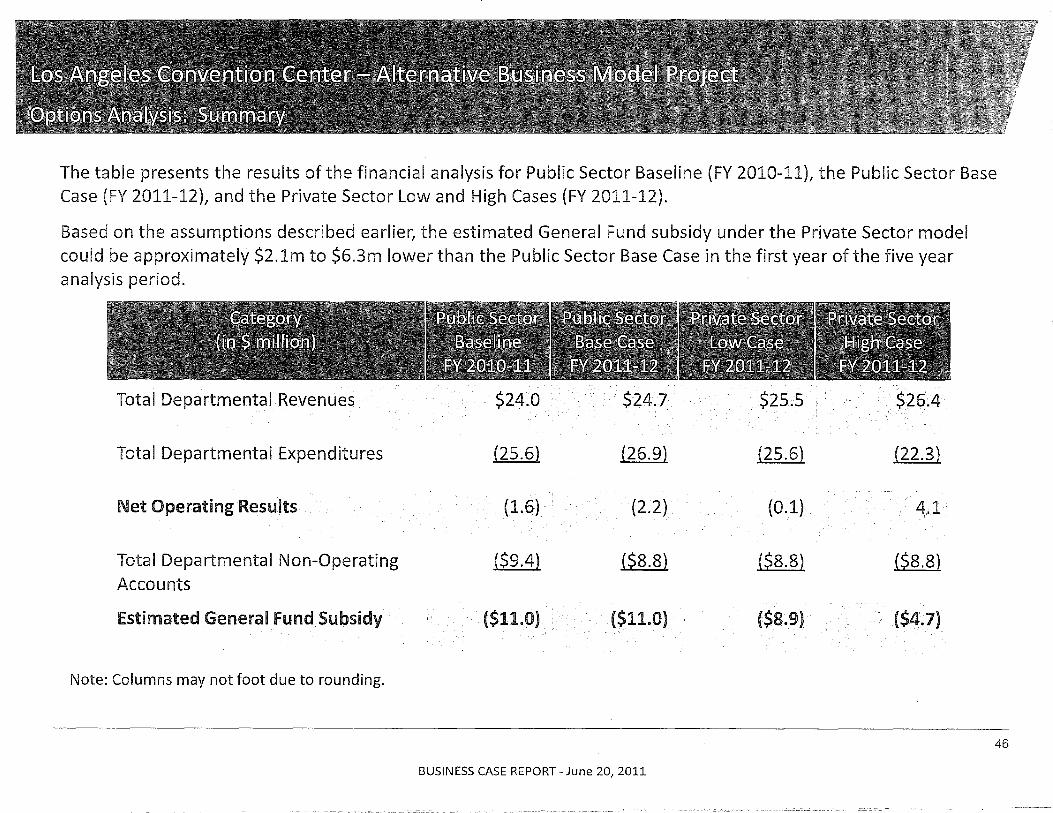
The table presents the results of the financial analysis for Public Sector Baseline (FY 2010-11), the Public Sector Base Case (FY 2011-12L and the Private Sector Low and High Cases (FY 2011-12).
Based on the assumptions described earlier, the estimated General Fund subsidy under the Private Sector model could be approximately $2.1m to $6.3m lower than the Public Sector Base Case in the first year of the five year analysis period.
Total Departmental Revenues $24.0 $24.7 $25.5 $26.4
Total Departmental Expenditures (25.6) (26.9) (25.6) (22.3)
Net Operating Results (1.6) (2.2) (0.1) 4.1
Total Departmental Non-Operating ($9.4) ($8.8) ($8.8) ($8.8) Accounts
Estimated General Fund Subsidy ($11.0) ($11.0) ($8.9) ($4.7)
Note: Columns may not foot due to rounding.
BUSINESS CASE REPORT - June 20, 2011
46
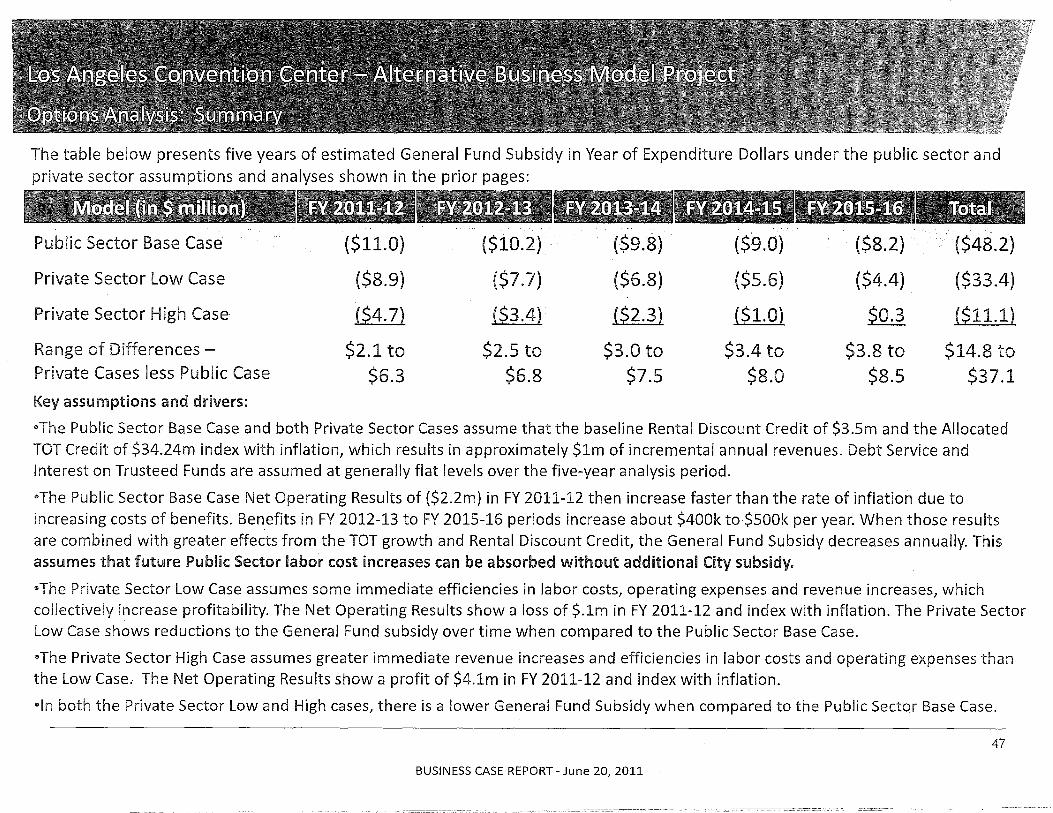
The table below presents five years of estimated General Fund Subsidy in Year of Expenditure Dollars under the public sector and private sector assumptions and analyses shown in the prior pages:
Public Sector Base Case ($11.0) ($10.2) ($9.8) ($9.0) ($8.2) ($48.2)
Private Sector Low Case ($8.9) ($7.7) ($6.8) ($5.6) ($4.4) ($33.4)
Private Sector High Case ($4.7) is:3.4) ($2.3) ($1.0) $0.3 ($11.1)
Range of Differences - $2.1 to $2.5 to $3.0 to $3.4 to $3.8 to $14.8 to Private Cases less Public Case $6.3 $6.8 $7.5 $8.0 $8.5 $37.1 Key assumptions and drivers:
-The Public Sector Base Case and both Private Sector Cases assume that the baseline Rental Discount Credit of $3.5m and the Allocated TOT Credit of $34.24m index with inflation, which results in approximately $lm of incremental annual revenues. Debt Service and Interest on Trusteed Funds are assumed at generally flat levels over the five-year analysis period.
"The Public Sector Base Case Net Operating Results of ($2.2m) in FY 2011-12 then increase faster than the rate of inflation due to increasing costs of benefits. Benefits in FY 2012-13 to FY 2015-16 periods increase about $400k to$500k per year. When those results are combined with greater effects from the TOT growth and Rental Discount Credit, the General Fund Subsidy decreases annually. This assumes that future Public Sector labor cost increases can be absorbed without additional City subsidy.
"The Private Sector Low Case assumes some immediate efficiencies in labor costs, operating expenses and revenue increases, which collectively increase profitability. The Net Operating Results show a loss of $.lm in FY 2011-12 and index with inflation. The Private Sector Low Case shows reductions to the General Fund subsidy over time when compared to the Public Sector Base Case.
"The Private Sector High Case assumes greater immediate revenue increases and efficiencies in labor costs and operating expenses than the Low Case. The Net Operating Results show a profit of $4.1m in FY 2011-12 and index with inflation.
Gin both the Private Sector Low and High cases, there is a lower General Fund Subsidy when compared to the Public Sector Base Case.
47
BUSINESS CASE REPORT - June 20, 2011
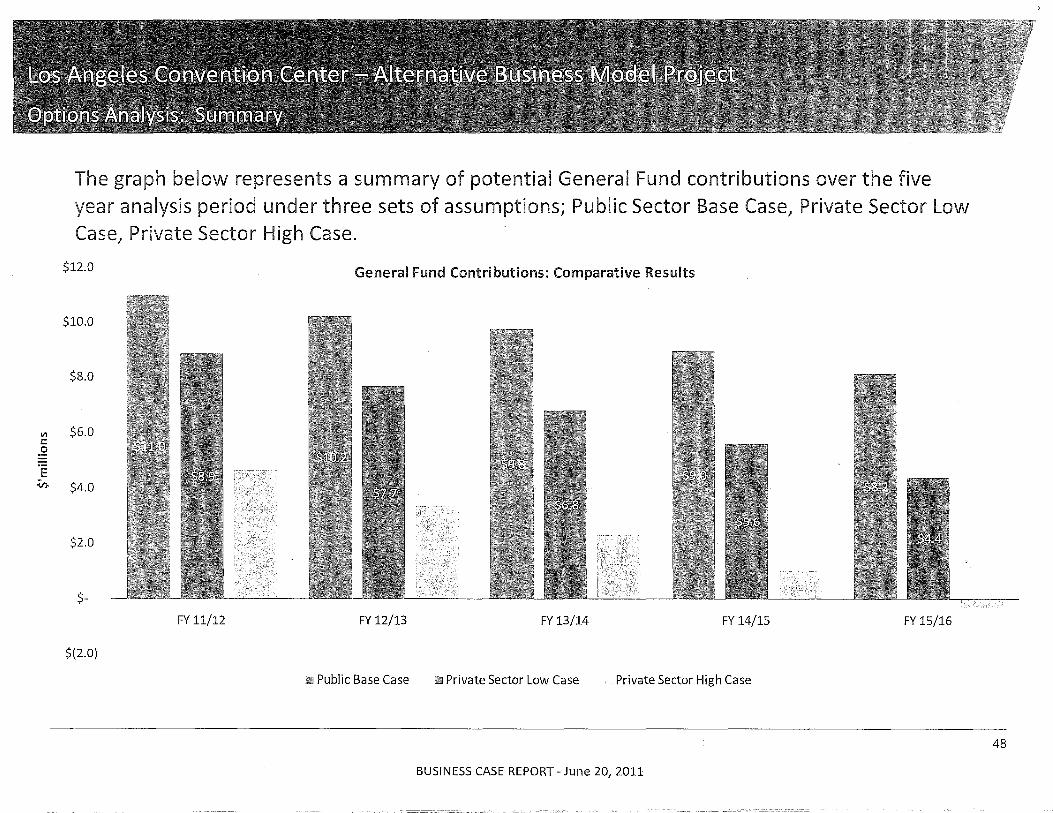
VI t: 0
'E -I/).
The graph below represents a summary of potential General Fund contributions over the five year analysis period under three sets of assumptions; Public Sector Base Case, Private Sector Low Case, Private Sector High Case.
$12.0 General Fund Contributions: Comparative Results
$10.0
$8.0
$6.0
$4.0
$2.0
$-
FY 11/12 FY 12/13 FY 13/14 FY 14/15 FY 15/16
$(2.0)
Public Base Case Private Sector Low Case Private Sector High Case
BUSINESS CASE REPORT - June 20, 2011
48
e A change to private sector management provides an opportunity to align the City's mission, business model and practices with a payment mechanism that drives performance contractually to the City's policy objectives.
€I Under any scenario, TOT increases with inflation and outpaces cost increases, which cause the estimated public subsidy to decline.
€I Under the Private Sector Low Case assumptions, the initial one time decrease in overtime rates and other costs and a one time revenue increase help reduce estimated subsidies.
€I Under the Private Sector High Case assumptions, both labor costs and labor mix are restructured providing additional benefit to operating costs which, if all other assumptions hold, may result in a significant decrease in the net City subsidy.
e Based on the financial opportunities illustrated in the analysis, moving forward with a procurement that seeks fixed bids from industry appears warranted. Such bids should be compared to similar financial results and commitments from the LACC.
BUSINESS CASE REPORT - June 20, 2011
49
As the City determines a course of action, the following factors should be addressed as part of a possible procurement:
., Clear communications about the City's strategies for the LACe's West Hall and the proposed stadium/event center. The private sector management marketpiace is highly aware of the Proposed New NFL Stadium Project. The City's strategy and how it relates to a private management of the LACC will be closely evaluated prior to determining whether to bid .
., A transition strategy and plan for employees over time .
., An estimate of the long term capital requirements of managing and maintaining the LACe.
" The level of governance and accountability that would be transferred to the facility operator.
" Legal review of City policies to enable the successful transition to private management.
" Bond counsel concurrence .
., Legal counsel concurrence.
s Payment and incentive structure options .
., A strategy and approach to market the LACC management opportunity which provides potential bidders with a clear indication that the LAce procurement is competitive.
BUSINESS CASE REPORT - June 20, 2011
51
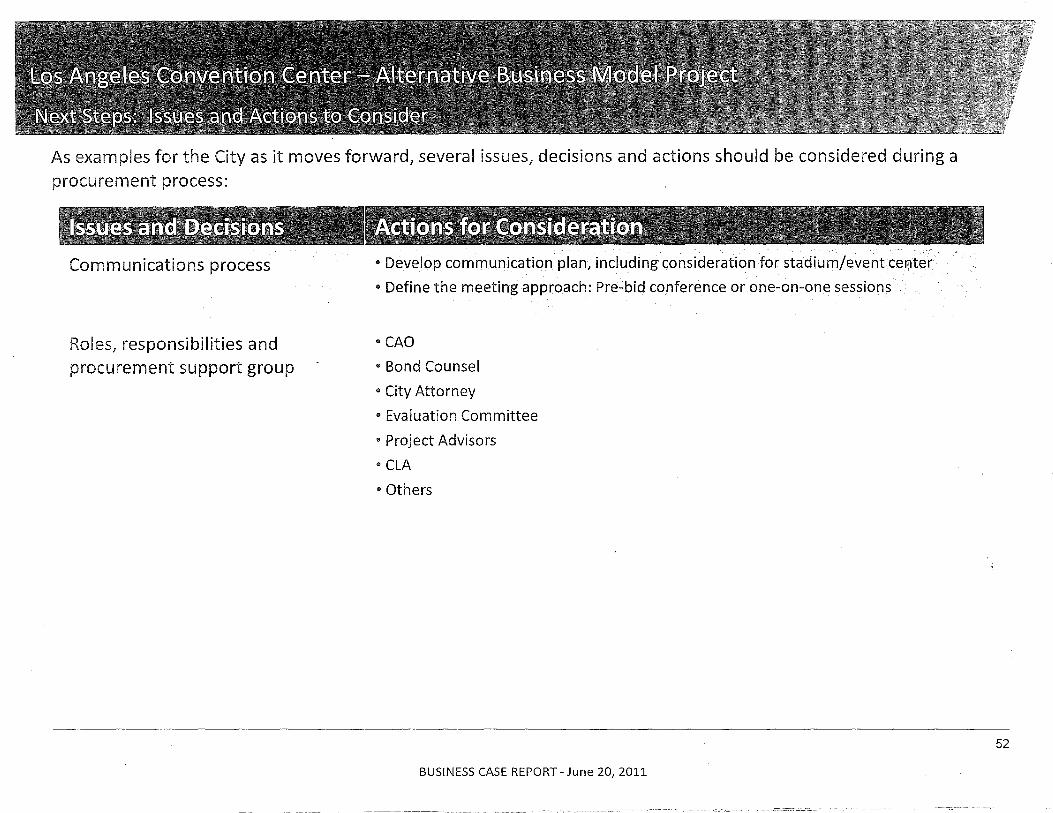
As examples for the City as it moves forward, several issues, decisions and actions should be considered during a procurement process:
Communications process
Roles, responsibilities and procurement support group
o Develop communication plan, including consideration for stadium/event center
.. Define the meeting approach: Pre.,bid conference or one-on-one sessions
-CAO
.. Bond Counsel
.. City Attorney
.. Evaluation Committee
" Project Advisors
• CLA
.. Others
BUSINESS CASE REPORT - June 20, 2011
52
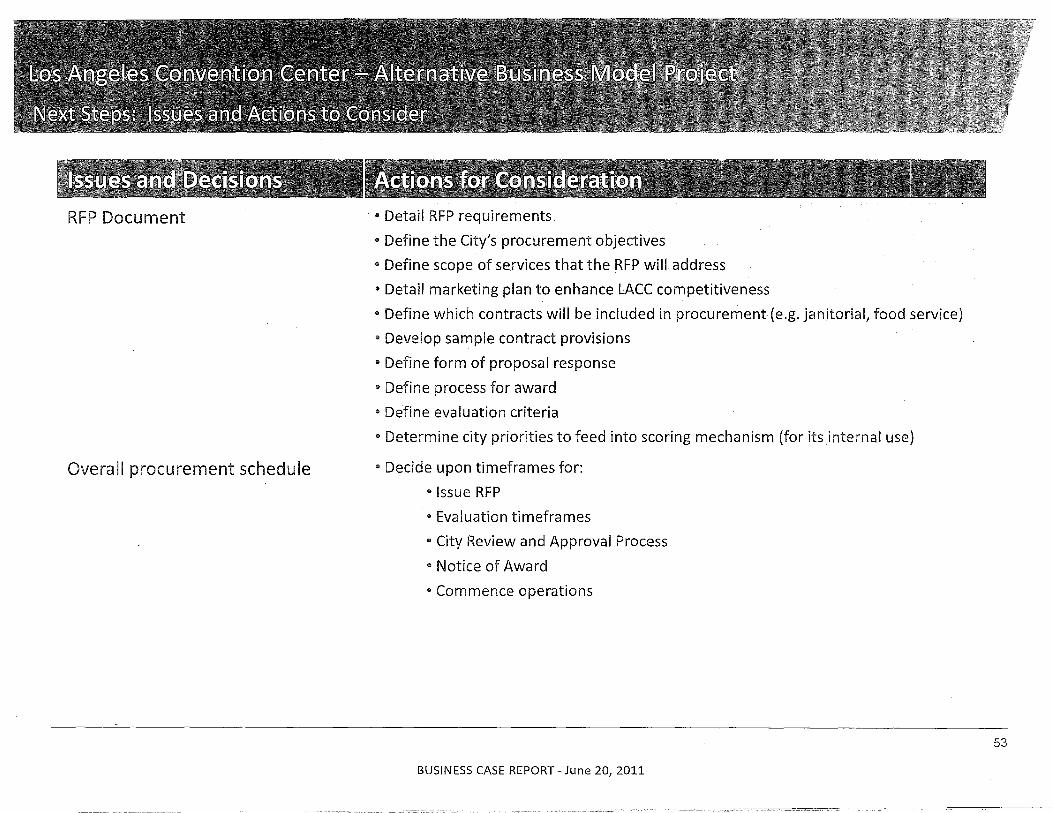
RFP Document
Overall procurement schedule
• Detail RFP requirements
e Define the City's procurement objectives
• Define scope of services that the RFP will address
" Detail marketing plan to enhance LACC competitiveness
• Define which contracts will be included in procurement (e.g. janitorial, food service)
• Developsample contract provisions
.. Define form of proposal response
" Define process for award
o Define evaluation criteria
o Determine city priorities to feed into scoring mechanism (for itsinternal use)
" Decide upon timeframes for:
" Issue RFP
" Evaluation timeframes
" City Review and Approval Process
.. Notice of Award
o Commence operations
BUSINESS CASE REPORT - June 20, 2011
53
© 2011 KPMG LLP, a Delaware limited liability partnership and a member firm of the KPMG network of independent member firms affiliated with KPMG International Cooperative ("KPMG International"), a
. Swiss entity. All rights reserved.
The KPMG name, logo and "cutting through complexity" are registered trademarks or trademarks of KPMG International Cooperative ("KPMG International").
BUSINESS CASE REPORT - June 20, 2011

ATTACHMENT 3
PERALTA GARCIA SOLUTIONS AND CROSSROADS CONSULTING SERVICES
COMPARATIVE ANALYSIS
he as for hange: The Rise of Los Angeles as a World Class Convention Destination Prepared for Miguel Santana, City Administrative Officer April 25,2012
CONSULTING SERVICES
Table of Contents
Section I: Introduction
Section II: Executive Summary
Section III: Overview of Convention Industry Trends
'" General Overview of U.S. Convention & Meetings Market '" Meeting / Convention Center Supply Trends ® Meeting / Convention Center Demand Trends
Section IV: Overview of Los Angeles Convention Center
'" LACC Competitive Position in the Convention Industry '" Summary of Current LACC Management & Governance Structure ® Resulting Impact of Current Position & Structure
Section V: The Case for Change & Transformation
'" Recommendation: Aiming Higher through Private Management
Page 3
Page 5
PageS
Page 10
Page 15
® Recommendation: Setting the Table for Transformation through New Governance
Appendices
Appendix A: Case Study: Cobo Center, Detroit, Michigan Appendix B: Case Study: McCormick Place, Chicago, Illinois
® Appendix C: Comparative Matrix with Los Angeles / Detroit / Chicago (j) Appendix D: Convention Destination Marketing Examples
Appendix E: Private Management Firms List of Development / Expansion Experience
"Change brings opportunity. "
bein
CONFIDENTIAL 2
Introduction
The City of Los Angeles ("City") has made significant investments in its convention center and supporting infrastructure over the last 40 years. From construction to expansion, marketing and on-going operations, the facility is one of the City's largest investments and its long-term ability to provide continued return is important. As the City finds itself at a critical crossroads related to the potential development of a new NFL stadium and a renovated convention center, it is essential now, more than ever, to ensure that the City is well positioned to control its tourism and hospitality destiny. In order to do so, the City will need to assess the best means of control, governance and management of its primary meeting and convention asset - the Los Angeles Convention Center ("LACC"). Whether or not the NFL stadium project comes to fruition within downtown Los Angeles, the City is still presented with an opportunity to raise the bar and fulfill its potential to become a world-class convention destination. Los Angeles already has a strong fundamental framework in place to serve as a top convention destination. By making management and governance improvements, Los Angeles can propel itself to the next level within this specialized and competitive industry. Without question there are gaps within the City's framework that currently prevent it from residing in the top tier of convention destination. By shoring up and strengthening the City's control over the convention center and the collaborative relationship with its partners, it will begin to operate from a position of strength in controlling its convention and hospitality potential on behalf of its constituents and stakeholders.
There are two relevant questions at hand:
(1) Where specifically are the gaps within the City's convention and hospitality framework that prevent it from being a top tier convention destination?
and
(2) What are the specific opportunities and proactive steps the City can take to fill the gaps so it can effectively compete among top convention destinations in the future?
The answers to these questions are not predicated upon a new NFL stadium or a renovated convention center, although both of those occurrences would be welcome for certain. Rather, they are compulsory of a City that already sees itself as an important domestic and international visitor and convention destination and that is prepared to take the next steps to avail itself to a recovering economy with growing demand for convention and meetings business. In fact, understanding the gaps and successfully filling them are essential as part of the City's strategic plan to grow and improve the LACC's economic benefits while fully realizing the maximum savings and revenue production for the City.
The City has the unique opportunity to bring together all of the convention and hospitality industry stakeholders that comprise the holistic solution that define successful convention cities. As other cities have established and shown, it is well within the realm of Los Angeles' stewardship to rid itself of competing interests within its current
CONFIDENTIAL 3
framework and to move forward with a universal approach that includes common goals and objectives across all stakeholder groups - the convention center, the convention and tourism bureau, hotels, restaurants, economic development groups, and others. The City is in the best position to serve as the director and unifier of all interests and to encapsulate these interests ensuring that the City at large benefits from these efforts.
This report focuses on and suggests two preliminary steps to set Los Angeles on the path toward improved competitive positioning.
@ The first is the continued analysis and compelling business to privatize the operation and management of the LACC.
@ The second is the complete overhaul and reorganization of the governance structure responsible for setting the vision and steering the ship of the convention industry in Los Angeles.
By bolstering and strengthening both of these fundamental principles, the City will position itself to welcome the challenges and opportunities that come with a new NFL stadium, an eventual economic turnaround, and new-found demand for sophisticated urban experiences by business travelers. In order to deliver the more specific components that must be in place for a true world-class convention city, there first must be in place the management and governance framework that can drive the necessary changes to deliver the transformation of Los Angeles.
CONFIDENTIAL 4
Executive Summa
Our research of the LACC and broader convention industry has led to the following primary findings.
<!> Significant investments have been made in recent years to the area surrounding the LACC including development of Staples Center, L.A. Live, the JW Marriott and Ritz Carlton hotels.
\\> Since 1993 the LACC has undergone relatively limited changes to its building program, governance, management and/or marketing strategy.
<!> The convention/meeting industry has undergone significant changes in the past two decades making it a highly competitive market place.
<!> Successful convention centers have actively pursued improvements to their supporting destination amenities, business structures and/or strategies to enhance their competitive positions.
\\> Despite current economic conditions, several industry sources project improvement in the convention/meeting industry. Thus, the timing is ripe for the City to prepare the LACC to improve its future competitive position.
Streamlining the LACC's governance can improve accountability and performance that could be achieved through an Authority structure similar to that utilized in Chicago and Detroit.
<I> Transferring LACC to private management can improve its competitive position, operating subsidy, general fund requirements, and economic and fiscal impacts including room night generation, transient occupancy tax revenues as well as other tax revenues.
fI} Private management is a clear indication to the convention and exhibition industry that Los Angeles intends to be a major competitor.
Because the information presented in the executive summary is extracted from the more detailed analysis, it is important for the reader to review the report in its entirety in order to gain a better understanding of the research, methodology and assumptions used.
CONFIDENTIAL 5
Convention Industry Trends
General Overview of U.S. Convention & Meetings Market
Over the last 20 years, the U.S. convention and meetings market experienced tremendous growth in the supply of exhibit and meeting space through both new construction and expansion. This increased supply led to a more competitive marketplace where numerous facilities can accommodate meeting planners' needs strictly in terms of the amount of space required.
The increase in supply combined with broader economic conditions such as higher unemployment, increased costs associated with travel and lower corporate returns has resulted in a downward trend in overall demand for convention and meeting space in recent years. However, the current environment provides an edge to those facilities located in destinations offering an attractive amenities package and proximate to a broad industry base of conventions and meetings hosted for a variety of geographic segments (Le., State, regional, national or international).
As a point of reference, the site selection criteria that meeting planners consider very important include the following:
oj) Availability of hotels or other facilities suitable for meetings <l> Affordability of destination <l> Safety and security of destination @ Ease of transporting attendees to/from location @ Distance traveled by attendees
There is no single source that measures the strength and performance of the convention and meetings industry. The breadth of facility types and geographic locations coupled with the variety of event types and sizes makes the ability to succinctly account for the entire industry's current or future position difficult. However, this section presents data that represents the leading and most comprehensive sources available including Center for Exhibition Industry Research (CEIR), Meeting Professionals International (MPI), Professional Convention Management Association (PCMA), Red 7 Media Research and Consulting, Standard & Poor's (S&P), and Destination Marketing Association International (DMAI).
Convention/Meeting Space Supply Trends
As shown in Graph 1.1 below, the convention center building boom peaked in 2002 and 2003 with gross SF annual growth exceeding 6.5% each year.
Graph 1.1 Supply of Convention Center Space - Millions of Gross SF
CONFIDENTIAL 6
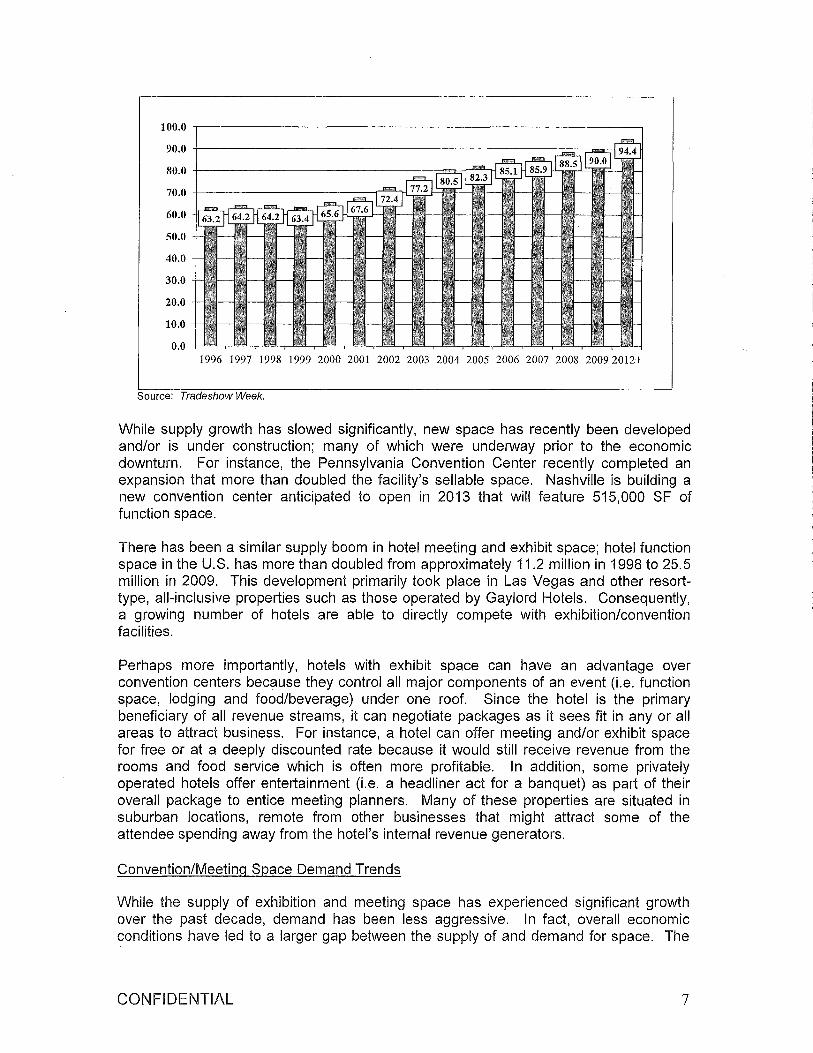
100.0 -r----------------------------,
90.0 +-----------------------==--="""":-1
80.0 +--------------~;lI:::_f-""""'r_l
70.0 -t--------------r":""-:rt
60.0
50.0
40.0
30.0
20.0
10.0
0.0 1996 1997 1998 1999 2000 2001 2002 2003 2004 2005 2006 2007 2008 20092012+
Source: Tradeshow Week.
While supply growth has slowed significantly, new space has recently been developed and/or is under construction; many of which were underway prior to the economic downturn. For instance, the Pennsylvania Convention Center recently completed an expansion that more than doubled the facility's sellable space. Nashville is building a new convention center anticipated to open in 2013 that will feature 515,000 SF of function space.
There has been a similar supply boom in hotel meeting and exhibit space; hotel function space in the u.S. has more than doubled from approximately 11.2 million in 1998 to 25.5 million in 2009. This development primarily took place in Las Vegas and other resorttype, all-inclusive properties such as those operated by Gaylord Hotels. Consequently, a growing number of hotels are able to directly compete with exhibition/convention facilities.
Perhaps more importantly, hotels with exhibit space can have an advantage over convention centers because they control all major components of an event (Le. function space, lodging and food/beverage) under one roof. Since the hotel is the primary beneficiary of all revenue streams, it can negotiate packages as it sees fit in any or all areas to attract business. For instance, a hotel can offer meeting and/or exhibit space for free or at a deeply discounted rate because it would still receive revenue from the rooms and food service which is often more profitable. In addition, some privately operated hotels offer entertainment (Le. a headliner act for a banquet) as part of their overall package to entice meeting planners. Many of these properties are situated in suburban locations, remote from other businesses that might attract some of the attendee spending away from the hotel's internal revenue generators.
Convention/Meeting Space Demand Trends
While the supply of exhibition and meeting space has experienced significant growth over the past decade, demand has been less aggressive. In fact, overall economic conditions have led to a larger gap between the supply of and demand for space. The
CONFIDENTIAL 7
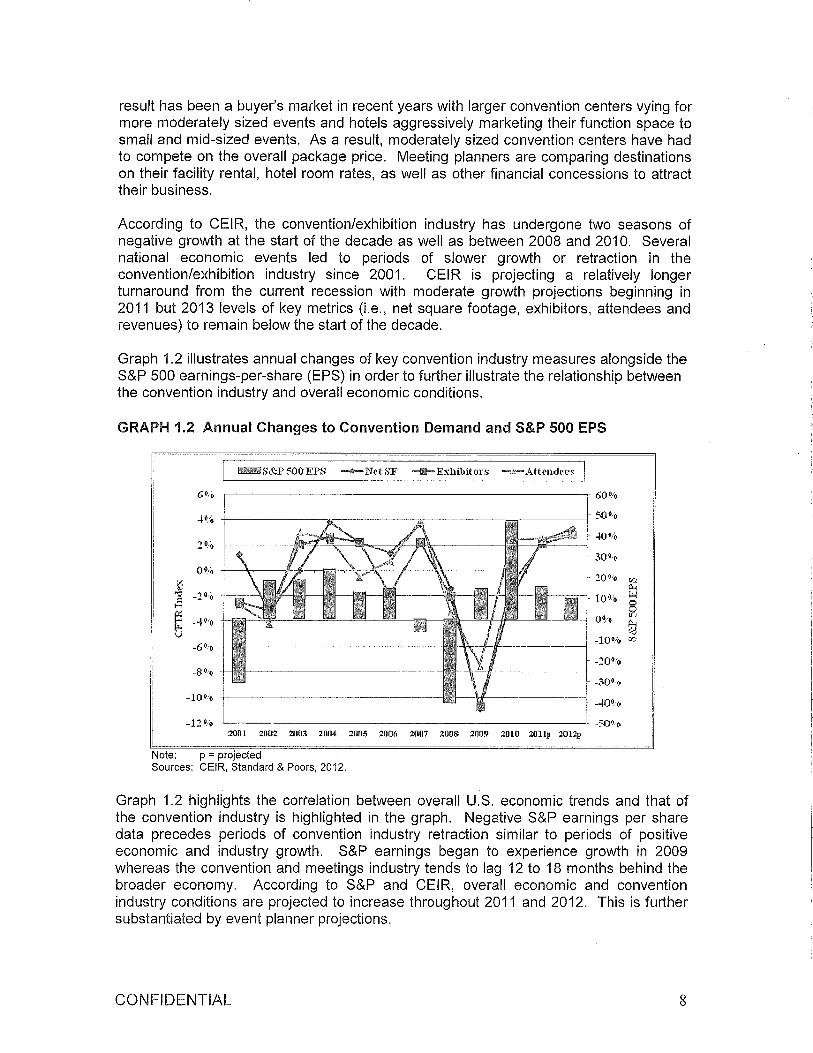
result has been a buyer's market in recent years with larger convention centers vying for more moderately sized events and hotels aggressively marketing their function space to small and mid-sized events. As a result, moderately sized convention centers have had to compete on the overall package price. Meeting planners are comparing destinations on their facility rental, hotel room rates, as well as other financial concessions to attract their business.
According to CEIR, the convention/exhibition industry has undergone two seasons of negative growth at the start of the decade as well as between 2008 and 2010. Several national economic events led to periods of slower growth or retraction in the convention/exhibition industry since 2001. CEIR is projecting a relatively longer turnaround from the current recession with moderate growth projections beginning in 2011 but 2013 levels of key metrics (i.e., net square footage, exhibitors, attendees and revenues) to remain below the start of the decade.
Graph 1.2 illustrates annual changes of key convention industry measures alongside the S&P 500 earnings-per-share (EPS) in order to further illustrate the relationship between the convention industry and overall economic conditions.
GRAPH 1.2 Annual Changes to Convention Demand and S&P 500 EPS
~S&P500EPS --Net SF ___ Exhibitors -"'~AtteJldees
6 0 0
-1%
~ 0.· _ .0
0°/. :.1 ... '" -1% .:1 ~
_-1°·0 I-i r..I v
-6%
-8°~
-10°0
-l::!0o -L-___________________ -----'
:2001 2002 2003 2004 :2005 2006 2007 2008 2009 2010 2011p 2012p
Note: p = projected Sources: CEIR, Standard & Poors, 2012.
Graph 1.2 highlights the correlation between overall U.S. economic trends and that of the convention industry is highlighted in the graph. Negative S&P earnings per share data precedes periods of convention industry retraction similar to periods of positive economic and industry growth. S&P earnings began to experience growth in 2009 whereas the convention and meetings industry tends to lag 12 to 18 months behind the broader economy. According to S&P and CEIR, overall economic and convention industry conditions are projected to increase throughout 2011 and 2012. This is further substantiated by event planner projections.
CONFIDENTIAL 8
Summary
Over the last 20 years, the U.S. convention and meetings market experienced tremendous growth in the supply of exhibit and meeting space through both new construction and expansion. This increased supply led to a more competitive marketplace where numerous facilities can accommodate meeting planners' needs strictly in terms of the amount of space required. Industry trends suggest that facilities located in destinations offering an attractive package in terms of overall appeal, hotel supply, accessibility, and cost have been better able to maintain, grow and/or diversify their business during challenging economic times.
Similar to the broader economy, the convention and meetings industry has experienced a downturn in recent years. However, several sources are projecting positive economic and industry growth in key metrics such as attendance, planner budgets, spending per meeting and the number of meetings. While convention/meetings industry demand trends have generally correlated to those of the broader economy, there tends to be lag of between 12 and 18 months.
CONFIDENTIAL 9
Overview of the Los Angeles Convention Center Hospitality Market
The visitor and convention industry is an important contributor to Los Angeles' local economy. Visitor spending generates significant economic impact through expenditures on accommodations, entertainment, dining, and transportation services. This spending generates economic benefits across a variety of fronts ranging from direct government revenues to impact on cultural and entertainment attractions in the area. In 2011, Los Angeles experienced the largest number of visitors and spending in the history of the City. A total of approximately 26.9 million people visited Los Angeles, which represents an increase of 4.2 percent more overnight visitors than in 2010. Tourist spending rose as well with visitors accounting for $15.2 billion in expenditures - an 8 percent increase from the previous year. These numbers evidence the significant impact and importance of visitors to the City.
One of the drivers of visitors to Los Angeles is the convention center, which brings over one million visitors per year to the downtown area. Convention centers are typically conceived and built to support economic growth and development while providing a venue for meetings, conventions, trade shows, public shows and other local activities. Because their underlying development and operations typically involve taxpayer investment, benefits are measured in terms of out-of-town visitors, occupied hotel room nights, incremental taxes, and sales. Therefore, the success of a convention center is typically measured by its ability to generate economic benefit for the community by attracting regional and national convention business.
los Angeles' Competitive Position in the Convention Industry
Today, the LACC contains approximately 720,000 square feet of exhibit hall space and approximately 147,000 square feet of meeting room space, totaling approximately 867,000 square feet of functional space. It is located in the heart of a vibrant event and entertainment area in downtown Los Angeles in close proximity to the following:
<!l Staples Center, a world-class arena and home of four professional sports franchises adjacent to the LACC and was opened in 1999.
<!l L.A. LIVE, adjacent to the LACC, and opened in 2008 and has significantly enhanced the restaurants and entertainment options near the LACC.
@ The JW Marriott and Ritz Carlton hotels at LA Live opened in 2010 and added significant new hotel supply across the street from the LACC.
Competition among convention locations and cities is fierce. Due to the potential for significant economic impact; meetings, conventions and trade shows have become a highly sought after means to spur economic development and to drive direct and indirect revenues to a city. Throughout North America cities wishing to increase their share of the convention market have expanded and upgraded exhibit and meeting space. At the same time, there has been an increase in the sophistication of the industry. Convention organizers are well aware of the economic benefits attached to the convention activity
CONFIDENTIAL 10
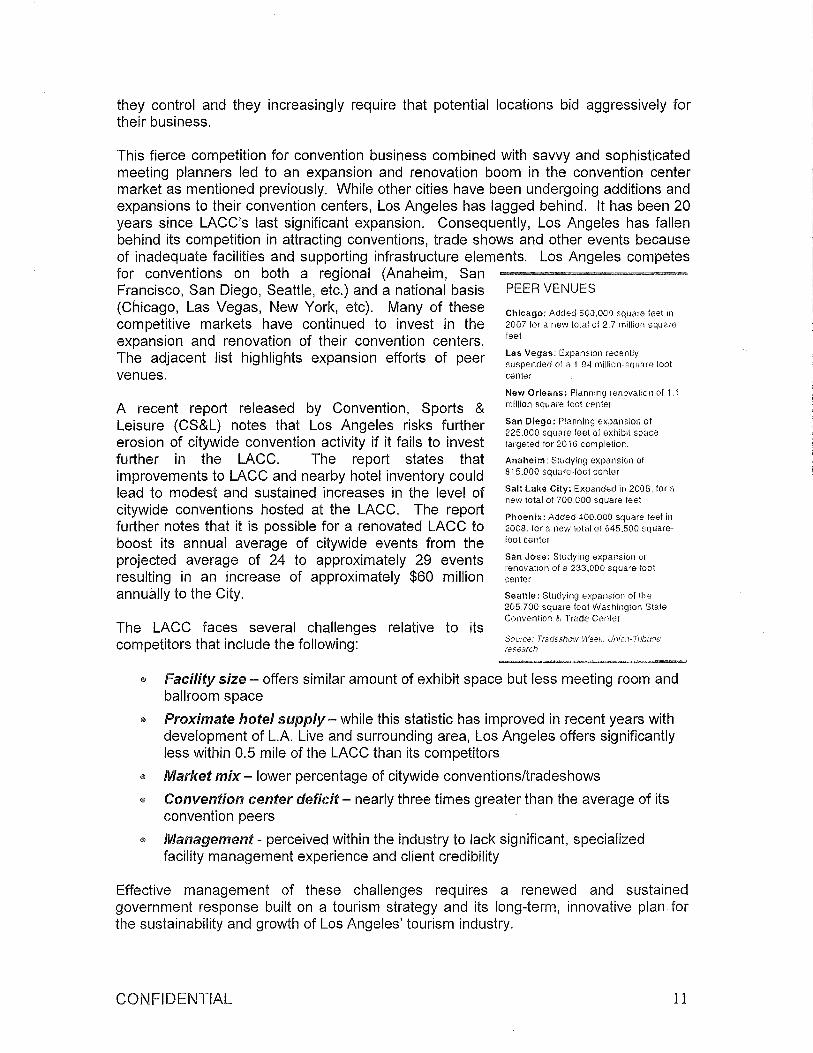
they control and they increasingly require that potential locations bid aggressively for their business.
This fierce competition for convention business combined with savvy and sophisticated meeting planners led to an expansion and renovation boom in the convention center market as mentioned previously. While other cities have been undergoing additions and expansions to their convention centers, Los Angeles has lagged behind. It has been 20 years since LACC's last significant expansion. Consequently, Los Angeles has fallen behind its competition in attracting conventions, trade shows and other events because of inadequate facilities and supporting infrastructure elements. Los Angeles competes for conventions on both a regional (Anaheim, San Francisco, San Diego, Seattle, etc.) and a national basis PEER VENUES
(Chicago, Las Vegas, New York, etc). Many of these ChIcago; Added 500,000 square feet in
competitive markets have continued to invest in the 2007 for a ne\'J total at 2.7 million square
expansion and renovation of their convention centers. feet
Th d· t I" t h' hI" ht . ff rt f Las Vegas: Expansion recently e a jacen IS Ig Ig S expansion e 0 s 0 peer suspended ot a t .94 million-square foot
venues. wn~
A recent report released by Convention, Sports & Leisure (CS&L) notes that Los Angeles risks further erosion of citywide convention activity if it fails to invest further in the LACC. The report states that improvements to LACC and nearby hotel inventory could lead to modest and sustained increases in the level of citywide conventions hosted at the LACC. The report further notes that it is possible for a renovated LACC to boost its annual average of citywide events from the projected average of 24 to approximately 29 events resulting in an increase of approximately $60 million annually to the City.
The LACC faces several challenges relative to its competitors that include the following:
New Orleans; Planning renovation of 1 1 million square loot center
San Diego: Planning expansion of 225.000 square feet of exhibit space targeted for 201 G completion.
Anaheim: Studying expansion of 815.000 square-foot center
Salt Lake CIty: Expanded in 2006. for a new total of 700.000 square feet
Phoenix: Added 400.000 square teet in 2008. for a new total 01 645.500 squarefoot center
San Jose: Stuc!'iing expansion or renovation of a 233,000 square foot center
Seattle: Studying expansion of the 205.700 square (oot Washington State Convention 8, Trade Center
SourCe: Tradeshol'l V,leef: Uri/on- T.ribune rt?S8arC!1
€I Facility size - offers similar amount of exhibit space but less meeting room and ballroom space
<I> Proximate hotel supply - while this statistic has improved in recent years with development of L.A. Live and surrounding area, Los Angeles offers significantly less within 0.5 mile of the LACC than its competitors
® Market mix - lower percentage of citywide conventions/tradeshows
'" Convention center deficit - nearly three times greater than the average of its convention peers
Management - perceived within the industry to lack significant, specialized facility management experience and client credibility
Effective management of these challenges requires a renewed and sustained government response built on a tourism strategy and its long-term, innovative plan for the sustainability and growth of Los Angeles' tourism industry.
CONFIDENTIAL 11
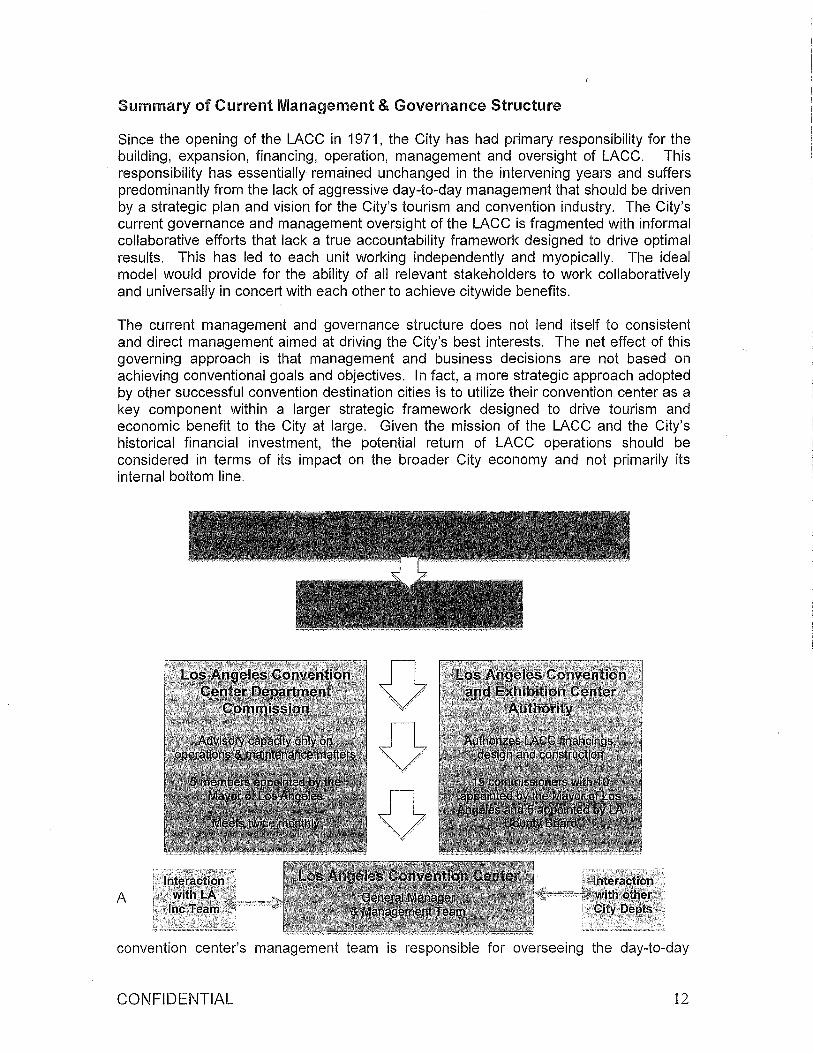
Summary of Current Management & Governance Structure
Since the opening of the LACC in 1971, the City has had primary responsibility for the building, expansion, financing, operation, management and oversight of LACC. This responsibility has essentially remained unchanged in the intervening years and suffers predominantly from the lack of aggressive day-to-day management that should be driven by a strategic plan and vision for the City's tourism and convention industry. The City's current governance and management oversight of the LACC is fragmented with informal collaborative efforts that lack a true accountability framework designed to drive optimal results. This has led to each unit working independently and myopically. The ideal model would provide for the ability of all relevant stakeholders to work collaboratively and universally in concert with each other to achieve citywide benefits.
The current management and governance structure does not lend itself to consistent and direct management aimed at driving the City's best interests. The net effect of this governing approach is that management and business decisions are not based on achieving conventional goals and objectives. In fact, a more strategic approach adopted by other successful convention destination cities is to utilize their convention center as a key component within a larger strategic framework designed to drive tourism and economic benefit to the City at large. Given the mission of the LACe and the City's historical financial investment, the potential return of LACC operations should be considered in terms of its impact on the broader City economy and not primarily its internal bottom line.
A
convention center's management team is responsible for overseeing the day-to-day
CONFIDENTIAL 12
operations including implementing its mission statement and operating policies. The management structure selected for a facility is important because it impacts all aspects of operations and customer service, including all facets of client management, sales and marketing, facility utilization, financial operations and the overall operating efficiency of the facility.
Reference to Management Structure in this report refers specifically to the following issues related to convention center management:
Ei> Public versus private management of the convention center facilities
Ei> Issues of control and decision-making
Ei> Operating policies and procedures
Today, the operation of the LACC remains under control of the City as the Convention Center Department that was established by ordinance in 1973. As outlined in the City of Los Angeles Charter and Administrative Code, the Mayor, subject to confirmation by the City Council, appoints the General Manger. The Convention Center Department is under the control of a General Manager who reports to the Mayor of the City. The General Manager interacts on an advisory and consulting basis only with the Board of Los Angeles Convention Center Commission ("Commission"). This Board is created through the City Charter, Section 8.146.
General Managers of major U.S. convention centers bring a long and distinguished resume with SUbstantial experience in sales, event management and facility management. This depth of expertise in the convention industry is important in that the General Manager must be knowledgeable on the intricacies of facility management and unique client interests. The General Manager serves as the primary point of contact and final arbiter for all decision-making. This experience also serves to bring "best practices" utilized by other facilities nationally. In the case of LACC, this specific industry expertise is lacking and the current management structure is encumbered with distracting political issues focused primarily in driving expedient decisions based on more narrow and shortsighted client and CVB deadlines.
LACC Current Governance Structure
The relationship between convention center owners, operators, and their sales agents varies depending on an individual city's funding mechanisms, legislation, and political environment. While there is no definitive structure for all cities, it is certain that the most effective relationships are those that consider efficient internal communication, clearly defined roles and responsibilities, quality customer service, proper allocation of resources and a framework that supports collaborative decision-making to drive the destination's goals.
Reference to Governance Structure refers specifically to the following issues related to convention center management:
€l> Relationship with other organizations - LA Inc, City departments, and LA Live and future Event Center management
'" Government Oversight Structure - City, County, Authority, Commission, etc.
CONFIDENTIAL 13
@> Linkage with private stakeholders and funding
The current governance structure for the LACC is essentially non-existent and consists of a Commission that is not empowered to drive the City's critical strategic direction for its convention and tourism objectives. The Commission only acts in an advisory and consulting capacity and neither sets policy nor can compel or impact the direction of the convention center or other important stakeholders. This results in the convention center operating relatively independently without the benefit of consistent input and direction from a board or authority that is focused primarily on the City's overall objectives and influenced by input from critical stakeholders.
Resulting Impact on LACC's Current Market Position and Structure
Convention centers do not operate in a vacuum; rather their industry, surrounding environment, governance, and management structure all playa role in their competitive positioning. Economic trends have led the convention and meeting industry to become more competitive over the past two decades. Destinations offering state-of-the-art meeting and convention space are no longer sufficient to ensure success. Communities have increasingly had to invest in supporting infrastructure such as hotels and transportation improvements to maintain market share. Changes are also being made to convention center business structures and strategies to allow these unique publicly owned assets to operate more effectively in a competitive environment. Some have established more flexible governance and management structures, offered rental concessions and reorganized their destination marketing agencies to bolster their chances at success.
While the LACC is among the largest centers in the U.S., and the City offers many necessary destination attributes, it lags behind its primary competitors in terms of its overall destination package, flexibility of operations and unified focus on the City's convention and tourism mission. Despite the City's significant financial investment in terms of general fund subsidy and providing a comparable overall destination marketing budget as its competitors, the LACC hosts a lower percentage of citywide conventions and tradeshows and operates with a higher deficit than its peers. Continuing to operate under the current structure is likely to yield similar or worse results in the future as other communities continue to improve their convention centers, supporting amenities and evolve their operations to meet the changing environment.
CONFIDENTIAL 14
The for h nge
With the accelerated rate of convention center development and expansion over the past 20 years, cities are taking a more strategic approach to ensure their success. As Los Angeles' competitive set has actively engaged in expansion, renovation, privatization, and new paradigms of sales, marketing and governance, the LACC model has essentially remained unchanged. The current Los Angeles convention business model essentially allows the convention center to operate independently without active highlevel management and governance. As a result the LACC's performance outcomes and strength of its business mix are seriously lagging and less favorable as compared to its industry peers.
In fact, it is only the emergence of a possible NFL stadium and its associated demands and requests that has spurred the City to visit the issue of private management of the LACC. Assets that are owned and managed by a highly sophisticated and savvy market player found in AEG may soon physically surround the LACC. This will require the City to put itself in the best possible position, led by experienced professionals able to meet its peers and other market developers on equal footing and from a position of strength. This, in addition to the need for the City to undertake its own re-invention of its convention model, is strong impetus to begin the transformation of Los Angeles to a world-class convention city.
The two primary recommendations of this report are as follows:
@ Management Structure - The procurement of a qualified private management company responsible for management and operation of the LACC
Recent privatization of major convention facilities such as McCormick Place lends a tremendous amount of credibility to this business model. It is not only the largest convention center in North America but consistently ranked among the top destinations for conventions in the United States. (Please see Appendix B for a more thorough case study related to McCormick Place)
@ Governance Structure - The creation of a new entity authorized and empowered to strategically govern and guide the LACC as well as the City's overall convention and tourism efforts aligned with the best interest of the City and its hospitality industry stakeholders
New governing paradigms designed to more aggressively direct, manage and measure outcomes have recently proven successful as evidenced by Detroit where the Detroit Regional Convention Facility Authority was recently created in 2009 to operate its convention center under a long-term lease from the City. (Please see Appendix A for a more thorough case study related to Detroit)
As the expression goes, "you have to start somewhere" and this time is a perfect starting place. Active management of sales and marketing efforts, facility planning as well as tracking key benchmarks such as event mix, occupancy, attendance, rental rates and income, economic impacts, and food and beverage sales are the only methods by which to measure and convey return on investment. Active and performance based management has translated in many other cities into a shifting of responsibilities to
CONFIDENTIAL 15
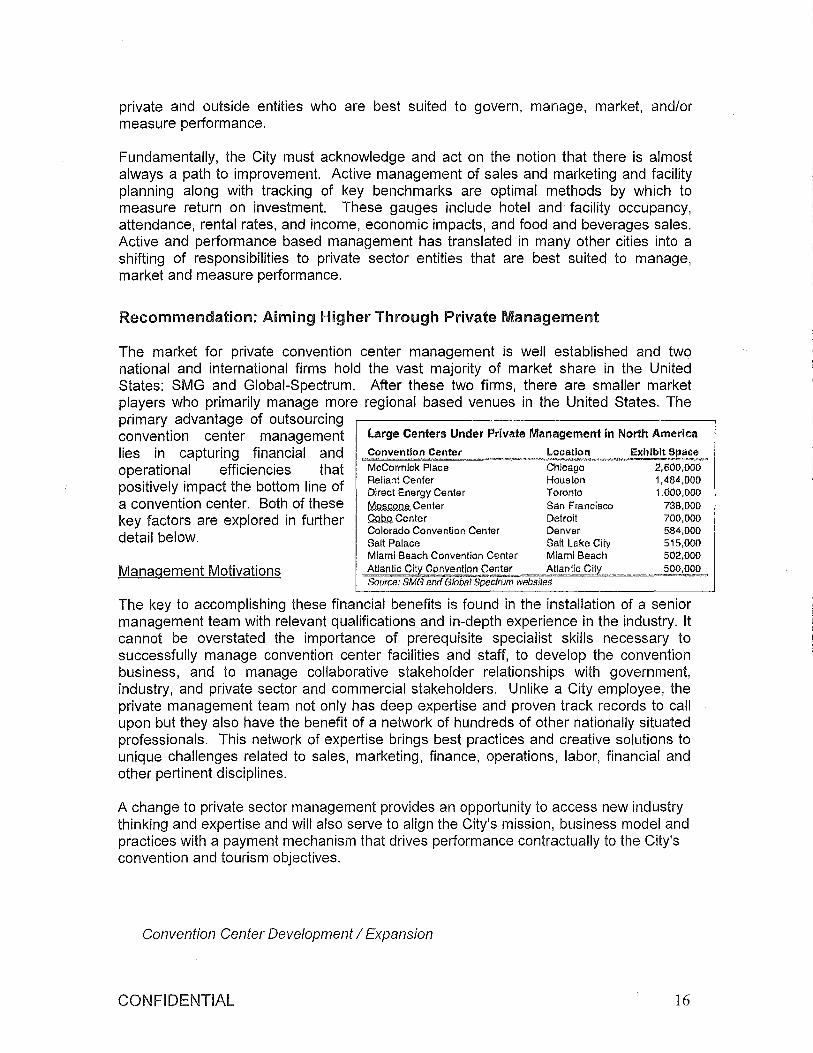
private and outside entities who are best suited to govern, manage, market, and/or measure performance.
Fundamentally, the City must acknowledge and act on the notion that there is almost always a path to improvement. Active management of sales and marketing and facility planning along with tracking of key benchmarks are optimal methods by which to measure return on investment. These gauges include hotel and facility occupancy, attendance, rental rates, and income, economic impacts, and food and beverages sales. Active and performance based management has translated in many other cities into a shifting of responsibilities to private sector entities that are best suited to manage, market and measure performance.
Recommendation: Aiming Higher Through Private Management
The market for private convention center management is well established and two national and international firms hold the vast majority of market share in the United States: SMG and Global-Spectrum. After these two firms, there are smaller market players who primarily manage more regional based venues in the United States. The primary advantage of outsourcing convention center management lies in capturing financial and operational efficiencies that positively impact the bottom line of a convention center. Both of these key factors are explored in further detail below.
Management Motivations
Large Centers Under Private Management in North America
Convention Center ~_~~~ McCormick Place Chicago 2,600,000 Reliant Center Houston 1,484,000 Direct f:nergy Center Toronto 1,000,000 MAAGW{t Center San I'"rancisco 73B,000 QQJ:>~Q Center Detroit 700,000 Colorado Convention Center Denver 584,000 Salt Palace Salt Lake City 515,000 Miami Beach Convention Center Miami Beach 502.000 Atlantic City Conve,!ltlon C~nter _~Iantic City = ~'~ 500.000._ Source: SMG and Global Spectrum websiles
The key to accomplishing these financial benefits is found in the installation of a senior management team with relevant qualifications and in-depth experience in the industry. It cannot be overstated the importance of prerequisite specialist skills necessary to successfully manage convention center facilities and staff, to develop the convention business, and to manage collaborative stakeholder relationships with government, industry, and private sector and commercial stakeholders. Unlike a City employee, the private management team not only has deep expertise and proven track records to call upon but they also have the benefit of a network of hundreds of other nationally situated professionals. This network of expertise brings best practices and creative solutions to unique challenges related to sales, marketing, finance, operations, labor, financial and other pertinent disciplines.
A change to private sector management provides an opportunity to access new industry thinking and expertise and will also serve to align the City's mission, business model and practices with a payment mechanism that drives performance contractually to the City's convention and tourism objectives.
Convention Center Development I Expansion
CONFIDENTIAL 16
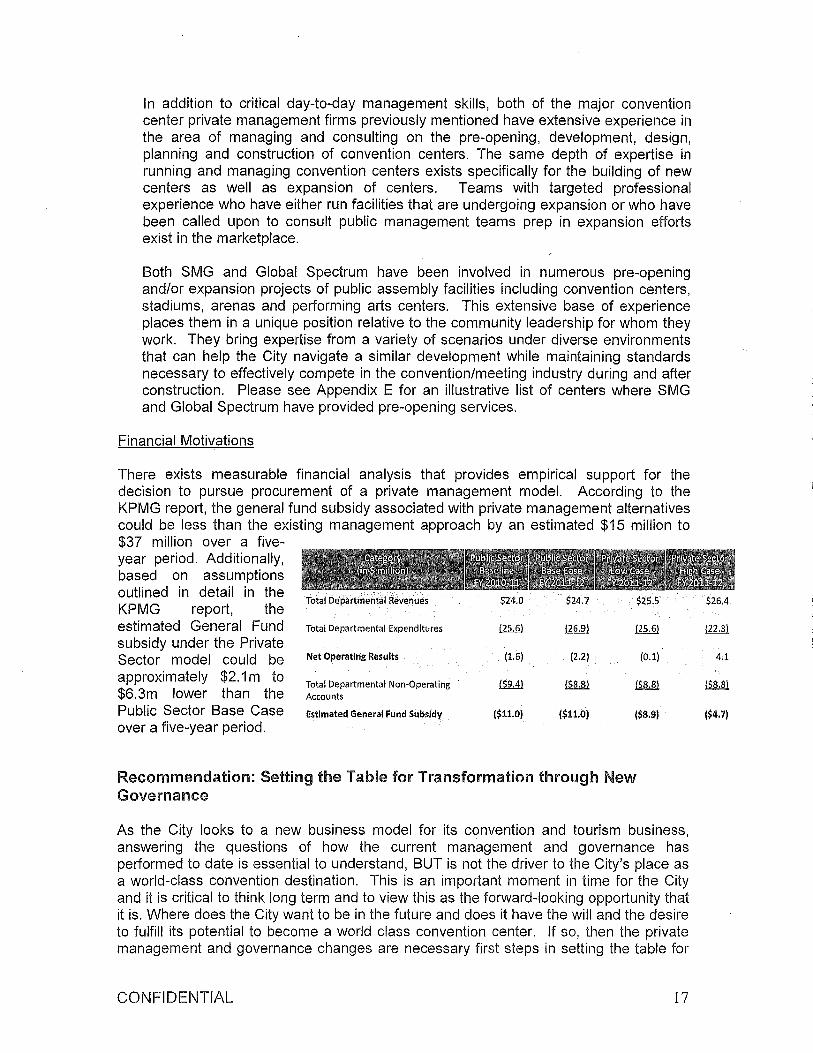
In addition to critical day-to-day management skills, both of the major convention center private management firms previously mentioned have extensive experience in the area of managing and consulting on the pre-opening, development, design, planning and construction of convention centers. The same depth of expertise in running and managing convention centers exists specifically for the building of new centers as well as expansion of centers. Teams with targeted professional experience who have either run facilities that are undergoing expansion or who have been called upon to consult public management teams prep in expansion efforts exist in the marketplace.
Both SMG and Global Spectrum have been involved in numerous pre-opening and/or expansion projects of public assembly facilities including convention centers, stadiums, arenas and performing arts centers. This extensive base of experience places them in a unique position relative to the community leadership for whom they work. They bring expertise from a variety of scenarios under diverse environments that can help the City navigate a similar development while maintaining standards necessary to effectively compete in the convention/meeting industry during and after construction. Please see Appendix E for an illustrative list of centers where SMG and Global Spectrum have provided pre-opening services.
Financial Motivations
There exists measurable financial analysis that provides empirical support for the decision to pursue procurement of a private management model. According to the KPMG report, the general fund subsidy associated with private management alternatives could be less than the existing management approach by an estimated $15 million to $37 million over a fiveyear period. Additionally, based on assumptions outlined in detail in the KPMG report, the
Total Departmental Revenues
estimated General Fund Total Departmental Expenditures
subsidy under the Private Sector model could be Net Operating Results
approximately $2.1 m to Total Departmental Non-Operating . $6.3m lower than the Accounts
$24.0 $24.7 $25.5
{1.61 {2.21 (0.1)
Public Sector Base Case Estimated General Fund Subsidy ($11.0) ($11.0) ($8.9)
over a five-year period.
Recommendation: Setting the Table for Transformation through New Governance
As the City looks to a new business model for its convention and tourism business, answering the questions of how the current management and governance has performed to date is essential to understand, BUT is not the driver to the City's place as a world-class convention destination. This is an important moment in time for the City and it is critical to think long term and to view this as the forward-looking opportunity that it is. Where does the City want to be in the future and does it have the will and the desire to fulfill its potential to become a world class convention center. If so, then the private management and governance changes are necessary first steps in setting the table for
CONFIDENTIAL 17
$26.4
4.1
($4.7)
this transformation. There can be no additional or significantly impactful changes to the operation, business mix, sales effort, control, additional hotel rooms, stakeholder inclusion or numerous other issues without first adjusting the framework within which all of these areas will be addressed. What is the forum for making changes and how will the City manage this important economic engine? The answer to that question is the salient issue at hand. What structure will optimally provide the ability to take the City's convention and hospitality industry from where it stands today to the next level -- to compete on a regional, national and international basis well into the future.
As in all areas of business it is essential, even critical, to evolve and to stay in front of the competition. In this regard, the convention industry is no different than any other competitive marketplace. The mere fact that a function has always been achieved in a particular way does not make it the best way but only begs the further question as to how the function can be done better, more efficiently and with improved results given the dynamic environment within which the entity operates. Policies that drive successful convention destinations are continually evolving their facility program, destination amenities, governance, management, sales and marketing and business strategies in order to remain competitive.
If the City embraces a private management team to take its convention business to the next level then how will that team be managed and directed to ensure positive financial results and optimal city utilization?
Governing Options
Various options exist as to how the City can restructure its current convention center governance. Generally the benefits of a special purpose authority or entity is such that the resulting authority remains fully accountable to the public sector but operates at arms length to ensure that the public sector's objectives are met in the most efficient and effective manner. If also establishes a new paradigm allowing for more freedom from political pressures, greater business expertise, flexibility and timeliness in decisionmaking. The entity or authority should have a formal agreement or charter with the City as it relates to ownership and financing of the facilities and future facilities. Any of the options outlined below are likely to strengthen the City's position as each. provides new policy, financing, strategic direction and decision-making powers. Below are three viable options for consideration:
Option 1: City of Los Angeles Proprietary Department The creation of a new Proprietary Department under the City Charter similar to Harbors, Airports and Ports which exist to pursue and fulfill a viable commercial purpose. Examples: Proprietary Departments are unique to the City of LA's charter and structure
Option 2: Independent Authority Responsible for LACC The creation of a new and independent authority responsible for strategic direction, policy, finances, contract management, and collaboration with convention stakeholders. This option is well utilized throughout the country and provides for high-level accountability and strategic direction via destination city and state leaders. Examples: Chicago and Detroit
CONFIDENTIAL 18
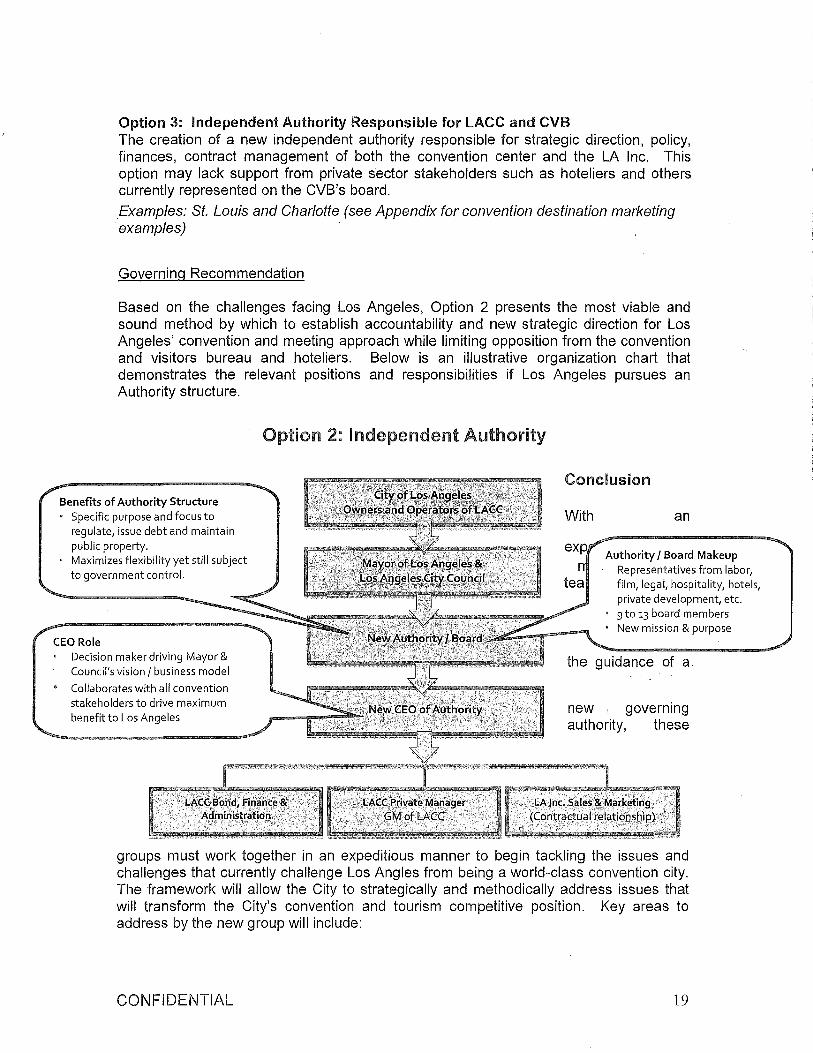
Option 3: Independent Authority Responsible for LACC and CVB The creation of a new independent authority responsible for strategic direction, policy, finances, contract management of both the convention center and the LA Inc. This option may lack support from private sector stakeholders such as hoteliers and others currently represented on the CVB's board.
Examples: St. Louis and Charlotte (see Appendix for convention destination marketing examples)
Governing Recommendation
Based on the challenges facing Los Angeles, Option 2 presents the most viable and sound method by which to establish accountability and new strategic direction for Los Angeles' convention and meeting approach while limiting opposition from the convention and visitors bureau and hoteliers. Below is an illustrative organization chart that demonstrates the relevant positions and responsibilities if Los Angeles pursues an Authority structure.
Option 2: Independent Authority
Conclusion Benefits of Authority Structure
Specific purpose and focus to regulate, issue debt and maintain public property.
With an
Authority I Board Makeup Representatives from labor, film, legal, hospitality, hotels, private development, etc.
Maximizes flexibility yet still subject to government control.
CEO Role • Decision maker driving Mayor &
Council's vision / business model • Collaborates with all convention
stakeholders to drive maximum benefit to Los Angeles
, "·~'··Lp.ic:~~~q~ .Fil'l"an~e:~\::·· '. Administration,;;': ,.
, .~ -, ,"','i >-
, 9 to ~3 board members New mission & purpose
the guidance of a
new governing authority, these
•. ' >:LA'n~ .. 'sale~fM~rketirl~ ',' " '(Contrac~ualreiatiQl]shjp) .c
groups must work together in an expeditious manner to begin tackling the issues and challenges that currently challenge Los Angles from being a world-class convention city. The framework will allow the City to strategically and methodically address issues that will transform the City's convention and tourism competitive position. Key areas to address by the new group will include:
CONFIDENTIAL 19

® Availability of hotels in close proximity to the convention center ® Mix of business issues - booking policy 41> Effectiveness of sales and marketing efforts ® Ease of transporting attendees to/from location ® Financial operating efficiency il Measuring and conveying return on investment il Labor policies and reform
CONFIDENTIAL 20
Appendix
Appendix A:
Appendix B:
Appendix C:
Appendix D:
Appendix E:
CONFIDENTIAL
Case Study: Cobo Center, Detroit Michigan
Case Study: McCormick Place, Chicago, Illinois
Matrix of Los Angeles I Detroit I Chicago Comparison
Examples of Convention Destination Marketing
Private Management Firms - list of Convention Center Pre Opening services
21
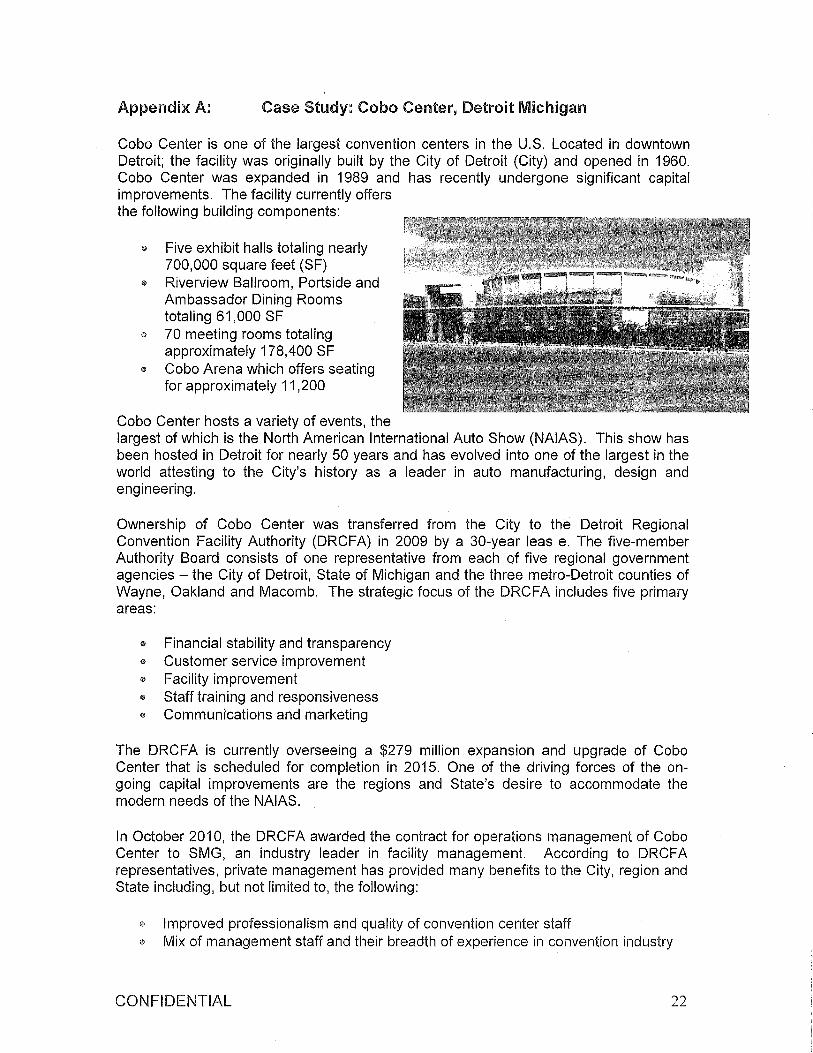
Appendix A: Case Study: Cobo Center, Detroit Michigan
Cobo Center is one of the largest convention centers in the U.S. Located in downtown Detroit; the facility was originally built by the City of Detroit (City) and opened in 1960. Cobo Center was expanded in 1989 and has recently undergone significant capital improvements. The facility currently offers the following building components:
Ii) Five exhibit halls totaling nearly 700,000 square feet (SF)
<I> Riverview Ballroom, Portside and Ambassador Dining Rooms totaling 61,000 SF
<I> 70 meeting rooms totaling approximately 178,400 SF
€I Cobo Arena which offers seating for approximately 11,200
Cobo Center hosts a variety of events, the largest of which is the North American International Auto Show (NAIAS). This show has been hosted in Detroit for nearly 50 years and has evolved into one of the largest in the world attesting to the City's history as a leader in auto manufacturing, design and engineering.
Ownership of Cobo Center was transferred from the City to the Detroit Regional Convention Facility Authority (DRCFA) in 2009 by a 30-year leas e. The five-member Authority Board consists of one representative from each of five regional government agencies - the City of Detroit, State of Michigan and the three metro-Detroit counties of Wayne, Oakland and Macomb. The strategic focus of the DRCFA includes five primary areas:
<I> Financial stability and transparency €I Customer service improvement <I> Facility improvement <I> Staff training and responsiveness €I Communications and marketing
The DRCFA is currently overseeing a $279 million expansion and upgrade of Cobo Center that is scheduled for completion in 2015. One of the driving forces of the ongoing capital improvements are the regions and State's desire to accommodate the modern needs of the NAIAS.
In October 2010, the DRCFA awarded the contract for operations management of Cobo Center to SMG, an industry leader in facility management. According to DRCFA representatives, private management has provided many benefits to the City, region and State including, but not limited to, the following:
Improved professionalism and quality of convention center staff Id Mix of management staff and their breadth of experience in convention industry
CONFIDENTIAL 22
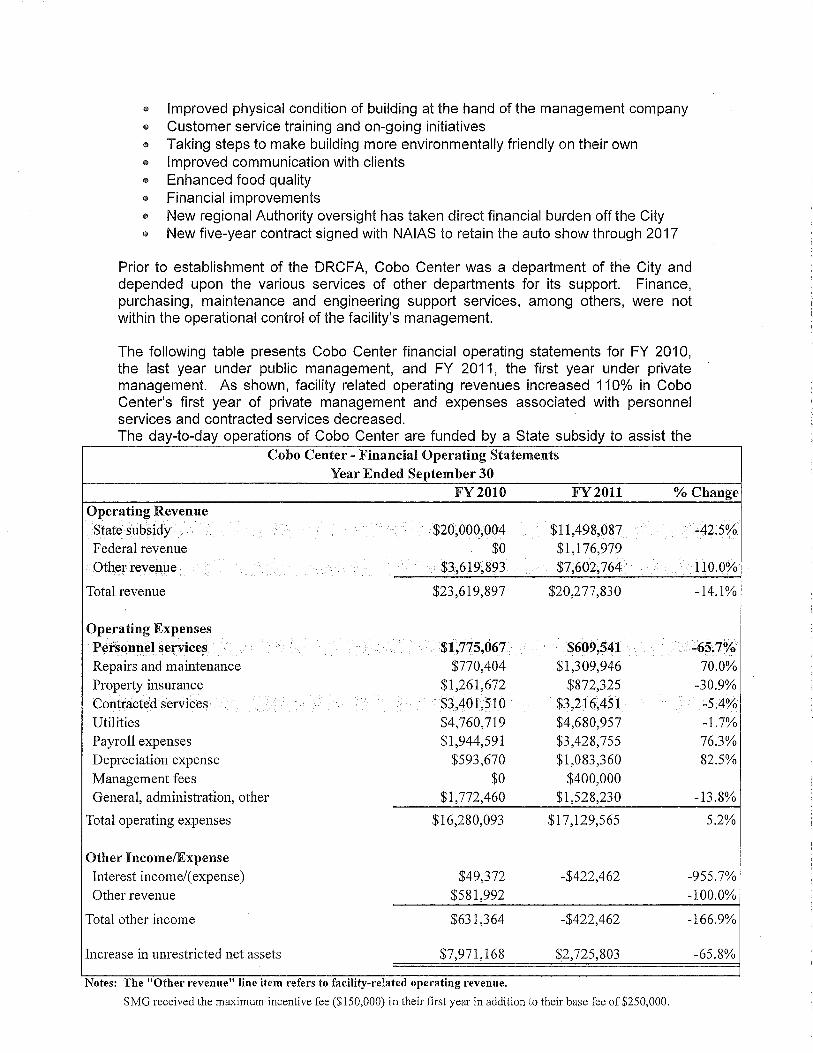
fi> Improved physical condition of building at the hand of the management company fi> Customer service training and on-going initiatives CiI Taking steps to make building more environmentally friendly on their own ® Improved communication with clients @ Enhanced food quality @ Financial improvements ® New regional Authority oversight has taken direct financial burden off the City ® New five-year contract signed with NAIAS to retain the auto show through 2017
Prior to establishment of the DRCFA, Cobo Center was a department of the City and depended upon the various services of other departments for its support. Finance, purchasing, maintenance and engineering support services, among others, were not within the operational control of the facility's management.
The following table presents Cobo Center financial operating statements for FY 2010, the last year under public management, and FY 2011, the first year under private management. As shown, facility related operating revenues increased 110% in Cobo Center's first year of private management and expenses associated with personnel services and contracted services decreased. The day-to-day operations of Cobo Center are funded by a State subsidy to assist the
Cobo Center - Financial Operating Statements Year Ended September 30
FY2010 FY2011 % Change Operating Revenue
State subsidy $20,000,004 $11,498,087 -42.5% Federal revenue $0 $1,176,979 Other revenue $3,619,893 $7,602,764 . 110.0%
Total revenue $23,619,897 $20,277,830 -14.1%
Operating Expenses Personnel' services $1,775,067 $609,541 . -65.7% Repairs and maintenance $770,404 $1,309,946 70.0% Property insurance $1,261,672 $872,325 -30.9% Contracted services $3,401,510 $3,216,451 -5.4% Utilities $4,760,719 $4,680,957 -1.7% Payroll expenses $1,944,591 $3,428,755 76.3% Depreciation expense $593,670 $1,083,360 82.5% Management fees $0 $400,000 General, administration, other $1,772,460 $1,528,230 -13.8%
Total operating expenses $16,280,093 $17,129,565 5.2%
Other IncomelExpense Interest income/( expense) $49,372 -$422,462 -955.7% Other revenue $581,992 -100.0%
Total other income $631,364 -$422,462 -166.9%
Increase in unrestricted net assets $7,971,168 $2,725,803 -65.8%
. . Notes: The "Other revenue" lme Item refers to faclhty-related operatmg revenue .
SMG received the maximum incentive fee ($150,000) in their first year in addition to their base fee of$250,000.
DRCFA in its early years. The subsidy is scheduled to decrease to $5.0 million annually beginning in 2018. The Federal subsidy in FY 2011 was awarded by the U.S. Department of Energy to off-set capital improvement costs associated with more efficient energy usage.
According to the FY 2011 audited financial statements, SMG initiated a complete assessment of the facility's overall finances and contracts. Renegotiations of all major contracted services, based on competitive bidding, other service contracts to identify better and more efficient production methods and various support agreements to include security, housekeeping and equipment maintenance were completed. Many of the contract terms are two-years allowing for timelier renegotiation or rebidding as necessary. According to the audit, these changes reduced the operating expenses by approximately $6.0 million.
CONFIDENTIAL 24
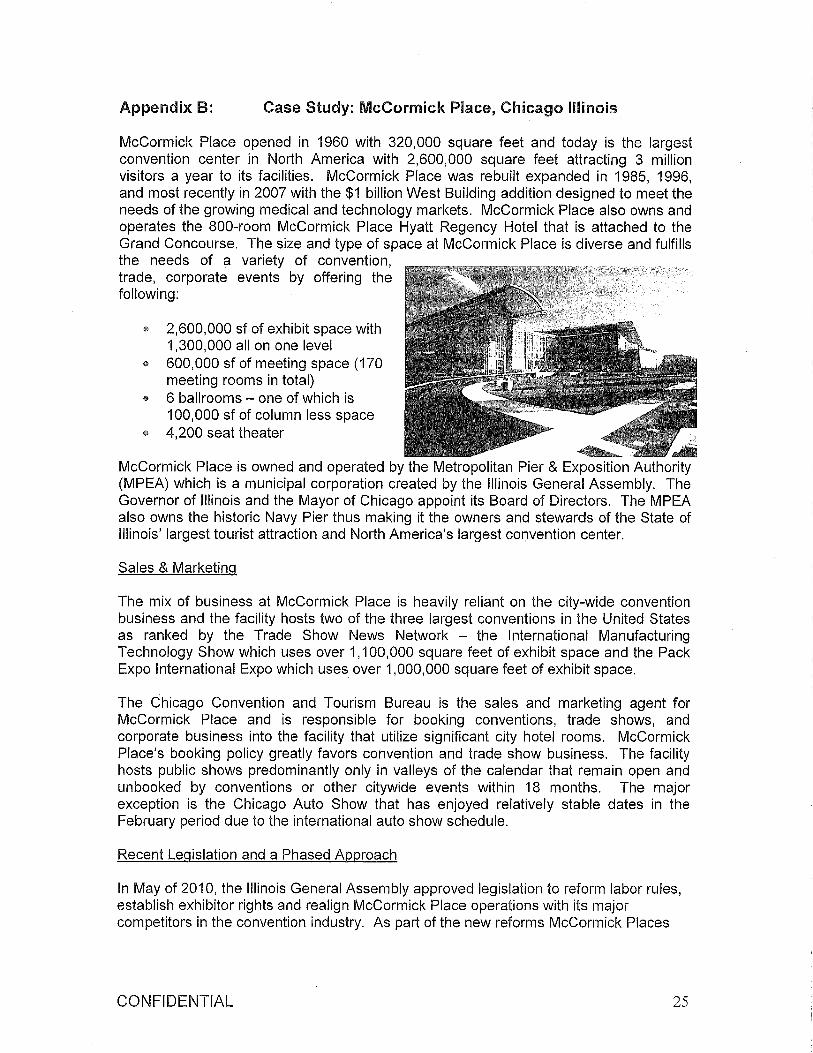
Appendix B: Case Study: McCormick Place, Chicago Illinois
McCormick Place opened in 1960 with 320,000 square feet and today is the largest convention center in North America with 2,600,000 square feet attracting 3 million visitors a year to its facilities. McCormick Place was rebuilt expanded in 1985, 1996, and most recently in 2007 with the $1 billion West Building addition designed to meet the needs of the growing medical and technology markets. McCormick Place also owns and operates the 800-room McCormick Place Hyatt Regency Hotel that is attached to the Grand Concourse. The size and type of space at McCormick Place is diverse and fulfills the needs of a variety of convention, trade, corporate events by offering the following:
<ll 2,600,000 sf of exhibit space with 1,300,000 all on one level
@ 600,000 sf of meeting space (170 meeting rooms in total)
<ll 6 ballrooms - one of which is 100,000 sf of column less space
<ll 4,200 seat theater
McCormick Place is owned and operated by the Metropolitan Pier & Exposition Authority (MPEA) which is a municipal corporation created by the Illinois General Assembly. The Governor of Illinois and the Mayor of Chicago appoint its Board of Directors. The MPEA also owns the historic Navy Pier thus making it the owners and stewards of the State of Illinois' largest tourist attraction and North America's largest corwention center.
Sales & Marketing
The mix of business at McCormick Place is heavily reliant on the city-wide convention business and the facility hosts two of the three largest conventions in the United States as ranked by the Trade Show News Network - the International Manufacturing Technology Show which uses over 1,100,000 square feet of exhibit space and the Pack Expo International Expo which uses over 1,000,000 square feet of exhibit space.
The Chicago Convention and Tourism Bureau is the sales and marketing agent for McCormick Place and is responsible for booking conventions, trade shows, and corporate business into the facility that utilize significant city hotel rooms. McCormick Place's booking policy greatly favors convention and trade show business. The facility hosts public shows predominantly only in valleys of the calendar that remain open and unbooked by conventions or other citywide events within 18 months. The major exception is the Chicago Auto Show that has enjoyed relatively stable dates in the February period due to the international auto show schedule.
Recent Legislation and a Phased Approach
In May of 2010, the Illinois General Assembly approved legislation to reform labor rules, establish exhibitor rights and realign McCormick Place operations with its major competitors in the convention industry. As part of the new reforms McCormick Places
CONFIDENTIAL 25
set forth a new two-phased plan for short and long-term stability that included the following:
• Refinancing MPEA's long term debt • Development of a new hotel • Development of a formal Advisory Council • Privatization of McCormick Place • New customers initiatives related to electrical, food & beverage and Wi-Fi
policies
The new McCormick Place Advisory Council has 23 members and consists of Show Organizers, Exhibitors, Labor, Service Contractors, MPEA management and Chicago Convention and Tourism Bureau Management. The Advisory Council has been an important group that updates and apprises the management and governance team at MPEA as to customer-centric issues and areas of improvement that can be adapted from other facilities.
MPEA's refinancing of debt allowed it to fund an expansion of the Hyatt Hotel and the renovation of existing hotel rooms, to replenish the center's reserve balance and to cover ongoing operating deficits
Private Management
As a key component of reforms designed to streamline operations and lower customer costs, the MPEA Board in May of 2011 selected the private convention venue management firm, SMG to run the daily operations of McCormick Place beginning July 1, 2011. SMG has been in place and operating McCormick Place since July of 2011 and at this time McCormick Place has not yet released results or findings related to the impact of the privatization effort.
Recent Developments
In July of 2011 the MPEA selected a design-build team for the expansion ·of its hotel that will add 461 hotel rooms in 2013 to the existing Hyatt Hotel attached to McCormick Place. In October of the same year labor organizations and MPEA reached agreement on new work rules changes and reforms that were authorized in the 2010 legislation to improve the customer experience while at McCormick Place.
In March of 2012, MPEA released a draft budget projecting McCormick Place revenues to be $37.6 million in fiscal year 2012 (fiscal year 2011 revenues were $69.3 million). This decline in revenues is attributed to 2010 legislative changes that mandated lower costs to exhibitors. These 2012 projections have significantly less revenue in space rental, food and beverage and electrical fees as a result of the legislation that eliminated profit margins in these areas. To assist in filling this financial gap, the Illinois legislature passed a $20 million per year tax surplus to fund McCormick Place operations. This surplus will remain in existence until the Hyatt Hotel expansion is operational in 2014. At which point, the new incremental revenues from that project are expected to cover the losses created by elimination of the profit centers.
CONFIDENTIAL 26
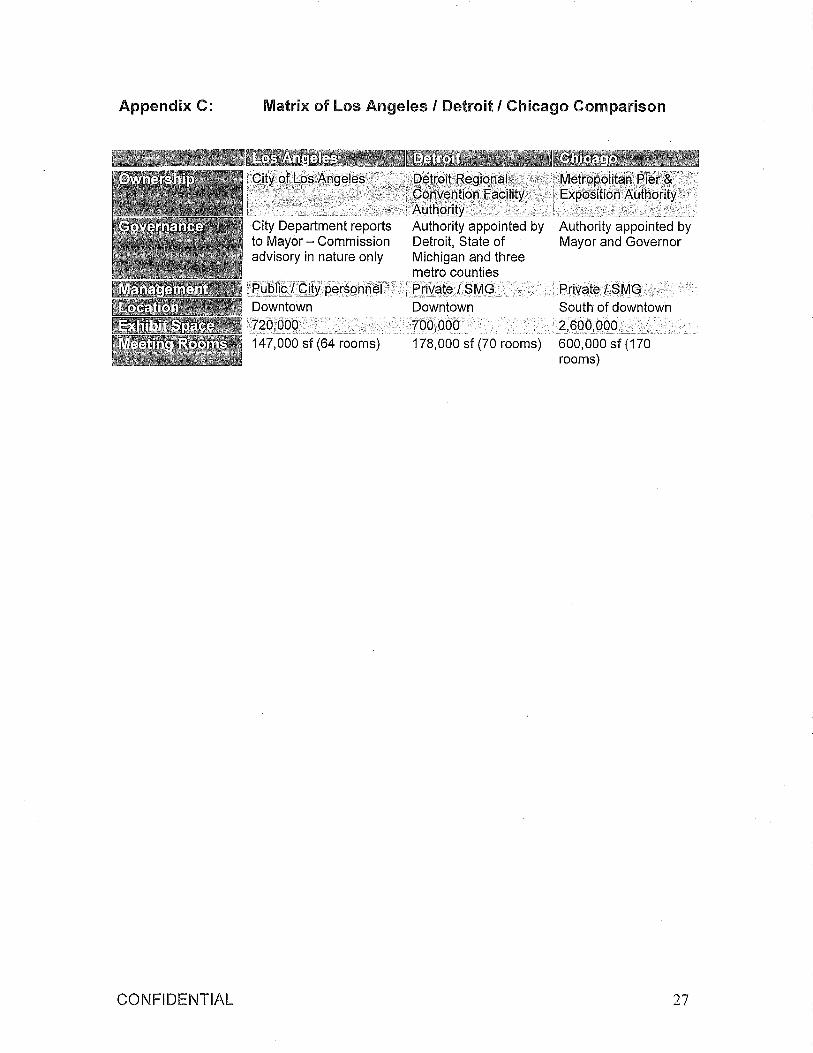
Appendix C:
CONFIDENTIAL
Matrix of los Angeles I Detroit I Chicago Comparison
' .... Detroit RegionEH . Cbnvehtionfacility ". i
ic L ,_. __ ~
City Department reports to Mayor - Commission advisory in nature only
i ~l.Jbl~T~ify'p~rs_ol!r1~I··-... _. Downtown
i720000 . I ,_0-_ .-,~:,, ___ -, __ _
147,000 sf (64 rooms)
AldtbQrlty~. . '. Authority appointed by Detroit, State of Michigan and three metro counties Private / SMG Downtown
Z.OQ,ClPO 178,000 sf (70 rooms)
!ry1~tropolitan Pier.&,· I EXPdsitionAufhbrity·· i I. .. _ ... _ ...
Authority appointed by Mayor and Governor
.' Priv.9teISMG South of downtown
! 2 .. 600-,009.____ 600,000 sf (170 rooms)
27
Appendix D: Examples of Convention Destination Marketing
Marketing for convention centers has traditionally been shared by both the facility and the local destination marketing organization (i.e., CVB). While a variety of structures exist for the marketing of convention facilities, the most typical includes a shared responsibility by facility management (for short-term bookings) and the marketing organization (for long-term bookings). The key to providing consistent marketing and sales efforts with two entities is a clearly articulated mission of the convention center, plainly delineated roles and responsibilities, and a streamlined governance/management structure that allows the two parties to smoothly work together.
Creating new a governance and/or management structure for the LACC may improve working relations with LA Inc. However, other cities offer examples of convention center sales/marketing alternatives regardless of management structure.
Convention destinations that have a successful reputation for marketing/sales include San Francisco that, according to management, attributes its success to their clearly defined mission to generate economic impact and draw overnight visitors. As such, the center's marketing is solely the responsibility of the destination marketing organization that controls the facility's event calendar. Given both entities operate with a unified mission; their efforts serve to complement one another. The city's destination attributes and reputation as one of the country's top visitor destinations also support its ability to remain solely focused on economic-generating events.
San Diego's convention center handled its marketing in-house until just last month when the City voted to give this responsibility back to its CVB. While management spoke positively of their in-house marketing model, area hoteliers wanted greater checks and balances as the facility seeks a hotel tax increase to fund convention center expansion.
Other destinations such as St. Louis and Charlotte have placed their convention centers and CVBs under one broad Authority structure to streamline operations and unify the mission. Regardless of the approached employed, successful convention center marketing typically occurs where there is a streamlined structure, cooperative relationships among entities, and an industry reputation for competitive facility/ destination characteristics.
CONFIDENTIAL 28
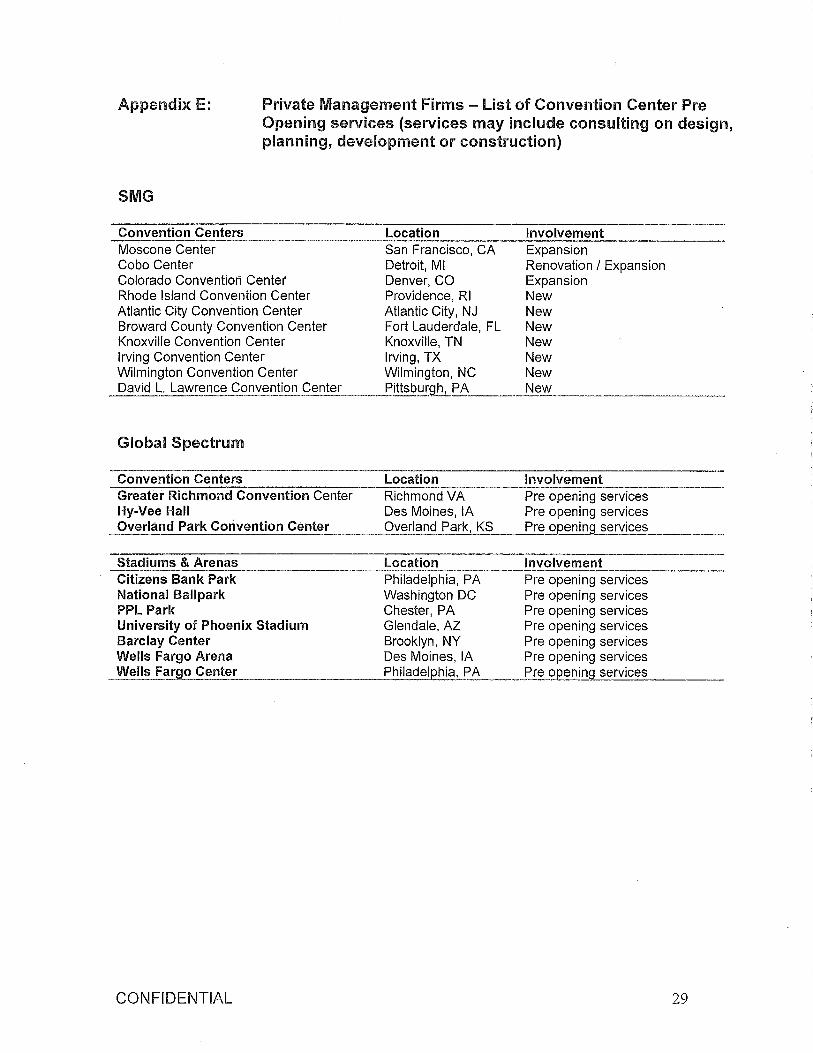
Appendix E: Private Management Firms - List of Convention Center Pre Opening services (services may include consulting on design, planning, development or construction)
SMG
Convention Centers Moscone Center Cobo Center Colorado Convention Center Rhode Island Convention Center Atlantic City Convention Center Broward County Convention Center Knoxville Convention Center Irving Convention Center Wilmington Convention Center David L. Lawrence Convention Center
Global Spectrum
Convention Centers Greater Richmond Convention Center Hy-Vee Hall Overland Park Convention Center
Stadiums & Arenas Citizens Bank Park National Ballpark PPL Park University of Phoenix Stadium Barclay Center
Location Involvement San Francisco, CA Expansion Detroit, MI Renovation / Expansion Denver, CO Expansion Providence, RI New Atlantic City, NJ New Fort Lauderdale, FL New Knoxville, TN New Irving, TX New Wilmington, NC New Pit~. __ N_ew_
Location Richmond VA Des Moines, IA Overland Park, KS
Involvement Pre opening services Pre opening services Pre opening services
Location Involvement Philadelphia, PA Pre opening services Washington DC Pre opening services Chester, PA Pre opening services Glendale, AZ Pre opening services Brooklyn, NY Pre opening services Des Moines, IA Pre opening services Wells Fargo Arena
Wells Fargo Center . _______ P_h_il_a_de_lL-p.....;hi ___ a.!-C-, p._L_ Pre ~_ningLs::..:e:.:..rv.:..:i.::.ce::..:s=--___ .
CONFIDENTIAL 29

ATTACHMENT 4
ORGANIZATIONAL CHART OF PROPOSED ENHANCED LACC GOVERNANCE STRUCTURE
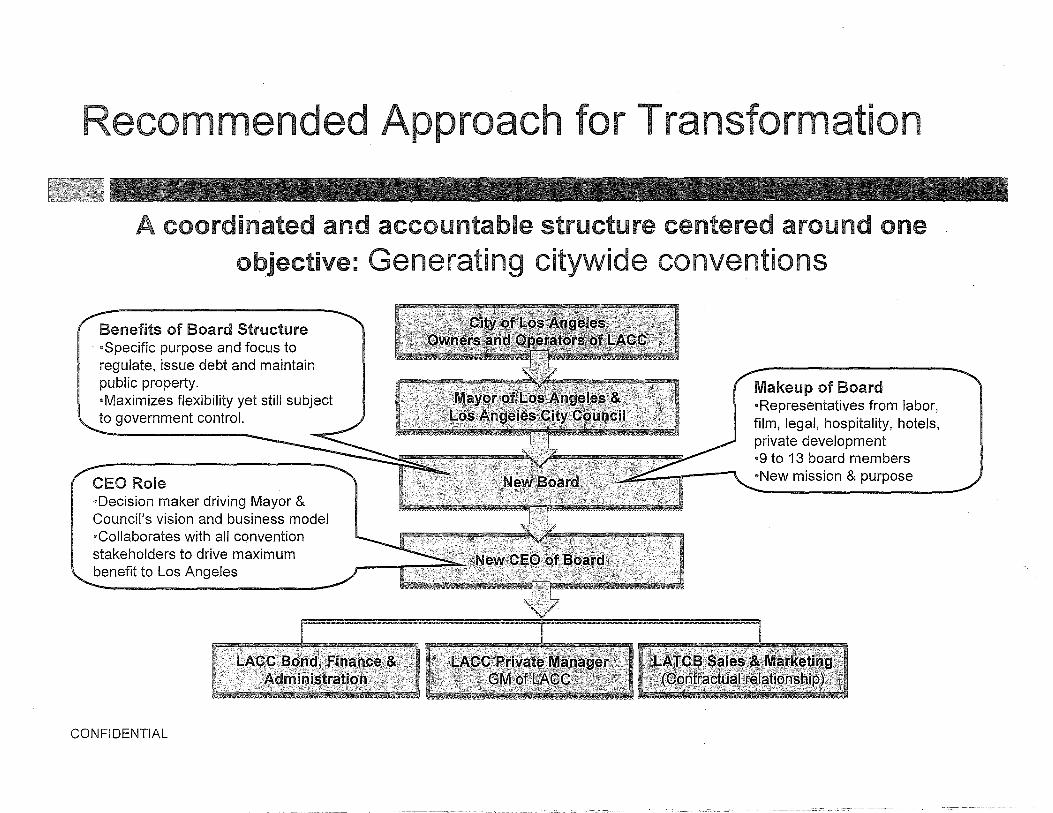
ecommended pproach for ransformation
A coordinated and accountable structure centered around one objective: Generating citywide conventions
Benefits of Board Structure ·Specific purpose and focus to regulate, issue debt and maintain public property. ·Maximizes flexibility yet still subject to government control.
CEO Role ·Decision maker driving Mayor & Council's vision and business model ·Collaborates with all convention stakeholders to drive maximum benefit to Los Angeles
CONFIDENTIAL
Makeup of Board ·Representatives from labor, film, legal, hospitality, hotels, private development ·9 to 13 board members ·New mission & purpose

ATTACHMENT 5
PROPOSED LACC BOOKING POLICY
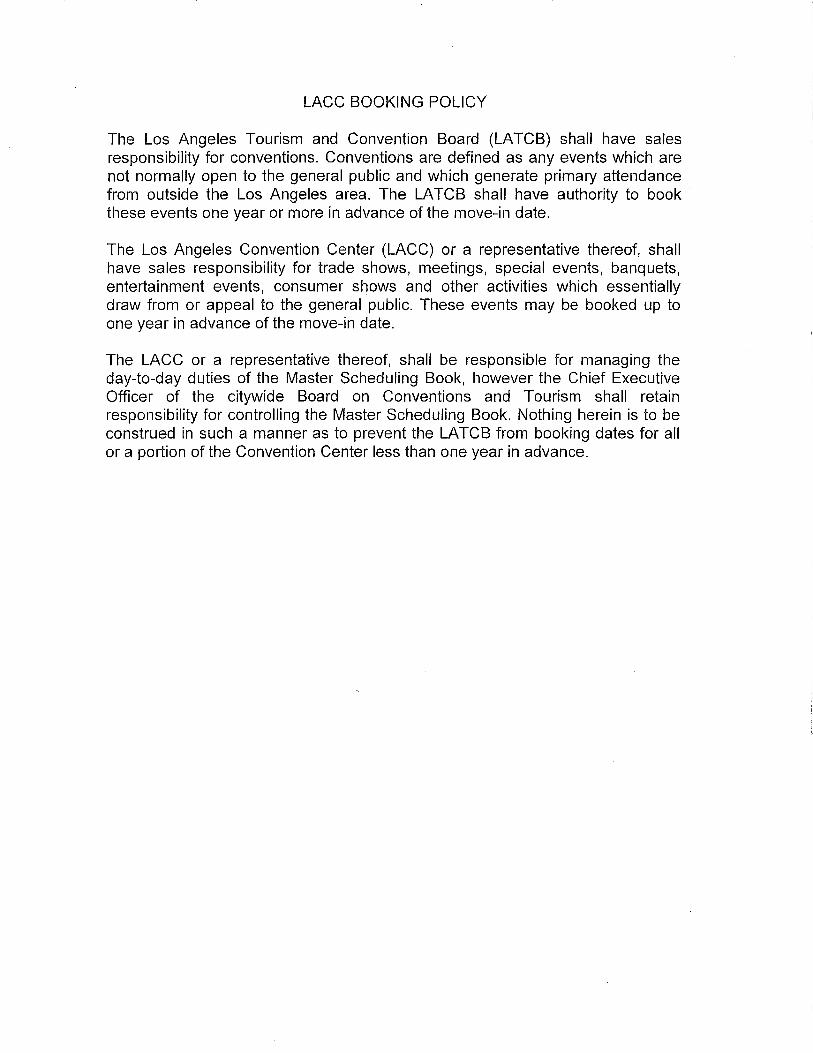
LACC BOOKING POLICY
The Los Angeles Tourism and Convention Board (LATCB) shall have sales responsibility for conventions. Conventions are defined as any events which are not normally open to the general public and which generate primary attendance from outside the Los Angeles area. The LA TCB shall have authority to book these events one year or more in advance of the move-in date.
The Los Angeles Convention Center (LACC) or a representative thereof, shall have sales responsibility for trade shows, meetings, special events, banquets, entertainment events, consumer shows and other activities which essentially draw from or appeal to the general public. These events may be booked up to one year in advance of the move-in date.
The LACC or a representative thereof, shall be responsible for managing the day-to-day duties of the Master Scheduling Book, however the Chief Executive Officer of the citywide Board on Conventions and Tourism shall retain responsibility for controlling the Master Scheduling Book. Nothing herein is to be construed in such a manner as to prevent the LATCB from booking dates for all or a portion of the Convention Center less than one year in advance.

ATTACHMENT 6
PKF CONSULTING REPORT DATED SEPTEMBER 24,2010
September 24, '2010
Mr. Pouria Abbassi General Manager & CEO Los Angeles Convention Center 1201 South Figueroa Street Los Angeles, CA 90015
Mr. Mark S. Liberman President & CEO LA INC The Los Angeles Convention and Visitors Bureau 333 South Hope Street, 18th Floor Los Angeles, CA 90071
Dear Messrs. Abbassi and Liberman:
Consulting 865 South Figueroa Street Suite 3500 Los Angeles CA 90017
Telephone (213) 680-0900 Telefax (213) 623-8240 www.pkfc.com
We understand that you are studying the long term booking of the Los Angeles International Auto Show within the context of convention bookings, client relationships and revenues. In accordance with your request, we have completed our analysis and prepared this letter report, which presents our findings and recommendations relative to the booking policy.
Introduction We were jointly retained by the Los Angeles Convention Center (LACC) and LA INC, The Los Angeles Convention and Visitors Bureau (LA INC) in February of 2009 to evaluate the current booking policies of the Convention Center, and specifically how these policies relate to future bookings of the Los Angeles International Auto Show. Our study focused on the Auto Show in particular, due to the fact that it is annually the largest single source of revenue for the Convention Center, and that it is one of the few "grandfathered" shows, which affords it a lengthier booking window than the average consumer show. While this analysis was focused primarily on the specific attributes of the Auto Show as compared to a citywide convention, we are of the opinion that the findings and conclusions contained herein would also be applicable to other similar situations that may arise in the future.
It is important to realize within the context of this report that the City of Los Angeles receives positive economic benefits from both LACC in the form of direct revenues and indirectly from LA INC in terms of transient occupancy taxes and delegate spending generated from conventions booked. It is beyond the scope of our analysis to ascertain how the City should balance the two interdependent revenues streams.
Methodology In the process of our analysis we were determined tO,contact as many persons as possible who are involved in the operation, sales and marketing, management, and oversight of the
Partnered with CMN, Inc., an independent member of Colliers Int'I Property Consultants
Mr. Pouria Abbassi and Mr. Mark Liberman The Los Angeles Convention Center, LA INC, The Convention and Visitors Bureau 2
LACC, as well as those that directly or indirectly benefit from its usage. As the Convention Center is a public entity partially funded by the City of Los Angeles, we first spoke with officials at City Hall, encompassing a number of different departments and disciplines including: the City Administrative Officer, the City Controller, and the Mayor's Office of Economic and Business Policy. We also met with individuals familiar with the day-to-day operations of the Convention Center i ncl ud i ng the add ressees of th is report, the respective heads of the Los Angeles Convention Center, and LA INC., The Los Angeles Convention and Visitors Bureau, as well as with the Los Angeles Convention Center Commission President. We also met with the General Manager and Assistant General Manager of the Auto Show. Our second charge was to meet with representatives of entities and attractions that potentially benefit from business originating from the LACC. These organizations included General Managers representing the major downtown Los Angeles Hotels, Anschutz Entertainment Group, Staples Center, LA Live, and the Nokia Theater.
We also asked for, and reviewed as available, historical operating revenues of the LACC, data specific to the Auto Show, historical convention booking trends and projected future utilization of the Convention Center for citywide events, and documents from the City of Los Angeles relative to booking policy dating back to the mid-1980's. Further, we researched competitive national and international auto shows, and d,etermined the respective booking policy of each, including the specific booking and licensing policies of each location. Finally, we asked for information relative to the number of roomnights generated by the Los Angeles Auto Show, and conducted our own independent pick-up study of the 2009 Auto Show to determine the number of room nights generated by the event.
From these interviews and a review of the data provided by the multitude of entities we were better able to understand the positions of both LACC and LA INC., as well as ultimately to come to a conclusion as to what policy would ultimately best benefit the City of Los Angeles.
Overview of LACC Originally opened in 1971, the Los Angeles Convention Center is located at 1201 South Figueroa Street in downtown Los Angeles. It is the main demand generator for large convention and meeting activity in Los Angeles. The Convention Center, which completed a major expansion in 1993, offers approximately 720,000 square feet of exhibit hall space and 150,000 square feet of meeting space split between its two halls. This makes it one of the largest meeting and convention facilities in the country. LACC is responsible for booking space at the Convention Center and coordinates with representatives and the sales staff of LA INC. to ensure that the facility maintains a high occupancy rate. In the 2008-09 fiscal year LACC hosted nearly 400 events, welcoming approximately 2.5 million guests.
Historically, LA INC. has been given the primary task of booking citywide conventions (defined as 3,OOO-plus minimum roomnights in total), while LACC has been tasked to book trade shows, consumer shows, special events, and other activities which generate revenues
Mr. Pouria Abbassi and Mr. Mark Liberman The Los Angeles Convention Center, LA INC., The Convention and Visitors Bureau 3
through the sales of services and rentals, but primarily draw a local attendance and generate a limited number of roomnights and economic impact to the City of Los Angeles. These events are typically booked between 12 and 24 months out, except for a collection of "grandfathered" shows, which retained their right to book up to ten years in advance of the show date, due to revisions made to the booking policy in 1992, which remains in effect today.
The Convention Center is one of the most important and unique economic assets in the City of Los Angeles, generating an estimated economic impact of over $1 billion a year. Further, unlike the great majority of municipally owned convention centers around the country, LACC has over the past few years covered its operating expenditures through its revenues. Although, we note that the debt service on the Center has annually been paid with a 25 percent allocation of the Transient Occupancy Tax generated citywide. The largest single revenue contributor to the Center is the Auto Show, which on average has reportedly accounted for nearly 15 percent of the annual net operating revenues. For this reason, LACC is highly interested in continuing their long standing relationship with the Auto Show, which includes, but is not limited to, offering a preferred set of dates and licensing the event as far into the future as possible per the request of the client. In the current economic climate, as well as given concerns of having to tap into the General Fund to cover operating expenses, and the deferred maintenance at the Center, this guaranteed source of future revenue carries perhaps an even greater significance today.
Overview of LA INC. LA INC., the Los Angeles Convention and Visitors Bureau is responsible for attracting and booking major citywide conventions to meet in the City of Los Angeles and utilize the Convention Center. Secondarily, LA INC. also markets the city as travel destination, regional, nationally, and internationally - promoting tourism and a positive image of the city. As mentioned previously, LA INC. works with LACC to ensure that the Convention Center is fully utilized, with LA INC. being tasked to book conventions occurring typically two or more years into the future which attract out of town visitors requiring a block of hotel rooms within Los Angeles. Bookings are cyclical in nature, reflecting the typical patterns of convention markets, in part because many major conventions either meet in alternate years or in alternate cities according to a set geographical rotation. These citywide conventions are given priority over trade and consumer shows due to the significant economic impact that these events have on the City of Los Angeles, given the consumer spending and applicable taxes. Between 1996 and 2009, LA INC. was responsible for the booking of nearly 3.6 million roomnights and $445 million of room revenues to Los Angeles area hotels. Additionally, according to LA INC., the organization will have created an economic benefit to the City of Los Angeles of more than $1.1 bill ion between fiscal years 2008 and 2012.
In an effort to attract citywide conventions to downtown Los Angeles, rather than losing them to regional competitors such as San Diego, Anaheim, San Francisco, or Las Vegas, conventions meeting a certain threshold are incentivized to meet at LACC through an
Mr. Pouria Abbassi and Mr. Mark Liberman The Los Angeles Convention Center, LA INC., The Convention and Visitors Bureau 4
abatement of rent payable to the Center. These measures were enacted to better position the City of Los Angeles and the Center relative to the abovementioned regional competitors, which benefit from a larger supply of hotel rooms proximate to the facility and greater and more varied number of entertainment and food and beverage outlets. With the evolution of LA LIVE and the JW Marriott/Ritz Carlton headquarters hotel recently coming to fruition these challenges have been lessened to some extent, although as a convention destination Los Angeles is still evolving into a top tier convention destination.
Overview of the Auto Show . Dating back more than a century, the Auto Show has a long and storied history in the City of Los Angeles. The Los Angeles Auto Show began in 1907 with approximately one hundred vehicles, and as the auto industry grew, the auto show changed venues four times throughout the 1920's to accommodate the growing needs of' vendors. The show continued to prove successful throughout the 1930's, but took a down turn during the Second World War and went on hiatus from 1940 through 1951. In 1952, the show reopened at the Pan Pacific Auditorium with 152 vehicles on display, including for the first time, those from international manufacturers. Throughout the next 50 years, the show continued to grow becoming the success that it is today.
Currently held annually at LACC, the Los Angeles International Auto Show is one of the world's most prestigious automobile expositions and occupies the entire Convention Center for 21 days a year, including ten move in, two press, eight consumer, and three move out days. In an effort to grow both the attendance and stature of the Los Angeles Auto Show, it was moved beginning in 2006 to November, with the final day being the Sunday immediately following Thanksgiving Day. This consistency of dates, and positioning of the show within the international auto show calendar are essential to the future of the Auto Show according to its management.
Historical Perspective LA INC. and LACC have a unique relationship given that they both share the primary goal of booking the Convention Center so as to provide the greatest benefit to the City of Los Angeles. Both, in good faith, however have somewhat contradictory approaches. It is worth noting that this issue and focus of this report is neither new nor unknown to those familiar with the Convention Center. Not to oversimplify the issue, but ul!imately the booking policy question has revolved around whether it is in the best interest of the Convention Center, and by extension the City of Los Angeles, to primarily book citywide conventions or to be self-supporting at an operational level.
Generally speaking, citywide conventions have a much greater economic impact to the city than a trade or consumer show. However, these shows generate less direct revenue to the Center given rental concessions and are not able to be booked with the same degree of certainty as consumer shows. Thus it is important to strike a balance between citywides and trade and consumer shows so that the Center continues to generat~ a steady revenue stream, while also maintaining the potential to accommodate a large citywide if the
Mr. Pouria Abbassi and Mr. Mark Liberman The Los Angeles Convention Center, LA INC, The Convention and Visitors Bureau 5
opportunity arises. The following excerpt from a March 23, 1992 report from the City Administrative Officer and the Booking Policy Review Committee to The Mayor summarizes the current policy.
The LACVB 1 would be responsible for booking conventions from two to ten years in advance. The former Priority Two category2 would be eliminated. The shows that qualified for the old Priority Two category would continue to be booked by the LACC up to ten years in advance, but the show dates would be subject to a certain flexibility in the event that the LACVB also needs those dates.
Although the purpose of this Booking Policy is to increase th'e number of out-of-town conventions booked into the Convention Center, both the LACVB and LACC must make every effort to keep the Convention Center as fully booked as possible. Nothing herein is to be construed in such a manner as to prevent the LACC and LACVB from agreeing to book a local event more than two years in advance if the LACVB believes that the local event will not conflict with the possible booking of a convention. Similarly, the LACVB is encouraged and authorized to turn over responsibility for all or a portion of the Convention Center to the LACC more than two years in advance if the LACVB has concluded that it is unlikely to book that date or space.
The above outlining the booking policy well defines'the overall direction of each entity, while allowing for real world flexibility. However, at times it is this very flexibility that often creates scheduling conflicts as LA INC. and LACC aggressively attempt to book the Center.
I mportance of Auto Show The Los Angeles International Auto Show is by far the largest source of revenue annually for LACC, generating approximately $4.4 million in fiscal year 2008-2009, the last year for which complete figures were available. Although it is not presently possible to determine the actual profit generated by the Show as LACC does not have a system in place to determine the actual cost to hold each event at the Convention Center, it is reasonable to conclude that it is in the best interest of the City of Los Angeles to maintain its longstanding relationship and to continue to hold the Show at LACC. Not only does the Show provide significant guaranteed revenue to LACC, it also generates a positive (although difficult to measure) economic impact with the visitation of at least 750,000 guests. Further, the Auto Show puts the City of Los Angeles in the national spotl ight and supports the city's many auto related industries.
1 LACVB is the former name of what is currently LA INC., The Convention and Visitors Bureau. 2 The Los Angeles Auto Show was formerly categorized as Priority Two, and today is able to be booked up to ten years in advance of the event.
A1r. Pouria Abbassi and Mr. Mark Liberman The Los Angeles Convention Center, LA INC., The Convention and Visitors Bureau 6
A lesser discussed fact is that in addition to being a consumer show, part of the Los Angeles Auto Show should also could be considered a convention or trade show as auto industry executives, manufactures and journalists converge at LACC for two days prior to the beginning of the public portion of the show. In an effort to better compare the Auto Show to an average convention we conducted a pick-up study to determine the number of roomnights generated by the 2009 Los Angeles International Auto Show. Specifically, we contacted 17 hotels located in Downtown Los Angeles to determine the actual roomnights and revenues attributable to the 2009 Show. In total, we determined that the 2009 Show generated 7,119 roomnights between November 10 th to December 21 st
, and a total room revenue of $885,459. These figures should be considered as a minimum given the fact that not all of the hotels surveyed had committed room blocks with the Auto Show and the inherent likelihood of persons booking outside of the block. It should qe noted though that while the Auto Show may generate a comparable amount of roomnights to the average citywide convention, citywides do so over a much shorter period, typically only occupying the convention center for a week at a time.
Additionally, we also reviewed a Los Angeles County Economic Development Corporation (LAEDC) report dated January 15, 2009 entitled The Economic Impact of Los Angeles Convention Center Events, 2006-2007 to further ascertain the estimated economic impact of the Auto Show. According to this report, the LAEDC estimates that in fiscal year 2006-07, consumer shows generated an economic impact of $221 million. Thus then by extension, the Los Angeles International Auto Show (that accounted for 54 percent of all consumer shows that fiscal year) generated an economic impact of $119 million to the City of Los Angeles.
Auto Show Perspective For consistency and in order to grow the Auto Show, its management wants to book and license the Show to the full extent as dictated by the March 1992 booking policy referenced herein. To this end, Auto Show executives are ready and willing put down a sizeable deposit to ensure that their preferred show dates in November are available for the next ten years. These dates, specifically with the Show ending on Thanksgiving weekend, are anything but arbitrary according to Auto Show executives. To continue to grow the Los Angeles International Auto Show and to build the brand it is vitally important to be appropriately positioned on the international auto show calendar. The collection of prestigious international auto shows follow a well established calendar and it is important to avoid overlap so that the Los Angeles International Auto Show has an advantage in the competition for new vehicle debuts and concept car introductions, which ultimately determines where manufacturers devote their resources.
In addition to the Los Angeles International Auto Show, there are potentially four other shows that have a well establ ished pattern of dates proximate to the Los Angeles Show. Europe's largest auto show alternates between Frankfurt in September and Paris in October, while the Tokyo show is held annually beginning in late-October. The Los Angeles Show is followed in January by the North American International Auto Show in Detroit. There are
Mr. Pouria Abbassi and Mr. Mark Liberman The Los Angeles Convention Center, LA INC, The Convention and Visitors Bureau 7
not any significant automobile shows held in the month of December given the holiday activities that are well underway. Therefore, Auto Show executives believe that the only logical dates to hold the Los Angeles Show is with it ending Thanksgiving weekend. Positioned here it is far enough removed from other major international shows to generate national and international press coverage, to be the first to debut new models and concept cars, and to increase attendance with the Thanksgiving holiday that essentially affords the Show a third weekend from which to maximize guest attendance.
LACC Perspective Management of the Los Angeles Convention Center operates the Center with a twofold mission: to support the hotel and hospitality industries and to meet the Center's operating expenses through revenue generation. Hosting nearly 400 events a year (many of which have a short booking window), LACC must be aggressive in seeking out new clients and maintaining existing client relationships. To ensure that the Center .continues to meet its operating costs through revenue generations, LACC management would prefer to book and license the Auto Show as far into the future as possible. Per the current booking policy LACC is within its right to request and issue a long term licenses for the Auto Show. Like any guest serving business, LACC recognizes the value of the Auto Show, not only in dollars and cents but also that it is one of the Center's longest running shows.
Additionally, in light of the city's budget uncertainty, the potential to capture a guaranteed revenue stream for the next ten years takes on an additional added significance. According to LACC officials, it is estimated that the Los Angeles International Auto Show generates a 42 percent profit margin to the Center on average annual revenue of $4.3 million. Comparatively, citywide events on average annual generate revenues of approximately $6 million, but only return a profit margin of five percent to LACC due to the rental di.scounts historically afforded to these groups. Therefore on average according to the LACC, the Auto Show has historically generated roughly $1.5 million more in profit to the center than the average citywide convention. Additionally, it was reiterated in our interviews that the Auto Show was one of the key reasons that the Center was able meet their operating costs during the last four years as it helped to absorb fluctuations and a degree of uncertainty inherently present in the convention industry. Finally, we note that this likely long term revenue source should be considered in light of the uncertainty of additional contributions from the City's General Fund, and the necessary capital improvements that need to be made to the Center to ensure that LACC, and by extension, the City of Los Angeles are able to provide superior service and to meet and exceed guest expectations.
LA INC. Perspective The primary function of LA INC. is to attract, book, and license citywide conventions that will ultimately utilize space at LACC and hotel rooms in Downtown and the greater Los Angeles area. It is generally agreed that booking large conventions is in the best interest of all parties involved, including the ultimate arbiter, the City of Los Angeles. These meetings and conventions attract attendees who book hotel rooms, dine, and shop in Los Angeles, contributing valuable tax dollars to the city. According to a Destination Marketing
Mr. Pouria Abbassi and lotr. Mark Liberman The Los Angeles Convention Center, LA INC., The Convention and Visitors Bureau 8
Association International, each citywide roomnight generates an economic impact of $894 to the City of Los Angeles. This can be compared to the average consumer or trade show, which typically attracts local day visitors who are estimated by the LAEDC to contribute an economic impact of approximately $43 per attendee. Therefore, while in general economic impact can be a difficult to measure and validate, it is clear that conventions and their respective attendee spending are more valuable to the City of Los Angeles than trade or consumer shows. This was an opinion that was shared by the Office of the City Administrator, and confirmed as city policy.
LA INC. would strongly prefer that the Auto Show (including the start of the move-in period) would not begin until the second half of November at the earliest. Again too, the preferences of LA INC. are anything but arbitrary, and the selection of these dates is based on well documented convention patterns and events held by month. Nationwide, meetings and convention are essentially an 11 month industry, with few events being held postThanksgiving until the convention season begins again in earnest mid-January. From Trade Show Week (TSW), the highly-respected source of news and information for trade show professionals for almost 40 years, we were able to obtain a comprehensive I isting of large events that were held in November and December of 2009, as well as those currently planned for November and December of 2010. It should be noted that in both instances we only considered events with confirmed total roomnights of 3,000 or more attendees to conform to the current definition of a Los Angeles citywide. This national trend is consistent with an internal analysis conducted by LA INC. that showed that in fiscal years 2008 and 2009, in terms of bookings by arrival month, there were a total of 95 citywide conventions booked for future years, none of which were for the month of December
According to TSW, in November of 2009 there were 35 events held with a total attendance of 519,000 as compared to 11 shows in December hosting a total of 174,200 attendees. A similar pattern holds true for shows planned for Winter 2010, with 33 events and an overall attendance of 640,875 planned for November, versus 13 events with a total attendance 188,950 planned for December. Therefore, although it cannot be certain of bringing a major convention to the Center in November or December, LA INC. is overwhelmingly more likely to do so in the month of November. As such, LA INC. believes that they should have the first priority in booking these dates in the future.
To further illustrate this, executives at LA INC. point to November 2009 as an example of how to best utilize dates and space available at the Convention Center. By delaying the Auto Show move-in until November 23, LA INC. was able to offer more than two weeks of available space in which it was able to book two significant citywide conventions (American Association of Pharmaceutical Scientists and the Microsoft Professional Developers Conference) that according to our analysis generated a minimum of 28,139 room nights and generated an economic impact of more than $25 million to the City of Los Angeles. Further, according to LA INC. executives, if the Auto Show was licensed for its preferred dates at least one, if not both of these conventions would not have come to Los Angeles.
Mr. Pouria Abbassi and Mr. Mark Liberman The Los Angeles Convention Center, LA INC., The Convention and Visitors Bureau 9
Similarly, LA INC. and LACC have also collaborated recently to secure the commitment of what is anticipated to be one of the city's largest conventions in some time. In working with Auto Show executives to move the already licensed Auto Show to later dates in 2012, LA INC. was able to offer the set of dates preferred by the American Heart Association, which is anticipated to generate more than 45,000 roomnights. We are of the opinion that these examples of flexibility to accommodate major conventions both on the part of LA INC. and LACC highlight the ability of the parties to work together to make business decisions that are ultimately in the best interest of th,e City of Los Angeles.
Another point of discussion between LA INC. and LACC is how far shows and conventions should be licensed into the future. LA INC. typically books conventions from two years to more than a decade into the future, although these conventions are not typically licensed until two years from the date of the event so as to give LA INC. and LACC the flexibility to continue to book additional, and perhaps overlapping conventions that would result in the need to move existing events on the convention calendar. This practice is standard in the meeting and convention industry, as management continually weighs the need to fully utilize the event venue against the possibility of attracting a more profitable piece of business at a future date. Thus, on principle LA INC. objects to the fact that the Auto Show can be, and currently is, I icensed well into the future because to move a I icensed show requires a sizeable monetary incentive, which ultimately is paid by the City of Los Angeles to the group in question. This current policy is further called into question by some as the City of Los Angeles is already subsidizing the newly opened JW Marriott/Ritz Carlton headquarters hotel that was constructed in large part to help attract major conventions to Downtown Los Angeles.
Comparable Centers and Shows The City of Los Angeles is one of a number of municipalities in the United States that host an automobile show each year. Thus, for further information and guidance on this issue we thought it highly appropriate to contact these other U.S. cities that host major auto shows, including: Chicago, Detroit, and Washington, D.C. These convention centers are for the most part similar to LACC, and range from approximately 700,000 to 2.6 million square feet. Of the three cities, only Detroit operates similarly to LACC. The Detroit Metro Convention and Visitors Bureau licenses their auto show five years into the future and has not moved the show to accommodate other pieces of business, although they have negotiated the move in by a week, which typically begins around Thanksgiving each year. Thus given the importance of the automobile industry to Detroit, the convention center affords more than two full months of center space from late November through January for. the show. In contrast Chicago, which has also held its annual show for more than a decade does not license the event until one year prior; stating that it does not generate many roomnights and thus is given a lesser priority. Lastly, the Washington Convention and Sports Authority in the District of Columbia has the most comprehensive policy as it relates to the auto show. The Authority will hold dates for many years out, but will not license the show until 18 months out. Further, they will move the auto show to accommodate
Mr. Pouria Abbassi and Mr. Mark Liberman The Los Angeles Convention Center, LA INC., The Convention and Visitors Bureau 10
convention business that brings a minimum of 2,500 rooms on peak to the city, while working to keep the show in the range period that is preferred.
Findings and Conclusion In completing our analysis of the booking policy we noted, perhaps somewhat surprisingly, that all parties involved in this important issue fundamentally agree on the following tenets. The overriding mission of LACC to act in the best interest of the City of Los Angeles is well understood by all. LA INC. concurs that the Los Angeles International Auto show is important not only to LACC, but also to the greater City of Los Angeles. Similarly, LACC recognizes the important role it shares with LA INC. in supporting the hospitality industry and shares the desire to see the Center first and foremost occupied by large citywide conventions. Thus then from our discussions and findings contained herein, we concluded that the major point of discussion between LACC and LA INC. was in determining and defining the size of a citywide convention that would supersede the continued long term licensing of the Auto Show, as well as the timing of licensing the show into the future.
,
Given that the Auto Show generates a sizeable attendance, revenue to the Center, roomnights to area hotels, and prestige to the City of Los Angeles, any piece of business that would potentially displace the Auto Show from its preferred set of dates would have to be significant. Further, in the process of marketing the Center, every effort should be made to accommodate the preferred dates of the Auto Show, while retaining the flexibility to attract a major citywide convention in the first two weeks in November. However, we would recommend that if a major convention is willing to license a major citywide convention in the first two weeks of November, it should be given the ability to do so, while thereby altering the move-in of the Auto Show by no more than one week.
In order to determine an appropriately sized convention to alter the preferred Auto Show move-in date, we analyzed our audited roomnight data, which is compiled annually for the City of Los Angeles and presented immediately following on the next page.
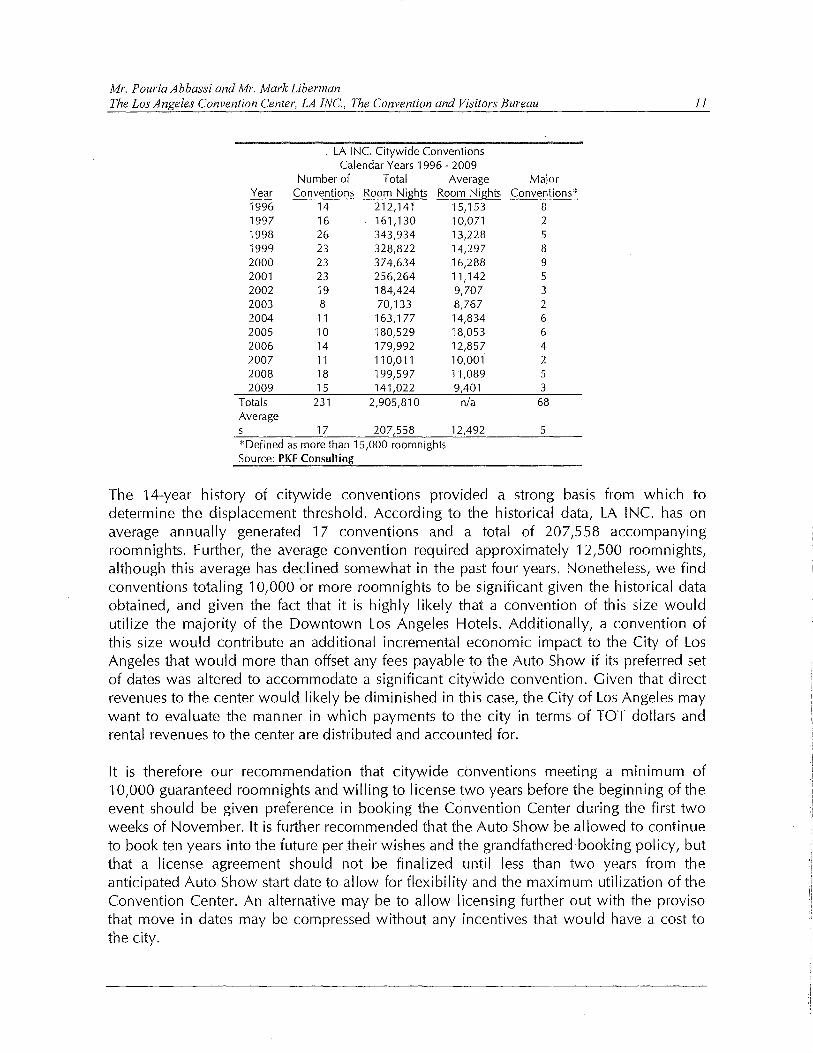
Mr. Pouria Abbassi and Mr. Mark Liberman The Los Angeles Convention Center, LA INC., The Convention and Visitors Bureau II
LA INC. Citywide Conventions Calendar Years 1996 - 2009
Number of Total Average Major Year Conventions Room Nights Room Nights Conventions* 1996 14 212,141 15,153 8 1997 16 161,130 10,071 2 1998 26 343,934 13,228 5 1999 23 328,822 14,297 8 2000 23 374,634 16,288 9 2001 23 256,264 11,142 5 2002 19 184,424 9,707 3 2003 8 70,133 8,767 2 2004 11 163,177 14,834 6 2005 10 180,529 18,053 6 2006 14 179,992 12,857 4 2007 11 110,011 10,001 2 2008 18 199,597 11,089 5 2009 15 141,022 9,401 3
Totals 231 2,905,810 n/a 68 Average s 17 207,558 12,492 5 *Defined as more than 15,000 roomnights Source: PKF Consulting
The 14-year history of citywide conventions provided a strong basis from which to determine the displacement threshold. According to the historical data, LA INC. has on average annually generated 17 conventions and a total of 207,558 accompanying roomnights. Further, the average convention required approximately 12,500 roomnights, although this average has declined somewhat in the past four years. Nonetheless, we find conventions totaling 10,000 or more roomnights to be significant given the historical data obtained, and given the fact that it is highly likely that a convention of this size would utilize the majority of the Downtown Los Angeles Hotels. Additionally, a convention of this size would contribute an additional incremental economic impact to the City of Los Angeles that would more than offset any fees payable to the Auto Show if its preferred set of dates was altered to accommodate a significant citywide convention. Given that direct revenues to the center would likely be diminished in this case, the City of Los Angeles may want to evaluate the manner in which payments to the city in terms of TOT dollars and rental revenues to the center are distributed and accounted for.
It is therefore our recommendation that citywide conventions meeting a minimum of 10,000 guaranteed roomnights and willing to license two years before the beginning of the event should be given preference in booking the Convention Center during the first two weeks of November. It is further recommended that the Auto Show be allowed to continue to book ten years into the future per their wishes and the grandfathered booking policy, but that a license agreement should not be finalized until less than two years from the anticipated Auto Show start date to allow for flexibility and the maximum utilization of the Convention Center. An alternative may be to allow licensing further out with the proviso that move in dates may be compressed without any incentives that would have a cost to the city.
Mr. Pouria Abbassi and Mr. Mark Liberman The Los Angeles Convention Center, LA INC, The Convention and Visitors Bureau 12
Finally, while the Auto Show is currently licensed through 2017, we recommend that the current policy be explored to a greater extent (including the potential inclusion of the abovementioned proviso) in future contractual discussions between LACC, LA INC., The City of Los Angeles, and The Los Angeles International Auto Show. Ultimately we conclude that it is in the best interest of the city to include contractual language decreasing or eliminating the marketing incentive fee if LA INC. were to book and license a significant citywide convention, defined herein as an event that would generate 10,000 or more roomnights and be willing to execute a licensing agreement at least two years prior to the start of the convention.
It has been a pleasure to work with you on this most interesting assignment. If we can be of any further assistance in the interpretation of our findings, please feel free to contact us.
Sincerely,
PKF Consulting
/J2-/7 /' (/ i/~ By Bruce Baltin Senior Vice President

Addendum
STATEMENT OF ASSUMPTIONS AND LIMITING CONDITIONS
This report is made with the following assumptions and limiting conditions:
Economic and Social Trends - The consultant assumes no responsibility for economic, physical or demographic factors which may affect or alter the opinions in this report if said economic, physical or demographic factors were not present as of the date of the letter of transmittal accompanying this report. The consultant is not obligated to predict future political, economic or social trends.
Information Furnished by Others - In preparing this report, the consultant was required to rely on information furnished by other individuals or found in previously existing records and/or documents. Unless otherwise indicated, such information is presumed to be reliable. However, no warranty, either express or implied, is given by the consultant for the accuracy of such information and the consultant assumes no responsibility for information relied upon later found to have been inaccurate. The consultant reserves the right to make such adjustments to the analyses, opinions and conclusions set forth in this report as may be required by consideration of additional data or more reliable data that may become available.
Hidden Conditions - The consultant assumes no responsibility for hidden or unapparent conditions of the property, subsoil, ground water or structures that render the subject property more or less valuable. No responsibility is assumed for arranging for engineering, geologic or environmental studies that may be required to discover such hidden or unapparent conditions.
Hazardous Materials - The consultant has not been provided any information regarding the presence of any material or substance on or in any portion of the subject property or improvements thereon, which material or substance possesses or may possess toxic, hazardous and/or other harmful and/or dangerous characteristics. Unless otherwise stated in the report, the consultant did not become aware of the presence of any such material or substance during the consultant's inspection of the subject property. However, the consultant is not qualified to investigate or test for the presence of such materials or substances. The presence of such materials or substances may adversely affect the value of the subject property. The value estimated in this report is predicated on the assumption that no such material or substance is present on or in the subject property or in such proximity thereto that it would cause a loss in value. The consultant assumes no responsibility for the presence of any such substance or material on or in the subject property, nor for any expertise or engineering knowledge required to discover the presence of such substance or material. Unless otherwise stated, this report assumes the subject property is in compliance with all federal, state and local environmental laws, regulations and rules.
Zoning and land Use - Unless otherwise stated, the projections were formulated assuming the hotel to be in full compliance with all applicable zoning and land use regulations and restrictions.
licenses and Permits - Unless otherwise stated, the property is assumed to have all required licenses, permits, certificates, consents or other legislative and/or administrative authority from any local, state or national government or private entity or organization have been or can be obtained or renewed for any use on which the value estimate contained in this report is based.
Engineering Survey - No engineering survey has been made by the consultant. Except as specifically stated, data relative to size and area of the subject property was taken from sources considered reliable and no encroachment of the subject property is considered to exist.
Subsurface Rights - No opinion is expressed as to the value of subsurface oil, gas or mineral rights or whether the property is subject to surface entry for the exploration or removal of such materials, except as is expressly stated.
Maps, Plats and Exhibits - Maps, plats and exhibits included in this report are for illustration only to serve as an aid in visualizing matters discussed within the report. They should not be considered as surveys or relied upon for any other purpose, nor should they be removed from, reproduced or used apart from the report.
STATEMENT OF ASSUMPTIONS AND LIMITING CONDITIONS (continued)
legal Matters - No opinion is intended to be expressed for matters which require legal expertise or specialized investigation or knowledge beyond that customarily employed by real estate consultants.
Right of Publication - Possession of this report, or a copy of it, does not carry with it the right of publication. Without the written consent of the consultant, this report may not be used for any purpose by any person other than the party to whom it is addressed. In any event, this report may be used only with proper written qualification and only in its entirety for its stated purpose.
Testimony in Court - Testimony or attendance in court or at any other hearing is not required by reason of rendering this appraisal, unless such arrangements are made a reasonable time in advance of said hearing. Further, unless otherwise indicated, separate arrangements shall be made concerning compensation for the consultant's time to prepare for and attend any such hearing. .
Archeological Significance - No investigation has been made by the consultant and no information has been provided to the consultant regarding potential archeological significance of the subject property or any portion thereof. This report assumes no portion of the subject property has archeological significance.
Compliance with the American Disabilities Act - The Americans with Disabilities Act ("ADA") became effective January 26, 1992. We assumed that the property will be in direct compliance with the various detailed requirements of the ADA.
Definitions and Assumptions - The definitions and assumptions upon which our analyses, opinions and conclusions are based are set forth in appropriate sections of this report and are to be part of these general assumptions as if included here in their entirety.
Dissemination of Material - Neither all nor any part of the contents of this report shall be disseminated to the general public through advertising or sales media, public relations media, news media or other public means of communication without the prior written consent and approval of the consultant(s).
Distribution and liability to Third Parties - The party for whom this report was prepared may distribute copies of this appraisal report only in its entirety to such third parties as may be selected by the party for whom this report was prepared; however, portions of this report shall not be given to third parties without our written consent. Liability to third parties will not be accepte§!.
Use in Offering Materials - This report, including all cash flow forecasts, market surveys and related data, conclusions, exhibits and supporting documentation, may not be reproduced or references made to the report or to PKF Consulting in any sale offering, prospectus, public or private placement memorandum, proxy statement or other document ("Offering Material") in connection with a merger, liquidation or other corporate transaction unless PKF Consulting has approved in writing the text of any such reference or reproduction prior to the distribution and filing thereof.
Limits to Liability - PKF Consulting cannot be held liable in any cause of action resulting in litigation for any dollar amount, which exceeds the total fees collected from this individual engagement.
legal Expenses - Any legal expenses incurred in defending or representing ourselves concerning this assignment will be the responsibility of the client.
ATTACHMENT 7
2012-13 ECONOMIC FORECAST AND INDUSTRY OUTLOOK REPORT PREPARED BY
THE LOS ANGELES COUNTY ECONOMIC DEVELOPMENT CORPORATION
LOS ANGELES COUNTY ECONOMIC DEVELOPMENT CORPORATION
2012-2013 ECONOMIC FORECAST AND INDUSTRY OUTLOOK
EMERGING OPPORTUNITIES AND NEW CHALLENGES IN 2012 AND BEYOND
THE KYSER CENTER FOR ECONOMIC RESEARCH
THE LAEDC THANKS THE FOLLOWING BUSINESS LEADERS FOR THEIR GENEROUS SUPPORT:
For information about LAEDC membership, contact Justin Goodkind (213) 236-4813.
Reports printed by Graphics & Beyond - (213) 625-8283 - www.graphicsandbeyond.com

THE 2012-2013 ECONOMIC FORECAST & INDUSTRY OUTLOOK EVENT IS SPONSORED BY:
MEDIA SPONSORS:
providing LIVE audiovisual technology
EVENT SPONSORS:

Los Angeles County Economic Development Corporation The Kyser Center for Economic Research 444 S. Flower St., 37th Floor, Los Angeles, CA 90071 Tel: 213-622-4300 or 888-4-LAEDC-1 Fax: 213-622-7100 Web: http://laedc.org
Kyser Center for Economic Research 2012-2013 Economic Forecast and
Industry Outlook
California & Southern California Including the National & International Setting
Prepared by: Robert Kleinhenz, Ph.D.
Kimberly Ritter-Martinez Ferdinando Guerra
Rafael De Anda
February 2012
© 2012 Los Angeles County Economic Development Corporation www.laedc.org 444 S. Flower Street, 37th Fl., Los Angeles, CA 90071 E: [email protected] T: 213.622.4300 F: 213.622.7100
The LAEDC, the region's premier business leadership organization, is a private, non-profit 501(c)3 organization established in 1981. As Southern California’s premier business leadership organization, the mission of the LAEDC is to attract, retain, and grow businesses and jobs for the regions of Los Angeles County. Since 1996, the LAEDC has helped retain or attract more than 171,300 jobs, providing $8.4 billion in direct economic impact from salaries and more than $144 million in tax revenue benefit to local governments and education in Los Angeles County (numbers last updated on March 31, 2011). Regional Leadership The members of the LAEDC are civic leaders and ranking executives of the region’s leading public and private organizations. Through financial support and direct participation in the mission, programs, and public policy initiatives of the LAEDC, the members are committed to playing a decisive role in shaping the region’s economic future. Business Services The LAEDC’s Business Development and Assistance Program provides essential services to L.A. County businesses at no cost, including coordinating site searches, securing incentives and permits, and identifying traditional and nontraditional financing including industrial development bonds. The LAEDC also works with workforce training, transportation, and utility providers. Economic Information Through our public information and for-fee research, the LAEDC provides critical economic analysis to business decision makers, education, media, and government. We publish a wide variety of industry focused and regional analysis, and our Economic Forecast report, produced by the Kyser Center for Economic Research, has been ranked #1 by the Wall Street Journal. Economic and Policy Analysis Group The LAEDC Economic and Policy Analysis Group offers thoughtful, highly regarded economic and policy expertise to private- and public-sector clients. The LAEDC takes a flexible approach to problem solving, supplementing its in-house staff when needed with outside firms and consultants. Depending on our clients' needs, the LAEDC will assemble and lead teams for complex, long-term projects; contribute to other teams as a subcontractor; or act as sole consultant. Leveraging our Leadership The LAEDC Center for Economic Development partners with the Southern California Leadership Council to help enable public sector officials, policy makers, and other civic leaders to address and solve public policy issues critical to the region’s economic vitality and quality of life. Global Connections The World Trade Center Association Los Angeles-Long Beach works to support the development of international trade and business opportunities for Southern California companies as the leading international trade association, trade service organization and trade resource in Los Angeles County. It also promotes the Los Angeles region as a destination for foreign investment. The WTCA LA-LB is a subsidiary of the Los Angeles County Economic Development Corporation. For more information, please visit www.wtca-lalb.org
Special acknowledgement and thanks to Kiana Perez, Economic Research Intern
TABLE OF CONTENTS I. 2012-2013 FORECAST AT A GLANCE ........................................................................................................ 1
II. OUTLOOK FOR THE U.S. ECONOMY ......................................................................................................... 2
Key Sectors ............................................................................................................................................................. 3 Monetary Policy and Interest Rates ..................................................................................................................... 8 Fiscal Policy ......................................................................................................................................................... 10 U.S. Forecast and Risks ....................................................................................................................................... 12 III. OUTLOOK FOR THE INTERNATIONAL ECONOMY .................................................................................. 14 Major Regions ..................................................................................................................................................... 15 Foreign Exchange Rates ...................................................................................................................................... 27 IV. OUTLOOK FOR THE CALIFORNIA ECONOMY ......................................................................................... 31 Trends in Major Industries .................................................................................................................................. 31 Gross Product Comparison .................................................................................................................................. 36 V. OUTLOOK FOR LOS ANGELES COUNTY .................................................................................................. 44
VI. OUTLOOK FOR ORANGE COUNTY.......................................................................................................... 49
VII. OUTLOOK FOR RIVERSIDE AND SAN BERNARDINO COUNTIES ............................................................. 55
VIII. OUTLOOK FOR VENTURA COUNTY ........................................................................................................ 61
IX. OUTLOOK FOR SAN DIEGO COUNTY ...................................................................................................... 67
X. MAJOR INDUSTRIES OF THE SOUTHERN CALIFORNIA ECONOMY ........................................................ 74 Apparel Design & Manufacturing ..................................................................................................................... 74 Business & Professional Management Services ................................................................................................ 75 Financial Services .............................................................................................................................................. 77 Health Services .................................................................................................................................................. 78 International Trade/Goods Movement............................................................................................................. 78 Motion Picture/TV Production .......................................................................................................................... 81 Technology ........................................................................................................................................................ 83 Travel & Tourism ............................................................................................................................................... 84
XI. OUTLOOK FOR CONSTRUCTION & RETAILING ........................................................................................ 86 Residential Real Estate ...................................................................................................................................... 86 Nonresidential Real Estate ................................................................................................................................ 93 Southern California Retail Trends ..................................................................................................................... 99 INDEX OF STATISTICAL TABLES ............................................................................................................ 102
Robert Kleinhenz Ph.D
Chief Economist National & California Outlook Los Angeles County Outlook
Industry Profiles
Kimberly Ritter-Martinez Associate Economist
Monetary & Fiscal Policy Construction, Real Estate & Retailing Orange & San Diego County Outlooks
Industry Profiles
Ferdinando Guerra
Associate Economist International Outlook & Foreign Exchange
Gross Product Comparisons Inland Empire Outlook
Industry Profiles
Rafael De Anda Research Assistant
Ventura County Outlook Industry Profiles
February 15, 2012
Good morning, Ladies and Gentlemen, and welcome to the LAEDC’s 2012-2013 Annual Forecast.
The LAEDC’s Economic Forecast is Southern California’s premier source for in-depth economic information and analysis on our global, national, state and regional economies. Each forecast release is accompanied by a public event featuring the insights of influential economists and leaders from both the public and private sectors. The forecast report is produced by the LAEDC’s Kyser Center for Economic Research, led by its new Chief Economist, Dr. Robert Kleinhenz.
A panel of expert economists has joined Dr. Kleinhenz today in his debut forecast for the LAEDC to provide a comprehensive and in-depth analysis of our local, state, national, and global economies. The panel includes: Kevin Klowden, Director of the California Center at the Milken Institute; Dr. Edward E. Leamer, the Chauncey J. Medberry Professor of Management, Professor of Economics and Professor of Statistics at UCLA; and Dr. Sung Won Sohn, Smith Professor of Economics California State University Channel Islands and Vice Chairman of multi-national retailer Forever 21. In addition, Dr. Christine Cooper, Vice President of the LAEDC’s Economic and Policy Analysis Group, will provide a fresh outlook for the region’s top traded and population-serving clusters. Repeating his role as Master of Ceremonies, Frank Mottek reports on the regional business and economic news for KNX 1070 NewsRadio where he is the host of the KNX Business Hour, the number one business radio show in Southern California.
This morning’s event has been made possible by a number of generous sponsors, including AGF Media Services, Chevron, Deloitte, Insperity, Loyola Marymount University, Manpower, Mercedes-Benz Driving Academy, the Port of Los Angeles, Studley, Union Bank, and Wal-Mart.
We are also pleased to announce the completion of the second year of implementation for the five-year Los Angeles County Strategic Plan for Economic Development. Year two’s many successes have been catalogued and will be delivered to the public in a Year Two Progress Report in the coming weeks. As we begin the third year of the plan’s implementation, we thank all of you who have turned this consensus plan – comprised of five aspirational goals, 12 objectives, and 52 individual strategies – into an “on-the-ground” program of action.
Due in large part to our shared commitment to implementation, we have seen the Strategic Plan serve as the impetus and model for many other planning efforts going on throughout California. Your ongoing support continues to show California and the nation just what can be achieved when public and private sector leaders come together with environment, education, labor, and community stakeholders to solve difficult problems facing our economy.
If you have not already done so, we would encourage you to find out more about the Strategic Plan at lacountystrategicplan.com and consider an endorsement of the Plan’s aspirational goals. Stand with the LAEDC and many other organizations, cities, and public officials who are committed to promoting a sustainable, thriving, and competitive 21st Century economy in Los Angeles County.
Thank you for your continued support of the LAEDC and our mission to attract, retain, and grow businesses and jobs for the people of Los Angeles County.
Sincerely,
Bill AllenPresident and CEO
2012-2013 Forecast at a Glance
LAEDC Kyser Center for Economic Research 1 Economic Forecast, February 2012
I. 2012-2013 FORECAST AT A GLANCE
The U.S. Economy
Below par growth and slow improvement in labor market Consumer sector key to improvement, potential drag from slower global growth Oil prices a perennial concern
Leading Sectors: Consumer Spending, Exports, Business Equipment Spending
Trailing Sectors: Construction, State/Local Government Spending
The California Economy
State improvement tied to nation and trading partners Private sector job gains, public sector job losses, unemployment rate improves slowly Working through housing sector problems, but signs of improvement
Leading Sectors: High-Tech, Tourism, International Trade
Trailing Sectors: Construction, State/Local Government Spending
Southern California Economy
Economic gains tied to nation
Orange County leading region in recovery and expansion
Recovery proceeds despite concerns about housing and state/local fiscal problems
Leading Sectors: High-Tech, Tourism, International Trade, Entertainment
Trailing Sectors: Construction, State/Local Government Spending
2011 2012 2013
Real GDP (% Change) +1.7% +1.9% +2.3% Nonfarm Jobs (% Change) +1.1% +1.1% +1.4% Unemployment Rate 9.0% 8.5% 8.3% Consumer Price Index (% Change) +3.2% +1.8% +1.9%
2011 2012 2013
Unemployment Rate 11.8% 11.1% 10.3% Nonfarm Jobs (% Change) +1.4% +1.5% +1.8% Population Growth (% Change) +0.7% +0.9% +0.9%
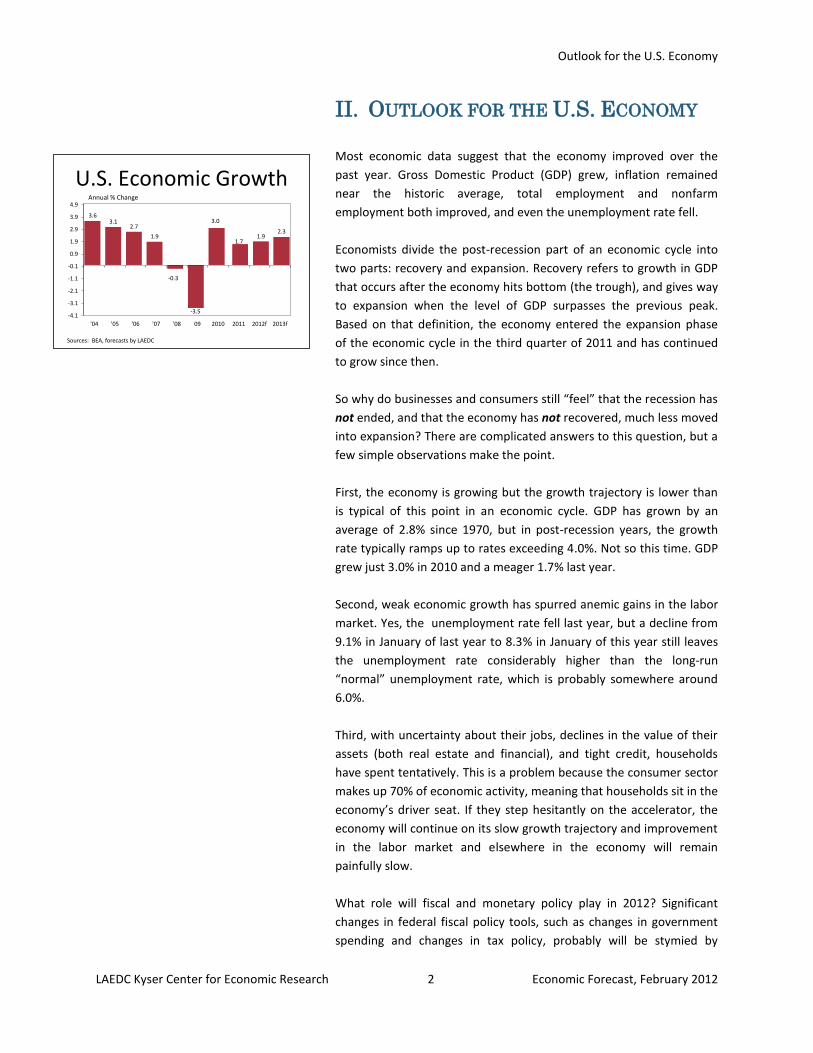
Outlook for the U.S. Economy
LAEDC Kyser Center for Economic Research 2 Economic Forecast, February 2012
3.63.1
2.7
1.9
-0.3
-3.5
3.0
1.71.9
2.3
-4.1
-3.1
-2.1
-1.1
-0.1
0.9
1.9
2.9
3.9
4.9
'04 '05 '06 '07 '08 09 2010 2011 2012f 2013f
U.S. Economic Growth
Sources: BEA, forecasts by LAEDC
Annual % Change
II. OUTLOOK FOR THE U.S. ECONOMY
Most economic data suggest that the economy improved over the
past year. Gross Domestic Product (GDP) grew, inflation remained
near the historic average, total employment and nonfarm
employment both improved, and even the unemployment rate fell.
Economists divide the post-recession part of an economic cycle into
two parts: recovery and expansion. Recovery refers to growth in GDP
that occurs after the economy hits bottom (the trough), and gives way
to expansion when the level of GDP surpasses the previous peak.
Based on that definition, the economy entered the expansion phase
of the economic cycle in the third quarter of 2011 and has continued
to grow since then.
So why do businesses and consumers still “feel” that the recession has
not ended, and that the economy has not recovered, much less moved
into expansion? There are complicated answers to this question, but a
few simple observations make the point.
First, the economy is growing but the growth trajectory is lower than
is typical of this point in an economic cycle. GDP has grown by an
average of 2.8% since 1970, but in post-recession years, the growth
rate typically ramps up to rates exceeding 4.0%. Not so this time. GDP
grew just 3.0% in 2010 and a meager 1.7% last year.
Second, weak economic growth has spurred anemic gains in the labor
market. Yes, the unemployment rate fell last year, but a decline from
9.1% in January of last year to 8.3% in January of this year still leaves
the unemployment rate considerably higher than the long-run
“normal” unemployment rate, which is probably somewhere around
6.0%.
Third, with uncertainty about their jobs, declines in the value of their
assets (both real estate and financial), and tight credit, households
have spent tentatively. This is a problem because the consumer sector
makes up 70% of economic activity, meaning that households sit in the
economy’s driver seat. If they step hesitantly on the accelerator, the
economy will continue on its slow growth trajectory and improvement
in the labor market and elsewhere in the economy will remain
painfully slow.
What role will fiscal and monetary policy play in 2012? Significant
changes in federal fiscal policy tools, such as changes in government
spending and changes in tax policy, probably will be stymied by
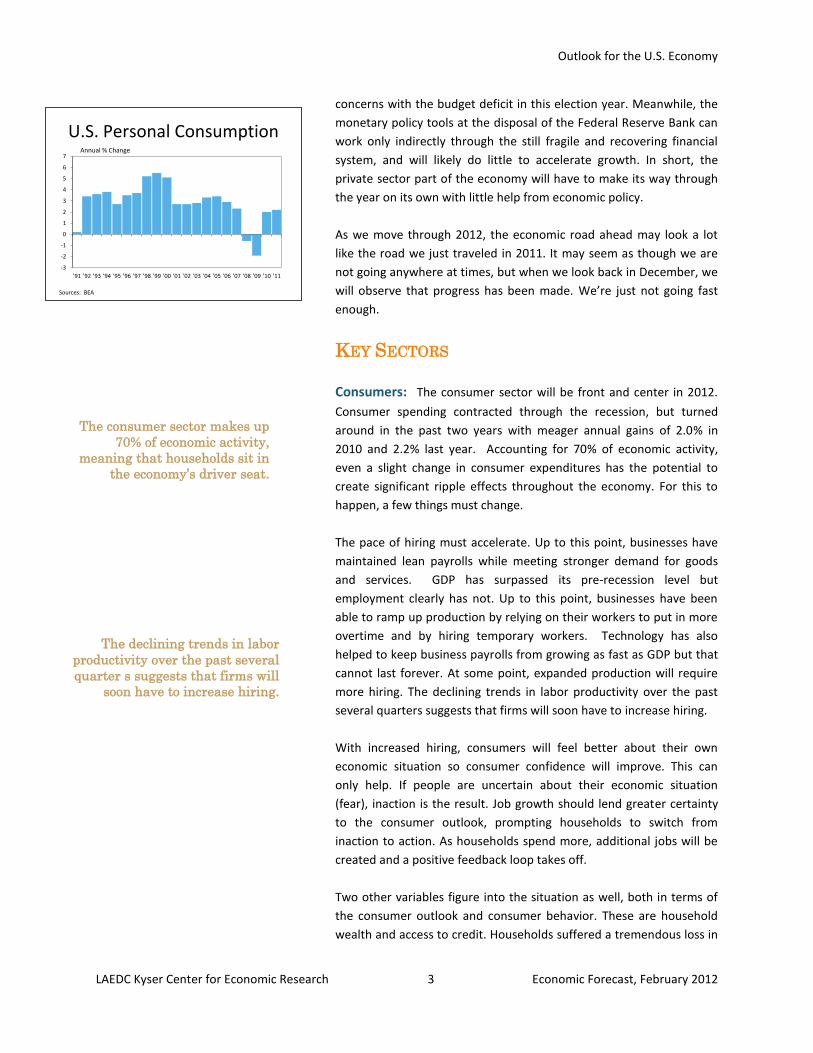
Outlook for the U.S. Economy
LAEDC Kyser Center for Economic Research 3 Economic Forecast, February 2012
U.S. Personal Consumption
Sources: BEA
Annual % Change
-3
-2
-1
0
1
2
3
4
5
6
7
'91 '92 '93 '94 '95 '96 '97 '98 '99 '00 '01 '02 '03 '04 '05 '06 '07 '08 '09 '10 '11
concerns with the budget deficit in this election year. Meanwhile, the
monetary policy tools at the disposal of the Federal Reserve Bank can
work only indirectly through the still fragile and recovering financial
system, and will likely do little to accelerate growth. In short, the
private sector part of the economy will have to make its way through
the year on its own with little help from economic policy.
As we move through 2012, the economic road ahead may look a lot
like the road we just traveled in 2011. It may seem as though we are
not going anywhere at times, but when we look back in December, we
will observe that progress has been made. We’re just not going fast
enough.
KEY SECTORS
Consumers: The consumer sector will be front and center in 2012.
Consumer spending contracted through the recession, but turned
around in the past two years with meager annual gains of 2.0% in
2010 and 2.2% last year. Accounting for 70% of economic activity,
even a slight change in consumer expenditures has the potential to
create significant ripple effects throughout the economy. For this to
happen, a few things must change.
The pace of hiring must accelerate. Up to this point, businesses have
maintained lean payrolls while meeting stronger demand for goods
and services. GDP has surpassed its pre-recession level but
employment clearly has not. Up to this point, businesses have been
able to ramp up production by relying on their workers to put in more
overtime and by hiring temporary workers. Technology has also
helped to keep business payrolls from growing as fast as GDP but that
cannot last forever. At some point, expanded production will require
more hiring. The declining trends in labor productivity over the past
several quarters suggests that firms will soon have to increase hiring.
With increased hiring, consumers will feel better about their own
economic situation so consumer confidence will improve. This can
only help. If people are uncertain about their economic situation
(fear), inaction is the result. Job growth should lend greater certainty
to the consumer outlook, prompting households to switch from
inaction to action. As households spend more, additional jobs will be
created and a positive feedback loop takes off.
Two other variables figure into the situation as well, both in terms of
the consumer outlook and consumer behavior. These are household
wealth and access to credit. Households suffered a tremendous loss in
The consumer sector makes up
70% of economic activity,
meaning that households sit in
the economy’s driver seat.
The declining trends in labor
productivity over the past several
quarter s suggests that firms will
soon have to increase hiring.
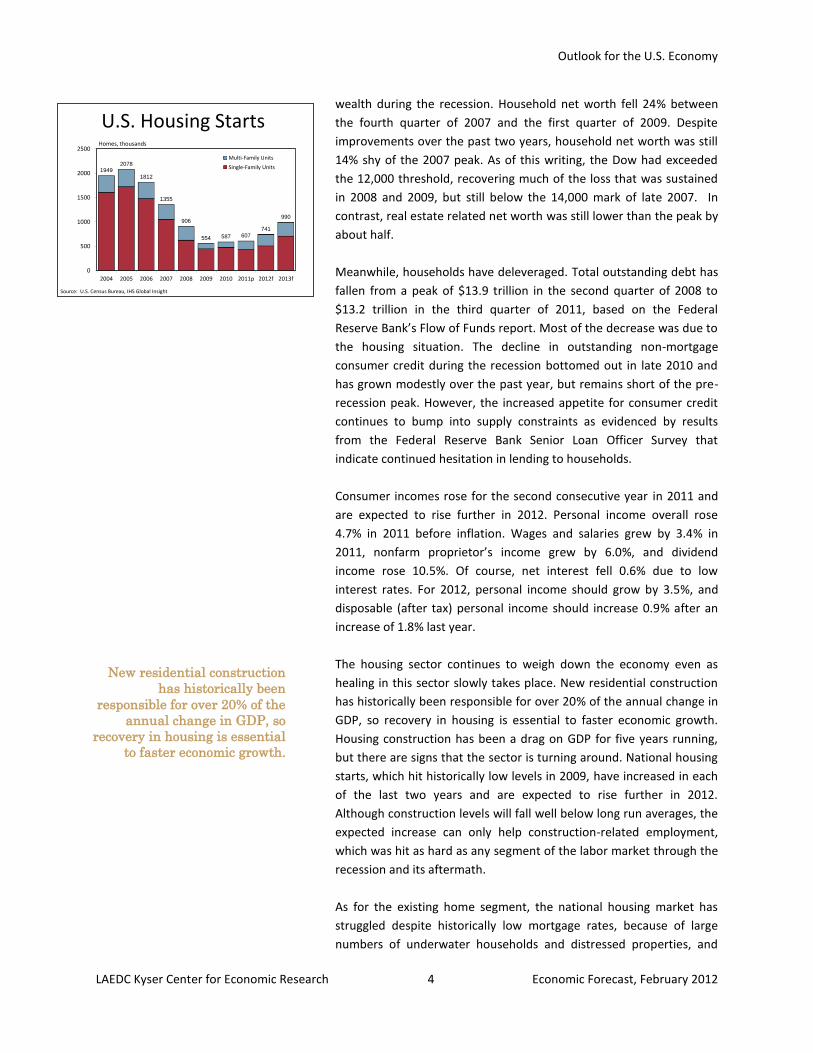
Outlook for the U.S. Economy
LAEDC Kyser Center for Economic Research 4 Economic Forecast, February 2012
U.S. Housing Starts
19492078
1812
1355
906
554 587 607741
990
0
500
1000
1500
2000
2500
2004 2005 2006 2007 2008 2009 2010 2011p 2012f 2013f
Multi-Family Units
Single-Family Units
Source: U.S. Census Bureau, IHS Global Insight
Homes, thousands
wealth during the recession. Household net worth fell 24% between
the fourth quarter of 2007 and the first quarter of 2009. Despite
improvements over the past two years, household net worth was still
14% shy of the 2007 peak. As of this writing, the Dow had exceeded
the 12,000 threshold, recovering much of the loss that was sustained
in 2008 and 2009, but still below the 14,000 mark of late 2007. In
contrast, real estate related net worth was still lower than the peak by
about half.
Meanwhile, households have deleveraged. Total outstanding debt has
fallen from a peak of $13.9 trillion in the second quarter of 2008 to
$13.2 trillion in the third quarter of 2011, based on the Federal
Reserve Bank’s Flow of Funds report. Most of the decrease was due to
the housing situation. The decline in outstanding non-mortgage
consumer credit during the recession bottomed out in late 2010 and
has grown modestly over the past year, but remains short of the pre-
recession peak. However, the increased appetite for consumer credit
continues to bump into supply constraints as evidenced by results
from the Federal Reserve Bank Senior Loan Officer Survey that
indicate continued hesitation in lending to households.
Consumer incomes rose for the second consecutive year in 2011 and
are expected to rise further in 2012. Personal income overall rose
4.7% in 2011 before inflation. Wages and salaries grew by 3.4% in
2011, nonfarm proprietor’s income grew by 6.0%, and dividend
income rose 10.5%. Of course, net interest fell 0.6% due to low
interest rates. For 2012, personal income should grow by 3.5%, and
disposable (after tax) personal income should increase 0.9% after an
increase of 1.8% last year.
The housing sector continues to weigh down the economy even as
healing in this sector slowly takes place. New residential construction
has historically been responsible for over 20% of the annual change in
GDP, so recovery in housing is essential to faster economic growth.
Housing construction has been a drag on GDP for five years running,
but there are signs that the sector is turning around. National housing
starts, which hit historically low levels in 2009, have increased in each
of the last two years and are expected to rise further in 2012.
Although construction levels will fall well below long run averages, the
expected increase can only help construction-related employment,
which was hit as hard as any segment of the labor market through the
recession and its aftermath.
As for the existing home segment, the national housing market has
struggled despite historically low mortgage rates, because of large
numbers of underwater households and distressed properties, and
New residential construction
has historically been
responsible for over 20% of the
annual change in GDP, so
recovery in housing is essential
to faster economic growth.
Outlook for the U.S. Economy
LAEDC Kyser Center for Economic Research 5 Economic Forecast, February 2012
tight underwriting standards that may be constraining the demand
side of the market and contributing to weakness in home prices. Still,
there have been improvements: The percentage of underwater
households has edged down over the last several quarters while the
percentage of non-distressed properties in the market has grown. The
market is headed in the right direction, but is proceeding very slowly
and full recovery is probably at least two years away. Meanwhile,
demographic trends point to pent-up demand for housing that will be
unleashed on the market as the economy gathers momentum.
Businesses: Businesses have been poised to grow for at least two
years. They pared payrolls and other expenses during the recession,
and stand ready to expand production if demand accelerates. To be
sure, businesses are spending. Business spending on equipment and
software turned around in 2010 with a 14.6% increase and rose again
in 2011 by 10.3%. Given the overall state of the real estate market,
nonresidential structures took longer to recover, but registered a 4.1%
increase last year.
Firms are expected to increase their spending on both categories of
business spending in 2012, contributing to expansion in the overall
economy. Significantly, more spending should occur across a wide
swath of the economy, with increased outlays on computers and
peripherals, industrial equipment, transportation equipment, and
structures in health care, manufacturing, utilities, and mining. This is
yet another sign that more sectors of the economy are headed in the
right direction.
Government: Federal, state, and local government will continue to
face challenges in 2012 and beyond, with consequences for the labor
market, the financial markets, and the overall economy. At the federal
level, the budget deficit hit $1.3 trillion in each of the last two years.
While down from a $1.4 trillion deficit in 2009, trillion dollar multi-
year deficits are a painful reminder of the depth of the recession.
High deficits should be a concern for all. But a large portion of the
deficit over the past three years was due to the recession, which
triggered a decline in federal receipts that has not yet returned to pre-
recession levels, and gave rise to elevated outlays. Among these
outlays, automatic stabilizers such as unemployment benefits and
government health insurance should diminish as the economy
improves. Indeed, things are moving in the right direction. The deficit
should fall to an even $1 trillion this year, and drop in the coming
years as the economy gathers momentum.
During the recession and recovery period, the U.S. government made extensive use of expansionary fiscal policy:
Economic Stabilization Act (2008)
Troubled Asset Relief Plan (2008)
American Recovery Reinvestment Act
(2009)
Tax Relief, Unemployment Insurance
Reauthorization and Job Creation Act
(2010)
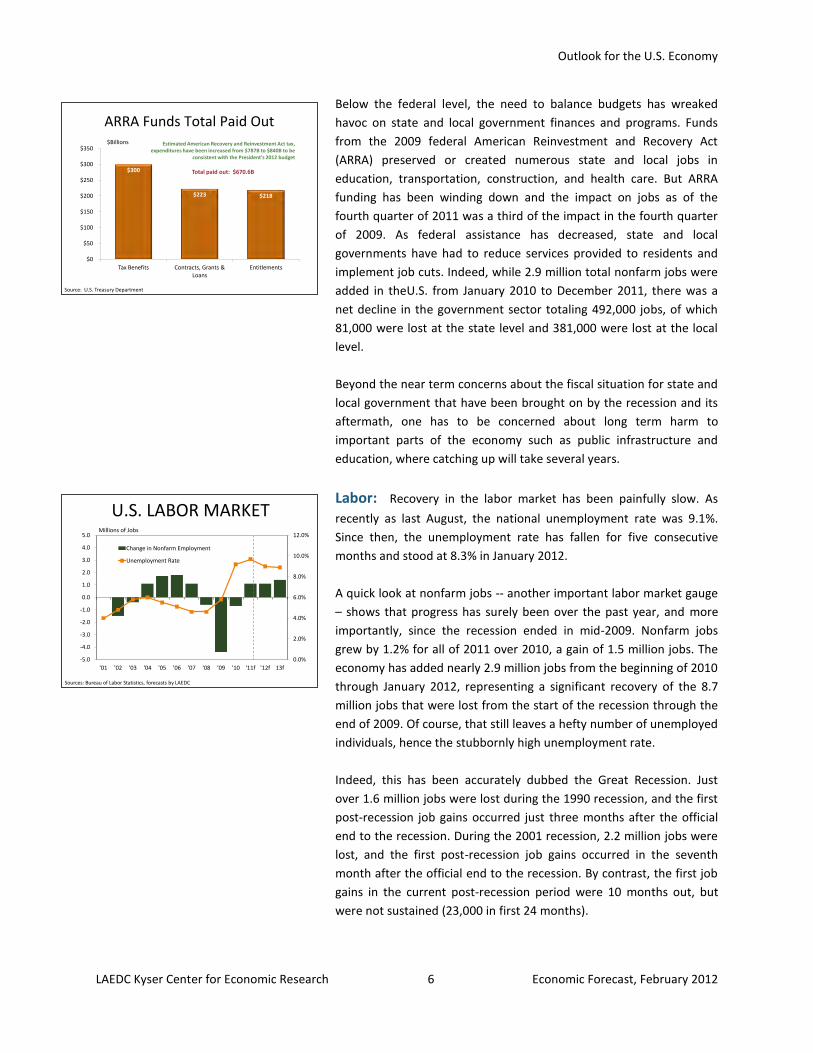
Outlook for the U.S. Economy
LAEDC Kyser Center for Economic Research 6 Economic Forecast, February 2012
U.S. LABOR MARKET
0.0%
2.0%
4.0%
6.0%
8.0%
10.0%
12.0%
-5.0
-4.0
-3.0
-2.0
-1.0
0.0
1.0
2.0
3.0
4.0
5.0
'01 '02 '03 '04 '05 '06 '07 '08 '09 '10 '11f '12f 13f
Change in Nonfarm Employment
Unemployment Rate
Sources: Bureau of Labor Statistics, forecasts by LAEDC
Millions of Jobs
ARRA Funds Total Paid Out
Source: U.S. Treasury Department
$300
$223 $218
$0
$50
$100
$150
$200
$250
$300
$350
Tax Benefits Contracts, Grants & Loans
Entitlements
$Billions Estimated American Recovery and Reinvestment Act tax, expenditures have been increased from $787B to $840B to be
consistent with the President's 2012 budget
Total paid out: $670.6B
Below the federal level, the need to balance budgets has wreaked
havoc on state and local government finances and programs. Funds
from the 2009 federal American Reinvestment and Recovery Act
(ARRA) preserved or created numerous state and local jobs in
education, transportation, construction, and health care. But ARRA
funding has been winding down and the impact on jobs as of the
fourth quarter of 2011 was a third of the impact in the fourth quarter
of 2009. As federal assistance has decreased, state and local
governments have had to reduce services provided to residents and
implement job cuts. Indeed, while 2.9 million total nonfarm jobs were
added in theU.S. from January 2010 to December 2011, there was a
net decline in the government sector totaling 492,000 jobs, of which
81,000 were lost at the state level and 381,000 were lost at the local
level.
Beyond the near term concerns about the fiscal situation for state and
local government that have been brought on by the recession and its
aftermath, one has to be concerned about long term harm to
important parts of the economy such as public infrastructure and
education, where catching up will take several years.
Labor: Recovery in the labor market has been painfully slow. As
recently as last August, the national unemployment rate was 9.1%.
Since then, the unemployment rate has fallen for five consecutive
months and stood at 8.3% in January 2012.
A quick look at nonfarm jobs -- another important labor market gauge
– shows that progress has surely been over the past year, and more
importantly, since the recession ended in mid-2009. Nonfarm jobs
grew by 1.2% for all of 2011 over 2010, a gain of 1.5 million jobs. The
economy has added nearly 2.9 million jobs from the beginning of 2010
through January 2012, representing a significant recovery of the 8.7
million jobs that were lost from the start of the recession through the
end of 2009. Of course, that still leaves a hefty number of unemployed
individuals, hence the stubbornly high unemployment rate.
Indeed, this has been accurately dubbed the Great Recession. Just
over 1.6 million jobs were lost during the 1990 recession, and the first
post-recession job gains occurred just three months after the official
end to the recession. During the 2001 recession, 2.2 million jobs were
lost, and the first post-recession job gains occurred in the seventh
month after the official end to the recession. By contrast, the first job
gains in the current post-recession period were 10 months out, but
were not sustained (23,000 in first 24 months).
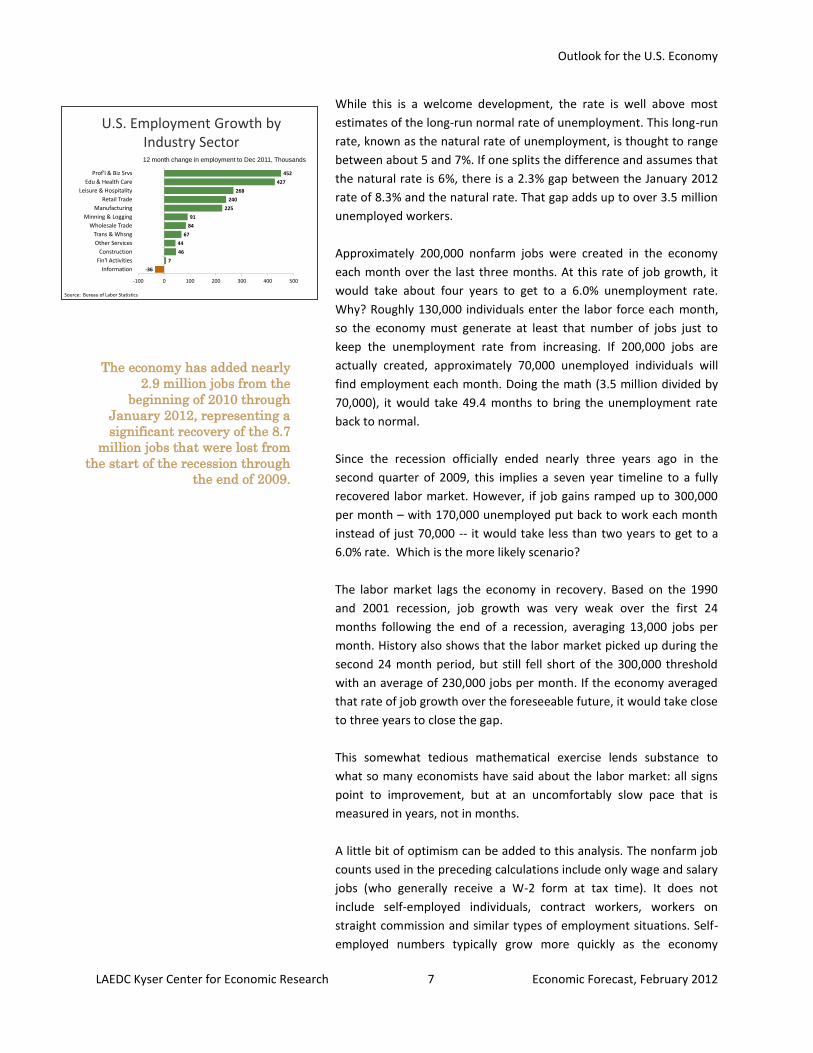
Outlook for the U.S. Economy
LAEDC Kyser Center for Economic Research 7 Economic Forecast, February 2012
U.S. Employment Growth by Industry Sector
Source: Bureau of Labor Statistics
12 month change in employment to Dec 2011, Thousands
-36
7
46
44
67
84
91
225
240
268
427
452
-100 0 100 200 300 400 500
Information
Fin'l Activities
Construction
Other Services
Trans & Whsng
Wholesale Trade
Minning & Logging
Manufacturing
Retail Trade
Leisure & Hospitality
Edu & Health Care
Prof'l & Biz Srvs
While this is a welcome development, the rate is well above most
estimates of the long-run normal rate of unemployment. This long-run
rate, known as the natural rate of unemployment, is thought to range
between about 5 and 7%. If one splits the difference and assumes that
the natural rate is 6%, there is a 2.3% gap between the January 2012
rate of 8.3% and the natural rate. That gap adds up to over 3.5 million
unemployed workers.
Approximately 200,000 nonfarm jobs were created in the economy
each month over the last three months. At this rate of job growth, it
would take about four years to get to a 6.0% unemployment rate.
Why? Roughly 130,000 individuals enter the labor force each month,
so the economy must generate at least that number of jobs just to
keep the unemployment rate from increasing. If 200,000 jobs are
actually created, approximately 70,000 unemployed individuals will
find employment each month. Doing the math (3.5 million divided by
70,000), it would take 49.4 months to bring the unemployment rate
back to normal.
Since the recession officially ended nearly three years ago in the
second quarter of 2009, this implies a seven year timeline to a fully
recovered labor market. However, if job gains ramped up to 300,000
per month – with 170,000 unemployed put back to work each month
instead of just 70,000 -- it would take less than two years to get to a
6.0% rate. Which is the more likely scenario?
The labor market lags the economy in recovery. Based on the 1990
and 2001 recession, job growth was very weak over the first 24
months following the end of a recession, averaging 13,000 jobs per
month. History also shows that the labor market picked up during the
second 24 month period, but still fell short of the 300,000 threshold
with an average of 230,000 jobs per month. If the economy averaged
that rate of job growth over the foreseeable future, it would take close
to three years to close the gap.
This somewhat tedious mathematical exercise lends substance to
what so many economists have said about the labor market: all signs
point to improvement, but at an uncomfortably slow pace that is
measured in years, not in months.
A little bit of optimism can be added to this analysis. The nonfarm job
counts used in the preceding calculations include only wage and salary
jobs (who generally receive a W-2 form at tax time). It does not
include self-employed individuals, contract workers, workers on
straight commission and similar types of employment situations. Self-
employed numbers typically grow more quickly as the economy
The economy has added nearly
2.9 million jobs from the
beginning of 2010 through
January 2012, representing a
significant recovery of the 8.7
million jobs that were lost from
the start of the recession through
the end of 2009.
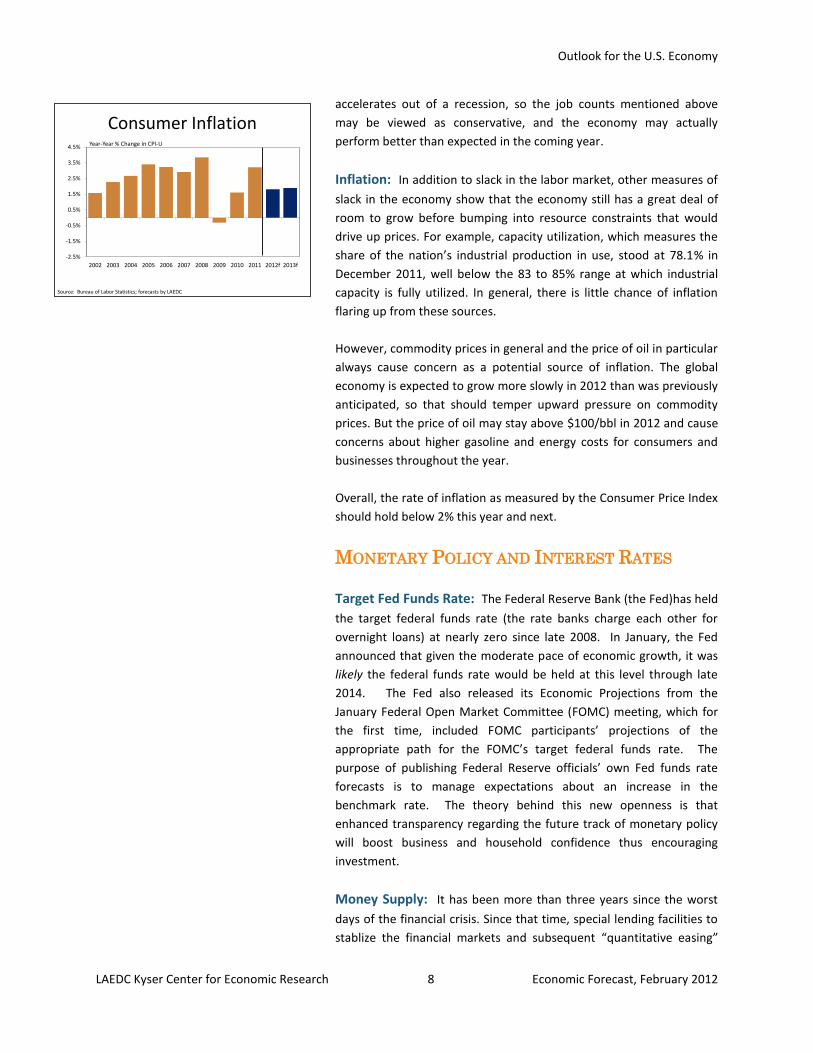
Outlook for the U.S. Economy
LAEDC Kyser Center for Economic Research 8 Economic Forecast, February 2012
Consumer Inflation
-2.5%
-1.5%
-0.5%
0.5%
1.5%
2.5%
3.5%
4.5%
2002 2003 2004 2005 2006 2007 2008 2009 2010 2011 2012f 2013f
Year-Year % Change in CPI-U
Source: Bureau of Labor Statistics; forecasts by LAEDC
accelerates out of a recession, so the job counts mentioned above
may be viewed as conservative, and the economy may actually
perform better than expected in the coming year.
Inflation: In addition to slack in the labor market, other measures of
slack in the economy show that the economy still has a great deal of
room to grow before bumping into resource constraints that would
drive up prices. For example, capacity utilization, which measures the
share of the nation’s industrial production in use, stood at 78.1% in
December 2011, well below the 83 to 85% range at which industrial
capacity is fully utilized. In general, there is little chance of inflation
flaring up from these sources.
However, commodity prices in general and the price of oil in particular
always cause concern as a potential source of inflation. The global
economy is expected to grow more slowly in 2012 than was previously
anticipated, so that should temper upward pressure on commodity
prices. But the price of oil may stay above $100/bbl in 2012 and cause
concerns about higher gasoline and energy costs for consumers and
businesses throughout the year.
Overall, the rate of inflation as measured by the Consumer Price Index
should hold below 2% this year and next.
MONETARY POLICY AND INTEREST RATES
Target Fed Funds Rate: The Federal Reserve Bank (the Fed)has held
the target federal funds rate (the rate banks charge each other for
overnight loans) at nearly zero since late 2008. In January, the Fed
announced that given the moderate pace of economic growth, it was
likely the federal funds rate would be held at this level through late
2014. The Fed also released its Economic Projections from the
January Federal Open Market Committee (FOMC) meeting, which for
the first time, included FOMC participants’ projections of the
appropriate path for the FOMC’s target federal funds rate. The
purpose of publishing Federal Reserve officials’ own Fed funds rate
forecasts is to manage expectations about an increase in the
benchmark rate. The theory behind this new openness is that
enhanced transparency regarding the future track of monetary policy
will boost business and household confidence thus encouraging
investment.
Money Supply: It has been more than three years since the worst
days of the financial crisis. Since that time, special lending facilities to
stablize the financial markets and subsequent “quantitative easing”
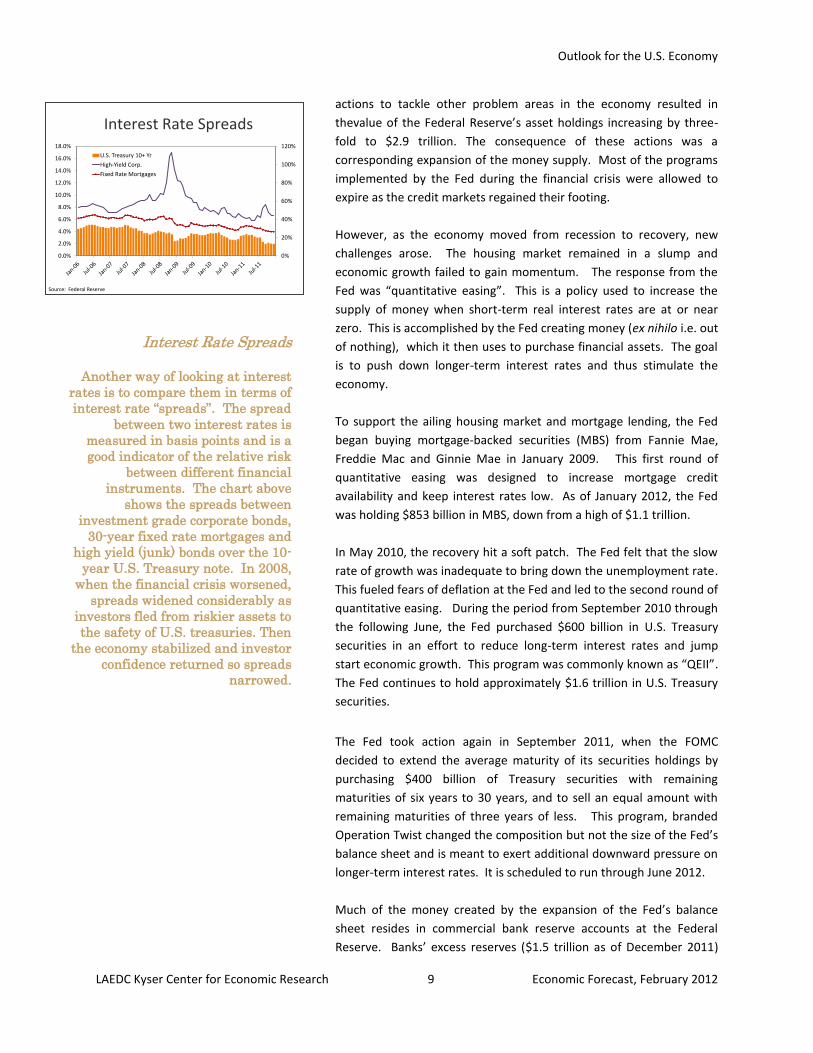
Outlook for the U.S. Economy
LAEDC Kyser Center for Economic Research 9 Economic Forecast, February 2012
Interest Rate Spreads
Another way of looking at interest
rates is to compare them in terms of
interest rate “spreads”. The spread
between two interest rates is
measured in basis points and is a
good indicator of the relative risk
between different financial
instruments. The chart above
shows the spreads between
investment grade corporate bonds,
30-year fixed rate mortgages and
high yield (junk) bonds over the 10-
year U.S. Treasury note. In 2008,
when the financial crisis worsened,
spreads widened considerably as
investors fled from riskier assets to
the safety of U.S. treasuries. Then
the economy stabilized and investor
confidence returned so spreads
narrowed.
Interest Rate Spreads
Source: Federal Reserve
0%
20%
40%
60%
80%
100%
120%
0.0%
2.0%
4.0%
6.0%
8.0%
10.0%
12.0%
14.0%
16.0%
18.0%
U.S. Treasury 10+ Yr
High-Yield Corp.
Fixed Rate Mortgages
actions to tackle other problem areas in the economy resulted in
thevalue of the Federal Reserve’s asset holdings increasing by three-
fold to $2.9 trillion. The consequence of these actions was a
corresponding expansion of the money supply. Most of the programs
implemented by the Fed during the financial crisis were allowed to
expire as the credit markets regained their footing.
However, as the economy moved from recession to recovery, new
challenges arose. The housing market remained in a slump and
economic growth failed to gain momentum. The response from the
Fed was “quantitative easing”. This is a policy used to increase the
supply of money when short-term real interest rates are at or near
zero. This is accomplished by the Fed creating money (ex nihilo i.e. out
of nothing), which it then uses to purchase financial assets. The goal
is to push down longer-term interest rates and thus stimulate the
economy.
To support the ailing housing market and mortgage lending, the Fed
began buying mortgage-backed securities (MBS) from Fannie Mae,
Freddie Mac and Ginnie Mae in January 2009. This first round of
quantitative easing was designed to increase mortgage credit
availability and keep interest rates low. As of January 2012, the Fed
was holding $853 billion in MBS, down from a high of $1.1 trillion.
In May 2010, the recovery hit a soft patch. The Fed felt that the slow
rate of growth was inadequate to bring down the unemployment rate.
This fueled fears of deflation at the Fed and led to the second round of
quantitative easing. During the period from September 2010 through
the following June, the Fed purchased $600 billion in U.S. Treasury
securities in an effort to reduce long-term interest rates and jump
start economic growth. This program was commonly known as “QEII”.
The Fed continues to hold approximately $1.6 trillion in U.S. Treasury
securities.
The Fed took action again in September 2011, when the FOMC
decided to extend the average maturity of its securities holdings by
purchasing $400 billion of Treasury securities with remaining
maturities of six years to 30 years, and to sell an equal amount with
remaining maturities of three years of less. This program, branded
Operation Twist changed the composition but not the size of the Fed’s
balance sheet and is meant to exert additional downward pressure on
longer-term interest rates. It is scheduled to run through June 2012.
Much of the money created by the expansion of the Fed’s balance
sheet resides in commercial bank reserve accounts at the Federal
Reserve. Banks’ excess reserves ($1.5 trillion as of December 2011)
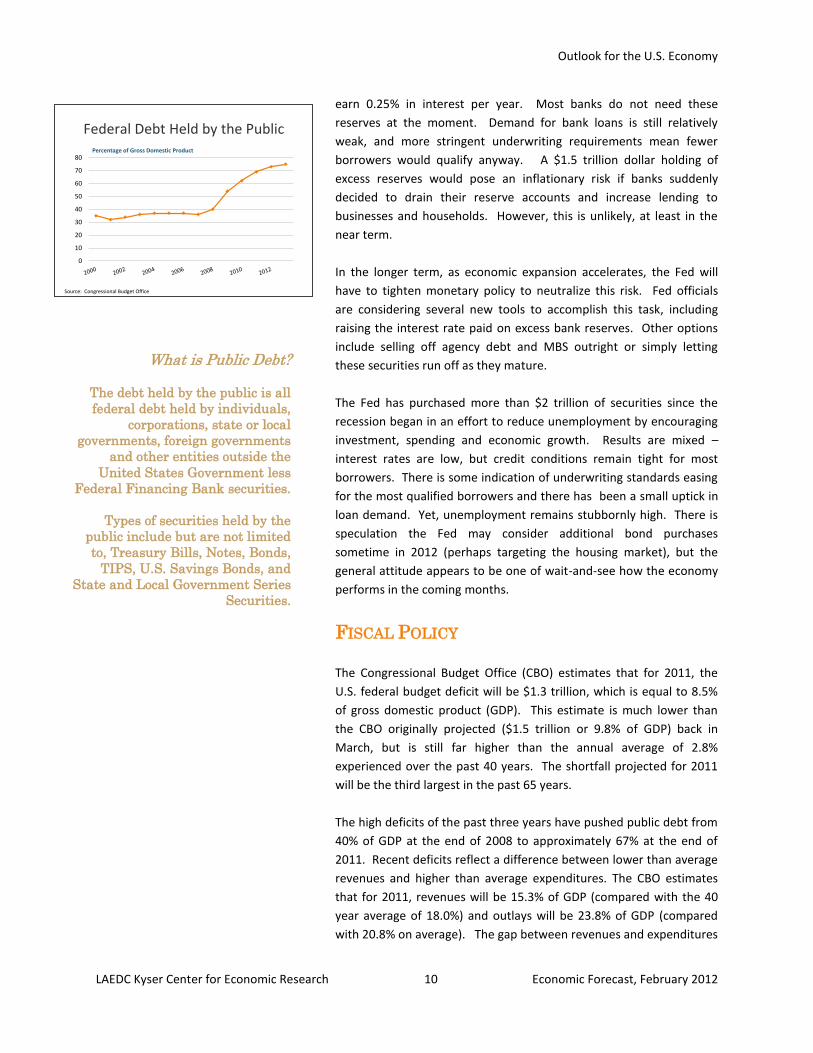
Outlook for the U.S. Economy
LAEDC Kyser Center for Economic Research 10 Economic Forecast, February 2012
0
10
20
30
40
50
60
70
80
Federal Debt Held by the Public
Source: Congressional Budget Office
Percentage of Gross Domestic Product
earn 0.25% in interest per year. Most banks do not need these
reserves at the moment. Demand for bank loans is still relatively
weak, and more stringent underwriting requirements mean fewer
borrowers would qualify anyway. A $1.5 trillion dollar holding of
excess reserves would pose an inflationary risk if banks suddenly
decided to drain their reserve accounts and increase lending to
businesses and households. However, this is unlikely, at least in the
near term.
In the longer term, as economic expansion accelerates, the Fed will
have to tighten monetary policy to neutralize this risk. Fed officials
are considering several new tools to accomplish this task, including
raising the interest rate paid on excess bank reserves. Other options
include selling off agency debt and MBS outright or simply letting
these securities run off as they mature.
The Fed has purchased more than $2 trillion of securities since the
recession began in an effort to reduce unemployment by encouraging
investment, spending and economic growth. Results are mixed –
interest rates are low, but credit conditions remain tight for most
borrowers. There is some indication of underwriting standards easing
for the most qualified borrowers and there has been a small uptick in
loan demand. Yet, unemployment remains stubbornly high. There is
speculation the Fed may consider additional bond purchases
sometime in 2012 (perhaps targeting the housing market), but the
general attitude appears to be one of wait-and-see how the economy
performs in the coming months.
FISCAL POLICY
The Congressional Budget Office (CBO) estimates that for 2011, the
U.S. federal budget deficit will be $1.3 trillion, which is equal to 8.5%
of gross domestic product (GDP). This estimate is much lower than
the CBO originally projected ($1.5 trillion or 9.8% of GDP) back in
March, but is still far higher than the annual average of 2.8%
experienced over the past 40 years. The shortfall projected for 2011
will be the third largest in the past 65 years.
The high deficits of the past three years have pushed public debt from
40% of GDP at the end of 2008 to approximately 67% at the end of
2011. Recent deficits reflect a difference between lower than average
revenues and higher than average expenditures. The CBO estimates
that for 2011, revenues will be 15.3% of GDP (compared with the 40
year average of 18.0%) and outlays will be 23.8% of GDP (compared
with 20.8% on average). The gap between revenues and expenditures
What is Public Debt?
The debt held by the public is all
federal debt held by individuals,
corporations, state or local
governments, foreign governments
and other entities outside the
United States Government less
Federal Financing Bank securities.
Types of securities held by the
public include but are not limited
to, Treasury Bills, Notes, Bonds,
TIPS, U.S. Savings Bonds, and
State and Local Government Series
Securities.
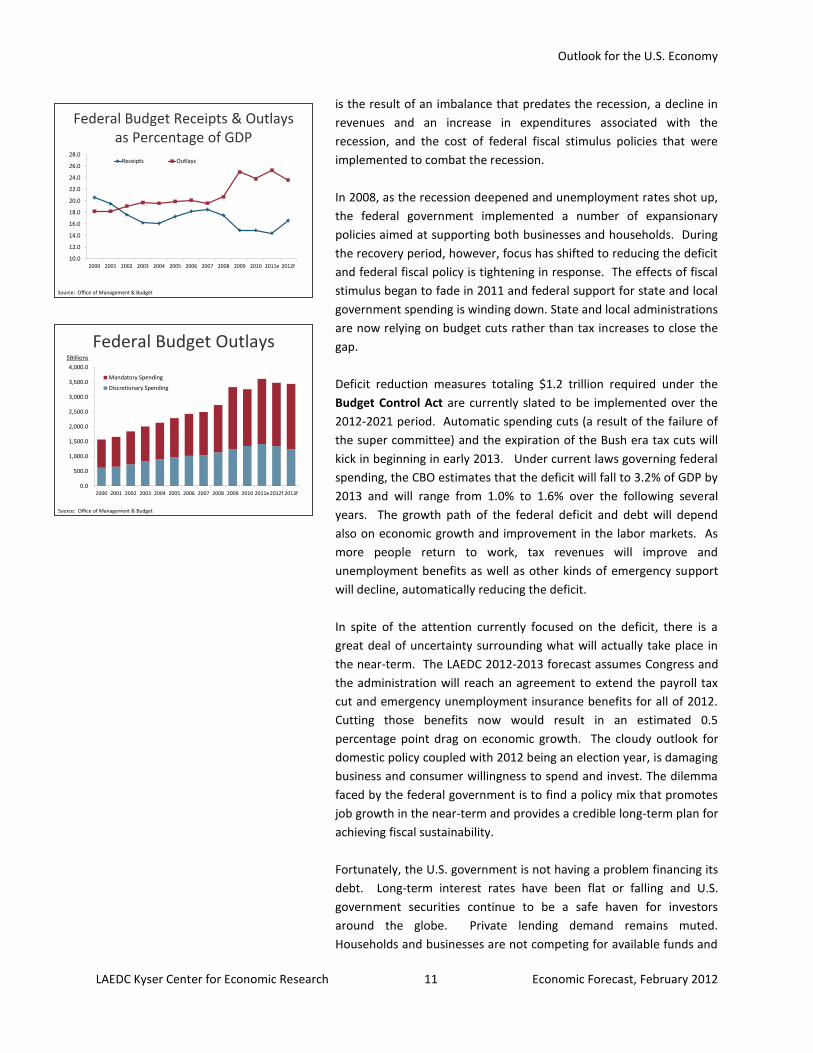
Outlook for the U.S. Economy
LAEDC Kyser Center for Economic Research 11 Economic Forecast, February 2012
Federal Budget Receipts & Outlays as Percentage of GDP
10.0
12.0
14.0
16.0
18.0
20.0
22.0
24.0
26.0
28.0
2000 2001 2002 2003 2004 2005 2006 2007 2008 2009 2010 2011e 2012f
Receipts Outlays
Source: Office of Management & Budget
Federal Budget Outlays
0.0
500.0
1,000.0
1,500.0
2,000.0
2,500.0
3,000.0
3,500.0
4,000.0
2000 2001 2002 2003 2004 2005 2006 2007 2008 2009 2010 2011e2012f 2013f
Mandatory Spending
Discretionary Spending
Source: Office of Management & Budget
$Billions
is the result of an imbalance that predates the recession, a decline in
revenues and an increase in expenditures associated with the
recession, and the cost of federal fiscal stimulus policies that were
implemented to combat the recession.
In 2008, as the recession deepened and unemployment rates shot up,
the federal government implemented a number of expansionary
policies aimed at supporting both businesses and households. During
the recovery period, however, focus has shifted to reducing the deficit
and federal fiscal policy is tightening in response. The effects of fiscal
stimulus began to fade in 2011 and federal support for state and local
government spending is winding down. State and local administrations
are now relying on budget cuts rather than tax increases to close the
gap.
Deficit reduction measures totaling $1.2 trillion required under the
Budget Control Act are currently slated to be implemented over the
2012-2021 period. Automatic spending cuts (a result of the failure of
the super committee) and the expiration of the Bush era tax cuts will
kick in beginning in early 2013. Under current laws governing federal
spending, the CBO estimates that the deficit will fall to 3.2% of GDP by
2013 and will range from 1.0% to 1.6% over the following several
years. The growth path of the federal deficit and debt will depend
also on economic growth and improvement in the labor markets. As
more people return to work, tax revenues will improve and
unemployment benefits as well as other kinds of emergency support
will decline, automatically reducing the deficit.
In spite of the attention currently focused on the deficit, there is a
great deal of uncertainty surrounding what will actually take place in
the near-term. The LAEDC 2012-2013 forecast assumes Congress and
the administration will reach an agreement to extend the payroll tax
cut and emergency unemployment insurance benefits for all of 2012.
Cutting those benefits now would result in an estimated 0.5
percentage point drag on economic growth. The cloudy outlook for
domestic policy coupled with 2012 being an election year, is damaging
business and consumer willingness to spend and invest. The dilemma
faced by the federal government is to find a policy mix that promotes
job growth in the near-term and provides a credible long-term plan for
achieving fiscal sustainability.
Fortunately, the U.S. government is not having a problem financing its
debt. Long-term interest rates have been flat or falling and U.S.
government securities continue to be a safe haven for investors
around the globe. Private lending demand remains muted.
Households and businesses are not competing for available funds and
Outlook for the U.S. Economy
LAEDC Kyser Center for Economic Research 12 Economic Forecast, February 2012
thus driving up interest rates. But, once a widespread pick-up in
private lending builds to a sufficient degree, this may or may not
remain the case.
U.S. FORECAST & RISKS
The economy should continue along its 2011 growth trajectory with
GDP growth in 2012 and 2013 in the 2.0% range. The labor market will
respond with modest gains in nonfarm jobs and slight improvement in
the unemployment rate, personal income will rise, and inflation will
stay in check. This is a conservative forecast. If consumers genuinely
sense that the economy is doing better – that their own circumstances
are improving – the economy and labor market could exceed the
forecast. On the other hand, there are risks that could slow down the
economy.
The initial situation was marked by sovereign debt problems in
individual countries like Greece, Italy, Spain, and elsewhere, but the
euro zone as a whole must grapple with the consequences and come
to a solution. Meanwhile, both the debt problems and the austerity
programs in reaction to the problems will likely force at least two
European countries (Italy and Spain) and possibly more into recession
in 2012. In brief, the situation in Europe has the potential to slow
growth in the U.S. economy, but is unlikely to bring on a recession.
A slowdown in fast-growing Asian economies, especially China, is
also a concern. As with the euro zone situation, the likely impact
is to slow growth in the U.S., but not cause recession.
An oil price spike perennially makes any list of economic risks,
whether spurred by political instability in oil-exporting parts of the
world or by other natural or man-made occurrences that might
disrupt the global supply of oil.
Fiscal austerity efforts to significantly rein in the budget deficit
and take action on the national debt seem unlikely in this election
year, but the actions of Congress on this matter are difficult to
predict.
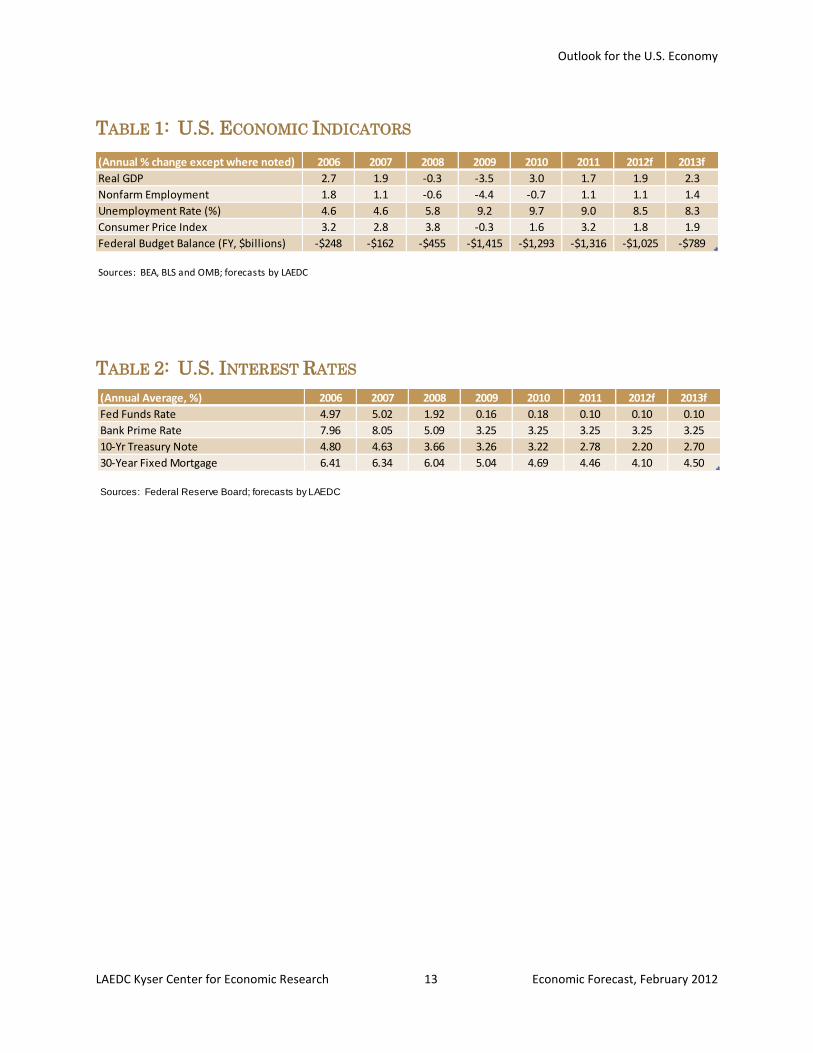
Outlook for the U.S. Economy
LAEDC Kyser Center for Economic Research 13 Economic Forecast, February 2012
(Annual Average, %) 2006 2007 2008 2009 2010 2011 2012f 2013f
Fed Funds Rate 4.97 5.02 1.92 0.16 0.18 0.10 0.10 0.10
Bank Prime Rate 7.96 8.05 5.09 3.25 3.25 3.25 3.25 3.25
10-Yr Treasury Note 4.80 4.63 3.66 3.26 3.22 2.78 2.20 2.70
30-Year Fixed Mortgage 6.41 6.34 6.04 5.04 4.69 4.46 4.10 4.50
Sources: Federal Reserve Board; forecasts by LAEDC
(Annual % change except where noted) 2006 2007 2008 2009 2010 2011 2012f 2013f
Real GDP 2.7 1.9 -0.3 -3.5 3.0 1.7 1.9 2.3
Nonfarm Employment 1.8 1.1 -0.6 -4.4 -0.7 1.1 1.1 1.4
Unemployment Rate (%) 4.6 4.6 5.8 9.2 9.7 9.0 8.5 8.3
Consumer Price Index 3.2 2.8 3.8 -0.3 1.6 3.2 1.8 1.9
Federal Budget Balance (FY, $billions) -$248 -$162 -$455 -$1,415 -$1,293 -$1,316 -$1,025 -$789
Sources: BEA, BLS and OMB; forecasts by LAEDC
TABLE 1: U.S. ECONOMIC INDICATORS
TABLE 2: U.S. INTEREST RATES
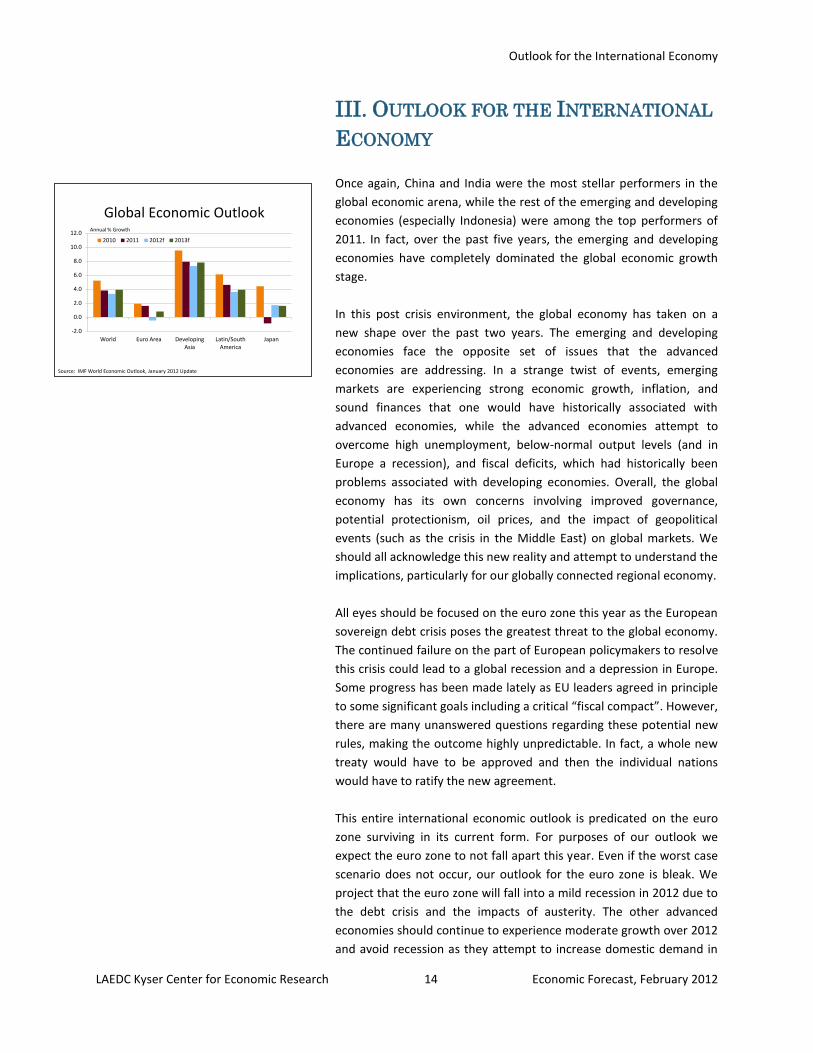
Outlook for the International Economy
LAEDC Kyser Center for Economic Research 14 Economic Forecast, February 2012
Global Economic Outlook
-2.0
0.0
2.0
4.0
6.0
8.0
10.0
12.0
World Euro Area Developing Asia
Latin/South America
Japan
2010 2011 2012f 2013f
Annual % Growth
Source: IMF World Economic Outlook, January 2012 Update
III. OUTLOOK FOR THE INTERNATIONAL
ECONOMY
Once again, China and India were the most stellar performers in the
global economic arena, while the rest of the emerging and developing
economies (especially Indonesia) were among the top performers of
2011. In fact, over the past five years, the emerging and developing
economies have completely dominated the global economic growth
stage.
In this post crisis environment, the global economy has taken on a
new shape over the past two years. The emerging and developing
economies face the opposite set of issues that the advanced
economies are addressing. In a strange twist of events, emerging
markets are experiencing strong economic growth, inflation, and
sound finances that one would have historically associated with
advanced economies, while the advanced economies attempt to
overcome high unemployment, below-normal output levels (and in
Europe a recession), and fiscal deficits, which had historically been
problems associated with developing economies. Overall, the global
economy has its own concerns involving improved governance,
potential protectionism, oil prices, and the impact of geopolitical
events (such as the crisis in the Middle East) on global markets. We
should all acknowledge this new reality and attempt to understand the
implications, particularly for our globally connected regional economy.
All eyes should be focused on the euro zone this year as the European
sovereign debt crisis poses the greatest threat to the global economy.
The continued failure on the part of European policymakers to resolve
this crisis could lead to a global recession and a depression in Europe.
Some progress has been made lately as EU leaders agreed in principle
to some significant goals including a critical “fiscal compact”. However,
there are many unanswered questions regarding these potential new
rules, making the outcome highly unpredictable. In fact, a whole new
treaty would have to be approved and then the individual nations
would have to ratify the new agreement.
This entire international economic outlook is predicated on the euro
zone surviving in its current form. For purposes of our outlook we
expect the euro zone to not fall apart this year. Even if the worst case
scenario does not occur, our outlook for the euro zone is bleak. We
project that the euro zone will fall into a mild recession in 2012 due to
the debt crisis and the impacts of austerity. The other advanced
economies should continue to experience moderate growth over 2012
and avoid recession as they attempt to increase domestic demand in
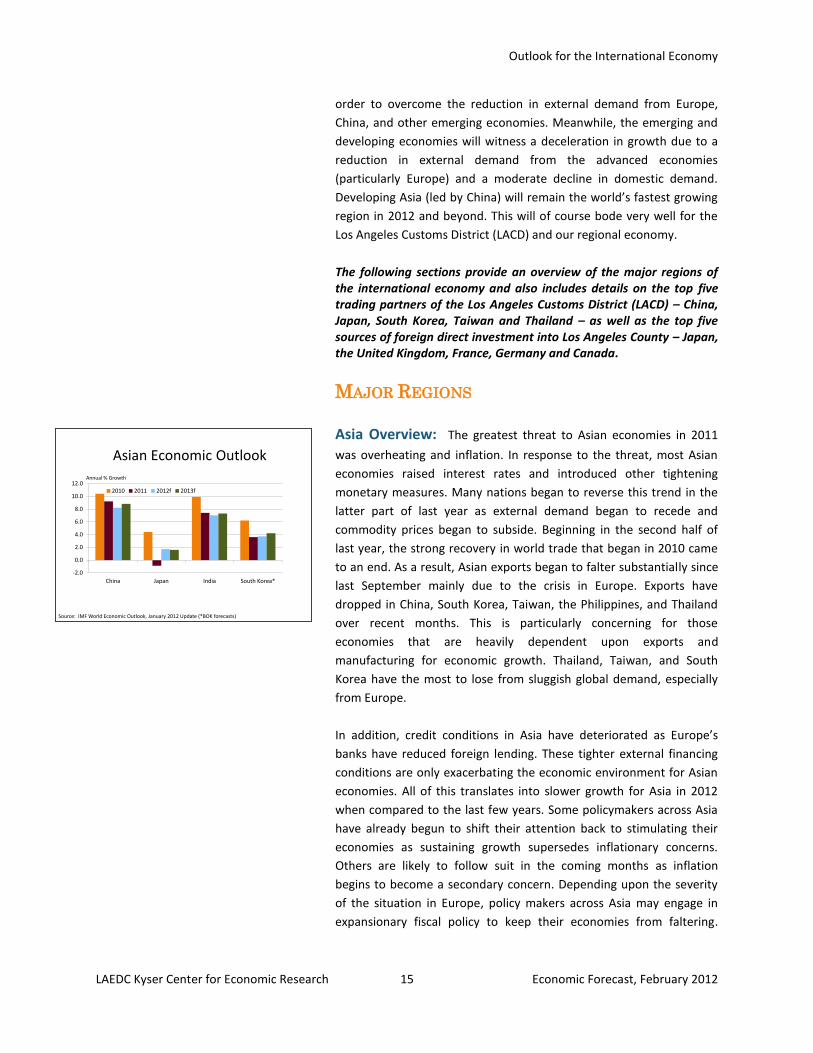
Outlook for the International Economy
LAEDC Kyser Center for Economic Research 15 Economic Forecast, February 2012
Asian Economic Outlook
-2.0
0.0
2.0
4.0
6.0
8.0
10.0
12.0
China Japan India South Korea*
2010 2011 2012f 2013f
Annual % Growth
Source: IMF World Economic Outlook, January 2012 Update (*BOK forecasts)
order to overcome the reduction in external demand from Europe,
China, and other emerging economies. Meanwhile, the emerging and
developing economies will witness a deceleration in growth due to a
reduction in external demand from the advanced economies
(particularly Europe) and a moderate decline in domestic demand.
Developing Asia (led by China) will remain the world’s fastest growing
region in 2012 and beyond. This will of course bode very well for the
Los Angeles Customs District (LACD) and our regional economy.
The following sections provide an overview of the major regions of the international economy and also includes details on the top five trading partners of the Los Angeles Customs District (LACD) – China, Japan, South Korea, Taiwan and Thailand – as well as the top five sources of foreign direct investment into Los Angeles County – Japan, the United Kingdom, France, Germany and Canada.
MAJOR REGIONS
Asia Overview: The greatest threat to Asian economies in 2011
was overheating and inflation. In response to the threat, most Asian
economies raised interest rates and introduced other tightening
monetary measures. Many nations began to reverse this trend in the
latter part of last year as external demand began to recede and
commodity prices began to subside. Beginning in the second half of
last year, the strong recovery in world trade that began in 2010 came
to an end. As a result, Asian exports began to falter substantially since
last September mainly due to the crisis in Europe. Exports have
dropped in China, South Korea, Taiwan, the Philippines, and Thailand
over recent months. This is particularly concerning for those
economies that are heavily dependent upon exports and
manufacturing for economic growth. Thailand, Taiwan, and South
Korea have the most to lose from sluggish global demand, especially
from Europe.
In addition, credit conditions in Asia have deteriorated as Europe’s
banks have reduced foreign lending. These tighter external financing
conditions are only exacerbating the economic environment for Asian
economies. All of this translates into slower growth for Asia in 2012
when compared to the last few years. Some policymakers across Asia
have already begun to shift their attention back to stimulating their
economies as sustaining growth supersedes inflationary concerns.
Others are likely to follow suit in the coming months as inflation
begins to become a secondary concern. Depending upon the severity
of the situation in Europe, policy makers across Asia may engage in
expansionary fiscal policy to keep their economies from faltering.
Outlook for the International Economy
LAEDC Kyser Center for Economic Research 16 Economic Forecast, February 2012
Asia will remain the fastest-growing and strongest region in the world
in 2012 and beyond. Fundamentally, there are two main reasons
along with other factors why Asia is so strong and will maintain its
position going forward. First, Asia’s key economic fundamentals are in
very good shape, especially when compared to Europe and the U.S.
Second, Asia now has its own economic superpower (China) that it can
rely upon for regional growth. This is extremely important to Asia as it
can depend more and more upon Chinese demand (both resources
and goods) and markets.
Key Asian Economies – Based on Los Angeles Customs
District’s (LACD’s) Top Trading Partners
*Note that the Los Angeles regional economy is deeply connected to
East Asia (China, Japan, South Korea and Taiwan) and Southeast Asia
(particularly the ASEAN-5, which includes Thailand, Vietnam,
Indonesia, Malaysia, and the Philippines).
China (LACD’s #1 Trading Partner): Once again, the Chinese economy
performed exceptionally well in 2011, expanding by 9.2%. This growth
rate surpassed the usual 8.0% target rate established by the Chinese
government and was noteworthy for the first year of a new five year
plan (twelfth 5-Year Plan) that began in 2011 and runs through 2015.
However, China’s economy did decelerate starting from the first
quarter of 2011 through the end of 2011 after growing by 10.4% in
2010. Economic growth in the fourth quarter of 2011 was 8.9% when
compared to a year earlier, which was the slowest growth rate since
the second quarter of 2009. In fact, China’s economy will continue to
experience a deceleration throughout 2012 and into 2013. The main
factors that have led to this slow down include a concentrated effort
by policymakers to prevent the economy from overheating, avoiding a
real estate bubble, and uncontrollable external events.
The People’s Bank of China (China’s Central Bank) pursued a
contractionary monetary policy (monetary tightening) in 2011 as
reducing inflationary pressures was the top priority. Also, the
government wanted to ensure that the property market cooled off by
reining in credit expansion. The Chinese government has attempted to
avoid its own real estate bubble by utilizing aggressive monetary
policy such as increasing reserve requirements. Real estate
transactions and prices declined in coastal cities such as Shanghai
throughout the second half of 2011. Also, the shortage of credit began
to negatively impact private-sector firms in the second half of last
year. This past October, the level of total loans outstanding
Will China experience a hard or
soft landing in 2012? The
LAEDC projects a soft landing
with some potential turbulence
along the way.
Outlook for the International Economy
LAEDC Kyser Center for Economic Research 17 Economic Forecast, February 2012
experienced its lowest rate of growth since 2008, while the money
supply (M2) fell to its weakest growth rate in a decade.
The Chinese economy also began to feel the impact of a reduction in
demand from Europe. Key economic indicators such as industrial
production and exports began to deteriorate in the third quarter of
2011, both as a direct result of the European situation and the overall
global slowdown. The key manufacturing index (PMI) for China
actually fell below 50 for the first time in three years in November
2011, which is the level distinguishing expansion from contraction.
Exports to Europe have been particularly impacted by the weakening
of the euro zone economies. This trend was clearly witnessed in the
third and fourth quarters of last year.
Inflation in China has become less of a concern, but remains a serious
issue for this year. Price pressures did start to subside in the latter part
of 2011 as commodity prices declined and, most importantly, food
prices began to recede. A poor harvest and a shortage of pork created
a big headache for the Chinese economy. However, policymakers will
still have to be very cautious when determining monetary policy as
inflation could worsen quickly and it is absolutely essential to keep
inflation in check in order to prevent social unrest. Monitoring
inflation will be particularly important this year as China undergoes its
most significant leadership transition (November 2012) in the past
decade. With that in mind, maintaining strong economic growth and
maintaining social stability will be the new leadership’s top priority.
Over the short term China will undoubtedly produce slower rates of
economic growth as domestic and external demand diminish when
compared to the past couple of years. Avoiding a real estate bubble
and non-performing loans will be critical for the Chinese economy this
year and next. One of the other key concerns going forward will
ultimately be the outcome of the European debt crisis and how deep
the European recession becomes.
In addition, China’s dependence upon investment for economic
growth represents another unsustainable issue for Chinese
policymakers. Investment currently contributes nearly 50% to China’s
GDP, which has reached an unprecedented level in the economic
development of China. According to most experts, this level of
dependency on investment for economic growth presents a very dire
situation as this leads to wasteful and unproductive assets. In fact, this
problem is already occurring in many parts of China. Another
significant problem that the current five-year plan will attempt to
address is the disparity and inequality between the eastern provinces
and the central and western provinces. There has been some
Outlook for the International Economy
LAEDC Kyser Center for Economic Research 18 Economic Forecast, February 2012
improvement in this respect as inland provinces outperformed the
coastal provinces in 2011.
Also, China’s economy must reduce its reliance upon exports
(particularly to the advanced economies) as Europe and the U.S. face
debt and low growth in the coming years. Undeniably, China will have
to move away from the investment and export-led model that has
served it so well towards a more consumer based model in order to
avoid the dreaded “hard landing’ everyone fears. This will be a very
difficult challenge for China and will definitely take time.
China will most likely avoid a “hard landing” this year and ultimately
experience a “soft landing” with some potential turbulence along the
way such as renewed domestic inflation, a spike in oil prices, asset
bubbles, and a more severe drop in exports to Europe. It is critical to
understand that Chinese policymakers still have the means (though
somewhat diminished due to the 2008 stimulus) to prevent a hard
landing from happening. This is already taking place with monetary
policy. As a result, China’s economy to projected to grow by close to
8.5% in 2012 as both investment and exports decline relative to the
last two years.
Japan (LA County’s #1 Source of FDI and the LACD’s #2 Trading
Partner): Japan’s economy recovered strongly from the triple
disasters – the earthquake, the subsequent Tsunami, and the nuclear
fallout - in the third quarter of 2011. It recorded 1.4% GDP growth in
the third quarter when compared to the second quarter. This was
after experiencing no growth or negative growth for three consecutive
quarters. There were some significant economic issues even before
the disasters. Japan has demonstrated amazing resiliency since the
disasters. Its recovery is an example for all of us. The economy was
able to rebound strongly in a very short period of time. Things began
to significantly turn around in June just three months after the tragic
disasters.
The key point to keep in mind is that the disasters impacted Japan’s
energy supply – nuclear power plants provide roughly 25% of
electricity – and the outcome of this story will go a long way in
determining the short and medium term outlooks. Japan’s fourth
quarter 2011 economic performance was not as strong as expected
due to a slowdown in exports and the impact of flooding in Thailand
on supply chains. The economic recovery began to stall in the fourth
quarter due to the drop in demand from Europe and a rising Yen. The
outlook for 2012 is bright particularly over the first half of this year as
the rebuilding process continues and acts as a stimulus due to the
Outlook for the International Economy
LAEDC Kyser Center for Economic Research 19 Economic Forecast, February 2012
increase in government spending and investment. As a result, we
project GDP to increase by 1.5% to 2.0% this year.
Why won’t growth be stronger in 2012? There are three key
challenges ahead for Japan. From the supply-side, they include
electricity shortages and damaged factories, which would impact
production and supply chains. The speed with which the factories
come back on line after the flooding in Thailand will also impact supply
chains. From the demand-side, a drop in external demand from China
(Japan’s top export market), Europe (third largest export market and
its ties to China will hurt Japan), and other Asian economies
(particularly South Korea and Thailand). Domestic demand (which
comprises roughly 60% of GDP) is not as strong as it needs to be in
order for Japan to really experience any type of robust growth. Real
wages have been going down and deflation continues to plague the
Japanese economy. Domestic demand will be the key determinant of
growth in the medium to long term. Finally, the strength of the Yen
poses a challenge in 2012 and into 2013, leading to an increase in
investment abroad and erosion of corporate profits due to higher
costs.
South Korea (LACD’s #3 Trading Partner): Asia’s fourth largest
economy performed well over the first six months of 2011. The nation
continued to be one of the leaders of the global recovery as it
benefitted from China’s persistent expansion. South Korea’s GDP in
the first quarter of 2011 expanded by 4.2% and by 3.5% in the second
quarter when compared to a year earlier, with exports continuing
their strong performance. Exports, which represent about 50% of total
economic output, rose by nearly 24% in May 2011 compared to a year
earlier. The key was the consistent strength of demand from Korea’s
Asian neighbors. In particular, demand from China, which takes 33% of
South Korean exports, has been instrumental in propelling this growth.
Electronics, autos, and shipbuilding have been the most heavily
demanded products. However, Korean exports began to face a more
difficult environment beginning at the end of the second quarter as
external demand from China, the U.S., Europe, and Japan decelerated.
Economic growth in the second half of 2011 decelerated as the global
slowdown began to have a real impact by the fourth quarter. Due to
its overall exposure to the world economy, the Korean economy has
experienced a slowdown in recent months as global demand has
deteriorated. The debt crisis in Europe along with the slowdown in
China has real repercussions for South Korea. As previously
mentioned, exports contribute almost 50% to overall GDP. Its reliance
upon exports has been one of the key ingredients to success over the
The Korea-US Free Trade
Agreement (KORUS FTA) was
approved and is expected to go
into effect in 2012.
Outlook for the International Economy
LAEDC Kyser Center for Economic Research 20 Economic Forecast, February 2012
past forty years, but it can also become a major liability during times
of global crisis as witnessed during the 2008 financial crisis.
Quarter-to-quarter growth consistently weakened throughout 2011
and the economy in the fourth quarter grew at its lowest level in two
years. GDP only expanded by 0.4% on a quarter-to-quarter basis. The
overall weakness was attributable to the decline in exports to Europe
and to China. Both Japan and South Korea have been indirectly
impacted by the events in Europe. When China’s exports to Europe
decline it inevitably leads to a decline in Japanese and Korean exports
as both nations export many of the inputs or intermediate goods that
make their way into the final assembled goods that China exports.
South Korean exports, investment and consumption dropped every
month in the fourth quarter (the first time in two years). The South
Korean economy grew by 3.6% in 2011 after expanding by 6.2% in
2010.
The Korean economic outlook for 2012 will depend upon the global
economic environment. First, developments in China will have the
largest impact on South Korea as China is by far South Korea’s largest
export market. Second, the situation in Europe will also largely
influence the South Korean economy as the global financial system
could be greatly impacted by a financial contagion in Europe. A
European recession will undoubtedly decrease Korean exports. In
addition, the recent slowdown in domestic consumer demand in South
Korea poses another significant threat. South Korea will have
parliamentary and presidential elections this year, which will definitely
have an impact on fiscal, monetary and trade policy. Finally, Korean
policymakers will be paying very close attention to what is happening
in North Korea over the coming months.
The Bank of Korea has raised interest rates five times since the middle
of 2010 in order to counter the inflationary environment. However,
monetary policy is expected to reverse course in 2012 as growth
concerns begin to supersede inflation concerns. Also, South Korea
could possibly conduct some expansionary fiscal policy as well
depending on what transpires over the next few months. We expect
the South Korean economy to grow at a rate of around 3.5% in 2012.
Taiwan (LACD’s #4 Trading Partner): Taiwan’s economy relies very
heavily on trade, as exports equal nearly 70% of total GDP. As a result,
any economic expansion is contingent upon growth in exports. The
key to growth in exports has been strong demand from China and the
ASEAN economies. A growing percentage of growth in export orders
came from members of the ASEAN in 2011 as intra-region trade
continues to expand as these economies develop. China (including
Outlook for the International Economy
LAEDC Kyser Center for Economic Research 21 Economic Forecast, February 2012
Hong Kong), demands over 40% of total Taiwanese exports. Nearly
80% of all Taiwanese exports go to Asia.
Taiwan’s economy struggled at the end of the year as exports
declined. In fact, exports grew at the slowest pace in over two years in
December. Taiwan’s GDP grew by 1.9% in the fourth quarter of 2011
when compared to a year earlier. On an annual basis, Taiwan’s GDP
expanded by 4.0% in 2011. However, the Taiwanese economy officially
entered into recession in the fourth quarter of 2011 as the economy
contracted for the second consecutive quarter on a quarter-to-quarter
basis. This will most likely be the trend going into 2012 as exports are
still a big concern. Ultimately, the Taiwanese economy’s performance
will be dependent upon how strong exports are in 2012. Taiwan’s GDP
grow in the 3.0% range in 2012. Economic growth could be even
stronger if the Chinese economy does not lose too much steam in the
coming months.
Thailand (LACD’s #5 Trading Partner): Thailand’s economy
experienced solid growth over the first six months of 2011. However,
this past July everything dramatically changed for the Thai people and
economy, when Thailand suffered its worst flooding in nearly 70 years.
The damage from the floods cost the Thai economy over one trillion
baht or the equivalent of 10% of GDP (this includes the cost of lost
output as well as damage to infrastructure and factories). The
devastation from the flooding greatly impacted both the supply-side
and the demand-side of the Thai economy.
The big story was the impact of the flooding on fourth quarter growth,
which contributed an estimated 1.0% decline to the overall GDP
contraction of 2.8%. Exports declined by 12.4% in November, the
worst showing in two years. Officials from the Thai government do not
expect a return to normalcy until at least March or April 2012, which
does not bode well for economic growth in the first quarter and for
trade with the LACD. The rebound is expected in the second quarter or
later but will be largely determined by domestic policy decisions and
the global economy. Export growth will ultimately boost
manufacturing production, employment and investment. Thailand’s
GDP is projected to grow by nearly 5.0% in 2012 as it recovers from
the natural disaster.
India: India (Asia’s third largest economy) continued to lead the
global expansion in 2011 and along with China, will lead the world
economy once again in 2012. The Indian economy was the second
best performer in 2011 (among the largest economies), with domestic
demand and manufacturing leading the way. However, India’s
economic engine did slow down in 2011 as GDP expanded by 7.4% in
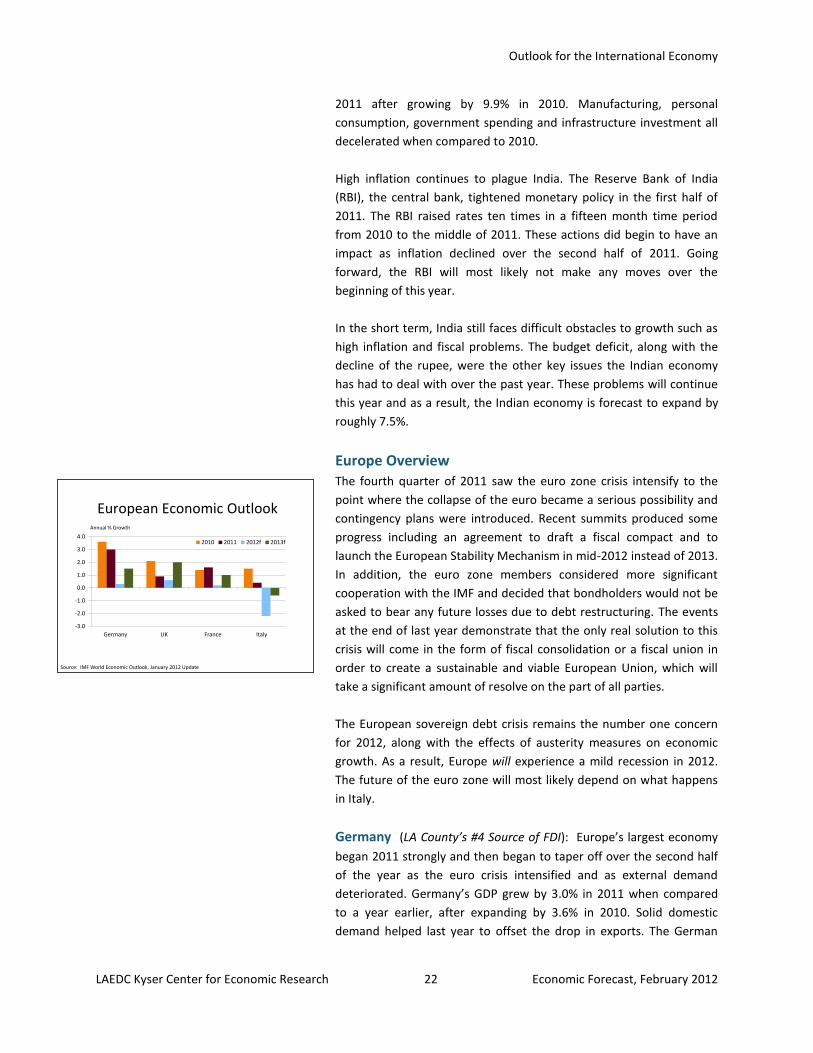
Outlook for the International Economy
LAEDC Kyser Center for Economic Research 22 Economic Forecast, February 2012
European Economic Outlook
-3.0
-2.0
-1.0
0.0
1.0
2.0
3.0
4.0
Germany UK France Italy
2010 2011 2012f 2013f
Annual % Growth
Source: IMF World Economic Outlook, January 2012 Update
2011 after growing by 9.9% in 2010. Manufacturing, personal
consumption, government spending and infrastructure investment all
decelerated when compared to 2010.
High inflation continues to plague India. The Reserve Bank of India
(RBI), the central bank, tightened monetary policy in the first half of
2011. The RBI raised rates ten times in a fifteen month time period
from 2010 to the middle of 2011. These actions did begin to have an
impact as inflation declined over the second half of 2011. Going
forward, the RBI will most likely not make any moves over the
beginning of this year.
In the short term, India still faces difficult obstacles to growth such as
high inflation and fiscal problems. The budget deficit, along with the
decline of the rupee, were the other key issues the Indian economy
has had to deal with over the past year. These problems will continue
this year and as a result, the Indian economy is forecast to expand by
roughly 7.5%.
Europe Overview The fourth quarter of 2011 saw the euro zone crisis intensify to the
point where the collapse of the euro became a serious possibility and
contingency plans were introduced. Recent summits produced some
progress including an agreement to draft a fiscal compact and to
launch the European Stability Mechanism in mid-2012 instead of 2013.
In addition, the euro zone members considered more significant
cooperation with the IMF and decided that bondholders would not be
asked to bear any future losses due to debt restructuring. The events
at the end of last year demonstrate that the only real solution to this
crisis will come in the form of fiscal consolidation or a fiscal union in
order to create a sustainable and viable European Union, which will
take a significant amount of resolve on the part of all parties.
The European sovereign debt crisis remains the number one concern
for 2012, along with the effects of austerity measures on economic
growth. As a result, Europe will experience a mild recession in 2012.
The future of the euro zone will most likely depend on what happens
in Italy.
Germany (LA County’s #4 Source of FDI): Europe’s largest economy
began 2011 strongly and then began to taper off over the second half
of the year as the euro crisis intensified and as external demand
deteriorated. Germany’s GDP grew by 3.0% in 2011 when compared
to a year earlier, after expanding by 3.6% in 2010. Solid domestic
demand helped last year to offset the drop in exports. The German
Outlook for the International Economy
LAEDC Kyser Center for Economic Research 23 Economic Forecast, February 2012
economy is heavily reliant on exports as they comprise roughly 35% of
GDP.
Germany’s economy contracted in the fourth quarter of 2011 as
business confidence and exports plunged due to the worsening of the
debt crisis. New export orders and overall industrial production
subsided and is expected to continue this trajectory into the first half
of this year. The Germany economy could very well experience a
recession in the first quarter of this year, but should regain some of its
strength in the second half of the year. Ultimately, the outcome of the
euro zone debt crisis along with external demand will determine the
performance of the German economy in 2012. Germany’s economy
will face some very difficult obstacles this year and just barely grow by
0.25% to 0.50%.
France (LA County’s #3 Source of FDI): The French economy
witnessed a relatively strong performance at the beginning of 2011.
This condition drastically changed as the year went on and the euro
zone debt crisis worsened. The euro zone’s second largest economy,
France saw investment and manufacturing weaken over the second
half of 2011. Unfortunately, this was after manufacturing production
had experienced its strongest growth in thirty years over the first
three months of 2011. By the second half of the year, government
austerity measures began to be implemented which hampered
consumer spending, negatively impacted investment, and added pain
to a situation that was already marked by high unemployment.
France’s economic performance really deteriorated in the fourth
quarter of 2011. After nine straight quarters of growth, the French
economy contracted in the final three months of the year falling by
0.2%. This weakness is expected to continue over the first quarter of
this year leading to a technical recession. As if this was not bad
enough news for the French economy, the ratings agency Standard &
Poor’s took away France’s AAA rating in January. Also, the country will
have presidential and legislative elections later this year and the
performance of the economy along with the deficit environment will
play a large role in the outcome. After growing by 1.6% in 2011, expect
the French economy to slightly expand by roughly 0.2% in 2012.
United Kingdom (LA County’s #2 Source of FDI): As expected, the
performance of the UK economy has been much weaker than that of
Germany and weaker than that of France in 2011. The UK economy
grew by 0.9% in 2011 on a year-to-year basis. This slight increase in
GDP was mainly due to a climb in exports. In fact, both consumer
spending and business investment dropped throughout the year. The
draconian government spending cuts greatly impacted private and
Only 17 of the 27 members of the
European Union are part of the
euro zone including Austria,
Belgium, Cyprus, Estonia,
Finland, France, Germany,
Greece, Ireland, Italy,
Luxembourg, Malta,
Netherlands, Portugal, Slovakia,
Slovenia, and Spain. The UK is
not part of the euro zone.
Outlook for the International Economy
LAEDC Kyser Center for Economic Research 24 Economic Forecast, February 2012
public spending. In addition, the increase in the British value added tax
(VAT) only exacerbated the situation. Consumer spending accounts for
the largest percentage of economic output in the UK and the outlook
continues to look bleak for 2012. The British economy will also have
to contend with headwinds in the form of high unemployment,
inflation, slower external demand, and the ongoing debt crisis.
British policymakers will try and boost confidence in the capital
markets, keep interest rates low and revive private investment in
order to restore real economic growth in the coming months. The UK
economy is forecast to barely grow by 0.5% to 0.8% in 2012.
Italy: The euro zone’s third largest economy entered into recession
after the fourth quarter of 2011 as the lack of economic growth
continues to plague Italy. This was the fifth recession since 2001 and
many would argue that Italy will never overcome its debt situation
until it can resolve the difficult issue of economic stagnation. Poor
economic fundamentals have caused a decade of lackluster growth.
Industrial production, consumer spending and investment all declined
over the course of 2011 as the debt crisis worsened and earlier
austerity measures were implemented. Things will further deteriorate
over the first half of this year due to draconian austerity measures and
a weakening global economy.
Italy was on the precipice of financial and economic disaster by the
end of 2011 as market confidence collapsed and its borrowing costs
skyrocketed to unsustainable levels. Italy was on the verge of
defaulting and potentially destroying the viability of the euro. Italy
represented a very different kind of problem relative to Greece,
Ireland or Portugal. Unlike Greece, Ireland, or Portugal, Italy was
considered to be too big to fail and too big to save as Italy is the third
largest economy in the euro zone.
Italy needed to desperately change political, economic, and financial
environments and it was able to do so as former Prime Minister Silvio
Berlusconi resigned and it welcomed a new technocratic government
led by Mario Monti. As a result of the severe spending cuts, tax
increases and a decline in exports the Italian economy is projected to
contract by nearly 2.0% this year. This means that Italy would be the
worst performer of all the advanced economies.
Americas Overview The Americas have followed Emerging Asia’s direction in the global
economic recovery process. Mexico was the strongest performer in
2011, followed by Brazil, both of which have acted to prevent their
economies from overheating and addressed inflation. Based on initial
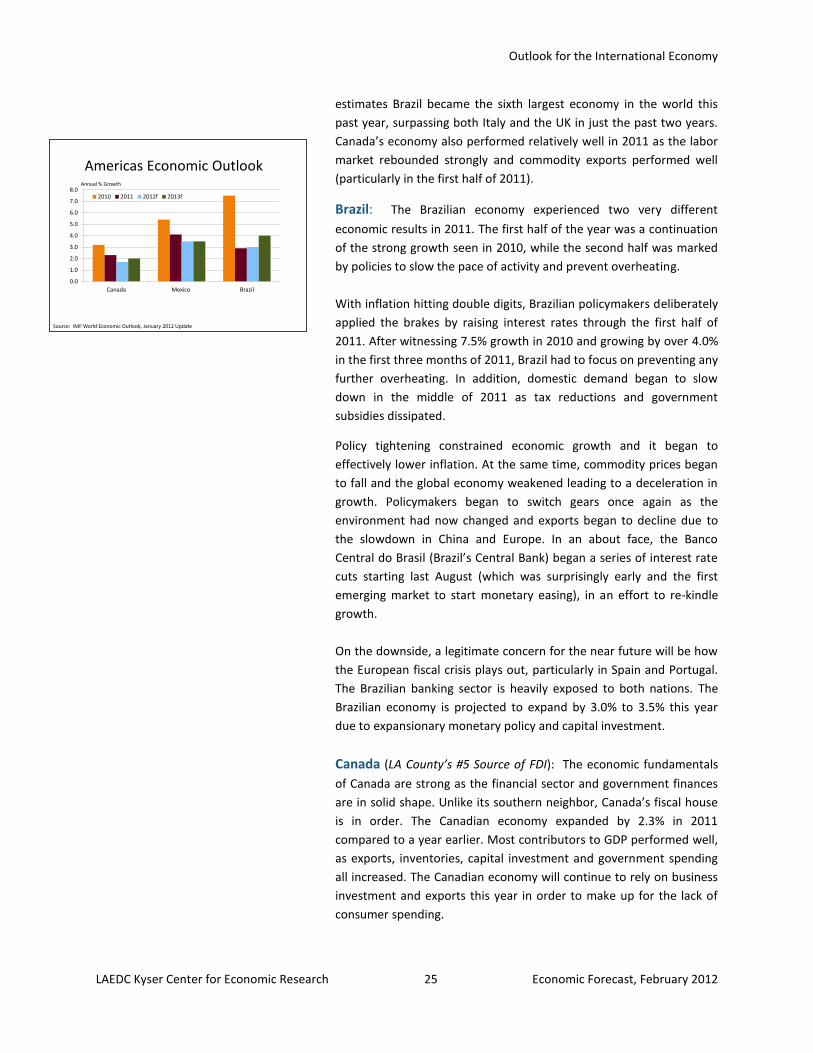
Outlook for the International Economy
LAEDC Kyser Center for Economic Research 25 Economic Forecast, February 2012
Americas Economic Outlook
0.0
1.0
2.0
3.0
4.0
5.0
6.0
7.0
8.0
Canada Mexico Brazil
2010 2011 2012f 2013f
Annual % Growth
Source: IMF World Economic Outlook, January 2012 Update
estimates Brazil became the sixth largest economy in the world this
past year, surpassing both Italy and the UK in just the past two years.
Canada’s economy also performed relatively well in 2011 as the labor
market rebounded strongly and commodity exports performed well
(particularly in the first half of 2011).
Brazil: The Brazilian economy experienced two very different
economic results in 2011. The first half of the year was a continuation
of the strong growth seen in 2010, while the second half was marked
by policies to slow the pace of activity and prevent overheating.
With inflation hitting double digits, Brazilian policymakers deliberately
applied the brakes by raising interest rates through the first half of
2011. After witnessing 7.5% growth in 2010 and growing by over 4.0%
in the first three months of 2011, Brazil had to focus on preventing any
further overheating. In addition, domestic demand began to slow
down in the middle of 2011 as tax reductions and government
subsidies dissipated.
Policy tightening constrained economic growth and it began to
effectively lower inflation. At the same time, commodity prices began
to fall and the global economy weakened leading to a deceleration in
growth. Policymakers began to switch gears once again as the
environment had now changed and exports began to decline due to
the slowdown in China and Europe. In an about face, the Banco
Central do Brasil (Brazil’s Central Bank) began a series of interest rate
cuts starting last August (which was surprisingly early and the first
emerging market to start monetary easing), in an effort to re-kindle
growth.
On the downside, a legitimate concern for the near future will be how
the European fiscal crisis plays out, particularly in Spain and Portugal.
The Brazilian banking sector is heavily exposed to both nations. The
Brazilian economy is projected to expand by 3.0% to 3.5% this year
due to expansionary monetary policy and capital investment.
Canada (LA County’s #5 Source of FDI): The economic fundamentals
of Canada are strong as the financial sector and government finances
are in solid shape. Unlike its southern neighbor, Canada’s fiscal house
is in order. The Canadian economy expanded by 2.3% in 2011
compared to a year earlier. Most contributors to GDP performed well,
as exports, inventories, capital investment and government spending
all increased. The Canadian economy will continue to rely on business
investment and exports this year in order to make up for the lack of
consumer spending.
Outlook for the International Economy
LAEDC Kyser Center for Economic Research 26 Economic Forecast, February 2012
The continued strength of exports will depend upon the U.S. economic
recovery in 2012, as 80% of Canadian exports go to the U.S.
Employment figures did improve in 2011 and they should remain
relatively strong in 2012. The overall outlook for 2012 is positive.
Capital investment should remain strong. Because Canada is a large
commodity exporter, it must be very attentive to the prices of oil and
other commodities. The price of oil should hold up, but non-oil
commodity prices are expected to weaken in 2012 as global demand
declines. Another concern in Canada has become averting a housing
crisis as housing purchases and prices have surged over the past
couple of years. The Canadian economy should continue to expand by
roughly 2% in 2012.
Mexico: Mexico’s economy witnessed stronger growth than both
Brazil and Canada in 2011 as it expanded by 4.1%. It also has a much
lower inflation rate than the other nations in Latin America, including
Brazil, and its currency has not strengthened as much as the Brazilian
Real and the Chilean Peso. Both of these put Mexico at an advantage
relative to other countries.
Latin America’s second largest economy has directly benefitted from
the upturn in the U.S. economy over the last two years, as a strong
rebound in American manufacturing increased demand for Mexican
exports. Similar to the Canadian economy, U.S. demand is absolutely
critical to the Mexican economy as the U.S. receives over 80% of
Mexico’s manufactured exports.
Strong oil prices this year have increased revenues for the Mexican
government and could provide even more support over 2012 as oil
prices continue to rise due to increased tensions in the Middle East.
Mexico’s enduring unemployment problem has improved and this
helped consumer spending over the latter part of last year.
Note that a worsening debt crisis in Spain, if it occurs, could negatively
affect the banking sector. Many Mexican banks are exposed to Spain
and Spanish foreign direct investment would be reduced. For 2012,
Mexico’s economy should grow by a respectable 3.5%.
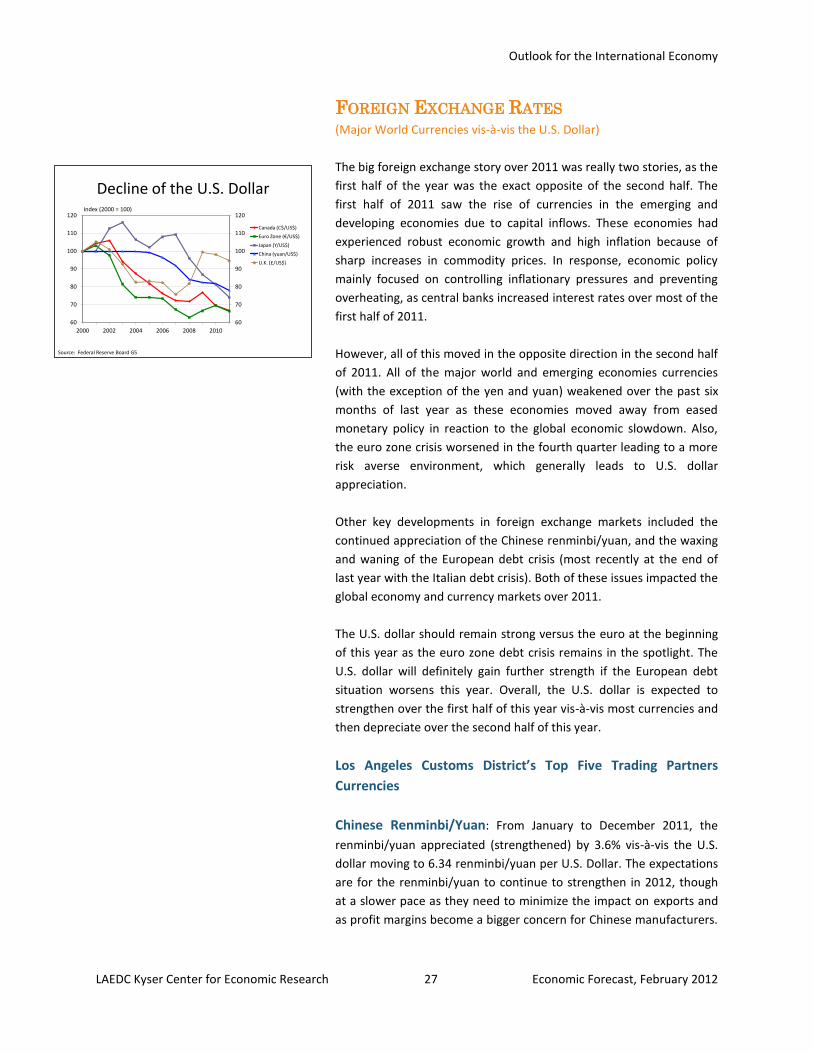
Outlook for the International Economy
LAEDC Kyser Center for Economic Research 27 Economic Forecast, February 2012
60
70
80
90
100
110
120
60
70
80
90
100
110
120
2000 2002 2004 2006 2008 2010
Canada (C$/US$)
Euro Zone (€/US$)
Japan (Y/US$)
China (yuan/US$)
U.K. (£/US$)
Decline of the U.S. DollarIndex (2000 = 100)
Source: Federal Reserve Board G5
FOREIGN EXCHANGE RATES
(Major World Currencies vis-à-vis the U.S. Dollar)
The big foreign exchange story over 2011 was really two stories, as the
first half of the year was the exact opposite of the second half. The
first half of 2011 saw the rise of currencies in the emerging and
developing economies due to capital inflows. These economies had
experienced robust economic growth and high inflation because of
sharp increases in commodity prices. In response, economic policy
mainly focused on controlling inflationary pressures and preventing
overheating, as central banks increased interest rates over most of the
first half of 2011.
However, all of this moved in the opposite direction in the second half
of 2011. All of the major world and emerging economies currencies
(with the exception of the yen and yuan) weakened over the past six
months of last year as these economies moved away from eased
monetary policy in reaction to the global economic slowdown. Also,
the euro zone crisis worsened in the fourth quarter leading to a more
risk averse environment, which generally leads to U.S. dollar
appreciation.
Other key developments in foreign exchange markets included the
continued appreciation of the Chinese renminbi/yuan, and the waxing
and waning of the European debt crisis (most recently at the end of
last year with the Italian debt crisis). Both of these issues impacted the
global economy and currency markets over 2011.
The U.S. dollar should remain strong versus the euro at the beginning
of this year as the euro zone debt crisis remains in the spotlight. The
U.S. dollar will definitely gain further strength if the European debt
situation worsens this year. Overall, the U.S. dollar is expected to
strengthen over the first half of this year vis-à-vis most currencies and
then depreciate over the second half of this year.
Los Angeles Customs District’s Top Five Trading Partners
Currencies
Chinese Renminbi/Yuan: From January to December 2011, the
renminbi/yuan appreciated (strengthened) by 3.6% vis-à-vis the U.S.
dollar moving to 6.34 renminbi/yuan per U.S. Dollar. The expectations
are for the renminbi/yuan to continue to strengthen in 2012, though
at a slower pace as they need to minimize the impact on exports and
as profit margins become a bigger concern for Chinese manufacturers.
Outlook for the International Economy
LAEDC Kyser Center for Economic Research 28 Economic Forecast, February 2012
Japanese Yen: The yen has reached 15-year highs over the past two
years, which has led the Japanese government to devalue the yen
multiple times. In addition, the G-7 nations decided to intervene in
order to prevent the yen from gaining any additional strength after
the disasters, which would have negatively impacted Japanese exports
and any hope for economic recovery. These moves only provided
temporary relief. In fact, since April of last year the yen appreciated
vis-à-vis the U.S. dollar by almost 12% moving back to 75 yen per U.S.
dollar, following a similar 12% appreciation in 2010. The demand for
safe-haven currencies will continue this year and should keep the
demand for the yen strong.
South Korean Won: Similar to most currencies, the won
strengthened over the first half of 2011 and then depreciated over the
second half. At the beginning of 2011, capital moved into South Korea
as the economy grew. All that changed after July as the won
depreciated and ultimately weakened by nearly 3.0% versus the U.S.
dollar for the year. The won is expected to depreciate further in 2012.
The U.S. dollar-won exchange rate will play a bigger role in
determining two-way trade flows between South Korea and the LACD
once the KORUS FTA goes into effect.
Taiwanese Dollar: In 2011, the Taiwanese dollar depreciated by
3.0% versus the U.S. Dollar. The Taiwanese Dollar started the year by
slightly appreciating versus the U.S. dollar. However, that trend did
not continue as the Taiwanese dollar weakened at the same time the
other emerging currencies lost steam and actually depreciated by
more than 4.0%. The Taiwanese dollar should also continue to
weaken, particularly over the first half of 2012.
Thai Baht: The Thai baht weakened by over 2% vis-à-vis the U.S.
dollar in 2011 after appreciating by over 10% in 2010. The Thai baht is
projected to weaken over the first half of 2012 due to the floods and
the weaker global environment. However, the recovery process will
likely have a positive impact on the baht over the second half of the
year.
Other Key Currencies Linked to our Local Economy
Canadian Dollar: The year began with the Canadian dollar gaining
strength versus the U.S. dollar and then the Canadian dollar gave back
all of its gains and more by the end of the year. Overall, the Canadian
dollar depreciated by 3.0% vis-à-vis the U.S. Dollar in 2011. The short
term outlook is for the Canadian dollar to remain slightly weaker than
the U.S. dollar.
The strength of the Yen presents
an excellent opportunity for
Japanese investors to invest in
the U.S. and in LA County.
Outlook for the International Economy
LAEDC Kyser Center for Economic Research 29 Economic Forecast, February 2012
Mexican Peso: Over the past year, the peso has weakened by 13.2%
versus the U.S. dollar after strengthening by over 5.0% vis-à-vis the
U.S. dollar in 2010. The outlook for 2012 is for the peso to gain
strength as the economy outperforms its neighbors and demand
should be relatively strong due to higher interest rates in Mexico.
Euro: The euro ended 2010 down by 8% versus the U.S. dollar. The
euro continued to perform well over the first half of 2011 as countries
continued to implement fiscal reforms. However, when the situation
in Greece deteriorated again in June the euro was never able to regain
its strength and weakened over the last few months of 2011. As the
situation in Italy deteriorated, the euro was on the verge of collapse.
Overall, the euro depreciated vis-à-vis the U.S. dollar by 15% last year.
The short-term outlook for the euro is to weaken as Europe faces a
recession and some big decisions.
British Pound: Similar to the euro, the pound strengthened versus
the dollar over the first part of 2011. In fact, the pound appreciated by
nearly 4.0% from January to August before it began to weaken. From
August to December the pound lost all of its strength and depreciated
by nearly 5.0%. Over the year, the pound only depreciated by 1.0%
versus the U.S dollar. The outlook is most likely for the British pound
to weaken as the economy will at best experience very sluggish
growth due to the austerity measures that were put into place in the
middle of 2010.
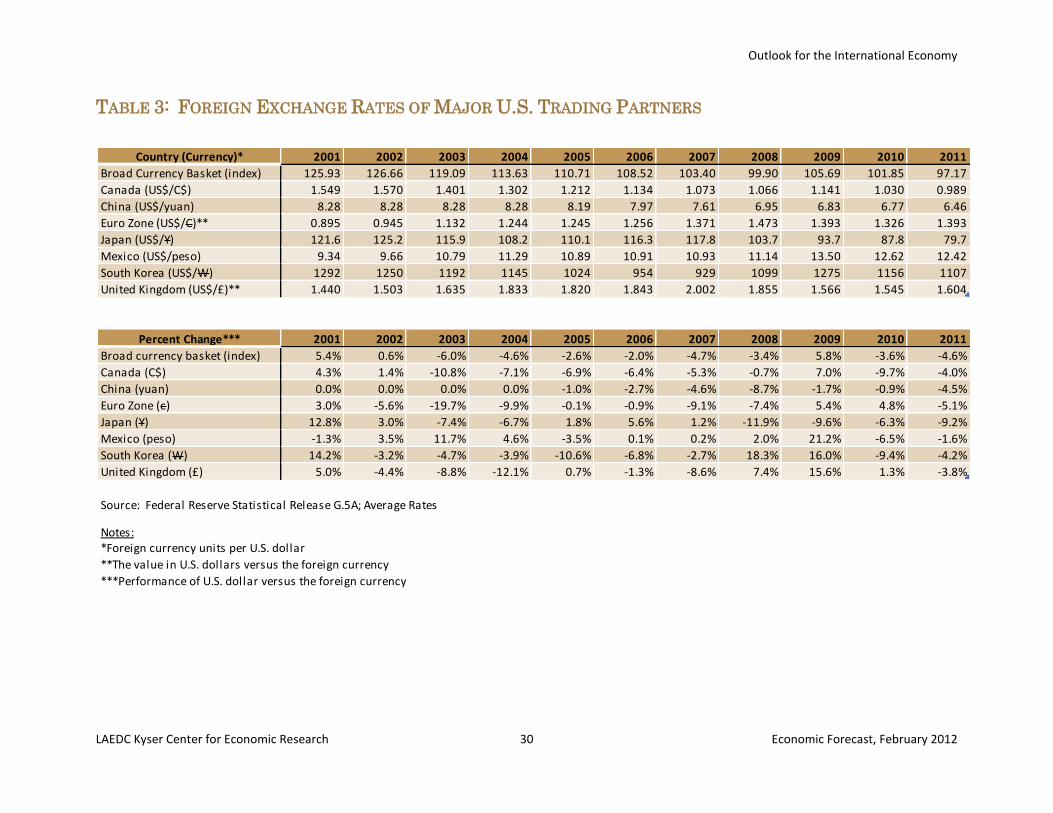
Outlook for the International Economy
LAEDC Kyser Center for Economic Research 30 Economic Forecast, February 2012
Country (Currency)* 2001 2002 2003 2004 2005 2006 2007 2008 2009 2010 2011
Broad Currency Basket (index) 125.93 126.66 119.09 113.63 110.71 108.52 103.40 99.90 105.69 101.85 97.17
Canada (US$/C$) 1.549 1.570 1.401 1.302 1.212 1.134 1.073 1.066 1.141 1.030 0.989
China (US$/yuan) 8.28 8.28 8.28 8.28 8.19 7.97 7.61 6.95 6.83 6.77 6.46
Euro Zone (US$/C)** 0.895 0.945 1.132 1.244 1.245 1.256 1.371 1.473 1.393 1.326 1.393
Japan (US$/Y) 121.6 125.2 115.9 108.2 110.1 116.3 117.8 103.7 93.7 87.8 79.7
Mexico (US$/peso) 9.34 9.66 10.79 11.29 10.89 10.91 10.93 11.14 13.50 12.62 12.42
South Korea (US$/W) 1292 1250 1192 1145 1024 954 929 1099 1275 1156 1107
United Kingdom (US$/£)** 1.440 1.503 1.635 1.833 1.820 1.843 2.002 1.855 1.566 1.545 1.604
Percent Change*** 2001 2002 2003 2004 2005 2006 2007 2008 2009 2010 2011
Broad currency basket (index) 5.4% 0.6% -6.0% -4.6% -2.6% -2.0% -4.7% -3.4% 5.8% -3.6% -4.6%
Canada (C$) 4.3% 1.4% -10.8% -7.1% -6.9% -6.4% -5.3% -0.7% 7.0% -9.7% -4.0%
China (yuan) 0.0% 0.0% 0.0% 0.0% -1.0% -2.7% -4.6% -8.7% -1.7% -0.9% -4.5%
Euro Zone (c) 3.0% -5.6% -19.7% -9.9% -0.1% -0.9% -9.1% -7.4% 5.4% 4.8% -5.1%
Japan (Y) 12.8% 3.0% -7.4% -6.7% 1.8% 5.6% 1.2% -11.9% -9.6% -6.3% -9.2%
Mexico (peso) -1.3% 3.5% 11.7% 4.6% -3.5% 0.1% 0.2% 2.0% 21.2% -6.5% -1.6%
South Korea (W) 14.2% -3.2% -4.7% -3.9% -10.6% -6.8% -2.7% 18.3% 16.0% -9.4% -4.2%
United Kingdom (£) 5.0% -4.4% -8.8% -12.1% 0.7% -1.3% -8.6% 7.4% 15.6% 1.3% -3.8%
Source: Federal Reserve Statistical Release G.5A; Average Rates
Notes:*Foreign currency units per U.S. dollar
**The value in U.S. dollars versus the foreign currency
***Performance of U.S. dollar versus the foreign currency
TABLE 3: FOREIGN EXCHANGE RATES OF MAJOR U.S. TRADING PARTNERS
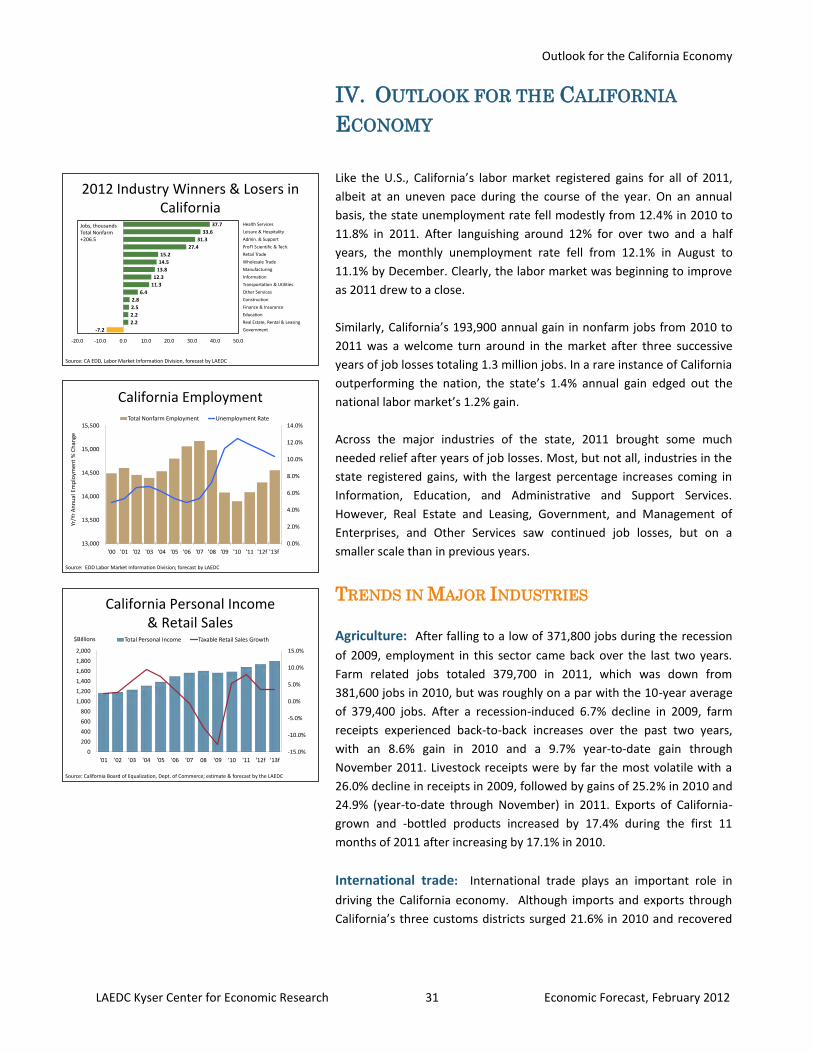
Outlook for the California Economy
LAEDC Kyser Center for Economic Research 31 Economic Forecast, February 2012
2012 Industry Winners & Losers in California
-7.2
2.2
2.2
2.5
2.8
6.4
11.3
12.3
13.8
14.5
15.2
27.4
31.3
33.6
37.7
-20.0 -10.0 0.0 10.0 20.0 30.0 40.0 50.0
Government
Real Estate, Rental & Leasing
Education
Finance & Insurance
Construction
Other Services
Transportation & Utilities
Information
Manufacturing
Wholesale Trade
Retail Trade
Prof'l Scientific & Tech.
Admin. & Support
Leisure & Hospitality
Health Services
Source: CA EDD, Labor Market Information Division, forecast by LAEDC
Jobs, thousandsTotal Nonfarm +206.5
California Employment
0.0%
2.0%
4.0%
6.0%
8.0%
10.0%
12.0%
14.0%
13,000
13,500
14,000
14,500
15,000
15,500
'00 '01 '02 '03 '04 '05 '06 '07 '08 '09 '10 '11 '12f '13f
Total Nonfarm Employment Unemployment Rate
Source: EDD Labor Market Information Division; forecast by LAEDC
Yr/Y
r A
nn
ual
Em
plo
ymen
t %
Ch
ange
California Personal Income & Retail Sales
-15.0%
-10.0%
-5.0%
0.0%
5.0%
10.0%
15.0%
0
200
400
600
800
1,000
1,200
1,400
1,600
1,800
2,000
'01 '02 '03 '04 '05 '06 '07 08 '09 '10 '11 '12f '13f
Total Personal Income Taxable Retail Sales Growth$Billions
Source: California Board of Equalization, Dept. of Commerce; estimate & forecast by the LAEDC
IV. OUTLOOK FOR THE CALIFORNIA
ECONOMY
Like the U.S., California’s labor market registered gains for all of 2011,
albeit at an uneven pace during the course of the year. On an annual
basis, the state unemployment rate fell modestly from 12.4% in 2010 to
11.8% in 2011. After languishing around 12% for over two and a half
years, the monthly unemployment rate fell from 12.1% in August to
11.1% by December. Clearly, the labor market was beginning to improve
as 2011 drew to a close.
Similarly, California’s 193,900 annual gain in nonfarm jobs from 2010 to
2011 was a welcome turn around in the market after three successive
years of job losses totaling 1.3 million jobs. In a rare instance of California
outperforming the nation, the state’s 1.4% annual gain edged out the
national labor market’s 1.2% gain.
Across the major industries of the state, 2011 brought some much
needed relief after years of job losses. Most, but not all, industries in the
state registered gains, with the largest percentage increases coming in
Information, Education, and Administrative and Support Services.
However, Real Estate and Leasing, Government, and Management of
Enterprises, and Other Services saw continued job losses, but on a
smaller scale than in previous years.
TRENDS IN MAJOR INDUSTRIES
Agriculture: After falling to a low of 371,800 jobs during the recession
of 2009, employment in this sector came back over the last two years.
Farm related jobs totaled 379,700 in 2011, which was down from
381,600 jobs in 2010, but was roughly on a par with the 10-year average
of 379,400 jobs. After a recession-induced 6.7% decline in 2009, farm
receipts experienced back-to-back increases over the past two years,
with an 8.6% gain in 2010 and a 9.7% year-to-date gain through
November 2011. Livestock receipts were by far the most volatile with a
26.0% decline in receipts in 2009, followed by gains of 25.2% in 2010 and
24.9% (year-to-date through November) in 2011. Exports of California-
grown and -bottled products increased by 17.4% during the first 11
months of 2011 after increasing by 17.1% in 2010.
International trade: International trade plays an important role in
driving the California economy. Although imports and exports through
California’s three customs districts surged 21.6% in 2010 and recovered
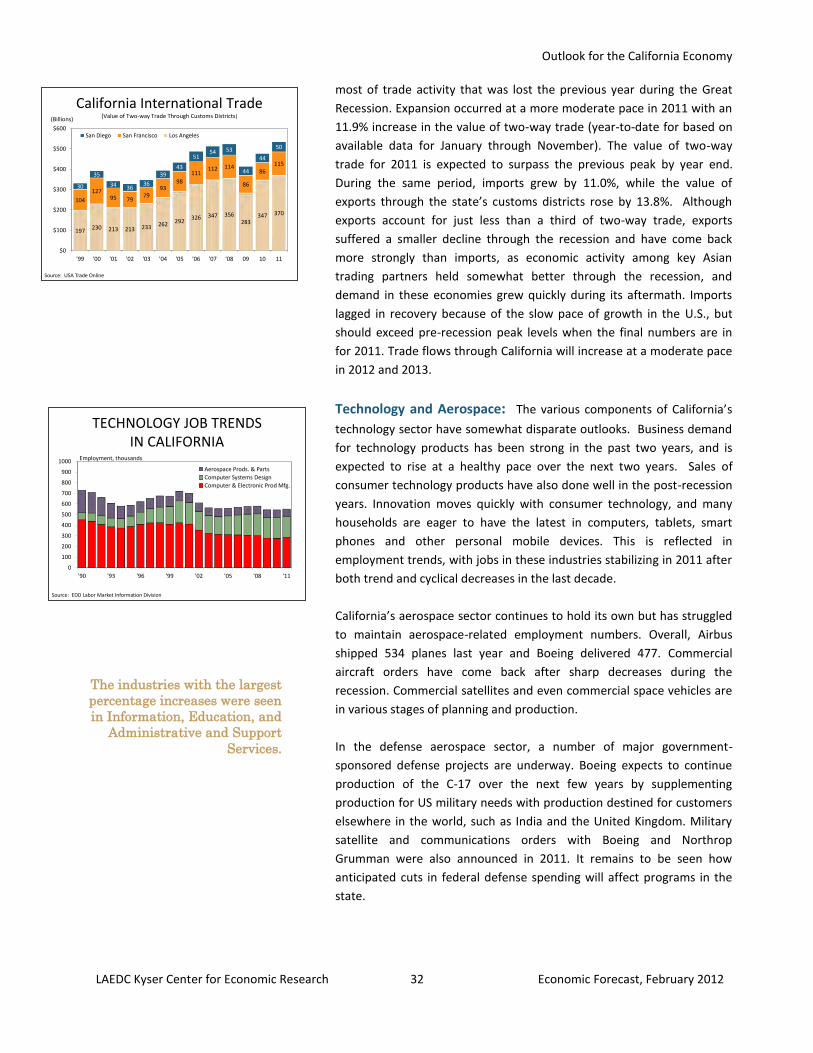
Outlook for the California Economy
LAEDC Kyser Center for Economic Research 32 Economic Forecast, February 2012
TECHNOLOGY JOB TRENDS IN CALIFORNIA
0
100
200
300
400
500
600
700
800
900
1000
'90 '93 '96 '99 '02 '05 '08 '11
Aerospace Prods. & Parts
Computer Systems Design
Computer & Electronic Prod Mfg.
Source: EDD Labor Market Information Division
Employment, thousands
California International Trade(Value of Two-way Trade Through Customs Districts)
197230 213 213 233 262 292
326 347 356283
347 370
104
12795 79
7993
98
111112 114
86
86115
30
35
34 3636
3943
5154 53
44
44
50
$0
$100
$200
$300
$400
$500
$600
'99 '00 '01 '02 '03 '04 '05 '06 '07 '08 09 10 11
San Diego San Francisco Los Angeles
Source: USA Trade Online
(Billions)
most of trade activity that was lost the previous year during the Great
Recession. Expansion occurred at a more moderate pace in 2011 with an
11.9% increase in the value of two-way trade (year-to-date for based on
available data for January through November). The value of two-way
trade for 2011 is expected to surpass the previous peak by year end.
During the same period, imports grew by 11.0%, while the value of
exports through the state’s customs districts rose by 13.8%. Although
exports account for just less than a third of two-way trade, exports
suffered a smaller decline through the recession and have come back
more strongly than imports, as economic activity among key Asian
trading partners held somewhat better through the recession, and
demand in these economies grew quickly during its aftermath. Imports
lagged in recovery because of the slow pace of growth in the U.S., but
should exceed pre-recession peak levels when the final numbers are in
for 2011. Trade flows through California will increase at a moderate pace
in 2012 and 2013.
Technology and Aerospace: The various components of California’s
technology sector have somewhat disparate outlooks. Business demand
for technology products has been strong in the past two years, and is
expected to rise at a healthy pace over the next two years. Sales of
consumer technology products have also done well in the post-recession
years. Innovation moves quickly with consumer technology, and many
households are eager to have the latest in computers, tablets, smart
phones and other personal mobile devices. This is reflected in
employment trends, with jobs in these industries stabilizing in 2011 after
both trend and cyclical decreases in the last decade.
California’s aerospace sector continues to hold its own but has struggled
to maintain aerospace-related employment numbers. Overall, Airbus
shipped 534 planes last year and Boeing delivered 477. Commercial
aircraft orders have come back after sharp decreases during the
recession. Commercial satellites and even commercial space vehicles are
in various stages of planning and production.
In the defense aerospace sector, a number of major government-
sponsored defense projects are underway. Boeing expects to continue
production of the C-17 over the next few years by supplementing
production for US military needs with production destined for customers
elsewhere in the world, such as India and the United Kingdom. Military
satellite and communications orders with Boeing and Northrop
Grumman were also announced in 2011. It remains to be seen how
anticipated cuts in federal defense spending will affect programs in the
state.
The industries with the largest
percentage increases were seen
in Information, Education, and
Administrative and Support
Services.
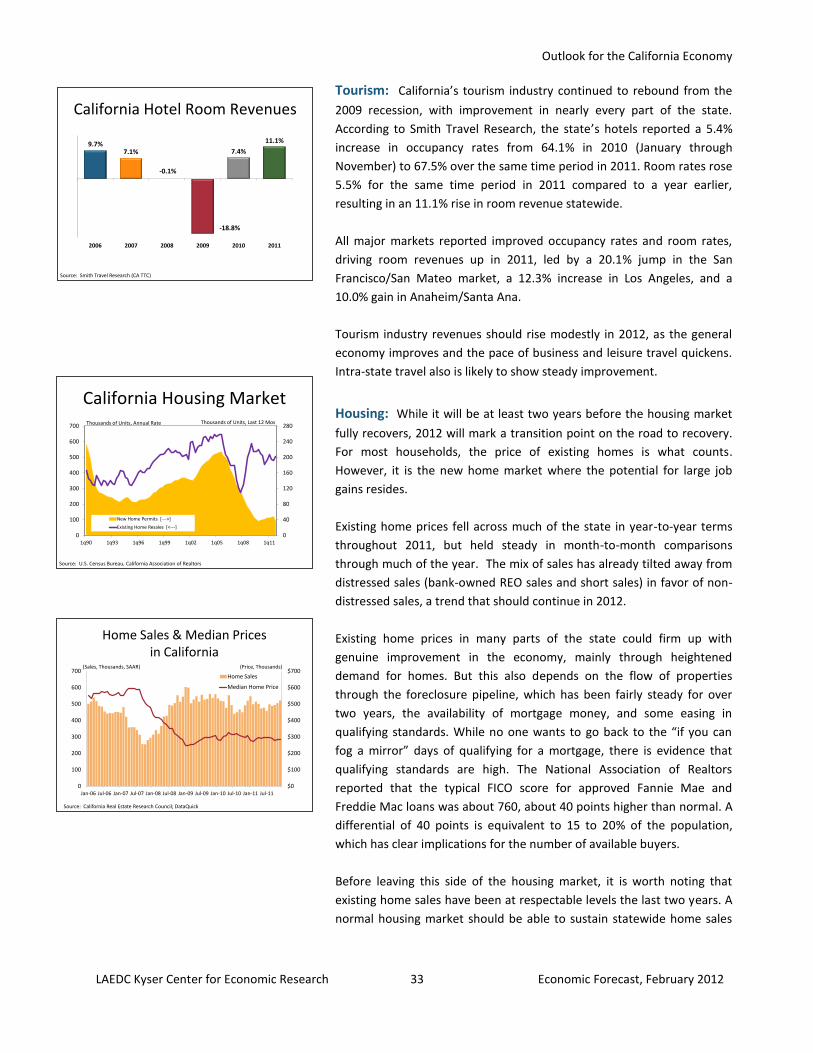
Outlook for the California Economy
LAEDC Kyser Center for Economic Research 33 Economic Forecast, February 2012
Home Sales & Median Pricesin California
$0
$100
$200
$300
$400
$500
$600
$700
0
100
200
300
400
500
600
700
Jan-06 Jul-06 Jan-07 Jul-07 Jan-08 Jul-08 Jan-09 Jul-09 Jan-10 Jul-10 Jan-11 Jul-11
Home Sales
Median Home Price
(Sales, Thousands, SAAR) (Price, Thousands)
Source: California Real Estate Research Council; DataQuick
Source: U.S. Census Bureau, California Association of Realtors
California Housing Market
0
40
80
120
160
200
240
280
0
100
200
300
400
500
600
700
1q90 1q93 1q96 1q99 1q02 1q05 1q08 1q11
New Home Permits [--->]
Existing Home Resales [<---]
Thousands of Units, Annual Rate Thousands of Units, Last 12 Mos
California Hotel Room Revenues
9.7%7.1%
-0.1%
-18.8%
7.4%
11.1%
2006 2007 2008 2009 2010 2011
Source: Smith Travel Research (CA TTC)
Tourism: California’s tourism industry continued to rebound from the
2009 recession, with improvement in nearly every part of the state.
According to Smith Travel Research, the state’s hotels reported a 5.4%
increase in occupancy rates from 64.1% in 2010 (January through
November) to 67.5% over the same time period in 2011. Room rates rose
5.5% for the same time period in 2011 compared to a year earlier,
resulting in an 11.1% rise in room revenue statewide.
All major markets reported improved occupancy rates and room rates,
driving room revenues up in 2011, led by a 20.1% jump in the San
Francisco/San Mateo market, a 12.3% increase in Los Angeles, and a
10.0% gain in Anaheim/Santa Ana.
Tourism industry revenues should rise modestly in 2012, as the general
economy improves and the pace of business and leisure travel quickens.
Intra-state travel also is likely to show steady improvement.
Housing: While it will be at least two years before the housing market
fully recovers, 2012 will mark a transition point on the road to recovery.
For most households, the price of existing homes is what counts.
However, it is the new home market where the potential for large job
gains resides.
Existing home prices fell across much of the state in year-to-year terms
throughout 2011, but held steady in month-to-month comparisons
through much of the year. The mix of sales has already tilted away from
distressed sales (bank-owned REO sales and short sales) in favor of non-
distressed sales, a trend that should continue in 2012.
Existing home prices in many parts of the state could firm up with
genuine improvement in the economy, mainly through heightened
demand for homes. But this also depends on the flow of properties
through the foreclosure pipeline, which has been fairly steady for over
two years, the availability of mortgage money, and some easing in
qualifying standards. While no one wants to go back to the “if you can
fog a mirror” days of qualifying for a mortgage, there is evidence that
qualifying standards are high. The National Association of Realtors
reported that the typical FICO score for approved Fannie Mae and
Freddie Mac loans was about 760, about 40 points higher than normal. A
differential of 40 points is equivalent to 15 to 20% of the population,
which has clear implications for the number of available buyers.
Before leaving this side of the housing market, it is worth noting that
existing home sales have been at respectable levels the last two years. A
normal housing market should be able to sustain statewide home sales
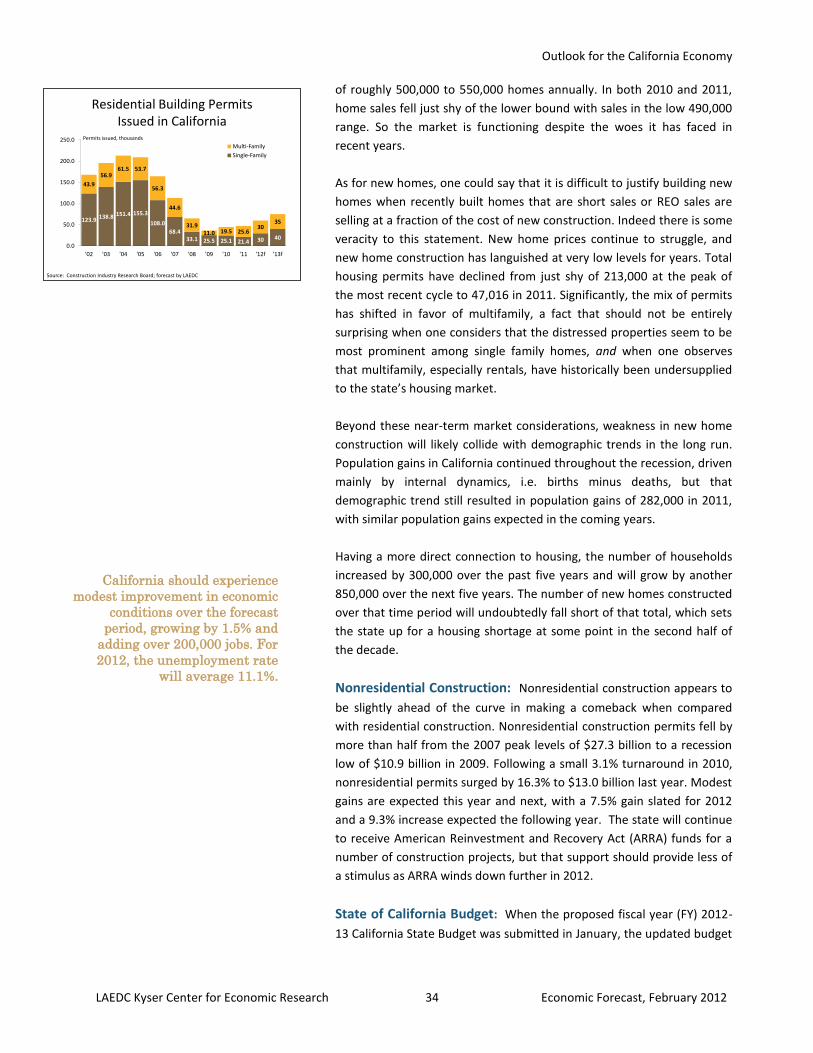
Outlook for the California Economy
LAEDC Kyser Center for Economic Research 34 Economic Forecast, February 2012
Residential Building Permits Issued in California
123.9 138.8 151.4 155.3
108.0
68.433.1 25.5 25.1 21.4 30 40
43.9
56.961.5 53.7
56.3
44.6
31.911.0 19.5 25.6
3035
0.0
50.0
100.0
150.0
200.0
250.0
'02 '03 '04 '05 '06 '07 '08 '09 '10 '11 '12f '13f
Multi-Family
Single-Family
Permits issued, thousands
Source: Construction Industry Research Board; forecast by LAEDC
of roughly 500,000 to 550,000 homes annually. In both 2010 and 2011,
home sales fell just shy of the lower bound with sales in the low 490,000
range. So the market is functioning despite the woes it has faced in
recent years.
As for new homes, one could say that it is difficult to justify building new
homes when recently built homes that are short sales or REO sales are
selling at a fraction of the cost of new construction. Indeed there is some
veracity to this statement. New home prices continue to struggle, and
new home construction has languished at very low levels for years. Total
housing permits have declined from just shy of 213,000 at the peak of
the most recent cycle to 47,016 in 2011. Significantly, the mix of permits
has shifted in favor of multifamily, a fact that should not be entirely
surprising when one considers that the distressed properties seem to be
most prominent among single family homes, and when one observes
that multifamily, especially rentals, have historically been undersupplied
to the state’s housing market.
Beyond these near-term market considerations, weakness in new home
construction will likely collide with demographic trends in the long run.
Population gains in California continued throughout the recession, driven
mainly by internal dynamics, i.e. births minus deaths, but that
demographic trend still resulted in population gains of 282,000 in 2011,
with similar population gains expected in the coming years.
Having a more direct connection to housing, the number of households
increased by 300,000 over the past five years and will grow by another
850,000 over the next five years. The number of new homes constructed
over that time period will undoubtedly fall short of that total, which sets
the state up for a housing shortage at some point in the second half of
the decade.
Nonresidential Construction: Nonresidential construction appears to
be slightly ahead of the curve in making a comeback when compared
with residential construction. Nonresidential construction permits fell by
more than half from the 2007 peak levels of $27.3 billion to a recession
low of $10.9 billion in 2009. Following a small 3.1% turnaround in 2010,
nonresidential permits surged by 16.3% to $13.0 billion last year. Modest
gains are expected this year and next, with a 7.5% gain slated for 2012
and a 9.3% increase expected the following year. The state will continue
to receive American Reinvestment and Recovery Act (ARRA) funds for a
number of construction projects, but that support should provide less of
a stimulus as ARRA winds down further in 2012.
State of California Budget: When the proposed fiscal year (FY) 2012-
13 California State Budget was submitted in January, the updated budget
California should experience
modest improvement in economic
conditions over the forecast
period, growing by 1.5% and
adding over 200,000 jobs. For
2012, the unemployment rate
will average 11.1%.
Outlook for the California Economy
LAEDC Kyser Center for Economic Research 35 Economic Forecast, February 2012
for the current FY 2011-12 (which ends June 30, 2012) showed a 9.0%
decline in general fund revenues, primarily because of large declines in
sales and use taxes, and corporate taxes. With the expiration of the
temporary 1% sales tax increase, sales and use tax receipts fell by 26.4%
from June through December 2011 compared with the same period in
2010.
Over the same time period, disbursements fell by 3.5%, with universities
and the legislative/executive/judicial operations experiencing the largest
state program cuts at 22.7% and 11.5% respectively. Total local
assistance fell by 10.9%, with K-12 education absorbing an 11.9% cut.
The proposed FY 2012-13 budget includes an anticipated 7.7% gain in
general fund revenues and a 7.0% increase in outlays. Several areas are
slated for increased funding, including K-12 schools, corrections, and
legislative/judicial/executive operations, partially restoring funds that
have been cut in recent years. The state legislature managed to pass the
FY 2011-12 budget on time last year. Time will tell whether they will
deliver a repeat performance.
California Forecast: California should experience modest
improvement in economic conditions over the forecast period, growing
by 1.5% and adding over 200,000 jobs this year, with a 1.8% next year,
which is equivalent to nearly 260,000 jobs. For 2012, the unemployment
rate will average 11.1%, with further improvement to 10.3% in 2013. As
mentioned throughout this report, the economy will continue to heal but
the process is uncomfortably long.
Outlook for the California Economy
LAEDC Kyser Center for Economic Research 36 Economic Forecast, February 2012
GROSS PRODUCT1
Which are the world’s largest economies? People frequently ask how
California’s gross domestic product (GDP) ranks among the nations of the
world. They also ask about where the Los Angeles five-county area and
Los Angeles County would rank if they were sovereign countries.
Based on the final results for 20102, California fell from eighth to ninth
place in the rankings behind Brazil and Italy, whereas the five-county
area retained its 16th
place ranking.
Los Angeles County moved up one
slot to 19th
place. Los Angeles County is now just behind the Netherlands,
Turkey, and Indonesia, and ahead of Switzerland, Poland and Belgium,
Sweden, Saudi Arabia, Taiwan and Norway.
In nominal terms (not adjusted for inflation and based on market
exchange rates), GDP growth rates in 2010 for the U.S., California, the
Los Angeles five-county region and Los Angeles County were not nearly
as high as in most emerging and developing nations. Taiwan, India, and
China were the only economies that experienced double-digit growth
rates in both nominal and real (adjusted for inflation and constant prices)
terms in 2010.
China surpassed Japan to become the second largest economy in the
world in 2010 (on a nominal basis). Other notable developments include
Spain falling from 9th
to 12th
place, while Canada, India and Russia all
moved up one spot in the rankings.
When compared in real GDP terms, the emerging and developing
economies also posted much stronger growth than the California and
Southern California economies. Taiwan, India, and China experienced the
largest GDP gains, boosted by government spending, exports, and
consumer spending. Other notable performances in real terms during
2010 included the economies of Turkey, Brazil, South Korea, and
Indonesia. The worst performances of the year occurred in some of the
euro zone economies.
1 This list is based on market exchange rates (nominal method) and not adjusted for purchasing power parity (PPP)
utilizing PPP exchange rates. 2 International gross domestic product figures (IMF) and domestic regional figures (BEA) are published in the third
quarter following the previous year end. Thus, the figures reported in Table 4 lag by one year.
Los Angeles County has the 19th
largest economy in the world.
Outlook for the California Economy
LAEDC Kyser Center for Economic Research 37 Economic Forecast, February 2012
Rank Country/State/Region 2010Nominal GDP
'09-'10 % Chg
Real GDP
'09-'10 %
Chg1 United States $14,526.55 4.2% 3.0%
2 China 5,878.26 17.8% 10.3%
3 Japan 5,458.80 8.5% 4.0%
4 Germany 3,286.45 -0.6% 3.6%
5 France 2,562.74 -2.6% 1.4%
6 United Kingdom 2,250.21 3.1% 1.4%
7 Brazil 2,090.31 30.6% 7.5%
8 Italy 2,055.11 -2.9% 1.3%
California 1,901.09 2.9% 1.8%9 India 1,631.97 29.0% 10.1%
10 Canada 1,577.04 17.9% 3.2%
11 Russia 1,479.83 21.1% 4.0%
12 Spain 1,409.95 -3.9% -0.1%
13 Australia 1,237.36 25.2% 2.7%
14 Mexico 1,034.31 17.6% 5.4%
15 South Korea 1,014.48 21.6% 6.2%
Los Angeles 5-co. area 881.30 2.3% 1.2%16 Netherlands 780.67 -1.9% 1.6%
17 Turkey 735.49 19.7% 8.9%
18 Indonesia 706.75 31.3% 6.1%
Los Angeles County 543.74 8.8% 0.3%19 Switzerland 527.92 7.2% 2.7%
20 Poland 469.40 9.0% 3.8%
21 Belgium 467.78 -0.9% 2.1%
22 Sweden 458.73 13.7% 5.7%
23 Saudi Arabia 448.36 18.9% 4.1%
24 Taiwan 429.85 13.9% 10.9%
25 Norway 412.99 11.4% 0.3%
Note: Based on market exchange rates and not on purchasing power parity exchange rates
Note: Nominal GDP figures are not adjusted for inflation
Sources: IMF WEO -- September 2011, BEA -- September 2011, and LAEDC estimates
TABLE 4: GROSS PRODUCT COMPARISONS
($Billions, 2010 figures)
Outlook for the California Economy
LAEDC Kyser Center for Economic Research 38 Economic Forecast, February 2012
YearPopulation on
July 1
(Thousands)
Nonfarm
Employment
(Ave., thousands)
Unemploy-
ment Rate
(ave., %)
Total Personal
Income
($Billions)
Per Capita
Personal
Income ($)
Taxable Retail
Sales ($Billions)
Value of Two-
way Trade
($Billions)
Housing Unit
Permits
Issued
Nonresidential
Buidling
Permist
($Millions)2001 34,481.8 14,602.0 5.4 1168.7 33,893 294.0 340.7 148,757 23,455
2002 34,867.8 14,457.8 6.7 1187.3 34,051 301.6 328.1 167,761 19,835
2003 35,236.6 14,392.8 6.8 1233.0 34,992 320.2 348.0 195,682 18,628
2004 35,538.3 14,532.6 6.2 1312.2 36,924 350.2 394.8 212,960 19,718
2005 35,770.7 14,801.3 5.4 1387.7 38,794 375.8 433.8 208,972 21,469
2006 35,947.5 15,060.3 4.9 1495.5 41,602 389.1 487.6 164,280 23,298
2007 36,185.9 15,173.5 5.2 1566.4 43,289 387.0 512.9 113,034 23,733
2008 36,538.0 14,981.4 7.2 1604.2 43,905 357.3 523.3 64,962 19,588
2009 36,887.6 14,084.7 11.3 1567.0 42,480 311.2 413.3 36,421 10,866
2010 37,318.5 13,896.4 12.4 1590.3 42,614 327.9 502.6 44,762 11,200
2011e 37,578.6 14,090.3 11.8 1681.9 44,757 354.5 559.7 47,015 13,029
2012f 37,916.8 14,296.8 11.1 1737.6 45,827 367.4 578.3 60,000 14,000
2013f 38,258.1 14,554.1 10.3 1804.5 47,167 380.6 606.0 75,000 15,300
% Change Column1 Column2 Column3 Column4 Column5 Column6 Column7 Column8 Column9
01/00 1.4% 0.8% 2.9% 1.5% 2.4% -13.1% 0.1% -12.2%
02/01 1.1% -1.0% 1.6% 0.5% 2.6% -3.7% 12.8% -15.4%
03/02 1.1% -0.4% 3.8% 2.8% 6.2% 6.1% 16.6% -6.1%
04/03 0.9% 1.0% 6.4% 5.5% 9.4% 13.4% 8.8% 5.9%
05/04 0.7% 1.8% 5.8% 5.1% 7.3% 9.9% -1.9% 8.9%
06/05 0.5% 1.7% 7.8% 7.2% 3.5% 12.4% -21.4% 8.5%
07/06 0.7% 0.8% 4.7% 4.1% -0.5% 5.2% -31.2% 1.9%
08/07 1.0% -1.3% 2.4% 1.4% -7.7% 2.0% -42.5% -17.5%
09/08 1.0% -6.0% -2.3% -3.2% -12.9% -21.0% -43.9% -44.5%
10/09 1.2% -1.3% 1.5% 0.3% 5.4% 21.6% 22.9% 3.1%
11/10 0.7% 1.4% 5.8% 5.0% 8.1% 11.4% 5.0% 16.3%
12/11 0.9% 1.5% 3.3% 2.4% 3.6% 3.3% 27.6% 7.5%
13/12 0.9% 1.8% 3.9% 2.9% 3.6% 4.8% 25.0% 9.3%
Sources : State of Ca l i fornia : Dept. of Finance, Employment Development Department, Board of Equal ization; U.S. Dept of Commerce
Construction Industry Research Board; estimates and forecasts by the LAEDC
TABLE 5: CALIFORNIA ECONOMIC INDICATORS
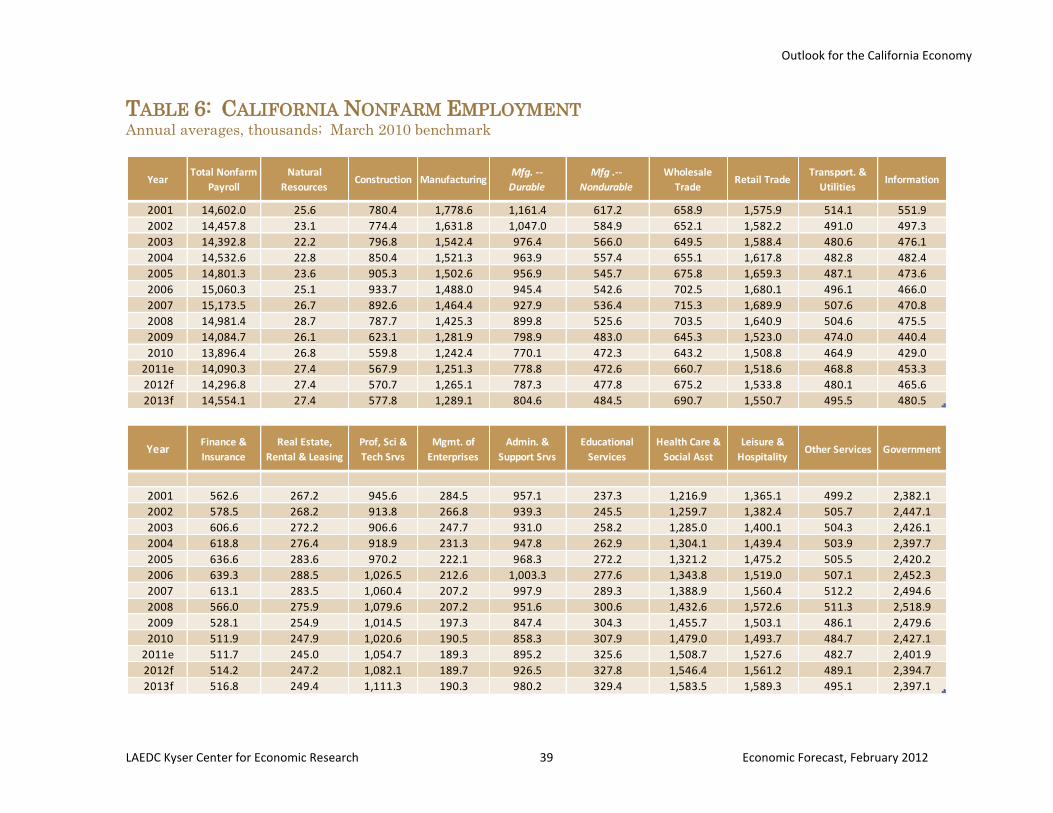
Outlook for the California Economy
LAEDC Kyser Center for Economic Research 39 Economic Forecast, February 2012
YearTotal Nonfarm
Payroll
Natural
ResourcesConstruction Manufacturing
Mfg. --
Durable
Mfg .--
Nondurable
Wholesale
TradeRetail Trade
Transport. &
UtilitiesInformation
2001 14,602.0 25.6 780.4 1,778.6 1,161.4 617.2 658.9 1,575.9 514.1 551.9
2002 14,457.8 23.1 774.4 1,631.8 1,047.0 584.9 652.1 1,582.2 491.0 497.3
2003 14,392.8 22.2 796.8 1,542.4 976.4 566.0 649.5 1,588.4 480.6 476.1
2004 14,532.6 22.8 850.4 1,521.3 963.9 557.4 655.1 1,617.8 482.8 482.4
2005 14,801.3 23.6 905.3 1,502.6 956.9 545.7 675.8 1,659.3 487.1 473.6
2006 15,060.3 25.1 933.7 1,488.0 945.4 542.6 702.5 1,680.1 496.1 466.0
2007 15,173.5 26.7 892.6 1,464.4 927.9 536.4 715.3 1,689.9 507.6 470.8
2008 14,981.4 28.7 787.7 1,425.3 899.8 525.6 703.5 1,640.9 504.6 475.5
2009 14,084.7 26.1 623.1 1,281.9 798.9 483.0 645.3 1,523.0 474.0 440.4
2010 13,896.4 26.8 559.8 1,242.4 770.1 472.3 643.2 1,508.8 464.9 429.0
2011e 14,090.3 27.4 567.9 1,251.3 778.8 472.6 660.7 1,518.6 468.8 453.3
2012f 14,296.8 27.4 570.7 1,265.1 787.3 477.8 675.2 1,533.8 480.1 465.6
2013f 14,554.1 27.4 577.8 1,289.1 804.6 484.5 690.7 1,550.7 495.5 480.5
YearFinance &
Insurance
Real Estate,
Rental & Leasing
Prof, Sci &
Tech Srvs
Mgmt. of
Enterprises
Admin. &
Support Srvs
Educational
Services
Health Care &
Social Asst
Leisure &
HospitalityOther Services Government
2001 562.6 267.2 945.6 284.5 957.1 237.3 1,216.9 1,365.1 499.2 2,382.1
2002 578.5 268.2 913.8 266.8 939.3 245.5 1,259.7 1,382.4 505.7 2,447.1
2003 606.6 272.2 906.6 247.7 931.0 258.2 1,285.0 1,400.1 504.3 2,426.1
2004 618.8 276.4 918.9 231.3 947.8 262.9 1,304.1 1,439.4 503.9 2,397.7
2005 636.6 283.6 970.2 222.1 968.3 272.2 1,321.2 1,475.2 505.5 2,420.2
2006 639.3 288.5 1,026.5 212.6 1,003.3 277.6 1,343.8 1,519.0 507.1 2,452.3
2007 613.1 283.5 1,060.4 207.2 997.9 289.3 1,388.9 1,560.4 512.2 2,494.6
2008 566.0 275.9 1,079.6 207.2 951.6 300.6 1,432.6 1,572.6 511.3 2,518.9
2009 528.1 254.9 1,014.5 197.3 847.4 304.3 1,455.7 1,503.1 486.1 2,479.6
2010 511.9 247.9 1,020.6 190.5 858.3 307.9 1,479.0 1,493.7 484.7 2,427.1
2011e 511.7 245.0 1,054.7 189.3 895.2 325.6 1,508.7 1,527.6 482.7 2,401.9
2012f 514.2 247.2 1,082.1 189.7 926.5 327.8 1,546.4 1,561.2 489.1 2,394.7
2013f 516.8 249.4 1,111.3 190.3 980.2 329.4 1,583.5 1,589.3 495.1 2,397.1
TABLE 6: CALIFORNIA NONFARM EMPLOYMENT Annual averages, thousands; March 2010 benchmark
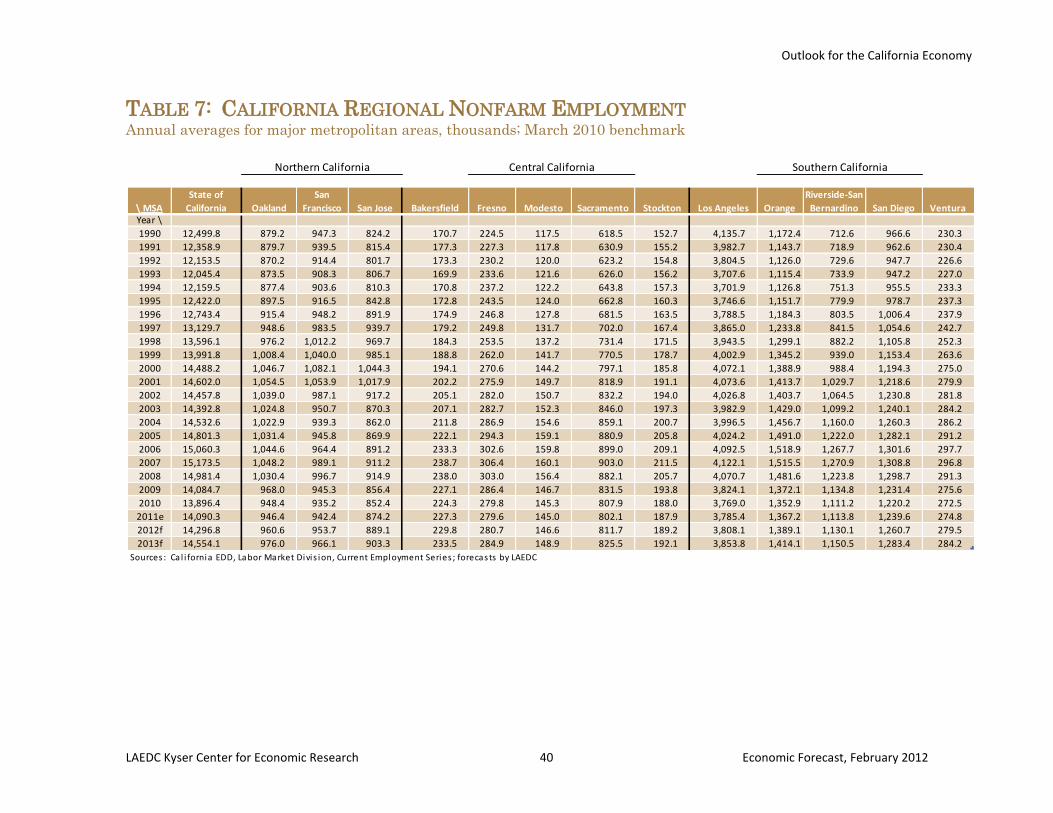
Outlook for the California Economy
LAEDC Kyser Center for Economic Research 40 Economic Forecast, February 2012
\ MSA
State of
California Oakland
San
Francisco San Jose Bakersfield Fresno Modesto Sacramento Stockton Los Angeles Orange
Riverside-San
Bernardino San Diego VenturaYear \
1990 12,499.8 879.2 947.3 824.2 170.7 224.5 117.5 618.5 152.7 4,135.7 1,172.4 712.6 966.6 230.3
1991 12,358.9 879.7 939.5 815.4 177.3 227.3 117.8 630.9 155.2 3,982.7 1,143.7 718.9 962.6 230.4
1992 12,153.5 870.2 914.4 801.7 173.3 230.2 120.0 623.2 154.8 3,804.5 1,126.0 729.6 947.7 226.6
1993 12,045.4 873.5 908.3 806.7 169.9 233.6 121.6 626.0 156.2 3,707.6 1,115.4 733.9 947.2 227.0
1994 12,159.5 877.4 903.6 810.3 170.8 237.2 122.2 643.8 157.3 3,701.9 1,126.8 751.3 955.5 233.3
1995 12,422.0 897.5 916.5 842.8 172.8 243.5 124.0 662.8 160.3 3,746.6 1,151.7 779.9 978.7 237.3
1996 12,743.4 915.4 948.2 891.9 174.9 246.8 127.8 681.5 163.5 3,788.5 1,184.3 803.5 1,006.4 237.9
1997 13,129.7 948.6 983.5 939.7 179.2 249.8 131.7 702.0 167.4 3,865.0 1,233.8 841.5 1,054.6 242.7
1998 13,596.1 976.2 1,012.2 969.7 184.3 253.5 137.2 731.4 171.5 3,943.5 1,299.1 882.2 1,105.8 252.3
1999 13,991.8 1,008.4 1,040.0 985.1 188.8 262.0 141.7 770.5 178.7 4,002.9 1,345.2 939.0 1,153.4 263.6
2000 14,488.2 1,046.7 1,082.1 1,044.3 194.1 270.6 144.2 797.1 185.8 4,072.1 1,388.9 988.4 1,194.3 275.0
2001 14,602.0 1,054.5 1,053.9 1,017.9 202.2 275.9 149.7 818.9 191.1 4,073.6 1,413.7 1,029.7 1,218.6 279.9
2002 14,457.8 1,039.0 987.1 917.2 205.1 282.0 150.7 832.2 194.0 4,026.8 1,403.7 1,064.5 1,230.8 281.8
2003 14,392.8 1,024.8 950.7 870.3 207.1 282.7 152.3 846.0 197.3 3,982.9 1,429.0 1,099.2 1,240.1 284.2
2004 14,532.6 1,022.9 939.3 862.0 211.8 286.9 154.6 859.1 200.7 3,996.5 1,456.7 1,160.0 1,260.3 286.2
2005 14,801.3 1,031.4 945.8 869.9 222.1 294.3 159.1 880.9 205.8 4,024.2 1,491.0 1,222.0 1,282.1 291.2
2006 15,060.3 1,044.6 964.4 891.2 233.3 302.6 159.8 899.0 209.1 4,092.5 1,518.9 1,267.7 1,301.6 297.7
2007 15,173.5 1,048.2 989.1 911.2 238.7 306.4 160.1 903.0 211.5 4,122.1 1,515.5 1,270.9 1,308.8 296.8
2008 14,981.4 1,030.4 996.7 914.9 238.0 303.0 156.4 882.1 205.7 4,070.7 1,481.6 1,223.8 1,298.7 291.3
2009 14,084.7 968.0 945.3 856.4 227.1 286.4 146.7 831.5 193.8 3,824.1 1,372.1 1,134.8 1,231.4 275.6
2010 13,896.4 948.4 935.2 852.4 224.3 279.8 145.3 807.9 188.0 3,769.0 1,352.9 1,111.2 1,220.2 272.5
2011e 14,090.3 946.4 942.4 874.2 227.3 279.6 145.0 802.1 187.9 3,785.4 1,367.2 1,113.8 1,239.6 274.8
2012f 14,296.8 960.6 953.7 889.1 229.8 280.7 146.6 811.7 189.2 3,808.1 1,389.1 1,130.1 1,260.7 279.5
2013f 14,554.1 976.0 966.1 903.3 233.5 284.9 148.9 825.5 192.1 3,853.8 1,414.1 1,150.5 1,283.4 284.2
Sources : Ca l i fornia EDD, Labor Market Divis ion, Current Employment Series ; forecasts by LAEDC
Central California Southern CaliforniaNorthern California
TABLE 7: CALIFORNIA REGIONAL NONFARM EMPLOYMENT Annual averages for major metropolitan areas, thousands; March 2010 benchmark
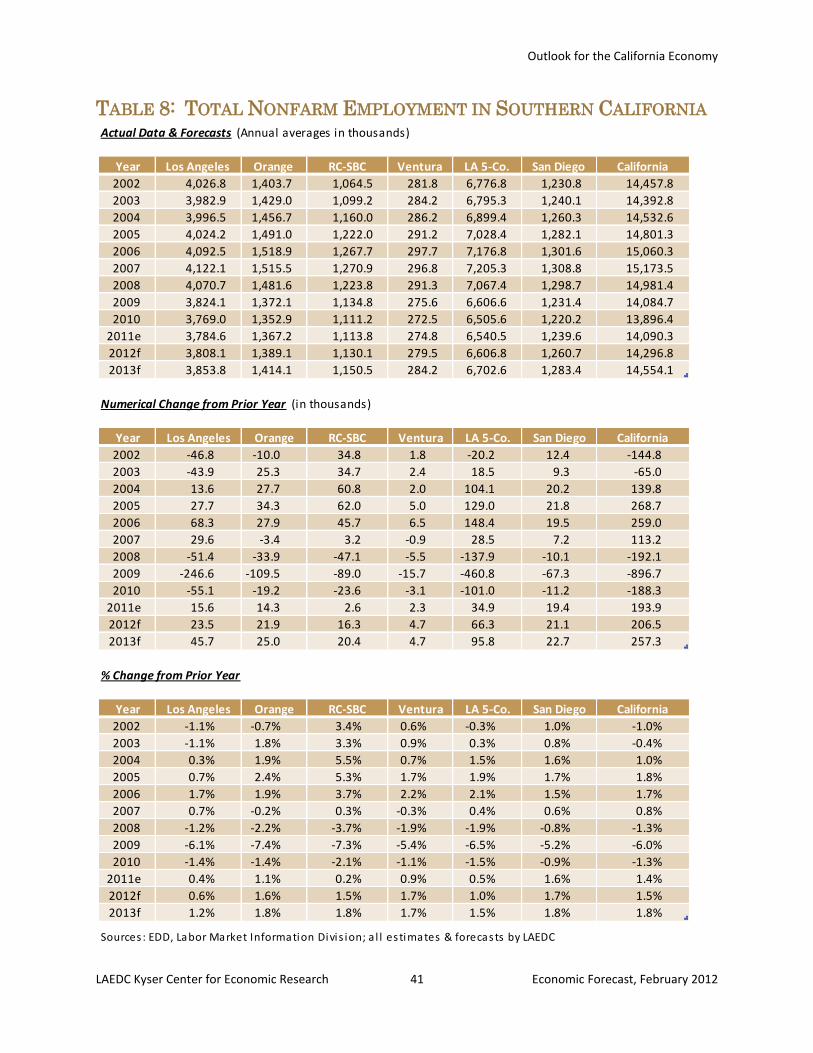
Outlook for the California Economy
LAEDC Kyser Center for Economic Research 41 Economic Forecast, February 2012
Actual Data & Forecasts (Annual averages in thousands)
Year Los Angeles Orange RC-SBC Ventura LA 5-Co. San Diego California
2002 4,026.8 1,403.7 1,064.5 281.8 6,776.8 1,230.8 14,457.8
2003 3,982.9 1,429.0 1,099.2 284.2 6,795.3 1,240.1 14,392.8
2004 3,996.5 1,456.7 1,160.0 286.2 6,899.4 1,260.3 14,532.6
2005 4,024.2 1,491.0 1,222.0 291.2 7,028.4 1,282.1 14,801.3
2006 4,092.5 1,518.9 1,267.7 297.7 7,176.8 1,301.6 15,060.3
2007 4,122.1 1,515.5 1,270.9 296.8 7,205.3 1,308.8 15,173.5
2008 4,070.7 1,481.6 1,223.8 291.3 7,067.4 1,298.7 14,981.4
2009 3,824.1 1,372.1 1,134.8 275.6 6,606.6 1,231.4 14,084.7
2010 3,769.0 1,352.9 1,111.2 272.5 6,505.6 1,220.2 13,896.4
2011e 3,784.6 1,367.2 1,113.8 274.8 6,540.5 1,239.6 14,090.3
2012f 3,808.1 1,389.1 1,130.1 279.5 6,606.8 1,260.7 14,296.8
2013f 3,853.8 1,414.1 1,150.5 284.2 6,702.6 1,283.4 14,554.1
Numerical Change from Prior Year (in thousands)
Year Los Angeles Orange RC-SBC Ventura LA 5-Co. San Diego California
2002 -46.8 -10.0 34.8 1.8 -20.2 12.4 -144.8
2003 -43.9 25.3 34.7 2.4 18.5 9.3 -65.0
2004 13.6 27.7 60.8 2.0 104.1 20.2 139.8
2005 27.7 34.3 62.0 5.0 129.0 21.8 268.7
2006 68.3 27.9 45.7 6.5 148.4 19.5 259.0
2007 29.6 -3.4 3.2 -0.9 28.5 7.2 113.2
2008 -51.4 -33.9 -47.1 -5.5 -137.9 -10.1 -192.1
2009 -246.6 -109.5 -89.0 -15.7 -460.8 -67.3 -896.7
2010 -55.1 -19.2 -23.6 -3.1 -101.0 -11.2 -188.3
2011e 15.6 14.3 2.6 2.3 34.9 19.4 193.9
2012f 23.5 21.9 16.3 4.7 66.3 21.1 206.5
2013f 45.7 25.0 20.4 4.7 95.8 22.7 257.3
% Change from Prior Year
Year Los Angeles Orange RC-SBC Ventura LA 5-Co. San Diego California
2002 -1.1% -0.7% 3.4% 0.6% -0.3% 1.0% -1.0%
2003 -1.1% 1.8% 3.3% 0.9% 0.3% 0.8% -0.4%
2004 0.3% 1.9% 5.5% 0.7% 1.5% 1.6% 1.0%
2005 0.7% 2.4% 5.3% 1.7% 1.9% 1.7% 1.8%
2006 1.7% 1.9% 3.7% 2.2% 2.1% 1.5% 1.7%
2007 0.7% -0.2% 0.3% -0.3% 0.4% 0.6% 0.8%
2008 -1.2% -2.2% -3.7% -1.9% -1.9% -0.8% -1.3%
2009 -6.1% -7.4% -7.3% -5.4% -6.5% -5.2% -6.0%
2010 -1.4% -1.4% -2.1% -1.1% -1.5% -0.9% -1.3%
2011e 0.4% 1.1% 0.2% 0.9% 0.5% 1.6% 1.4%
2012f 0.6% 1.6% 1.5% 1.7% 1.0% 1.7% 1.5%
2013f 1.2% 1.8% 1.8% 1.7% 1.5% 1.8% 1.8%
Sources : EDD, Labor Market Information Divis ion; a l l es timates & forecasts by LAEDC
TABLE 8: TOTAL NONFARM EMPLOYMENT IN SOUTHERN CALIFORNIA
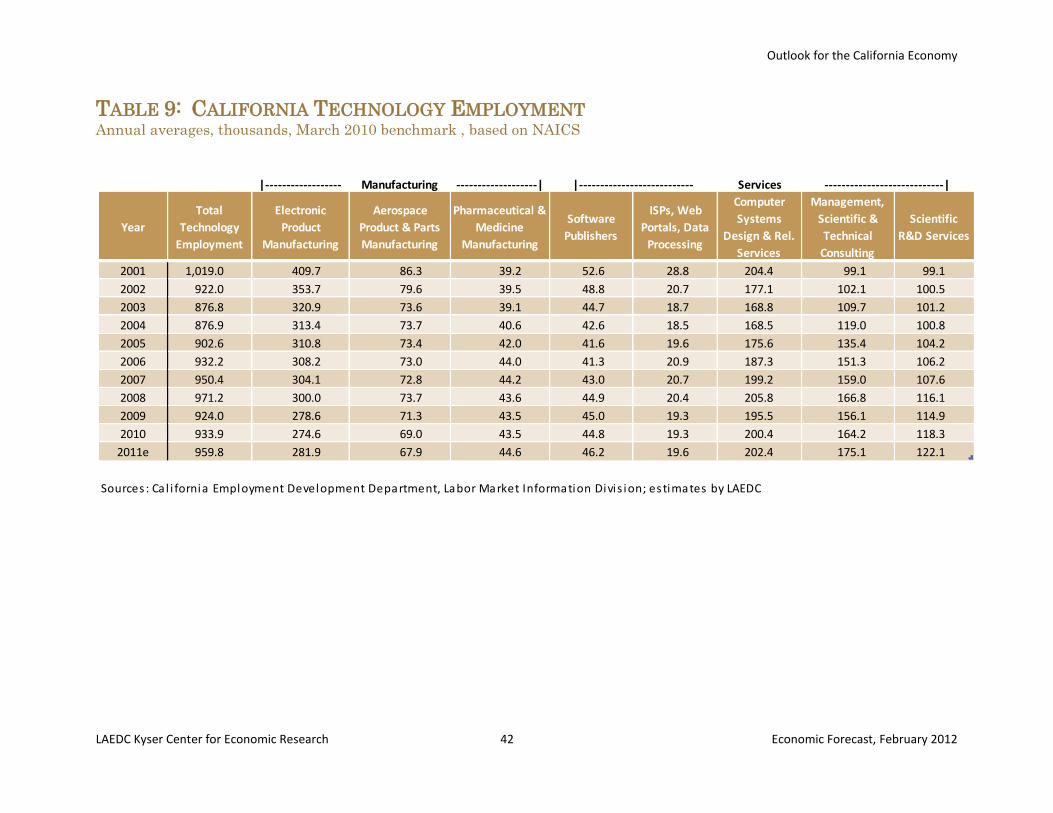
Outlook for the California Economy
LAEDC Kyser Center for Economic Research 42 Economic Forecast, February 2012
|------------------ Manufacturing -------------------| Services
Year
Total
Technology
Employment
Electronic
Product
Manufacturing
Aerospace
Product & Parts
Manufacturing
Pharmaceutical &
Medicine
Manufacturing
Software
Publishers
ISPs, Web
Portals, Data
Processing
Computer
Systems
Design & Rel.
Services
Management,
Scientific &
Technical
Consulting
Scientific
R&D Services
2001 1,019.0 409.7 86.3 39.2 52.6 28.8 204.4 99.1 99.1
2002 922.0 353.7 79.6 39.5 48.8 20.7 177.1 102.1 100.5
2003 876.8 320.9 73.6 39.1 44.7 18.7 168.8 109.7 101.2
2004 876.9 313.4 73.7 40.6 42.6 18.5 168.5 119.0 100.8
2005 902.6 310.8 73.4 42.0 41.6 19.6 175.6 135.4 104.2
2006 932.2 308.2 73.0 44.0 41.3 20.9 187.3 151.3 106.2
2007 950.4 304.1 72.8 44.2 43.0 20.7 199.2 159.0 107.6
2008 971.2 300.0 73.7 43.6 44.9 20.4 205.8 166.8 116.1
2009 924.0 278.6 71.3 43.5 45.0 19.3 195.5 156.1 114.9
2010 933.9 274.6 69.0 43.5 44.8 19.3 200.4 164.2 118.3
2011e 959.8 281.9 67.9 44.6 46.2 19.6 202.4 175.1 122.1
Sources : Ca l i fornia Employment Development Department, Labor Market Information Divis ion; estimates by LAEDC
|--------------------------- ----------------------------|
TABLE 9: CALIFORNIA TECHNOLOGY EMPLOYMENT Annual averages, thousands, March 2010 benchmark , based on NAICS
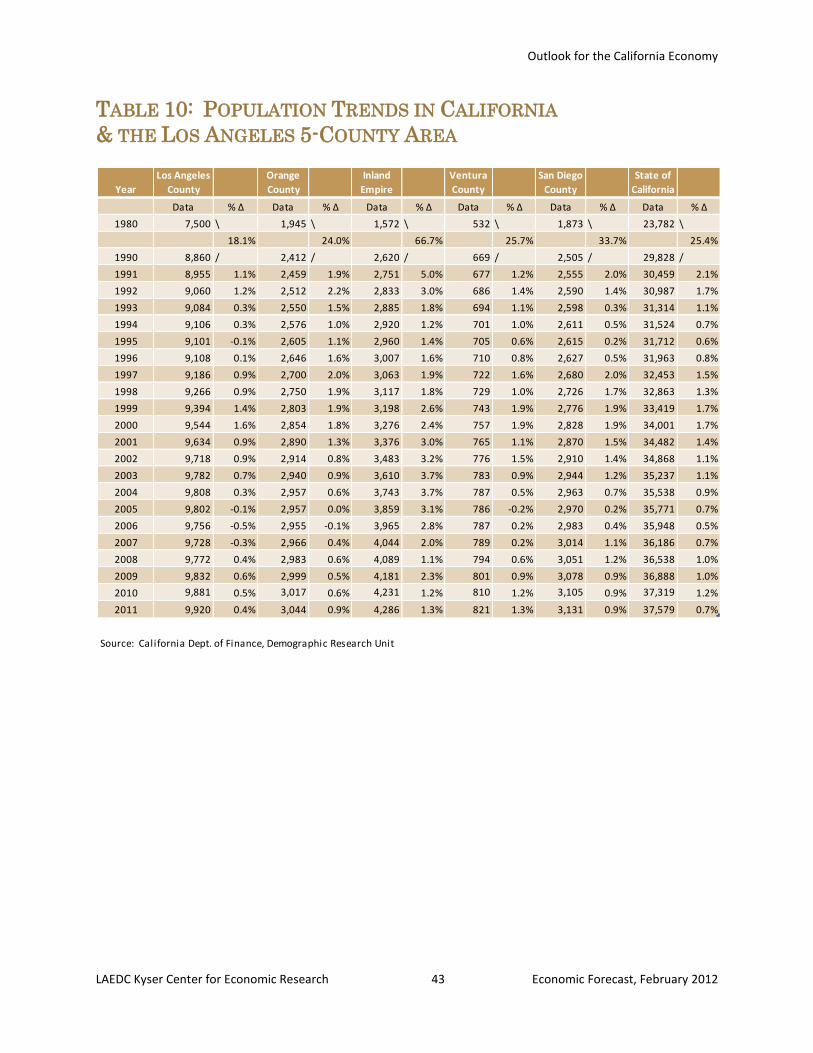
Outlook for the California Economy
LAEDC Kyser Center for Economic Research 43 Economic Forecast, February 2012
Year
Los Angeles
County
Column
1
Orange
County
Column
3
Inland
Empire
Column
5
Ventura
County
Column
7
San Diego
County
Column
9
State of
California
Column
11
Data % ∆ Data % ∆ Data % ∆ Data % ∆ Data % ∆ Data % ∆
1980 7,500 \ 1,945 \ 1,572 \ 532 \ 1,873 \ 23,782 \
18.1% 24.0% 66.7% 25.7% 33.7% 25.4%
1990 8,860 / 2,412 / 2,620 / 669 / 2,505 / 29,828 /
1991 8,955 1.1% 2,459 1.9% 2,751 5.0% 677 1.2% 2,555 2.0% 30,459 2.1%
1992 9,060 1.2% 2,512 2.2% 2,833 3.0% 686 1.4% 2,590 1.4% 30,987 1.7%
1993 9,084 0.3% 2,550 1.5% 2,885 1.8% 694 1.1% 2,598 0.3% 31,314 1.1%
1994 9,106 0.3% 2,576 1.0% 2,920 1.2% 701 1.0% 2,611 0.5% 31,524 0.7%
1995 9,101 -0.1% 2,605 1.1% 2,960 1.4% 705 0.6% 2,615 0.2% 31,712 0.6%
1996 9,108 0.1% 2,646 1.6% 3,007 1.6% 710 0.8% 2,627 0.5% 31,963 0.8%
1997 9,186 0.9% 2,700 2.0% 3,063 1.9% 722 1.6% 2,680 2.0% 32,453 1.5%
1998 9,266 0.9% 2,750 1.9% 3,117 1.8% 729 1.0% 2,726 1.7% 32,863 1.3%
1999 9,394 1.4% 2,803 1.9% 3,198 2.6% 743 1.9% 2,776 1.9% 33,419 1.7%
2000 9,544 1.6% 2,854 1.8% 3,276 2.4% 757 1.9% 2,828 1.9% 34,001 1.7%
2001 9,634 0.9% 2,890 1.3% 3,376 3.0% 765 1.1% 2,870 1.5% 34,482 1.4%
2002 9,718 0.9% 2,914 0.8% 3,483 3.2% 776 1.5% 2,910 1.4% 34,868 1.1%
2003 9,782 0.7% 2,940 0.9% 3,610 3.7% 783 0.9% 2,944 1.2% 35,237 1.1%
2004 9,808 0.3% 2,957 0.6% 3,743 3.7% 787 0.5% 2,963 0.7% 35,538 0.9%
2005 9,802 -0.1% 2,957 0.0% 3,859 3.1% 786 -0.2% 2,970 0.2% 35,771 0.7%
2006 9,756 -0.5% 2,955 -0.1% 3,965 2.8% 787 0.2% 2,983 0.4% 35,948 0.5%
2007 9,728 -0.3% 2,966 0.4% 4,044 2.0% 789 0.2% 3,014 1.1% 36,186 0.7%
2008 9,772 0.4% 2,983 0.6% 4,089 1.1% 794 0.6% 3,051 1.2% 36,538 1.0%
2009 9,832 0.6% 2,999 0.5% 4,181 2.3% 801 0.9% 3,078 0.9% 36,888 1.0%
2010 9,881 0.5% 3,017 0.6% 4,231 1.2% 810 1.2% 3,105 0.9% 37,319 1.2%
2011 9,920 0.4% 3,044 0.9% 4,286 1.3% 821 1.3% 3,131 0.9% 37,579 0.7%
Source: California Dept. of Finance, Demographic Research Unit
TABLE 10: POPULATION TRENDS IN CALIFORNIA
& THE LOS ANGELES 5-COUNTY AREA
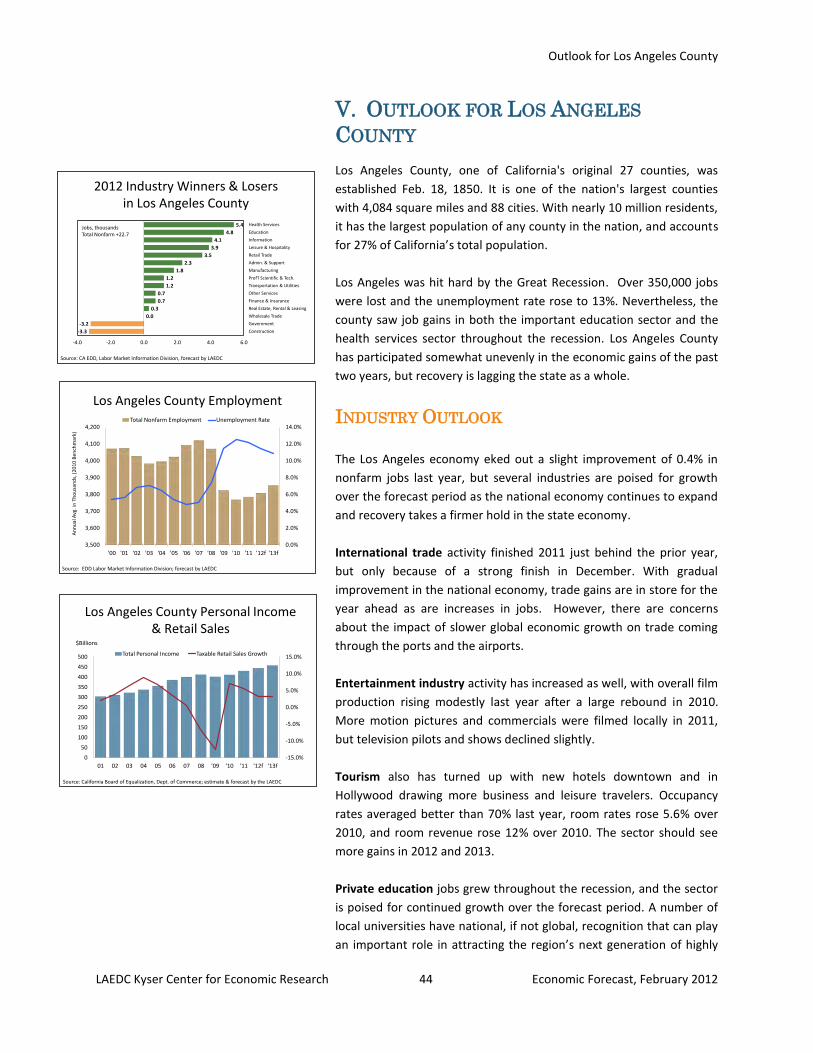
Outlook for Los Angeles County
LAEDC Kyser Center for Economic Research 44 Economic Forecast, February 2012
Los Angeles County Employment
0.0%
2.0%
4.0%
6.0%
8.0%
10.0%
12.0%
14.0%
3,500
3,600
3,700
3,800
3,900
4,000
4,100
4,200
'00 '01 '02 '03 '04 '05 '06 '07 '08 '09 '10 '11 '12f '13f
Total Nonfarm Employment Unemployment Rate
Source: EDD Labor Market Information Division; forecast by LAEDC
An
nu
al A
vg. i
n T
ho
usa
nd
s, (
20
10
Ben
chm
ark)
Los Angeles County Personal Income & Retail Sales
-15.0%
-10.0%
-5.0%
0.0%
5.0%
10.0%
15.0%
0
50
100
150
200
250
300
350
400
450
500
01 02 03 04 05 06 07 08 '09 '10 '11 '12f '13f
Total Personal Income Taxable Retail Sales Growth
$Billions
Source: California Board of Equalization, Dept. of Commerce; estimate & forecast by the LAEDC
2012 Industry Winners & Losers in Los Angeles County
-3.3
-3.2
0.0
0.3
0.7
0.7
1.2
1.2
1.8
2.3
3.5
3.9
4.1
4.8
5.4
-4.0 -2.0 0.0 2.0 4.0 6.0
Construction
Government
Wholesale Trade
Real Estate, Rental & Leasing
Finance & Insurance
Other Services
Transportation & Utilities
Prof'l Scientific & Tech.
Manufacturing
Admin. & Support
Retail Trade
Leisure & Hospitality
Information
Education
Health Services
Source: CA EDD, Labor Market Information Division, forecast by LAEDC
Jobs, thousandsTotal Nonfarm +22.7
V. OUTLOOK FOR LOS ANGELES
COUNTY
Los Angeles County, one of California's original 27 counties, was
established Feb. 18, 1850. It is one of the nation's largest counties
with 4,084 square miles and 88 cities. With nearly 10 million residents,
it has the largest population of any county in the nation, and accounts
for 27% of California’s total population.
Los Angeles was hit hard by the Great Recession. Over 350,000 jobs
were lost and the unemployment rate rose to 13%. Nevertheless, the
county saw job gains in both the important education sector and the
health services sector throughout the recession. Los Angeles County
has participated somewhat unevenly in the economic gains of the past
two years, but recovery is lagging the state as a whole.
INDUSTRY OUTLOOK
The Los Angeles economy eked out a slight improvement of 0.4% in
nonfarm jobs last year, but several industries are poised for growth
over the forecast period as the national economy continues to expand
and recovery takes a firmer hold in the state economy.
International trade activity finished 2011 just behind the prior year,
but only because of a strong finish in December. With gradual
improvement in the national economy, trade gains are in store for the
year ahead as are increases in jobs. However, there are concerns
about the impact of slower global economic growth on trade coming
through the ports and the airports.
Entertainment industry activity has increased as well, with overall film
production rising modestly last year after a large rebound in 2010.
More motion pictures and commercials were filmed locally in 2011,
but television pilots and shows declined slightly.
Tourism also has turned up with new hotels downtown and in
Hollywood drawing more business and leisure travelers. Occupancy
rates averaged better than 70% last year, room rates rose 5.6% over
2010, and room revenue rose 12% over 2010. The sector should see
more gains in 2012 and 2013.
Private education jobs grew throughout the recession, and the sector
is poised for continued growth over the forecast period. A number of
local universities have national, if not global, recognition that can play
an important role in attracting the region’s next generation of highly
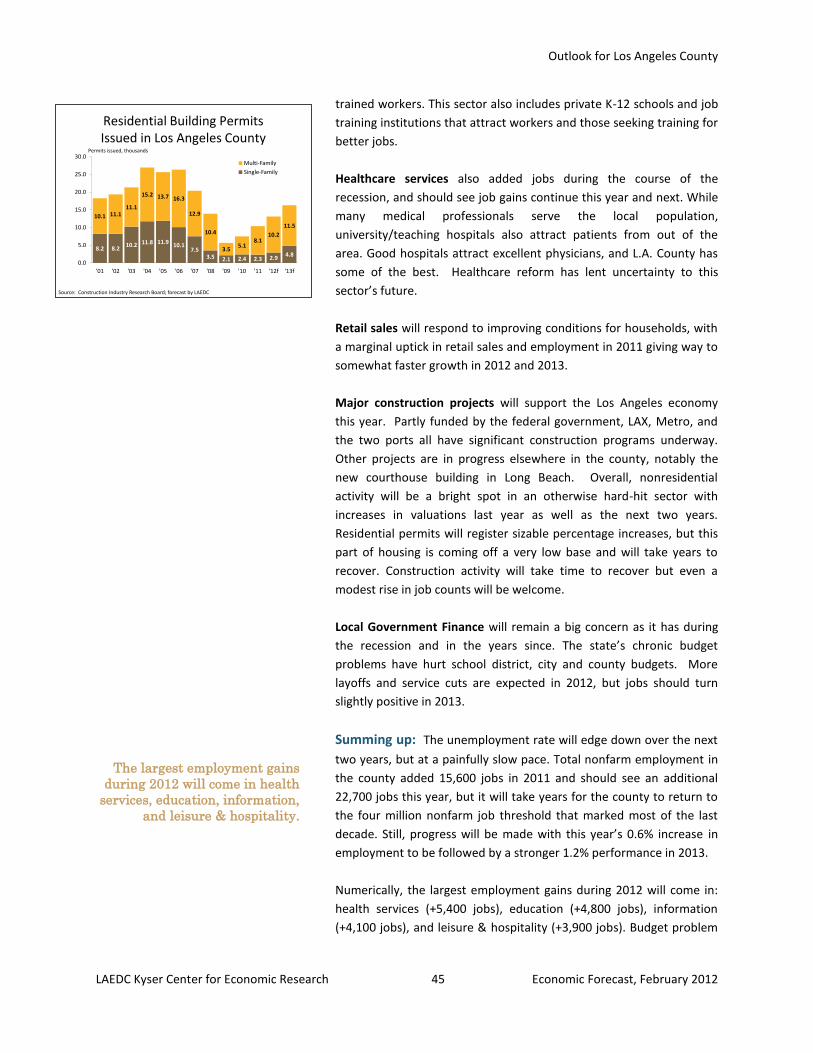
Outlook for Los Angeles County
LAEDC Kyser Center for Economic Research 45 Economic Forecast, February 2012
Residential Building Permits Issued in Los Angeles County
8.2 8.210.2 11.8 11.9
10.17.5
3.5 2.1 2.4 2.3 2.94.8
10.1 11.111.1
15.2 13.7 16.3
12.9
10.4
3.55.1
8.110.2
11.5
0.0
5.0
10.0
15.0
20.0
25.0
30.0
'01 '02 '03 '04 '05 '06 '07 '08 '09 '10 '11 '12f '13f
Multi-Family
Single-Family
Permits issued, thousands
Source: Construction Industry Research Board; forecast by LAEDC
trained workers. This sector also includes private K-12 schools and job
training institutions that attract workers and those seeking training for
better jobs.
Healthcare services also added jobs during the course of the
recession, and should see job gains continue this year and next. While
many medical professionals serve the local population,
university/teaching hospitals also attract patients from out of the
area. Good hospitals attract excellent physicians, and L.A. County has
some of the best. Healthcare reform has lent uncertainty to this
sector’s future.
Retail sales will respond to improving conditions for households, with
a marginal uptick in retail sales and employment in 2011 giving way to
somewhat faster growth in 2012 and 2013.
Major construction projects will support the Los Angeles economy
this year. Partly funded by the federal government, LAX, Metro, and
the two ports all have significant construction programs underway.
Other projects are in progress elsewhere in the county, notably the
new courthouse building in Long Beach. Overall, nonresidential
activity will be a bright spot in an otherwise hard-hit sector with
increases in valuations last year as well as the next two years.
Residential permits will register sizable percentage increases, but this
part of housing is coming off a very low base and will take years to
recover. Construction activity will take time to recover but even a
modest rise in job counts will be welcome.
Local Government Finance will remain a big concern as it has during
the recession and in the years since. The state’s chronic budget
problems have hurt school district, city and county budgets. More
layoffs and service cuts are expected in 2012, but jobs should turn
slightly positive in 2013.
Summing up: The unemployment rate will edge down over the next
two years, but at a painfully slow pace. Total nonfarm employment in
the county added 15,600 jobs in 2011 and should see an additional
22,700 jobs this year, but it will take years for the county to return to
the four million nonfarm job threshold that marked most of the last
decade. Still, progress will be made with this year’s 0.6% increase in
employment to be followed by a stronger 1.2% performance in 2013.
Numerically, the largest employment gains during 2012 will come in:
health services (+5,400 jobs), education (+4,800 jobs), information
(+4,100 jobs), and leisure & hospitality (+3,900 jobs). Budget problem
The largest employment gains
during 2012 will come in health
services, education, information,
and leisure & hospitality.
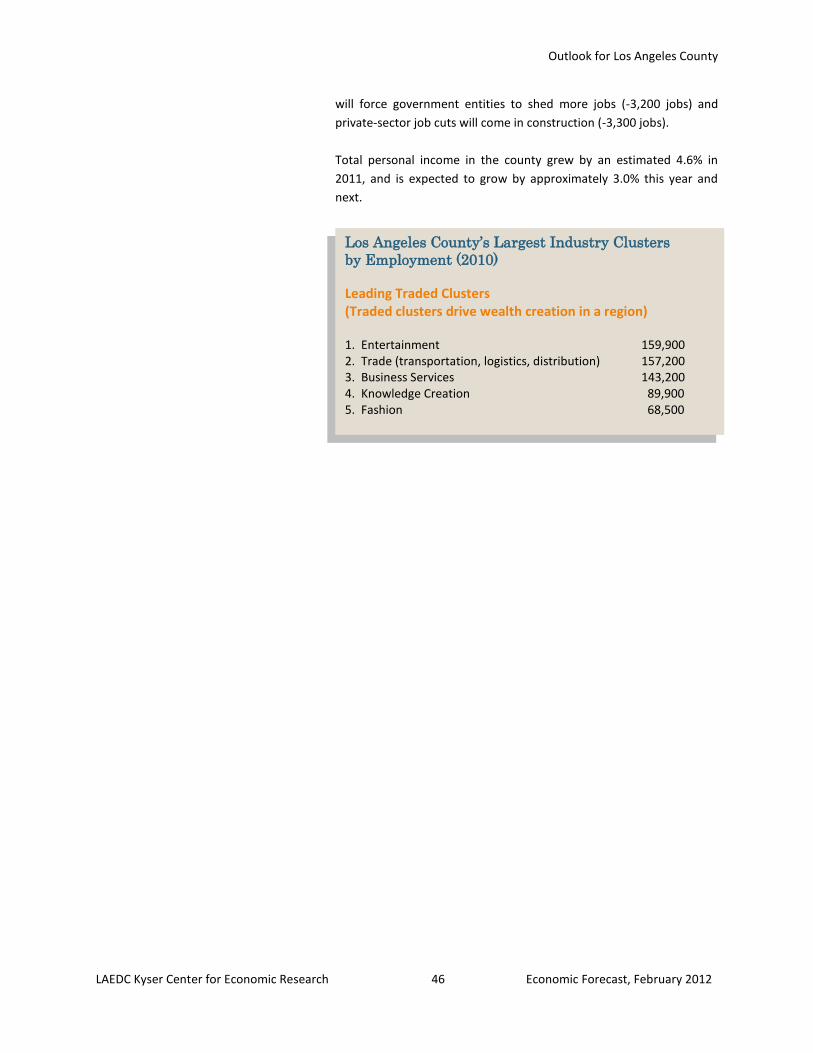
Outlook for Los Angeles County
LAEDC Kyser Center for Economic Research 46 Economic Forecast, February 2012
will force government entities to shed more jobs (-3,200 jobs) and
private-sector job cuts will come in construction (-3,300 jobs).
Total personal income in the county grew by an estimated 4.6% in
2011, and is expected to grow by approximately 3.0% this year and
next.
Los Angeles County’s Largest Industry Clusters
by Employment (2010)
Leading Traded Clusters (Traded clusters drive wealth creation in a region) 1. Entertainment 159,900 2. Trade (transportation, logistics, distribution) 157,200 3. Business Services 143,200 4. Knowledge Creation 89,900 5. Fashion 68,500
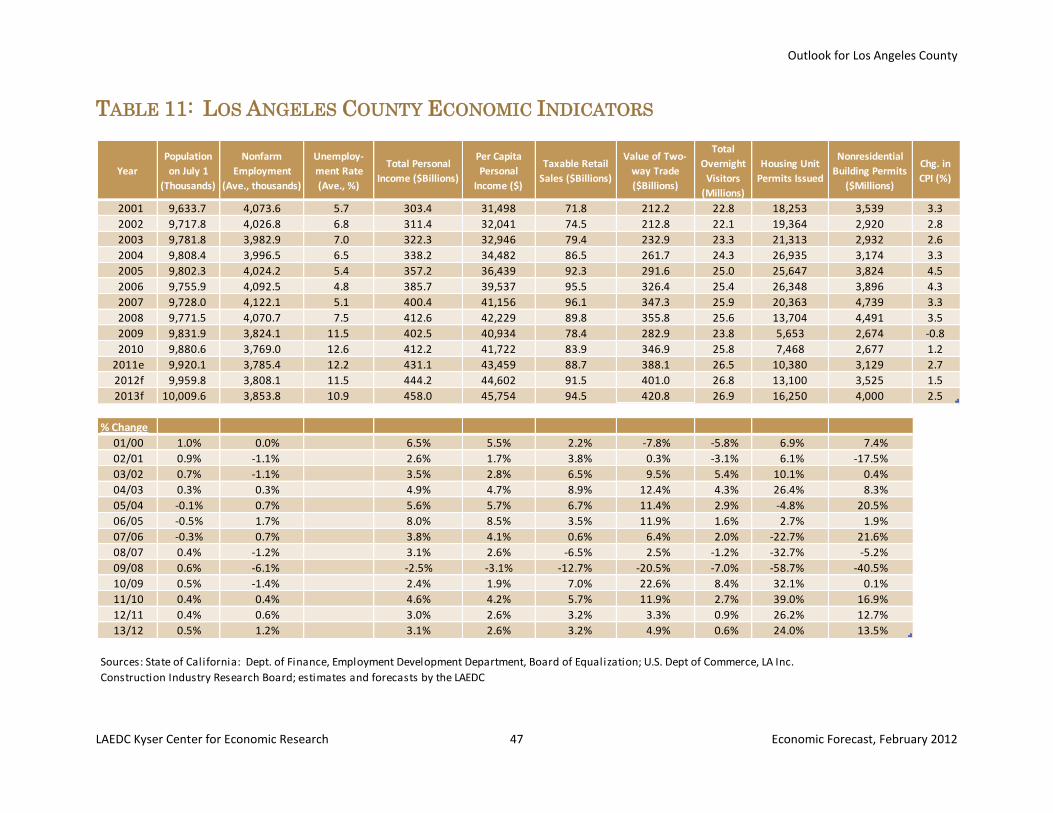
Outlook for Los Angeles County
LAEDC Kyser Center for Economic Research 47 Economic Forecast, February 2012
Year
Population
on July 1
(Thousands)
Nonfarm
Employment
(Ave., thousands)
Unemploy-
ment Rate
(Ave., %)
Total Personal
Income ($Billions)
Per Capita
Personal
Income ($)
Taxable Retail
Sales ($Billions)
Value of Two-
way Trade
($Billions)
Total
Overnight
Visitors
(Millions)
Housing Unit
Permits Issued
Nonresidential
Building Permits
($Millions)
Chg. in
CPI (%)
2001 9,633.7 4,073.6 5.7 303.4 31,498 71.8 212.2 22.8 18,253 3,539 3.3
2002 9,717.8 4,026.8 6.8 311.4 32,041 74.5 212.8 22.1 19,364 2,920 2.8
2003 9,781.8 3,982.9 7.0 322.3 32,946 79.4 232.9 23.3 21,313 2,932 2.6
2004 9,808.4 3,996.5 6.5 338.2 34,482 86.5 261.7 24.3 26,935 3,174 3.3
2005 9,802.3 4,024.2 5.4 357.2 36,439 92.3 291.6 25.0 25,647 3,824 4.5
2006 9,755.9 4,092.5 4.8 385.7 39,537 95.5 326.4 25.4 26,348 3,896 4.3
2007 9,728.0 4,122.1 5.1 400.4 41,156 96.1 347.3 25.9 20,363 4,739 3.3
2008 9,771.5 4,070.7 7.5 412.6 42,229 89.8 355.8 25.6 13,704 4,491 3.5
2009 9,831.9 3,824.1 11.5 402.5 40,934 78.4 282.9 23.8 5,653 2,674 -0.8
2010 9,880.6 3,769.0 12.6 412.2 41,722 83.9 346.9 25.8 7,468 2,677 1.2
2011e 9,920.1 3,785.4 12.2 431.1 43,459 88.7 388.1 26.5 10,380 3,129 2.7
2012f 9,959.8 3,808.1 11.5 444.2 44,602 91.5 401.0 26.8 13,100 3,525 1.5
2013f 10,009.6 3,853.8 10.9 458.0 45,754 94.5 420.8 26.9 16,250 4,000 2.5
% Change Column1 Column2 Column3 Column4 Column5 Column6 Column7 Column8 Column9 Column10
01/00 1.0% 0.0% 6.5% 5.5% 2.2% -7.8% -5.8% 6.9% 7.4%
02/01 0.9% -1.1% 2.6% 1.7% 3.8% 0.3% -3.1% 6.1% -17.5%
03/02 0.7% -1.1% 3.5% 2.8% 6.5% 9.5% 5.4% 10.1% 0.4%
04/03 0.3% 0.3% 4.9% 4.7% 8.9% 12.4% 4.3% 26.4% 8.3%
05/04 -0.1% 0.7% 5.6% 5.7% 6.7% 11.4% 2.9% -4.8% 20.5%
06/05 -0.5% 1.7% 8.0% 8.5% 3.5% 11.9% 1.6% 2.7% 1.9%
07/06 -0.3% 0.7% 3.8% 4.1% 0.6% 6.4% 2.0% -22.7% 21.6%
08/07 0.4% -1.2% 3.1% 2.6% -6.5% 2.5% -1.2% -32.7% -5.2%
09/08 0.6% -6.1% -2.5% -3.1% -12.7% -20.5% -7.0% -58.7% -40.5%
10/09 0.5% -1.4% 2.4% 1.9% 7.0% 22.6% 8.4% 32.1% 0.1%
11/10 0.4% 0.4% 4.6% 4.2% 5.7% 11.9% 2.7% 39.0% 16.9%
12/11 0.4% 0.6% 3.0% 2.6% 3.2% 3.3% 0.9% 26.2% 12.7%
13/12 0.5% 1.2% 3.1% 2.6% 3.2% 4.9% 0.6% 24.0% 13.5%
Sources: State of California: Dept. of Finance, Employment Development Department, Board of Equalization; U.S. Dept of Commerce, LA Inc.
Construction Industry Research Board; estimates and forecasts by the LAEDC
TABLE 11: LOS ANGELES COUNTY ECONOMIC INDICATORS
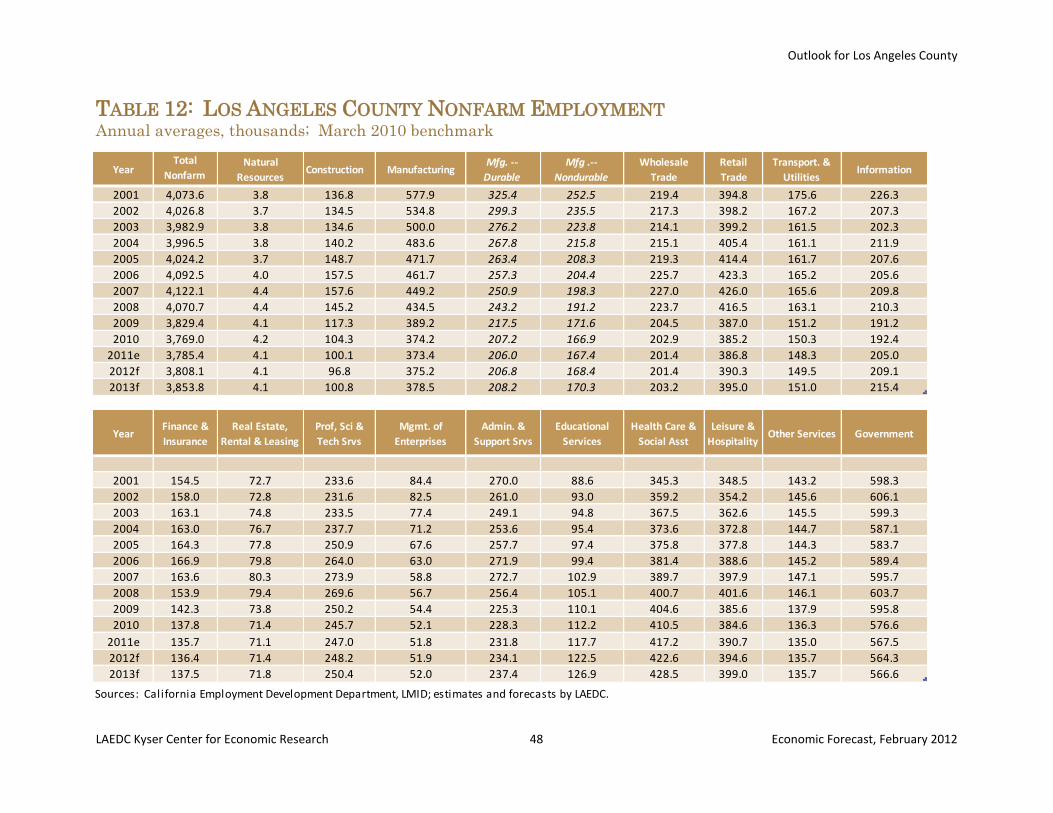
Outlook for Los Angeles County
LAEDC Kyser Center for Economic Research 48 Economic Forecast, February 2012
YearTotal
Nonfarm
Payroll
Natural
ResourcesConstruction Manufacturing
Mfg. --
Durable
Mfg .--
Nondurable
Wholesale
Trade
Retail
Trade
Transport. &
UtilitiesInformation
2001 4,073.6 3.8 136.8 577.9 325.4 252.5 219.4 394.8 175.6 226.3
2002 4,026.8 3.7 134.5 534.8 299.3 235.5 217.3 398.2 167.2 207.3
2003 3,982.9 3.8 134.6 500.0 276.2 223.8 214.1 399.2 161.5 202.3
2004 3,996.5 3.8 140.2 483.6 267.8 215.8 215.1 405.4 161.1 211.9
2005 4,024.2 3.7 148.7 471.7 263.4 208.3 219.3 414.4 161.7 207.6
2006 4,092.5 4.0 157.5 461.7 257.3 204.4 225.7 423.3 165.2 205.6
2007 4,122.1 4.4 157.6 449.2 250.9 198.3 227.0 426.0 165.6 209.8
2008 4,070.7 4.4 145.2 434.5 243.2 191.2 223.7 416.5 163.1 210.3
2009 3,829.4 4.1 117.3 389.2 217.5 171.6 204.5 387.0 151.2 191.2
2010 3,769.0 4.2 104.3 374.2 207.2 166.9 202.9 385.2 150.3 192.4
2011e 3,785.4 4.1 100.1 373.4 206.0 167.4 201.4 386.8 148.3 205.0
2012f 3,808.1 4.1 96.8 375.2 206.8 168.4 201.4 390.3 149.5 209.1
2013f 3,853.8 4.1 100.8 378.5 208.2 170.3 203.2 395.0 151.0 215.4
YearFinance &
Insurance
Real Estate,
Rental & Leasing
Prof, Sci &
Tech Srvs
Mgmt. of
Enterprises
Admin. &
Support Srvs
Educational
Services
Health Care &
Social Asst
Leisure &
HospitalityOther Services Government
2001 154.5 72.7 233.6 84.4 270.0 88.6 345.3 348.5 143.2 598.3
2002 158.0 72.8 231.6 82.5 261.0 93.0 359.2 354.2 145.6 606.1
2003 163.1 74.8 233.5 77.4 249.1 94.8 367.5 362.6 145.5 599.3
2004 163.0 76.7 237.7 71.2 253.6 95.4 373.6 372.8 144.7 587.1
2005 164.3 77.8 250.9 67.6 257.7 97.4 375.8 377.8 144.3 583.7
2006 166.9 79.8 264.0 63.0 271.9 99.4 381.4 388.6 145.2 589.4
2007 163.6 80.3 273.9 58.8 272.7 102.9 389.7 397.9 147.1 595.7
2008 153.9 79.4 269.6 56.7 256.4 105.1 400.7 401.6 146.1 603.7
2009 142.3 73.8 250.2 54.4 225.3 110.1 404.6 385.6 137.9 595.8
2010 137.8 71.4 245.7 52.1 228.3 112.2 410.5 384.6 136.3 576.6
2011e 135.7 71.1 247.0 51.8 231.8 117.7 417.2 390.7 135.0 567.5
2012f 136.4 71.4 248.2 51.9 234.1 122.5 422.6 394.6 135.7 564.3
2013f 137.5 71.8 250.4 52.0 237.4 126.9 428.5 399.0 135.7 566.6
Sources: California Employment Development Department, LMID; estimates and forecasts by LAEDC.
TABLE 12: LOS ANGELES COUNTY NONFARM EMPLOYMENT Annual averages, thousands; March 2010 benchmark
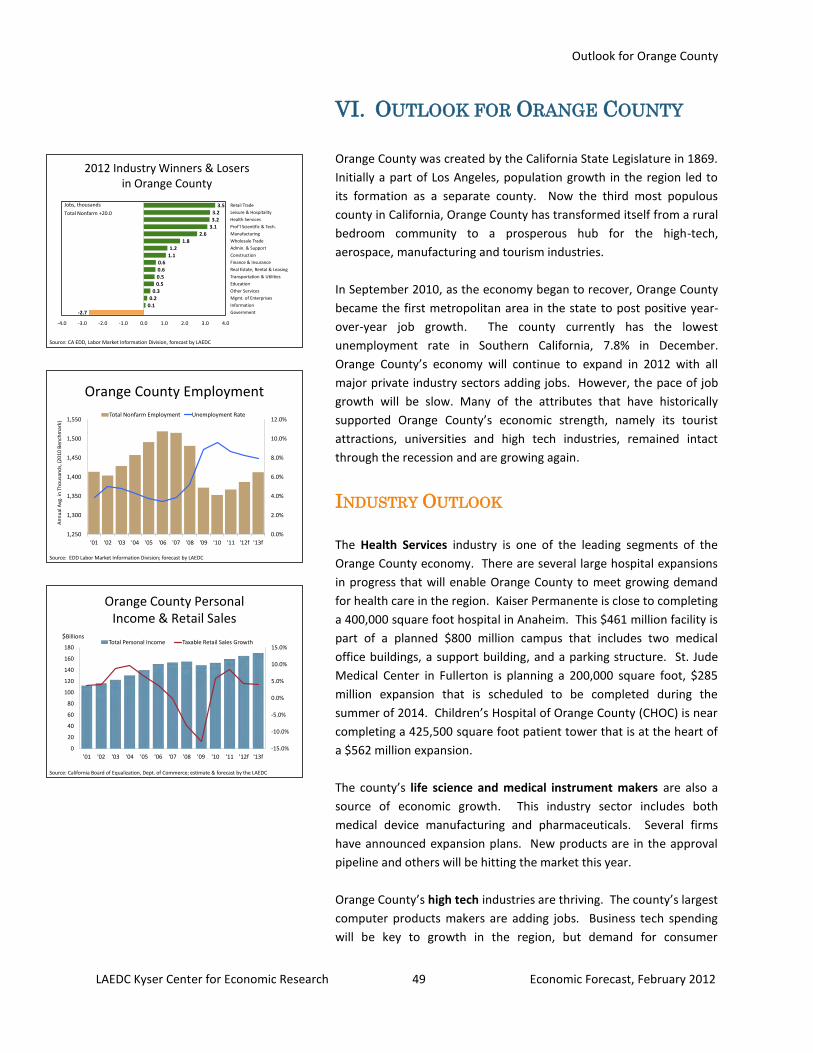
Outlook for Orange County
LAEDC Kyser Center for Economic Research 49 Economic Forecast, February 2012
2012 Industry Winners & Losers in Orange County
Source: CA EDD, Labor Market Information Division, forecast by LAEDC
-2.7
0.1
0.2
0.3
0.5
0.5
0.6
0.6
1.1
1.2
1.8
2.6
3.1
3.2
3.2
3.5
-4.0 -3.0 -2.0 -1.0 0.0 1.0 2.0 3.0 4.0
Government
Information
Mgmt. of Enterprises
Other Services
Education
Transportation & Utilities
Real Estate, Rental & Leasing
Finance & Insurance
Construction
Admin. & Support
Wholesale Trade
Manufacturing
Prof'l Scientific & Tech.
Health Services
Leisure & Hospitality
Retail Trade
Total Nonfarm +20.0
Jobs, thousands
Orange County Personal Income & Retail Sales
-15.0%
-10.0%
-5.0%
0.0%
5.0%
10.0%
15.0%
0
20
40
60
80
100
120
140
160
180
'01 '02 '03 '04 '05 '06 '07 '08 '09 '10 '11 '12f '13f
Total Personal Income Taxable Retail Sales Growth$Billions
Source: California Board of Equalization, Dept. of Commerce; estimate & forecast by the LAEDC
Orange County Employment
0.0%
2.0%
4.0%
6.0%
8.0%
10.0%
12.0%
1,250
1,300
1,350
1,400
1,450
1,500
1,550
'01 '02 '03 '04 '05 '06 '07 '08 '09 '10 '11 '12f '13f
Total Nonfarm Employment Unemployment Rate
Source: EDD Labor Market Information Division; forecast by LAEDC
An
nu
al A
vg. i
n T
ho
usa
nd
s, (2
01
0 B
ench
mar
k)
VI. OUTLOOK FOR ORANGE COUNTY
Orange County was created by the California State Legislature in 1869.
Initially a part of Los Angeles, population growth in the region led to
its formation as a separate county. Now the third most populous
county in California, Orange County has transformed itself from a rural
bedroom community to a prosperous hub for the high-tech,
aerospace, manufacturing and tourism industries.
In September 2010, as the economy began to recover, Orange County
became the first metropolitan area in the state to post positive year-
over-year job growth. The county currently has the lowest
unemployment rate in Southern California, 7.8% in December.
Orange County’s economy will continue to expand in 2012 with all
major private industry sectors adding jobs. However, the pace of job
growth will be slow. Many of the attributes that have historically
supported Orange County’s economic strength, namely its tourist
attractions, universities and high tech industries, remained intact
through the recession and are growing again.
INDUSTRY OUTLOOK
The Health Services industry is one of the leading segments of the
Orange County economy. There are several large hospital expansions
in progress that will enable Orange County to meet growing demand
for health care in the region. Kaiser Permanente is close to completing
a 400,000 square foot hospital in Anaheim. This $461 million facility is
part of a planned $800 million campus that includes two medical
office buildings, a support building, and a parking structure. St. Jude
Medical Center in Fullerton is planning a 200,000 square foot, $285
million expansion that is scheduled to be completed during the
summer of 2014. Children’s Hospital of Orange County (CHOC) is near
completing a 425,500 square foot patient tower that is at the heart of
a $562 million expansion.
The county’s life science and medical instrument makers are also a
source of economic growth. This industry sector includes both
medical device manufacturing and pharmaceuticals. Several firms
have announced expansion plans. New products are in the approval
pipeline and others will be hitting the market this year.
Orange County’s high tech industries are thriving. The county’s largest
computer products makers are adding jobs. Business tech spending
will be key to growth in the region, but demand for consumer
Outlook for Orange County
LAEDC Kyser Center for Economic Research 50 Economic Forecast, February 2012
electronics is also on the rise. Information technology will be the big
winner as spending increases for smartphones, tablet computers,
mobile networks, social networking and big data analytics (see side
bar). Moderate growth for 2012 is expected for the county’s
computer chip makers after a record year in 2011. One exception is
the county’s telecommunications companies. Consolidation and
restructuring within the industry has resulted in the fifth straight year
of jobs cuts. A large percentage of the county’s high tech products are
exported. Slower growth abroad in 2012 will have some impact on
sales but even so, demand from overseas will continue to provide a
boost to the local economy.
Travel and tourism in Orange County rebounded last year and will
expand further in 2012 as more leisure and business travelers take to
the road. The Anaheim Convention Center will see an increase in the
number of meetings and conventions held this year. The convention
center is moving forward with plans for a $17 million expansion that
will add 100,000 square feet of outdoor event space that is scheduled
to be completed before the end of next year. The county’s lodging
sector is also doing quite well. Occupancy rates are up and average
daily room rates are expected to increase in 2012 after two years of
declines. In addition to a number of extensive hotel and resort
renovations, new hotel construction is making a cautious comeback.
Orange County’s tourist attractions are expanding as well.
Disneyland’s new Cars Land at its California Adventure Park is
scheduled to open later this year and Knott’s Berry Farm debuted its
new Windseeker ride this past summer. Orange County’s Great Park
(located on the former El Toro Marine base) is slated for a $70 million
expansion plan.
The John Wayne International Airport opened its new Terminal C in
November, the last major element of a $543 million expansion and
renovation project. Expected to begin mid-year 2012, new nonstop
service from John Wayne to Mexico City and Cabo San Lucas will
provide a lift for the local tourism industry by making it more
convenient for tourists from Mexico to visit Orange county.
Manufacturing employment will continue to make small gains in 2012.
Manufacturing establishments make up about 22% of all business
firms in Orange County. Expansion is being fueled by both domestic
demand and export demand (principally from Asia) for the county’s
computer products, medical devices, industrial goods and apparel.
Growth in defense related activities will be flat this year due to Federal
budget cuts and military downsizing. Boeing has trimmed hundreds of
jobs at various Orange County operations, but remains one of the
Big Data is a general term used
describe the huge amounts of
unstructured and semi-
structured data a company
creates – data that would take
too much time and cost too much
money to load into a regular data
base. Big Data is not another
word for a lot of data. It is large
files of data that need to be
manipulated so a firm can
analyze it to unlock some
business value. For example, the
data Amazon accumulates from
its customers’ purchases to
recommend other items to buy.
The number of patents awarded
to Orange County firms rose by
14% in 2011 to 2,709. Orange
County accounted for 1% of total
number of patents issued in the
United States last year. The
largest number of new patents in
the county were awarded to
makers of computer chips,
pharmaceuticals and disk drives.
Orange County ranks as the 10th
largest county in the nation in
terms of manufacturing
employment.
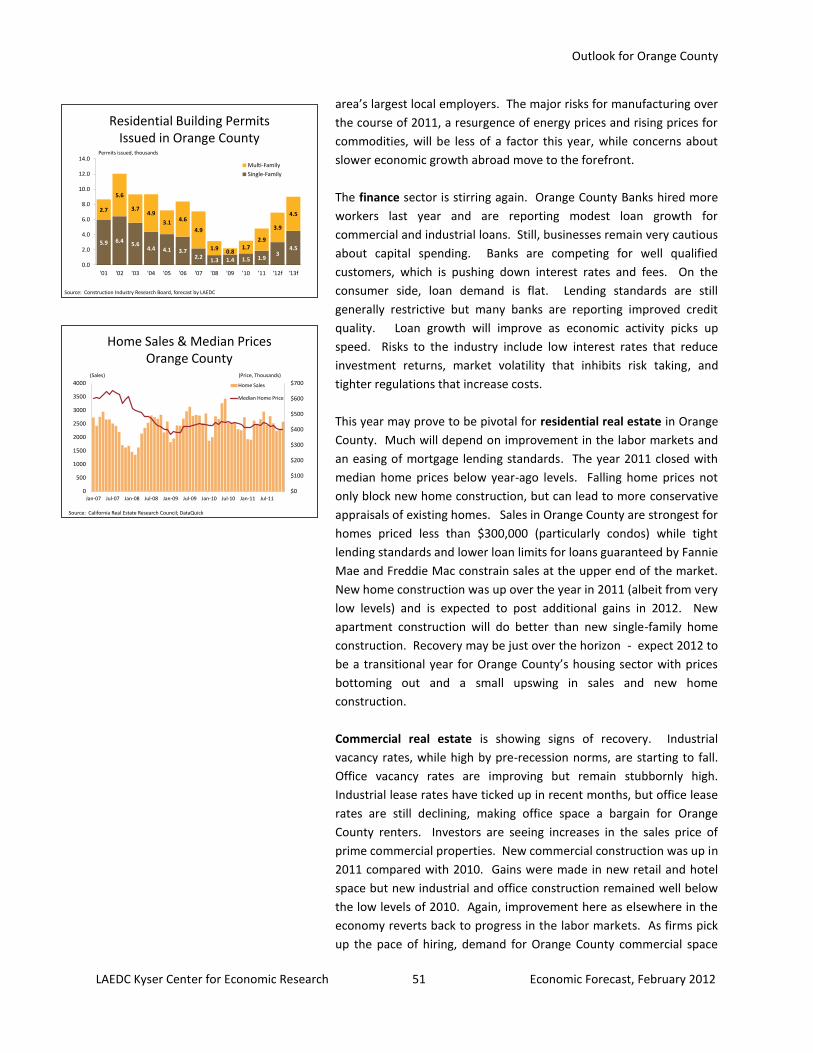
Outlook for Orange County
LAEDC Kyser Center for Economic Research 51 Economic Forecast, February 2012
Residential Building Permits Issued in Orange County
5.9 6.45.6
4.4 4.1 3.72.2
1.3 1.4 1.5 1.93
4.5
2.7
5.6
3.74.9
3.1 4.6
4.9
1.90.8
1.72.9
3.9
4.5
0.0
2.0
4.0
6.0
8.0
10.0
12.0
14.0
'01 '02 '03 '04 '05 '06 '07 '08 '09 '10 '11 '12f '13f
Multi-Family
Single-Family
Permits issued, thousands
Source: Construction Industry Research Board, forecast by LAEDC
Home Sales & Median PricesOrange County
$0
$100
$200
$300
$400
$500
$600
$700
0
500
1000
1500
2000
2500
3000
3500
4000
Jan-07 Jul-07 Jan-08 Jul-08 Jan-09 Jul-09 Jan-10 Jul-10 Jan-11 Jul-11
Home Sales
Median Home Price
(Sales) (Price, Thousands)
Source: California Real Estate Research Council; DataQuick
area’s largest local employers. The major risks for manufacturing over
the course of 2011, a resurgence of energy prices and rising prices for
commodities, will be less of a factor this year, while concerns about
slower economic growth abroad move to the forefront.
The finance sector is stirring again. Orange County Banks hired more
workers last year and are reporting modest loan growth for
commercial and industrial loans. Still, businesses remain very cautious
about capital spending. Banks are competing for well qualified
customers, which is pushing down interest rates and fees. On the
consumer side, loan demand is flat. Lending standards are still
generally restrictive but many banks are reporting improved credit
quality. Loan growth will improve as economic activity picks up
speed. Risks to the industry include low interest rates that reduce
investment returns, market volatility that inhibits risk taking, and
tighter regulations that increase costs.
This year may prove to be pivotal for residential real estate in Orange
County. Much will depend on improvement in the labor markets and
an easing of mortgage lending standards. The year 2011 closed with
median home prices below year-ago levels. Falling home prices not
only block new home construction, but can lead to more conservative
appraisals of existing homes. Sales in Orange County are strongest for
homes priced less than $300,000 (particularly condos) while tight
lending standards and lower loan limits for loans guaranteed by Fannie
Mae and Freddie Mac constrain sales at the upper end of the market.
New home construction was up over the year in 2011 (albeit from very
low levels) and is expected to post additional gains in 2012. New
apartment construction will do better than new single-family home
construction. Recovery may be just over the horizon - expect 2012 to
be a transitional year for Orange County’s housing sector with prices
bottoming out and a small upswing in sales and new home
construction.
Commercial real estate is showing signs of recovery. Industrial
vacancy rates, while high by pre-recession norms, are starting to fall.
Office vacancy rates are improving but remain stubbornly high.
Industrial lease rates have ticked up in recent months, but office lease
rates are still declining, making office space a bargain for Orange
County renters. Investors are seeing increases in the sales price of
prime commercial properties. New commercial construction was up in
2011 compared with 2010. Gains were made in new retail and hotel
space but new industrial and office construction remained well below
the low levels of 2010. Again, improvement here as elsewhere in the
economy reverts back to progress in the labor markets. As firms pick
up the pace of hiring, demand for Orange County commercial space
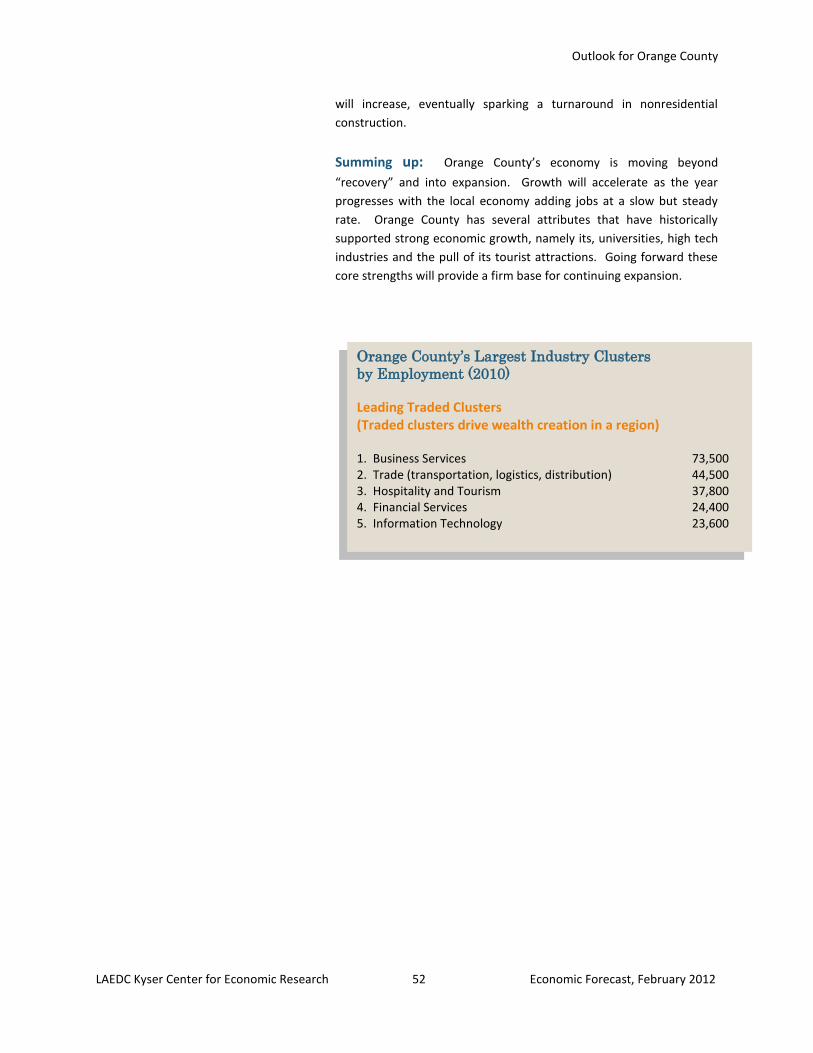
Outlook for Orange County
LAEDC Kyser Center for Economic Research 52 Economic Forecast, February 2012
Orange County’s Largest Industry Clusters
by Employment (2010)
Leading Traded Clusters (Traded clusters drive wealth creation in a region) 1. Business Services 73,500 2. Trade (transportation, logistics, distribution) 44,500 3. Hospitality and Tourism 37,800 4. Financial Services 24,400 5. Information Technology 23,600
will increase, eventually sparking a turnaround in nonresidential
construction.
Summing up: Orange County’s economy is moving beyond
“recovery” and into expansion. Growth will accelerate as the year
progresses with the local economy adding jobs at a slow but steady
rate. Orange County has several attributes that have historically
supported strong economic growth, namely its, universities, high tech
industries and the pull of its tourist attractions. Going forward these
core strengths will provide a firm base for continuing expansion.
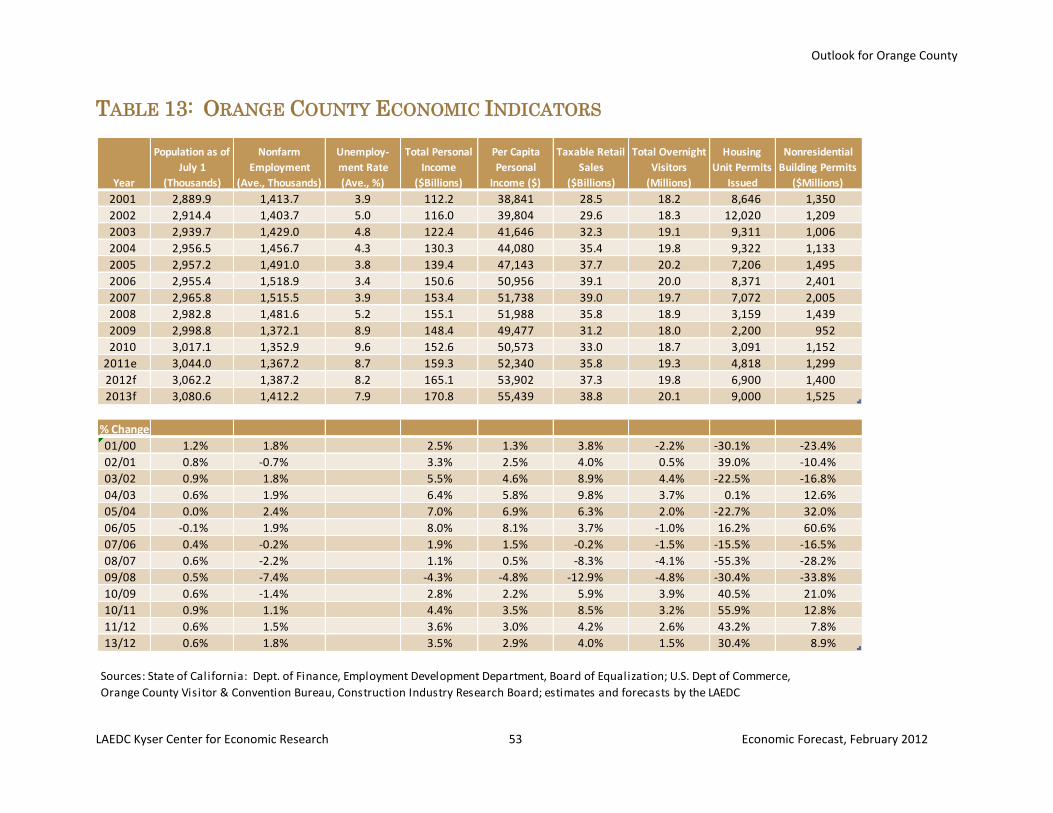
Outlook for Orange County
LAEDC Kyser Center for Economic Research 53 Economic Forecast, February 2012
Year
Population as of
July 1
(Thousands)
Nonfarm
Employment
(Ave., Thousands)
Unemploy-
ment Rate
(Ave., %)
Total Personal
Income
($Billions)
Per Capita
Personal
Income ($)
Taxable Retail
Sales
($Billions)
Total Overnight
Visitors
(Millions)
Housing
Unit Permits
Issued
Nonresidential
Building Permits
($Millions)
2001 2,889.9 1,413.7 3.9 112.2 38,841 28.5 18.2 8,646 1,350
2002 2,914.4 1,403.7 5.0 116.0 39,804 29.6 18.3 12,020 1,209
2003 2,939.7 1,429.0 4.8 122.4 41,646 32.3 19.1 9,311 1,006
2004 2,956.5 1,456.7 4.3 130.3 44,080 35.4 19.8 9,322 1,133
2005 2,957.2 1,491.0 3.8 139.4 47,143 37.7 20.2 7,206 1,495
2006 2,955.4 1,518.9 3.4 150.6 50,956 39.1 20.0 8,371 2,401
2007 2,965.8 1,515.5 3.9 153.4 51,738 39.0 19.7 7,072 2,005
2008 2,982.8 1,481.6 5.2 155.1 51,988 35.8 18.9 3,159 1,439
2009 2,998.8 1,372.1 8.9 148.4 49,477 31.2 18.0 2,200 952
2010 3,017.1 1,352.9 9.6 152.6 50,573 33.0 18.7 3,091 1,152
2011e 3,044.0 1,367.2 8.7 159.3 52,340 35.8 19.3 4,818 1,299
2012f 3,062.2 1,387.2 8.2 165.1 53,902 37.3 19.8 6,900 1,400
2013f 3,080.6 1,412.2 7.9 170.8 55,439 38.8 20.1 9,000 1,525
% Change Column1 Column2 Column3 Column4 Column5 Column6 Column7 Column8 Column9
01/00 1.2% 1.8% 2.5% 1.3% 3.8% -2.2% -30.1% -23.4%
02/01 0.8% -0.7% 3.3% 2.5% 4.0% 0.5% 39.0% -10.4%
03/02 0.9% 1.8% 5.5% 4.6% 8.9% 4.4% -22.5% -16.8%
04/03 0.6% 1.9% 6.4% 5.8% 9.8% 3.7% 0.1% 12.6%
05/04 0.0% 2.4% 7.0% 6.9% 6.3% 2.0% -22.7% 32.0%
06/05 -0.1% 1.9% 8.0% 8.1% 3.7% -1.0% 16.2% 60.6%
07/06 0.4% -0.2% 1.9% 1.5% -0.2% -1.5% -15.5% -16.5%
08/07 0.6% -2.2% 1.1% 0.5% -8.3% -4.1% -55.3% -28.2%
09/08 0.5% -7.4% -4.3% -4.8% -12.9% -4.8% -30.4% -33.8%
10/09 0.6% -1.4% 2.8% 2.2% 5.9% 3.9% 40.5% 21.0%
10/11 0.9% 1.1% 4.4% 3.5% 8.5% 3.2% 55.9% 12.8%
11/12 0.6% 1.5% 3.6% 3.0% 4.2% 2.6% 43.2% 7.8%
13/12 0.6% 1.8% 3.5% 2.9% 4.0% 1.5% 30.4% 8.9%
Sources: State of California: Dept. of Finance, Employment Development Department, Board of Equalization; U.S. Dept of Commerce,
Orange County Visitor & Convention Bureau, Construction Industry Research Board; estimates and forecasts by the LAEDC
TABLE 13: ORANGE COUNTY ECONOMIC INDICATORS
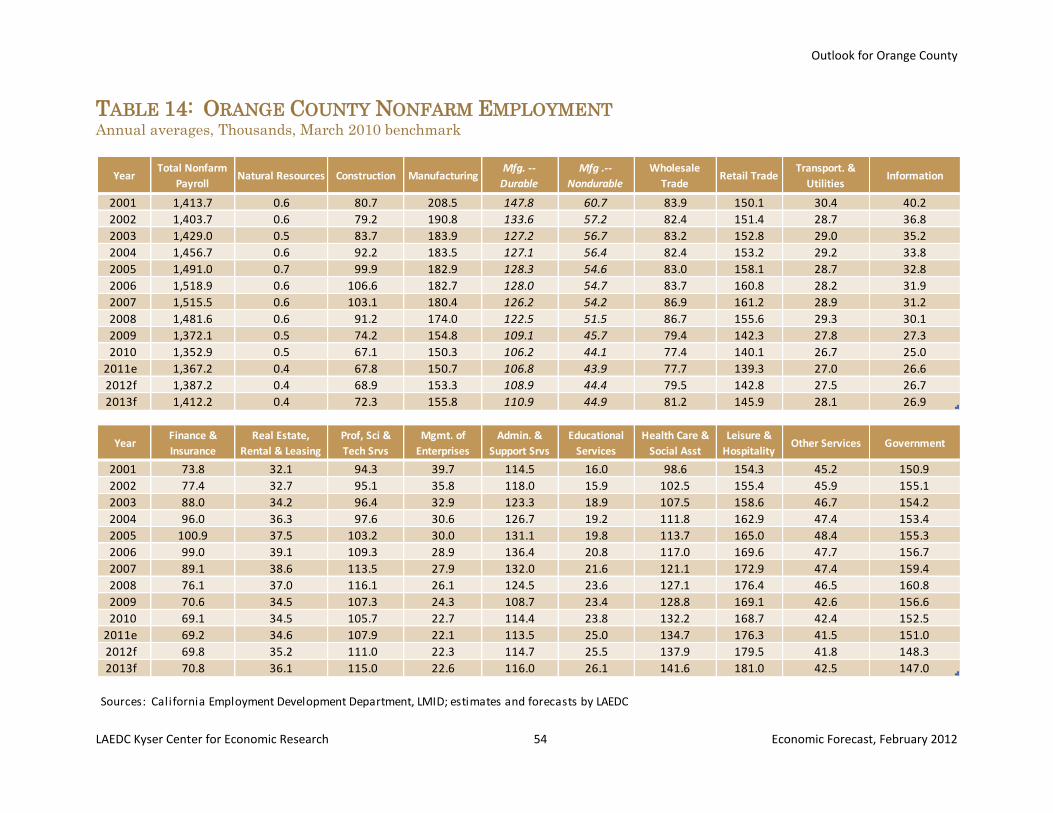
Outlook for Orange County
LAEDC Kyser Center for Economic Research 54 Economic Forecast, February 2012
YearTotal Nonfarm
PayrollNatural Resources Construction Manufacturing
Mfg. --
Durable
Mfg .--
Nondurable
Wholesale
TradeRetail Trade
Transport. &
UtilitiesInformation
2001 1,413.7 0.6 80.7 208.5 147.8 60.7 83.9 150.1 30.4 40.2
2002 1,403.7 0.6 79.2 190.8 133.6 57.2 82.4 151.4 28.7 36.8
2003 1,429.0 0.5 83.7 183.9 127.2 56.7 83.2 152.8 29.0 35.2
2004 1,456.7 0.6 92.2 183.5 127.1 56.4 82.4 153.2 29.2 33.8
2005 1,491.0 0.7 99.9 182.9 128.3 54.6 83.0 158.1 28.7 32.8
2006 1,518.9 0.6 106.6 182.7 128.0 54.7 83.7 160.8 28.2 31.9
2007 1,515.5 0.6 103.1 180.4 126.2 54.2 86.9 161.2 28.9 31.2
2008 1,481.6 0.6 91.2 174.0 122.5 51.5 86.7 155.6 29.3 30.1
2009 1,372.1 0.5 74.2 154.8 109.1 45.7 79.4 142.3 27.8 27.3
2010 1,352.9 0.5 67.1 150.3 106.2 44.1 77.4 140.1 26.7 25.0
2011e 1,367.2 0.4 67.8 150.7 106.8 43.9 77.7 139.3 27.0 26.6
2012f 1,387.2 0.4 68.9 153.3 108.9 44.4 79.5 142.8 27.5 26.7
2013f 1,412.2 0.4 72.3 155.8 110.9 44.9 81.2 145.9 28.1 26.9
YearFinance &
Insurance
Real Estate,
Rental & Leasing
Prof, Sci &
Tech Srvs
Mgmt. of
Enterprises
Admin. &
Support Srvs
Educational
Services
Health Care &
Social Asst
Leisure &
HospitalityOther Services Government
2001 73.8 32.1 94.3 39.7 114.5 16.0 98.6 154.3 45.2 150.9
2002 77.4 32.7 95.1 35.8 118.0 15.9 102.5 155.4 45.9 155.1
2003 88.0 34.2 96.4 32.9 123.3 18.9 107.5 158.6 46.7 154.2
2004 96.0 36.3 97.6 30.6 126.7 19.2 111.8 162.9 47.4 153.4
2005 100.9 37.5 103.2 30.0 131.1 19.8 113.7 165.0 48.4 155.3
2006 99.0 39.1 109.3 28.9 136.4 20.8 117.0 169.6 47.7 156.7
2007 89.1 38.6 113.5 27.9 132.0 21.6 121.1 172.9 47.4 159.4
2008 76.1 37.0 116.1 26.1 124.5 23.6 127.1 176.4 46.5 160.8
2009 70.6 34.5 107.3 24.3 108.7 23.4 128.8 169.1 42.6 156.6
2010 69.1 34.5 105.7 22.7 114.4 23.8 132.2 168.7 42.4 152.5
2011e 69.2 34.6 107.9 22.1 113.5 25.0 134.7 176.3 41.5 151.0
2012f 69.8 35.2 111.0 22.3 114.7 25.5 137.9 179.5 41.8 148.3
2013f 70.8 36.1 115.0 22.6 116.0 26.1 141.6 181.0 42.5 147.0
Sources: California Employment Development Department, LMID; estimates and forecasts by LAEDC
TABLE 14: ORANGE COUNTY NONFARM EMPLOYMENT Annual averages, Thousands, March 2010 benchmark
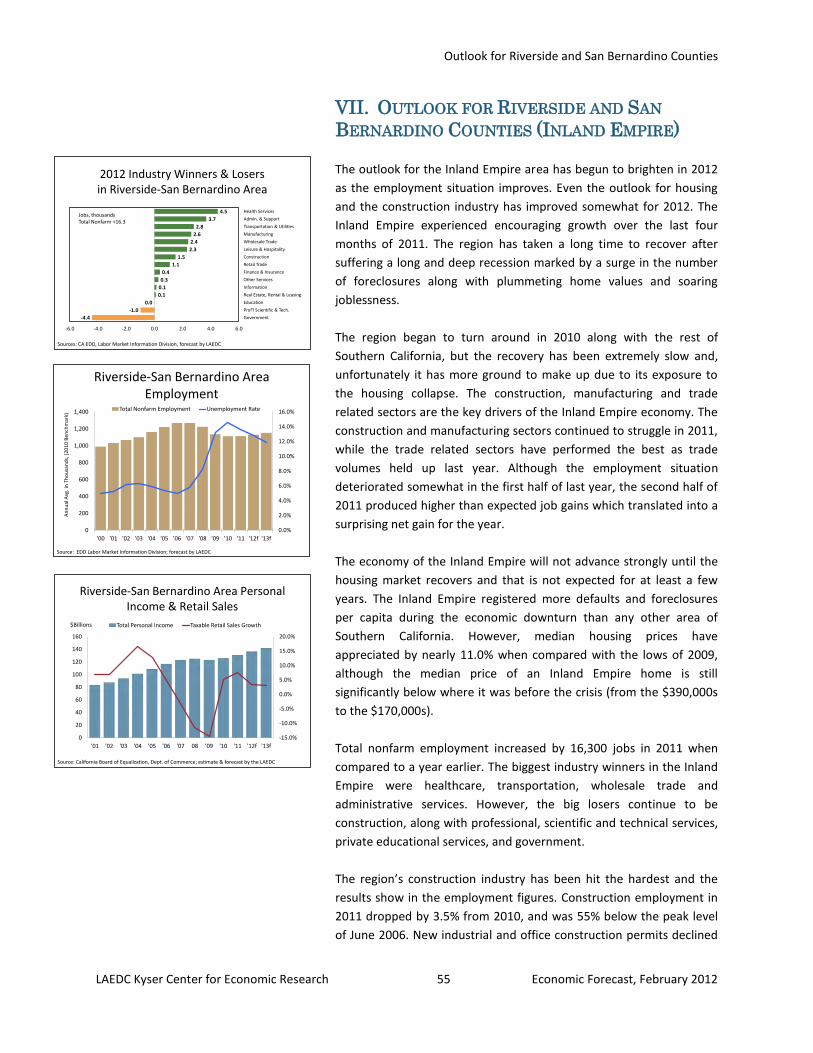
Outlook for Riverside and San Bernardino Counties
LAEDC Kyser Center for Economic Research 55 Economic Forecast, February 2012
2012 Industry Winners & Losers in Riverside-San Bernardino Area
Sources: CA EDD, Labor Market Information Division, forecast by LAEDC
-4.4
-1.0
0.0
0.1
0.1
0.3
0.4
1.1
1.5
2.3
2.4
2.6
2.8
3.7
4.5
-6.0 -4.0 -2.0 0.0 2.0 4.0 6.0
Government
Prof'l Scientific & Tech.
Education
Real Estate, Rental & Leasing
Information
Other Services
Finance & Insurance
Retail Trade
Construction
Leisure & Hospitality
Wholesale Trade
Manufacturing
Transportation & Utilities
Admin. & Support
Health ServicesJobs, thousandsTotal Nonfarm +16.3
Riverside-San Bernardino Area Employment
0.0%
2.0%
4.0%
6.0%
8.0%
10.0%
12.0%
14.0%
16.0%
0
200
400
600
800
1,000
1,200
1,400
'00 '01 '02 '03 '04 '05 '06 '07 '08 '09 '10 '11 '12f '13f
Total Nonfarm Employment Unemployment Rate
Source: EDD Labor Market Information Division; forecast by LAEDC
An
nu
al A
vg. i
n T
ho
usa
nd
s, (
20
10
Ben
chm
ark)
Riverside-San Bernardino Area Personal Income & Retail Sales
-15.0%
-10.0%
-5.0%
0.0%
5.0%
10.0%
15.0%
20.0%
0
20
40
60
80
100
120
140
160
'01 '02 '03 '04 '05 '06 '07 08 '09 '10 '11 '12f '13f
Total Personal Income Taxable Retail Sales Growth$Billions
Source: California Board of Equalization, Dept. of Commerce; estimate & forecast by the LAEDC
VII. OUTLOOK FOR RIVERSIDE AND SAN
BERNARDINO COUNTIES (INLAND EMPIRE)
The outlook for the Inland Empire area has begun to brighten in 2012
as the employment situation improves. Even the outlook for housing
and the construction industry has improved somewhat for 2012. The
Inland Empire experienced encouraging growth over the last four
months of 2011. The region has taken a long time to recover after
suffering a long and deep recession marked by a surge in the number
of foreclosures along with plummeting home values and soaring
joblessness.
The region began to turn around in 2010 along with the rest of
Southern California, but the recovery has been extremely slow and,
unfortunately it has more ground to make up due to its exposure to
the housing collapse. The construction, manufacturing and trade
related sectors are the key drivers of the Inland Empire economy. The
construction and manufacturing sectors continued to struggle in 2011,
while the trade related sectors have performed the best as trade
volumes held up last year. Although the employment situation
deteriorated somewhat in the first half of last year, the second half of
2011 produced higher than expected job gains which translated into a
surprising net gain for the year.
The economy of the Inland Empire will not advance strongly until the
housing market recovers and that is not expected for at least a few
years. The Inland Empire registered more defaults and foreclosures
per capita during the economic downturn than any other area of
Southern California. However, median housing prices have
appreciated by nearly 11.0% when compared with the lows of 2009,
although the median price of an Inland Empire home is still
significantly below where it was before the crisis (from the $390,000s
to the $170,000s).
Total nonfarm employment increased by 16,300 jobs in 2011 when
compared to a year earlier. The biggest industry winners in the Inland
Empire were healthcare, transportation, wholesale trade and
administrative services. However, the big losers continue to be
construction, along with professional, scientific and technical services,
private educational services, and government.
The region’s construction industry has been hit the hardest and the
results show in the employment figures. Construction employment in
2011 dropped by 3.5% from 2010, and was 55% below the peak level
of June 2006. New industrial and office construction permits declined
Outlook for Riverside and San Bernardino Counties
LAEDC Kyser Center for Economic Research 56 Economic Forecast, February 2012
dramatically during the recession but 2011 saw slightly better activity.
Nonresidential construction should continue to improve slightly in
2012, but will remain well below peak levels reached prior to the
recession.
The unemployment rate in the Inland Empire fell to 13.6% in 2011
after reaching a high of 14.5% in 2010 and is expected to come down
to 12.8% by the end of 2012. Persistently high unemployment has
been very difficult for the Inland Empire to overcome and the results
can be clearly seen, as retail sales also have suffered. Taxable retail
sales improved last year as unemployment declined and are again
expected to improve this year and next as unemployment falls and
personal income increases.
Recovery in the Inland Empire will still lag other parts of California and
the U.S. as the area is climbing out of a very deep hole. The good news
is the dramatic declines seen in 2009 have ended and the area beat
expectations last year. Still, the recovery in the Inland Empire will
seem slow as unemployment and housing remain significant issues
during the forecast period. Nonfarm employment is expected to
increase by 1.5% in 2011 and to increase further by 1.8% in 2013.
The continued strength in two-way trade flows at the twin ports had
positive results once again for the Inland Empire’s transportation and
wholesale trade sectors in 2011. The area should see even more
positive results in the coming months. The Inland Empire plays a
pivotal role as a distribution center for many of the goods flowing
through the ports of Long Beach and Los Angeles. World trade
volumes rose by roughly 6.5% in 2011 after increasing by 16.0% in
2010. World trade volumes are projected to increase by about 4.0%
this year. Imports from Asia to the U.S. rose by roughly 8.0% in 2011. It
is important to remember that over 40% of the U.S.’s imported
containers come through the ports of L.A. and Long Beach and roughly
20% to 30% of these imports are bound for Southern California. The
improvement in trade activity will translate into positive results for the
transportation and logistics sector in the Inland Empire for 2012 and
into 2013.
The severe downturn of the Inland Empire economy brought
migration into the area to a halt. Again, what formerly was a part of
the Inland Empire’s competitive advantage has become a detriment to
recovery. Rapid population growth, particularly from 1998 to 2008
was the one of the key economic drivers for the area. However, with
the economy stabilizing, the decline in migration has abated, leading
demand for housing, retail and services to grow again, but very slowly
through 2013.
The largest employment gains
during 2012 will come in health services, administrative and support services, wholesale trade, and transportation.
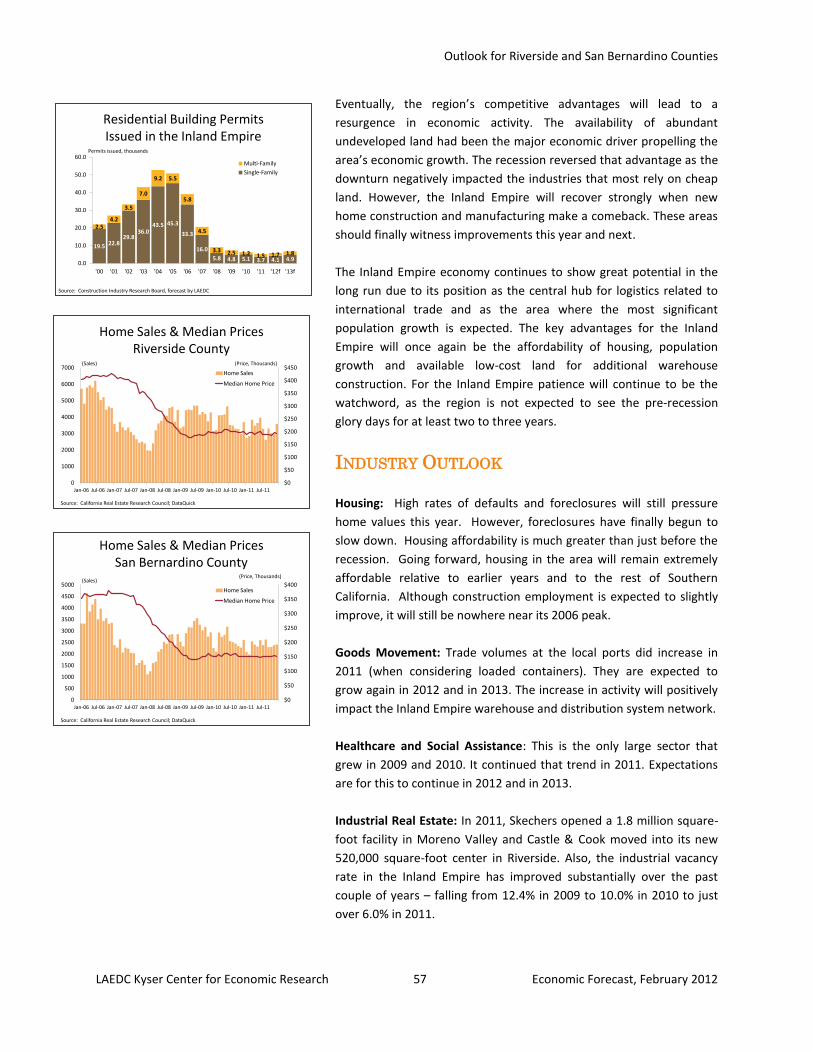
Outlook for Riverside and San Bernardino Counties
LAEDC Kyser Center for Economic Research 57 Economic Forecast, February 2012
Residential Building Permits Issued in the Inland Empire
19.5 22.829.8
36.043.5 45.3
33.3
16.0
5.8 4.8 5.1 3.7 4.1 4.9
2.54.2
3.5
7.0
9.2 5.5
5.8
4.5
3.3 2.5 1.2 1.5 1.7 1.8
0.0
10.0
20.0
30.0
40.0
50.0
60.0
'00 '01 '02 '03 '04 '05 '06 '07 '08 '09 '10 '11 '12f '13f
Multi-Family
Single-Family
Permits issued, thousands
Source: Construction Industry Research Board, forecast by LAEDC
Home Sales & Median PricesRiverside County
$0
$50
$100
$150
$200
$250
$300
$350
$400
$450
0
1000
2000
3000
4000
5000
6000
7000
Jan-06 Jul-06 Jan-07 Jul-07 Jan-08 Jul-08 Jan-09 Jul-09 Jan-10 Jul-10 Jan-11 Jul-11
Home Sales
Median Home Price
(Sales) (Price, Thousands)
Source: California Real Estate Research Council; DataQuick
Home Sales & Median PricesSan Bernardino County
$0
$50
$100
$150
$200
$250
$300
$350
$400
0
500
1000
1500
2000
2500
3000
3500
4000
4500
5000
Jan-06 Jul-06 Jan-07 Jul-07 Jan-08 Jul-08 Jan-09 Jul-09 Jan-10 Jul-10 Jan-11 Jul-11
Home Sales
Median Home Price
(Sales)(Price, Thousands)
Source: California Real Estate Research Council; DataQuick
Eventually, the region’s competitive advantages will lead to a
resurgence in economic activity. The availability of abundant
undeveloped land had been the major economic driver propelling the
area’s economic growth. The recession reversed that advantage as the
downturn negatively impacted the industries that most rely on cheap
land. However, the Inland Empire will recover strongly when new
home construction and manufacturing make a comeback. These areas
should finally witness improvements this year and next.
The Inland Empire economy continues to show great potential in the
long run due to its position as the central hub for logistics related to
international trade and as the area where the most significant
population growth is expected. The key advantages for the Inland
Empire will once again be the affordability of housing, population
growth and available low-cost land for additional warehouse
construction. For the Inland Empire patience will continue to be the
watchword, as the region is not expected to see the pre-recession
glory days for at least two to three years.
INDUSTRY OUTLOOK
Housing: High rates of defaults and foreclosures will still pressure
home values this year. However, foreclosures have finally begun to
slow down. Housing affordability is much greater than just before the
recession. Going forward, housing in the area will remain extremely
affordable relative to earlier years and to the rest of Southern
California. Although construction employment is expected to slightly
improve, it will still be nowhere near its 2006 peak.
Goods Movement: Trade volumes at the local ports did increase in
2011 (when considering loaded containers). They are expected to
grow again in 2012 and in 2013. The increase in activity will positively
impact the Inland Empire warehouse and distribution system network.
Healthcare and Social Assistance: This is the only large sector that
grew in 2009 and 2010. It continued that trend in 2011. Expectations
are for this to continue in 2012 and in 2013.
Industrial Real Estate: In 2011, Skechers opened a 1.8 million square-
foot facility in Moreno Valley and Castle & Cook moved into its new
520,000 square-foot center in Riverside. Also, the industrial vacancy
rate in the Inland Empire has improved substantially over the past
couple of years – falling from 12.4% in 2009 to 10.0% in 2010 to just
over 6.0% in 2011.
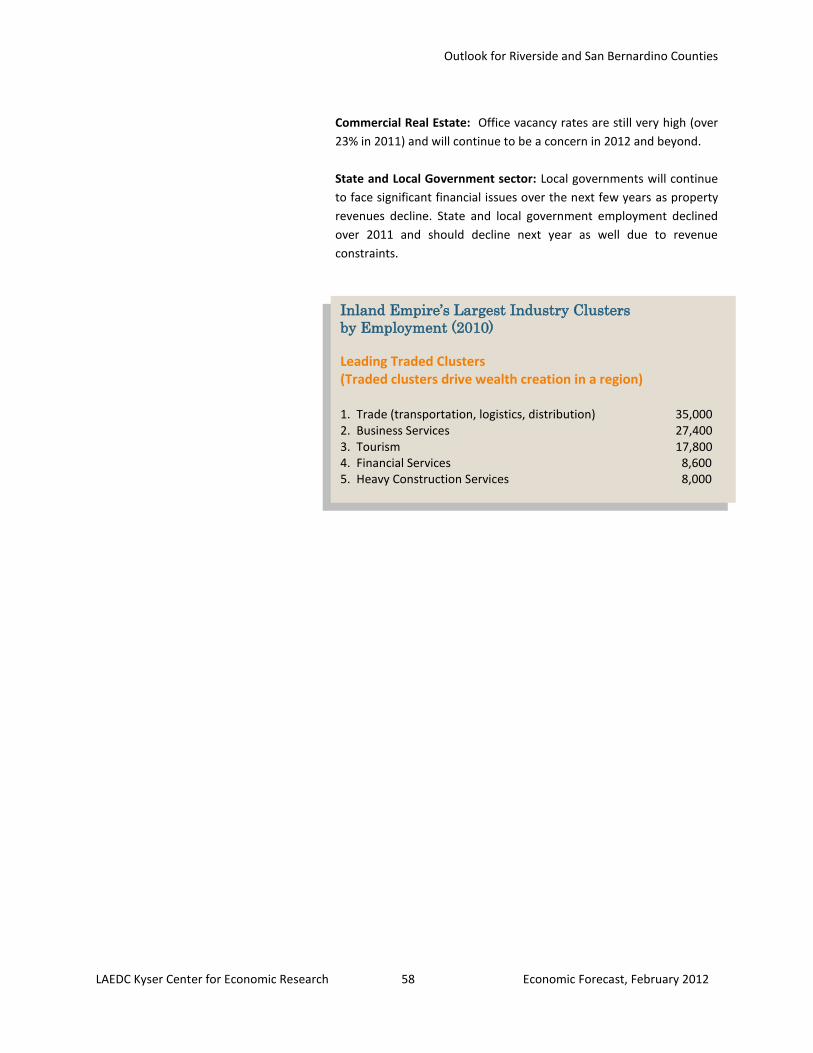
Outlook for Riverside and San Bernardino Counties
LAEDC Kyser Center for Economic Research 58 Economic Forecast, February 2012
Commercial Real Estate: Office vacancy rates are still very high (over
23% in 2011) and will continue to be a concern in 2012 and beyond.
State and Local Government sector: Local governments will continue
to face significant financial issues over the next few years as property
revenues decline. State and local government employment declined
over 2011 and should decline next year as well due to revenue
constraints.
Inland Empire’s Largest Industry Clusters
by Employment (2010)
Leading Traded Clusters (Traded clusters drive wealth creation in a region) 1. Trade (transportation, logistics, distribution) 35,000 2. Business Services 27,400 3. Tourism 17,800 4. Financial Services 8,600 5. Heavy Construction Services 8,000
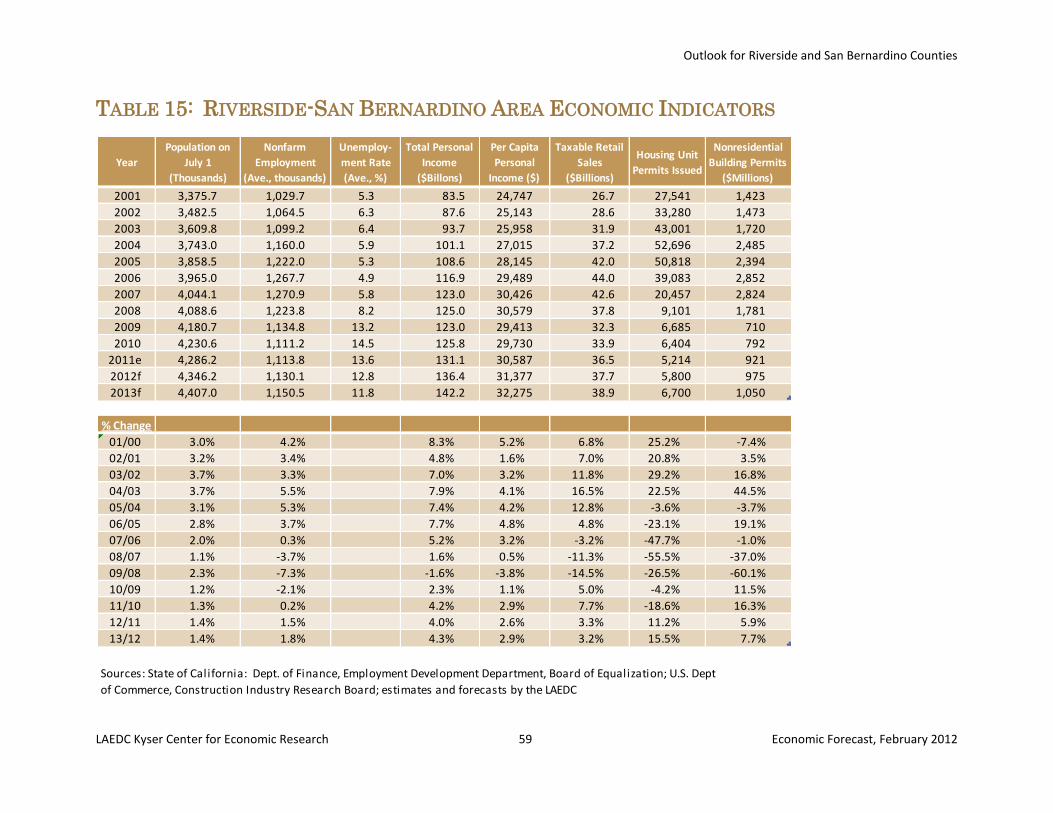
Outlook for Riverside and San Bernardino Counties
LAEDC Kyser Center for Economic Research 59 Economic Forecast, February 2012
Year
Population on
July 1
(Thousands)
Nonfarm
Employment
(Ave., thousands)
Unemploy-
ment Rate
(Ave., %)
Total Personal
Income
($Billons)
Per Capita
Personal
Income ($)
Taxable Retail
Sales
($Billions)
Housing Unit
Permits Issued
Nonresidential
Building Permits
($Millions)
2001 3,375.7 1,029.7 5.3 83.5 24,747 26.7 27,541 1,423
2002 3,482.5 1,064.5 6.3 87.6 25,143 28.6 33,280 1,473
2003 3,609.8 1,099.2 6.4 93.7 25,958 31.9 43,001 1,720
2004 3,743.0 1,160.0 5.9 101.1 27,015 37.2 52,696 2,485
2005 3,858.5 1,222.0 5.3 108.6 28,145 42.0 50,818 2,394
2006 3,965.0 1,267.7 4.9 116.9 29,489 44.0 39,083 2,852
2007 4,044.1 1,270.9 5.8 123.0 30,426 42.6 20,457 2,824
2008 4,088.6 1,223.8 8.2 125.0 30,579 37.8 9,101 1,781
2009 4,180.7 1,134.8 13.2 123.0 29,413 32.3 6,685 710
2010 4,230.6 1,111.2 14.5 125.8 29,730 33.9 6,404 792
2011e 4,286.2 1,113.8 13.6 131.1 30,587 36.5 5,214 921
2012f 4,346.2 1,130.1 12.8 136.4 31,377 37.7 5,800 975
2013f 4,407.0 1,150.5 11.8 142.2 32,275 38.9 6,700 1,050
% Change Column1 Column2 Column3 Column4 Column5 Column6 Column7 Column8
01/00 3.0% 4.2% 8.3% 5.2% 6.8% 25.2% -7.4%
02/01 3.2% 3.4% 4.8% 1.6% 7.0% 20.8% 3.5%
03/02 3.7% 3.3% 7.0% 3.2% 11.8% 29.2% 16.8%
04/03 3.7% 5.5% 7.9% 4.1% 16.5% 22.5% 44.5%
05/04 3.1% 5.3% 7.4% 4.2% 12.8% -3.6% -3.7%
06/05 2.8% 3.7% 7.7% 4.8% 4.8% -23.1% 19.1%
07/06 2.0% 0.3% 5.2% 3.2% -3.2% -47.7% -1.0%
08/07 1.1% -3.7% 1.6% 0.5% -11.3% -55.5% -37.0%
09/08 2.3% -7.3% -1.6% -3.8% -14.5% -26.5% -60.1%
10/09 1.2% -2.1% 2.3% 1.1% 5.0% -4.2% 11.5%
11/10 1.3% 0.2% 4.2% 2.9% 7.7% -18.6% 16.3%
12/11 1.4% 1.5% 4.0% 2.6% 3.3% 11.2% 5.9%
13/12 1.4% 1.8% 4.3% 2.9% 3.2% 15.5% 7.7%
Sources: State of California: Dept. of Finance, Employment Development Department, Board of Equalization; U.S. Dept
of Commerce, Construction Industry Research Board; estimates and forecasts by the LAEDC
TABLE 15: RIVERSIDE-SAN BERNARDINO AREA ECONOMIC INDICATORS
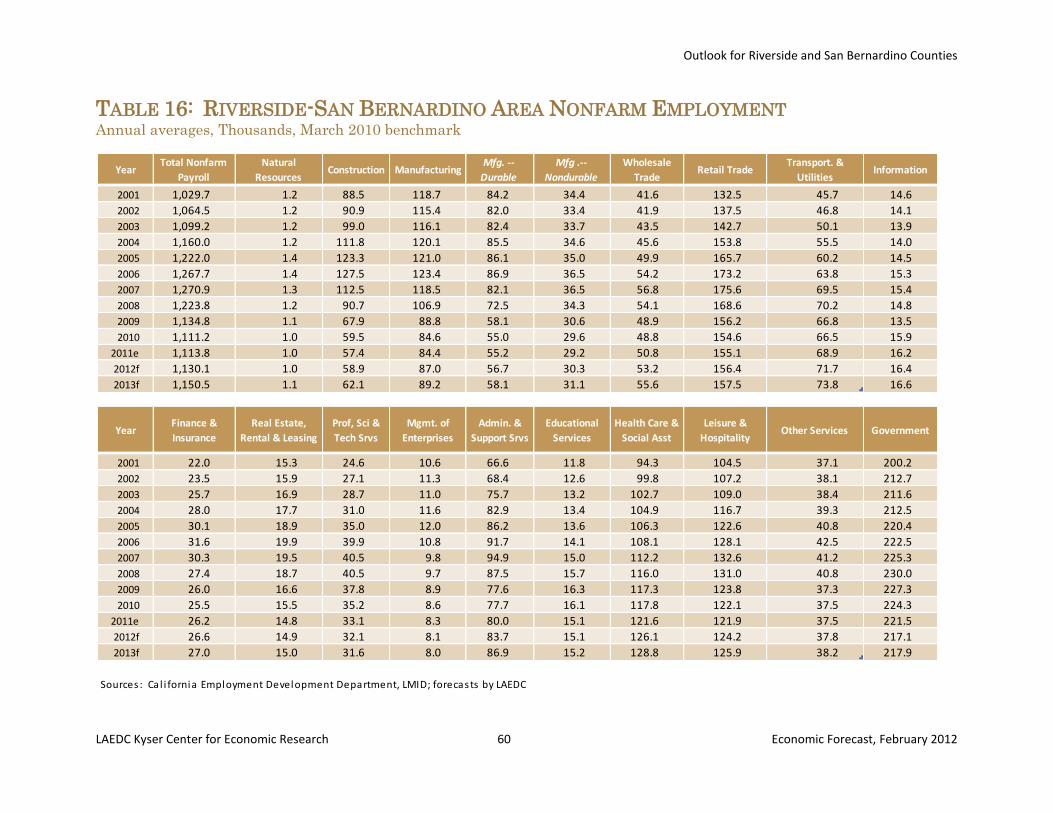
Outlook for Riverside and San Bernardino Counties
LAEDC Kyser Center for Economic Research 60 Economic Forecast, February 2012
YearTotal Nonfarm
Payroll
Natural
ResourcesConstruction Manufacturing
Mfg. --
Durable
Mfg .--
Nondurable
Wholesale
TradeRetail Trade
Transport. &
UtilitiesInformation
2001 1,029.7 1.2 88.5 118.7 84.2 34.4 41.6 132.5 45.7 14.6
2002 1,064.5 1.2 90.9 115.4 82.0 33.4 41.9 137.5 46.8 14.1
2003 1,099.2 1.2 99.0 116.1 82.4 33.7 43.5 142.7 50.1 13.9
2004 1,160.0 1.2 111.8 120.1 85.5 34.6 45.6 153.8 55.5 14.0
2005 1,222.0 1.4 123.3 121.0 86.1 35.0 49.9 165.7 60.2 14.5
2006 1,267.7 1.4 127.5 123.4 86.9 36.5 54.2 173.2 63.8 15.3
2007 1,270.9 1.3 112.5 118.5 82.1 36.5 56.8 175.6 69.5 15.4
2008 1,223.8 1.2 90.7 106.9 72.5 34.3 54.1 168.6 70.2 14.8
2009 1,134.8 1.1 67.9 88.8 58.1 30.6 48.9 156.2 66.8 13.5
2010 1,111.2 1.0 59.5 84.6 55.0 29.6 48.8 154.6 66.5 15.9
2011e 1,113.8 1.0 57.4 84.4 55.2 29.2 50.8 155.1 68.9 16.2
2012f 1,130.1 1.0 58.9 87.0 56.7 30.3 53.2 156.4 71.7 16.4
2013f 1,150.5 1.1 62.1 89.2 58.1 31.1 55.6 157.5 73.8 16.6
YearFinance &
Insurance
Real Estate,
Rental & Leasing
Prof, Sci &
Tech Srvs
Mgmt. of
Enterprises
Admin. &
Support Srvs
Educational
Services
Health Care &
Social Asst
Leisure &
HospitalityOther Services Government
2001 22.0 15.3 24.6 10.6 66.6 11.8 94.3 104.5 37.1 200.2
2002 23.5 15.9 27.1 11.3 68.4 12.6 99.8 107.2 38.1 212.7
2003 25.7 16.9 28.7 11.0 75.7 13.2 102.7 109.0 38.4 211.6
2004 28.0 17.7 31.0 11.6 82.9 13.4 104.9 116.7 39.3 212.5
2005 30.1 18.9 35.0 12.0 86.2 13.6 106.3 122.6 40.8 220.4
2006 31.6 19.9 39.9 10.8 91.7 14.1 108.1 128.1 42.5 222.5
2007 30.3 19.5 40.5 9.8 94.9 15.0 112.2 132.6 41.2 225.3
2008 27.4 18.7 40.5 9.7 87.5 15.7 116.0 131.0 40.8 230.0
2009 26.0 16.6 37.8 8.9 77.6 16.3 117.3 123.8 37.3 227.3
2010 25.5 15.5 35.2 8.6 77.7 16.1 117.8 122.1 37.5 224.3
2011e 26.2 14.8 33.1 8.3 80.0 15.1 121.6 121.9 37.5 221.5
2012f 26.6 14.9 32.1 8.1 83.7 15.1 126.1 124.2 37.8 217.1
2013f 27.0 15.0 31.6 8.0 86.9 15.2 128.8 125.9 38.2 217.9
Sources : Ca l i fornia Employment Development Department, LMID; forecasts by LAEDC
TABLE 16: RIVERSIDE-SAN BERNARDINO AREA NONFARM EMPLOYMENT Annual averages, Thousands, March 2010 benchmark
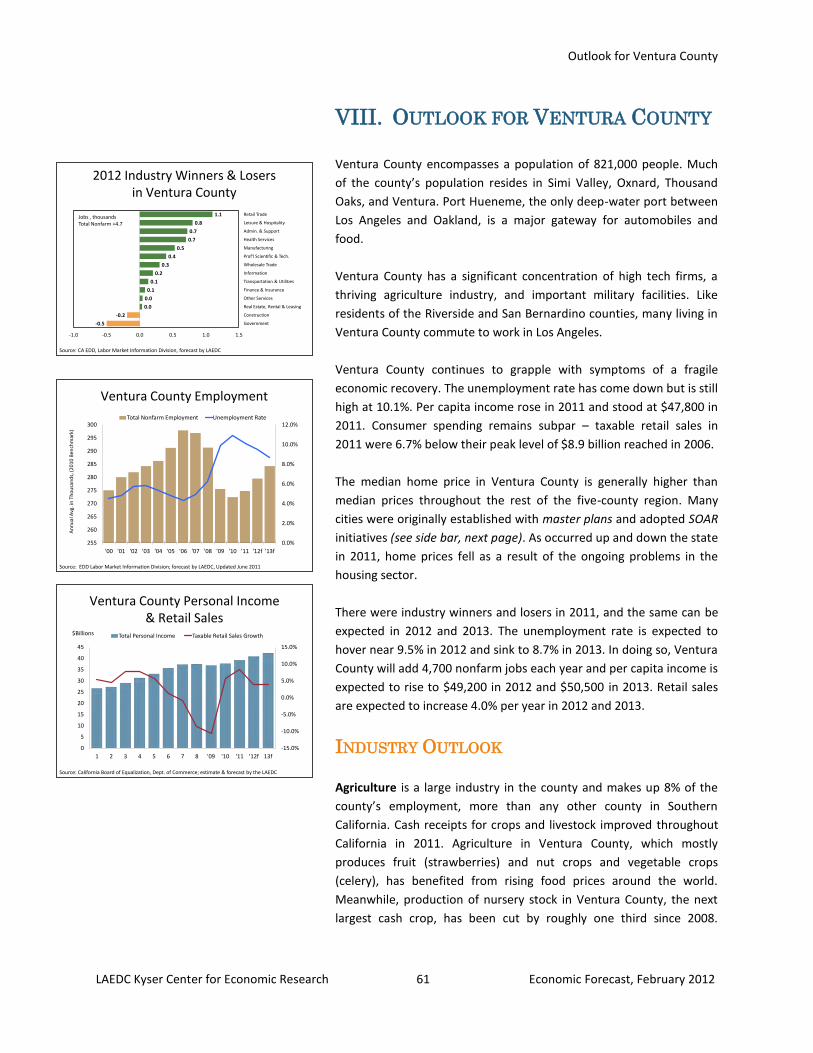
Outlook for Ventura County
LAEDC Kyser Center for Economic Research 61 Economic Forecast, February 2012
Ventura County Employment
0.0%
2.0%
4.0%
6.0%
8.0%
10.0%
12.0%
255
260
265
270
275
280
285
290
295
300
'00 '01 '02 '03 '04 '05 '06 '07 '08 '09 '10 '11 '12f '13f
Total Nonfarm Employment Unemployment Rate
Source: EDD Labor Market Information Division; forecast by LAEDC, Updated June 2011
An
nu
al A
vg. i
n T
ho
usa
nd
s, (
20
10
Ben
chm
ark)
Ventura County Personal Income& Retail Sales
-15.0%
-10.0%
-5.0%
0.0%
5.0%
10.0%
15.0%
0
5
10
15
20
25
30
35
40
45
1 2 3 4 5 6 7 8 '09 '10 '11 '12f 13f
Total Personal Income Taxable Retail Sales Growth$Billions
Source: California Board of Equalization, Dept. of Commerce; estimate & forecast by the LAEDC
2012 Industry Winners & Losers in Ventura County
Source: CA EDD, Labor Market Information Division, forecast by LAEDC
-0.5
-0.2
0.0
0.0
0.1
0.1
0.2
0.3
0.4
0.5
0.7
0.7
0.8
1.1
-1.0 -0.5 0.0 0.5 1.0 1.5
Government
Construction
Real Estate, Rental & Leasing
Other Services
Finance & Insurance
Transportation & Utilities
Information
Wholesale Trade
Prof'l Scientific & Tech.
Manufacturing
Health Services
Admin. & Support
Leisure & Hospitality
Retail TradeJobs , thousandsTotal Nonfarm +4.7
VIII. OUTLOOK FOR VENTURA COUNTY
Ventura County encompasses a population of 821,000 people. Much
of the county’s population resides in Simi Valley, Oxnard, Thousand
Oaks, and Ventura. Port Hueneme, the only deep-water port between
Los Angeles and Oakland, is a major gateway for automobiles and
food.
Ventura County has a significant concentration of high tech firms, a
thriving agriculture industry, and important military facilities. Like
residents of the Riverside and San Bernardino counties, many living in
Ventura County commute to work in Los Angeles.
Ventura County continues to grapple with symptoms of a fragile
economic recovery. The unemployment rate has come down but is still
high at 10.1%. Per capita income rose in 2011 and stood at $47,800 in
2011. Consumer spending remains subpar – taxable retail sales in
2011 were 6.7% below their peak level of $8.9 billion reached in 2006.
The median home price in Ventura County is generally higher than
median prices throughout the rest of the five-county region. Many
cities were originally established with master plans and adopted SOAR
initiatives (see side bar, next page). As occurred up and down the state
in 2011, home prices fell as a result of the ongoing problems in the
housing sector.
There were industry winners and losers in 2011, and the same can be
expected in 2012 and 2013. The unemployment rate is expected to
hover near 9.5% in 2012 and sink to 8.7% in 2013. In doing so, Ventura
County will add 4,700 nonfarm jobs each year and per capita income is
expected to rise to $49,200 in 2012 and $50,500 in 2013. Retail sales
are expected to increase 4.0% per year in 2012 and 2013.
INDUSTRY OUTLOOK
Agriculture is a large industry in the county and makes up 8% of the
county’s employment, more than any other county in Southern
California. Cash receipts for crops and livestock improved throughout
California in 2011. Agriculture in Ventura County, which mostly
produces fruit (strawberries) and nut crops and vegetable crops
(celery), has benefited from rising food prices around the world.
Meanwhile, production of nursery stock in Ventura County, the next
largest cash crop, has been cut by roughly one third since 2008.
Outlook for Ventura County
LAEDC Kyser Center for Economic Research 62 Economic Forecast, February 2012
Nursery stock relies heavily on new home building, still a depressed
industry throughout the Southern California region.
Farm employment decreased by 3.3% in 2011, but is still much larger
than in the 1990s and early 2000s. Expect farms to re-hire workers in
2012 and 2013 as the new U.S. free trade agreements boost demand
for Ventura County’s agriculture products.
The construction sector will continue to struggle for at least two more
years. Construction jobs, which make up 3.5% of Ventura County jobs,
decreased to 10,600 in 2011 from 11,300 jobs in 2010. This was the
fifth consecutive year that construction jobs declined.
Home sales edged down. There were 8,400 homes3 sold in 2011,
compared with 8,500 homes in 2010 and 9,200 homes sold in 2009. It
will be difficult for construction employment to recover without a
corresponding recovery in the housing market. Construction-related
employment is expected to fall to 10,400 workers this year, but the
county should see construction industry begin to add jobs again in
2013.
There are roughly 930 manufacturing establishments in Ventura
County, a number that has remained consistent since the recession,
even as jobs disappeared. The 32,500 manufacturing jobs in 2011
make up 11% of all Ventura County employment.
Durable goods manufacturing in Ventura County is comprised
primarily of fabricated metal products, machine shops, machinery, and
semiconductors. Many high-tech companies have been outsourcing
manufacturing jobs while retaining local research and development
units. Recent reports suggest some manufacturing jobs may be
returning to the state. High tech manufacturing is likely to be one of
the first sectors to see an increase in manufacturing employment.
Ventura County has a well-educated labor force and many of today’s
hi-tech manufacturing jobs require advanced training. For example,
Ventura based Solarsilicon recently moved to a larger facility in order
to expand their local manufacturing operations.
Manufacturing of chemical goods and pharmaceuticals struggled in
2011. Amgen, the county’s largest biotech manufacturer, restructured
its research operations and reduced its workforce. Other nondurable
goods manufacturers picked up the slack.
Ventura County manufacturing employment is expected to increase by
500 jobs in 2012, and by an additional 700 jobs in 2013.
3 New and resale single-family homes and condos (DataQuick)
AMGEN is the only
Fortune 500 company
headquartered in
Ventura County
(Thousand Oaks). With
revenues of $15.6 billion
in 2011, AMGEN
employs 17,000
throughout the world,
including approximately
6,200 in Ventura County.
Many cities in Ventura
County originally
established with a master
plan to set apart land
and prohibit any future
development. SOAR (Save Open Air and
Agricultural Resources)
prevents changes in
specified land use
categories of the general
plan without approval by
a majority of voters. SOAR was approved by
the Ventura County in 1998.
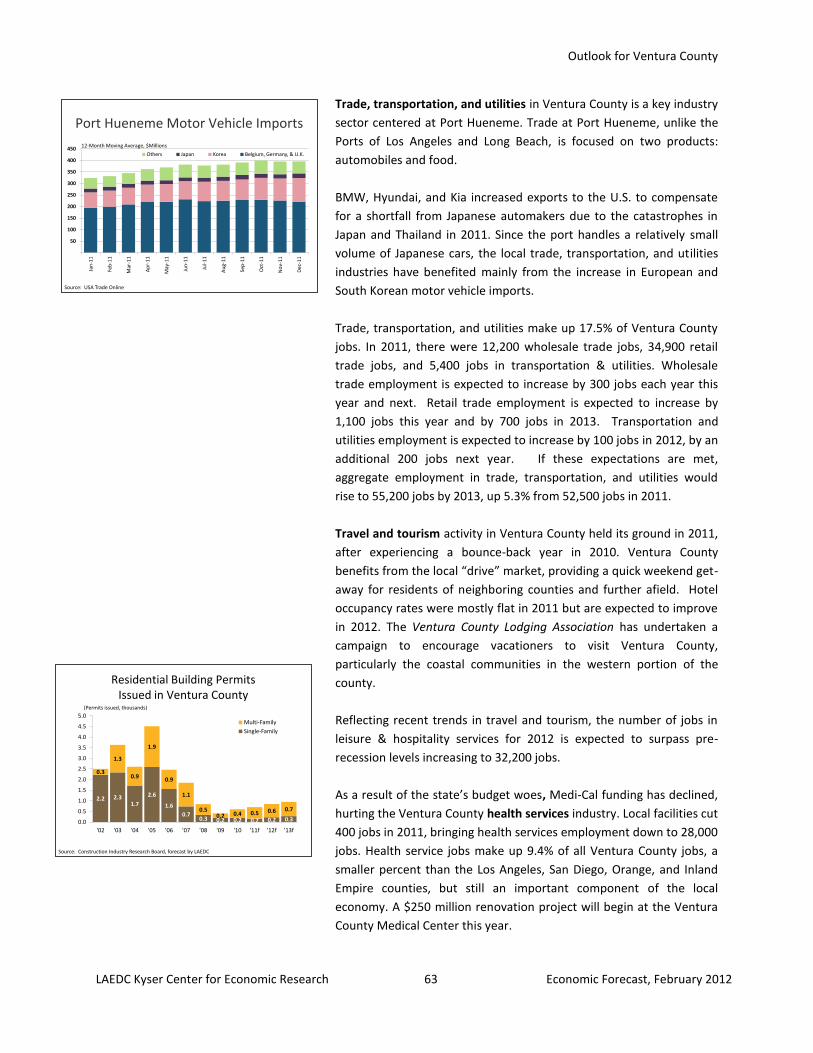
Outlook for Ventura County
LAEDC Kyser Center for Economic Research 63 Economic Forecast, February 2012
Residential Building Permits Issued in Ventura County
2.2 2.31.7
2.6
1.6
0.70.3 0.2 0.2 0.2 0.2 0.3
0.3
1.3
0.9
1.9
0.9
1.1
0.50.2 0.4 0.5 0.6 0.7
0.0
0.5
1.0
1.5
2.0
2.5
3.0
3.5
4.0
4.5
5.0
'02 '03 '04 '05 '06 '07 '08 '09 '10 '11f '12f '13f
Multi-Family
Single-Family
(Permits issued, thousands)
Source: Construction Industry Research Board, forecast by LAEDC
50
100
150
200
250
300
350
400
450
Jan
-11
Feb
-11
Mar
-11
Ap
r-1
1
May
-11
Jun
-11
Jul-
11
Au
g-1
1
Sep
-11
Oct
-11
No
v-1
1
Dec
-11
Others Japan Korea Belgium, Germany, & U.K.
12-Month Moving Average, $Millions
Port Hueneme Motor Vehicle Imports
Source: USA Trade Online
Trade, transportation, and utilities in Ventura County is a key industry
sector centered at Port Hueneme. Trade at Port Hueneme, unlike the
Ports of Los Angeles and Long Beach, is focused on two products:
automobiles and food.
BMW, Hyundai, and Kia increased exports to the U.S. to compensate
for a shortfall from Japanese automakers due to the catastrophes in
Japan and Thailand in 2011. Since the port handles a relatively small
volume of Japanese cars, the local trade, transportation, and utilities
industries have benefited mainly from the increase in European and
South Korean motor vehicle imports.
Trade, transportation, and utilities make up 17.5% of Ventura County
jobs. In 2011, there were 12,200 wholesale trade jobs, 34,900 retail
trade jobs, and 5,400 jobs in transportation & utilities. Wholesale
trade employment is expected to increase by 300 jobs each year this
year and next. Retail trade employment is expected to increase by
1,100 jobs this year and by 700 jobs in 2013. Transportation and
utilities employment is expected to increase by 100 jobs in 2012, by an
additional 200 jobs next year. If these expectations are met,
aggregate employment in trade, transportation, and utilities would
rise to 55,200 jobs by 2013, up 5.3% from 52,500 jobs in 2011.
Travel and tourism activity in Ventura County held its ground in 2011,
after experiencing a bounce-back year in 2010. Ventura County
benefits from the local “drive” market, providing a quick weekend get-
away for residents of neighboring counties and further afield. Hotel
occupancy rates were mostly flat in 2011 but are expected to improve
in 2012. The Ventura County Lodging Association has undertaken a
campaign to encourage vacationers to visit Ventura County,
particularly the coastal communities in the western portion of the
county.
Reflecting recent trends in travel and tourism, the number of jobs in
leisure & hospitality services for 2012 is expected to surpass pre-
recession levels increasing to 32,200 jobs.
As a result of the state’s budget woes, Medi-Cal funding has declined,
hurting the Ventura County health services industry. Local facilities cut
400 jobs in 2011, bringing health services employment down to 28,000
jobs. Health service jobs make up 9.4% of all Ventura County jobs, a
smaller percent than the Los Angeles, San Diego, Orange, and Inland
Empire counties, but still an important component of the local
economy. A $250 million renovation project will begin at the Ventura
County Medical Center this year.
The VCLA (Ventura
County Lodging
Association) is a new
organization that aims to
promote tourism in
Camarillo, Oxnard and
Ventura. The VCLA
aims to reach a 70%
occupancy rate for the
region by promoting in
Los Angeles and the San
Fernando Valley.
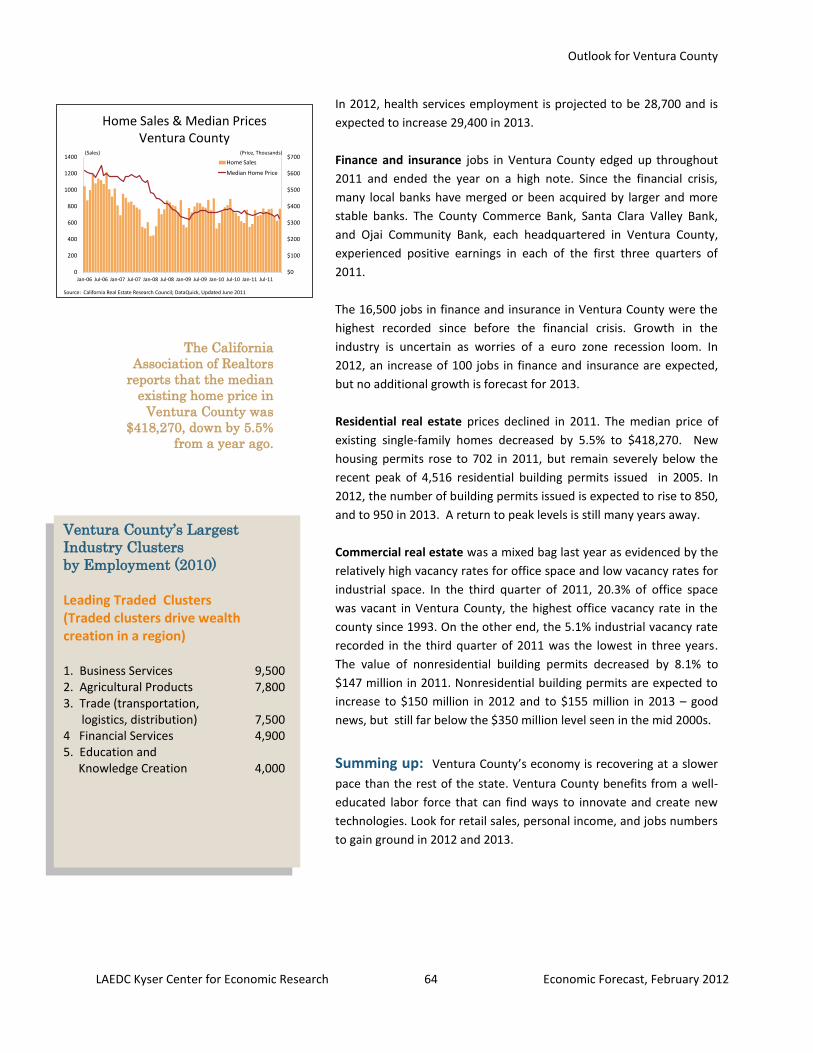
Outlook for Ventura County
LAEDC Kyser Center for Economic Research 64 Economic Forecast, February 2012
Home Sales & Median PricesVentura County
$0
$100
$200
$300
$400
$500
$600
$700
0
200
400
600
800
1000
1200
1400
Jan-06 Jul-06 Jan-07 Jul-07 Jan-08 Jul-08 Jan-09 Jul-09 Jan-10 Jul-10 Jan-11 Jul-11
Home Sales
Median Home Price
(Sales) (Price, Thousands)
Source: California Real Estate Research Council; DataQuick, Updated June 2011
In 2012, health services employment is projected to be 28,700 and is
expected to increase 29,400 in 2013.
Finance and insurance jobs in Ventura County edged up throughout
2011 and ended the year on a high note. Since the financial crisis,
many local banks have merged or been acquired by larger and more
stable banks. The County Commerce Bank, Santa Clara Valley Bank,
and Ojai Community Bank, each headquartered in Ventura County,
experienced positive earnings in each of the first three quarters of
2011.
The 16,500 jobs in finance and insurance in Ventura County were the
highest recorded since before the financial crisis. Growth in the
industry is uncertain as worries of a euro zone recession loom. In
2012, an increase of 100 jobs in finance and insurance are expected,
but no additional growth is forecast for 2013.
Residential real estate prices declined in 2011. The median price of
existing single-family homes decreased by 5.5% to $418,270. New
housing permits rose to 702 in 2011, but remain severely below the
recent peak of 4,516 residential building permits issued in 2005. In
2012, the number of building permits issued is expected to rise to 850,
and to 950 in 2013. A return to peak levels is still many years away.
Commercial real estate was a mixed bag last year as evidenced by the
relatively high vacancy rates for office space and low vacancy rates for
industrial space. In the third quarter of 2011, 20.3% of office space
was vacant in Ventura County, the highest office vacancy rate in the
county since 1993. On the other end, the 5.1% industrial vacancy rate
recorded in the third quarter of 2011 was the lowest in three years.
The value of nonresidential building permits decreased by 8.1% to
$147 million in 2011. Nonresidential building permits are expected to
increase to $150 million in 2012 and to $155 million in 2013 – good
news, but still far below the $350 million level seen in the mid 2000s.
Summing up: Ventura County’s economy is recovering at a slower
pace than the rest of the state. Ventura County benefits from a well-
educated labor force that can find ways to innovate and create new
technologies. Look for retail sales, personal income, and jobs numbers
to gain ground in 2012 and 2013.
The California
Association of Realtors
reports that the median
existing home price in
Ventura County was
$418,270, down by 5.5%
from a year ago.
Ventura County’s Largest
Industry Clusters
by Employment (2010) Leading Traded Clusters (Traded clusters drive wealth creation in a region) 1. Business Services 9,500 2. Agricultural Products 7,800 3. Trade (transportation, logistics, distribution) 7,500 4 Financial Services 4,900 5. Education and Knowledge Creation 4,000
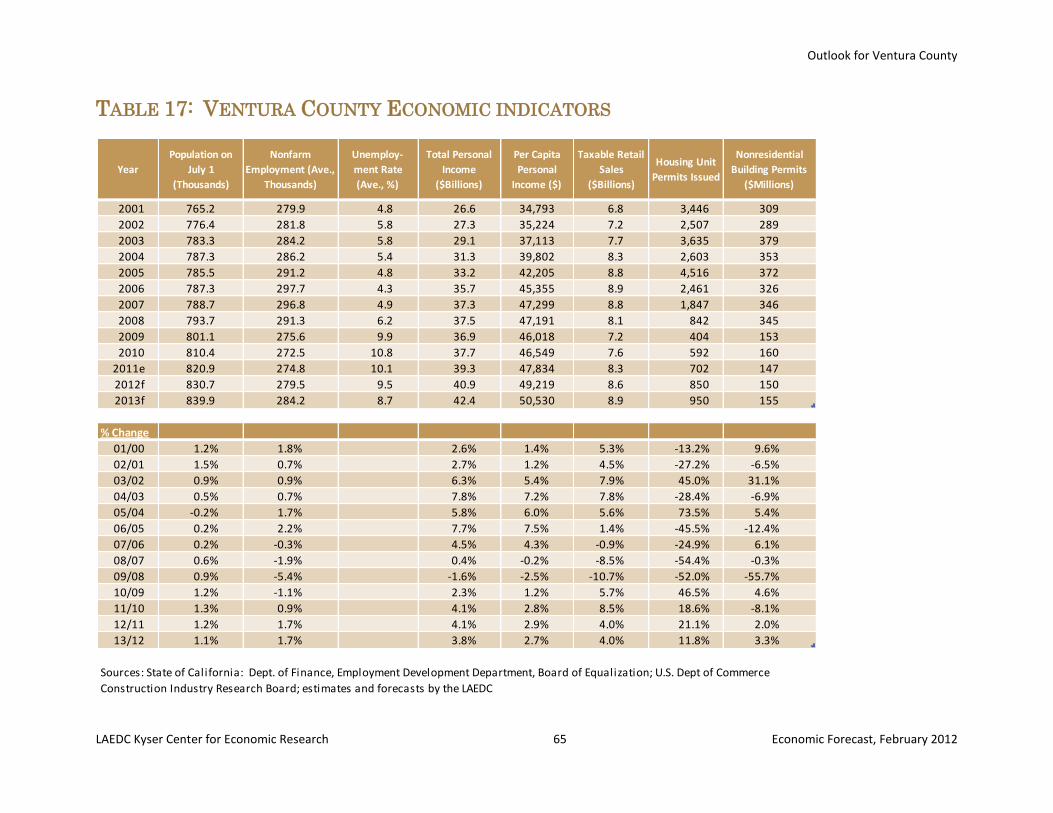
Outlook for Ventura County
LAEDC Kyser Center for Economic Research 65 Economic Forecast, February 2012
Year
Population on
July 1
(Thousands)
Nonfarm
Employment (Ave.,
Thousands)
Unemploy-
ment Rate
(Ave., %)
Total Personal
Income
($Billions)
Per Capita
Personal
Income ($)
Taxable Retail
Sales
($Billions)
Housing Unit
Permits Issued
Nonresidential
Building Permits
($Millions)
2001 765.2 279.9 4.8 26.6 34,793 6.8 3,446 309
2002 776.4 281.8 5.8 27.3 35,224 7.2 2,507 289
2003 783.3 284.2 5.8 29.1 37,113 7.7 3,635 379
2004 787.3 286.2 5.4 31.3 39,802 8.3 2,603 353
2005 785.5 291.2 4.8 33.2 42,205 8.8 4,516 372
2006 787.3 297.7 4.3 35.7 45,355 8.9 2,461 326
2007 788.7 296.8 4.9 37.3 47,299 8.8 1,847 346
2008 793.7 291.3 6.2 37.5 47,191 8.1 842 345
2009 801.1 275.6 9.9 36.9 46,018 7.2 404 153
2010 810.4 272.5 10.8 37.7 46,549 7.6 592 160
2011e 820.9 274.8 10.1 39.3 47,834 8.3 702 147
2012f 830.7 279.5 9.5 40.9 49,219 8.6 850 150
2013f 839.9 284.2 8.7 42.4 50,530 8.9 950 155
% Change Column1 Column2 Column3 Column4 Column5 Column6 Column7 Column8
01/00 1.2% 1.8% 2.6% 1.4% 5.3% -13.2% 9.6%
02/01 1.5% 0.7% 2.7% 1.2% 4.5% -27.2% -6.5%
03/02 0.9% 0.9% 6.3% 5.4% 7.9% 45.0% 31.1%
04/03 0.5% 0.7% 7.8% 7.2% 7.8% -28.4% -6.9%
05/04 -0.2% 1.7% 5.8% 6.0% 5.6% 73.5% 5.4%
06/05 0.2% 2.2% 7.7% 7.5% 1.4% -45.5% -12.4%
07/06 0.2% -0.3% 4.5% 4.3% -0.9% -24.9% 6.1%
08/07 0.6% -1.9% 0.4% -0.2% -8.5% -54.4% -0.3%
09/08 0.9% -5.4% -1.6% -2.5% -10.7% -52.0% -55.7%
10/09 1.2% -1.1% 2.3% 1.2% 5.7% 46.5% 4.6%
11/10 1.3% 0.9% 4.1% 2.8% 8.5% 18.6% -8.1%
12/11 1.2% 1.7% 4.1% 2.9% 4.0% 21.1% 2.0%
13/12 1.1% 1.7% 3.8% 2.7% 4.0% 11.8% 3.3%
Sources: State of California: Dept. of Finance, Employment Development Department, Board of Equalization; U.S. Dept of Commerce
Construction Industry Research Board; estimates and forecasts by the LAEDC
TABLE 17: VENTURA COUNTY ECONOMIC INDICATORS
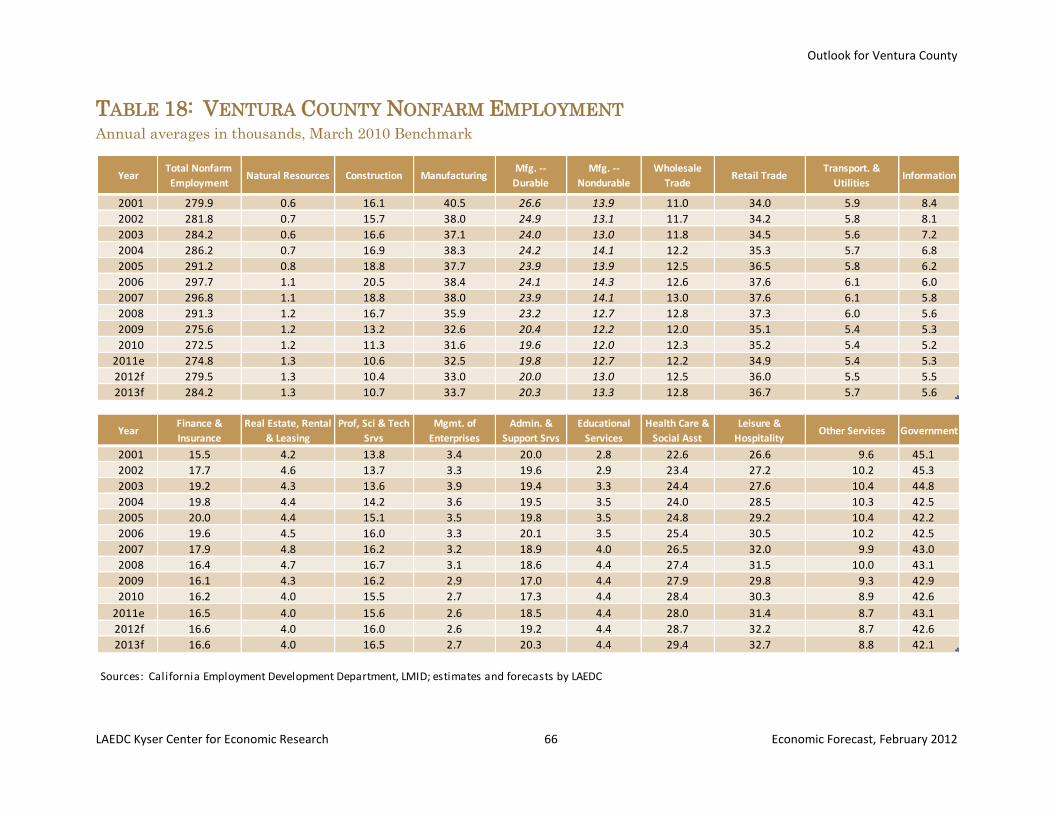
Outlook for Ventura County
LAEDC Kyser Center for Economic Research 66 Economic Forecast, February 2012
YearTotal Nonfarm
EmploymentNatural Resources Construction Manufacturing
Mfg. --
Durable
Mfg. --
Nondurable
Wholesale
TradeRetail Trade
Transport. &
UtilitiesInformation
2001 279.9 0.6 16.1 40.5 26.6 13.9 11.0 34.0 5.9 8.4
2002 281.8 0.7 15.7 38.0 24.9 13.1 11.7 34.2 5.8 8.1
2003 284.2 0.6 16.6 37.1 24.0 13.0 11.8 34.5 5.6 7.2
2004 286.2 0.7 16.9 38.3 24.2 14.1 12.2 35.3 5.7 6.8
2005 291.2 0.8 18.8 37.7 23.9 13.9 12.5 36.5 5.8 6.2
2006 297.7 1.1 20.5 38.4 24.1 14.3 12.6 37.6 6.1 6.0
2007 296.8 1.1 18.8 38.0 23.9 14.1 13.0 37.6 6.1 5.8
2008 291.3 1.2 16.7 35.9 23.2 12.7 12.8 37.3 6.0 5.6
2009 275.6 1.2 13.2 32.6 20.4 12.2 12.0 35.1 5.4 5.3
2010 272.5 1.2 11.3 31.6 19.6 12.0 12.3 35.2 5.4 5.2
2011e 274.8 1.3 10.6 32.5 19.8 12.7 12.2 34.9 5.4 5.3
2012f 279.5 1.3 10.4 33.0 20.0 13.0 12.5 36.0 5.5 5.5
2013f 284.2 1.3 10.7 33.7 20.3 13.3 12.8 36.7 5.7 5.6
YearFinance &
Insurance
Real Estate, Rental
& Leasing
Prof, Sci & Tech
Srvs
Mgmt. of
Enterprises
Admin. &
Support Srvs
Educational
Services
Health Care &
Social Asst
Leisure &
HospitalityOther Services Government
2001 15.5 4.2 13.8 3.4 20.0 2.8 22.6 26.6 9.6 45.1
2002 17.7 4.6 13.7 3.3 19.6 2.9 23.4 27.2 10.2 45.3
2003 19.2 4.3 13.6 3.9 19.4 3.3 24.4 27.6 10.4 44.8
2004 19.8 4.4 14.2 3.6 19.5 3.5 24.0 28.5 10.3 42.5
2005 20.0 4.4 15.1 3.5 19.8 3.5 24.8 29.2 10.4 42.2
2006 19.6 4.5 16.0 3.3 20.1 3.5 25.4 30.5 10.2 42.5
2007 17.9 4.8 16.2 3.2 18.9 4.0 26.5 32.0 9.9 43.0
2008 16.4 4.7 16.7 3.1 18.6 4.4 27.4 31.5 10.0 43.1
2009 16.1 4.3 16.2 2.9 17.0 4.4 27.9 29.8 9.3 42.9
2010 16.2 4.0 15.5 2.7 17.3 4.4 28.4 30.3 8.9 42.6
2011e 16.5 4.0 15.6 2.6 18.5 4.4 28.0 31.4 8.7 43.1
2012f 16.6 4.0 16.0 2.6 19.2 4.4 28.7 32.2 8.7 42.6
2013f 16.6 4.0 16.5 2.7 20.3 4.4 29.4 32.7 8.8 42.1
Sources: California Employment Development Department, LMID; estimates and forecasts by LAEDC
TABLE 18: VENTURA COUNTY NONFARM EMPLOYMENT Annual averages in thousands, March 2010 Benchmark
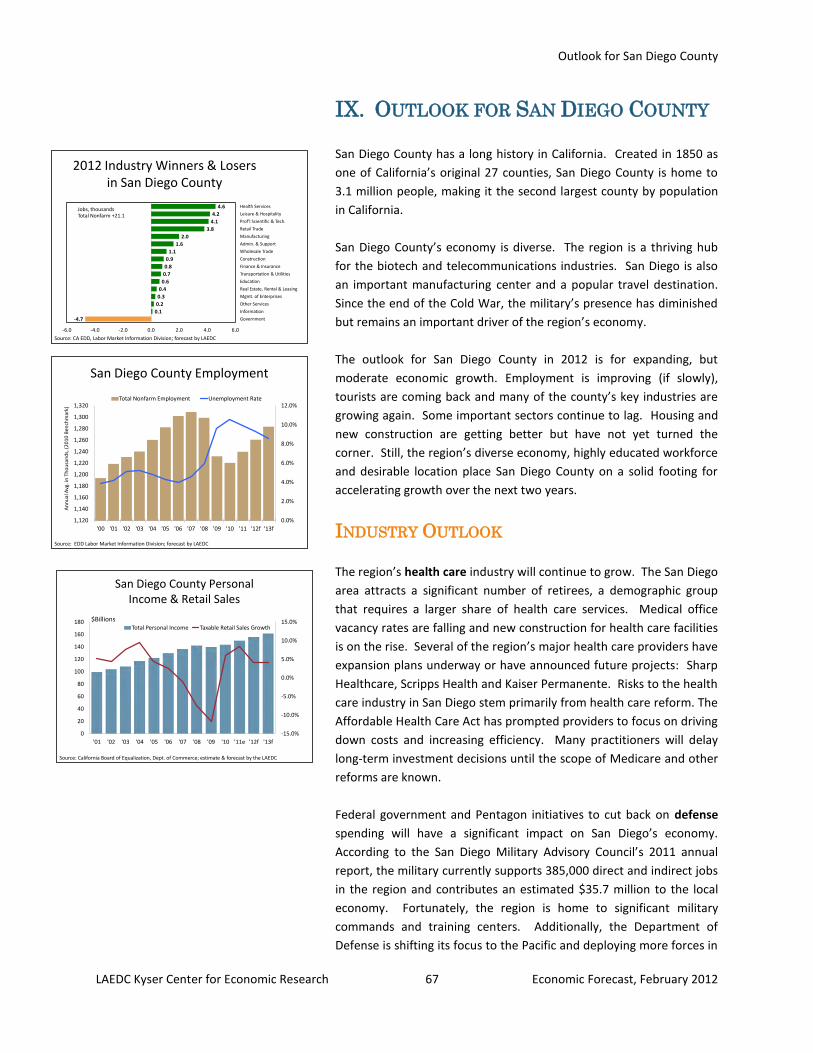
Outlook for San Diego County
LAEDC Kyser Center for Economic Research 67 Economic Forecast, February 2012
San Diego County Personal Income & Retail Sales
-15.0%
-10.0%
-5.0%
0.0%
5.0%
10.0%
15.0%
0
20
40
60
80
100
120
140
160
180
'01 '02 '03 '04 '05 '06 '07 '08 '09 '10 '11e '12f '13f
Total Personal Income Taxable Retail Sales Growth
$Billions
Source: California Board of Equalization, Dept. of Commerce; estimate & forecast by the LAEDC
2012 Industry Winners & Losers in San Diego County
Source: CA EDD, Labor Market Information Division; forecast by LAEDC
-4.7
0.1
0.2
0.3
0.4
0.6
0.7
0.8
0.9
1.1
1.6
2.0
3.8
4.1
4.2
4.6
-6.0 -4.0 -2.0 0.0 2.0 4.0 6.0
Government
Information
Other Services
Mgmt. of Enterprises
Real Estate, Rental & Leasing
Education
Transportation & Utilities
Finance & Insurance
Construction
Wholesale Trade
Admin. & Support
Manufacturing
Retail Trade
Prof'l Scientific & Tech.
Leisure & Hospitality
Health ServicesJobs, thousandsTotal Nonfarm +21.1
San Diego County Employment
0.0%
2.0%
4.0%
6.0%
8.0%
10.0%
12.0%
1,120
1,140
1,160
1,180
1,200
1,220
1,240
1,260
1,280
1,300
1,320
'00 '01 '02 '03 '04 '05 '06 '07 '08 '09 '10 '11 '12f '13f
Total Nonfarm Employment Unemployment Rate
Source: EDD Labor Market Information Division; forecast by LAEDC
An
nu
al A
vg. i
n T
ho
usa
nd
s, (
20
10
Ben
chm
ark)
IX. OUTLOOK FOR SAN DIEGO COUNTY
San Diego County has a long history in California. Created in 1850 as
one of California’s original 27 counties, San Diego County is home to
3.1 million people, making it the second largest county by population
in California.
San Diego County’s economy is diverse. The region is a thriving hub
for the biotech and telecommunications industries. San Diego is also
an important manufacturing center and a popular travel destination.
Since the end of the Cold War, the military’s presence has diminished
but remains an important driver of the region’s economy.
The outlook for San Diego County in 2012 is for expanding, but
moderate economic growth. Employment is improving (if slowly),
tourists are coming back and many of the county’s key industries are
growing again. Some important sectors continue to lag. Housing and
new construction are getting better but have not yet turned the
corner. Still, the region’s diverse economy, highly educated workforce
and desirable location place San Diego County on a solid footing for
accelerating growth over the next two years.
INDUSTRY OUTLOOK
The region’s health care industry will continue to grow. The San Diego
area attracts a significant number of retirees, a demographic group
that requires a larger share of health care services. Medical office
vacancy rates are falling and new construction for health care facilities
is on the rise. Several of the region’s major health care providers have
expansion plans underway or have announced future projects: Sharp
Healthcare, Scripps Health and Kaiser Permanente. Risks to the health
care industry in San Diego stem primarily from health care reform. The
Affordable Health Care Act has prompted providers to focus on driving
down costs and increasing efficiency. Many practitioners will delay
long-term investment decisions until the scope of Medicare and other
reforms are known.
Federal government and Pentagon initiatives to cut back on defense
spending will have a significant impact on San Diego’s economy.
According to the San Diego Military Advisory Council’s 2011 annual
report, the military currently supports 385,000 direct and indirect jobs
in the region and contributes an estimated $35.7 million to the local
economy. Fortunately, the region is home to significant military
commands and training centers. Additionally, the Department of
Defense is shifting its focus to the Pacific and deploying more forces in
Outlook for San Diego County
LAEDC Kyser Center for Economic Research 68 Economic Forecast, February 2012
San Diego. As a result, defense dollars should continue to flow into
the county.
Although defense related firms are rightly concerned about Federal
budget cuts, a large proportion of the work being done by local
contractors is related to the development of unmanned aerial vehicles
(UAVs) and cyber security systems. The last major shipyard on the
west coast (General Dynamics Nassco) is also located in San Diego.
Through the third quarter of 2011, military contracts awarded to firms
in the region totaled nearly $2.3 billion.4 Nassco received a $744
million contract (62% benefiting San Diego County) for the design and
construction of two Navy ships, with the first scheduled to be
delivered by spring 2013 and the second by early 2014. The USAF
awarded $247 million (100% to San Diego) to Northrop Grumman for
logistics support for the Global Hawk UAV which will support 290 jobs
in San Diego County. The Army awarded a $300 million contract
(100% to San Diego) to General Atomics Aeronautical Systems for the
purchase of system hardware for the Army’s Gray Eagle UAV.
San Diego’s travel and tourism industry is growing again. In the
lodging sector, fundamentals continue to improve – demand for hotel
rooms is up and occupancy rates are rising. Room rates have not yet
regained all the ground lost during the recession but are starting to
improve. New hotel construction remains at very low levels. It is still
a challenge to obtain financing for large construction projects.
Instead, existing hotels are upgrading and modernizing their facilities.
As the number of visitors increases, the lack of new supply will help
push up room rates. While growth will continue in 2012, it will be at a
slower pace as visitor numbers start to stabilize.
A plan to expand the San Diego Convention center has been under
evaluation for some time. Approval is pending, but if the expansion
goes forward, the $550 million project would begin in 2013 and be
completed by 2016. In 2011, convention center activities generated
an estimated 704,000 room nights and are projected to generate
763,000 room nights in 2012.5 This year, 98 events including 65
conventions are scheduled. If the expansion occurs, additional and
larger conventions would be attracted to San Diego, increasing lodging
demand.
The “drive” market is also very important to San Diego’s hotel
industry. Short stay travelers have nearly as large an impact as
convention visitors. As the economies and employment outlook of the
4 San Diego Business Journal (November 7, 2011)
5 San Diego Convention Center Corporation
The San Diego International
Airport is the second busiest
single runway airport in the
world behind Gatwick in London
Outlook for San Diego County
LAEDC Kyser Center for Economic Research 69 Economic Forecast, February 2012
region’s feeder markets (e.g. Los Angeles, Orange County, and
Phoenix, AZ) continue to improve, San Diego’s tourism industry will
benefit.
Some trouble spots remain. San Diego has a large cruise ship business
which was, until recently, heavily focused on the Mexican Riviera.
Over the past few years, however, demand for cruises to Mexico has
declined and cruise lines have been shrinking their presence in San
Diego. It may be several years before the industry recovers. Much will
depend on repairing Mexico’s image as a tourist destination.
The number of overnight visitors will increase by about 1.3% to 15.8
million in 2012. San Diego’s attractions, beaches, casino gaming and
sports venues will continue to make San Diego a popular destination
for both domestic and international travelers. LEGOLAND, the San
Diego Zoo and SeaWorld have all announced or will debut new
attractions in 2012, and British Airways’ daily direct flights from San
Diego to London are having a positive impact on the number of
European visitors.
The manufacturing sector will employ more workers this year.
Technology firms in particular are hiring more engineers, software
developers and software support staff. San Diego County has the
benefit of several innovative clusters including communications, bio-
fuels, genomics, energy storage, cyber-security and clean-tech. San
Diego also is home to one of the nation’s largest biotech sectors.
Navy cargo ships and drone aircraft are made in San Diego as well as
electronic products for the military, aviation and space. Benefiting
from a highly educated workforce, San Diego is a hub of research and
innovation in biotechnology, communications and software
development.
While smaller than it once was, San Diego’s agricultural industry is still
significant. It ranks as the 17th
largest agricultural economy among
counties in the United States. The region has 6,687 farms (covering
302,713 acres), more than any other county in the U.S. The total value
of the county’s agricultural output in 2010 was $1.6 billion,6 an
increase of 7% from the previous year. The largest commercial crops
were nursery plants (59% of the total dollar value of output) and
avocados (9%). In spite of having what the National Weather Service
describes as the most nearly perfect climate in the country, San Diego
growers do face some considerable challenges – land costs are high
and water supply is an ongoing concern, specifically the increasing
6 Farm Bureau San Diego, County of San Diego Department of Agriculture, Weights & Measures, 2010 Crop
Statistics & Annual Report
40% of San Diego’s adult
population has a bachelor’s
degree or higher.
San Diego has the nation’s
highest per capita concentration
of PhD degrees.
22 Companies in San Diego
County made Deloitte, LLP’s
2011 Technology Fast 500 list of
fastest growing technology
companies in the United States
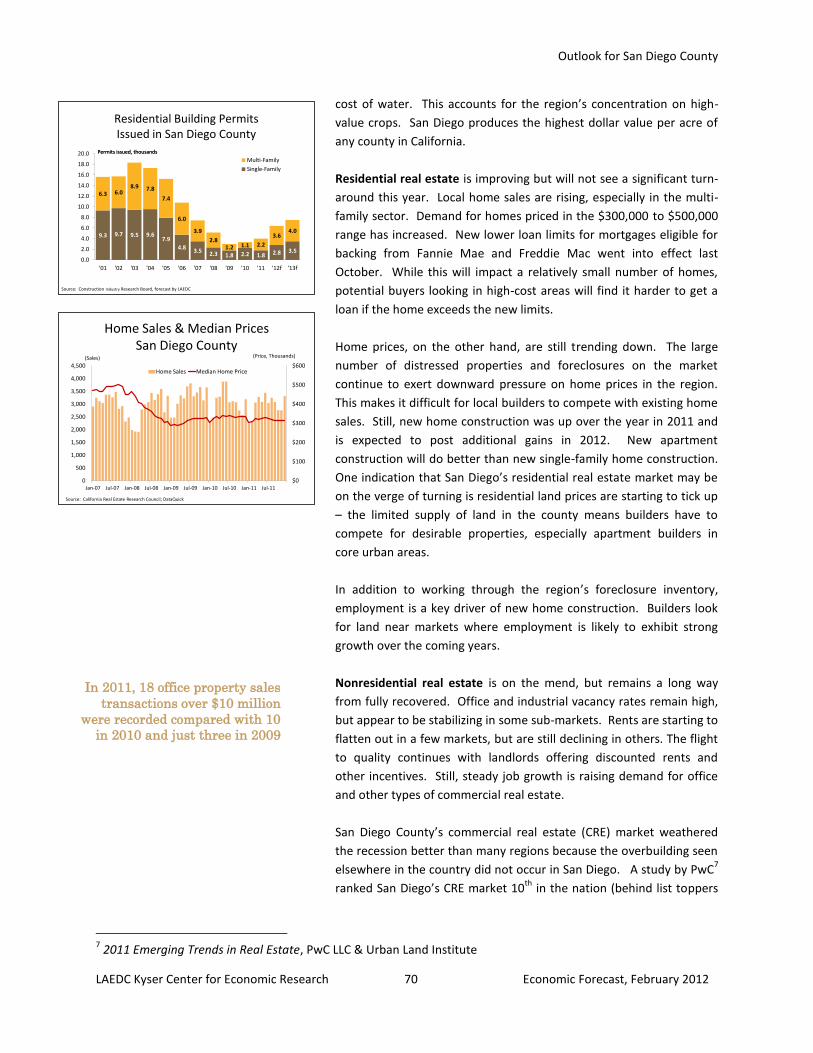
Outlook for San Diego County
LAEDC Kyser Center for Economic Research 70 Economic Forecast, February 2012
Residential Building Permits Issued in San Diego County
9.3 9.7 9.5 9.67.9
4.83.5 2.3 1.8 2.2 1.8 2.8 3.5
6.3 6.08.9 7.8
7.4
6.0
3.9
2.81.2 1.1 2.2
3.64.0
0.0
2.0
4.0
6.0
8.0
10.0
12.0
14.0
16.0
18.0
20.0
'01 '02 '03 '04 '05 '06 '07 '08 '09 '10 '11 '12f '13f
Multi-Family
Single-Family
Permits issued, thousandsPermits issued, thousands
Source: Construction Industry Research Board, forecast by LAEDC
Home Sales & Median PricesSan Diego County
$0
$100
$200
$300
$400
$500
$600
0
500
1,000
1,500
2,000
2,500
3,000
3,500
4,000
4,500
Jan-07 Jul-07 Jan-08 Jul-08 Jan-09 Jul-09 Jan-10 Jul-10 Jan-11 Jul-11
Home Sales Median Home Price
(Sales) (Price, Thousands)
Source: California Real Estate Research Council; DataQuick
cost of water. This accounts for the region’s concentration on high-
value crops. San Diego produces the highest dollar value per acre of
any county in California.
Residential real estate is improving but will not see a significant turn-
around this year. Local home sales are rising, especially in the multi-
family sector. Demand for homes priced in the $300,000 to $500,000
range has increased. New lower loan limits for mortgages eligible for
backing from Fannie Mae and Freddie Mac went into effect last
October. While this will impact a relatively small number of homes,
potential buyers looking in high-cost areas will find it harder to get a
loan if the home exceeds the new limits.
Home prices, on the other hand, are still trending down. The large
number of distressed properties and foreclosures on the market
continue to exert downward pressure on home prices in the region.
This makes it difficult for local builders to compete with existing home
sales. Still, new home construction was up over the year in 2011 and
is expected to post additional gains in 2012. New apartment
construction will do better than new single-family home construction.
One indication that San Diego’s residential real estate market may be
on the verge of turning is residential land prices are starting to tick up
– the limited supply of land in the county means builders have to
compete for desirable properties, especially apartment builders in
core urban areas.
In addition to working through the region’s foreclosure inventory,
employment is a key driver of new home construction. Builders look
for land near markets where employment is likely to exhibit strong
growth over the coming years.
Nonresidential real estate is on the mend, but remains a long way
from fully recovered. Office and industrial vacancy rates remain high,
but appear to be stabilizing in some sub-markets. Rents are starting to
flatten out in a few markets, but are still declining in others. The flight
to quality continues with landlords offering discounted rents and
other incentives. Still, steady job growth is raising demand for office
and other types of commercial real estate.
San Diego County’s commercial real estate (CRE) market weathered
the recession better than many regions because the overbuilding seen
elsewhere in the country did not occur in San Diego. A study by PwC7
ranked San Diego’s CRE market 10th
in the nation (behind list toppers
7 2011 Emerging Trends in Real Estate, PwC LLC & Urban Land Institute
In 2011, 18 office property sales
transactions over $10 million
were recorded compared with 10
in 2010 and just three in 2009
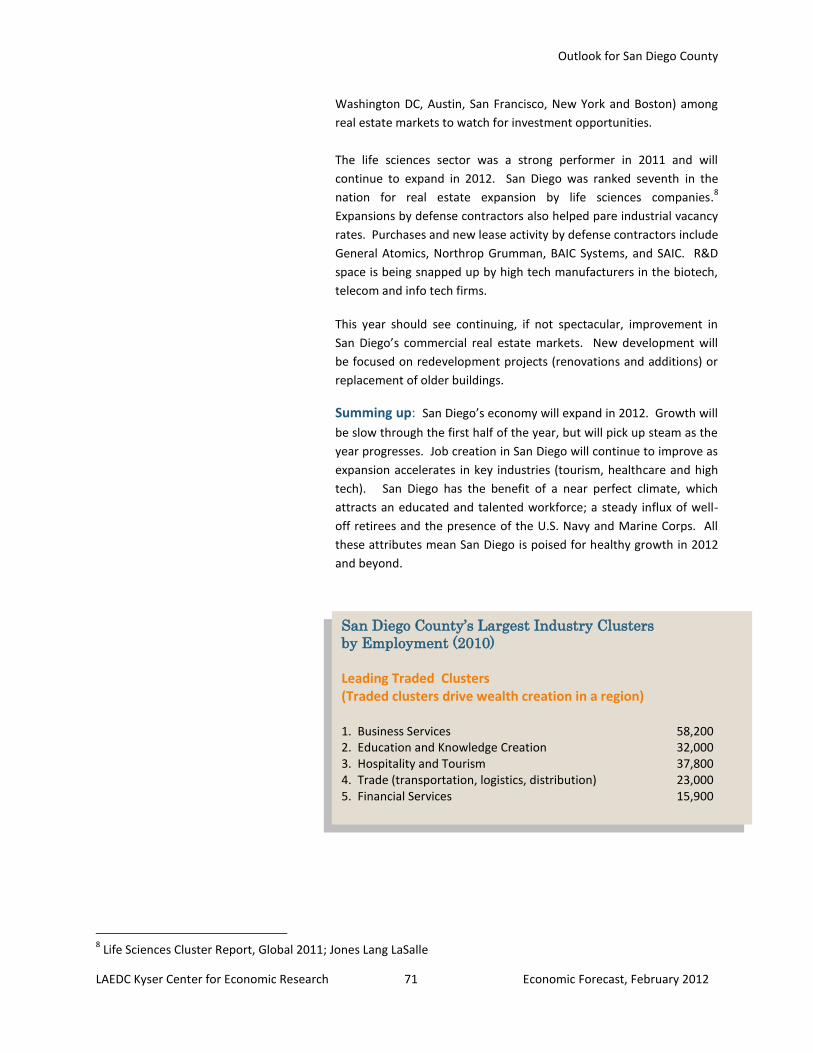
Outlook for San Diego County
LAEDC Kyser Center for Economic Research 71 Economic Forecast, February 2012
Washington DC, Austin, San Francisco, New York and Boston) among
real estate markets to watch for investment opportunities.
The life sciences sector was a strong performer in 2011 and will
continue to expand in 2012. San Diego was ranked seventh in the
nation for real estate expansion by life sciences companies.8
Expansions by defense contractors also helped pare industrial vacancy
rates. Purchases and new lease activity by defense contractors include
General Atomics, Northrop Grumman, BAIC Systems, and SAIC. R&D
space is being snapped up by high tech manufacturers in the biotech,
telecom and info tech firms.
This year should see continuing, if not spectacular, improvement in
San Diego’s commercial real estate markets. New development will
be focused on redevelopment projects (renovations and additions) or
replacement of older buildings.
Summing up: San Diego’s economy will expand in 2012. Growth will
be slow through the first half of the year, but will pick up steam as the
year progresses. Job creation in San Diego will continue to improve as
expansion accelerates in key industries (tourism, healthcare and high
tech). San Diego has the benefit of a near perfect climate, which
attracts an educated and talented workforce; a steady influx of well-
off retirees and the presence of the U.S. Navy and Marine Corps. All
these attributes mean San Diego is poised for healthy growth in 2012
and beyond.
8 Life Sciences Cluster Report, Global 2011; Jones Lang LaSalle
San Diego County’s Largest Industry Clusters
by Employment (2010) Leading Traded Clusters (Traded clusters drive wealth creation in a region) 1. Business Services 58,200 2. Education and Knowledge Creation 32,000 3. Hospitality and Tourism 37,800 4. Trade (transportation, logistics, distribution) 23,000 5. Financial Services 15,900
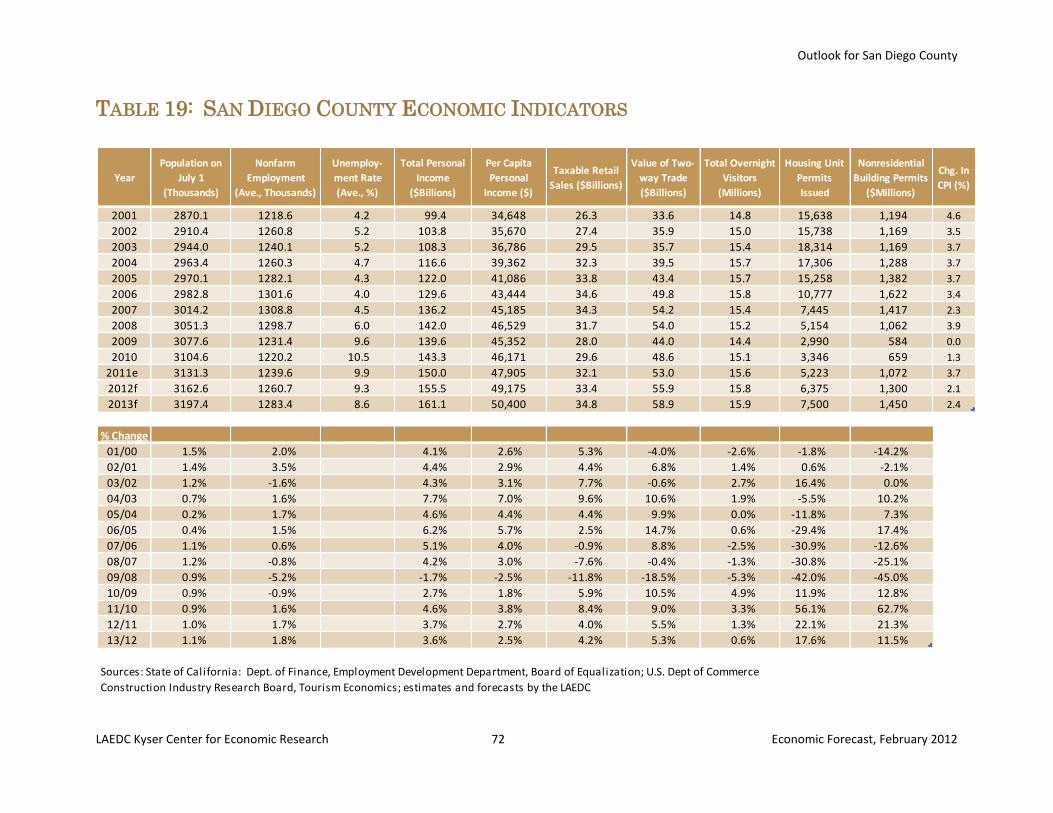
Outlook for San Diego County
LAEDC Kyser Center for Economic Research 72 Economic Forecast, February 2012
Year
Population on
July 1
(Thousands)
Nonfarm
Employment
(Ave., Thousands)
Unemploy-
ment Rate
(Ave., %)
Total Personal
Income
($Billions)
Per Capita
Personal
Income ($)
Taxable Retail
Sales ($Billions)
Value of Two-
way Trade
($Billions)
Total Overnight
Visitors
(Millions)
Housing Unit
Permits
Issued
Nonresidential
Building Permits
($Millions)
Chg. In
CPI (%)
2001 2870.1 1218.6 4.2 99.4 34,648 26.3 33.6 14.8 15,638 1,194 4.6
2002 2910.4 1260.8 5.2 103.8 35,670 27.4 35.9 15.0 15,738 1,169 3.5
2003 2944.0 1240.1 5.2 108.3 36,786 29.5 35.7 15.4 18,314 1,169 3.7
2004 2963.4 1260.3 4.7 116.6 39,362 32.3 39.5 15.7 17,306 1,288 3.7
2005 2970.1 1282.1 4.3 122.0 41,086 33.8 43.4 15.7 15,258 1,382 3.7
2006 2982.8 1301.6 4.0 129.6 43,444 34.6 49.8 15.8 10,777 1,622 3.4
2007 3014.2 1308.8 4.5 136.2 45,185 34.3 54.2 15.4 7,445 1,417 2.3
2008 3051.3 1298.7 6.0 142.0 46,529 31.7 54.0 15.2 5,154 1,062 3.9
2009 3077.6 1231.4 9.6 139.6 45,352 28.0 44.0 14.4 2,990 584 0.0
2010 3104.6 1220.2 10.5 143.3 46,171 29.6 48.6 15.1 3,346 659 1.3
2011e 3131.3 1239.6 9.9 150.0 47,905 32.1 53.0 15.6 5,223 1,072 3.7
2012f 3162.6 1260.7 9.3 155.5 49,175 33.4 55.9 15.8 6,375 1,300 2.1
2013f 3197.4 1283.4 8.6 161.1 50,400 34.8 58.9 15.9 7,500 1,450 2.4
% Change Column1 Column2 Column3 Column4 Column5 Column6 Column7 Column8 Column9 Column10
01/00 1.5% 2.0% 4.1% 2.6% 5.3% -4.0% -2.6% -1.8% -14.2%
02/01 1.4% 3.5% 4.4% 2.9% 4.4% 6.8% 1.4% 0.6% -2.1%
03/02 1.2% -1.6% 4.3% 3.1% 7.7% -0.6% 2.7% 16.4% 0.0%
04/03 0.7% 1.6% 7.7% 7.0% 9.6% 10.6% 1.9% -5.5% 10.2%
05/04 0.2% 1.7% 4.6% 4.4% 4.4% 9.9% 0.0% -11.8% 7.3%
06/05 0.4% 1.5% 6.2% 5.7% 2.5% 14.7% 0.6% -29.4% 17.4%
07/06 1.1% 0.6% 5.1% 4.0% -0.9% 8.8% -2.5% -30.9% -12.6%
08/07 1.2% -0.8% 4.2% 3.0% -7.6% -0.4% -1.3% -30.8% -25.1%
09/08 0.9% -5.2% -1.7% -2.5% -11.8% -18.5% -5.3% -42.0% -45.0%
10/09 0.9% -0.9% 2.7% 1.8% 5.9% 10.5% 4.9% 11.9% 12.8%
11/10 0.9% 1.6% 4.6% 3.8% 8.4% 9.0% 3.3% 56.1% 62.7%
12/11 1.0% 1.7% 3.7% 2.7% 4.0% 5.5% 1.3% 22.1% 21.3%
13/12 1.1% 1.8% 3.6% 2.5% 4.2% 5.3% 0.6% 17.6% 11.5%
Sources: State of California: Dept. of Finance, Employment Development Department, Board of Equalization; U.S. Dept of Commerce
Construction Industry Research Board, Tourism Economics; estimates and forecasts by the LAEDC
TABLE 19: SAN DIEGO COUNTY ECONOMIC INDICATORS
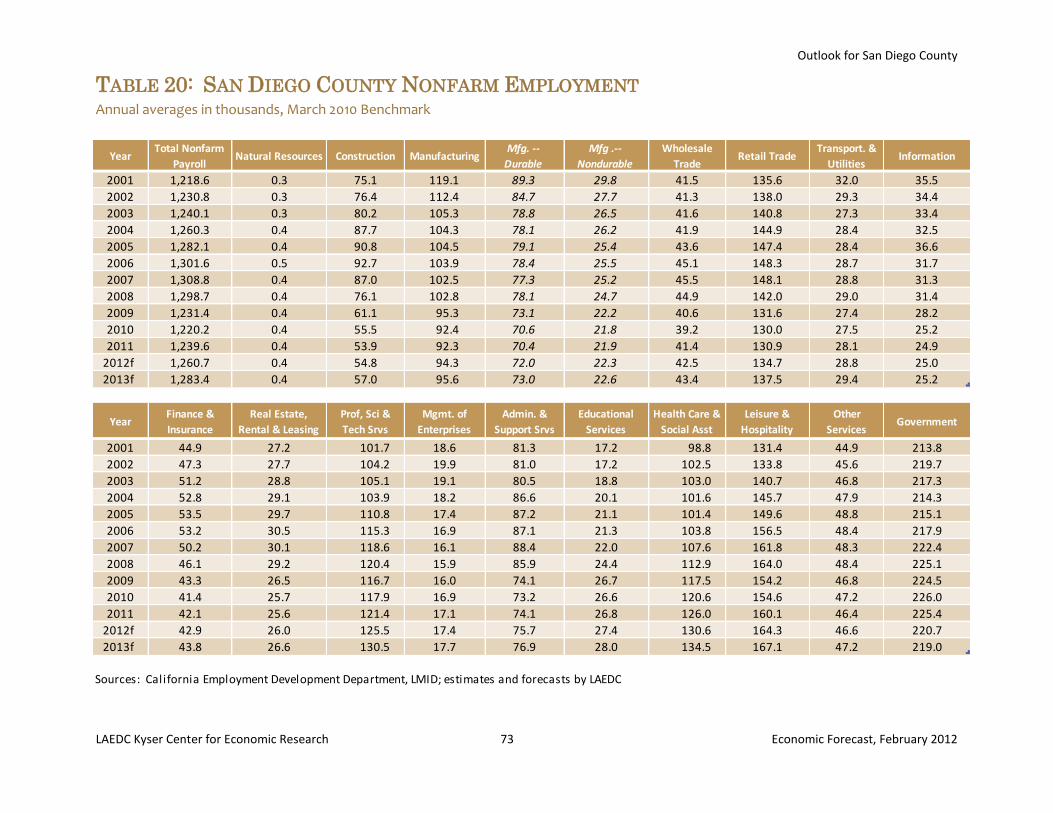
Outlook for San Diego County
LAEDC Kyser Center for Economic Research 73 Economic Forecast, February 2012
YearTotal Nonfarm
PayrollNatural Resources Construction Manufacturing
Mfg. --
Durable
Mfg .--
Nondurable
Wholesale
TradeRetail Trade
Transport. &
UtilitiesInformation
2001 1,218.6 0.3 75.1 119.1 89.3 29.8 41.5 135.6 32.0 35.5
2002 1,230.8 0.3 76.4 112.4 84.7 27.7 41.3 138.0 29.3 34.4
2003 1,240.1 0.3 80.2 105.3 78.8 26.5 41.6 140.8 27.3 33.4
2004 1,260.3 0.4 87.7 104.3 78.1 26.2 41.9 144.9 28.4 32.5
2005 1,282.1 0.4 90.8 104.5 79.1 25.4 43.6 147.4 28.4 36.6
2006 1,301.6 0.5 92.7 103.9 78.4 25.5 45.1 148.3 28.7 31.7
2007 1,308.8 0.4 87.0 102.5 77.3 25.2 45.5 148.1 28.8 31.3
2008 1,298.7 0.4 76.1 102.8 78.1 24.7 44.9 142.0 29.0 31.4
2009 1,231.4 0.4 61.1 95.3 73.1 22.2 40.6 131.6 27.4 28.2
2010 1,220.2 0.4 55.5 92.4 70.6 21.8 39.2 130.0 27.5 25.2
2011 1,239.6 0.4 53.9 92.3 70.4 21.9 41.4 130.9 28.1 24.9
2012f 1,260.7 0.4 54.8 94.3 72.0 22.3 42.5 134.7 28.8 25.0
2013f 1,283.4 0.4 57.0 95.6 73.0 22.6 43.4 137.5 29.4 25.2
YearFinance &
Insurance
Real Estate,
Rental & Leasing
Prof, Sci &
Tech Srvs
Mgmt. of
Enterprises
Admin. &
Support Srvs
Educational
Services
Health Care &
Social Asst
Leisure &
Hospitality
Other
ServicesGovernment
2001 44.9 27.2 101.7 18.6 81.3 17.2 98.8 131.4 44.9 213.8
2002 47.3 27.7 104.2 19.9 81.0 17.2 102.5 133.8 45.6 219.7
2003 51.2 28.8 105.1 19.1 80.5 18.8 103.0 140.7 46.8 217.3
2004 52.8 29.1 103.9 18.2 86.6 20.1 101.6 145.7 47.9 214.3
2005 53.5 29.7 110.8 17.4 87.2 21.1 101.4 149.6 48.8 215.1
2006 53.2 30.5 115.3 16.9 87.1 21.3 103.8 156.5 48.4 217.9
2007 50.2 30.1 118.6 16.1 88.4 22.0 107.6 161.8 48.3 222.4
2008 46.1 29.2 120.4 15.9 85.9 24.4 112.9 164.0 48.4 225.1
2009 43.3 26.5 116.7 16.0 74.1 26.7 117.5 154.2 46.8 224.5
2010 41.4 25.7 117.9 16.9 73.2 26.6 120.6 154.6 47.2 226.0
2011 42.1 25.6 121.4 17.1 74.1 26.8 126.0 160.1 46.4 225.4
2012f 42.9 26.0 125.5 17.4 75.7 27.4 130.6 164.3 46.6 220.7
2013f 43.8 26.6 130.5 17.7 76.9 28.0 134.5 167.1 47.2 219.0
Sources: California Employment Development Department, LMID; estimates and forecasts by LAEDC
TABLE 20: SAN DIEGO COUNTY NONFARM EMPLOYMENT Annual averages in thousands, March 2010 Benchmark
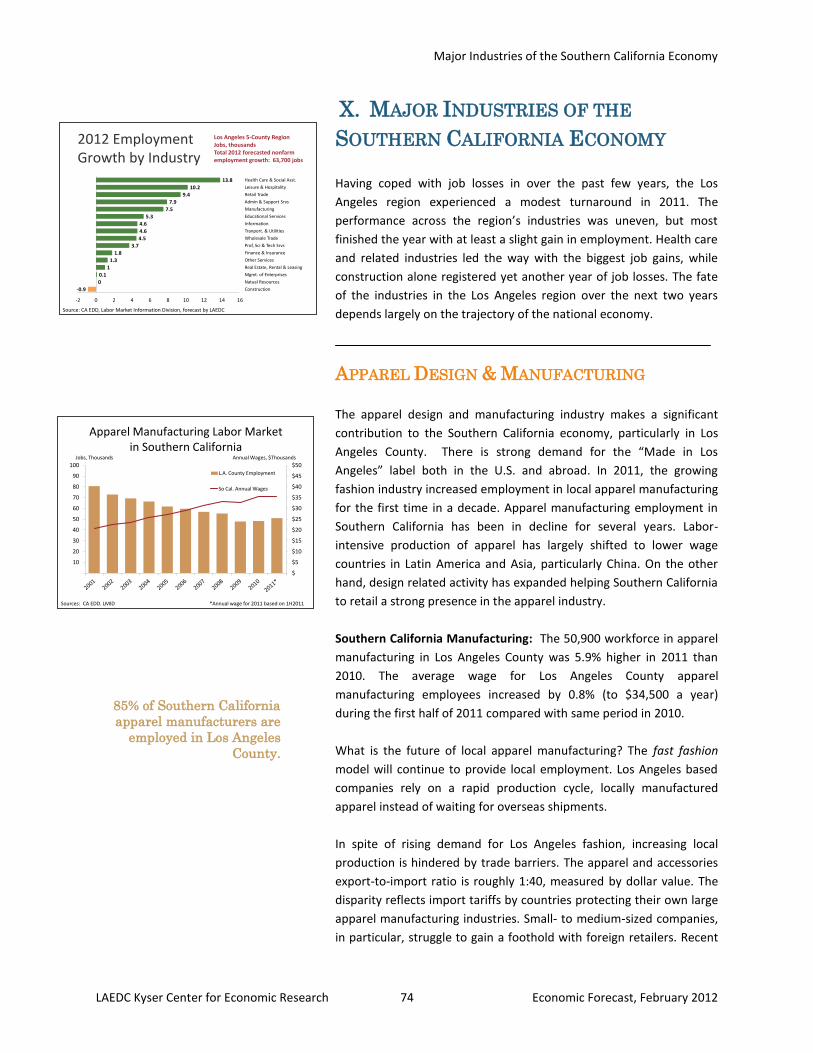
Major Industries of the Southern California Economy
LAEDC Kyser Center for Economic Research 74 Economic Forecast, February 2012
Apparel Manufacturing Labor Market in Southern California
Sources: CA EDD. LMID
$
$5
$10
$15
$20
$25
$30
$35
$40
$45
$50
10
20
30
40
50
60
70
80
90
100L.A. County Employment
So Cal. Annual Wages
Jobs, Thousands Annual Wages, $Thousands
*Annual wage for 2011 based on 1H2011
2012 Employment Growth by Industry
-0.9
0
0.1
1
1.3
1.8
3.7
4.5
4.6
4.6
5.3
7.5
7.9
9.4
10.2
13.8
-2 0 2 4 6 8 10 12 14 16
Construction
Natual Resources
Mgmt. of Enterprises
Real Estate, Rental & Leasing
Other Services
Finance & Insurance
Prof, Sci & Tech Srvs
Wholesale Trade
Tranport. & Utilities
Information
Educational Services
Manufacturing
Admin & Support Srvs
Retail Trade
Leisure & Hospitality
Health Care & Social Asst.
Los Angeles 5-County RegionJobs, thousandsTotal 2012 forecasted nonfarm employment growth: 63,700 jobs
Source: CA EDD, Labor Market Information Division, forecast by LAEDC
X. MAJOR INDUSTRIES OF THE
SOUTHERN CALIFORNIA ECONOMY
Having coped with job losses in over the past few years, the Los
Angeles region experienced a modest turnaround in 2011. The
performance across the region’s industries was uneven, but most
finished the year with at least a slight gain in employment. Health care
and related industries led the way with the biggest job gains, while
construction alone registered yet another year of job losses. The fate
of the industries in the Los Angeles region over the next two years
depends largely on the trajectory of the national economy.
APPAREL DESIGN & MANUFACTURING
The apparel design and manufacturing industry makes a significant
contribution to the Southern California economy, particularly in Los
Angeles County. There is strong demand for the “Made in Los
Angeles” label both in the U.S. and abroad. In 2011, the growing
fashion industry increased employment in local apparel manufacturing
for the first time in a decade. Apparel manufacturing employment in
Southern California has been in decline for several years. Labor-
intensive production of apparel has largely shifted to lower wage
countries in Latin America and Asia, particularly China. On the other
hand, design related activity has expanded helping Southern California
to retail a strong presence in the apparel industry.
Southern California Manufacturing: The 50,900 workforce in apparel
manufacturing in Los Angeles County was 5.9% higher in 2011 than
2010. The average wage for Los Angeles County apparel
manufacturing employees increased by 0.8% (to $34,500 a year)
during the first half of 2011 compared with same period in 2010.
What is the future of local apparel manufacturing? The fast fashion
model will continue to provide local employment. Los Angeles based
companies rely on a rapid production cycle, locally manufactured
apparel instead of waiting for overseas shipments.
In spite of rising demand for Los Angeles fashion, increasing local
production is hindered by trade barriers. The apparel and accessories
export-to-import ratio is roughly 1:40, measured by dollar value. The
disparity reflects import tariffs by countries protecting their own large
apparel manufacturing industries. Small- to medium-sized companies,
in particular, struggle to gain a foothold with foreign retailers. Recent
85% of Southern California
apparel manufacturers are
employed in Los Angeles
County.
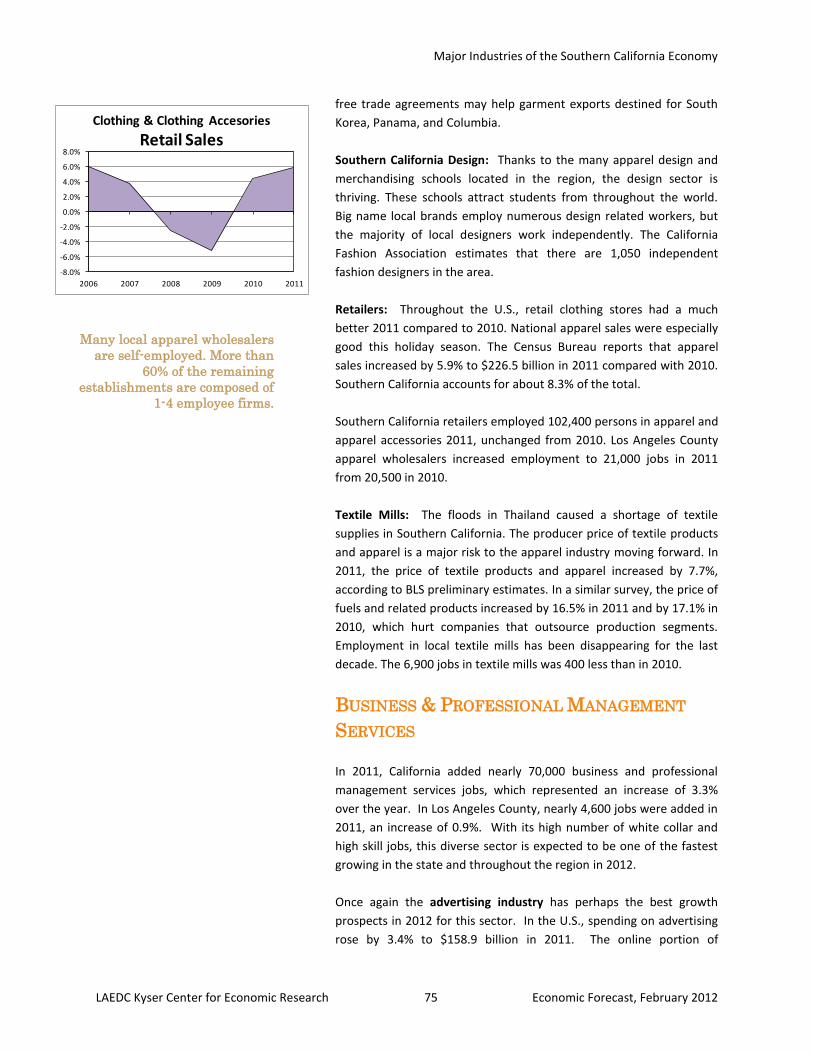
Major Industries of the Southern California Economy
LAEDC Kyser Center for Economic Research 75 Economic Forecast, February 2012
-8.0%
-6.0%
-4.0%
-2.0%
0.0%
2.0%
4.0%
6.0%
8.0%
2006 2007 2008 2009 2010 2011
Clothing & Clothing Accesories
Retail Sales
free trade agreements may help garment exports destined for South
Korea, Panama, and Columbia.
Southern California Design: Thanks to the many apparel design and
merchandising schools located in the region, the design sector is
thriving. These schools attract students from throughout the world.
Big name local brands employ numerous design related workers, but
the majority of local designers work independently. The California
Fashion Association estimates that there are 1,050 independent
fashion designers in the area.
Retailers: Throughout the U.S., retail clothing stores had a much
better 2011 compared to 2010. National apparel sales were especially
good this holiday season. The Census Bureau reports that apparel
sales increased by 5.9% to $226.5 billion in 2011 compared with 2010.
Southern California accounts for about 8.3% of the total.
Southern California retailers employed 102,400 persons in apparel and
apparel accessories 2011, unchanged from 2010. Los Angeles County
apparel wholesalers increased employment to 21,000 jobs in 2011
from 20,500 in 2010.
Textile Mills: The floods in Thailand caused a shortage of textile
supplies in Southern California. The producer price of textile products
and apparel is a major risk to the apparel industry moving forward. In
2011, the price of textile products and apparel increased by 7.7%,
according to BLS preliminary estimates. In a similar survey, the price of
fuels and related products increased by 16.5% in 2011 and by 17.1% in
2010, which hurt companies that outsource production segments.
Employment in local textile mills has been disappearing for the last
decade. The 6,900 jobs in textile mills was 400 less than in 2010.
BUSINESS & PROFESSIONAL MANAGEMENT
SERVICES
In 2011, California added nearly 70,000 business and professional
management services jobs, which represented an increase of 3.3%
over the year. In Los Angeles County, nearly 4,600 jobs were added in
2011, an increase of 0.9%. With its high number of white collar and
high skill jobs, this diverse sector is expected to be one of the fastest
growing in the state and throughout the region in 2012.
Once again the advertising industry has perhaps the best growth
prospects in 2012 for this sector. In the U.S., spending on advertising
rose by 3.4% to $158.9 billion in 2011. The online portion of
Many local apparel wholesalers
are self-employed. More than
60% of the remaining
establishments are composed of
1-4 employee firms.
Major Industries of the Southern California Economy
LAEDC Kyser Center for Economic Research 76 Economic Forecast, February 2012
advertising in the U.S. grew at an even faster rate, increasing by 23%
to $32 billion in 2011. Increasingly, more money is being directed to
online advertising because of the growing amount of time consumers
are spending with digital platforms. The Internet is also a more
measurable medium than traditional print and TV advertising. Total
ad spending across all media in the U.S. is forecast to increase in 2012
by 6.7% to $169.5 billion.9
The summer Olympics and the U.S. Presidential election will provide a
boost to ad expenditures this year. Many corporations have built up
large cash reserves and will be investing a portion of those reserves in
advertising to stimulate consumer demand and build market share.
Much of the growth in the advertising industry will depend on
increases in consumer spending.
Mergers and acquisitions (M&A) activity is growing increasingly
contentious and legally complex. After a promising start last year,
deal activity fell during the second half of 2011 by 23.9%. Over the
year, deal volume was down by more than 19.0% while values plunged
by 35%.10
Volatile markets and depressed stock prices took a toll on
the number of transactions. Deals took longer to complete, especially
in industries like telecommunications which are subject to heavy
regulatory scrutiny. The financial industry was also hit hard in terms
of deal volume. Regulatory and compliance concerns more than ever
must be factored in to deal-making. Private equity deals, the one
bright spot last year, stepped up both in terms of volume and the
value of deals completed in 2011 versus 2010.
As to 2012, there is still an appetite for growth among companies with
strong cash reserves and untapped capital to expend. Mergers and
acquisitions activity will likely rebound once market volatility subsides.
M&A activity benefits everyone needed to complete a deal:
accountants, lawyers, investment bankers, advisors and consultants
(strategic, valuation, etc.).
Commercial real estate in major metro areas is beginning to improve.
There is still little activity on the new construction front, but
buying/selling activity for Class A properties is on the upswing. That
benefits agents, brokers, lawyers, title companies – anyone involved in
the mechanics of property transfer. Additionally, there is still a
substantial amount of work to be done by firms handling property
workouts or foreclosures.
9 www.eMarketer.com
10 The Gloves are Off, Thomson Reuters (January 26, 2012)
Major Industries of the Southern California Economy
LAEDC Kyser Center for Economic Research 77 Economic Forecast, February 2012
Business conditions at architectural firms are improving in most
regions of the U.S. December 2011 marked the second straight month
that the AIA’s architecture Billings Index increased. This was the first
back-to-back gain since February-March 2011. However, the
December index indicated the billings figures for the Western region
(which includes California) were still too weak to generate growth.
Nationwide, most major construction sectors are reporting gains.
Firms specializing in residential, commercial/industrial, and
institutional projects all reported gains in December. Activity levels
will remain volatile during 2012, but cautious optimism is making its
way back into architectural firms’ outlook.
FINANCIAL SERVICES
Many segments of the financial services industry were hard hit by the
mortgage meltdown and broader financial crisis that accompanied the
Great Recession. Across the state, the industry lost more than 160,000
jobs over four successive years before eking out a slight gain in 2011.
But the industry still has some distance to travel before it is fully on
the mend.
Financial institutions with large real estate exposure continue to work
through loan delinquencies and foreclosures. On the residential side,
the number of foreclosures and short sales has probably peaked, but
the distressed sale pipeline will be full for at least two more years. As
economic and housing market conditions improve this year and next,
both the number of underwater properties and the number of
delinquencies will even out and decline. Moreover, since tighter
underwriting standards have been in place for a number of years, the
number of new delinquencies in the coming years should likely
decline, and banks should begin to see the light at the end of the
tunnel.
Financial institutions still face legal and regulatory hurdles in the years
ahead. As of this writing, government officials and five major banks
reached an agreement valued at $26 billion to settle alleged
foreclosure abuses by lenders. Other lawsuits and legal battles
stemming from their lending and investing practices before, during,
and after the financial crisis may still be forthcoming. They must also
implement measures to comply with financial and consumer
protection regulations that passed in 2010.
The future of Fannie Mae and Freddie Mac is still uncertain, and
Congress is unlikely to act substantively on this matter until 2013,
Major Industries of the Southern California Economy
LAEDC Kyser Center for Economic Research 78 Economic Forecast, February 2012
after the November election passed. Once Congress takes action,
actual changes to government’s role in real estate finance will take
years to implement.
In sum, these legal and regulatory developments may affect the
financial industry’s willingness and ability to provide more liquidity to
businesses and households as the overall economy improves.
HEALTH SERVICES
The Health Services industry is one of the leading segments of the
Southern California economy. Anchored by leading medical facilities
through the region, the industry accounts for 10% of regional jobs.
Healthcare services added jobs during the course of the recession, and
should see job gains continue this year and next. This trend will be
driven by demographics, notably continued population growth, longer
life expectancy, and increasing numbers of older Southern California
residents. One also expects more households to have a greater ability
to afford insurance and medical treatment as their finances improve
along with the performance of the economy.
In response to growing healthcare needs, several institutions have
expanded their facilities or have plans to do so:
Los Angeles County: Long Beach Children’s Hospital
Orange County: Kaiser Permanente, St. Jude Medical Center, and
Children’s Hospital Orange County in Orange County
Ventura County: Ventura County Medical Center
San Diego: Sharp Healthcare, Scripps Health and Kaiser
Permanente
In addition to providing treatment, several medical research
institutions are located in the region. Medical research and production
of medical instruments and pharmaceuticals are also an important
source of economic growth.
Employment in the health services industry of Southern California is
expected to see job growth accelerate from 2.0% in 2011 to 2.7% in
2012, with an additional 2.3% increase in 2013.
INTERNATIONAL TRADE/GOODS MOVEMENT
International trade has played a critical role in our regional economy’s
recovery over the past two years. In fact, international trade related
employment has rebounded strongly since 2009 starting at the local
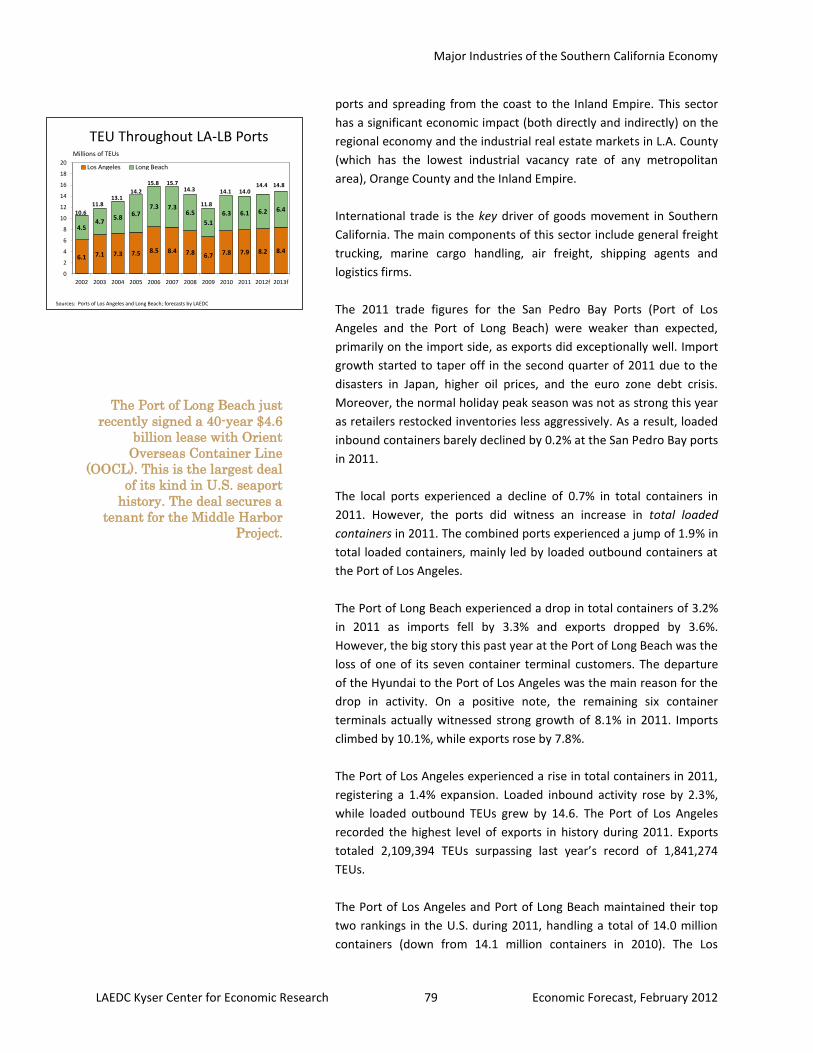
Major Industries of the Southern California Economy
LAEDC Kyser Center for Economic Research 79 Economic Forecast, February 2012
6.1 7.1 7.3 7.5 8.5 8.4 7.8 6.7 7.8 7.9 8.2 8.4
4.54.7
5.86.7
7.3 7.36.5
5.1
6.3 6.1 6.2 6.4
0
2
4
6
8
10
12
14
16
18
20
2002 2003 2004 2005 2006 2007 2008 2009 2010 2011 2012f 2013f
Los Angeles Long Beach
14.014.4 14.8
Millions of TEUs
14.3
10.6
11.813.1
14.2
15.8 15.7
11.8
14.1
TEU Throughout LA-LB Ports
Sources: Ports of Los Angeles and Long Beach; forecasts by LAEDC
ports and spreading from the coast to the Inland Empire. This sector
has a significant economic impact (both directly and indirectly) on the
regional economy and the industrial real estate markets in L.A. County
(which has the lowest industrial vacancy rate of any metropolitan
area), Orange County and the Inland Empire.
International trade is the key driver of goods movement in Southern
California. The main components of this sector include general freight
trucking, marine cargo handling, air freight, shipping agents and
logistics firms.
The 2011 trade figures for the San Pedro Bay Ports (Port of Los
Angeles and the Port of Long Beach) were weaker than expected,
primarily on the import side, as exports did exceptionally well. Import
growth started to taper off in the second quarter of 2011 due to the
disasters in Japan, higher oil prices, and the euro zone debt crisis.
Moreover, the normal holiday peak season was not as strong this year
as retailers restocked inventories less aggressively. As a result, loaded
inbound containers barely declined by 0.2% at the San Pedro Bay ports
in 2011.
The local ports experienced a decline of 0.7% in total containers in
2011. However, the ports did witness an increase in total loaded
containers in 2011. The combined ports experienced a jump of 1.9% in
total loaded containers, mainly led by loaded outbound containers at
the Port of Los Angeles.
The Port of Long Beach experienced a drop in total containers of 3.2%
in 2011 as imports fell by 3.3% and exports dropped by 3.6%.
However, the big story this past year at the Port of Long Beach was the
loss of one of its seven container terminal customers. The departure
of the Hyundai to the Port of Los Angeles was the main reason for the
drop in activity. On a positive note, the remaining six container
terminals actually witnessed strong growth of 8.1% in 2011. Imports
climbed by 10.1%, while exports rose by 7.8%.
The Port of Los Angeles experienced a rise in total containers in 2011,
registering a 1.4% expansion. Loaded inbound activity rose by 2.3%,
while loaded outbound TEUs grew by 14.6. The Port of Los Angeles
recorded the highest level of exports in history during 2011. Exports
totaled 2,109,394 TEUs surpassing last year’s record of 1,841,274
TEUs.
The Port of Los Angeles and Port of Long Beach maintained their top
two rankings in the U.S. during 2011, handling a total of 14.0 million
containers (down from 14.1 million containers in 2010). The Los
The Port of Long Beach just
recently signed a 40-year $4.6
billion lease with Orient
Overseas Container Line
(OOCL). This is the largest deal
of its kind in U.S. seaport
history. The deal secures a
tenant for the Middle Harbor
Project.
Major Industries of the Southern California Economy
LAEDC Kyser Center for Economic Research 80 Economic Forecast, February 2012
Angeles Customs District (LACD) maintained its number one position in
the U.S. in 2011 (through November) with a two-way trade value of
$355 billion. The Port of Los Angeles remained the top port in the
nation with regards to total container traffic with 7.9 million
containers, while the Port of Long Beach maintained its number two
ranking with a total of 6.1 million containers. Through November
2011, the value of total two-way trade had increased by 12.3% on a
year-to-date basis.
The outlook for 2012 is positive as the global recovery continues, but
with many significant risks lingering this year, including the European
sovereign debt crisis, oil prices, and the slowdown in China. The Asian
economies are once again expected to lead the way with higher rates
of growth compared with the economies of Europe and North
America, which bodes well for trade volumes at the local ports.
However, the Asian economies are not projected to see the growth
rates they experienced two years ago or last year as they face lower
exports and high inflation rates. Still, the LACD’s top five trading
partners are all projected to post growth rates of 3% or higher with
the exception of Japan.
The forecast for 2012 calls for an increase in total trade volumes for
both local ports. Total container traffic at the Port of Los Angeles and
the Port of Long Beach is projected to expand in 2012 to 14.4 million
TEUs, an increase of 2.8% and in 2013 to 14.8 million TEUs, also a rise
of 2.8%. Both imports and exports should improve this year with
exports outperforming imports. The expected improvement in trade
will positively impact both ports as well as all the other goods
movement industry players, from the longshoremen’s union to the
independent truck drivers to the railroads.
The Big Questions: For the international trade industry, the two
main questions are: How well will the global economy perform in
2012? When will we see the peak trade volume years of 2006-2007
return?
The pace of global economic recovery will slow in 2012. The recovery
will continue to reflect two different economic stories. The developing
economies (especially in Emerging Asia) will lead the global recovery
(albeit at a much slower pace than in the last two years), while the
advanced economies will see modest improvements in GDP growth
and some will fall into recession (i.e. Europe). The growth in Emerging
Asia bodes well for trade volumes at our local ports. Overall, the
results for 2012 should be healthy as growth will exceed 2011 levels.
The answer to the second question has become more difficult to
answer after last year’s somewhat disappointing performance. Trade
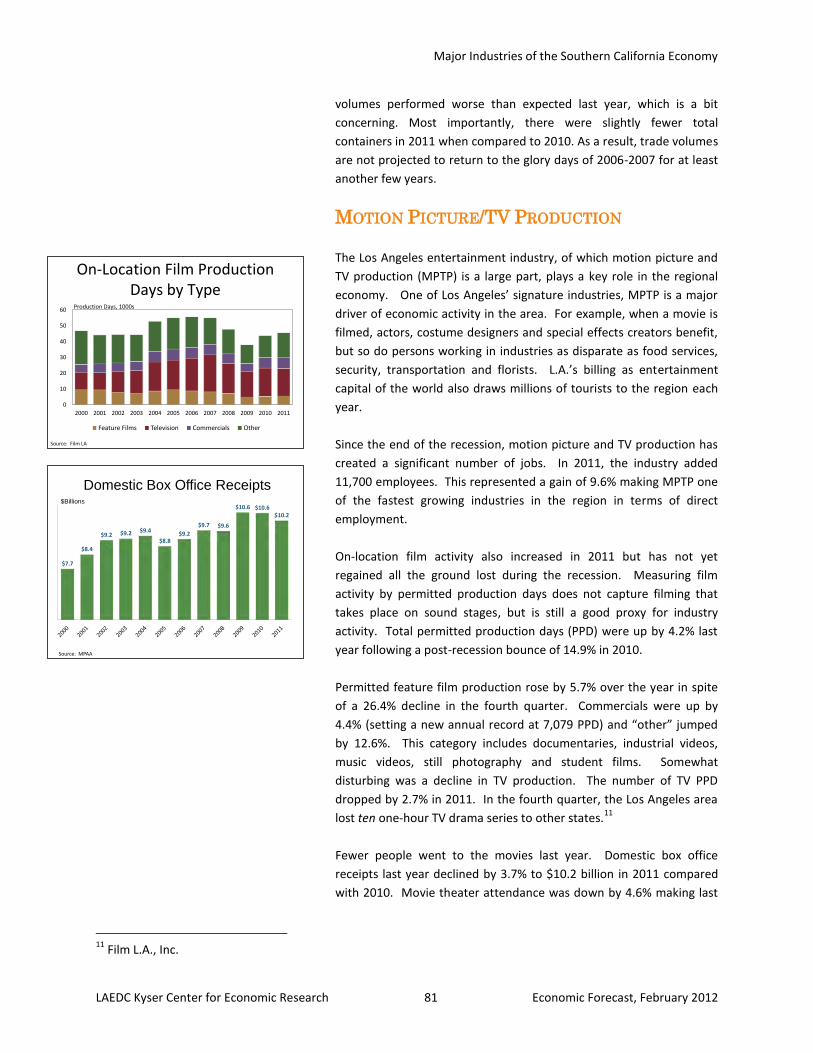
Major Industries of the Southern California Economy
LAEDC Kyser Center for Economic Research 81 Economic Forecast, February 2012
$7.7
$8.4
$9.2 $9.2 $9.4
$8.8$9.2
$9.7 $9.6
$10.6 $10.6$10.2
Domestic Box Office Receipts$Billions
Source: MPAA
On-Location Film Production Days by Type
0
10
20
30
40
50
60
2000 2001 2002 2003 2004 2005 2006 2007 2008 2009 2010 2011
Feature Films Television Commercials Other
Production Days, 1000s
Source: Film LA
volumes performed worse than expected last year, which is a bit
concerning. Most importantly, there were slightly fewer total
containers in 2011 when compared to 2010. As a result, trade volumes
are not projected to return to the glory days of 2006-2007 for at least
another few years.
MOTION PICTURE/TV PRODUCTION
The Los Angeles entertainment industry, of which motion picture and
TV production (MPTP) is a large part, plays a key role in the regional
economy. One of Los Angeles’ signature industries, MPTP is a major
driver of economic activity in the area. For example, when a movie is
filmed, actors, costume designers and special effects creators benefit,
but so do persons working in industries as disparate as food services,
security, transportation and florists. L.A.’s billing as entertainment
capital of the world also draws millions of tourists to the region each
year.
Since the end of the recession, motion picture and TV production has
created a significant number of jobs. In 2011, the industry added
11,700 employees. This represented a gain of 9.6% making MPTP one
of the fastest growing industries in the region in terms of direct
employment.
On-location film activity also increased in 2011 but has not yet
regained all the ground lost during the recession. Measuring film
activity by permitted production days does not capture filming that
takes place on sound stages, but is still a good proxy for industry
activity. Total permitted production days (PPD) were up by 4.2% last
year following a post-recession bounce of 14.9% in 2010.
Permitted feature film production rose by 5.7% over the year in spite
of a 26.4% decline in the fourth quarter. Commercials were up by
4.4% (setting a new annual record at 7,079 PPD) and “other” jumped
by 12.6%. This category includes documentaries, industrial videos,
music videos, still photography and student films. Somewhat
disturbing was a decline in TV production. The number of TV PPD
dropped by 2.7% in 2011. In the fourth quarter, the Los Angeles area
lost ten one-hour TV drama series to other states.11
Fewer people went to the movies last year. Domestic box office
receipts last year declined by 3.7% to $10.2 billion in 2011 compared
with 2010. Movie theater attendance was down by 4.6% making last
11
Film L.A., Inc.
Major Industries of the Southern California Economy
LAEDC Kyser Center for Economic Research 82 Economic Forecast, February 2012
year’s movie audience the smallest since 1995, while the average price
of a ticket edged up by 0.9% to $7.96.12
Although 2011 saw employment numbers rebound to a ten-year high,
the entertainment industry continued to grapple with a number of
complex issues that took root prior to the onset of the recession.
Foremost is the role of new technologies that have changed how
people consume entertainment. Related to this development is the
issue of protecting intellectual property rights and stemming the flow
of illegally downloaded media. There is also debate surrounding
California’s film tax credit and the outflow of movie and TV production
from the region.
For consumers of entertainment media, connectivity is critical. Newly
connected PCs, Blue-ray players and other network devices using Wi-Fi
technology have dramatically changed how consumers access
entertainment. The challenge is how to deal with rapidly changing
consumer preferences and shorter product life-cycles. Consumer
spending on home entertainment was down by 2% in 2011, the
seventh consecutive annual decline.13
Recent attempts by Hollywood
to keep people buying movies as they ditch DVD discs in favor of
Internet-connected TVs, smartphones and tablets were slow in coming
and have gotten off to a rocky start. The recent launch of Ultra Violet
is one example. The service was jointly developed by movie studios,
electronics makers and retailers to build an “ecosystem” for buying
and watching movies across multiple platforms. Some early adopters
reported that the service was “confusing and buggy”. Still, Ultra
Violet represents an important step forward for the industry.
The issue of how much people are willing to pay and how to charge for
content across multiple platforms is a contentious one. Piracy and
illegal file sharing are an ongoing threat to the industry. Media
companies have had some success cracking down on file sharing
outfits. Financial losses are hard to quantify but it is safe to say
foregone revenues are substantial. The recent showdown between
entertainment companies and Internet providers over the Stop Online
Piracy Act (SOPA) was a clear demonstration of the competing
interests and complexity involved in tackling this problem.
The outward migration of film production has slowed due to the
state’s program of film tax credits, which took effect in 2009. The
state has allocated $100 million annually beginning fiscal year 2009-
2010 through fiscal year 2013-2014. The program provides a 20% to
12
Box Office Mojo 13
Digital Entertainment Group
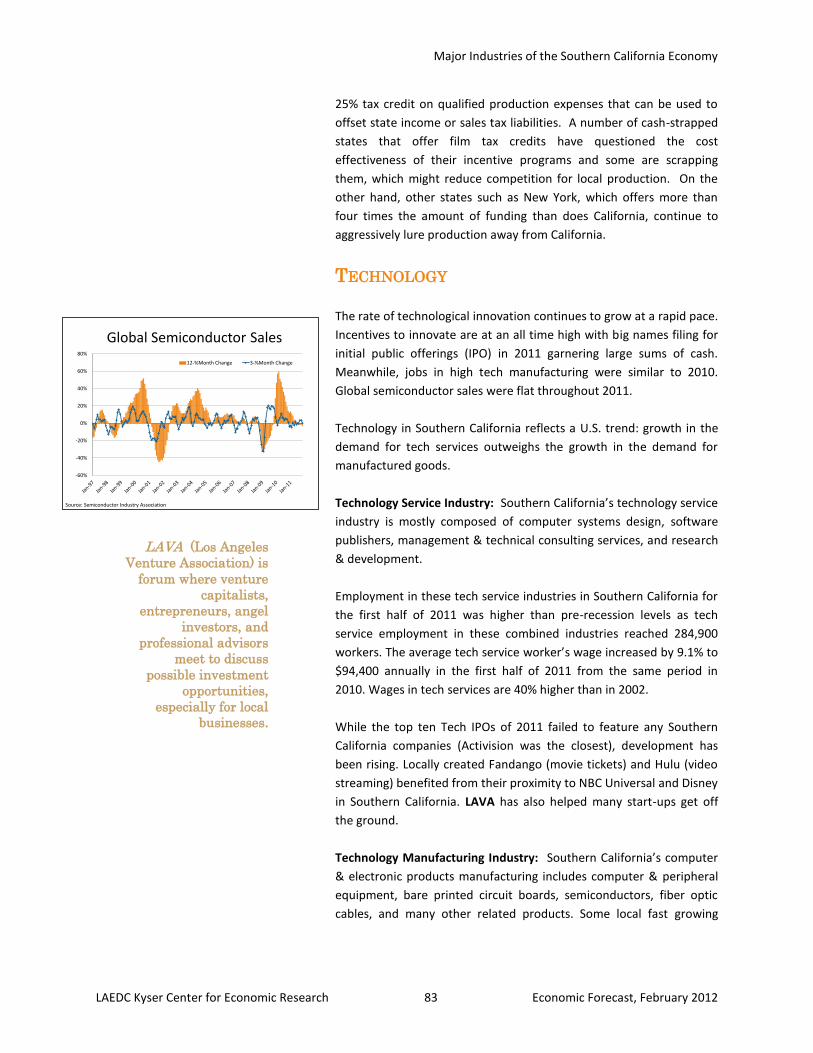
Major Industries of the Southern California Economy
LAEDC Kyser Center for Economic Research 83 Economic Forecast, February 2012
Source: Semiconductor Industry Association
Global Semiconductor Sales
-60%
-40%
-20%
0%
20%
40%
60%
80%
12-%Month Change 3-%Month Change
25% tax credit on qualified production expenses that can be used to
offset state income or sales tax liabilities. A number of cash-strapped
states that offer film tax credits have questioned the cost
effectiveness of their incentive programs and some are scrapping
them, which might reduce competition for local production. On the
other hand, other states such as New York, which offers more than
four times the amount of funding than does California, continue to
aggressively lure production away from California.
TECHNOLOGY
The rate of technological innovation continues to grow at a rapid pace.
Incentives to innovate are at an all time high with big names filing for
initial public offerings (IPO) in 2011 garnering large sums of cash.
Meanwhile, jobs in high tech manufacturing were similar to 2010.
Global semiconductor sales were flat throughout 2011.
Technology in Southern California reflects a U.S. trend: growth in the
demand for tech services outweighs the growth in the demand for
manufactured goods.
Technology Service Industry: Southern California’s technology service
industry is mostly composed of computer systems design, software
publishers, management & technical consulting services, and research
& development.
Employment in these tech service industries in Southern California for
the first half of 2011 was higher than pre-recession levels as tech
service employment in these combined industries reached 284,900
workers. The average tech service worker’s wage increased by 9.1% to
$94,400 annually in the first half of 2011 from the same period in
2010. Wages in tech services are 40% higher than in 2002.
While the top ten Tech IPOs of 2011 failed to feature any Southern
California companies (Activision was the closest), development has
been rising. Locally created Fandango (movie tickets) and Hulu (video
streaming) benefited from their proximity to NBC Universal and Disney
in Southern California. LAVA has also helped many start-ups get off
the ground.
Technology Manufacturing Industry: Southern California’s computer
& electronic products manufacturing includes computer & peripheral
equipment, bare printed circuit boards, semiconductors, fiber optic
cables, and many other related products. Some local fast growing
LAVA (Los Angeles
Venture Association) is
forum where venture
capitalists,
entrepreneurs, angel
investors, and
professional advisors
meet to discuss
possible investment
opportunities,
especially for local
businesses.
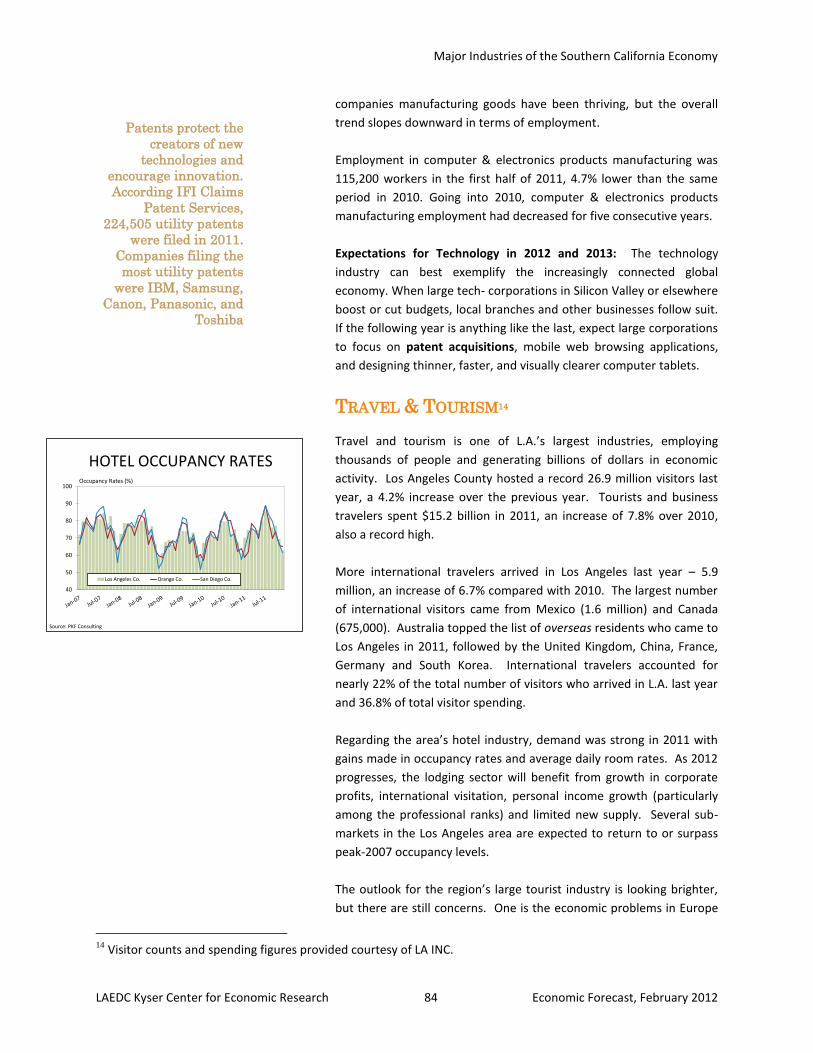
Major Industries of the Southern California Economy
LAEDC Kyser Center for Economic Research 84 Economic Forecast, February 2012
HOTEL OCCUPANCY RATES
Source: PKF Consulting
Occupancy Rates (%)
40
50
60
70
80
90
100
Los Angeles Co. Orange Co. San Diego Co.
companies manufacturing goods have been thriving, but the overall
trend slopes downward in terms of employment.
Employment in computer & electronics products manufacturing was
115,200 workers in the first half of 2011, 4.7% lower than the same
period in 2010. Going into 2010, computer & electronics products
manufacturing employment had decreased for five consecutive years.
Expectations for Technology in 2012 and 2013: The technology
industry can best exemplify the increasingly connected global
economy. When large tech- corporations in Silicon Valley or elsewhere
boost or cut budgets, local branches and other businesses follow suit.
If the following year is anything like the last, expect large corporations
to focus on patent acquisitions, mobile web browsing applications,
and designing thinner, faster, and visually clearer computer tablets.
TRAVEL & TOURISM14 Travel and tourism is one of L.A.’s largest industries, employing
thousands of people and generating billions of dollars in economic
activity. Los Angeles County hosted a record 26.9 million visitors last
year, a 4.2% increase over the previous year. Tourists and business
travelers spent $15.2 billion in 2011, an increase of 7.8% over 2010,
also a record high.
More international travelers arrived in Los Angeles last year – 5.9
million, an increase of 6.7% compared with 2010. The largest number
of international visitors came from Mexico (1.6 million) and Canada
(675,000). Australia topped the list of overseas residents who came to
Los Angeles in 2011, followed by the United Kingdom, China, France,
Germany and South Korea. International travelers accounted for
nearly 22% of the total number of visitors who arrived in L.A. last year
and 36.8% of total visitor spending.
Regarding the area’s hotel industry, demand was strong in 2011 with
gains made in occupancy rates and average daily room rates. As 2012
progresses, the lodging sector will benefit from growth in corporate
profits, international visitation, personal income growth (particularly
among the professional ranks) and limited new supply. Several sub-
markets in the Los Angeles area are expected to return to or surpass
peak-2007 occupancy levels.
The outlook for the region’s large tourist industry is looking brighter,
but there are still concerns. One is the economic problems in Europe
14
Visitor counts and spending figures provided courtesy of LA INC.
Patents protect the
creators of new
technologies and
encourage innovation.
According IFI Claims
Patent Services,
224,505 utility patents
were filed in 2011.
Companies filing the
most utility patents
were IBM, Samsung,
Canon, Panasonic, and
Toshiba
Major Industries of the Southern California Economy
LAEDC Kyser Center for Economic Research 85 Economic Forecast, February 2012
and the Euro’s decline in value against the U.S. dollar. This could hurt
travel to Southern California from such key markets as Germany, the
UK and France. Slower growth in many emerging economies could
also have a negative impact on the region’s tourism industry. On the
domestic front, although the labor markets are on the mend,
unemployment remains very high – a deterrent to discretionary travel.
Like most industries, the travel and tourism sector is also seeking to
use new technologies to attract consumers and influence their travel
decisions. Meanwhile, consumers are using mobile devices and social
networks to track down the lowest prices and most desirable
amenities siphoning pricing power away from airlines, hotels and
other travel services providers.
Of course there is always competition from other popular travel
destinations in the United States. There are a number of efforts
underway to maintain L.A.’s position as a premier travel destination.
The Tom Bradley International Terminal at LAX is undergoing a major
face lift that will make it more attractive and user friendly for
travelers. Local theme parks opened several new attractions last year
and more are in the works. A number of hotels are renovating and
upgrading their facilities. Los Angeles is also gaining popularity as a
convention destination and new attractions such as the Broad
Contemporary Art Museum are broadening the region’s cultural
appeal.
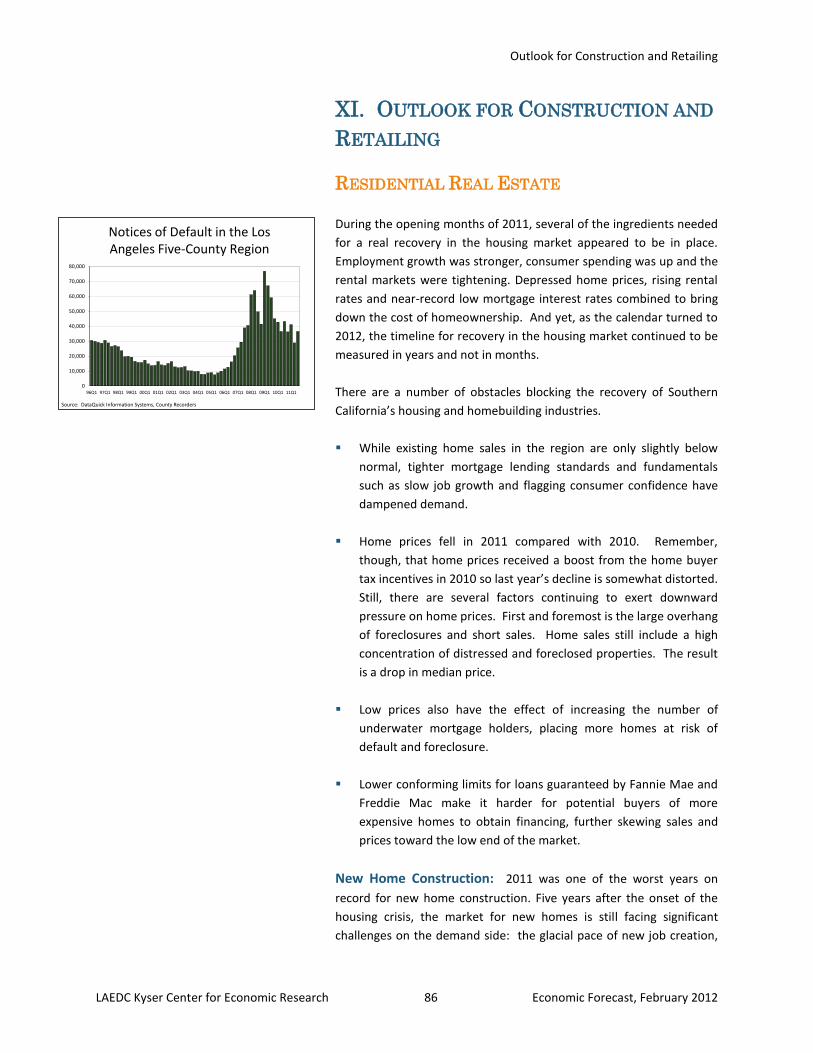
Outlook for Construction and Retailing
LAEDC Kyser Center for Economic Research 86 Economic Forecast, February 2012
Notices of Default in the Los Angeles Five-County Region
Source: DataQuick Information Systems, County Recorders
0
10,000
20,000
30,000
40,000
50,000
60,000
70,000
80,000
96Q1 97Q1 98Q1 99Q1 00Q1 01Q1 02Q1 03Q1 04Q1 05Q1 06Q1 07Q1 08Q1 09Q1 10Q1 11Q1
XI. OUTLOOK FOR CONSTRUCTION AND
RETAILING
RESIDENTIAL REAL ESTATE
During the opening months of 2011, several of the ingredients needed
for a real recovery in the housing market appeared to be in place.
Employment growth was stronger, consumer spending was up and the
rental markets were tightening. Depressed home prices, rising rental
rates and near-record low mortgage interest rates combined to bring
down the cost of homeownership. And yet, as the calendar turned to
2012, the timeline for recovery in the housing market continued to be
measured in years and not in months.
There are a number of obstacles blocking the recovery of Southern
California’s housing and homebuilding industries.
While existing home sales in the region are only slightly below
normal, tighter mortgage lending standards and fundamentals
such as slow job growth and flagging consumer confidence have
dampened demand.
Home prices fell in 2011 compared with 2010. Remember,
though, that home prices received a boost from the home buyer
tax incentives in 2010 so last year’s decline is somewhat distorted.
Still, there are several factors continuing to exert downward
pressure on home prices. First and foremost is the large overhang
of foreclosures and short sales. Home sales still include a high
concentration of distressed and foreclosed properties. The result
is a drop in median price.
Low prices also have the effect of increasing the number of
underwater mortgage holders, placing more homes at risk of
default and foreclosure.
Lower conforming limits for loans guaranteed by Fannie Mae and
Freddie Mac make it harder for potential buyers of more
expensive homes to obtain financing, further skewing sales and
prices toward the low end of the market.
New Home Construction: 2011 was one of the worst years on
record for new home construction. Five years after the onset of the
housing crisis, the market for new homes is still facing significant
challenges on the demand side: the glacial pace of new job creation,
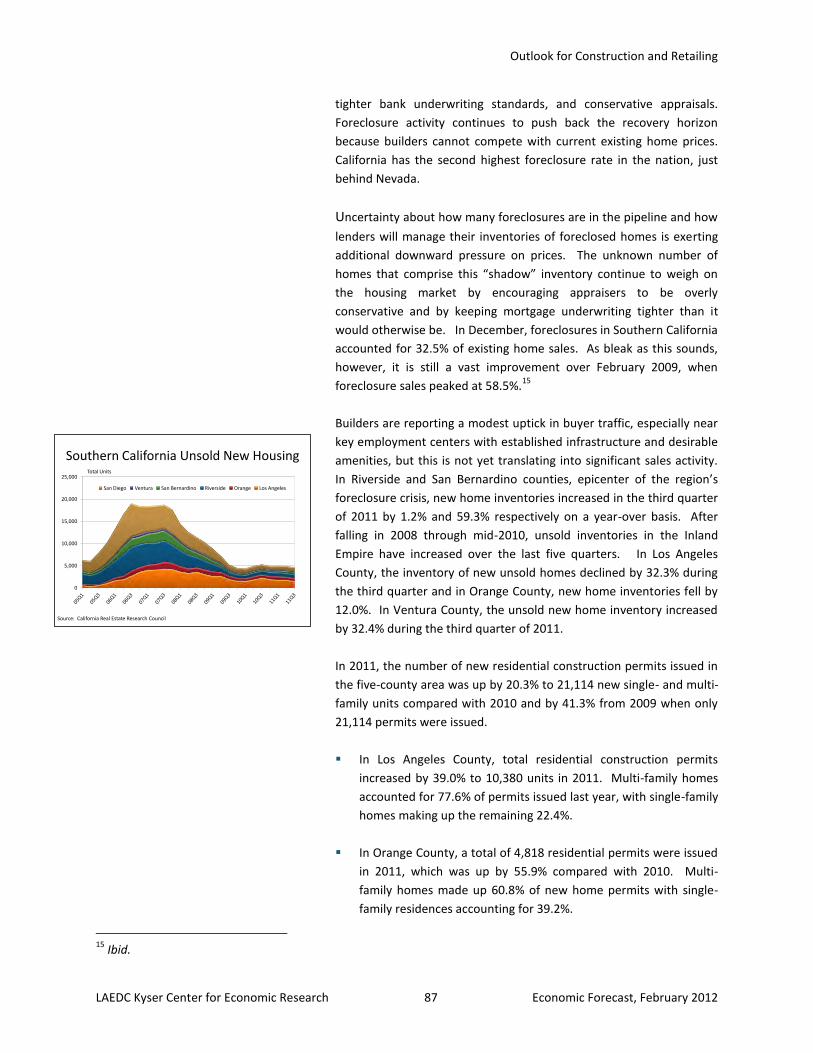
Outlook for Construction and Retailing
LAEDC Kyser Center for Economic Research 87 Economic Forecast, February 2012
0
5,000
10,000
15,000
20,000
25,000
San Diego Ventura San Bernardino Riverside Orange Los Angeles
Southern California Unsold New Housing
Source: California Real Estate Research Council
Total Units
tighter bank underwriting standards, and conservative appraisals.
Foreclosure activity continues to push back the recovery horizon
because builders cannot compete with current existing home prices.
California has the second highest foreclosure rate in the nation, just
behind Nevada.
Uncertainty about how many foreclosures are in the pipeline and how
lenders will manage their inventories of foreclosed homes is exerting
additional downward pressure on prices. The unknown number of
homes that comprise this “shadow” inventory continue to weigh on
the housing market by encouraging appraisers to be overly
conservative and by keeping mortgage underwriting tighter than it
would otherwise be. In December, foreclosures in Southern California
accounted for 32.5% of existing home sales. As bleak as this sounds,
however, it is still a vast improvement over February 2009, when
foreclosure sales peaked at 58.5%.15
Builders are reporting a modest uptick in buyer traffic, especially near
key employment centers with established infrastructure and desirable
amenities, but this is not yet translating into significant sales activity.
In Riverside and San Bernardino counties, epicenter of the region’s
foreclosure crisis, new home inventories increased in the third quarter
of 2011 by 1.2% and 59.3% respectively on a year-over basis. After
falling in 2008 through mid-2010, unsold inventories in the Inland
Empire have increased over the last five quarters. In Los Angeles
County, the inventory of new unsold homes declined by 32.3% during
the third quarter and in Orange County, new home inventories fell by
12.0%. In Ventura County, the unsold new home inventory increased
by 32.4% during the third quarter of 2011.
In 2011, the number of new residential construction permits issued in
the five-county area was up by 20.3% to 21,114 new single- and multi-
family units compared with 2010 and by 41.3% from 2009 when only
21,114 permits were issued.
In Los Angeles County, total residential construction permits
increased by 39.0% to 10,380 units in 2011. Multi-family homes
accounted for 77.6% of permits issued last year, with single-family
homes making up the remaining 22.4%.
In Orange County, a total of 4,818 residential permits were issued
in 2011, which was up by 55.9% compared with 2010. Multi-
family homes made up 60.8% of new home permits with single-
family residences accounting for 39.2%.
15
Ibid.
Outlook for Construction and Retailing
LAEDC Kyser Center for Economic Research 88 Economic Forecast, February 2012
Alone among the regions of the Los Angeles five-county area, the
Inland Empire posted a decline in new home construction in 2011.
Permits fell by 18.6% to 5,214 units last year, which was down by
90% from the region’s new home building peak in 2004. Single-
family permits continue to dominate in the Inland Empire, making
up 71.6% of the total number of new housing permits.
In Ventura County, a total of 702 residential permits were issued
during 2011, an increase of 19.0% from the previous year. Of the
housing permits issued in 2011, 77.1% were for multi-family
residences. Compared with the rest of the region, less new home
construction occurs in Ventura County. Barriers include a lengthy
permitting process, limited land availability, and median prices
that are relatively high compared with the rest of the Los Angeles
five-county area.
Resale Housing: In 2011, existing single-family home sales in
California edged up by 1.1% over the year, while the median price fell
by 6.3%. Although prices are still declining on a year-over basis, the
month-to-month numbers are beginning to exhibit some stability.
Median prices for existing single-family homes by county in 2011:16
In Los Angeles County the median price was $307,660, which was
down by 4.8% over the year.
In Orange County, the median home price declined by 6.2% to
$512,500.
The median price in the Inland Empire fell by 3.9% to $172,820.
Ventura County had a median price of $418,270, a decline of 5.5%
from a year ago.
Foreclosure activity has declined significantly from its peak in 2009,
but remains at extremely high levels and is largely responsible (along
with the lack of financing for higher priced homes) for concentrating
sales at the low end of the market. Investors, many of whom pay
cash, are filling in some of the gap left by the lack of entry level
buyers. In December, investors were responsible for 26.4% of existing
home sales in the region. Sales of higher-end homes (priced $500,000
or more) made up just 17.8% of sales in December, hampered by tight
credit conditions and since last October, lower conforming loan limits.
The ten year monthly average for homes sold in this price range is
nearly 28% of total sales (although the decline in median price would
affect the number of homes offered at that price point). 17
16
California Association of Realtors 17
Southland December Home Sales (December 17, 2012); DQNews.com
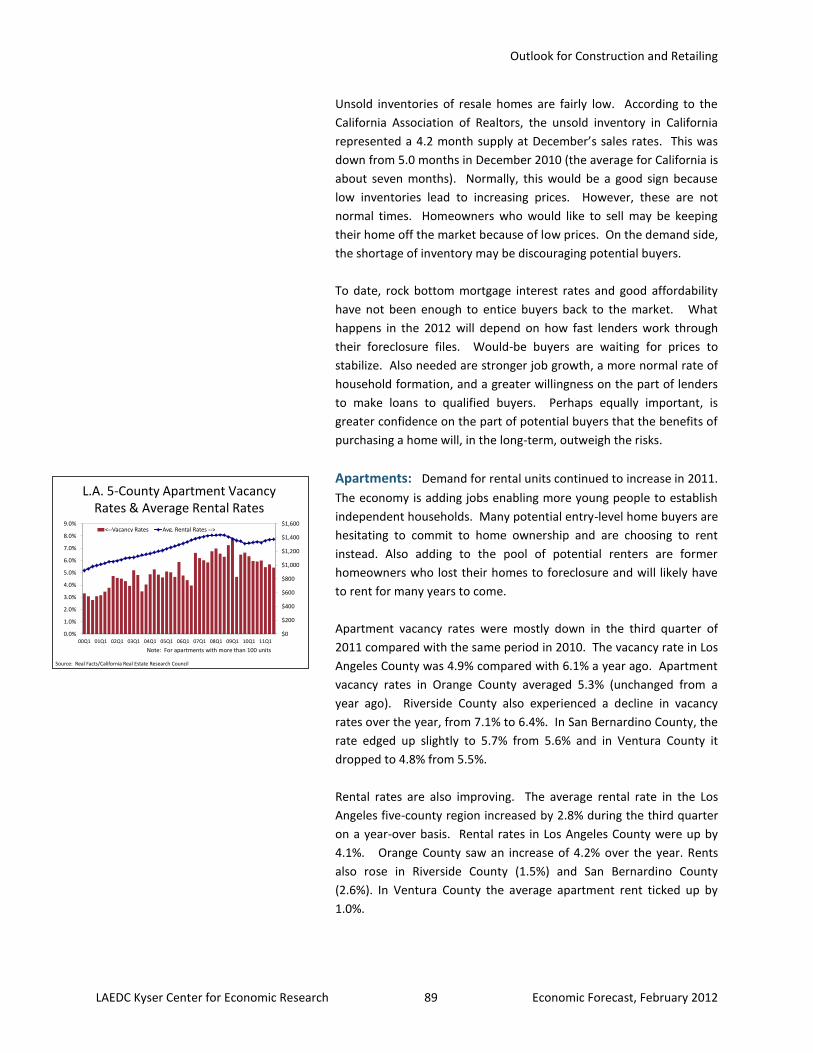
Outlook for Construction and Retailing
LAEDC Kyser Center for Economic Research 89 Economic Forecast, February 2012
L.A. 5-County Apartment Vacancy Rates & Average Rental Rates
Source: Real Facts/California Real Estate Research Council
$0
$200
$400
$600
$800
$1,000
$1,200
$1,400
$1,600
0.0%
1.0%
2.0%
3.0%
4.0%
5.0%
6.0%
7.0%
8.0%
9.0%
00Q1 01Q1 02Q1 03Q1 04Q1 05Q1 06Q1 07Q1 08Q1 09Q1 10Q1 11Q1
<--Vacancy Rates Avg. Rental Rates -->
Note: For apartments with more than 100 units
Unsold inventories of resale homes are fairly low. According to the
California Association of Realtors, the unsold inventory in California
represented a 4.2 month supply at December’s sales rates. This was
down from 5.0 months in December 2010 (the average for California is
about seven months). Normally, this would be a good sign because
low inventories lead to increasing prices. However, these are not
normal times. Homeowners who would like to sell may be keeping
their home off the market because of low prices. On the demand side,
the shortage of inventory may be discouraging potential buyers.
To date, rock bottom mortgage interest rates and good affordability
have not been enough to entice buyers back to the market. What
happens in the 2012 will depend on how fast lenders work through
their foreclosure files. Would-be buyers are waiting for prices to
stabilize. Also needed are stronger job growth, a more normal rate of
household formation, and a greater willingness on the part of lenders
to make loans to qualified buyers. Perhaps equally important, is
greater confidence on the part of potential buyers that the benefits of
purchasing a home will, in the long-term, outweigh the risks.
Apartments: Demand for rental units continued to increase in 2011.
The economy is adding jobs enabling more young people to establish
independent households. Many potential entry-level home buyers are
hesitating to commit to home ownership and are choosing to rent
instead. Also adding to the pool of potential renters are former
homeowners who lost their homes to foreclosure and will likely have
to rent for many years to come.
Apartment vacancy rates were mostly down in the third quarter of
2011 compared with the same period in 2010. The vacancy rate in Los
Angeles County was 4.9% compared with 6.1% a year ago. Apartment
vacancy rates in Orange County averaged 5.3% (unchanged from a
year ago). Riverside County also experienced a decline in vacancy
rates over the year, from 7.1% to 6.4%. In San Bernardino County, the
rate edged up slightly to 5.7% from 5.6% and in Ventura County it
dropped to 4.8% from 5.5%.
Rental rates are also improving. The average rental rate in the Los
Angeles five-county region increased by 2.8% during the third quarter
on a year-over basis. Rental rates in Los Angeles County were up by
4.1%. Orange County saw an increase of 4.2% over the year. Rents
also rose in Riverside County (1.5%) and San Bernardino County
(2.6%). In Ventura County the average apartment rent ticked up by
1.0%.
Outlook for Construction and Retailing
LAEDC Kyser Center for Economic Research 90 Economic Forecast, February 2012
Apartment fundamentals are relatively healthy compared with the
detached for-sale housing market. Transaction costs associated with
renting are lower than buying, renting does not tie up funds in the
form of a down payment, and renting offers greater flexibility if an
individual needs to move to obtain a job. Additionally, the apartment
market did not suffer from excess supply problems and was less
affected by foreclosure crisis. On the other hand, increasing rental
rates may lead to a reassessment of the “rent-or-buy” calculation for
some households as their financial situation improves along with the
economy.
Multi-family construction has been the one bright spot in the
residential real estate market during the past year and momentum is
building. Many families and individuals are rethinking the choice
between purchasing a single-family home in a distant area for the sake
of affordability versus long commutes to work. Younger people are
embracing the flexibility afforded by renting. New apartment
construction remains at relatively low levels but as more people return
to work, demand will increase pushing up rents and encouraging
builders to forge ahead with new developments.
Housing Forecast: The housing market in Southern California will be
better in 2012. Economic reports dealing with housing indicators are
showing a little more strength lately. Low mortgage interest rates
make buying a home more affordable, the employment outlook is
stronger, some easing of mortgage underwriting standards has been
reported, and demand appears to be firming a bit.
The biggest risk to the housing market is if the pace of job growth fails
to accelerate. Foreclosures and negative equity remain significant
hurdles to recovery. Foreclosures will continue to be a major driver of
sales in Southern California’s distressed areas in 2012 and well into
next year. Until that process plays out, the market outlook will remain
uncertain. Job growth is essential to reducing foreclosures and
delinquencies which, in turn will help stabilize prices – a prerequisite
to luring discretionary buyers back to the market. Tight lending
standards also threaten to hold back the housing recovery. Many
would be borrowers have not been able to benefit from low interest
rates because they do not have enough equity in their current homes
or have a blemish on their credit or have had uneven income over the
past few years.
Despite all of this, the LAEDC expects a modest rise in home sales and
new home construction in 2012. We will have to wait for 2013 to see
a more robust turn-around. The LAEDC forecasts that a total of 26,650
Outlook for Construction and Retailing
LAEDC Kyser Center for Economic Research 91 Economic Forecast, February 2012
new housing units will be permitted during 2012 in the five-county
region, an increase of 26.2% from 2011, but still down by 70.9% from
the 2004 peak level of 91,556 units. Gains in 2012 will stem from
improvements in the rest of the economy, particularly stronger job
and income growth, increased household formation and better
housing affordability. Pent up demand for housing is building. At
some point, population growth and young people striking out on their
own will reignite demand for housing.
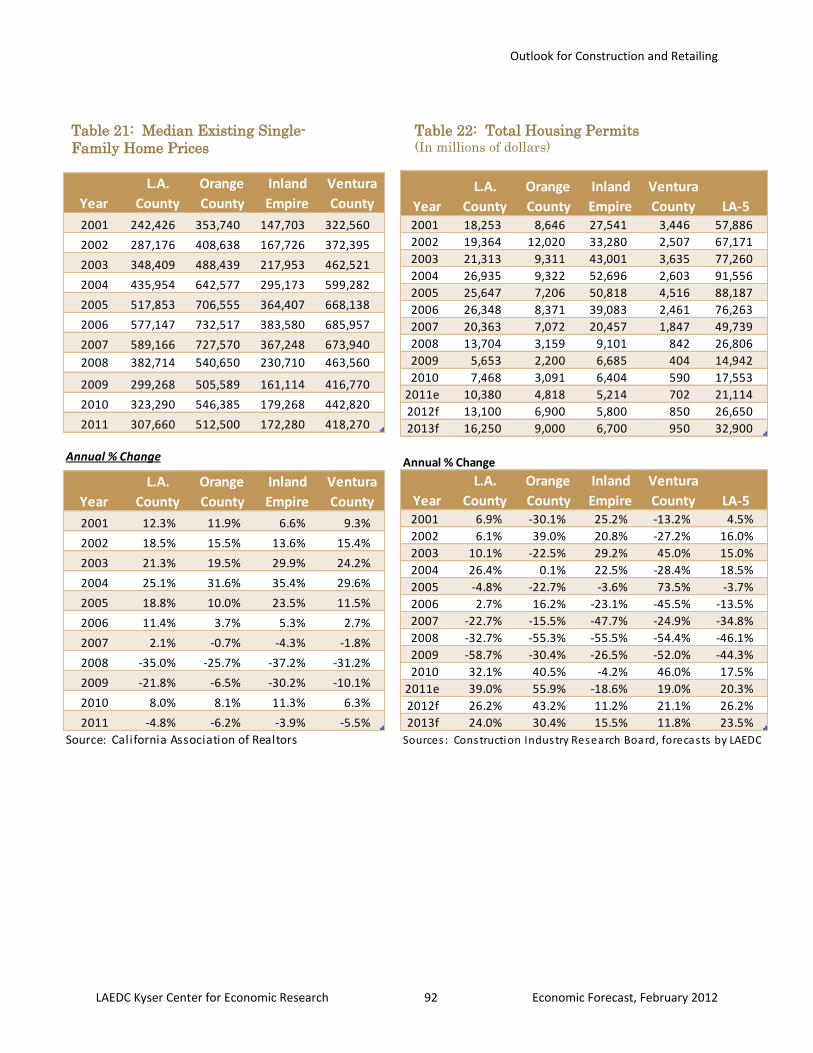
Outlook for Construction and Retailing
LAEDC Kyser Center for Economic Research 92 Economic Forecast, February 2012
Year
L.A.
County
Orange
County
Inland
Empire
Ventura
County
2001 242,426 353,740 147,703 322,560
2002 287,176 408,638 167,726 372,395
2003 348,409 488,439 217,953 462,521
2004 435,954 642,577 295,173 599,282
2005 517,853 706,555 364,407 668,138
2006 577,147 732,517 383,580 685,957
2007 589,166 727,570 367,248 673,940
2008 382,714 540,650 230,710 463,560
2009 299,268 505,589 161,114 416,770
2010 323,290 546,385 179,268 442,820
2011 307,660 512,500 172,280 418,270
Annual % Change
Year
L.A.
County
Orange
County
Inland
Empire
Ventura
County
2001 12.3% 11.9% 6.6% 9.3%
2002 18.5% 15.5% 13.6% 15.4%
2003 21.3% 19.5% 29.9% 24.2%
2004 25.1% 31.6% 35.4% 29.6%
2005 18.8% 10.0% 23.5% 11.5%
2006 11.4% 3.7% 5.3% 2.7%
2007 2.1% -0.7% -4.3% -1.8%
2008 -35.0% -25.7% -37.2% -31.2%
2009 -21.8% -6.5% -30.2% -10.1%
2010 8.0% 8.1% 11.3% 6.3%
2011 -4.8% -6.2% -3.9% -5.5%
Source: California Association of Realtors
Year
L.A.
County
Orange
County
Inland
Empire
Ventura
County LA-52001 18,253 8,646 27,541 3,446 57,886
2002 19,364 12,020 33,280 2,507 67,171
2003 21,313 9,311 43,001 3,635 77,260
2004 26,935 9,322 52,696 2,603 91,556
2005 25,647 7,206 50,818 4,516 88,187
2006 26,348 8,371 39,083 2,461 76,263
2007 20,363 7,072 20,457 1,847 49,739
2008 13,704 3,159 9,101 842 26,806
2009 5,653 2,200 6,685 404 14,942
2010 7,468 3,091 6,404 590 17,553
2011e 10,380 4,818 5,214 702 21,114
2012f 13,100 6,900 5,800 850 26,650
2013f 16,250 9,000 6,700 950 32,900
Annual % Change
Year
L.A.
County
Orange
County
Inland
Empire
Ventura
County LA-52001 6.9% -30.1% 25.2% -13.2% 4.5%
2002 6.1% 39.0% 20.8% -27.2% 16.0%
2003 10.1% -22.5% 29.2% 45.0% 15.0%
2004 26.4% 0.1% 22.5% -28.4% 18.5%
2005 -4.8% -22.7% -3.6% 73.5% -3.7%
2006 2.7% 16.2% -23.1% -45.5% -13.5%
2007 -22.7% -15.5% -47.7% -24.9% -34.8%
2008 -32.7% -55.3% -55.5% -54.4% -46.1%
2009 -58.7% -30.4% -26.5% -52.0% -44.3%
2010 32.1% 40.5% -4.2% 46.0% 17.5%
2011e 39.0% 55.9% -18.6% 19.0% 20.3%
2012f 26.2% 43.2% 11.2% 21.1% 26.2%
2013f 24.0% 30.4% 15.5% 11.8% 23.5%
Sources : Construction Industry Research Board, forecasts by LAEDC
Table 22: Total Housing Permits (In millions of dollars)
Table 21: Median Existing Single-
Family Home Prices
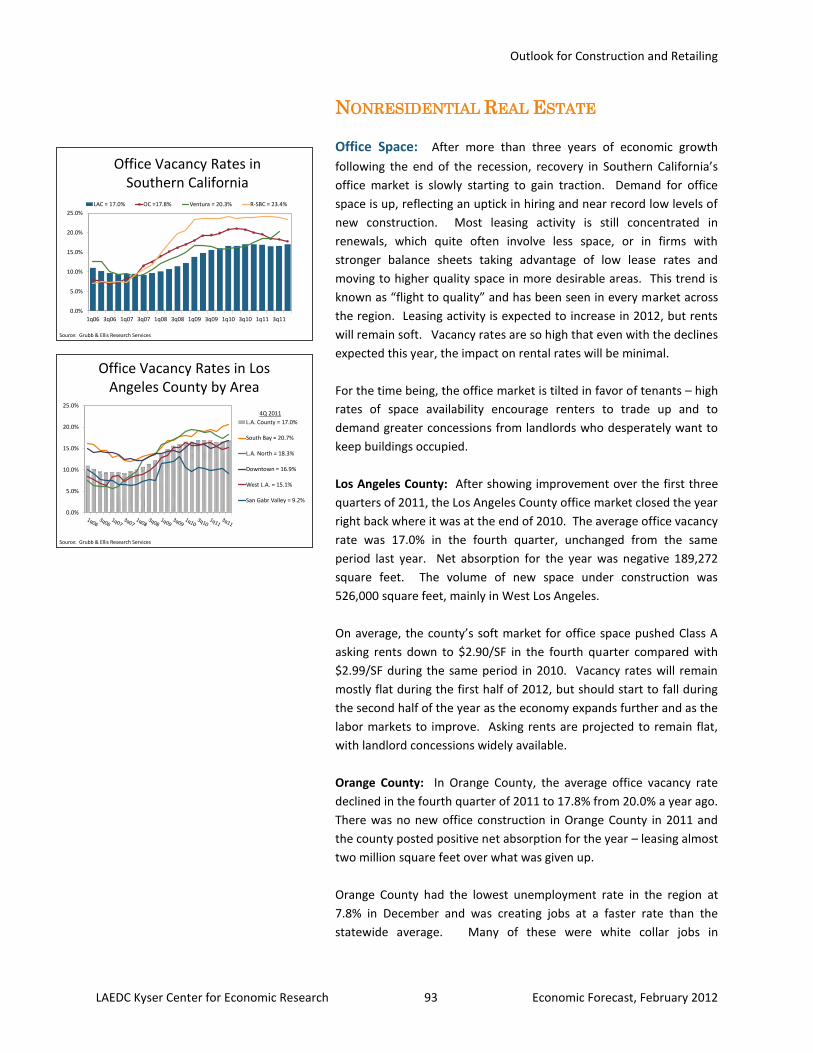
Outlook for Construction and Retailing
LAEDC Kyser Center for Economic Research 93 Economic Forecast, February 2012
Office Vacancy Rates in Los Angeles County by Area
Source: Grubb & Ellis Research Services
0.0%
5.0%
10.0%
15.0%
20.0%
25.0%
L.A. County = 17.0%
South Bay = 20.7%
L.A. North = 18.3%
Downtown = 16.9%
West L.A. = 15.1%
San Gabr Valley = 9.2%
4Q 2011
Office Vacancy Rates in Southern California
Source: Grubb & Ellis Research Services
0.0%
5.0%
10.0%
15.0%
20.0%
25.0%
1q06 3q06 1q07 3q07 1q08 3q08 1q09 3q09 1q10 3q10 1q11 3q11
LAC = 17.0% OC =17.8% Ventura = 20.3% R-SBC = 23.4%
NONRESIDENTIAL REAL ESTATE
Office Space: After more than three years of economic growth
following the end of the recession, recovery in Southern California’s
office market is slowly starting to gain traction. Demand for office
space is up, reflecting an uptick in hiring and near record low levels of
new construction. Most leasing activity is still concentrated in
renewals, which quite often involve less space, or in firms with
stronger balance sheets taking advantage of low lease rates and
moving to higher quality space in more desirable areas. This trend is
known as “flight to quality” and has been seen in every market across
the region. Leasing activity is expected to increase in 2012, but rents
will remain soft. Vacancy rates are so high that even with the declines
expected this year, the impact on rental rates will be minimal.
For the time being, the office market is tilted in favor of tenants – high
rates of space availability encourage renters to trade up and to
demand greater concessions from landlords who desperately want to
keep buildings occupied.
Los Angeles County: After showing improvement over the first three
quarters of 2011, the Los Angeles County office market closed the year
right back where it was at the end of 2010. The average office vacancy
rate was 17.0% in the fourth quarter, unchanged from the same
period last year. Net absorption for the year was negative 189,272
square feet. The volume of new space under construction was
526,000 square feet, mainly in West Los Angeles.
On average, the county’s soft market for office space pushed Class A
asking rents down to $2.90/SF in the fourth quarter compared with
$2.99/SF during the same period in 2010. Vacancy rates will remain
mostly flat during the first half of 2012, but should start to fall during
the second half of the year as the economy expands further and as the
labor markets to improve. Asking rents are projected to remain flat,
with landlord concessions widely available.
Orange County: In Orange County, the average office vacancy rate
declined in the fourth quarter of 2011 to 17.8% from 20.0% a year ago.
There was no new office construction in Orange County in 2011 and
the county posted positive net absorption for the year – leasing almost
two million square feet over what was given up.
Orange County had the lowest unemployment rate in the region at
7.8% in December and was creating jobs at a faster rate than the
statewide average. Many of these were white collar jobs in
Outlook for Construction and Retailing
LAEDC Kyser Center for Economic Research 94 Economic Forecast, February 2012
professional and technical services that need office space. Many
tenants expanded into larger spaces after downsizing during the
recession. The increase in demand for office space, however, has not
yet translated to higher lease rates. Class A asking rents were mostly
flat over the year at $2.18/SF
Looking ahead, gains in 2012 will build on last year’s improvements.
Growth will be slow and steady. With very little new office
construction expected this year, and a faster pace of job creation,
vacancy rates will continue to edge down. Overall asking rents appear
to have bottomed out. Supplies of Class A space and of spaces over
100,000 SF are dwindling. Rental rates should firm up later this year
and begin to inch towards the end of 2012.
Inland Empire: In the Inland Empire, the vacancy rate was 23.4% in
the fourth quarter of 2011, down marginally from the same period in
2010 (24.9%). Rental rates fell by 4.5% to $1.93/SF in the fourth
quarter of 2011 compared with $2.02/SF during the same period in
2010. Total net absorption in 2011 was negative 37,000 square feet.
Modest employment gains in the Inland Empire did little to offset
tenant downsizing and move-outs. Additionally, of the nearly 2.7
million square feet of speculative construction built since 2007, nearly
half was still vacant at the end of 2011. Fallout from the crash of the
region’s housing market is still impacting industries linked to the
housing market. White collar hiring is on the increase, but is not
expanding fast enough to fill the large amount of available space.
Little improvement is expected for 2012. Recovery in the office
leasing market is closely tied to improvement in the region’s base of
finance, business services, and related sectors, but it will be some time
before they absorb the available space.
New Office Construction: During 2011, office building permits valued
at $264.6 million were issued in the five-county region. The value of
new office construction dropped by 6.9% from 2010’s already low
levels. Los Angeles County accounted for 59% by valuation of office
building permits issued in the five-county region year-to-date
compared with 47% during the 2010. Orange County accounted for a
33% share, roughly the same as in 2010. The Inland Empire’s share
was 7% and Ventura County held a 1% share.
Industrial Space: Southern California is a major center for
manufacturing, international trade and logistics, and entertainment.
Los Angeles County is the nation’s largest manufacturing center and is
home to its biggest port complex.
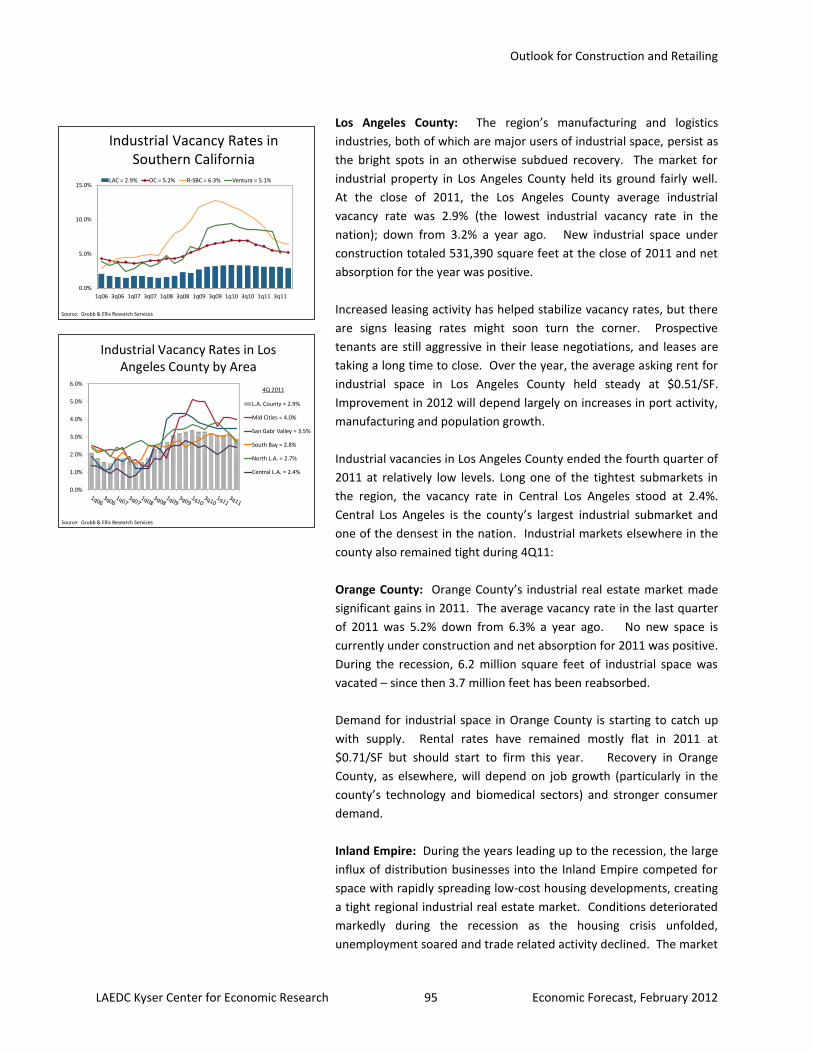
Outlook for Construction and Retailing
LAEDC Kyser Center for Economic Research 95 Economic Forecast, February 2012
Industrial Vacancy Rates in Los Angeles County by Area
Source: Grubb & Ellis Research Services
0.0%
1.0%
2.0%
3.0%
4.0%
5.0%
6.0%
L.A. County = 2.9%
Mid Cities = 4.0%
San Gabr Valley = 3.5%
South Bay = 2.8%
North L.A. = 2.7%
Central L.A. = 2.4%
4Q 2011
Industrial Vacancy Rates in Southern California
Source: Grubb & Ellis Research Services
0.0%
5.0%
10.0%
15.0%
1q06 3q06 1q07 3q07 1q08 3q08 1q09 3q09 1q10 3q10 1q11 3q11
LAC = 2.9% OC = 5.2% R-SBC = 6.3% Ventura = 5.1%
Los Angeles County: The region’s manufacturing and logistics
industries, both of which are major users of industrial space, persist as
the bright spots in an otherwise subdued recovery. The market for
industrial property in Los Angeles County held its ground fairly well.
At the close of 2011, the Los Angeles County average industrial
vacancy rate was 2.9% (the lowest industrial vacancy rate in the
nation); down from 3.2% a year ago. New industrial space under
construction totaled 531,390 square feet at the close of 2011 and net
absorption for the year was positive.
Increased leasing activity has helped stabilize vacancy rates, but there
are signs leasing rates might soon turn the corner. Prospective
tenants are still aggressive in their lease negotiations, and leases are
taking a long time to close. Over the year, the average asking rent for
industrial space in Los Angeles County held steady at $0.51/SF.
Improvement in 2012 will depend largely on increases in port activity,
manufacturing and population growth.
Industrial vacancies in Los Angeles County ended the fourth quarter of
2011 at relatively low levels. Long one of the tightest submarkets in
the region, the vacancy rate in Central Los Angeles stood at 2.4%.
Central Los Angeles is the county’s largest industrial submarket and
one of the densest in the nation. Industrial markets elsewhere in the
county also remained tight during 4Q11:
Orange County: Orange County’s industrial real estate market made
significant gains in 2011. The average vacancy rate in the last quarter
of 2011 was 5.2% down from 6.3% a year ago. No new space is
currently under construction and net absorption for 2011 was positive.
During the recession, 6.2 million square feet of industrial space was
vacated – since then 3.7 million feet has been reabsorbed.
Demand for industrial space in Orange County is starting to catch up
with supply. Rental rates have remained mostly flat in 2011 at
$0.71/SF but should start to firm this year. Recovery in Orange
County, as elsewhere, will depend on job growth (particularly in the
county’s technology and biomedical sectors) and stronger consumer
demand.
Inland Empire: During the years leading up to the recession, the large
influx of distribution businesses into the Inland Empire competed for
space with rapidly spreading low-cost housing developments, creating
a tight regional industrial real estate market. Conditions deteriorated
markedly during the recession as the housing crisis unfolded,
unemployment soared and trade related activity declined. The market
Outlook for Construction and Retailing
LAEDC Kyser Center for Economic Research 96 Economic Forecast, February 2012
was flooded with new space built by speculators just as businesses
were downsizing or closing up altogether. Vacancy rates soared to
nearly 13% and effective rents declined to historic lows.
The latest numbers, however, show the Inland Empire has made
significant gains over the past year. The fourth quarter vacancy rate
was 6.3%, still somewhat elevated compared to pre-recession levels,
but down from 10.0% during the same period last year – a remarkable
turnaround. Net absorption was positive in 2011 and when the year
ended, 4.5 million square feet of speculative new industrial space was
under construction, the first in the region since 2009. The rebound in
international trade and strong growth in retail sales have pushed the
Inland Empire industrial real estate market out of the trough. Asking
rents are strengthening ($0.33/SF versus $0.31/SF a year ago). In
2012, strong demand for Class A warehouse space and limited supply
will drive up lease rates, especially for buildings in excess of 100,000
square feet.
New Industrial Construction: During 2011, industrial building permits
valued at nearly $214 million were issued in the five-county region.
The value of industrial permits nearly doubled compared with 2010.
Most of the gain occurred in Los Angeles County, which garnered 64%
of the industrial permits issued last year, followed by the Inland
Empire with just over 28%.
Forecast for Nonresidential Construction: The value of total
private nonresidential construction in the five-county region increased
to $5.5 billion in 2011, up by 14.9% compared with 2010. Activity will
increase modestly in 2012, with a forecast total permit value of $6.0
billion (or 10.1%). While conditions have mostly stabilized,
commercial real estate still has some distance to travel on the road to
recovery. The mountain of troubled commercial real estate loans is
beginning to erode, mostly due to write-downs and a dearth of new
lending, but there are still billions of dollars of real estate loans that
will be maturing over the next five years. Special servicers are holding
back on disposing of problem assets, playing a game of extend and
pretend. As long as the economy continues to expand, banks will
continue to resolve troubled loans at an unhurried pace to avoid a
refinancing crisis.
Private nonresidential building permit values in Los Angeles County
rose by nearly 17% in 2011, will continue on an upward path in 2012,
rising by 12.7%. Orange County’s total nonresidential construction
activity value increased by nearly 12.8% in 2011 and will expand again
in 2012, rising by 7.8%. The Riverside-San Bernardino area’s total
nonresidential building permit values climbed by 16.3% in 2011.
Outlook for Construction and Retailing
LAEDC Kyser Center for Economic Research 97 Economic Forecast, February 2012
Although fundamentals in the region have improved, nonresidential
construction will grow at a slower pace in 2012 (5.8%). Ventura
County’s total nonresidential construction permit values declined by
8.3% in 2011 but should turn the corner next year and increase by
about 2.0%.
For the most part, office space development will be restrained in all
five counties of the Southern California region. Office vacancy rates
around the region should be stable during 2012 and begin to decline in
some areas as the employment situation improves. Average rents
may continue to soften in some areas, but also appear to be
stabilizing. Recovery will be helped along by the lack of new
construction and stronger employment growth. Changes in workplace
organization will present a challenge going forward. The necessity of
reducing office space during the recession taught companies to use
less space per worker. This will slow the office market’s return to
health unless the pace of job creation picks up significantly.
The outlook for industrial space development is much brighter
throughout Southern California. Improvements in vacancy rates and
rents will depend largely on growth in trade and manufacturing
activity. Another factor is the rate at which speculative developments
come on line, particularly in the Inland Empire. Too much supply
added too fast could derail recovery. Gasoline prices, which affects
the cost of trucking goods from the ports to warehouses, will also have
an impact as firms weigh transportation costs against rental rates in
cheaper (Inland Empire) versus more accessible areas such as Los
Angeles.
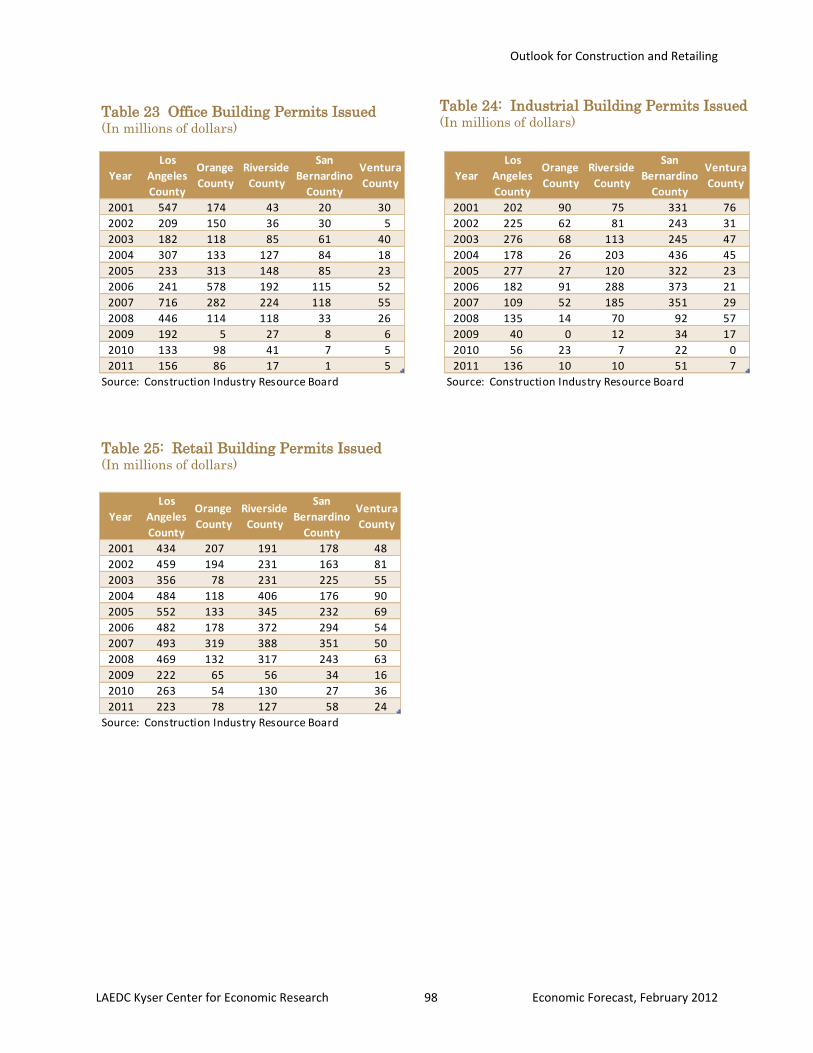
Outlook for Construction and Retailing
LAEDC Kyser Center for Economic Research 98 Economic Forecast, February 2012
Year
Los
Angeles
County
Orange
County
Riverside
County
San
Bernardino
County
Ventura
County
2001 547 174 43 20 30
2002 209 150 36 30 5
2003 182 118 85 61 40
2004 307 133 127 84 18
2005 233 313 148 85 23
2006 241 578 192 115 52
2007 716 282 224 118 55
2008 446 114 118 33 26
2009 192 5 27 8 6
2010 133 98 41 7 5
2011 156 86 17 1 5
Source: Construction Industry Resource Board
Year
Los
Angeles
County
Orange
County
Riverside
County
San
Bernardino
County
Ventura
County
2001 202 90 75 331 76
2002 225 62 81 243 31
2003 276 68 113 245 47
2004 178 26 203 436 45
2005 277 27 120 322 23
2006 182 91 288 373 21
2007 109 52 185 351 29
2008 135 14 70 92 57
2009 40 0 12 34 17
2010 56 23 7 22 0
2011 136 10 10 51 7
Source: Construction Industry Resource Board
Year
Los
Angeles
County
Orange
County
Riverside
County
San
Bernardino
County
Ventura
County
2001 434 207 191 178 48
2002 459 194 231 163 81
2003 356 78 231 225 55
2004 484 118 406 176 90
2005 552 133 345 232 69
2006 482 178 372 294 54
2007 493 319 388 351 50
2008 469 132 317 243 63
2009 222 65 56 34 16
2010 263 54 130 27 36
2011 223 78 127 58 24
Source: Construction Industry Resource Board
Table 23 Office Building Permits Issued (In millions of dollars)
Table 24: Industrial Building Permits Issued (In millions of dollars)
Table 25: Retail Building Permits Issued (In millions of dollars)
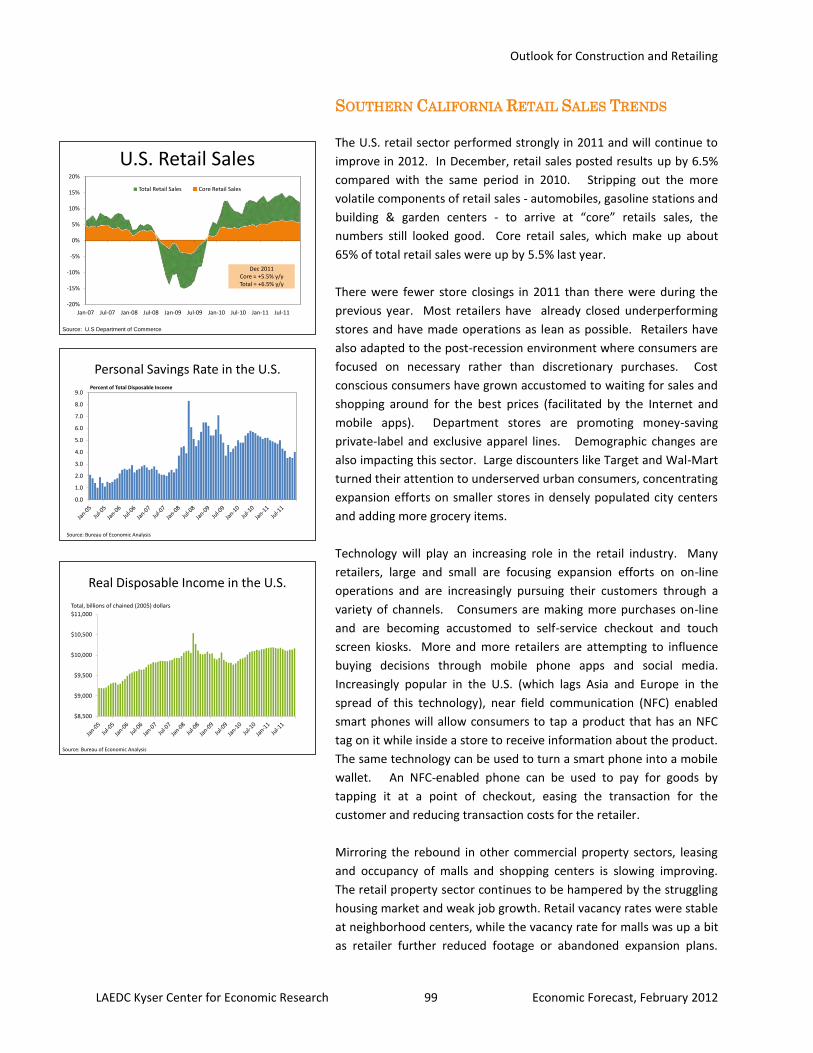
Outlook for Construction and Retailing
LAEDC Kyser Center for Economic Research 99 Economic Forecast, February 2012
-20%
-15%
-10%
-5%
0%
5%
10%
15%
20%
Jan-07 Jul-07 Jan-08 Jul-08 Jan-09 Jul-09 Jan-10 Jul-10 Jan-11 Jul-11
Total Retail Sales Core Retail Sales
Dec 2011Core = +5.5% y/yTotal = +6.5% y/y
U.S. Retail Sales
Source: U.S Department of Commerce
0.0
1.0
2.0
3.0
4.0
5.0
6.0
7.0
8.0
9.0
Personal Savings Rate in the U.S.Percent of Total Disposable Income
Source: Bureau of Economic Analysis
Real Disposable Income in the U.S.
$8,500
$9,000
$9,500
$10,000
$10,500
$11,000
Source: Bureau of Economic Analysis
Total, billions of chained (2005) dollars
SOUTHERN CALIFORNIA RETAIL SALES TRENDS
The U.S. retail sector performed strongly in 2011 and will continue to
improve in 2012. In December, retail sales posted results up by 6.5%
compared with the same period in 2010. Stripping out the more
volatile components of retail sales - automobiles, gasoline stations and
building & garden centers - to arrive at “core” retails sales, the
numbers still looked good. Core retail sales, which make up about
65% of total retail sales were up by 5.5% last year.
There were fewer store closings in 2011 than there were during the
previous year. Most retailers have already closed underperforming
stores and have made operations as lean as possible. Retailers have
also adapted to the post-recession environment where consumers are
focused on necessary rather than discretionary purchases. Cost
conscious consumers have grown accustomed to waiting for sales and
shopping around for the best prices (facilitated by the Internet and
mobile apps). Department stores are promoting money-saving
private-label and exclusive apparel lines. Demographic changes are
also impacting this sector. Large discounters like Target and Wal-Mart
turned their attention to underserved urban consumers, concentrating
expansion efforts on smaller stores in densely populated city centers
and adding more grocery items.
Technology will play an increasing role in the retail industry. Many
retailers, large and small are focusing expansion efforts on on-line
operations and are increasingly pursuing their customers through a
variety of channels. Consumers are making more purchases on-line
and are becoming accustomed to self-service checkout and touch
screen kiosks. More and more retailers are attempting to influence
buying decisions through mobile phone apps and social media.
Increasingly popular in the U.S. (which lags Asia and Europe in the
spread of this technology), near field communication (NFC) enabled
smart phones will allow consumers to tap a product that has an NFC
tag on it while inside a store to receive information about the product.
The same technology can be used to turn a smart phone into a mobile
wallet. An NFC-enabled phone can be used to pay for goods by
tapping it at a point of checkout, easing the transaction for the
customer and reducing transaction costs for the retailer.
Mirroring the rebound in other commercial property sectors, leasing
and occupancy of malls and shopping centers is slowing improving.
The retail property sector continues to be hampered by the struggling
housing market and weak job growth. Retail vacancy rates were stable
at neighborhood centers, while the vacancy rate for malls was up a bit
as retailer further reduced footage or abandoned expansion plans.
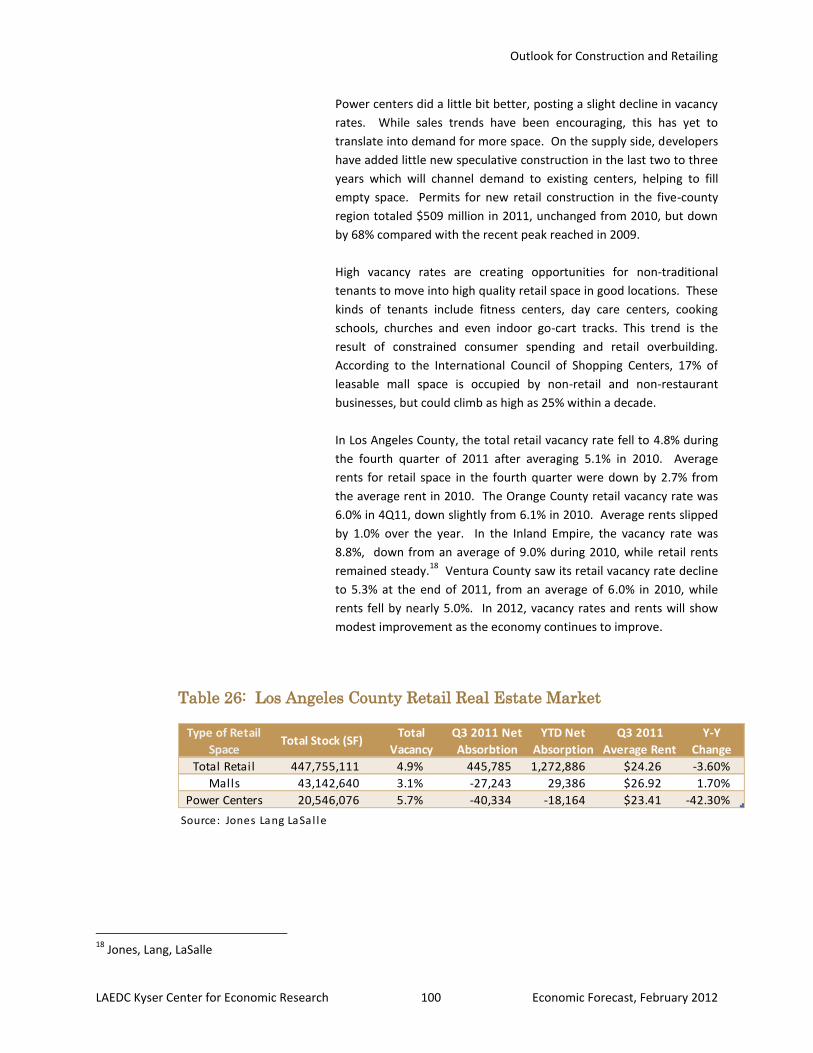
Outlook for Construction and Retailing
LAEDC Kyser Center for Economic Research 100 Economic Forecast, February 2012
Type of Retail
SpaceTotal Stock (SF)
Total
Vacancy
Q3 2011 Net
Absorbtion
YTD Net
Absorption
Q3 2011
Average Rent
Y-Y
Change
Total Retail 447,755,111 4.9% 445,785 1,272,886 $24.26 -3.60%
Malls 43,142,640 3.1% -27,243 29,386 $26.92 1.70%
Power Centers 20,546,076 5.7% -40,334 -18,164 $23.41 -42.30%
Source: Jones Lang LaSal le
Power centers did a little bit better, posting a slight decline in vacancy
rates. While sales trends have been encouraging, this has yet to
translate into demand for more space. On the supply side, developers
have added little new speculative construction in the last two to three
years which will channel demand to existing centers, helping to fill
empty space. Permits for new retail construction in the five-county
region totaled $509 million in 2011, unchanged from 2010, but down
by 68% compared with the recent peak reached in 2009.
High vacancy rates are creating opportunities for non-traditional
tenants to move into high quality retail space in good locations. These
kinds of tenants include fitness centers, day care centers, cooking
schools, churches and even indoor go-cart tracks. This trend is the
result of constrained consumer spending and retail overbuilding.
According to the International Council of Shopping Centers, 17% of
leasable mall space is occupied by non-retail and non-restaurant
businesses, but could climb as high as 25% within a decade.
In Los Angeles County, the total retail vacancy rate fell to 4.8% during
the fourth quarter of 2011 after averaging 5.1% in 2010. Average
rents for retail space in the fourth quarter were down by 2.7% from
the average rent in 2010. The Orange County retail vacancy rate was
6.0% in 4Q11, down slightly from 6.1% in 2010. Average rents slipped
by 1.0% over the year. In the Inland Empire, the vacancy rate was
8.8%, down from an average of 9.0% during 2010, while retail rents
remained steady.18
Ventura County saw its retail vacancy rate decline
to 5.3% at the end of 2011, from an average of 6.0% in 2010, while
rents fell by nearly 5.0%. In 2012, vacancy rates and rents will show
modest improvement as the economy continues to improve.
18
Jones, Lang, LaSalle
Table 26: Los Angeles County Retail Real Estate Market
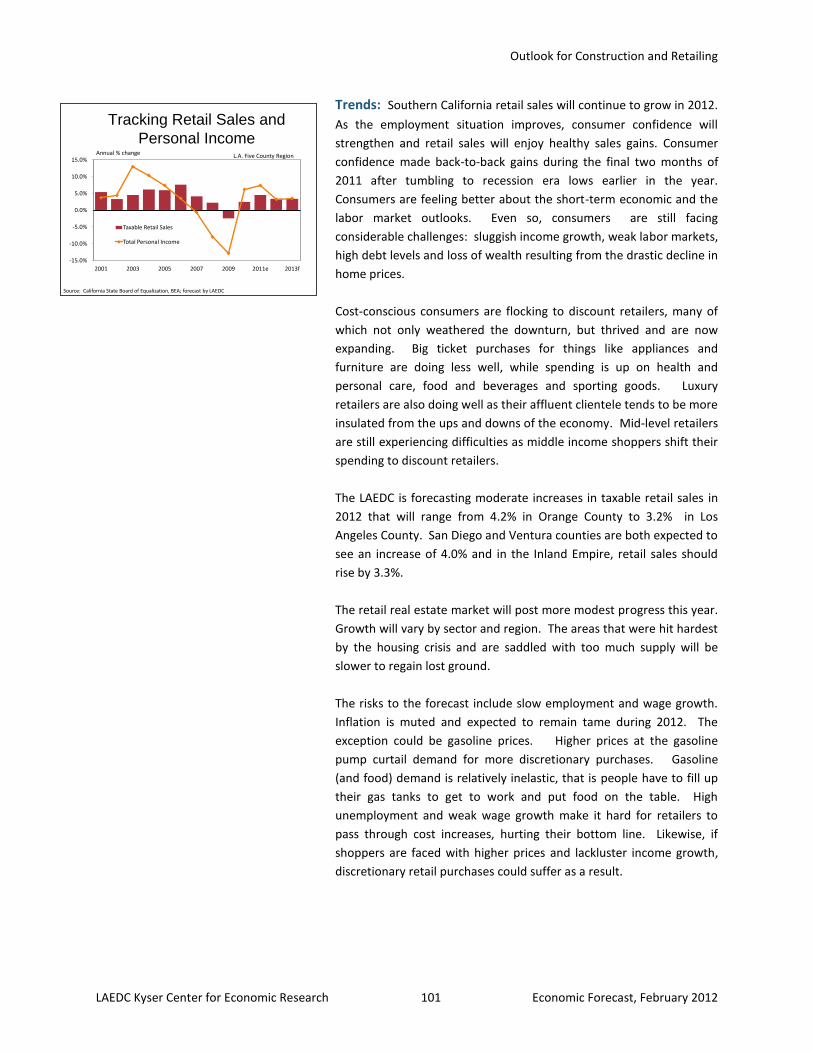
Outlook for Construction and Retailing
LAEDC Kyser Center for Economic Research 101 Economic Forecast, February 2012
Tracking Retail Sales and
Personal Income
-15.0%
-10.0%
-5.0%
0.0%
5.0%
10.0%
15.0%
2001 2003 2005 2007 2009 2011e 2013f
Taxable Retail Sales
Total Personal Income
Source: California State Board of Equalization, BEA; forecast by LAEDC
Annual % change L.A. Five County Region
Trends: Southern California retail sales will continue to grow in 2012.
As the employment situation improves, consumer confidence will
strengthen and retail sales will enjoy healthy sales gains. Consumer
confidence made back-to-back gains during the final two months of
2011 after tumbling to recession era lows earlier in the year.
Consumers are feeling better about the short-term economic and the
labor market outlooks. Even so, consumers are still facing
considerable challenges: sluggish income growth, weak labor markets,
high debt levels and loss of wealth resulting from the drastic decline in
home prices.
Cost-conscious consumers are flocking to discount retailers, many of
which not only weathered the downturn, but thrived and are now
expanding. Big ticket purchases for things like appliances and
furniture are doing less well, while spending is up on health and
personal care, food and beverages and sporting goods. Luxury
retailers are also doing well as their affluent clientele tends to be more
insulated from the ups and downs of the economy. Mid-level retailers
are still experiencing difficulties as middle income shoppers shift their
spending to discount retailers.
The LAEDC is forecasting moderate increases in taxable retail sales in
2012 that will range from 4.2% in Orange County to 3.2% in Los
Angeles County. San Diego and Ventura counties are both expected to
see an increase of 4.0% and in the Inland Empire, retail sales should
rise by 3.3%.
The retail real estate market will post more modest progress this year.
Growth will vary by sector and region. The areas that were hit hardest
by the housing crisis and are saddled with too much supply will be
slower to regain lost ground.
The risks to the forecast include slow employment and wage growth.
Inflation is muted and expected to remain tame during 2012. The
exception could be gasoline prices. Higher prices at the gasoline
pump curtail demand for more discretionary purchases. Gasoline
(and food) demand is relatively inelastic, that is people have to fill up
their gas tanks to get to work and put food on the table. High
unemployment and weak wage growth make it hard for retailers to
pass through cost increases, hurting their bottom line. Likewise, if
shoppers are faced with higher prices and lackluster income growth,
discretionary retail purchases could suffer as a result.
Index of Statistical Tables
LAEDC Kyser Center for Economic Research 102 Economic Forecast, February 2012
INDEX OF STATISTICAL TABLES
Table 1: U.S. Economic Indicators .................................................................................................. 13 Table 2: U.S. Interest Rates ............................................................................................................ 13 Table 3: Foreign Exchange Rates of Major U.S. Trading Partners………………………… ................ …….30 Table 4: Gross Product Comparisons ............................................................................................. 37 Table 5: California Economic Indicators ......................................................................................... 38 Table 6: California Nonfarm Employment ..................................................................................... 39 Table 7: California Regional Nonfarm Employment ...................................................................... 40 Table 8: Total Nonfarm Employment in Southern California ........................................................ 41 Table 9: California Technology Employment ................................................................................. 42 Table 10: Population Trends in California and the Los Angeles Five-County Area ........................ 43 Table 11: Los Angeles County Economic Indicators ....................................................................... 47 Table 12: Los Angeles County Nonfarm Employment ................................................................... 48 Table 13: Orange County Economic Indicators .............................................................................. 53 Table 14: Orange County Nonfarm Employment .......................................................................... 54 Table 15: Riverside-San Bernardino Area Economic Indicators ..................................................... 59 Table 16: Riverside-San Bernardino Area Nonfarm Employment ................................................. 60 Table 17: Ventura County Economic Indicators ............................................................................. 65 Table 18: Ventura County Nonfarm Employment ......................................................................... 66 Table 19: San Diego County Economic Indicators .......................................................................... 72 Table 20: San Diego County Nonfarm Employment ...................................................................... 73 Table 21: Median Existing Single-Family Home Prices ................................................................... 92 Table 22: Total Housing Permits .................................................................................................... 92 Table 23: Office Building Permits Issued ........................................................................................ 98 Table 24: Industrial Building Permits Issued .................................................................................. 98 Table 25: Retail Building Permits Issued ........................................................................................ 98 Table 26: Los Angeles County Retail Real Estate Market............................................................. 100

ATTACHMENT 8
DRAFT REQUEST FOR PROPOSAL FOR MANAGEMENT AND OPERATION OF
THE LOS ANGELES CONVENTION CENTER
REQUEST FOR PROPOSALS
MANAGEMENT AND OPERATION OF THE LOS ANGELES CONVENTION CENTER
FOR THE
CITY OF LOS ANGELES
ISSUED BY
CITY OF LOS ANGELES CITY ADMINISTRATIVE OFFICER
July xx, 2012
DRAFT MATERIAL – SUBJECT TO CHANGE ‐ NOT FOR DISTRIBUTION 1
Request for Proposals DATE ISSUED: July xx, 2012 TITLE: Management and Operation of the Los Angeles Convention Center DESCRIPTION: The City of Los Angeles (“City”) is seeking proposals from
experienced organizations or firms interested in managing and operating the Los Angeles Convention Center for the City.
DEADLINE FOR SUBMITTING PROPOSALS: Proposals must be
received as the address shown below by [two months after issue date] September xx, 2012, 5:00 p.m. (Pacific Time)
PROPOSAL DELIVERY ADDRESS: City Administrative Officer
Room 1500, City Hall East 200 North Main Street
Los Angeles, CA 90012 Attention: Diana Mangioglu
QUESTIONS REGARDING THE RFP PROCESS: Submit in writing via e-mail
to Diana Mangioglu at [email protected] no later than 5:00 p.m. (Pacific Time), August [one month after issue date] xx, 2012.
PROPOSERS’ CONFERENCE: A mandatory Proposers’
Conference will be held on day, August xx, 2012 [one month after issue date], 1:00 p.m. at 200 North Main Street, Room 1500, City Hall East, Los Angeles, CA 90012. All Proposers are required to attend.
DRAFT MATERIAL – SUBJECT TO CHANGE ‐ NOT FOR DISTRIBUTION 2
DRAFT MATERIAL – SUBJECT TO CHANGE ‐ NOT FOR DISTRIBUTION 3
REQUEST FOR PROPOSALS
MANAGEMENT AND OPERATION OF THE
LOS ANGELES CONVENTION CENTER
FOR THE CITY OF LOS ANGELES
July xx, 2012
TABLE OF CONTENTS Section Description Page I. INTRODUCTION 5
II. OBJECTIVE 5
III. GOALS 6
IV. FACILITY OVERVIEW AND FUTURE DEVELOPMENT 6
V. MANAGEMENT AND RESPONSIBILITIES 8
VI. PROPOSAL REQUIREMENTS 13
VII. COMMUNICATION PROTOCAL 26
VIII. PROPOSER EVALUATION 27
IX. AWARD OF CONTRACT 28
X. PROTEST PROCEDURES 30
XI. PROPOSERS’ CONFERENCE 31
XII. NEXT STEPS 31
ATTACHMENT I – GENERAL REQUIREMENTS
APPENDICES Appendix A Standard Provisions for City Personal Services Contracts (Rev 3-09) Appendix B Affirmative Action Plan Appendix C MBE/WBE/OBE Subcontractor Outreach Program Appendix D Headquarters/Workforce Information Appendix E Equal Benefits Ordinance Appendix F Contractor Responsibility Ordinance Appendix G Small and Local Business Program Appendix H Mayor’s Executive Directive Number PE-6 Appendix I Slavery Disclosure Ordinance Appendix J Bidder Certification CEC Form 50 Appendix K Limitations on Bidder Contributions and Fundraising Appendix L Worker Retention Workforce Appendix M Living Wage Ordinance
ATTACHMENT II - BOOKING POLICY ATTACHMENT III – DISCOUNT POLICY ATTACHMENT IV – HISTORICAL FINANCIAL DATA ATTACHMENT V – ORGANIZATIONAL CHART/STAFFING LEVELS/SALARIES BY POSITION ATACHMENT VI – THIRD PARTY SERVICE AGREEMENTS ATTACHMENT VII – LATCB CONTRACT ATTACHMENT VIII – LIST OF EXISTING FOOD/BEVERAGE LOCATIONS
DRAFT MATERIAL – SUBJECT TO CHANGE ‐ NOT FOR DISTRIBUTION 4
CITY OF LOS ANGELES REQUEST FOR PROPOSALS
FOR THE MANAGEMENT AND OPERATIONS OF THE LOS ANGELES CONVENTION CENTER
I. INTRODUCTION
The City of Los Angeles (City) seeks an experienced organization or firm to manage and operate the Los Angeles Convention Center (LACC) for the City. The City invites submittals from qualified firms that have proven experience in providing comprehensive management, operation and food and beverage services at major market convention or exhibition facilities. This Request for Proposal (RFP) is for consolidated services only. That is, proposers must agree to provide all of the above services. However, the City will consider a proposer’s use of affiliated companies, joint ventures, or subcontractors to provide consolidated services. At the conclusion of the RFP process described herein, and upon execution of an Alternative Management Structure Agreement (Agreement), the selected proposer will be responsible for the comprehensive management and operation of the LACC. The selected proposer shall be an independent contractor and shall furnish all management, supervision, labor, and any or all other services, as required by the City, consistent with generally accepted operations of a first-class convention center. The selected proposer shall be responsible for the maintenance of the land, building, furniture, fixtures and equipment; local marketing of the LACC; management of various product and service providers; coordination of LACC utilization, coordinating with the Los Angeles Tourism and Convention Board (LATCB), scheduling, negotiating and licensing of events with the assistance of the City Attorney and the City’s Risk Manager. Coordination of events and utilization of the LACC may also involve future Farmer’s Field events that will be addressed as part of a macro-booking policy for the greater campus area (including LACC, Staples, Farmer’s Field and LA Live); as well as any other responsibilities that may be required in the Agreement. The City is considering the creation of a Board of Commissioners (Board) to oversee and implement the City’s policies as it relates to tourism and convention business in Los Angeles. A Chief Executive Officer would be appointed to serve as a liaison to the Board, the Mayor and the City Council. The selected proposer would be reporting directly to the Chief Executive Officer and may be requested to participate in public discussions directed by the Board. It is the desired goal of the City to have an executed Agreement with the selected proposer no later than Spring 2013.
DRAFT MATERIAL – SUBJECT TO CHANGE ‐ NOT FOR DISTRIBUTION 5
II. OBJECTIVE
The City strives to operate a first-class, high-quality, state-of-the-art convention center that is competitive in the industry. The first priority is to meet the needs of citywide events including conventions and trade shows, and the second priority is to meet the needs of local events and activities including other trade shows, consumer shows, meetings, filming, entertainment, and community events. The City currently subsidizes the LACC’s debt service and related costs. The City strives to reduce the impact on the General Fund and is seeking proposers with operational plans that would limit the City subsidy and achieve cost savings by reducing the City’s subsidy.
III. GOALS In pursuing a private management alternative, the City has identified the following operational goals for the LACC. The intent of transitioning to a private management structure is to achieve these goals in a more timely and cost efficient manner than may be possible under the current management structure. Proposers should consider these goals an important part of the RFP process, as their ability to meet them will be carefully evaluated in the selection process.
Achieve the greatest possible financial returns, consistent with other City objectives, including maximizing the generation of hotel room occupancy and transient occupancy taxes.
Manage day-to-day operations of the LACC in a cost efficient, high quality and effective manner.
Manage operational expenses within annual operating budget approved by the City.
Provide superior services to patrons and visitors utilizing and attending events at the LACC, thereby maximizing customer satisfaction as exhibited by an industry-wide positive image and maximizing LACC re-bookings.
Develop and implement innovative initiatives to penetrate new markets, attract new events and promote the LACC to enhance usage and occupancy within the City’s booking policies.
Work cooperatively with THE LATCB in attracting citywide events including national conventions, tradeshows, and meetings to LACC, to better compete in the national marketplace.
Identify and implement initiatives to enhance LACC revenues, while ensuring that the LACC remains economically competitive with other convention centers.
DRAFT MATERIAL – SUBJECT TO CHANGE ‐ NOT FOR DISTRIBUTION 6
Procure and negotiate various contracts and agreements involving facilities, products and services related to the LACC, with the assistance of the City.
Properly maintain and safeguard the City's capital investment in the LACC through the exercise of the highest standards of maintenance and preservation, and, as the need arises, recommend capital improvements.
Respond to the ever changing needs of the community and users of the facility with recommendations for expansion, renovations and upgrades of services.
Achieve all objectives in a professional manner, consistent with industry best practices and all applicable laws and ordinances.
IV. FACILITY OVERVIEW AND FUTURE DEVELOPMENT
A. Facility Overview Owned and operated by the City, the LACC is one of the most efficiently designed and technologically advanced convention and exhibition facilities in the world. Its trademark glass and steel pavilions, which house the exhibition halls, towers and lobbies are conveniently linked by a meeting room concourse forming a grand unified center. The LACC opened in 1971 with 210,685 square feet of exhibit space, 21 meeting rooms and 9,230 square feet of pre-function/registration space. A major expansion was completed in 1993, adding 347,000 square feet of exhibit space, 43 meeting rooms and a 299-seat theater. Kentia Hall with 162,000 square feet of exhibit space was added in 1997. The LACC currently offers:
720,000 square feet of exhibit hall space 64 meeting rooms totaling 147,000 square feet and a 299-seat
presentation theater Sun-filled spacious lobbies with artworks by nationally recognized
artists Three food courts Full-service business center On-site parking for 5,600 vehicles including electrical charge stations Ample shuttle bus pick-up and drop-off areas Advanced fiber optics, power and data/network systems Marriott/Ritz Convention Center Headquarters Hotel Sports & entertainment venues including LA Live & Staples Center
DRAFT MATERIAL – SUBJECT TO CHANGE ‐ NOT FOR DISTRIBUTION 7
B. Proposed Convention Center Renovation Project and Downtown Event Center On August 9, 2011, the City Council adopted a Memorandum of Understanding (MOU) that outlines a development model in response to a proposal presented by the Anshutz Entertainment Group (AEG), to develop a 70,000-seat event center in Downtown Los Angeles (Project), immediately adjacent to the Staples Center on land currently occupied by the West Hall of the LACC. The MOU is a non-binding framework that will guide discussions on the Definitive Agreements, and the contractual documents that would implement the Project. The Project includes the construction of the New Hall and parking garages located on Cherry Street and Bond Street, followed by demolition of the West Hall and construction of the event center. The event center would host a National Football League (NFL) team, concerts, and other sports and entertainment events. The selected proposer shall be an active participant and a representative of the LACC on matters that involve, but are not limited to, facility design, operations and management, coordination and policy. The City anticipates to return to the City Council by August 2012. Concurrently the Council will consider the environmental review conducted as part of the California Environmental Quality Act. If approved by the Council, the City anticipates the following timeline: Summer 2013 Initiate construction of the New Parking Structures and
New Hall upon execution of contract between AEG and an NFL team
Summer/Fall 2014 Opening of the New Parking Structures and New Hall and
Initiate construction of the Event Center Summer 2016 Opening of the Event Center
V. MANAGEMENT AND RESPONSIBILITIES A. City of Los Angeles The CAO will be the City’s representative and contract administrator. The CAO will oversee the performance of the City’s responsibilities and obligations under the contract including, but not limited to, the following: 1. Funding the annual debt service for the Convention Center through the
annual City budget process;
DRAFT MATERIAL – SUBJECT TO CHANGE ‐ NOT FOR DISTRIBUTION 8
2. Monitoring the selected proposer’s performance on a regular basis through quarterly reports and periodic audits by the City Controller to review the performance and finances;
3. Reviewing and forwarding annual reports from the selected proposer to
the Mayor and Council;
4. Approve all agreements necessary for the operations of the LACC, as set forth in the Agreement;
5. Oversee capital repair and replacement efforts; and
6. Approve pricing, policies and other arrangements necessary for the
operations of the LACC. B. LATCB The City has hired LATCB to provide citywide marketing services for the purposes of generating a local economic benefit and attracting overnight visitors that will support Transient Occupancy Tax (TOT) revenues. LATCB is also actively involved in booking citywide conventions and meetings at the LACC. The selected proposer will work with LATCB in coordinating bookings and supporting efforts that attract citywide events. The mission of LATCB is to advance the local economy by marketing and selling Los Angeles as the premier destination for conventions, events and leisure travel worldwide. The LATCB is a private, nonprofit 501(c)(6) business association contracted by the City. The LATCB receives an amount equivalent to one percent of the TOT. Headquartered in Los Angeles and staffed with 75 employees, LATCB has sales representation throughout the United States. The LATCB also maintains international marketing offices in alliance with Los Angeles World Airports (LAWA) in Tokyo, London and Beijing. In particular, the LATCB represents the Los Angeles destination to the meetings and convention industry nationwide; the international travel trade and traveler; the cruise passenger and cruise lines; the domestic leisure traveler; as well as the worldwide travel media.
C. Selected Proposer The Agreement may include and is not limited to the following items.
DRAFT MATERIAL – SUBJECT TO CHANGE ‐ NOT FOR DISTRIBUTION 9
MANAGEMENT
1. The selected proposer shall manage and operate the LACC in accordance with policies approved by the City. The selected proposer shall be responsible for all day-to-day functions and operations of the LACC and shall operate the LACC at all times in the public interest and in accordance with the highest professional and ethical standards. Day-to-day functions include, but are not limited to:
Food service Parking Grounds keeping Custodial and building maintenance services Security Booking/scheduling within an agreed upon window Sales and marketing Advertising/sponsorship Event setup and take down Event coordination/supervision Event services Staff scheduling Staff training Box office operations/ticketing Information technology services Web site maintenance Financial and administrative services such as accounting, budgeting,
purchasing, personnel, and contracting of outside services
2. The selected proposer shall be responsible for recommending to the City
or its authorized representatives, all rental rates, fees, and charges for services provided throughout the LACC.
3. The selected proposer shall establish an effective system of
communication that encourages linkages and collaborative efforts between the LACC and other segments of the hospitality industry, including the LATCB, the Los Angeles hotel industry and other visitor industry segments.
4. The selected proposer will administer, negotiate and execute agreements
with service providers, subcontractors, and licensees. The selected proposer shall work with the City Attorney in developing a standard license agreement. Non-standard license agreements shall be reviewed by the City Attorney as to form and legality. The City shall administer the procurement for agreements that in the City’s opinion may create potential conflicts of interests for the selected proposer. Agreements that may have
DRAFT MATERIAL – SUBJECT TO CHANGE ‐ NOT FOR DISTRIBUTION 10
a private business use impact shall be reviewed by the City’s Bond Counsel. The City’s Risk Manager shall determine the insurance requirements.
5. The selected proposer shall be responsible for and pay all federal, county,
city and state taxes arising as a result of the Agreement. 6. The selected proposer shall constantly endeavor to improve the operation
of the LACC and to provide the most efficient and highest quality in service to customers, minimizing operating costs, while increasing the quality of maintenance and security, and maximizing gross receipts without negatively impacting exhibitor or show manager costs.
7. The selected proposer shall require that its employees maintain a
professional appearance and conduct him or herself in a business-like manner consistent with the requirements of the Agreement.
8. The selected proposer shall maintain the tax exempt status of outstanding
bonds which financed and refinanced the LACC by entering into a contract that complies with IRS Revenue Procedure 97-13.
FOOD AND BEVERAGE
The food and beverage service at the LACC must continue to provide the highest level of service and product selection and be able to support high end demand catering functions. In addition, the program must reflect the stature of Los Angeles as a leading international city that is committed to environmental stewardship. Contractors submitting proposals must be mindful of competition from branded upscale restaurants located within LA Live. Therefore, the City is looking for a management company that is able to upgrade the foodservices at the LACC to encourage conventioneers and other attendees to remain in the facility at meals periods and use the center’s culinary sales locations. 1. The selected proposer will be responsible for the operation of all
mobile/fixed concession stands; all catering and banquet services; all meeting rooms with supporting areas; and all other services associated with food/beverage sales.
2. The selected proposer shall be responsible for the purchase, storage,
preparation, sales, marketing and service of food, alcoholic and non-alcoholic beverages as well as other related food items for LACC catered and non-catered events.
DRAFT MATERIAL – SUBJECT TO CHANGE ‐ NOT FOR DISTRIBUTION 11
3. The selected proposer should operate food/beverage facilities that consistently provide the highest level of service, product selection, customer satisfaction and revenue generation.
LACC MARKETING The selected proposer shall establish a positive relationship with the LATCB,
LA Live, area associations, hotels, and other appropriate agencies to develop and engage in advertising, solicitation and promotional activities, as required to develop the full potential of the LACC. The marketing responsibilities shall consist primarily of those activities performed to attract events within the adopted operating policies in existence, and to support the LATCB for events that it books on behalf of the City and in cooperation with the selected proposer. The selected proposer will develop printed promotional material and maintain the LACC website.
MAINTENANCE AND REPAIR
1. The selected proposer will have responsibility for preventative maintenance, general maintenance and repair. The interior, exterior, and infrastructure of the physical facility and grounds will be maintained by the selected proposer. The selected proposer shall also be responsible for informing the City of degraded conditions. The proposer is further responsible for taking all actions necessary to maintain the validity of all warranties and for ensuring that repairs to any part of the LACC or Furniture, Fixtures and Equipment (FF&E) that is under warranty is accomplished under the warranty.
2. All areas of the LACC are to be kept clean, orderly, attractive, and sanitary
at all times. 3. No alterations or additions shall be made to the LACC, or any part thereof,
without first having obtained the written consent of the City's Contract Administrator or an authorized representative. Authorized alterations or additions shall become the property of the City at the expiration date/or termination of the Agreement.
4. The selected proposer shall not remove any FF&E furnished to the LACC
without the written consent of the City. 5. The selected proposer shall replace, at its own expense, any FF&E
provided under the Agreement that has been destroyed or damaged with like equipment.
6. At the conclusion of the term of the negotiated agreement, the selected
proposer shall be responsible for returning the LACC and FF&E to the City
DRAFT MATERIAL – SUBJECT TO CHANGE ‐ NOT FOR DISTRIBUTION 12
in the same condition in which they were provided, except for normal wear-and-tear.
SIGNAGE AND ADVERTISING
No signs or advertising identifying the selected proposer or its subcontractors shall be placed on the premises unless provided by written approval by the City's Contract Administrator or authorized representative.
MAINTENANCE OF RECORDS AND REPORTS
The selected proposer must maintain accurate and complete books and records relating to the Convention Center, including all revenues and expenditures in accordance with generally accepted accounting principles. The City shall have the right to inspect and audit such books and records at reasonable times during normal business hours and upon reasonable prior notice to the selected proposer. The selected proposer must agree to allow the City Controller to audit and permit access to all financial and other records. All such books and records shall be maintained by the selected proposer in accordance with City record retention policies. Quarterly status reports to the City, due within 15 working days after the end of the quarter, will be required of the selected proposer during the term of the agreement and will include the following information: Financial statements; Booked and licensed events; Major issues encountered and proposed solutions; Future problem areas and recommended countermeasures. The selected proposer will be required to submit annual unaudited financial statement of operations of the LACC within 90 days after the end of the fiscal year and annual independent auditor’s reports prepared by a certified public accountant within 180 days after the end of the fiscal year. Additionally, the selected proposer will be required to inform the City within three days after the selected proposer becomes aware of any substantial change in key personnel, major problems or inability to fully comply with any contract provision. The selected proposer must inform the City within five days after it learns of a likely litigation or receives notice of claim, report of litigation or serious personal injury to any person at the Convention Center. The selected proposer must inform the City within 10 days of learning of any material damage to City property at the LACC.
DRAFT MATERIAL – SUBJECT TO CHANGE ‐ NOT FOR DISTRIBUTION 13
LACC GENERAL MANAGER
The LACC shall be operated by a competent, selected general manager capable of, and empowered to operate the LACC and to be responsive to the desires and directives of the City in the areas of contract enforcement, scheduling, personnel relations and any and all other matters pertinent to the operation and management of the LACC. It is expressly understood that the General Manager of the LACC will be located on-site.
CONFIDENTIALITY OF INFORMATION
All information and data furnished to the selected proposer by the City, and all other documents to which the selected proposer’s employees have access during the term of the agreement, shall be treated as confidential information to the extent permitted by law, and any oral or written disclosure to unauthorized individuals except as permitted by law, is prohibited. Because the City will continue ownership of the Convention Center, including but not limited to grounds, parking structures and facility, the selected proposer is obligated to provide public access to information that is normally considered a matter of public record at any publicly-owned facility.
VI. PROPOSAL REQUIREMENTS This section will explain the procedure which will be followed by all proposers. Proposers are cautioned to carefully read and follow the procedures required by this section. Material deviations from these requirements may cause rejection of proposals.
All proposers must submit: One (1) original proposal and a cover letter, each signed in ink, six (6) unbound
hard copies and one (1) electronic copy in the form of a compact disk or flash drive. Proposal package must be hand-or-courier delivered in a sealed package by 5:00 PM PST on September xx, 2012, to the following address:
Office of the City Administrative Officer Attention: Diana Mangioglu 200 N. Main Street City Hall East, Room 1500 Los Angeles, CA 90012-4190
In addition, all proposers must supply one unbound copy of their proposal with any redacted sections “blacked out” (see Section X – Confidential Information), for a total of seven unbound copies. The “blacked out” copy will be used to respond to a request under the California Public Records Act pursuant to applicable provisions.
DRAFT MATERIAL – SUBJECT TO CHANGE ‐ NOT FOR DISTRIBUTION 14

Persons who hand-deliver proposals shall be issued a “Notice of Receipt of Proposal.” The original copy of proposals submitted will be marked with a time and date stamp. Timely submission of proposals is the sole responsibility of the proposer. The City reserves the right to determine the timeliness of all submissions. Late proposals will not be reviewed. All proposals submitted after the deadline will be returned unopened to proposers.
The copies must be numbered on the upper right hand side of the cover to indicate “Copy No.” Each copy must include all forms, attachments, appendices, exhibits and cover letter. All pages must be firmly secured. Pages should be double-sided. Neon or fluorescent paper shall not be used in any written documents submitted. Proposals should be typed and may be bound in a three-ring binder, without card stock or colored paper. Submitted materials will not be returned to the sender after the proposals have been opened.
A. Written Submissions Format
To be considered responsive, a proposal must be submitted in writing. All applicable documents, including forms, attachments, appendices and exhibits to this RFP, must be completed, signed and returned with the proposal. Each page of the proposal, including exhibits, must be numbered sequentially at the bottom of the page to indicate Page __ of __ . Proposals must be submitted in the English language in accordance to the following standards. Font size – 12 points Margins – At least 1 inch on all sides Line spacing – Single-spaced Plain white paper Numerical data must be in the English measurement system; costs must be in United States dollars.
Please use the indicative mood (will, shall, etc.) in narratives rather than the
subjective (would, should, etc.) so that proposals can be easily converted to contract form.
B. Detailed Company Information – Cover Letter
Each proposal must be accompanied by a cover letter limited to one page that references the title of this RFP and includes the following detailed company information: 1. Full legal name of the proposer;
DRAFT MATERIAL – SUBJECT TO CHANGE ‐ NOT FOR DISTRIBUTION 15
2. Legal business status (individual, partnership, corporation, etc.),
address, telephone number, fax number and e-mail of the person(s) authorized to represent the proposer and each collaborator;
3. If proposer is a corporation, partnership, LLP, LLC, etc., identify the
state under whose laws proposer is organized. Otherwise, if proposer is an individual, identify the state where proposer is domiciled;
4. Name, title, email address, telephone number and mailing address of
the person or persons who will be the primary contact and is authorized to represent the proposer in order to enter into negotiations with the City with respect to the RFP and any subsequent awarded contract. The cover letter must also indicate any limitation of authority for any person named;
5. Identify the individual or firm which prepared or assisted in preparing
the proposal. If that individual or firm will not participate in the implementation of the project, describe how the transfer of responsibility will occur to ensure timely implementation;
6. State that the proposal is in response to this RFP and will remain firm
for a period of one hundred twenty (120) days from its due date and thereafter until the proposer withdraws it, or a contract is executed, or the procurement request is terminated by the City, whichever occurs first; and
7. Be signed in accordance with Section VI (D).
C. Table of Contents
Show page locations of each heading of the required content as well as additional exhibits provided as a part of the proposal.
D. Narratives Responses to this RFP must be made in accordance with the requirements set forth herein. Failure to adhere to these requirements may be cause for rejection of the proposal as non-responsive. In completing the narratives and exhibits, including the budget, clearly identify the services to be provided, the service provider, and the demonstrated ability of subcontractors, if any. This outline is not all-inclusive and professional management companies can add information as deemed appropriate. In order to ensure a uniform review process and to obtain the maximum degree of comparability, the proposals must be organized in the following manner:
DRAFT MATERIAL – SUBJECT TO CHANGE ‐ NOT FOR DISTRIBUTION 16
BACKGROUND AND PROJECT SUMMARY Provide a description of the proposer’s overall philosophy and approach for the management and operation of the LACC. Provide information describing the proposed strategies, policies and procedures to be employed in managing the LACC that clearly addresses the scope of services presented in this RFP. FIRM QUALIFICATIONS
a) Summarize the proposer’s experience and number of years in managing
and operating major market exhibition facilities or convention centers, including a list of current and former clients. Include a minimum of three references for facilities managed by the proposer, including name, mailing address, e-mail address and telephone numbers of key individuals who may be contacted. Also, include the listing and size of other facilities/centers the proposer has managed. A minimum of five (5) years experience managing and operating similar major market exhibition facilities or convention centers is required. A firm that has not been in operation for the minimum of five (5) years may present a submittal so long as the key personnel can demonstrate the minimum of five (5) years of upper-level management experience of major market exhibition facilities or convention centers.
b) Proposers should have a minimum of five (5) years of selected experience
providing food and beverage services, inclusive of full-service catering operations, in a similar major market exhibition facility or convention center with gross food/beverage sales of at least $10 million or more per year, per facility.
c) Similar facilities for subsection a) and b) are defined as a major market
exhibition facility or convention center of 300,000 - 700,000 gross square feet with approximately 200,000 – 500,000 square feet of exhibition space and 100,000 – 200,000 square feet of ballroom and meeting room space.
CORPORATE MANAGEMENT QUALIFICATIONS Proposers will be required to detail the experience and qualifications of the proposer's corporate management team and include resumes outlining the experience, education, and performance record of individuals who will have supervisory responsibility over the LACC. Address any plans to provide home office and corporate regional support to the proposer’s resident LACC manager for LACC events with unusual requirements, as well as any type of recurring support that the proposer will provide to its proposed manager.
DRAFT MATERIAL – SUBJECT TO CHANGE ‐ NOT FOR DISTRIBUTION 17
MARKETING PLAN a) Provide a summary of components of a marketing plan that you would
consider for use at the LACC. Discuss elements that address proposer’s innovative and creative approach to the unique conditions with respect to the LACC. Focus your discussion on your strategy for marketing short-term events that are the proposer’s responsibility as well as how you envision supporting the marketing efforts of the LATCB. Provide specific approaches for working with the LATCB on improving short and long-term bookings.
b) Provide a brief description of the proposer’s experience in working with
Destination Marketing Organizations, including detail as to programs, goals and results for selected projects that distinguish the proposer's ability to work in conjunction with these organizations.
STAFFING AND ORGANIZATION PLAN
a) Submit an organizational chart that outlines the proposed staffing plan for
the LACC. Provide descriptions of functional responsibilities as appropriate to ensure understanding of each part of the organization.
b) Submit position descriptions for its key personnel proposed to be assigned
to the LACC operations, food and beverage, marketing and financial areas including, at a minimum, the facility manager, the director of operations, the executive chef, the director of food and beverage, the director of marketing, director of sales and the director of finance. (The position titles used herein are for example only and are not intended to define or describe an organizational structure.) The proposal must adequately describe each proposed individual’s qualifications and experience.
c) Identify at least three (3) candidates for General Manager who will have
overall responsibility for the operation of the LACC on a day to day basis. Each candidate must demonstrate extensive experience with operations of large exhibition and convention center facilities. Proposers are encouraged to provide several highly qualified candidates. Provide a description of the process you will follow which allows the City the opportunity to meet and evaluate your proposed candidates. The City will have the ultimate approval authority of the General Manager position throughout the life of the agreement.
SUBCONTRACTOR INFORMATION AND QUALIFICATIONS Identify those services the selected proposer may elect to subcontract. While certain of these subcontractors may not be identified until after award of the
DRAFT MATERIAL – SUBJECT TO CHANGE ‐ NOT FOR DISTRIBUTION 18
Agreement, the selected proposer must identify the specific service, roles and responsibilities of the subcontractor. FOOD AND BEVERAGE OPERATIONS It is the City’s intent to provide food and beverage services and related customer service at the highest quality. Please describe your approach to providing food and beverage operations at the LACC. If you plan on providing food and beverage operations through a division or subsidiary company controlled by the management company, please detail what fees and profits the parent company will earn and how the management company will be able to control their own affiliate.
Describe your approach to pricing, quality, variety, purchasing procedures, surplus/loss, delivery approaches, vendors (including branded food/beverage vendors) and operating procedures. Provide examples of specialty food items which it believes would work well at the LACC. Provide a proposed menu and proposed pricing schedule for the public food areas at the LACC including cafes and concession stands. Provide sample banquet/catering menus with pricing for breakfasts, lunches, and dinners. OPERATIONS AND MANAGEMENT a) Operations Plan - Provide an operational plan that describes the operating
policies and procedures for managing and operating the LACC, including approaches related to security, customer service, repair and maintenance and other primary building functions. Describe training programs offered to staff. Describe your firm’s approach to financial management, risk management, life/safety management, employee management and administrative policies and procedures. Describe your firm’s event management and accounting systems and provide sample records illustrating the capabilities of your system (include samples of monthly and annual reports). Describe your firm’s approach to implement and maintain an effective system of internal controls.
b) Management Plan - Submit the key elements of a management plan for the
LACC to include considerations for cost containment/expense reduction, revenue enhancement (including non-operating revenue sources), customer service improvement, improvements to building maintenance procedures, and other key LACC operational characteristics.
FINANCIAL PRO FORMA Provide an estimated financial pro forma for LACC operations for the contract term. The pro forma should itemize estimated revenues and expenses by major line item as well as supporting assumptions related to LACC operations
DRAFT MATERIAL – SUBJECT TO CHANGE ‐ NOT FOR DISTRIBUTION 19
including a summary of event activity for the length of the contract. Provide your strategy for minimizing the operating expenses and maximizing the annual operating revenues. Discuss the financial package you would likely provide for your employees in terms of annual salary, bonus/incentive compensation, and benefit package of employees. Copies of the Convention Center’s previous budget are available upon request. All revenues derived from the operations of the Convention Center shall be used solely for the operation and enhancement of the Convention Center. Proposers must ensure that any proposed revenue-generating activities are in compliance with the City’s policies. PREVENTATIVE MAINTENANCE PROGRAM Provide Preventive Maintenance Programs (PMP) for the proposed term of the Agreement. Please provide examples of a PMP in effect at comparable facilities managed by proposer. Include in the program proposer’s methods for assuring that all maintenance work is scheduled, completed, documented, and performed in a manner that is consistent with generally accepted standards for building maintenance. TRANSITION PLAN Submit an overview of key elements of a transition plan, which shall include:
A plan to interview and consider for hire LACC City employees as employees of the proposer;
Recommendations for transitioning financial systems; and The anticipated timeframe for execution of the transition plan for
complete handover of LACC operations to the selected proposer. Unless approved for an exemption, contractors under contracts primarily for the furnishing of services to or for the City and that involve an expenditure or receipt in excess of $25,000 and a contract term of at least three (3) months, lessees and licensees of City property, and certain recipients of City financial assistance, shall comply with the provisions of Los Angeles Administrative Code Sections 10.37 et seq., Living Wage Ordinance (LWO) and 10.36 et seq., Service Contractor Worker Retention Ordinance (SCWRO). Proposers shall refer to Appendix x and xx “Living Wage Ordinance” and “Service Contractor Worker Retention Ordinance” for further information regarding the requirements of the Ordinances. Proposers who believe they meet the qualifications for one of the exemptions described in the LWO List of Statutory Exemptions shall apply for exemption from the Ordinance by submitting with their proposal the Bidder/Contractor
DRAFT MATERIAL – SUBJECT TO CHANGE ‐ NOT FOR DISTRIBUTION 20
Application for Non-Coverage or Exemption (Form OCC/LW-10), or the Non-Profit/One Person Contractor Certification of Exemption (OCC/LW-13). The List of Statutory Exemptions, the Application and the Certification are included as Appendix x. FEE PROPOSAL State the following: (i) the annual management fee required to operate the LACC (inclusive of fixed and variable fees), and (ii) a proposed incentive fee component. Together, these two fees would constitute the proposer’s total compensation for performance under the contract. The LACC is financed with tax-exempt bonds. Additional tax-exempt bonds may be issued in the future to finance additions and/or improvements on the LACC. Thus, the final agreement between the City and the selected provider of management and operational services must comply with federal tax laws that restrict the “private business use” of facilities financed with tax-exempt bonds. Proposers will be required to ensure that their proposals are in full compliance with IRS procedures and guidelines and federal tax laws governing private business use of facilities financed with tax-exempt bonds, and the proposed term should not exceed five years. Proposers are expected to adhere to IRS Safe Harbor provisions found in Revenue Procedure 97-13 and proposals should include an analysis of the basis on which the provider believes its proposed contract terms comply with this Revenue Procedure.
The term of the Agreement will be for five years. The City intends, effective the last day of the third year, and anytime thereafter, to have the right to terminate the Agreement with or without cause and without payment of any penalty, fee or premium. Cancellation without cause may be exercised by the City after the initial three years of the Agreement, as mandated by the applicable IRS regulations.
a) Fixed Fee: Propose a compensation arrangement, which includes an
annual fixed management fee. Proposers must indicate whether or not all or any part of the Executive Management (facility manager(s) and directors) salary(ies) is to be derived from the management or incentive fees. Any portion of Executive Management (facility manager(s) and directors) salary(ies) which is not derived from the management or incentive fee must be included in the staffing plan and proposed operating budgets for the LACC.
b) Incentive Fee: Propose an incentive fee, which shall be applicable during
the operating period of the Agreement. The incentive component is designed to reward superior performance in the areas of customer satisfaction, innovative and selected marketing, revenue enhancement,
DRAFT MATERIAL – SUBJECT TO CHANGE ‐ NOT FOR DISTRIBUTION 21
cost containment, and facility maintenance. The incentive is to be based on goals which exceed historical and currently contracted performance levels. Provide a proposal for the basis of these incentives, which will be finalized though negotiation with the City. In providing a proposal for an incentive fee arrangement, reference again is made to Revenue Procedure 97-13 which restricts the types of incentive or variable fees which may be included in a contract designed to comply with these safe harbors.
c) Capital Investment: Provide the dollar amount and plan for how that money will be allocated and what it is expected to generate in terms of new revenues. The Proposer must submit a financial pro forma as described in more detail earlier in this section of the RFP. Due to the nature of the RFP and the information provided, it is understood that any pro formas and proposed compensation structure will be subject to further negotiation, review, and clarification of the detailed financial information.
FINANCIAL SUSTAINABILITY Provide the following financial documents. Items one (1) through six (6) below must be audited financial statements in US GAAP. 1. Balance Sheets for prior three years. 2. Income Statements for the prior three years. 3. Statements of Cash Flows for the prior three years. 4. Statement of changes in stockholder's equity for the prior three years. 5. Notes to Financial Statements. 6. Corporate/partnership federal income tax return for the last completed fiscal year. 7. Credit report (e.g., Dun & Bradstreet report). 8. Credit history letter(s) from financial institution(s). 9. Most recent quarterly financial statement. In any event, should the City require additional evidence of financial stability other than what is submitted, the proposers will be expected to provide such acceptable evidence in order for their proposer to be considered responsive to this RFP. APPROACH TO ENVIRONMENTAL SUSTAINABILITY Summarize the approach to ensuring environmental sustainability as part of the operations of the LACC, and with respect to capital repairs to the extent the proposer has been involved in such projects. Reference specific examples of sustainability initiatives employed at other centers managed by
DRAFT MATERIAL – SUBJECT TO CHANGE ‐ NOT FOR DISTRIBUTION 22
the proposer, and describe their approach to maintain the LACC’s LEED certification. TERMINATED CONTRACTS List any contracts of the proposer for management and operation services of a facility that were terminated or not renewed within the past ten (10) years, including reasons for termination or non-renewal and whether the termination or non-renewal was initiated by the proposer or the facility.
D. Signature Requirements
All documents, forms, attachments, appendices, and exhibits, including the cover letter, must be signed by a representative or officer of the proposer. That representative shall have authority to bind the proposer to all provisions of the proposal, the RFP, any subsequent changes, and to the contract if an award is made. If the proposer is a partnership, the proposal and cover letter must be signed in the name of the partnership by a general partner thereof. If the proposer is a corporation, the proposal and cover letter must be signed on behalf of the corporation by two (2) authorized officers (a Chairman of the Board, President or Vice-President and a secretary, treasurer or chief financial officer) or an officer authorized by the Board of Directors to execute such documents on behalf of the corporation. All the above signatures must be original and in ink.
E. General Proposal Conditions
1. Costs Incurred by Proposers
All costs of proposal(s) preparation shall be borne by the proposer. The City shall not, in any event, be liable for any pre-contractual expenses incurred by proposers in the preparation and/or submission of the proposals. Proposals shall not include any such expenses as part of the proposed budget. The City will not provide parking, clerical, office/storage space, telephone services or reproduction services throughout the proposal process.
2. Best Offer
The proposal shall include the proposer’s best terms and conditions. Submission of the proposal shall constitute a firm and fixed offer to the
DRAFT MATERIAL – SUBJECT TO CHANGE ‐ NOT FOR DISTRIBUTION 23
City that will remain open and valid for a minimum of one hundred and twenty (120) days from the submission deadline.
3. Accuracy and Completeness
The cover letter and proposal must set forth accurate and complete information as required in this RFP. Unclear, incomplete, and/or inaccurate documentation may not be considered. Falsification of any information may result in disqualification from the selection process, or in termination of a contract, if discovered in the future. If a proposer knowingly and willfully submits false performance or other data, the City reserves the right to reject the proposal. If it is determined that a contract was awarded as a result of false performance or other data submitted in response to this RFP, the City reserves the right to terminate the contract. Portions of a proposal that include content from this RFP that have been altered in any manner must be footnoted and referenced in a separate appendix to the proposal. Unnecessarily elaborate or lengthy proposals or other presentations beyond those needed to give a sufficient, clear response to all the RFP requirements are not desired.
4. Withdrawal of Proposals
Proposals may be withdrawn by written request of the authorized signatory on the proposer’s letterhead or by telegram at any time prior to the submission deadline.
5. General City Reservations
a. The City reserves the right to extend the submission deadline should this be in the interest of the City. Proposers have the right to revise their proposals in the event that the deadline is extended. In the event this date is changed, notice will be posted on the City’s Business Assistance Virtual Network (BAVN) at www.labavn.org.
b. The City reserves the right to withdraw this RFP at any time without
prior notice. The City makes no representation that any contract will be awarded to any proposer responding to the RFP. The City reserves the right to reject any or all submissions.
c. If an inadequate number of proposals is received or the proposals
received are deemed non-responsive, not qualified or not cost effective, the City may at its sole discretion reissue the RFP or execute a sole-source contract with a vendor.
d. The City shall review and rate submitted proposals. The proposer
may not make any changes or additions after the deadline for
DRAFT MATERIAL – SUBJECT TO CHANGE ‐ NOT FOR DISTRIBUTION 24
receipt of proposals. The City reserves the right to request additional information or documentation, as it deems necessary.
e. The City reserves the right to verify all information in the proposal.
If the information cannot be verified, and if the errors are not willful, the City reserves the right to reduce the rating points awarded.
f. The City reserves the right to require a pre-award interview. g. The City reserves the right to waive minor defects in the proposal in
accordance with the City Charter. h. If the selection of the proposer is based in part on the qualifications
of specific key individuals named in the proposal, the City must approve in advance any changes in the key individuals or the percentage of time they spend on the project. The City reserves the right to have the contractor replace any project personnel.
6. Contract Negotiations
Proposers approved for funding shall be required to negotiate a contract with the City on an offer/counter-offer basis. The best terms and conditions originally offered in the proposal shall bind the negotiations. The City reserves the right to make a contract award contingent upon the satisfactory completion by the proposer of certain special conditions. The contract offer of the City may contain additional terms or terms different from those set forth herein.
7. Standing of Proposer
a. Regardless of the merits of the proposal submitted, a proposer may not be recommended for funding if it has a history of contract non-compliance with the City or any other funding source, poor past or current contract performance with the City or any other funding source, or current disputed or disallowed costs with the City or any other funding source.
b. Contractors/Organizations that have been sanctioned because of
non-compliance with Single Audit Act requirements for managing grant funds will be eligible to apply; however, they will not be eligible to receive any funding, if awarded under this RFP process, until this sanction is removed.
c. The City will enter into an agreement only with entities that are in
good standing with the California Secretary of State.
DRAFT MATERIAL – SUBJECT TO CHANGE ‐ NOT FOR DISTRIBUTION 25
8. Proprietary Interests of the City
The City reserves the right to retain all submitted proposals which shall then become the property of the City and a matter of public record. Any department or agency of the City has the right to use any or all ideas presented in the proposal without any change or limitation. Selection or rejection of a proposal does not affect these rights. All proposals will be considered public documents, subject to review and inspection by the public at the City’s discretion, in accordance with the Public Records Act.
9. Confidential Information
Proposals made in response to this RFP may contain technical, financial, or other data whose public disclosure could cause substantial injury to the proposer’s competitive position or constitute a trade secret. To protect such data from disclosure to the extent permitted by law, the proposer should specifically identify the pages of the proposal that contain confidential information by properly marking the applicable pages and inserting the following notice in the front of the proposal: “NOTICE”
“The data on the pages of this proposal identified by an asterisk (*) or marked along the margin with a vertical line, contain information which are trade secrets and/or whose disclosure would cause substantial injury to the proposer’s competitive position. The proposer requests that such data be used only for the evaluation of its proposal, but understands that disclosure will be allowed to the extent that the City determines that the data or information is not confidential and must be released pursuant to federal, state, or local law.”
In proposals containing proprietary information, proprietary paragraphs and/or data should be clearly marked as noted above. The proposer must include one additional unbound copy of the proposal with the confidential material totally blacked out or removed from the text so that one copy is available as public material. In accordance with the California Public Records Act, this information may, upon request, be released to the public including the blacked out or removed material if determined by the City that disclosure pursuant to the law is required.
DRAFT MATERIAL – SUBJECT TO CHANGE ‐ NOT FOR DISTRIBUTION 26
The City assumes no responsibility for disclosure or use of unmarked data for any purposes. In the event properly marked data are requested, the proposer will be advised of the request and may expeditiously submit to the City a detailed statement indicating the reasons it has for believing that the information is exempt from disclosure under federal, state, and local law. The City will exercise care in applying this confidentiality standard, but will not be held liable for any damage or injury that may result from any disclosure that may occur. The proposer agrees to assume and pay for all costs incurred by the City, including attorneys’ fees awarded by the court, if proposer requests the City to resist disclosure of material provided to the City by the proposer, provided the City determines the said materials are exempt under federal, state, and local law. Further should a proposer request that portions of the proposal remain confidential and not be disclosed, the proposer must conform assurance to indemnify, defend and hold harmless the City by including the following statement in the cover letter: “The proposer agrees to indemnify the City and its officers,
employees and agents and hold them harmless from any claim or liability and will defend any action brought against the City for its refusal to disclose copyrighted material, trade secrets, or other proprietary information to any person making a request therefore.”
Failure to include such a statement shall constitute a waiver of a proposer’s right to exemption from disclosure. Note that wholesale use of headers/footers bearing designations such as “confidential”, “proprietary”, or “trade secret” on all or nearly all of a proposal is not acceptable, and may be deemed by the City as a waiver of any exemption claim. The identification of exempt information must be more specific.
10. Assurances
As a condition to the award of financial assistance from the Department of Labor under Title I of WIA, the grant applicant assures that it will comply fully with the nondiscrimination and equal opportunity provisions of the following laws: a. Section 188 of the Workforce Investment Act of 1998 (WIA), which
prohibits discrimination against all individuals in the United States on the basis of race, color, religion, sex, national origin, age, disability, political affiliation or belief, and against beneficiaries on the basis of either citizenship/status as a lawfully admitted
DRAFT MATERIAL – SUBJECT TO CHANGE ‐ NOT FOR DISTRIBUTION 27
immigrant authorized to work in the United States or participation in any WIA Title I financially assisted program or activity;
b. Title VI of the Civil Rights Act of 1964, as amended, which
prohibits discrimination on the basis of race, color and national origin;
c. Section 504 of the Rehabilitation Act of 1973, as amended, which
prohibits discrimination against qualified individuals with disabilities;
d. The Age Discrimination Act of 1975, as amended, which prohibits
discrimination on the basis of age. e. The grant applicant also assures that it will comply with 29 CFR
Part 37 and all other regulations implementing the laws listed above. This assurance applies to the grant applicant’s operation of the WIA Title I financially assisted program or activity, and to all agreements the grant applicant makes to carry out the WIA Title I financially assisted program or activity. The grant applicant understands that the United States has the right to seek judicial enforcement of this assurance.
11. Limitations on Bidder Contributions and Fundraising
Bidders must submit CEC Form 55 (provided in Appendix X) to the awarding authority at the same time the response is submitted. The form requires bidders to identify their principals, their subcontractors performing $100,000 or more in work on the contract, and the principals of those subcontractors. Bidders must also notify their principals and subcontractors in writing of the restrictions and include the notice in contracts with subcontractors. Responses submitted without a completed CEC Form 55 shall be deemed non-responsive. Bidders who fail to comply with City law may be subject to penalties, termination of contract, and debarment. Additional information regarding these restrictions and requirements may be obtained from the City Ethics Commission at (213) 978-1960 or ethics.lacity.org.
E. General Requirements
The proposal must conform to the “General Requirements” included in the Attachment. PROPOSERS ARE STRONGLY ENCOURAGED TO READ THE GENERAL REQUIREMENTS CAREFULLY AND TO PROVIDE ALL REQUESTED INFORMATION.
DRAFT MATERIAL – SUBJECT TO CHANGE ‐ NOT FOR DISTRIBUTION 28
VII. COMMUNICATION PROTOCAL Throughout the course of the City’s process to award the Contract, the following communications protocol will apply.
A. The individual at the City (the “Response Coordinator”) tasked with assuring
that all proposers are treated consistent with this protocol and to whom all communications should be directed is:
Diana Mangioglu Office of the City Administrative Officer City of Los Angeles 200 N. Main Street, City Hall East, Room 1500 Los Angeles, CA 90012 Telephone: (213) 473-7557 Email: [email protected]
B. Each proposer shall receive the same information in the same method at
substantially the same time as all other proposers. No confidential information about the City or the LACC will be shared with one proposer unless it is shared with all proposers.
C. All technical assistance questions must be submitted by e-mail to
[email protected]. Please identify the RFP title on the subject line of your message.
D. To ensure the fair and consistent distribution of information, all questions will be answered by a Question-and-Answer (Q&A) document available on the CAO website at http://cao.lacity.org/. No individual answers will be given. The Q&A document will be updated on a regular basis to ensure the prompt delivery of information. If you do not have access to the Internet, the Q&A document will be available by fax or by pick-up at the address on the front cover.
E. After the submittal of proposals and continuing until a contract has been
awarded, all City personnel involved in the project will be specifically directed against holding any meetings, conferences or technical discussions with any proposer except as provided in the RFP. Proposers shall not initiate communication in any manner with City personnel regarding this RFP or the proposals during this period of time, unless authorized, in advance, by the City. Failure to comply with this requirement may terminate further consideration of that proposer’s proposal(s). Each proposer must report any meetings or calls with City officials, City staff, or Financial Advisors, to the CAO within 48 hours of such contact. Failure to promptly report such contact
DRAFT MATERIAL – SUBJECT TO CHANGE ‐ NOT FOR DISTRIBUTION 29
may be grounds for disqualification of the proposer from further consideration, at the City’s sole discretion.
F. Each proposer must immediately disclose the name of any lobbyist or advisor
paid to assist in securing this contract. VIII. PROPOSER EVALUATION The City, at its option, may reject any and all proposals submitted in response to this RFP, or waive any informalities in a proposal when to do so would be to the advantage to the City or its taxpayers. A. Evaluation Committee
The City will use an Evaluation Committee (Committee) to review and evaluate the proposals. Each proposal will first be analyzed to determine overall responsiveness and completeness. Failure to comply with the instructions or submission of a proposal may result in the proposal being deemed non-responsive and may, at the discretion of the Committee, be eliminated from further consideration. As part of the proposal review process, the Committee may request additional information or a presentation from management companies who have been ranked highly based upon the evaluation of the responses to this RFP. The presentation will cover the information included in the proposal and will be utilized as a means to further assess qualifications. Discussions shall not be initiated by proposers. The General Manager who will be assigned to the convention center is a critical factor in the committee’s decision making process. As such, the City expects that the proposed on-site General Manager or the potential candidates under consideration for the position of General Manager will attend the presentation. In addition, the City reserves the right throughout the RFP evaluation process to request more information from all respondents regarding submitted proposals. At the conclusion of the evaluation process, the Committee shall recommend to the CAO, Mayor and City Council the award be made to the proposer whose proposal is determined to be the most advantageous to the City. The CAO will then submit the Committee’s recommendation to the Mayor and Council for consideration of executing an Agreement.
B. Evaluation Criteria
The City may use some or all of the following criteria in its evaluation and comparison of proposals submitted. The criteria listed are not necessarily an
DRAFT MATERIAL – SUBJECT TO CHANGE ‐ NOT FOR DISTRIBUTION 30
all-inclusive list. The order in which they appear is not intended to indicate their relative importance:
Experience and Qualifications: Experience, qualifications, performance and
national stature of the firm and experience in managing major market convention centers and exhibition facilities that are similar in scope, complexity and size.
Management Team: Experience and qualifications of the proposer's
convention industry management team and the resumes outlining the experience, education, and performance record of individuals who would be instrumental in the management and operation of the LACC and upper-level regional or national management personnel who will have supervisory responsibility over the LACC.
Approach and Methodology: Plan for the management, operation, marketing,
and maintenance of the LACC consistent with the Goals outlined in the RFP. Coordination with THE LATCB: Initiatives that have been used in other
proposer-managed centers to coordinate the convention sales process between the center and DMO management, and otherwise have assisted the DMO meets is strategic priorities.
Fee Proposal: Management and incentive fee proposals for the management,
operation and food and beverage services at the LACC. References: Demonstrated record of success by the proposer on work
previously performed. Financial Stability and Capability: Demonstrated financial stability and
capability of the proposer. IX. AWARD OF CONTRACT If recommended for award, the proposer shall be required to enter into an agreement with the City and comply with the requirements listed below. Failure to comply with these requirements will result in non-execution of the contract. A copy of the City’s Standard Agreement is available upon request. The agreement with the selected proposer(s) will be on a VARIABLE to-be-negotiated fee-for-performance basis. A. Secretary of State Documentation
All contractors are required to submit one copy of their Articles of Incorporation, partnership, or other business organizational documents (as
DRAFT MATERIAL – SUBJECT TO CHANGE ‐ NOT FOR DISTRIBUTION 31

appropriate) filed with the Secretary of the State. Organizations must be in good standing and authorized to do business in California.
B. Corporate Documents
All contractors who are organized as a corporation or a limited liability company are required to submit a Secretary of State Corporate Number, a copy of its By-Laws, a current list of its Board of Directors, and a Resolution of Executorial Authority with a Signature Specimen.
C. Proof of IRS Number (W-9)
All contractors are required to complete and submit Proof of IRS Number (W-9) Form.
D. Certifications
Contractor shall provide copies of the following documents to the City: a) Certification Regarding Ineligibility, Suspension and Debarment as
required by Executive Order 12549.
b) Certification and Disclosure Regarding Lobbying (not required for contracts under $ 100,000). Contractor shall also file a Disclosure Form, at the end of each calendar quarter during which any event requiring disclosure, or which materially effects the accuracy of the information contained in any previously filed Disclosure Form, occurs
c) A Certificate Regarding Drug-Free Workplace Requirements (if
applicable).
E. Collaboration The City may, at its discretion, require two or more proposers to collaborate as a condition to contract execution.
F. Contractor Evaluation
At the end of the contract, the City will conduct an evaluation of the Contractor’s performance. The City may also conduct evaluations of the Contractor’s performance during the term of the contract. As required by Section 10.39.2 of the Los Angeles Administrative Code, evaluations will be based on a number of criteria, including the quality of work product or service performed, the timeliness of performance, the Contractor’s compliance with budget requirements, and the expertise of personnel that the Contractor assigns to the contract. A copy of the Contractor Evaluation Form is available
DRAFT MATERIAL – SUBJECT TO CHANGE ‐ NOT FOR DISTRIBUTION 32
upon request. The Contractor will be provided with a copy of the final City evaluation and allowed fourteen (14) calendar days to respond. The City will use the final City evaluation, and any response from the Contractor, to evaluate proposals and to conduct reference checks when awarding other contracts.
X. PROTEST PROCEDURES The purpose of these protest procedures is to provide a method for resolving protests regarding the award of the Agreement before the City awards an Agreement. Proposers will have an opportunity to protest the recommendation of award of the Agreement under this RFP. These procedures will enable the City to ascertain the facts necessary to make an informed recommendation regarding the award of the Agreement. Any protest as to the RFP documents or matters or procedures referred to therein must be submitted in detail and in writing to the “Response Coordinator” and postmarked within fourteen (14) days after issuance of this RFP to the proposers. Any protest as to any other matter must be submitted in detail and in writing and submitted to and received by the City by 12:00 PM, PST, on the fifth (5) business day after the City notifies the proposers by e-mail of its recommendation to the award the Agreement. The protest shall contain a full and complete statement specifying in detail the grounds of the protest and the facts in support thereof. All protests must include the following information: The name, address and telephone number of the person representing the
protesting party; Name of the RFP; The initial protest document must contain a detailed statement of the legal
and factual grounds of the protest, including copies of relevant documents; and,
Statement as to the form of relief requested.
The procedure and time limits set forth in this Section are mandatory and are the sole and exclusive remedy in the event of protest. Failure to comply with these procedures shall constitute a waiver of any right to further pursue the protest, including filing a Government Code claim or legal proceedings. The City will only consider protests by or against any proposer(s) who appears to have a substantial and reasonable prospect of receiving an award if the protest is denied or sustained, as applicable.
DRAFT MATERIAL – SUBJECT TO CHANGE ‐ NOT FOR DISTRIBUTION 33
DRAFT MATERIAL – SUBJECT TO CHANGE ‐ NOT FOR DISTRIBUTION 34
Protests meeting the above criteria will be reviewed and will be submitted to the City. Protesting parties will be notified of the time and date that the protest will be considered by an administrative panel or body. The panel or body will issue a report to the Los Angeles City Council regarding the protest. XI. PROPOSERS’ CONFERENCE
A mandatory Proposers’ Conference will be held on this day, August xx, 2012 at 2:00 p.m. at 200 N. Main Street, Room 1500, City Hall East, Los Angeles, CA 90012. All prospective proposers are required to attend. This requirement will be waived if the proposer certifies in writing prior to the pre-proposal meeting that it is informed as to the project requirements.
XII. NEXT STEPS
The following is a tentative timeline for the RFP submittal, review, selection, and contract approval. Activity Date Issue RFP July x, 2012 Conduct Optional Pre-Proposal Submission Meeting/Site Visit August x, 2012 Deadline for Receipt of Written Questions August x, 2012 Deadline for Receipt of Proposals September x, 2012 Oral Interviews with Proposers (Tentative) Proposers Must Hold These Dates for Possible Interviews
October x, 2012
Proposal Evaluation Completed November x, 2012 Award Recommendation Presented to City Council for Approval
November x, 2012
Contract Executed January x, 2012

ATTACHMENT 9
MOTION PERRY/ZINE (C.F. NO. 12-0692)
.I r
f
MOTION
'; .,j , i
Los Angeles is the second most visited City in the Ul1ited States fi:)]' in1emational travelers anel the fifth 1110st visited by U,S. residenLs, Nearly 27 million visitors in 20 I I. spent over $15 billion Oil goods [mel services. The tourism and hospitality industry is a leading employer in Los Angeles County, with one in tenjobs serving the millions of visitors who corne hear each year.
One orllle most imporU.mf. facilities serving visi10rs to the City is the I.,os Angeles Convention Center (LACC). The primary purpose f()]' expanding the L;\CC i tl the late 1980s was to provide a world-class J'aeility that would attract national and international conventions, Current eiJorts related to the Event Center and New Hall project continue the City's commitmenl to providing the best convention facility possible.
A significant j~"tctor in the effort to attract national and international Gonventions is the LACe Booking Policy. The City Council and Mayor have established policies that seek to improve the ability to attract these events and bolster lourisrn in the CiLy. With pending changes in the LACC exhibit halls, as well as improvenlenLs in the greater LACC campus, Soutb Park :mel Dmvntowll, it is essential that the Council review these policies to ensure that they il1:e focused on attracting nntional ane! international events. The LACC Booking Policy has not been reviewed or evaluated in several years and it is critical1hat such a review be conducted now.
I THEREFORE MOVE that the City Council instruct the City Administrative Officer, with assistance ofthc Los Angeles Convention Center and the Los Angeles Tourism and Convention Board, io report on the status of the Convention Cenler booking policy, with recommendations as (0 how the City can more effecti vely attract natiol~al clnc! inleJ<national convention business.
PRESEl"-lTED BY:
SECONDED BY:
, , , ,
JonJ'(~1TY
Councilme(nLlyl', 9th District") , I .

ATTACHMENT 10
LACC DISCOUNTY POLICY
Attachment
Discqunt Policy
i. .. BASIC ·DfSCOUNT 'POLICY
The,Discount Policy authorizes the ,los Anm~fes Convention and Visitors'Bureau (LACVB) to offer . reductions in rental rqtes to Conventions and TradE?show~ in order to provide an incentive to
Conventions and Trad~shows to hold their events at the Los Angeies Convention Center (LACe), The LACV~ may offer discounts of up to 100% of LACC space rental costs to prospective·Clients;' subject to the limitation that the· amount discounted may not exceed the amount of Transient Occupancy Tax (TOT) revenues theeyent produces for the City: of Los Angeles.
fl. PURPOSE
The Discount Policy is intended to give the LACVB an additional marketing tool so that it can sUGcessfully sell Los Angeles and the LACCas a destination .for.CbnventiQJ}~ and Tradeshows. It is also Intended t9 protect the City's fi~ancial position by minill}izing anYnegci.tiv~ impact :qf the w\CC;s ciperations and of the (.lebt seryic,e require·rnents foLthe LACC expansion· projectcOrnpieted ·io· 1992 on the City's Generai Fund. As long as:the TOT revenLies received by the City equal,or exceed the amounf of the discount provi<;ied·to an event, the City's interests are protected whiie the goal of stimulating the local economy by attracting out-of-town Conventions and TradeShows to the area is
.. advanced. The Discount P9licy is not to be interpreted and applied ·so rigidly that application of the {, Policy thwarts the City's goals. . . . \.
III. DETERMINATION OF DISCOUNT AMOUNT
Factors to Consider. The amount of discount to. be offered a prospective client is determined through negotiations and is necessarily subjective. The following factors, which are; list~d.in their approximate order of importance, shall be considered by tt18 LACVB in determinin!;ftfle maximum discount to be offered to any given event:
. , " Estimated amount of tOT .revenue to be generated for the City by the event compared to the full
rental cost for the event. . ,. Number of projected hotel room nights and the number at hotels ClflGf their locations,required to
accommodate the event. . .• Pn;>jected-demand for the LACe at the time of the event; cQnsidering the general demand ,for the
LAcc at that time of year, the length of time before the event, and the perceived likelihood that another event can be booked for the same dates.
.. Estimated futUre val.ue of the event to Los Ang~les.
.. Past history of the event in Los Angeles. and other cities. III MUlti-year commrtment to hold subseqllent events in Los Angeles. It Competition for the event from competing venues. • Exposure the event will provide showcasing Los Angeles and the LACC to other potential clients
as well as to the rest of the State, the Nation and the world.
1 of 11
The LACVB shall develop standardized guidelines and procedures to ensure consistency among its sales representatives in determining the discount amount that may be offered to prospective clients.
General Guidelines. The goal is to attract events·to Los Angeles in order to provide an economic ( stimulus to the local economy and to generate additional revenues to the City, DiscolJnt incentives are offered to prospective clients in order to overcome the current. competitive disad.vantage the City has in providing .sufficient quality hotel rooms within walking distance of fhe 'lACe. Accordingly, the amount of rental discount to be offered an eve'nt should be directly related to the benefit the event
.. will br!ng,to the local economy and the City's revenues and·to the additional costs and inconvenience the event and its participants will incur by" 'selecting Lo.s Angeles for their event.
As a general guideline, proper application of the Discount Policy should result in the following:'
• The greater the number'of people occupying 'hotel rooms for an event, the greater the economic stimulus the event will' provide to the local economy anp the more revenues it will generate for the City, Consequently, events with large numbers of at~endees are more likely to receive a proportionately greater discount than events with fewer attendees',
.. The greater the difference between the estimated rOT an event wiU generate and the full rental cost for the space it requires, the greater the amount ,of revenue the City will receive net of the dis'count provided. Consequently, events that provide 'significari'tly more TOT than the full rental cost for the event are more likely to receive a proportionately greater discount than events for which the TOT is only slightly more than the full rental'cost for the event. .'
• The gr~a~er the number 'of attendee.s fo('an event, th~ more dl,spersedtho~e attendees will be ( among CIty hotels and the greater WIll be the cost and inconvenience of movIng attendees to the' LACe from their hotels. Consequently, events that cannot be fully accofTIm.odated in,'downtown area hotels are more likely to receive larger discounts than events'that wHi primarily oQcup'y Hotels located downtown.
IV. EU6IBlE EVENTS
Only Conventions and Tradeshows (Defined as Category 1 events. under the Booking policy definition) booked into the LACC by the LACVB are eligible to be offered,a rental discount.. These ,events are normally. but not always, booked by the LACVB two' or more years in advance of the actual event. These events are distinguished from non-eligible Category 2 (local trade and consumer shows) events in that'theylypically require hotel night occupancy for the majority of theif attendees.
V. ESTIMATING TRANSIENT OCCUPANCY TAX
The LACVB shall develop a standardized set of assumptions and a standardized procedure for estimating the TOT events are expected to generate. The goal is to develop a method for en$uring consistency among all events in how TOT to be generated by each event will be estimated and to provide a realistic estimate of the TOT that will be generated.
2 of 11
(
o Room Night Projections. The LACVB shall develop a procedure for esH'mating room nights based ~n the history Of the event the last three times it was held. ThH procedwe shall use a shorter'period' when a three-year history is not avC)ilaple. It shall provide a method fores~imating future y'ear:, increas~s-..in room..nigt)ts' projection$ for subsequent events to be 'held through a 'multi-year agreement, 'which projection shall be subject to first event performa'nce goals. The Discount Approval .Form shalllnGficate the number of. room nights from ~ach of the proceeding three: events ,and shC)li provide' a brief explanation of how the room nights projection was derived from the history. ' ,
, ~oom Rate ProjeCtion,s. Rooin rate projections shall be based on widely pubfished studies' of current average room rates by geographic area of South~rn California (.e.g., Pannell kerr
," .. Forster's periodic, room rates published in the Los Angeles Business Journal). The published , ratessliall be:adjustedin. acc6rcjancewith ,assumptions agreed to by the LACVB, LACe and the , ,CAO, The'fanbwing factors' shall be considered in adjusting the pub!is~.ed rates: currenttrends,
economic fore.casts, anticip,ated hotel development'and',inflatfQn. Each'year's projected room rate,$ may. notbe more than 3% greater than the preced.ing year's projected 'or actual room rates: More than one room rate may be established for a single period of time, and within ,each year,The LACVB shall provide a dear explanation of how the -appropriate rate(s) will be identified whet) estimating TOT for any given event. The room rate projections shalLbe reviewed, and revised annually;
!t . City v~rsus NO'1-ci*yHotels. T~e TOT calculatin'n shall be ,based only on hotels an event may use ,th<;lt g~ner~t~ TOT ,for' the City. The LACVB shalJ develop a procedure for excluding the ,e,stimat~d number of 110n-Qity room ,nights wh~n estimatigg the TOT an eVent wHl',generate.,This procedure must be approved by the City'Administrative Officer (CAO) and the LACe.
Approval of TOT Estimating Procedures and Assumptions. The LACVB'shall'firstslJbm~t the procedure for estimating TOT and ,the propos~d room rate assumptions to the LACC for review' and 'approval. If-the LACe disagrees with the procedures and'assumptions as sUbm'itted; the LACe and the LACVB shall attempt to resolve any disagreements by reviSIng the procedures andass4mp~ions. After the LACC indicates its approval of the procedures and assuf1wtions in writing, the procedures and assumptions shall be submitted to the CAO for review'and approval. '
If the LACe and the LACVS- are 'unable to concur dn the proc'edures and/or assumptions, the LACC shall forward the proposed procedures and assumptions to the CAO with its written comments as to the a'reas of disagreement. The CAO shall make the final decision to res61ve any areas of disagreement. Resolution'shall be' based on the goals of making TOT projeCtions as'realistic as po'ssible and of making the calculation of TOT consistent b~tween events. '
The procedures and assumptions shall become effective once approved iil,wrltiiig by the CAO. These procedures and assumptions shall be adhered to by the LACVB in making offers to clients.
AnlJuql Revisions to TOT and Room Nights Estimating Procedures .. Annually, the LAOVB shall initiate a review of the. procedures and estimated room rate assumptions used in estimating TOT.
'It shall.also ini,tiate a review, at any time, if it believes there are problems with the procedures and assumptions that need to be addressed or if the actual TOT conSistently varies significantfy from the estimates. The LACC and the CAO shall participate in any such reviews.
3 of 11
VI. ESTIIVIATIt.JG SPACE RENTAL COSTS , ,
Determination of Event Needs. The LACVB and the LACC shall work join'tly with each event to / ,develop a realistic estimate of the space and other needs actually required for an event. Estimates { shall'besubject to minimum rental requirements that comply wIth the'industry standard.
Rental Costs that May be Discounted. Spacerentat cost caleulatjons shall include Exhibition Ha/J and Meeting Room space rentals for the actual days ofthe event, the standard number of mbve in and move out days which are provided at no additional charge, and any additional move in and. move out.days actually , required for the event. 'All rental costs determined as being required for an event may be discounted. ' ,
Move In I Move Out Oays. Events will be given the standard number cif moVe in and move Qut days, based on the number of exhibition days, at no,charge. Additional move inandmove'out days may be -provided, at the request of. the event, if the LACe and the LACVB agree that the additional days are'actually required for the event. Rellt for additional move in and 'move out days' may be discounted provided the discount vs. TOT criteria is' met. Licensing of the event shall include any additional move in and move out days determined 'as required prior to the event being licensed. ",
Licensed Value of the, Discount. A flat incentive amount will be determined' so the client fully understands that the event is responsible for any additional rent. The amount of the incentive shall be expressed in dollar terms clearly indicating the dollar value of the space discounted based on estimates'made at the time of negotiations, TOT to be generate(j, spaCe rental,cdsts, and lhi3 'amount of space being contracted for. The License for the event shall clearly identify the dollar value of the discount. Refere'nces to reduCing rental costs to $1 or to providing free rent shall not be made either, in the License or in representations tn the client. .,' (
VII. MAXIMUM DISCOUNT
Except ,as provided below, the offered discount amount may not 'exceed the TOT an event is estimateq tq gene~ate. !
VIII. EXCEPTIONS TO BASIC DISCOUNT POLICY
The following may be .offered Discounts that exceed the TOT the event will generate:
.. fndustry .. :Wide ,and Travel Association Events,. M~etings of natIonal and regional Industry-Wide , and Travel Associations' may have a significant impact on future business and tpurism. They
showcase Los Angeles to potential clientq. In recognition of this, the'LACV8 may offer ,,1:00% discount's to such Associations even though the' discount may exceed the estimated TOT the meeting will g~nerate.
Associations eligible for 100% discounts are: American SOCiety of Association Executives (AS.AE;), American :Society of Travel Agents (ASTA), International Association for Exhibition Management (lAEM), Professional Convention Management Association (PCMA), Meeting Professionals International (MPI), National Tour Asqociation (NTA), National Business Travel Association (NBTA), Society of Government Meeting Planners (SGMP), Society of Independent Show Organizers (SISO}; National Coalition of Black Meeting Planners (NCBMP) and,' POW/WOW. "
4 of 11
(
In addition, if the LACVS beljeves additfonal organizations, not listed abqve, fall intO the broad category of national or regionallhdustry-Wide orfravef ASso¢.iation, it 'may6ffer a'100% discount to such organization after first obtaining the written concurrence of the LACC andlhe CAO that such AssoCiation~s purposes fall within the intent of this 'paragraph. '
• Multi,.Year Licenses. Aq an incentive for organizalions to make q comtJ1itment to return their even~ tq the LACC within five yea'rs of their first Los Angeles event;' the LAGVB may offer up to ,8 '1.00% discount on rental fees for ,the first event provided in a multi-year License, without consideration of the e$tjm~ted TOT the event will generate. Discounts provided for suqsequent events under the Ucense may not exceed the estimated, ToT the subsequent events will g~merate and yvitl be subject to aJl other Discount Policy requirements. '
If a multi-year incentive isoffered, it will be based on minimum performance standards that wiH be established at the time of negotiation and Licensing. Should these not be met, all terms for future events included in the multi-year agreement are subject t6 renegotiation.
This exception shall apply only to new events licensed after approval of this Discount Policy by theCio/. ' ' ' ' ,
• Exceptional Events. Periodically the opportunity arises to book' an event that does not meef the 'Discount Policy requirements pf generating more TOT thaI) th~ amount of the discount, but that '$Ubstantially furthers fhe goals of the City which were 'identified aoove: Such events may prQvide a substantial benefit to the local economy and, !Tlay provide sub~tantial business to the' hotel industry. They rhay showcase Los Angeles to ih,du,stry leaders Who are able to direct additional business to the LAce. 'They may provide subdantial national arid even inter,national publicity further promoting and showcasing Los, Angell3s asa tourist 'a.rid, convention destination. They may be events that other venues compete strongly for and that require additional,incentives to s~lect ,
, Los Angeles. They may be s6 highly sought that they refuse'to aCQeptpr.oposals that req!Jire paymen't of rent. They may-provide subsfantial additional revenues to the' LACe, thereby redUCing
, the risk that the City's 'Generai' Fund maY-have to sUb$idize the LACC'soperatibns and the debt , '
service for the expansion.
When the LACVB believes it has the opportunity to bobk such an event, the LACVB shall submit a' proposal to the LACC requesting the LACC!s concurrence that the evenfbe designated an "Exceptional Event" and be exempted from the standard Discount Policy requirements. The request shall indicate all of the information 'normally required urider the Discount Policy (Le., s$timated TOT, discount amount, estimated room nrghts, etc.). It will also prOVide a written statement as to the reasons the'LACVB believes the event should be exempted from the nprrnaJ ni~count Policy requirements. '
The LACC shall respond in writing to the LACVB within one week of receiving the request. The response shall indicate either its concurrence that the event be exempted from the standard
, requirements of the Discount Policy, or it shall indicate that the LACC does not agree with exempting the event. If the LACe disagrees with exempting the event, it wili provide a written
, statement of the reasons why it does, not concur.
5 of, 11
,Jf the LACVB and theLACC concurthat the event shnuld be exempted from the Di$courit Policy requirements, the ,LACV!3 shall transmit a reque$t for approval of the exemption to the Mayor. The ' transmitt~1 shall inClude the respon~e of the LACC: ' " t
If the LACVB and the LACC do not concur, the LACVB shall consider the respon$e of the LACe and shall decide whether to pursue the matter further. If the LACVB decides to further pursue the matter, it will submlf a request that the event be exempt~d to the Mayor. The suhmittal :shall
, 'irichi'de 'the respons~tsent by the LACe as to why'it does not concur with' exempting the event.
In'both instances, tlie:Mayor shall m,ake the final determination and may either authorizeJhat the event b~ exempted or deny the request.
It is anticipated that very few ~vents are so exceptional as, to merit consideration under this exemption provision. ' "
IX. GUARANTEES
Licensing' Commitment. The License Agreement shall obligate the event to pay the difference between the verified TOT and the final value of the discount if the verified TOT is determined to be : less than the value of the discount.
Gl;Jarant~es to cover,any TOT vs; DiscoiJnt ShortfalL It 'is pr,eferred that the event guarantee to pq'y for any shortfqll. This encour~ges the event to work with the LACVBand the LACe to minimize space requirements to what is necessary, avoid last minute move-:in fncreas,es in the space utilized, anq minimize the number of move 'in/move 'out days the, event requests. It also encourages the event' to, dired as muc'h hotel room registration as pOSSIble to ,hotels that generate TOT for the City. {
, -- ' , , ' , , " ' ',',
LACVB may elect t9 pay for the shortfall itseJf. The LACVB shall attach a statement to the Discount Approv~1 Form (dentifying the reason for LACVB agreeing.to pay for any sho~all.: Possible, reasons for the LACVB electing to guarantee to' pay 'for any shortfall include, butare flat limited to:.
o The client has a satisfactory history with the LACC demonstrating its ability to generate s\Jfficient TOT to the City to offset space rental costs.
o the client signs a multi-year ag,reement to hold at least two events at the LACe.
In cases where the LAGVB agrees to guaran'tee to pay for any~hortfali', the LACVB shall prepare and execute an agreement with the client outlining the terms of the gUarantee. The agreement between the'LACVB and the client 9hall not preclude the LACC 'frQm 90i./ecting the full amount from the client. The Convention Center, however, may accept payments directly from th~ LACVB in fulfillment of such obligation. The LACVB shall provide the LACC and CAO with a copy of the agreement.
X. APPROVAL OF DISCOUNTS
Discounts must be approved in writing by the CAd and included in the, LACC License Agreement. It is the intent ofthis Discount Policy that the LACVB shalf c.omplywith,the req[Jirements of this Policy when developing proposal$ and making offers to potential clients. The LACVB shall inform potential
, clients that discounts offered during negotiations are subject to the City's final review and
6 of 11
(-'
(
, ,
qpprOval. CJo;~e coordination with the LAce will be,re,quif~d toins~re the availability of dates and the aqjuracy pf space usage estlmafes When developing off~r~. Once 'an offer is made by. the,Lt\GVB and accepted' by the client, subject to the approval .of the City, the ,disc;ount request will b~ reviewed by the LACe, and then by the' CAO, for complialJq~ with thepiscaunt Policy and its standardized piocedure~. ' , ' " ' ,
Nothing herein is intended to prevent or delay the LACVB from developing and makin.g offers to potential clieflts. Offers that comply with th~ provision's and, procedures of .this Policy, shall be ar):proved by the CAO. The LACVB has the bUrden of demonstrating that an' offer complies with the Discount Policy, that the estimates were developed in accordance with the Policy's procedures, and thatjhe discount 9ffered is consi,stent with other dis~Ul;lts offemq to other events under the general guidelines ofthJs Policy. ' "
DI'scourit Approval, For~s. The LACVB' shall complet~' a Discount Approval Form for each discounted event. The Form shall contain all relevant information related to the event. This shall include, but tlot be limited t6: ' "
.. An estimate of TOT to be generated by the event. • An estimate of-the number of room nights the event willge'qerate. • An' estimate of the spqce and other relevant requirements,fpr t~e event. GO Ah,esti'm.ate,ofthefullundiscounted space reQtal CQst for the event. .. 'yvh.er~ available, a' history of the room nights generated by th,e event for the three most recent
eyents~.
.. A written statement of the business reasons for discounting the event.' s An explanation of how the amount of the discount was derived. III A written statement of any contingencies included,in the offer to the:Eivent. , fit A statement that the event agrees to pay for any difference' betw~etl the TOr the event actually
generates and the amount of the discount and whether the LACVB will guarantee the payment df,such shortfall. ' ,
LAce and LACVB Joint Review. The LACVB will submit a tompleted Discount Approveil FOriTrto the LACe; as soon as possible,· but not later than 30 days following' aCceptance of an offer;by a client. The'LACCand the LACVB shall 'jointly reviewthe'FO'r1n td verif{compliance with the DiscouilfPolicy and with the 'standardized procedures of the PolicY': Revrew of the form shEIII j·nclude verifying rental costs, event date availability, room,nights estimates, the TOT estimate; the' discount amOUr'lt, 'and space needs. The LACC and the LACVB shall attempt to resolve any issues over the application of the Discount Policy and procedures and the,information submitted oli the form. The LACe shall then submit the Discount Approval Form to the CAO with a recommendation that the discount either be approved'or disapproved. This trahsmittal is to be completed within ren days of the LACC's receipt of the Discount Approval Form. '
If the, LACC believes the request complies with the Discount Policy and its procedures, and agrees with th~ information contained in the request; the L~CC shaM recommend approval of the discount. If the LAcc believe~ the request in some way varies from, the Dtscount Policy and its procedures, or dis9grees with th,e inform~tion provided, the LACC shall proviae a wr~tten statement of its concerns and shall recommend either approval",despite the apparent problem, or disapprova~ of the discount.
7 of 11
CAO Review and Appr9v~I/Disapproval. The CAO shall verify' that'tt)e information provided supports the' conclusion that the e~timated TOT exceeds the 'valve of the discount and .th~Ut is
. cansi.stent with the policies and proced~re~ ~oh~ained herein. The ?AO shan review the ~mount of (. the discount for adherence to tne .. general gUIdelines and shall. consider the recommendation of the . ·LACC. Any contingencies that are part of the agreement shan also be reviewed. This review is (0 be completed within ten business days from receipt of the Discount Approval' Form by the CAO.
The CAO shall sign the Discount Approval Fonn, approving' the discount, once he is satisfied'that the offer complies with the Discount Policy and its proced.ures and that the information provided supports the discount granted. . .
If the CAO believes the' request vades In some .aspect from the Policy and its procedt,lres, th~ GAO may, at his sole discretion, either approve or disapprove the request, subject only to the requirement that the approved discount may not exceed the estimat.ed amount of TOT the event will generate.
Any Policy and procedure variations and any dlffererices concerning information included iri' the. Form will be reviewed jointly by the CAO, LACC, and LACVB and action taken to avoid similar situations from arising in the future.
The CAO's written approval will constitute formal approval of the discount and will establish the maximum dollar value for the discount. Any subsequent adJustmen.ts to the discount amount, which re$u.lt in all increa.se in this .dollar amount. are unauthorized ·a.nd sha!1 not be honored by-the City unless approved by the CAO in writing prior to the event as required by this policy. Adjustments to the' discount amount that reduce the amount of the discount do not require the CAO's :approval unless' the adjustment was due to a change in the TOT estimate. ( licensing of Event. After the Discount has been approved" the LACC shall proceed with licensing the event in accordance with the provisions of the approved Licensing and Deposit Policies. "
CHent Jurisdiction. Prior to executing the License for the event, the LACC sha',,' work cooperatively with the LACVB to assist in the negotiations and to work with the client to determine client needs and to resolve-is~ues related,to G.onvention Center use. However, prior to exe'cuting the License,. th.e LACVB will b~ solely responsible fdr all negotiatiorys and for presentirig. and revising prop'osals .in accordance with this Discount Policy. After th~ License is executed, the'LACe shall b.e 'solely respqnpible for all client contacts and shall be responsible for negotiating ,any revisions to the License as client needs change.
XI. ADJUSTMENTS TO APPROVED DISCOUNTS
It may be necessary to review and recalculate the amount of the authorized discount for one or more of the following reasons: .
110 Cl1a'ngas to Room Nights Estimates •. If an event reduces its room ,nights estimate, the value of th~ TOT the event will generate will' most likely be reduced. The maximum allowable discount amount will be recalculate.dand the amount of d~scount that the City is willing to offer shall be redetermined based on a review of all the factors that were used to determine the amount of the original discount. If the room nights estimate is increased, the discount wHi also be reviewed to i determine whether or not to increase the discount to be provid€)d an event.
8 of 11
(
0, , AdjOs'tments for Inadeq~~te Performa~ce. for multi-year Licenses, jf the aqtual rOT generated by £m eY!3nf differs slgni'ficantly from the estimated TOT, the License will be reviewed by the LACVB and the LAce for events to be held in -subsequent years of the License.. The disGount provisions may be revised unless the City is willing to accept a greater guarantee from the event.
o Adjustments to Space Rental Gosts for Addi~ional Space. After the event is li,censed, ,if it wishes to increase its space requirements, the rental cost for such additional space will be determined t~rough negotiations betwe,et! the LACC, and the ev~nt,' subject to th~ reqllirelT!e.nt thaf.the total space rental discount for the 'original and, additional sp,ace may not:exceedtheTOT
. the event is, ~stimated to produCe'.: The addition of exhibit space or meeting rooms,shaU be bqsed d'n avall<:,tbHrty as determined by the LAcq. Th,e revised amount of the discount m!Jst be ,approveci by:the GAO if itis increased over the previously approved discount amount.
o Adjustments to Space Rental Costs for Reductions in Space. if an event redu~es its space requirement, either before or after a License has' been issued, the ~pace rental costs shall.be
, recalcul,ated and the amo,unt of the discou'nt adjusted in a manner consistent wjth the basis used t9 determine th,e original discount amount. If the released space cannot be rebooked, the original rentc:ll provisions wm ,continue and 'the event. will be chargeq the standard undiscounted rate for the,unused space. If an event books more space than it actually uses, it wlU also be charged the ' full rental rate for the unused space. '
• Reseheduled Events. From time to time, it meW be desirable to, rnove an event's scheduled dates in. order to accommodate a different event. The rescheduled event may be offered a discount as
,compensation for the change of date. In-such instances, the qdditional TOj generated by the new ,event)' after accounting for discounts; must offset. the value, of the additional compensation provided to the rescheduled event.' ,
, 't
The LACC and the LACVB shall jointly prepare a revised Discount Approval form for" the rescheduled event. This Form shall be submitted to the CAO with the Discount Approval Form for the new event. The revised discount for the rescheduled event shall not be effective until approved by the CAO.
XII. POST EVENT RECONCJ~IATION OF ACTUAL TOT TO THE RENTAL DISCOUNT
TOT and Room Nights Verification and Reporting. The LACVB shall,contract with'an indep~ndent consultant to determine the TOT and number of room nights aCtually generated by each event. 'The selection of the consultant must be approved, in writfng, by the 'CAO and the LACC. '
The consultant's report shall identify the TOT and the number of room nights generated by each event by hotel. Information shall be aggregated separately for hotels that generate TOT for the City and for those hotels thatdo not. Verification is- to be completed within ,60 days following the conclusion of each event. Verification shall be obtained only from the hotels in the identified hotel block for each event.
The LACVB shall include in its quarterly reports a comparison of the actual TOT generatE?d by each event to the, estimated TOT used in establishing the discount. The value of the TOT generated shall also ,be compared to the value of the actual discount provided. The reports shall indicate'the shortfall or overage between the verified TOT and the actuat value of the discoUht. Any variations between
9 of 11
r.
the·actual value of the discount and the 'originally approved discount value will be explained. All information shall' be provided on an event-by-event basis with aggregate figures also provided. The consultant's verification reports shall be attached to and transmitted with the quart$rly reports to the ", CAO.· .{
The LACC shall provide the LACVB with any information it possesses that is required to complete these reports. ' .
Appeals. by Events.· Events shall· have the right. to appeal the TOT amounts determined by the consultant. Appeals will be approved only if the event prQvides satisfactory evidence that the ,actual TOT generatecl is greater thim that identified by the consultant Satisfactory.eviden¢e may be provided either by' a recognized housing service (firms that assist Convention organizers in managing room reservations) invDlved in booking the event, o'r by a legitimate room verification. 'Such evidence ·shall be accepted and the TOT and room nights figures adjusted.
Concurrence with Procedures by Events. At the time of Licensing, events shall Qe fully informed of 'the process by which TOT Cjnd room nights verification is Qbtained. This shall include the identification of Which hQtels in the hot~1 bloyk will be considered in determining the TOT g~nerated. Events shall'be informed of what forms of evidence are accepted in appeal!ng the TOT verification . figures. .
Payment of TOT versus Discount Shortfalls. The LACC shall initiate procedures to collect any amounts owed by events upon receiving the consultant's verification reports from the LACVB. For events where the LACVB has agreed to cover any shortfall, the LACe may accept payments directly from the LACVB for the fu'lfillment of such obligations. 'Overages from events where the TOr generated exceeds the ambunt of the discount may not be used as a credit to offset any shortfalls. (
XIII. REPORTING 1·
Each quarter the LACVB and the LACC shalLindep'endently submit·reports to the CAO indicating' the. following: '
o Status of number of bookings by event year. " Status of Convention·and Trad~showbusiness receiving discounts. QII Status of room nights booked per event year. '" Status of events held during the quarter., " Summary of the value of discourits for events held. , " Summary of the consultant verification of TOT and room nights generated and a copy of the
conSUltant's reports. " Reports on any cancellations and the reasons therefore. . , '" Explanation of any majqr variations between. actual event performanGe .and th~ original
estimates.
XIV. EVALUATING DISCOUNT POLICY PRACTICES OF THE LACVB
As part of.a broader annual review of the LACV8's performance, the CAO shall include an evaluation of the LACV8's activities. as th,ey relate to the Discount Policy. The CAO sha/nnclude in the Discount Policy portion of the evaluation a determination of the following:
10 of 11
(
I!l Percentage of events that generated TOT equal to or more than discounts granted over total number of events granted discourits. '
f!I Accuracy of room night projections for completed events. Ii> Adh~rence to the general'guidelines for discounting events booked during the year. ,. Compliance with procedural requirements.
.xv.
,. Timeliness, accuracy, and completeness of reports. lit Effectiveness of the use of discounts in securing new bookings. • Use of discounts to secure multi-year commitments.
MODIFICATIONS TO DISCOUNT POLICY
Annual Reviews. Annually, the CAO, the LACC, and the LACVB shall jointly review the City's' experience under the Discount Policy'. The provisions of this Policy may be modified with the unanimous concurrence of the CAO, the LACC, and the LACVB subject only to the requirement that the discount provided to an event may not exceed the TOT estimated to be generated by the event. Any modifications agreed to by the three parties sh,a/l be reported to the Mayor and the City Council. , Modifications will be deemed approved unless the Mayor and .council reject the changes.
Cancellations. The CAO, the LACC, and' the LACVB shall jointly .review the caus~s of any cancellations that occur once a discount has been approved. They shall also review any failures to obtain a booking when the LACVB believes that the operation of the Discount Policy was a major factor. The purpose of these reviews is to determine whether modifications are needed to improve. the usefulness of the Discount Policy and to address issues before they read to additional cancellations or rejections. .
XVI. APPROVALS
Written approvals required under the provisions of this Policy require the signatures of the following:
.. For the LACC, the General Manager or his designee .
., For the LACVB, an Executive Vice President
., For the CAO, the CAO or his designee (Chief A<;:fministrative Analyst level or higher).
XVII. EXPIRATION OF DISCOUNT POLICY
This Discount Policy shall expire on 'July 1, 2012, unless terminated earlier by the City. Upon the opening of a Convention Center Hotel, the CAO shall . review, with the assistance of the LACC and the LACVB, the issue of whether or nO,t the City needs to continue offering discounts as an incentive to attract events, and sha.1I report thereon, with recommendations, to the Mayor and City Council. This review shaH be repeat~d eVery two years until the Discount Policy terminates.
After the expiration of the Discount Policy, the LACVB shall no longer be authorized to offer rental discounts without additional City authorization. Discounts offered to events prior to the expiration date shall be honored even jf the actual event occurs at a date subsequent to the expiration of this Policy.
40706c
11 Of 11
ATTACHMENT 11
DOWNTOWN LOS ANGELES DEMOGRAPHIC STUDY 2011 PREPARED BY
THE DOWNTOWN CENTER BUSINESS IMPROVEMENT DISTRICT
Downtown Center Business Improvement District
626 Wilshire Blvd., Suite 200
Los Angeles, California 90017
(213) 624-2146 phone
(213) 624-0858 fax
www.DowntownLA.com
DCBID Downtown LA Demographic Study 2011 • 1
Study Producer:
Downtown Center Business Improvement District (DCBID)
626 Wilshire Blvd., Suite 200
Los Angeles, California 90017
(213) 624-2146 phone
(213) 624-0858 fax
www.DowntownLA.com
Study Consultant:
Horizon Consumer Science
865 S. Figueroa St., Suite 3400
Los Angeles, California 90017
(213) 532-3264 phone
(213) 623-8240 fax
www.market-research.com
Special Thanks to Our Media Partner for Outreach:
Los Angeles Downtown News
1264 W. First St.
Los Angeles, California 90026
(213) 481-1448 phone
(213) 250-4617 fax
www.downtownnews.com
Cover Photo: Downtown Skyline View by Andrew Murray
DCBID Downtown LA Demographic Study 2011 • 2
Table of Contents
EXECUTIVE SUMMARY 5
Changes Since the 2008 Study and 2011 Study Key Findings 6
Summary Comparison of Key Findings Comparing 2008 & 14
2011 Demographic Study Among Only Downtown Residents
Summary of Key Findings for All Respondents and Segments 19
Demographic Study 2011
DOWNTOWN LA DEMOGRAPHIC STUDY 2011
DETAILED FINDINGS 23
Detailed Results – Downtown Residents
Demographic Study 2011 and Comparison to 2008 Study 27
Detailed Findings for All Respondents (including Downtown
Residents, Workers, and Visitors) – Demographic Study 2011 38
INDEX OF DETAILED TABLES 88

DCBID Downtown LA Demographic Study 2011 • 3
“We are an urban downtown, but one in which we
increasingly feel a sense of community, of being a part of a
neighborhood and all of the good things that go with it.”
Carol E. Schatz
President and CEO
Downtown Center Business Improvement District
Welcome to the Downtown Center Business Improvement District’s Downtown Los Angeles Demographic
Study 2011.
For many of us in an increasingly analytical world, numbers help to clarify and define an experience; they can
give support to supposition and dispel conventional wisdom. We hope you will find all of that in the results of
our polling.
This is our third study of the demographics of Downtown Los Angeles in the last five years, and we continue to
be amazed at how the findings mirror what we see every day on the sidewalks, in our work places, in the
restaurants and concert halls, on buses and trains and when we’re just out walking the dog in Downtown.
Those of us who live, work, play or visit Downtown LA already see a vibrant, diverse community. We see a young
and affluent community. We see the skyline change with new towers; historic movie palace marquees light up
anew and another storefront, bar or restaurant open every day.
We hear applause spill out of the concert halls, the sounds of cash registers ringing, music in the parks and the
lively chatter from block-long lines of patrons waiting outside Downtown’s trendiest and hottest night spots.
We are an urban Downtown, but one in which we increasingly feel a sense of community, of being a part of a
neighborhood and all of the good things that go with it. We know the comfort of familiarity of our favorite places
and the excitement of new ideas, new opportunities, new neighbors and old friends. First it was pets on a leash,
and now we’re seeing more and more baby strollers. Those are the signs that a city has become a neighborhood
and that 9-to-5 workers and visitors have become residents.
In the following pages you will see all of this displayed in the numbers. You will be able to see where we are in
terms of employment, education and income. You will see how we spend our time and our money. You will see
how we have changed since our last report in 2008.
Like the nation as a whole, we took some hits in the recession and the slow recovery, and you will find this in the
figures as well. But I believe that, like me, you may be surprised to see how Downtown has continued to grow –
more housing units and more residents in them.

DCBID Downtown LA Demographic Study 2011 • 4
Learning is an active two-way communication. We’re sure that after reviewing the 2011 Demographic Study you
may have additional questions. We are here to help with those as well. You can visit our website at
DowntownLA.com, or contact me or Hal Bastian, our Senior Vice President & Director of Economic
Development, at (213) 624-2146 x 213 / [email protected] for more information.
Welcome to Downtown Los Angeles.
Carol E. Schatz
DCBID Downtown LA Demographic Study 2011 • 5Executive Summary
Executive Summary
BACKGROUND AND PURPOSE
The Downtown Center Business Improvement District (DCBID) is a coalition of Downtown property owners,
encompassing a 65-block district in the heart of Downtown that funds safe-and-clean programs, economic
development programs, and extensive marketing to support Downtown businesses.
This demographic study was conducted to provide economic and demographic data about who lives, works,
plays and visits in Downtown LA, thus improving the DCBID’s ability to recruit and retain retailers, restaurants,
and other consumer businesses and amenities to Downtown Los Angeles.
To that end and to update its Downtown Los Angeles Demographic Survey 2008,1 the DCBID retained Horizon
Consumer Science (HCS) to manage and conduct comprehensive market research of demographic/ household
characteristics among the current population of Downtown residents, employees and visitors, as well as to
compare results and changes from the 2008 study.
DEMOGRAPHIC STUDY 2011 METHODOLOGY
The 2011 study was facilitated as an Internet survey to a self-selected sample across the central Downtown LA
population, in particular any resident, employee, visitor, and cultural arts and sports event attendee. This was
not a “census” but rather a comprehensive survey of Downtown residents and consumers.
To publicize the survey, the DCBID undertook an extensive outreach effort throughout Downtown. Media
advertisements, postcards and door hangers directed potential respondents to access the survey through a “url”
link, DowntownLA.com/survey posted on the DCBID website, DowntownLA.com. A total of 11,323 usable
surveys were received. This sample has a variance of not greater than 0.9% at the 95% confidence level.2
DEFINITION OF “DOWNTOWN LA”
For the purpose of this study, the Downtown “population” is defined as residents, workers, visitors and others
who are in Downtown for a variety of reasons including business, shopping, attending cultural, sports or special
events, within the following boundaries:
1 Downtown Center Business Improvement District, Downtown Los Angeles Demographic Survey 2008, (April 2009)2 Where any response to a question with the full base is 50%, this is the level of variance. For any response lower than 50%, the variance will be lower.
DCBID Downtown LA Demographic Study 2011 • 6Executive Summary
North: 101 Freeway and the Chinatown area East: Los Angeles RiverSouth: 10 Freeway West: 110 Freeway and the City West area
OVERVIEW OF DOWNTOWN MARKET
Over the past 10 years, Downtown Los Angeles has experienced an extraordinary commercial and residential
renaissance. With some 45,000 residents, 500,000+ weekday employees and more than 10 million annual
non-local visitors, Downtown Los Angeles has become Southern California’s economic engine.
According to primary research by the DCBID, Downtown LA’s housing market and population rose during the
2008-2011 period as follows: 3
A total of 28,861 residential units are located in Downtown LA, up 11.0% from 2008 (4th quarter).
A total of 45,518 persons are residing in Downtown, a strong 15.1% rise from 2008 (4th quarter).
CHANGES SINCE 2008 AND KEY FINDINGS FOR 2011 STUDY
The Downtown LA population of residents, employees and visitors, has continued to grow and mature since the
2008 study, despite the recent recession. A new wave of Downtown LA businesses, including restaurants,
nightspots, personal and professional services and amenities has been delivered. At the same time, the
increasingly well-educated, higher-income, active and diverse population still seeks additional goods and
services. To that end, a new Target store was announced as the anchor at the 7+FIG retail (now renamed
FIGat7th) center currently undergoing complete renovation and due to open Fall 2012.
Changes Since the 2008 Downtown LA Demographic Study
The results of this study are strikingly comparable to those in the 2008 study, with differences within one or two
percentage points for most indicators. The main changes concerned employment, home ownership, income and
commuting behavior for both Total 4 respondents and for Downtown residents:
Employment: In both surveys, 83% of Downtown residents reported being employed (anywhere, not
only in Downtown LA). In the 2011 study, 78% of Total respondents were employed compared to 88%
in 2008, indicating that Downtown residents better maintained their employment level than did Total
respondents.
3 Downtown Los Angeles Residential Fact Sheet, 2nd Quarter 2011, Downtown Center Business Improvement District
4 Total refers to all who responded to the survey including Downtown residents, those employed Downtown and visitors. Residents are those who live Downtown.
DCBID Downtown LA Demographic Study 2011 • 7Executive Summary
Place of Work: 57% of Downtown residents reported that they worked in Downtown LA in 2011
compared to 64% who did so in 2008. This indicates that while maintaining their overall rate of
employment, more Downtown residents were working outside Downtown.
Commuting Mode: In 2011, 55% of Downtown residents commuted alone by car and 40% used public
transit. In 2008, 35% commuted alone by car and 35% used public transit. Thus, both car use for
commuting and use of public transit rose in 2011. Of note is that the sum percentage for all commuting
modes was up in 2011, indicating that residents took more modes to commute to work. This may be
related to the lower percentage of Downtown residents who worked Downtown in 2011 than in 2008
and used more modes to reach their workplaces.
Ownership versus Rental: In 2011, more Downtown residents rented an apartment or condo with 68%
versus 66% in 2008, while fewer owned their residences, 28% in 2011 versus 30% in 2008.
Income: Total respondents reported a median household income of $85,500 for 2011 versus $92,200 in
2008. Overall Downtown residents reported a median income of $86,300 in 2011 versus $89,900 in
2008.
These changes were apparently related and attributable to the lingering effects of the recent recession, as well
as an accompanying credit crunch that adversely impacted the housing market. The number of new units and
their more affordable pricing levels brought many new renters, as opposed to owners who typically have higher
incomes. Thus, reported household income dropped slightly in 2011 from 2008. In addition, the changed labor
market affected employment levels, where residents were employed and how they commuted.
Summary of Key Findings for Downtown LA Demographic Study 2011 – by
Residents, Employees, Visitors and Total Respondents
The following sections highlight key findings by segments. Note, the number shown in parenthesis ( )
following the 2011 result represents the comparable result from the Demographic Study 2008.
Downtown Residents
Demographics: Downtown residents’ racial/ethnic composition, age, household size and gender
demographic ratios in 2011 were highly comparable to 2008.
Ethnicity: The largest group, Caucasians, remained constant at 53% (versus 54% in 2008), with Asian-
Americans/Pacific Islanders at 22% (21%) and Hispanics/Latinos at nearly 18% (17%), whereas
African-Americans at 6.5% slipped slightly from 8% in 2008.
Gender: 54% (53%) of Downtown resident respondents were female and 46% (47%) were male.
Age: Downtown residents’ median age was 32.5 (32.1) years.
DCBID Downtown LA Demographic Study 2011 • 8Executive Summary
Household Income - overall: For all Downtown residents, median household income was $86,300 in
2011 versus $89,900 in 2008, a decrease attributed to the recent recession.
Household Income with wage earner: For Downtown households with at least one employed person,
overall median income for 2011 was $89,800, below the $96,200 reported in 2008, attributed to the
recession.
Education Attainment: Downtown residents’ educational level continued to rise. Those completing
four years of college or higher was at 80% in 2011, versus 78% in 2008, and approximately five
percentage points higher than the 75% of Total respondents who completed at least four years of
college.
Children at Home: Just 6% (6%) of Downtown residents had children under the age of 5 years living at
home while 5% (4% aged 5 -13 in 2008) had children aged 5 to 18 living at home.
Own vs. Rent: 68% (66%) of Downtown residents rented an apartment or condo while 28% (30%)
owned their residence.
Employment Level and Location: 83% of Downtown residents reported being employed (anywhere)
in both survey years. Thus, while Total respondents reported a lower employment level since 2008,
Downtown residents’ maintained their employment at the same level in both surveys. However, fewer
Downtown residents reported being employed in Downtown in 2011, at 57% from 64% in 2008.
Employment Field: One-fifth or 20% (20%) of Downtown residents were employed in
business/professional/technical services, with nearly as many, 19% (17%) in arts/ entertainment, by
far the top two fields.
Employment Position: In 2011, of employed Downtown residents, more than one-half, 52% (50%)
were at top, senior and professional staff levels (regardless of workplace location).
Commuting to Work: Since the last survey commuting mode shifted. Far more Downtown residents
commuted alone by car, 55% in 2011 versus 35% in 2008, while 40% in both surveys, used modes of
public transit (e.g. bus, subway, Metrolink).
Tenure at Residence: Downtown residents spent a median of 1.7 (2.3) years at their current residence.
Pets: 43% (40%) of residents owned some type of pet; 28% (24%) owned a dog and 17% (16%) owned
a cat.
Travel and Spending for Groceries: Downtown residents traveled a median of 2.0 (2.6) miles for
groceries. Each residential household spent a median of $102.00 ($99) per week.
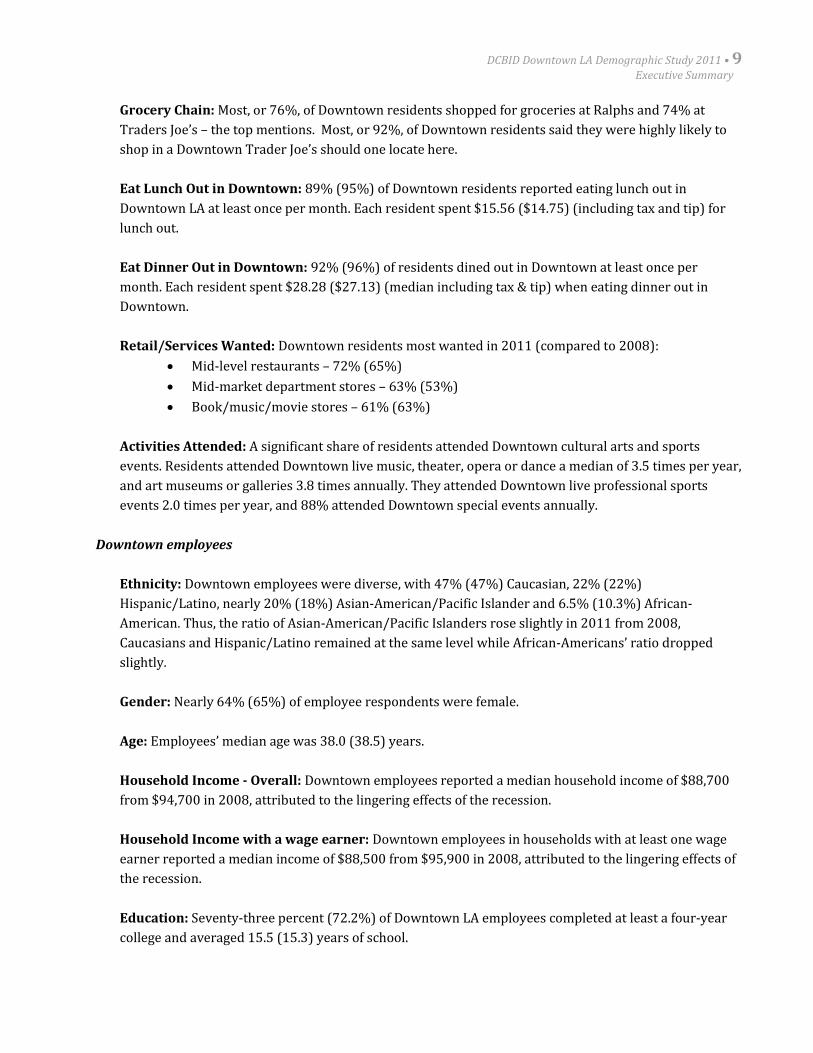
DCBID Downtown LA Demographic Study 2011 • 9Executive Summary
Grocery Chain: Most, or 76%, of Downtown residents shopped for groceries at Ralphs and 74% at
Traders Joe’s – the top mentions. Most, or 92%, of Downtown residents said they were highly likely to
shop in a Downtown Trader Joe’s should one locate here.
Eat Lunch Out in Downtown: 89% (95%) of Downtown residents reported eating lunch out in
Downtown LA at least once per month. Each resident spent $15.56 ($14.75) (including tax and tip) for
lunch out.
Eat Dinner Out in Downtown: 92% (96%) of residents dined out in Downtown at least once per
month. Each resident spent $28.28 ($27.13) (median including tax & tip) when eating dinner out in
Downtown.
Retail/Services Wanted: Downtown residents most wanted in 2011 (compared to 2008):
Mid-level restaurants – 72% (65%)
Mid-market department stores – 63% (53%)
Book/music/movie stores – 61% (63%)
Activities Attended: A significant share of residents attended Downtown cultural arts and sports
events. Residents attended Downtown live music, theater, opera or dance a median of 3.5 times per year,
and art museums or galleries 3.8 times annually. They attended Downtown live professional sports
events 2.0 times per year, and 88% attended Downtown special events annually.
Downtown employees
Ethnicity: Downtown employees were diverse, with 47% (47%) Caucasian, 22% (22%)
Hispanic/Latino, nearly 20% (18%) Asian-American/Pacific Islander and 6.5% (10.3%) African-
American. Thus, the ratio of Asian-American/Pacific Islanders rose slightly in 2011 from 2008,
Caucasians and Hispanic/Latino remained at the same level while African-Americans’ ratio dropped
slightly.
Gender: Nearly 64% (65%) of employee respondents were female.
Age: Employees’ median age was 38.0 (38.5) years.
Household Income - Overall: Downtown employees reported a median household income of $88,700
from $94,700 in 2008, attributed to the lingering effects of the recession.
Household Income with a wage earner: Downtown employees in households with at least one wage
earner reported a median income of $88,500 from $95,900 in 2008, attributed to the lingering effects of
the recession.
Education: Seventy-three percent (72.2%) of Downtown LA employees completed at least a four-year
college and averaged 15.5 (15.3) years of school.
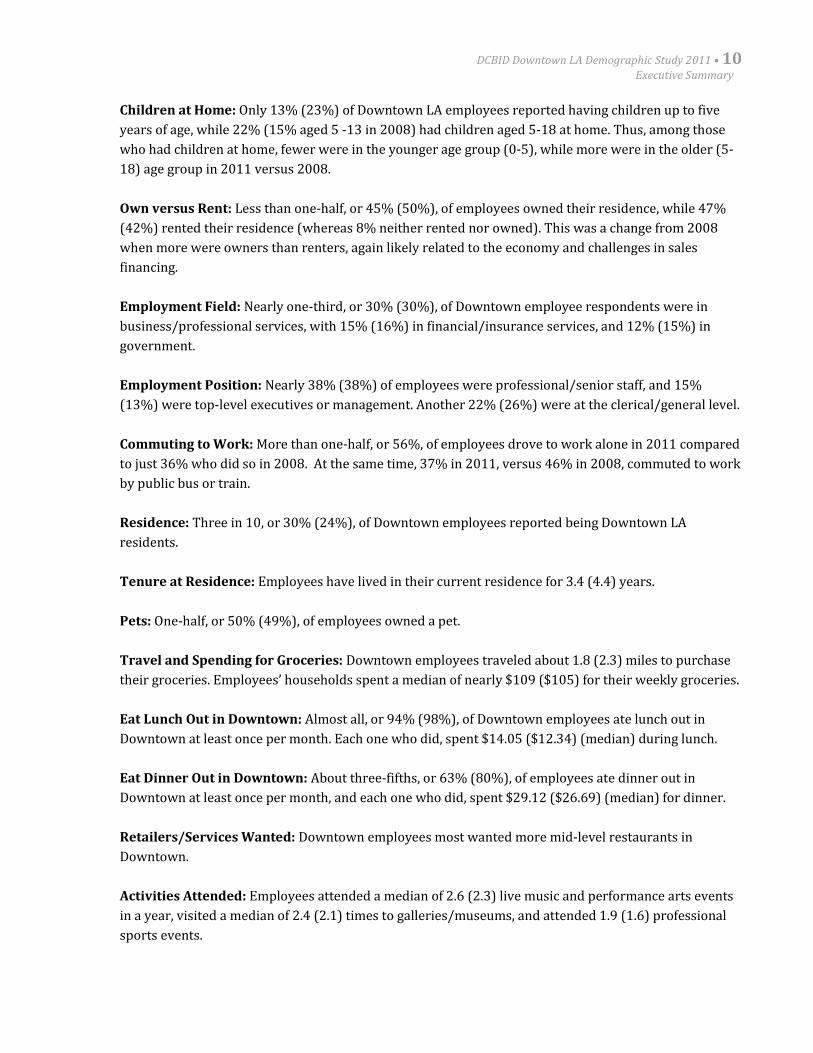
DCBID Downtown LA Demographic Study 2011 • 10Executive Summary
Children at Home: Only 13% (23%) of Downtown LA employees reported having children up to five
years of age, while 22% (15% aged 5 -13 in 2008) had children aged 5-18 at home. Thus, among those
who had children at home, fewer were in the younger age group (0-5), while more were in the older (5-
18) age group in 2011 versus 2008.
Own versus Rent: Less than one-half, or 45% (50%), of employees owned their residence, while 47%
(42%) rented their residence (whereas 8% neither rented nor owned). This was a change from 2008
when more were owners than renters, again likely related to the economy and challenges in sales
financing.
Employment Field: Nearly one-third, or 30% (30%), of Downtown employee respondents were in
business/professional services, with 15% (16%) in financial/insurance services, and 12% (15%) in
government.
Employment Position: Nearly 38% (38%) of employees were professional/senior staff, and 15%
(13%) were top-level executives or management. Another 22% (26%) were at the clerical/general level.
Commuting to Work: More than one-half, or 56%, of employees drove to work alone in 2011 compared
to just 36% who did so in 2008. At the same time, 37% in 2011, versus 46% in 2008, commuted to work
by public bus or train.
Residence: Three in 10, or 30% (24%), of Downtown employees reported being Downtown LA
residents.
Tenure at Residence: Employees have lived in their current residence for 3.4 (4.4) years.
Pets: One-half, or 50% (49%), of employees owned a pet.
Travel and Spending for Groceries: Downtown employees traveled about 1.8 (2.3) miles to purchase
their groceries. Employees’ households spent a median of nearly $109 ($105) for their weekly groceries.
Eat Lunch Out in Downtown: Almost all, or 94% (98%), of Downtown employees ate lunch out in
Downtown at least once per month. Each one who did, spent $14.05 ($12.34) (median) during lunch.
Eat Dinner Out in Downtown: About three-fifths, or 63% (80%), of employees ate dinner out in
Downtown at least once per month, and each one who did, spent $29.12 ($26.69) (median) for dinner.
Retailers/Services Wanted: Downtown employees most wanted more mid-level restaurants in
Downtown.
Activities Attended: Employees attended a median of 2.6 (2.3) live music and performance arts events
in a year, visited a median of 2.4 (2.1) times to galleries/museums, and attended 1.9 (1.6) professional
sports events.
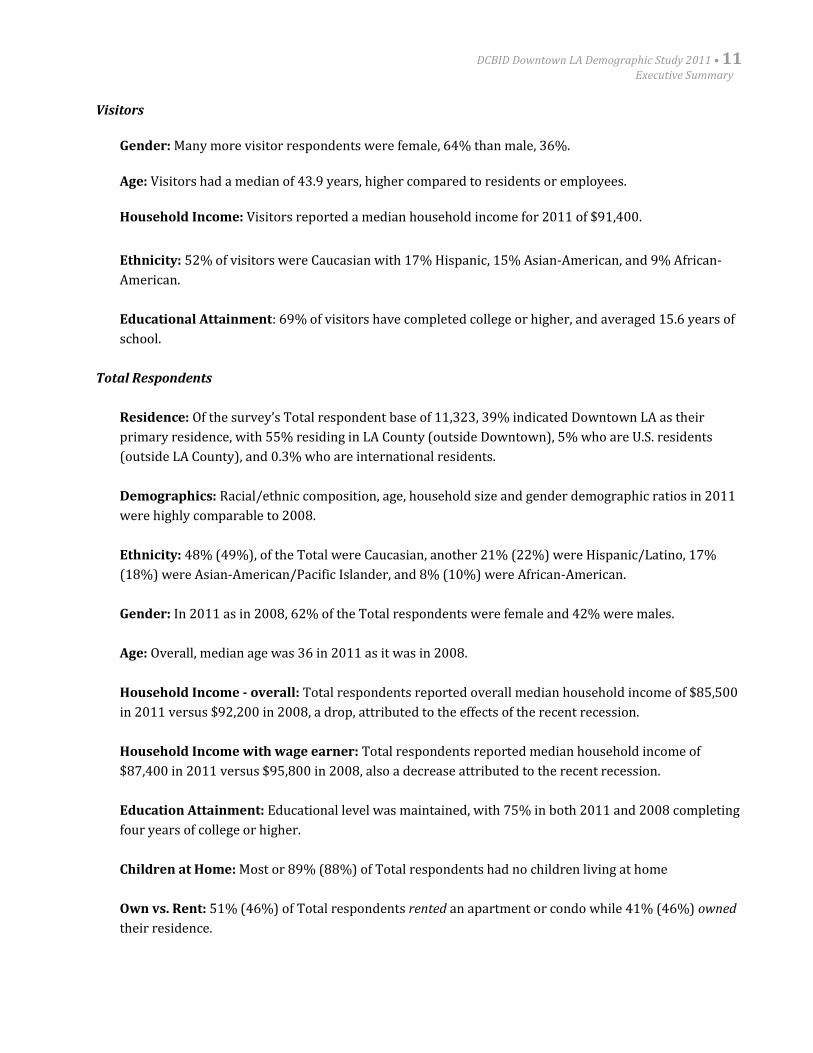
DCBID Downtown LA Demographic Study 2011 • 11Executive Summary
Visitors
Gender: Many more visitor respondents were female, 64% than male, 36%.
Age: Visitors had a median of 43.9 years, higher compared to residents or employees.
Household Income: Visitors reported a median household income for 2011 of $91,400.
Ethnicity: 52% of visitors were Caucasian with 17% Hispanic, 15% Asian-American, and 9% African-
American.
Educational Attainment: 69% of visitors have completed college or higher, and averaged 15.6 years of
school.
Total Respondents
Residence: Of the survey’s Total respondent base of 11,323, 39% indicated Downtown LA as their
primary residence, with 55% residing in LA County (outside Downtown), 5% who are U.S. residents
(outside LA County), and 0.3% who are international residents.
Demographics: Racial/ethnic composition, age, household size and gender demographic ratios in 2011
were highly comparable to 2008.
Ethnicity: 48% (49%), of the Total were Caucasian, another 21% (22%) were Hispanic/Latino, 17%
(18%) were Asian-American/Pacific Islander, and 8% (10%) were African-American.
Gender: In 2011 as in 2008, 62% of the Total respondents were female and 42% were males.
Age: Overall, median age was 36 in 2011 as it was in 2008.
Household Income - overall: Total respondents reported overall median household income of $85,500
in 2011 versus $92,200 in 2008, a drop, attributed to the effects of the recent recession.
Household Income with wage earner: Total respondents reported median household income of
$87,400 in 2011 versus $95,800 in 2008, also a decrease attributed to the recent recession.
Education Attainment: Educational level was maintained, with 75% in both 2011 and 2008 completing
four years of college or higher.
Children at Home: Most or 89% (88%) of Total respondents had no children living at home
Own vs. Rent: 51% (46%) of Total respondents rented an apartment or condo while 41% (46%) owned
their residence.
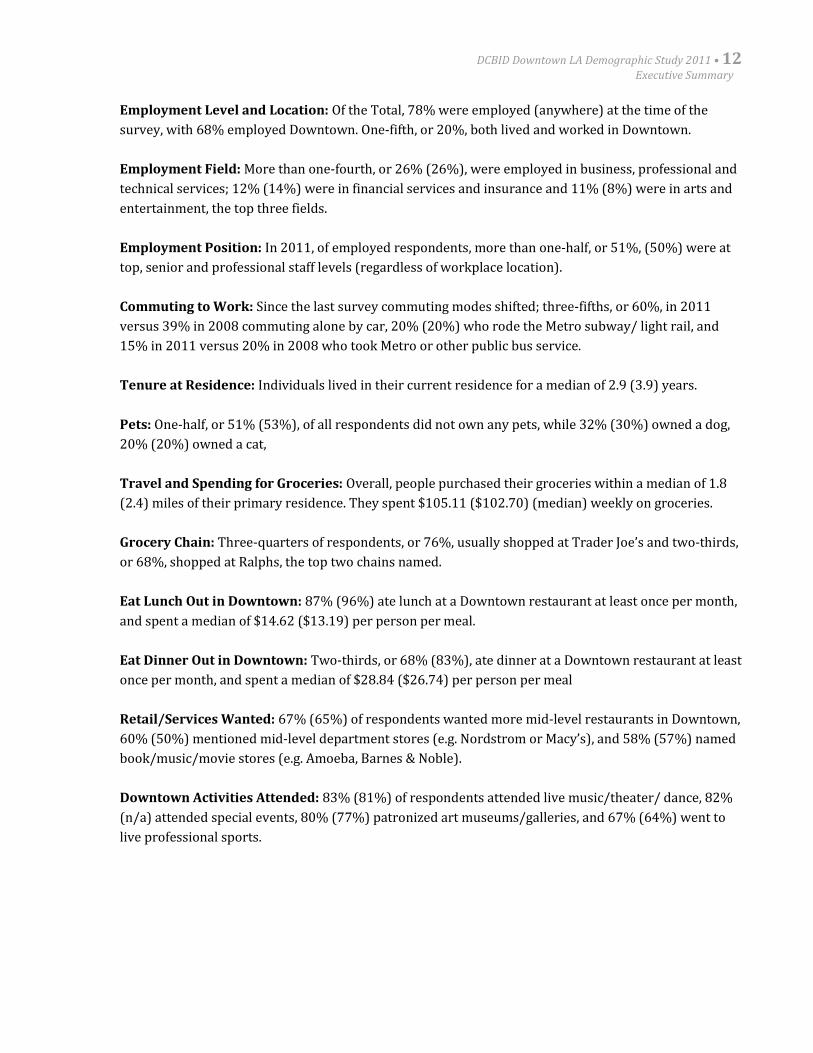
DCBID Downtown LA Demographic Study 2011 • 12Executive Summary
Employment Level and Location: Of the Total, 78% were employed (anywhere) at the time of the
survey, with 68% employed Downtown. One-fifth, or 20%, both lived and worked in Downtown.
Employment Field: More than one-fourth, or 26% (26%), were employed in business, professional and
technical services; 12% (14%) were in financial services and insurance and 11% (8%) were in arts and
entertainment, the top three fields.
Employment Position: In 2011, of employed respondents, more than one-half, or 51%, (50%) were at
top, senior and professional staff levels (regardless of workplace location).
Commuting to Work: Since the last survey commuting modes shifted; three-fifths, or 60%, in 2011
versus 39% in 2008 commuting alone by car, 20% (20%) who rode the Metro subway/ light rail, and
15% in 2011 versus 20% in 2008 who took Metro or other public bus service.
Tenure at Residence: Individuals lived in their current residence for a median of 2.9 (3.9) years.
Pets: One-half, or 51% (53%), of all respondents did not own any pets, while 32% (30%) owned a dog,
20% (20%) owned a cat,
Travel and Spending for Groceries: Overall, people purchased their groceries within a median of 1.8
(2.4) miles of their primary residence. They spent $105.11 ($102.70) (median) weekly on groceries.
Grocery Chain: Three-quarters of respondents, or 76%, usually shopped at Trader Joe’s and two-thirds,
or 68%, shopped at Ralphs, the top two chains named.
Eat Lunch Out in Downtown: 87% (96%) ate lunch at a Downtown restaurant at least once per month,
and spent a median of $14.62 ($13.19) per person per meal.
Eat Dinner Out in Downtown: Two-thirds, or 68% (83%), ate dinner at a Downtown restaurant at least
once per month, and spent a median of $28.84 ($26.74) per person per meal
Retail/Services Wanted: 67% (65%) of respondents wanted more mid-level restaurants in Downtown,
60% (50%) mentioned mid-level department stores (e.g. Nordstrom or Macy’s), and 58% (57%) named
book/music/movie stores (e.g. Amoeba, Barnes & Noble).
Downtown Activities Attended: 83% (81%) of respondents attended live music/theater/ dance, 82%
(n/a) attended special events, 80% (77%) patronized art museums/galleries, and 67% (64%) went to
live professional sports.
DCBID Downtown LA Demographic Study 2011 • 13Executive Summary
CONCLUSION
The study results underscore that Downtown LA is supported by a strong residential and employment base.
Downtown LA is alive with new developments, fine and eclectic restaurants, unique businesses, exciting events
and activities, and a new wave of residents entering the market. Downtown LA is economically viable, culturally
vibrant and continues to grow strongly. Downtown LA is the Southern California hub for economic activity,
employment and transportation. It is the region’s premier destination for entertainment, nightlife, sports events,
cultural arts and special events.
In 2010, the Los Angeles Film Festival relocated to Downtown LA. As of 2011, the Los Angeles Times’ Festival of
Books moved to the University of Southern California campus (just south of Downtown), and the ESPN X Games
will be held exclusively in Downtown. All signs point to sustained growth and viability now and into the near-
term future.
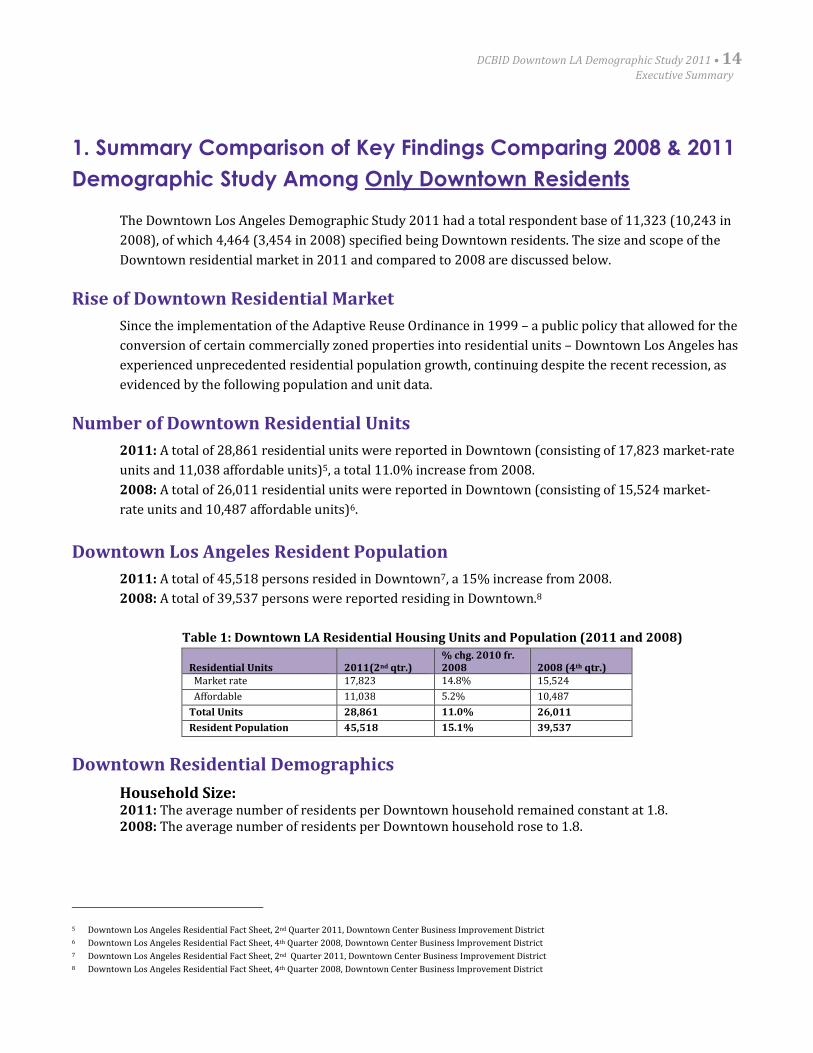
DCBID Downtown LA Demographic Study 2011 • 14Executive Summary
1. Summary Comparison of Key Findings Comparing 2008 & 2011
Demographic Study Among Only Downtown Residents
The Downtown Los Angeles Demographic Study 2011 had a total respondent base of 11,323 (10,243 in
2008), of which 4,464 (3,454 in 2008) specified being Downtown residents. The size and scope of the
Downtown residential market in 2011 and compared to 2008 are discussed below.
Rise of Downtown Residential Market
Since the implementation of the Adaptive Reuse Ordinance in 1999 – a public policy that allowed for the
conversion of certain commercially zoned properties into residential units – Downtown Los Angeles has
experienced unprecedented residential population growth, continuing despite the recent recession, as
evidenced by the following population and unit data.
Number of Downtown Residential Units
2011: A total of 28,861 residential units were reported in Downtown (consisting of 17,823 market-rate
units and 11,038 affordable units)5, a total 11.0% increase from 2008.
2008: A total of 26,011 residential units were reported in Downtown (consisting of 15,524 market-
rate units and 10,487 affordable units)6.
Downtown Los Angeles Resident Population
2011: A total of 45,518 persons resided in Downtown7, a 15% increase from 2008.
2008: A total of 39,537 persons were reported residing in Downtown.8
Table 1: Downtown LA Residential Housing Units and Population (2011 and 2008)
Residential Units 2011(2nd qtr.)% chg. 2010 fr.2008 2008 (4th qtr.)
Market rate 17,823 14.8% 15,524
Affordable 11,038 5.2% 10,487
Total Units 28,861 11.0% 26,011
Resident Population 45,518 15.1% 39,537
Downtown Residential Demographics
Household Size:2011: The average number of residents per Downtown household remained constant at 1.8.2008: The average number of residents per Downtown household rose to 1.8.
5 Downtown Los Angeles Residential Fact Sheet, 2nd Quarter 2011, Downtown Center Business Improvement District6 Downtown Los Angeles Residential Fact Sheet, 4th Quarter 2008, Downtown Center Business Improvement District7 Downtown Los Angeles Residential Fact Sheet, 2nd Quarter 2011, Downtown Center Business Improvement District8 Downtown Los Angeles Residential Fact Sheet, 4th Quarter 2008, Downtown Center Business Improvement District
DCBID Downtown LA Demographic Study 2011 • 15Executive Summary
Household Composition:2011: Single heterosexual adult households comprised 45% (versus 43% in 2008) of total Downtown
households. All married/partnered adults (whether heterosexual or GLBT9) comprised 40% (41%), and
single GLBT adults at 7% remained comparable to 2008.
2008: Single heterosexual adult households comprised 43% of total Downtown households. Married/
partnered adults (whether heterosexual or GLBT) comprised 41%, and single GLBT adults at 6%.
Residential Tenure:
2011: Downtown residents spent a median of 1.7 years at their current residence.
2008: Downtown residents spent 2.3 years at their current residence.
*In 2011, resident tenure dropped from 2008. This suggests that the survey included many new residents, and likely reflects
the many new residential units that have entered the Downtown market since 2008.
Own vs. Rent:
2011: The percentage of Downtown residents who rented an apartment or condo grew to 68% while
28% owned their residences. The remaining 4% reported other living arrangements.
2008: The percentage of Downtown residents who rented was 66% versus 30% who owned their
residence, with 4% reporting other arrangements.
*This growth in renters was likely due to two factors: recent economic and financing conditions in which more people
qualified to rent verses own, and that most of the new residential product entering the Downtown market was rental.
Employment – Full- or Part-Time:
2011: 83% of Downtown residents were employed or self-employed full-time or part-time.
2008: 83% of Downtown residents were employed or self-employed full-time or part-time.
Employment – Position:
2011: Just over one-half, or 52%, of Downtown residents were at top, senior and professional staff
levels (regardless of workplace location).
2008: One-half, or 50% of Downtown residents were at top, senior and professional staff levels
(regardless of workplace location).
Where Downtown Residents Work:
2011: 57% of residents worked in Downtown.
2008: 64% of residents worked in Downtown.
*The decline in 2011 reflects a loss of jobs in Downtown by residents. Future surveys will provide a better idea as to the
significance of this indicator for 2011.
Education:
2011: 80% of Downtown residents completed four-year college or higher levels of education.
2008: 78% of Downtown residents completed four-year college or higher levels of education.
*The level of educational attainment continued to rise in each of the study periods.
9 GLBT = Gay/Lesbian/Bisexual/Transgendered individuals
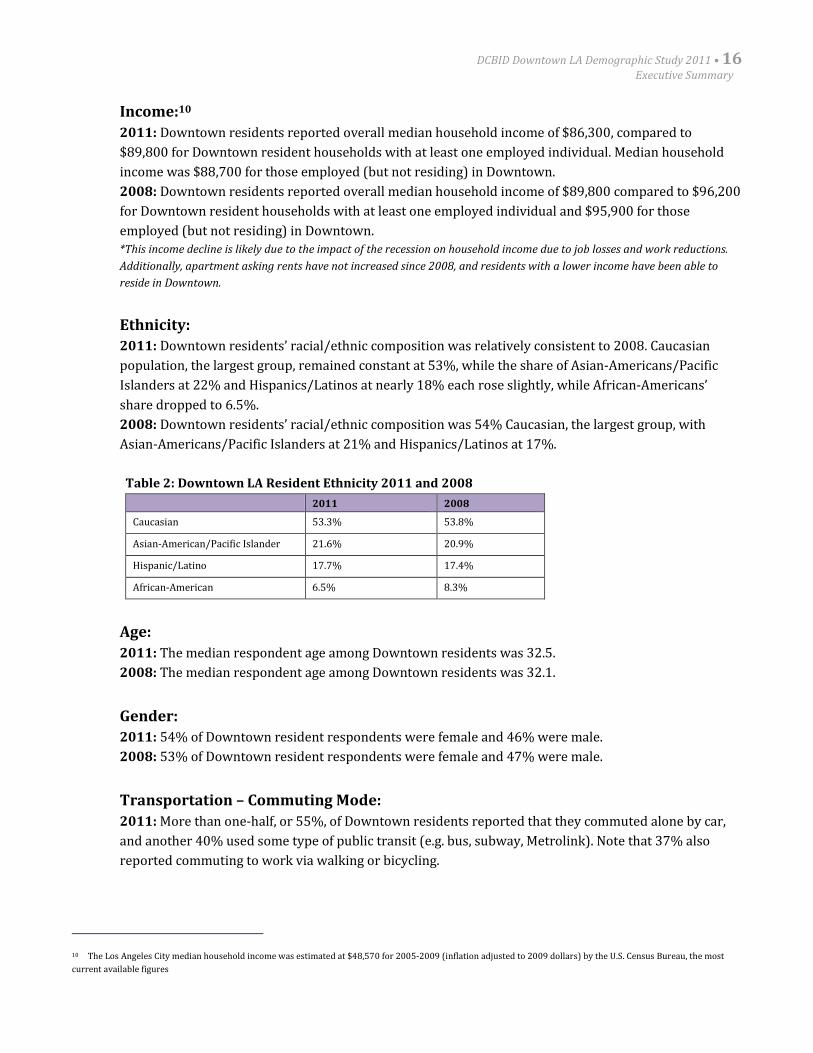
DCBID Downtown LA Demographic Study 2011 • 16Executive Summary
Income:10
2011: Downtown residents reported overall median household income of $86,300, compared to
$89,800 for Downtown resident households with at least one employed individual. Median household
income was $88,700 for those employed (but not residing) in Downtown.
2008: Downtown residents reported overall median household income of $89,800 compared to $96,200
for Downtown resident households with at least one employed individual and $95,900 for those
employed (but not residing) in Downtown.
*This income decline is likely due to the impact of the recession on household income due to job losses and work reductions.
Additionally, apartment asking rents have not increased since 2008, and residents with a lower income have been able to
reside in Downtown.
Ethnicity:
2011: Downtown residents’ racial/ethnic composition was relatively consistent to 2008. Caucasian
population, the largest group, remained constant at 53%, while the share of Asian-Americans/Pacific
Islanders at 22% and Hispanics/Latinos at nearly 18% each rose slightly, while African-Americans’
share dropped to 6.5%.
2008: Downtown residents’ racial/ethnic composition was 54% Caucasian, the largest group, with
Asian-Americans/Pacific Islanders at 21% and Hispanics/Latinos at 17%.
Table 2: Downtown LA Resident Ethnicity 2011 and 2008
2011 2008
Caucasian 53.3% 53.8%
Asian-American/Pacific Islander 21.6% 20.9%
Hispanic/Latino 17.7% 17.4%
African-American 6.5% 8.3%
Age:
2011: The median respondent age among Downtown residents was 32.5.
2008: The median respondent age among Downtown residents was 32.1.
Gender:
2011: 54% of Downtown resident respondents were female and 46% were male.
2008: 53% of Downtown resident respondents were female and 47% were male.
Transportation – Commuting Mode:
2011: More than one-half, or 55%, of Downtown residents reported that they commuted alone by car,
and another 40% used some type of public transit (e.g. bus, subway, Metrolink). Note that 37% also
reported commuting to work via walking or bicycling.
10 The Los Angeles City median household income was estimated at $48,570 for 2005-2009 (inflation adjusted to 2009 dollars) by the U.S. Census Bureau, the most
current available figures
DCBID Downtown LA Demographic Study 2011 • 17Executive Summary
2008: One-third, or 35%, commuted alone by car, another 35% used public transit, and 17% commuted
to work via walking or bicycling.
* The large shift to commuting alone by car in 2011 from 2008 may be unexpected, and is attributed to a lower share of
Downtown residents reporting working in Downtown in this survey, likely meaning they work outside of Downtown and
requiring them to drive to work.
Grocery Spending:
2011: Each residential household spent $102.00 (median - current dollars) per week on groceries.
2008: Each residential household spent $99.00 (median - current dollars) per week on groceries.
Grocery Stores Shop in/Requested:
2011: This year’s survey reworded the question asking “in which grocery chain do you usually shop?”
Most residents, 76% named Ralphs and 74% named Traders Joe’s as the top two mentions.
2008: Most residents, 89% named Traders Joe’s and 68% named Whole Foods Market as the most
requested grocers to locate in Downtown. A Ralphs Fresh Fare opened in Downtown before the 2008
survey.
Likely to Shop in Trader Joe’s:
The 2011 survey specifically asked the likelihood of shopping at Trader Joe’s if located in Downtown.
Mostly all, or 92%, of Downtown residents said they were extremely or very likely to shop in a
Downtown Trader Joe’s.
Dining Out – Dinner in Downtown
2011: 92% of residents dined out in Downtown at least once per month. Each resident spent $28.28
(median including tax & tip) when eating dinner out in Downtown.
2008: 96% of residents ate dinner out in Downtown at least once per month. Each resident spent
$27.13 (median including tax & tip) when eating dinner out in Downtown.
Dining Out – Dinner in Any Area
2011: 99% of residents ate dinner out in any area at least once per month. Each resident spent $27.93
(median including tax & tip) when eating dinner out (in any area, not just in Downtown).
2008: This question was not asked.
Dining Out – Lunch in Downtown
2011: 89% of Downtown residents reported eating lunch out in Downtown LA at least once per month.
Each resident spent $15.56 (including tax and tip) for lunch out.
2008: 95% of Downtown residents reported eating lunch out in Downtown LA at least once per month
Each resident spent $14.75 (including tax and tip) for lunch out.
DCBID Downtown LA Demographic Study 2011 • 18Executive Summary
Retail/Services Most Wanted in Downtown:
2011: Residents’ retail/services most wanted were:
Mid-level restaurants – 72%
Mid-market department stores – 63%
Book/music/movie stores – 61%
2008: Residents’ retail/services most wanted were:
Discount department stores – 67%
Mid-level restaurants – 65%
Movie theaters – 59%
*In 2011, the most wanted retail types for Downtown shifted to mid-level restaurants and mid-level department stores, awayfrom discount stores, likely due to the announcement of a Target store to open in Downtown. Top retail brands desiredincluded: Nordstrom/Nordstrom Rack, Apple Store, Best Buy, Barnes & Noble Booksellers, Bloomingdale’s and Costco. Thelower percentage naming movie theaters was likely due to the opening of the Regal 14 Cinemas at L.A. Live on October 27,2009.
Pet Ownership:
2011: 43% of residents owned some type of pet; 28% owned a dog and 17% owned a cat.
2008: 40% of residents owned some type of pet; 24% owned a dog and 16% owned a cat.
DCBID Downtown LA Demographic Study 2011 • 19Executive Summary
2. Summary of Key Findings for All Respondents (“Overall
Demographics”) for the Demographic Study 2011, including
Downtown residents, office workers and visitors
The current study was conducted via Internet, targeting a broad Downtown population base beyond
residents – to those who were employed, visiting, and attending cultural arts or sports events in
Downtown. “Total” refers to all 11,323 (10,243 in 2008) respondents encompassing these categories.
The number shown in parenthesis ( ) following the 2011 result represents the comparable result from
the Demographic Study 2008.
The key findings from all respondents are presented below.
Overall Demographics
Relationship to Downtown Los Angeles, Employment and Activities:
2011: Of Total respondents, 39% were Downtown LA residents, with 55% residing in LA County
(outside Downtown), 5% who were U.S. residents (outside LA County), and .3% were international
residents.
2008: Of Total respondents, 39% indicated that their primary residence was in Downtown LA, with
61% living outside of Downtown.
2011: Of the Total, 68% were employed in Downtown, and 20% both lived and worked in Downtown.
2008: Of the Total, 72% were employed in Downtown, and 14% both lived and worked in Downtown.
2011: Just more than half, or 51%, of all respondents attended Downtown museums, live theater, or arts
events at least four times a year.
2008: Half, or 50%, of all respondents attended Downtown museums, live theater, or arts events at least
four times a year.
2011: 29% attended live sports events in Downtown at least once quarterly, identical to 2008.
2008: Nearly one in three, or 29%, attended live sports events in Downtown at least once quarterly.
Income:
2011: Total respondents reported median annual household income of $85,500, again well above that
for Los Angeles City and County overall.11
2008: Total respondents reported median annual household income of $92,200.
11 The 2007 median income (latest available for L.A. County) was $54,828 for Los Angeles County households and $48,570 for Los Angeles City. Source: 2005-2009
American Community Survey 5-Year Estimates, U.S. Census Bureau (adjusted for inflation in 2009 dollars), the most current available figures.
DCBID Downtown LA Demographic Study 2011 • 20Executive Summary
Age:
2011: The median age of all respondents again was 36 years old.
2008: The median age of all respondents was 36 years old.
Ethnicity:
2011: Nearly half, or 48%, of the Total were Caucasian, 21% were Hispanic/Latino, 17% were Asian-
American/Pacific Islander, and 8% were African-American.
2008: Nearly half, or 49%, of the Total were Caucasian, 22% were Hispanic/Latino, 18% were Asian-
American/Pacific Islander, and 10% were African-American.
Education:
2011: Three-quarters, or 75%, of the Total completed four years of college or higher while averaging
15.9 total years of education.
2008: Three-quarters, or 75 %, of the Total completed nearly 16 years of education.
Gender:
2011: Again more than six in 10, or 62%, of Total respondents were female.
2008: 62% of all respondents were female.
Employment:
2011:
78% were employed full- or part-time.
10% were self-employed.
51% of all respondents were professional, senior staff or top-level executives.
For Downtown employees, 53% were top-level executives/senior staff.
2008:
88% were employed full- or part-time.
7% were self-employed.
50% of all respondents were professional, senior staff or top-level executives.
For Downtown employees, 51% were top-level executives/senior staff.
Household Composition:
2011: Marital: About 45% of the Total households were comprised of married/partnered heterosexual
or GLBT12 adults. Overall, 40% of the Total households consisted of a single adult.
2008: Marital: 47% of the Total households were comprised of married/partnered heterosexual or
GLBT adults. Overall, 39% of the Total households consisted of a single adult.
12 GLBT = Gay/Lesbian/Bisexual/Transgendered individuals
DCBID Downtown LA Demographic Study 2011 • 21Executive Summary
Children:
2011: Overall, 21% of Total respondents had children from infant to five years old, while 15% reported
children at home aged 5 -18 (5 -13 in 2008).
2008: Overall, 22% of Total respondents had children from infant to five years old, while 12% had
children at home aged 5 -13.
Household Size:
2011: Each participant household averaged a total of 2.2 people.
2008: Each participant household averaged a total of 2.3 people.
Residence Ownership versus Rental:
2011: 41% of all respondents owned their residence, and 51% rented their residence (with 8% in other
arrangements).
2008: 47% of all respondents owned their residence, and 46% rented their residence (with 7% in other
arrangements).
Tenure:
2011: Downtown residents have lived at their current location for 1.7 years, a decrease from 2008.
2008: Downtown residents have lived at their current location for 2.3 years
Office or Studio:
2011: More than one-quarter, or 28%, of the Total used their residence as a primary or secondary office
or studio.
2008: About one-quarter of the Total used their residence as a primary or secondary office or studio.
Grocery, Retail, Dining Out and Activities
Grocery Purchases:
Each household spent $105 ($102 in 2008) median (mid-point) per week on groceries, shopping mainly
at chain supermarkets, but also at specialty grocers and farmers’ markets. Downtown residents were
more likely than the Total to travel slightly farther to purchase groceries, to shop at non-chain grocers,
or to go outside of Downtown due to the limited presence of chain grocers other than Ralphs in the area.
Where They Buy Groceries:
Trader Joe’s was mentioned by 75% of all respondents and Ralphs was mentioned by 68% as the top
two grocery chains where they usually shop.
Retailers Wanted in Downtown:
In 2011, the focus shifted as 65% (67% in 2008) wanted more mid-level restaurants, while only 41%
(65%) named a discount store, likely due to the planned Downtown Target store. Another 60% (50%)
DCBID Downtown LA Demographic Study 2011 • 22Executive Summary
wanted mid-level department stores, nearly as many 58% (57%) named book/music/movie stores and
57% (53%) named electronics stores. About one-half, or 51%, (51%) wanted fashion/clothing stores
and 47% (59%) wanted movie theaters – likely lower than in 2008 due to the opening of the Regal 14
Cineplex at LA LIVE in October 2009.
Dining Out:
Downtown residents, employees and others have a very high propensity for eating out at Downtown Los
Angeles restaurants.
Lunch out: They ate nearly eight (seven) lunches out per month, and spent a median of $14.60
($13.00) per person.
Dinner out: They dined out nearly four (four) times per month and spent a median of nearly
$29.00 ($27.00) per person.
Events and Activities:
Downtown attracts significant amounts of people for cultural arts and sports events.
Cultural: All respondents attended Downtown live music, theater, opera or dance a median of
2.8 (2.5) times per year, and art museums or galleries 2.7 (2.4) times per year.
Sports: Respondents attended live collegiate sports events .4 (.4) times per year and live
professional sports events 1.8 (1.6) times per year.
Special events: 88% (there is no % from 2008) of respondents attended special events in
Downtown.
DCBID Downtown LA Demographic Study 2011 • 23Detailed Findings
Downtown LADemographic Study 2011Detailed Findings
BACKGROUND AND PURPOSE
Over the past 10 years, Downtown Los Angeles has experienced an extraordinary commercial and residential
renaissance. With some 45,000 residents, 500,000+ weekday employment population and over 10 million
annual non-local visitors, Downtown Los Angeles has become Southern California’s economic engine.
The Downtown Center Business Improvement District (DCBID) is a coalition of property owners, consisting of
more than 2,623 parcels13, committed to enhancing the quality of life in Downtown Los Angeles and helping it
achieve its full potential as a great place to live, work and play. Encompassing a 65-block district in the heart of
Downtown, the DCBID funds safe-and-clean programs through its “Purple Patrol,” engages in economic
development, business retention and attraction programs, and acts as a resource to potential retailers,
restaurants, nightlife tenants, amenities, services, investors, bankers, residents and developers.
The DCBID also provides marketing programs such as special events, promotional offers, advertising and public
relations, targeting both businesses and consumers.
The main purpose of this demographic study is to provide economic and demographic data to inform the DCBID
about who lives, works, plays and visits in Downtown LA. With this information, the DCBID is better able to
recruit retailers, restaurants, and other consumer businesses and amenities to Downtown Los Angeles.
To that end and to update its Downtown Los Angeles Demographic Survey 200814, the DCBID retained Horizon
Consumer Science (HCS) to manage and conduct comprehensive market research of demographic/household
characteristics among current Downtown residents, employees and visitors. This 2011 study also compares the
results to the 2008 study, as shown in parenthesis ( ) following the 2011 result.
13 Of these properties, 835 parcels (or 87.4% of the assessed) are commercial use; 1,777 parcels (or 9.2% of the assessed) are residential use; and 11 parcels (or 3.4%
of the assessed) are government use.14 Downtown Center Business Improvement District, Downtown Los Angeles Demographic Survey 2008, (April 2009)
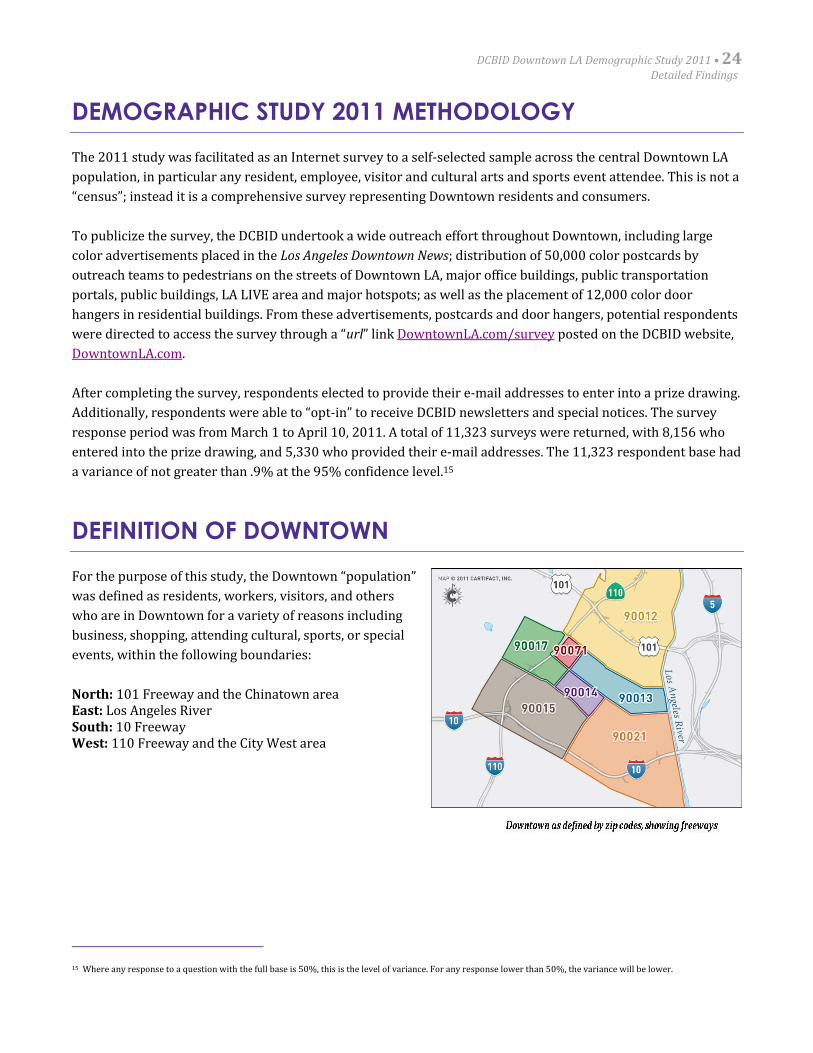
DCBID Downtown LA Demographic Study 2011 • 24Detailed Findings
DEMOGRAPHIC STUDY 2011 METHODOLOGY
The 2011 study was facilitated as an Internet survey to a self-selected sample across the central Downtown LA
population, in particular any resident, employee, visitor and cultural arts and sports event attendee. This is not a
“census”; instead it is a comprehensive survey representing Downtown residents and consumers.
To publicize the survey, the DCBID undertook a wide outreach effort throughout Downtown, including large
color advertisements placed in the Los Angeles Downtown News; distribution of 50,000 color postcards by
outreach teams to pedestrians on the streets of Downtown LA, major office buildings, public transportation
portals, public buildings, LA LIVE area and major hotspots; as well as the placement of 12,000 color door
hangers in residential buildings. From these advertisements, postcards and door hangers, potential respondents
were directed to access the survey through a “url” link DowntownLA.com/survey posted on the DCBID website,
DowntownLA.com.
After completing the survey, respondents elected to provide their e-mail addresses to enter into a prize drawing.
Additionally, respondents were able to “opt-in” to receive DCBID newsletters and special notices. The survey
response period was from March 1 to April 10, 2011. A total of 11,323 surveys were returned, with 8,156 who
entered into the prize drawing, and 5,330 who provided their e-mail addresses. The 11,323 respondent base had
a variance of not greater than .9% at the 95% confidence level.15
DEFINITION OF DOWNTOWN
For the purpose of this study, the Downtown “population”
was defined as residents, workers, visitors, and others
who are in Downtown for a variety of reasons including
business, shopping, attending cultural, sports, or special
events, within the following boundaries:
North: 101 Freeway and the Chinatown areaEast: Los Angeles RiverSouth: 10 FreewayWest: 110 Freeway and the City West area
15 Where any response to a question with the full base is 50%, this is the level of variance. For any response lower than 50%, the variance will be lower.
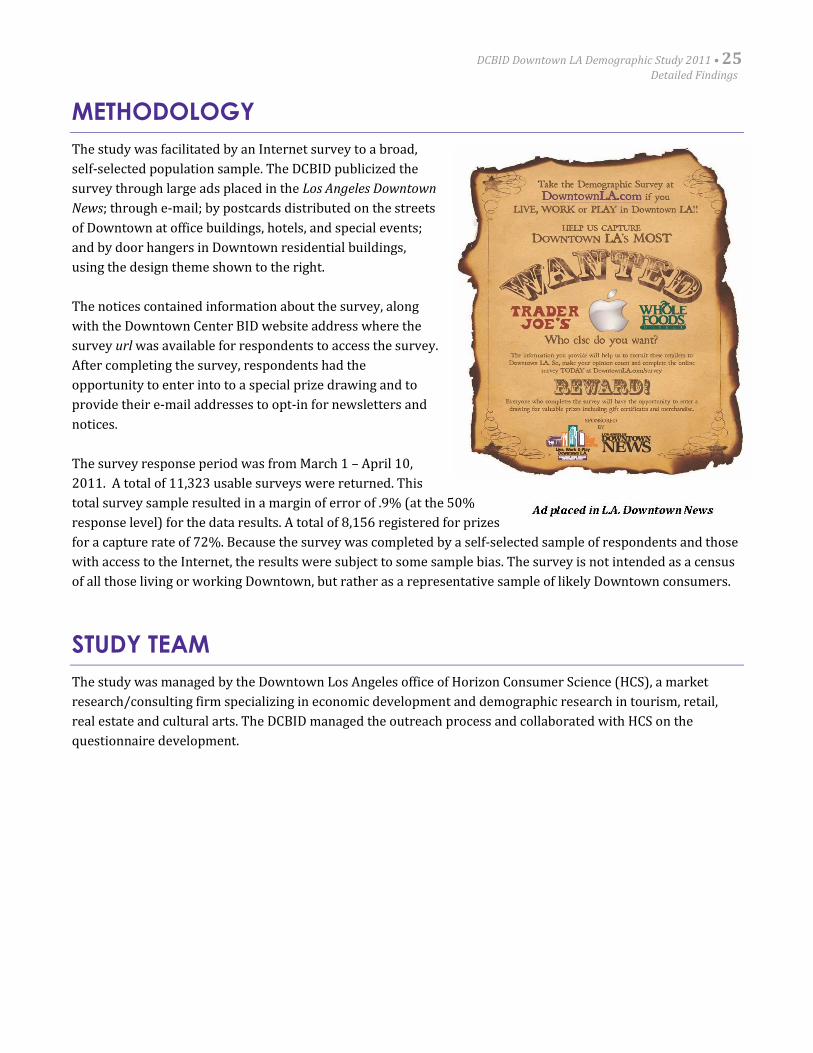
DCBID Downtown LA Demographic Study 2011 • 25Detailed Findings
METHODOLOGY
The study was facilitated by an Internet survey to a broad,
self-selected population sample. The DCBID publicized the
survey through large ads placed in the Los Angeles Downtown
News; through e-mail; by postcards distributed on the streets
of Downtown at office buildings, hotels, and special events;
and by door hangers in Downtown residential buildings,
using the design theme shown to the right.
The notices contained information about the survey, along
with the Downtown Center BID website address where the
survey url was available for respondents to access the survey.
After completing the survey, respondents had the
opportunity to enter into to a special prize drawing and to
provide their e-mail addresses to opt-in for newsletters and
notices.
The survey response period was from March 1 – April 10,
2011. A total of 11,323 usable surveys were returned. This
total survey sample resulted in a margin of error of .9% (at the 50%
response level) for the data results. A total of 8,156 registered for prizes
for a capture rate of 72%. Because the survey was completed by a self-selected sample of respondents and those
with access to the Internet, the results were subject to some sample bias. The survey is not intended as a census
of all those living or working Downtown, but rather as a representative sample of likely Downtown consumers.
STUDY TEAM
The study was managed by the Downtown Los Angeles office of Horizon Consumer Science (HCS), a market
research/consulting firm specializing in economic development and demographic research in tourism, retail,
real estate and cultural arts. The DCBID managed the outreach process and collaborated with HCS on the
questionnaire development.
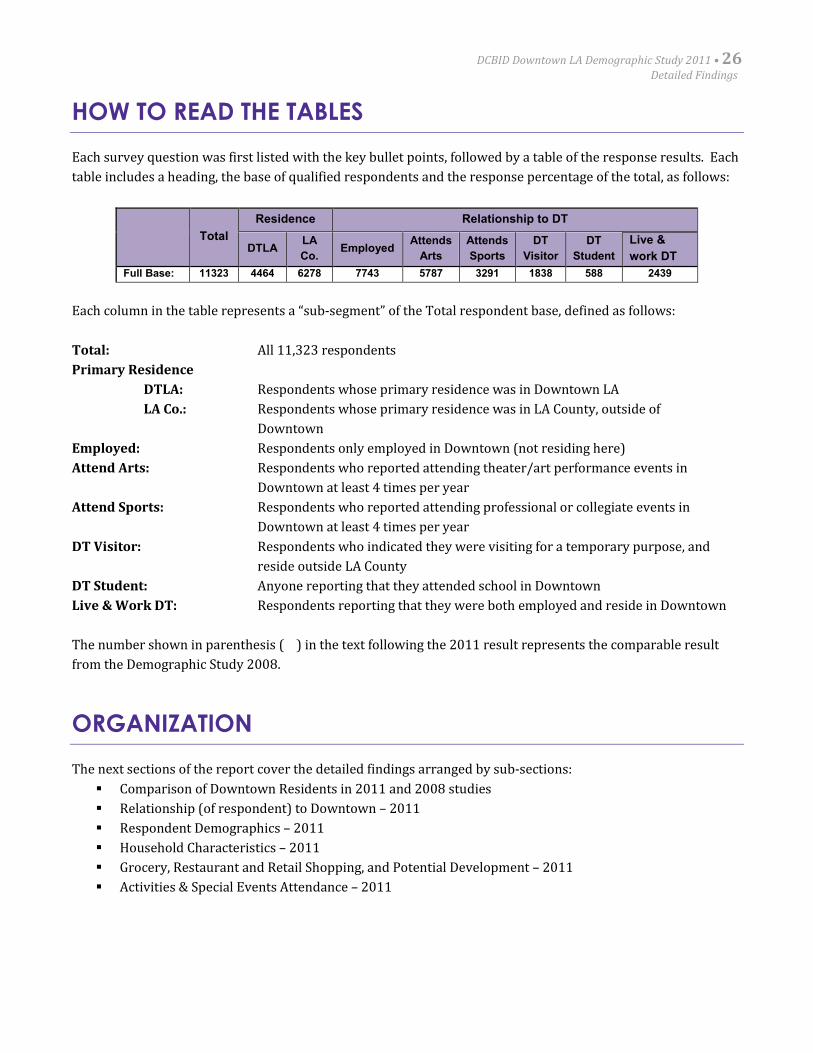
DCBID Downtown LA Demographic Study 2011 • 26Detailed Findings
HOW TO READ THE TABLES
Each survey question was first listed with the key bullet points, followed by a table of the response results. Each
table includes a heading, the base of qualified respondents and the response percentage of the total, as follows:
Total
Residence Relationship to DT
DTLALA
Co.Employed
Attends
Arts
Attends
Sports
DT
Visitor
DT
Student
Live &
work DT
Full Base: 11323 4464 6278 7743 5787 3291 1838 588 2439
Each column in the table represents a “sub-segment” of the Total respondent base, defined as follows:
Total: All 11,323 respondents
Primary Residence
DTLA: Respondents whose primary residence was in Downtown LA
LA Co.: Respondents whose primary residence was in LA County, outside of
Downtown
Employed: Respondents only employed in Downtown (not residing here)
Attend Arts: Respondents who reported attending theater/art performance events in
Downtown at least 4 times per year
Attend Sports: Respondents who reported attending professional or collegiate events in
Downtown at least 4 times per year
DT Visitor: Respondents who indicated they were visiting for a temporary purpose, and
reside outside LA County
DT Student: Anyone reporting that they attended school in Downtown
Live & Work DT: Respondents reporting that they were both employed and reside in Downtown
The number shown in parenthesis ( ) in the text following the 2011 result represents the comparable result
from the Demographic Study 2008.
ORGANIZATION
The next sections of the report cover the detailed findings arranged by sub-sections:
Comparison of Downtown Residents in 2011 and 2008 studies
Relationship (of respondent) to Downtown – 2011
Respondent Demographics – 2011
Household Characteristics – 2011
Grocery, Restaurant and Retail Shopping, and Potential Development – 2011
Activities & Special Events Attendance – 2011
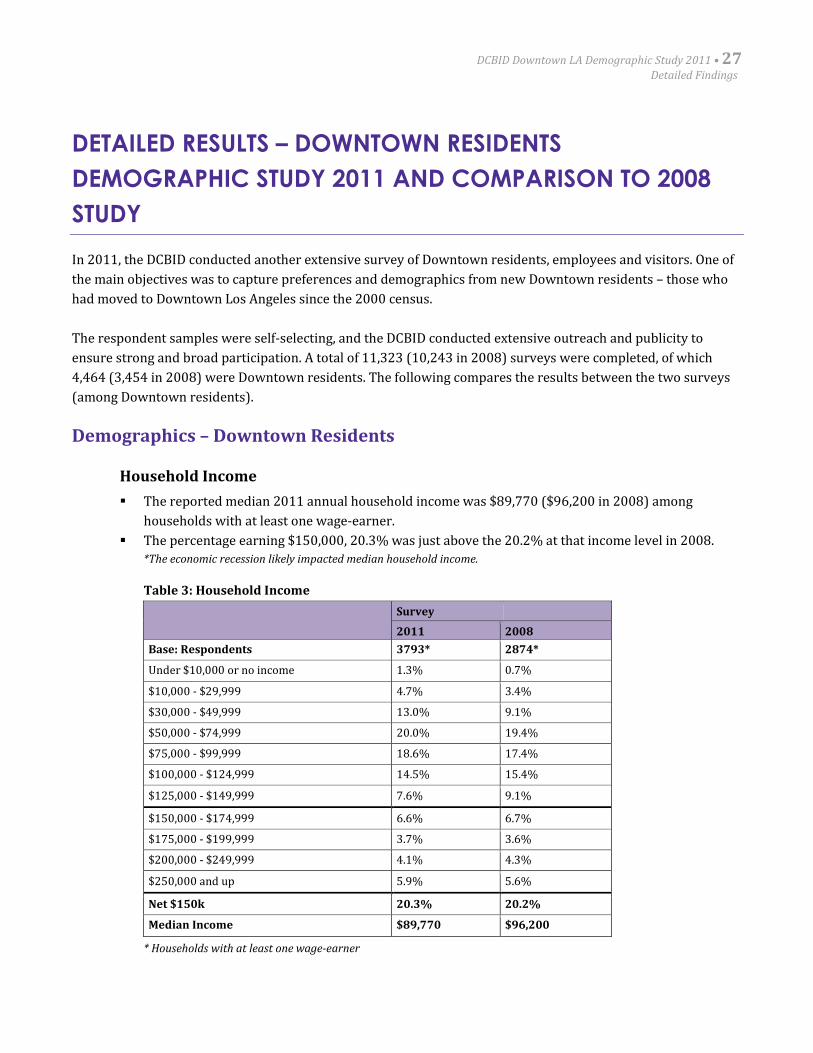
DCBID Downtown LA Demographic Study 2011 • 27Detailed Findings
DETAILED RESULTS – DOWNTOWN RESIDENTS
DEMOGRAPHIC STUDY 2011 AND COMPARISON TO 2008
STUDY
In 2011, the DCBID conducted another extensive survey of Downtown residents, employees and visitors. One of
the main objectives was to capture preferences and demographics from new Downtown residents – those who
had moved to Downtown Los Angeles since the 2000 census.
The respondent samples were self-selecting, and the DCBID conducted extensive outreach and publicity to
ensure strong and broad participation. A total of 11,323 (10,243 in 2008) surveys were completed, of which
4,464 (3,454 in 2008) were Downtown residents. The following compares the results between the two surveys
(among Downtown residents).
Demographics – Downtown Residents
Household Income
The reported median 2011 annual household income was $89,770 ($96,200 in 2008) among
households with at least one wage-earner.
The percentage earning $150,000, 20.3% was just above the 20.2% at that income level in 2008.
*The economic recession likely impacted median household income.
Table 3: Household Income
Survey
2011 2008
Base: Respondents 3793* 2874*
Under $10,000 or no income 1.3% 0.7%
$10,000 - $29,999 4.7% 3.4%
$30,000 - $49,999 13.0% 9.1%
$50,000 - $74,999 20.0% 19.4%
$75,000 - $99,999 18.6% 17.4%
$100,000 - $124,999 14.5% 15.4%
$125,000 - $149,999 7.6% 9.1%
$150,000 - $174,999 6.6% 6.7%
$175,000 - $199,999 3.7% 3.6%
$200,000 - $249,999 4.1% 4.3%
$250,000 and up 5.9% 5.6%
Net $150k 20.3% 20.2%
Median Income $89,770 $96,200
* Households with at least one wage-earner
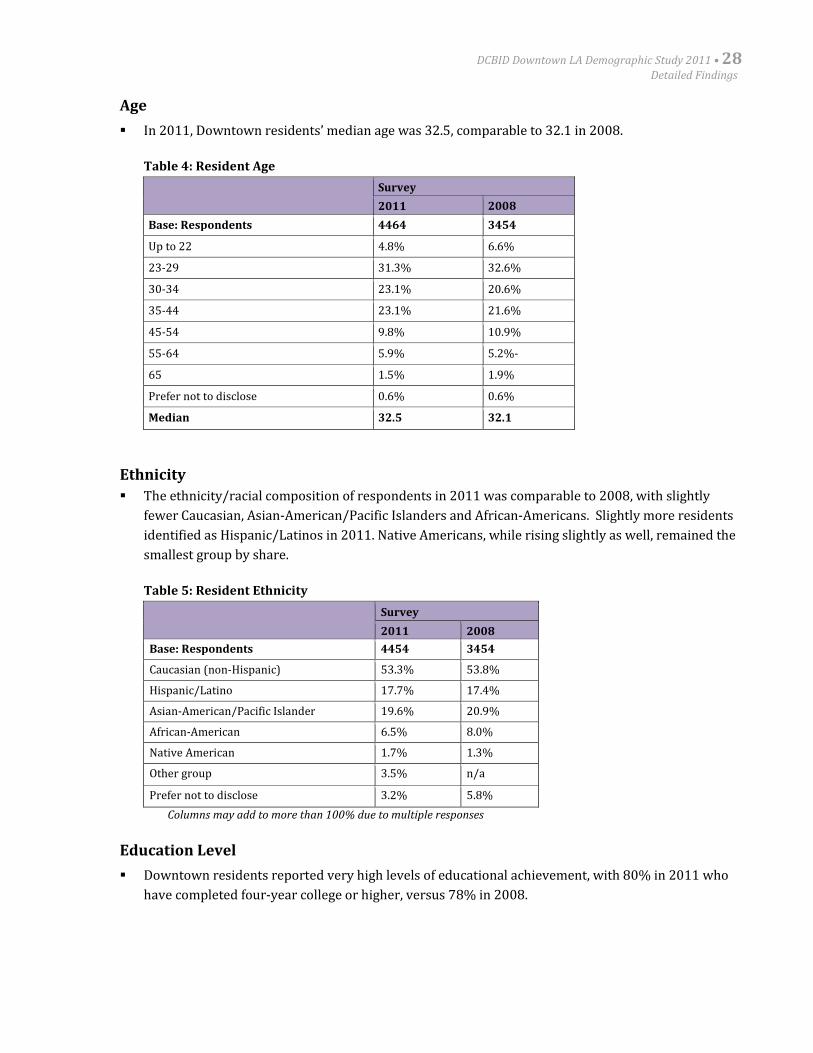
DCBID Downtown LA Demographic Study 2011 • 28Detailed Findings
Age
In 2011, Downtown residents’ median age was 32.5, comparable to 32.1 in 2008.
Table 4: Resident Age
Survey
2011 2008
Base: Respondents 4464 3454
Up to 22 4.8% 6.6%
23-29 31.3% 32.6%
30-34 23.1% 20.6%
35-44 23.1% 21.6%
45-54 9.8% 10.9%
55-64 5.9% 5.2%-
65 1.5% 1.9%
Prefer not to disclose 0.6% 0.6%
Median 32.5 32.1
Ethnicity
The ethnicity/racial composition of respondents in 2011 was comparable to 2008, with slightly
fewer Caucasian, Asian-American/Pacific Islanders and African-Americans. Slightly more residents
identified as Hispanic/Latinos in 2011. Native Americans, while rising slightly as well, remained the
smallest group by share.
Table 5: Resident Ethnicity
Survey
2011 2008
Base: Respondents 4454 3454
Caucasian (non-Hispanic) 53.3% 53.8%
Hispanic/Latino 17.7% 17.4%
Asian-American/Pacific Islander 19.6% 20.9%
African-American 6.5% 8.0%
Native American 1.7% 1.3%
Other group 3.5% n/a
Prefer not to disclose 3.2% 5.8%
Columns may add to more than 100% due to multiple responses
Education Level
Downtown residents reported very high levels of educational achievement, with 80% in 2011 who
have completed four-year college or higher, versus 78% in 2008.
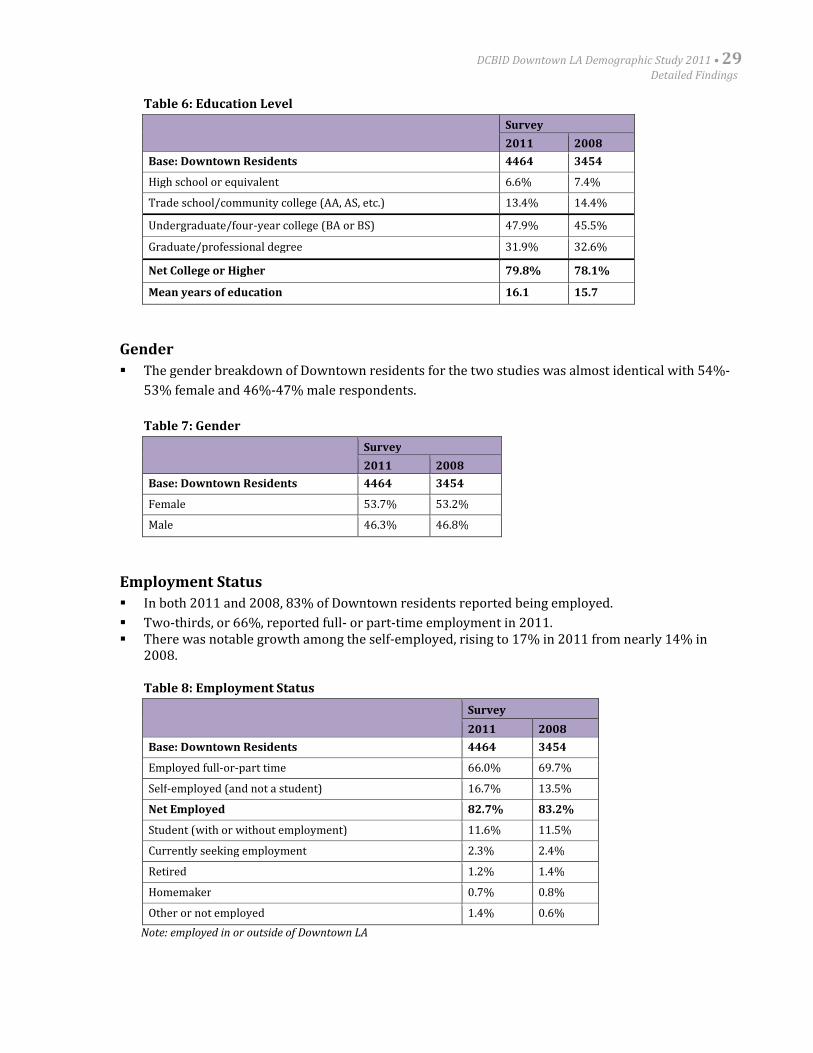
DCBID Downtown LA Demographic Study 2011 • 29Detailed Findings
Table 6: Education Level
Survey
2011 2008
Base: Downtown Residents 4464 3454
High school or equivalent 6.6% 7.4%
Trade school/community college (AA, AS, etc.) 13.4% 14.4%
Undergraduate/four-year college (BA or BS) 47.9% 45.5%
Graduate/professional degree 31.9% 32.6%
Net College or Higher 79.8% 78.1%
Mean years of education 16.1 15.7
Gender
The gender breakdown of Downtown residents for the two studies was almost identical with 54%-
53% female and 46%-47% male respondents.
Table 7: Gender
Survey
2011 2008
Base: Downtown Residents 4464 3454
Female 53.7% 53.2%
Male 46.3% 46.8%
Employment Status
In both 2011 and 2008, 83% of Downtown residents reported being employed.
Two-thirds, or 66%, reported full- or part-time employment in 2011. There was notable growth among the self-employed, rising to 17% in 2011 from nearly 14% in
2008.
Table 8: Employment Status
Survey
2011 2008
Base: Downtown Residents 4464 3454
Employed full-or-part time 66.0% 69.7%
Self-employed (and not a student) 16.7% 13.5%
Net Employed 82.7% 83.2%
Student (with or without employment) 11.6% 11.5%
Currently seeking employment 2.3% 2.4%
Retired 1.2% 1.4%
Homemaker 0.7% 0.8%
Other or not employed 1.4% 0.6%
Note: employed in or outside of Downtown LA
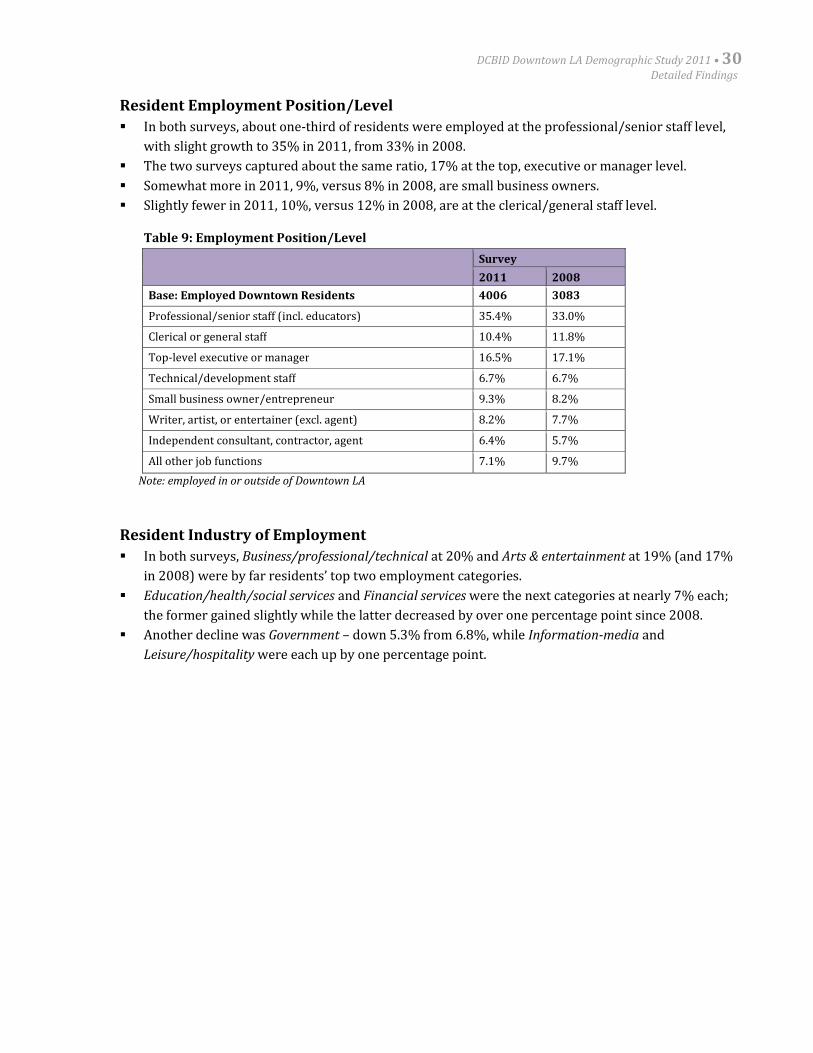
DCBID Downtown LA Demographic Study 2011 • 30Detailed Findings
Resident Employment Position/Level
In both surveys, about one-third of residents were employed at the professional/senior staff level,
with slight growth to 35% in 2011, from 33% in 2008.
The two surveys captured about the same ratio, 17% at the top, executive or manager level.
Somewhat more in 2011, 9%, versus 8% in 2008, are small business owners.
Slightly fewer in 2011, 10%, versus 12% in 2008, are at the clerical/general staff level.
Table 9: Employment Position/Level
Survey
2011 2008
Base: Employed Downtown Residents 4006 3083
Professional/senior staff (incl. educators) 35.4% 33.0%
Clerical or general staff 10.4% 11.8%
Top-level executive or manager 16.5% 17.1%
Technical/development staff 6.7% 6.7%
Small business owner/entrepreneur 9.3% 8.2%
Writer, artist, or entertainer (excl. agent) 8.2% 7.7%
Independent consultant, contractor, agent 6.4% 5.7%
All other job functions 7.1% 9.7%
Note: employed in or outside of Downtown LA
Resident Industry of Employment
In both surveys, Business/professional/technical at 20% and Arts & entertainment at 19% (and 17%
in 2008) were by far residents’ top two employment categories.
Education/health/social services and Financial services were the next categories at nearly 7% each;
the former gained slightly while the latter decreased by over one percentage point since 2008.
Another decline was Government – down 5.3% from 6.8%, while Information-media and
Leisure/hospitality were each up by one percentage point.
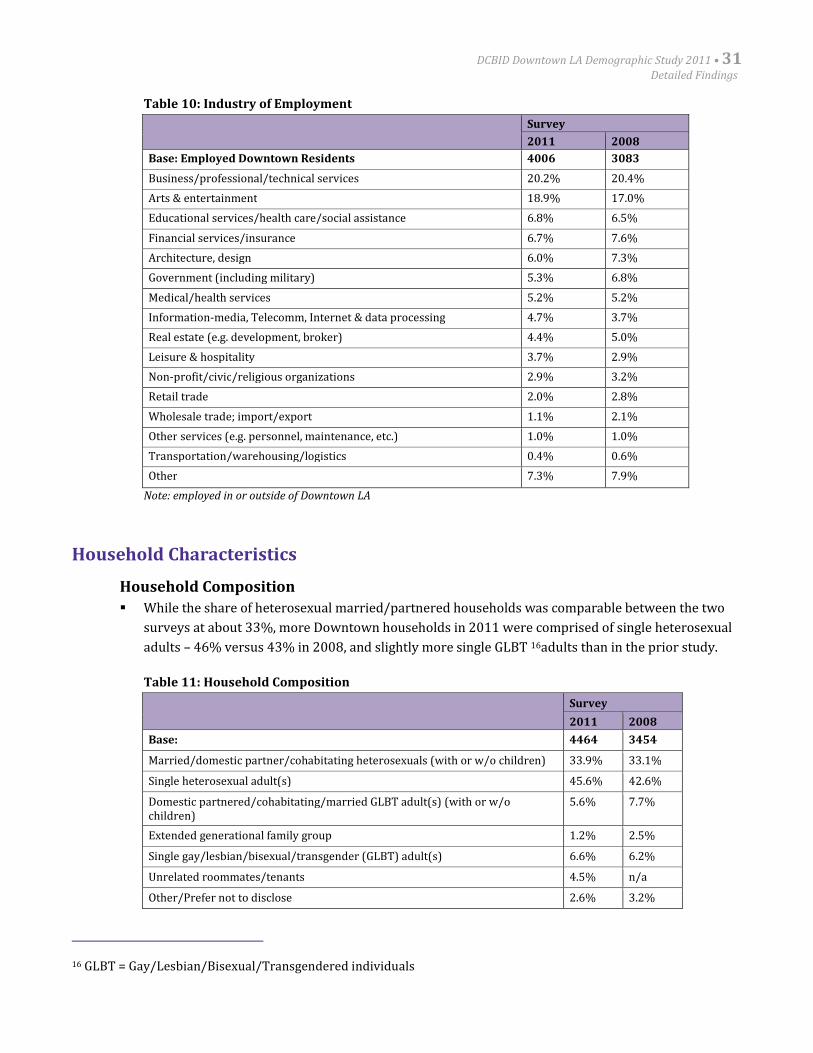
DCBID Downtown LA Demographic Study 2011 • 31Detailed Findings
Table 10: Industry of Employment
Survey
2011 2008
Base: Employed Downtown Residents 4006 3083
Business/professional/technical services 20.2% 20.4%
Arts & entertainment 18.9% 17.0%
Educational services/health care/social assistance 6.8% 6.5%
Financial services/insurance 6.7% 7.6%
Architecture, design 6.0% 7.3%
Government (including military) 5.3% 6.8%
Medical/health services 5.2% 5.2%
Information-media, Telecomm, Internet & data processing 4.7% 3.7%
Real estate (e.g. development, broker) 4.4% 5.0%
Leisure & hospitality 3.7% 2.9%
Non-profit/civic/religious organizations 2.9% 3.2%
Retail trade 2.0% 2.8%
Wholesale trade; import/export 1.1% 2.1%
Other services (e.g. personnel, maintenance, etc.) 1.0% 1.0%
Transportation/warehousing/logistics 0.4% 0.6%
Other 7.3% 7.9%
Note: employed in or outside of Downtown LA
Household Characteristics
Household Composition
While the share of heterosexual married/partnered households was comparable between the two
surveys at about 33%, more Downtown households in 2011 were comprised of single heterosexual
adults – 46% versus 43% in 2008, and slightly more single GLBT 16adults than in the prior study.
Table 11: Household Composition
Survey
2011 2008
Base: 4464 3454
Married/domestic partner/cohabitating heterosexuals (with or w/o children) 33.9% 33.1%
Single heterosexual adult(s) 45.6% 42.6%
Domestic partnered/cohabitating/married GLBT adult(s) (with or w/ochildren)
5.6% 7.7%
Extended generational family group 1.2% 2.5%
Single gay/lesbian/bisexual/transgender (GLBT) adult(s) 6.6% 6.2%
Unrelated roommates/tenants 4.5% n/a
Other/Prefer not to disclose 2.6% 3.2%
16 GLBT = Gay/Lesbian/Bisexual/Transgendered individuals
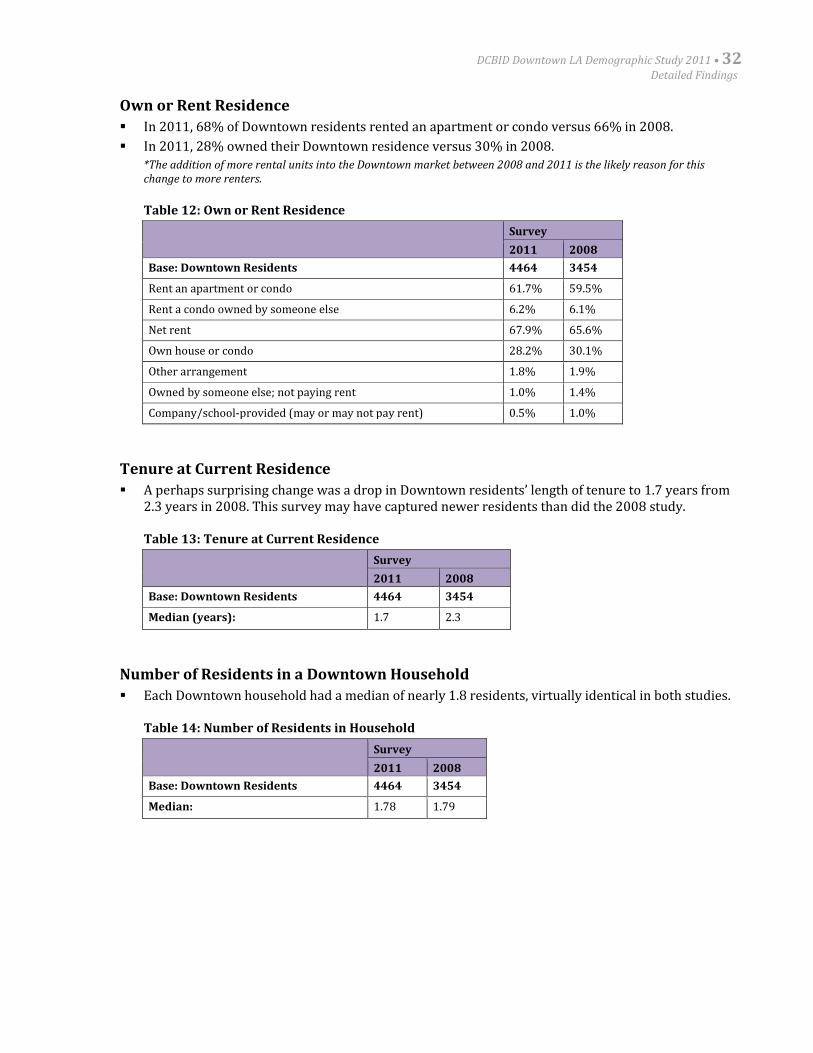
DCBID Downtown LA Demographic Study 2011 • 32Detailed Findings
Own or Rent Residence
In 2011, 68% of Downtown residents rented an apartment or condo versus 66% in 2008.
In 2011, 28% owned their Downtown residence versus 30% in 2008.
*The addition of more rental units into the Downtown market between 2008 and 2011 is the likely reason for thischange to more renters.
Table 12: Own or Rent Residence
Survey
2011 2008
Base: Downtown Residents 4464 3454
Rent an apartment or condo 61.7% 59.5%
Rent a condo owned by someone else 6.2% 6.1%
Net rent 67.9% 65.6%
Own house or condo 28.2% 30.1%
Other arrangement 1.8% 1.9%
Owned by someone else; not paying rent 1.0% 1.4%
Company/school-provided (may or may not pay rent) 0.5% 1.0%
Tenure at Current Residence
A perhaps surprising change was a drop in Downtown residents’ length of tenure to 1.7 years from2.3 years in 2008. This survey may have captured newer residents than did the 2008 study.
Table 13: Tenure at Current Residence
Survey
2011 2008
Base: Downtown Residents 4464 3454
Median (years): 1.7 2.3
Number of Residents in a Downtown Household
Each Downtown household had a median of nearly 1.8 residents, virtually identical in both studies.
Table 14: Number of Residents in Household
Survey
2011 2008
Base: Downtown Residents 4464 3454
Median: 1.78 1.79
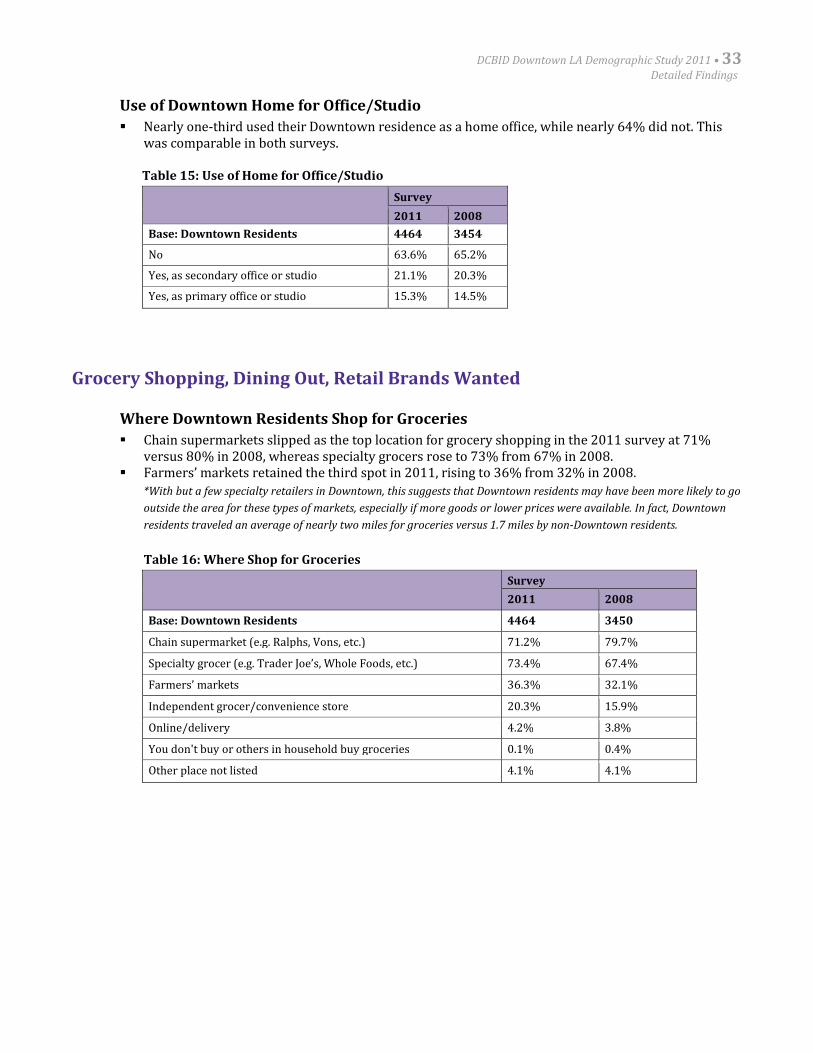
DCBID Downtown LA Demographic Study 2011 • 33Detailed Findings
Use of Downtown Home for Office/Studio
Nearly one-third used their Downtown residence as a home office, while nearly 64% did not. Thiswas comparable in both surveys.
Table 15: Use of Home for Office/Studio
Survey
2011 2008
Base: Downtown Residents 4464 3454
No 63.6% 65.2%
Yes, as secondary office or studio 21.1% 20.3%
Yes, as primary office or studio 15.3% 14.5%
Grocery Shopping, Dining Out, Retail Brands Wanted
Where Downtown Residents Shop for Groceries
Chain supermarkets slipped as the top location for grocery shopping in the 2011 survey at 71%versus 80% in 2008, whereas specialty grocers rose to 73% from 67% in 2008.
Farmers’ markets retained the third spot in 2011, rising to 36% from 32% in 2008.
*With but a few specialty retailers in Downtown, this suggests that Downtown residents may have been more likely to go
outside the area for these types of markets, especially if more goods or lower prices were available. In fact, Downtown
residents traveled an average of nearly two miles for groceries versus 1.7 miles by non-Downtown residents.
Table 16: Where Shop for Groceries
Survey
2011 2008
Base: Downtown Residents 4464 3450
Chain supermarket (e.g. Ralphs, Vons, etc.) 71.2% 79.7%
Specialty grocer (e.g. Trader Joe’s, Whole Foods, etc.) 73.4% 67.4%
Farmers’ markets 36.3% 32.1%
Independent grocer/convenience store 20.3% 15.9%
Online/delivery 4.2% 3.8%
You don't buy or others in household buy groceries 0.1% 0.4%
Other place not listed 4.1% 4.1%
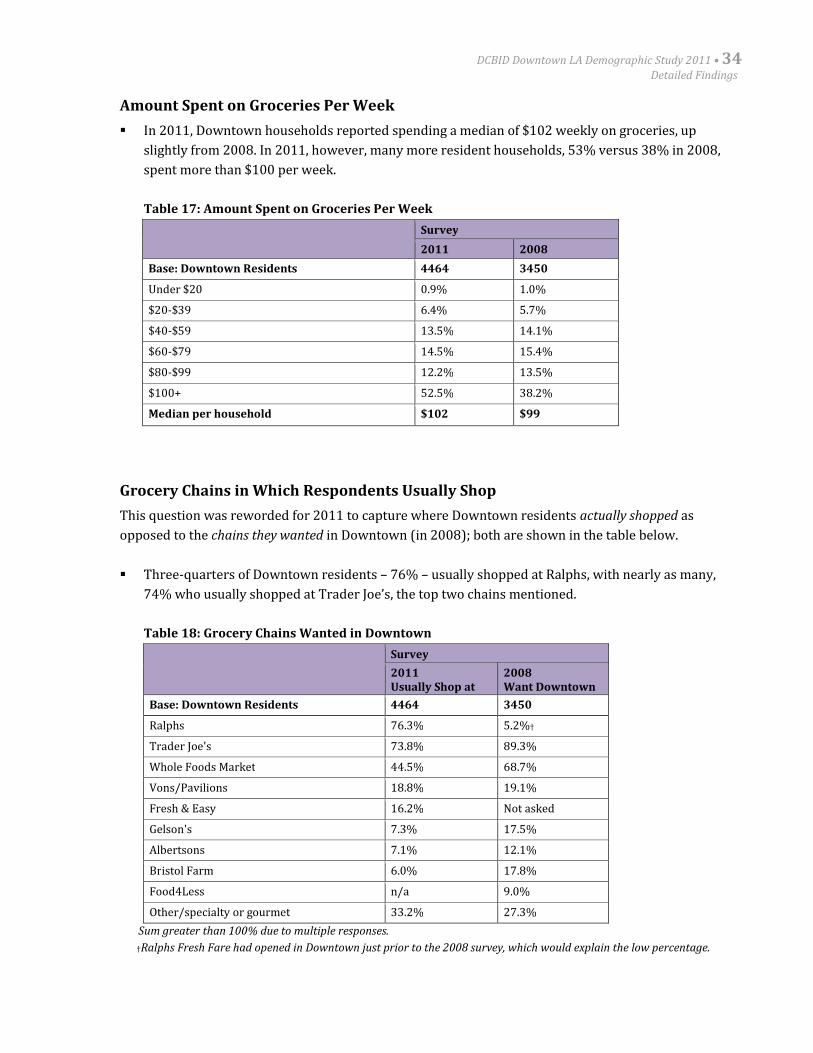
DCBID Downtown LA Demographic Study 2011 • 34Detailed Findings
Amount Spent on Groceries Per Week
In 2011, Downtown households reported spending a median of $102 weekly on groceries, up
slightly from 2008. In 2011, however, many more resident households, 53% versus 38% in 2008,
spent more than $100 per week.
Table 17: Amount Spent on Groceries Per Week
Survey
2011 2008
Base: Downtown Residents 4464 3450
Under $20 0.9% 1.0%
$20-$39 6.4% 5.7%
$40-$59 13.5% 14.1%
$60-$79 14.5% 15.4%
$80-$99 12.2% 13.5%
$100+ 52.5% 38.2%
Median per household $102 $99
Grocery Chains in Which Respondents Usually Shop
This question was reworded for 2011 to capture where Downtown residents actually shopped as
opposed to the chains they wanted in Downtown (in 2008); both are shown in the table below.
Three-quarters of Downtown residents – 76% – usually shopped at Ralphs, with nearly as many,
74% who usually shopped at Trader Joe’s, the top two chains mentioned.
Table 18: Grocery Chains Wanted in Downtown
Survey
2011Usually Shop at
2008Want Downtown
Base: Downtown Residents 4464 3450
Ralphs 76.3% 5.2%†
Trader Joe's 73.8% 89.3%
Whole Foods Market 44.5% 68.7%
Vons/Pavilions 18.8% 19.1%
Fresh & Easy 16.2% Not asked
Gelson's 7.3% 17.5%
Albertsons 7.1% 12.1%
Bristol Farm 6.0% 17.8%
Food4Less n/a 9.0%
Other/specialty or gourmet 33.2% 27.3%
Sum greater than 100% due to multiple responses.
†Ralphs Fresh Fare had opened in Downtown just prior to the 2008 survey, which would explain the low percentage.
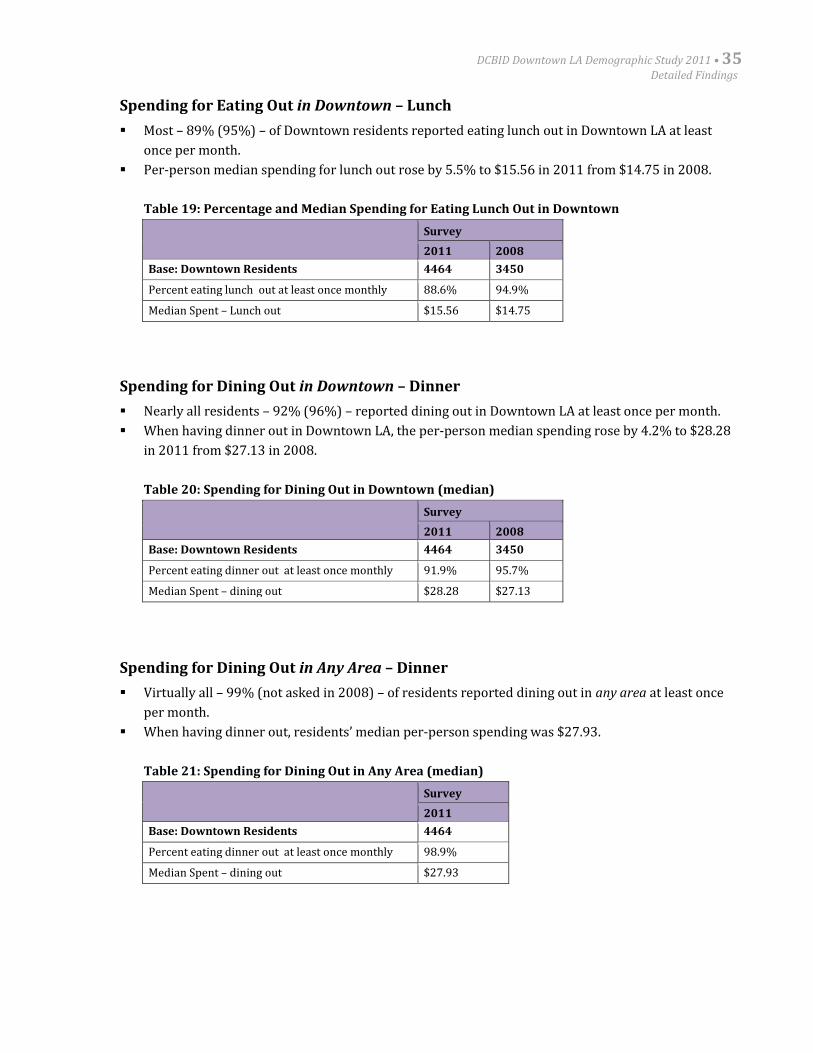
DCBID Downtown LA Demographic Study 2011 • 35Detailed Findings
Spending for Eating Out in Downtown – Lunch
Most – 89% (95%) – of Downtown residents reported eating lunch out in Downtown LA at least
once per month.
Per-person median spending for lunch out rose by 5.5% to $15.56 in 2011 from $14.75 in 2008.
Table 19: Percentage and Median Spending for Eating Lunch Out in Downtown
Survey
2011 2008
Base: Downtown Residents 4464 3450
Percent eating lunch out at least once monthly 88.6% 94.9%
Median Spent – Lunch out $15.56 $14.75
Spending for Dining Out in Downtown – Dinner
Nearly all residents – 92% (96%) – reported dining out in Downtown LA at least once per month.
When having dinner out in Downtown LA, the per-person median spending rose by 4.2% to $28.28
in 2011 from $27.13 in 2008.
Table 20: Spending for Dining Out in Downtown (median)
Survey
2011 2008
Base: Downtown Residents 4464 3450
Percent eating dinner out at least once monthly 91.9% 95.7%
Median Spent – dining out $28.28 $27.13
Spending for Dining Out in Any Area – Dinner
Virtually all – 99% (not asked in 2008) – of residents reported dining out in any area at least once
per month.
When having dinner out, residents’ median per-person spending was $27.93.
Table 21: Spending for Dining Out in Any Area (median)
Survey
2011
Base: Downtown Residents 4464
Percent eating dinner out at least once monthly 98.9%
Median Spent – dining out $27.93
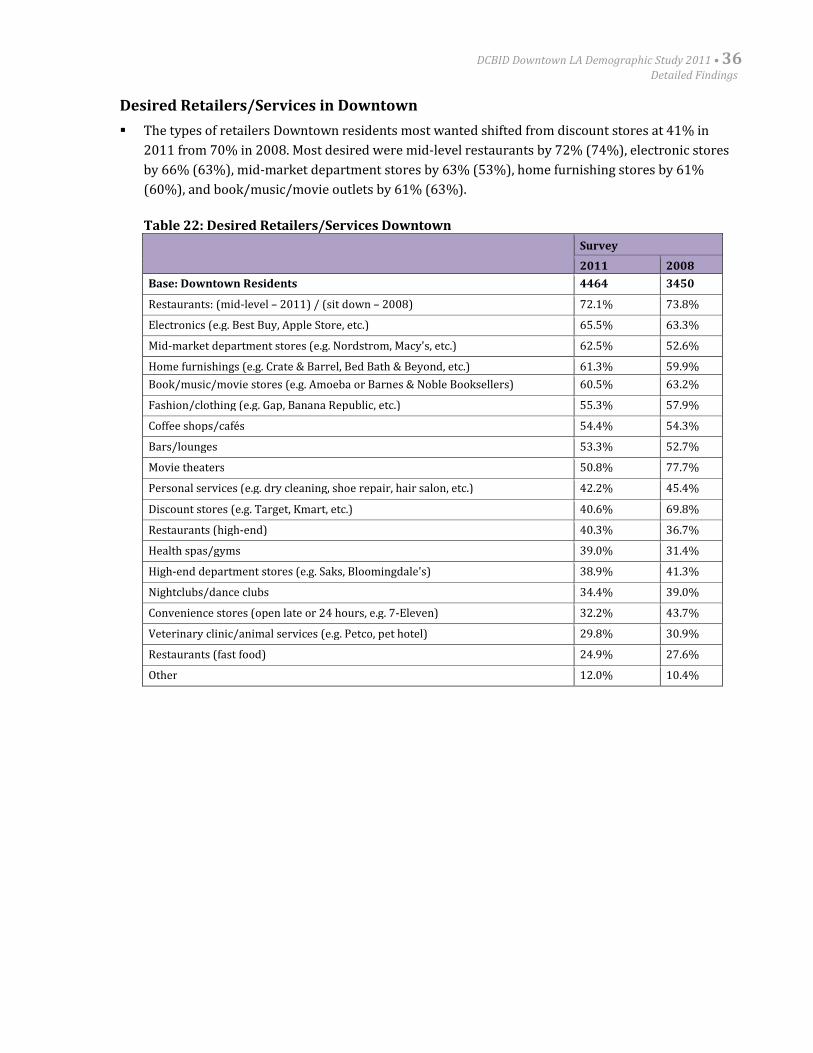
DCBID Downtown LA Demographic Study 2011 • 36Detailed Findings
Desired Retailers/Services in Downtown
The types of retailers Downtown residents most wanted shifted from discount stores at 41% in
2011 from 70% in 2008. Most desired were mid-level restaurants by 72% (74%), electronic stores
by 66% (63%), mid-market department stores by 63% (53%), home furnishing stores by 61%
(60%), and book/music/movie outlets by 61% (63%).
Table 22: Desired Retailers/Services Downtown
Survey
2011 2008
Base: Downtown Residents 4464 3450
Restaurants: (mid-level – 2011) / (sit down – 2008) 72.1% 73.8%
Electronics (e.g. Best Buy, Apple Store, etc.) 65.5% 63.3%
Mid-market department stores (e.g. Nordstrom, Macy's, etc.) 62.5% 52.6%
Home furnishings (e.g. Crate & Barrel, Bed Bath & Beyond, etc.) 61.3% 59.9%
Book/music/movie stores (e.g. Amoeba or Barnes & Noble Booksellers) 60.5% 63.2%
Fashion/clothing (e.g. Gap, Banana Republic, etc.) 55.3% 57.9%
Coffee shops/cafés 54.4% 54.3%
Bars/lounges 53.3% 52.7%
Movie theaters 50.8% 77.7%
Personal services (e.g. dry cleaning, shoe repair, hair salon, etc.) 42.2% 45.4%
Discount stores (e.g. Target, Kmart, etc.) 40.6% 69.8%
Restaurants (high-end) 40.3% 36.7%
Health spas/gyms 39.0% 31.4%
High-end department stores (e.g. Saks, Bloomingdale's) 38.9% 41.3%
Nightclubs/dance clubs 34.4% 39.0%
Convenience stores (open late or 24 hours, e.g. 7-Eleven) 32.2% 43.7%
Veterinary clinic/animal services (e.g. Petco, pet hotel) 29.8% 30.9%
Restaurants (fast food) 24.9% 27.6%
Other 12.0% 10.4%
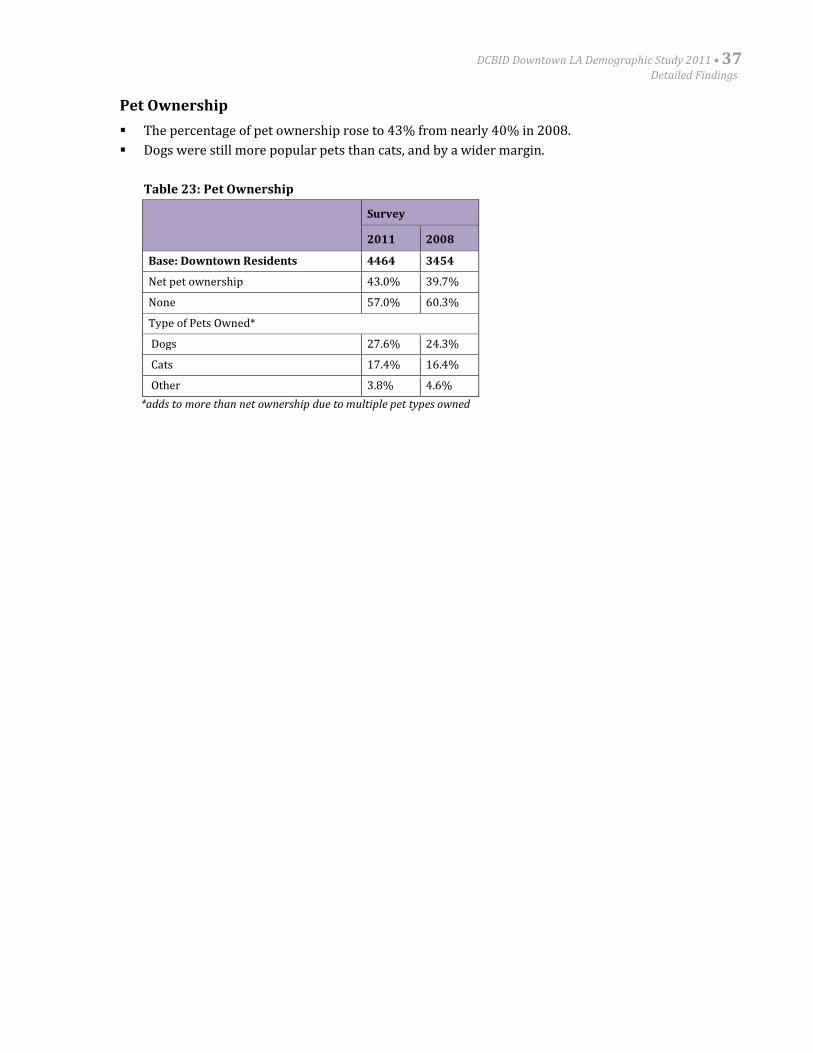
DCBID Downtown LA Demographic Study 2011 • 37Detailed Findings
Pet Ownership
The percentage of pet ownership rose to 43% from nearly 40% in 2008.
Dogs were still more popular pets than cats, and by a wider margin.
Table 23: Pet Ownership
Survey
2011 2008
Base: Downtown Residents 4464 3454
Net pet ownership 43.0% 39.7%
None 57.0% 60.3%
Type of Pets Owned*
Dogs 27.6% 24.3%
Cats 17.4% 16.4%
Other 3.8% 4.6%
*adds to more than net ownership due to multiple pet types owned
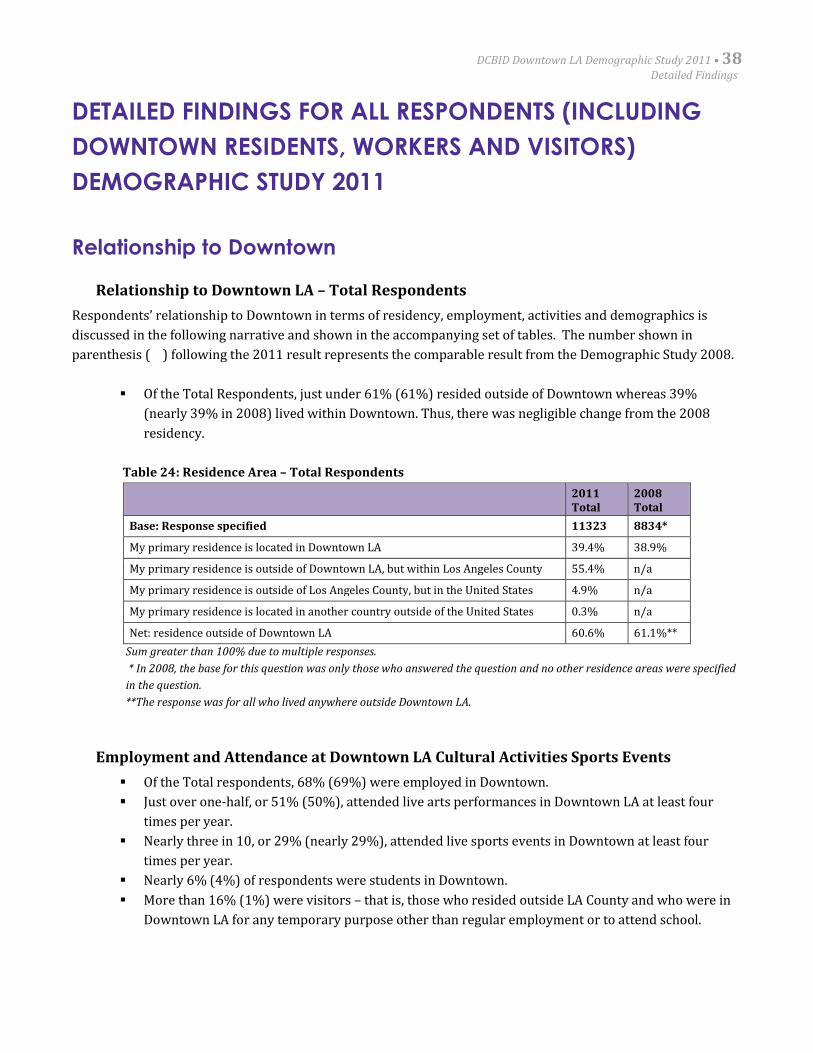
DCBID Downtown LA Demographic Study 2011 • 38Detailed Findings
DETAILED FINDINGS FOR ALL RESPONDENTS (INCLUDING
DOWNTOWN RESIDENTS, WORKERS AND VISITORS)
DEMOGRAPHIC STUDY 2011
Relationship to Downtown
Relationship to Downtown LA – Total Respondents
Respondents’ relationship to Downtown in terms of residency, employment, activities and demographics is
discussed in the following narrative and shown in the accompanying set of tables. The number shown in
parenthesis ( ) following the 2011 result represents the comparable result from the Demographic Study 2008.
Of the Total Respondents, just under 61% (61%) resided outside of Downtown whereas 39%
(nearly 39% in 2008) lived within Downtown. Thus, there was negligible change from the 2008
residency.
Table 24: Residence Area – Total Respondents
2011Total
2008Total
Base: Response specified 11323 8834*
My primary residence is located in Downtown LA 39.4% 38.9%
My primary residence is outside of Downtown LA, but within Los Angeles County 55.4% n/a
My primary residence is outside of Los Angeles County, but in the United States 4.9% n/a
My primary residence is located in another country outside of the United States 0.3% n/a
Net: residence outside of Downtown LA 60.6% 61.1%**
Sum greater than 100% due to multiple responses.
* In 2008, the base for this question was only those who answered the question and no other residence areas were specified
in the question.
**The response was for all who lived anywhere outside Downtown LA.
Employment and Attendance at Downtown LA Cultural Activities Sports Events
Of the Total respondents, 68% (69%) were employed in Downtown.
Just over one-half, or 51% (50%), attended live arts performances in Downtown LA at least four
times per year.
Nearly three in 10, or 29% (nearly 29%), attended live sports events in Downtown at least four
times per year.
Nearly 6% (4%) of respondents were students in Downtown.
More than 16% (1%) were visitors – that is, those who resided outside LA County and who were in
Downtown LA for any temporary purpose other than regular employment or to attend school.
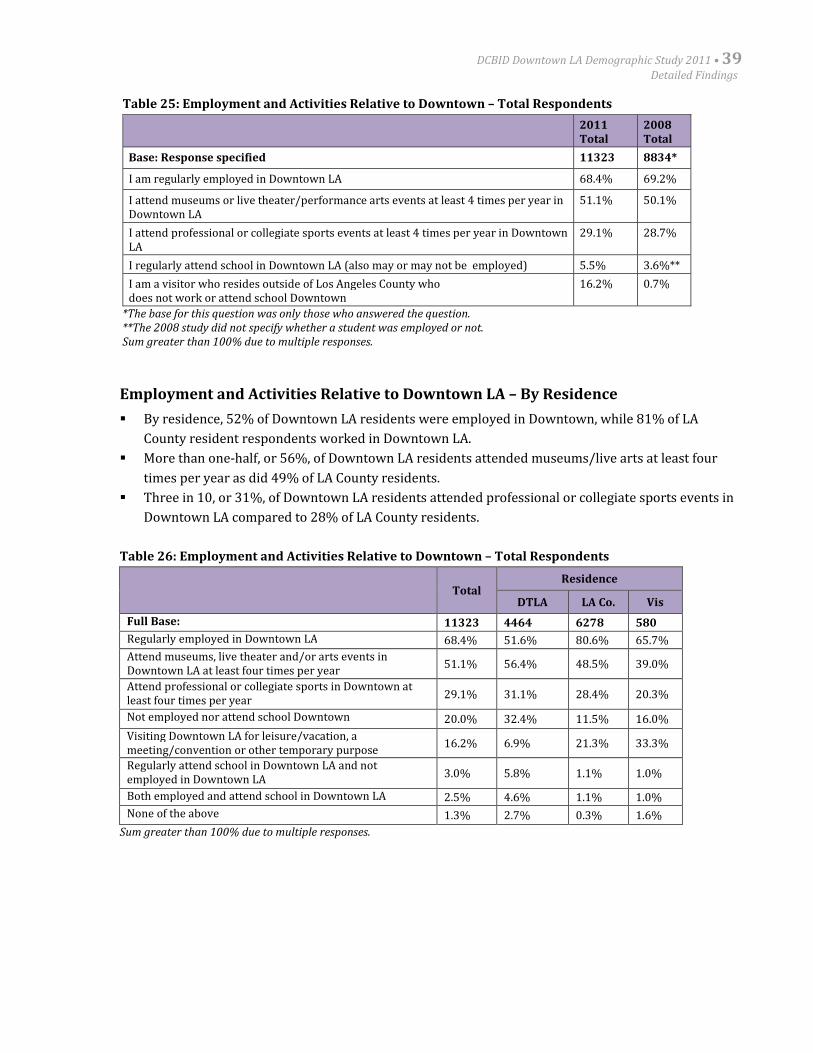
DCBID Downtown LA Demographic Study 2011 • 39Detailed Findings
Table 25: Employment and Activities Relative to Downtown – Total Respondents
2011Total
2008Total
Base: Response specified 11323 8834*
I am regularly employed in Downtown LA 68.4% 69.2%
I attend museums or live theater/performance arts events at least 4 times per year inDowntown LA
51.1% 50.1%
I attend professional or collegiate sports events at least 4 times per year in DowntownLA
29.1% 28.7%
I regularly attend school in Downtown LA (also may or may not be employed) 5.5% 3.6%**
I am a visitor who resides outside of Los Angeles County whodoes not work or attend school Downtown
16.2% 0.7%
*The base for this question was only those who answered the question.**The 2008 study did not specify whether a student was employed or not.Sum greater than 100% due to multiple responses.
Employment and Activities Relative to Downtown LA – By Residence
By residence, 52% of Downtown LA residents were employed in Downtown, while 81% of LA
County resident respondents worked in Downtown LA.
More than one-half, or 56%, of Downtown LA residents attended museums/live arts at least four
times per year as did 49% of LA County residents.
Three in 10, or 31%, of Downtown LA residents attended professional or collegiate sports events in
Downtown LA compared to 28% of LA County residents.
Table 26: Employment and Activities Relative to Downtown – Total Respondents
TotalResidence
DTLA LA Co. Vis
Full Base: 11323 4464 6278 580
Regularly employed in Downtown LA 68.4% 51.6% 80.6% 65.7%
Attend museums, live theater and/or arts events inDowntown LA at least four times per year
51.1% 56.4% 48.5% 39.0%
Attend professional or collegiate sports in Downtown atleast four times per year
29.1% 31.1% 28.4% 20.3%
Not employed nor attend school Downtown 20.0% 32.4% 11.5% 16.0%
Visiting Downtown LA for leisure/vacation, ameeting/convention or other temporary purpose
16.2% 6.9% 21.3% 33.3%
Regularly attend school in Downtown LA and notemployed in Downtown LA
3.0% 5.8% 1.1% 1.0%
Both employed and attend school in Downtown LA 2.5% 4.6% 1.1% 1.0%
None of the above 1.3% 2.7% 0.3% 1.6%
Sum greater than 100% due to multiple responses.
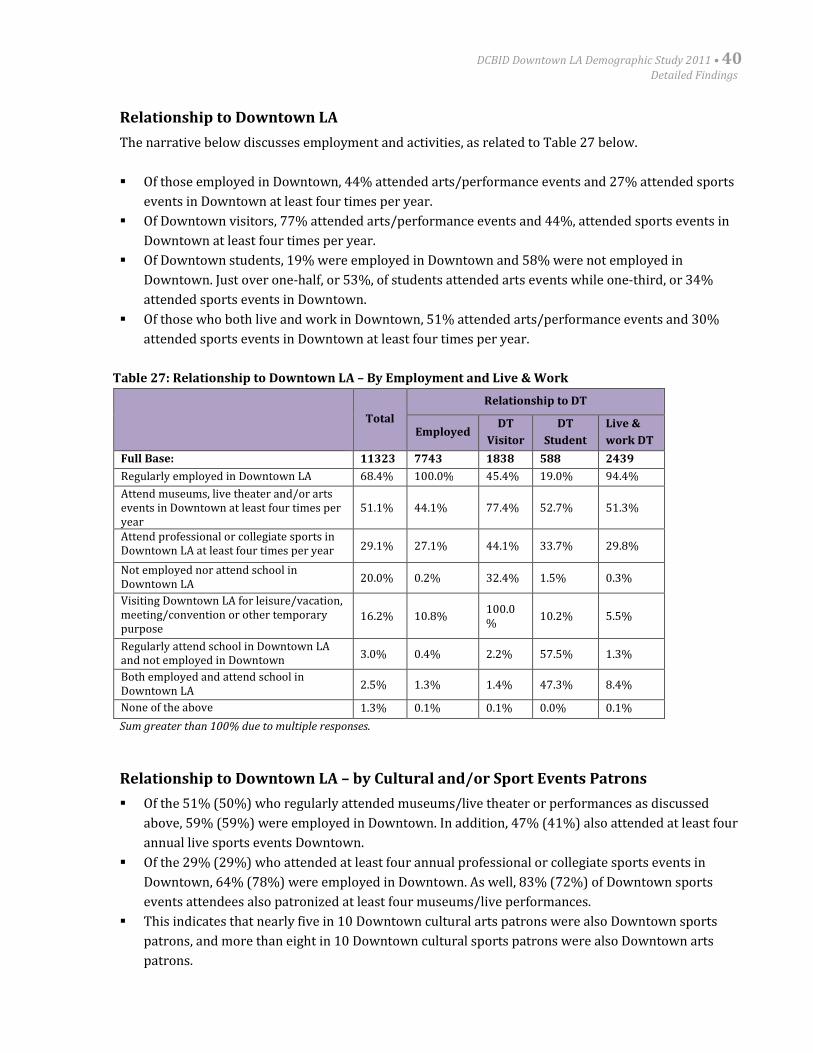
DCBID Downtown LA Demographic Study 2011 • 40Detailed Findings
Relationship to Downtown LA
The narrative below discusses employment and activities, as related to Table 27 below.
Of those employed in Downtown, 44% attended arts/performance events and 27% attended sports
events in Downtown at least four times per year.
Of Downtown visitors, 77% attended arts/performance events and 44%, attended sports events in
Downtown at least four times per year.
Of Downtown students, 19% were employed in Downtown and 58% were not employed in
Downtown. Just over one-half, or 53%, of students attended arts events while one-third, or 34%
attended sports events in Downtown.
Of those who both live and work in Downtown, 51% attended arts/performance events and 30%
attended sports events in Downtown at least four times per year.
Table 27: Relationship to Downtown LA – By Employment and Live & Work
Total
Relationship to DT
EmployedDT
Visitor
DT
Student
Live &
work DT
Full Base: 11323 7743 1838 588 2439
Regularly employed in Downtown LA 68.4% 100.0% 45.4% 19.0% 94.4%
Attend museums, live theater and/or artsevents in Downtown at least four times peryear
51.1% 44.1% 77.4% 52.7% 51.3%
Attend professional or collegiate sports inDowntown LA at least four times per year 29.1% 27.1% 44.1% 33.7% 29.8%
Not employed nor attend school inDowntown LA
20.0% 0.2% 32.4% 1.5% 0.3%
Visiting Downtown LA for leisure/vacation,meeting/convention or other temporarypurpose
16.2% 10.8%100.0%
10.2% 5.5%
Regularly attend school in Downtown LAand not employed in Downtown
3.0% 0.4% 2.2% 57.5% 1.3%
Both employed and attend school inDowntown LA
2.5% 1.3% 1.4% 47.3% 8.4%
None of the above 1.3% 0.1% 0.1% 0.0% 0.1%
Sum greater than 100% due to multiple responses.
Relationship to Downtown LA – by Cultural and/or Sport Events Patrons
Of the 51% (50%) who regularly attended museums/live theater or performances as discussed
above, 59% (59%) were employed in Downtown. In addition, 47% (41%) also attended at least four
annual live sports events Downtown.
Of the 29% (29%) who attended at least four annual professional or collegiate sports events in
Downtown, 64% (78%) were employed in Downtown. As well, 83% (72%) of Downtown sports
events attendees also patronized at least four museums/live performances.
This indicates that nearly five in 10 Downtown cultural arts patrons were also Downtown sports
patrons, and more than eight in 10 Downtown cultural sports patrons were also Downtown arts
patrons.
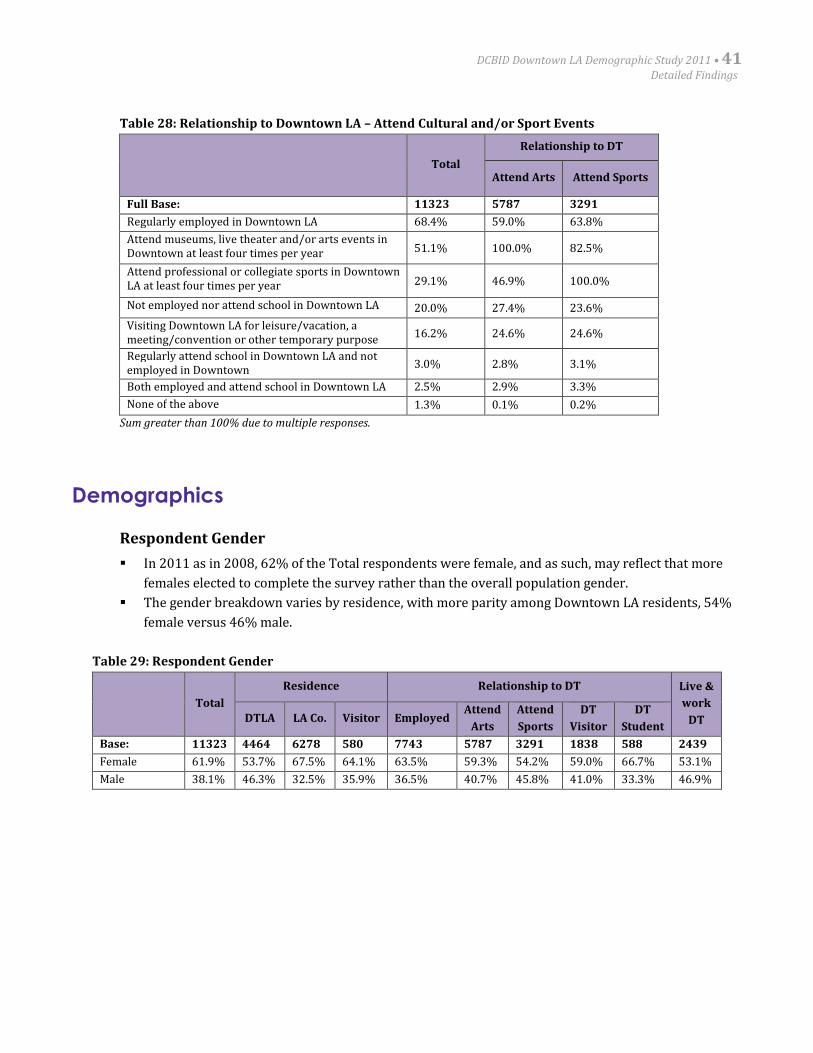
DCBID Downtown LA Demographic Study 2011 • 41Detailed Findings
Table 28: Relationship to Downtown LA – Attend Cultural and/or Sport Events
Total
Relationship to DT
Attend Arts Attend Sports
Full Base: 11323 5787 3291
Regularly employed in Downtown LA 68.4% 59.0% 63.8%
Attend museums, live theater and/or arts events inDowntown at least four times per year 51.1% 100.0% 82.5%
Attend professional or collegiate sports in DowntownLA at least four times per year 29.1% 46.9% 100.0%
Not employed nor attend school in Downtown LA 20.0% 27.4% 23.6%
Visiting Downtown LA for leisure/vacation, ameeting/convention or other temporary purpose
16.2% 24.6% 24.6%
Regularly attend school in Downtown LA and notemployed in Downtown
3.0% 2.8% 3.1%
Both employed and attend school in Downtown LA 2.5% 2.9% 3.3%
None of the above 1.3% 0.1% 0.2%
Sum greater than 100% due to multiple responses.
Demographics
Respondent Gender
In 2011 as in 2008, 62% of the Total respondents were female, and as such, may reflect that more
females elected to complete the survey rather than the overall population gender.
The gender breakdown varies by residence, with more parity among Downtown LA residents, 54%
female versus 46% male.
Table 29: Respondent Gender
Total
Residence Relationship to DT Live &
work
DTDTLA LA Co. Visitor EmployedAttend
Arts
Attend
Sports
DT
Visitor
DT
Student
Base: 11323 4464 6278 580 7743 5787 3291 1838 588 2439
Female 61.9% 53.7% 67.5% 64.1% 63.5% 59.3% 54.2% 59.0% 66.7% 53.1%
Male 38.1% 46.3% 32.5% 35.9% 36.5% 40.7% 45.8% 41.0% 33.3% 46.9%
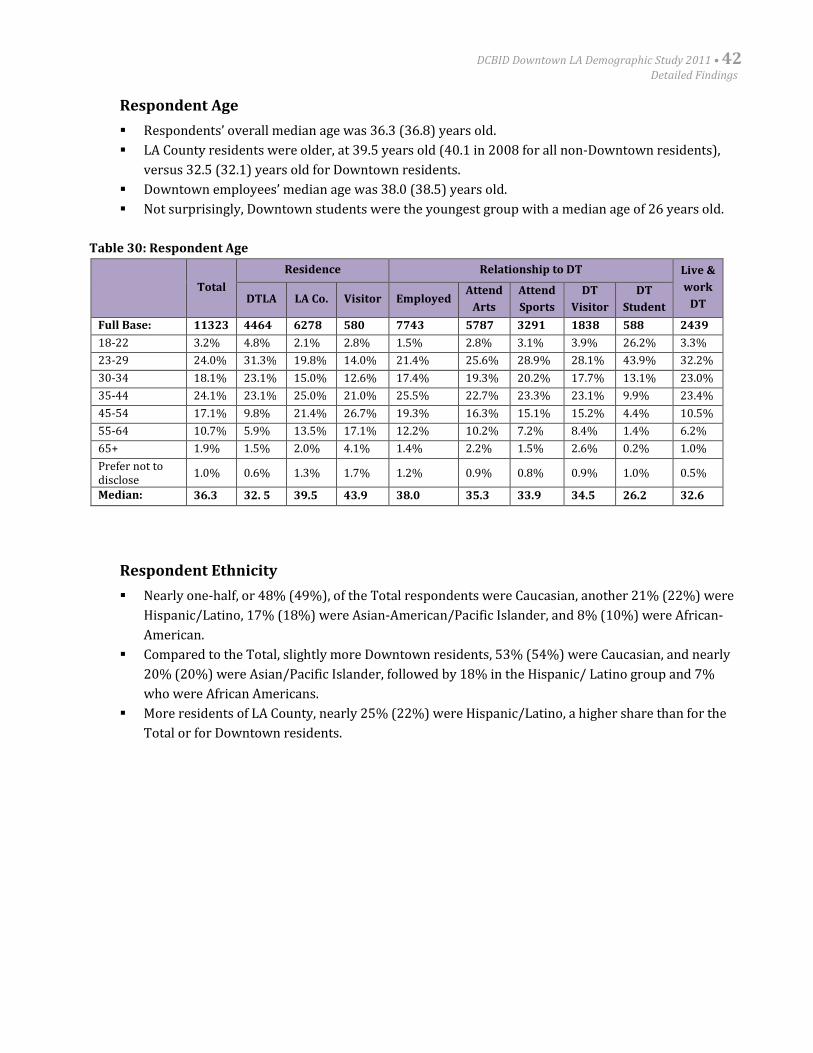
DCBID Downtown LA Demographic Study 2011 • 42Detailed Findings
Respondent Age
Respondents’ overall median age was 36.3 (36.8) years old.
LA County residents were older, at 39.5 years old (40.1 in 2008 for all non-Downtown residents),
versus 32.5 (32.1) years old for Downtown residents.
Downtown employees’ median age was 38.0 (38.5) years old.
Not surprisingly, Downtown students were the youngest group with a median age of 26 years old.
Table 30: Respondent Age
Total
Residence Relationship to DT Live &
work
DTDTLA LA Co. Visitor EmployedAttend
Arts
Attend
Sports
DT
Visitor
DT
Student
Full Base: 11323 4464 6278 580 7743 5787 3291 1838 588 2439
18-22 3.2% 4.8% 2.1% 2.8% 1.5% 2.8% 3.1% 3.9% 26.2% 3.3%
23-29 24.0% 31.3% 19.8% 14.0% 21.4% 25.6% 28.9% 28.1% 43.9% 32.2%
30-34 18.1% 23.1% 15.0% 12.6% 17.4% 19.3% 20.2% 17.7% 13.1% 23.0%
35-44 24.1% 23.1% 25.0% 21.0% 25.5% 22.7% 23.3% 23.1% 9.9% 23.4%
45-54 17.1% 9.8% 21.4% 26.7% 19.3% 16.3% 15.1% 15.2% 4.4% 10.5%
55-64 10.7% 5.9% 13.5% 17.1% 12.2% 10.2% 7.2% 8.4% 1.4% 6.2%
65+ 1.9% 1.5% 2.0% 4.1% 1.4% 2.2% 1.5% 2.6% 0.2% 1.0%
Prefer not todisclose
1.0% 0.6% 1.3% 1.7% 1.2% 0.9% 0.8% 0.9% 1.0% 0.5%
Median: 36.3 32. 5 39.5 43.9 38.0 35.3 33.9 34.5 26.2 32.6
Respondent Ethnicity
Nearly one-half, or 48% (49%), of the Total respondents were Caucasian, another 21% (22%) were
Hispanic/Latino, 17% (18%) were Asian-American/Pacific Islander, and 8% (10%) were African-
American.
Compared to the Total, slightly more Downtown residents, 53% (54%) were Caucasian, and nearly
20% (20%) were Asian/Pacific Islander, followed by 18% in the Hispanic/ Latino group and 7%
who were African Americans.
More residents of LA County, nearly 25% (22%) were Hispanic/Latino, a higher share than for the
Total or for Downtown residents.
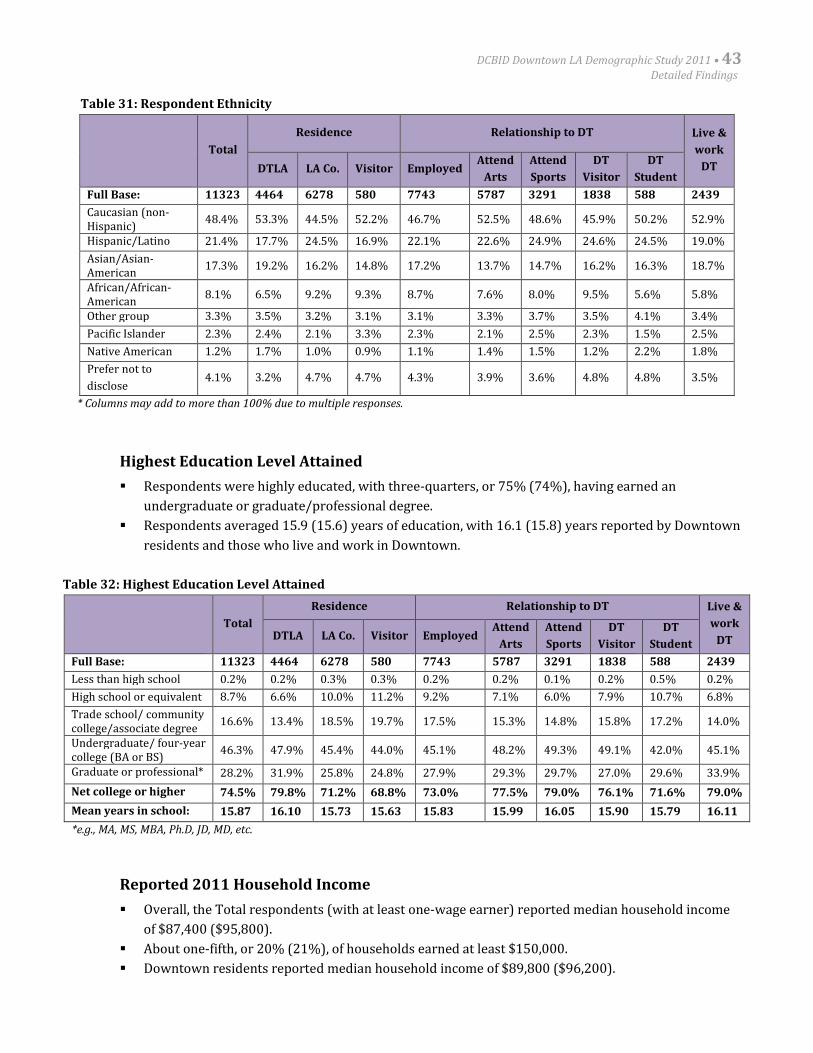
DCBID Downtown LA Demographic Study 2011 • 43Detailed Findings
Table 31: Respondent Ethnicity
Total
Residence Relationship to DT Live &
work
DTDTLA LA Co. Visitor EmployedAttend
Arts
Attend
Sports
DT
Visitor
DT
Student
Full Base: 11323 4464 6278 580 7743 5787 3291 1838 588 2439
Caucasian (non-Hispanic)
48.4% 53.3% 44.5% 52.2% 46.7% 52.5% 48.6% 45.9% 50.2% 52.9%
Hispanic/Latino 21.4% 17.7% 24.5% 16.9% 22.1% 22.6% 24.9% 24.6% 24.5% 19.0%
Asian/Asian-American
17.3% 19.2% 16.2% 14.8% 17.2% 13.7% 14.7% 16.2% 16.3% 18.7%
African/African-American
8.1% 6.5% 9.2% 9.3% 8.7% 7.6% 8.0% 9.5% 5.6% 5.8%
Other group 3.3% 3.5% 3.2% 3.1% 3.1% 3.3% 3.7% 3.5% 4.1% 3.4%
Pacific Islander 2.3% 2.4% 2.1% 3.3% 2.3% 2.1% 2.5% 2.3% 1.5% 2.5%
Native American 1.2% 1.7% 1.0% 0.9% 1.1% 1.4% 1.5% 1.2% 2.2% 1.8%
Prefer not to
disclose4.1% 3.2% 4.7% 4.7% 4.3% 3.9% 3.6% 4.8% 4.8% 3.5%
* Columns may add to more than 100% due to multiple responses.
Highest Education Level Attained
Respondents were highly educated, with three-quarters, or 75% (74%), having earned an
undergraduate or graduate/professional degree.
Respondents averaged 15.9 (15.6) years of education, with 16.1 (15.8) years reported by Downtown
residents and those who live and work in Downtown.
Table 32: Highest Education Level Attained
Total
Residence Relationship to DT Live &
work
DTDTLA LA Co. Visitor EmployedAttend
Arts
Attend
Sports
DT
Visitor
DT
Student
Full Base: 11323 4464 6278 580 7743 5787 3291 1838 588 2439
Less than high school 0.2% 0.2% 0.3% 0.3% 0.2% 0.2% 0.1% 0.2% 0.5% 0.2%
High school or equivalent 8.7% 6.6% 10.0% 11.2% 9.2% 7.1% 6.0% 7.9% 10.7% 6.8%
Trade school/ communitycollege/associate degree
16.6% 13.4% 18.5% 19.7% 17.5% 15.3% 14.8% 15.8% 17.2% 14.0%
Undergraduate/ four-yearcollege (BA or BS)
46.3% 47.9% 45.4% 44.0% 45.1% 48.2% 49.3% 49.1% 42.0% 45.1%
Graduate or professional* 28.2% 31.9% 25.8% 24.8% 27.9% 29.3% 29.7% 27.0% 29.6% 33.9%
Net college or higher 74.5% 79.8% 71.2% 68.8% 73.0% 77.5% 79.0% 76.1% 71.6% 79.0%
Mean years in school: 15.87 16.10 15.73 15.63 15.83 15.99 16.05 15.90 15.79 16.11
*e.g., MA, MS, MBA, Ph.D, JD, MD, etc.
Reported 2011 Household Income
Overall, the Total respondents (with at least one-wage earner) reported median household income
of $87,400 ($95,800).
About one-fifth, or 20% (21%), of households earned at least $150,000.
Downtown residents reported median household income of $89,800 ($96,200).
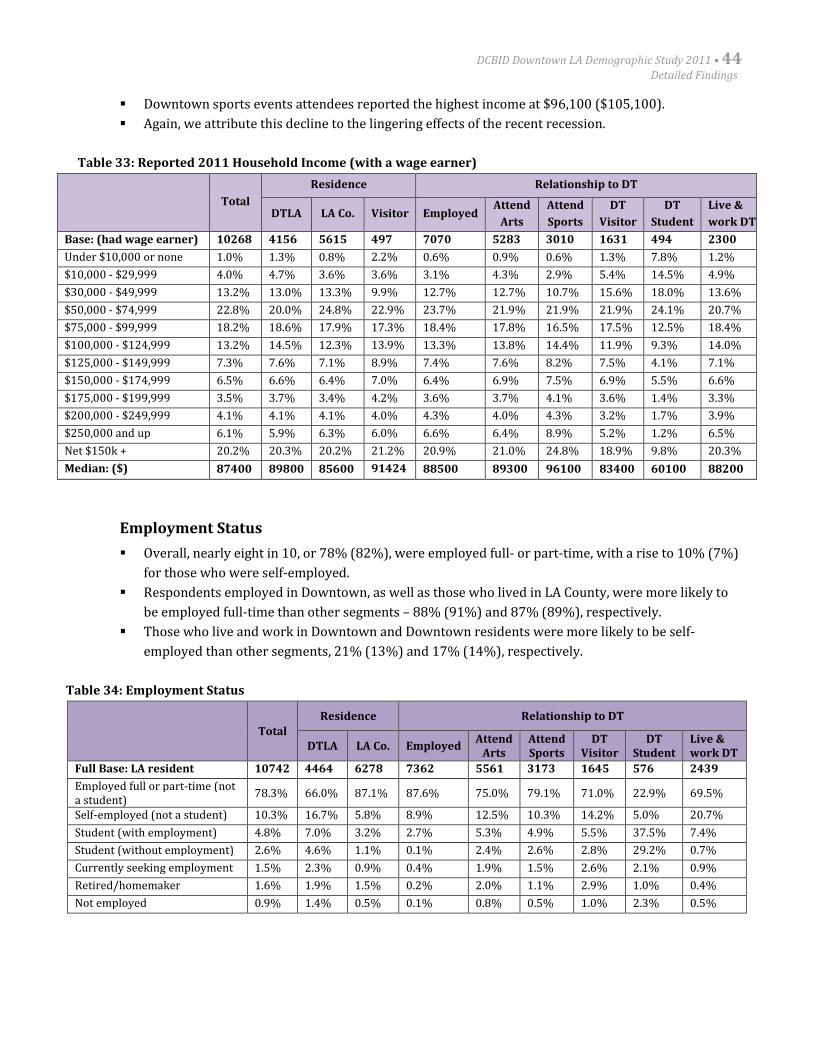
DCBID Downtown LA Demographic Study 2011 • 44Detailed Findings
Downtown sports events attendees reported the highest income at $96,100 ($105,100).
Again, we attribute this decline to the lingering effects of the recent recession.
Table 33: Reported 2011 Household Income (with a wage earner)
Total
Residence Relationship to DT
DTLA LA Co. Visitor EmployedAttend
Arts
Attend
Sports
DT
Visitor
DT
Student
Live &
work DT
Base: (had wage earner) 10268 4156 5615 497 7070 5283 3010 1631 494 2300
Under $10,000 or none 1.0% 1.3% 0.8% 2.2% 0.6% 0.9% 0.6% 1.3% 7.8% 1.2%
$10,000 - $29,999 4.0% 4.7% 3.6% 3.6% 3.1% 4.3% 2.9% 5.4% 14.5% 4.9%
$30,000 - $49,999 13.2% 13.0% 13.3% 9.9% 12.7% 12.7% 10.7% 15.6% 18.0% 13.6%
$50,000 - $74,999 22.8% 20.0% 24.8% 22.9% 23.7% 21.9% 21.9% 21.9% 24.1% 20.7%
$75,000 - $99,999 18.2% 18.6% 17.9% 17.3% 18.4% 17.8% 16.5% 17.5% 12.5% 18.4%
$100,000 - $124,999 13.2% 14.5% 12.3% 13.9% 13.3% 13.8% 14.4% 11.9% 9.3% 14.0%
$125,000 - $149,999 7.3% 7.6% 7.1% 8.9% 7.4% 7.6% 8.2% 7.5% 4.1% 7.1%
$150,000 - $174,999 6.5% 6.6% 6.4% 7.0% 6.4% 6.9% 7.5% 6.9% 5.5% 6.6%
$175,000 - $199,999 3.5% 3.7% 3.4% 4.2% 3.6% 3.7% 4.1% 3.6% 1.4% 3.3%
$200,000 - $249,999 4.1% 4.1% 4.1% 4.0% 4.3% 4.0% 4.3% 3.2% 1.7% 3.9%
$250,000 and up 6.1% 5.9% 6.3% 6.0% 6.6% 6.4% 8.9% 5.2% 1.2% 6.5%
Net $150k + 20.2% 20.3% 20.2% 21.2% 20.9% 21.0% 24.8% 18.9% 9.8% 20.3%
Median: ($) 87400 89800 85600 91424 88500 89300 96100 83400 60100 88200
Employment Status
Overall, nearly eight in 10, or 78% (82%), were employed full- or part-time, with a rise to 10% (7%)
for those who were self-employed.
Respondents employed in Downtown, as well as those who lived in LA County, were more likely to
be employed full-time than other segments – 88% (91%) and 87% (89%), respectively.
Those who live and work in Downtown and Downtown residents were more likely to be self-
employed than other segments, 21% (13%) and 17% (14%), respectively.
Table 34: Employment Status
Total
Residence Relationship to DT
DTLA LA Co. EmployedAttend
ArtsAttendSports
DTVisitor
DTStudent
Live &work DT
Full Base: LA resident 10742 4464 6278 7362 5561 3173 1645 576 2439
Employed full or part-time (nota student)
78.3% 66.0% 87.1% 87.6% 75.0% 79.1% 71.0% 22.9% 69.5%
Self-employed (not a student) 10.3% 16.7% 5.8% 8.9% 12.5% 10.3% 14.2% 5.0% 20.7%
Student (with employment) 4.8% 7.0% 3.2% 2.7% 5.3% 4.9% 5.5% 37.5% 7.4%
Student (without employment) 2.6% 4.6% 1.1% 0.1% 2.4% 2.6% 2.8% 29.2% 0.7%
Currently seeking employment 1.5% 2.3% 0.9% 0.4% 1.9% 1.5% 2.6% 2.1% 0.9%
Retired/homemaker 1.6% 1.9% 1.5% 0.2% 2.0% 1.1% 2.9% 1.0% 0.4%
Not employed 0.9% 1.4% 0.5% 0.1% 0.8% 0.5% 1.0% 2.3% 0.5%
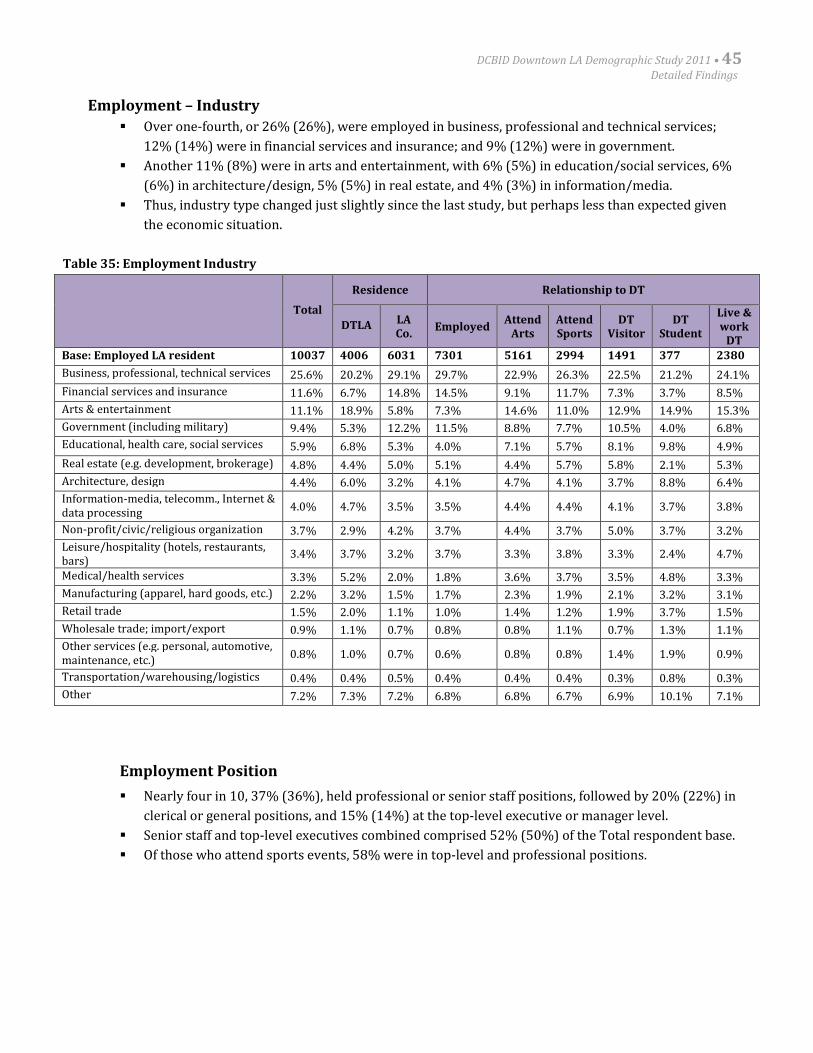
DCBID Downtown LA Demographic Study 2011 • 45Detailed Findings
Employment – Industry
Over one-fourth, or 26% (26%), were employed in business, professional and technical services;
12% (14%) were in financial services and insurance; and 9% (12%) were in government.
Another 11% (8%) were in arts and entertainment, with 6% (5%) in education/social services, 6%
(6%) in architecture/design, 5% (5%) in real estate, and 4% (3%) in information/media.
Thus, industry type changed just slightly since the last study, but perhaps less than expected given
the economic situation.
Table 35: Employment Industry
Total
Residence Relationship to DT
DTLA LACo.
EmployedAttend
ArtsAttendSports
DTVisitor
DTStudent
Live &work
DTBase: Employed LA resident 10037 4006 6031 7301 5161 2994 1491 377 2380
Business, professional, technical services 25.6% 20.2% 29.1% 29.7% 22.9% 26.3% 22.5% 21.2% 24.1%
Financial services and insurance 11.6% 6.7% 14.8% 14.5% 9.1% 11.7% 7.3% 3.7% 8.5%
Arts & entertainment 11.1% 18.9% 5.8% 7.3% 14.6% 11.0% 12.9% 14.9% 15.3%
Government (including military) 9.4% 5.3% 12.2% 11.5% 8.8% 7.7% 10.5% 4.0% 6.8%
Educational, health care, social services 5.9% 6.8% 5.3% 4.0% 7.1% 5.7% 8.1% 9.8% 4.9%
Real estate (e.g. development, brokerage) 4.8% 4.4% 5.0% 5.1% 4.4% 5.7% 5.8% 2.1% 5.3%
Architecture, design 4.4% 6.0% 3.2% 4.1% 4.7% 4.1% 3.7% 8.8% 6.4%
Information-media, telecomm., Internet &data processing
4.0% 4.7% 3.5% 3.5% 4.4% 4.4% 4.1% 3.7% 3.8%
Non-profit/civic/religious organization 3.7% 2.9% 4.2% 3.7% 4.4% 3.7% 5.0% 3.7% 3.2%
Leisure/hospitality (hotels, restaurants,bars)
3.4% 3.7% 3.2% 3.7% 3.3% 3.8% 3.3% 2.4% 4.7%
Medical/health services 3.3% 5.2% 2.0% 1.8% 3.6% 3.7% 3.5% 4.8% 3.3%
Manufacturing (apparel, hard goods, etc.) 2.2% 3.2% 1.5% 1.7% 2.3% 1.9% 2.1% 3.2% 3.1%
Retail trade 1.5% 2.0% 1.1% 1.0% 1.4% 1.2% 1.9% 3.7% 1.5%
Wholesale trade; import/export 0.9% 1.1% 0.7% 0.8% 0.8% 1.1% 0.7% 1.3% 1.1%
Other services (e.g. personal, automotive,maintenance, etc.)
0.8% 1.0% 0.7% 0.6% 0.8% 0.8% 1.4% 1.9% 0.9%
Transportation/warehousing/logistics 0.4% 0.4% 0.5% 0.4% 0.4% 0.4% 0.3% 0.8% 0.3%
Other 7.2% 7.3% 7.2% 6.8% 6.8% 6.7% 6.9% 10.1% 7.1%
Employment Position
Nearly four in 10, 37% (36%), held professional or senior staff positions, followed by 20% (22%) in
clerical or general positions, and 15% (14%) at the top-level executive or manager level.
Senior staff and top-level executives combined comprised 52% (50%) of the Total respondent base.
Of those who attend sports events, 58% were in top-level and professional positions.
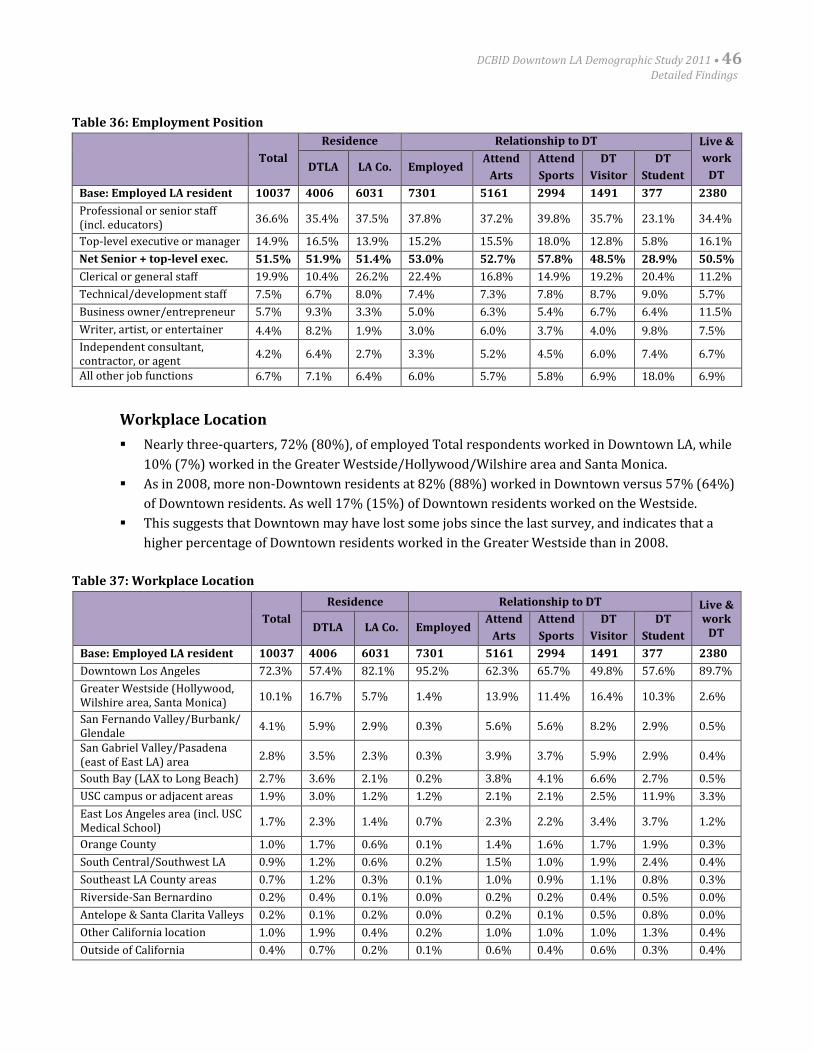
DCBID Downtown LA Demographic Study 2011 • 46Detailed Findings
Table 36: Employment Position
Total
Residence Relationship to DT Live &
work
DTDTLA LA Co. Employed
Attend
Arts
Attend
Sports
DT
Visitor
DT
Student
Base: Employed LA resident 10037 4006 6031 7301 5161 2994 1491 377 2380
Professional or senior staff(incl. educators)
36.6% 35.4% 37.5% 37.8% 37.2% 39.8% 35.7% 23.1% 34.4%
Top-level executive or manager 14.9% 16.5% 13.9% 15.2% 15.5% 18.0% 12.8% 5.8% 16.1%
Net Senior + top-level exec. 51.5% 51.9% 51.4% 53.0% 52.7% 57.8% 48.5% 28.9% 50.5%
Clerical or general staff 19.9% 10.4% 26.2% 22.4% 16.8% 14.9% 19.2% 20.4% 11.2%
Technical/development staff 7.5% 6.7% 8.0% 7.4% 7.3% 7.8% 8.7% 9.0% 5.7%
Business owner/entrepreneur 5.7% 9.3% 3.3% 5.0% 6.3% 5.4% 6.7% 6.4% 11.5%
Writer, artist, or entertainer 4.4% 8.2% 1.9% 3.0% 6.0% 3.7% 4.0% 9.8% 7.5%
Independent consultant,contractor, or agent
4.2% 6.4% 2.7% 3.3% 5.2% 4.5% 6.0% 7.4% 6.7%
All other job functions 6.7% 7.1% 6.4% 6.0% 5.7% 5.8% 6.9% 18.0% 6.9%
Workplace Location
Nearly three-quarters, 72% (80%), of employed Total respondents worked in Downtown LA, while
10% (7%) worked in the Greater Westside/Hollywood/Wilshire area and Santa Monica.
As in 2008, more non-Downtown residents at 82% (88%) worked in Downtown versus 57% (64%)
of Downtown residents. As well 17% (15%) of Downtown residents worked on the Westside.
This suggests that Downtown may have lost some jobs since the last survey, and indicates that a
higher percentage of Downtown residents worked in the Greater Westside than in 2008.
Table 37: Workplace Location
Total
Residence Relationship to DT Live &work
DTDTLA LA Co. EmployedAttend
Arts
Attend
Sports
DT
Visitor
DT
Student
Base: Employed LA resident 10037 4006 6031 7301 5161 2994 1491 377 2380
Downtown Los Angeles 72.3% 57.4% 82.1% 95.2% 62.3% 65.7% 49.8% 57.6% 89.7%
Greater Westside (Hollywood,Wilshire area, Santa Monica)
10.1% 16.7% 5.7% 1.4% 13.9% 11.4% 16.4% 10.3% 2.6%
San Fernando Valley/Burbank/Glendale
4.1% 5.9% 2.9% 0.3% 5.6% 5.6% 8.2% 2.9% 0.5%
San Gabriel Valley/Pasadena(east of East LA) area
2.8% 3.5% 2.3% 0.3% 3.9% 3.7% 5.9% 2.9% 0.4%
South Bay (LAX to Long Beach) 2.7% 3.6% 2.1% 0.2% 3.8% 4.1% 6.6% 2.7% 0.5%
USC campus or adjacent areas 1.9% 3.0% 1.2% 1.2% 2.1% 2.1% 2.5% 11.9% 3.3%
East Los Angeles area (incl. USCMedical School)
1.7% 2.3% 1.4% 0.7% 2.3% 2.2% 3.4% 3.7% 1.2%
Orange County 1.0% 1.7% 0.6% 0.1% 1.4% 1.6% 1.7% 1.9% 0.3%
South Central/Southwest LA 0.9% 1.2% 0.6% 0.2% 1.5% 1.0% 1.9% 2.4% 0.4%
Southeast LA County areas 0.7% 1.2% 0.3% 0.1% 1.0% 0.9% 1.1% 0.8% 0.3%
Riverside-San Bernardino 0.2% 0.4% 0.1% 0.0% 0.2% 0.2% 0.4% 0.5% 0.0%
Antelope & Santa Clarita Valleys 0.2% 0.1% 0.2% 0.0% 0.2% 0.1% 0.5% 0.8% 0.0%
Other California location 1.0% 1.9% 0.4% 0.2% 1.0% 1.0% 1.0% 1.3% 0.4%
Outside of California 0.4% 0.7% 0.2% 0.1% 0.6% 0.4% 0.6% 0.3% 0.4%
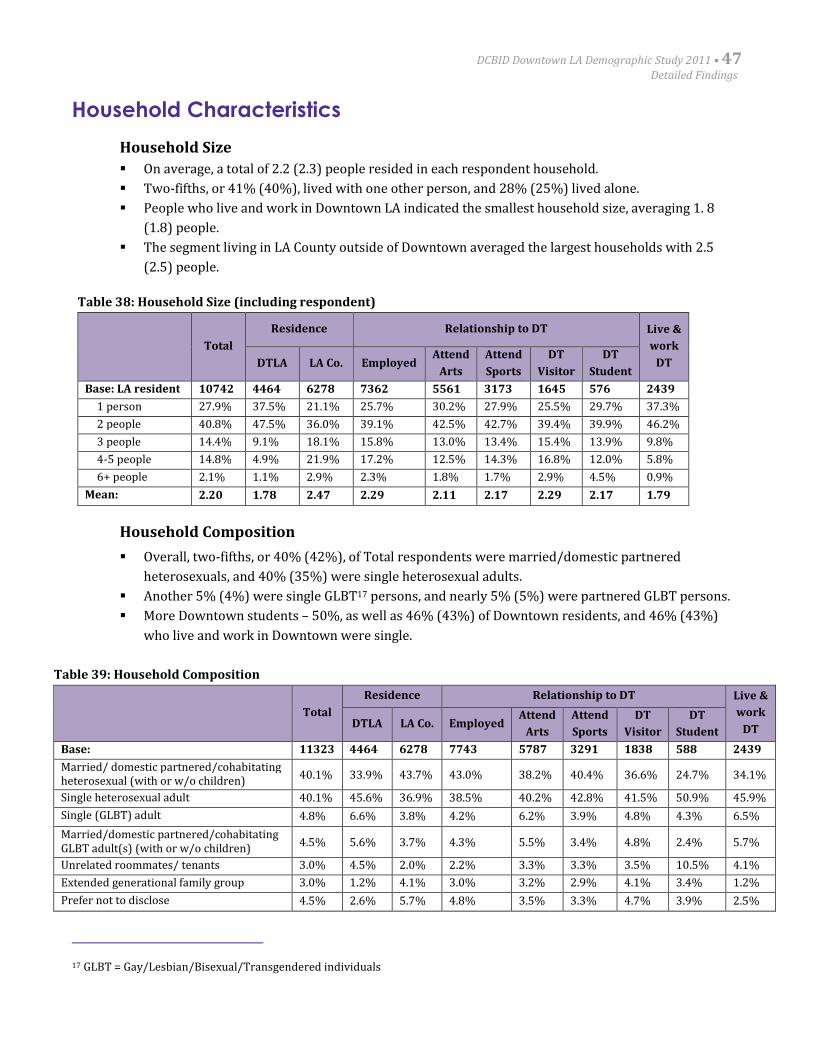
DCBID Downtown LA Demographic Study 2011 • 47Detailed Findings
Household Characteristics
Household Size
On average, a total of 2.2 (2.3) people resided in each respondent household.
Two-fifths, or 41% (40%), lived with one other person, and 28% (25%) lived alone.
People who live and work in Downtown LA indicated the smallest household size, averaging 1. 8
(1.8) people.
The segment living in LA County outside of Downtown averaged the largest households with 2.5
(2.5) people.
Table 38: Household Size (including respondent)
Total
Residence Relationship to DT Live &
work
DTDTLA LA Co. EmployedAttend
Arts
Attend
Sports
DT
Visitor
DT
Student
Base: LA resident 10742 4464 6278 7362 5561 3173 1645 576 2439
1 person 27.9% 37.5% 21.1% 25.7% 30.2% 27.9% 25.5% 29.7% 37.3%
2 people 40.8% 47.5% 36.0% 39.1% 42.5% 42.7% 39.4% 39.9% 46.2%
3 people 14.4% 9.1% 18.1% 15.8% 13.0% 13.4% 15.4% 13.9% 9.8%
4-5 people 14.8% 4.9% 21.9% 17.2% 12.5% 14.3% 16.8% 12.0% 5.8%
6+ people 2.1% 1.1% 2.9% 2.3% 1.8% 1.7% 2.9% 4.5% 0.9%
Mean: 2.20 1.78 2.47 2.29 2.11 2.17 2.29 2.17 1.79
Household Composition
Overall, two-fifths, or 40% (42%), of Total respondents were married/domestic partnered
heterosexuals, and 40% (35%) were single heterosexual adults.
Another 5% (4%) were single GLBT17 persons, and nearly 5% (5%) were partnered GLBT persons.
More Downtown students – 50%, as well as 46% (43%) of Downtown residents, and 46% (43%)
who live and work in Downtown were single.
Table 39: Household Composition
Total
Residence Relationship to DT Live &
work
DTDTLA LA Co. EmployedAttend
Arts
Attend
Sports
DT
Visitor
DT
Student
Base: 11323 4464 6278 7743 5787 3291 1838 588 2439
Married/ domestic partnered/cohabitatingheterosexual (with or w/o children)
40.1% 33.9% 43.7% 43.0% 38.2% 40.4% 36.6% 24.7% 34.1%
Single heterosexual adult 40.1% 45.6% 36.9% 38.5% 40.2% 42.8% 41.5% 50.9% 45.9%
Single (GLBT) adult 4.8% 6.6% 3.8% 4.2% 6.2% 3.9% 4.8% 4.3% 6.5%
Married/domestic partnered/cohabitatingGLBT adult(s) (with or w/o children)
4.5% 5.6% 3.7% 4.3% 5.5% 3.4% 4.8% 2.4% 5.7%
Unrelated roommates/ tenants 3.0% 4.5% 2.0% 2.2% 3.3% 3.3% 3.5% 10.5% 4.1%
Extended generational family group 3.0% 1.2% 4.1% 3.0% 3.2% 2.9% 4.1% 3.4% 1.2%
Prefer not to disclose 4.5% 2.6% 5.7% 4.8% 3.5% 3.3% 4.7% 3.9% 2.5%
17 GLBT = Gay/Lesbian/Bisexual/Transgendered individuals
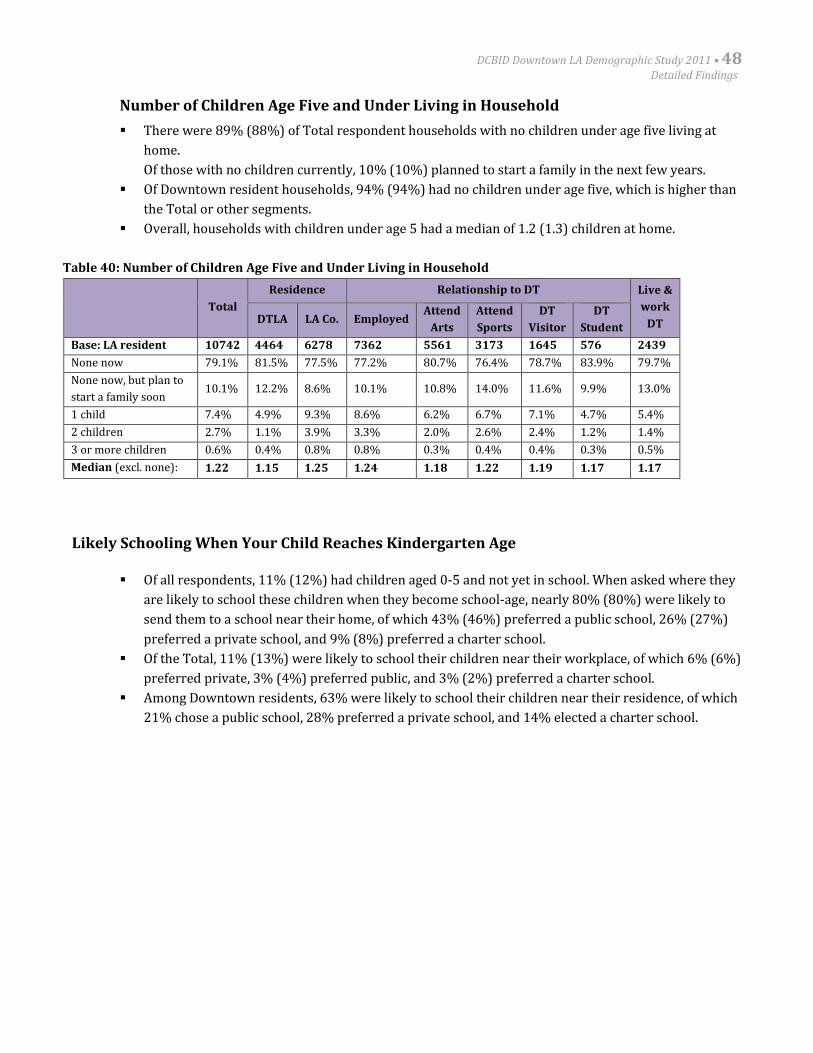
DCBID Downtown LA Demographic Study 2011 • 48Detailed Findings
Number of Children Age Five and Under Living in Household
There were 89% (88%) of Total respondent households with no children under age five living at
home.
Of those with no children currently, 10% (10%) planned to start a family in the next few years.
Of Downtown resident households, 94% (94%) had no children under age five, which is higher than
the Total or other segments.
Overall, households with children under age 5 had a median of 1.2 (1.3) children at home.
Table 40: Number of Children Age Five and Under Living in Household
Total
Residence Relationship to DT Live &
work
DTDTLA LA Co. EmployedAttend
Arts
Attend
Sports
DT
Visitor
DT
Student
Base: LA resident 10742 4464 6278 7362 5561 3173 1645 576 2439
None now 79.1% 81.5% 77.5% 77.2% 80.7% 76.4% 78.7% 83.9% 79.7%
None now, but plan to
start a family soon10.1% 12.2% 8.6% 10.1% 10.8% 14.0% 11.6% 9.9% 13.0%
1 child 7.4% 4.9% 9.3% 8.6% 6.2% 6.7% 7.1% 4.7% 5.4%
2 children 2.7% 1.1% 3.9% 3.3% 2.0% 2.6% 2.4% 1.2% 1.4%
3 or more children 0.6% 0.4% 0.8% 0.8% 0.3% 0.4% 0.4% 0.3% 0.5%
Median (excl. none): 1.22 1.15 1.25 1.24 1.18 1.22 1.19 1.17 1.17
Likely Schooling When Your Child Reaches Kindergarten Age
Of all respondents, 11% (12%) had children aged 0-5 and not yet in school. When asked where they
are likely to school these children when they become school-age, nearly 80% (80%) were likely to
send them to a school near their home, of which 43% (46%) preferred a public school, 26% (27%)
preferred a private school, and 9% (8%) preferred a charter school.
Of the Total, 11% (13%) were likely to school their children near their workplace, of which 6% (6%)
preferred private, 3% (4%) preferred public, and 3% (2%) preferred a charter school.
Among Downtown residents, 63% were likely to school their children near their residence, of which
21% chose a public school, 28% preferred a private school, and 14% elected a charter school.
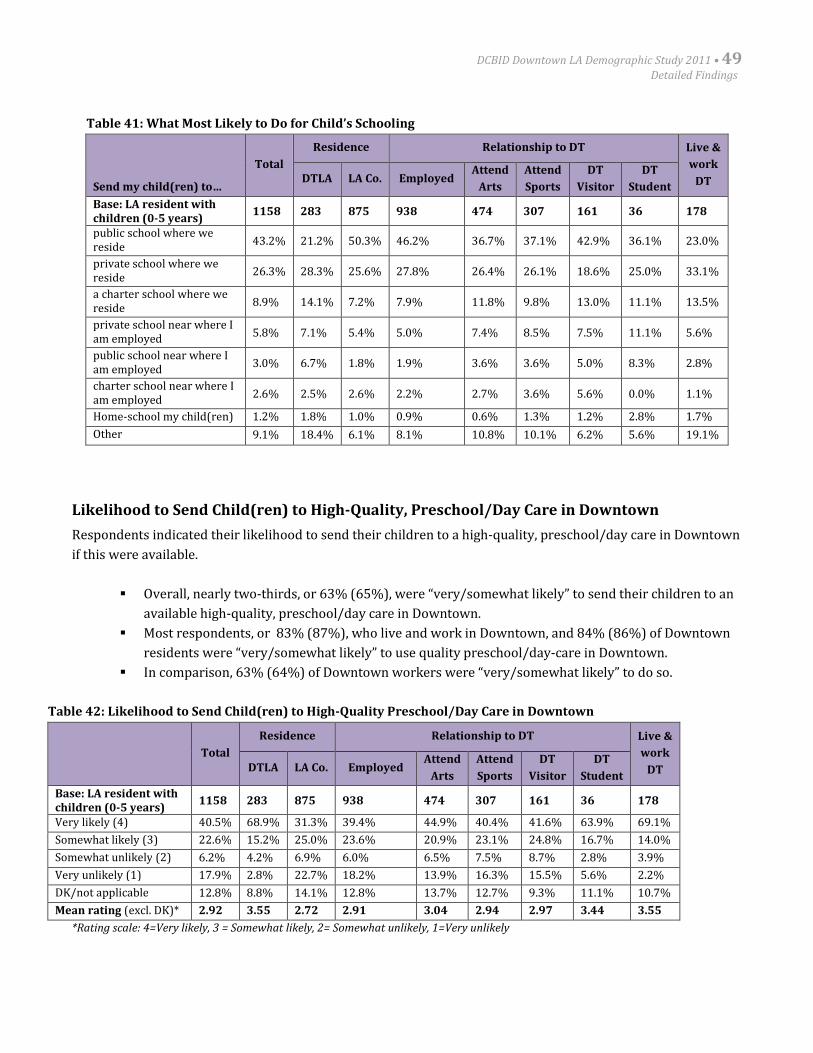
DCBID Downtown LA Demographic Study 2011 • 49Detailed Findings
Table 41: What Most Likely to Do for Child’s Schooling
Send my child(ren) to…
Total
Residence Relationship to DT Live &
work
DTDTLA LA Co. EmployedAttend
Arts
Attend
Sports
DT
Visitor
DT
Student
Base: LA resident withchildren (0-5 years)
1158 283 875 938 474 307 161 36 178
public school where wereside
43.2% 21.2% 50.3% 46.2% 36.7% 37.1% 42.9% 36.1% 23.0%
private school where wereside
26.3% 28.3% 25.6% 27.8% 26.4% 26.1% 18.6% 25.0% 33.1%
a charter school where wereside
8.9% 14.1% 7.2% 7.9% 11.8% 9.8% 13.0% 11.1% 13.5%
private school near where Iam employed
5.8% 7.1% 5.4% 5.0% 7.4% 8.5% 7.5% 11.1% 5.6%
public school near where Iam employed
3.0% 6.7% 1.8% 1.9% 3.6% 3.6% 5.0% 8.3% 2.8%
charter school near where Iam employed
2.6% 2.5% 2.6% 2.2% 2.7% 3.6% 5.6% 0.0% 1.1%
Home-school my child(ren) 1.2% 1.8% 1.0% 0.9% 0.6% 1.3% 1.2% 2.8% 1.7%
Other 9.1% 18.4% 6.1% 8.1% 10.8% 10.1% 6.2% 5.6% 19.1%
Likelihood to Send Child(ren) to High-Quality, Preschool/Day Care in Downtown
Respondents indicated their likelihood to send their children to a high-quality, preschool/day care in Downtown
if this were available.
Overall, nearly two-thirds, or 63% (65%), were “very/somewhat likely” to send their children to an
available high-quality, preschool/day care in Downtown.
Most respondents, or 83% (87%), who live and work in Downtown, and 84% (86%) of Downtown
residents were “very/somewhat likely” to use quality preschool/day-care in Downtown.
In comparison, 63% (64%) of Downtown workers were “very/somewhat likely” to do so.
Table 42: Likelihood to Send Child(ren) to High-Quality Preschool/Day Care in Downtown
Total
Residence Relationship to DT Live &
work
DTDTLA LA Co. EmployedAttend
Arts
Attend
Sports
DT
Visitor
DT
Student
Base: LA resident withchildren (0-5 years)
1158 283 875 938 474 307 161 36 178
Very likely (4) 40.5% 68.9% 31.3% 39.4% 44.9% 40.4% 41.6% 63.9% 69.1%
Somewhat likely (3) 22.6% 15.2% 25.0% 23.6% 20.9% 23.1% 24.8% 16.7% 14.0%
Somewhat unlikely (2) 6.2% 4.2% 6.9% 6.0% 6.5% 7.5% 8.7% 2.8% 3.9%
Very unlikely (1) 17.9% 2.8% 22.7% 18.2% 13.9% 16.3% 15.5% 5.6% 2.2%
DK/not applicable 12.8% 8.8% 14.1% 12.8% 13.7% 12.7% 9.3% 11.1% 10.7%
Mean rating (excl. DK)* 2.92 3.55 2.72 2.91 3.04 2.94 2.97 3.44 3.55
*Rating scale: 4=Very likely, 3 = Somewhat likely, 2= Somewhat unlikely, 1=Very unlikely
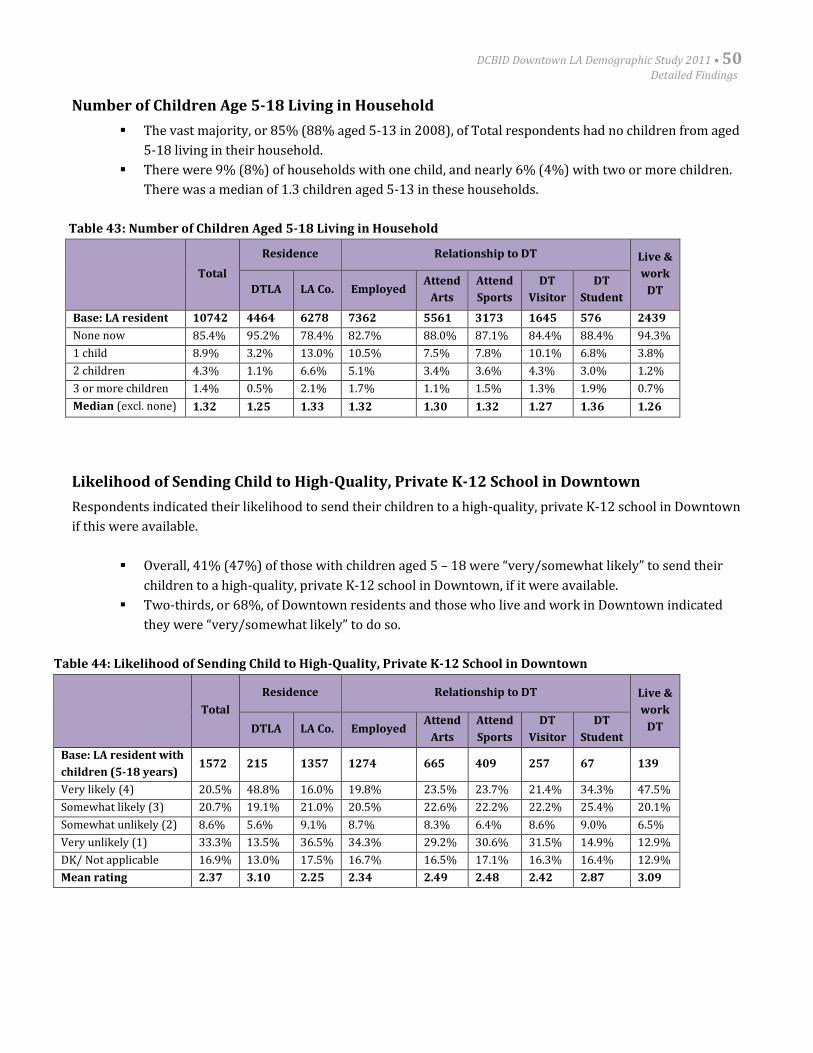
DCBID Downtown LA Demographic Study 2011 • 50Detailed Findings
Number of Children Age 5-18 Living in Household
The vast majority, or 85% (88% aged 5-13 in 2008), of Total respondents had no children from aged
5-18 living in their household.
There were 9% (8%) of households with one child, and nearly 6% (4%) with two or more children.
There was a median of 1.3 children aged 5-13 in these households.
Table 43: Number of Children Aged 5-18 Living in Household
Total
Residence Relationship to DT Live &
work
DTDTLA LA Co. EmployedAttend
Arts
Attend
Sports
DT
Visitor
DT
Student
Base: LA resident 10742 4464 6278 7362 5561 3173 1645 576 2439
None now 85.4% 95.2% 78.4% 82.7% 88.0% 87.1% 84.4% 88.4% 94.3%
1 child 8.9% 3.2% 13.0% 10.5% 7.5% 7.8% 10.1% 6.8% 3.8%
2 children 4.3% 1.1% 6.6% 5.1% 3.4% 3.6% 4.3% 3.0% 1.2%
3 or more children 1.4% 0.5% 2.1% 1.7% 1.1% 1.5% 1.3% 1.9% 0.7%
Median (excl. none) 1.32 1.25 1.33 1.32 1.30 1.32 1.27 1.36 1.26
Likelihood of Sending Child to High-Quality, Private K-12 School in Downtown
Respondents indicated their likelihood to send their children to a high-quality, private K-12 school in Downtown
if this were available.
Overall, 41% (47%) of those with children aged 5 – 18 were “very/somewhat likely” to send their
children to a high-quality, private K-12 school in Downtown, if it were available.
Two-thirds, or 68%, of Downtown residents and those who live and work in Downtown indicated
they were “very/somewhat likely” to do so.
Table 44: Likelihood of Sending Child to High-Quality, Private K-12 School in Downtown
Total
Residence Relationship to DT Live &
work
DTDTLA LA Co. EmployedAttend
Arts
Attend
Sports
DT
Visitor
DT
Student
Base: LA resident with
children (5-18 years)1572 215 1357 1274 665 409 257 67 139
Very likely (4) 20.5% 48.8% 16.0% 19.8% 23.5% 23.7% 21.4% 34.3% 47.5%
Somewhat likely (3) 20.7% 19.1% 21.0% 20.5% 22.6% 22.2% 22.2% 25.4% 20.1%
Somewhat unlikely (2) 8.6% 5.6% 9.1% 8.7% 8.3% 6.4% 8.6% 9.0% 6.5%
Very unlikely (1) 33.3% 13.5% 36.5% 34.3% 29.2% 30.6% 31.5% 14.9% 12.9%
DK/ Not applicable 16.9% 13.0% 17.5% 16.7% 16.5% 17.1% 16.3% 16.4% 12.9%
Mean rating 2.37 3.10 2.25 2.34 2.49 2.48 2.42 2.87 3.09
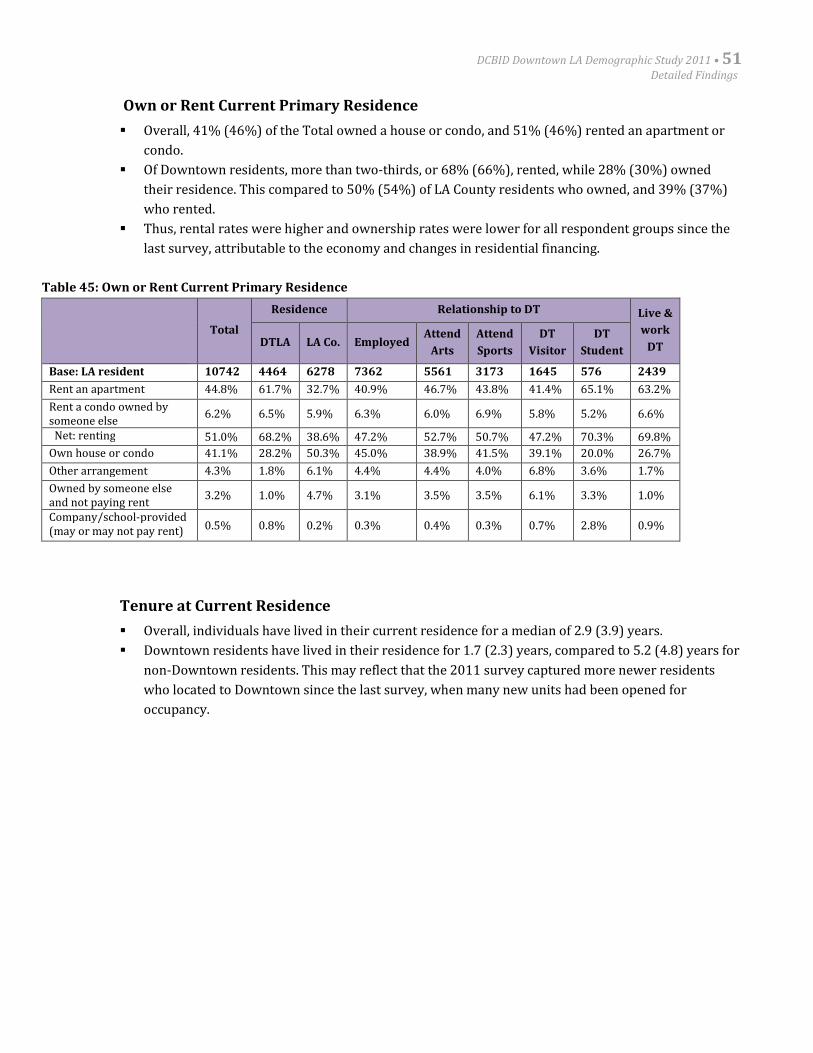
DCBID Downtown LA Demographic Study 2011 • 51Detailed Findings
Own or Rent Current Primary Residence
Overall, 41% (46%) of the Total owned a house or condo, and 51% (46%) rented an apartment or
condo.
Of Downtown residents, more than two-thirds, or 68% (66%), rented, while 28% (30%) owned
their residence. This compared to 50% (54%) of LA County residents who owned, and 39% (37%)
who rented.
Thus, rental rates were higher and ownership rates were lower for all respondent groups since the
last survey, attributable to the economy and changes in residential financing.
Table 45: Own or Rent Current Primary Residence
Total
Residence Relationship to DT Live &
work
DTDTLA LA Co. EmployedAttend
Arts
Attend
Sports
DT
Visitor
DT
Student
Base: LA resident 10742 4464 6278 7362 5561 3173 1645 576 2439
Rent an apartment 44.8% 61.7% 32.7% 40.9% 46.7% 43.8% 41.4% 65.1% 63.2%
Rent a condo owned bysomeone else
6.2% 6.5% 5.9% 6.3% 6.0% 6.9% 5.8% 5.2% 6.6%
Net: renting 51.0% 68.2% 38.6% 47.2% 52.7% 50.7% 47.2% 70.3% 69.8%
Own house or condo 41.1% 28.2% 50.3% 45.0% 38.9% 41.5% 39.1% 20.0% 26.7%
Other arrangement 4.3% 1.8% 6.1% 4.4% 4.4% 4.0% 6.8% 3.6% 1.7%
Owned by someone elseand not paying rent
3.2% 1.0% 4.7% 3.1% 3.5% 3.5% 6.1% 3.3% 1.0%
Company/school-provided(may or may not pay rent) 0.5% 0.8% 0.2% 0.3% 0.4% 0.3% 0.7% 2.8% 0.9%
Tenure at Current Residence
Overall, individuals have lived in their current residence for a median of 2.9 (3.9) years.
Downtown residents have lived in their residence for 1.7 (2.3) years, compared to 5.2 (4.8) years for
non-Downtown residents. This may reflect that the 2011 survey captured more newer residents
who located to Downtown since the last survey, when many new units had been opened for
occupancy.
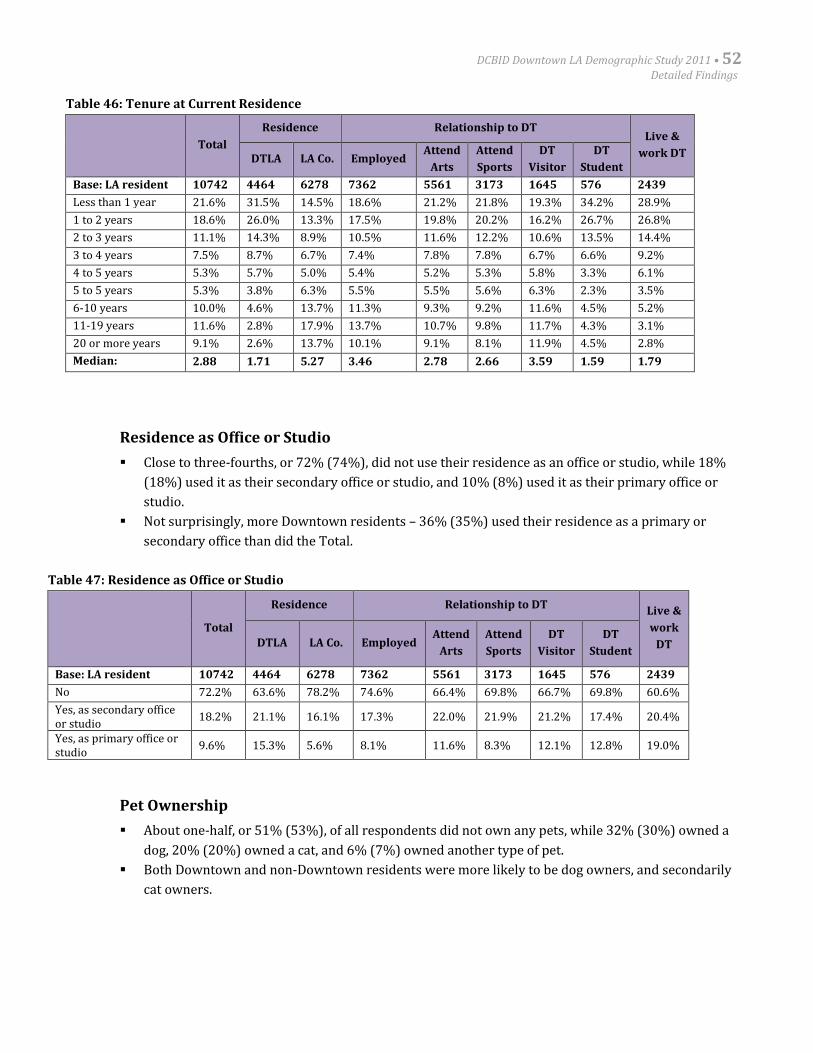
DCBID Downtown LA Demographic Study 2011 • 52Detailed Findings
Table 46: Tenure at Current Residence
Total
Residence Relationship to DTLive &
work DTDTLA LA Co. EmployedAttend
Arts
Attend
Sports
DT
Visitor
DT
Student
Base: LA resident 10742 4464 6278 7362 5561 3173 1645 576 2439
Less than 1 year 21.6% 31.5% 14.5% 18.6% 21.2% 21.8% 19.3% 34.2% 28.9%
1 to 2 years 18.6% 26.0% 13.3% 17.5% 19.8% 20.2% 16.2% 26.7% 26.8%
2 to 3 years 11.1% 14.3% 8.9% 10.5% 11.6% 12.2% 10.6% 13.5% 14.4%
3 to 4 years 7.5% 8.7% 6.7% 7.4% 7.8% 7.8% 6.7% 6.6% 9.2%
4 to 5 years 5.3% 5.7% 5.0% 5.4% 5.2% 5.3% 5.8% 3.3% 6.1%
5 to 5 years 5.3% 3.8% 6.3% 5.5% 5.5% 5.6% 6.3% 2.3% 3.5%
6-10 years 10.0% 4.6% 13.7% 11.3% 9.3% 9.2% 11.6% 4.5% 5.2%
11-19 years 11.6% 2.8% 17.9% 13.7% 10.7% 9.8% 11.7% 4.3% 3.1%
20 or more years 9.1% 2.6% 13.7% 10.1% 9.1% 8.1% 11.9% 4.5% 2.8%
Median: 2.88 1.71 5.27 3.46 2.78 2.66 3.59 1.59 1.79
Residence as Office or Studio
Close to three-fourths, or 72% (74%), did not use their residence as an office or studio, while 18%
(18%) used it as their secondary office or studio, and 10% (8%) used it as their primary office or
studio.
Not surprisingly, more Downtown residents – 36% (35%) used their residence as a primary or
secondary office than did the Total.
Table 47: Residence as Office or Studio
Total
Residence Relationship to DTLive &
work
DTDTLA LA Co. EmployedAttend
Arts
Attend
Sports
DT
Visitor
DT
Student
Base: LA resident 10742 4464 6278 7362 5561 3173 1645 576 2439
No 72.2% 63.6% 78.2% 74.6% 66.4% 69.8% 66.7% 69.8% 60.6%
Yes, as secondary officeor studio
18.2% 21.1% 16.1% 17.3% 22.0% 21.9% 21.2% 17.4% 20.4%
Yes, as primary office orstudio
9.6% 15.3% 5.6% 8.1% 11.6% 8.3% 12.1% 12.8% 19.0%
Pet Ownership
About one-half, or 51% (53%), of all respondents did not own any pets, while 32% (30%) owned a
dog, 20% (20%) owned a cat, and 6% (7%) owned another type of pet.
Both Downtown and non-Downtown residents were more likely to be dog owners, and secondarily
cat owners.
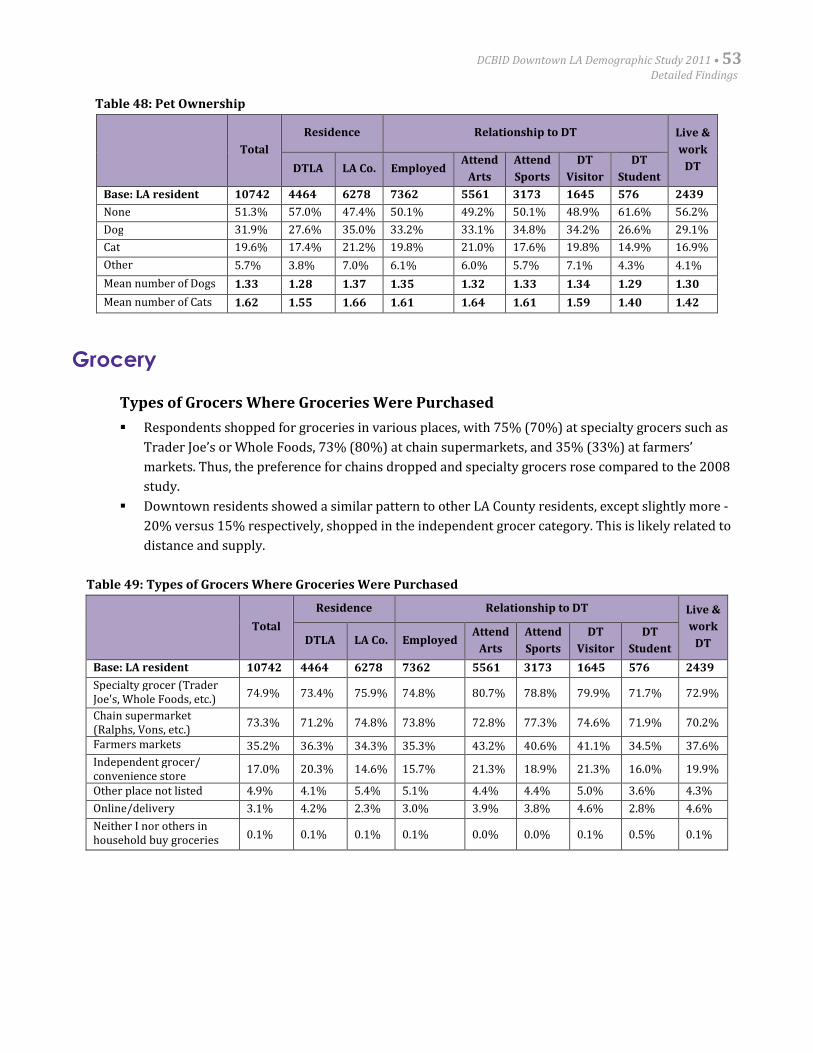
DCBID Downtown LA Demographic Study 2011 • 53Detailed Findings
Table 48: Pet Ownership
Total
Residence Relationship to DT Live &
work
DTDTLA LA Co. EmployedAttend
Arts
Attend
Sports
DT
Visitor
DT
Student
Base: LA resident 10742 4464 6278 7362 5561 3173 1645 576 2439
None 51.3% 57.0% 47.4% 50.1% 49.2% 50.1% 48.9% 61.6% 56.2%
Dog 31.9% 27.6% 35.0% 33.2% 33.1% 34.8% 34.2% 26.6% 29.1%
Cat 19.6% 17.4% 21.2% 19.8% 21.0% 17.6% 19.8% 14.9% 16.9%
Other 5.7% 3.8% 7.0% 6.1% 6.0% 5.7% 7.1% 4.3% 4.1%
Mean number of Dogs 1.33 1.28 1.37 1.35 1.32 1.33 1.34 1.29 1.30
Mean number of Cats 1.62 1.55 1.66 1.61 1.64 1.61 1.59 1.40 1.42
Grocery
Types of Grocers Where Groceries Were Purchased
Respondents shopped for groceries in various places, with 75% (70%) at specialty grocers such as
Trader Joe’s or Whole Foods, 73% (80%) at chain supermarkets, and 35% (33%) at farmers’
markets. Thus, the preference for chains dropped and specialty grocers rose compared to the 2008
study.
Downtown residents showed a similar pattern to other LA County residents, except slightly more -
20% versus 15% respectively, shopped in the independent grocer category. This is likely related to
distance and supply.
Table 49: Types of Grocers Where Groceries Were Purchased
Total
Residence Relationship to DT Live &
work
DTDTLA LA Co. EmployedAttend
Arts
Attend
Sports
DT
Visitor
DT
Student
Base: LA resident 10742 4464 6278 7362 5561 3173 1645 576 2439
Specialty grocer (TraderJoe's, Whole Foods, etc.)
74.9% 73.4% 75.9% 74.8% 80.7% 78.8% 79.9% 71.7% 72.9%
Chain supermarket(Ralphs, Vons, etc.)
73.3% 71.2% 74.8% 73.8% 72.8% 77.3% 74.6% 71.9% 70.2%
Farmers markets 35.2% 36.3% 34.3% 35.3% 43.2% 40.6% 41.1% 34.5% 37.6%
Independent grocer/convenience store
17.0% 20.3% 14.6% 15.7% 21.3% 18.9% 21.3% 16.0% 19.9%
Other place not listed 4.9% 4.1% 5.4% 5.1% 4.4% 4.4% 5.0% 3.6% 4.3%
Online/delivery 3.1% 4.2% 2.3% 3.0% 3.9% 3.8% 4.6% 2.8% 4.6%
Neither I nor others inhousehold buy groceries 0.1% 0.1% 0.1% 0.1% 0.0% 0.0% 0.1% 0.5% 0.1%
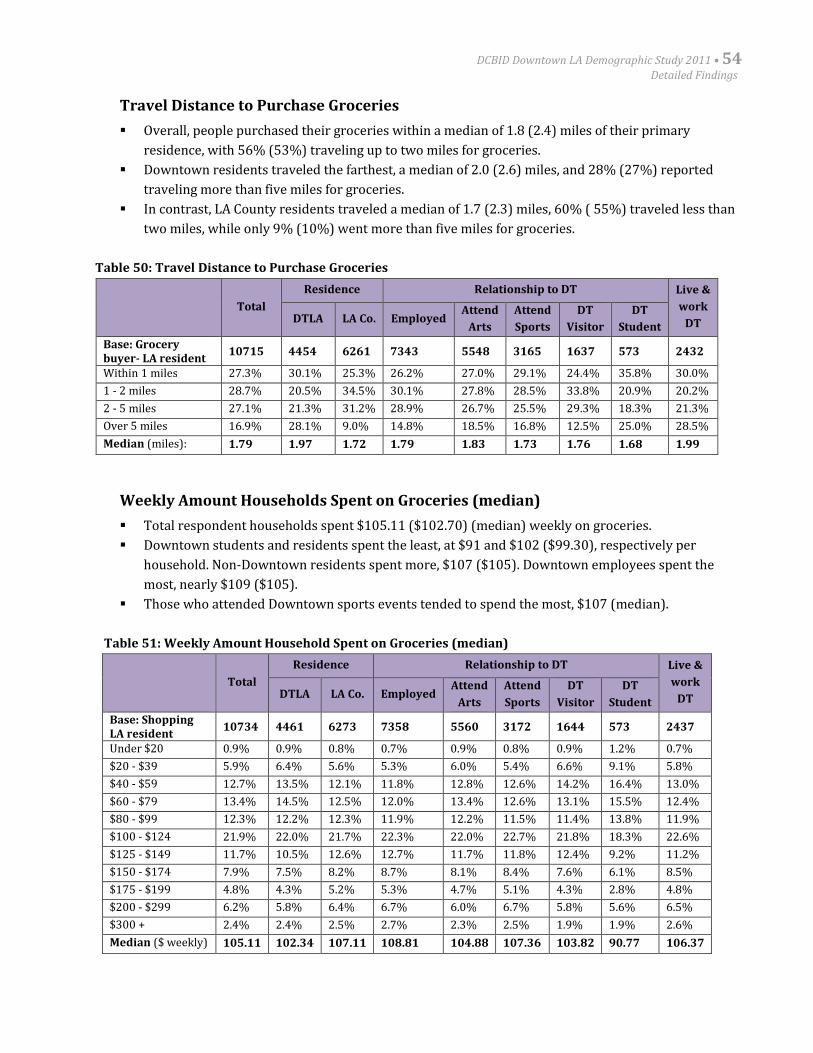
DCBID Downtown LA Demographic Study 2011 • 54Detailed Findings
Travel Distance to Purchase Groceries
Overall, people purchased their groceries within a median of 1.8 (2.4) miles of their primary
residence, with 56% (53%) traveling up to two miles for groceries.
Downtown residents traveled the farthest, a median of 2.0 (2.6) miles, and 28% (27%) reported
traveling more than five miles for groceries.
In contrast, LA County residents traveled a median of 1.7 (2.3) miles, 60% ( 55%) traveled less than
two miles, while only 9% (10%) went more than five miles for groceries.
Table 50: Travel Distance to Purchase Groceries
Total
Residence Relationship to DT Live &
work
DTDTLA LA Co. EmployedAttend
Arts
Attend
Sports
DT
Visitor
DT
Student
Base: Grocerybuyer- LA resident
10715 4454 6261 7343 5548 3165 1637 573 2432
Within 1 miles 27.3% 30.1% 25.3% 26.2% 27.0% 29.1% 24.4% 35.8% 30.0%
1 - 2 miles 28.7% 20.5% 34.5% 30.1% 27.8% 28.5% 33.8% 20.9% 20.2%
2 - 5 miles 27.1% 21.3% 31.2% 28.9% 26.7% 25.5% 29.3% 18.3% 21.3%
Over 5 miles 16.9% 28.1% 9.0% 14.8% 18.5% 16.8% 12.5% 25.0% 28.5%
Median (miles): 1.79 1.97 1.72 1.79 1.83 1.73 1.76 1.68 1.99
Weekly Amount Households Spent on Groceries (median)
Total respondent households spent $105.11 ($102.70) (median) weekly on groceries.
Downtown students and residents spent the least, at $91 and $102 ($99.30), respectively per
household. Non-Downtown residents spent more, $107 ($105). Downtown employees spent the
most, nearly $109 ($105).
Those who attended Downtown sports events tended to spend the most, $107 (median).
Table 51: Weekly Amount Household Spent on Groceries (median)
Total
Residence Relationship to DT Live &
work
DTDTLA LA Co. EmployedAttend
Arts
Attend
Sports
DT
Visitor
DT
Student
Base: ShoppingLA resident
10734 4461 6273 7358 5560 3172 1644 573 2437
Under $20 0.9% 0.9% 0.8% 0.7% 0.9% 0.8% 0.9% 1.2% 0.7%
$20 - $39 5.9% 6.4% 5.6% 5.3% 6.0% 5.4% 6.6% 9.1% 5.8%
$40 - $59 12.7% 13.5% 12.1% 11.8% 12.8% 12.6% 14.2% 16.4% 13.0%
$60 - $79 13.4% 14.5% 12.5% 12.0% 13.4% 12.6% 13.1% 15.5% 12.4%
$80 - $99 12.3% 12.2% 12.3% 11.9% 12.2% 11.5% 11.4% 13.8% 11.9%
$100 - $124 21.9% 22.0% 21.7% 22.3% 22.0% 22.7% 21.8% 18.3% 22.6%
$125 - $149 11.7% 10.5% 12.6% 12.7% 11.7% 11.8% 12.4% 9.2% 11.2%
$150 - $174 7.9% 7.5% 8.2% 8.7% 8.1% 8.4% 7.6% 6.1% 8.5%
$175 - $199 4.8% 4.3% 5.2% 5.3% 4.7% 5.1% 4.3% 2.8% 4.8%
$200 - $299 6.2% 5.8% 6.4% 6.7% 6.0% 6.7% 5.8% 5.6% 6.5%
$300 + 2.4% 2.4% 2.5% 2.7% 2.3% 2.5% 1.9% 1.9% 2.6%
Median ($ weekly) 105.11 102.34 107.11 108.81 104.88 107.36 103.82 90.77 106.37
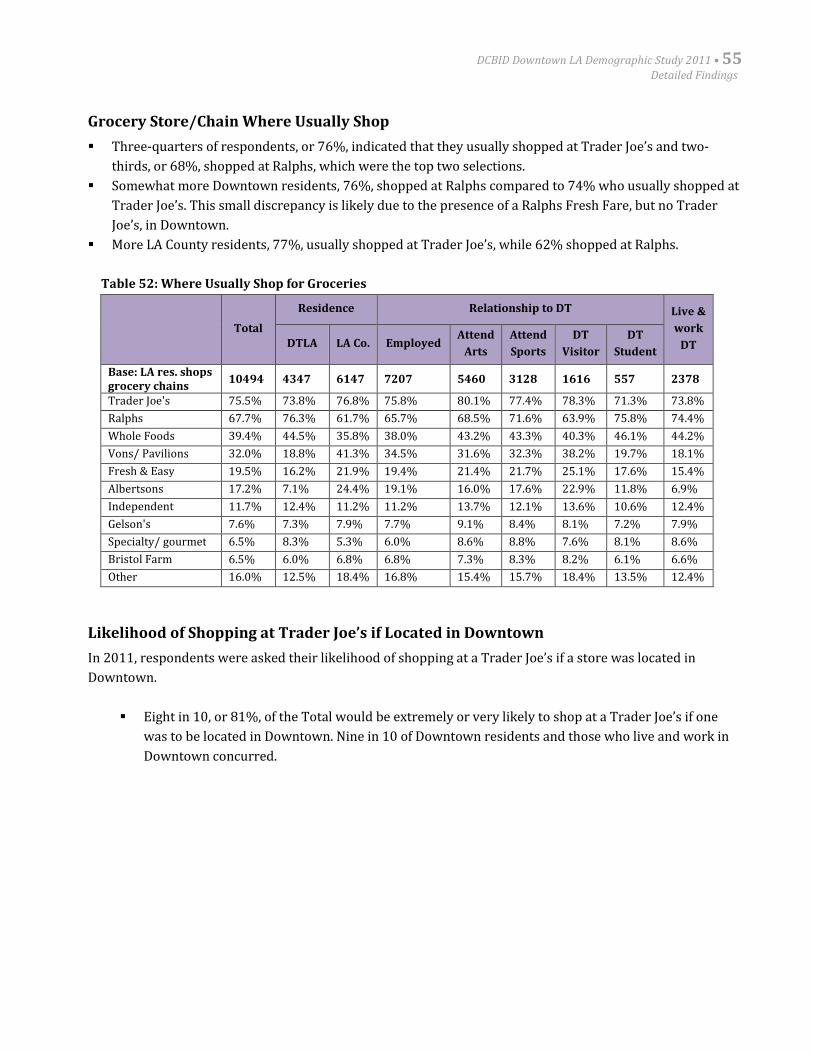
DCBID Downtown LA Demographic Study 2011 • 55Detailed Findings
Grocery Store/Chain Where Usually Shop
Three-quarters of respondents, or 76%, indicated that they usually shopped at Trader Joe’s and two-
thirds, or 68%, shopped at Ralphs, which were the top two selections.
Somewhat more Downtown residents, 76%, shopped at Ralphs compared to 74% who usually shopped at
Trader Joe’s. This small discrepancy is likely due to the presence of a Ralphs Fresh Fare, but no Trader
Joe’s, in Downtown.
More LA County residents, 77%, usually shopped at Trader Joe’s, while 62% shopped at Ralphs.
Table 52: Where Usually Shop for Groceries
Total
Residence Relationship to DT Live &
work
DTDTLA LA Co. EmployedAttend
Arts
Attend
Sports
DT
Visitor
DT
Student
Base: LA res. shopsgrocery chains
10494 4347 6147 7207 5460 3128 1616 557 2378
Trader Joe's 75.5% 73.8% 76.8% 75.8% 80.1% 77.4% 78.3% 71.3% 73.8%
Ralphs 67.7% 76.3% 61.7% 65.7% 68.5% 71.6% 63.9% 75.8% 74.4%
Whole Foods 39.4% 44.5% 35.8% 38.0% 43.2% 43.3% 40.3% 46.1% 44.2%
Vons/ Pavilions 32.0% 18.8% 41.3% 34.5% 31.6% 32.3% 38.2% 19.7% 18.1%
Fresh & Easy 19.5% 16.2% 21.9% 19.4% 21.4% 21.7% 25.1% 17.6% 15.4%
Albertsons 17.2% 7.1% 24.4% 19.1% 16.0% 17.6% 22.9% 11.8% 6.9%
Independent 11.7% 12.4% 11.2% 11.2% 13.7% 12.1% 13.6% 10.6% 12.4%
Gelson's 7.6% 7.3% 7.9% 7.7% 9.1% 8.4% 8.1% 7.2% 7.9%
Specialty/ gourmet 6.5% 8.3% 5.3% 6.0% 8.6% 8.8% 7.6% 8.1% 8.6%
Bristol Farm 6.5% 6.0% 6.8% 6.8% 7.3% 8.3% 8.2% 6.1% 6.6%
Other 16.0% 12.5% 18.4% 16.8% 15.4% 15.7% 18.4% 13.5% 12.4%
Likelihood of Shopping at Trader Joe’s if Located in Downtown
In 2011, respondents were asked their likelihood of shopping at a Trader Joe’s if a store was located in
Downtown.
Eight in 10, or 81%, of the Total would be extremely or very likely to shop at a Trader Joe’s if one
was to be located in Downtown. Nine in 10 of Downtown residents and those who live and work in
Downtown concurred.
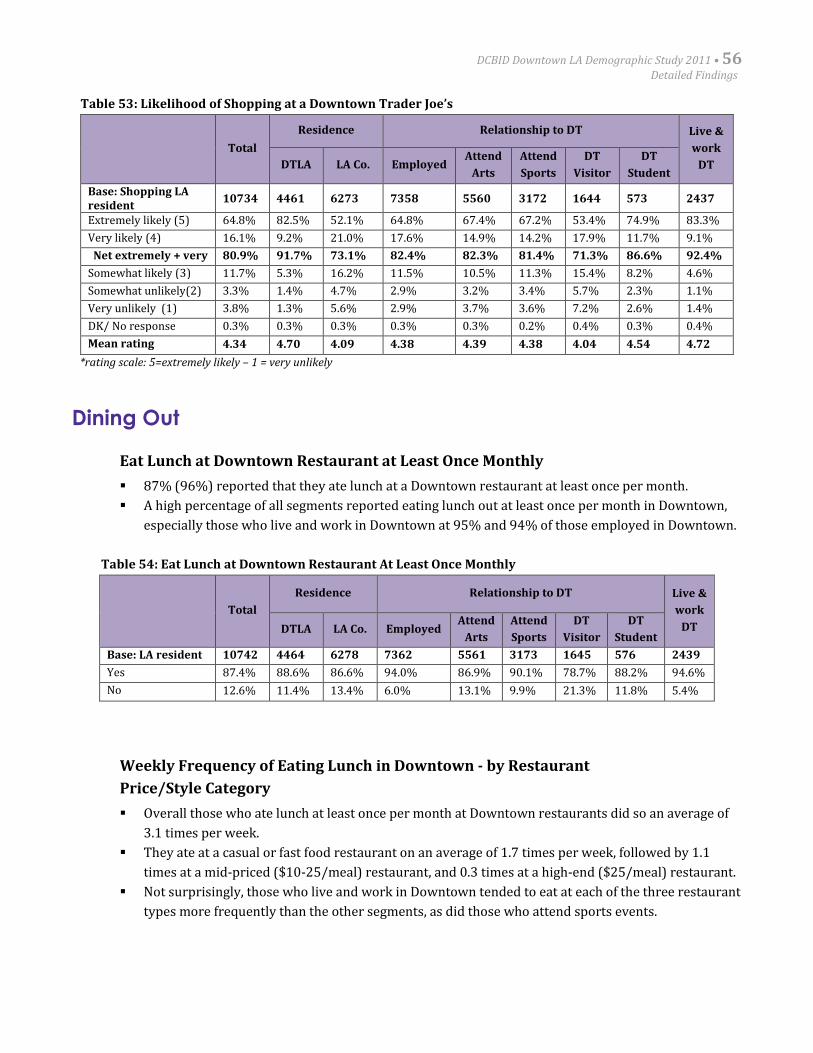
DCBID Downtown LA Demographic Study 2011 • 56Detailed Findings
Table 53: Likelihood of Shopping at a Downtown Trader Joe’s
Total
Residence Relationship to DT Live &
work
DTDTLA LA Co. EmployedAttend
Arts
Attend
Sports
DT
Visitor
DT
Student
Base: Shopping LAresident
10734 4461 6273 7358 5560 3172 1644 573 2437
Extremely likely (5) 64.8% 82.5% 52.1% 64.8% 67.4% 67.2% 53.4% 74.9% 83.3%
Very likely (4) 16.1% 9.2% 21.0% 17.6% 14.9% 14.2% 17.9% 11.7% 9.1%
Net extremely + very 80.9% 91.7% 73.1% 82.4% 82.3% 81.4% 71.3% 86.6% 92.4%
Somewhat likely (3) 11.7% 5.3% 16.2% 11.5% 10.5% 11.3% 15.4% 8.2% 4.6%
Somewhat unlikely(2) 3.3% 1.4% 4.7% 2.9% 3.2% 3.4% 5.7% 2.3% 1.1%
Very unlikely (1) 3.8% 1.3% 5.6% 2.9% 3.7% 3.6% 7.2% 2.6% 1.4%
DK/ No response 0.3% 0.3% 0.3% 0.3% 0.3% 0.2% 0.4% 0.3% 0.4%
Mean rating 4.34 4.70 4.09 4.38 4.39 4.38 4.04 4.54 4.72
*rating scale: 5=extremely likely – 1 = very unlikely
Dining Out
Eat Lunch at Downtown Restaurant at Least Once Monthly
87% (96%) reported that they ate lunch at a Downtown restaurant at least once per month.
A high percentage of all segments reported eating lunch out at least once per month in Downtown,
especially those who live and work in Downtown at 95% and 94% of those employed in Downtown.
Table 54: Eat Lunch at Downtown Restaurant At Least Once Monthly
Total
Residence Relationship to DT Live &
work
DTDTLA LA Co. EmployedAttend
Arts
Attend
Sports
DT
Visitor
DT
Student
Base: LA resident 10742 4464 6278 7362 5561 3173 1645 576 2439
Yes 87.4% 88.6% 86.6% 94.0% 86.9% 90.1% 78.7% 88.2% 94.6%
No 12.6% 11.4% 13.4% 6.0% 13.1% 9.9% 21.3% 11.8% 5.4%
Weekly Frequency of Eating Lunch in Downtown - by Restaurant
Price/Style Category
Overall those who ate lunch at least once per month at Downtown restaurants did so an average of
3.1 times per week.
They ate at a casual or fast food restaurant on an average of 1.7 times per week, followed by 1.1
times at a mid-priced ($10-25/meal) restaurant, and 0.3 times at a high-end ($25/meal) restaurant.
Not surprisingly, those who live and work in Downtown tended to eat at each of the three restaurant
types more frequently than the other segments, as did those who attend sports events.
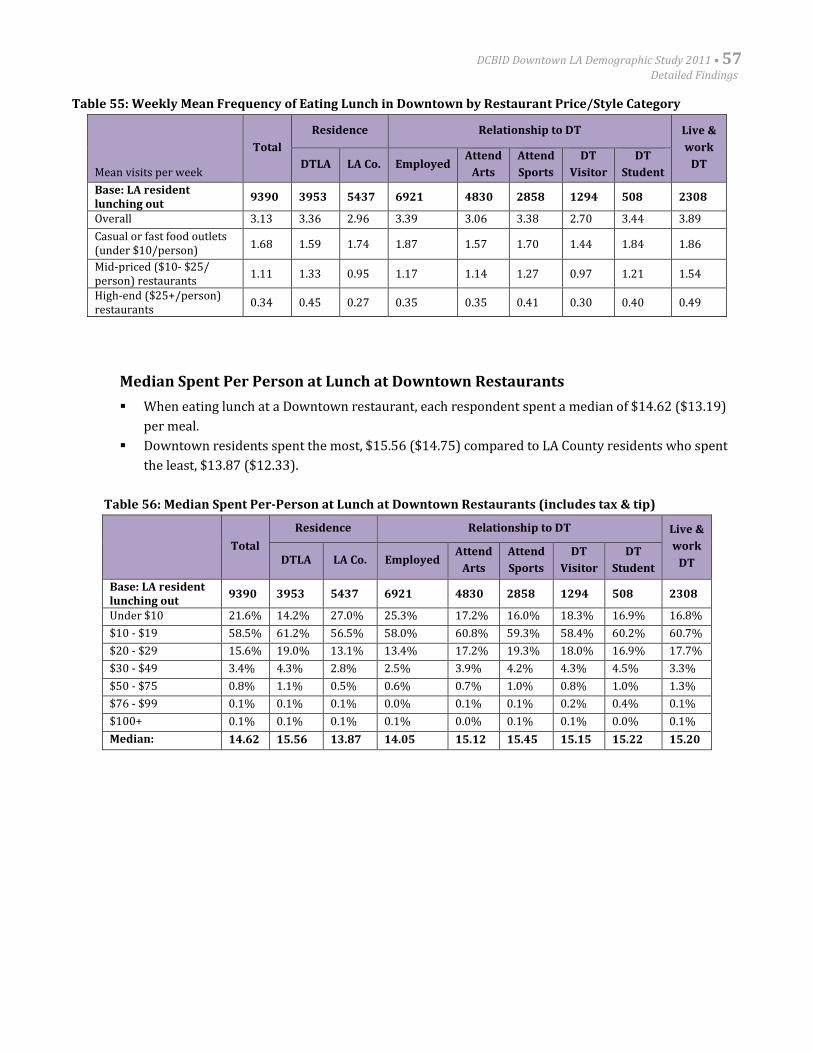
DCBID Downtown LA Demographic Study 2011 • 57Detailed Findings
Table 55: Weekly Mean Frequency of Eating Lunch in Downtown by Restaurant Price/Style Category
Mean visits per week
Total
Residence Relationship to DT Live &
work
DTDTLA LA Co. EmployedAttend
Arts
Attend
Sports
DT
Visitor
DT
Student
Base: LA residentlunching out
9390 3953 5437 6921 4830 2858 1294 508 2308
Overall 3.13 3.36 2.96 3.39 3.06 3.38 2.70 3.44 3.89
Casual or fast food outlets(under $10/person)
1.68 1.59 1.74 1.87 1.57 1.70 1.44 1.84 1.86
Mid-priced ($10- $25/person) restaurants
1.11 1.33 0.95 1.17 1.14 1.27 0.97 1.21 1.54
High-end ($25+/person)restaurants
0.34 0.45 0.27 0.35 0.35 0.41 0.30 0.40 0.49
Median Spent Per Person at Lunch at Downtown Restaurants
When eating lunch at a Downtown restaurant, each respondent spent a median of $14.62 ($13.19)
per meal.
Downtown residents spent the most, $15.56 ($14.75) compared to LA County residents who spent
the least, $13.87 ($12.33).
Table 56: Median Spent Per-Person at Lunch at Downtown Restaurants (includes tax & tip)
Total
Residence Relationship to DT Live &
work
DTDTLA LA Co. EmployedAttend
Arts
Attend
Sports
DT
Visitor
DT
Student
Base: LA residentlunching out
9390 3953 5437 6921 4830 2858 1294 508 2308
Under $10 21.6% 14.2% 27.0% 25.3% 17.2% 16.0% 18.3% 16.9% 16.8%
$10 - $19 58.5% 61.2% 56.5% 58.0% 60.8% 59.3% 58.4% 60.2% 60.7%
$20 - $29 15.6% 19.0% 13.1% 13.4% 17.2% 19.3% 18.0% 16.9% 17.7%
$30 - $49 3.4% 4.3% 2.8% 2.5% 3.9% 4.2% 4.3% 4.5% 3.3%
$50 - $75 0.8% 1.1% 0.5% 0.6% 0.7% 1.0% 0.8% 1.0% 1.3%
$76 - $99 0.1% 0.1% 0.1% 0.0% 0.1% 0.1% 0.2% 0.4% 0.1%
$100+ 0.1% 0.1% 0.1% 0.1% 0.0% 0.1% 0.1% 0.0% 0.1%
Median: 14.62 15.56 13.87 14.05 15.12 15.45 15.15 15.22 15.20
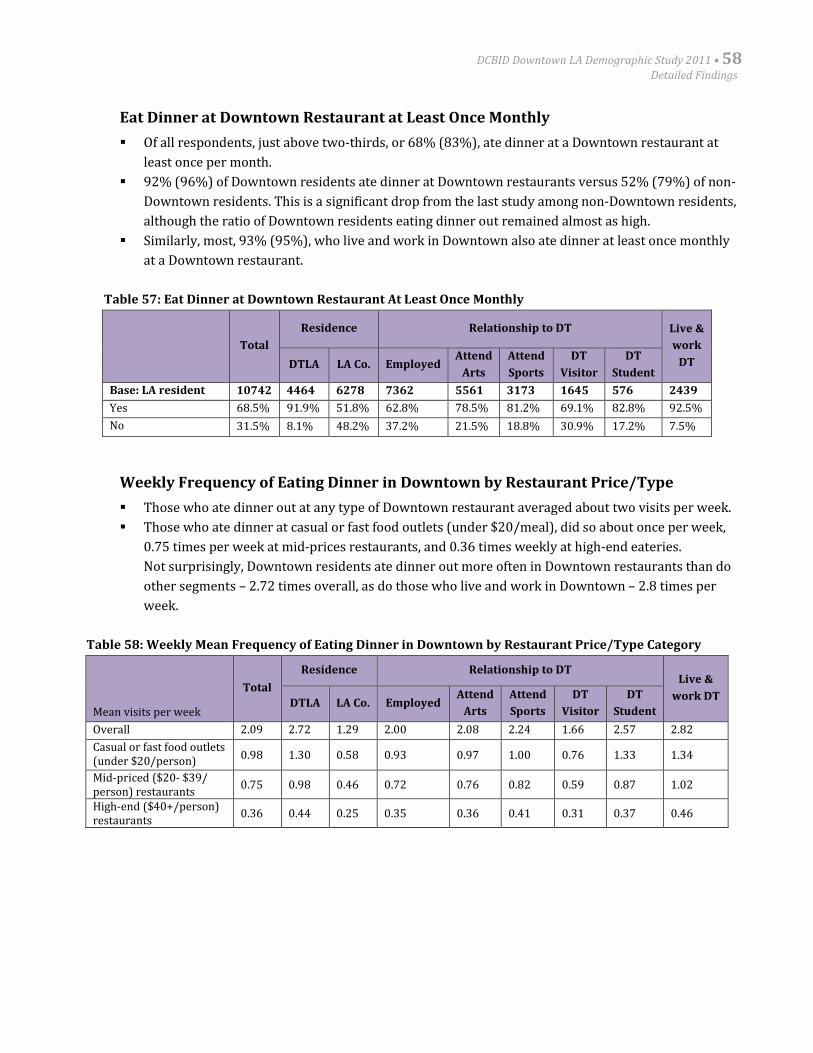
DCBID Downtown LA Demographic Study 2011 • 58Detailed Findings
Eat Dinner at Downtown Restaurant at Least Once Monthly
Of all respondents, just above two-thirds, or 68% (83%), ate dinner at a Downtown restaurant at
least once per month.
92% (96%) of Downtown residents ate dinner at Downtown restaurants versus 52% (79%) of non-
Downtown residents. This is a significant drop from the last study among non-Downtown residents,
although the ratio of Downtown residents eating dinner out remained almost as high.
Similarly, most, 93% (95%), who live and work in Downtown also ate dinner at least once monthly
at a Downtown restaurant.
Table 57: Eat Dinner at Downtown Restaurant At Least Once Monthly
Total
Residence Relationship to DT Live &
work
DTDTLA LA Co. EmployedAttend
Arts
Attend
Sports
DT
Visitor
DT
Student
Base: LA resident 10742 4464 6278 7362 5561 3173 1645 576 2439
Yes 68.5% 91.9% 51.8% 62.8% 78.5% 81.2% 69.1% 82.8% 92.5%
No 31.5% 8.1% 48.2% 37.2% 21.5% 18.8% 30.9% 17.2% 7.5%
Weekly Frequency of Eating Dinner in Downtown by Restaurant Price/Type
Those who ate dinner out at any type of Downtown restaurant averaged about two visits per week.
Those who ate dinner at casual or fast food outlets (under $20/meal), did so about once per week,
0.75 times per week at mid-prices restaurants, and 0.36 times weekly at high-end eateries.
Not surprisingly, Downtown residents ate dinner out more often in Downtown restaurants than do
other segments – 2.72 times overall, as do those who live and work in Downtown – 2.8 times per
week.
Table 58: Weekly Mean Frequency of Eating Dinner in Downtown by Restaurant Price/Type Category
Mean visits per week
Total
Residence Relationship to DTLive &
work DTDTLA LA Co. Employed
Attend
Arts
Attend
Sports
DT
Visitor
DT
Student
Overall 2.09 2.72 1.29 2.00 2.08 2.24 1.66 2.57 2.82
Casual or fast food outlets(under $20/person)
0.98 1.30 0.58 0.93 0.97 1.00 0.76 1.33 1.34
Mid-priced ($20- $39/person) restaurants
0.75 0.98 0.46 0.72 0.76 0.82 0.59 0.87 1.02
High-end ($40+/person)restaurants
0.36 0.44 0.25 0.35 0.36 0.41 0.31 0.37 0.46
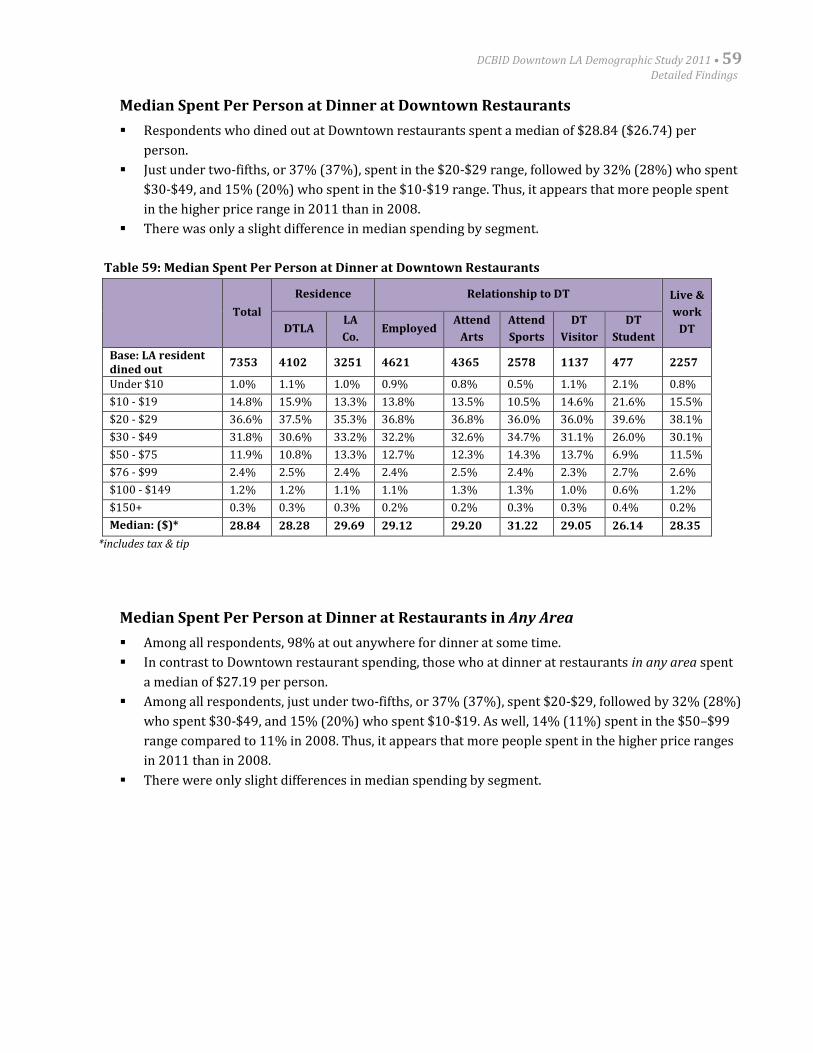
DCBID Downtown LA Demographic Study 2011 • 59Detailed Findings
Median Spent Per Person at Dinner at Downtown Restaurants
Respondents who dined out at Downtown restaurants spent a median of $28.84 ($26.74) per
person.
Just under two-fifths, or 37% (37%), spent in the $20-$29 range, followed by 32% (28%) who spent
$30-$49, and 15% (20%) who spent in the $10-$19 range. Thus, it appears that more people spent
in the higher price range in 2011 than in 2008.
There was only a slight difference in median spending by segment.
Table 59: Median Spent Per Person at Dinner at Downtown Restaurants
Total
Residence Relationship to DT Live &
work
DTDTLALA
Co.Employed
Attend
Arts
Attend
Sports
DT
Visitor
DT
Student
Base: LA residentdined out
7353 4102 3251 4621 4365 2578 1137 477 2257
Under $10 1.0% 1.1% 1.0% 0.9% 0.8% 0.5% 1.1% 2.1% 0.8%
$10 - $19 14.8% 15.9% 13.3% 13.8% 13.5% 10.5% 14.6% 21.6% 15.5%
$20 - $29 36.6% 37.5% 35.3% 36.8% 36.8% 36.0% 36.0% 39.6% 38.1%
$30 - $49 31.8% 30.6% 33.2% 32.2% 32.6% 34.7% 31.1% 26.0% 30.1%
$50 - $75 11.9% 10.8% 13.3% 12.7% 12.3% 14.3% 13.7% 6.9% 11.5%
$76 - $99 2.4% 2.5% 2.4% 2.4% 2.5% 2.4% 2.3% 2.7% 2.6%
$100 - $149 1.2% 1.2% 1.1% 1.1% 1.3% 1.3% 1.0% 0.6% 1.2%
$150+ 0.3% 0.3% 0.3% 0.2% 0.2% 0.3% 0.3% 0.4% 0.2%
Median: ($)* 28.84 28.28 29.69 29.12 29.20 31.22 29.05 26.14 28.35
*includes tax & tip
Median Spent Per Person at Dinner at Restaurants in Any Area
Among all respondents, 98% at out anywhere for dinner at some time.
In contrast to Downtown restaurant spending, those who at dinner at restaurants in any area spent
a median of $27.19 per person.
Among all respondents, just under two-fifths, or 37% (37%), spent $20-$29, followed by 32% (28%)
who spent $30-$49, and 15% (20%) who spent $10-$19. As well, 14% (11%) spent in the $50–$99
range compared to 11% in 2008. Thus, it appears that more people spent in the higher price ranges
in 2011 than in 2008.
There were only slight differences in median spending by segment.
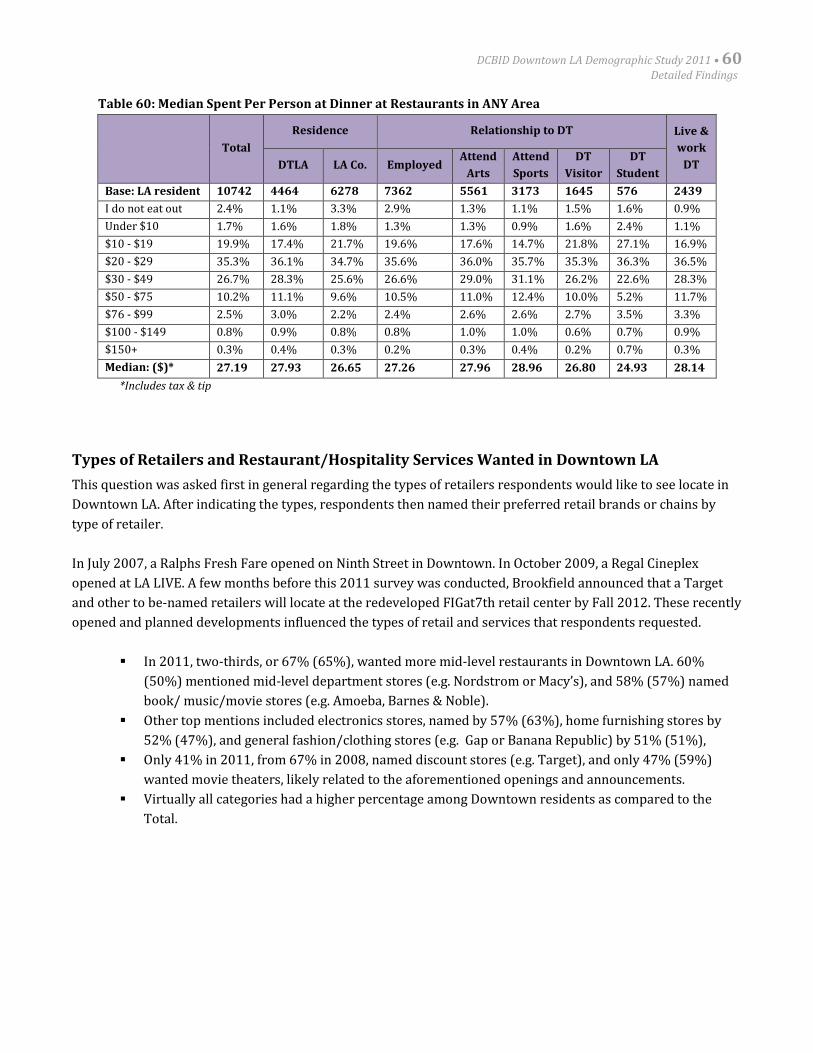
DCBID Downtown LA Demographic Study 2011 • 60Detailed Findings
Table 60: Median Spent Per Person at Dinner at Restaurants in ANY Area
Total
Residence Relationship to DT Live &
work
DTDTLA LA Co. EmployedAttend
Arts
Attend
Sports
DT
Visitor
DT
Student
Base: LA resident 10742 4464 6278 7362 5561 3173 1645 576 2439
I do not eat out 2.4% 1.1% 3.3% 2.9% 1.3% 1.1% 1.5% 1.6% 0.9%
Under $10 1.7% 1.6% 1.8% 1.3% 1.3% 0.9% 1.6% 2.4% 1.1%
$10 - $19 19.9% 17.4% 21.7% 19.6% 17.6% 14.7% 21.8% 27.1% 16.9%
$20 - $29 35.3% 36.1% 34.7% 35.6% 36.0% 35.7% 35.3% 36.3% 36.5%
$30 - $49 26.7% 28.3% 25.6% 26.6% 29.0% 31.1% 26.2% 22.6% 28.3%
$50 - $75 10.2% 11.1% 9.6% 10.5% 11.0% 12.4% 10.0% 5.2% 11.7%
$76 - $99 2.5% 3.0% 2.2% 2.4% 2.6% 2.6% 2.7% 3.5% 3.3%
$100 - $149 0.8% 0.9% 0.8% 0.8% 1.0% 1.0% 0.6% 0.7% 0.9%
$150+ 0.3% 0.4% 0.3% 0.2% 0.3% 0.4% 0.2% 0.7% 0.3%
Median: ($)* 27.19 27.93 26.65 27.26 27.96 28.96 26.80 24.93 28.14
*Includes tax & tip
Types of Retailers and Restaurant/Hospitality Services Wanted in Downtown LA
This question was asked first in general regarding the types of retailers respondents would like to see locate in
Downtown LA. After indicating the types, respondents then named their preferred retail brands or chains by
type of retailer.
In July 2007, a Ralphs Fresh Fare opened on Ninth Street in Downtown. In October 2009, a Regal Cineplex
opened at LA LIVE. A few months before this 2011 survey was conducted, Brookfield announced that a Target
and other to be-named retailers will locate at the redeveloped FIGat7th retail center by Fall 2012. These recently
opened and planned developments influenced the types of retail and services that respondents requested.
In 2011, two-thirds, or 67% (65%), wanted more mid-level restaurants in Downtown LA. 60%
(50%) mentioned mid-level department stores (e.g. Nordstrom or Macy’s), and 58% (57%) named
book/ music/movie stores (e.g. Amoeba, Barnes & Noble).
Other top mentions included electronics stores, named by 57% (63%), home furnishing stores by
52% (47%), and general fashion/clothing stores (e.g. Gap or Banana Republic) by 51% (51%),
Only 41% in 2011, from 67% in 2008, named discount stores (e.g. Target), and only 47% (59%)
wanted movie theaters, likely related to the aforementioned openings and announcements.
Virtually all categories had a higher percentage among Downtown residents as compared to the
Total.
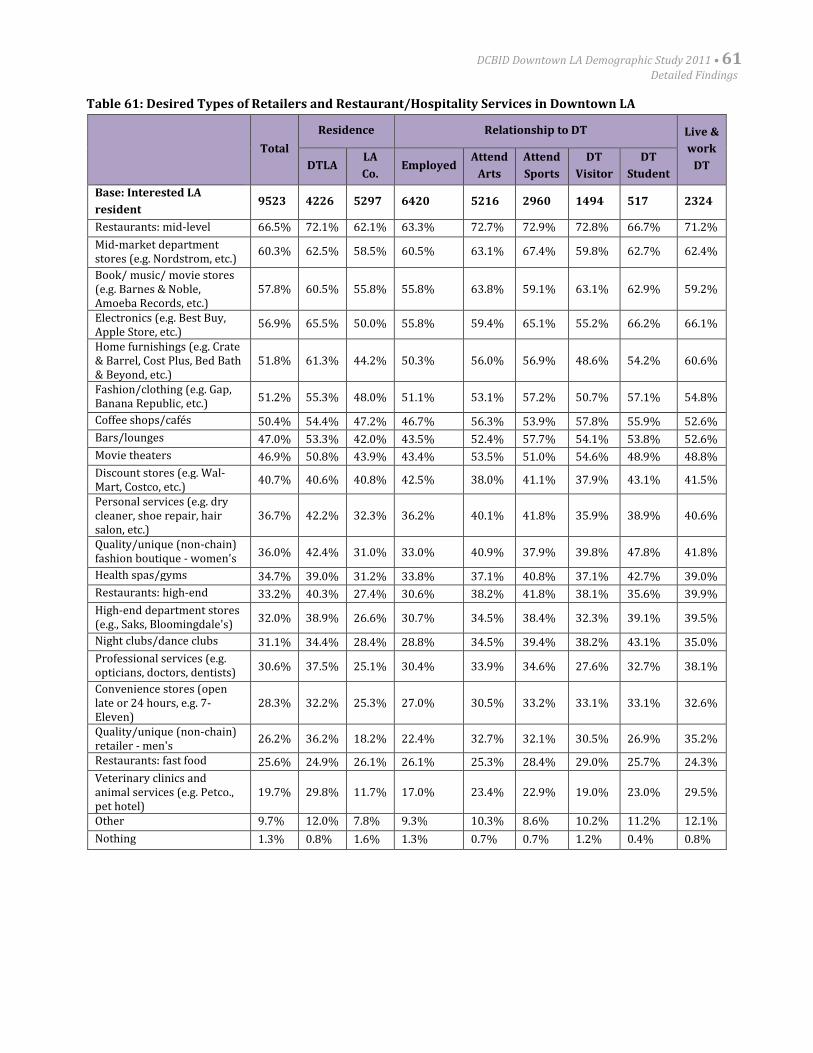
DCBID Downtown LA Demographic Study 2011 • 61Detailed Findings
Table 61: Desired Types of Retailers and Restaurant/Hospitality Services in Downtown LA
Total
Residence Relationship to DT Live &
work
DTDTLALA
Co.Employed
Attend
Arts
Attend
Sports
DT
Visitor
DT
Student
Base: Interested LA
resident9523 4226 5297 6420 5216 2960 1494 517 2324
Restaurants: mid-level 66.5% 72.1% 62.1% 63.3% 72.7% 72.9% 72.8% 66.7% 71.2%
Mid-market departmentstores (e.g. Nordstrom, etc.)
60.3% 62.5% 58.5% 60.5% 63.1% 67.4% 59.8% 62.7% 62.4%
Book/ music/ movie stores(e.g. Barnes & Noble,Amoeba Records, etc.)
57.8% 60.5% 55.8% 55.8% 63.8% 59.1% 63.1% 62.9% 59.2%
Electronics (e.g. Best Buy,Apple Store, etc.)
56.9% 65.5% 50.0% 55.8% 59.4% 65.1% 55.2% 66.2% 66.1%
Home furnishings (e.g. Crate& Barrel, Cost Plus, Bed Bath& Beyond, etc.)
51.8% 61.3% 44.2% 50.3% 56.0% 56.9% 48.6% 54.2% 60.6%
Fashion/clothing (e.g. Gap,Banana Republic, etc.)
51.2% 55.3% 48.0% 51.1% 53.1% 57.2% 50.7% 57.1% 54.8%
Coffee shops/cafés 50.4% 54.4% 47.2% 46.7% 56.3% 53.9% 57.8% 55.9% 52.6%
Bars/lounges 47.0% 53.3% 42.0% 43.5% 52.4% 57.7% 54.1% 53.8% 52.6%
Movie theaters 46.9% 50.8% 43.9% 43.4% 53.5% 51.0% 54.6% 48.9% 48.8%
Discount stores (e.g. Wal-Mart, Costco, etc.)
40.7% 40.6% 40.8% 42.5% 38.0% 41.1% 37.9% 43.1% 41.5%
Personal services (e.g. drycleaner, shoe repair, hairsalon, etc.)
36.7% 42.2% 32.3% 36.2% 40.1% 41.8% 35.9% 38.9% 40.6%
Quality/unique (non-chain)fashion boutique - women's
36.0% 42.4% 31.0% 33.0% 40.9% 37.9% 39.8% 47.8% 41.8%
Health spas/gyms 34.7% 39.0% 31.2% 33.8% 37.1% 40.8% 37.1% 42.7% 39.0%
Restaurants: high-end 33.2% 40.3% 27.4% 30.6% 38.2% 41.8% 38.1% 35.6% 39.9%
High-end department stores(e.g., Saks, Bloomingdale's)
32.0% 38.9% 26.6% 30.7% 34.5% 38.4% 32.3% 39.1% 39.5%
Night clubs/dance clubs 31.1% 34.4% 28.4% 28.8% 34.5% 39.4% 38.2% 43.1% 35.0%
Professional services (e.g.opticians, doctors, dentists)
30.6% 37.5% 25.1% 30.4% 33.9% 34.6% 27.6% 32.7% 38.1%
Convenience stores (openlate or 24 hours, e.g. 7-Eleven)
28.3% 32.2% 25.3% 27.0% 30.5% 33.2% 33.1% 33.1% 32.6%
Quality/unique (non-chain)retailer - men's
26.2% 36.2% 18.2% 22.4% 32.7% 32.1% 30.5% 26.9% 35.2%
Restaurants: fast food 25.6% 24.9% 26.1% 26.1% 25.3% 28.4% 29.0% 25.7% 24.3%
Veterinary clinics andanimal services (e.g. Petco.,pet hotel)
19.7% 29.8% 11.7% 17.0% 23.4% 22.9% 19.0% 23.0% 29.5%
Other 9.7% 12.0% 7.8% 9.3% 10.3% 8.6% 10.2% 11.2% 12.1%
Nothing 1.3% 0.8% 1.6% 1.3% 0.7% 0.7% 1.2% 0.4% 0.8%
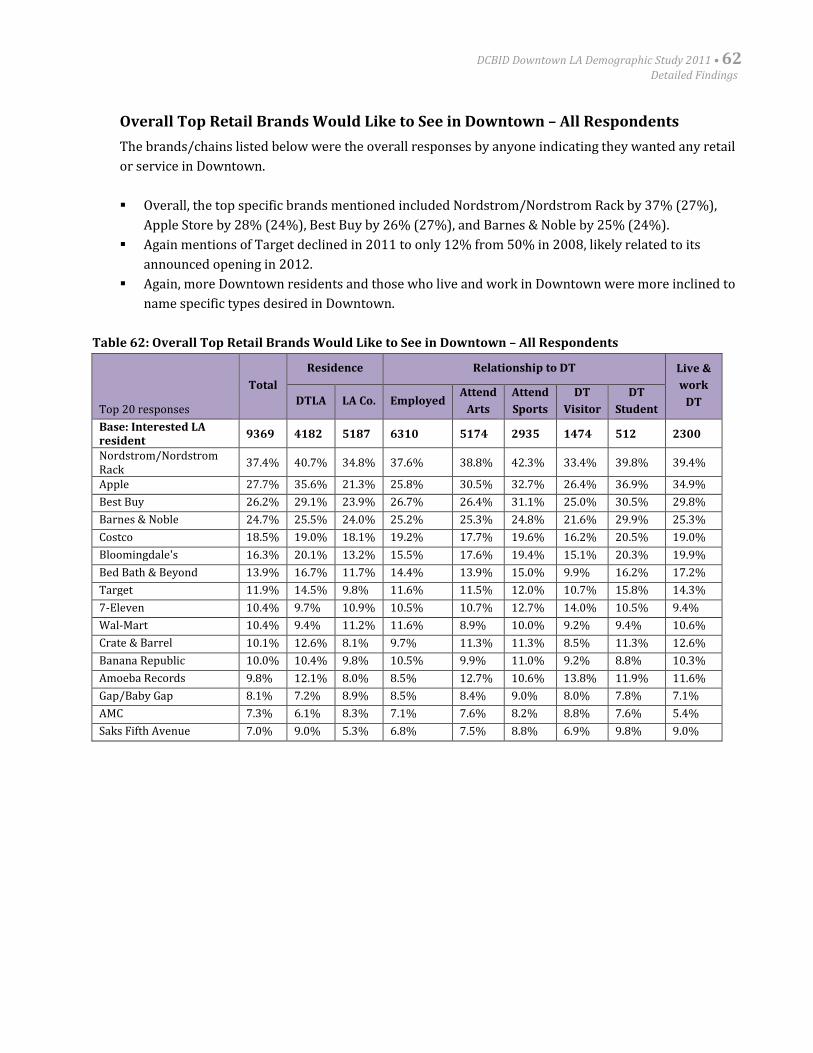
DCBID Downtown LA Demographic Study 2011 • 62Detailed Findings
Overall Top Retail Brands Would Like to See in Downtown – All Respondents
The brands/chains listed below were the overall responses by anyone indicating they wanted any retail
or service in Downtown.
Overall, the top specific brands mentioned included Nordstrom/Nordstrom Rack by 37% (27%),
Apple Store by 28% (24%), Best Buy by 26% (27%), and Barnes & Noble by 25% (24%).
Again mentions of Target declined in 2011 to only 12% from 50% in 2008, likely related to its
announced opening in 2012.
Again, more Downtown residents and those who live and work in Downtown were more inclined to
name specific types desired in Downtown.
Table 62: Overall Top Retail Brands Would Like to See in Downtown – All Respondents
Top 20 responses
Total
Residence Relationship to DT Live &
work
DTDTLA LA Co. EmployedAttend
Arts
Attend
Sports
DT
Visitor
DT
Student
Base: Interested LAresident
9369 4182 5187 6310 5174 2935 1474 512 2300
Nordstrom/NordstromRack
37.4% 40.7% 34.8% 37.6% 38.8% 42.3% 33.4% 39.8% 39.4%
Apple 27.7% 35.6% 21.3% 25.8% 30.5% 32.7% 26.4% 36.9% 34.9%
Best Buy 26.2% 29.1% 23.9% 26.7% 26.4% 31.1% 25.0% 30.5% 29.8%
Barnes & Noble 24.7% 25.5% 24.0% 25.2% 25.3% 24.8% 21.6% 29.9% 25.3%
Costco 18.5% 19.0% 18.1% 19.2% 17.7% 19.6% 16.2% 20.5% 19.0%
Bloomingdale's 16.3% 20.1% 13.2% 15.5% 17.6% 19.4% 15.1% 20.3% 19.9%
Bed Bath & Beyond 13.9% 16.7% 11.7% 14.4% 13.9% 15.0% 9.9% 16.2% 17.2%
Target 11.9% 14.5% 9.8% 11.6% 11.5% 12.0% 10.7% 15.8% 14.3%
7-Eleven 10.4% 9.7% 10.9% 10.5% 10.7% 12.7% 14.0% 10.5% 9.4%
Wal-Mart 10.4% 9.4% 11.2% 11.6% 8.9% 10.0% 9.2% 9.4% 10.6%
Crate & Barrel 10.1% 12.6% 8.1% 9.7% 11.3% 11.3% 8.5% 11.3% 12.6%
Banana Republic 10.0% 10.4% 9.8% 10.5% 9.9% 11.0% 9.2% 8.8% 10.3%
Amoeba Records 9.8% 12.1% 8.0% 8.5% 12.7% 10.6% 13.8% 11.9% 11.6%
Gap/Baby Gap 8.1% 7.2% 8.9% 8.5% 8.4% 9.0% 8.0% 7.8% 7.1%
AMC 7.3% 6.1% 8.3% 7.1% 7.6% 8.2% 8.8% 7.6% 5.4%
Saks Fifth Avenue 7.0% 9.0% 5.3% 6.8% 7.5% 8.8% 6.9% 9.8% 9.0%
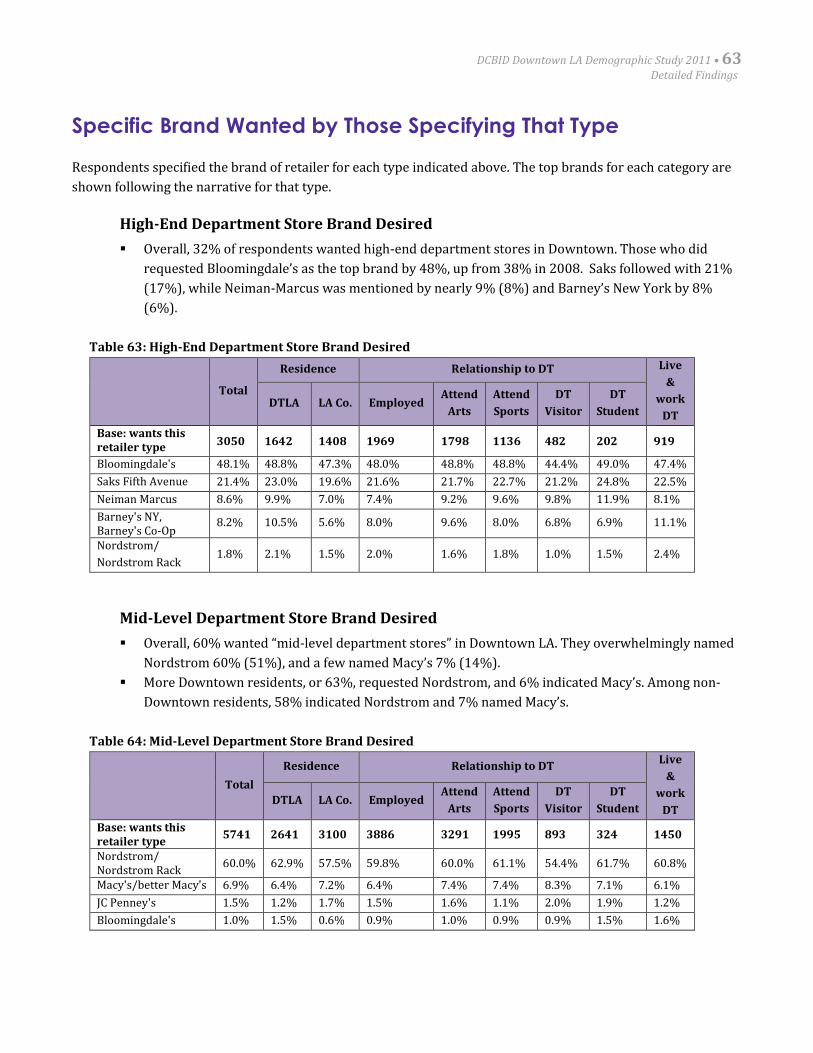
DCBID Downtown LA Demographic Study 2011 • 63Detailed Findings
Specific Brand Wanted by Those Specifying That Type
Respondents specified the brand of retailer for each type indicated above. The top brands for each category are
shown following the narrative for that type.
High-End Department Store Brand Desired
Overall, 32% of respondents wanted high-end department stores in Downtown. Those who did
requested Bloomingdale’s as the top brand by 48%, up from 38% in 2008. Saks followed with 21%
(17%), while Neiman-Marcus was mentioned by nearly 9% (8%) and Barney’s New York by 8%
(6%).
Table 63: High-End Department Store Brand Desired
Total
Residence Relationship to DT Live
&
work
DTDTLA LA Co. Employed
Attend
Arts
Attend
Sports
DT
Visitor
DT
Student
Base: wants thisretailer type
3050 1642 1408 1969 1798 1136 482 202 919
Bloomingdale's 48.1% 48.8% 47.3% 48.0% 48.8% 48.8% 44.4% 49.0% 47.4%
Saks Fifth Avenue 21.4% 23.0% 19.6% 21.6% 21.7% 22.7% 21.2% 24.8% 22.5%
Neiman Marcus 8.6% 9.9% 7.0% 7.4% 9.2% 9.6% 9.8% 11.9% 8.1%
Barney's NY,Barney's Co-Op
8.2% 10.5% 5.6% 8.0% 9.6% 8.0% 6.8% 6.9% 11.1%
Nordstrom/
Nordstrom Rack1.8% 2.1% 1.5% 2.0% 1.6% 1.8% 1.0% 1.5% 2.4%
Mid-Level Department Store Brand Desired
Overall, 60% wanted “mid-level department stores” in Downtown LA. They overwhelmingly named
Nordstrom 60% (51%), and a few named Macy’s 7% (14%).
More Downtown residents, or 63%, requested Nordstrom, and 6% indicated Macy’s. Among non-
Downtown residents, 58% indicated Nordstrom and 7% named Macy’s.
Table 64: Mid-Level Department Store Brand Desired
Total
Residence Relationship to DTLive
&
work
DTDTLA LA Co. Employed
Attend
Arts
Attend
Sports
DT
Visitor
DT
Student
Base: wants thisretailer type
5741 2641 3100 3886 3291 1995 893 324 1450
Nordstrom/Nordstrom Rack
60.0% 62.9% 57.5% 59.8% 60.0% 61.1% 54.4% 61.7% 60.8%
Macy's/better Macy's 6.9% 6.4% 7.2% 6.4% 7.4% 7.4% 8.3% 7.1% 6.1%
JC Penney's 1.5% 1.2% 1.7% 1.5% 1.6% 1.1% 2.0% 1.9% 1.2%
Bloomingdale's 1.0% 1.5% 0.6% 0.9% 1.0% 0.9% 0.9% 1.5% 1.6%
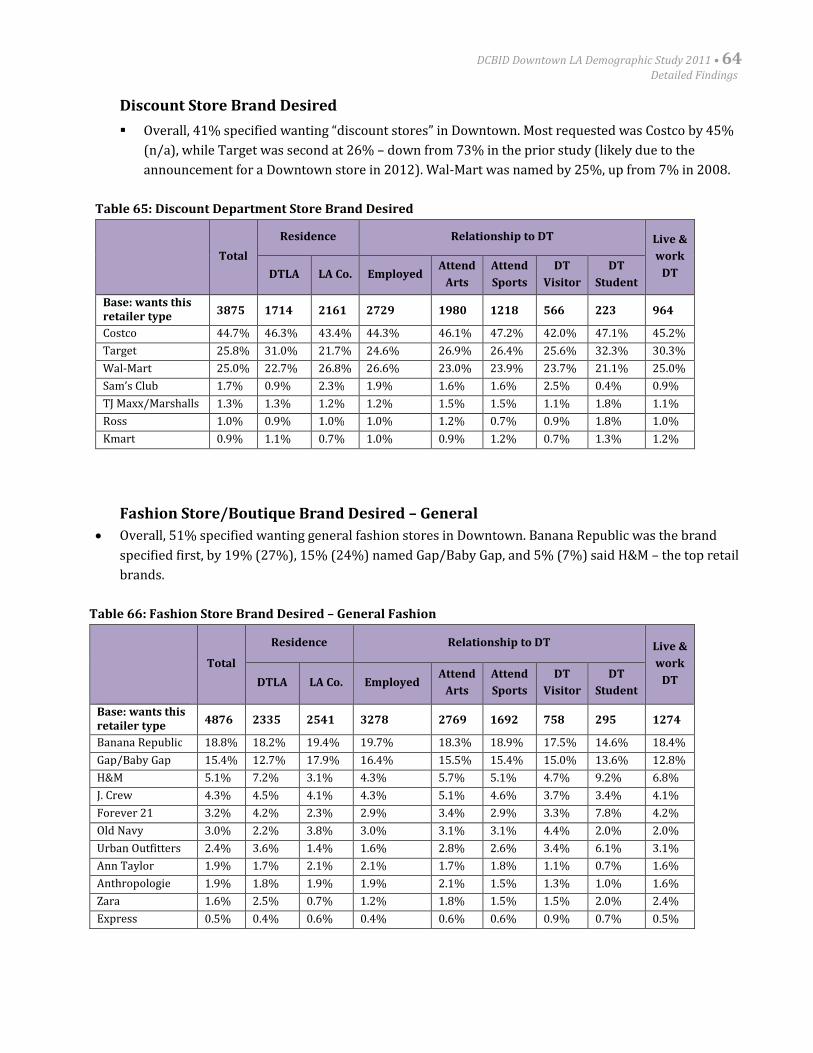
DCBID Downtown LA Demographic Study 2011 • 64Detailed Findings
Discount Store Brand Desired
Overall, 41% specified wanting “discount stores” in Downtown. Most requested was Costco by 45%
(n/a), while Target was second at 26% – down from 73% in the prior study (likely due to the
announcement for a Downtown store in 2012). Wal-Mart was named by 25%, up from 7% in 2008.
Table 65: Discount Department Store Brand Desired
Total
Residence Relationship to DT Live &
work
DTDTLA LA Co. EmployedAttend
Arts
Attend
Sports
DT
Visitor
DT
Student
Base: wants thisretailer type
3875 1714 2161 2729 1980 1218 566 223 964
Costco 44.7% 46.3% 43.4% 44.3% 46.1% 47.2% 42.0% 47.1% 45.2%
Target 25.8% 31.0% 21.7% 24.6% 26.9% 26.4% 25.6% 32.3% 30.3%
Wal-Mart 25.0% 22.7% 26.8% 26.6% 23.0% 23.9% 23.7% 21.1% 25.0%
Sam’s Club 1.7% 0.9% 2.3% 1.9% 1.6% 1.6% 2.5% 0.4% 0.9%
TJ Maxx/Marshalls 1.3% 1.3% 1.2% 1.2% 1.5% 1.5% 1.1% 1.8% 1.1%
Ross 1.0% 0.9% 1.0% 1.0% 1.2% 0.7% 0.9% 1.8% 1.0%
Kmart 0.9% 1.1% 0.7% 1.0% 0.9% 1.2% 0.7% 1.3% 1.2%
Fashion Store/Boutique Brand Desired – General
Overall, 51% specified wanting general fashion stores in Downtown. Banana Republic was the brand
specified first, by 19% (27%), 15% (24%) named Gap/Baby Gap, and 5% (7%) said H&M – the top retail
brands.
Table 66: Fashion Store Brand Desired – General Fashion
Total
Residence Relationship to DT Live &
work
DTDTLA LA Co. EmployedAttend
Arts
Attend
Sports
DT
Visitor
DT
Student
Base: wants thisretailer type
4876 2335 2541 3278 2769 1692 758 295 1274
Banana Republic 18.8% 18.2% 19.4% 19.7% 18.3% 18.9% 17.5% 14.6% 18.4%
Gap/Baby Gap 15.4% 12.7% 17.9% 16.4% 15.5% 15.4% 15.0% 13.6% 12.8%
H&M 5.1% 7.2% 3.1% 4.3% 5.7% 5.1% 4.7% 9.2% 6.8%
J. Crew 4.3% 4.5% 4.1% 4.3% 5.1% 4.6% 3.7% 3.4% 4.1%
Forever 21 3.2% 4.2% 2.3% 2.9% 3.4% 2.9% 3.3% 7.8% 4.2%
Old Navy 3.0% 2.2% 3.8% 3.0% 3.1% 3.1% 4.4% 2.0% 2.0%
Urban Outfitters 2.4% 3.6% 1.4% 1.6% 2.8% 2.6% 3.4% 6.1% 3.1%
Ann Taylor 1.9% 1.7% 2.1% 2.1% 1.7% 1.8% 1.1% 0.7% 1.6%
Anthropologie 1.9% 1.8% 1.9% 1.9% 2.1% 1.5% 1.3% 1.0% 1.6%
Zara 1.6% 2.5% 0.7% 1.2% 1.8% 1.5% 1.5% 2.0% 2.4%
Express 0.5% 0.4% 0.6% 0.4% 0.6% 0.6% 0.9% 0.7% 0.5%
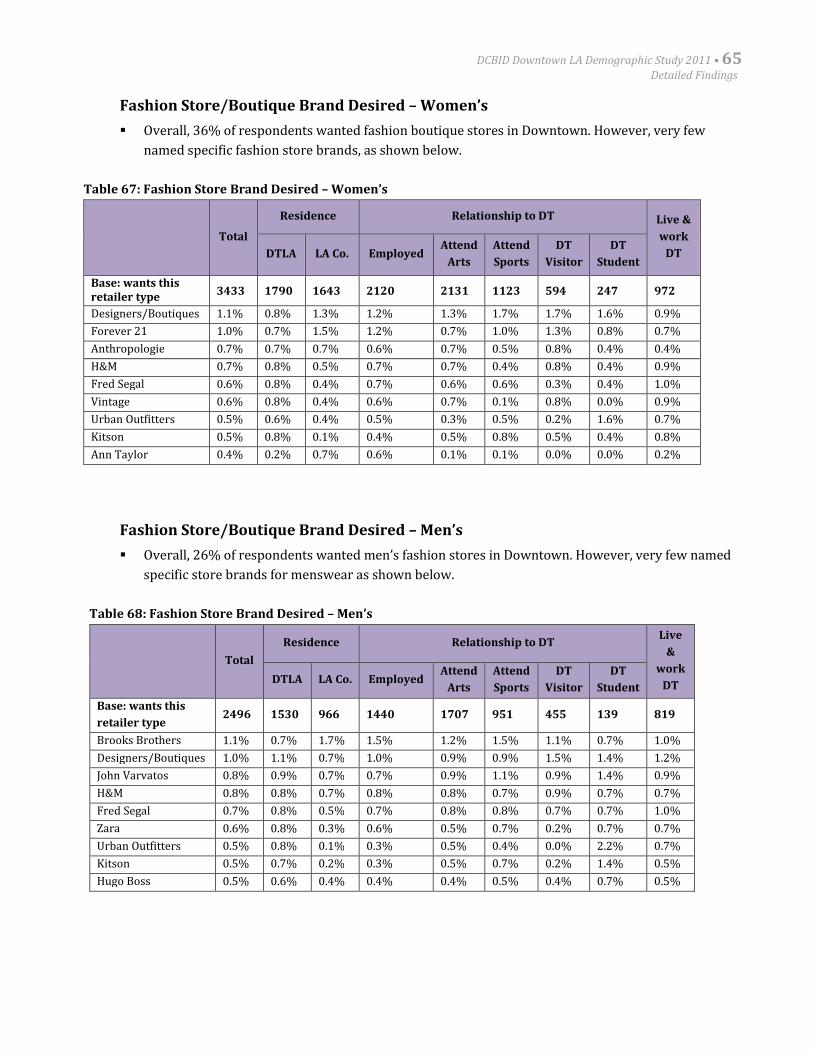
DCBID Downtown LA Demographic Study 2011 • 65Detailed Findings
Fashion Store/Boutique Brand Desired – Women’s
Overall, 36% of respondents wanted fashion boutique stores in Downtown. However, very few
named specific fashion store brands, as shown below.
Table 67: Fashion Store Brand Desired – Women’s
Total
Residence Relationship to DT Live &
work
DTDTLA LA Co. EmployedAttend
Arts
Attend
Sports
DT
Visitor
DT
Student
Base: wants thisretailer type
3433 1790 1643 2120 2131 1123 594 247 972
Designers/Boutiques 1.1% 0.8% 1.3% 1.2% 1.3% 1.7% 1.7% 1.6% 0.9%
Forever 21 1.0% 0.7% 1.5% 1.2% 0.7% 1.0% 1.3% 0.8% 0.7%
Anthropologie 0.7% 0.7% 0.7% 0.6% 0.7% 0.5% 0.8% 0.4% 0.4%
H&M 0.7% 0.8% 0.5% 0.7% 0.7% 0.4% 0.8% 0.4% 0.9%
Fred Segal 0.6% 0.8% 0.4% 0.7% 0.6% 0.6% 0.3% 0.4% 1.0%
Vintage 0.6% 0.8% 0.4% 0.6% 0.7% 0.1% 0.8% 0.0% 0.9%
Urban Outfitters 0.5% 0.6% 0.4% 0.5% 0.3% 0.5% 0.2% 1.6% 0.7%
Kitson 0.5% 0.8% 0.1% 0.4% 0.5% 0.8% 0.5% 0.4% 0.8%
Ann Taylor 0.4% 0.2% 0.7% 0.6% 0.1% 0.1% 0.0% 0.0% 0.2%
Fashion Store/Boutique Brand Desired – Men’s
Overall, 26% of respondents wanted men’s fashion stores in Downtown. However, very few named
specific store brands for menswear as shown below.
Table 68: Fashion Store Brand Desired – Men’s
Total
Residence Relationship to DTLive
&
work
DTDTLA LA Co. Employed
Attend
Arts
Attend
Sports
DT
Visitor
DT
Student
Base: wants this
retailer type2496 1530 966 1440 1707 951 455 139 819
Brooks Brothers 1.1% 0.7% 1.7% 1.5% 1.2% 1.5% 1.1% 0.7% 1.0%
Designers/Boutiques 1.0% 1.1% 0.7% 1.0% 0.9% 0.9% 1.5% 1.4% 1.2%
John Varvatos 0.8% 0.9% 0.7% 0.7% 0.9% 1.1% 0.9% 1.4% 0.9%
H&M 0.8% 0.8% 0.7% 0.8% 0.8% 0.7% 0.9% 0.7% 0.7%
Fred Segal 0.7% 0.8% 0.5% 0.7% 0.8% 0.8% 0.7% 0.7% 1.0%
Zara 0.6% 0.8% 0.3% 0.6% 0.5% 0.7% 0.2% 0.7% 0.7%
Urban Outfitters 0.5% 0.8% 0.1% 0.3% 0.5% 0.4% 0.0% 2.2% 0.7%
Kitson 0.5% 0.7% 0.2% 0.3% 0.5% 0.7% 0.2% 1.4% 0.5%
Hugo Boss 0.5% 0.6% 0.4% 0.4% 0.4% 0.5% 0.4% 0.7% 0.5%
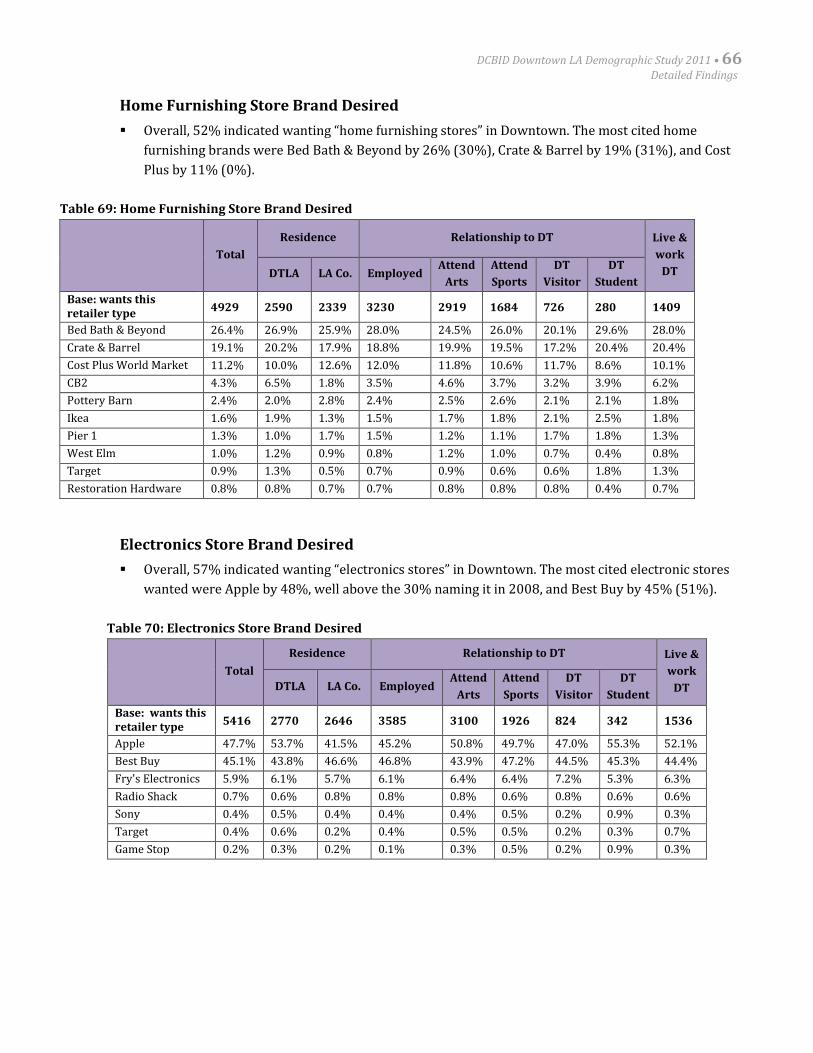
DCBID Downtown LA Demographic Study 2011 • 66Detailed Findings
Home Furnishing Store Brand Desired
Overall, 52% indicated wanting “home furnishing stores” in Downtown. The most cited home
furnishing brands were Bed Bath & Beyond by 26% (30%), Crate & Barrel by 19% (31%), and Cost
Plus by 11% (0%).
Table 69: Home Furnishing Store Brand Desired
Total
Residence Relationship to DT Live &
work
DTDTLA LA Co. EmployedAttend
Arts
Attend
Sports
DT
Visitor
DT
Student
Base: wants thisretailer type
4929 2590 2339 3230 2919 1684 726 280 1409
Bed Bath & Beyond 26.4% 26.9% 25.9% 28.0% 24.5% 26.0% 20.1% 29.6% 28.0%
Crate & Barrel 19.1% 20.2% 17.9% 18.8% 19.9% 19.5% 17.2% 20.4% 20.4%
Cost Plus World Market 11.2% 10.0% 12.6% 12.0% 11.8% 10.6% 11.7% 8.6% 10.1%
CB2 4.3% 6.5% 1.8% 3.5% 4.6% 3.7% 3.2% 3.9% 6.2%
Pottery Barn 2.4% 2.0% 2.8% 2.4% 2.5% 2.6% 2.1% 2.1% 1.8%
Ikea 1.6% 1.9% 1.3% 1.5% 1.7% 1.8% 2.1% 2.5% 1.8%
Pier 1 1.3% 1.0% 1.7% 1.5% 1.2% 1.1% 1.7% 1.8% 1.3%
West Elm 1.0% 1.2% 0.9% 0.8% 1.2% 1.0% 0.7% 0.4% 0.8%
Target 0.9% 1.3% 0.5% 0.7% 0.9% 0.6% 0.6% 1.8% 1.3%
Restoration Hardware 0.8% 0.8% 0.7% 0.7% 0.8% 0.8% 0.8% 0.4% 0.7%
Electronics Store Brand Desired
Overall, 57% indicated wanting “electronics stores” in Downtown. The most cited electronic stores
wanted were Apple by 48%, well above the 30% naming it in 2008, and Best Buy by 45% (51%).
Table 70: Electronics Store Brand Desired
Total
Residence Relationship to DT Live &
work
DTDTLA LA Co. EmployedAttend
Arts
Attend
Sports
DT
Visitor
DT
Student
Base: wants thisretailer type
5416 2770 2646 3585 3100 1926 824 342 1536
Apple 47.7% 53.7% 41.5% 45.2% 50.8% 49.7% 47.0% 55.3% 52.1%
Best Buy 45.1% 43.8% 46.6% 46.8% 43.9% 47.2% 44.5% 45.3% 44.4%
Fry's Electronics 5.9% 6.1% 5.7% 6.1% 6.4% 6.4% 7.2% 5.3% 6.3%
Radio Shack 0.7% 0.6% 0.8% 0.8% 0.8% 0.6% 0.8% 0.6% 0.6%
Sony 0.4% 0.5% 0.4% 0.4% 0.4% 0.5% 0.2% 0.9% 0.3%
Target 0.4% 0.6% 0.2% 0.4% 0.5% 0.5% 0.2% 0.3% 0.7%
Game Stop 0.2% 0.3% 0.2% 0.1% 0.3% 0.5% 0.2% 0.9% 0.3%
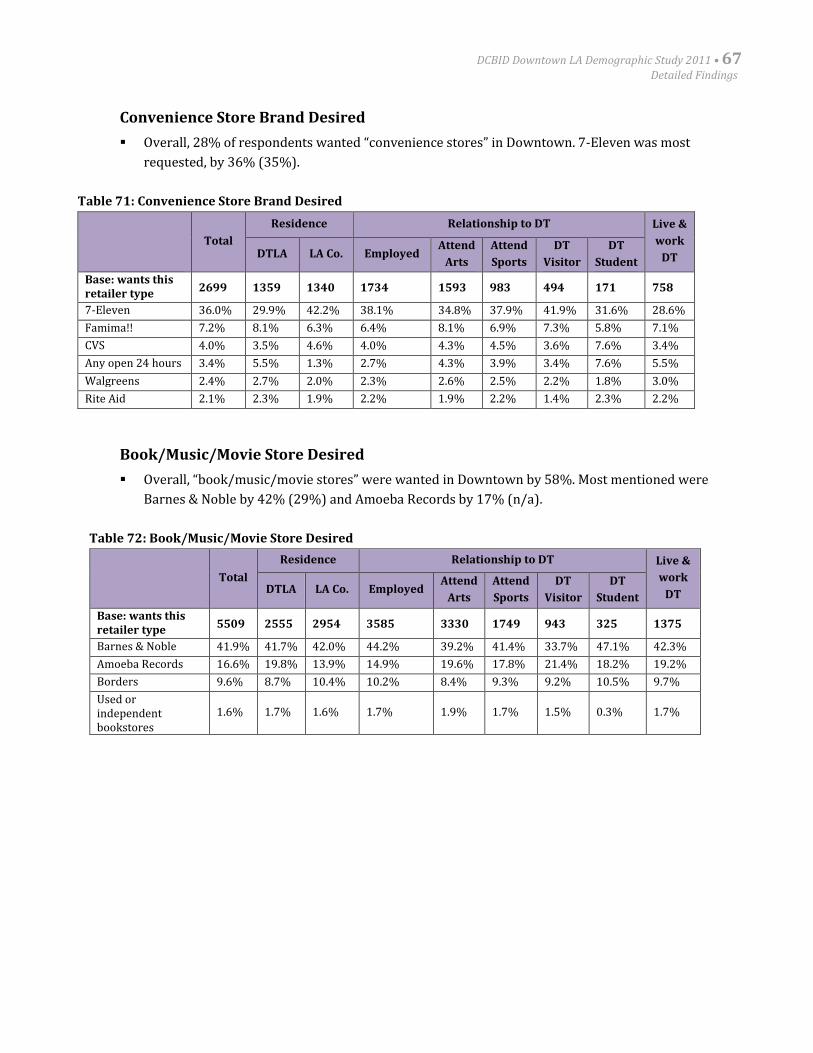
DCBID Downtown LA Demographic Study 2011 • 67Detailed Findings
Convenience Store Brand Desired
Overall, 28% of respondents wanted “convenience stores” in Downtown. 7-Eleven was most
requested, by 36% (35%).
Table 71: Convenience Store Brand Desired
Total
Residence Relationship to DT Live &
work
DTDTLA LA Co. EmployedAttend
Arts
Attend
Sports
DT
Visitor
DT
Student
Base: wants thisretailer type
2699 1359 1340 1734 1593 983 494 171 758
7-Eleven 36.0% 29.9% 42.2% 38.1% 34.8% 37.9% 41.9% 31.6% 28.6%
Famima!! 7.2% 8.1% 6.3% 6.4% 8.1% 6.9% 7.3% 5.8% 7.1%
CVS 4.0% 3.5% 4.6% 4.0% 4.3% 4.5% 3.6% 7.6% 3.4%
Any open 24 hours 3.4% 5.5% 1.3% 2.7% 4.3% 3.9% 3.4% 7.6% 5.5%
Walgreens 2.4% 2.7% 2.0% 2.3% 2.6% 2.5% 2.2% 1.8% 3.0%
Rite Aid 2.1% 2.3% 1.9% 2.2% 1.9% 2.2% 1.4% 2.3% 2.2%
Book/Music/Movie Store Desired
Overall, “book/music/movie stores” were wanted in Downtown by 58%. Most mentioned were
Barnes & Noble by 42% (29%) and Amoeba Records by 17% (n/a).
Table 72: Book/Music/Movie Store Desired
Total
Residence Relationship to DT Live &
work
DTDTLA LA Co. EmployedAttend
Arts
Attend
Sports
DT
Visitor
DT
Student
Base: wants thisretailer type
5509 2555 2954 3585 3330 1749 943 325 1375
Barnes & Noble 41.9% 41.7% 42.0% 44.2% 39.2% 41.4% 33.7% 47.1% 42.3%
Amoeba Records 16.6% 19.8% 13.9% 14.9% 19.6% 17.8% 21.4% 18.2% 19.2%
Borders 9.6% 8.7% 10.4% 10.2% 8.4% 9.3% 9.2% 10.5% 9.7%
Used orindependentbookstores
1.6% 1.7% 1.6% 1.7% 1.9% 1.7% 1.5% 0.3% 1.7%
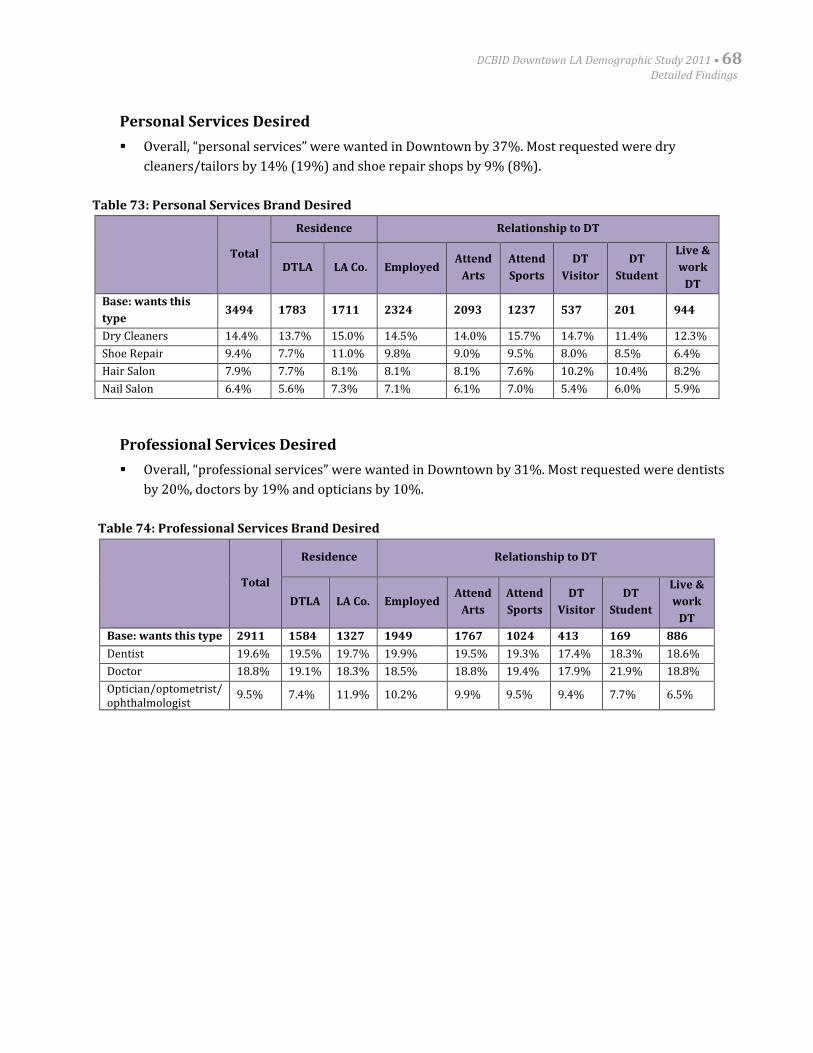
DCBID Downtown LA Demographic Study 2011 • 68Detailed Findings
Personal Services Desired
Overall, “personal services” were wanted in Downtown by 37%. Most requested were dry
cleaners/tailors by 14% (19%) and shoe repair shops by 9% (8%).
Table 73: Personal Services Brand Desired
Total
Residence Relationship to DT
DTLA LA Co. EmployedAttend
Arts
Attend
Sports
DT
Visitor
DT
Student
Live &
work
DT
Base: wants this
type3494 1783 1711 2324 2093 1237 537 201 944
Dry Cleaners 14.4% 13.7% 15.0% 14.5% 14.0% 15.7% 14.7% 11.4% 12.3%
Shoe Repair 9.4% 7.7% 11.0% 9.8% 9.0% 9.5% 8.0% 8.5% 6.4%
Hair Salon 7.9% 7.7% 8.1% 8.1% 8.1% 7.6% 10.2% 10.4% 8.2%
Nail Salon 6.4% 5.6% 7.3% 7.1% 6.1% 7.0% 5.4% 6.0% 5.9%
Professional Services Desired
Overall, “professional services” were wanted in Downtown by 31%. Most requested were dentists
by 20%, doctors by 19% and opticians by 10%.
Table 74: Professional Services Brand Desired
Total
Residence Relationship to DT
DTLA LA Co. EmployedAttend
Arts
Attend
Sports
DT
Visitor
DT
Student
Live &
work
DT
Base: wants this type 2911 1584 1327 1949 1767 1024 413 169 886
Dentist 19.6% 19.5% 19.7% 19.9% 19.5% 19.3% 17.4% 18.3% 18.6%
Doctor 18.8% 19.1% 18.3% 18.5% 18.8% 19.4% 17.9% 21.9% 18.8%
Optician/optometrist/ophthalmologist
9.5% 7.4% 11.9% 10.2% 9.9% 9.5% 9.4% 7.7% 6.5%
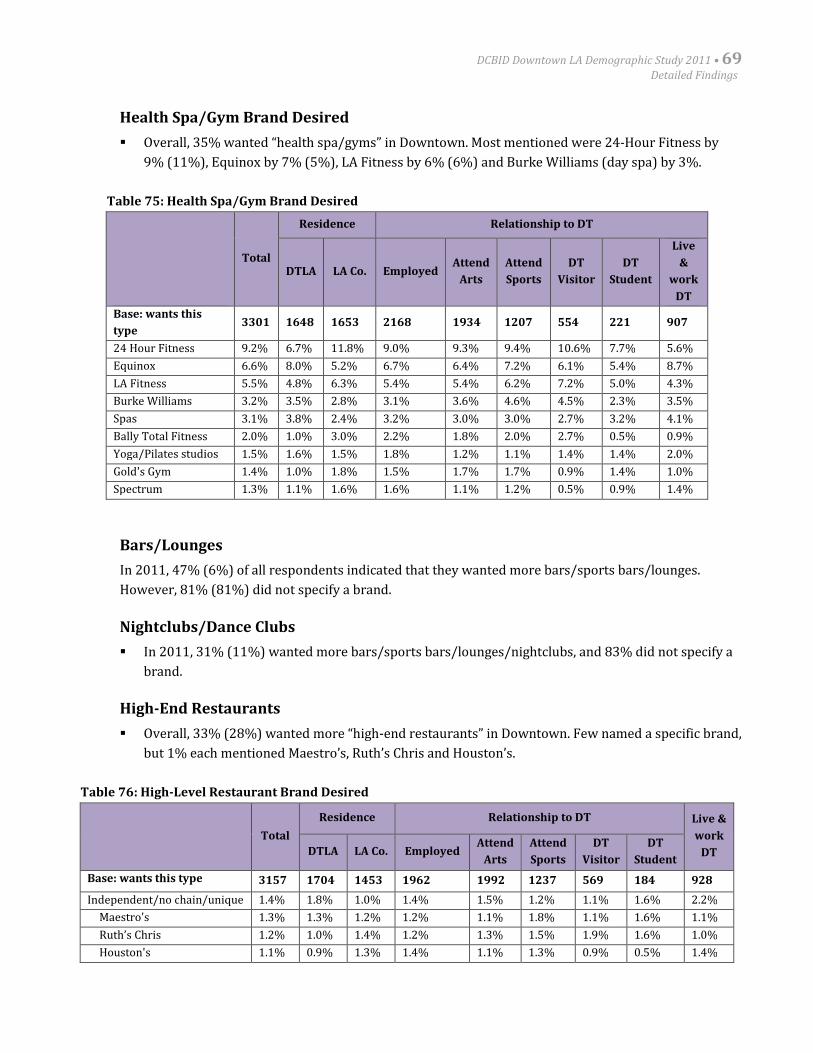
DCBID Downtown LA Demographic Study 2011 • 69Detailed Findings
Health Spa/Gym Brand Desired
Overall, 35% wanted “health spa/gyms” in Downtown. Most mentioned were 24-Hour Fitness by
9% (11%), Equinox by 7% (5%), LA Fitness by 6% (6%) and Burke Williams (day spa) by 3%.
Table 75: Health Spa/Gym Brand Desired
Total
Residence Relationship to DT
DTLA LA Co. EmployedAttend
Arts
Attend
Sports
DT
Visitor
DT
Student
Live
&
work
DT
Base: wants this
type3301 1648 1653 2168 1934 1207 554 221 907
24 Hour Fitness 9.2% 6.7% 11.8% 9.0% 9.3% 9.4% 10.6% 7.7% 5.6%
Equinox 6.6% 8.0% 5.2% 6.7% 6.4% 7.2% 6.1% 5.4% 8.7%
LA Fitness 5.5% 4.8% 6.3% 5.4% 5.4% 6.2% 7.2% 5.0% 4.3%
Burke Williams 3.2% 3.5% 2.8% 3.1% 3.6% 4.6% 4.5% 2.3% 3.5%
Spas 3.1% 3.8% 2.4% 3.2% 3.0% 3.0% 2.7% 3.2% 4.1%
Bally Total Fitness 2.0% 1.0% 3.0% 2.2% 1.8% 2.0% 2.7% 0.5% 0.9%
Yoga/Pilates studios 1.5% 1.6% 1.5% 1.8% 1.2% 1.1% 1.4% 1.4% 2.0%
Gold's Gym 1.4% 1.0% 1.8% 1.5% 1.7% 1.7% 0.9% 1.4% 1.0%
Spectrum 1.3% 1.1% 1.6% 1.6% 1.1% 1.2% 0.5% 0.9% 1.4%
Bars/Lounges
In 2011, 47% (6%) of all respondents indicated that they wanted more bars/sports bars/lounges.
However, 81% (81%) did not specify a brand.
Nightclubs/Dance Clubs
In 2011, 31% (11%) wanted more bars/sports bars/lounges/nightclubs, and 83% did not specify a
brand.
High-End Restaurants
Overall, 33% (28%) wanted more “high-end restaurants” in Downtown. Few named a specific brand,
but 1% each mentioned Maestro’s, Ruth’s Chris and Houston’s.
Table 76: High-Level Restaurant Brand Desired
Total
Residence Relationship to DT Live &
work
DTDTLA LA Co. EmployedAttend
Arts
Attend
Sports
DT
Visitor
DT
Student
Base: wants this type 3157 1704 1453 1962 1992 1237 569 184 928
Independent/no chain/unique 1.4% 1.8% 1.0% 1.4% 1.5% 1.2% 1.1% 1.6% 2.2%
Maestro's 1.3% 1.3% 1.2% 1.2% 1.1% 1.8% 1.1% 1.6% 1.1%
Ruth’s Chris 1.2% 1.0% 1.4% 1.2% 1.3% 1.5% 1.9% 1.6% 1.0%
Houston's 1.1% 0.9% 1.3% 1.4% 1.1% 1.3% 0.9% 0.5% 1.4%
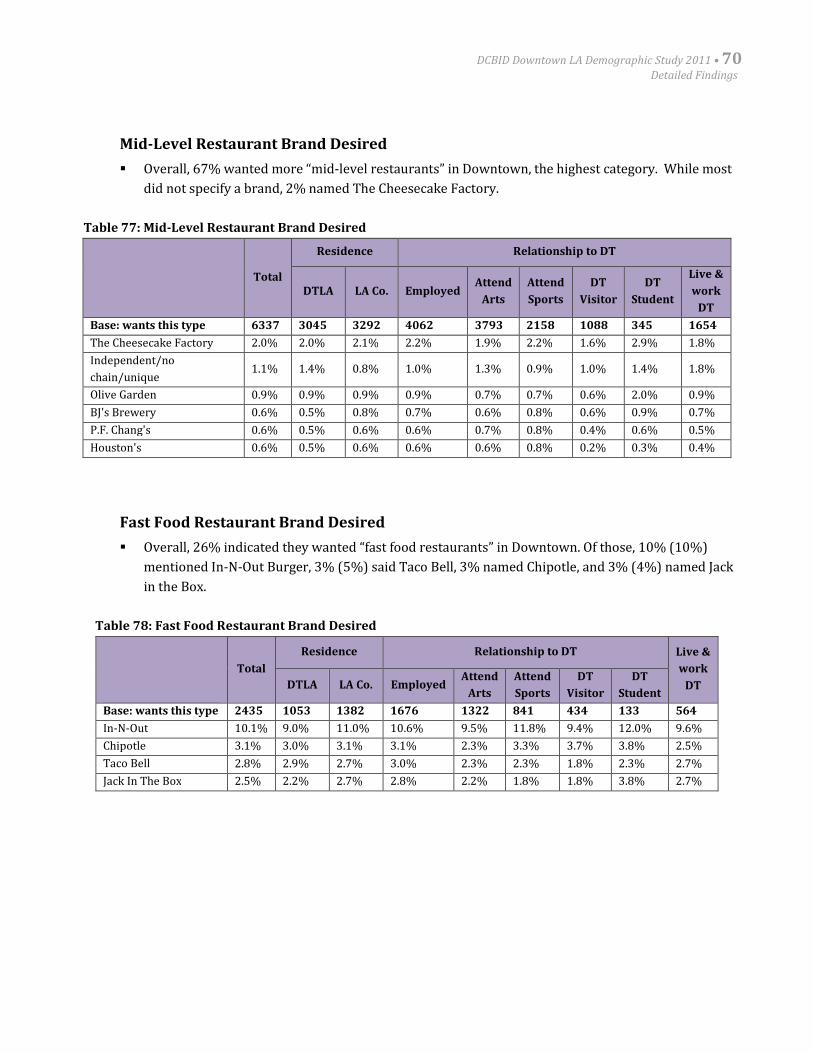
DCBID Downtown LA Demographic Study 2011 • 70Detailed Findings
Mid-Level Restaurant Brand Desired
Overall, 67% wanted more “mid-level restaurants” in Downtown, the highest category. While most
did not specify a brand, 2% named The Cheesecake Factory.
Table 77: Mid-Level Restaurant Brand Desired
Total
Residence Relationship to DT
DTLA LA Co. EmployedAttend
Arts
Attend
Sports
DT
Visitor
DT
Student
Live &
work
DT
Base: wants this type 6337 3045 3292 4062 3793 2158 1088 345 1654
The Cheesecake Factory 2.0% 2.0% 2.1% 2.2% 1.9% 2.2% 1.6% 2.9% 1.8%
Independent/no
chain/unique1.1% 1.4% 0.8% 1.0% 1.3% 0.9% 1.0% 1.4% 1.8%
Olive Garden 0.9% 0.9% 0.9% 0.9% 0.7% 0.7% 0.6% 2.0% 0.9%
BJ's Brewery 0.6% 0.5% 0.8% 0.7% 0.6% 0.8% 0.6% 0.9% 0.7%
P.F. Chang's 0.6% 0.5% 0.6% 0.6% 0.7% 0.8% 0.4% 0.6% 0.5%
Houston's 0.6% 0.5% 0.6% 0.6% 0.6% 0.8% 0.2% 0.3% 0.4%
Fast Food Restaurant Brand Desired
Overall, 26% indicated they wanted “fast food restaurants” in Downtown. Of those, 10% (10%)
mentioned In-N-Out Burger, 3% (5%) said Taco Bell, 3% named Chipotle, and 3% (4%) named Jack
in the Box.
Table 78: Fast Food Restaurant Brand Desired
Total
Residence Relationship to DT Live &
work
DTDTLA LA Co. EmployedAttend
Arts
Attend
Sports
DT
Visitor
DT
Student
Base: wants this type 2435 1053 1382 1676 1322 841 434 133 564
In-N-Out 10.1% 9.0% 11.0% 10.6% 9.5% 11.8% 9.4% 12.0% 9.6%
Chipotle 3.1% 3.0% 3.1% 3.1% 2.3% 3.3% 3.7% 3.8% 2.5%
Taco Bell 2.8% 2.9% 2.7% 3.0% 2.3% 2.3% 1.8% 2.3% 2.7%
Jack In The Box 2.5% 2.2% 2.7% 2.8% 2.2% 1.8% 1.8% 3.8% 2.7%
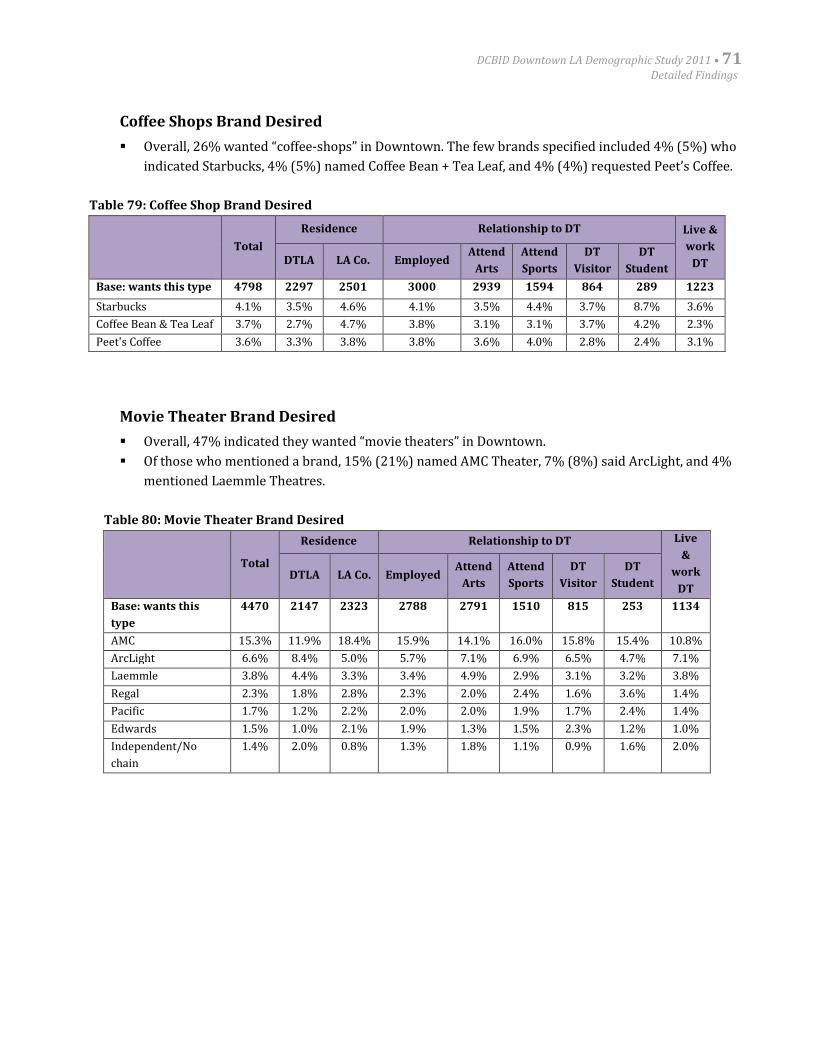
DCBID Downtown LA Demographic Study 2011 • 71Detailed Findings
Coffee Shops Brand Desired
Overall, 26% wanted “coffee-shops” in Downtown. The few brands specified included 4% (5%) who
indicated Starbucks, 4% (5%) named Coffee Bean + Tea Leaf, and 4% (4%) requested Peet’s Coffee.
Table 79: Coffee Shop Brand Desired
Total
Residence Relationship to DT Live &
work
DTDTLA LA Co. EmployedAttend
Arts
Attend
Sports
DT
Visitor
DT
Student
Base: wants this type 4798 2297 2501 3000 2939 1594 864 289 1223
Starbucks 4.1% 3.5% 4.6% 4.1% 3.5% 4.4% 3.7% 8.7% 3.6%
Coffee Bean & Tea Leaf 3.7% 2.7% 4.7% 3.8% 3.1% 3.1% 3.7% 4.2% 2.3%
Peet's Coffee 3.6% 3.3% 3.8% 3.8% 3.6% 4.0% 2.8% 2.4% 3.1%
Movie Theater Brand Desired
Overall, 47% indicated they wanted “movie theaters” in Downtown.
Of those who mentioned a brand, 15% (21%) named AMC Theater, 7% (8%) said ArcLight, and 4%
mentioned Laemmle Theatres.
Table 80: Movie Theater Brand Desired
Total
Residence Relationship to DT Live
&
work
DTDTLA LA Co. Employed
Attend
Arts
Attend
Sports
DT
Visitor
DT
Student
Base: wants this
type
4470 2147 2323 2788 2791 1510 815 253 1134
AMC 15.3% 11.9% 18.4% 15.9% 14.1% 16.0% 15.8% 15.4% 10.8%
ArcLight 6.6% 8.4% 5.0% 5.7% 7.1% 6.9% 6.5% 4.7% 7.1%
Laemmle 3.8% 4.4% 3.3% 3.4% 4.9% 2.9% 3.1% 3.2% 3.8%
Regal 2.3% 1.8% 2.8% 2.3% 2.0% 2.4% 1.6% 3.6% 1.4%
Pacific 1.7% 1.2% 2.2% 2.0% 2.0% 1.9% 1.7% 2.4% 1.4%
Edwards 1.5% 1.0% 2.1% 1.9% 1.3% 1.5% 2.3% 1.2% 1.0%
Independent/No
chain
1.4% 2.0% 0.8% 1.3% 1.8% 1.1% 0.9% 1.6% 2.0%
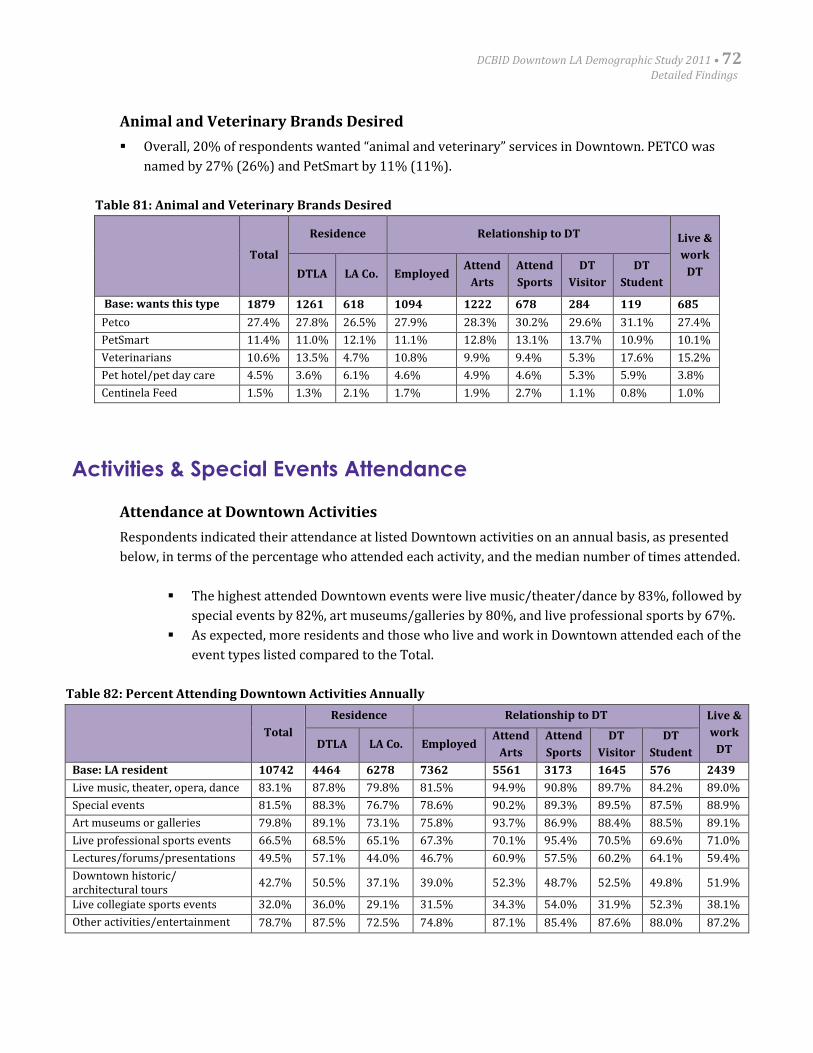
DCBID Downtown LA Demographic Study 2011 • 72Detailed Findings
Animal and Veterinary Brands Desired
Overall, 20% of respondents wanted “animal and veterinary” services in Downtown. PETCO was
named by 27% (26%) and PetSmart by 11% (11%).
Table 81: Animal and Veterinary Brands Desired
Total
Residence Relationship to DT Live &
work
DTDTLA LA Co. EmployedAttend
Arts
Attend
Sports
DT
Visitor
DT
Student
Base: wants this type 1879 1261 618 1094 1222 678 284 119 685
Petco 27.4% 27.8% 26.5% 27.9% 28.3% 30.2% 29.6% 31.1% 27.4%
PetSmart 11.4% 11.0% 12.1% 11.1% 12.8% 13.1% 13.7% 10.9% 10.1%
Veterinarians 10.6% 13.5% 4.7% 10.8% 9.9% 9.4% 5.3% 17.6% 15.2%
Pet hotel/pet day care 4.5% 3.6% 6.1% 4.6% 4.9% 4.6% 5.3% 5.9% 3.8%
Centinela Feed 1.5% 1.3% 2.1% 1.7% 1.9% 2.7% 1.1% 0.8% 1.0%
Activities & Special Events Attendance
Attendance at Downtown Activities
Respondents indicated their attendance at listed Downtown activities on an annual basis, as presented
below, in terms of the percentage who attended each activity, and the median number of times attended.
The highest attended Downtown events were live music/theater/dance by 83%, followed by
special events by 82%, art museums/galleries by 80%, and live professional sports by 67%.
As expected, more residents and those who live and work in Downtown attended each of the
event types listed compared to the Total.
Table 82: Percent Attending Downtown Activities Annually
Total
Residence Relationship to DT Live &
work
DTDTLA LA Co. EmployedAttend
Arts
Attend
Sports
DT
Visitor
DT
Student
Base: LA resident 10742 4464 6278 7362 5561 3173 1645 576 2439
Live music, theater, opera, dance 83.1% 87.8% 79.8% 81.5% 94.9% 90.8% 89.7% 84.2% 89.0%
Special events 81.5% 88.3% 76.7% 78.6% 90.2% 89.3% 89.5% 87.5% 88.9%
Art museums or galleries 79.8% 89.1% 73.1% 75.8% 93.7% 86.9% 88.4% 88.5% 89.1%
Live professional sports events 66.5% 68.5% 65.1% 67.3% 70.1% 95.4% 70.5% 69.6% 71.0%
Lectures/forums/presentations 49.5% 57.1% 44.0% 46.7% 60.9% 57.5% 60.2% 64.1% 59.4%
Downtown historic/architectural tours
42.7% 50.5% 37.1% 39.0% 52.3% 48.7% 52.5% 49.8% 51.9%
Live collegiate sports events 32.0% 36.0% 29.1% 31.5% 34.3% 54.0% 31.9% 52.3% 38.1%
Other activities/entertainment 78.7% 87.5% 72.5% 74.8% 87.1% 85.4% 87.6% 88.0% 87.2%
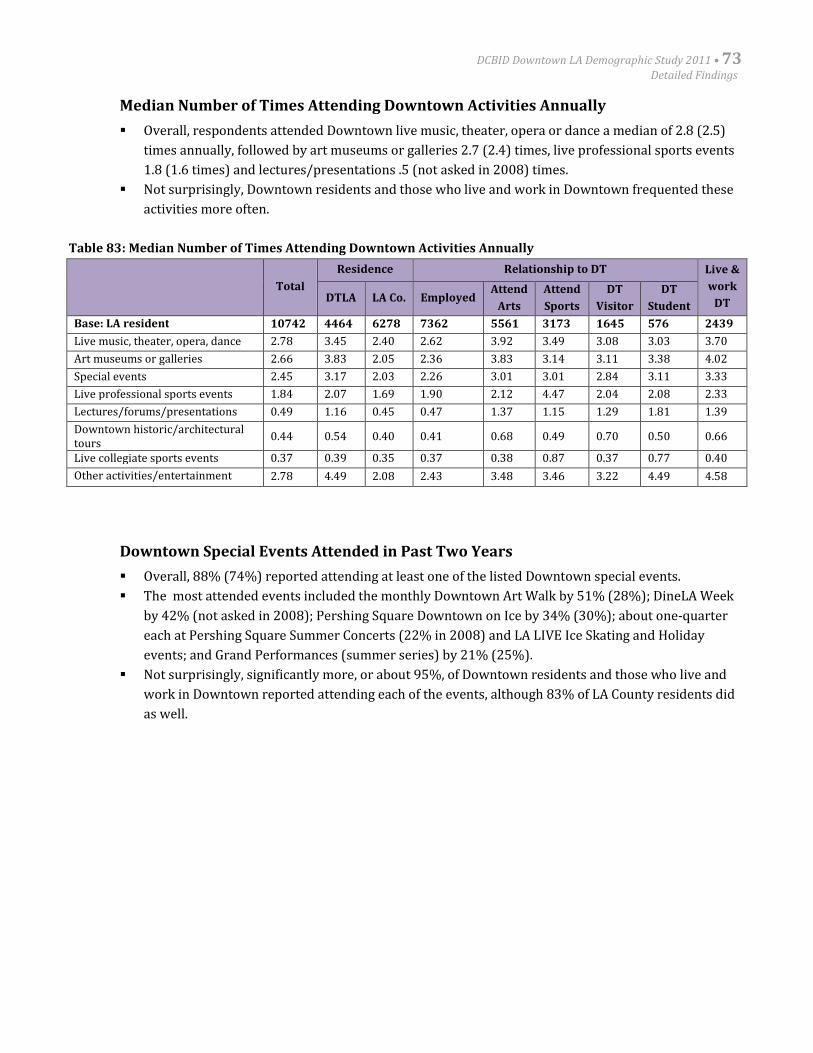
DCBID Downtown LA Demographic Study 2011 • 73Detailed Findings
Median Number of Times Attending Downtown Activities Annually
Overall, respondents attended Downtown live music, theater, opera or dance a median of 2.8 (2.5)
times annually, followed by art museums or galleries 2.7 (2.4) times, live professional sports events
1.8 (1.6 times) and lectures/presentations .5 (not asked in 2008) times.
Not surprisingly, Downtown residents and those who live and work in Downtown frequented these
activities more often.
Table 83: Median Number of Times Attending Downtown Activities Annually
Total
Residence Relationship to DT Live &
work
DTDTLA LA Co. EmployedAttend
Arts
Attend
Sports
DT
Visitor
DT
Student
Base: LA resident 10742 4464 6278 7362 5561 3173 1645 576 2439
Live music, theater, opera, dance 2.78 3.45 2.40 2.62 3.92 3.49 3.08 3.03 3.70
Art museums or galleries 2.66 3.83 2.05 2.36 3.83 3.14 3.11 3.38 4.02
Special events 2.45 3.17 2.03 2.26 3.01 3.01 2.84 3.11 3.33
Live professional sports events 1.84 2.07 1.69 1.90 2.12 4.47 2.04 2.08 2.33
Lectures/forums/presentations 0.49 1.16 0.45 0.47 1.37 1.15 1.29 1.81 1.39
Downtown historic/architecturaltours
0.44 0.54 0.40 0.41 0.68 0.49 0.70 0.50 0.66
Live collegiate sports events 0.37 0.39 0.35 0.37 0.38 0.87 0.37 0.77 0.40
Other activities/entertainment 2.78 4.49 2.08 2.43 3.48 3.46 3.22 4.49 4.58
Downtown Special Events Attended in Past Two Years
Overall, 88% (74%) reported attending at least one of the listed Downtown special events.
The most attended events included the monthly Downtown Art Walk by 51% (28%); DineLA Week
by 42% (not asked in 2008); Pershing Square Downtown on Ice by 34% (30%); about one-quarter
each at Pershing Square Summer Concerts (22% in 2008) and LA LIVE Ice Skating and Holiday
events; and Grand Performances (summer series) by 21% (25%).
Not surprisingly, significantly more, or about 95%, of Downtown residents and those who live and
work in Downtown reported attending each of the events, although 83% of LA County residents did
as well.
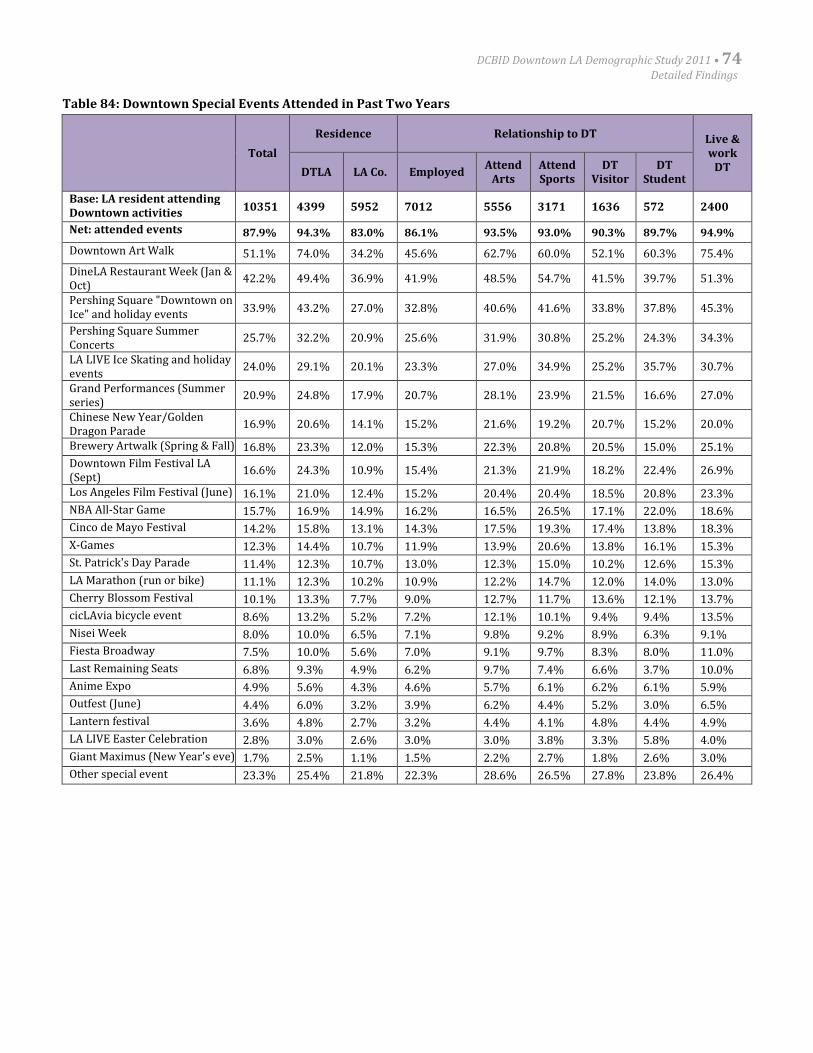
DCBID Downtown LA Demographic Study 2011 • 74Detailed Findings
Table 84: Downtown Special Events Attended in Past Two Years
Total
Residence Relationship to DT Live &work
DTDTLA LA Co. EmployedAttend
ArtsAttendSports
DTVisitor
DTStudent
Base: LA resident attendingDowntown activities
10351 4399 5952 7012 5556 3171 1636 572 2400
Net: attended events 87.9% 94.3% 83.0% 86.1% 93.5% 93.0% 90.3% 89.7% 94.9%
Downtown Art Walk 51.1% 74.0% 34.2% 45.6% 62.7% 60.0% 52.1% 60.3% 75.4%
DineLA Restaurant Week (Jan &Oct)
42.2% 49.4% 36.9% 41.9% 48.5% 54.7% 41.5% 39.7% 51.3%
Pershing Square "Downtown onIce" and holiday events
33.9% 43.2% 27.0% 32.8% 40.6% 41.6% 33.8% 37.8% 45.3%
Pershing Square SummerConcerts
25.7% 32.2% 20.9% 25.6% 31.9% 30.8% 25.2% 24.3% 34.3%
LA LIVE Ice Skating and holidayevents
24.0% 29.1% 20.1% 23.3% 27.0% 34.9% 25.2% 35.7% 30.7%
Grand Performances (Summerseries)
20.9% 24.8% 17.9% 20.7% 28.1% 23.9% 21.5% 16.6% 27.0%
Chinese New Year/GoldenDragon Parade
16.9% 20.6% 14.1% 15.2% 21.6% 19.2% 20.7% 15.2% 20.0%
Brewery Artwalk (Spring & Fall) 16.8% 23.3% 12.0% 15.3% 22.3% 20.8% 20.5% 15.0% 25.1%
Downtown Film Festival LA(Sept)
16.6% 24.3% 10.9% 15.4% 21.3% 21.9% 18.2% 22.4% 26.9%
Los Angeles Film Festival (June) 16.1% 21.0% 12.4% 15.2% 20.4% 20.4% 18.5% 20.8% 23.3%
NBA All-Star Game 15.7% 16.9% 14.9% 16.2% 16.5% 26.5% 17.1% 22.0% 18.6%
Cinco de Mayo Festival 14.2% 15.8% 13.1% 14.3% 17.5% 19.3% 17.4% 13.8% 18.3%
X-Games 12.3% 14.4% 10.7% 11.9% 13.9% 20.6% 13.8% 16.1% 15.3%
St. Patrick's Day Parade 11.4% 12.3% 10.7% 13.0% 12.3% 15.0% 10.2% 12.6% 15.3%
LA Marathon (run or bike) 11.1% 12.3% 10.2% 10.9% 12.2% 14.7% 12.0% 14.0% 13.0%
Cherry Blossom Festival 10.1% 13.3% 7.7% 9.0% 12.7% 11.7% 13.6% 12.1% 13.7%
cicLAvia bicycle event 8.6% 13.2% 5.2% 7.2% 12.1% 10.1% 9.4% 9.4% 13.5%
Nisei Week 8.0% 10.0% 6.5% 7.1% 9.8% 9.2% 8.9% 6.3% 9.1%
Fiesta Broadway 7.5% 10.0% 5.6% 7.0% 9.1% 9.7% 8.3% 8.0% 11.0%
Last Remaining Seats 6.8% 9.3% 4.9% 6.2% 9.7% 7.4% 6.6% 3.7% 10.0%
Anime Expo 4.9% 5.6% 4.3% 4.6% 5.7% 6.1% 6.2% 6.1% 5.9%
Outfest (June) 4.4% 6.0% 3.2% 3.9% 6.2% 4.4% 5.2% 3.0% 6.5%
Lantern festival 3.6% 4.8% 2.7% 3.2% 4.4% 4.1% 4.8% 4.4% 4.9%
LA LIVE Easter Celebration 2.8% 3.0% 2.6% 3.0% 3.0% 3.8% 3.3% 5.8% 4.0%
Giant Maximus (New Year's eve) 1.7% 2.5% 1.1% 1.5% 2.2% 2.7% 1.8% 2.6% 3.0%
Other special event 23.3% 25.4% 21.8% 22.3% 28.6% 26.5% 27.8% 23.8% 26.4%
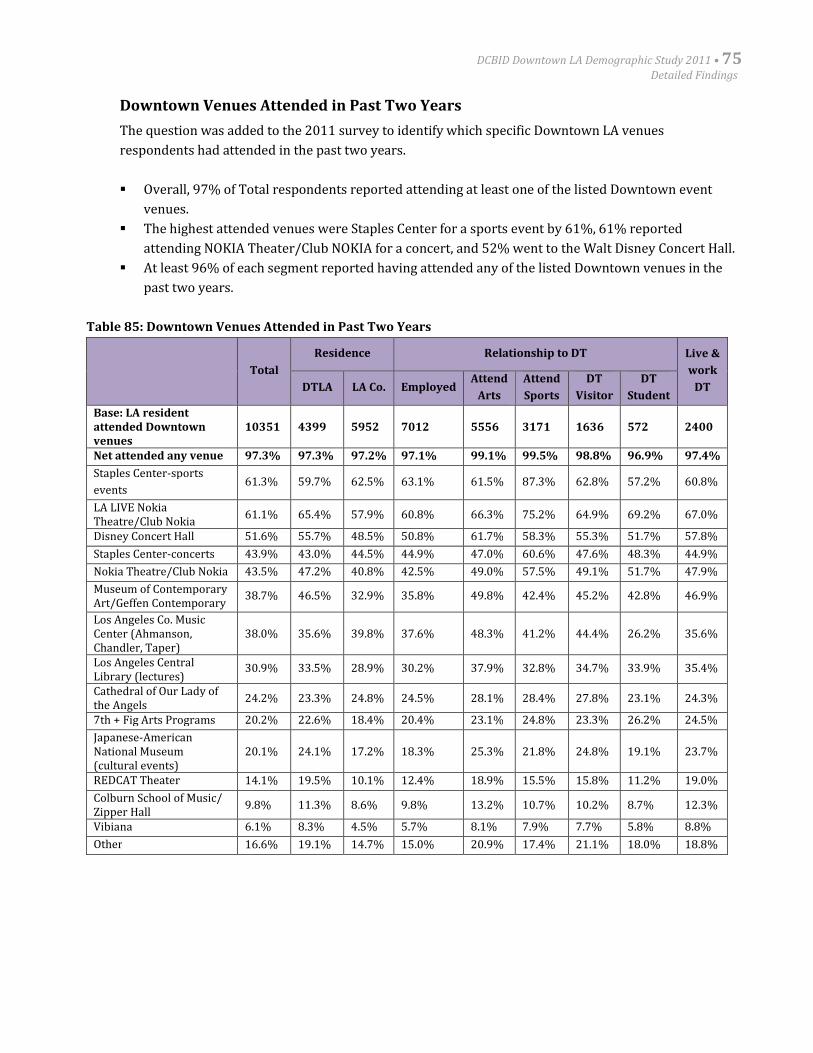
DCBID Downtown LA Demographic Study 2011 • 75Detailed Findings
Downtown Venues Attended in Past Two Years
The question was added to the 2011 survey to identify which specific Downtown LA venues
respondents had attended in the past two years.
Overall, 97% of Total respondents reported attending at least one of the listed Downtown event
venues.
The highest attended venues were Staples Center for a sports event by 61%, 61% reported
attending NOKIA Theater/Club NOKIA for a concert, and 52% went to the Walt Disney Concert Hall.
At least 96% of each segment reported having attended any of the listed Downtown venues in the
past two years.
Table 85: Downtown Venues Attended in Past Two Years
Total
Residence Relationship to DT Live &
work
DTDTLA LA Co. EmployedAttend
Arts
Attend
Sports
DT
Visitor
DT
Student
Base: LA residentattended Downtownvenues
10351 4399 5952 7012 5556 3171 1636 572 2400
Net attended any venue 97.3% 97.3% 97.2% 97.1% 99.1% 99.5% 98.8% 96.9% 97.4%
Staples Center-sports
events61.3% 59.7% 62.5% 63.1% 61.5% 87.3% 62.8% 57.2% 60.8%
LA LIVE NokiaTheatre/Club Nokia
61.1% 65.4% 57.9% 60.8% 66.3% 75.2% 64.9% 69.2% 67.0%
Disney Concert Hall 51.6% 55.7% 48.5% 50.8% 61.7% 58.3% 55.3% 51.7% 57.8%
Staples Center-concerts 43.9% 43.0% 44.5% 44.9% 47.0% 60.6% 47.6% 48.3% 44.9%
Nokia Theatre/Club Nokia 43.5% 47.2% 40.8% 42.5% 49.0% 57.5% 49.1% 51.7% 47.9%
Museum of ContemporaryArt/Geffen Contemporary
38.7% 46.5% 32.9% 35.8% 49.8% 42.4% 45.2% 42.8% 46.9%
Los Angeles Co. MusicCenter (Ahmanson,Chandler, Taper)
38.0% 35.6% 39.8% 37.6% 48.3% 41.2% 44.4% 26.2% 35.6%
Los Angeles CentralLibrary (lectures)
30.9% 33.5% 28.9% 30.2% 37.9% 32.8% 34.7% 33.9% 35.4%
Cathedral of Our Lady ofthe Angels
24.2% 23.3% 24.8% 24.5% 28.1% 28.4% 27.8% 23.1% 24.3%
7th + Fig Arts Programs 20.2% 22.6% 18.4% 20.4% 23.1% 24.8% 23.3% 26.2% 24.5%
Japanese-AmericanNational Museum(cultural events)
20.1% 24.1% 17.2% 18.3% 25.3% 21.8% 24.8% 19.1% 23.7%
REDCAT Theater 14.1% 19.5% 10.1% 12.4% 18.9% 15.5% 15.8% 11.2% 19.0%
Colburn School of Music/Zipper Hall
9.8% 11.3% 8.6% 9.8% 13.2% 10.7% 10.2% 8.7% 12.3%
Vibiana 6.1% 8.3% 4.5% 5.7% 8.1% 7.9% 7.7% 5.8% 8.8%
Other 16.6% 19.1% 14.7% 15.0% 20.9% 17.4% 21.1% 18.0% 18.8%
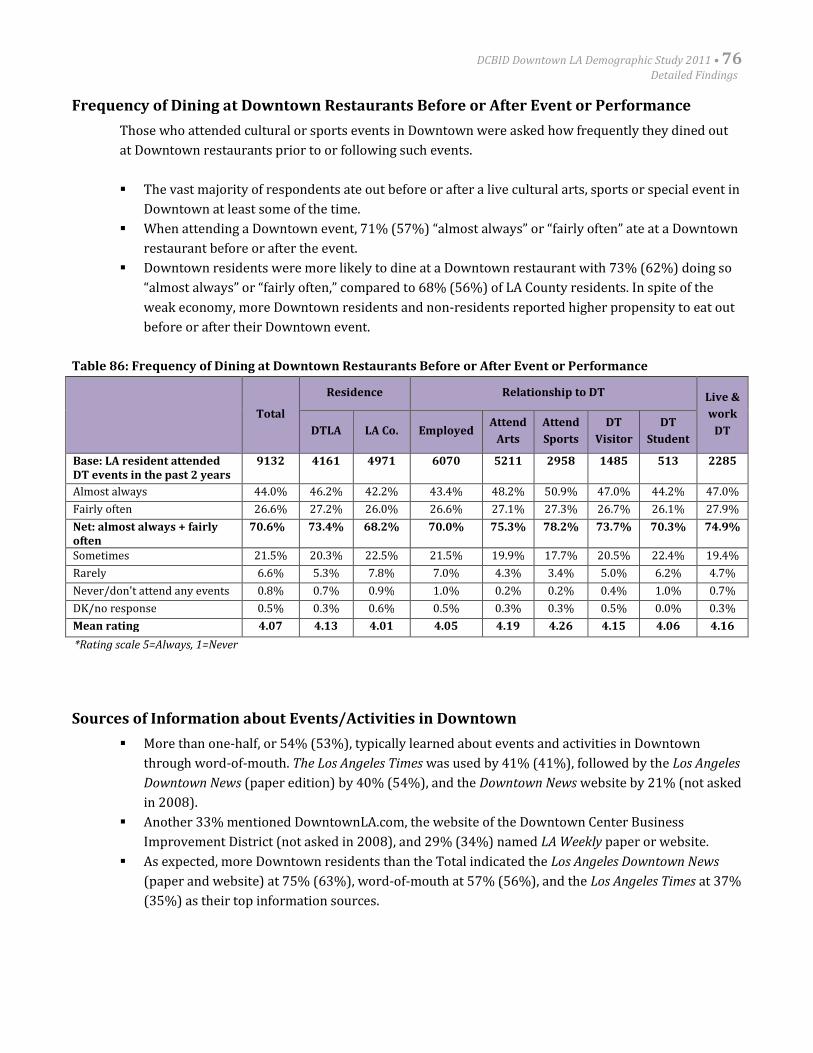
DCBID Downtown LA Demographic Study 2011 • 76Detailed Findings
Frequency of Dining at Downtown Restaurants Before or After Event or Performance
Those who attended cultural or sports events in Downtown were asked how frequently they dined out
at Downtown restaurants prior to or following such events.
The vast majority of respondents ate out before or after a live cultural arts, sports or special event in
Downtown at least some of the time.
When attending a Downtown event, 71% (57%) “almost always” or “fairly often” ate at a Downtown
restaurant before or after the event.
Downtown residents were more likely to dine at a Downtown restaurant with 73% (62%) doing so
“almost always” or “fairly often,” compared to 68% (56%) of LA County residents. In spite of the
weak economy, more Downtown residents and non-residents reported higher propensity to eat out
before or after their Downtown event.
Table 86: Frequency of Dining at Downtown Restaurants Before or After Event or Performance
Total
Residence Relationship to DT Live &
work
DTDTLA LA Co. EmployedAttend
Arts
Attend
Sports
DT
Visitor
DT
Student
Base: LA resident attendedDT events in the past 2 years
9132 4161 4971 6070 5211 2958 1485 513 2285
Almost always 44.0% 46.2% 42.2% 43.4% 48.2% 50.9% 47.0% 44.2% 47.0%
Fairly often 26.6% 27.2% 26.0% 26.6% 27.1% 27.3% 26.7% 26.1% 27.9%
Net: almost always + fairlyoften
70.6% 73.4% 68.2% 70.0% 75.3% 78.2% 73.7% 70.3% 74.9%
Sometimes 21.5% 20.3% 22.5% 21.5% 19.9% 17.7% 20.5% 22.4% 19.4%
Rarely 6.6% 5.3% 7.8% 7.0% 4.3% 3.4% 5.0% 6.2% 4.7%
Never/don't attend any events 0.8% 0.7% 0.9% 1.0% 0.2% 0.2% 0.4% 1.0% 0.7%
DK/no response 0.5% 0.3% 0.6% 0.5% 0.3% 0.3% 0.5% 0.0% 0.3%
Mean rating 4.07 4.13 4.01 4.05 4.19 4.26 4.15 4.06 4.16
*Rating scale 5=Always, 1=Never
Sources of Information about Events/Activities in Downtown
More than one-half, or 54% (53%), typically learned about events and activities in Downtown
through word-of-mouth. The Los Angeles Times was used by 41% (41%), followed by the Los Angeles
Downtown News (paper edition) by 40% (54%), and the Downtown News website by 21% (not asked
in 2008).
Another 33% mentioned DowntownLA.com, the website of the Downtown Center Business
Improvement District (not asked in 2008), and 29% (34%) named LA Weekly paper or website.
As expected, more Downtown residents than the Total indicated the Los Angeles Downtown News
(paper and website) at 75% (63%), word-of-mouth at 57% (56%), and the Los Angeles Times at 37%
(35%) as their top information sources.
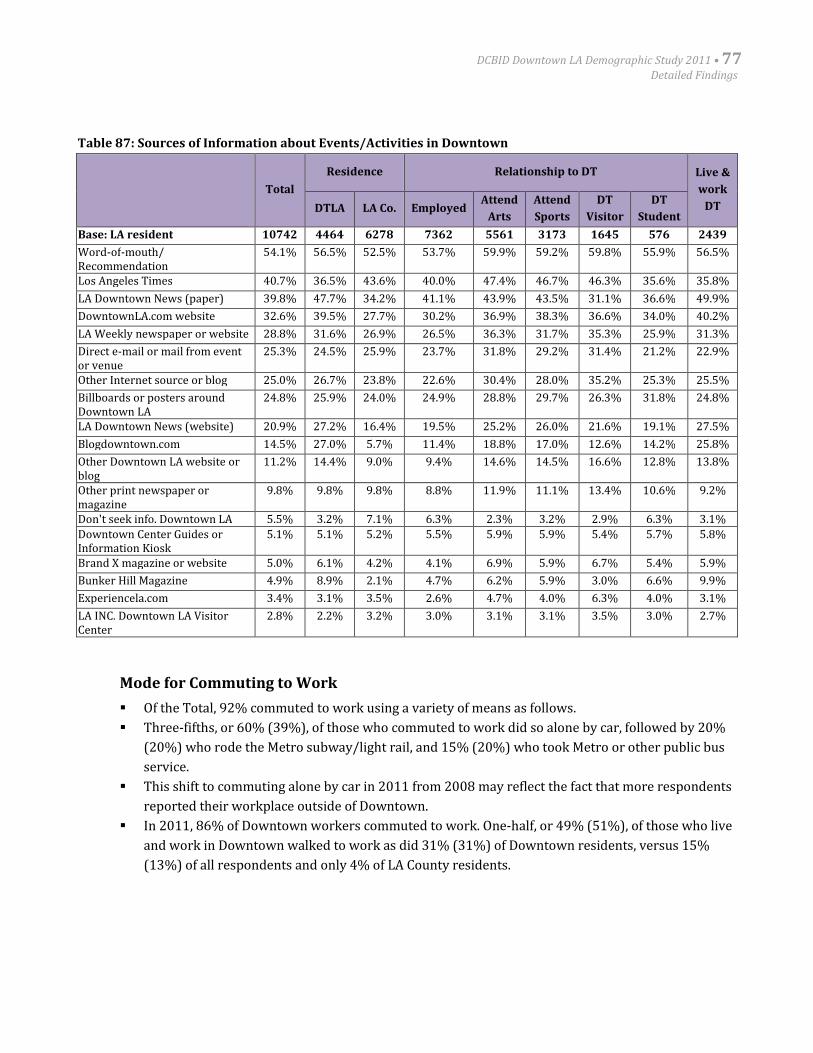
DCBID Downtown LA Demographic Study 2011 • 77Detailed Findings
Table 87: Sources of Information about Events/Activities in Downtown
Total
Residence Relationship to DT Live &
work
DTDTLA LA Co. EmployedAttend
Arts
Attend
Sports
DT
Visitor
DT
Student
Base: LA resident 10742 4464 6278 7362 5561 3173 1645 576 2439
Word-of-mouth/Recommendation
54.1% 56.5% 52.5% 53.7% 59.9% 59.2% 59.8% 55.9% 56.5%
Los Angeles Times 40.7% 36.5% 43.6% 40.0% 47.4% 46.7% 46.3% 35.6% 35.8%
LA Downtown News (paper) 39.8% 47.7% 34.2% 41.1% 43.9% 43.5% 31.1% 36.6% 49.9%
DowntownLA.com website 32.6% 39.5% 27.7% 30.2% 36.9% 38.3% 36.6% 34.0% 40.2%
LA Weekly newspaper or website 28.8% 31.6% 26.9% 26.5% 36.3% 31.7% 35.3% 25.9% 31.3%
Direct e-mail or mail from eventor venue
25.3% 24.5% 25.9% 23.7% 31.8% 29.2% 31.4% 21.2% 22.9%
Other Internet source or blog 25.0% 26.7% 23.8% 22.6% 30.4% 28.0% 35.2% 25.3% 25.5%
Billboards or posters aroundDowntown LA
24.8% 25.9% 24.0% 24.9% 28.8% 29.7% 26.3% 31.8% 24.8%
LA Downtown News (website) 20.9% 27.2% 16.4% 19.5% 25.2% 26.0% 21.6% 19.1% 27.5%
Blogdowntown.com 14.5% 27.0% 5.7% 11.4% 18.8% 17.0% 12.6% 14.2% 25.8%
Other Downtown LA website orblog
11.2% 14.4% 9.0% 9.4% 14.6% 14.5% 16.6% 12.8% 13.8%
Other print newspaper ormagazine
9.8% 9.8% 9.8% 8.8% 11.9% 11.1% 13.4% 10.6% 9.2%
Don't seek info. Downtown LA 5.5% 3.2% 7.1% 6.3% 2.3% 3.2% 2.9% 6.3% 3.1%
Downtown Center Guides orInformation Kiosk
5.1% 5.1% 5.2% 5.5% 5.9% 5.9% 5.4% 5.7% 5.8%
Brand X magazine or website 5.0% 6.1% 4.2% 4.1% 6.9% 5.9% 6.7% 5.4% 5.9%
Bunker Hill Magazine 4.9% 8.9% 2.1% 4.7% 6.2% 5.9% 3.0% 6.6% 9.9%
Experiencela.com 3.4% 3.1% 3.5% 2.6% 4.7% 4.0% 6.3% 4.0% 3.1%
LA INC. Downtown LA VisitorCenter
2.8% 2.2% 3.2% 3.0% 3.1% 3.1% 3.5% 3.0% 2.7%
Mode for Commuting to Work
Of the Total, 92% commuted to work using a variety of means as follows.
Three-fifths, or 60% (39%), of those who commuted to work did so alone by car, followed by 20%
(20%) who rode the Metro subway/light rail, and 15% (20%) who took Metro or other public bus
service.
This shift to commuting alone by car in 2011 from 2008 may reflect the fact that more respondents
reported their workplace outside of Downtown.
In 2011, 86% of Downtown workers commuted to work. One-half, or 49% (51%), of those who live
and work in Downtown walked to work as did 31% (31%) of Downtown residents, versus 15%
(13%) of all respondents and only 4% of LA County residents.
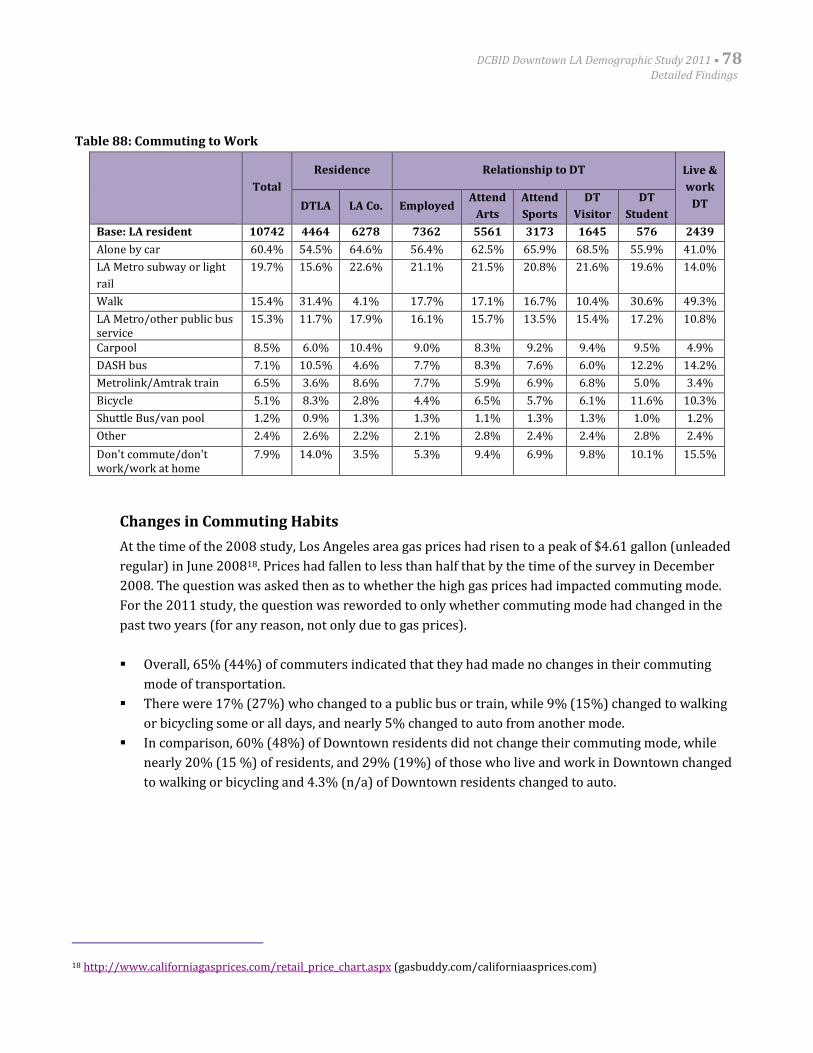
DCBID Downtown LA Demographic Study 2011 • 78Detailed Findings
Table 88: Commuting to Work
Total
Residence Relationship to DT Live &
work
DTDTLA LA Co. EmployedAttend
Arts
Attend
Sports
DT
Visitor
DT
Student
Base: LA resident 10742 4464 6278 7362 5561 3173 1645 576 2439
Alone by car 60.4% 54.5% 64.6% 56.4% 62.5% 65.9% 68.5% 55.9% 41.0%
LA Metro subway or light
rail
19.7% 15.6% 22.6% 21.1% 21.5% 20.8% 21.6% 19.6% 14.0%
Walk 15.4% 31.4% 4.1% 17.7% 17.1% 16.7% 10.4% 30.6% 49.3%
LA Metro/other public busservice
15.3% 11.7% 17.9% 16.1% 15.7% 13.5% 15.4% 17.2% 10.8%
Carpool 8.5% 6.0% 10.4% 9.0% 8.3% 9.2% 9.4% 9.5% 4.9%
DASH bus 7.1% 10.5% 4.6% 7.7% 8.3% 7.6% 6.0% 12.2% 14.2%
Metrolink/Amtrak train 6.5% 3.6% 8.6% 7.7% 5.9% 6.9% 6.8% 5.0% 3.4%
Bicycle 5.1% 8.3% 2.8% 4.4% 6.5% 5.7% 6.1% 11.6% 10.3%
Shuttle Bus/van pool 1.2% 0.9% 1.3% 1.3% 1.1% 1.3% 1.3% 1.0% 1.2%
Other 2.4% 2.6% 2.2% 2.1% 2.8% 2.4% 2.4% 2.8% 2.4%
Don't commute/don'twork/work at home
7.9% 14.0% 3.5% 5.3% 9.4% 6.9% 9.8% 10.1% 15.5%
Changes in Commuting Habits
At the time of the 2008 study, Los Angeles area gas prices had risen to a peak of $4.61 gallon (unleaded
regular) in June 200818. Prices had fallen to less than half that by the time of the survey in December
2008. The question was asked then as to whether the high gas prices had impacted commuting mode.
For the 2011 study, the question was reworded to only whether commuting mode had changed in the
past two years (for any reason, not only due to gas prices).
Overall, 65% (44%) of commuters indicated that they had made no changes in their commuting
mode of transportation.
There were 17% (27%) who changed to a public bus or train, while 9% (15%) changed to walking
or bicycling some or all days, and nearly 5% changed to auto from another mode.
In comparison, 60% (48%) of Downtown residents did not change their commuting mode, while
nearly 20% (15 %) of residents, and 29% (19%) of those who live and work in Downtown changed
to walking or bicycling and 4.3% (n/a) of Downtown residents changed to auto.
18 http://www.californiagasprices.com/retail_price_chart.aspx (gasbuddy.com/californiaasprices.com)
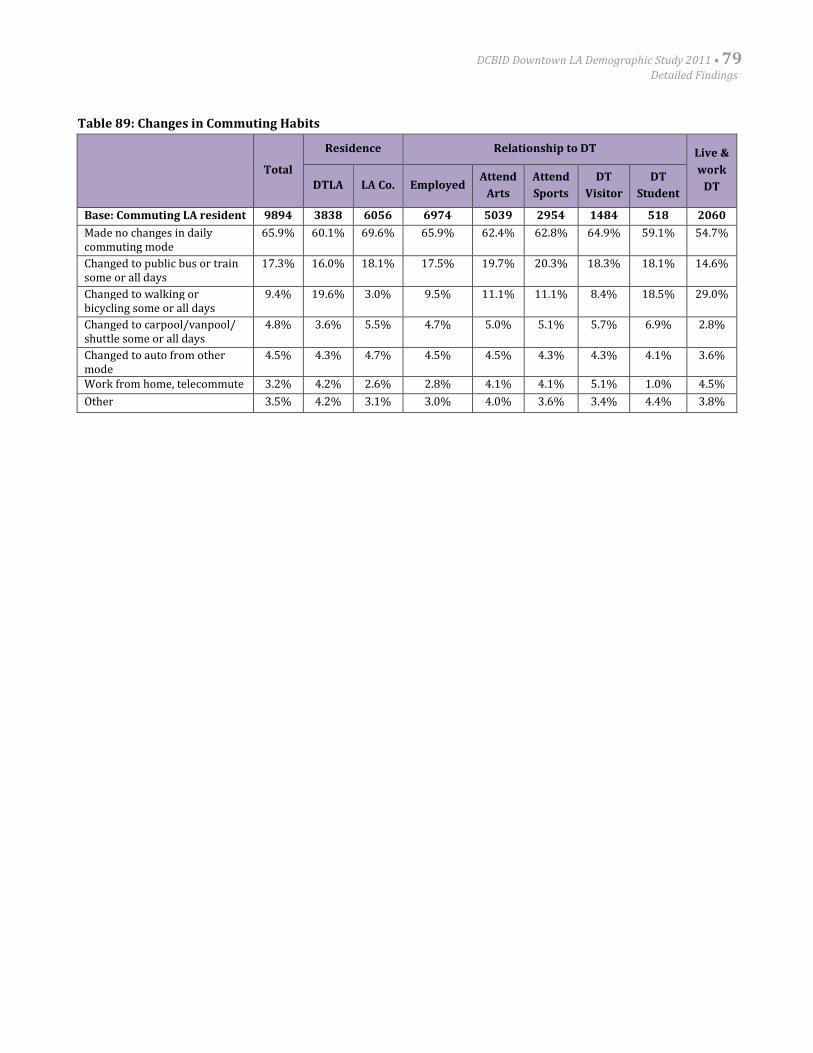
DCBID Downtown LA Demographic Study 2011 • 79Detailed Findings
Table 89: Changes in Commuting Habits
Total
Residence Relationship to DT Live &
work
DTDTLA LA Co. EmployedAttend
Arts
Attend
Sports
DT
Visitor
DT
Student
Base: Commuting LA resident 9894 3838 6056 6974 5039 2954 1484 518 2060
Made no changes in dailycommuting mode
65.9% 60.1% 69.6% 65.9% 62.4% 62.8% 64.9% 59.1% 54.7%
Changed to public bus or trainsome or all days
17.3% 16.0% 18.1% 17.5% 19.7% 20.3% 18.3% 18.1% 14.6%
Changed to walking orbicycling some or all days
9.4% 19.6% 3.0% 9.5% 11.1% 11.1% 8.4% 18.5% 29.0%
Changed to carpool/vanpool/shuttle some or all days
4.8% 3.6% 5.5% 4.7% 5.0% 5.1% 5.7% 6.9% 2.8%
Changed to auto from othermode
4.5% 4.3% 4.7% 4.5% 4.5% 4.3% 4.3% 4.1% 3.6%
Work from home, telecommute 3.2% 4.2% 2.6% 2.8% 4.1% 4.1% 5.1% 1.0% 4.5%
Other 3.5% 4.2% 3.1% 3.0% 4.0% 3.6% 3.4% 4.4% 3.8%
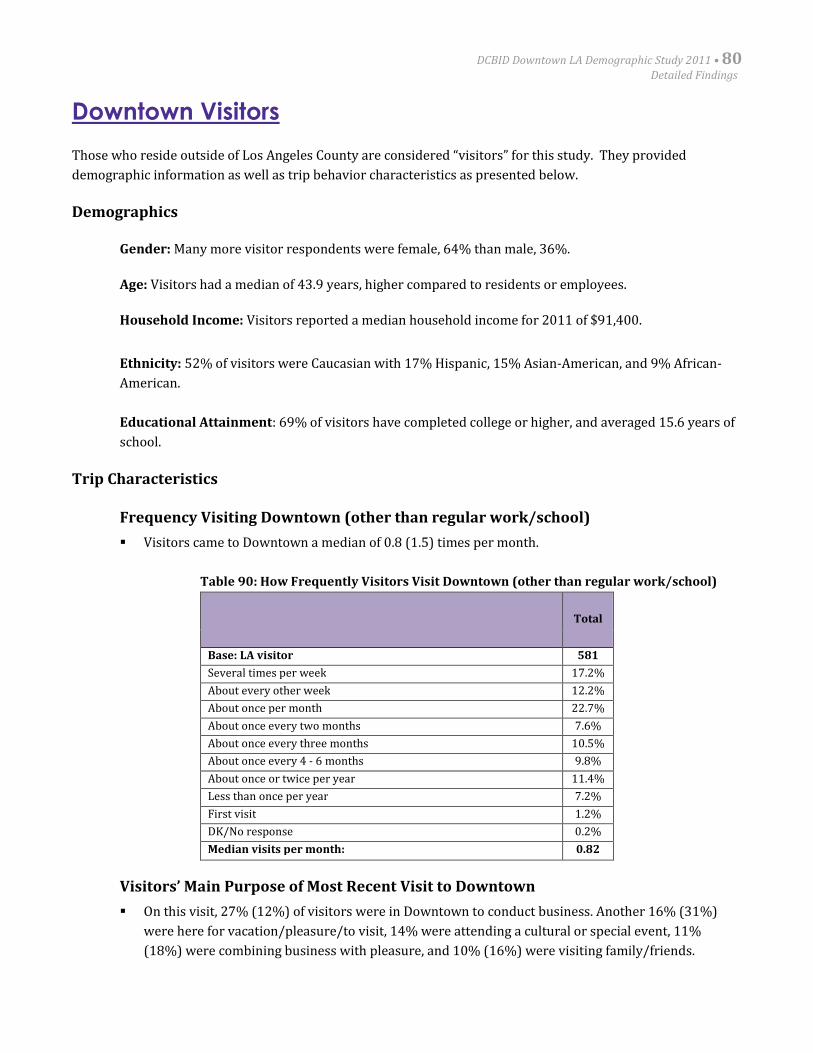
DCBID Downtown LA Demographic Study 2011 • 80Detailed Findings
Downtown Visitors
Those who reside outside of Los Angeles County are considered “visitors” for this study. They provided
demographic information as well as trip behavior characteristics as presented below.
Demographics
Gender: Many more visitor respondents were female, 64% than male, 36%.
Age: Visitors had a median of 43.9 years, higher compared to residents or employees.
Household Income: Visitors reported a median household income for 2011 of $91,400.
Ethnicity: 52% of visitors were Caucasian with 17% Hispanic, 15% Asian-American, and 9% African-
American.
Educational Attainment: 69% of visitors have completed college or higher, and averaged 15.6 years of
school.
Trip Characteristics
Frequency Visiting Downtown (other than regular work/school)
Visitors came to Downtown a median of 0.8 (1.5) times per month.
Table 90: How Frequently Visitors Visit Downtown (other than regular work/school)
Total
Base: LA visitor 581
Several times per week 17.2%
About every other week 12.2%
About once per month 22.7%
About once every two months 7.6%
About once every three months 10.5%
About once every 4 - 6 months 9.8%
About once or twice per year 11.4%
Less than once per year 7.2%
First visit 1.2%
DK/No response 0.2%
Median visits per month: 0.82
Visitors’ Main Purpose of Most Recent Visit to Downtown
On this visit, 27% (12%) of visitors were in Downtown to conduct business. Another 16% (31%)
were here for vacation/pleasure/to visit, 14% were attending a cultural or special event, 11%
(18%) were combining business with pleasure, and 10% (16%) were visiting family/friends.
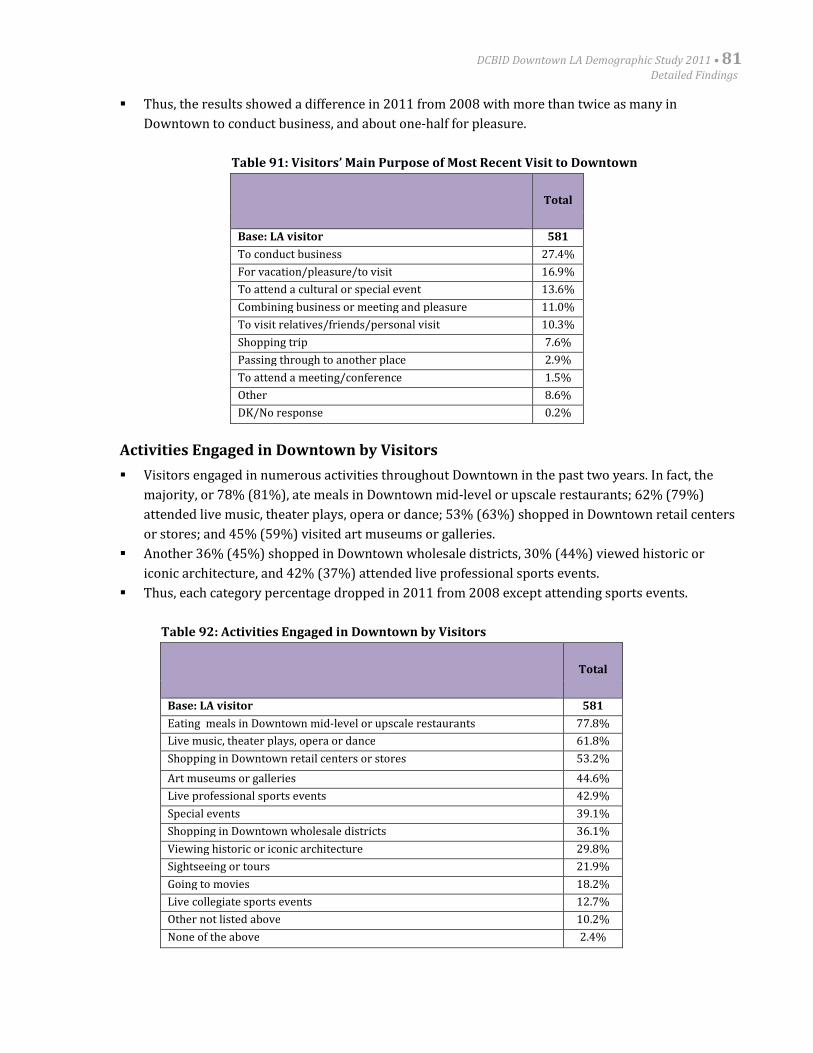
DCBID Downtown LA Demographic Study 2011 • 81Detailed Findings
Thus, the results showed a difference in 2011 from 2008 with more than twice as many in
Downtown to conduct business, and about one-half for pleasure.
Table 91: Visitors’ Main Purpose of Most Recent Visit to Downtown
Total
Base: LA visitor 581
To conduct business 27.4%
For vacation/pleasure/to visit 16.9%
To attend a cultural or special event 13.6%
Combining business or meeting and pleasure 11.0%
To visit relatives/friends/personal visit 10.3%
Shopping trip 7.6%
Passing through to another place 2.9%
To attend a meeting/conference 1.5%
Other 8.6%
DK/No response 0.2%
Activities Engaged in Downtown by Visitors
Visitors engaged in numerous activities throughout Downtown in the past two years. In fact, the
majority, or 78% (81%), ate meals in Downtown mid-level or upscale restaurants; 62% (79%)
attended live music, theater plays, opera or dance; 53% (63%) shopped in Downtown retail centers
or stores; and 45% (59%) visited art museums or galleries.
Another 36% (45%) shopped in Downtown wholesale districts, 30% (44%) viewed historic or
iconic architecture, and 42% (37%) attended live professional sports events.
Thus, each category percentage dropped in 2011 from 2008 except attending sports events.
Table 92: Activities Engaged in Downtown by Visitors
Total
Base: LA visitor 581
Eating meals in Downtown mid-level or upscale restaurants 77.8%
Live music, theater plays, opera or dance 61.8%
Shopping in Downtown retail centers or stores 53.2%
Art museums or galleries 44.6%
Live professional sports events 42.9%
Special events 39.1%
Shopping in Downtown wholesale districts 36.1%
Viewing historic or iconic architecture 29.8%
Sightseeing or tours 21.9%
Going to movies 18.2%
Live collegiate sports events 12.7%
Other not listed above 10.2%
None of the above 2.4%
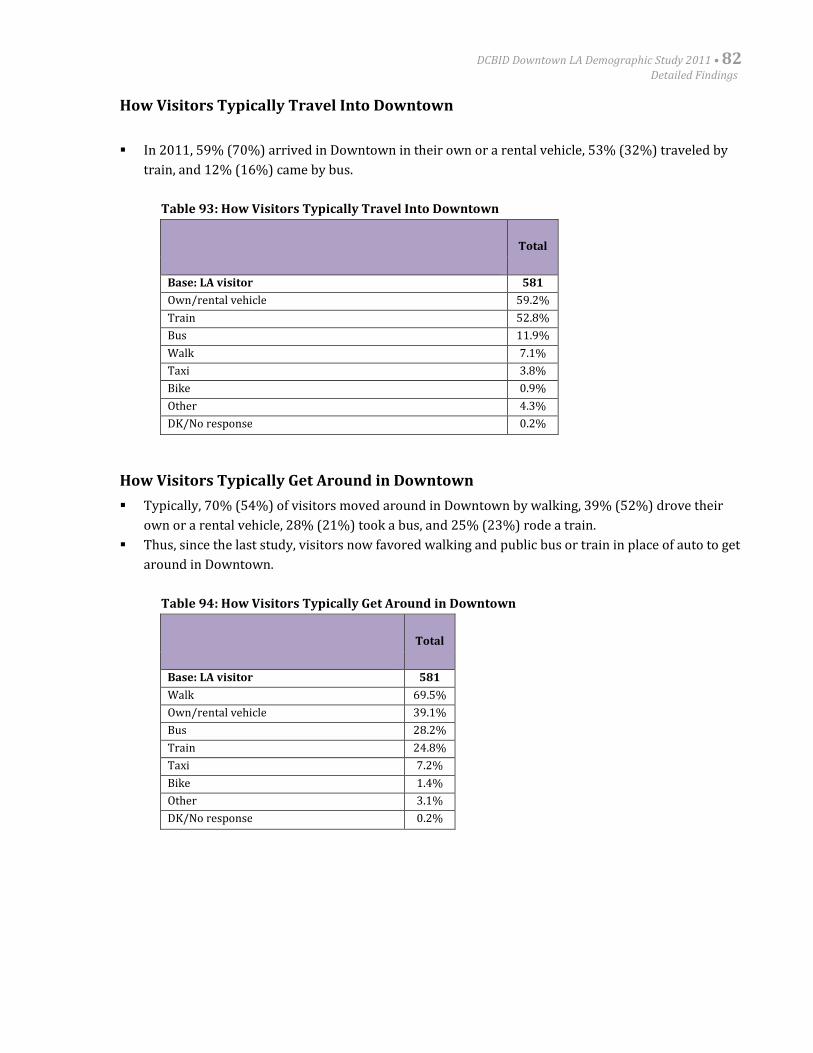
DCBID Downtown LA Demographic Study 2011 • 82Detailed Findings
How Visitors Typically Travel Into Downtown
In 2011, 59% (70%) arrived in Downtown in their own or a rental vehicle, 53% (32%) traveled by
train, and 12% (16%) came by bus.
Table 93: How Visitors Typically Travel Into Downtown
Total
Base: LA visitor 581
Own/rental vehicle 59.2%
Train 52.8%
Bus 11.9%
Walk 7.1%
Taxi 3.8%
Bike 0.9%
Other 4.3%
DK/No response 0.2%
How Visitors Typically Get Around in Downtown
Typically, 70% (54%) of visitors moved around in Downtown by walking, 39% (52%) drove their
own or a rental vehicle, 28% (21%) took a bus, and 25% (23%) rode a train.
Thus, since the last study, visitors now favored walking and public bus or train in place of auto to get
around in Downtown.
Table 94: How Visitors Typically Get Around in Downtown
Total
Base: LA visitor 581
Walk 69.5%
Own/rental vehicle 39.1%
Bus 28.2%
Train 24.8%
Taxi 7.2%
Bike 1.4%
Other 3.1%
DK/No response 0.2%
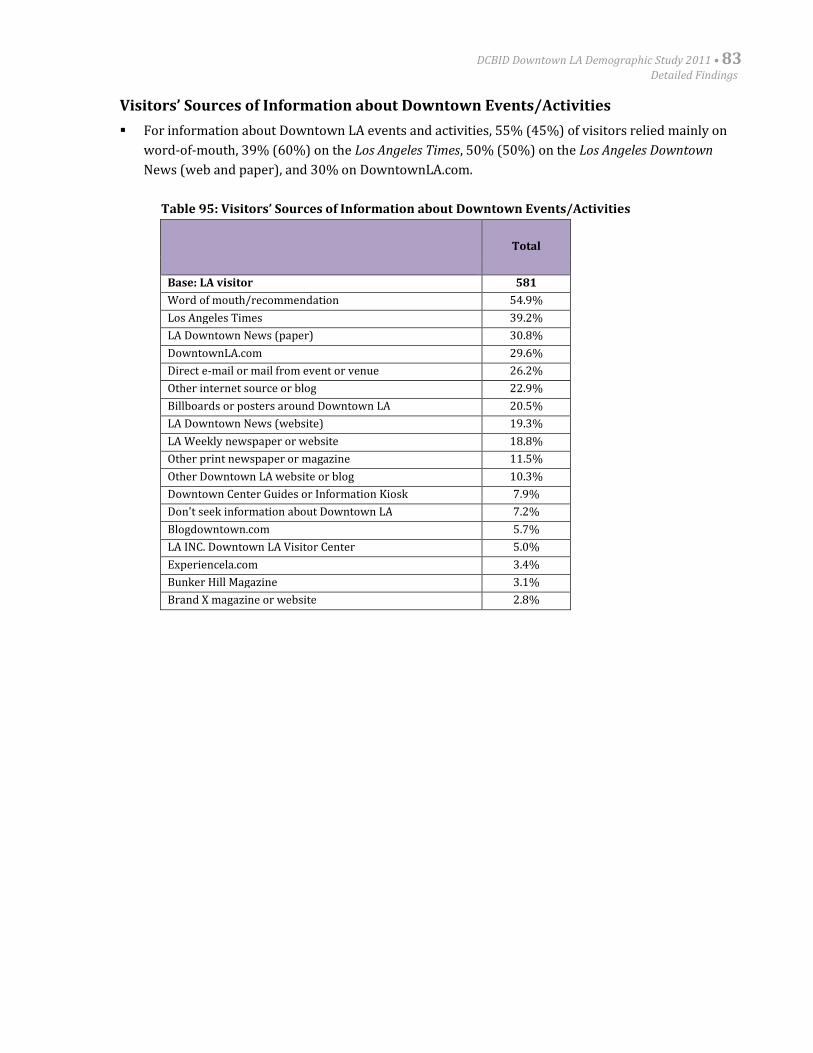
DCBID Downtown LA Demographic Study 2011 • 83Detailed Findings
Visitors’ Sources of Information about Downtown Events/Activities
For information about Downtown LA events and activities, 55% (45%) of visitors relied mainly on
word-of-mouth, 39% (60%) on the Los Angeles Times, 50% (50%) on the Los Angeles Downtown
News (web and paper), and 30% on DowntownLA.com.
Table 95: Visitors’ Sources of Information about Downtown Events/Activities
Total
Base: LA visitor 581
Word of mouth/recommendation 54.9%
Los Angeles Times 39.2%
LA Downtown News (paper) 30.8%
DowntownLA.com 29.6%
Direct e-mail or mail from event or venue 26.2%
Other internet source or blog 22.9%
Billboards or posters around Downtown LA 20.5%
LA Downtown News (website) 19.3%
LA Weekly newspaper or website 18.8%
Other print newspaper or magazine 11.5%
Other Downtown LA website or blog 10.3%
Downtown Center Guides or Information Kiosk 7.9%
Don't seek information about Downtown LA 7.2%
Blogdowntown.com 5.7%
LA INC. Downtown LA Visitor Center 5.0%
Experiencela.com 3.4%
Bunker Hill Magazine 3.1%
Brand X magazine or website 2.8%
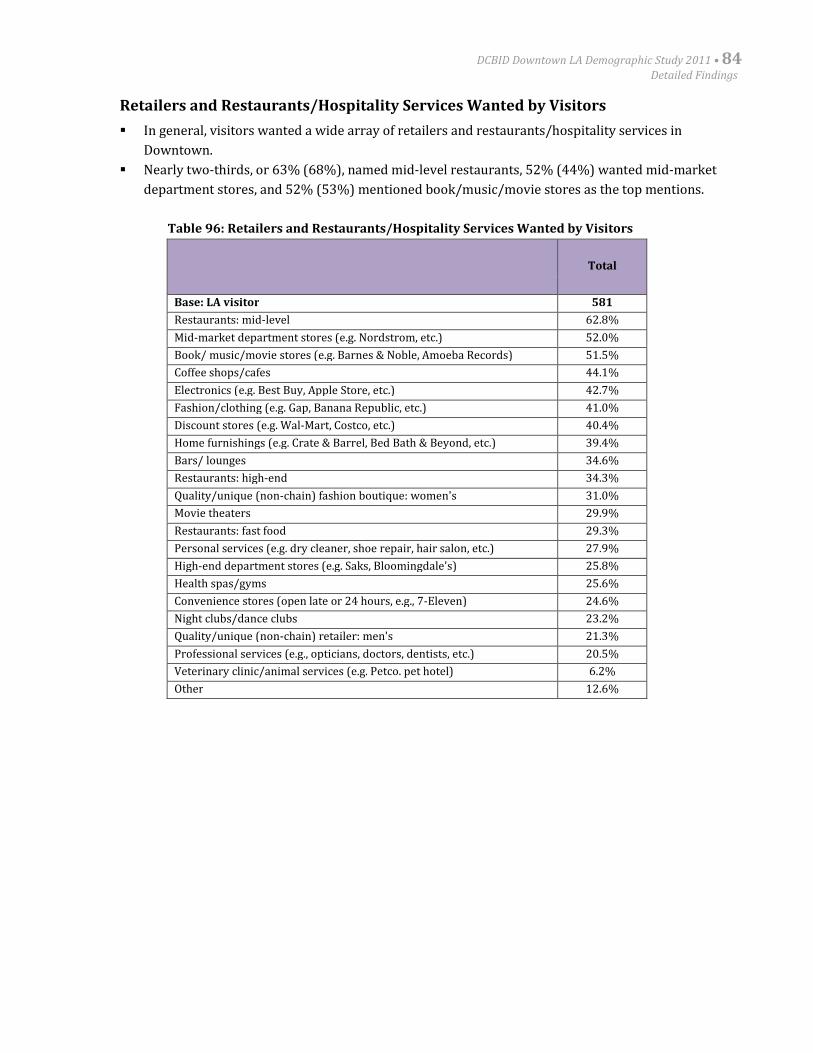
DCBID Downtown LA Demographic Study 2011 • 84Detailed Findings
Retailers and Restaurants/Hospitality Services Wanted by Visitors
In general, visitors wanted a wide array of retailers and restaurants/hospitality services in
Downtown.
Nearly two-thirds, or 63% (68%), named mid-level restaurants, 52% (44%) wanted mid-market
department stores, and 52% (53%) mentioned book/music/movie stores as the top mentions.
Table 96: Retailers and Restaurants/Hospitality Services Wanted by Visitors
Total
Base: LA visitor 581
Restaurants: mid-level 62.8%
Mid-market department stores (e.g. Nordstrom, etc.) 52.0%
Book/ music/movie stores (e.g. Barnes & Noble, Amoeba Records) 51.5%
Coffee shops/cafes 44.1%
Electronics (e.g. Best Buy, Apple Store, etc.) 42.7%
Fashion/clothing (e.g. Gap, Banana Republic, etc.) 41.0%
Discount stores (e.g. Wal-Mart, Costco, etc.) 40.4%
Home furnishings (e.g. Crate & Barrel, Bed Bath & Beyond, etc.) 39.4%
Bars/ lounges 34.6%
Restaurants: high-end 34.3%
Quality/unique (non-chain) fashion boutique: women's 31.0%
Movie theaters 29.9%
Restaurants: fast food 29.3%
Personal services (e.g. dry cleaner, shoe repair, hair salon, etc.) 27.9%
High-end department stores (e.g. Saks, Bloomingdale's) 25.8%
Health spas/gyms 25.6%
Convenience stores (open late or 24 hours, e.g., 7-Eleven) 24.6%
Night clubs/dance clubs 23.2%
Quality/unique (non-chain) retailer: men's 21.3%
Professional services (e.g., opticians, doctors, dentists, etc.) 20.5%
Veterinary clinic/animal services (e.g. Petco. pet hotel) 6.2%
Other 12.6%
DCBID Downtown LA Demographic Study 2011 • 85Detailed Findings
Summary Profile of Downtown Workers
Downtown’s daytime worker population is estimated at approximately 500,000.
Of the Total respondents, 68% (69%) reported being employed in Downtown. This section profiles these
employees. Generally, Downtown LA employees were ethnically diverse, skewed slightly more female, in
their mid-30s, with high educational attainment and high household income. Four in 10 were married,
while most had no children at home. More than one-half commuted to work by private auto, a change
from the 2008 survey when more used public transit. They were employed in a diverse range of sectors,
mainly services and government, and about one-half were at the executive or senior staff level.
Ethnicity:
Downtown employees were diverse, with 47% (47%) Caucasian, 22% (22%) Hispanic/Latino, nearly
20% (18%) Asian-American/Pacific Islander and 6.5% (10.3%) African-American. Thus, the ratio of
Asian-American/Pacific Islanders rose slightly while the ratio of African-Americans dropped slightly
from the 2008 study. Caucasians and Hispanic/Latino remained at the same level in 2011 as in 2008.
Gender:
Nearly 64% (65%) of employee respondents were female.
Age:
Employees’ median age was 38.0 (38.5) years.
Education:
Seventy-three percent (72.2%) of Downtown LA employees completed at least a four-year college and
averaged 15.5 (15.3) years of school.
Income:
Downtown LA employees reported a median household income of $88,500 versus $95,900 in 2008. It is
likely that the lingering effects of the recession impacted total income in 2011.
Children at Home:
Only 13% (23%) of Downtown LA employees reported having children up to five years of age, while
22% (15%) had children aged 5-13 at home. Thus, among those who had children at home, fewer were
in the younger age group (0-5), while more were in the older (5-18) age group in 2011 versus 2008.
Own versus Rent:
Less than one-half, or 45% (50%), of employees owned their residence, while 47% (42%) rented their
residence (whereas 8% neither rented nor owned). This was a change from 2008 when more were
owners than renters, again likely related to the economy and challenges in sales financing.
DCBID Downtown LA Demographic Study 2011 • 86Detailed Findings
Employment Field:
Nearly one-third, or 30% (30%), of Downtown employee respondents were in business/professional
services, with 15% (16%) in financial/insurance services, and 12% (15%) in government.
Employment Position:
Nearly 38% (38%) of employees were professional/senior staff, and 15% (13%) were top-level
executives or management. Another 22% (26%) were at the clerical/general level.
Commuting to Work:
More than one-half, or 56%, of employees drove to work alone in 2011 compared to just 36% who did
so in 2008. At the same time, 37% in 2011, versus 46% in 2008, commuted to work by public bus or
train.
Residence:
Three in 10, or 30% (24%), of Downtown employees reported being Downtown LA residents.
Tenure at Residence:
Employees have lived in their current residence for 3.4 (4.4) years.
Pets:
One-half, or 50% (49%), of employees owned a pet.
Travel and Spending for Groceries:
Downtown employees traveled about 1.8 (2.3) miles to purchase their groceries. Employees’ households
spent a media of nearly $109 ($105) for their weekly groceries.
Eat Lunch Out in Downtown:
Almost all, or 94% (98%), of Downtown employees ate lunch out in Downtown at least once per month.
Each one who did spent $14.05 ($12.34) (median) during lunch.
Eat Dinner Out in Downtown:
About three-fifths, or 63% (80%), of employees ate dinner out in Downtown at least once per month,
and each one who did spent $29.12 ($26.69) (median) for dinner.
Retailers Wanted in Downtown:
Downtown employees most wanted more mid-level restaurants in Downtown.
Activities Attended:
Employees attended a median of 2.6 (2.3) live music and performance arts events in a year, visited a
median of 2.4 (2.1) times to galleries/museums, and attended 1.9 (1.6) professional sports events.
DCBID Downtown LA Demographic Study 2011 • 87Detailed Findings
Table 97: Summary Profile of Downtown Workers
2011 2008
Base: Employed Downtown (only) 7743 7409
Percentage of Total respondents 68% 69%
Reside in Downtown 29.7% 24.3%
Reside outside of Downtown 70.3% 75.7%
Female/male 63.5%/36.5% 64.8%/35.2%
Median age 38.0 38.5
Ethnic/racial: Caucasian (non-Hispanic) 46.7% 47.1%
Hispanic/Latino 22.1% 22.4%
Asian/Pacific Islander 19.5% 18.1%
African-American 6.5% 10.3%
Completed 4-Year College or Higher/median years of education 73.0%/15.8 72.2%/15.5
Median household income (overall) $88,700 $94,700
Median household Income (with wage earner) $88,500 $95,900
Number in household (mean) 2.29 2.40
Married (heterosexual) 43.0% 44.6%
% with children aged 0-5 at home 12.7% 23.1%
% with children aged 5-18 at home (aged 5 -13 in 2008) 21.7% 15.1%
% Own/Rent current residence 45.0%/47.2% 50%/42%
Years at Current Residence (median) 3.4 4.4
Own A Pet 49.9% 49.1%
Distance (miles) travel for Groceries (median) 1.79 2.31
Median weekly Grocery Spending (household) $108.81 $104.80
% Eat lunch out in Downtown (<once/month) 94.0% 98.4%
Median Spent For Lunch Out in Downtown (per-person) $14.05 $12.34
% Eat Dinner out in Downtown (<once/month) 62.8% 79.7%
Median Spent For Dinner Out in Downtown (per-person) $29.12 $26.69
Want (more) mid-level Restaurant in Downtown 63.3% 62.4%
Median Times/Year Attend: Downtown live music, theater plays, opera, dance 2.62 2.32
Median Times/Year Downtown Art museums or galleries 2.36 2.11
Median Times/Year Downtown Professional sports events 1.90 1.59
Industry of Employment: Business/professional/technical services 29.7% 29.8%
Financial services /insurance 14.5% 16.4%
Government (including military) 11.5% 14.9%
Position: Professional/senior staff (incl. educators) 37.8% 38.0%
Clerical or general staff 22.4% 26.0%
Top-level executive or manager 15.2% 13.3%
Commute to work: Alone by car 56.4% 35.8%
LA Metro/other Public Bus Service 16.1% 23.6%
LA Metro subway or light rail 21.1% 22.0%
DCBID Downtown LA Demographic Study 2011 • 88Index of Detailed Tables
Index of Detailed TablesTable 1: Downtown LA Residential Housing Units and Population (2011 and 2008)........................................................................................14
Table 2: Downtown LA Resident Ethnicity 2011 and 2008.............................................................................................................................................16
Table 3: Household Income .............................................................................................................................................................................................................27
Table 4: Resident Age .........................................................................................................................................................................................................................28
Table 5: Resident Ethnicity ..............................................................................................................................................................................................................28
Table 6: Education Level ...................................................................................................................................................................................................................29
Table 7: Gender......................................................................................................................................................................................................................................29
Table 8: Employment Status............................................................................................................................................................................................................29
Table 9: Employment Position/Level .........................................................................................................................................................................................30
Table 10: Industry of Employment ..............................................................................................................................................................................................31
Table 11: Household Composition ...............................................................................................................................................................................................31
Table 12: Own or Rent Residence.................................................................................................................................................................................................32
Table 13: Tenure at Current Residence .....................................................................................................................................................................................32
Table 14: Number of Residents in Household ........................................................................................................................................................................32
Table 15: Use of Home for Office/Studio...................................................................................................................................................................................33
Table 16: Where Shop for Groceries............................................................................................................................................................................................33
Table 17: Amount Spent on Groceries Per Week ..................................................................................................................................................................34
Table 18: Grocery Chains Wanted in Downtown ..................................................................................................................................................................34
Table 19: Percentage and Median Spending for Eating Lunch Out in Downtown ................................................................................................35
Table 20: Spending for Dining Out in Downtown (median) ............................................................................................................................................35
Table 21: Spending for Dining Out in Any Area (median) ................................................................................................................................................35
Table 22: Desired Retailers/Services Downtown.................................................................................................................................................................36
Table 23: Pet Ownership...................................................................................................................................................................................................................37
Table 24: Residence Area – Total Respondents.....................................................................................................................................................................38
Table 25: Employment and Activities Relative to Downtown – Total Respondents............................................................................................39
Table 26: Employment and Activities Relative to Downtown – Total Respondents............................................................................................39
Table 27: Relationship to Downtown LA – By Employment and Live & Work.......................................................................................................40
Table 28: Relationship to Downtown LA – Attend Cultural and/or Sport Events ................................................................................................41
Table 29: Respondent Gender ........................................................................................................................................................................................................41
Table 30: Respondent Age................................................................................................................................................................................................................42
Table 31: Respondent Ethnicity.....................................................................................................................................................................................................43
Table 32: Highest Education Level Attained............................................................................................................................................................................43
Table 33: Reported 2011 Household Income (with a wage earner)............................................................................................................................44
Table 34: Employment Status.........................................................................................................................................................................................................44
Table 35: Employment Industry....................................................................................................................................................................................................45
Table 36: Employment Position ....................................................................................................................................................................................................46
Table 37: Workplace Location........................................................................................................................................................................................................46
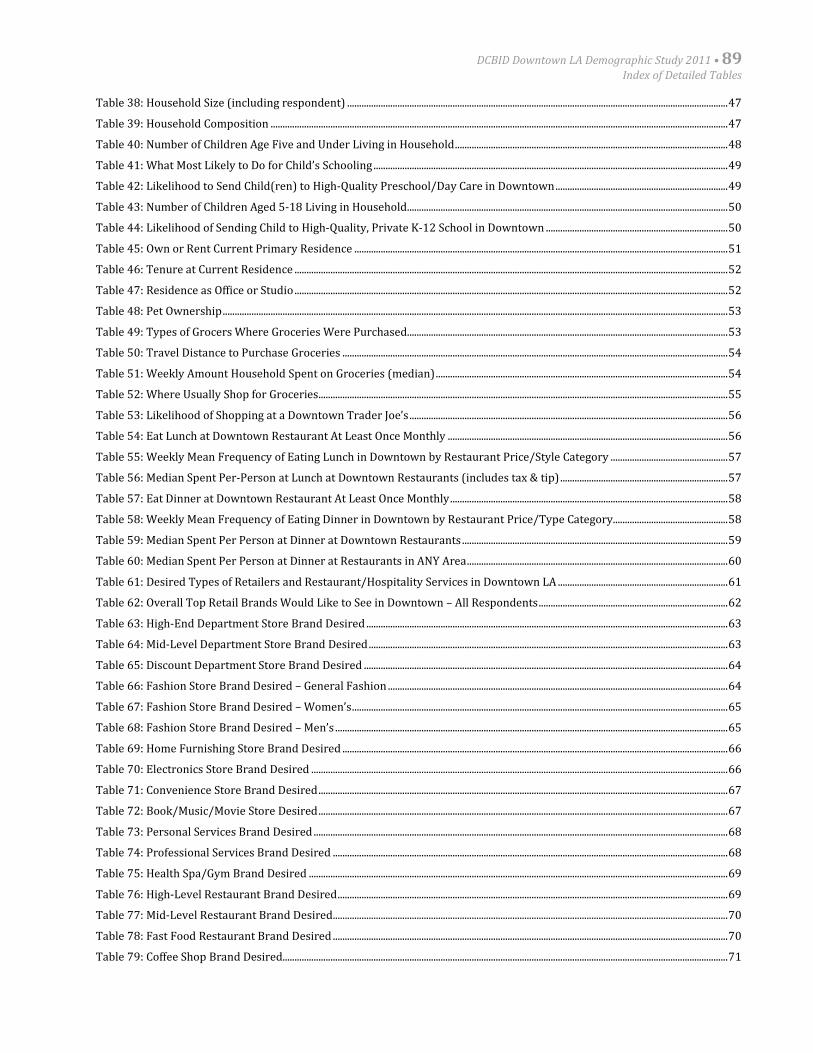
DCBID Downtown LA Demographic Study 2011 • 89Index of Detailed Tables
Table 38: Household Size (including respondent) ...............................................................................................................................................................47
Table 39: Household Composition ...............................................................................................................................................................................................47
Table 40: Number of Children Age Five and Under Living in Household..................................................................................................................48
Table 41: What Most Likely to Do for Child’s Schooling ....................................................................................................................................................49
Table 42: Likelihood to Send Child(ren) to High-Quality Preschool/Day Care in Downtown........................................................................49
Table 43: Number of Children Aged 5-18 Living in Household......................................................................................................................................50
Table 44: Likelihood of Sending Child to High-Quality, Private K-12 School in Downtown ............................................................................50
Table 45: Own or Rent Current Primary Residence ............................................................................................................................................................51
Table 46: Tenure at Current Residence .....................................................................................................................................................................................52
Table 47: Residence as Office or Studio.....................................................................................................................................................................................52
Table 48: Pet Ownership...................................................................................................................................................................................................................53
Table 49: Types of Grocers Where Groceries Were Purchased......................................................................................................................................53
Table 50: Travel Distance to Purchase Groceries .................................................................................................................................................................54
Table 51: Weekly Amount Household Spent on Groceries (median)..........................................................................................................................54
Table 52: Where Usually Shop for Groceries...........................................................................................................................................................................55
Table 53: Likelihood of Shopping at a Downtown Trader Joe’s.....................................................................................................................................56
Table 54: Eat Lunch at Downtown Restaurant At Least Once Monthly .....................................................................................................................56
Table 55: Weekly Mean Frequency of Eating Lunch in Downtown by Restaurant Price/Style Category .................................................57
Table 56: Median Spent Per-Person at Lunch at Downtown Restaurants (includes tax & tip)......................................................................57
Table 57: Eat Dinner at Downtown Restaurant At Least Once Monthly....................................................................................................................58
Table 58: Weekly Mean Frequency of Eating Dinner in Downtown by Restaurant Price/Type Category................................................58
Table 59: Median Spent Per Person at Dinner at Downtown Restaurants...............................................................................................................59
Table 60: Median Spent Per Person at Dinner at Restaurants in ANY Area.............................................................................................................60
Table 61: Desired Types of Retailers and Restaurant/Hospitality Services in Downtown LA .......................................................................61
Table 62: Overall Top Retail Brands Would Like to See in Downtown – All Respondents...............................................................................62
Table 63: High-End Department Store Brand Desired .......................................................................................................................................................63
Table 64: Mid-Level Department Store Brand Desired......................................................................................................................................................63
Table 65: Discount Department Store Brand Desired ........................................................................................................................................................64
Table 66: Fashion Store Brand Desired – General Fashion ..............................................................................................................................................64
Table 67: Fashion Store Brand Desired – Women’s.............................................................................................................................................................65
Table 68: Fashion Store Brand Desired – Men’s ....................................................................................................................................................................65
Table 69: Home Furnishing Store Brand Desired .................................................................................................................................................................66
Table 70: Electronics Store Brand Desired ..............................................................................................................................................................................66
Table 71: Convenience Store Brand Desired...........................................................................................................................................................................67
Table 72: Book/Music/Movie Store Desired...........................................................................................................................................................................67
Table 73: Personal Services Brand Desired .............................................................................................................................................................................68
Table 74: Professional Services Brand Desired .....................................................................................................................................................................68
Table 75: Health Spa/Gym Brand Desired ...............................................................................................................................................................................69
Table 76: High-Level Restaurant Brand Desired...................................................................................................................................................................69
Table 77: Mid-Level Restaurant Brand Desired.....................................................................................................................................................................70
Table 78: Fast Food Restaurant Brand Desired .....................................................................................................................................................................70
Table 79: Coffee Shop Brand Desired..........................................................................................................................................................................................71
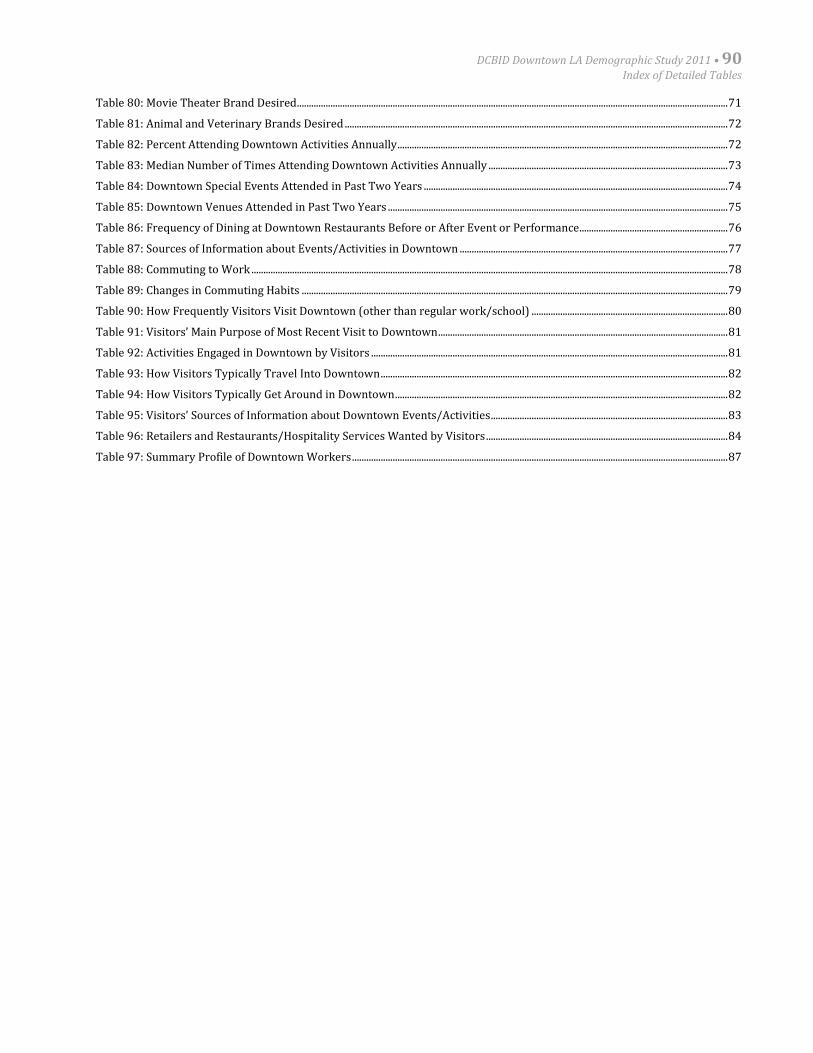
DCBID Downtown LA Demographic Study 2011 • 90Index of Detailed Tables
Table 80: Movie Theater Brand Desired....................................................................................................................................................................................71
Table 81: Animal and Veterinary Brands Desired ................................................................................................................................................................72
Table 82: Percent Attending Downtown Activities Annually..........................................................................................................................................72
Table 83: Median Number of Times Attending Downtown Activities Annually ....................................................................................................73
Table 84: Downtown Special Events Attended in Past Two Years ...............................................................................................................................74
Table 85: Downtown Venues Attended in Past Two Years ..............................................................................................................................................75
Table 86: Frequency of Dining at Downtown Restaurants Before or After Event or Performance..............................................................76
Table 87: Sources of Information about Events/Activities in Downtown ................................................................................................................77
Table 88: Commuting to Work .......................................................................................................................................................................................................78
Table 89: Changes in Commuting Habits ..................................................................................................................................................................................79
Table 90: How Frequently Visitors Visit Downtown (other than regular work/school) ..................................................................................80
Table 91: Visitors’ Main Purpose of Most Recent Visit to Downtown.........................................................................................................................81
Table 92: Activities Engaged in Downtown by Visitors .....................................................................................................................................................81
Table 93: How Visitors Typically Travel Into Downtown.................................................................................................................................................82
Table 94: How Visitors Typically Get Around in Downtown...........................................................................................................................................82
Table 95: Visitors’ Sources of Information about Downtown Events/Activities...................................................................................................83
Table 96: Retailers and Restaurants/Hospitality Services Wanted by Visitors.....................................................................................................84
Table 97: Summary Profile of Downtown Workers.............................................................................................................................................................87