Embed Size (px)
Citation preview

137
http://www.futureofchildren.org
The Cost of ChildhoodUnintentional Injuries and the Value of PreventionTed R. MillerEduardo O. RomanoRebecca S. Spicer
AbstractCost data are useful in comparing various health problems, assessing risks, settingresearch priorities, and selecting interventions that most efficiently reduce healthburdens. Using analyses of national and state data sets, this article presents data onthe frequency, costs, and quality-of-life losses associated with unintentional child-hood injuries in 1996. The frequency, severity, potential for death and disability,and costs of unintentional injury make it a leading childhood health problem.Unintentional childhood injuries in 1996 resulted in an estimated $14 billion inlifetime medical spending, $1 billion in other resource costs, and $66 billion inpresent and future work losses. These injuries imposed quality-of-life losses equiv-alent to 92,400 child deaths. Since Medicaid and other government sources paidfor 39% of the days children spent in hospitals due to unintentional injuries, thegovernment has a financial interest in, and arguably a responsibility for, assuringthe safety of disadvantaged children. Federal agencies, however, devote relativelyfew public dollars to injury prevention research and programming.
Several proven child safety interventions cost less than the medical and otherresource costs they save. Thus, governments, managed care companies, and third-party payers could save money by encouraging the routine use of selected childsafety measures such as child safety seats, bicycle helmets, and smoke detectors.Yet, these and other proven injury prevention interventions are not universallyimplemented.
Injury is a common and costly childhood affliction, accounting forapproximately 15% of medical spending from ages 1 to 19.1 Indeed, forchildren and adolescents 5 to 19 years of age, injury rivals the common
cold in frequency.2 Injuries, however, are much more likely than colds tohave lasting effects. In 1996, unintentional injuries—primarily brain, spinalcord, burn, and limb injuries—left an estimated 150,000 or more childrenand adolescents permanently disabled and often in need of lifetime follow-up care.1 Another 13,000 children and adolescents were killed by uninten-tional injuries in the same year (see the article by Grossman in this journal
The Future of Children UNINTENTIONAL INJURIES IN CHILDHOOD Vol. 10 • No. 1 – Spring/Summer 2000
Ted R. Miller, Ph.D., isprincipal research scien-tist at Pacific Institutefor Research and Eval-uation in Landover,MD, a nonprofit policyresearch organizationspecializing in preven-tive health.
Eduardo O. Romano,Ph.D., is research associ-ate at Pacific Institutefor Research and Eval-uation in Landover,MD, a nonprofit policyresearch organizationspecializing in preven-tive health.
Rebecca S. Spicer, M.P.H.,is associate research sci-entist at Pacific Institutefor Research and Eval-uation in Landover,MD, a nonprofit policyresearch organizationspecializing in pre-ventive health; and adoctoral candidate atthe School of PublicHealth, Department ofHealth Policy andManagement, at JohnsHopkins University.

138 THE FUTURE OF CHILDREN – SPRING/SUMMER 2000
http://www.futureofchildren.org
issue). Coupled with this high death rate, the frequency, severity, anddisabling outcomes of unintentional injuries make them a costly childhoodhealth problem.
Quantifying the costs associated with childhood injuries is important.Cost estimates reduce different outcomes or injuries—deaths, neardrownings, broken legs, or even damaged cars—to a common metric.This makes cost data a useful element in gauging the relative size of vari-ous problems, assessing risks, setting research priorities, and selectinginterventions that most efficiently reduce the burden of injury. For exam-ple, injury costs by diagnosis can inform a decision about whether to usea playground-improvement budget to fix swings (estimated to preventseven broken arms) or to fix slides (estimated to prevent two brokenlegs). Measuring the benefit of interventions in dollars also helps plan-ners and evaluators estimate the “net cost” of a safety investment (that is,the total cost of the investment minus the benefits accrued). On abroader scale, comparably measured costs of injury and illness can pro-vide insight into the relative magnitude of these problems and caninform resource allocation. Finally, cost data can be used for advocacypurposes, by conveying risk reductions in a way that captures the atten-tion of politicians, the media, and the public. For example, a car seat give-away program targeting Medicaid recipients may reduce an infant’s riskof death by 1% and save the government $50. While both risk reductionand government savings are important, communicating the benefit inmonetary terms may be more informative for policymakers concernedwith state or federal budgets.
A widely quoted report, Cost of Injury in the United States: A Report toCongress,3 estimated medical spending and other costs resulting fromchildhood injuries, using data from the mid-1980s. This report providedcost-of-injury estimates that helped draw recognition of injury as a majorpublic health threat. It did not differentiate injuries by intent, however,combining unintentional injuries with intentional harm such as childabuse and homicide. The report also grouped costs by only seven causes—burns, drownings, falls, firearms, motor vehicles, poisonings, and other.These groupings fail to distinguish among important subcategories ofmotor vehicle injuries (that is, occupant, pedestrian, and bicycle) and theydo not capture other important injury categories, such as being struck byor against an object, as often occurs in contact sports. With the arrival ofthe new millennium, these cost estimates are outdated and may no longerportray accurately the burden childhood injuries place on society.
This article defines the costs associated with childhood unintentionalinjuries and briefly reviews the concepts used in estimating injury costs.It then reports estimates of the lifetime costs of childhood unintentionalinjuries using more recent, cause-specific, and child-specific data thanwere previously available. This information allows for a cost comparisonbetween unintentional injuries and other child health problems and itprovides a basis for judging whether injury prevention research and

139The Cost of Childhood Unintentional Injuries and the Value of Prevention
http://www.futureofchildren.org
implementation efforts are adequately funded. To address that questionmore fully, the article closes with a review of cost-effectiveness estimatesfor selected childhood unintentional injury prevention interventionscompared with similar estimates for other child health measures.
Unintentional Injury Costsand Quality-of-Life LossesDefining CostsInjuries among children and adolescentsimpose a financial burden on many seg-ments of society. Parents and health insur-ers, for example, assume responsibility for amyriad of medically related expenses due toinjuries. Parents may be forced to stay homefrom work to care for an injured child,affecting both the family’s income and theemployers’ profit. Children who are dis-abled from an injury may be unable to workin the future. Deciding which of these coststo include in cost-of-injury estimates is criti-cal, because the decision can influence theestimated monetary burden of injuries byorders of magnitude. As recommended bythe Panel on Cost-Effectiveness in Healthand Medicine,4 a nonfederal panel con-vened by the U.S. Public Health Service(PHS), this article adopts a societal perspectivethat attempts to estimate all costs associatedwith childhood unintentional injuries—costs to victims, families, government, insur-ers, and taxpayers. Other perspectives wouldconstrain the analysis to, for example, gov-ernment expenditures or health care payerexpenditures, which include only a subset oftotal injury costs.
Injury costs can be separated intoresource and productivity costs. Resource costsare associated with caring for injury victimsand managing the aftermath of injury inci-dents, and they are dominated by the medicalcosts of injuries. Productivity costs value wagework and housework that children and ado-lescents will be unable to do because of theirinjury, as well as the work that parents orother adults forego to care for injured chil-dren. Box 1 describes more fully the cost-of-injury concepts used in this article.
Because injuries sustained during child-hood may impact the productivity of both chil-dren and their caregivers over time, accountingfor losses to both parties is critical. For example,an employed adolescent temporarily disabledfrom an injury may lose wages in the near term.
Likewise, an injury that keeps a child homefrom school for a few days may require that aparent stay home to act as a caregiver. Sincesuch injuries are relatively frequent among chil-dren, total work losses for adult family mem-bers caring for injured children also are amajor cost. Of course, the most extreme impacton productivity occurs when a child is killed orpermanently disabled by an injury. In suchinstances, a lifetime of work is lost.
Defining Quality-of-Life LossesThis article focuses primarily on resourceand productivity costs associated with child-hood unintentional injuries. However, thesecosts do not fully capture the burden ofinjuries to children. Injuries also affect chil-dren and families by reducing their qualityof life. Families who lose a child to injurymay suffer years of mental anguish. Childrenwho are permanently disabled by injury mayexperience lifelong pain or suffer perma-nent loss of motor or cognitive functioning.To capture these less quantifiable conse-quences of childhood injuries, quality-of-lifelosses, valued in nonmonetary terms asquality-adjusted life years (QALYs), also arereported (see Box 2). Both monetary costsand quality-of-life measures should beconsidered when allocating resources, andboth should be incorporated into cost-effectiveness analyses that weigh “net costs”against quality-of-life improvements.
Estimating Costs and Quality-of-Life LossesThe next section reports findings from ananalysis that estimated the present andfuture costs of childhood unintentionalinjuries that occurred during 1996. Injurieswere included that affected children ages 0to 19 and resulted in a physician office visit,an emergency department visit, a hospital-ization, or a death. Cost-of-injury estimateswere computed by multiplying the numberof injury victims in 1996—stratified by age,diagnosis, severity, and cause—by the corre-sponding costs per victim (in 1996 dollars).Data for these estimates were abstractedfrom the literature and 11 data setsdescribed in Table 1. Table 2 summarizes the

140 THE FUTURE OF CHILDREN – SPRING/SUMMER 2000
http://www.futureofchildren.org
estimated frequency, by severity and age, ofthe childhood unintentional injuries. Thisarticle, however, focuses on injury costs andquality-of-life losses. Total injury costs arereported, as are costs stratified by cause, age,severity, and cost category. Estimated QALYlosses were computed in a similar mannerand are reported following the cost-of-injuryfindings. The methods used to estimateinjury frequency, costs, and quality-of-lifelosses are described more fully in the Appen-dix at the end of this article.
Childhood UnintentionalInjury CostsThe estimated lifetime resource and pro-ductivity costs of unintentional injuries thatoccurred during 1996 to U.S. children ages0 to 19 equal $81 billion (see Table 3). This
estimate summarizes the costs for 22.2 mil-lion children—3 in every 10 children—whosuffered unintentional injuries seriousenough to require medical treatment orcause at least half a day of restricted activity.Of these children, more than 13,000 diedand 292,000 were hospitalized because oftheir injuries. The overwhelming majority ofinjured children, however, did not sustaininjuries severe enough to require a hospitaladmission.
The bulk of the financial burden associ-ated with childhood unintentional injuriesresults from work losses experienced byinjured children and their caregivers. Pre-sent and future productivity lossesaccounted for more than 80% ($66.5 bil-lion) of the total lifetime childhood injury
Cost-of-Injury Concepts
Incidence-Based vs. Prevalence-Based Costs
■ Incidence-based costs are the present value of the lifetime costs that may result frominjuries that occur during a single year. For example, the incidence-based cost ofhead injuries in 1996 estimates total lifetime costs associated with all head injuriesthat occurred in 1996. Incidence-based costs measure the savings that preventioncan yield.
■ Prevalence-based costs measure all injury-related expenses during one year, regard-less of when the injury occurred. For example, the prevalence-based cost of headinjuries in 1996 measures the total health care spending on head injuries during1996, including spending on victims injured many years earlier. Prevalence-basedcost data are needed to project health care spending and evaluate cost controls.
Resource vs. Productivity Costs
Resource costs are broken down into medical costs and other resource costs. Produc-tivity costs include immediate and future work losses due to a childhood injury.
■ Medical costs include emergency medical services, physician, hospital, rehabilita-tion, prescription drug, and related treatment costs, as well as ancillary costs (thatis, for crutches, physical therapy, etc.), funeral/coroner expenses for fatalities, andthe administrative costs of processing medical payments to providers.
■ Other direct costs include police and fire department costs, plus the travel delay foruninjured travelers resulting from transportation crashes and the injuries causedby the crashes.
■ Work-loss costs include victims’ lost wages and the value of lost household work,fringe benefits, and the administrative costs of processing compensation for lostearnings through litigation, insurance, or public welfare programs such as foodstamps and Supplemental Security Income. Work losses by family and friends whocare for injured children also are included.
Box 1

141The Cost of Childhood Unintentional Injuries and the Value of Prevention
http://www.futureofchildren.org
costs. Medical costs made up most of theremainder, accounting for 17% ($13.8 bil-lion) of lifetime costs. Thus, although unin-tentional injuries may be viewedappropriately as a health problem, from acost perspective, injuries are even more aneconomic problem. Each year injuries kill ordisable thousands of otherwise healthy chil-dren before they have had the opportunityto use their talents to benefit society. Thecurrent workforce is affected, too, as manyadult caregivers are forced to stay home totend to injured children.
Costs by Injury SeverityThe most severe childhood injuries—thosethat result in death—disproportionatelycontribute to lifetime injury costs. Fatalinjuries accounted for less than 1% of allchildhood injuries in 1996, but theyaccounted for more than 17% of injury-related costs. By contrast, the least severeinjuries—nonfatal injuries where the childwas not hospitalized—accounted for nearly99% of all childhood injuries, yet they wereassociated with 58% of the estimated life-time costs (see Table 3). Thus, although thevery rare injury fatalities contributed dis-proportionately to the financial burden ofchildhood injuries, the most common and
least severe injuries still accounted for morethan half of the total injury costs.
The severity of childhood injuries alsoaffects the relative contribution of medicalcosts, versus productivity losses, to total injurycosts. When a child suffers a nonfatal injury,for example, caregiver work losses typicallycost much more than medical treatment.Nonetheless, hospital care is expensive, andmedical costs account for a larger proportionof total injury costs among hospitalized(27%) than nonhospitalized (21%) injuredchildren. For children killed from an injury,the overwhelming cost (96%) is the futurework that these children will never do. Med-ical costs account for less than 1% of the totalinjury costs for these victims.
Costs by Age of ChildAs children grow, their motor skills and cog-nitive skills develop and their environmentchanges. Therefore, their injury risks shift.Critical developmental milestones that affectinjury risk may include starting to crawl,walk, attend school, ride a bicycle, drinkalcohol, and drive a car, as well as developingan ability to recognize and make decisionsabout dangerous situations. Thus, injuryrates, causes, and severity vary with age.
Quality-Adjusted Life Years
Estimating quality-adjusted life years (QALYs) is one way to value the good health lost toan individual who suffers a health problem, is disabled, or dies prematurely. A QALY isa measure based on individual preferences for states of health that assigns a value of “1”to a year of perfect health and “0” to death.1 QALY losses are affected by the durationand severity of a health problem. To estimate QALY losses, years of potential life lost toa fatal injury are added to the number of years spent with an injury-related disability mul-tiplied by a “weighting factor” that represents the severity of the disability.2 Such weight-ing factors can be estimated by using rating scales3 or by using trade-off methods that elicit individual preferences between death and various health states.4,5
Endnotes:1 Gold, M.R., Siegel, J.E., Russell, L.B., and Weinstein, M.C., eds. Cost-effectiveness in health and medicine. New York: Oxford
University Press, 1996.2 Following the recommendations of the Panel on Cost-Effectiveness in Health and Medicine (note v), QALY losses in future
years are discounted to present value at a 3% discount rate as they are summed. See note no. 1, Gold, Siegel, Russell, andWeinstein.
3 Hirsch, A., Eppinger, R., Shame, T., et al. Impairment scaling from the abbreviated injury scale. Washington, DC: National Highway Traffic Safety Administration, 1983.
4 Miller, T.R., Pindus, N.M., Douglass, J.B., and Rossman, S.B. Databook on nonfatal injury: Incidence, costs, and consequences.Washington, DC: The Urban Institute Press, 1995.
5 Drummond, M.F., O’Brien, B., Stoddart, G.L., and Torrance, G.W. Methods for the economic evaluation of health care pro-grammes. 2d ed. New York: Oxford Medical Publications, 1997.
Box 2

142 THE FUTURE OF CHILDREN – SPRING/SUMMER 2000
http://www.futureofchildren.org
Name and Years of Other RelevantSource Population Covered Data Used Data Elements Used Information
BLS Annual Survey Annual sample of 1993 Days lost per injury Restricted to of Occupational lost-workday workersIllnesses and occupational Injuries (Bureau incidentsof Labor Statistics)
CHAMPUS Annual summary of 1992–94 • Ratio of professional • Longitudinal forCivilian Health health care claims fees to hospital one year and Medical for about 2 million payments • Few males ages Program of the military dependents • Payments per 18 to 45 Uniformed and retirees nonadmitted case • Few people over Services (U.S. age 65Department ofDefense)
Medstat, Inc. Proprietary health 1987–89 Ratio of medical costs Longitudinal dataclaims data care claims data on over time for child versus on children and (leased employer-insured adult injury victims with adults under ageproprietary data) families comparable diagnoses 65
NAMCS Sample of doctor’s 1995–96 Cause distribution (for —National office and clinic incidence estimates)Ambulatory visitsMedical CareSurvey (NationalCenter for HealthStatistics [NCHS])
NCCI Sample of workers’ 1979–87 • Percentage of • Longitudinal Detailed claims compensation lost- 1992–96 medical payments in datadatabase work claims first year • Workdays lost to (National Council • Disability probabilities qualify varies by on Compensation stateInsurance)
NHAMCS Sample of hospital 1992–96 Cause distribution (for Initial visits are hardNational Hospital emergency depart- incidence estimates) to distinguishAmbulatory ment visitsMedical CareSurvey (NCHS)
NHDS Annual sample of 1996 • Hospital admissions by Only 63% causeNational Hospital hospital discharges age and cause codedDischarge Survey • Length of stay (NCHS) • Percentage
discharged to nursing home
• Payer distribution
NHIS Household interview 1987–96 • Nonadmitted injury • Self-reportedNational Health survey cases diagnosesInterview Survey • Work-loss probabilities • Data covers the (NCHS) two weeks prior
to interview
Table 1
Summary of Data Sources Used for Cost-of-Injury Analysis

143The Cost of Childhood Unintentional Injuries and the Value of Prevention
http://www.futureofchildren.org
Adolescents, and to a lesser extent youngchildren ages zero to four, experiencehigher rates of unintentional injuries thatare fatal or require hospitalization com-pared with children ages 5 to 14 (see Table2). Similarly, injury costs are higher amongadolescents than other children. The totallifetime resource and productivity costs ofunintentional injuries that occurred in 1996are estimated to be $28 billion amongteenagers 15 to 19 years of age. Amongschool-age and younger children, costs areconsiderably less ($19 billion among 0- to 4-year-olds, $20 billion among 5- to 9-year-olds,and $14 billion among 10- to 14-year-olds).Adolescents ages 15 to 19 also have higherlifetime costs per child due to unintentionalinjury ($1,500) compared with younger chil-dren or adults (see Figure 1).
The higher total injury costs among ado-lescents reflect the greater absolute numberof serious and fatal injuries that occur in thisage group and the types of injuries sus-tained. Approximately 6,900 youths ages 15to 19 died from unintentional injuries thatoccurred in 1996—more than the numberof deaths from unintentional injuries in allother age groups combined (6,400 deaths).The higher number of adolescent fatalitiestranslates into higher total injury costs in thisage group, since teenagers who are killedlose a lifetime of future work. The causes of
injuries sustained by adolescents also tend toresult in the most costly injuries per victim.For example, as shown in Table 4, firearminjuries are one of the most costly causes ofunintentional childhood injury per victim,and such injuries, although rare, occurmuch more frequently among adolescentsthan children in any other age group(data not shown). These troubling statisticsrelated to adolescent injury costs should notbe a surprise. Adolescence is a time of learn-ing and a time of testing, so teenagers areprone to engage in dangerous activities thatcan prove costly.
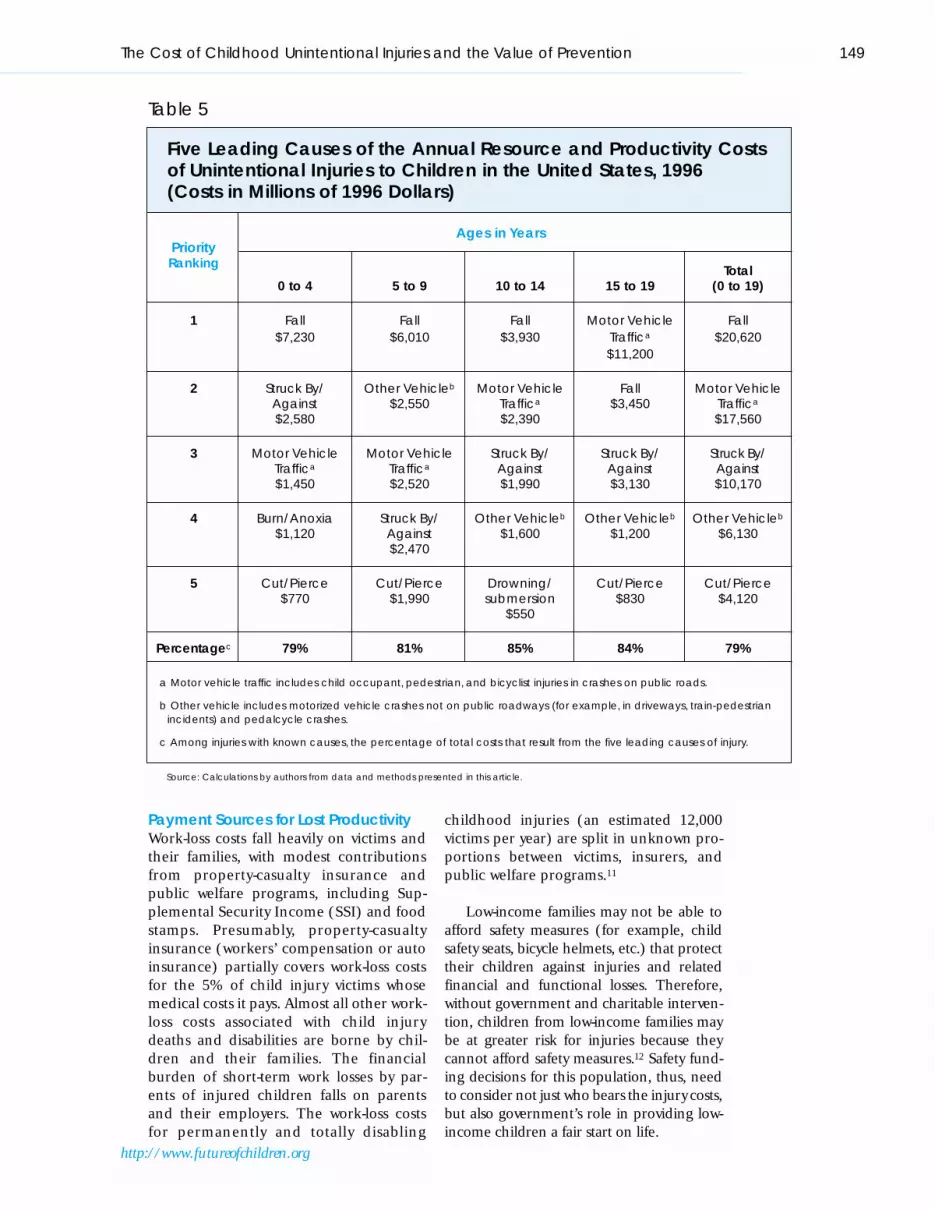
Costs by Cause of InjuryFive primary causes of unintentional injuryaccount for almost 80% of total lifetime costsamong children ages 0 to 19.5 As shown inTable 5, these causes include falls, motorvehicle crashes on public roads (includesoccupant, pedestrian, or bicyclist injuries),being struck by or against an object orperson, vehicle crashes not on publicroads, and cutting or piercing. These fivecauses of unintentional injuries contributesubstantially to overall injury costs becausethe combination of their frequency in thepopulation and the average cost per victim isexceedingly high.
The relative importance of frequencyversus cost per case, however, varies by type
Name and Years of Other RelevantSource Population Covered Data Used Data Elements Used Information
NMES Household interview 1987 (most • Medical costs by Cases identifiedNational Medical survey, with provider recent; updates hospital admission by self-reports fromExpenditure follow-up Rice and status and nature of 14,000 householdsSurvey (NCHS) MacKenzie’s expense
1980 data) • Visits per case
U.S.Vital Statistics Annual census of 1996 Deaths by age, sex, and Cases of unknown(NCHS) deaths cause (for incidence intent were treated
estimates, productivity as unintentionalcomputations)
Pooled six state Annual census of CA 1993 • Cause distribution (for Regressions hospital discharge hospital discharges MD 1994–95 incidence estimates) modeled effectssurveys MO 1994 • Cost per day of stay of age and sex on(purchased from NY 1994 from MD and NY cost per daythose states) VT 1990 • Readmission rates
WA 1989–91 from MO
Table 1 (continued)
Summary of Data Sources Used for Cost-of-Injury Analysis

144 THE FUTURE OF CHILDREN – SPRING/SUMMER 2000
http://www.futureofchildren.org
of injury. For example, although individualfalls are not unreasonably costly ($4,200 pervictim as shown in Table 4), estimates fromthis analysis found that falls are the leadingcause of injury hospitalization among chil-dren (data not shown). It is primarily becauseof their frequency in the population that fallscause the most costly childhood uninten-tional injuries overall. In contrast, althoughmotor vehicle crashes that injure childrenoccur much less frequently than falls, theresulting injuries are often severe and costly.It is primarily the severity of such injuries thatmake motor vehicle traffic crashes the secondleading contributor to total unintentionalinjury costs among children.
The relative importance of various injurycauses to total injury costs is different when costper victim is estimated rather than total cost (seeTable 4). Drowning or submersion, for exam-ple, causes the most expensive injuries, at$21,000 per victim. Motor vehicle-pedestrian($20,500), motor vehicle-pedalcycle ($17,600),and unintentional firearm ($17,400) cause thenext most costly injuries per victim. Althoughhigh-cost injuries occur less frequently thanmany unintentional injury causes among chil-dren and adolescents, the severity of theinjuries and the long-term disability and deathsthat often result make them extremely expen-sive when they do occur.
Finally, the importance of the five mostcostly unintentional injury causes is fairlyconsistent across the child age categories,although their relative importance differs(see Table 5). For example, through age 14,falls are the most costly cause of uninten-tional injury. Among 15- to 19-year-olds, how-ever, motor vehicle crashes displace falls asthe most costly cause of injury. Also, somecauses only show up as leading contributorsfor one age group. For example, burns areamong the five leading causes of injury costsonly for infants and young children ages 0 to4, while drowning or submersion makes thelist only for children ages 10 to 14 (where itedges out cutting and piercing injuries,which are the fifth leading contributors forother age groups).
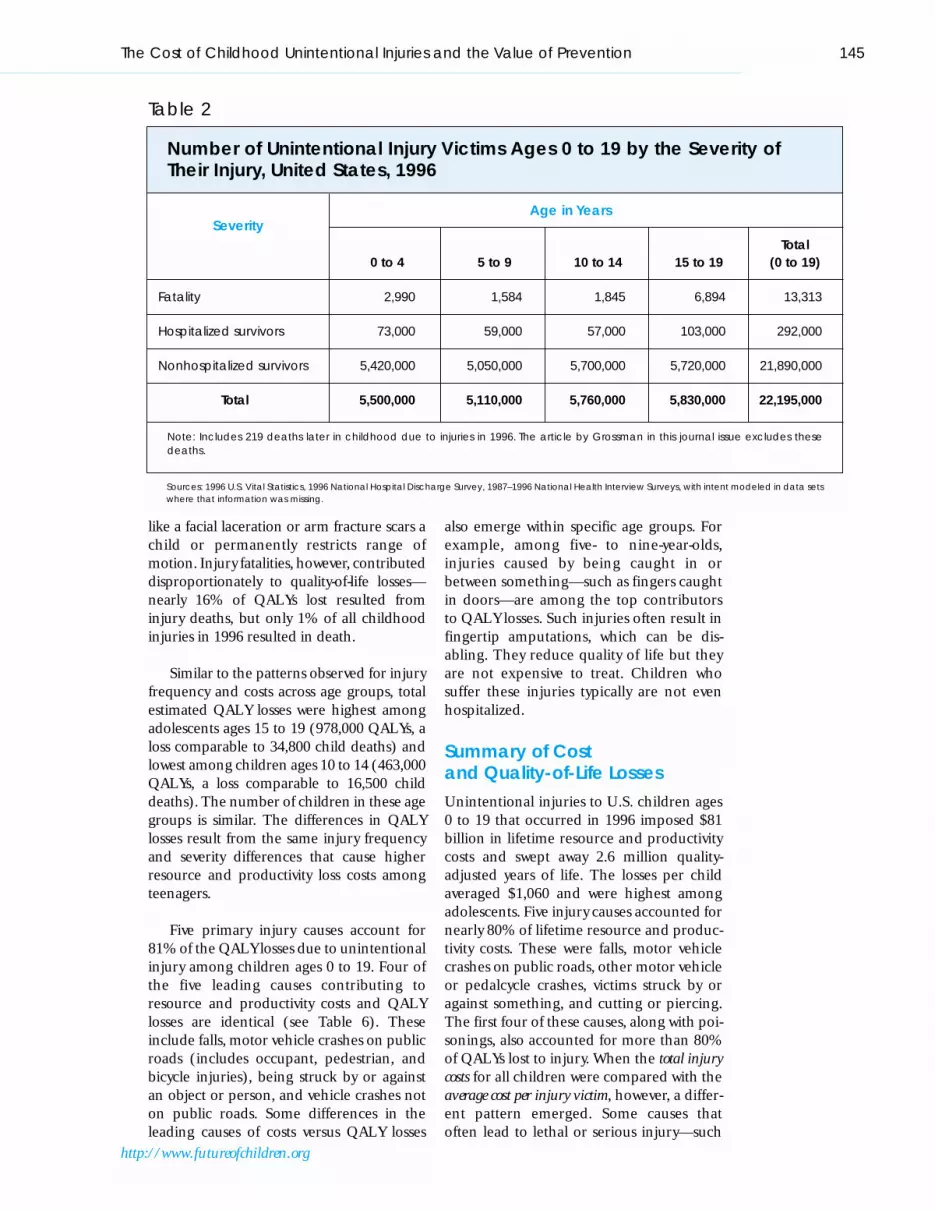
Quality-of-Life LossesUnintentional injuries among childrenimpose more than monetary costs on society.Such injuries also reduce the quality of life forinjured children and their families. Childreninjured in 1996 lost the equivalent of 2.7 mil-lion years of life, a loss comparable to 92,400child deaths.6 Nearly half of QALYs lost wereassociated with nonfatal injuries that did notrequire hospitalization (see Table 3). Thelosses for these injuries result from short-termand long-term disabilities that arise whencomplications develop or a nonfatal injury
PHOTO OMITTED
145The Cost of Childhood Unintentional Injuries and the Value of Prevention
http://www.futureofchildren.org
like a facial laceration or arm fracture scars achild or permanently restricts range ofmotion. Injury fatalities, however, contributeddisproportionately to quality-of-life losses—nearly 16% of QALYs lost resulted frominjury deaths, but only 1% of all childhoodinjuries in 1996 resulted in death.
Similar to the patterns observed for injuryfrequency and costs across age groups, totalestimated QALY losses were highest amongadolescents ages 15 to 19 (978,000 QALYs, aloss comparable to 34,800 child deaths) andlowest among children ages 10 to 14 (463,000QALYs, a loss comparable to 16,500 childdeaths). The number of children in these agegroups is similar. The differences in QALYlosses result from the same injury frequencyand severity differences that cause higherresource and productivity loss costs amongteenagers.
Five primary injury causes account for81% of the QALY losses due to unintentionalinjury among children ages 0 to 19. Four ofthe five leading causes contributing toresource and productivity costs and QALYlosses are identical (see Table 6). Theseinclude falls, motor vehicle crashes on publicroads (includes occupant, pedestrian, andbicycle injuries), being struck by or againstan object or person, and vehicle crashes noton public roads. Some differences in theleading causes of costs versus QALY losses
also emerge within specific age groups. Forexample, among five- to nine-year-olds,injuries caused by being caught in orbetween something—such as fingers caughtin doors—are among the top contributorsto QALY losses. Such injuries often result infingertip amputations, which can be dis-abling. They reduce quality of life but theyare not expensive to treat. Children whosuffer these injuries typically are not evenhospitalized.
Summary of Cost and Quality-of-Life LossesUnintentional injuries to U.S. children ages0 to 19 that occurred in 1996 imposed $81billion in lifetime resource and productivitycosts and swept away 2.6 million quality-adjusted years of life. The losses per childaveraged $1,060 and were highest amongadolescents. Five injury causes accounted fornearly 80% of lifetime resource and produc-tivity costs. These were falls, motor vehiclecrashes on public roads, other motor vehicleor pedalcycle crashes, victims struck by oragainst something, and cutting or piercing.The first four of these causes, along with poi-sonings, also accounted for more than 80%of QALYs lost to injury. When the total injurycosts for all children were compared with theaverage cost per injury victim, however, a differ-ent pattern emerged. Some causes thatoften lead to lethal or serious injury—such
Age in YearsSeverity
Total0 to 4 5 to 9 10 to 14 15 to 19 (0 to 19)
Fatality 2,990 1,584 1,845 6,894 13,313
Hospitalized survivors 73,000 59,000 57,000 103,000 292,000
Nonhospitalized survivors 5,420,000 5,050,000 5,700,000 5,720,000 21,890,000
Total 5,500,000 5,110,000 5,760,000 5,830,000 22,195,000
Note: Includes 219 deaths later in childhood due to injuries in 1996. The article by Grossman in this journal issue excludes thesedeaths.
Table 2
Number of Unintentional Injury Victims Ages 0 to 19 by the Severity ofTheir Injury, United States, 1996
Sources: 1996 U.S. Vital Statistics, 1996 National Hospital Discharge Survey, 1987–1996 National Health Interview Surveys, with intent modeled in data setswhere that information was missing.

146 THE FUTURE OF CHILDREN – SPRING/SUMMER 2000
http://www.futureofchildren.org
as unintentional firearm injury and drown-ing or submersion—had the highest costsper victim. Because these causes are rela-tively infrequent, however, they did not con-tribute substantially to total injury costs.
The Implications of InjuryCosts for Investing in SafetyBehaviors and PracticesThe first part of this article examined thelifetime costs and quality-of-life losses associ-ated with childhood unintentional injuriesthat occurred during 1996. The followingsections explore the implications of thesecosts for decisions about policy investmentsin safety behaviors and practices. Specifically,the sections examine how the medical costsand lost productivity of childhood uninten-tional injuries compare with the costs ofother child health problems, with emphasison a payer’s perspective. This analysis pointsto the government as a major player in child-hood injury prevention and control. It alsoraises the question of whether the level ofgovernment funding for injury preventionresearch makes sense relative to the overallsize of the problem and the costs incurred.In part, funding priorities depend onwhether strategies for preventing childhood
injuries are cost effective relative to strategiesaimed at preventing other major childhealth problems.
Comparing Costs and Sourcesof Payment for Childhood Injuryand IllnessThe estimated medical costs of childhoodinjuries are comparable to the costs associ-ated with low birth weight, an importanthealth problem afflicting children in theUnited States. On a prevalence basis (asdefined in Box 1), roughly 13% of all med-ical spending on children ages 1 to 19during 1996 was used to treat unintentionalinjuries; these injuries accounted for 11%of hospital admissions, 39% of nonadmit-ted emergency department visits, and 9%of physician office visits for this age group.7Analyses performed for this article suggestthat prevalence-based medical spending onunintentional injury during 1996 totaled$13 billion for children ages 0 to 19. Bycomparison, the estimated prevalence-based medical spending on low birthweight during 1996 was $9 billion to $10 bil-lion for children from birth through age14.8 Thus, unintentional injuries to chil-dren impose a health care burden relatively
Other PercentageMedical Resource Productivity Total Percentage QALYs of QALYs
Costs Costs Costs Costs of Total Lost Lost
Fatal Injuries $110 $382 $13,400 $13,900 17.1% 412,000 15.5%
Hospital- $4,000 $10 $16,100 $20,100 24.7% 957,000 36.0%AdmittedInjuries
Other Injuries $9,700 $660 $37,000 $47,400 58.2% 1,287,000 48.5%
Total $13,800 $1,100 $66,500 $81,400 100.0% 2,656,000 100.0%
Percentage 17.0% 1.4% 82.1% 100.0% — — —of Total
Note: Computed at a 3% discount rate. Row and column totals differ due to rounding.
Table 3
Estimated Lifetime Resource and Productivity Costs and QALY Losses Due to Unintentional Injuries to Children Ages 0 to 19 in the United States, 1996(Costs are in Millions of 1996 Dollars)
Source: Calculations by authors from data and methods presented in this article.

similar in magnitude to another majorchild health problem—low birth weight.
In terms of lost productivity, unintentionalinjuries are more costly than child illnesses. In1996, 43% of all deaths and related futurework-loss costs among children and adoles-cents ages 1 to 19 were the result of uninten-tional injury, while only 35% resulted fromillness (with the remaining 22% resultingfrom intentional injury). Thus, fatal uninten-tional injuries caused greater work-relatedproductivity losses than all fatal childhood ill-nesses combined.
Given the tremendous financial burdenof childhood injuries, in terms of both med-ical and future productivity costs, investingin effective injury prevention makes sense.Who should invest in prevention, however,largely depends on who pays the costs asso-ciated with childhood injuries. The remain-der of this section examines separately thepayment sources for injury-related medicalcosts versus lost productivity costs.
Payment Sources for Medical CostsThe largest share of the medical costs ofinjuries are paid by private insurers andMedicaid (the government program for low-income children and families). Private insur-ers paid for 43% of the days children spent inhospitals due to unintentional injury, whilegovernment sources, primarily Medicaid,paid for another 39%, according to the1996 National Hospital Discharge Survey(NHDS).9 For other childhood illnesses, gov-ernment sources paid for nearly half (49%)of hospital days, while private insurers paidfor 40%. One reason for the lesser relianceon government funding for injury hospital-izations is the presence of property-casualtyinsurance (auto, home, and workers’ com-pensation), which NHDS states is the payerfor at least 5% of the injury costs but none ofthe illness costs. Also, costly low birth weightand related perinatal problems are concen-trated in the Medicaid population,10 andhealth care responsibility for children withpermanently disabling and costly chronic ill-nesses gravitates toward government.
147The Cost of Childhood Unintentional Injuries and the Value of Prevention
http://www.futureofchildren.org
Source: Calculations by authors from data and methods presented in this article.
Figure 1
Lifetime Costs per Child Resulting from Unintentional Injuriesin 1996 by Age Group
$0
$200
$400
$600
$800
$1,000
$1,200
$1,400
0 to 4 5 to 9 10 to 14 15 to 19 Average0 to 19
Age Group
Life
time
Co
sts
(pe
r Chi
ld)

148 THE FUTURE OF CHILDREN – SPRING/SUMMER 2000
http://www.futureofchildren.org
Per Victim Percentage of Total
Cause Resource Resourceand and
Productivity QALY Productivity QALYCost Loss Cost Loss
Bites and Stings $2,300 0.016 3% 1%
Burn/Anoxia $4,500 0.112 3% 2%
Caught In/Between Objects $1,900 0.105 1% 2%
Cut/Pierce $2,200 0.039 5% 3%
Drowning/Submersion $21,000 0.374 3% 2%
Fall $4,200 0.130 27% 25%
Firearm $17,400 1.055 1% 2%
Motor Vehicle Traffic Occupant $9,300 0.314 18% 19%
Motor Vehicle Traffic Pedalcycle $17,600 0.626 1% 1%
Motor Vehicle Traffic Pedestrian $20,500 0.721 3% 3%
Natural Environment $3,000 0.226 1% 1%
Other Pedalcycle $4,900 0.142 5% 4%
Other Pedestrian-Vehicle $2,300 0.124 1% 1%
Other Vehicle $12,800 0.511 3% 3%
Overexertion $1,600 0.044 1% 1%
Poisoning $300 0.046 1% 4%
Struck By/Against $3,400 0.082 13% 9%
Suffocation and Choking $11,000 0.412 1% 1%
Other Known Cause $3,700 0.137 1% 1%
Unknown $1,900 0.104 10% 16%
Total $3,600 0.119 100% 100%
Note: Percentages may not total 100% due to rounding.
Table 4
Burden of Childhood Unintentional Injury by Cause, per Victim, andas a Percentage of Total
Source: Calculations by authors from data and methods presented in this article.
149The Cost of Childhood Unintentional Injuries and the Value of Prevention
http://www.futureofchildren.org
Payment Sources for Lost ProductivityWork-loss costs fall heavily on victims andtheir families, with modest contributionsfrom property-casualty insurance andpublic welfare programs, including Sup-plemental Security Income (SSI) and foodstamps. Presumably, property-casualtyinsurance (workers’ compensation or autoinsurance) partially covers work-loss costsfor the 5% of child injury victims whosemedical costs it pays. Almost all other work-loss costs associated with child injurydeaths and disabilities are borne by chil-dren and their families. The financialburden of short-term work losses by par-ents of injured children falls on parentsand their employers. The work-loss costsfor permanently and totally disabling
childhood injuries (an estimated 12,000victims per year) are split in unknown pro-portions between victims, insurers, andpublic welfare programs.11
Low-income families may not be able toafford safety measures (for example, childsafety seats, bicycle helmets, etc.) that protecttheir children against injuries and relatedfinancial and functional losses. Therefore,without government and charitable interven-tion, children from low-income families maybe at greater risk for injuries because theycannot afford safety measures.12 Safety fund-ing decisions for this population, thus, needto consider not just who bears the injury costs,but also government’s role in providing low-income children a fair start on life.
Ages in YearsPriority
TotalRanking
0 to 4 5 to 9 10 to 14 15 to 19 (0 to 19)
1 Fall Fall Fall Motor Vehicle Fall$7,230 $6,010 $3,930 Traffica $20,620
$11,200
2 Struck By/ Other Vehicleb Motor Vehicle Fall Motor VehicleAgainst $2,550 Traffica $3,450 Traffica
$2,580 $2,390 $17,560
3 Motor Vehicle Motor Vehicle Struck By/ Struck By/ Struck By/Traffica Traffica Against Against Against$1,450 $2,520 $1,990 $3,130 $10,170
4 Burn/Anoxia Struck By/ Other Vehicleb Other Vehicleb Other Vehicleb
$1,120 Against $1,600 $1,200 $6,130$2,470
5 Cut/Pierce Cut/Pierce Drowning/ Cut/Pierce Cut/Pierce$770 $1,990 submersion $830 $4,120
$550
Percentagec 79% 81% 85% 84% 79%
a Motor vehicle traffic includes child occupant, pedestrian, and bicyclist injuries in crashes on public roads.
b Other vehicle includes motorized vehicle crashes not on public roadways (for example, in driveways, train-pedestrianincidents) and pedalcycle crashes.
c Among injuries with known causes, the percentage of total costs that result from the five leading causes of injury.
Table 5
Five Leading Causes of the Annual Resource and Productivity Costsof Unintentional Injuries to Children in the United States, 1996 (Costs in Millions of 1996 Dollars)
Source: Calculations by authors from data and methods presented in this article.

Are Current Federal FundingPatterns for Health CareResearch Sensible?
As with illness, government plays a major rolein funding childhood injury prevention andcontrol efforts. Evidence reported in otherarticles in this journal issue indicate thateffective prevention strategies exist for manycauses of childhood injury, including motorvehicle crashes, bicycle injuries, and residen-tial fires (see the articles by DiGuiseppi andRoberts, by Klassen and colleagues, bySchieber, Gilchrist, and Sleet, and by Mal-lonee in this journal issue). Furthermore, asdiscussed in the next section of this article,cost-effectiveness estimates indicate thatinjury prevention strategies of proven effec-tiveness often are a good investment worthyof wider implementation. Taken together,
these findings—that effective and cost-effectiveinjury prevention strategies exist—suggestthat government funding priorities shouldbe commensurate with the prevalence andcost of childhood unintentional injuries rela-tive to other child health problems.
To gain insight into the federal govern-ment’s allocation of resources for injury pre-vention versus prevention of major illnesses,recent estimates of total federal civilianinjury prevention and treatment researchspending levels (fiscal year 1995–96) werecompared with National Institutes of Health(NIH) research budgets for two other lead-ing health problems—vascular disease(heart attack and stroke) and cancer.13
Prevalence-based estimates of medicalspending for all ages in 1996 and publishedestimates of years of potential life lost also
150 THE FUTURE OF CHILDREN – SPRING/SUMMER 2000
http://www.futureofchildren.org
Ages in YearsPriority
TotalRanking
0 to 4 5 to 9 10 to 14 15 to 19 (0 to 19)
1 Fall Fall Fall Motor Vehicle Fall216,800 216,800 109,200 Traffica 648,000
364,600
2 Motor Vehicle Motor Vehicle Motor Vehicle Fall Motor VehicleTraffica Traffica Traffica 105,200 Traffica
52,800 89,700 89,200 596,300
3 Struck By/ Struck By/ Other Vehicleb Struck By/ Struck By/Against Against 77,700 Against Against44,400 53,600 97,800 248,000
4 Burn/Anoxia Other Vehicleb Struck By/ Other Vehicleb Other Vehicleb
31,700 53,100 Against 56,900 212,90052,200
5 Other Vehicleb Caught In/ Poisoning Poisoning Poisoning25,200 Between 16,000 53,400 92,600
19,700
Percentagec 73% 90% 85% 83% 81%
a Motor vehicle traffic includes child occupant, pedestrian, and pedalcyclist injuries in crashes on public roads.b Other vehicle includes motorized vehicle crashes not on public roadways (for example, in driveways, train-pedestrian
incidents) and pedalcycle crashes.c Among injuries with known causes, the percentage of total costs that result from the five leading causes of injury.
Table 6
Five Leading Causes of the Annual QALY Losses from UnintentionalInjuries to Children in the United States, 1996
Source: Calculations by authors from data and methods presented in this article.

151The Cost of Childhood Unintentional Injuries and the Value of Prevention
http://www.futureofchildren.org
were compared for these three health prob-lems.14 Unfortunately, research spending onchildren could not be separated from gov-ernment estimates, so estimates for all agescombined are reported here. Preventionversus treatment research spending alsocould not be separated in this analysis.
Federal spending for research on injuries,vascular disease, and cancer contrastedsharply with the relative burdens of thesehealth problems, measured by medicalspending and years of potential life lost. Asshown in Figure 2, although injury, vasculardisease, and cancer accounted for similar pro-portions of medical spending (12%, 14%,
and 9% respectively), research funding inthese areas varied substantially (2.4%, 5.9%,and 10.5% respectively). Estimated researchspending on vascular disease ($900 million)was approximately 2.4 times higher than esti-mated research spending on injuries ($370million), and spending on cancer research($1.6 billion) was more than four timeshigher than injury research spending. Thus,relative to problem size, research spendingon injuries is much lower than researchspending on vascular disease or cancer.
The estimated injury research spendingdata used in this analysis was compiled by afederal agency,13 but it should be interpreted
Sources: Computations by authors from data in National Center for Injury Prevention and Control. Inventory of federally fundedresearch in injury prevention and control, 1995. Database. Atlanta, GA: Centers for Disease Control, 1997; National Institutes ofHealth Web site; Bureau of the Census. Statistical Abstract of the United States 1997. Washington, DC: U.S. Government PrintingOffice, 1997, Tables 144 and 153; and National health care data sets.
Figure 2
Years of Potential Life Lost, Medical Spending, and Research Budgets for Injury, Vascular Disease (Heart Disease and Stroke),and Cancer
Injuries Vascular Disease Cancer
0
5
10
15
20
25
30
Medical Spending
Years of Potential Life Lost
Research Spending
Perc
ent
ag
e

cautiously since injury research funding isdiffused across many federal agencies,which makes it difficult to identify. Yet,although it is difficult to assess current fund-ing levels for injury prevention, increasedfunding is warranted. Unfortunately, thetrend is not in this direction. Alarmingly,based on the fiscal year 2000 federal budget,it is likely that the Preventive Health Ser-vices Block Grant—which has supportedmany state injury prevention programs aswell as chronic disease prevention—will bereduced in future years.15 Moreover, somepolicymakers are arguing that the remain-ing funds should be targeted for chronic
disease only. The return on investment forinjury prevention strategies shown in thecost-effectiveness analyses reported in thisarticle should be carefully weighed by thesedecision makers.
How Cost Effective Are Childhood Injury PreventionStrategies?Estimating the cost effectiveness of injuryprevention strategies relative to the costeffectiveness of efforts aimed at mitigatingother child health problems is useful toinform decisions about the allocation ofscarce resources. For example, the costs andoutcomes of one intervention (such as childsafety seat use) can be compared with thecosts and outcomes of another intervention(such as immunizations) when the out-comes measured are the same. In health-related studies, the outcome consideredmost frequently is good health measured inQALYs. With cost-effectiveness estimates,decision makers may decide to invest, forexample, only in interventions that save aspecified number of QALYs for a given cost.Alternatively, they may decide to invest inone intervention over another because it hasa more favorable cost-effectiveness ratio(that is, cost per QALY is lower).
This section summarizes the cost effec-tiveness of seven childhood injury preventionmeasures that published studies havedemonstrated to be effective (see Table 7).16
These seven measures were selected becausethey primarily focus on unintentional child-hood injuries, cover a range of risks andapproaches, have reasonably strong evidencefor effectiveness, and were analyzed usinguniform methods for estimating injury costsand cost effectiveness. The cost effectivenessof these injury prevention strategies is com-pared with published cost-effectiveness esti-mates for measures that have been widelyused to prevent other important neonataland childhood problems, including neonatalintensive care, phenylketonuria screening,and measles/mumps/rubella immunization.The data presented here suggest that manychildhood injury prevention strategies havesimilar cost-effectiveness ratios comparedwith other well-accepted strategies to preventchildhood illnesses. Yet, implementation ofchildhood injury prevention strategies isnot widespread.
The Cost Effectiveness of SelectedChild Safety MeasuresTable 7 lists the seven child safety measuresexamined and the cost per QALY savedfrom society’s perspective.17–22 Each safetymeasure, the evidence for its effectiveness,and cost-effectiveness estimates based onprevious analyses are summarized below.23
■ Child Safety Seats. A national study of out-comes in crashes where two infants or tod-dlers were restrained differently24 providedeffectiveness estimates for analyzing the costeffectiveness of child safety seats.17 Thestudy estimated that, based on actual use,child safety seats were 54% effective againstchild occupant fatalities and 52% effectiveagainst nonfatal injuries. These data werecombined with retail purchase price datafor a no-frills convertible seat that can beused for infants and toddlers, with a 20%allowance added to cover parent educationabout need and installation. Applying theseestimates, child safety seats yielded net costsavings.17 This finding holds even if oneadds the cost of passing child seat laws andthe time spent by parents buying and learn-ing to use a seat. These estimates ignorechild discomfort costs and offsetting bene-fits from reduced driver distraction when atoddler is not free to roam in the vehicle.
152 THE FUTURE OF CHILDREN – SPRING/SUMMER 2000
http://www.futureofchildren.org
The study estimated that, based on actualuse, child safety seats were 54% effectiveagainst child occupant fatalities and 52%effective against nonfatal injuries.

153The Cost of Childhood Unintentional Injuries and the Value of Prevention
http://www.futureofchildren.org
■ Zero Alcohol Tolerance Laws. Every state haspassed zero alcohol tolerance laws making itillegal for adolescents under age 21 to drivewith a blood alcohol level of 0.02% orgreater.25 Two multistate studies estimated thatthese laws reduced alcohol-related crashesamong young drivers by 20%.25,26 The primarycost of these laws is the freedom that youthslose to drink illegally and then drive; policeenforcement and sanctioning impose muchsmaller costs. Accounting for these costs, zerotolerance laws yielded net cost savings.19
■ Graduated Licensing with Midnight DrivingCurfews. A broader approach to reducing thecosts of automobile crashes by young driversis graduated licensing, discussed by Schieber,Gilchrist, and Sleet in this journal issue. Thecost effectiveness of graduated licensing pro-grams that impose a midnight driving curfewuntil the driver turns 19 years of age or drivesfor at least six consecutive months without acrash or moving violation has been esti-mated.19 Drawing on evidence from threeprograms, researchers estimated that crashesinvolving novice drivers decline by 5% withthese programs in place.27–29 The largest costof this intervention is lost mobility for young
drivers (loss of the ability to legally drive inde-pendently between midnight and 5:00 A.M.,plus loss of the ability to drive legally when alicense is revoked or suspended for curfewviolation). Enforcement and sanctioningimpose further costs. Nonetheless, takingthese costs into account, the graduatedlicensing model yielded net cost savings.
■ Bicycle Helmet Use. The cost effectiveness ofa bicycle safety helmet purchased at a retailcost of $25, as well as the cost effectiveness ofa bulk distribution program that deliveredhelmets at half this price, have been ana-lyzed.18 The estimated effectiveness of bicyclehelmets taken from case-control studiesshowed that, even when misuse was consid-ered, helmets prevented 68% to 85% of non-fatal head and scalp injuries and 65% ofupper and middle face injuries.30–32 Ignoringchildren’s discomfort and inconveniencecosts and the time spent shopping for ahelmet, the study estimated that bicycle hel-mets offered net cost savings if at least half ofchildren with helmets wore them. Additionalanalyses conducted for this article estimatedthat if 85% of children who ride a bicyclewear a helmet, helmet use offers a net cost
Injury Prevention Measure* Cost per QALYa
Child Safety Seat17 <$0**
Zero Tolerance of Alcohol, Drivers under Age 2119 <$0
Provisional Licensing, Midnight Curfew19 <$0
Bicycle Helmet, Ages 5 to 1518 <$0**
Smoke Detector20 <$0
Childproof Cigarette Lighter21 $4,000
Poison Control Center22 <$0
a All estimates were computed at a 3% discount rate and are compared with the absence of the inter-vention. The cost per QALY saved was computed by dividing the QALYs saved per unit by the net cost ofthe unit (which equals the unit cost minus the reduced medical care, property damage, insurance claimsadministration, and other direct costs). When these direct cost savings exceeded the cost of the safetymeasure, the cost per QALY saved is <$0.
Table 7
Costs per QALY for Selected Injury Prevention Measures(in 1997 Dollars)
* See related endnotes at the end of this article.
** Ignores discomfort and inconvenience costs.
savings, even accounting for time spent shop-ping. This may be a realistic usage goal,based on helmet use estimates following theenactment of legislation in Georgia, where90% of parents reported that their childrenwho owned a helmet wore it on their mostrecent ride, with reported helmet use stableacross family income levels.33
■ Smoke Detectors. The cost effectiveness ofbattery-operated smoke detectors has beenanalyzed20 using National Bureau of Stan-dards engineering estimates that smokedetectors are 45% effective against deathsand 30% effective against nonfatal injuries.34
The cost-effectiveness estimates reportedhere further assume that smoke detectorsare 10% effective against property damage.Smoke detectors are not strictly child safetydevices; they also benefit children by savingtheir parents and grandparents. The cost-effectiveness analysis accounted for time andmoney spent buying, installing, and main-taining an average of 1.6 smoke detectorsper home. Using these estimates, smokedetectors offer net cost savings.20
■ Child-Safe Cigarette Lighters. In 1993, theU.S. Consumer Product Safety Commission(CPSC) required that all cigarette lightershave a dual-action catch that children ageszero to five cannot readily operate.21 TheCPSC used engineering and experimentalresearch to estimate the effectiveness as
approximately a 70% reduction in firesstarted by children ages zero to five playingwith lighters. This change in product designcost $.15 per cigarette lighter. The regulationcosts $3,000 to $4,000 per QALY saved.21
■ Poison Control Centers. Poison control cen-ters, professionally staffed sources of freetelephone advice about how to respond toand prevent potentially toxic exposures,have been shown to reduce the unnecessaryuse of health care services.22 Studies fromtwo jurisdictions where services becameunavailable estimated that the centersappropriately reduced medical visits for poi-soning by more than 37%.35,36 The cost perpoison control center telephone call camefrom a national summary of center financialreports.37 Using these estimates, poison con-trol center calls yield net cost savings.22 Ananalysis of the robustness of this finding inregards to changes in the estimated effec-tiveness found that poison control centersoffer net cost savings as long as the estimatedreduction in medical visits is at least 7%.22
Comparison with the Cost Effectivenessof Other Child Health RisksTo further interpret the cost-effectivenessanalyses of childhood injury preventionefforts, similar estimates of cost per QALYsaved for seven other neonatal and childhealth risks were examined (see Table 8).These examples were selected because the
154 THE FUTURE OF CHILDREN – SPRING/SUMMER 2000
http://www.futureofchildren.org
PHOTO OMITTED

155The Cost of Childhood Unintentional Injuries and the Value of Prevention
http://www.futureofchildren.org
cost-effectiveness studies were of good qual-ity, used or could be converted to a 3% dis-count rate, and represented diverseapproaches to child risk reduction.38–41
Many of these estimates—including cerealfortification with folic acid, selected new-born vaccinations, and newborn screeningfor phenylketonuria—offered net cost sav-ings. Efforts to reduce cigarette sales tominors cost $1,000 per QALY saved. Hepati-tis B vaccination of newborns and neonatalintensive care were less cost effective. Thecost estimates in these studies all focused onthe costs of delivering health care, food sup-plements, or health education. Theyignored time spent by parents and child dis-comfort and inconvenience. Thus, the costsare accounted for less completely than inmany of the safety studies, so comparisons ofcost-effectiveness estimates should be madewith caution.
Summary of Cost-Effectiveness EstimatesThis section summarized the cost effective-ness of seven childhood unintentional injuryprevention interventions, and it comparedthese estimates with the cost effectiveness ofother widely accepted interventions aimed atimproving the health of infants and children.Six of the injury prevention interventions
offered net cost savings; one measure cost$4,000 per QALY saved. Two recent reviewsof cost-effectiveness analyses in health andsafety conclude that net cost savings are“fairly rare,” so childhood injury preventionefforts score well.38,41
The cost effectiveness of childhoodunintentional injury prevention strategiesreviewed here also compares favorably withthe cost effectiveness of several widelyimplemented childhood illness preventionmeasures. These findings should be inter-preted cautiously, however, since the studiesare not completely comparable, especiallyin their methods for estimating QALYsavings. They should, however, be reason-ably robust since the injury studies generallyaccount for costs more comprehensivelythan do the illness studies.
Despite some uncertainty about the cost-effectiveness estimates reported here, thesefindings suggest that society may profit fromimplementing many child safety measures,and more widespread use of them may bewarranted. Third-party payers—such asmanaged care organizations, other healthinsurers, and auto insurers—may savemoney by advocating for, subsidizing, orpaying to promote routine use of some
Child Health Measure* Cost per QALYa
Hepatitis B Vaccination of Newborns38 $26,000–$55,000
Restriction of Cigarette Sales to Minors38 $1,000
Cereal Fortification with Folic Acid to Improve <$0Pregnancy Outcomes39
Neonatal Intensive Care, Weight 500 to 999 Grams40 $23,000
Neonatal Intensive Care, Weight 1,000 to 1,499 Grams40 $13,000
Phenylketonuria Screening of Newborns41 <$0
Measles/Mumps/Rubella Immunization41 <$0
a All estimates were computed at a 3% discount rate and are compared to the absence of the intervention.
Table 8
Costs per QALY for Selected Other Child Health Measures(in 1997 Dollars)
* See related endnotes at the end of this article.

156 THE FUTURE OF CHILDREN – SPRING/SUMMER 2000
http://www.futureofchildren.org
safety measures, such as child safety seatsand smoke detectors. The potential costsavings may be particularly great for low-income families on Medicaid, since theseparents often cannot afford the safetydevices purchased by wealthier parents.Finally, many other injury preventionmeasures merit careful evaluation and, ifeffective, cost-effectiveness analyses.These include readily grasped, small-diameter handrails without sharp edges;window guards; pool fencing ordinances;learn-to-swim programs (which poten-tially could increase risk); restrictions onchild gun access; childproof cabinetlatches; plastic plug covers for electric out-lets; rounded corners on furniture; andhome safety inspections. Particularly forsafety measures that are expensive, wide-spread adoption should await these cost-effectiveness analyses.
ConclusionsIn 1996, unintentional injuries were the mostprevalent and expensive health risk faced bychildren and adolescents ages 1 to 19. Child-hood unintentional injuries that occurred in1996 resulted in $14 billion in lifetime med-ical spending, $1 billion in other resourcecosts, and $66 billion in present and futurework losses. These injuries imposed quality-of-life losses equivalent to 92,400 child deaths.The most costly risks were falls, motor vehiclecrashes, and incidents in which children wereunintentionally struck by or against an object.
Despite their relatively small numbers, deathsand hospitalized injuries accounted for halfof the injury costs.
Most unintentional injuries are, in theory,preventable, and proven strategies exist toreduce the injury toll. Moreover, the costs ofpreventing injuries are often less than thecosts of treatment. This suggests that managedcare companies, state Medicaid agencies, andother third-party payers could save money bysubsidizing or promoting routine use ofselected child safety measures such as childsafety seats. Tax dollars could be saved by pro-viding child safety seats and bicycle helmets toinfants and children enrolled in Medicaid.Insurance bills could be reduced by equip-ping homes with working smoke detectors.Yet, these and other proven injury preventioninterventions often are not widely imple-mented. When personal freedom clashes withchild safety, Americans strongly value theirfreedom. Furthermore, unintentional injuryis under-appreciated as a major child healthproblem. Federal agencies fund dispropor-tionately little research on injury preventionmeasures and devote relatively few public dol-lars to injury prevention programming.
Children pay the price for the nation’sunderinvestment in injury prevention; manydie unnecessarily, and others suffer fromlong-term disabilities. This article suggeststhat, with funding and will, the nation canprevent these devastating injuries. Until this
PHOTO OMITTED

157The Cost of Childhood Unintentional Injuries and the Value of Prevention
http://www.futureofchildren.org
Methods of Estimating Childhood Unintentional InjuryCosts and Quality-of-Life Losses
Throughout most of this article, cost estimates refer to incidence-based costs—the life-time costs associated with childhood unintentional injuries that occurred during1996 (see Box 1). Prevalence-based costs—the costs associated with childhood unin-tentional injuries accrued in 1996, regardless of when the injury occurred—are dis-cussed only in reference to spending on injury versus illness. This appendix focuseson the estimation of incidence-based costs.
The Theory behind Estimating Future Costs
The incidence-based costs reported estimate the present value of all expected costsover the child’s expected life span. For costs that will occur in future years, the “pre-sent value” is estimated, defined as the amount one would have to invest today inorder to pay these costs when they come due. The present value of future costsdepends on how many years in the future the costs are borne and on the “discountrate.” The discount rate applied to future costs to estimate their present value isindependent of inflation. This article uses the 3% discount rate recommended bythe Panel on Cost-Effectiveness in Health and Medicine.1
Methods for Estimating Injury Occurrence, Costs, and Quality-of-Life Losses
Estimating the costs and quality-of-life losses associated with childhood uninten-tional injuries required separately estimating the frequency of injuries (stratified byseverity, diagnosis, cause, and age), the present and future costs (resource and pro-ductivity) of the injuries, and the quality-adjusted life years (QALYs) lost due toinjury. Table 2 presents the injury frequency data used in this analysis.
The subsections below summarize the data sources and limitations of the meth-ods used to estimate each component of injury frequency, cost, and quality-of-lifelosses in this analysis. Detailed technical notes on the methods and results tables bycause and age group are available from the authors.
Estimating Injury Occurrence
Injury Frequency, Severity, and Diagnoses
The frequency, severity, and diagnoses for childhood injury were estimated primar-ily from three federal sources: the 1996 U.S. Vital Statistics census for injury deaths;the 1996 National Hospital Discharge Survey (NHDS) for hospitalized injury sur-vivors; and 1987–1996 National Health Interview Surveys (NHIS) for otherinjury survivors. Poisonings handled over the telephone by poison control centerswere estimated from Toxic Exposure Surveillance System data collected in 1992.2
Appendix
happens, unintentional childhood injurieswill remain a costly national tragedy.
The research reported in this article was sup-ported by a grant from the National Highway Traf-fic Safety Administration (grant numberDTHN22-97-8-55072); a Children’s Safety Net-work contract from the Health Resources and Ser-vices Administration, U.S. Department of Health
and Human Services (contract number MCJ-240-98-0006); and a grant from The David andLucile Packard Foundation. Participating in theInternational Collaborative Effort on Injury Sta-tistics—sponsored by the National Center forHealth Statistics with funding from the NationalInstitute of Child Health and Human Develop-ment, National Institutes of Health—also con-tributed critically to this research.

158 THE FUTURE OF CHILDREN – SPRING/SUMMER 2000
http://www.futureofchildren.org
These data sets provide nationally representative estimates, but they havemethodological limitations that may lead to undercounting or overcountinginjuries. For example, the NHDS does not clearly distinguish initial hospitalizationsfrom transfers and follow-up hospitalizations, so some injuries may have beencounted more than once, even though an attempt was made to remove transfersand follow-ups from the analyses. Because of small survey responses, many years ofNHIS data were pooled to obtain the distribution of diagnoses for nonhospitalizedsurvivors by age group, and this distribution was assumed to be stable over time. Thisassumption may not be accurate, however, because managed care probably hasreduced the likelihood of hospital admission differentially across diagnoses. TheNHIS survey also is limited because it relies on victim rather than medical descrip-tions of injury, and it does not include homeless or institutionalized populations.
Injury Intent and Causes
The unintentional injury cause distributions used in this analysis are nationallyrepresentative, classified by external cause of injury codes, and cover all med-ically treated injuries (see Table 2). Intent and cause were modeled withintent/cause-coded data from 1996 U.S. Vital Statistics, 1996 NHDS, pooled1992–1996 National Hospital Ambulatory Medical Care Surveys (NHAMCS),pooled 1995–1996 National Ambulatory Medical Care Surveys (NAMCS), andpooled hospital discharge data from six states. For injuries with differing severityor place of treatment, these data sets either provided national intent/cause dis-tributions or enabled those distributions to be estimated from national data setsdescribing injury incidence by age group and diagnosis. The vital statistics mor-tality census included external cause of injury codes, as did 63% of 1996 NHDSinjury cases. The causes for NHDS cases without external cause of injury codeswere inferred from external cause coded cases for the same diagnosis group andage group, which introduces some unknown level of inaccuracy.
Similarly, for nonhospitalized injury survivors, available national data on the dis-tribution of intent/cause by diagnosis and age group were applied to pooled,nationally representative 1987–1996 NHIS data on nonhospitalized injury fre-quency to estimate intent and causes. The cause distributions by diagnosis groupand by age group, however, were taken from available external cause coded federalprovider surveys—the 1995–1996 NAMCS and the 1992–1996 NHAMCS. TheNAMCS and NHAMCS are limited in that they do not cover all ambulatory care;they count visits rather than injury victims; they fail to distinguish some follow-upvisits from initial visits; and sample sizes are small. As a result, causes for 10.4% ofchildhood injury cases, almost entirely cases treated only in physician offices, wereunable to be estimated.
Estimating Injury Costs
Injury costs were divided into resource costs (medical and other) and productivity costs(costs of work losses).
Resource Costs
Medical costs were estimated using the methods employed in building the U.S. Con-sumer Product Safety Commission’s (CPSC) injury cost model, except the methodswere tailored to children. These methods have been documented elsewhere.3Briefly, costs of initial treatment were extracted from nationally representative or
Appendix (continued)

159The Cost of Childhood Unintentional Injuries and the Value of Prevention
http://www.futureofchildren.org
statewide data sets. By diagnosis, medical follow-up, rehabilitation, and long-termcosts computed from national data on the percentage of medical costs associatedwith initial treatment were added. Due to data unavailability, these percentages wereless current than the costs for initial treatment, although they were tailored to chil-dren. The primary data sources used to compute medical costs included: NHDS,hospital discharge data from Maryland and New York, payment summaries from theCivilian Health and Medical Program of the Uniformed Services (CHAMPUS), lon-gitudinal MEDSTAT health care claims data, and longitudinal Detailed ClaimsInformation data from the National Council on Compensation Insurance. Data forother resource costs—including police, fire department, and travel delay costs—were available from previous research.4,5 Conceptually, these costs should not varyby victim age.
Productivity Costs
Productivity cost estimates also paralleled the CPSC injury cost model3 where thoseestimates were tailored to children. For nonfatal injuries, the work loss cost is thesum of the lifetime loss due to permanent disability (averaged across permanentlydisabling and nondisabling cases), plus the loss due to temporary disability. For fatalinjuries, the work-loss cost is the present value of expected lifetime earnings, fringebenefits, and household work. The primary data sets used to estimate the extent ofproductivity losses included the 1987–1996 NHIS, the 1993 Survey of OccupationalInjury and Illness of the U.S. Bureau of Labor Statistics, and the Detailed ClaimsInformation database from the National Council on Compensation Insurance.
Data Limitations
While primarily large, nationally representative data sets were used to estimateinjury costs, data had limitations that may have biased the cost estimates. For exam-ple, although hospitalization cost estimates used in this analysis are age-specific,other data are not. Specifically, the permanent disability cost estimates associatedwith productivity losses account for the longer life span of children but are not child-specific in other respects. The work-loss cost estimates in this analysis have otherdrawbacks as well. Because women and minorities are paid less than white males forcomparable work, productivity costs undervalues their lives.6 For example, using a3% discount rate, at age seven the present value of lifetime wage and householdwork loss resulting from the death of a girl is $788,000, compared with $1,003,000for the death of a boy. Because children’s earnings are in the future, their presentvalue also is less than the present value of earnings losses of young adults, eventhough more years of future work are lost.6 Some of the minor cost contributors inthis analysis, notably coroner costs, also have limitations, because data used to esti-mate them are 10 to 20 years old. Inflating these old estimates to current dollars mayintroduce some inaccuracy, but they contribute too little to total costs to justify theexpense of collecting new estimates. Finally, the cause-estimating process for non-fatal injuries required several assumptions and failed to associate causes with almost10% of the costs (virtually all for nonfatal injuries treated only in doctor offices).Thus, many of the cost estimates presented in this analysis may be underestimates.
Estimating Lost Quality-of-Life
Quality-of-life losses were estimated as the sum of years of potential life lost to fatalinjury plus the QALY losses resulting from nonfatal injury. For each death or
Appendix (continued)

160 THE FUTURE OF CHILDREN – SPRING/SUMMER 2000
http://www.futureofchildren.org
1. This estimate comes from the analyses reported in this article.
2. Bureau of the Census. Statistical abstract of the United States 1997. Washington, DC: U.S. Govern-ment Printing Office, 1997, table 217.
3. Rice, D.P., and E.J. MacKenzie and Associates. Cost of injury in the United States: A report to Con-gress. San Francisco, CA: Institute for Health & Aging, University of California, and Injury Pre-vention Center, The Johns Hopkins University, 1989.
4. Gold, M.R., Siegel, J.E., Russell, L.B., and Weinstein, M.C., eds. Cost-effectiveness in health andmedicine. New York: Oxford University Press, 1996.
5. An estimated 10% of the lifetime costs were associated with nonhospitalized, nonfatal injuriesof unknown causes. The available data lacked sample cases that could provide insight intointent and causes of these cases.
6. Discounted to present value at a 3% discount rate.
paralyzing injury that shortens the life span, the years of life lost were estimated froma life expectancy table.7,8 For QALY losses associated with temporary or permanentdisability, estimates by injury diagnosis and victim age were taken from a previousstudy.9 These estimates combined physician ratings of the impact of injuries over timeon a person’s ability to think, see, walk, and so forth, and on pain,8,9 with diagnosis-specific National Council on Compensation Insurance data on the probability thatan injury would permanently reduce earning capacity or prevent the victim fromworking and on the percentage earnings reduction.10 The rating scales used were nottailored to children, although the physicians were asked to rate probable impairmentlevels and durations separately for children. The estimated impairment impacts weretranslated into QALY losses using survey data that weighed the relative importancethat respondents placed on different dimensions of impact.11–15 Most of these weightswere specific to a child and adolescent population.
1 Gold, M.R., Siegel, J.E., Russell, L.B., and Weinstein, M.C., eds. Cost-effectiveness in health and medicine. New York:Oxford University Press, 1996.
2 Litovitz, T., Holm, K.C., Clancy, C., et al. 1992 annual report of the American Association of Poison Control CentersToxic Exposure Surveillance System. American Journal of Emergency Medicine (1993) 11:494–555.
3 Miller, T.R., Lawrence, B.A., Jensen, A.F., et al. Estimating the cost to society of consumer product injuries: Therevised injury cost model. Bethesda, MD: U.S. Consumer Product Safety Commission, 1998.
4 Miller, T.R., and Levy, D.T. Cost-outcome analysis in injury prevention and control: A primer on methods. Injury Preven-tion (1997) 3:288–93.
5 Miller, T.R. Costs and functional consequences of U.S. roadway crashes. Accident Analysis and Prevention (1993)25:593–607.
6 Rice, D.P., and E.J. MacKenzie and Associates. Cost of injury in the United States: A report to Congress. San Fran-cisco, CA: Institute for Health and Aging, University of California, and Injury Prevention Center, The Johns Hopkins Uni-versity, 1989.
7 Bureau of the Census. Statistical abstract of the United States 1997. Washington, DC: U.S. Government PrintingOffice, 1997, Table 217.
8 Hirsch, A., Eppinger, R., Shame, T., et al. Impairment scaling from the abbreviated injury scale. Washington, DC:National Highway Traffic Safety Administration, 1983.
9 Miller, T.R., Pindus, N.M., Douglass, J.B., and Rossman, S.B. Nonfatal injury costs and consequences: A data book.Washington, DC: The Urban Institute Press, 1995.
10 National Council on Compensation Insurance. Detailed claims information special tabulation. Boca Raton, FL: NCCI, 1998.
11 Carsten, O. Relationship of accident type to occupant injuries. Report no. UMTR-86-15. Ann Arbor, MI: University ofMichigan Transportation Research Institute, 1986.
12 Green, C.H., and Brown, R. Life safety: What is it and how much is it worth? Garston, Watford, UK: Building ResearchEstablishment, Department of the Environment, 1978.
13 Kaplan, R.M. Human preference measurement for health decisions and the evaluation of long-term care. In Valuesand long-term care. R.L. Kane and R.M. Kane, eds. Lexington, MA: Lexington Books, 1982, pp. 157–88.
14 Kind, P., Rachel, R., and Williams, A. Valuation of quality of life: Some psychometric evidence. In The value of lifeand safety. M.W. Jones-Lee, ed. New York: North-Holland Publishing, 1982, pp. 159–70.
15 Torrance, G.W. Multiattribute utility theory as a method of measuring social preferences for health states in long-termcare. In Values and long-term care. R.L. Kane and R.M. Kane, eds. Lexington, MA: Lexington Books, 1982, pp. 127–56.
Appendix (continued)

161The Cost of Childhood Unintentional Injuries and the Value of Prevention
http://www.futureofchildren.org
7. Costs were estimated from National Health Interview Survey and National Hospital DischargeSurvey (NHDS) data, Maryland and New York hospital data on cost per day, and CivilianHealth and Medical Program of the Uniformed Services cost data. This prevalence-based esti-mate is consistent with the most current published estimate, which analyzed 1987 NationalMedical Expenditure Survey data. See Miller, T.R., Lestina, D.C., and Galbraith, M.S. Patternsof childhood medical spending. Archives of Pediatrics and Adolescent Medicine (1995) 149:369–73. Visit counts are from the NHDS with intent modeled where missing, the NationalHospital Ambulatory Medical Care Survey, and the National Ambulatory Medical Care Survey.
8. Lewitt, E.M., Baker, L.S., Corman, H., and Shiono, P.H. The direct cost of low birth weight.The Future of Children (Spring 1995) 5,1:35–56. Their estimate was inflated to 1996 dollars withthe same price adjuster used in the injury estimates.
9. National Center for Health Statistics. 1996 national hospital discharge survey. Public use datatape. Hyattsville, MD: NCHS, 1998.
10. Hughes, D., and Simpson, L. The role of social change in preventing low birth weight. TheFuture of Children (Spring 1995) 5:87–102.
11. See note no. 3, Rice and MacKenzie, chapter 3.
12. For example, low-income parents are less likely to own a child safety seat than other parents,but those who do own child safety seats use them at the same rate as other parents. See Mayer,M., and LeClere, F.B. Injury prevention measures in households with children in the United States,1990. From Vital and Health Statistics of the Centers for Disease Control and Prevention/National Center for Health Statistics. Advance data no. 250. Hyattsville, MD: NCHS, 1994.
13. The injury estimates are from a database maintained by the National Center for Injury Pre-vention and Control (Inventory of federally funded research in injury prevention and con-trol, 1995. Atlanta, GA: Centers for Disease Control, 1997), which includes both intentionaland unintentional injuries. The estimates for other causes come from the National Institutesof Health (NIH) budget and exclude spending by the Agency for Health Care Policy andResearch. Both estimates exclude spending by the Departments of Defense and VeteransAffairs. These estimates may not have captured all research on occupational injuries, possiblyunderestimating injury research funding. Activities comparable to some of the activitiesincluded under NIH research spending on cancer would not have been labeled as researchin the injury estimate, possibly overstating cancer research funding.
14. See note no. 2, Bureau of the Census, table 144.
15. Institute of Medicine. Reducing the burden of injury. Washington, DC: National Academy Press,1999.
16. Cost effectiveness is measured as the net cost per quality-adjusted life year (QALY) of goodhealth produced or saved. To compute cost effectiveness, the costs of implementing a preven-tion measure and the direct costs and QALYs it is expected to save are estimated. Subtractingthe direct cost savings from the costs of implementing the intervention yields the net cost. If thenet cost is less than zero, the measure produces “net cost savings.” If this is not the case, dividingthe net cost by the QALYs saved produces a cost per QALY saved. The cost-effectiveness analysesprovide results relative to the preintervention situation.
17. Miller, T.R., Demes, J.C., and Bovbjerg, R.R. Child seats: How large are the benefits andwho should pay? In Child occupant protection. SP-986. Warrendale, PA: Society for Automo-tive Engineers, 1993, pp. 81–90. This article, “The cost of childhood unintentional injuriesand the value of prevention,” reports an updated estimate that raised the cost per childsafety seat to $50.
18. Miller, T.R., and Levy, D.T. Reducing highway crash costs: The cost-outcome analyses. InTransportation, traffic safety, and health. H. von Holst, A. Nygren, and A.E. Andersson, eds.Stockholm, Sweden: Karolinska Institute, 1998, pp. 171–98.
19. Miller, T.R., Lestina, D.C., and Spicer, R.S. Highway crash costs in the United States by driverage, blood alcohol level, victim age, and restraint use. Accident Analysis and Prevention (1998)30:137–50.
20. Miller, T.R., and Levy, D.T. Cost-outcome analysis in injury prevention and control: A primeron methods. Injury Prevention (1997) 3:288–93.

162 THE FUTURE OF CHILDREN – SPRING/SUMMER 2000
http://www.futureofchildren.org
21. U.S. Consumer Product Safety Commission (CPSC), Safety standard for cigarette lighters, 58Fed. Reg. 131 (July 12, 1993) 16 C.F.R. pt. 1210. In this study, the burn injury costs werereplaced with more recent CPSC burn injury costs, which match the injury costs used in theother six studies.
22. Miller, T.R., and Lestina, D.C. The costs of poisoning in the U.S. and the savings from poisoncontrol centers: A benefit-cost analysis. Annals of Emergency Medicine (1997) 29:239–45.
23. Six of the seven estimates come from previously published benefit-cost analyses that used a2.5% discount rate and similar injury costs to one another. The seventh is from a regulatoryanalysis of dual-catch cigarette lighters. For this article, all seven estimates were recomputedusing a 3% discount rate. Supplementing the published information with unpublisheddetails, the cost per QALY saved for each study was computed.
24. Partyka, S. Lives saved by child safety seats from 1982 through 1987. Report no. 89-1A-O-002. 12thInternational Technical Conference on “Experimental Safety Vehicles.” Gothenburg, Sweden,May 29–June 1, 1989.
25. Hingson, R., Heeren, T., and Winter, M. Effects of lower legal blood alcohol limits for youngand adult drivers. Alcohol, Drugs, and Driving (1995) 10:243–52.
26. Hingson, R., Heeren, T., Howland, J., and Winter, M. Reduced BAC limits for young people:Impact on night fatal crashes. Alcohol, Drugs, and Driving (1991) 7:117–27.
27. Hagge, R.A., and Marsh, W.C. An evaluation of the traffic safety impact of provisional licens-ing. Report no. CAL-DMV-RSS-88-116. Sacramento, CA: Department of Motor Vehicles, 1988.
28. McKnight, A.J., Tippetts, A.S., and Marques, P.R. Provisional driver license system for follow-up evaluation of Maryland youth license control demonstration project. Report no. DOT-HS-807-669. Washington, DC: National Highway Traffic Safety Administration, 1990.
29. Langley, J.D., Wagenaar, A.C., and Begg, D.J. An evaluation of the New Zealand graduateddriver licensing system. Accident Analysis and Prevention (1996) 28:139–46.
30. Thompson, D.C., Nunn, M.E., Thompson, R.S., and Rivara, F.P. Effectiveness of bicycle safetyhelmets in preventing serious facial injury. Journal of the American Medical Association (1996)276:1974–75.
31. Thompson, D.C., Thompson, R.S., and Rivara, F.P. Effectiveness of bicycle safety helmets inpreventing head injuries. Journal of the American Medical Association (1996) 276:1968–73.
32. Thompson, R.S., Rivara, F.P., and Thompson, D.C. A case-control study of the effectiveness ofbicycle safety helmets. New England Journal of Medicine (1989) 320:1361–67.
33. Schieber, R.A., Kresnow, M.J., Sacks, J.J., et al. Effect of a state law on reported bicycle helmetownership and use. Archives of Pediatrics and Adolescent Medicine (1996) 150:707–12.
34. Dardis, R. The value of life: New evidence from the marketplace. American Economic Review(1980) 70:1077–82.
35. Zech, C. Letter to J.R. Maurer and J.H. Trestrail from Blue Cross/Blue Shield of Michigan,August 12, 1993. In Poison control centers: Is there an antidote for budget cuts? Hearing before the Subcommittee on Human Resources and Intergovernmental Relations, Committee onGovernment Operations, U.S. House of Representatives, 103rd Cong., 2nd Sess. (March 15,1994). Washington, DC: U.S. Government Printing Office, 1994.
36. King, W.D., and Palmisano, P.A. Poison control centers: Can their value be measured? South-ern Medical Journal (1991) 84:722–26.
37. Litovitz, T., Kearney, T.E., Holm, K., et al. Poison control centers: Is there an antidote forbudget cuts? American Journal of Emergency Medicine (1994) 12:585–99.
38. Graham, J.D., Corso, P.S., Morris, J.M., et al. Evaluating the cost-effectiveness of clinical andpublic health measures. Annual Review of Public Health (1998) 19:125–52. Used estimates forhepatitis vaccination and cigarette sales to minors from comparably computed costs perQALY saved at a 3% discount rate.
39. Kelly, A.E., Haddix, A.C., Scanlon, K.S., et al. Appendix B: Cost-effectiveness of strategies toprevent neural tube defects. In Cost-effectiveness in health and medicine. M.R. Gold, J.E. Siegel,L.B. Russell, and M.C. Weinstein, eds. New York: Oxford University Press, 1996. Estimatedcost per QALY saved from cereal fortification at a 3% discount rate.

40. Boyle, M.H., Torrance, G.W., Sinclair, J.C., and Horwood, S.P. Economic evaluation of neona-tal intensive care of very low birth weight infants. New England Journal of Medicine (1983)308:1330–37. Estimated cost per QALY saved of neonatal intensive care was at a 5% discountrate. The estimate in Table 8 was recomputed at a 3% discount rate and omitted expectedearnings gains (an indirect cost) from the calculation of net costs to avoid double counting.This estimate unavoidably reflects 1978 treatment capabilities, so it may not measure currentcost effectiveness very accurately.
41. Tengs, T.O., Adams, M.E., Pliskin, J.S., et al. Five hundred life-saving interventions and theircost effectiveness. Risk Analysis (1995) 15:369–90. Used measles immunization and phenylke-tonuria screening estimates of costs per life year saved computed at a 5% discount rate. Esti-mates were recomputed using a 3% discount rate.
163The Cost of Childhood Unintentional Injuries and the Value of Prevention
http://www.futureofchildren.org


