Embed Size (px)
Citation preview
PLEASE SCROLL DOWN FOR ARTICLE
This article was downloaded by: [University of Trento]On: 13 October 2008Access details: Access Details: [subscription number 789759913]Publisher RoutledgeInforma Ltd Registered in England and Wales Registered Number: 1072954 Registered office: Mortimer House,37-41 Mortimer Street, London W1T 3JH, UK
Global CrimePublication details, including instructions for authors and subscription information:http://www.informaworld.com/smpp/title~content=t714592492
The cost of protection racket in SicilyAdam Asmundo a; Maurizio Lisciandra b
a Facoltà di Scienze della Formazione, Università di Palermo, V.le delle Scienze, Palermo, Italy b Dipartimentodi Scienze Economiche, Università di Bologna, Bologna, Italy
Online Publication Date: 01 August 2008
To cite this Article Asmundo, Adam and Lisciandra, Maurizio(2008)'The cost of protection racket in Sicily',Global Crime,9:3,221 — 240
To link to this Article: DOI: 10.1080/17440570802254338
URL: http://dx.doi.org/10.1080/17440570802254338
Full terms and conditions of use: http://www.informaworld.com/terms-and-conditions-of-access.pdf
This article may be used for research, teaching and private study purposes. Any substantial orsystematic reproduction, re-distribution, re-selling, loan or sub-licensing, systematic supply ordistribution in any form to anyone is expressly forbidden.
The publisher does not give any warranty express or implied or make any representation that the contentswill be complete or accurate or up to date. The accuracy of any instructions, formulae and drug dosesshould be independently verified with primary sources. The publisher shall not be liable for any loss,actions, claims, proceedings, demand or costs or damages whatsoever or howsoever caused arising directlyor indirectly in connection with or arising out of the use of this material.
The cost of protection racket in Sicily
Adam Asmundoa,b* and Maurizio Lisciandrac
aFacolta di Scienze della Formazione, Universita di Palermo, V.le delle Scienze, Palermo, Italy; bUfficioStudi Banco di Sicilia, Via Gen.le Magliocco 1, Palermo, Italy; cDipartimento di Scienze Economiche,
Universita di Bologna, Bologna, Italy
The purpose of this paper is to estimate the current cost of protection rackets in Sicily. Bymeans of a database constructed on judicial evidence, it has been possible to come up with anestimate of the average and total costs of the protection-money system, as well as finding outin which sectors of economic activity and in which provinces is most pervasive. The averagemonthly payment is approximately 600 euros per business, with stronger effects in those areaswith a relatively more traditional economic structure. As a whole, in monetary terms, theprotection racket in Sicily accounts for over 1.4% of gross regional product. Finally, the papersupports the hypothesis that in most cases, the pervasive presence of the mafia represents aconsiderable constraint on business growth.
Keywords: cost of crime; racket; extortion; organised crime
1. Introduction
This article provides an estimate for the costs of protection rackets to private businesses in Sicily
and, consequently, produces an estimate of direct withdrawal of resources from the Sicilian
economy by organised crime. Judicial evidence will be used in support of such an estimate. The
literature which deals with measuring the cost of extortion is rather sparse; in general, judicial
evidence resulting from years of investigation has never been used for an aggregate estimation of
the cost of extortion, both in Sicily and elsewhere.
Any reference made in this article to extortion will refer solely to protection rackets
implemented by organised crime groups for the ‘protection’ of private businesses. No
consideration will be made of money extorted within the system of tenders nor of extortion of
any kind carried out by public officials in pursuing their own corruption schemes.
Extortion represents a direct cost, as it involves an immediate loss of economic value for a
business. However, this is only a component of the total cost of the protection racket. Indeed,
there are other indirect costs. These may be, for example, revenue from future investments
which is forgone due to a lack of incentive. Apart from tangible indirect costs, i.e. which can be
quantified monetarily, there are intangible indirect costs, such as fear and suffering, whose
measurement is rather complex.
Within this study, only a part of the direct cost is taken into consideration. This being, that
which is incurred as a consequence of criminal racketeering activity – i.e. the amount of
ISSN 1744-0572 print/ISSN 1744-0580 online
q 2008 Taylor & Francis
DOI: 10.1080/17440570802254338
http://www.informaworld.com
This paper partially draws on an earlier study of the same authors for the Fondazione Rocco Chinnici, andpublished in Italian in 2008 as ‘Un tentativo di stima del costo delle estorsioni sulle imprese a livelloregionale: il caso Sicilia’, in A. La Spina (eds.) I costi dell’illegalita, Bologna, Il Mulino.
*Corresponding author. Email: [email protected]
Global Crime
Vol. 9, No. 3, August 2008, 221–240
Downloaded By: [University of Trento] At: 15:52 13 October 2008
protection money periodically requested of businesses.1 Therefore, no estimate is made of either
anticipation costs of extortion (e.g. insurance expenses, security, etc.) incurred by businesses not
paying money (but which are a potential target), or costs as a response to extortion (expenses in
action against organised crime, expenses in investigative and judicial activity, and expenses for
the issue and enforcement of verdicts) or, finally, intangible and indirect consequential costs
(moral, psychological and physical damages).2
There is a strand of literature identifying money protection as the price - a kind of improper
tax – paid to the mafia for private ‘protection’,3 which is what the mafia itself pretends to supply
within its distorted, negative system of ‘trust’.4 In this perspective, the cost of protection should
also be balanced off with the benefits accruing from the mafia’s ‘services’. The current
investigation acknowledges this point of view but argues that the literature may be supplemented
with the following observation. As far as racketeering is concerned, ‘benefits’ accruing to
businesses can be divided into two major categories:
. primary benefits, mainly consisting in securing business survival.5 The expected cost of
primary risks is usually higher than the cost of protection;
. secondary benefits, consisting in extra-rents stemming from additional services supplied
by organised crime (e.g. protection against the risk of being cheated during business
transactions, assistance in disposing of competitors, systematic facilitations in attracting
customers or making new business). Secondary benefits are more related to markets, as
they involve the cost of (and the access to) inputs, subcontracting and tenders.
While it may be debatable that primary benefits are actually voluntarily requested as an
ex ante rational choice by entrepreneurs,6 secondary benefits may be quite persistent in some
1. This analysis does not take into account extortion carried out ‘in kind’, that is with merchandise handedover by shop owners, a rather common practice in the commercial sector. A survey by Confesercenti(2007), conducted on an Italian national level among 60,000 associates, poses at 55% the percentage offirms affected by this form of extortion (22% for a value greater than 10,000 Euros).2. For a detailed definition and subdivision of costs of crime, see S. Brand and R. Price, ‘The Economicand Social Costs of Crime’, in Home Office Research Study (Economics and Resource Analysis –Research, Development and Statistics Directorate, Home Office, 2000).3. It is an obviously perverse and ambiguous kind of protection, based on coercion and violence, and inmost cases victims have no choice. See also D. Gambetta, The Sicilian Mafia: The Business of PrivateProtection (Cambridge, MA: Harvard University Press, 1993); D. Gambetta, ‘Mafia: The Price of Distrust’,in Trust: Making and Breaking Cooperative Relations, ed. D. Gambetta (Oxford: Department of Sociology,University of Oxford, 2000), http://www.sociology.ox.ac.uk/papers/gambetta158-175.pdf4. Gambetta (2000) points out and widely explains the enduring social and economic costs of distrustinduced by the mafia, ‘where people do not cooperate when it would be mutually beneficial to do so; wherethey compete in harmful ways; and, finally, where they refrain from competing in those instances when theycould all gain considerably from competition. ( . . . ) In addition, the mafia is exemplary of those cases wherethe public interest lies in collapsing rather than building internal trust and cooperation.’ Gambetta, ‘Mafia:The Price of Distrust’.5. There are complementary primary benefits, consisting for instance in avoiding the insurance cost of theoperational risks related to malicious mischief, thievery and robbery.6. The supplier of protection would force entrepreneurs to buy ‘goods’ through retaliation whose needitself is in turn imposed through actions which protection should prevent. Today, free exchange is no longeravailable, the existence of demand is strictly related to the existence of supply but, in this case, supply is notmarket-maker but rather need-maker. Differently, the origins of the mafia were related to the exchange ofprotection for monetary benefits (i.e. during the baronial control of their estates through field guards; see forinstance, O. Bandiera, ‘Land Reform, the Market for Protection, and the Origins of Sicilian Mafia: Theoryand Evidence’, Journal of Law, Economic, and Organization 19, no. 1 (2003): 218–44) at the same fashionas described by Varese for the Russian mafia after the transition, where the State was an ‘erratic, predatory,
A. Asmundo and M. Lisciandra222
Downloaded By: [University of Trento] At: 15:52 13 October 2008
sectors. However, no available systematic data show the existence of an actual demand for
protection to organised crime by Sicilian businesses, although in this respect this paper will be
able to make some inroads.
The literature on the assessment of the cost of racketeering is rather scarce and
discontinuous, despite the protection racket being one of the most common criminal activities, in
particular among those that can be ascribed to organised crime. The earliest data and estimates
trace back to the years of rampant criminal activity in the city of Chicago. The New York Times
reported that the cost of racketeering in the city of Chicago was $136 million a year (about
$1.6 billion in 2007 dollars). In 1931, the Employers’ Association of Chicago went public with a
report which estimated the cost of bombings at $500 million ($6.8 billion in 2007 dollars) and
the cost of racketeering at $145 million ($1.9 billion in 2007 dollars).7 Nowadays, empirical
evidence on the cost of racketeering has not made any significant progress. Iwai (1986) estimates
that, in Japan, racketeering accounts for approximately 2% of GNP for the year 1980. Smith and
Varese8 report that, in 1988, out of approximately 6000 extortion cases in the Soviet Union,
more than half paid between 500 and 1000 roubles, with a certain regularity. At the beginning of
the 1990s, the Analytical Centre for Social and Economic Policies claimed that three-quarters of
private enterprises were forced to pay 10–20% of their earnings to criminal gangs.9 Colombian
data10 show great variability in the amount of money paid based on the type of business affected,
ranging from about $20 a month for butchers to $19 a day for taxi drivers.
Such scarcity and dispersion of empirical information is typical of the analyses of those
criminal activities that often escape investigation or for which no reliable data are available.
Usually, in fact, the cost of racketeering as well as the cost of usury do not appear among those
costs of crime taken into consideration when attempting to quantify the social and economic
costs of crime as a whole.11 Now, however, both the phenomenon of ‘pentiti’ (former mafia
members who have decided to collaborate with investigators and magistrates) and the
remarkable judicial successes of recent years in the control of organised crime afford a broad and
detailed range of cases of extortion and, consequently, the possibility to assess the extent of
racketeering more precisely.
Through collection and classification of judicial evidence from all Sicilian courts (District
Attorneys), a database has been built on racketeering in the last 20 years.12 For each individual
case, extracted from over 200 judicial acts, information has been reported on: racketeered
activity (name of business, racketeered person and economic activity); territory (province, town,
address and mafia-controlled district); extortion (type of extortion, damages, monthly, yearly
(Footnote 6 continued)
and non-impartial supplier of protection’, F. Varese, The Russian Mafia: Private Protection in a NewMarket Economy (Oxford: Oxford University Press, 2001), 7.7. ‘Finds Rackets Cost More Than War Did’, New York Times, September 21, 1932.8. A. Smith and F. Varese, ‘Payment, Protection and Punishment: The Role of Information and Reputationin the Mafia’, Rationality and Society 13, no. 3 (2001): 349–93.9. Economist, ‘Crime in Russia: The High Price of Freeing Markets’, Economist, February 19, 1994, 57.10. C. Moser and C. McIlwaine, ‘Urban Poor Perceptions of Violence and Exclusion in Colombia. ConflictPrevention and Post-Conflict Reconstruction’ (Washington, DC: The International Bank for Reconstructionand Development/The World Bank, 2000).11. Brand and Price, ‘The Economic and Social Costs of Crime’; P. Mayhew, ‘Counting the Costs of Crimein Australia: Technical Report, Technical and Background’ (Canberra: Australian Institute of Criminology,2003); R. Dubourg and S. Prichard, ‘The Impact of Organised Crime in the UK: Revenues and Economicand Social Costs’ (London: Home Office Online Report 14/07, 2007); Transcrime, ‘I Costi DellaCriminalita in Trentino Ed in Italia: Presentazione Della Metodologia E Tentativi Di Stima’ (2006).12. In this respect, a word of thanks goes to Attilio Scaglione for the onerous work of reading acts andaggregating data.
Global Crime 223
Downloaded By: [University of Trento] At: 15:52 13 October 2008
and/or one-off payments); period and source (type of judicial act, reference number and name of
police operation).
This paper is divided into the following parts. Section 2 describes the dataset constructed on
the basis of judicial evidence. Section 3 introduces the chosen methodology within the
framework of traditional inductive inference. A simple statistical model is introduced for the
estimation of the overall cost of extortion, and the fundamental variables to be estimated are
identified. In particular, seeing as a victimisation survey of Sicilian businesses is missing,
attention has been given to the issue of the ‘dark number’, which represents an important factor
in defining an overall estimate of the extent of the protection racket. In Section 4, monthly
estimates of extortion are made on the basis of the available dataset; a series of descriptive
statistics are also analysed with the purpose of strengthening the estimate of average payments of
protection money. Section 5 extends the statistical analysis so as to come up with a punctual
estimate of the overall cost of extortion, both for the entire region and single provinces. Section 6
presents our conclusions.13
2. Dataset description
The dataset of businesses studied here presents certain particular characteristics. In fact, it is not
a statistically representative sample – stratified by sector and area – of the regional or provincial
productive structure, but rather a set of enterprises presenting statistical evidence, emerging
from investigative and judicial evidence, of having been subjected to racketeering in recent
years.
Entries in the dataset not only stem from cases reported by victims, but are also the result of
investigative actions and confessions from repentant members of the mafia. Therefore, while we
may think of some bias in a dataset built upon cases in which the victim reports to police
authorities (e.g. large businesses less intimidated by organised crime), our dataset relies on a
wide range of sectors evenly distributed across provinces.14
For the purpose of this analysis, it is reasonable to assume that businesses similar in terms of
size and product, belonging to the same sector and operating in the same area, are subject to
similar, scarcely differentiated forms of pressure by the mafia. Such hypothesis may be
cautiously adopted as a general criterion, to be extended to the business world as a whole.
The database in use is made of judicial acts and evidence regarding 2286 enterprises. Of
these, 333 have been the objects of one-off requests by racketeers for an average value of
approximately 25,000 euros.15 Only a part of the overall dataset shows monthly (or periodical)
data regarding protection money;16 and it is on this part that the analysis will focus. In total,
there are 646 enterprises in which it is certain that protection money was paid from 1987 to 2007.
That is to say, there are some firms which have made payments until, for example, 1995 and
others until 2007. It is reasonable to assume that all these firms were representing an extorted
13. It is important to point out that, had a victimisation survey been conducted, the only possible conclusionwould have been that the issue of racketeering in Sicily is absolutely marginal. In fact, most entrepreneurs,faced with the concrete possibility of heavy retaliation, prefer to deny having been intimidated by the mafia.14. Yet, we are unable to distinguish the entries coming from victims complaints from those related to mereinvestigative activity.15. These requests are usually put forward during the start-up stage, especially concentrated in theconstruction sector. Though remarkable in their amount, they are not current costs and therefore will not betaken into consideration within this study.16. Where the amount of protection money periodically paid is known, its monthly value in the lastavailable year has been made current using monetary values of 2006. For example, if it is certain that a firmhas paid a certain amount until 1995, then this figure has been made current at 2006 prices.
A. Asmundo and M. Lisciandra224
Downloaded By: [University of Trento] At: 15:52 13 October 2008
firm in 2006. Variations in the structure of production did obviously occur over time, but the
average amount paid for protection did not substantially change in real terms, if not in response
to business cycle.
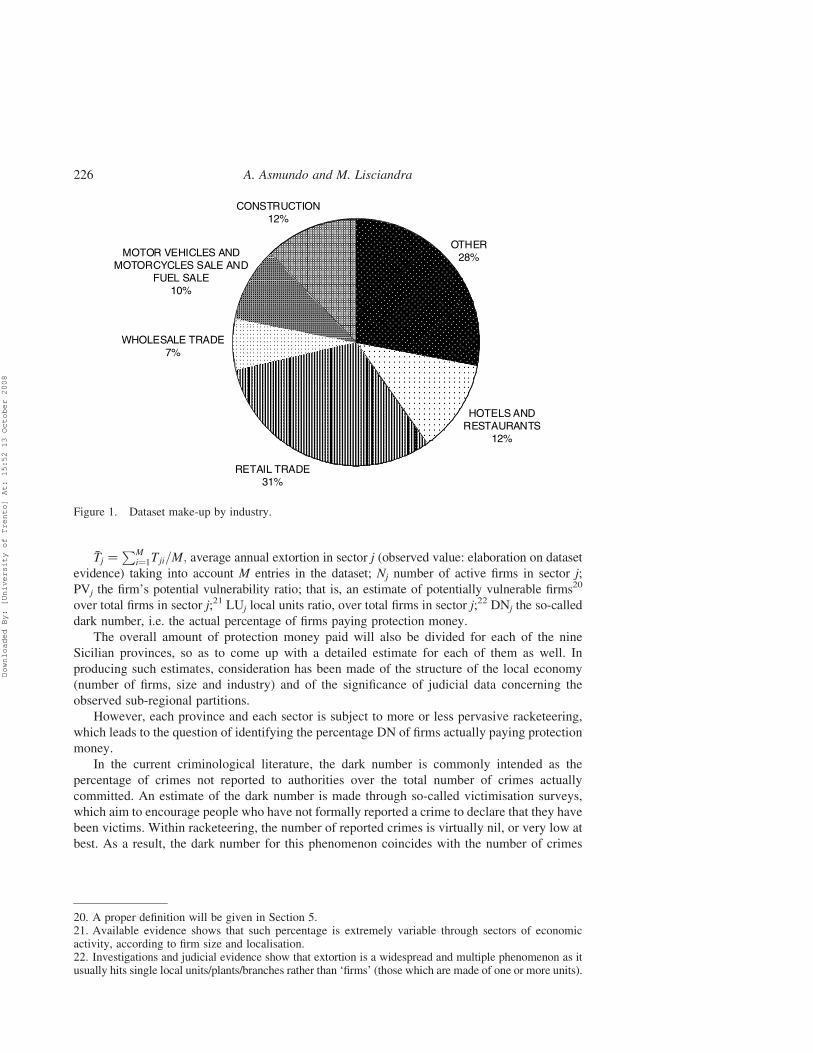
As shown in Figure 1, retail, construction and hotels and restaurants are the industries for which
most data are available. Such higher availability may be a sign of both a higher invasiveness of
racketeering and a more thorough investigative activity in some sectors as opposed to others.
3. Concepts and methods
In order to utilise any information provided by the available dataset to the full, and to avoid any
possible distortion or data misinterpretation, this paper is based on a traditional inductive
inference methodology.
In fact, considering our (albeit extended) dataset as a statistical sample would entail the risk
of incurring a varied range of systematic errors or biases. This is because random or judgmental
sampling in this case would be affected by systematic underestimation of the statistical universe
variability. Or, which is the same, parametric estimators’ variability would be too large – that is,
of no logical or statistical significance.
Inductive inference, however, allows us to generate extended empirical evidence through the
available dataset, under some acceptable assumptions.17 Our general conclusions regarding
unobserved events are based on the evidence provided by observed events, and the ‘predictive’
capability – i.e. the inner consistency – of the model has turned out to be higher and higher as
the dataset was progressively being enriched with new data.18
The risk of incurring typical inductive bias19 has been reduced by the introduction of some
categorical restrictions, concerning sector and territorial evidence, emerging from the available
dataset.
Our model can be formally described by
T ¼XN
j¼1
ð �Tj £ Nj £ PVj £ LUj £ DNjÞ;
where the overall cost of extortion per year (T) in Sicily, as the sum of the cost in the N business
sectors, is given by
17. Theoretical support to our approach can be found in C.S. Wallace, Statistical and Inductive Inferenceby Minimum Message Length (New York: Springer, 2005), T. Mitchell, Machine Learning (McGraw Hill,1997), U. Fayyad and R. Uthurusamy, ‘The Kdd Process for Extracting Useful Knowledge from Volumesof Data’, Communications of the ACM 39, no. 11 (1996): 27–34, J. Han and M. Kamber, Data Mining:Concepts and Techniques (Morgan Kaufmann Publishers, 2001).18. On reducing error variability, see P.N. Johnson-Laird, Human and Machine Thinking (Mahwah, NJ,1994), 71–86 and 108–14. This paper is based on a 2-year analysis of reports and investigations by the nineSicilian Procure della Repubblica (District Courts); for further details, see A. La Spina, ‘I CostiDell’illegalita – Mafia Ed Estorsioni in Sicilia’, in Fondazione Rocco Chinnici, ed. A. La Spina (Bologna:Il Mulino, 2008). Our dataset has been gradually expanding with new acquisitions over the periodindicated. As in any inductive inference, we cannot be sure that our conclusions are a logical result of thepremises, but we may well be able to assign a remarkable degree of likelihood to each conclusion, as shownbelow.19. For example, especially, the strong preference bias related to generalising small evidence with respectto the whole statistical universe; see, for instance, SOS Impresa – Confesercenti, ‘Le Mani DellaCriminalita Sulle Imprese’ (Roma, 2007), where an unbalanced sample of listed small firms has beenassumed as a representative of a far more complex business universe.
Global Crime 225
Downloaded By: [University of Trento] At: 15:52 13 October 2008
�Tj ¼PM
i¼1Tji=M; average annual extortion in sector j (observed value: elaboration on dataset
evidence) taking into account M entries in the dataset; Nj number of active firms in sector j;
PVj the firm’s potential vulnerability ratio; that is, an estimate of potentially vulnerable firms20
over total firms in sector j;21 LUj local units ratio, over total firms in sector j;22 DNj the so-called
dark number, i.e. the actual percentage of firms paying protection money.
The overall amount of protection money paid will also be divided for each of the nine
Sicilian provinces, so as to come up with a detailed estimate for each of them as well. In
producing such estimates, consideration has been made of the structure of the local economy
(number of firms, size and industry) and of the significance of judicial data concerning the
observed sub-regional partitions.
However, each province and each sector is subject to more or less pervasive racketeering,
which leads to the question of identifying the percentage DN of firms actually paying protection
money.
In the current criminological literature, the dark number is commonly intended as the
percentage of crimes not reported to authorities over the total number of crimes actually
committed. An estimate of the dark number is made through so-called victimisation surveys,
which aim to encourage people who have not formally reported a crime to declare that they have
been victims. Within racketeering, the number of reported crimes is virtually nil, or very low at
best. As a result, the dark number for this phenomenon coincides with the number of crimes
Figure 1. Dataset make-up by industry.
20. A proper definition will be given in Section 5.21. Available evidence shows that such percentage is extremely variable through sectors of economicactivity, according to firm size and localisation.22. Investigations and judicial evidence show that extortion is a widespread and multiple phenomenon as itusually hits single local units/plants/branches rather than ‘firms’ (those which are made of one or more units).
A. Asmundo and M. Lisciandra226
Downloaded By: [University of Trento] At: 15:52 13 October 2008
actually committed. Besides, a victimisation survey on such criminal activity would not afford a
good estimate of the dark number, as victims of extortion are unlikely to come forward as such.
Although ‘omerta’ (conspiracy of silence) as a phenomenon may affect racketeered firms in
any part of the world, victimisation surveys or similar studies have only been carried out in some
countries. In Germany, a representative sample of restaurant owners has disclosed that the
percentage of racketeered owners ranges from 4 to 13% according to their ethnic background.23
In Moscow, according to the results of the survey by Frye and Shleifer,24 38% of shop owners
have been contacted by the racket in the previous six months compared to 8% of shop owners in
Warsaw. Johnson, Kaufmann et al. (2000) report that 90% of the managers of manufacturing
firms in Russia and the Ukraine stated that they pay for mafia protection. Clayton and McDavid
(2004) report that between 75 and 80% of contractors in the engineering and construction
industry operating in the Kingston Metropolitan area have had some contact with extortionists,
whereas in a survey, only 25% admitted to paying protection money.
Recent Italian data show, for example, that 78% of Calabrian entrepreneurs and 51.5% of
Sicilian entrepreneurs believe that criminal activity in their territory is rare (as opposed to an
overall average of the sample – regarding Southern Italy – equal to 54.6%).25 While not aiming
at identifying such evidence as omerta,26 it must be highlighted how indicative it is of a very
sensitive situation, where the presence of organised crime is perceived by many entrepreneurs as
normal in their communities and territories: a power which is difficult – or perhaps useless or
counterproductive – to oppose and which therefore largely loses its criminal profile.
As opposed to the above-quoted data, other surveys, carried out by Italian business
associations, show that the percentage of Sicilian commercial and service businesses27 subject to
racketeering is approximately 70%, with peaks in a few provinces with a higher occurrence of
extortion (Agrigento, Caltanissetta, Catania, Messina, Palermo and Trapani) and reaches its
highest at 80% in the cities of Palermo and Catania. Such surveys also highlight that
approximately 46% of Sicilian businesses have taken at least one precautionary measure against
racketeering.28
A cross-analysis of evidence and its implicit compatibility offers one further prompt for
interpretation: probably the very monetary amount of extortion turns out to be sufficiently
tolerable (as it is not incredibly high) in relation to the firm’s cash and budget flow; for this
reason, extortion is considered as ‘normal’ and made endogenous by the economic and social
system, as an (ordinary) component of production costs. Such hypothesis will find partial
confirmation in the data to be analysed and interpreted.
23. T. Ohlemacher, ‘Viewing the Crime Wave from the Inside: Perceived Rates of Extortion amongRestaurateurs in Germany’, European Journal on Criminal Policy and Research 7 (1999): 43–61.24. T. Frye and A. Shleifer, ‘The Invisible Hand and the Grabbing Hand’, American Economic Review 87,no. 2 (1993): 354–58.25. Interviews carried out in Calabria and in Sicily, for example, indicate that in the former region, anaverage 80% of interviewees believe racketeering and usury are not very common. Similarly in Sicily, only10% of entrepreneurs believe protection racket to be widespread, while for 58% it is little present and forthe remaining 31.4% it is altogether non-existent. See CENSIS – Fondazione BNC, ‘Impresa E CriminalitaNel Mezzogiorno’ (Roma, 2003).26. The Calabrian figure is astounding, in the face of apparent difficulties to set up businesses in a contextobjectively plagued by a widespread lack of legality; the Sicilian figure instead, being surprisingly lowerthan the Southern average, supports the endogenisation hypothesis made in the text.27. This survey was carried out among associates.28. See Confesercenti, ‘Le Mani Della Criminalita Sulle Imprese’, and Confcommercio – Gfk Eurisko, ‘LaMappa Della Criminalita Regione Per Regione’, http://www.confcommercio.it/home/indagine-per-sito.doc_cvt.htm
Global Crime 227
Downloaded By: [University of Trento] At: 15:52 13 October 2008
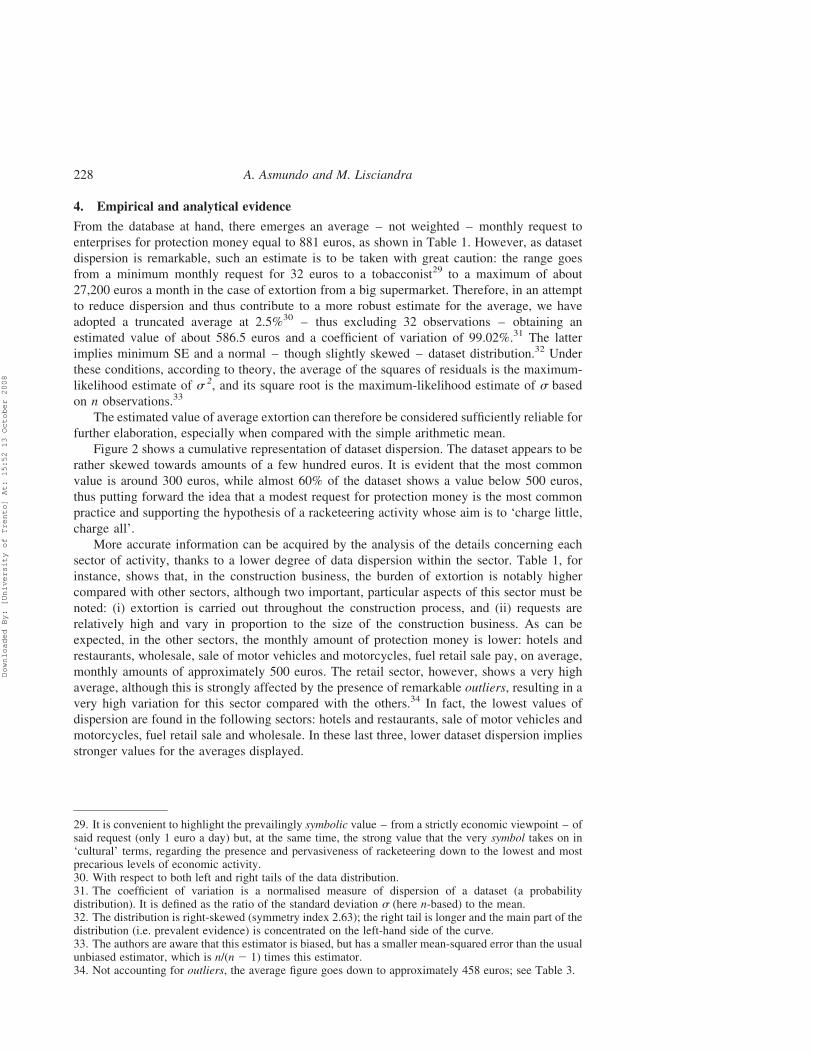
4. Empirical and analytical evidence
From the database at hand, there emerges an average – not weighted – monthly request to
enterprises for protection money equal to 881 euros, as shown in Table 1. However, as dataset
dispersion is remarkable, such an estimate is to be taken with great caution: the range goes
from a minimum monthly request for 32 euros to a tobacconist29 to a maximum of about
27,200 euros a month in the case of extortion from a big supermarket. Therefore, in an attempt
to reduce dispersion and thus contribute to a more robust estimate for the average, we have
adopted a truncated average at 2.5%30 – thus excluding 32 observations – obtaining an
estimated value of about 586.5 euros and a coefficient of variation of 99.02%.31 The latter
implies minimum SE and a normal – though slightly skewed – dataset distribution.32 Under
these conditions, according to theory, the average of the squares of residuals is the maximum-
likelihood estimate of s 2, and its square root is the maximum-likelihood estimate of s based
on n observations.33
The estimated value of average extortion can therefore be considered sufficiently reliable for
further elaboration, especially when compared with the simple arithmetic mean.
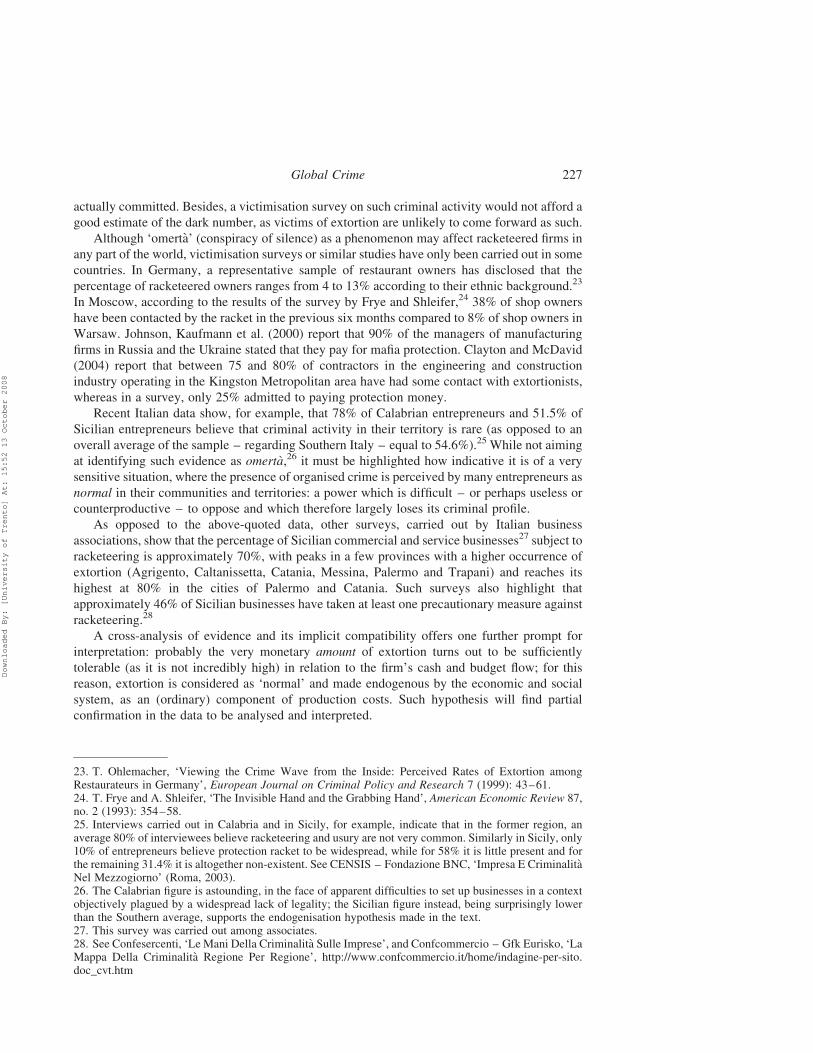
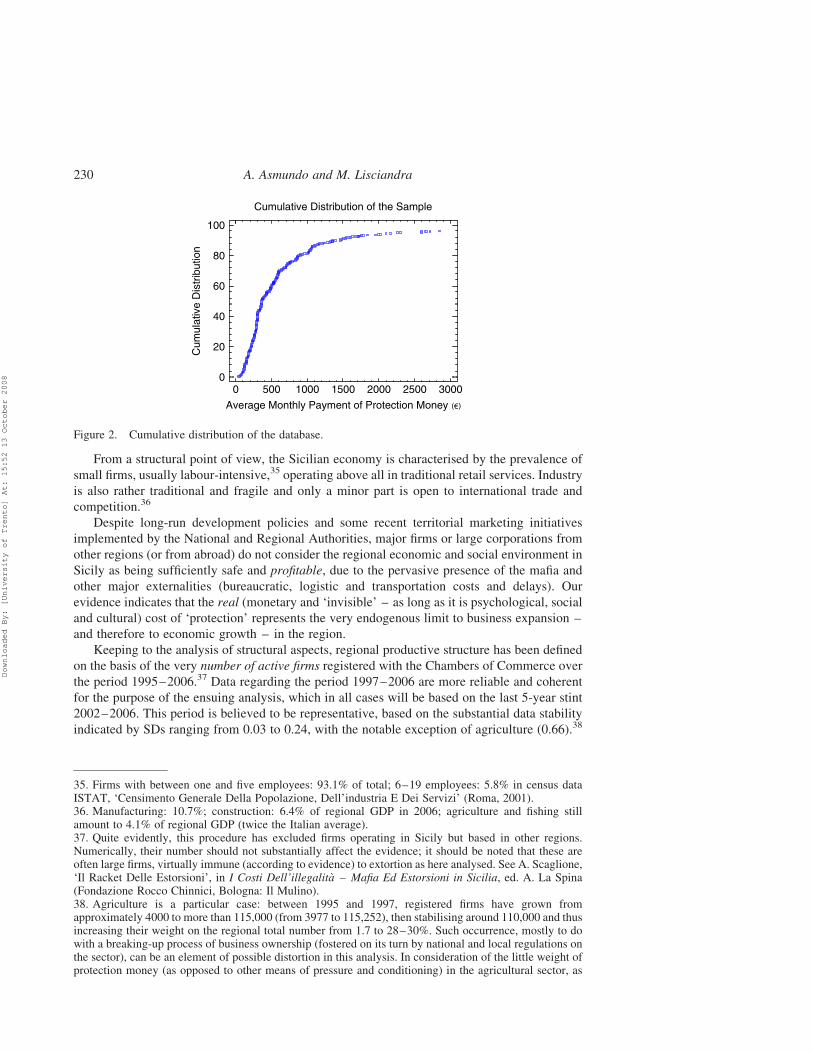
Figure 2 shows a cumulative representation of dataset dispersion. The dataset appears to be
rather skewed towards amounts of a few hundred euros. It is evident that the most common
value is around 300 euros, while almost 60% of the dataset shows a value below 500 euros,
thus putting forward the idea that a modest request for protection money is the most common
practice and supporting the hypothesis of a racketeering activity whose aim is to ‘charge little,
charge all’.
More accurate information can be acquired by the analysis of the details concerning each
sector of activity, thanks to a lower degree of data dispersion within the sector. Table 1, for
instance, shows that, in the construction business, the burden of extortion is notably higher
compared with other sectors, although two important, particular aspects of this sector must be
noted: (i) extortion is carried out throughout the construction process, and (ii) requests are
relatively high and vary in proportion to the size of the construction business. As can be
expected, in the other sectors, the monthly amount of protection money is lower: hotels and
restaurants, wholesale, sale of motor vehicles and motorcycles, fuel retail sale pay, on average,
monthly amounts of approximately 500 euros. The retail sector, however, shows a very high
average, although this is strongly affected by the presence of remarkable outliers, resulting in a
very high variation for this sector compared with the others.34 In fact, the lowest values of
dispersion are found in the following sectors: hotels and restaurants, sale of motor vehicles and
motorcycles, fuel retail sale and wholesale. In these last three, lower dataset dispersion implies
stronger values for the averages displayed.
29. It is convenient to highlight the prevailingly symbolic value – from a strictly economic viewpoint – ofsaid request (only 1 euro a day) but, at the same time, the strong value that the very symbol takes on in‘cultural’ terms, regarding the presence and pervasiveness of racketeering down to the lowest and mostprecarious levels of economic activity.30. With respect to both left and right tails of the data distribution.31. The coefficient of variation is a normalised measure of dispersion of a dataset (a probabilitydistribution). It is defined as the ratio of the standard deviation s (here n-based) to the mean.32. The distribution is right-skewed (symmetry index 2.63); the right tail is longer and the main part of thedistribution (i.e. prevalent evidence) is concentrated on the left-hand side of the curve.33. The authors are aware that this estimator is biased, but has a smaller mean-squared error than the usualunbiased estimator, which is n/(n 2 1) times this estimator.34. Not accounting for outliers, the average figure goes down to approximately 458 euros; see Table 3.
A. Asmundo and M. Lisciandra228
Downloaded By: [University of Trento] At: 15:52 13 October 2008
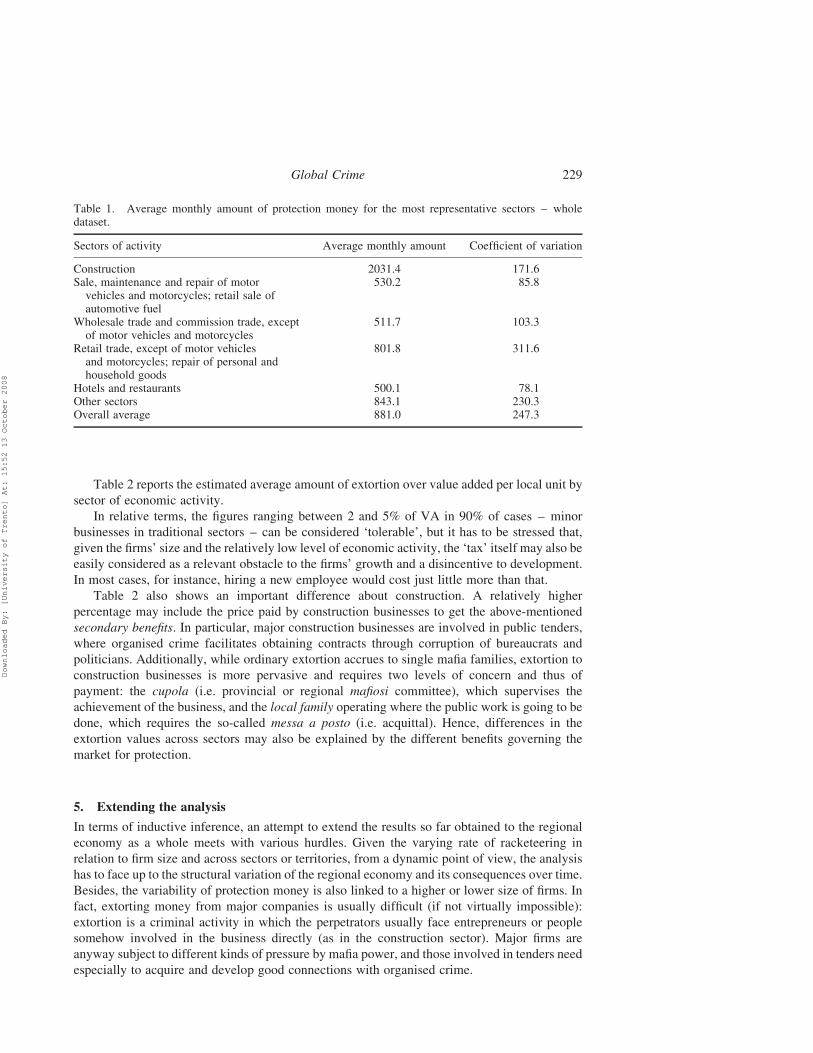
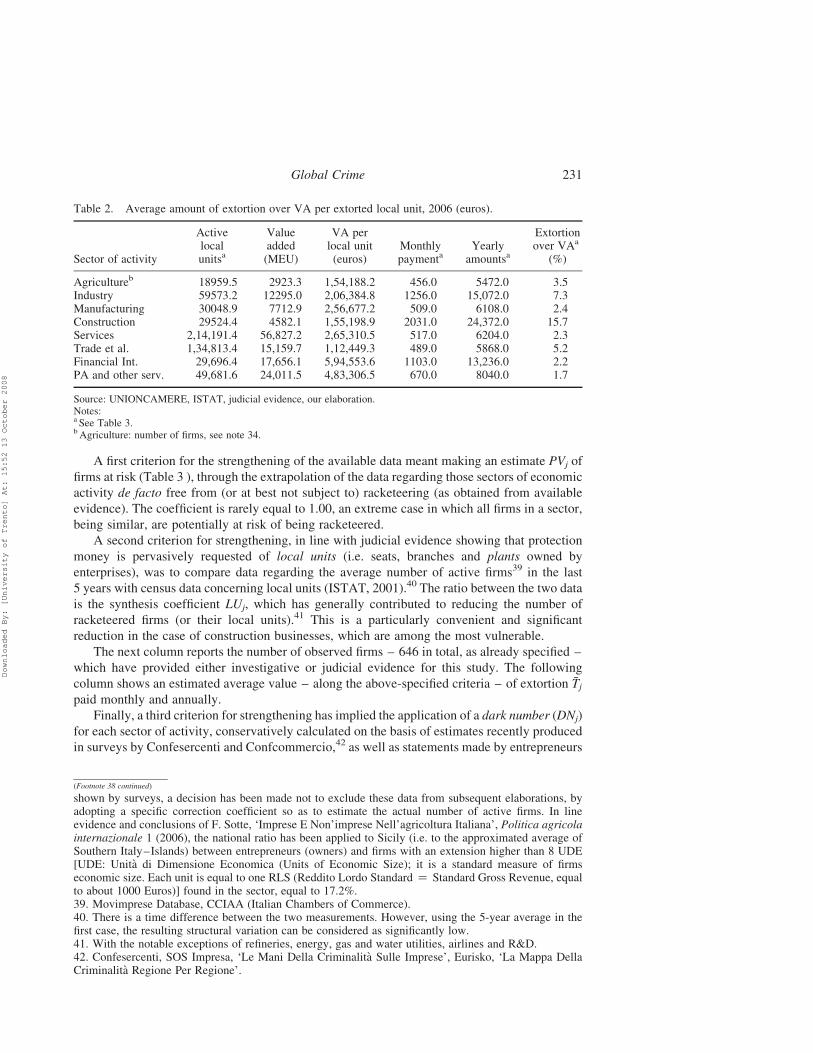
Table 2 reports the estimated average amount of extortion over value added per local unit by
sector of economic activity.
In relative terms, the figures ranging between 2 and 5% of VA in 90% of cases – minor
businesses in traditional sectors – can be considered ‘tolerable’, but it has to be stressed that,
given the firms’ size and the relatively low level of economic activity, the ‘tax’ itself may also be
easily considered as a relevant obstacle to the firms’ growth and a disincentive to development.
In most cases, for instance, hiring a new employee would cost just little more than that.
Table 2 also shows an important difference about construction. A relatively higher
percentage may include the price paid by construction businesses to get the above-mentioned
secondary benefits. In particular, major construction businesses are involved in public tenders,
where organised crime facilitates obtaining contracts through corruption of bureaucrats and
politicians. Additionally, while ordinary extortion accrues to single mafia families, extortion to
construction businesses is more pervasive and requires two levels of concern and thus of
payment: the cupola (i.e. provincial or regional mafiosi committee), which supervises the
achievement of the business, and the local family operating where the public work is going to be
done, which requires the so-called messa a posto (i.e. acquittal). Hence, differences in the
extortion values across sectors may also be explained by the different benefits governing the
market for protection.
5. Extending the analysis
In terms of inductive inference, an attempt to extend the results so far obtained to the regional
economy as a whole meets with various hurdles. Given the varying rate of racketeering in
relation to firm size and across sectors or territories, from a dynamic point of view, the analysis
has to face up to the structural variation of the regional economy and its consequences over time.
Besides, the variability of protection money is also linked to a higher or lower size of firms. In
fact, extorting money from major companies is usually difficult (if not virtually impossible):
extortion is a criminal activity in which the perpetrators usually face entrepreneurs or people
somehow involved in the business directly (as in the construction sector). Major firms are
anyway subject to different kinds of pressure by mafia power, and those involved in tenders need
especially to acquire and develop good connections with organised crime.
Table 1. Average monthly amount of protection money for the most representative sectors – wholedataset.
Sectors of activity Average monthly amount Coefficient of variation
Construction 2031.4 171.6Sale, maintenance and repair of motorvehicles and motorcycles; retail sale ofautomotive fuel
530.2 85.8
Wholesale trade and commission trade, exceptof motor vehicles and motorcycles
511.7 103.3
Retail trade, except of motor vehiclesand motorcycles; repair of personal andhousehold goods
801.8 311.6
Hotels and restaurants 500.1 78.1Other sectors 843.1 230.3Overall average 881.0 247.3
Global Crime 229
Downloaded By: [University of Trento] At: 15:52 13 October 2008
From a structural point of view, the Sicilian economy is characterised by the prevalence of
small firms, usually labour-intensive,35 operating above all in traditional retail services. Industry
is also rather traditional and fragile and only a minor part is open to international trade and
competition.36
Despite long-run development policies and some recent territorial marketing initiatives
implemented by the National and Regional Authorities, major firms or large corporations from
other regions (or from abroad) do not consider the regional economic and social environment in
Sicily as being sufficiently safe and profitable, due to the pervasive presence of the mafia and
other major externalities (bureaucratic, logistic and transportation costs and delays). Our
evidence indicates that the real (monetary and ‘invisible’ – as long as it is psychological, social
and cultural) cost of ‘protection’ represents the very endogenous limit to business expansion –
and therefore to economic growth – in the region.
Keeping to the analysis of structural aspects, regional productive structure has been defined
on the basis of the very number of active firms registered with the Chambers of Commerce over
the period 1995–2006.37 Data regarding the period 1997–2006 are more reliable and coherent
for the purpose of the ensuing analysis, which in all cases will be based on the last 5-year stint
2002–2006. This period is believed to be representative, based on the substantial data stability
indicated by SDs ranging from 0.03 to 0.24, with the notable exception of agriculture (0.66).38
Figure 2. Cumulative distribution of the database.
35. Firms with between one and five employees: 93.1% of total; 6–19 employees: 5.8% in census dataISTAT, ‘Censimento Generale Della Popolazione, Dell’industria E Dei Servizi’ (Roma, 2001).36. Manufacturing: 10.7%; construction: 6.4% of regional GDP in 2006; agriculture and fishing stillamount to 4.1% of regional GDP (twice the Italian average).37. Quite evidently, this procedure has excluded firms operating in Sicily but based in other regions.Numerically, their number should not substantially affect the evidence; it should be noted that these areoften large firms, virtually immune (according to evidence) to extortion as here analysed. See A. Scaglione,‘Il Racket Delle Estorsioni’, in I Costi Dell’illegalita – Mafia Ed Estorsioni in Sicilia, ed. A. La Spina(Fondazione Rocco Chinnici, Bologna: Il Mulino).38. Agriculture is a particular case: between 1995 and 1997, registered firms have grown fromapproximately 4000 to more than 115,000 (from 3977 to 115,252), then stabilising around 110,000 and thusincreasing their weight on the regional total number from 1.7 to 28–30%. Such occurrence, mostly to dowith a breaking-up process of business ownership (fostered on its turn by national and local regulations onthe sector), can be an element of possible distortion in this analysis. In consideration of the little weight ofprotection money (as opposed to other means of pressure and conditioning) in the agricultural sector, as
A. Asmundo and M. Lisciandra230
Downloaded By: [University of Trento] At: 15:52 13 October 2008
A first criterion for the strengthening of the available data meant making an estimate PVj of
firms at risk (Table 3 ), through the extrapolation of the data regarding those sectors of economic
activity de facto free from (or at best not subject to) racketeering (as obtained from available
evidence). The coefficient is rarely equal to 1.00, an extreme case in which all firms in a sector,
being similar, are potentially at risk of being racketeered.
A second criterion for strengthening, in line with judicial evidence showing that protection
money is pervasively requested of local units (i.e. seats, branches and plants owned by
enterprises), was to compare data regarding the average number of active firms39 in the last
5 years with census data concerning local units (ISTAT, 2001).40 The ratio between the two data
is the synthesis coefficient LUj, which has generally contributed to reducing the number of
racketeered firms (or their local units).41 This is a particularly convenient and significant
reduction in the case of construction businesses, which are among the most vulnerable.
The next column reports the number of observed firms – 646 in total, as already specified –
which have provided either investigative or judicial evidence for this study. The following
column shows an estimated average value – along the above-specified criteria – of extortion �Tjpaid monthly and annually.
Finally, a third criterion for strengthening has implied the application of a dark number (DNj)
for each sector of activity, conservatively calculated on the basis of estimates recently produced
in surveys by Confesercenti and Confcommercio,42 as well as statements made by entrepreneurs
Table 2. Average amount of extortion over VA per extorted local unit, 2006 (euros).
Sector of activity
Activelocalunitsa
Valueadded(MEU)
VA perlocal unit(euros)
Monthlypaymenta
Yearlyamountsa
Extortionover VAa
(%)
Agricultureb 18959.5 2923.3 1,54,188.2 456.0 5472.0 3.5Industry 59573.2 12295.0 2,06,384.8 1256.0 15,072.0 7.3Manufacturing 30048.9 7712.9 2,56,677.2 509.0 6108.0 2.4Construction 29524.4 4582.1 1,55,198.9 2031.0 24,372.0 15.7Services 2,14,191.4 56,827.2 2,65,310.5 517.0 6204.0 2.3Trade et al. 1,34,813.4 15,159.7 1,12,449.3 489.0 5868.0 5.2Financial Int. 29,696.4 17,656.1 5,94,553.6 1103.0 13,236.0 2.2PA and other serv. 49,681.6 24,011.5 4,83,306.5 670.0 8040.0 1.7
Source: UNIONCAMERE, ISTAT, judicial evidence, our elaboration.Notes:a See Table 3.b Agriculture: number of firms, see note 34.
(Footnote 38 continued)
shown by surveys, a decision has been made not to exclude these data from subsequent elaborations, byadopting a specific correction coefficient so as to estimate the actual number of active firms. In lineevidence and conclusions of F. Sotte, ‘Imprese E Non’imprese Nell’agricoltura Italiana’, Politica agricolainternazionale 1 (2006), the national ratio has been applied to Sicily (i.e. to the approximated average ofSouthern Italy–Islands) between entrepreneurs (owners) and firms with an extension higher than 8 UDE[UDE: Unita di Dimensione Economica (Units of Economic Size); it is a standard measure of firmseconomic size. Each unit is equal to one RLS (Reddito Lordo Standard ¼ Standard Gross Revenue, equalto about 1000 Euros)] found in the sector, equal to 17.2%.39. Movimprese Database, CCIAA (Italian Chambers of Commerce).40. There is a time difference between the two measurements. However, using the 5-year average in thefirst case, the resulting structural variation can be considered as significantly low.41. With the notable exceptions of refineries, energy, gas and water utilities, airlines and R&D.42. Confesercenti, SOS Impresa, ‘Le Mani Della Criminalita Sulle Imprese’, Eurisko, ‘La Mappa DellaCriminalita Regione Per Regione’.
Global Crime 231
Downloaded By: [University of Trento] At: 15:52 13 October 2008
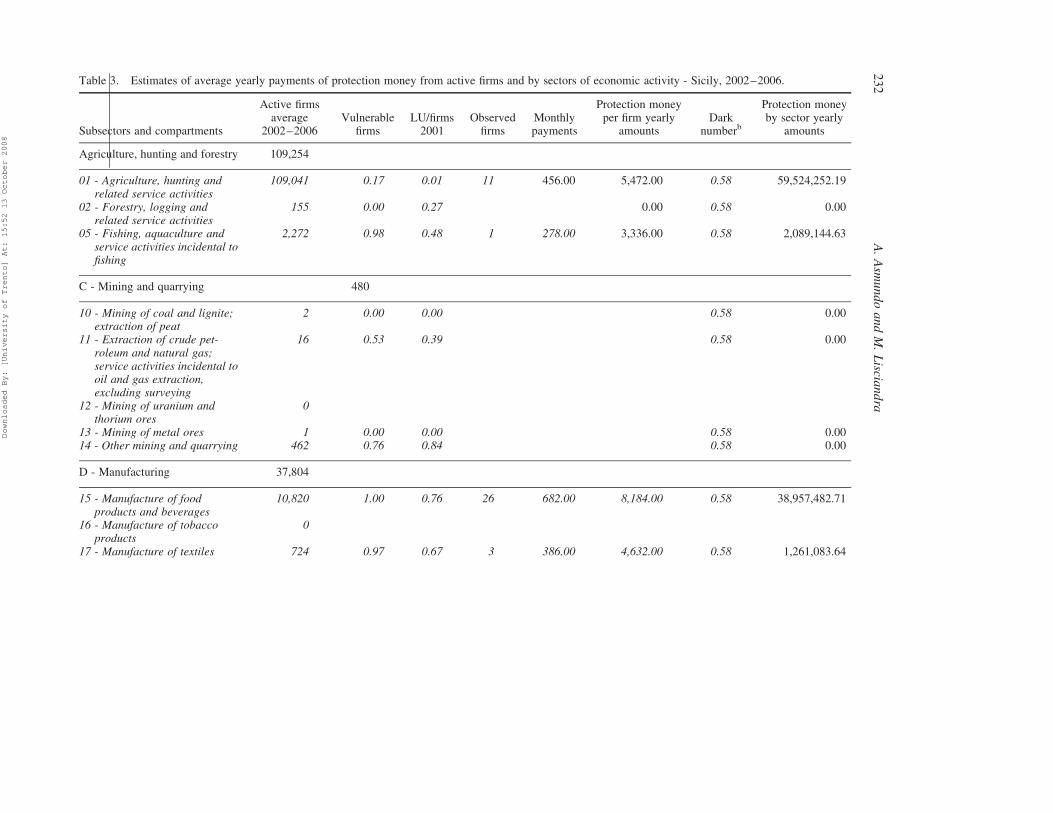
Table 3. Estimates of average yearly payments of protection money from active firms and by sectors of economic activity - Sicily, 2002–2006.
Subsectors and compartments
Active firmsaverage
2002–2006Vulnerable
firmsLU/firms2001
Observedfirms
Monthlypayments
Protection moneyper firm yearly
amountsDark
numberb
Protection moneyby sector yearly
amounts
Agriculture, hunting and forestry 109,254
01 - Agriculture, hunting andrelated service activities
109,041 0.17 0.01 11 456.00 5,472.00 0.58 59,524,252.19
02 - Forestry, logging andrelated service activities
155 0.00 0.27 0.00 0.58 0.00
05 - Fishing, aquaculture andservice activities incidental tofishing
2,272 0.98 0.48 1 278.00 3,336.00 0.58 2,089,144.63
C - Mining and quarrying 480
10 - Mining of coal and lignite;extraction of peat
2 0.00 0.00 0.58 0.00
11 - Extraction of crude pet-roleum and natural gas;service activities incidental tooil and gas extraction,excluding surveying
16 0.53 0.39 0.58 0.00
12 - Mining of uranium andthorium ores
0
13 - Mining of metal ores 1 0.00 0.00 0.58 0.0014 - Other mining and quarrying 462 0.76 0.84 0.58 0.00
D - Manufacturing 37,804
15 - Manufacture of foodproducts and beverages
10,820 1.00 0.76 26 682.00 8,184.00 0.58 38,957,482.71
16 - Manufacture of tobaccoproducts
0
17 - Manufacture of textiles 724 0.97 0.67 3 386.00 4,632.00 0.58 1,261,083.64
A.Asm
undoandM.Liscia
ndra
232
Downloaded By: [University of Trento] At: 15:52 13 October 2008
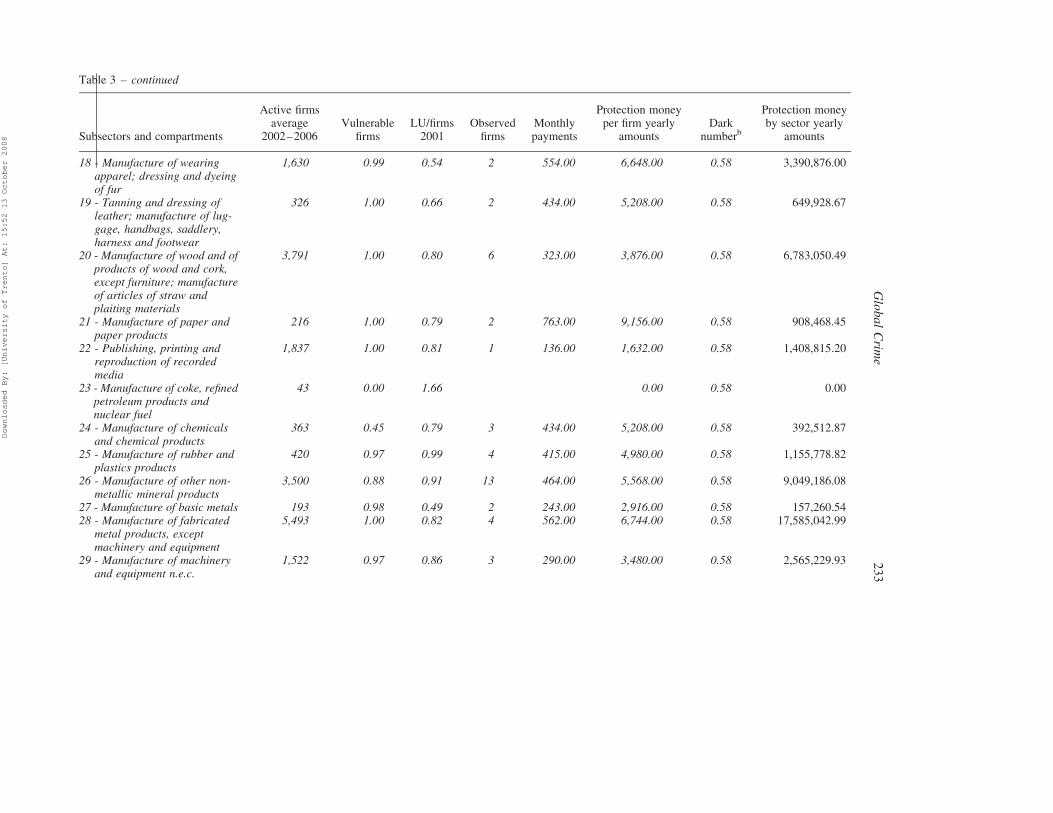
Table 3 – continued
Subsectors and compartments
Active firmsaverage
2002–2006Vulnerable
firmsLU/firms2001
Observedfirms
Monthlypayments
Protection moneyper firm yearly
amountsDark
numberb
Protection moneyby sector yearly
amounts
18 - Manufacture of wearingapparel; dressing and dyeingof fur
1,630 0.99 0.54 2 554.00 6,648.00 0.58 3,390,876.00
19 - Tanning and dressing ofleather; manufacture of lug-gage, handbags, saddlery,harness and footwear
326 1.00 0.66 2 434.00 5,208.00 0.58 649,928.67
20 - Manufacture of wood and ofproducts of wood and cork,except furniture; manufactureof articles of straw andplaiting materials
3,791 1.00 0.80 6 323.00 3,876.00 0.58 6,783,050.49
21 - Manufacture of paper andpaper products
216 1.00 0.79 2 763.00 9,156.00 0.58 908,468.45
22 - Publishing, printing andreproduction of recordedmedia
1,837 1.00 0.81 1 136.00 1,632.00 0.58 1,408,815.20
23 - Manufacture of coke, refinedpetroleum products andnuclear fuel
43 0.00 1.66 0.00 0.58 0.00
24 - Manufacture of chemicalsand chemical products
363 0.45 0.79 3 434.00 5,208.00 0.58 392,512.87
25 - Manufacture of rubber andplastics products
420 0.97 0.99 4 415.00 4,980.00 0.58 1,155,778.82
26 - Manufacture of other non-metallic mineral products
3,500 0.88 0.91 13 464.00 5,568.00 0.58 9,049,186.08
27 - Manufacture of basic metals 193 0.98 0.49 2 243.00 2,916.00 0.58 157,260.5428 - Manufacture of fabricated
metal products, exceptmachinery and equipment
5,493 1.00 0.82 4 562.00 6,744.00 0.58 17,585,042.99
29 - Manufacture of machineryand equipment n.e.c.
1,522 0.97 0.86 3 290.00 3,480.00 0.58 2,565,229.93
GlobalCrim
e233
Downloaded By: [University of Trento] At: 15:52 13 October 2008
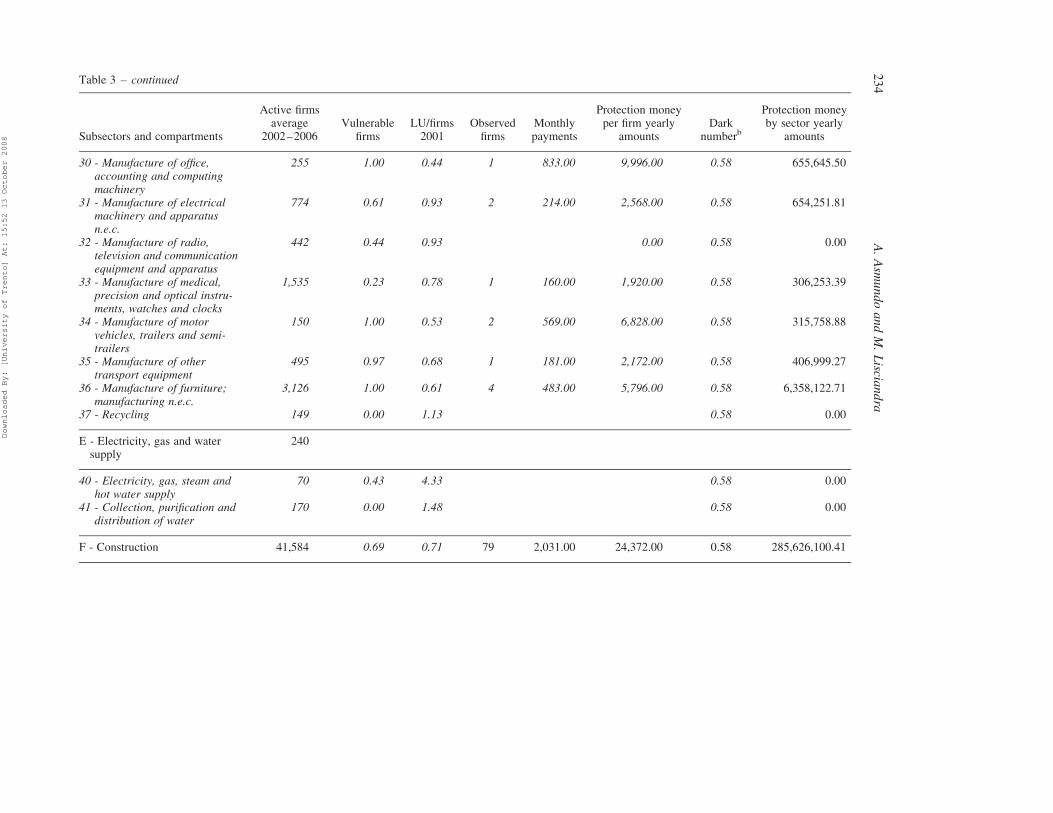
Table 3 – continued
Subsectors and compartments
Active firmsaverage
2002–2006Vulnerable
firmsLU/firms2001
Observedfirms
Monthlypayments
Protection moneyper firm yearly
amountsDark
numberb
Protection moneyby sector yearly
amounts
30 - Manufacture of office,accounting and computingmachinery
255 1.00 0.44 1 833.00 9,996.00 0.58 655,645.50
31 - Manufacture of electricalmachinery and apparatusn.e.c.
774 0.61 0.93 2 214.00 2,568.00 0.58 654,251.81
32 - Manufacture of radio,television and communicationequipment and apparatus
442 0.44 0.93 0.00 0.58 0.00
33 - Manufacture of medical,precision and optical instru-ments, watches and clocks
1,535 0.23 0.78 1 160.00 1,920.00 0.58 306,253.39
34 - Manufacture of motorvehicles, trailers and semi-trailers
150 1.00 0.53 2 569.00 6,828.00 0.58 315,758.88
35 - Manufacture of othertransport equipment
495 0.97 0.68 1 181.00 2,172.00 0.58 406,999.27
36 - Manufacture of furniture;manufacturing n.e.c.
3,126 1.00 0.61 4 483.00 5,796.00 0.58 6,358,122.71
37 - Recycling 149 0.00 1.13 0.58 0.00
E - Electricity, gas and watersupply
240
40 - Electricity, gas, steam andhot water supply
70 0.43 4.33 0.58 0.00
41 - Collection, purification anddistribution of water
170 0.00 1.48 0.58 0.00
F - Construction 41,584 0.69 0.71 79 2,031.00 24,372.00 0.58 285,626,100.41
A.Asm
undoandM.Liscia
ndra
234
Downloaded By: [University of Trento] At: 15:52 13 October 2008
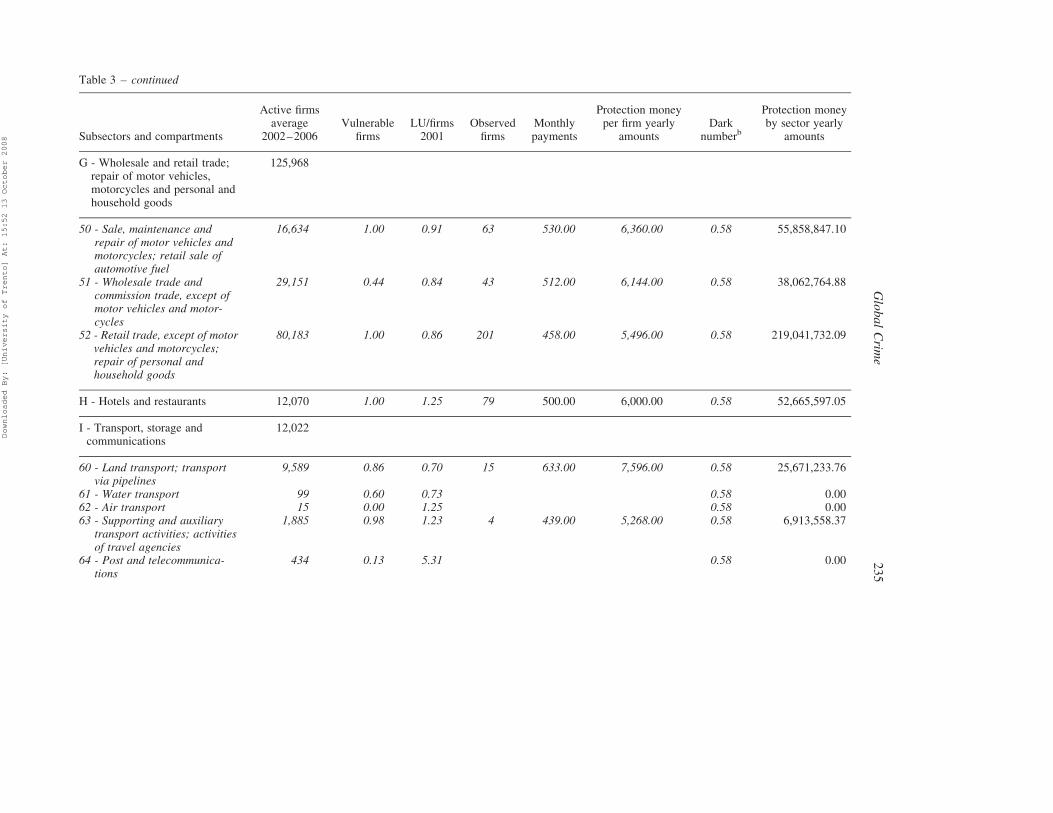
Table 3 – continued
Subsectors and compartments
Active firmsaverage
2002–2006Vulnerable
firmsLU/firms2001
Observedfirms
Monthlypayments
Protection moneyper firm yearly
amountsDark
numberb
Protection moneyby sector yearly
amounts
G - Wholesale and retail trade;repair of motor vehicles,motorcycles and personal andhousehold goods
125,968
50 - Sale, maintenance andrepair of motor vehicles andmotorcycles; retail sale ofautomotive fuel
16,634 1.00 0.91 63 530.00 6,360.00 0.58 55,858,847.10
51 - Wholesale trade andcommission trade, except ofmotor vehicles and motor-cycles
29,151 0.44 0.84 43 512.00 6,144.00 0.58 38,062,764.88
52 - Retail trade, except of motorvehicles and motorcycles;repair of personal andhousehold goods
80,183 1.00 0.86 201 458.00 5,496.00 0.58 219,041,732.09
H - Hotels and restaurants 12,070 1.00 1.25 79 500.00 6,000.00 0.58 52,665,597.05
I - Transport, storage andcommunications
12,022
60 - Land transport; transportvia pipelines
9,589 0.86 0.70 15 633.00 7,596.00 0.58 25,671,233.76
61 - Water transport 99 0.60 0.73 0.58 0.0062 - Air transport 15 0.00 1.25 0.58 0.0063 - Supporting and auxiliary
transport activities; activitiesof travel agencies
1,885 0.98 1.23 4 439.00 5,268.00 0.58 6,913,558.37
64 - Post and telecommunica-tions
434 0.13 5.31 0.58 0.00
GlobalCrim
e235
Downloaded By: [University of Trento] At: 15:52 13 October 2008
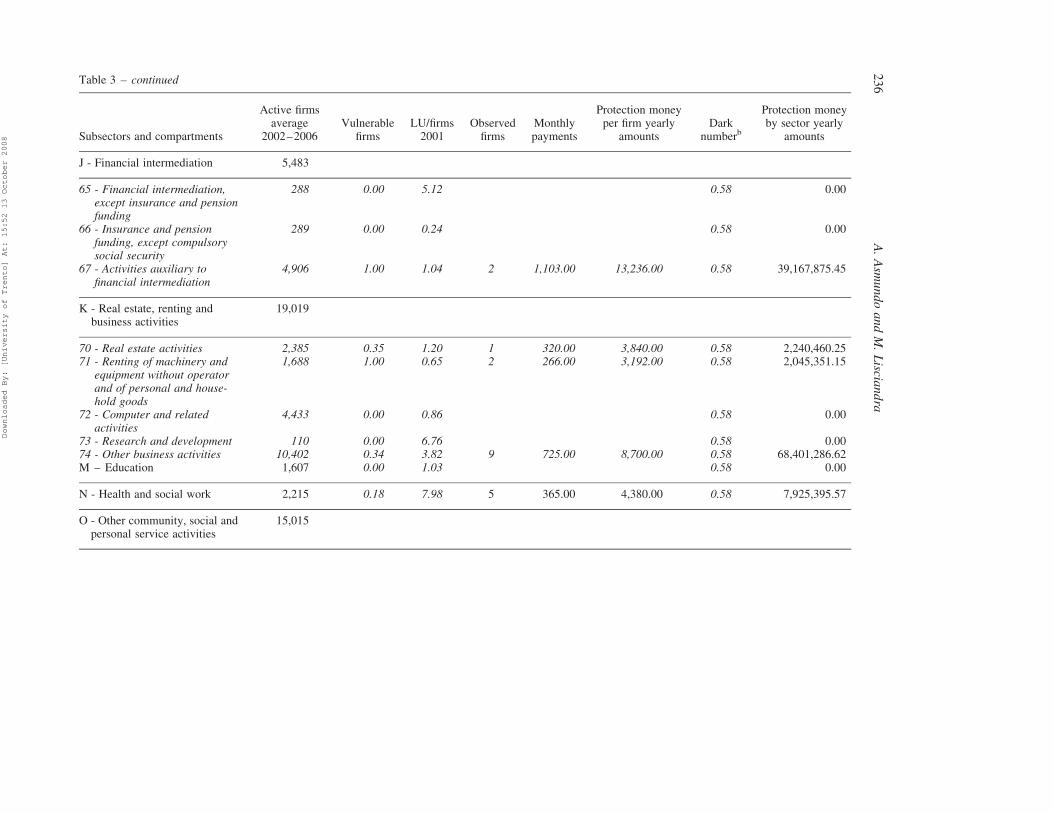
Table 3 – continued
Subsectors and compartments
Active firmsaverage
2002–2006Vulnerable
firmsLU/firms2001
Observedfirms
Monthlypayments
Protection moneyper firm yearly
amountsDark
numberb
Protection moneyby sector yearly
amounts
J - Financial intermediation 5,483
65 - Financial intermediation,except insurance and pensionfunding
288 0.00 5.12 0.58 0.00
66 - Insurance and pensionfunding, except compulsorysocial security
289 0.00 0.24 0.58 0.00
67 - Activities auxiliary tofinancial intermediation
4,906 1.00 1.04 2 1,103.00 13,236.00 0.58 39,167,875.45
K - Real estate, renting andbusiness activities
19,019
70 - Real estate activities 2,385 0.35 1.20 1 320.00 3,840.00 0.58 2,240,460.2571 - Renting of machinery and
equipment without operatorand of personal and house-hold goods
1,688 1.00 0.65 2 266.00 3,192.00 0.58 2,045,351.15
72 - Computer and relatedactivities
4,433 0.00 0.86 0.58 0.00
73 - Research and development 110 0.00 6.76 0.58 0.0074 - Other business activities 10,402 0.34 3.82 9 725.00 8,700.00 0.58 68,401,286.62M – Education 1,607 0.00 1.03 0.58 0.00
N - Health and social work 2,215 0.18 7.98 5 365.00 4,380.00 0.58 7,925,395.57
O - Other community, social andpersonal service activities
15,015
A.Asm
undoandM.Liscia
ndra
236
Downloaded By: [University of Trento] At: 15:52 13 October 2008
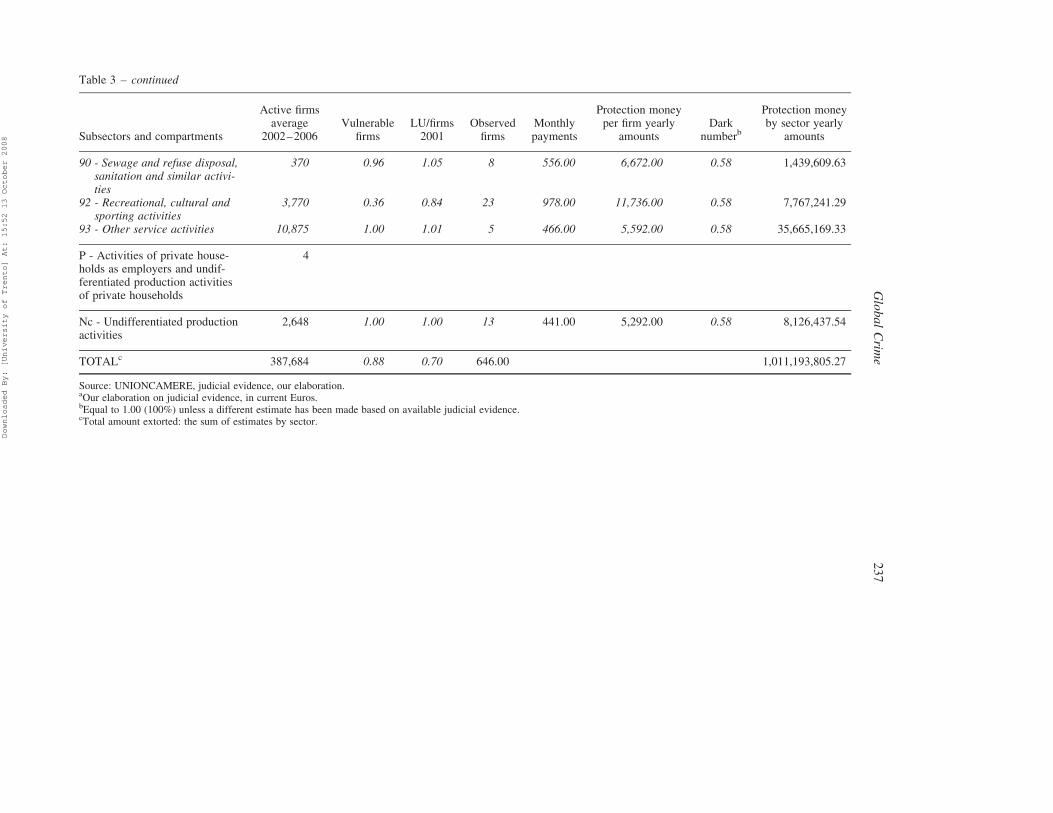
Table 3 – continued
Subsectors and compartments
Active firmsaverage
2002–2006Vulnerable
firmsLU/firms2001
Observedfirms
Monthlypayments
Protection moneyper firm yearly
amountsDark
numberb
Protection moneyby sector yearly
amounts
90 - Sewage and refuse disposal,sanitation and similar activi-ties
370 0.96 1.05 8 556.00 6,672.00 0.58 1,439,609.63
92 - Recreational, cultural andsporting activities
3,770 0.36 0.84 23 978.00 11,736.00 0.58 7,767,241.29
93 - Other service activities 10,875 1.00 1.01 5 466.00 5,592.00 0.58 35,665,169.33
P - Activities of private house-holds as employers and undif-ferentiated production activitiesof private households
4
Nc - Undifferentiated productionactivities
2,648 1.00 1.00 13 441.00 5,292.00 0.58 8,126,437.54
TOTALc 387,684 0.88 0.70 646.00 1,011,193,805.27
Source: UNIONCAMERE, judicial evidence, our elaboration.aOur elaboration on judicial evidence, in current Euros.bEqual to 1.00 (100%) unless a different estimate has been made based on available judicial evidence.cTotal amount extorted: the sum of estimates by sector.
GlobalCrim
e237
Downloaded By: [University of Trento] At: 15:52 13 October 2008
and ‘pentiti’. As previously indicated, such evidence brings to 70% the number of racketeered
firms in the most strongly affected sectors (construction, commerce, crafts, hotels and shops),
with peaks at 80% in Palermo and Catania and high rates also recorded in the provinces
of Trapani, Agrigento, Caltanissetta and Messina; Enna, Siracusa and Ragusa show seemingly
less alarming rates. Therefore, it has been decided to weigh the relative coefficients offered by
such surveys (75 and 50% respectively), comparing them to the 46% of Confcommercio43
and the residents of the various territorial units. This procedure has allowed an estimate of
the potential dark number (representing, in this case, a reliable estimate of the maximum
percentage of racketeered firms), yielding coefficients equal to 0.58 for the entire region, 0.60
for the areas most at risk and 0.48 for the least affected ones. These coefficients have been
applied to all sectors without differentiation, based only on territorial considerations,
letting them interact – in the final elaboration by sectors – with other, previously defined
parameters.
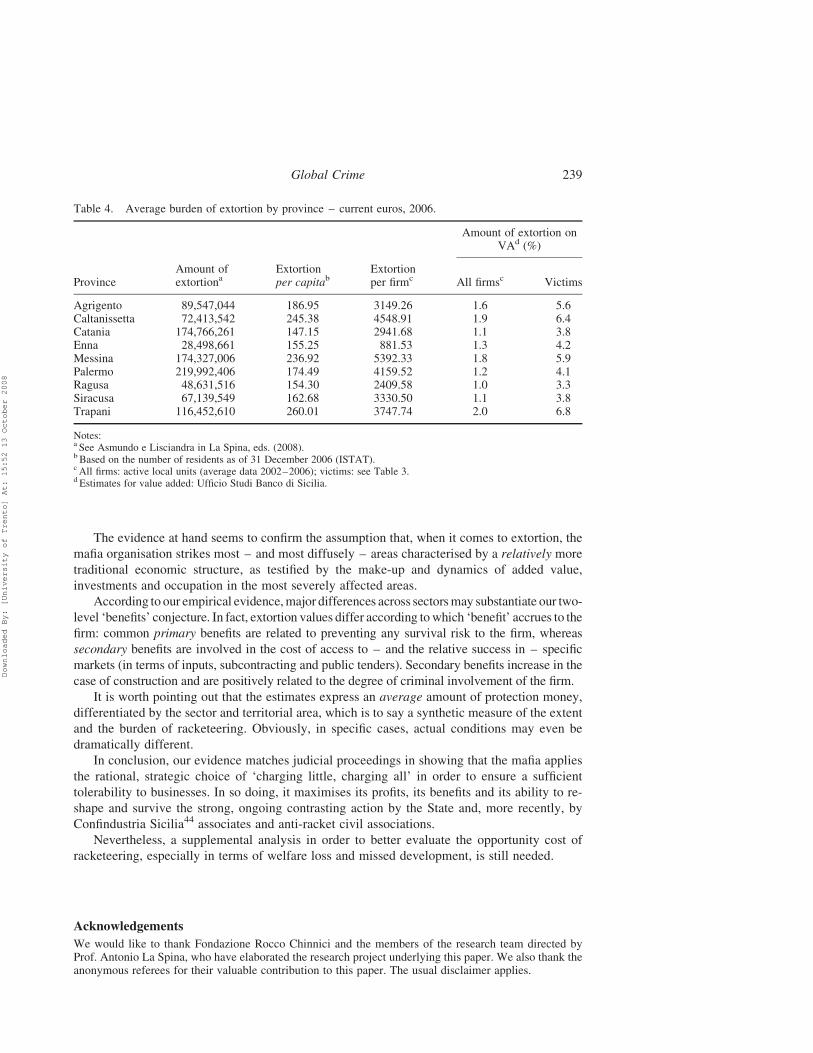
Along these lines, we have been able to assess the average burden of extortion by province,
both in absolute (current euros) and in relative terms (with regard to population and economic
activity), as shown in Table 4.
The results are obviously affected by the distribution of production and by the intensity of
economic activity across the region. As seen above, some sectors are more hit by extortion than
others and their relative prevalence makes some specific areas more vulnerable.
A major issue from Table 4 is the evidence of a relatively higher burden of extortion in areas
characterised by a relatively lower level (and a slower pace) of economic activity. For instance,
due to the higher weight of construction with respect to total VA, Agrigento, Caltanissetta,
Messina and Trapani show figures considerably higher than the other provinces.
6. Concluding remarks
This study provides an estimate of direct costs of the protection racket on the Sicilian
economy. The authors are aware that they have dealt with only one aspect of mafia activity on
firms and territory almost as if taking a ‘snapshot’, that is as if such costs could be quantified
regardless of a timeframe, in terms of forgone growth and development of the Sicilian
economy and society.
After looking, with a statistical eye, at the most recent judicial evidence on the issue, the
methodology used has taken into account the varying rates of the phenomenon in various sectors
of economic activity, both at a regional and provincial level.
While still in the realm of cautious basic hypotheses, the apparent cost of simple extortion,
according to a conveniently conservative estimate, amounts to not less than a billion euros,
corresponding to over 1.4% of 2006 gross regional product. A figure which appears to be
particularly significant and, as stated before, somewhat partial, as it is the mere monetary value
withdrawn from firms in the extortion process.
The methodology used has afforded an estimate of the weight of extortion in the various
sectors not only at a regional level, but also with some detail for the various provinces. The
regional level, based on a wider number of observations and hence on more statistically
significant average values, turns out to be stronger. But provincial evidence also, to which in
some cases regional averages have been extensively applied (supplementing available data),
offers an interesting interpretation of the phenomenon.
In absolute terms, the most penalised sectors are construction, commerce – mostly retail –
stores and crafts; namely, all those activities that are characteristic, for their diffusion and
frequency in terms of territorial density, of the productive system of Sicily.
A. Asmundo and M. Lisciandra238
Downloaded By: [University of Trento] At: 15:52 13 October 2008
The evidence at hand seems to confirm the assumption that, when it comes to extortion, the
mafia organisation strikes most – and most diffusely – areas characterised by a relatively more
traditional economic structure, as testified by the make-up and dynamics of added value,
investments and occupation in the most severely affected areas.
According to our empirical evidence,major differences across sectorsmay substantiate our two-
level ‘benefits’ conjecture. In fact, extortion values differ according towhich ‘benefit’ accrues to the
firm: common primary benefits are related to preventing any survival risk to the firm, whereas
secondary benefits are involved in the cost of access to – and the relative success in – specific
markets (in terms of inputs, subcontracting and public tenders). Secondary benefits increase in the
case of construction and are positively related to the degree of criminal involvement of the firm.
It is worth pointing out that the estimates express an average amount of protection money,
differentiated by the sector and territorial area, which is to say a synthetic measure of the extent
and the burden of racketeering. Obviously, in specific cases, actual conditions may even be
dramatically different.
In conclusion, our evidence matches judicial proceedings in showing that the mafia applies
the rational, strategic choice of ‘charging little, charging all’ in order to ensure a sufficient
tolerability to businesses. In so doing, it maximises its profits, its benefits and its ability to re-
shape and survive the strong, ongoing contrasting action by the State and, more recently, by
Confindustria Sicilia44 associates and anti-racket civil associations.
Nevertheless, a supplemental analysis in order to better evaluate the opportunity cost of
racketeering, especially in terms of welfare loss and missed development, is still needed.
Acknowledgements
We would like to thank Fondazione Rocco Chinnici and the members of the research team directed byProf. Antonio La Spina, who have elaborated the research project underlying this paper. We also thank theanonymous referees for their valuable contribution to this paper. The usual disclaimer applies.
Table 4. Average burden of extortion by province – current euros, 2006.
Amount of extortion onVAd (%)
ProvinceAmount ofextortiona
Extortionper capitab
Extortionper firmc All firmsc Victims
Agrigento 89,547,044 186.95 3149.26 1.6 5.6Caltanissetta 72,413,542 245.38 4548.91 1.9 6.4Catania 174,766,261 147.15 2941.68 1.1 3.8Enna 28,498,661 155.25 881.53 1.3 4.2Messina 174,327,006 236.92 5392.33 1.8 5.9Palermo 219,992,406 174.49 4159.52 1.2 4.1Ragusa 48,631,516 154.30 2409.58 1.0 3.3Siracusa 67,139,549 162.68 3330.50 1.1 3.8Trapani 116,452,610 260.01 3747.74 2.0 6.8
Notes:a See Asmundo e Lisciandra in La Spina, eds. (2008).b Based on the number of residents as of 31 December 2006 (ISTAT).c All firms: active local units (average data 2002–2006); victims: see Table 3.d Estimates for value added: Ufficio Studi Banco di Sicilia.
Global Crime 239
Downloaded By: [University of Trento] At: 15:52 13 October 2008
Notes on contributors
Adam Asmundo is currently a Adjunct Professor of Economic Policy and Development Economics atPalermo University, Palermo and Scientific Director of the Ufficio Studi (Department of EconomicStudies), Banco di Sicilia, Head Office, Palermo. An expert in econometrics and applied economics, hisfield of research is macroeconomics and related development economics issues, growth theory, industrialand labour economics and redistributive policies. His papers have mainly been published on EconomiaItaliana and Rivista Economica del Mezzogiorno. He published some monographic studies and some essaysin collected volumes with Il Mulino and Franco Angeli. He is a member of RSAI, Regional ScienceAssociation International.
Maurizio Lisciandra studied Economics at the Bocconi University in Milan where he obtained the Laureasumma cum laude in 1998, becoming teaching assistant in the subsequent year in Microeconomics. In 1999,he moved to the University of Cambridge (Trinity College), where he obtained the MPhil in Economicswith distinction in the dissertation and in 2005, the PhD. In Cambridge, he was supervised by JamesMirrlees, Paul Ryan and William Brown. After the PhD, he worked as a consultant for the Unit Wage at theILO in Geneva and as an Adjoint Professor for the University of Palermo. Currently, Maurizio is a researchfellow at the faculty of Economics at the University of Bologna (Italy). His main research interests focus atpresent on law and economics, and economics of crime. He published essays in Studi Economici, Storia delPensiero Economico and in collected volumes with Il Mulino. Email: [email protected]
A. Asmundo and M. Lisciandra240
Downloaded By: [University of Trento] At: 15:52 13 October 2008


